UNITED STATES
SECURITIES AND EXCHANGE COMMISSION
Washington, D.C. 20549
Form 10-K
| x | ANNUAL REPORT PURSUANT TO SECTION 13 OR 15(d) OF THE SECURITIES EXCHANGE ACT OF 1934 |
For the fiscal year ended February 28, 2015
| ¨ | TRANSITION REPORT PURSUANT TO SECTION 13 OR 15(d) OF THE SECURITIES EXCHANGE ACT OF 1934 |
For the transition period from to
Commission File No. 001-33376
SARATOGA INVESTMENT CORP.
(Exact name of Registrant as specified in its charter)
| Maryland | 20-8700615 | |
(State or other jurisdiction of incorporation or organization) | (I.R.S. Employer Identification Number) |
535 Madison Avenue
New York, New York 10022
(Address of principal executive offices)
(212) 906-7800
(Registrant's telephone number, including area code)
Securities registered pursuant to Section 12(b) of the Act:
Title of Each Class | Name of Each Exchange on Which Registered | |
| Common Stock, par value $0.001 per share | The New York Stock Exchange | |
| 7.50% Notes due 2020 | The New York Stock Exchange |
Securities registered pursuant to Section 12(g) of the Act: None
Indicate by check mark if the registrant is a well-known seasoned issuer, as defined in Rule 405 of the Securities Act. Yes ¨ No x
Indicate by check mark if the registrant is not required to file reports pursuant to Section 13 or 15(d) of the Act. Yes ¨ No x
Indicate by check mark whether the Registrant (1) has filed all reports required to be filed by Section 13 or 15(d) of the Securities Exchange Act of 1934 during the preceding 12 months (or for such shorter period that the Registrant was required to file such reports), and (2) has been subject to such filing requirements for the past 90 days: Yes x No ¨
Indicate by check mark whether the registrant has submitted electronically and posted on its corporate Web site, if any, every Interactive Data File required to be submitted and posted pursuant to Rule 405 of Regulation S-T during the preceding 12 months (or for such shorter period that the registrant was required to submit and post such files). Yes ¨ No ¨
Indicate by check mark if disclosure of delinquent filers pursuant to Item 405 of Regulation S-K is not contained herein, and will not be contained, to the best of registrant's knowledge, in definitive proxy or information statements incorporated by reference in Part III of this Form 10-K or any amendment to this Form 10-K. x
Indicate by check mark whether the registrant is a large accelerated filer, an accelerated filer, a non-accelerated filer, or a smaller reporting company. See the definitions of "large accelerated filer," "accelerated filer" and "smaller reporting company" in Rule 12b-2 of the Exchange Act. (Check one):
| Large accelerated filer | ¨ | Accelerated filer | ¨ | |||
| Non-accelerated filer | x (Do not check if a smaller reporting company) | Smaller reporting company | ¨ | |||
Indicate by check mark whether the registrant is a shell company (as defined in Rule 12b-2 of the Act). Yes ¨ No x
The aggregate market value of the voting and non-voting common stock held by non-affiliates of the registrant as of August 29, 2014 was approximately $55.5 million based upon a closing price of $16.06 reported for such date by the New York Stock Exchange.
The number of outstanding common shares of the registrant as of May 20, 2015 was 5,428,758.
DOCUMENTS INCORPORATED BY REFERENCE
None.
NOTE ABOUT REFERENCES
In this Annual Report on Form 10-K (the "Annual Report"), the "Company," "we," "us" and "our" refer to Saratoga Investment Corp. and its wholly owned subsidiaries, Saratoga Investment Funding LLC and Saratoga Investment Corp. SBIC, L.P., unless the context otherwise requires. We refer to Saratoga Investment Advisors, LLC, our investment adviser, as "Saratoga Investment Advisors" or the "Investment Adviser."
NOTE ABOUT FORWARD-LOOKING STATEMENTS
Some of the statements in this Annual Report constitute forward-looking statements. Forward-looking statements relate to expectations, beliefs, projections, future plans and strategies, anticipated events or trends and similar expressions concerning matters that are not historical facts. In some cases, you can identify forward-looking statements by terms such as "anticipate," "believe," "could," "estimate," "expect," "intend," "may," "plan," "potential," "project," "should," "will" and "would" or the negative of these terms or other comparable terminology.
The forward-looking statements are based on our beliefs, assumptions and expectations of our future performance, taking into account all information currently available to us. These beliefs, assumptions and expectations can change as a result of many possible events or factors, not all of which are known to us or are within our control. If a change occurs, our business, financial condition, liquidity and results of operations may vary materially from those expressed in our forward-looking statements.
The forward-looking statements contained in this Annual Report involve risks and uncertainties, including statements as to:
| • | our future operating results; |
| • | our business prospects and the prospects of our portfolio companies; |
| • | the impact of investments that we expect to make; |
| • | our contractual arrangements and relationships with third parties; |
| • | the dependence of our future success on the general economy and its impact on the industries in which we invest; |
| • | the ability of our portfolio companies to achieve their objectives; |
| • | our expected financings and investments; |
| • | our regulatory structure and tax treatment, including our ability to operate as a business development company, or to operate our small business investment company subsidiary, and to continue to qualify to be taxed as a regulated investment company; |
| • | the adequacy of our cash resources and working capital; |
| • | the timing of cash flows, if any, from the operations of our portfolio companies; and |
| • | the ability of our investment adviser to locate suitable investments for us and to monitor and effectively administer our investments. |
For a discussion of factors that could cause our actual results to differ from forward-looking statements contained in this Annual Report, please see the discussion under Part I, Item 1A "Risk Factors". You should not place undue reliance on these forward-looking statements. The forward-looking statements made in this Annual Report relate only to events as of the date on which the statements are made. We undertake no obligation to update any forward-looking statement to reflect events or circumstances occurring after the date of this Annual Report.
2
TABLE OF CONTENTS
| PAGE | ||||
PART I | 4 | |||
Item 1. Business | 4 | |||
Item 1A. Risk Factors | 23 | |||
Item 1B. Unresolved Staff Comments | 42 | |||
Item 2. Properties | 42 | |||
Item 3. Legal Proceedings | 42 | |||
Item 4. Mine Safety Disclosures | 42 | |||
PART II | 43 | |||
Item 5. Market for Registrant's Common Equity, Related Stockholder Matters and Issuer Purchases of Equity Securities | 43 | |||
Item 6. Selected Financial Data | 47 | |||
Item 7. Management's Discussion and Analysis of Financial Condition and Results of Operations | 50 | |||
Item 7A. Quantitative and Qualitative Disclosures about Market Risk | 72 | |||
Item 8. Financial Statements and Supplementary Data | 72 | |||
Item 9. Changes in and Disagreements with Accountants on Accounting and Financial Disclosure | 72 | |||
Item 9A. Controls and Procedures | 73 | |||
Item 9B. Other Information | 73 | |||
PART III | 74 | |||
Item 10. Directors, Executive Officers and Corporate Governance | 74 | |||
Item 11. Executive Compensation | 76 | |||
Item 12. Security Ownership of Certain Beneficial Owners and Management and Related Stockholder Matters | 77 | |||
Item 13. Certain Relationships and Related Transactions, and Director Independence | 78 | |||
Item 14. Principal Accountant Fees and Services | 79 | |||
PART IV | 80 | |||
Item 15. Exhibits and Financial Statement Schedules | 80 | |||
Signatures | 83 | |||
3
PART I
ITEM 1. BUSINESS
General
We are a specialty finance company that invests primarily in leveraged loans and mezzanine debt issued by private U.S. middle-market companies, which we define as companies having annual EBITDA (earnings before interest, taxes, depreciation and amortization) of $2 million and $50 million, both through direct lending and through participation in loan syndicates. Our investment objective is to generate current income and, to a lesser extent, capital appreciation from our investments. We are externally managed and advised by Saratoga Investment Advisors, LLC, a New York-based investment firm affiliated with Saratoga Partners, a middle market private equity investment firm.
Our portfolio is comprised primarily of investments in leveraged loans (both first and second lien term loans) issued by middle market companies. Leveraged loans are generally senior debt instruments that rank ahead of subordinated debt of the portfolio company. Leveraged loans also have the benefit of security interests on the assets of the portfolio company, which may rank ahead of, or be junior to, other security interests. Term loans are loans that do not allow the borrowers to repay all or a portion of the loans prior to maturity and then re-borrow such repaid amounts under the loan again. We also purchase mezzanine debt and make equity investments in middle market companies. Mezzanine debt is typically unsecured and subordinated to senior debt of the portfolio company.
While our primary focus is to generate current income and capital appreciation from our debt and equity investments in middle market companies, we may invest up to 30.0% of our portfolio in opportunistic investments in order to seek to enhance returns to stockholders. Such investments may include investments in distressed debt, including securities of companies in bankruptcy, foreign debt, private equity, securities of public companies that are not thinly traded and structured finance vehicles such as collateralized loan obligation funds.
As of February 28, 2015, we had total assets of $263.6 million and investments in 34 portfolio companies and an additional investment in the subordinated notes of one collateralized loan obligation fund, Saratoga Investment Corp. CLO 2013-1, Ltd. ("Saratoga CLO"), which had a fair value of $17.0 million as of February 28, 2015. The overall portfolio composition as of February 28, 2015 consisted of 7.6% of syndicated loans, 60.3% of first lien term loans, 14.8% of second lien term loans, 1.8 % of unsecured notes, 7.1% of subordinated notes of Saratoga CLO and 8.4% of common equity. As of February 28, 2015 the weighted average yield on all of our debt investments, including our investment in the subordinated notes of Saratoga CLO, was approximately 11.8%. As of February 28, 2015, approximately 97.7% of our first lien debt investments were fully collateralized in the sense that the portfolio companies in which we held such investments had an enterprise value or our investment had an asset coverage equal to or greater than the principal amount of the related debt investment. Our investment in the subordinated notes of Saratoga CLO represents a first loss position in a portfolio that, at February 28, 2015, was composed of $296.9 million in aggregate principal amount of predominantly senior secured first lien term loans. A first loss position means that we will suffer the first economic losses if losses are incurred on loans held by the Saratoga CLO. As a result, this investment is subject to unique risks. See Part I, Item 1A. "Risk Factors-Our investment in Saratoga CLO constitutes a leveraged investment in a portfolio of predominantly senior secured first lien term loans and is subject to additional risks and volatility."
We are an externally managed, closed-end, non-diversified management investment company that has elected to be regulated as a business development company ("BDC") under the Investment Company Act of 1940 ("1940 Act"). As a BDC, we are required to comply with various regulatory requirements, including limitations on our use of debt. We finance our investments through borrowings. However, as a BDC, we are only generally allowed to borrow amounts such that our asset coverage, as defined in the 1940 Act, equals at least 200.0% after such borrowing. Pursuant to the 200.0% asset coverage ratio limitation, we are permitted to borrow one dollar to make investments for every dollar we have in assets less all liabilities and indebtedness not represented by preferred stock or debt securities issued by us or loans obtained by us so that for every one dollar of outstanding indebtedness we have two dollars of assets.
We have elected to be treated for U.S. federal income tax purposes as a regulated investment company ("RIC"), under Subchapter M of the Internal Revenue Code of 1986 (the "Code"). As a RIC, we generally will not have to pay corporate-level federal income taxes on any net ordinary income or capital gains that we distribute to our stockholders if we meet certain source-of-income, distribution and asset diversification requirements.
In addition, we have a wholly-owned subsidiary that is licensed as a small business investment company ("SBIC") and regulated by the Small Business Administration ("SBA"). See "Item 1. Business-Regulation-Small Business Investment Company Regulations." The SBIC license allows us, through our wholly-owned subsidiary, to issue SBA-guaranteed debentures. We received
4
exemptive relief from the Securities and Exchange Commission ("SEC") to permit us to exclude the debt of our SBIC subsidiary guaranteed by the SBA from the 200.0% asset coverage ratio we are required to maintain under the 1940 Act. This allows us increased flexibility under the 200.0% asset coverage test by permitting us to borrow up to $150.0 million more than we would otherwise be able to absent the receipt of this exemptive relief.
Corporate History and Information
We commenced operations, at the time known as GSC Investment Corp., on March 23, 2007 and completed an initial public offering of shares of common stock on March 28, 2007. Prior to July 30, 2010, we were externally managed and advised by GSCP (NJ), L.P., an entity affiliated with GSC Group, Inc. In connection with the consummation of a recapitalization transaction on July 30, 2010, we engaged Saratoga Investment Advisors ("SIA") to replace GSCP (NJ), L.P. as our investment adviser and changed our name to Saratoga Investment Corp.
The recapitalization transaction consisted of (i) the private sale of 986,842 shares of our common stock for $15.0 million in aggregate purchase price to Saratoga Investment Advisors and certain of its affiliates and (ii) the entry into a $40.0 million senior secured revolving credit facility with Madison Capital Funding LLC (the "Credit Facility"). We used the net proceeds from the private sale of shares of our common stock and a portion of the funds available to us under the Credit Facility to pay the full amount of principal and accrued interest, including default interest, outstanding under our revolving securitized credit facility with Deutsche Bank AG, New York Branch. Specifically, in July 2009, we had exceeded permissible borrowing limits under the revolving securitized credit facility with Deutsche Bank, which resulted in an event of default under the revolving securitized credit facility. As a result of the event of default, Deutsche Bank had the right to accelerate repayment of the outstanding indebtedness under the revolving securitized credit facility and to foreclose and liquidate the collateral pledged under the revolving securitized credit facility. The revolving securitized credit facility with Deutsche Bank was terminated in connection with our payment of all amounts outstanding thereunder on July 30, 2010. In January 2011, we registered for public resale by Saratoga Investment Advisors and certain of its affiliates the 986,842 shares of our common stock issued to them in the recapitalization.
On March 28, 2012, our wholly-owned subsidiary, Saratoga Investment Corp. SBIC, LP, received an SBIC license from the SBA.
Our corporate offices are located at 535 Madison Avenue, New York, New York 10022. Our telephone number is (212) 906-7800. We maintain a website on the Internet at www.saratogainvestmentcorp.com. Information contained on our website is not incorporated by reference into this Annual Report, and you should not consider that information to be part of this Annual Report.
Saratoga Investment Advisors
General
Our investment adviser was formed in 2010 as a Delaware limited liability company and became our investment adviser in July 2010. Our investment adviser is led by four principals, Christian L. Oberbeck, Michael J. Grisius, Thomas V. Inglesby, and Charles G. Phillips, with 27, 25, 28 and 18 years of experience in leveraged finance, respectively. Our investment adviser is affiliated with Saratoga Partners, a middle market private equity investment firm. Saratoga Partners was established in 1984 to be the middle market private investment arm of Dillon Read & Co. Inc. and has been independent of Dillon Read since 1998. Saratoga Partners has a 28-year history of private investments in middle market companies and focuses on public and private equity, preferred stock, and senior and mezzanine debt investments.
Our Relationship with Saratoga Investment Advisors
We utilize the personnel, infrastructure, relationships and experience of Saratoga Investment Advisors to enhance the growth of our business. We currently have no employees and each of our executive officers is also an officer of Saratoga Investment Advisors.
We have entered into an investment advisory and management agreement (the "Management Agreement") with Saratoga Investment Advisors. Pursuant to the 1940 Act, the initial term of the Management Agreement was for two years from its effective date of July 30, 2010, with automatic, one-year renewals, subject to approval by our board of directors, a majority of whom must be our independent directors. On July 10, 2014, our board of directors approved the renewal of the Management Agreement for an additional one-year term at an in-person meeting. Pursuant to the Management Agreement, Saratoga Investment Advisors implements our business strategy on a day-to-day basis and performs certain services for us under the direction of our board of directors. Saratoga Investment Advisors is responsible for, among other duties, performing all of our day-to-day functions, determining investment criteria, sourcing, analyzing and executing investments, asset sales, financings and performing asset management duties.
5
Saratoga Investment Advisors has formed an investment committee to advise and consult with its senior management team with respect to our investment policies, investment portfolio holdings, financing and leveraging strategies and investment guidelines. We believe that the collective experience of the investment committee members across a variety of fixed income asset classes will benefit us. The investment committee must unanimously approve all investments in excess of $1.0 million made by us. In addition, all sales of our investments must be approved by all four of our investment committee members. The current members of the investment committee are Messrs. Oberbeck, Grisius, Inglesby, and Phillips.
We pay Saratoga Investment Advisors a fee for investment advisory and management services consisting of two components-a base management fee and an incentive fee. The base management fee is calculated at an annual rate of 1.75% of our gross assets which includes assets purchased with borrowed funds but excludes cash and cash equivalents. As a result, Saratoga Investment Advisors will benefit as we incur debt or use leverage to purchase assets. Our board of directors will monitor the conflicts presented by this compensation structure by approving the amount of leverage that we may incur.
In addition to the base management fee, we pay Saratoga Investment Advisors an incentive fee which consists of two parts. First, we pay Saratoga Investment Advisors an incentive fee with respect to our pre-incentive fee net investment income in each calendar quarter as follows:
| • | no incentive fee in any calendar quarter in which our pre-incentive fee income does not exceed a fixed "hurdle rate" of 1.875% per quarter (7.5% annualized); and |
| • | 100.0% of our pre-incentive fee net investment income with respect to that portion of such pre-incentive fee net investment income, if any, that exceeds the hurdle rate but is less than or equal to 2.344% in any fiscal quarter (9.376% annualized) is payable to the investment adviser. We refer to this portion of our pre-incentive fee net investment income (which exceeds the hurdle rate but is less than or equal to 2.344%) as the "catch-up." The "catch-up" provision is intended to provide our investment adviser with an incentive fee of 20.0% on all of our pre-incentive fee net investment income as if a hurdle rate did not apply when our pre-incentive fee net investment income exceeds 2.344% in any fiscal quarter. Notwithstanding the foregoing, with respect to any period ending on or prior to December 31, 2010, our investment adviser was only entitled to 20.0% of the amount of our pre-incentive fee net investment income, if any, that exceeded 1.875% in any fiscal quarter (7.5% annualized) without any catch-up provision; and |
| • | 20.0% of the amount of our pre-incentive fee net investment income, if any, that exceeds 2.344% in any fiscal quarter (9.376% annualized) is payable to the investment adviser (once the hurdle is reached and the catch-up is achieved, 20.0% of all pre-incentive fee net investment income thereafter is allocated to the investment adviser). |
Pre-incentive fee net investment income means interest income, dividend income and other income (including any other fees, such as commitment, origination, structuring, diligence, managerial and consulting fees or other fees that we receive from portfolio companies) earned during the calendar quarter, minus our operating expenses for the quarter.
The second part of the incentive fee is determined and payable in arrears as of the end of each fiscal year (or upon termination of the Management Agreement) and equals 20.0% of our "incentive fee capital gains," which equals our realized capital gains on a cumulative basis from May 31, 2010 through the end of the fiscal year, if any, computed net of all realized capital losses and unrealized capital depreciation on a cumulative basis, less the aggregate amount of any previously paid capital gain incentive fee. Importantly, the capital gains portion of the incentive fee is based on realized gains and realized and unrealized losses from May 31, 2010. Therefore, realized and unrealized losses incurred prior to such time will not be taken into account when calculating the capital gains portion of the incentive fee, and Saratoga Investment Advisors will be entitled to 20.0% of incentive fee capital gains that arise after May 31, 2010. In addition, for the purpose of the "incentive fee capital gains" calculations, the cost basis for computing realized gains and losses on investments held by us as of May 31, 2010 will equal the fair value of such investments as of such date.
We have also entered into a separate administration agreement with Saratoga Investment Advisors pursuant to which Saratoga Investment Advisors furnishes us with office facilities, equipment and clerical, bookkeeping and record keeping services. The administration agreement has an initial term of two years from its effective date of July 30, 2010, with automatic one-year renewals, subject to approval by our board of directors, a majority of whom must be our independent directors. On July 10, 2014, our board of directors approved the renewal of the Administration Agreement for an additional one-year term and determined to maintain the cap on the payment or reimbursement of expenses by us thereunder to $1.0 million for the additional one-year term. Under the administration agreement, Saratoga Investment Advisors also performs, or oversees the performance of our required administrative services, which include, among other things, being responsible for the financial records which we are required to maintain, preparing reports for our stockholders and reports required to be filed with the SEC. Payments under the administration agreement will be equal to an amount based upon the allocable portion of Saratoga Investment Advisors' overhead in performing its obligations under the administration agreement, including rent and the allocable portion of the cost of our officers and their respective staffs relating to the performance of services under the administration agreement.
6
Investments
Our portfolio is comprised primarily of investments in leveraged loans (both first and second lien term loans) issued by middle market companies. Investments in middle market companies are generally less liquid than equivalent investments in companies with larger capitalizations. These investments are sourced in both the primary and secondary markets through a network of relationships with commercial and investment banks, commercial finance companies and financial sponsors. The leveraged loans that we purchase are generally used to finance buyouts, acquisitions, growth, recapitalizations and other types of transactions. Leveraged loans are generally senior debt instruments that rank ahead of subordinated debt of the portfolio company. Leveraged loans also have the benefit of security interests on the assets of the portfolio company, which may rank ahead of, or be junior to, other security interests. For a discussion of the risks pertaining to our secured investments, see Part I, Item 1A. "Risk Factors-Our investments may be risky, and you could lose all or part of your investment."
As part of our long-term strategy, we also purchase mezzanine debt and make equity investments in middle market companies. Mezzanine debt is typically unsecured and subordinated to senior debt of the portfolio company. See Part I, Item 1A. "Risk Factors-If we make unsecured debt investments, we may lack adequate protection in the event our portfolio companies become distressed or insolvent and will likely experience a lower recovery than more senior debtholders in the event our portfolio companies defaults on their indebtedness."
Substantially all of the debt investments held in our portfolio hold a non-investment grade rating by one or more rating agencies or, if not rated, would be rated below investment grade if rated, which are often referred to as "junk." As of February 28, 2015, 40.6% of our debt portfolio at fair value consisted of debt securities for which issuers were not required to make principal payments until the maturity of such debt securities, which could result in a substantial loss to us if such issuers are unable to refinance or repay their debt at maturity. In addition, 59.4% of our debt investments at February 28, 2015, had variable interest rates that reset periodically based on benchmarks such as LIBOR and the prime rate. As a result, significant increases in such benchmarks in the future may make it more difficult for these borrowers to service their obligations under the debt investments that we hold.
As a BDC, we are required to comply with certain regulatory requirements. For instance, we have to invest at least 70.0% of our total assets in assets of the type listed in section 55(a) of the 1940 Act, including securities of U.S. operating companies whose securities are not listed on a national securities exchange (i.e., New York Stock Exchange, NYSE MKT and The NASDAQ Stock Market), U.S. operating companies with listed securities that have market capitalizations of less than $250.0 million, cash, cash equivalents, U.S. government securities and high-quality debt investments that mature in one year or less, which we refer to as "qualifying assets".
While our primary focus is to generate current income and capital appreciation from our debt and equity investments in middle market companies, we may invest up to 30.0% of the portfolio in opportunistic investments in order to seek to enhance returns to stockholders. Such investments may include investments in distressed debt, private equity, securities of public companies that are not thinly traded and structured finance vehicles such as collateralized loan obligation funds.
Leveraged loans
Our leveraged loan portfolio is comprised primarily of first lien and second lien term loans. First lien term loans are secured by a first priority perfected security interest on all or substantially all of the assets of the borrower and typically include a first priority pledge of the capital stock of the borrower. First lien term loans hold a first priority with regard to right of payment. Generally, first lien term loans offer floating rate interest payments, have a stated maturity of five to seven years, and have a fixed amortization schedule. First lien term loans generally have restrictive financial and negative covenants. Second lien term loans are secured by a second priority perfected security interest on all or substantially all of the assets of the borrower and typically include a second priority pledge of the capital stock of the borrower. Second lien term loans hold a second priority with regard to right of payment. Second lien term loans offer either floating rate or fixed rate interest payments, generally have a stated maturity of five to eight years, and may or may not have a fixed amortization schedule. Second lien term loans that do not have fixed amortization schedules require payment of the principal amount of the loan upon the maturity date of the loan. Second lien term loans have less restrictive financial and negative covenants than those that govern first lien term loans.
7
Mezzanine debt
Mezzanine debt usually ranks subordinate in priority of payment to senior debt and is often unsecured. However, mezzanine debt ranks senior to common and preferred equity in a borrowers' capital structure. Mezzanine debt typically has fixed rate interest payments and a stated maturity of six to eight years and does not have fixed amortization schedules.
In some cases, our debt investments may provide for a portion of the interest payable to be paid-in-kind interest ("PIK"). To the extent interest is paid-in-kind, it will be payable through the increase of the principal amount of the obligation by the amount of interest due on the then-outstanding aggregate principal amount of such obligation.
Equity Investments
Equity investments may consist of preferred equity that is expected to pay dividends on a current basis or preferred equity that does not pay current dividends. Preferred equity generally has a preference over common equity as to distributions on liquidation and dividends. In some cases, we may acquire common equity. In general, our equity investments are not control-oriented investments and we expect that in many cases we will acquire equity securities as part of a group of private equity investors in which we are not the lead investor.
Opportunistic Investments
Opportunistic investments may include investments in distressed debt, which may include securities of companies in bankruptcy, debt and equity securities of public companies that are not thinly traded, emerging market debt, structured finance vehicles such as collateralized loan obligation funds and debt of middle market companies located outside the United States.
In January 2008, we purchased for $30.0 million all of the outstanding subordinated notes of Saratoga CLO, a collateralized loan obligation fund managed by us that invests primarily in leveraged loans. As of February 28, 2015, the Saratoga CLO portfolio consisted of $296.9 million in aggregate principal amount of primarily senior secured first lien term loans to 179 obligors with an average obligor exposure of $1.6 million and $5.8 million in uninvested cash. The weighted average maturity of the portfolio is 4.68 years.
Prospective portfolio company characteristics
Our investment adviser generally selects portfolio companies with one or more of the following characteristics:
| • | a history of generating stable earnings and strong free cash flow; |
| • | well-constructed balance sheets, supported by sustainable enterprise values; |
| • | reasonable debt-to-cash flow multiples; |
| • | industry leadership with competitive advantages and sustainable market shares in attractive sectors; and |
| • | capital structures that provide appropriate terms and reasonable covenants. |
Investment selection
In managing us, Saratoga Investment Advisors employs the same investment philosophy and portfolio management methodologies used by Saratoga Partners. Through this investment selection process, based on quantitative and qualitative analysis, Saratoga Investment Advisors seeks to identify portfolio companies with superior fundamental risk-reward profiles and strong, defensible business franchises with the goal of minimizing principal losses while maximizing risk-adjusted returns. Saratoga Investment Advisors' investment process emphasizes the following:
| • | bottoms-up, company-specific research and analysis; |
| • | capital preservation, low volatility and minimization of downside risk; and |
| • | investing with experienced management teams that hold meaningful equity ownership in their businesses. |
8
Our investment adviser's investment process generally includes the following steps:
| • | Initial screening. A brief analysis identifies the investment opportunity and reviews the merits of the transaction. The initial screening memorandum provides a brief description of the company, its industry, competitive position, capital structure, financials, equity sponsor and deal economics. If the deal is determined to be attractive by the senior members of the deal team, the opportunity is fully analyzed. |
| • | Full analysis. A full analysis includes: |
| • | Business and Industry analysis-a review of the company's business position, competitive dynamics within its industry, cost and growth drivers and technological and geographic factors. Business and industry research often includes meetings with industry experts, consultants, other investors, customers and competitors. |
| • | Company analysis-a review of the company's historical financial performance, future projections, cash flow characteristics, balance sheet strength, liquidation value, legal, financial and accounting risks, contingent liabilities, market share analysis and growth prospects. |
| • | Structural/security analysis-a thorough legal document analysis including but not limited to an assessment of financial and negative covenants, events of default, enforceability of liens and voting rights. |
| • | Approval of the investment committee. The investment is then presented to the investment committee for approval. The investment committee must unanimously approve all investments in excess of $1 million made by us. In addition, all sales of our investments must be approved by all four of our investment committee members. The members of our investment committee are Christian L. Oberbeck, Michael J. Grisius, Thomas V. Inglesby, and Charles G. Phillips. |
Investment structure
In general, our Investment Adviser intends to select investments with financial covenants and terms that reduce leverage over time, thereby enhancing credit quality. These methods include:
| • | maintenance leverage covenants requiring a decreasing ratio of debt to cash flow; |
| • | maintenance cash flow covenants requiring an increasing ratio of cash flow to the sum of interest expense and capital expenditures; and |
| • | debt incurrence prohibitions, limiting a company's ability to re-lever. |
In addition, limitations on asset sales and capital expenditures should prevent a company from changing the nature of its business or capitalization without our consent.
Our investment adviser seeks, where appropriate, to limit the downside potential of our investments by:
| • | requiring a total return on our investments (including both interest and potential equity appreciation) that compensates us for credit risk; |
| • | requiring companies to use a portion of their excess cash flow to repay debt; |
| • | selecting investments with covenants that incorporate call protection as part of the investment structure; and |
| • | selecting investments with affirmative and negative covenants, default penalties, lien protection, change of control provisions and board rights, including either observation or participation rights. |
Valuation process
We account for our investments at fair value in accordance with the Financial Accounting Standards Board ("FASB") Accounting Standards Codification ("ASC") Topic 820, Fair Value Measurements and Disclosures ("ASC 820"), as approved in good faith using written policies and procedures adopted by our board of directors. Investments for which market quotations are readily available are recorded in our financial statements at such market quotations subject to any decision by our board of directors to
9
approve a fair value determination to reflect significant events affecting the value of these investments. We value investments for which market quotations are not readily available at fair value as approved in good faith by our board of directors based on input from Saratoga Investment Advisors, our audit committee and an independent valuation firm engaged by our board of directors. Determinations of fair value may involve subjective judgments and estimates. The types of factors that may be considered in determining the fair value of our investments include the nature and realizable value of any collateral, the portfolio company's ability to make payments, the markets in which the portfolio company does business, market yield trend analysis, comparison to publicly traded companies, discounted cash flow and other relevant factors.
Our investment in the subordinated notes of Saratoga CLO is carried at fair value, which is based on a discounted cash flow model that utilizes prepayment, re-investment and loss assumptions based on historical experience and projected performance, economic factors, the characteristics of the underlying cash flow, and comparable yields for similar collateralized loan obligation fund subordinated notes or equity, when available. Specifically, we use Intex cash flow models, or an appropriate substitute, to form the basis for Saratoga CLO's valuation. The Intex cash flow models use a set of assumptions including projected default rates, recovery rates, reinvestment rate and prepayment rates in order to arrive at estimated cash flows. The assumptions are based on available market data and projections provided by third parties as well as management estimates. We use the output from the Intex models (i.e., the estimated cash flows from our investment in Saratoga CLO) to perform a discounted cash flows analysis on expected future cash flows from our investment in Saratoga CLO to determine a valuation for the subordinated notes of Saratoga CLO held by us.
We undertake a multi-step valuation process each quarter when valuing investments for which market quotations are not readily available, as described below:
| • | each investment is initially valued by the responsible investment professionals of Saratoga Investment Advisors and preliminary valuation conclusions are documented and discussed with our senior management; and |
| • | an independent valuation firm engaged by our board of directors independently values at least one quarter of our investments each quarter so that the valuation of each investment for which market quotes are not readily available is independently valued by an independent valuation firm at least annually. |
In addition, all our investments are subject to the following valuation process:
| • | the audit committee of our board of directors reviews each preliminary valuation and our investment adviser and independent valuation firm (if applicable) will supplement the preliminary valuation to reflect any comments provided by the audit committee; and |
| • | our board of directors discusses the valuations and approves the fair value of each investment in good faith based on the input of our investment adviser, independent valuation firm (to the extent applicable) and the audit committee of our board of directors. |
Because such valuations, and particularly valuations of private investments and private companies, are inherently uncertain, they may fluctuate over short periods of time and may be based on estimates. The determination of fair value may differ materially from the values that would have been used if a ready market for these investments existed. Our net asset value could be materially affected if the determinations regarding the fair value of our investments were materially higher or lower than the values that we ultimately realize upon the disposal of such investments.
Ongoing relationships with and monitoring of portfolio companies
Saratoga Investment Advisors will closely monitor each investment we make and, when appropriate, will conduct a regular dialogue with both the management team and other debtholders and seek specifically tailored financial reporting. In addition, in certain circumstances, senior investment professionals of Saratoga Investment Advisors may take board seats or board observation seats.
Distributions
Our distributions, if any, will be determined by our board of directors and paid out of assets legally available for distribution. Any such distributions generally will be taxable to our stockholders, including to those stockholders who receive additional shares of our common stock pursuant to our dividend reinvestment plan. Prior to January 2009, we paid quarterly dividends to our stockholders. However, in January 2009, we suspended the practice of paying quarterly dividends to our stockholders and thereafter paid five annual dividend distributions (December 2013, 2012, 2011, 2010 and 2009) to our stockholders since such time, which distributions were made with a combination of cash and the issuance of shares of our common stock as discussed more fully below.
10
On September 24, 2014, we announced the recommencement of quarterly dividends to our stockholders, and have subsequently made two distributions under this new policy. We have adopted a dividend reinvestment plan ("DRIP") that provides for reinvestment of our dividend distributions on behalf of our stockholders unless a stockholder elects to receive cash. As a result, if our board of directors authorizes, and we declare, a cash dividend, then our stockholders who have not "opted out" of the DRIP by the dividend record date will have their cash dividends automatically reinvested into additional shares of our common stock, rather than receiving the cash dividends. We have the option to satisfy the share requirements of the DRIP through the issuance of new shares of common stock or through open market purchases of common stock by the DRIP plan administrator.
In order to maintain our qualification as a RIC, we must for each fiscal year distribute an amount equal to at least 90.0% of our ordinary net taxable income and realized net short-term capital gains in excess of realized net long-term capital losses, if any, reduced by deductible expenses. In addition, we will be subject to federal excise taxes to the extent we do not distribute during the calendar year at least (1) 98.0% of our ordinary income for the calendar year, (2) 98.2% of our capital gains in excess of capital losses for the one year period ending on October 31 of the calendar year and (3) any ordinary income and net capital gains for preceding years that were not distributed during such years and on which we paid no federal income tax. For the 2014 calendar year, we made distributions sufficient such that we did not incur any federal excise taxes. We may elect to withhold from distribution a portion of our ordinary income for the 2015 calendar year and/or portion of the capital gains in excess of capital losses realized during the one year period ending October 31, 2015, if any, and, if we do so, we would expect to incur federal excise taxes as a result.
We may distribute taxable dividends that are payable in cash or shares of our common stock at the election of each stockholder. Under certain applicable provisions of the Code and the Treasury regulations, distributions payable in cash or in shares of stock at the election of stockholders are treated as taxable dividends. The Internal Revenue Service has issued private rulings indicating that this rule will apply even where the total amount of cash that may be distributed is limited to no more than 20.0% of the total distribution. Under these rulings, if too many stockholders elect to receive their distributions in cash, each such stockholder would receive a pro rata share of the total cash to be distributed and would receive the remainder of their distribution in shares of stock. If we decide to make any distributions consistent with these rulings that are payable in part in our stock, taxable stockholders receiving such dividends will be required to include the full amount of the dividend (whether received in cash, our stock, or a combination thereof) as ordinary income (or as long-term capital gain to the extent such distribution is properly reported as a capital gain dividend) to the extent of our current and accumulated earnings and profits for United States federal income tax purposes. As a result, a U.S. stockholder may be required to pay tax with respect to such dividends in excess of any cash received. If a U.S. stockholder sells the stock it receives as a dividend in order to pay this tax, the sales proceeds may be less than the amount included in income with respect to the dividend, depending on the market price of our stock at the time of the sale. Furthermore, with respect to non-U.S. stockholders, we may be required to withhold U.S. tax with respect to such dividends, including in respect of all or a portion of such dividend that is payable in stock. In addition, if a significant number of our stockholders determine to sell shares of our stock in order to pay taxes owed on dividends, it may put downward pressure on the trading price of our stock.
Competition
Our primary competitors in providing financing to private middle market companies include public and private investment funds (including private equity funds, mezzanine funds, BDCs and SBICs), commercial and investment banks and commercial financing companies. Many of our competitors are substantially larger and have considerably greater financial and marketing resources than us. For example, some competitors may have access to funding sources that are not available to us. In addition, some of our competitors may have higher risk tolerances or different risk assessments, which may allow them to consider a wider variety of investments. Furthermore, many of our competitors are not subject to the regulatory restrictions that the 1940 Act imposes on us as a BDC. For additional information concerning the competitive risks we face, please see Part I, Item 1A, "Risk Factors-We operate in a highly competitive market for investment opportunities."
Staffing
We do not currently have any employees and do not expect to have any employees in the future. Services necessary for our business are provided by individuals who are employees of Saratoga Investment Advisors, pursuant to the terms of the Management Agreement and the administration agreement. For a discussion of the Management Agreement, see "Business-Investment Advisory and Management Agreement" below. We reimburse Saratoga Investment Advisors for our allocable portion of expenses incurred by it in performing its obligations under the administration agreement, including rent and our allocable portion of the cost of our officers and their respective staffs, subject to certain limitations. For a discussion of the administration agreement, see "Business-Administration Agreement" below.
11
Investment Advisory and Management Agreement
Saratoga Investment Advisors serves as our investment adviser. Our investment adviser was formed in 2010 as a Delaware limited liability company and became our investment advisor in July 2010. Subject to the overall supervision of our board of directors, Saratoga Investment Advisors manages our day-to-day operations and provides investment advisory and management services to us. Under the terms of the Management Agreement, Saratoga Investment Advisors:
| • | determines the composition of our portfolio, the nature and timing of the changes to our portfolio and the manner of implementing such changes; |
| • | identifies, evaluates and negotiates the structure of the investments we make (including performing due diligence on our prospective portfolio companies); |
| • | closes and monitors the investments we make; and |
| • | determines the securities and other assets that we purchase, retain or sell. |
Saratoga Investment Advisors services under the Management Agreement are not exclusive, and it is free to furnish similar services to other entities.
Management Fee and Incentive Fee
Pursuant to the Management Agreement with Saratoga Investment Advisors, we pay Saratoga Investment Advisors a fee for investment advisory and management services consisting of two components-a base management fee and an incentive fee.
The base management fee is paid quarterly in arrears, and equals 1.75% per annum of our gross assets (other than cash or cash equivalents but including assets purchased with borrowed funds) and calculated at the end of each fiscal quarter based on the average value of our gross assets (other than cash or cash equivalents but including assets purchased with borrowed funds) as of the end of such fiscal quarter and the end of the immediate prior fiscal quarter. Base management fees for any partial month or quarter are appropriately pro-rated.
The incentive fee has the following two parts:
The first part is calculated and payable quarterly in arrears based on our pre-incentive fee net investment income for the immediately preceding fiscal quarter. Pre-incentive fee net investment income means interest income, dividend income and any other income (including any other fees such as commitment, origination, structuring, diligence, managerial and consulting fees or other fees that we receive from portfolio companies) accrued during the fiscal quarter, minus our operating expenses for the quarter (including the base management fee, expenses payable under the administration agreement, and any interest expense and dividends paid on any issued and outstanding preferred stock or debt security, but excluding the incentive fee). Pre-incentive fee net investment income includes, in the case of investments with a deferred interest feature (such as market discount, debt instruments with payment-in-kind interest, preferred stock with payment-in-kind dividends and zero coupon securities), accrued income that we have not yet received in cash. Pre-incentive fee net investment income does not include any realized capital gains, realized capital losses or unrealized capital appreciation or depreciation. Pre-incentive fee net investment income, expressed as a rate of return on the value of our net assets (defined as total assets less liabilities) at the end of the immediately preceding fiscal quarter, is compared to a "hurdle rate" of 1.875% per quarter (7.5% annualized), subject to a "catch up" provision. The base management fee is calculated prior to giving effect to the payment of any incentive fees.
We pay Saratoga Investment Advisors an incentive fee with respect to our pre-incentive fee net investment income in each fiscal quarter as follows: (A) no incentive fee in any fiscal quarter in which our pre-incentive fee net investment income does not exceed the hurdle rate; (B) 100.0% of our pre-incentive fee net investment income with respect to that portion of such pre-incentive fee net investment income, if any, that exceeds the hurdle rate but is less than or equal to 2.344% in any fiscal quarter (9.376% annualized) is payable to Saratoga Investment Advisors; and (C) 20.0% of the amount of our pre-incentive fee net investment income, if any, that exceeds 2.344% in any fiscal quarter (9.376% annualized). We refer to the amount specified in clause (B) as the "catch-up." The "catch-up" provision is intended to provide Saratoga Investment Advisors with an incentive fee of 20.0% on all of our pre-incentive fee net investment income as if a hurdle rate did not apply when our pre-incentive fee net investment income exceeds 2.344% in any fiscal quarter. Notwithstanding the foregoing, with respect to any period ending on or prior to December 31, 2010, Saratoga Investment Advisors was only entitled to 20.0% of the amount of our pre-incentive fee net investment income, if any, that exceeded 1.875% in any fiscal quarter (7.5% annualized) without any catch-up provision. These calculations are appropriately pro-rated when such calculations are applicable for any period of less than three months.
12
The following is a graphical representation of the calculation of the income-related portion of the incentive fee subsequent to any period ending after December 31, 2010:
Quarterly Incentive Fee Based on "Pre-Incentive Fee Net Investment Income"
Pre-Incentive Fee Net Investment Income
(expressed as a percentage of the value of net assets)
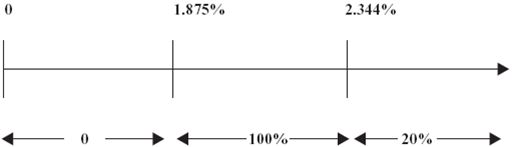
Percentage of Pre-Incentive Fee Net Investment
Income allocated to income-related portion of incentive fee
The second part of the incentive fee, the capital gains fee, is determined and payable in arrears as of the end of each fiscal year (or, upon termination of the Management Agreement), and is calculated at the end of each applicable fiscal year by subtracting (1) the sum of our cumulative aggregate realized capital losses and aggregate unrealized capital depreciation from (2) our cumulative aggregate realized capital gains, in each case calculated from May 31, 2010. If such amount is positive at the end of such year, then the capital gains fee for such year is equal to 20.0% of such amount, less the cumulative aggregate amount of capital gains fees paid in all prior years. If such amount is negative, then there is no capital gains fee for such year.
Under the Management Agreement, the capital gains portion of the incentive fee is based on realized gains and realized and unrealized losses from May 31, 2010. Therefore, realized and unrealized losses incurred prior to such time will not be taken into account when calculating the capital gains portion of the incentive fee, and Saratoga Investment Advisors will be entitled to 20.0% of net capital gains that arise after May 31, 2010. In addition, the cost basis for computing our realized gains and losses on investments held by us as of May 31, 2010 equals the fair value of such investments as of such date.
Examples of Quarterly Incentive Fee Calculation
Example 1: Income Related Portion of Incentive Fee(1):
Assumptions
| • | Hurdle rate(2) = 1.875% |
| • | Management fee(3) = 0.4375% |
| • | Other expenses (legal, accounting, custodian, transfer agent, etc.)(4) = 0.33% |
Alternative 1
Additional Assumptions
| • | Investment income (including interest, dividends, fees, etc.) = 1.25% |
| • | Pre-incentive fee net investment income (investment income–(management fee + other expenses)) = 0.4825% |
13
Pre-incentive fee net investment income does not exceed hurdle rate, therefore there is no incentive fee.
Alternative 2
Additional Assumptions
| • | Investment income (including interest, dividends, fees, etc.) = 3.0% |
| • | Pre-incentive fee net investment income (investment income–(management fee + other expenses)) = 2.2325% |
Pre-incentive fee net investment income exceeds hurdle rate, but does not fully satisfy the "catch-up" provision, therefore the income related portion of the incentive fee is 0.3575%.
Incentive Fee | = | (100.0% × (pre-incentive fee net investment income–1.875%) | ||||
| = | 100.0%(2.2325%–1.875%) | |||||
| = | 100.0%(0.3575%) | |||||
| = | 0.3575% |
| (1) | The hypothetical amount of pre-incentive fee net investment income shown is based on a percentage of total net assets. |
| (2) | Represents 7.5% annualized hurdle rate. |
| (3) | Represents 1.75% annualized management fee. For the purposes of this example, we have assumed that we have not incurred any indebtedness and that we maintain no cash or cash equivalents. |
| (4) | The "catch-up" provision is intended to provide our investment adviser with an incentive fee of 20.0% on all pre-incentive fee net investment income as if a hurdle rate did not apply when our net investment income exceeds 2.344% in any fiscal quarter. |
Alternative 3
Additional Assumptions
| • | Investment income (including interest, dividends, fees, etc.) = 3.5% |
| • | Pre-Incentive Fee Net Investment Income (investment income–(management fee + other expenses) = 2.7325% |
Pre-incentive fee net investment income exceeds the hurdle rate, and fully satisfies the "catch-up" provision, therefore the income related portion of the incentive fee is 0.5467%.
Incentive fee | = | 100.0% × pre-incentive fee net investment income (subject to "catch-up")(4) | ||||
Incentive fee | = | 100.0% × "catch-up" + (20.0% × (Pre-incentive fee net investment income–2.344%)) | ||||
Catch up | = | 2.344%–1.875% | ||||
| = | 0.469% | |||||
Incentive fee | = | (100.0% × 0.469%) +(20.0% ×(2.7325%–2.344%)) | ||||
| = | 0.469% +(20.0% × 0.3885%) | |||||
| = | 0.469% + 0.0777% | |||||
| = | 0.5467% |
Example 2: Capital Gains Portion of Incentive Fee:
Alternative 1
Assumptions(1)
| • | Year 1: $20.0 million investment made in Company A ("Investment A"), and $30.0 million investment made in Company B ("Investment B") |
14
| • | Year 2: Investment A is sold for $50.0 million and fair market value ("FMV") of Investment B determined to be $32.0 million |
| • | Year 3: FMV of Investment B determined to be $25.0 million |
| • | Year 4: Investment B sold for $31.0 million |
The capital gains portion of the incentive fee, if any, calculated under the cumulative method would be:
| • | Year 1: None |
| • | Year 2: $6 million (20.0% multiplied by $30.0 million realized capital gains on sale of Investment A) |
| • | Year 3: None; $5 million (20.0% multiplied by ($30.0 million realized cumulative capital gains less $5.0 million cumulative capital depreciation)) less $6.0 million (capital gains incentive fee paid in Year 2) |
| • | Year 4: $200,000; $6.2 million (20.0% multiplied by $31.0 million cumulative realized capital gains) less $6.0 million (capital gains incentive fee paid in Year 2) |
Alternative 2
Assumptions(1)
| (1) | The examples assume that Investment A and Investment B were acquired by us subsequent to May 31, 2010. If Investment A and B were acquired by us prior to May 31, 2010, then the cost basis for computing our realized gains and losses on such investments would equal the fair value of such investments as of May 31, 2010. |
| • | Year 1: $20.0 million investment made in Company A ("Investment A"), $30.0 million investment made in Company B ("Investment B") and $25.0 million investment made in Company C ("Investment C") |
| • | Year 2: Investment A sold for $50.0 million, FMV of Investment B determined to be $25.0 million and FMV of Investment C determined to be $25.0 million |
| • | Year 3: FMV of Investment B determined to be $27.0 million and Investment C sold for $30.0 million |
| • | Year 4: FMV of Investment B determined to be $35.0 million |
| • | Year 5: Investment B sold for $20.0 million |
The capital gains portion of the incentive fee, if any, calculated under the cumulative method would be:
| • | Year 1: None |
| • | Year 2: $5.0 million (20.0% multiplied by $25.0 million ($30.0 million realized capital gains on Investment A less $5.0 million unrealized capital depreciation on Investment B)) |
| • | Year 3: $1.4 million ($6.4 million (20.0% multiplied by $32.0 million ($35.0 million cumulative realized capital gains less $3.0 million unrealized capital depreciation)) less $5.0 million (capital gains incentive fee paid in Year 2)) |
| • | Year 4: None |
| • | Year 5: None ($5.0 million (20.0% multiplied by $25.0 million (cumulative realized capital gains of $35.0 million less realized capital losses of $10.0 million)) less $6.4 million (cumulative capital gains incentive fee paid in Year 2 and Year 3)) |
The Management Agreement with Saratoga Investment Advisors was approved by our board of directors at an in-person meeting of the directors, including a majority of our independent directors, and was approved by our stockholders at the special meeting of stockholders held on July 30, 2010. On July 10, 2014, our board of directors approved the renewal of the Management Agreement for an additional one-year term at an in-person meeting.
15
In approving this Management Agreement, the directors considered, among other things, (i) the nature, extent and quality of the advisory and other services to be provided to us by Saratoga Investment Advisors; (ii) our investment performance and the investment performance of Saratoga Investment Advisors; (iii) the expected costs of the services to be provided by Saratoga Investment Advisors (including management fees, advisory fees and expense ratios) and the profits expected to be realized by Saratoga Investment Advisors; (iv) the limited potential for economies of scale in investment management associated with managing us; and (v) Saratoga Investment Advisors estimated pro forma profitability with respect to managing us.
Payment of our expenses
The Management Agreement provides that all investment professionals of Saratoga Investment Advisors and its staff, when and to the extent engaged in providing investment advisory services required to be provided by Saratoga Investment Advisors, and the compensation and routine overhead expenses of such personnel allocable to such services, will be provided and paid for by Saratoga Investment Advisors and not by us.
We bear all costs and expenses of our operations and transactions, including those relating to:
| • | organization; |
| • | calculating our net asset value (including the cost and expenses of any independent valuation firm); |
| • | expenses incurred by Saratoga Investment Advisors payable to third parties, including agents, consultants or other advisors, in monitoring financial and legal affairs for us and in monitoring our investments and performing due diligence on our prospective portfolio companies; |
| • | interest payable on debt, if any, incurred to finance our investments; |
| • | offerings of our common stock and other securities; |
| • | investment advisory and management fees; |
| • | fees payable to third parties, including agents, consultants or other advisors, relating to, or associated with, evaluating and making investments; |
| • | transfer agent and custodial fees; |
| • | federal and state registration fees; |
| • | all costs of registration and listing our common stock on any securities exchange; |
| • | federal, state and local taxes; |
| • | independent directors' fees and expenses; |
| • | costs of preparing and filing reports or other documents required by governmental bodies (including the SEC and the SBA); |
| • | costs of any reports, proxy statements or other notices to common stockholders including printing costs; |
| • | our fidelity bond, directors and officers errors and omissions liability insurance, and any other insurance premiums; |
| • | direct costs and expenses of administration, including printing, mailing, long distance telephone, copying, secretarial and other staff, independent auditors and outside legal costs; and |
| • | administration fees and all other expenses incurred by us or, if applicable, the administrator in connection with administering our business (including payments under the administration agreement based upon our allocable portion of the administrator's overhead in performing its obligations under the administration agreement, including rent and the allocable portion of the cost of our officers and their respective staffs (including travel expenses). |
16
Duration and Termination
The Management Agreement will remain in effect continuously, unless terminated under the termination provisions of the agreement. The Management Agreement provides that it may be terminated at any time, without the payment of any penalty, upon 60 days written notice, by the vote of stockholders holding a majority of our outstanding voting securities, or by the vote of our directors or by Saratoga Investment Advisors.
The Management Agreement will, unless terminated as described above, continue in effect until July 30, 2014 and will continue in effect from year to year thereafter so long as it is approved at least annually by (i) the vote of the board of directors, or by the vote of stockholders holding a majority of our outstanding voting securities, and (ii) the vote of a majority of our directors who are not parties to the Management Agreement or "interested persons" (as such term is defined in Section 2(a)(19) of the 1940 Act) of any party to such agreement, in accordance with the requirements of the 1940 Act.
Indemnification
Under the Management Agreement, Saratoga Investment Advisors and certain of its affiliates are not liable to us for any action taken or omitted to be taken by Saratoga Investment Advisors in connection with the performance of any of its duties or obligations under the agreement or otherwise as an investment adviser to us, except to the extent specified in Section 36(b) of the 1940 Act concerning loss resulting from a breach of fiduciary duty (as the same is finally determined by judicial proceedings) with respect to the receipt of compensation for services and except to the extent such action or omission constitutes gross negligence, willful misfeasance, bad faith or reckless disregard of its duties and obligations under the agreement.
We also provide indemnification to Saratoga Investment Advisors and certain of its affiliates for damages, liabilities, costs and expenses incurred by them in or by reason of any pending, threatened or completed action, suit, investigation or other proceeding arising out of or otherwise based upon the performance of any of its duties or obligations under the agreement or otherwise as an investment adviser to us. However, we would not provide indemnification against any liability to us or our security holders to which Saratoga Investment Advisors or such affiliates would otherwise be subject by reason of willful misfeasance, bad faith or gross negligence in the performance of any such person's duties or by reason of the reckless disregard of its duties and obligations under the agreement.
Organization of the Investment Adviser
Saratoga Investment Advisors is registered as an investment adviser under the Investment Advisers Act of 1940. The principal executive offices of Saratoga Investment Advisors are located at 535 Madison Avenue, New York, New York 10022.
Administration Agreement
Pursuant to a separate administration agreement, Saratoga Investment Advisors, who also serves as our administrator, furnishes us with office facilities, equipment and clerical, book-keeping and record keeping services. Under the administration agreement, our administrator also performs, or oversees the performance of, our required administrative services, which include, among other things, being responsible for the financial records which we are required to maintain, preparing reports for our stockholders and reports required to be filed with the SEC. In addition, our administrator assists us in determining and publishing our net asset value, oversees the preparation and filing of our tax returns and the printing and dissemination of reports to our stockholders, and generally oversees the payment of our expenses and the performance of administrative and professional services rendered to us by others. Payments under the administration agreement equal an amount based upon our allocable portion of our administrator's overhead in performing its obligations under the administration agreement, including rent and our allocable portion of the cost of our officers and their respective staffs relating to the performance of services under this agreement (including travel expenses). Our allocable portion is based on the proportion that our total assets bears to the total assets administered or managed by our administrator. Under the administration agreement, our administrator also provides managerial assistance, on our behalf, to those portfolio companies who accept our offer of assistance. The administration agreement may be terminated by either party without penalty upon 60 days written notice to the other party. The amount payable by us under the administration agreement was initially capped at $1.0 million for each annual term of the agreement. On July 10, 2014, our board of directors approved the renewal of the administration agreement for an additional one-year term and determined to maintain the cap on the payment or reimbursement of expenses by us thereunder to $1.0 million for the additional one-year term.
17
Indemnification
Under the administration agreement, Saratoga Investment Advisors and certain of its affiliates are not liable to us for any action taken or omitted to be taken by Saratoga Investment Advisors in connection with the performance of any of its duties or obligations under the agreement.
We also provide indemnification to Saratoga Investment Advisors and certain of its affiliates for damages, liabilities, costs and expenses incurred by them in or by reason of any pending, threatened or completed action, suit, investigation or other proceeding arising out of or otherwise based upon the performance of any of its duties or obligations under the agreement or otherwise as an administrator to us. However, we do not provide indemnification against any liability to us or our security holders to which Saratoga Investment Advisors or such affiliates would otherwise be subject by reason of willful misfeasance, bad faith or gross negligence in the performance of any such person's duties or by reason of the reckless disregard of its duties and obligations under the agreement.
License Agreement
We entered into a trademark license agreement with Saratoga Investment Advisors, pursuant to which Saratoga Investment Advisors grants us a non-exclusive, royalty-free license to use the name "Saratoga." Under this agreement, we have a right to use the "Saratoga" name, for so long as Saratoga Investment Advisors or one of its affiliates remains our investment adviser. Other than with respect to this limited license, we have no legal right to the "Saratoga" name. Saratoga Investment Advisors has the right to terminate the license agreement if it is no longer acting as our investment adviser. In the event the Management Agreement is terminated, we would be required to change our name to eliminate the use of the name "Saratoga."
Business Development Company Regulations
We have elected to be treated as a BDC under the 1940 Act. As with other companies regulated by the 1940 Act, a BDC must adhere to certain substantive regulatory requirements. The 1940 Act contains prohibitions and restrictions relating to transactions between BDCs and their affiliates (including any investment advisers or sub-advisers), principal underwriters and affiliates of those affiliates or underwriters, and requires that a majority of the directors be persons other than "interested persons," as that term is defined in the 1940 Act. In addition, the 1940 Act provides that we may not change the nature of our business so as to cease to be, or to withdraw our election as, a BDC, unless approved by a majority of our outstanding voting securities. A majority of the outstanding voting securities of a company is defined under the 1940 Act as the lesser of: (i) 67.0% or more of such company's stock present at a meeting if more than 50.0% of the outstanding stock of such company is present and represented by proxy or (ii) more than 50.0% of the outstanding stock of such company.
Qualifying assets
A BDC must have been organized and have its principal place of business in the United States and must be operated for the purpose of making investments in the types of securities described in (1), (2) or (3) below. Under the 1940 Act, a BDC may not acquire any asset other than assets of the type listed in Section 55(a) of the 1940 Act, which are referred to as qualifying assets, unless, at the time the acquisition is made, qualifying assets represent at least 70.0% of the company's total assets. The principal categories of qualifying assets relevant to our business are the following:
| (1) | Securities purchased in transactions not involving any public offering from the issuer of such securities, which issuer (subject to certain limited exceptions) is an eligible portfolio company, or from any person who is, or has been during the preceding 13 months, an affiliated person of an eligible portfolio company, or from any other person, subject to such rules as may be prescribed by the SEC. An eligible portfolio company is defined in the 1940 Act as any issuer which: |
| (a) | is organized under the laws of, and has its principal place of business in, the United States; |
| (b) | is not an investment company (other than a small business investment company wholly owned by the BDC) or a company that would be an investment company but for certain exclusions under the 1940 Act; and |
| (c) | satisfies either of the following: |
| (i) | does not have any class of securities listed on a national securities exchange; |
| (ii) | has a class of securities listed on a national securities exchange but has an aggregate market value of outstanding voting and non-voting common equity of less than $250.0 million; |
18
| (iii) | is controlled by a BDC or a group of companies including a BDC and the BDC has an affiliated person who is a director of the eligible portfolio company; |
| (iv) | is a small and solvent company having total assets of not more than $4.0 million and capital and surplus of not less than $2.0 million; or |
| (v) | meets such other criteria as may established by the SEC. |
| (2) | Securities of any eligible portfolio company which we control. |
| (3) | Securities purchased in a private transaction from a U.S. issuer that is not an investment company or from an affiliated person of the issuer, or in transactions incident thereto, if the issuer is in bankruptcy and subject to reorganization or if the issuer, immediately prior to the purchase of its securities was unable to meet its obligations as they came due without material assistance other than conventional lending or financing arrangements. |
| (4) | Securities of an eligible portfolio company purchased from any person in a private transaction if there is no ready market for such securities and we already own at least 60.0% of the outstanding equity of the eligible portfolio company. |
| (5) | Securities received in exchange for or distributed on or with respect to securities described in (1) through (4) above, or pursuant to the exercise of options, warrants or rights relating to such securities. |
| (6) | Cash, cash equivalents, U.S. Government securities or high-quality debt securities maturing in one year or less from the time of investment. |
Managerial assistance to portfolio companies
Business development companies generally must offer to make available to the issuer of the securities in which we invest significant managerial assistance, except in circumstances where either (i) the business development company controls such issuer of securities or (ii) the business development company purchases such securities in conjunction with one or more other persons acting together and one of the other persons in the group makes available such managerial assistance. As a BDC we offer, and must provide upon request, managerial assistance to our portfolio companies. Making available significant managerial assistance means, among other things, any arrangement whereby the BDC, through its directors, officers or employees or those of its investment adviser, offers to provide, and, if accepted, does so provide, significant guidance and counsel concerning the management, operations or business objectives and policies of a portfolio company. This assistance could involve, among other things, monitoring the operations of our portfolio companies, participating in board and management meetings, consulting with and advising officers of portfolio companies and providing other organizational and financial guidance. Pursuant to a separate administration agreement, our investment adviser provides such managerial assistance on our behalf to portfolio companies that request this assistance, recognizing that our involvement with each investment will vary based on factors including the size of the company, the nature of our investment, the company's overall stage of development and our relative position in the capital structure. We may receive fees for these services.
Temporary investments
As a BDC, pending investment in other types of "qualifying assets," as described above, our investments may consist of cash, cash equivalents, U.S. Government securities or high-quality debt securities maturing in one year or less from the time of investment, which we refer to, collectively, as temporary investments, so that 70.0% of our assets are qualifying assets. Typically, we will invest in U.S. Treasury bills or in repurchase agreements, provided that such agreements are fully collateralized by cash or securities issued by the U.S. Government or its agencies. A repurchase agreement involves the purchase by an investor, such as us, of a specified security and the simultaneous agreement by the seller to repurchase it at an agreed-upon future date and at a price which is greater than the purchase price by an amount that reflects an agreed-upon interest rate. There is no percentage restriction on the proportion of our assets that may be invested in such repurchase agreements. However, if more than 25.0% of our total assets constitute repurchase agreements from a single counterparty, we would not meet the asset diversification requirements in order to qualify as a RIC for U.S. federal income tax purposes. Thus, we do not intend to enter into repurchase agreements with a single counterparty in excess of this limit. Our investment adviser will monitor the creditworthiness of the counterparties with which we enter into repurchase agreement transactions.
19
Indebtedness and senior securities
As a BDC, we are permitted, under specified conditions, to issue multiple classes of indebtedness and one class of shares of stock senior to our common stock if our asset coverage, as defined in the 1940 Act, is at least equal to 200.0% immediately after each such issuance. In addition, while any indebtedness and senior securities remain outstanding, we must generally make provisions to prohibit any distribution to our stockholders or the repurchase of such securities or stock unless we meet the applicable asset coverage ratios at the time of the distribution or repurchase. We may also borrow amounts up to 5.0% of the value of our total assets for temporary or emergency purposes without regard to asset coverage.
Common stock
We are generally not able to issue and sell our common stock at a price below net asset value per share. We may, however, sell our common stock, warrants, options or rights to acquire our common stock, at a price below the current net asset value of the common stock if our board of directors determines that such sale is in our best interests and that of our stockholders, and our stockholders approve such sale. In any such case, the price at which our securities are to be issued and sold may not be less than a price which, in the determination of our board of directors, closely approximates the market value of such securities (less any distributing commission or discount). We may also make rights offerings to our stockholders at prices per share less than the net asset value per share, subject to applicable requirements of the 1940 Act.
Code of ethics
As a BDC, we and Saratoga Investment Advisors have each adopted a code of ethics pursuant to Rule 17j-1 under the 1940 Act that establishes procedures for personal investments and restricts certain personal securities transactions. Personnel subject to each code may invest in securities for their personal investment accounts, including securities that may be purchased or held by us, so long as such investments are made in accordance with the code's requirements.
Proxy voting policies and procedures
SEC registered investment advisers that have the authority to vote (client) proxies (which authority may be implied from a general grant of investment discretion) are required to adopt policies and procedures reasonably designed to ensure that the adviser votes proxies in the best interests of its clients. Registered investment advisers also must maintain certain records on proxy voting. In most cases, we will invest in securities that do not generally entitle us to voting rights in our portfolio companies. When we do have voting rights, we will delegate the exercise of such rights to our investment adviser.
Saratoga Investment Advisors has particular proxy voting policies and procedures in place. In determining how to vote, officers of Saratoga Investment Advisors will consult with each other, taking into account our interests and the interests of our investors, as well as any potential conflicts of interest. Saratoga Investment Advisors will consult with legal counsel to identify potential conflicts of interest. Where a potential conflict of interest exists, Saratoga Investment Advisors may, if it so elects, resolve it by following the recommendation of a disinterested third party, by seeking the direction of our independent directors or, in extreme cases, by abstaining from voting. While Saratoga Investment Advisors may retain an outside service to provide voting recommendations and to assist in analyzing votes, it will not delegate its voting authority to any third party.
An officer of Saratoga Investment Advisors will keep a written record of how all such proxies are voted. It will retain records of (1) proxy voting policies and procedures, (2) all proxy statements received (or it may rely on proxy statements filed on the SEC's EDGAR system in lieu thereof), (3) all votes cast, (4) investor requests for voting information, and (5) any specific documents prepared or received in connection with a decision on a proxy vote. If it uses an outside service, Saratoga Investment Advisors may rely on such service to maintain copies of proxy statements and records, so long as such service will provide a copy of such documents promptly upon request.
Saratoga Investment Advisors' proxy voting policies are not exhaustive and are designed to be responsive to the wide range of issues that may be subject to a proxy vote. In general, Saratoga Investment Advisors will vote our proxies in accordance with these guidelines unless: (1) it has determined otherwise due to the specific and unusual facts and circumstances with respect to a particular vote, (2) the subject matter of the vote is not covered by these guidelines, (3) a material conflict of interest is present, or (4) it finds it necessary to vote contrary to its general guidelines to maximize stockholder value or our best interests.
In reviewing proxy issues, Saratoga Investment Advisors generally will use the following guidelines:
Elections of Directors: In general, Saratoga Investment Advisors will vote in favor of the management-proposed slate of directors. If there is a proxy fight for seats on a portfolio company's board of directors, or Saratoga Investment Advisors determines
20
that there are other compelling reasons for withholding our vote, it will determine the appropriate vote on the matter. It may withhold votes for directors that fail to act on key issues, such as failure to: (1) implement proposals to declassify a board, (2) implement a majority vote requirement, (3) submit a rights plan to a stockholder vote or (4) act on tender offers where a majority of stockholders have tendered their shares. Finally, Saratoga Investment Advisors may withhold votes for directors of non-U.S. issuers where there is insufficient information about the nominees disclosed in the proxy statement.
Appointment of Auditors: We believe that a portfolio company remains in the best position to choose its independent auditors and Saratoga Investment Advisors will generally support management's recommendation in this regard.
Changes in Capital Structure: Changes in a portfolio company's organizational documents may be required by state or federal regulation. In general, Saratoga Investment Advisors will cast our votes in accordance with the management on such proposals. However, Saratoga Investment Advisors will consider carefully any proposal regarding a change in corporate structure that is not required by state or federal regulation.
Corporate Restructurings, Mergers and Acquisitions: We believe proxy votes dealing with corporate reorganizations are an extension of the investment decision. Accordingly, Saratoga Investment Advisors will analyze such proposals on a case-by-case basis and vote in accordance with its perception of our interests.
Proposals Affecting Stockholder Rights: We will generally vote in favor of proposals that give stockholders a greater voice in the affairs of a portfolio company and oppose any measure that seeks to limit such rights. However, when analyzing such proposals, Saratoga Investment Advisors will balance the financial impact of the proposal against any impairment of stockholder rights as well as of our investment in the portfolio company.
Corporate Governance: We recognize the importance of good corporate governance. Accordingly, Saratoga Investment Advisors will generally favor proposals that promote transparency and accountability within a portfolio company.
Anti-Takeover Measures: Saratoga Investment Advisors will evaluate, on a case-by-case basis, any proposals regarding anti-takeover measures to determine the likely effect on stockholder value dilution.
Share Splits: Saratoga Investment Advisors will generally vote with management on share split matters.
Limited Liability of Directors: Saratoga Investment Advisors will generally vote with management on matters that could adversely affect the limited liability of directors.
Social and Corporate Responsibility: Saratoga Investment Advisors will review proposals related to social, political and environmental issues to determine whether they may adversely affect stockholder value. It may abstain from voting on such proposals where they do not have a readily determinable financial impact on stockholder value.
Privacy principles
We are committed to protecting the privacy of our stockholders. The following explains the privacy policies of Saratoga Investment Corp., Saratoga Investment Advisors and their affiliated companies.
We will safeguard, according to strict standards of security and confidentiality, all information we receive about our stockholders. The only information we collect from stockholders is the holder's name, address, number of shares and social security number. This information is used only so that we can send annual reports and other information about us to the stockholder, and send the stockholder proxy statements or other information required by law.
We do not share this information with any non-affiliated third party except as described below.
| • | Authorized Employees of Saratoga Investment Advisors. It is our policy that only authorized employees of Saratoga Investment Advisors who need to know a stockholder's personal information will have access to it. |
| • | Service Providers. We may disclose your personal information to companies that provide services on our behalf, such as recordkeeping, processing a stockholder's trades, and mailing stockholder information. These companies are required to protect our stockholders' information and use it solely for the purpose for which they received it. |
21
| • | Courts and Government Officials. If required by law, we may disclose a stockholder's personal information in accordance with a court order or at the request of government regulators. Only that information required by law, subpoena, or court order will be disclosed. |
Compliance with applicable laws
As a BDC, we are periodically examined by the SEC for compliance with the 1940 Act.
We are required to provide and maintain a bond issued by a reputable fidelity insurance company to protect us against larceny and embezzlement. Furthermore, as a BDC, we are prohibited from protecting any director or officer against any liability to us or our stockholders arising from willful misfeasance, bad faith, gross negligence or reckless disregard of the duties involved in the conduct of such person's office.
We and Saratoga Investment Advisors are each required to adopt and implement written policies and procedures reasonably designed to prevent violation of the federal securities laws, review these policies and procedures annually for their adequacy and the effectiveness of their implementation, and designate a chief compliance officer to be responsible for administering the policies and procedures.
Co-investment
We may be prohibited under the 1940 Act from knowingly participating in certain transactions with our affiliates without the prior approval of our board of directors who are not interested persons and, in some cases, prior approval by the SEC. Thus, based on current SEC interpretations, co-investment transactions involving a BDC like us and an entity that is advised by Saratoga Investment Advisors or an affiliated adviser generally could not be effected without SEC relief. The staff of the SEC has, however, granted no-action relief permitting for purchases of a single class of privately-placed securities provided that the adviser negotiates no term other than price and certain other conditions are met. As a result, currently we only expect to co-invest on a concurrent basis with affiliates of Saratoga Investment Advisors when each of us will own the same securities of the issuer and when no term is negotiated other than price. Any such investment would be made, subject to compliance with existing regulatory guidance, applicable regulations and our allocation procedures.
We may in the future submit an exemptive application to the SEC to permit greater flexibility to negotiate the terms of co-investments because we believe that it will be advantageous for us to co-invest with affiliates of Saratoga Investment Advisors where such investment is consistent with the investment objective, investment positions, investment policies, investment strategies, investment restrictions, regulatory requirements and other pertinent factors applicable to us. However, there is no assurance that any application for exemptive relief, if made, would be granted by the SEC.
Small Business Investment Company Regulations
On March 28, 2012, our wholly-owned subsidiary, Saratoga Investment Corp. SBIC, LP, received an SBIC license from the SBA.
The SBIC license allows our SBIC subsidiary to obtain leverage by issuing SBA-guaranteed debentures, subject to the satisfaction of certain customary procedures. SBA-guaranteed debentures are non-recourse, interest only debentures with interest payable semi-annually and have a ten year maturity. The principal amount of SBA-guaranteed debentures is not required to be paid prior to maturity but may be prepaid at any time without penalty. The interest rate of SBA-guaranteed debentures is fixed at the time of issuance at a market-driven spread over U.S. Treasury Notes with 10-year maturities.
SBICs are designed to stimulate the flow of private equity capital to eligible small businesses. Under SBA regulations, SBICs may make loans to eligible small businesses and invest in the equity securities of small businesses. Under present SBA regulations, eligible small businesses include businesses that have a tangible net worth not exceeding $19.5 million and have average annual fully taxed net income not exceeding $6.5 million for the two most recent fiscal years. In addition, an SBIC must devote 25.0% of its investment activity to "smaller" concerns as defined by the SBA. A smaller concern is one that has a tangible net worth not exceeding $6.0 million and has average annual fully taxed net income not exceeding $2.0 million for the two most recent fiscal years. SBA regulations also provide alternative size standard criteria to determine eligibility, which depend on the industry in which the business is engaged and are based on such factors as the number of employees and gross sales. According to SBA regulations, SBICs may make long-term loans to small businesses, invest in the equity securities of such businesses and provide them with consulting and advisory services.
22
SBA regulations currently limit the amount of SBA-guaranteed debentures that an SBIC may issue to $150.0 million when it has at least $75.0 million in regulatory capital. Affiliated SBICs are permitted to issue up to a combined maximum amount of $225.0 million in SBA-guaranteed debentures when they have at least $112.5 million in combined regulatory capital.
On April 2, 2015, the SBA issued a "green light" or "go forth" letter inviting us to continue our application process to obtain a license to form and operate our second SBIC subsidiary. If approved, a second SBIC license would provide us an incremental source of long-term capital by permitting us to issue $75 million of additional SBA-guaranteed debentures in addition to the $150 million already approved under the first license. Receipt of a green light letter from the SBA does not assure an applicant that the SBA will ultimately issue an SBIC license and we have received no assurance or indication from the SBA that it will receive an SBIC license, or of the timeframe in which it would receive a license, should one be granted.
As of February 28, 2015, our SBIC subsidiary had $59.3 million in regulatory capital and $79.0 million of SBA-guaranteed debentures outstanding. The SBA restricts the ability of SBICs to repurchase their capital stock. SBA regulations also include restrictions on a "change of control" or transfer of an SBIC and require that SBICs invest idle funds in accordance with SBA regulations. In addition, our SBIC subsidiary may also be limited in its ability to make distributions to us if it does not have sufficient capital, in accordance with SBA regulations.
Our SBIC subsidiary is subject to regulation and oversight by the SBA, including requirements with respect to maintaining certain minimum financial ratios and other covenants. The SBA, as a creditor, will have a superior claim to our SBIC subsidiary's assets over our stockholders in the event we liquidate our SBIC subsidiary or the SBA exercises its remedies under the SBA-guaranteed debentures issued by our SBIC subsidiary upon an event of default.
We received exemptive relief from the SEC to permit us to exclude the debt of our SBIC guaranteed by the SBA from the definition of senior securities in the 200.0% asset coverage test under the 1940 Act. This allows us increased flexibility under the 200.0% asset coverage test by permitting us to borrow up to $150.0 million more than we would otherwise be able to absent the receipt of this exemptive relief.
Available Information
We file with or submit to the SEC annual, quarterly and current periodic reports, proxy statements and other information meeting the informational requirements of the Securities Exchange of 1934, as amended (the "Exchange Act"). You may inspect and copy these reports, proxy statements and other information at the Public Reference Room of the SEC at 100 F Street, N.E., Washington, D.C. 20549. You may obtain information on the operation of the Public Reference Room by calling the SEC at 1-800-SEC-0330. Copies of these reports, proxy and information statements and other information may be obtained, after paying a duplicating fee, by electronic request at the following e-mail address: [email protected], or by writing the SEC's Public Reference Section, Washington, D.C. 20549-0102. In addition, the SEC maintains an Internet website that contains reports, proxy and information statements and other information filed electronically by us with the SEC at http://www.sec.gov. Our Internet address is http://www.saratogainvestmentcorp.com. We make available free of charge on our Internet website our annual report on Form 10-K, quarterly reports on Form 10-Q, current reports on Form 8-K, and amendments to those reports as soon as reasonably practicable after we electronically file such material with, or furnish it to, the SEC. Information contained on our website is not incorporated by reference into this Annual Report, and you should not consider that information to be part of this Annual Report.
Item 1A. Risk Factors
Investing in our securities involves a high degree of risk. The risks set forth below are the principal risks with respect to the Company generally and with respect to business development companies, they may not be the only risks we face. If any of the following risks occur, our business and financial condition could be materially and adversely affected. If any of the risks occur, our business, financial condition and results of operations could be materially adversely affected. In such case, our net asset value and the trading price of our securities could decline.
Risks Related to Our Business and Structure
The current state of the economy and financial markets increases the likelihood of adverse effects on our financial position and results of operations.
The broader economic fundamentals of the United States economy remain uncertain. Unemployment levels remain elevated and other economic fundamentals remain depressed. In the event that the United States economic performance contracts, it is likely that the financial results of middle market companies, like those in which we invest, could experience deterioration or limited growth, which could ultimately lead to difficulty in meeting their debt service requirements and an increase in defaults. Consequently, we can provide no assurance that the performance of certain of our portfolio companies will not be negatively impacted by economic or other conditions, which could also have a negative impact on our future results.
23
The current worldwide financial market situation, as well as various social and political tensions in the United States and around the world, may continue to contribute to increased market volatility, may have long-term effects on the United States and worldwide financial markets, and may cause further economic uncertainties or deterioration in the United States and worldwide. Since 2010, several European Union ("EU") countries, including Greece, Ireland, Italy, Spain, and Portugal, have faced budget issues, some of which may have negative long-term effects for the economies of those countries and other EU countries. There is continued concern about national-level support for the Euro and the accompanying coordination of fiscal and wage policy among European Economic and Monetary Union member countries. In addition, the fiscal policy of foreign nations, such as China, may have a severe impact on the worldwide and United States financial markets. Moreover, there are concerns that the recent economic slowdown in China could have a negative impact on markets throughout the world. We do not know how long the financial markets will continue to be affected by these events and cannot predict the effects of these or similar events in the future on the United States economy and securities markets or on our investments. We monitor developments and seek to manage our investments in a manner consistent with achieving our investment objective, but there can be no assurance that we will be successful in doing so.
Although we have been able to secure access to additional liquidity, the potential for volatility in the debt and in the equity capital markets provides no assurance that debt or equity capital will be available to us in the future on favorable terms, or at all.
We may be obligated to pay Saratoga Investment Advisors incentive fees even if we incur a net loss, or there is a decline in the value of our portfolio.
Saratoga Investment Advisors is entitled to incentive fees for each fiscal quarter in an amount equal to a percentage of the excess of our investment income for that quarter (before deducting incentive compensation, but net of operating expenses and certain other items) above a threshold return for that quarter. Our pre-incentive fee net investment income, for incentive compensation purposes, excludes realized and unrealized capital gains or losses that we may incur in the fiscal quarter, even if such capital gains or losses result in a net gain or loss on our statement of operations for that quarter. Thus, we may be required to pay Saratoga Investment Advisors incentive fees for a fiscal quarter even if there is a decline in the value of our portfolio or we incur a net loss for that quarter.
Under the terms of the Management Agreement, we may have to pay incentive fees to Saratoga Investment Advisors in connection with the sale of an investment that is sold at a price higher than the fair value of such investment on May 31, 2010, even if we incur a loss on the sale of such investment.
Incentive fees on capital gains paid to Saratoga Investment Advisors under the Management Agreement equals 20.0% of our "incentive fee capital gains," which equals our realized capital gains on a cumulative basis from May 31, 2010 through the end of the year, if any, computed net of all realized capital losses and unrealized capital depreciation on a cumulative basis, less the aggregate amount of any previously paid capital gain incentive fee. Under the Management Agreement, the capital gains portion of the incentive fee is based on realized gains and realized and unrealized losses from May 31, 2010. Therefore, realized and unrealized losses incurred prior to such time will not be taken into account when calculating the capital gains portion of the incentive fee, and Saratoga Investment Advisors will be entitled to 20.0% of the incentive fee capital gains that arise after May 31, 2010. In addition, the cost basis for computing realized gains and losses on investments held by us as of May 31, 2010 will equal the fair value of such investments as of such date. See our Form 10-Q for the quarter ended May 31, 2010 that was filed with the SEC on July 15, 2010 for the fair value and other information related to our investments as of such date. As a result, we may be required to pay incentive fees to Saratoga Investment Advisors on the sale of an investment even if we incur a realized loss on such investment, so long as the investment is sold for an amount greater than its fair value as of May 31, 2010.
The way in which the base management and incentive fees under the Management Agreement is determined may encourage Saratoga Investment Advisors to take actions that may not be in our best interests.
The incentive fee payable by us to our investment adviser may create an incentive for it to make investments on our behalf that are risky or more speculative than would be the case in the absence of such compensation arrangement, which could result in higher investment losses, particularly during cyclical economic downturns. The way in which the incentive fee payable to our investment adviser is determined, which is calculated separately in two components as a percentage of the income (subject to a hurdle rate) and as a percentage of the realized gain on invested capital, may encourage our investment adviser to use leverage to increase the return on our investments or otherwise manipulate our income so as to recognize income in quarters where the hurdle rate is exceeded. Moreover, we pay Saratoga Investment Advisors a base management fee based on our total assets, including any investments made with borrowings, which may create an incentive for it to cause us to incur more leverage than is prudent, or not to repay our outstanding indebtedness when it may be advantageous for us to do so, in order to maximize its compensation. Under certain circumstances, the use of leverage may increase the likelihood of default, which would disfavor the holders of our securities.
24
The incentive fee payable by us to our investment adviser also may create an incentive for our investment adviser to invest on our behalf in instruments that have a deferred interest feature. Under these investments, we would accrue the interest over the life of the investment but would not receive the cash income from the investment until the end of the investment's term, if at all. Our net investment income used to calculate the income portion of our incentive fee, however, includes accrued interest. Thus, a portion of the incentive fee would be based on income that we have not yet received in cash and may never receive in cash if the portfolio company is unable to satisfy such interest payment obligation to us. Consequently, while we may make incentive fee payments on income accruals that we may not collect in the future and with respect to which we do not have a "claw back" right against our investment adviser per se, the amount of accrued income written off in any period will reduce the income in the period in which such write-off was taken and may thereby reduce such period's incentive fee payment.
In addition, Saratoga Investment Advisors receives a quarterly income incentive fee based, in part, on our pre-incentive fee net investment income, if any, for the immediately preceding calendar quarter. This income incentive fee is subject to a fixed quarterly hurdle rate before providing an income incentive fee return to Saratoga Investment Advisors. This fixed hurdle rate was determined when then current interest rates were relatively low on a historical basis. Thus, if interest rates rise, it would become easier for our investment income to exceed the hurdle rate and, as a result, more likely that Saratoga Investment Advisors will receive an income incentive fee than if interest rates on our investments remained constant or decreased. In addition, if we repurchase our outstanding debt securities, including our 7.50% Notes due 2020 (the "Notes") and such repurchase results in our recording a net gain on the extinguishment of debt for financial reporting and tax purposes, such net gain will be included in our pre-incentive fee net investment income for purposes of determining the income incentive fee payable to our investment adviser under the Management Agreement.
Moreover, our investment adviser receives the incentive fee based, in part, upon net capital gains realized on our investments. Unlike the portion of the incentive fee based on income, there is no performance threshold applicable to the portion of the incentive fee based on net capital gains. As a result, our investment adviser may have a tendency to invest more in investments that are likely to result in capital gains as compared to income producing securities. Such a practice could result in our investing in more speculative securities than would otherwise be the case, which could result in higher investment losses, particularly during economic downturns.
Our board of directors will seek to ensure that Saratoga Investment Advisors is acting in our best interests and that any conflict of interest faced by Saratoga Investment Advisors in its capacity as our investment adviser does not negatively impact us.
The base management fee we pay to Saratoga Investment Advisors may cause it to increase our leverage contrary to our interest.
We pay Saratoga Investment Advisors a quarterly base management fee based on the value of our total assets (including any assets acquired with leverage). Accordingly, Saratoga Investment Advisors has an economic incentive to increase our leverage. Our board of directors monitors the conflicts presented by this compensation structure by approving the amount of leverage that we incur. If our leverage is increased, we will be exposed to increased risk of loss, bear the increase cost of issuing and servicing such senior indebtedness, and will be subject to any additional covenant restrictions imposed on us in an indenture or other instrument or by the applicable lender.
We employ leverage, which magnifies the potential for gain or loss on amounts invested and may increase the risk of investing in us.
Borrowings, also known as leverage, magnify the potential for gain or loss on amounts invested and, therefore, increase the risks associated with investing in us. We borrow from and issue senior debt securities to banks and other lenders that is secured by a lien on our assets. Holders of these senior securities have fixed dollar claims on our assets that are superior to the claims of the holders of our securities. Leverage is generally considered a speculative investment technique. Any increase in our income in excess of interest payable on our outstanding indebtedness would cause our net income to increase more than it would have had we not incurred leverage, while any decrease in our income would cause net income to decline more sharply than it would have had we not incurred leverage. Such a decline could negatively affect our ability to make common stock distributions or scheduled debt payments, including with respect to the Notes. There can be no assurance that our leveraging strategy will be successful.
As of February 28, 2015, there was a $9.6 million outstanding balance under the Credit Facility. As of February 28, 2015, we had issued $79.0 million SBA-guaranteed debentures and $48.3 million of the Notes. We may incur additional indebtedness in the future, including, but not limited to, up to an additional $35.4 million under the Credit Facility or the issuance of additional debt securities in one or more public or private offerings, although there can be no assurance that we will be successful in doing so. Our ability to service our debt depends largely on our financial performance and is subject to prevailing economic conditions and competitive pressures. The amount of leverage that we employ at any particular time will depend on our management's and our Board of Directors' assessment of market and other factors at the time of any proposed borrowing.
25
Our outstanding indebtedness imposes, and additional debt we may incur in the future will likely impose, financial and operating covenants that restrict our business activities, including limitations that could hinder our ability to finance additional loans and investments or to make the distributions required to maintain our status as a RIC. A failure to add new debt facilities or issue additional debt securities or other evidences of indebtedness in lieu of or in addition to existing indebtedness could have a material adverse effect on our business, financial condition or results of operations.
Saratoga Investment Advisors' liability is limited under the Management Agreement and we will indemnify Saratoga Investments Advisors against certain liabilities, which may lead it to act in a riskier manner on our behalf than it would when acting for its own account.
Saratoga Investment Advisors has not assumed any responsibility to us other than to render the services described in the Management Agreement. Pursuant to the Management Agreement, Saratoga Investment Advisors and its officers and employees are not liable to us for their acts under the Management Agreement absent willful misfeasance, bad faith, gross negligence or reckless disregard in the performance of their duties. We have agreed to indemnify, defend and protect Saratoga Investment Advisors and its officers and employees with respect to all damages, liabilities, costs and expenses resulting from acts of Saratoga Investment Advisors not arising out of willful misfeasance, bad faith, gross negligence or reckless disregard in the performance of their duties under the Management Agreement. These protections may lead Saratoga Investment Advisors to act in a riskier manner when acting on our behalf than it would when acting for its own account.
Substantially all of our assets are subject to security interests under our Credit Facility or claims of the SBA with respect to SBA-guaranteed debentures we may issue and if we default on our obligations thereunder, we may suffer adverse consequences, including the foreclosure on our assets.
Substantially all of our assets are pledged as collateral under the Credit Facility or are subject to a superior claim over the holders of our common stock or the Notes by the SBA pursuant to the SBA-guaranteed debentures. If we default on our obligations under the Credit Facility or the SBA-guaranteed debentures, Madison Capital Funding and/or the SBA may have the right to foreclose upon and sell, or otherwise transfer, the collateral subject to their security interests or superior claim. In such event, we may be forced to sell our investments to raise funds to repay our outstanding borrowings in order to avoid foreclosure and these forced sales may be at times and at prices we would not consider advantageous. Moreover, such deleveraging of our company could significantly impair our ability to effectively operate our business in the manner in which we have historically operated.
In addition, if Madison Capital Funding exercises its right to sell the assets pledged under the Credit Facility, such sales may be completed at distressed sale prices, thereby diminishing or potentially eliminating the amount of cash available to us after repayment of the amounts outstanding under the Credit Facility.
We are exposed to risks associated with changes in interest rates including potential effects on our cost of capital and net investment income.
General interest rate fluctuations and changes in credit spreads on floating rate loans may have a substantial negative impact on our investments and investment opportunities and, accordingly, may have a material adverse effect on our rate of return on invested capital. In addition, an increase in interest rates would make it more expensive to use debt to finance our investments. Decreases in credit spreads on debt that pays a floating rate of return would have an impact on the income generation of our floating rate assets. Trading prices for debt that pays a fixed rate of return tend to fall as interest rates rise. Trading prices tend to fluctuate more for fixed rate securities that have longer maturities. Although we have no policy governing the maturities of our investments, under current market conditions we expect that we will invest in a portfolio of debt generally having maturities of up to ten years. This means that we will be subject to greater risk (other things being equal) than an entity investing solely in shorter-term securities.
Because we may borrow to fund our investments, a portion of our net investment income may be dependent upon the difference between the interest rate at which we borrow funds and the interest rate at which we invest these funds. A portion of our investments will have fixed interest rates, while a portion of our borrowings will likely have floating interest rates. As a result, a significant change in market interest rates could have a material adverse effect on our net investment income. In periods of rising interest rates, our cost of funds could increase, which would reduce our net investment income. We may hedge against such interest rate fluctuations by using standard hedging instruments such as futures, options and forward contracts, subject to applicable legal requirements, including without limitation, all necessary registrations (or exemptions from registration) with the Commodity Futures Trading Commission. These activities may limit our ability to participate in the benefits of lower interest rates with respect to the hedged borrowings. Adverse developments resulting from changes in interest rates or hedging transactions could have a material adverse effect on our business, financial condition and results of operations.
26
There are significant potential conflicts of interest which could adversely impact our investment returns.
Our executive officers and directors, and the members of our investment adviser, serve or may serve as officers, directors or principals of entities that operate in the same or a related line of business as we do or of investment funds managed by our affiliates. Accordingly, they may have obligations to investors in those entities, the fulfillment of which might not be in the best interests of us or our stockholders. For example, Christian L. Oberbeck, our chief executive officer and managing member of our investment adviser, is the managing partner of Saratoga Partners, a middle market private equity investment firm. In addition, the principals of our investment adviser may manage other funds which may from time to time have overlapping investment objectives with those of us and accordingly invest in, whether principally or secondarily, asset classes similar to those targeted by us. If this should occur, the principals of our investment adviser will face conflicts of interest in the allocation of investment opportunities to us and such other funds. Although our investment professionals will endeavor to allocate investment opportunities in a fair and equitable manner, we and our common stockholders could be adversely affected in the event investment opportunities are allocated among us and other investment vehicles managed or sponsored by, or affiliated with, our executive officers, directors and investment adviser, and the members of our investment adviser.
Changes in laws or regulations governing our operations, or changes in the interpretation thereof, and any failure by us to comply with laws or regulations governing our operations may adversely affect our business.
We are subject to regulation at the local, state and federal levels. These laws and regulations, as well as their interpretation, may be changed from time to time. Any change in these laws or regulations, or their interpretation, or any failure by us to comply with these laws or regulations may adversely affect our business.
We face cyber-security risks.
Our business operations rely upon secure information technology systems for data processing, storage and reporting. Despite careful security and controls design, implementation and updating, our information technology systems could become subject to cyber-attacks. Network, system, application and data breaches could result in operational disruptions or information misappropriation, which could have a material adverse effect on our business, results of operations and financial condition.
If we are unable to maintain the availability of our electronic data systems and safeguard the security of our data, our ability to conduct business may be compromised, which could impair our liquidity, disrupt our business, damage our reputation and cause losses.
Cybersecurity refers to the combination of technologies, processes, and procedures established to protect information technology systems and data from unauthorized access, attack, or damage. We are subject to cybersecurity risks. Information cyber security risks have significantly increased in recent years and, while we have not experienced any material losses relating to cyber attacks or other information security breaches, we could suffer such losses in the future. Our computer systems, software and networks may be vulnerable to unauthorized access, computer viruses or other malicious code and other events that could have a security impact. If one or more of such events occur, this potentially could jeopardize confidential and other information, including nonpublic personal information and sensitive business data, processed and stored in, and transmitted through, our computer systems and networks, or otherwise cause interruptions or malfunctions in our operations or the operations of our customers or counterparties, which could result in significant losses or reputational damage. This could result in significant losses, reputational damage, litigation, regulatory fines or penalties, or otherwise adversely affect our business, financial condition or results of operations. Privacy and information security laws and regulation changes, and compliance with those changes, may result in cost increases due to system changes and the development of new administrative processes. In addition, we may be required to expend significant additional resources to modify our protective measures and to investigate and remediate vulnerabilities or other exposures arising from operational and security risks. We currently do not maintain insurance coverage relating to cybersecurity risks, and we may be required to expend significant additional resources to modify our protective measures or to investigate and remediate vulnerabilities or other exposures, and we may be subject to litigation and financial losses that are not fully insured.
Third parties with which we do business may also be sources of cybersecurity or other technological risks. We outsource certain functions and these relationships allow for the storage and processing of our information, as well as customer, counterparty, employee and borrower information. While we engage in actions to reduce our exposure resulting from outsourcing, ongoing threats may result in unauthorized access, loss, exposure or destruction of data, or other cybersecurity incidents, with increased costs and other consequences, including those described above.
27
Regulations governing our operation as a BDC will affect our ability to raise additional capital.
Our business requires a substantial amount of additional capital. We may acquire additional capital from the issuance of senior securities or other indebtedness or the issuance of additional shares of our common stock. However, we may not be able to raise additional capital in the future on favorable terms or at all. We may issue debt securities or preferred securities, which we refer to collectively as "senior securities," and we may borrow money from banks or other financial institutions, up to the maximum amount permitted by the 1940 Act.
Under the provisions of the 1940 Act, we are permitted, as a BDC, to incur indebtedness or issue senior securities only in amounts such that our asset coverage, as defined in the 1940 Act, equals at least 200.0% after such incurrence or issuance. Our ability to issue different types of securities is also limited. Compliance with these requirements may unfavorably limit our investment opportunities and reduce our ability in comparison to other companies to profit from favorable spreads between the rates at which we can borrow and the rates at which we can lend. As a business development company, therefore, we may need to issue equity more frequently than our privately owned competitors, which may lead to greater stockholder dilution. With respect to certain types of senior securities, we must make provisions to prohibit any dividend distribution to our stockholders or the repurchase of certain of our securities, unless we meet the applicable asset coverage ratios at the time of the dividend distribution or repurchase. If the value of our assets declines, we may be unable to satisfy the asset coverage test. If that happens, we may be required to liquidate a portion of our investments and repay a portion of our indebtedness at a time when such sales may be disadvantageous in order to make dividend distributions or repurchase certain of our securities.
We are not generally able to issue and sell our common stock at a price below net asset value per share. We may, however, sell our common stock, or warrants, options or rights to acquire our common stock, at a price below the current net asset value of the common stock if our board of directors determines that such sale is in our best interests and the best interests of our stockholders, and our stockholders approve such sale. In any such case, the price at which our securities are to be issued and sold may not be less than a price which, in the determination of our board of directors, closely approximates the market value of such securities (less any commission or discount). If our common stock trades at a discount to net asset value, this restriction could adversely affect our ability to raise capital. At our 2014 annual meeting of stockholders, our stockholders approved a proposal that authorizes us to sell shares of our common stock below the then current net asset value per share of our common stock at an offering price per share that is not less than 85% of the then current net asset value per share in one or more offerings for a period of one year ending on the earlier of September 30, 2015 or the date of our 2015 annual meeting of stockholders. Continued access to this exception will require approval of similar proposals at future stockholder meetings. If our common stock trades at a discount to net asset value, this restriction could adversely affect our ability to raise capital.
Pending legislation may allow us to incur additional leverage.
As a business development company, we are generally not permitted to incur indebtedness unless immediately after such borrowing we have an asset coverage for total borrowings of at least 200% (i.e., the amount of debt may not exceed 50% of the value of our assets). We have agreed in the covenant in the indenture governing the Notes not to violate this section of the 1940 Act, whether or not we continue to be subject to such provision, but giving effect, in either case, to any exemptive relief granted to us by the SEC. Recent legislation, if passed, would modify this section of the 1940 Act and increase the amount of debt that business development companies may incur by modifying the percentage from 200% to 150%. As a result, we may be able to incur additional indebtedness in the future and therefore your risk of an investment in our securities may increase.
The agreement governing our Credit Facility contains various covenants that, among other things, limits our discretion in operating our business and provides for certain minimum financial covenants.
The agreement governing the Credit Facility contains customary default provisions such as the termination or departure of certain "key persons" of Saratoga Investment Advisors, a material adverse change in our business and the failure to maintain certain minimum loan quality and performance standards. An event of default under the facility would result, among other things, in termination of the availability of further funds under the facility and an accelerated maturity date for all amounts outstanding under the facility, which would likely disrupt our business and, potentially, the portfolio companies whose loans we financed through the facility. This could reduce our revenues and, by delaying any cash payment allowed to us under the facility until the lender has been paid in full, reduce our liquidity and cash flow and impair our ability to grow our business and maintain our status as a RIC.
Each loan origination under the facility is subject to the satisfaction of certain conditions. We cannot assure you that we will be able to borrow funds under the facility at any particular time or at all.
28
We will be subject to corporate-level income tax if we fail to qualify as a RIC.
We seek to maintain our qualification as a RIC under the Code, which requires us to qualify continuously as a BDC and meet certain source of income, distribution and asset diversification requirements.
The source of income requirement is satisfied if we derive at least 90.0% of our annual gross income from interest, dividends, payments with respect to certain securities loans, gains from the sale or other disposition of securities or options thereon or foreign currencies, or other income derived with respect to our business of investing in such securities or currencies, and net income from interests in "qualified publicly traded partnerships," as defined in the Code.
The annual distribution requirement is satisfied if we distribute to our stockholders on an annual basis an amount equal to at least 90.0% of our ordinary net taxable income and realized net short-term capital gains in excess of realized net long-term capital losses, if any, reduced by deductible expenses. We are subject to certain asset coverage ratio requirements under the 1940 Act and covenants under our borrowing agreements that could, under certain circumstances, restrict us from making distributions necessary to qualify as a RIC. In such case, if we are unable to obtain cash from other sources, we may fail to qualify as a RIC and, thus, may be subject to corporate-level income tax.
The diversification requirements will be satisfied if we diversify our holdings so that at the end of each quarter of the taxable year: (i) at least 50.0% of the value of our assets consists of cash, cash equivalents, U.S. government securities, securities of other regulated investment companies, and other securities if such other securities of any one issuer do not represent more than 5.0% of the value of our assets or more than 10% of the outstanding voting securities of the issuer; and (ii) no more than 25.0% of the value of our assets is invested in the securities, other than U.S. government securities or securities of other regulated investment companies, of one issuer or of two or more issuers that are controlled, as determined under applicable tax rules, by us and that are engaged in the same or similar or related trades or businesses or in certain publicly traded partnerships.
Failure to meet these tests may result in our having to (i) dispose of certain investments quickly or (ii) raise additional capital to prevent the loss of our RIC qualification. Because most of our investments will be in private companies, any such dispositions could be made at disadvantageous prices and may result in substantial losses. If we raise additional capital to satisfy the asset diversification requirements, it could take us time to invest such capital. During this period, we will invest the additional capital in temporary investments, such as cash and cash equivalents, which we expect will earn yields substantially lower than the interest income that we anticipate receiving in respect of investments in leveraged loans and mezzanine debt.
If we fail to qualify as a RIC for any reason, all of our taxable income will be subject to U.S. federal income tax at regular corporate rates. The resulting corporate taxes could substantially reduce our net assets, the amount of income available for distribution to our common stockholders or payment of our outstanding indebtedness including the Notes. Such a failure would have a material adverse effect on us and the holders of our securities.
Because we intend to distribute between 90% and 100% of our income to our stockholders in connection with our election to be treated as a RIC, we will continue to need additional capital to finance our growth. If additional funds are unavailable or not available on favorable terms, our ability to grow will be impaired.
In order to qualify for the tax benefits available to RICs and to minimize corporate-level taxes, we intend to distribute to our stockholders between 90% and 100% of our annual taxable income, except that we may retain certain net capital gains for investment, and treat such amounts as deemed distributions to our stockholders. If we elect to treat any amounts as deemed distributions, we must pay income taxes at the corporate rate on such deemed distributions on behalf of our stockholders. As a result of these requirements, we will likely need to raise capital from other sources to grow our business. As a BDC, we generally are required to meet a coverage ratio of total assets, less liabilities and indebtedness not represented by senior securities, to total senior securities, which includes all of our borrowings and any outstanding preferred stock, of at least 200%. These requirements limit the amount that we may borrow. Because we will continue to need capital to grow our investment portfolio, these limitations may prevent us from incurring debt and require us to raise additional equity at a time when it may be disadvantageous to do so.
While we expect to be able to borrow and to issue additional debt and equity securities, we cannot assure you that debt and equity financing will be available to us on favorable terms, or at all. Also, as a BDC, we generally are not permitted to issue equity securities priced below net asset value without stockholder approval. If additional funds are not available to us, we could be forced to curtail or cease new investment activities, and our net asset value and share price could decline.
29
We may have difficulty paying our required distributions if we recognize income before or without receiving cash in respect of such income.
For federal income tax purposes, we may be required to recognize taxable income in circumstances in which we do not receive a corresponding payment in cash. For example, we may on occasion hold debt obligations that are treated under applicable tax rules as having original issue discount (such as debt instruments with PIK or, in certain cases, increasing interest rates or issued with warrants) and we must include in income each year a portion of the original issue discount that accrues over the life of the obligation, regardless of whether cash representing such income is received by us in the same taxable year. We may also have to include in income other amounts that we have not yet received in cash, such as deferred loan origination fees that are paid after origination of the loan or are paid in non-cash compensation such as warrants or stock. In addition, we may be required to accrue for federal income tax purposes amounts attributable to our investment in Saratoga CLO, a collateralized loan obligation fund, that may differ from the distributions paid in respect of our investment in the subordinated notes of such collateralized loan obligation fund because of the factors set forth above or because distributions on the subordinated notes are contractually required to be diverted for reinvestment or to pay down outstanding indebtedness.
Because any original issue discount or other amounts accrued will be included in our investment company taxable income for the year of accrual, we may be required to make a distribution to our stockholders in order to satisfy the annual distribution requirement, even though we will not have received any corresponding cash amount. As a result, we may have difficulty meeting the annual distribution requirement necessary to obtain and maintain RIC tax treatment under the Code. We may have to sell some of our investments at times and/or at prices we would not consider advantageous, raise additional debt or equity capital or forgo new investment opportunities for this purpose. If we are not able to obtain cash from other sources, we may fail to qualify for RIC tax treatment and thus become subject to corporate-level income tax.
Our ability to enter into transactions with our affiliates is restricted.
We are prohibited under the 1940 Act from participating in certain transactions with certain of our affiliates without the prior approval of the members of our independent directors and, in some cases, the SEC. Any person that owns, directly or indirectly, 5.0% or more of our outstanding voting securities is our affiliate for purposes of the 1940 Act and we are generally prohibited from buying or selling any securities (other than our securities) from or to such affiliate, absent the prior approval of our independent directors. The 1940 Act also prohibits certain "joint" transactions with certain of our affiliates, which could include investments in the same portfolio company, without prior approval of our independent directors and, in some cases, the SEC. If a person acquires more than 25.0% of our voting securities, we are prohibited from buying or selling any security (other than any security of which we are the issuer) from or to such person or certain of that person's affiliates, or entering into prohibited joint transactions with such person, absent the prior approval of the SEC. Similar restrictions limit our ability to transact business with our officers, directors or investment adviser or their affiliates. As a result of these restrictions, we may be prohibited from buying or selling any security (other than any security of which we are the issuer) from or to any portfolio company of a private equity fund managed by our investment adviser without the prior approval of the SEC, which may limit the scope of investment opportunities that would otherwise be available to us.
We operate in a highly competitive market for investment opportunities.
A number of entities compete with us to make the types of investments that we make in private middle market companies. We compete with other BDCs, public and private funds (including SBICs), commercial and investment banks, commercial financing companies, insurance companies, high-yield investors, hedge funds, and, to the extent they provide an alternative form of financing, private equity funds. Many of our competitors are substantially larger and have considerably greater financial, technical and marketing resources than us. Some competitors may have a lower cost of funds and access to funding sources that are not available to us. In addition, some of our competitors may have higher risk tolerances or different risk assessments that could allow them to consider a wider variety of investments and establish more relationships than us. Furthermore, many of our competitors are not subject to the regulatory restrictions that the 1940 Act imposes on us as a BDC. As a result of this competition, we may not be able to take advantage of attractive investment opportunities from time to time, and we cannot assure you that we will be able to identify and make investments that meet our investment objective.
We do not seek to compete primarily based on the interest rates we offer and we believe that some of our competitors may make loans with interest rates that are comparable to or lower than the rates we offer.
We may lose investment opportunities if we do not match our competitors' pricing, terms and structure. If we match our competitors' pricing, terms and structure, we may experience decreased net interest income and increased risk of credit loss. As a result of operating in such a competitive environment, we may make investments that are on better terms to our portfolio companies than we originally anticipated, which may impact our return on these investments.
30
Economic recessions or downturns could impair our portfolio companies and harm our operating results.
Many of our portfolio companies may be susceptible to economic slowdowns or recessions and may be unable to repay our debt investments during these periods. Therefore, our non-performing assets are likely to increase and the value of our portfolio is likely to decrease during these periods. Adverse economic conditions also may decrease the value of collateral securing some of our debt investments and the value of our equity investments. Economic slowdowns or recessions could lead to financial losses in our portfolio and a decrease in revenues, net income and assets. Unfavorable economic conditions also could increase our funding costs, limit our access to the capital markets or result in a decision by lenders not to extend credit to us. These events could prevent us from increasing investments and harm our operating results.
We are a non-diversified investment company within the meaning of the 1940 Act, and therefore we are not limited with respect to the proportion of our assets that may be invested in securities of a single issuer.
We are classified as a non-diversified investment company within the meaning of the 1940 Act, which means that we are not limited by the 1940 Act with respect to the proportion of our assets that we may invest in securities of a single issuer. Although we seek to maintain a diversified portfolio in accordance with our business strategies, to the extent that we assume large positions in the securities of a small number of issuers, our net asset value may fluctuate to a greater extent than that of a diversified investment company as a result of changes in the financial condition or the market's assessment of the issuer. We may also be more susceptible to any single economic or regulatory occurrence than a diversified investment company. Beyond our RIC asset diversification requirements, we do not have fixed guidelines for diversification, and our investments could be concentrated in relatively few portfolio companies.
Our financial condition and results of operation depend on our ability to manage future investments effectively.
Our ability to achieve our investment objective depends on our ability to acquire suitable investments and monitor and administer those investments, which depends, in turn, on Saratoga Investment Advisors' ability to identify, invest in and monitor companies that meet our investment criteria.
Accomplishing this result on a cost-effective basis is largely a function of Saratoga Investment Advisors' structuring of the investment process and its ability to provide competent, attentive and efficient service to us. Our executive officers and the officers and employees of Saratoga Investment Advisors have substantial responsibilities in connection with their roles at Saratoga Partners as well as responsibilities under the Management Agreement. They may also be called upon to provide managerial assistance to our portfolio companies. These demands on their time, which will increase as the number of investments grow, may distract them or slow the rate of investment. In order to grow, Saratoga Investment Advisors may need to hire, train, supervise and manage new employees. However, we cannot assure you that any such employees will contribute to the work of Saratoga Investment Advisors. Any failure to manage our future growth effectively could have a material adverse effect on our business and financial condition.
We may experience fluctuations in our quarterly results.
We could experience fluctuations in our quarterly operating results due to a number of factors, including the interest rate payable on the debt investments we make, the default rate on such investments, the level of our expenses, variations in and the timing of the recognition of realized and unrealized gains or losses, the degree to which we encounter competition in our markets and general economic conditions. As a result of these factors, results for any period should not be relied upon as being indicative of performance in future periods.
Substantially all of our portfolio investments are recorded at fair value as approved in good faith by our board of directors; such valuations are inherently uncertain and may be materially higher or lower than the values that we ultimately realize upon the disposal of such investments.
Substantially all of our portfolio is, and we expect will continue to be, comprised of investments that are not publicly traded. The value of investments that are not publicly traded may not be readily determinable. We value these investments quarterly at fair value as approved in good faith by our board of directors. Where appropriate, Saratoga Investment Advisers may utilize the services of an independent valuation firm to aid it in determining fair value. The types of factors that may be considered in valuing our investments include the nature and realizable value of any collateral, the portfolio company's ability to make payments and its earnings, the markets in which the portfolio company does business, market yield trend analysis, comparison to publicly traded companies, discounted cash flow and other relevant factors. Because such valuations, and particularly valuations of private investments and private companies, are inherently uncertain, may fluctuate over short periods of time and may be based on estimates, our determinations of fair value may differ materially from the values that would have been used if a ready market for these investments existed. Our net asset value could be materially affected if the determinations regarding the fair value of our investments were materially higher or lower than the values that we ultimately realize upon the disposal of such investments.
31
If we make unsecured debt investments, we may lack adequate protection in the event our portfolio companies become distressed or insolvent and will likely experience a lower recovery than more senior debtholders in the event our portfolio companies defaults on their indebtedness.
We make unsecured debt investments in portfolio companies. Unsecured debt investments are unsecured and junior to other indebtedness of the portfolio company. As a consequence, the holder of an unsecured debt investment may lack adequate protection in the event the portfolio company becomes distressed or insolvent and will likely experience a lower recovery than more senior debtholders in the event the portfolio company defaults on its indebtedness. In addition, unsecured debt investments of middle-market companies are often highly illiquid and in adverse market conditions may experience steep declines in valuation even if they are fully performing.
If we invest in the securities and other obligations of distressed or bankrupt companies, such investments may be subject to significant risks, including lack of income, extraordinary expenses, uncertainty with respect to satisfaction of debt, lower-than expected investment values or income potentials and resale restrictions.
We are authorized to invest in the securities and other obligations of distressed or bankrupt companies. At times, distressed debt obligations may not produce income and may require us to bear certain extraordinary expenses (including legal, accounting, valuation and transaction expenses) in order to protect and recover our investment. Therefore, to the extent we invest in distressed debt, our ability to achieve current income may be diminished which may affect our ability to make distributions on our common stock or make interest and principal payments of the Notes.
We also will be subject to significant uncertainty as to when and in what manner and for what value the distressed debt we invest in will eventually be satisfied (e.g., through a liquidation of the obligor's assets, an exchange offer or plan of reorganization involving the distressed debt securities or a payment of some amount in satisfaction of the obligation). In addition, even if an exchange offer is made or plan of reorganization is adopted with respect to distressed debt held by us, there can be no assurance that the securities or other assets received by us in connection with such exchange offer or plan of reorganization will not have a lower value or income potential than may have been anticipated when the investment was made.
Moreover, any securities received by us upon completion of an exchange offer or plan of reorganization may be restricted as to resale. As a result of our participation in negotiations with respect to any exchange offer or plan of reorganization with respect to an issuer of distressed debt, we may be restricted from disposing of such securities if we are in possession of material non-public information relating to the issuer.
Second priority liens on collateral securing loans that we make to our portfolio companies may be subject to control by senior creditors with first priority liens. If there is a default, the value of the collateral may not be sufficient to repay in full both the first priority creditors and us.
Certain loans that we make to portfolio companies will be secured on a second priority basis by the same collateral securing senior secured debt of such companies. The first priority liens on the collateral will secure the portfolio company's obligations under any outstanding senior debt and may secure certain other future debt that may be permitted to be incurred by the company under the agreements governing the loans. The holders of obligations secured by the first priority liens on the collateral will generally control the liquidation of and be entitled to receive proceeds from any realization of the collateral to repay their obligations in full before us. In addition, the value of the collateral in the event of liquidation will depend on market and economic conditions, the availability of buyers and other factors. There can be no assurance that the proceeds, if any, from the sale or sales of all of the collateral would be sufficient to satisfy the loan obligations secured by the second priority liens after payment in full of all obligations secured by the first priority liens on the collateral. If such proceeds are not sufficient to repay amounts outstanding under the loan obligations secured by the second priority liens, then we, to the extent not repaid from the proceeds of the sale of the collateral, will only have an unsecured claim against the company's remaining assets, if any.
The rights we may have with respect to the collateral securing the loans we make to our portfolio companies with senior debt outstanding may also be limited pursuant to the terms of one or more intercreditor agreements that we enter into with the holders of senior debt. Under such an intercreditor agreement, at any time that obligations that have the benefit of the first priority liens are outstanding, any of the following actions that may be taken with respect to the collateral will be at the direction of the holders of the obligations secured by the first priority liens: the ability to cause the commencement of enforcement proceedings against the collateral; the ability to control the conduct of such proceedings; the approval of amendments to collateral documents; releases of liens on the collateral; and waivers of past defaults under collateral documents. We may not have the ability to control or direct such actions, even if our rights are adversely affected.
32
The lack of liquidity in our investments may adversely affect our business.
We primarily make investments in private companies. A portion of these securities may be subject to legal and other restrictions on resale, transfer, pledge or other disposition or will otherwise be less liquid than publicly traded securities. The illiquidity of our investments may make it difficult for us to sell such investments if the need arises. In addition, if we are required to liquidate all or a portion of our portfolio quickly, we may realize significantly less than the value at which we have previously recorded our investments. In addition, we may face other restrictions on our ability to liquidate an investment in a business entity to the extent that we or our investment adviser has or could be deemed to have material non-public information regarding such business entity.
The debt securities in which we invest are subject to credit risk and prepayment risk.
An issuer of a debt security may be unable to make interest payments and repay principal. We could lose money if the issuer of a debt obligation is, or is perceived to be, unable or unwilling to make timely principal and/or interest payments, or to otherwise honor its obligations. The downgrade of a security by rating agencies may further decrease its value.
Certain debt instruments may contain call or redemption provisions which would allow the issuer thereof to prepay principal prior to the debt instrument's stated maturity. This is known as prepayment risk. Prepayment risk is greater during a falling interest rate environment as issuers can reduce their cost of capital by refinancing higher interest debt instruments with lower interest debt instruments. An issuer may also elect to refinance their debt instruments with lower interest debt instruments if the credit standing of the issuer improves. To the extent debt securities in our portfolio are called or redeemed, we may receive less than we paid for such security and we may be forced to reinvest in lower yielding securities or debt securities of issuers of lower credit quality.
Uncertainty relating to the LIBOR calculation process may adversely affect the value of our portfolio of the LIBOR-indexed, floating-rate debt securities.
Concerns have been publicized that some of the member banks surveyed by the British Bankers' Association ("BBA") in connection with the calculation of LIBOR across a range of maturities and currencies may have been under-reporting or otherwise manipulating the inter-bank lending rate applicable to them in order to profit on their derivatives positions or to avoid an appearance of capital insufficiency or adverse reputational or other consequences that may have resulted from reporting inter-bank lending rates higher than those they actually submitted. A number of BBA member banks have entered into settlements with their regulators and law enforcement agencies with respect to alleged manipulation of LIBOR, and investigations by regulators and governmental authorities in various jurisdictions are ongoing.
Actions by the BBA, regulators or law enforcement agencies may result in changes to the manner in which LIBOR is determined. Uncertainty as to the nature of such potential changes may adversely affect the market for LIBOR-based securities, including our portfolio of LIBOR-indexed, floating-rate debt securities. In addition, any further changes or reforms to the determination or supervision of LIBOR may result in a sudden or prolonged increase or decrease in reported LIBOR, which could have an adverse impact on the market for LIBOR-based securities or the value of our portfolio of LIBOR-indexed, floating-rate debt securities.
Our investment in Saratoga CLO constitutes a leveraged investment in a portfolio of predominantly senior secured first lien term loans and is subject to additional risks and volatility.
At February 28, 2015, our investment in the subordinated notes of Saratoga CLO, a collateralized loan obligation fund, had a fair value of $17.0 million and constituted 7.1% of our portfolio. This investment constitutes a first loss position in a portfolio that, as of February 28, 2015, was composed of $296.9 million in aggregate principal amount of primarily senior secured first lien term loans and $5.8 million in uninvested cash. A first loss position means that we will suffer the first economic losses if the value of Saratoga CLO decreases. First loss positions typically carry a higher risk and earn a higher yield. Interest payments generated from this portfolio will be used to pay the administrative expenses of Saratoga CLO and interest on the debt issued by Saratoga CLO before paying a return on the subordinated notes. Principal payments will be similarly applied to pay administrative expenses of Saratoga CLO and for reinvestment or repayment of Saratoga CLO debt before paying a return on, or repayment of, the subordinated notes. In addition, 80.0% of our fixed management fee and 100.0% our incentive management fee for acting as the collateral manager of Saratoga CLO is subordinated to the payment of interest and principal on Saratoga CLO debt. Any losses on the portfolio will accordingly reduce the cash flow available to pay these management fees and provide a return on, or repayment of, our investment. Depending on the amount and timing of such losses, we may experience smaller than expected returns and, potentially, the loss of our entire investment.
33
As the manager of the portfolio of Saratoga CLO we will have some ability to direct the composition of the portfolio, but our discretion is limited by the terms of the debt issued by Saratoga CLO which may limit our ability to make investments that we feel are in the best interests of the subordinated notes, and the availability of suitable investments. The performance of Saratoga CLO's portfolio is also subject to many of the same risks sets forth in this Annual Report with respect to portfolio investments in leveraged loans.
In the event that a bankruptcy court orders the substantive consolidation of us with Saratoga CLO, the creditors of Saratoga CLO, including the holders of $296.9 million aggregate principal amount of debt, as of February 28, 2015 issued by Saratoga CLO, would have claims against the consolidated bankruptcy estate, which would include our assets.
We believe that we have observed and will observe certain formalities and operating procedures that are generally recognized requirements for maintaining our separate existence and that our assets and liabilities can be readily identified as distinct from those of Saratoga CLO. However, we cannot assure you that a bankruptcy court would agree in the event that we or Saratoga CLO became a debtor in connection with a bankruptcy proceeding. If a bankruptcy court concludes that substantive consolidation of us with Saratoga CLO is warranted, the creditors of Saratoga CLO, including the holders of $296.9 million aggregate principal amount of debt, as of February 28, 2015 issued by Saratoga CLO, would have claims against the consolidated bankruptcy estate. Substantive consolidation means that our assets are placed in a single bankruptcy estate with those of Saratoga CLO, rather than kept separate, and that the creditors of Saratoga CLO have a claim against that single estate (including our assets), as opposed to retaining their claims against only Saratoga CLO.
Available information about privately held companies is limited.
We invest primarily in privately-held companies. Generally, little public information exists about these companies, and we are required to rely on the ability of our investment adviser's investment professionals to obtain adequate information to evaluate the potential returns from investing in these companies. These companies and their financial information are not subject to the Sarbanes-Oxley Act of 2002 and other rules that govern public companies. If we are unable to uncover all material information about these companies, we may not make a fully informed investment decision, and we may lose money on our investments.
When we are a debt or minority equity investor in a portfolio company, we may not be in a position to control the entity, and its management may make decisions that could decrease the value of our investment.
We make both debt and minority equity investments; therefore, we are subject to the risk that a portfolio company may make business decisions with which we disagree, and the stockholders and management of such company may take risks or otherwise act in ways that do not serve our interests. As a result, a portfolio company may make decisions that could decrease the value of our portfolio holdings.
Our portfolio companies may incur debt or issue equity securities that rank equally with, or senior to, our investments in such companies.
Our portfolio companies usually will have, or may be permitted to incur, other debt, or issue other equity securities that rank equally with, or senior to, our investments. By their terms, such instruments may provide that the holders are entitled to receive payment of dividends, interest or principal on or before the dates on which we are entitled to receive payments in respect of our investments. These debt instruments will usually prohibit the portfolio companies from paying interest on or repaying our investments in the event and during the continuance of a default under such debt. Also, in the event of insolvency, liquidation, dissolution, reorganization or bankruptcy of a portfolio company, holders of securities ranking senior to our investment in that portfolio company would typically be entitled to receive payment in full before we receive any distribution in respect of our investment. After repaying such holders, the portfolio company may not have any remaining assets to use for repaying its obligation to us. In the case of debtor ranking equally with our investments, we would have to share on an equal basis any distributions with other holders in the event of an insolvency, liquidation, dissolution, reorganization or bankruptcy of the relevant portfolio company.
There may be circumstances where our debt investments could be subordinated to claims of other creditors or we could be subject to lender liability claims.
If one of our portfolio companies were to go bankrupt, even though we may have structured our interest as senior debt, depending on the facts and circumstances, including the extent to which we actually provided managerial assistance to that portfolio company, a bankruptcy court might re-characterize our debt holding and subordinate all or a portion of our claim to that of other
34
creditors. In addition, lenders can be subject to lender liability claims for actions taken by them where they become too involved in the borrower's business or exercise control over the borrower. It is possible that we could become subject to a lender's liability claim, including as a result of actions taken if we actually render significant managerial assistance.
Investments in equity securities involve a substantial degree of risk.
We purchase common stock and other equity securities. Although equity securities have historically generated higher average total returns than fixed-income securities over the long-term, equity securities also have experienced significantly more volatility in those returns and in recent years have significantly underperformed relative to fixed-income securities. The equity securities we acquire may fail to appreciate and may decline in value or become worthless and our ability to recover our investment will depend on our portfolio company's success. Investments in equity securities involve a number of significant risks, including:
| • | any equity investment we make in a portfolio company could be subject to further dilution as a result of the issuance of additional equity interests and to serious risks as a junior security that will be subordinate to all indebtedness or senior securities in the event that the issuer is unable to meet its obligations or becomes subject to a bankruptcy process; |
| • | to the extent that the portfolio company requires additional capital and is unable to obtain it, we may not recover our investment in equity securities; and |
| • | in some cases, equity securities in which we invest will not pay current dividends, and our ability to realize a return on our investment, as well as to recover our investment, will be dependent on the success of our portfolio companies. Even if the portfolio companies are successful, our ability to realize the value of our investment may be dependent on the occurrence of a liquidity event, such as a public offering or the sale of the portfolio company. It is likely to take a significant amount of time before a liquidity event occurs or we can sell our equity investments. In addition, the equity securities we receive or invest in may be subject to restrictions on resale during periods in which it could be advantageous to sell. |
There are special risks associated with investing in preferred securities, including:
| • | preferred securities may include provisions that permit the issuer, at its discretion, to defer distributions for a stated period without any adverse consequences to the issuer. If we own a preferred security that is deferring its distributions, we may be required to report income for tax purposes even though we have not received any cash payments in respect of such income; |
| • | preferred securities are subordinated with respect to corporate income and liquidation payments, and are therefore subject to greater risk than debt; |
| • | preferred securities may be substantially less liquid than many other securities, such as common securities or U.S. government securities; and |
| • | preferred security holders generally have no voting rights with respect to the issuing company, subject to limited exceptions. |
Our investments in foreign debt, including that of emerging market issuers, may involve significant risks in addition to the risks inherent in U.S. investments.
Although there are limitations on our ability to invest in foreign debt, we may, from time to time, invest in debt of foreign companies, including the debt of emerging market issuers. Investing in foreign companies may expose us to additional risks not typically associated with investing in U.S. companies. These risks include changes in exchange control regulations, political and social instability, expropriation, imposition of foreign taxes, less liquid markets and less available information than is generally the case in the United States, higher transaction costs, less government supervision of exchanges, brokers and issuers, less developed bankruptcy laws, difficulty in enforcing contractual obligations, lack of uniform accounting and auditing standards and greater price volatility. Investments in the debt of emerging market issuers may subject us to additional risks such as inflation, wage and price controls, and the imposition of trade barriers. Furthermore, economic conditions in emerging market countries are, to some extent, influenced by economic and securities market conditions in other emerging market countries. Although economic conditions are different in each country, investors' reaction to developments in one country can have effects on the debt of issuers in other countries.
Although most of our investments will be U.S. dollar-denominated, our investments that are denominated in a foreign currency will be subject to the risk that the value of a particular currency will change in relation to one or more other currencies.
35
Among the factors that may affect currency values are trade balances, the level of short-term interest rates, differences in relative values of similar assets in different currencies, long-term opportunities for investment and capital appreciation, and political developments. We may employ hedging techniques to minimize these risks, but we cannot assure you that we will fully hedge against these risks or that such strategies will be effective.
We may expose ourselves to risks if we engage in hedging transactions.
We may utilize instruments such as forward contracts, currency options and interest rate swaps, caps, collars and floors to seek to hedge against fluctuations in the relative values of our portfolio positions from changes in currency exchange rates and market interest rates. Use of these hedging instruments may expose us to counter-party credit risk. Hedging against a decline in the values of our portfolio positions does not eliminate the possibility of fluctuations in the values of such positions or prevent losses if the values of such positions decline. However, such hedging can establish other positions designed to gain from those same developments, thereby offsetting the decline in the value of such portfolio positions. Such hedging transactions may also limit the opportunity for gain if the values of the portfolio positions should increase. Moreover, it may not be possible to hedge against an exchange rate or interest rate fluctuation that is generally anticipated at an acceptable price.
Our board of directors may change our investment objective, operating policies and strategies without prior notice or stockholder approval, the effects of which may be adverse.
Our board of directors has the authority to modify or waive our current investment objective, operating policies and strategies without prior notice and without stockholder approval. We cannot predict the effect any changes to our current operating policies and strategies would have on our business, financial condition, and value of our common stock. However, the effects might be adverse, which could negatively impact our ability to pay dividends and cause you to lose all or part of your investment.
We have limited experience in managing an SBIC and any failure to comply with SBA regulations, resulting from our lack of experience or otherwise, could have an adverse effect on our operations.
On March 28, 2012, our wholly-owned subsidiary, Saratoga Investment Corp. SBIC, LP, received a license from the SBA to operate as an SBIC under Section 301(c) of the Small Business Investment Act of 1958 and is regulated by the SBA.
The SBA places certain limitations on the financing terms of investments by SBICs in portfolio companies and prohibits SBICs from providing funds for certain purposes or to businesses in a few prohibited industries. Compliance with SBIC requirements may cause our SBIC subsidiary to forego attractive investment opportunities that are not permitted under SBA regulations.
Further, SBA regulations require that an SBIC be periodically examined and audited by the SBA to determine its compliance with the relevant SBA regulations. The SBA prohibits, without prior SBA approval, a "change of control" of an SBIC or transfers that would result in any person (or a group of persons acting in concert) owning 10% or more of a class of capital stock of an SBIC. If our SBIC subsidiary fails to comply with applicable SBA regulations, the SBA could, depending on the severity of the violation, limit or prohibit its use of debentures, declare outstanding debentures immediately due and payable, and/or limit it from making new investments. In addition, the SBA can revoke or suspend a license for willful or repeated violation of, or willful or repeated failure to observe, any provision of the Small Business Investment Act of 1958 or any rule or regulation promulgated thereunder. These actions by the SBA would, in turn, negatively affect us because our SBIC subsidiary is our wholly-owned subsidiary. We do not have any prior experience managing an SBIC. Our lack of experience in complying with SBA regulations may hinder our ability to take advantage of our SBIC subsidiary's access to SBA-guaranteed debentures.
Any failure to comply with SBA regulations could have an adverse effect on our operations.
Our investments may be risky, and you could lose all or part of your investment.
Substantially all of our debt investments hold a non-investment grade rating by one or more rating agencies or, where not rated by any rating agency, would be below investment grade, if rated. A below investment grade rating means that, in the rating agency's view, there is an increased risk that the obligor on such debt will be unable to pay interest and repay principal on its debt in full. We also invest in debt that defers or pays PIK interest. To the extent interest payments associated with such debt are deferred, such debt will be subject to greater fluctuations in value based on changes in interest rates, such debt could produce taxable income without a corresponding cash payment to us, and since we generally do not receive any cash prior to maturity of the debt, the investment will be of greater risk.
36
In addition, private middle market companies in which we invest are exposed to a number of significant risks, including:
| • | limited financial resources and an inability to meet their obligations, which may be accompanied by a deterioration in the value of any collateral and a reduction in the likelihood of us realizing any guarantees we may have obtained in connection with our investment; |
| • | shorter operating histories, narrower product lines and smaller market shares than larger businesses, which tend to render them more vulnerable to competitors' actions and market conditions, as well as general economic downturns; |
| • | dependence on the management talents and efforts of a small group of persons; the death, disability, resignation or termination of one or more of which could have a material adverse impact on the company and, in turn, on us; |
| • | less predictable operating results and, possibly, substantial additional capital requirements to support their operations, finance expansion or maintain their competitive position; and |
| • | difficulty accessing the capital markets to meet future capital needs. |
In addition, our executive officers, directors and our investment adviser may, in the ordinary course of business, be named as defendants in litigation arising from our investments in the portfolio companies.
Our independent auditors have not assessed our internal control over financial reporting. If our internal control over financial reporting is not effective, it could have a material adverse effect on our stock price and our ability to raise capital.
Because we are a "non-accelerated filer" within the meaning of Rule 12b-2 under the Securities Exchange Act of 1934, our independent auditors are not required to assess our internal control over financial reporting or to provide a report thereon. Although our management determined that our internal control over financial reporting was effective at February 28, 2015 (the last date that such determination was required to be made by us), there can be no assurance that our independent auditors would agree with our management's conclusion. Furthermore, if our market capitalization, excluding affiliated stockholders, at August 31 of any fiscal year is greater than $75 million, then we will be required to obtain independent auditor certification on the adequacy of our internal control over financial reporting for that fiscal year. If our internal control over financial reporting is determined in the future to not be effective, whether by our management or by our independent auditors, there could be an adverse reaction in the financial markets due to a loss of confidence in the reliability of our financial statements, which could materially adversely affect our stock price and our ability to raise capital necessary to operate our business. In addition, we may be required to incur costs in improving our internal control system and hiring additional personnel.
Risks Related to Our Common Stock
Investing in our common stock may involve an above average degree of risk.
The investments we make in accordance with our investment objective may result in a higher amount of risk than alternative investment options and volatility or loss of principal. Our investments in portfolio companies may be highly speculative and aggressive, and therefore, an investment in our common stock may not be suitable for someone with lower risk tolerance.
We may continue to choose to pay dividends in our own stock, in which case you may be required to pay tax in excess of the cash you receive.
We have in the past, and may continue to, distribute taxable dividends that are payable to our stockholders in part through the issuance of shares of our common stock. For example, on October 30, 2013, our board of directors declared a dividend of $2.65 per share to shareholders payable in cash or shares of our common stock. Under certain applicable provisions of the Code and the Treasury regulations, distributions payable in cash or in shares of stock at the election of stockholders are treated as taxable dividends. The Internal Revenue Service has issued private rulings indicating that this rule will apply even where the total amount of cash that may be distributed is limited to no more than 20.0% of the total distribution. Under these rulings, if too many stockholders elect to receive their distributions in cash, each such stockholder would receive a pro rata share of the total cash to be distributed and would receive the remainder of their distribution in shares of stock. If we decide to make any distributions consistent with these rulings that are payable in part in our stock, taxable stockholders receiving such dividends will be required to include the full amount of the dividend (whether received in cash, our stock, or a combination thereof) as ordinary income (or as long-term capital gain to the extent such distribution is properly reported as a capital gain dividend) to the extent of our current and accumulated earnings and profits for United States federal income tax purposes. As a result, a U.S. stockholder may be required to pay tax with respect to such dividends in excess of any cash received. If a U.S. stockholder sells the stock it receives as a dividend in order to pay this tax, the sales proceeds may be less than the amount included in income with respect to the dividend, depending on the market price of our stock at the time of the sale. Furthermore, with respect to non-U.S. stockholders, we may be required to withhold U.S. tax with respect to such dividends, including in respect of all or a portion of such dividend that is payable in stock. In addition, if a significant number of our stockholders determine to sell shares of our stock in order to pay taxes owed on dividends, it may put downward pressure on the trading price of our stock.
37
On September 24, 2014, the Company declared an ordinary dividend of $0.18 per share payable on November 28, 2014. Shareholders had the option to receive payment of the dividend in cash, or receive shares of common stock pursuant to our DRIP. Based on shareholder elections, the dividend consisted of approximately $0.6 million in cash and 22,283 newly issued shares of common stock, or 0.4% of our outstanding common stock prior to the dividend payment. The number of shares of common stock comprising the stock portion was calculated based on a price of $14.37 per share, which equaled the volume weighted average trading price per share of the common stock on November 14, 17, 18, 19, 20, 21, 24, 25, 26 and 28, 2014.
Also on September 24, 2014, the Company declared a dividend of $0.22 per share payable on February 27, 2015. Shareholders have the option to receive payment of the dividend in cash, or receive shares of common stock, pursuant our DRIP. Based on shareholder elections, the dividend consisted of approximately $0.8 million in cash and 26,858 newly issued shares of common stock, or 0.5% of our outstanding common stock prior to the dividend payment. The number of shares of common stock comprising the stock portion was calculated based on a price of $14.97 per share, which equaled the volume weighted average trading price per share of the common stock on February 13, 17, 18, 19, 20, 23, 24, 25, 26 and 27, 2015.
The market price of our common stock may fluctuate significantly.
The market price and liquidity of the market for our common stock may be significantly affected by numerous factors, some of which are beyond our control and may not be directly related to our operating performance. These factors include:
| • | significant volatility in the market price and trading volume of securities of BDCs or other companies in our sector, which are not necessarily related to the operating performance of these companies; |
| • | changes in regulatory policies, accounting pronouncements or tax rules, particularly with respect to RICs, BDCs or SBICs; |
| • | loss of RIC qualification; |
| • | changes in the value of our portfolio of investments; |
| • | any shortfall in revenue or net income or any increase in losses from levels expected by investors or securities analysts; |
| • | departure of any of Saratoga Investment Advisors' key personnel; |
| • | operating performance of companies comparable to us; |
| • | general economic trends and other external factors; and |
| • | loss of a major funding source. |
There is a risk that you may not receive distributions or that our distributions may not grow over time.
As a BDC for 1940 Act purposes and a RIC for U.S. federal income tax purposes, we intend to make distributions out of assets legally available for distribution to our stockholders once such distributions are authorized by our board of directors and declared by us. We cannot assure you that we will achieve investment results that will allow us to make a specified level of cash distributions or year-to-year increases in cash distributions. In addition, due to the asset coverage test that is applicable to us as a BDC, and provisions contained in the agreements governing our borrowings, we may be limited in our ability to make distributions. Further, if we invest a greater amount of assets in equity securities that do not pay current dividends, it could reduce the amount available for distribution.
Provisions of our governing documents and the Maryland General Corporation Law could deter future takeover attempts and have an adverse impact on the price of our common stock.
We are governed by our charter and bylaws, which we refer to as our "governing documents."
38
Our governing documents and the Maryland General Corporation Law contain provisions that may have the effect of delaying, deferring or preventing a future transaction or change in control of us that might involve a premium price for our stockholders or otherwise be in their best interest.
Our charter provides for the classification of our board of directors into three classes of directors, serving staggered three-year terms, which may render a change of control of us or removal of our incumbent management more difficult. Furthermore, any and all vacancies on our board of directors will be filled generally only by the affirmative vote of a majority of the remaining directors in office, even if the remaining directors do not constitute a quorum, and any director elected to fill a vacancy will serve for the remainder of the full term until a successor is elected and qualifies.
Our board of directors is authorized to create and issue new series of shares, to classify or reclassify any unissued shares of stock into one or more classes or series, including preferred stock and, without stockholder approval, to amend our charter to increase or decrease the number of shares of stock that we have authority to issue, which could have the effect of diluting a stockholder's ownership interest. Prior to the issuance of shares of stock of each class or series, including any reclassified series, our board of directors is required by our governing documents to set the terms, preferences, conversion or other rights, voting powers, restrictions, limitations as to dividends or other distributions, qualifications and terms or conditions of redemption for each class or series of shares of stock.
Our governing documents also provide that our board of directors has the exclusive power to adopt, alter or repeal any provision of our bylaws, and to make new bylaws. The Maryland General Corporation Law also contains certain provisions that may limit the ability of a third party to acquire control of us, such as:
| • | The Maryland Business Combination Act, which, subject to certain limitations, prohibits certain business combinations between us and an "interested stockholder" (defined generally as any person who beneficially owns 10% or more of the voting power of the common stock or an affiliate thereof) for five years after the most recent date on which the stockholder becomes an interested stockholder and, thereafter, imposes special minimum price provisions and special stockholder voting requirements on these combinations; and |
| • | The Maryland Control Share Acquisition Act, which provides that "control shares" of a Maryland corporation (defined as shares of common stock which, when aggregated with other shares of common stock controlled by the stockholder, entitles the stockholder to exercise one of three increasing ranges of voting power in electing directors) acquired in a "control share acquisition" (defined as the direct or indirect acquisition of ownership or control of "control shares") have no voting rights except to the extent approved by stockholders by the affirmative vote of at least two-thirds of all the votes entitled to be cast on the matter, excluding all interested shares of common stock. |
In addition, the provisions of the Maryland Business Combination Act will not apply, however, if our board of directors adopts a resolution that any business combination between us and any other person will be exempt from the provisions of the Maryland Business Combination Act. Although our board of directors has adopted such a resolution, there can be no assurance that this resolution will not be altered or repealed in whole or in part at any time. If the resolution is altered or repealed, the provisions of the Maryland Business Combination Act may discourage others from trying to acquire control of us.
As permitted by Maryland law, our bylaws contain a provision exempting from the Maryland Control Share Acquisition Act any and all acquisitions by any person of our common stock. Although our bylaws include such a provision, such a provision may also be amended or eliminated by our board of directors at any time in the future, subject to obtaining confirmation from the SEC that it does not object to us being subject to the Maryland Control Share Acquisition Act.
Our common stock may trade at a discount to our net asset value per share.
Common stock of BDCs, as closed-end investment companies, frequently trade at a discount to net asset value. Our common stock has traded at a discount to our net asset value since shortly after our initial public offering. The risk that our common stock may continue to trade at a discount to our net asset value is separate and distinct from the risk that our net asset value per share may decline.
Stockholders may incur dilution if we sell shares of our common stock in one or more offerings at prices below the then current net asset value per share of our common stock.
The 1940 Act prohibits us from selling shares of our common stock at a price below the current net asset value per share of such stock, with certain exceptions. One such exception is prior stockholder approval of issuances below net asset value provided that our board of directors makes certain determinations. At our 2014 annual meeting of stockholders, our stockholders approved a
39
proposal that authorizes us to sell shares of our common stock below the then current net asset value per share of our common stock at an offering price per share that is not less than 85% of the then current net asset value per share in one or more offerings for a period of one year ending on the earlier of September 30, 2015 or the date of our 2015 annual meeting of stockholders. Continued access to this exception will require approval of similar proposals at future stockholder meetings.
If we were to sell shares of our common stock below net asset value per share, such sales would result in an immediate dilution to the net asset value per share. This dilution would occur as a result of the sale of shares at a price below the then current net asset value per share of our common stock and a proportionately greater decrease in a stockholder's interest in our earnings and assets and voting interest in us than the increase in our assets resulting from such issuance.
Because the number of shares of common stock that could be so issued and the timing of any issuance is not currently known, the actual dilutive effect cannot be predicted.
Risks Related to Our Notes
The Notes are unsecured and therefore are effectively subordinated to any secured indebtedness we have currently incurred or may incur in the future.
The Notes are not secured by any of our assets or any of the assets of our subsidiaries, including our wholly owned subsidiaries. As a result, the Notes are effectively subordinated to any secured indebtedness we or they have currently incurred and may incur in the future (or any indebtedness that is initially unsecured to which we subsequently grant security) to the extent of the value of the assets securing such indebtedness, including indebtedness under the Credit Facility. In any liquidation, dissolution, bankruptcy or other similar proceeding, the holders of any of our existing or future secured indebtedness and the secured indebtedness of our subsidiaries may assert rights against the assets pledged to secure that indebtedness in order to receive full payment of their indebtedness before the assets may be used to pay other creditors, including the holders of the Notes. As of February 28, 2015, there was a $9.6 million outstanding balance under the Credit Facility and we had the ability to borrow up to $35.4 million under the Credit Facility, subject to certain conditions. As of February 28, 2015, we had $79.0 million in SBA-guaranteed debentures outstanding. The indebtedness under the Credit Facility and to SBA-guaranteed debentures is senior to the Notes to the extent of the value of the assets securing such indebtedness.
The Notes are structurally subordinated to the indebtedness and other liabilities of our subsidiaries.
The Notes are obligations exclusively of Saratoga Investment Corp., and not of any of our subsidiaries. None of our subsidiaries is a guarantor of the Notes and the Notes are not required to be guaranteed by any subsidiary we may acquire or create in the future. Any assets of our subsidiaries are not directly available to satisfy the claims of our creditors, including holders of the Notes. Except to the extent we are a creditor with recognized claims against our subsidiaries, all claims of creditors of our subsidiaries will have priority over our equity interests in such entities (and therefore the claims of our creditors, including holders of the Notes) with respect to the assets of such entities. Even if we are recognized as a creditor of one or more of these entities, our claims would still be effectively subordinated to any security interests in the assets of any such entity and to any indebtedness or other liabilities of any such entity senior to our claims. Consequently, the Notes are structurally subordinated to all indebtedness and other liabilities of any of our subsidiaries and portfolio companies with respect to which we hold equity investments. In addition, our subsidiaries and these entities may incur substantial indebtedness in the future, all of which would be structurally senior to the Notes.
The indenture under which the Notes are issued contains limited protection for holders of the Notes.
The indenture under which the Notes are issued offers limited protection to holders of the Notes. The terms of the indenture and the Notes do not restrict our or any of our subsidiaries' ability to engage in, or otherwise be a party to, a variety of corporate transactions, circumstances or events that could have a material adverse impact on your investment in the Notes. In particular, the terms of the indenture and the Notes do not place any restrictions on our or our subsidiaries' ability to:
| • | issue securities or otherwise incur additional indebtedness or other obligations, including (1) any indebtedness or other obligations that would be equal in right of payment to the Notes, (2) any indebtedness or other obligations that would be secured and therefore rank effectively senior in right of payment to the Notes to the extent of the values of the assets securing such debt, (3) indebtedness of ours that is guaranteed by one or more of our subsidiaries and which therefore is structurally senior to the Notes and (4) securities, indebtedness or obligations issued or incurred by our subsidiaries or the portfolio companies with respect to which we hold an equity investment that would be senior to our equity interests in those entities and therefore rank structurally senior to the Notes with respect to the assets of these entities, in each case other than an incurrence of indebtedness or other obligation that would cause a violation of Section 18(a)(1)(A) as modified by Section 61(a)(1) of the 1940 Act or any successor provisions |
40
(whether or not we are subject thereto), but giving effect, in each case, to any exemptive relief granted to us by the SEC. Currently, these provisions generally prohibit us from making additional borrowings, including through the issuance of additional debt or the sale of additional debt securities, unless our asset coverage, as defined in the 1940 Act, equals at least 200% after such borrowings; |
| • | pay dividends on, or purchase or redeem or make any payments in respect of, capital stock or other securities ranking junior in right of payment to the Notes, including subordinated indebtedness, in each case other than dividends, purchases, redemptions or payments that would cause a violation of Section 18(a)(1)(B) as modified by Section 61(a)(1) of the 1940 Act or any successor provisions, but giving effect to any exemptive relief granted to us by the SEC or no-action letter granted by the SEC to another BDC (or the Company if it determines to seek such similar no-action or other relief) permitting the BDC to declare any cash dividend or distribution in order to maintain the BDC's RIC status. These provisions generally prohibit us from declaring any cash dividend or distribution upon any class of our capital stock, or purchasing any such capital stock if our asset coverage, as defined in the 1940 Act, is below 200% at the time of the declaration of the dividend or distribution or the purchase and after deducting the amount of such dividend, distribution or purchase; |
| • | sell assets (other than certain limited restrictions on our ability to consolidate, merge or sell all or substantially all of our assets); |
| • | enter into transactions with affiliates; |
| • | create liens (including liens on the shares of our subsidiaries) or enter into sale and leaseback transactions; |
| • | make investments; or |
| • | create restrictions on the payment of dividends or other amounts to us from our subsidiaries. |
In addition, the indenture does not require us to offer to purchase the Notes in connection with a change of control or any other event.
Furthermore, the terms of the indenture and the Notes do not protect holders of the Notes in the event that we experience changes (including significant adverse changes) in our financial condition, results of operations or credit ratings, if any, as they do not require that we adhere to any financial tests or ratios or specified levels of net worth, revenues, income, cash flow, or liquidity.
Our ability to recapitalize, incur additional debt and take a number of other actions that are not limited by the terms of the Notes may have important consequences for you as a holder of the Notes, including making it more difficult for us to satisfy our obligations with respect to the Notes or negatively affecting the trading value of the Notes.
Other debt we issue or incur in the future could contain more protections for its holders than the indenture and the Notes, including additional covenants and events of default. For example, the indenture under which the Notes are issued does not contain cross-default provisions that are contained in the Credit Facility. The issuance or incurrence of any such debt with incremental protections could affect the market for and trading levels and prices of the Notes.
An active trading market for the Notes may not develop, which could limit your ability to sell the Notes or the market price of the Notes.
The Notes are listed on the NYSE under the symbol ‘‘SAQ.'' We cannot provide any assurances that an active trading market will develop or be maintained for the Notes or that you will be able to sell your Notes. If the Notes are traded after their initial issuance, they may trade at a discount from their initial offering price depending on prevailing interest rates, the market for similar securities, our credit ratings, if any, general economic conditions, our financial condition, performance and prospects and other factors. The underwriters involved in the offering of the Notes have advised us that they intend to make a market in the Notes, but they are not obligated to do so. The underwriters may discontinue any market-making in the Notes at any time at their sole discretion.
Accordingly, we cannot assure you that a liquid trading market will develop for the Notes, that you will be able to sell your Notes at a particular time or that the price you receive when you sell will be favorable. To the extent an active trading market does not develop, the liquidity and trading price for the Notes may be harmed. Accordingly, you may be required to bear the financial risk of an investment in the Notes for an indefinite period of time.
41
We may choose to redeem the Notes when prevailing interest rates are relatively low.
On or after May 31, 2016, we may choose to redeem the Notes from time to time, especially when prevailing interests rates are lower than the rate borne by the Notes. If prevailing rates are lower at the time of redemption, you would not be able to reinvest the redemption proceeds in a comparable security at an effective interest rate as high as the interest rate on the Notes being redeemed. Our redemption right also may adversely impact your ability to sell the Notes as the optional redemption date or period approaches.
If we default on our obligations to pay our other indebtedness, we may not be able to make payments on the Notes.
Any default under the agreements governing our indebtedness, including a default under the Credit Facility or other indebtedness to which we may be a party that is not waived by the required lenders, and the remedies sought by the holders of such indebtedness could make us unable to pay principal, premium, if any, and interest on the Notes and substantially decrease the market value of the Notes. If we are unable to generate sufficient cash flow and are otherwise unable to obtain funds necessary to meet required payments of principal, premium, if any, and interest on our indebtedness, or if we otherwise fail to comply with the various covenants, including financial and operating covenants, in the instruments governing our indebtedness, we could be in default under the terms of the agreements governing such indebtedness, including the Notes. In the event of such default, the holders of such indebtedness could elect to declare all the funds borrowed thereunder to be due and payable, together with accrued and unpaid interest, the lender under the Credit Facility or other debt we may incur in the future could elect to terminate its commitment, cease making further loans and institute foreclosure proceedings against our assets, and we could be forced into bankruptcy or liquidation. In addition, any such default may constitute a default under the Notes, which could further limit our ability to repay our debt, including the Notes. If our operating performance declines, we may in the future need to seek to obtain waivers from the lender under the Credit Facility or other debt that we may incur in the future to avoid being in default. If we breach our covenants under the Credit Facility or other debt and seek a waiver, we may not be able to obtain a waiver from the required lenders. If this occurs, we would be in default under the Credit Facility or other debt, the lender could exercise its rights as described above, and we could be forced into bankruptcy or liquidation. If we are unable to repay debt, lenders having secured obligations could proceed against the collateral securing the debt. Because the Credit Facility has, and any future credit facilities will likely have, customary cross-default provisions, if the indebtedness under the Notes, the Credit Facility or under any future credit facility is accelerated, we may be unable to repay or finance the amounts due.
Item 1B. Unresolved Staff Comments
None.
Item 2. Properties
We do not own any real estate or other physical properties important to our operations, however, an affiliate of our investment adviser leases office space for our executive offices at 535 Madison Avenue, New York, New York 10022.
Item 3. Legal Proceedings
On August 31, 2012, a complaint was filed in the United States Bankruptcy Court for the Southern District of New York by GSC Acquisition Holdings, LLC against us to recover, among other things, approximately $2.6 million for the benefit of the estates and the general unsecured creditors of GSC Group, Inc. and its affiliates, including the Company's former investment adviser, GSCP (NJ), L.P. The complaint alleges that the former investment adviser made a constructively fraudulent transfer of $2.6 million in deferred incentive fees by waiving them in connection with the termination of the Management Agreement with us, and that the termination of the Management Agreement was itself a fraudulent transfer. These transfers, the complaint alleges, were made without receipt of reasonably equivalent value and while the former investment adviser was insolvent. The complaint has not yet been served, and the plaintiff's motion for authority to prosecute the case on behalf of the estates was taken under advisement by the court on October 1, 2012. We opposed that motion. We believe that the claims in this lawsuit are without merit and, if the plaintiff is authorized to proceed, intend to vigorously defend against this action.
Except as discussed above, neither we nor our wholly-owned subsidiaries, Saratoga Investment Funding LLC and Saratoga Investment Corp. SBIC LP, are currently subject to any material legal proceedings.
Item 4. Mine Safety Disclosures
None.
42
PART II
Item 5. Market for Registrant's Common Equity, Related Stockholder Matters and Issuer Purchases of Equity Securities
Price range of common stock
Our common stock is traded on the New York Stock Exchange under the symbol "SAR." Prior to July 30, 2010, our common stock traded on the New York Stock Exchange under the symbol "GNV." The following table sets forth, for the two most recent fiscal years and the current fiscal year, the range of high and low sales prices of our common stock as reported on the New York Stock Exchange, the sales price as a percentage of our net asset value ("NAV") and the dividends declared by us for each fiscal quarter. The net asset value per share and high and low sales prices listed below reflect the 1:10 reverse stock split that occurred on August 12, 2010.
Fiscal Year ended February 28, 2014 | NAV(1) | High | Low | |||||||||
First Quarter | $ | 23.48 | $ | 19.08 | $ | 16.35 | ||||||
Second Quarter | $ | 23.55 | $ | 18.70 | $ | 17.40 | ||||||
Third Quarter | $ | 20.39 | $ | 19.55 | $ | 15.40 | ||||||
Fourth Quarter | $ | 21.08 | $ | 16.56 | $ | 15.25 | ||||||
Fiscal Year ended February 28, 2015 | NAV(1) | High | Low | |||||||||
First Quarter | $ | 21.41 | $ | 15.91 | $ | 15.05 | ||||||
Second Quarter | $ | 22.00 | $ | 16.26 | $ | 15.15 | ||||||
Third Quarter | $ | 22.45 | $ | 16.32 | $ | 15.00 | ||||||
Fourth Quarter | $ | 22.70 | $ | 15.84 | $ | 14.44 | ||||||
Fiscal Year ending February 28, 2016 | NAV(1) | High | Low | |||||||||
First Quarter through May 19, 2015 | $ | * | $ | 17.95 | $ | 15.28 | ||||||
| * | Not determinable at the time of filing. |
| (1) | Net asset value per share is determined as of the last day in the relevant quarter and therefore may not reflect the net asset value per share on the date of the high and low closing sales prices. The net asset values shown are based on outstanding shares at the end of each period. |
As described in Note 2 to the consolidated financial statements and notes thereto, we identified errors that impacted the years ended February 28, 2014, February 28, 2013, February 29, 2012 and February 28, 2011. The corrections for the errors, which we have concluded are immaterial to all prior period consolidated financial statements, are reflected in the consolidated financial statements and selected financial data included in this Form 10-K.
On September 24, 2014, the Company announced the approval of an open market share repurchase plan that allows it to repurchase up to 200,000 shares of its common stock at prices below its NAV as reported in its then most recently published financial statements. As of February 28, 2015, the Company had not purchased any shares of common stock pursuant to this repurchase plan.
Holders
The last reported price for our common stock on May 19, 2015 was $17.80 per share. As of May 19, 2015, there were 22 holders of record of our common stock.
43
Dividend Policy
The following table summarizes our dividends or distributions declared during fiscal 2009, 2010, 2011, 2012, 2013, 2014 and 2015:
Date Declared | Record Date | Payment Date | Amount per Share | |||||
May 22, 2008 | May 30, 2008 | June 13, 2008 | $ | 3.90 | ||||
August 19, 2008 | August 29, 2008 | September 15, 2008 | $ | 3.90 | ||||
December 8, 2008 | December 18, 2008 | December 29, 2008 | $ | 2.50 | ||||
|
| |||||||
Total Dividends Declared for Fiscal 2009 | $ | 10.30 | ||||||
|
| |||||||
November 13, 2009 | November 25, 2009 | December 31, 2009 | $ | 18.25 | (1) | |||
|
| |||||||
Total Dividends Declared for Fiscal 2010 | $ | 18.25 | ||||||
|
| |||||||
November 12, 2010 | November 19, 2010 | December 29, 2010 | $ | 4.40 | (1) | |||
|
| |||||||
Total Dividends Declared for Fiscal 2011 | $ | 4.40 | ||||||
|
| |||||||
November 15, 2011 | November 25, 2011 | December 30, 2011 | $ | 3.00 | (1) | |||
|
| |||||||
Total Dividends Declared for Fiscal 2012 | $ | 3.00 | ||||||
|
| |||||||
November 9, 2012 | November 20, 2012 | December 31, 2012 | $ | 4.25 | (1) | |||
|
| |||||||
Total Dividends Declared for Fiscal 2013 | $ | 4.25 | ||||||
|
| |||||||
October 30, 2013 | November 13, 2013 | December 27, 2013 | $ | 2.65 | (1) | |||
|
| |||||||
Total Dividends Declared for Fiscal 2014 | $ | 2.65 | ||||||
|
| |||||||
September 24, 2014 | October 30, 2014 | November 28, 2014 | $ | 0.18 | (1) | |||
|
| |||||||
September 24, 2014 | January 29, 2015 | February 27, 2015 | $ | 0.22 | (1) | |||
|
| |||||||
Total Dividends Declared for Fiscal 2015 | $ | 0.40 | ||||||
|
| |||||||
| (1) | This dividend was paid by combination of shares of common stock and cash. Please see the discussion immediately following this table for more detail about the composition of this dividend. |
Our distributions, if any, will be determined by our board of directors and paid out of assets legally available for distribution. Any such distributions generally will be taxable to our stockholders, including to those stockholders who receive additional shares of our common stock pursuant to our dividend reinvestment plan. Prior to January 2009, we paid quarterly dividends to our stockholders. However, in January 2009, we suspended the practice of paying quarterly dividends to our stockholders and thereafter, paid five annual dividend distributions (December 2013, 2012, 2011, 2010 and 2009) to our stockholders since such time, which distributions were made with a combination of cash and the issuance of shares of our common stock as discussed more fully below.
On September 24, 2014, we announced the recommencement of quarterly dividends to our stockholders, and have subsequently made two distributions under this new policy. We have adopted a dividend reinvestment plan ("DRIP") that provides for reinvestment of our dividend distributions on behalf of our stockholders unless a stockholder elects to receive cash. As a result, if our board of directors authorizes, and we declare, a cash dividend, then our stockholders who have not "opted out" of the DRIP by the dividend record date will have their cash dividends automatically reinvested into additional shares of our common stock, rather than receiving the cash dividends. We have the option to satisfy the share requirements of the DRIP through the issuance of new shares of common stock or through open market purchases of common stock by the DRIP plan administrator.
We are prohibited from making distributions that cause us to fail to maintain the asset coverage ratios stipulated by the 1940 Act, subject to certain exceptions, or that violate our debt covenants.
In order to maintain our qualification as a RIC, we must for each fiscal year distribute an amount equal to at least 90.0% of our ordinary net taxable income and realized net short-term capital gains in excess of realized net long-term capital losses, if any, reduced by deductible expenses. In addition, we will be subject to federal excise taxes to the extent we do not distribute during the calendar year at least (1) 98.0% of our ordinary income for the calendar year, (2) 98.2% of our capital gains in excess of capital losses for the one year period ending on October 31 of the calendar year and (3) any ordinary income and net capital gains for preceding years that were not distributed during such years and on which we paid no federal income tax. For the 2014 calendar year, the Company made distributions sufficient such that we did not incur any federal excise taxes. We may elect to withhold from distribution a portion of our ordinary income for the 2015 calendar year and/or portion of the capital gains in excess of capital losses realized during the one year period ending October 31, 2015, if any, and, if we do so, we would expect to incur federal excise taxes as a result.
Pursuant to a revenue procedure (Revenue Procedure 2010-12), or the Revenue Procedure, issued by the Internal Revenue Service, or IRS, the IRS indicated that it would treat distributions from certain publicly traded RICs (including BDCs) that were paid part in cash and part in stock as dividends that would satisfy the RIC's annual distribution requirements and qualify for the dividends paid deduction for federal income tax purposes. In order to qualify for such treatment, the Revenue Procedure required that at least 10.0% of the total distribution be payable in cash and that each stockholder have a right to elect to receive its entire distribution in cash. If too many stockholders elected to receive cash, each stockholder electing to receive cash must receive a proportionate share of the cash to be distributed (although no stockholder electing to receive cash may receive less than 10.0% of such stockholder's distribution in cash). This Revenue Procedure applied to distributions declared on or before December 31, 2012 with respect to taxable years ending on or before December 31, 2011.
44
Although this Revenue Procedure is no longer available and did not apply to our distributions for our fiscal year ended February 28, 2015, the revenue procedure was based upon certain applicable provisions of the Code and the Treasury regulations pursuant to which distributions payable in cash or in shares of stock at the election of stockholders are treated as taxable dividends. Consistent with these provisions, the IRS has issued private letter rulings concluding that a RIC may treat a distribution of its own stock as fulfilling its RIC distribution requirements if each stockholder may elect to receive his or her entire distribution in either cash or stock of the RIC subject to a limitation on the aggregate amount of cash to be distributed to all stockholders, which limitation must be at least 20.0% of the aggregate declared distribution.
On September 24, 2014, our board of directors declared a dividend of $0.22 per share payable on February 27, 2015, to common stockholders of record on February 2, 2015. Shareholders have the option to receive payment of the dividend in cash, or receive shares of common stock, pursuant our DRIP.
Based on shareholder elections, the dividend consisted of approximately $0.8 million in cash and 26,858 newly issued shares of common stock, or 0.5% of our outstanding common stock prior to the dividend payment. The number of shares of common stock comprising the stock portion was calculated based on a price of $14.97 per share, which equaled the volume weighted average trading price per share of the common stock on February 13, 17, 18, 19, 20, 23, 24, 25, 26 and 27, 2015.
On September 24, 2014, our board of directors declared a dividend of $0.18 per share payable on November 28, 2014, to common stockholders of record on November 3, 2014. Shareholders had the option to receive payment of the dividend in cash, or receive shares of common stock pursuant to our DRIP.
Based on shareholder elections, the dividend consisted of approximately $0.6 million in cash and 22,283 newly issued shares of common stock, or 0.4% of our outstanding common stock prior to the dividend payment. The number of shares of common stock comprising the stock portion was calculated based on a price of $14.37 per share, which equaled the volume weighted average trading price per share of the common stock on November 14, 17, 18, 19, 20, 21, 24, 25, 26 and 28, 2014.
On October 30, 2013, our board of directors declared a dividend of $2.65 per share payable on December 27, 2013, to common stockholders of record on November 13, 2013. Shareholders had the option to receive payment of the dividend in cash, shares of common stock, or a combination of cash and shares of common stock, provided that the aggregate cash payable to all shareholders was limited to approximately $2.5 million or $0.53 per share.
Based on shareholder elections, the dividend consisted of approximately $2.5 million in cash and 649,500 shares of common stock, or 13.7% of our outstanding common stock prior to the dividend payment. The amount of cash elected to be received was greater than the cash limit of 20.0% of the aggregate dividend amount, thus resulting in the payment of a combination of cash and stock to shareholders who elected to receive cash. The number of shares of common stock comprising the stock portion was calculated based on a price of $15.439 per share, which equaled the volume weighted average trading price per share of the common stock on December 11, 13, and 16, 2013.
On November 9, 2012, our board of directors declared a dividend of $4.25 per share payable on December 31, 2012, to common stockholders of record on November 20, 2012. Shareholders had the option to receive payment of the dividend in cash, shares of common stock, or a combination of cash and shares of common stock, provided that the aggregate cash payable to all shareholders was limited to approximately $3.3 million or $0.85 per share.
Based on shareholder elections, the dividend consisted of $3.3 million in cash and 853,455 shares of common stock, or 22.0% of our outstanding common stock prior to the dividend payment. The amount of cash elected to be received was greater than the cash limit of 20.0% of the aggregate dividend amount, thus resulting in the payment of a combination of cash and stock to shareholders who elected to receive cash. The number of shares of common stock comprising the stock portion was calculated based on a price of $15.444 per share, which equaled the volume weighted average trading price per share of the common stock on December 14, 17 and 19, 2012.
On November 15, 2011, our board of directors declared a dividend of $3.00 per share payable on December 30, 2011, to common stockholders of record on November 25, 2011. Shareholders had the option to receive payment of the dividend in cash, shares of common stock, or a combination of cash and shares of common stock, provided that the aggregate cash payable to all shareholders was limited to $2.0 million or $0.60 per share.
Based on shareholder elections, the dividend consisted of $2.0 million in cash and 599,584 shares of common stock, or 18.0% of our outstanding common stock prior to the dividend payment. The amount of cash elected to be received was greater than the cash limit of 20.0% of the aggregate dividend amount, thus resulting in the payment of a combination of cash and stock to shareholders who elected to receive cash. The number of shares of common stock comprising the stock portion was calculated based on a price of $13.12 per share, which equaled the volume weighted average trading price per share of the common stock on December 20, 21 and 22, 2011.
45
On November 12, 2010, we declared a dividend of $4.40 per share which was paid on December 29, 2010. Stockholders had the option to receive payment of the dividend in cash, shares of common stock, or a combination of cash and shares of common stock, provided that the aggregate cash payable to all shareholders was limited to $1.2 million or $0.44 per share.
Based on shareholder elections, the dividend consisted of $1.2 million in cash and 596,235 shares of common stock, or 22.0% of our outstanding common stock prior to the dividend payment. The amount of cash elected to be received was greater than the cash limit of 10.0% of the aggregate dividend amount, thus resulting in the payment of a combination of cash and stock to shareholders who elected to receive cash. The number of shares of common stock comprising the stock portion was calculated based on a price of $17.8049 per share, which equaled the volume weighted average trading price per share of the common stock on December 20, 21 and 22, 2010.
On November 13, 2009, we declared a dividend of $18.25 per share payable on December 31, 2009. Stockholders had the option to receive payment of the dividend in cash, shares of common stock, or a combination of cash and shares of common stock, provided that the aggregate cash payable to all stockholders was limited to $2.1 million or $0.25 per share.
Based on stockholder elections, the dividend consisted of $2.1 million in cash and 8,648,725 shares of common stock, or 104.0% of our outstanding common stock prior to the dividend payment. The amount of cash elected to be received was greater than the cash limit of 13.7% of the aggregate dividend amount, thus resulting in the payment of a combination of cash and stock to stockholders who elected to receive cash. The number of shares of common stock comprising the stock portion was calculated based on a price of $1.5099 per share, which equaled the volume weighted average trading price per share of the common stock on December 24 and 28, 2009.
Performance Graph
The following graph compares the return on our common stock with that of the Standard & Poor's 500 Stock Index and the NASDAQ Financial 100 index, for the period from March 23, 2007, the date our common stock began trading, through February 28, 2015. The graph assumes that, on March 23, 2007, a person invested $100 in each of our common stock, the Standard & Poor's 500 Stock Index and the NASDAQ Financial 100 index. The graph measures total shareholder return, which takes into account both changes in stock price and dividends. It assumes that dividends paid are reinvested in like securities.
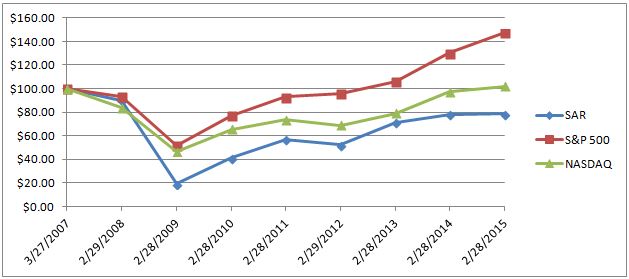
Sales of unregistered securities
Not applicable.
Issuer purchases of equity securities
We did not purchase any shares of our common stock in the open market during the year ended February 28, 2015.
46
Item 6. Selected Financial Data
The following selected financial and other data for the years ended February 28, 2015, February 28, 2014, February 28, 2013, February 29, 2012 and February 28, 2011 are derived from our consolidated financial statements which have been audited by Ernst & Young LLP, an independent registered public accounting firm, whose report thereon is included within this Annual Report. The data should be read in conjunction with our consolidated financial statements and notes thereto, which are included elsewhere in this Annual Report, and Part II, Item 7, "Management's Discussion and Analysis of Financial Condition and Results of Operations".
As described in Note 2 to the consolidated financial statements and notes thereto, we identified errors that impacted the years ended February 28, 2014, February 28, 2013, February 29, 2012 and February 28, 2011. The corrections for the errors, which we have concluded are immaterial to all prior period consolidated financial statements, are reflected in the consolidated financial statements and selected financial data included in this Form 10-K.
SARATOGA INVESTMENT CORP.
SELECTED FINANCIAL DATA
(dollar amounts in thousands, except share and per share numbers)
| Year Ended February 28, 2015 | Year Ended February 28, 2014 | Year Ended February 28, 2013 | Year Ended February 29, 2012 | Year Ended February 28, 2011 | ||||||||||||||||
Income Statement Data: | ||||||||||||||||||||
Interest and related portfolio income: | ||||||||||||||||||||
Interest | $ | 24,684 | $ | 20,179 | $ | 14,444 | $ | 11,254 | $ | 12,041 | ||||||||||
Management fee and other income | 2,691 | 2,714 | 2,563 | 2,258 | 2,132 | |||||||||||||||
|
|
|
|
|
|
|
|
|
| |||||||||||
Total interest and related portfolio income | 27,375 | 22,893 | 17,007 | 13,512 | 14,173 | |||||||||||||||
|
|
|
|
|
|
|
|
|
| |||||||||||
Expenses: | ||||||||||||||||||||
Interest and debt financing expenses | 7,375 | 6,084 | 2,540 | 1,298 | 2,612 | |||||||||||||||
Base management and incentive management fees(1) | 6,704 | 4,266 | 4,710 | 3,339 | 3,741 | |||||||||||||||
Administrator expenses | 1,000 | 1,000 | 1,000 | 1,000 | 810 | |||||||||||||||
Administrative and other | 2,328 | 2,669 | 2,287 | 2,638 | 4,882 | |||||||||||||||
Excise tax expense | 294 | - | - | - | - | |||||||||||||||
Expense reimbursement | - | - | - | - | (2,894 | ) | ||||||||||||||
|
|
|
|
|
|
|
|
|
| |||||||||||
Total operating expenses after reimbursements | 17,701 | 14,019 | 10,537 | 8,275 | 9,151 | |||||||||||||||
|
|
|
|
|
|
|
|
|
| |||||||||||
Net investment income | 9,674 | 8,874 | 6,470 | 5,237 | 5,022 | |||||||||||||||
|
|
|
|
|
|
|
|
|
| |||||||||||
Realized and unrealized gain (loss) on investments and derivatives: | ||||||||||||||||||||
Net realized gain (loss) | 3,276 | 1,271 | 562 | (12,186 | ) | (24,684 | ) | |||||||||||||
Net change in unrealized gain (loss) | (1,943 | ) | (1,648 | ) | 7,012 | 19,760 | 36,393 | |||||||||||||
|
|
|
|
|
|
|
|
|
| |||||||||||
Total net gain (loss) | 1,333 | (377 | ) | 7,574 | 7,574 | 11,709 | ||||||||||||||
|
|
|
|
|
|
|
|
|
| |||||||||||
Net increase in net assets resulting from operations | $ | 11,007 | $ | 8,497 | $ | 14,044 | $ | 12,811 | $ | 16,731 | ||||||||||
|
|
|
|
|
|
|
|
|
| |||||||||||
47
| Year Ended February 28, 2015 | Year Ended February 28, 2014 | Year Ended February 28, 2013 | Year Ended February 29, 2012 | Year Ended February 28, 2011 | ||||||||||||||||
Per Share: | ||||||||||||||||||||
Earnings per common share-basic and diluted(2) | $ | 2.04 | $ | 1.73 | $ | 3.42 | $ | 3.73 | $ | 6.86 | ||||||||||
Net investment income per share-basic and diluted(2) | $ | 1.80 | $ | 1.80 | $ | 1.57 | $ | 1.52 | $ | 2.06 | ||||||||||
Net realized and unrealized gain (loss) per share-basic and diluted(2) | $ | 0.24 | $ | (0.07 | ) | $ | 1.85 | $ | 2.21 | $ | 4.80 | |||||||||
Dividends declared per common share (3) | $ | 0.40 | $ | 2.65 | $ | 4.25 | $ | 3.00 | $ | 4.40 | ||||||||||
Dilutive impact of dividends paid in stock on net asset value per share (4) | $ | (0.02 | ) | $ | (0.71 | ) | $ | (1.40 | ) | $ | (1.99 | ) | $ | (9.01 | ) | |||||
Net asset value per share | $ | 22.70 | $ | 21.08 | $ | 22.71 | $ | 24.94 | $ | 26.20 | ||||||||||
Statement of Assets and Liabilities Data: | ||||||||||||||||||||
Investment assets at fair value | $ | 240,538 | $ | 205,845 | $ | 155,080 | $ | 95,360 | $ | 80,025 | ||||||||||
Total assets (5) | 263,560 | 215,168 | 172,321 | 124,291 | 97,130 | |||||||||||||||
Total debt outstanding (5) | 132,117 | 94,291 | 58,210 | 18,801 | 2,861 | |||||||||||||||
Stockholders' equity | 122,599 | 113,428 | 107,438 | 96,689 | 85,845 | |||||||||||||||
Net asset value per common share | $ | 22.70 | $ | 21.08 | $ | 22.71 | $ | 24.94 | $ | 26.20 | ||||||||||
Common shares outstanding at end of year | 5,401,899 | 5,379,616 | 4,730,116 | 3,876,661 | 3,277,077 | |||||||||||||||
Other Data: | ||||||||||||||||||||
Investments funded | $ | 104,872 | $ | 121,074 | $ | 71,596 | $ | 38,679 | $ | 9,014 | ||||||||||
Principal collections related to investment repayments or sales | $ | 73,257 | $ | 71,607 | $ | 21,488 | $ | 33,568 | $ | 31,975 | ||||||||||
Number of investments at year end | 64 | 60 | 47 | 33 | 37 | |||||||||||||||
Weighted average yield of income producing debt investments-Non-control/non-affiliate | 10.63 | % | 10.62 | % | 11.26 | % | 11.88 | % | 11.1 | % | ||||||||||
Weighted average yield on income producing debt investments-Control | 25.22 | % | 18.55 | % | 27.11 | % | 20.17 | % | 15.8 | % | ||||||||||
| (1) | See Note 6 in consolidated financial statements contained elsewhere herein. |
| (2) | For the years ended February 28, 2015, February 28, 2014, February 28, 2013, February 29, 2012, and February 28, 2011 amounts are calculated using weighted average common shares outstanding of 5,385,049, 4,920,517, 4,110,484, 3,434,345, and 2,437,577, respectively. |
| (3) | Calculated using the shares outstanding at ex-dividend date. |
| (4) | Dilutive effect of the issuance of shares of common stock below net asset value per share in connection with the satisfaction of the Company's annual RIC distribution requirement. See "Price Range of Common Stock and Distributions-Dividend Policy." |
| (5) | As described in Note 2 to the consolidated financial statements and notes thereto, the Company has adopted the provisions of ASU 2015-03 Interest-Imputation of Interest (Subtopic 835-30): Simplifying the Presentation of Debt Issuance Costs , as of February 28, 2015. The amendements in this ASU require that debt issuance costs related to a recognized debt liability be presented in the balance sheet as a direct deduction from the carrying amount of that debt liability consistent with debt discounts. The adoption of the provisions of ASU 2015-03 did not materially impact the Company's consolidated financial position or results of operations. Prior period amounts for the years ended February 28, 2015, February 28, 2014, February 28, 2013, February 29, 2012, and February 28, 2011 were reclassified to conform to the current period presentation. |
48
Item 7. Management's Discussion and Analysis of Financial Condition and Results of Operations
The following discussion should be read in conjunction with our financial statements and related notes and other financial information appearing elsewhere in this Annual Report on Form 10-K. In addition to historical information, the following discussion and other parts of this Annual Report contain forward-looking information that involves risks and uncertainties. Our actual results could differ materially from those anticipated by such forward-looking information due to the factors discussed under Part I, Item 1A "Risk Factors" and "Note about Forward-Looking Statements" appearing elsewhere herein.
The forward-looking statements are based on our beliefs, assumptions and expectations of our future performance, taking into account all information currently available to us. These beliefs, assumptions and expectations can change as a result of many possible events or factors, not all of which are known to us or are within our control. If a change occurs, our business, financial condition, liquidity and results of operations may vary materially from those expressed in our forward-looking statements.
The forward-looking statements contained in this Annual Report on Form 10-K involve risks and uncertainties, including statements as to:
| • | our future operating results; |
| • | our business prospects and the prospects of our portfolio companies; |
| • | the impact of investments that we expect to make; |
| • | our contractual arrangements and relationships with third parties; |
| • | the dependence of our future success on the general economy and its impact on the industries in which we invest; |
| • | the ability of our portfolio companies to achieve their objectives; |
| • | our expected financings and investments; |
| • | our regulatory structure and tax treatment, including our ability to operate as a business development company ("BDC"), or to operate our small business investment company ("SBIC") subsidiary, and to continue to qualify to be taxed as a regulated investment company ("RIC"); |
| • | the adequacy of our cash resources and working capital; |
| • | the timing of cash flows, if any, from the operations of our portfolio companies; and |
| • | the ability of our investment adviser to locate suitable investments for us and to monitor and effectively administer our investments. |
You should not place undue reliance on these forward-looking statements. The forward-looking statements made in this Annual Report on Form 10-K relate only to events as of the date on which the statements are made. We undertake no obligation to update any forward-looking statement to reflect events or circumstances occurring after the date of this Annual Report on Form 10-K.
OVERVIEW
We are a Maryland corporation that has elected to be treated as a BDC under the Investment Company Act of 1940 (the "1940 Act"). Our investment objective is to generate current income and, to a lesser extent, capital appreciation from our investments. We invest primarily in leveraged loans and mezzanine debt issued by private U.S. middle market companies, which we define as companies having EBITDA of between $5 million and $50 million, both through direct lending and through participation in loan syndicates. We may also invest up to 30.0% of the portfolio in opportunistic investments in order to seek to enhance returns to stockholders. Such investments may include investments in distressed debt, which may include securities of companies in bankruptcy, foreign debt, private equity, securities of public companies that are not thinly traded and structured finance vehicles such as collateralized loan obligation funds. We have elected and qualified to be treated as a RIC under Subchapter M of the Internal Revenue Code of 1986, as amended (the "Code").
Corporate History and Recent Developments
We commenced operations, at the time known as GSC Investment Corp., on March 23, 2007 and completed an initial public offering of shares of common stock on March 28, 2007. Prior to July 30, 2010, we were externally managed and advised by GSCP (NJ), L.P., an entity affiliated with GSC Group, Inc. In connection with the consummation of a recapitalization transaction on July 30, 2010, as described below we engaged Saratoga Investment Advisors ("SIA") to replace GSCP (NJ), L.P. as our investment adviser and changed our name to Saratoga Investment Corp.
As a result of the event of default under a revolving securitized credit facility with Deutsche Bank we previously had in place, in December 2008 we engaged the investment banking firm of Stifel, Nicolaus & Company to evaluate strategic transaction opportunities and consider alternatives for us. On April 14, 2010, GSC Investment Corp. entered into a stock purchase agreement with
49
Saratoga Investment Advisors and certain of its affiliates and an assignment, assumption and novation agreement with Saratoga Investment Advisors, pursuant to which GSC Investment Corp. assumed certain rights and obligations of Saratoga Investment Advisors under a debt commitment letter Saratoga Investment Advisors received from Madison Capital Funding LLC, which indicated Madison Capital Funding's willingness to provide GSC Investment Corp. with a $40.0 million senior secured revolving credit facility, subject to the satisfaction of certain terms and conditions. In addition, GSC Investment Corp. and GSCP (NJ), L.P. entered into a termination and release agreement, to be effective as of the closing of the transaction contemplated by the stock purchase agreement, pursuant to which GSCP (NJ), L.P., among other things, agreed to waive any and all accrued and unpaid deferred incentive management fees up to and as of the closing of the transaction contemplated by the stock purchase agreement but continued to be entitled to receive the base management fees earned through the date of the closing of the transaction contemplated by the stock purchase agreement.
On July 30, 2010, the transactions contemplated by the stock purchase agreement with Saratoga Investment Advisors and certain of its affiliates were completed, the private sale of 986,842 shares of our common stock for $15.0 million in aggregate purchase price to Saratoga Investment Advisors and certain of its affiliates closed, the Company entered into the Credit Facility, and the Company began doing business as Saratoga Investment Corp.
We used the net proceeds from the private sale transaction and a portion of the funds available to us under the Credit Facility to pay the full amount of principal and accrued interest, including default interest, outstanding under our revolving securitized credit facility with Deutsche Bank. The revolving securitized credit facility with Deutsche Bank was terminated in connection with our payment of all amounts outstanding thereunder on July 30, 2010.
On August 12, 2010, we effected a one-for-ten reverse stock split of our outstanding common stock. As a result of the reverse stock split, every ten shares of our common stock were converted into one share of our common stock. Any fractional shares received as a result of the reverse stock split were redeemed for cash. The total cash payment in lieu of shares was $230. Immediately after the reverse stock split, we had 2,680,842 shares of our common stock outstanding.
In January 2011, we registered for public resale the 982,842 shares of our common stock issued to Saratoga Investment Advisors and certain of its affiliates.
On March 28, 2012, our wholly-owned subsidiary, Saratoga Investment Corp. SBIC, LP ("SBIC LP"), received a SBIC license from the Small Business Administration ("SBA").
In May 2013, we issued $48.3 million in aggregate principal amount of our 7.50% unsecured notes due 2020 for net proceeds of $46.1 million after deducting underwriting commissions of $1.9 million and offering costs of $0.3 million. The proceeds included the underwriters' full exercise of their overallotment option. Interest on these notes is paid quarterly in arrears on February 15, May 15, August 15 and November 15, at a rate of 7.50% per year, beginning August 15, 2013. The notes mature on May 31, 2020 and may be redeemed in whole or in part at any time or from time to time at our option on or after May 31, 2016. The notes are listed on the NYSE under the trading symbol "SAQ" with a par value of $25.00 per share.
Critical Accounting Policies
Basis of Presentation
The preparation of financial statements in accordance with U.S. generally accepted accounting principles ("U.S. GAAP") requires management to make certain estimates and assumptions affecting amounts reported in the Company's consolidated financial statements. We have identified investment valuation, revenue recognition and the recognition of capital gains incentive fee expense as our most critical accounting estimates. We continuously evaluate our estimates, including those related to the matters described below. These estimates are based on the information that is currently available to us and on various other assumptions that we believe to be reasonable under the circumstances. Actual results could differ materially from those estimates under different assumptions or conditions. A discussion of our critical accounting policies follows.
Investment Valuation
The Company accounts for its investments at fair value in accordance with the Financial Accounting Standards Board ("FASB") Accounting Standards Codification ("ASC") Topic 820, Fair Value Measurements and Disclosures ("ASC 820"). ASC 820 defines fair value, establishes a framework for measuring fair value, establishes a fair value hierarchy based on the quality of inputs used to measure fair value and enhances disclosure requirements for fair value measurements. ASC 820 requires the Company to assume that its investments are to be sold at the statement of assets and liabilities date in the principal market to independent market participants, or in the absence of a principal market, in the most advantageous market, which may be a hypothetical market. Market participants are defined as buyers and sellers in the principal or most advantageous market that are independent, knowledgeable, and willing and able to transact.
50
Investments for which market quotations are readily available are fair valued at such market quotations obtained from independent third party pricing services and market makers subject to any decision by our board of directors to approve a fair value determination to reflect significant events affecting the value of these investments. We value investments for which market quotations are not readily available at fair value as approved, in good faith, by our board of directors based on input from Saratoga Investment Advisers, the audit committee of our board of directors and a third party independent valuation firm. Determinations of fair value may involve subjective judgments and estimates. The types of factors that may be considered in determining the fair value of our investments include the nature and realizable value of any collateral, the portfolio company's ability to make payments, market yield trend analysis, the markets in which the portfolio company does business, comparison to publicly traded companies, discounted cash flow and other relevant factors.
We undertake a multi-step valuation process each quarter when valuing investments for which market quotations are not readily available, as described below:
| • | Each investment is initially valued by the responsible investment professionals of Saratoga Investment Advisors and preliminary valuation conclusions are documented and discussed with our senior management; and |
| • | An independent valuation firm engaged by our board of directors reviews approximately one quarter of these preliminary valuations each quarter so that the valuation of each investment for which market quotes are not readily available is reviewed by the independent valuation firm at least annually. |
In addition, all our investments are subject to the following valuation process:
| • | The audit committee of our board of directors reviews each preliminary valuation and Saratoga Investment Advisors and independent valuation firm (if applicable) will supplement the preliminary valuation to reflect any comments provided by the audit committee; and |
| • | Our board of directors discusses the valuations and approves the fair value of each investment, in good faith, based on the input of Saratoga Investment Advisors, independent valuation firm (to the extent applicable) and the audit committee of our board of directors. |
Our investment in Saratoga Investment Corp. CLO 2013-1, Ltd. ("Saratoga CLO") is carried at fair value, which is based on a discounted cash flow model that utilizes prepayment, re-investment and loss assumptions based on historical experience and projected performance, economic factors, the characteristics of the underlying cash flow, and comparable yields for equity interests in collateralized loan obligation funds similar to Saratoga CLO, when available, as determined by SIA and recommended to our board of directors. Specifically, we use Intex cash flow models, or an appropriate substitute, to form the basis for the valuation of our investment in Saratoga CLO. The models use a set of assumptions including projected default rates, recovery rates, reinvestment rate and prepayment rates in order to arrive at estimated valuations. The assumptions are based on available market data and projections provided by third parties as well as management estimates. We use the output from the Intex models (i.e., the estimated cash flows) to perform a discounted cash flows analysis on expected future cash flows to determine a valuation for our investment in Saratoga CLO.
Revenue Recognition
Income Recognition
Interest income, adjusted for amortization of premium and accretion of discount, is recorded on an accrual basis to the extent that such amounts are expected to be collected. The Company stops accruing interest on its investments when it is determined that interest is no longer collectible. Discounts and premiums on investments purchased are accreted/amortized over the life of the respective investment using the effective yield method. The amortized cost of investments represents the original cost adjusted for the accretion of discounts and amortizations of premium on investments.
Loans are generally placed on non-accrual status when there is reasonable doubt that principal or interest will be collected. Accrued interest is generally reserved when a loan is placed on non-accrual status. Interest payments received on non-accrual loans may be recognized as a reduction in principal depending upon management's judgment regarding collectability. Non-accrual loans are restored to accrual status when past due principal and interest is paid and, in management's judgment, are likely to remain current, although we may make exceptions to this general rule if the loan has sufficient collateral value and is in the process of collection.
51
Interest income on our investment in Saratoga CLO is recorded using the effective interest method in accordance with the provisions of ASC Topic 325-40, Investments-Other, Beneficial Interests in Securitized Financial Assets , based on the anticipated yield and the estimated cash flows over the projected life of the investment. Yields are revised when there are changes in actual or estimated cash flows due to changes in prepayments and/or re-investments, credit losses or asset pricing. Changes in estimated yield are recognized as an adjustment to the estimated yield over the remaining life of the investment from the date the estimated yield was changed.
Paid-in-Kind Interest
The Company holds debt investments in its portfolio that contain a payment-in-kind ("PIK") interest provision. The PIK interest, which represents contractually deferred interest added to the investment balance that is generally due at maturity, is generally recorded on the accrual basis to the extent such amounts are expected to be collected. We stop accruing PIK interest if we do not expect the issuer to be able to pay all principal and interest when due.
Capital Gains Incentive Fee
The Company records an expense accrual relating to the capital gains incentive fee payable by the Company to its investment adviser when the unrealized gains on its investments exceed all realized capital losses on its investments given the fact that a capital gains incentive fee would be owed to the investment adviser if the Company were to liquidate its investment portfolio at such time. The actual incentive fee payable to the Company's investment adviser related to capital gains will be determined and payable in arrears at the end of each fiscal year and will include only realized capital gains for the period.
Revenues
We generate revenue in the form of interest income and capital gains on the debt investments that we hold and capital gains, if any, on equity interests that we may acquire. We expect our debt investments, whether in the form of leveraged loans or mezzanine debt, to have terms of up to ten years, and to bear interest at either a fixed or floating rate. Interest on debt will be payable generally either quarterly or semi-annually. In some cases, our debt investments may provide for a portion of the interest to be PIK. To the extent interest is paid-in-kind, it will be payable through the increase of the principal amount of the obligation by the amount of interest due on the then-outstanding aggregate principal amount of such obligation. The principal amount of the debt and any accrued but unpaid interest will generally become due at the maturity date. In addition, we may generate revenue in the form of commitment, origination, structuring or diligence fees, fees for providing managerial assistance or investment management services and possibly consulting fees. Any such fees will be generated in connection with our investments and recognized as earned. We may also invest in preferred equity securities that pay dividends on a current basis.
On January 22, 2008, we entered into a collateral management agreement with Saratoga CLO, pursuant to which we act as its collateral manager. The Saratoga CLO was refinanced in October 2013 and its reinvestment period ends in October 2016. The Saratoga CLO remains 100% owned and managed by Saratoga Investment Corp. We receive a senior collateral management fee of 0.25% and a subordinate collateral management fee of 0.25% of the outstanding principal amount of Saratoga CLO's assets, paid quarterly to the extent of available proceeds. We are also entitled to an incentive management fee equal to 20.0% of excess cash flow to the extent the Saratoga CLO subordinated notes receive an internal rate of return equal to or greater than 12.0%.
We recognize interest income on our investment in the subordinated notes of Saratoga CLO using the effective interest method, based on the anticipated yield and the estimated cash flows over the projected life of the investment. Yields are revised when there are changes in actual or estimated cash flows due to changes in prepayments and/or re-investments, credit losses or asset pricing. Changes in estimated yield are recognized as an adjustment to the estimated yield over the remaining life of the investment from the date the estimated yield was changed.
Expenses
Our primary operating expenses include the payment of investment advisory and management fees, professional fees, directors and officers insurance, fees paid to independent directors and administrator expenses, including our allocable portion of our administrator's overhead. Our investment advisory and management fees compensate our investment adviser for its work in identifying, evaluating, negotiating, closing and monitoring our investments. We bear all other costs and expenses of our operations and transactions, including those relating to:
| • | organization; |
| • | calculating our net asset value (including the cost and expenses of any independent valuation firm); |
52
| • | expenses incurred by our investment adviser payable to third parties, including agents, consultants or other advisers, in monitoring our financial and legal affairs and in monitoring our investments and performing due diligence on our prospective portfolio companies; |
| • | interest payable on debt, if any, incurred to finance our investments; |
| • | offerings of our common stock and other securities; |
| • | investment advisory and management fees; |
| • | fees payable to third parties, including agents, consultants or other advisers, relating to, or associated with, evaluating and making investments; |
| • | transfer agent and custodial fees; |
| • | federal and state registration fees; |
| • | all costs of registration and listing our common stock on any securities exchange; |
| • | federal, state and local taxes; |
| • | independent directors' fees and expenses; |
| • | costs of preparing and filing reports or other documents required by governmental bodies (including the SEC and the SBA); |
| • | costs of any reports, proxy statements or other notices to common stockholders including printing costs; |
| • | our fidelity bond, directors and officers errors and omissions liability insurance, and any other insurance premiums; |
| • | direct costs and expenses of administration, including printing, mailing, long distance telephone, copying, secretarial and other staff, independent auditors and outside legal costs; and |
| • | administration fees and all other expenses incurred by us or, if applicable, the administrator in connection with administering our business (including payments under the administration agreement based upon our allocable portion of the administrator's overhead in performing its obligations under an administration agreement, including rent and the allocable portion of the cost of our officers and their respective staffs (including travel expenses)). |
Pursuant to the investment advisory and management agreement that we had with GSCP (NJ), L.P., our former investment adviser and administrator, we had agreed to pay GSCP (NJ), L.P. as investment adviser a quarterly base management fee of 1.75% of the average value of our total assets (other than cash or cash equivalents but including assets purchased with borrowed funds) at the end of the two most recently completed fiscal quarters, and appropriately adjusted for any share issuances or repurchases during the applicable fiscal quarter, and an incentive fee.
The incentive fee had two parts:
| • | A fee, payable quarterly in arrears, equal to 20.0% of our pre-incentive fee net investment income, expressed as a rate of return on the value of the net assets at the end of the immediately preceding quarter, that exceeded a 1.875% quarterly (7.5% annualized) hurdle rate measured as of the end of each fiscal quarter. Under this provision, in any fiscal quarter, our investment adviser received no incentive fee unless our pre-incentive fee net investment income exceeded the hurdle rate of 1.875%. Amounts received as a return of capital were not included in calculating this portion of the incentive fee. Since the hurdle rate was based on net assets, a return of less than the hurdle rate on total assets could still have resulted in an incentive fee. |
| • | A fee, payable at the end of each fiscal year, equal to 20.0% of our net realized capital gains, if any, computed net of all realized capital losses and unrealized capital depreciation, in each case on a cumulative basis, less the aggregate amount of capital gains incentive fees paid to the investment adviser through such date. |
53
We deferred cash payment of any incentive fee otherwise earned by our former investment adviser if, during the then most recent four full fiscal quarters ending on or prior to the date such payment was to be made, the sum of (a) our aggregate distributions to our stockholders and (b) our change in net assets (defined as total assets less liabilities) (before taking into account any incentive fees payable during that period) was less than 7.5% of our net assets at the beginning of such period. These calculations were appropriately pro-rated for the first three fiscal quarters of operation and adjusted for any share issuances or repurchases during the applicable period. Such incentive fee would become payable on the next date on which such test had been satisfied for the most recent four full fiscal quarters or upon certain terminations of the investment advisory and management agreement. We commenced deferring cash payment of incentive fees during the quarterly period ended August 31, 2007, and continued to defer such payments through the quarterly period ended May 31, 2010. As of July 30, 2010, the date on which GSCP (NJ), L.P. ceased to be our investment adviser and administrator, we owed GSCP (NJ), L.P. $2.9 million in fees for services previously provided to us; of which $0.3 million has been paid by us. GSCP (NJ), L.P. agreed to waive payment by us of the remaining $2.6 million in connection with the consummation of the stock purchase transaction with Saratoga Investment Advisors and certain of its affiliates described elsewhere in this Annual Report.
The terms of the investment advisory and management agreement with Saratoga Investment Advisors, our current investment adviser, are substantially similar to the terms of the investment advisory and management agreement we had entered into with GSCP (NJ), L.P., our former investment adviser, except for the following material distinctions in the fee terms:
| • | The capital gains portion of the incentive fee was reset with respect to gains and losses from May 31, 2010, and therefore losses and gains incurred prior to such time will not be taken into account when calculating the capital gains fee payable to Saratoga Investment Advisors and, as a result, Saratoga Investment Advisors will be entitled to 20.0% of net gains that arise after May 31, 2010. In addition, the cost basis for computing realized gains and losses on investments held by us as of May 31, 2010 equal the fair value of such investment as of such date. Under the investment advisory and management agreement with our former investment adviser, GSCP (NJ), L.P., the capital gains fee was calculated from March 21, 2007, and the gains were substantially outweighed by losses. |
| • | Under the "catch up" provision, 100.0% of our pre-incentive fee net investment income with respect to that portion of such pre-incentive fee net investment income that exceeds 1.875% (7.5% annualized) but is less than or equal to 2.344% in any fiscal quarter is payable to Saratoga Investment Advisors. This will enable Saratoga Investment Advisors to receive 20.0% of all net investment income as such amount approaches 2.344% in any quarter, and Saratoga Investment Advisors will receive 20.0% of any additional net investment income. Under the investment advisory and management agreement with our former investment adviser, GSCP (NJ), L.P. only received 20.0% of the excess net investment income over 1.875%. |
| • | We will no longer have deferral rights regarding incentive fees in the event that the distributions to stockholders and change in net assets is less than 7.5% for the preceding four fiscal quarters. |
To the extent that any of our leveraged loans are denominated in a currency other than U.S. dollars, we may enter into currency hedging contracts to reduce our exposure to fluctuations in currency exchange rates. We may also enter into interest rate hedging agreements. Such hedging activities, which will be subject to compliance with applicable legal requirements, may include the use of interest rate caps, futures, options and forward contracts. Costs incurred in entering into or settling such contracts will be borne by us.
New Accounting Pronouncements
In February 2015, the FASB issued ASU 2015-02, Consolidation (ASC Topic 810): Amendments to the Consolidation Analysis ("ASU 2015-02"). ASU 2015-02 significantly changes the consolidation analysis required under GAAP and ends the deferral granted to investment companies from applying the variable interest entity guidance. ASU 2015-02 is effective for interim and annual reporting periods in fiscal years that begin after December 15, 2015 and early adoption is permitted. Management is currently evaluating the impact these changes will have on the Company's consolidated financial statements and disclosures.
In August 2014, the FASB issued new accounting guidance that requires management to assess an entity's ability to continue as a going concern by incorporating and expanding upon certain principles that are currently in U.S. auditing standards. The amendments provide a definition of the term "substantial doubt" and include principles for considering the mitigating effect of management's plans. The amendments also require an evaluation every reporting period, including interim periods for a period of one year after the date that the financial statements are issued (or available to be issued), and certain disclosures when substantial doubt is alleviated or not alleviated. The amendments in this update are effective for reporting periods ending after December 15, 2016. Management is currently evaluating the impact of adopting this new accounting guidance update on the company's consolidated financial statement.
54
In June 2014, the FASB issued ASU 2014-11, Repurchase-to-Maturity Transactions, Repurchase Financings, and Disclosures, ("ASU 2014-11"). ASU 2014-11 makes limited changes to the accounting for repurchase agreements, clarifies when repurchase agreements and securities lending transactions should be accounted for as secured borrowings, and requires additional disclosures regarding these types of transactions. The guidance is effective for fiscal years beginning on or after December 15, 2014, and for interim periods within those fiscal years. Management is currently evaluating the impact these changes will have on the Company's consolidated financial statement disclosures.
In May 2014, the Financial Accounting Standards Board ("FASB") issued Accounting Standards Update ("ASU") 2014-09, Revenue from Contracts with Customers (Topic 606) , which supersedes the revenue recognition requirements in Revenue Recognition (Topic 605). Under the new guidance, an entity should recognize revenue to depict the transfer of promised goods or services to customers in an amount that reflects the consideration to which the entity expects to be entitled in exchange for those goods or services. This guidance is effective for annual and interim reporting periods beginning after December 15, 2016, and early application is not permitted. The Company is currently evaluating the impact this ASU will have on its consolidated financial statements.
Portfolio and investment activity
Corporate Debt Portfolio Overview
| At February 28, 2015 | At February 28, 2014 | At February 28, 2013 | ||||||||||
| ($ in millions) | ($ in millions) | ($ in millions) | ||||||||||
Number of investments(1) | 63 | 59 | 44 | |||||||||
Number of portfolio companies(1) | 34 | 37 | 28 | |||||||||
Average investment size(1) | $ | 3.5 | $ | 3.2 | $ | 2.9 | ||||||
Weighted average maturity(1) | 3.7yrs | 4.3yrs | 3.7yrs | |||||||||
Number of industries(1) | 14 | 16 | 15 | |||||||||
Average investment per portfolio company(1) | $ | 6.6 | $ | 5.0 | $ | 4.6 | ||||||
Non-performing or delinquent investments(1) | $ | 0.0 | $ | 0.3 | $ | 6.7 | ||||||
Fixed rate debt (% of interest bearing portfolio)(2) | $ | 82.5(40.6) | % | $ | 70.6(40.1) | % | $ | 53.4(43.9) | % | |||
Weighted average current coupon(2) | 12.0 | % | 12.5 | % | 12.6 | % | ||||||
Floating rate debt (% of interest bearing portfolio)(2) | $ | 120.8(59.4) | % | $ | 105.4(59.9) | % | $ | 68.2(56.1) | % | |||
Weighted average current spread over LIBOR(2) | 8.7 | % | 7.3 | % | 7.5 | % | ||||||
| (1) | Excludes our investment in the subordinated notes of Saratoga CLO and limited partnership interests. |
| (2) | Excludes our investment in the subordinated notes of Saratoga CLO, investments in common stocks and limited partnership interests. |
During the fiscal year ended February 28, 2015, we invested $104.9 million in new or existing portfolio companies and had $73.3 million in aggregate amount of exits and repayments resulting in net investments of $31.6 million for the year.
During the fiscal year ended February 28, 2014, we invested $121.1 million in new or existing portfolio companies and had $71.6 million in aggregate amount of exits and repayments resulting in net investments of $49.5 million for the year.
During the fiscal year ended February 28, 2013, we invested $71.6 million in new or existing portfolio companies and had $21.5 million in aggregate amount of exits and repayments resulting in net investments of $50.1 million for the year.
55
Our portfolio composition at February 28, 2015, February 28, 2014 and February 28, 2013 at fair value was as follows:
Portfolio composition
| At February 28, 2015 | At February 28, 2014 | At February 28, 2013 | ||||||||||||||||||||||
| Percentage of Total Portfolio | Weighted Average Current Yield | Percentage of Total Portfolio | Weighted Average Current Yield | Percentage of Total Portfolio | Weighted Average Current Yield | |||||||||||||||||||
Syndicated loans | 7.6 | % | 6.2 | % | 15.7 | % | 6.2 | % | - | % | - | % | ||||||||||||
First lien term loans | 60.3 | 11.0 | 53.6 | 11.5 | 69.0 | 11.0 | ||||||||||||||||||
Second lien term loans | 14.8 | 11.2 | 13.5 | 11.1 | 6.2 | 11.1 | ||||||||||||||||||
Unsecured notes | 1.8 | 13.7 | 2.7 | 15.2 | 3.1 | 16.4 | ||||||||||||||||||
Saratoga CLO subordinated notes | 7.1 | 25.2 | 9.5 | 18.6 | 16.5 | 27.1 | ||||||||||||||||||
Equity interests | 8.4 | N/A | 5.0 | N/A | 5.2 | N/A | ||||||||||||||||||
|
|
|
|
|
|
|
|
|
|
|
| |||||||||||||
Total | 100.0 | % | 11.8 | % | 100.0 | % | 11.8 | % | 100.0 | % | 14.0 | % | ||||||||||||
|
|
|
|
|
|
|
|
|
|
|
| |||||||||||||
Our investment in the subordinated notes of Saratoga CLO represents a first loss position in a portfolio that, at February 28, 2015, February 28, 2014 and February 28, 2013, was composed of $296.9 million, $301.3 million and $383.3 million, respectively, in aggregate principal amount of predominantly senior secured first lien term loans. This investment is subject to unique risks. (See "Risk Factors-Our investment in Saratoga CLO 2013-1 LTD. constitutes a leveraged investment in a portfolio of predominantly senior secured first lien term loans and is subject to additional risks and volatility"). We do not consolidate the Saratoga CLO portfolio in our financial statements. Accordingly, the metrics below do not include the underlying Saratoga CLO portfolio investments. However, at February 28, 2015, $291.6 million or 98.8% of the Saratoga CLO portfolio investments in terms of market value had a CMR (as defined below) color rating of green or yellow and two Saratoga CLO portfolio investments were in default with a fair value of $2.7 million. At February 28, 2014, $298.9 million or 99.5% of the Saratoga CLO portfolio investments in terms of market value had a CMR (as defined below) color rating of green or yellow and zero Saratoga CLO portfolio investments were in default with a fair value of $1.6 million. For more information relating to Saratoga CLO, see the audited financial statements for Saratoga CLO included elsewhere herein.
Saratoga Investment Advisors normally grades all of our investments using a credit and monitoring rating system ("CMR"). The CMR consists of a single component: a color rating. The color rating is based on several criteria, including financial and operating strength, probability of default, and restructuring risk. The color ratings are characterized as follows: (Green)-strong credit; (Yellow)-satisfactory credit; (Red)-payment default risk, in payment default and/or significant restructuring activity.
The CMR distribution of our investments at February 28, 2015 and February 28, 2014 was as follows:
Portfolio CMR distribution
| At February 28, 2015 | At February 28, 2014 | |||||||||||||||
Color Score | Investments at Fair Value | Percentage of Total Portfolio | Investments at Fair Value | Percentage of Total Portfolio | ||||||||||||
| ($ in thousands) | ||||||||||||||||
Green | $ | 191,606 | 79.7 | % | $ | 159,207 | 77.4 | % | ||||||||
Yellow | 11,635 | 4.8 | 8,466 | 4.1 | ||||||||||||
Red | 101 | 0.0 | 8,270 | 4.0 | ||||||||||||
N/A(1) | 37,196 | 15.5 | 29,902 | 14.5 | ||||||||||||
|
|
|
|
|
|
|
| |||||||||
Total | $ | 240,538 | 100.0 | % | $ | 205,845 | 100.0 | % | ||||||||
|
|
|
|
|
|
|
| |||||||||
| (1) | Comprised of our investment in the subordinated notes of Saratoga CLO and equity interests. |
The CMR distribution of Saratoga CLO investments at February 28, 2015 and February 28, 2014 was as follows:
Portfolio CMR distribution
| At February 28, 2015 | At February 28, 2014 | |||||||||||||||
Color Score | Investments at Fair Value | Percentage of Total Portfolio | Investments at Fair Value | Percentage of Total Portfolio | ||||||||||||
| ($ in thousands) | ||||||||||||||||
Green | $ | 278,769 | 94.4 | % | $ | 284,796 | 94.8 | % | ||||||||
Yellow | 12,875 | 4.4 | 14,106 | 4.7 | ||||||||||||
Red | 2,978 | 1.0 | 1,589 | 0.5 | ||||||||||||
N/A(1) | 617 | 0.2 | - | - | ||||||||||||
|
|
|
|
|
|
|
| |||||||||
Total | $ | 295,239 | 100.0 | % | $ | 300,491 | 100.0 | % | ||||||||
|
|
|
|
|
|
|
| |||||||||
| (1) | Comprised of Saratoga CLO's equity interests. |
56
Portfolio composition by industry grouping at fair value
The following table shows our portfolio composition by industry grouping at fair value at February 28, 2015 and February 28, 2014:
| At February 28, 2015 | At February 28, 2014 | |||||||||||||||
| Investments at Fair Value | Percentage of Total Portfolio | Investments at Fair Value | Percentage of Total Portfolio | |||||||||||||
| ($ in thousands) | ||||||||||||||||
Business Services | $ | 52,128 | 21.7 | % | $ | 57,330 | 27.9 | % | ||||||||
Software | 50,362 | 20.9 | 21,738 | 10.5 | ||||||||||||
Consumer Services | 27,332 | 11.4 | 21,897 | 10.6 | ||||||||||||
Healthcare Services | 20,641 | 8.6 | 23,810 | 11.6 | ||||||||||||
Structured Finance (1) | 17,031 | 7.1 | 19,570 | 9.5 | ||||||||||||
Metals | 15,262 | 6.3 | 6,645 | 3.2 | ||||||||||||
Media | 15,026 | 6.2 | - | - | ||||||||||||
Automotive Aftermarket | 10,980 | 4.6 | 10,621 | 5.2 | ||||||||||||
Food and Beverage | 10,348 | 4.3 | 17,286 | 8.4 | ||||||||||||
Electronics | 6,667 | 2.8 | 6,741 | 3.3 | ||||||||||||
Utilities | 5,955 | 2.5 | - | - | ||||||||||||
Building Products | 3,436 | 1.4 | 901 | 0.4 | ||||||||||||
Consumer Products | 3,284 | 1.4 | 6,118 | 3.0 | ||||||||||||
Publishing | 1,985 | 0.8 | 1,191 | 0.6 | ||||||||||||
Education | 101 | 0.0 | 90 | 0.0 | ||||||||||||
Manufacturing | - | - | 5,970 | 2.9 | ||||||||||||
Environmental | - | - | 5,249 | 2.5 | ||||||||||||
Aerospace | - | - | 344 | 0.2 | ||||||||||||
Homebuilding | - | - | 344 | 0.2 | ||||||||||||
|
|
|
|
|
|
|
| |||||||||
Total | $ | 240,538 | 100.0 | % | $ | 205,845 | 100.0 | % | ||||||||
|
|
|
|
|
|
|
| |||||||||
| (1) | Comprised of our investment in the subordinated notes of Saratoga CLO. |
The following table shows Saratoga CLO's portfolio composition by industry grouping at fair value at February 28, 2015 and February 28, 2014:
| At February 28, 2015 | At February 28, 2014 | |||||||||||||||
| Investments at Fair Value | Percentage of Total Portfolio | Investments at Fair Value | Percentage of Total Portfolio | |||||||||||||
| ($ in thousands) | ||||||||||||||||
Business Equipment and Services | $ | 42,751 | 14.5 | % | $ | 28,386 | 9.4 | % | ||||||||
Healthcare | 34,400 | 11.6 | 37,896 | 12.6 | ||||||||||||
Chemicals/Plastics | 25,758 | 8.7 | 26,345 | 8.8 | ||||||||||||
Retailers (Except Food and Drugs) | 22,026 | 7.4 | 15,314 | 5.1 | ||||||||||||
Conglomerate | 19,928 | 6.7 | 24,285 | 8.1 | ||||||||||||
Industrial Equipment | 15,290 | 5.2 | 24,143 | 8.0 | ||||||||||||
Electronics/Electric | 12,904 | 4.4 | 11,861 | 4.0 | ||||||||||||
Leisure Goods/Activities/Movies | 12,629 | 4.3 | 8,990 | 3.0 | ||||||||||||
Financial Intermediaries | 10,806 | 3.7 | 8,138 | 2.7 | ||||||||||||
Drugs | 10,091 | 3.4 | 11,873 | 4.0 | ||||||||||||
Aerospace and Defense | 7,287 | 2.5 | 20,465 | 6.8 | ||||||||||||
Telecommunications | 6,675 | 2.3 | 6,627 | 2.2 | ||||||||||||
Automotive | 6,650 | 2.2 | 10,279 | 3.4 | ||||||||||||
Utilities | 6,281 | 2.1 | 5,830 | 1.9 | ||||||||||||
Oil & Gas | 6,070 | 2.1 | 2,488 | 0.8 | ||||||||||||
Food Services | 5,886 | 2.0 | 5,612 | 1.9 | ||||||||||||
Food/Drug Retailers | 5,861 | 2.0 | 5,012 | 1.7 | ||||||||||||
Food Products | 5,856 | 2.0 | 12,450 | 4.1 | ||||||||||||
57
| At February 28, 2015 | At February 28, 2014 | |||||||||||||||
| Investments at Fair Value | Percentage of Total Portfolio | Investments at Fair Value | Percentage of Total Portfolio | |||||||||||||
| ($ in thousands) | ||||||||||||||||
Lodging and Casinos | $ | 5,826 | 2.0 | % | $ | 499 | 0.2 | % | ||||||||
Publishing | 5,627 | 1.9 | 2,913 | 1.0 | ||||||||||||
Insurance | 5,425 | 1.8 | 5,517 | 1.8 | ||||||||||||
Brokers/Dealers/Investment Houses | 4,832 | 1.6 | 3,740 | 1.2 | ||||||||||||
Containers/Glass Products | 4,313 | 1.5 | 2,906 | 1.0 | ||||||||||||
Cable and Satellite Television | 2,646 | 0.9 | 2,666 | 0.9 | ||||||||||||
Telecommunications/Cellular | 2,431 | 0.8 | 2,460 | 0.8 | ||||||||||||
Media | 2,004 | 0.7 | 1,000 | 0.3 | ||||||||||||
Nonferrous Metals/Minerals | 1,835 | 0.6 | 4,328 | 1.4 | ||||||||||||
Technology | 1,008 | 0.3 | - | - | ||||||||||||
Healthcare & Pharmaceuticals | 499 | 0.2 | - | - | ||||||||||||
Building and Development | 485 | 0.2 | 3,246 | 1.1 | ||||||||||||
Broadcast Radio and Television | 467 | 0.2 | 1,505 | 0.5 | ||||||||||||
Health Insurance | 442 | 0.1 | - | - | ||||||||||||
Environmental | 250 | 0.1 | - | - | ||||||||||||
Computers & Electronics | - | - | 1,479 | 0.5 | ||||||||||||
Ecological Services and Equipment | - | - | 1,241 | 0.4 | ||||||||||||
Gaming And Hotels | - | - | 500 | 0.2 | ||||||||||||
Leasing | - | - | 497 | 0.2 | ||||||||||||
|
|
|
|
|
|
|
| |||||||||
Total | $ | 295,239 | 100.0 | % | $ | 300,491 | 100.0 | % | ||||||||
|
|
|
|
|
|
|
| |||||||||
58
Portfolio composition by geographic location at fair value
The following table shows our portfolio composition by geographic location at fair value at February 28, 2015 and February 28, 2014. The geographic composition is determined by the location of the corporate headquarters of the portfolio company.
| At February 28, 2015 | At February 28, 2014 | |||||||||||||||
| Investments at Fair Value | Percentage of Total Portfolio | Investments at Fair Value | Percentage of Total Portfolio | |||||||||||||
| ($ in thousands) | ||||||||||||||||
Southeast | $ | 92,069 | 38.3 | % | $ | 83,161 | 40.4 | % | ||||||||
Midwest | 55,767 | 23.2 | 41,453 | 20.1 | ||||||||||||
West | 40,259 | 16.7 | 44,470 | 21.6 | ||||||||||||
Northeast | 34,412 | 14.3 | 17,191 | 8.4 | ||||||||||||
Other(1) | 17,031 | 7.1 | 19,570 | 9.5 | ||||||||||||
International | 1,000 | 0.4 | - | - | ||||||||||||
|
|
|
|
|
|
|
| |||||||||
Total | $ | 240,538 | 100.0 | % | $ | 205,845 | 100.0 | % | ||||||||
|
|
|
|
|
|
|
| |||||||||
| (1) | Comprised of our investment in the subordinated notes of Saratoga CLO. |
Results of operations
Operating results for the fiscal years ended February 28, 2015, February 28, 2014 and February 28, 2013 are as follows:
| For the Year Ended | ||||||||||||
| February 28, 2015 | February 28, 2014 | February 28, 2013 | ||||||||||
| ($ in thousands) | ||||||||||||
Total investment income | $ | 27,375 | $ | 22,893 | $ | 17,007 | ||||||
Total expenses, net | 17,701 | 14,019 | 10,537 | |||||||||
|
|
|
|
|
| |||||||
Net investment income | 9,674 | 8,874 | 6,470 | |||||||||
Net realized gains | 3,276 | 1,271 | 431 | |||||||||
Net unrealized gains (losses) | (1,943 | ) | (1,648 | ) | 7,143 | |||||||
|
|
|
|
|
| |||||||
Net increase in net assets resulting from operations | $ | 11,007 | $ | 8,497 | $ | 14,044 | ||||||
|
|
|
|
|
| |||||||
As described in Note 2 to the consolidated financial statements and notes thereto, we identified errors that impacted the years ended February 28, 2014, February 28, 2013, February 29, 2012 and February 28, 2011. The corrections for the errors, which we have concluded are immaterial to all prior period consolidated financial statements, are reflected in the consolidated financial statements and selected financial data included in this Form 10-K.
Investment income
The composition of our investment income for the fiscal years ended February 28, 2015, February 28, 2014 and February 28, 2013 are as follows:
| February 28, 2015 | February 28, 2014 | February 28, 2013 | ||||||||||
| ($ in thousands) | ||||||||||||
Interest from investments | $ | 24,684 | $ | 20,179 | $ | 14,444 | ||||||
Management fees from Saratoga CLO | 1,520 | 1,775 | 2,000 | |||||||||
Interest from cash and cash equivalents and other income | 1,171 | 939 | 563 | |||||||||
|
|
|
|
|
| |||||||
Total | $ | 27,375 | $ | 22,893 | $ | 17,007 | ||||||
|
|
|
|
|
| |||||||
For the fiscal year ended February 28, 2015, total investment income increased $4.5 million, or 19.6% compared to the fiscal year ended February 28, 2014. Interest income from investments increased $4.5 million, or 22.3%, to $24.7 million for the year ended February 28, 2015 from $20.2 million for the fiscal year ended February 28, 2014. This reflects an increase of 16.9% in total investments to $240.5 million at February 28, 2015 from $205.8 million at February 28, 2014, despite the weighted average current coupon reducing from 12.5% to 12.0%.
59
For the fiscal year ended February 28, 2014, total investment income increased $5.9 million, or 34.6% compared to the fiscal year ended February 28, 2013. Interest income from investments increased $5.7 million, or 39.7%, to $20.2 million for the year ended February 28, 2014 from $14.4 million for the fiscal year ended February 28, 2013. This reflects an increase of 32.7% in total investments to $205.8 million at February 28, 2014 from $155.1 million at February 28, 2013, while the weighted average current coupon remained relatively unchanged at 12.5%.
For the fiscal years ended February 28, 2015, February 28, 2014, and February 28, 2013, total PIK income was $1.2 million, $1.0 million, and $1.1 million, respectively.
The Saratoga CLO was refinanced in October 2013. As a result, proceeds from principal payments in the loan portfolio of Saratoga CLO must now be used to paydown its outstanding notes. Thus, the management fee income and investment income that we receive from Saratoga CLO has declined from historical periods, decreasing $0.3 million or 14.3% to 1.5 million and $0.2 million or 10%, to $1.8 million, for the years ended February 28, 2015 and 2014, respectively.
Operating expenses
The composition of our operating expenses for the years ended February 28, 2015, February 28, 2014 and February 28, 2013 are as follows:
Operating Expenses
| February 28, 2015 | February 28, 2014 | February 28, 2013 | ||||||||||
| ($ in thousands) | ||||||||||||
Interest and credit facility expense | $ | 7,375 | $ | 6,084 | $ | 2,540 | ||||||
Base management fees | 4,157 | 3,327 | 2,107 | |||||||||
Professional fees | 1,302 | 1,212 | 1,191 | |||||||||
Incentive management fees | 2,548 | 939 | 2,603 | |||||||||
Administrator expenses | 1,000 | 1,000 | 1,000 | |||||||||
Insurance expenses | 337 | 443 | 516 | |||||||||
Directors fees | 210 | 204 | 207 | |||||||||
Excise tax expense | 294 | - | - | |||||||||
General and administrative and other expenses | 478 | 810 | 373 | |||||||||
|
|
|
|
|
| |||||||
Total expenses | $ | 17,701 | $ | 14,019 | $ | 10,537 | ||||||
|
|
|
|
|
| |||||||
For the year ended February 28, 2015, total operating expenses increased $3.7 million, or 26.3% compared to the year ended February 28, 2014. For the year ended February 28, 2014, total operating expenses before manager expense waiver and reimbursement increased $3.5 million, or 33.0% compared to the year ended February 28, 2013.
For the years ended February 28, 2015 and 2014, the increase in interest and credit facility expense is primarily attributable to an increase in outstanding debt as compared to the prior years, with increased levels of both the SBA debentures and the revolving credit facility outstanding, as well as the notes payable being outstanding for the full year ended February 28, 2015. For the year ended February 28, 2015, the weighted average interest rate on our outstanding indebtedness was 4.92% compared to 5.35% for the fiscal year ended February 28, 2014 and 6.35% for the fiscal year ended February 28, 2013. This decrease was primarily driven by an increase in SBA debentures that carry a lower interest rate but now make up a higher proportion of our overall debt, increasing from 50.9% of overall debt as of February 28, 2014 to 57.7% as of February 28, 2015.
For the year ended February 28, 2015, base management fees increased $0.8 million, or 25.0% compared to the fiscal year ended February 28, 2014. The increase in base management fees results from the increase in the average value of our total assets, less cash and cash equivalents, from $209.2 million to $246.5 million as of February 28, 2014 and 2015, respectively. For the year ended February 28, 2014, base management fees increased $1.2 million, or 57.9% compared to the fiscal year ended February 28, 2013. The increase in base management fees results from the increase in the average value of our total assets, less cash and cash equivalents from $142.5 million to $209.2 million as of February 28, 2013 and 2014, respectively.
For the year ended February 28, 2015, professional fees increased $0.09 million, or 7.4% compared to the fiscal year ended February 28, 2014. For the year ended February 28, 2014, professional fees increased $0.02 million, or 1.8% compared to the fiscal year ended February 28, 2013.
60
For the year ended February 28, 2015, incentive management fees increased $1.6 million, or 171.4% compared to the fiscal year ended February 28, 2014. The increase in incentive management fees is primarily attributable to an increase in accrued incentive fees this year, as higher total assets has led to increased net investment income above the hurdle rate pursuant to the investment advisory and management agreement. In addition, for the year ended February 28, 2015, the incentive management fees related to capital gains changed from a $0.07 million reduction of expense to a $0.3 million increase in expense compared to the fiscal year ended February 28, 2014. For the year ended February 28, 2014, incentive management fees decreased $1.7 million, or 63.9% compared to the fiscal year ended February 28, 2013. The decrease in incentive management fees is primarily attributable to the second part of the incentive fee accrual related to capital losses, with the year ending February 28, 2013 being an accrual of $1.6 million as compared to the year ending February 28, 2014 being a reversal of the accrual of $0.1 million.
As discussed above, the increase in interest and credit facility expense for the years ended February 28, 2015, February 28, 2014 and February 28, 2013 is primarily attributable to an increase in the amount of outstanding debt as compared to the prior periods. For the years ended February 28, 2015, February 28, 2014 and February 28, 2013, the weighted average interest rate on the outstanding borrowings under the Credit Facility for the years ended February 28, 2015, February 28, 2014 and February 28, 2013 was 6.75%, 7.50% and 7.50%, respectively. For the years ended February 28, 2015, February 28, 2014, and February 28, 2013, the weighted average interest rate on the outstanding borrowings of the SBA debentures was 2.93%, 3.03% and 1.42%, respectively.
Net realized gains/losses on sales of investments
For the fiscal year ended February 28, 2015, the Company had $73.3 million of sales, repayments, exits or restructurings resulting in $3.3 million of net realized gains. The most significant realized gains and losses during the year ended February 28, 2015 were as follows:
Fiscal year ended February 28, 2015
Issuer | Asset Type | Gross Proceeds | Cost | Net Realized Gain/ (Loss) | ||||||||||
| ($ in thousands) | ||||||||||||||
Community Investors, Inc. | Term Loan A Senior Fac | $ | 6,983 | $ | 6,886 | $ | 97 | |||||||
HOA Restaurant GP/Finance | Senior Secured Notes | 4,225 | 3,938 | 287 | ||||||||||
USS Parent Holding Corp | Non Voting Common Stock | 248 | 133 | 115 | ||||||||||
USS Parent Holding Corp | Voting Common Stock | 5,650 | 3,026 | 2,624 | ||||||||||
For the fiscal year ended February 28, 2014, the Company had $71.6 million of sales, repayments, exits or restructurings resulting in $1.3 million of net realized gains. The most significant realized gains and losses during the year ended February 28, 2014 were as follows:
Fiscal year ended February 28, 2014
Issuer | Asset Type | Gross Proceeds | Cost | Net Realized Gain/ (Loss) | ||||||||||
| ($ in thousands) | ||||||||||||||
Penton Media, Inc. | First Lien Term Loan | $ | 4,887 | $ | 4,681 | $ | 206 | |||||||
Sourcehov, LLC | Second Lien Term Loan | 3,030 | 2,659 | 371 | ||||||||||
Worldwide Express Operations, LLC | Warrants | 128 | - | 128 | ||||||||||
For the fiscal year ended February 28, 2013, the Company had $21.5 million of sales, repayments, exits or restructurings resulting in $0.6 million of net realized gains. The most significant realized gains and losses during the year ended February 28, 2013 were as follows:
Fiscal year ended February 28, 2013
Issuer | Asset Type | Gross Proceeds | Cost | Net Realized Gain/ (Loss) | ||||||||||
| ($ in thousands) | ||||||||||||||
Grant US Holdings LLP | Second Lien Term Loan | $ | 183 | $ | - | $ | 183 | |||||||
Energy Alloys LLC | Warrants | 146 | - | 146 | ||||||||||
61
Net unrealized appreciation/depreciation on investments
For the year ended February 28, 2015, our investments had net unrealized depreciation of $1.9 million versus net unrealized depreciation of $1.6 million for the year ended February 28, 2014. The most significant cumulative changes in unrealized appreciation and depreciation for the year ended February 28, 2015, were the following:
Fiscal year ended February 28, 2015
Issuer | Asset Type | Cost | Fair Value | Total Unrealized Appreciation/ (Depreciation) | YTD Change in Unrealized Appreciation/ (Depreciation) | |||||||||||||
| ($ in thousands) | ||||||||||||||||||
Legacy Cabinets, Inc. | Common-Voting A-1 | 221 | 1,493 | 1,272 | 941 | |||||||||||||
Targus Holdings, Inc. | Common | 567 | - | (567 | ) | (730 | ) | |||||||||||
Saratoga CLO | Other/Structured Finance Securities | 15,953 | 17,031 | 1,078 | (1,935 | ) | ||||||||||||
The $0.9 million of unrealized appreciation in our investment in Legacy Cabinets, Inc. was driven by significant fundamental growth, which increased the fair market value of the equity.
The $0.7 million of unrealized depreciation in our investment in Targus Holdings, Inc. was due to a decline in earnings resulting from weakened demand in the company's end markets.
The $1.9 million unrealized depreciation in our investment in the Saratoga CLO was primarily due to a higher discount rate based on prevailing market conditions.
For the year ended February 28, 2014, our investments had a decrease in net unrealized depreciation of $1.6 million versus an increase in net unrealized appreciation of $7.0 million for the year ended February 28, 2013. The most significant cumulative changes in unrealized appreciation and depreciation for the year ended February 28, 2014, were the following:
Fiscal year ended February 28, 2014
Issuer | Asset Type | Cost | Fair Value | Total Unrealized Appreciation/ (Depreciation) | YTD Change in Unrealized Appreciation/ (Depreciation) | |||||||||||||
| ($ in thousands) | ||||||||||||||||||
Saratoga CLO | Other/Structured Finance Securities | $ | 16,556 | $ | 19,570 | $ | 3,014 | $ | (3,558 | ) | ||||||||
Targus Holdings, Inc. | Common Stock | 567 | 730 | 163 | (2,595 | ) | ||||||||||||
USS Parent Holding Corp. | Voting Common Stock | 3,026 | 5,028 | 2,002 | 2,162 | |||||||||||||
Group Dekko, Inc. | Second Lien Term Loan | 6,902 | 6,741 | (161 | ) | (56 | ) | |||||||||||
Elyria Foundry Company, LLC | Senior Secured Notes | 9,037 | 6,777 | (2,260 | ) | (2,259 | ) | |||||||||||
For the year ended February 28, 2013, our investments had an increase in net unrealized appreciation of $7.0 million versus an increase in net unrealized appreciation of $19.8 million for the year ended February 29, 2012. The most significant cumulative changes in unrealized appreciation and depreciation for the year ended February 28, 2013, were the following:
Fiscal year ended February 28, 2013
Issuer | Asset Type | Cost | Fair Value | Total Unrealized Appreciation/ (Depreciation) | YTD Change in Unrealized Appreciation/ (Depreciation) | |||||||||||||
| ($ in thousands) | ||||||||||||||||||
Saratoga CLO | Other/Structured Finance Securities | $ | 18,945 | $ | 25,517 | $ | 6,572 | $ | 4,266 | |||||||||
Targus Holdings, Inc. | Common Stock | 567 | 3,325 | 2,758 | 649 | |||||||||||||
USS Parent Holding Corp. | Voting Common Stock | 3,026 | 2,866 | (160 | ) | 641 | ||||||||||||
Group Dekko, Inc. | Second Lien Term Loan | 6,825 | 6,721 | (104 | ) | 464 | ||||||||||||
Worldwide Express Operations, LLC | First Lien Term Loan | 6,461 | 6,504 | 43 | 352 | |||||||||||||
Penton Media, Inc. | First Lien Term Loan | 4,497 | 4,670 | 173 | 798 | |||||||||||||
62
The $4.3 million net unrealized appreciation in our investment in the Saratoga CLO subordinated notes was due to higher cash flow projections based on an increase in principal balance and an improvement in the overcollateralization ratios, a decrease in the assumed portfolio default rate (based on better than forecast actual default rates and improved default forecasts) and an improvement in reinvestment assumptions based on current market conditions and projections.
Changes in net assets resulting from operations
For the fiscal years ended February 28, 2015, February 28, 2014 and February 28, 2013 we recorded a net increase in net assets resulting from operations of $11.0 million, $8.5 million and $14.0 million, respectively. Based on 5,385,049 weighted average common shares outstanding as of February 28, 2015, our per share net increase in net assets resulting from operations was $2.04 for the fiscal year ended February 28, 2015. This compares to a per share net increase in net assets resulting from operations of $1.73 for the fiscal year ended February 28, 2014 (based on 4,920,517 weighted average common shares outstanding as of February 28, 2014), and a per share net increase in net assets resulting from operations of $3.42 for the fiscal year ended February 28, 2013 (based on 4,110,484 weighted average common shares outstanding as of February 28, 2013).
FINANCIAL CONDITION, LIQUIDITY AND CAPITAL RESOURCES
We intend to continue to generate cash primarily from cash flows from operations, including interest earned from our investments in debt in middle market companies, interest earned from the temporary investment of cash in U.S. government securities and other high-quality debt investments that mature in one year or less, future borrowings and future offerings of securities.
Although we expect to fund the growth of our investment portfolio through the net proceeds from SBA debenture drawdowns and future equity offerings, including our dividend reinvestment plan, and issuances of senior securities or future borrowings, to the extent permitted by the 1940 Act, we cannot assure you that our plans to raise capital will be successful. In this regard, because our common stock has historically traded at a price below our current net asset value per share and we are limited in our ability to sell our common stock at a price below net asset value per share, we have been and may continue to be limited in our ability to raise equity capital. Our stockholders approved a proposal at our annual meeting of stockholders held on September 30, 2014 that authorizes us to sell shares of our common stock at an offering price per share to investors that is not less than 85% of our then current net asset value per share in one or more offerings for a period ending on the earlier of September 30, 2015 or the date of our next annual meeting of stockholders. We would need stockholder approval of a similar proposal to issue shares below net asset value per share at any time after the earlier of September 30, 2015 or our next annual meeting of stockholders.
In addition, we intend to distribute to our stockholders substantially all of our taxable income in order to satisfy the distribution requirement applicable to RICs under Subchapter M of the Code. In satisfying this distribution requirement, we have in the past relied on IRS issued private letter rulings concluding that a RIC may treat a distribution of its own stock as fulfilling its RIC distribution requirements if each stockholder may elect to receive his or her entire distribution in either cash or stock of the RIC subject to a limitation on the aggregate amount of cash to be distributed to all stockholders, which limitation must be at least 20% of the aggregate declared distribution. We may rely on these IRS private letter rulings in future periods to satisfy our RIC distribution requirement.
Also, as a BDC, we generally are required to meet a coverage ratio of total assets, less liabilities and indebtedness not represented by senior securities, to total senior securities, which include all of our borrowings and any outstanding preferred stock, of at least 200%. This requirement limits the amount that we may borrow. Our asset coverage ratio, as defined in the 1940 Act, was 321.1% as of February 28, 2015 and 348.2% as of February 28, 2014. To fund growth in our investment portfolio in the future, we anticipate needing to raise additional capital from various sources, including the equity markets and other debt-related markets, which may or may not be available on favorable terms, if at all.
Consequently, we may not have the funds or the ability to fund new investments, to make additional investments in our portfolio companies, to fund our unfunded commitments to portfolio companies or to repay borrowings. Also, the illiquidity of our portfolio investments may make it difficult for us to sell these investments when desired and, if we are required to sell these investments, we may realize significantly less than their recorded value.
Madison revolving credit facility
Below is a summary of the terms of the senior secured revolving credit facility we entered into with Madison Capital Funding (the "Credit Facility") on June 30, 2010.
Availability. The Company can draw up to the lesser of (i) $40.0 million (the "Facility Amount") and (ii) the product of the applicable advance rate (which varies from 50.0% to 75.0% depending on the type of loan asset) and the value, determined in
63
accordance with the Credit Facility (the "Adjusted Borrowing Value"), of certain "eligible" loan assets pledged as security for the loan (the "Borrowing Base"), in each case less (a) the amount of any undrawn funding commitments the Company has under any loan asset and which are not covered by amounts in the Unfunded Exposure Account referred to below (the "Unfunded Exposure Amount") and (b) outstanding borrowings. Each loan asset held by the Company as of the date on which the Credit Facility was closed was valued as of that date and each loan asset that the Company acquires after such date will be valued at the lowest of its fair value, its face value (excluding accrued interest) and the purchase price paid for such loan asset. Adjustments to the value of a loan asset will be made to reflect, among other things, changes in its fair value, a default by the obligor on the loan asset, insolvency of the obligor, acceleration of the loan asset, and certain modifications to the terms of the loan asset.
The Credit Facility contains limitations on the type of loan assets that are "eligible" to be included in the Borrowing Base and as to the concentration level of certain categories of loan assets in the Borrowing Base such as restrictions on geographic and industry concentrations, asset size and quality, payment frequency, status and terms, average life, and collateral interests. In addition, if an asset is to remain an "eligible" loan asset, the Company may not make changes to the payment, amortization, collateral and certain other terms of the loan assets without the consent of the administrative agent that will either result in subordination of the loan asset or be materially adverse to the lenders.
Collateral. The Credit Facility is secured by substantially all of the assets of the Company (other than assets held by our SBIC subsidiary) and includes the subordinated notes ("CLO Notes") issued by Saratoga CLO and the Company's rights under the CLO Management Agreement (as defined below).
Interest Rate and Fees. Under the Credit Facility, funds are borrowed from or through certain lenders at the greater of the prevailing LIBOR rate and 2.00%, plus an applicable margin of 5.50%. At the Company's option, funds may be borrowed based on an alternative base rate, which in no event will be less than 3.00%, and the applicable margin over such alternative base rate is 4.50%. In addition, the Company pays the lenders a commitment fee of 0.75% per year on the unused amount of the Credit Facility for the duration of the Revolving Period (defined below). Accrued interest and commitment fees are payable monthly. The Company was also obligated to pay certain other fees to the lenders in connection with the closing of the Credit Facility.
Revolving Period and Maturity Date. The Company may make and repay borrowings under the Credit Facility for a period of three years following the closing of the Credit Facility (the "Revolving Period"). The Revolving Period may be terminated at an earlier time by the Company or, upon the occurrence of an event of default, by action of the lenders or automatically. All borrowings and other amounts payable under the Credit Facility are due and payable in full five years after the end of the Revolving Period.
Collateral Tests. It is a condition precedent to any borrowing under the Credit Facility that the principal amount outstanding under the Credit Facility, after giving effect to the proposed borrowings, not exceed the lesser of the Borrowing Base or the Facility Amount (the "Borrowing Base Test"). In addition to satisfying the Borrowing Base Test, the following tests must also be satisfied (together with Borrowing Base Test, the "Collateral Tests"):
| • | Interest Coverage Ratio. The ratio (expressed as a percentage) of interest collections with respect to pledged loan assets, less certain fees and expenses relating to the Credit Facility, to accrued interest and commitment fees and any breakage costs payable to the lenders under the Credit Facility for the last 6 payment periods must equal at least 175.0%. |
| • | Overcollateralization Ratio. The ratio (expressed as a percentage) of the aggregate Adjusted Borrowing Value of "eligible" pledged loan assets plus the fair value of certain ineligible pledged loan assets and the CLO Notes (in each case, subject to certain adjustments) to outstanding borrowings under the Credit Facility plus the Unfunded Exposure Amount must equal at least 200.0%. |
| • | Weighted Average FMV Test. The aggregate adjusted or weighted value of "eligible" pledged loan assets as a percentage of the aggregate outstanding principal balance of "eligible" pledged loan assets must be equal to or greater than 72.0% and 80.0% during the one-year periods prior to the first and second anniversary of the closing date, respectively, and 85.0% at all times thereafter. |
The Credit Facility also requires payment of outstanding borrowings or replacement of pledged loan assets upon the Company's breach of its representation and warranty that pledged loan assets included in the Borrowing Base are "eligible" loan assets. Such payments or replacements must equal the lower of the amount by which the Borrowing Base is overstated as a result of such breach or any deficiency under the Collateral Tests at the time of repayment or replacement. Compliance with the Collateral Tests is also a condition to the discretionary sale of pledged loan assets by the Company.
Priority of Payments. During the Revolving Period, the priority of payments provisions of the Credit Facility require, after payment of specified fees and expenses and any necessary funding of the Unfunded Exposure Account, that collections of principal
64
from the loan assets and, to the extent that these are insufficient, collections of interest from the loan assets, be applied on each payment date to payment of outstanding borrowings if the Borrowing Base Test, the Overcollateralization Ratio and the Interest Coverage Ratio would not otherwise be met. Similarly, following termination of the Revolving Period, collections of interest are required to be applied, after payment of certain fees and expenses, to cure any deficiencies in the Borrowing Base Test, the Interest Coverage Ratio and the Overcollateralization Ratio as of the relevant payment date.
Reserve Account. The Credit Facility requires the Company to set aside an amount equal to the sum of accrued interest, commitment fees and administrative agent fees due and payable on the next succeeding three payment dates (or corresponding to three payment periods). If for any monthly period during which fees and other payments accrue, the aggregate Adjusted Borrowing Value of "eligible" pledged loan assets which do not pay cash interest at least quarterly exceeds 15.0% of the aggregate Adjusted Borrowing Value of "eligible" pledged loan assets, the Company is required to set aside such interest and fees due and payable on the next succeeding six payment dates. Amounts in the reserve account can be applied solely to the payment of administrative agent fees, commitment fees, accrued and unpaid interest and any breakage costs payable to the lenders.
Unfunded Exposure Account. With respect to revolver or delayed draw loan assets, the Company is required to set aside in a designated account (the "Unfunded Exposure Account") 100.0% of its outstanding and undrawn funding commitments with respect to such loan assets. The Unfunded Exposure Account is funded at the time the Company acquires a revolver or delayed draw loan asset and requests a related borrowing under the Credit Facility. The Unfunded Exposure Account is funded through a combination of proceeds of the requested borrowing and other Company funds, and if for any reason such amounts are insufficient, through application of the priority of payment provisions described above.
Operating Expenses. The priority of payments provision of the Credit Facility provides for the payment of certain operating expenses of the Company out of collections on principal and interest during the Revolving Period and out of collections on interest following the termination of the Revolving Period in accordance with the priority established in such provision. The operating expenses payable pursuant to the priority of payment provisions is limited to $350,000 for each monthly payment date or $2.5 million for the immediately preceding period of twelve consecutive monthly payment dates. This ceiling can be increased by the lesser of 5.0% or the percentage increase in the fair market value of all the Company's assets only on the first monthly payment date to occur after each one-year anniversary following the closing of the Credit Facility. Upon the occurrence of a Manager Event (described below), the consent of the administrative agent is required in order to pay operating expenses through the priority of payments provision.
Events of Default. The Credit Facility contains certain negative covenants, customary representations and warranties and affirmative covenants and events of default. The Credit Facility does not contain grace periods for breach by the Company of certain covenants, including, without limitation, preservation of existence, negative pledge, change of name or jurisdiction and separate legal entity status of the Company covenants and certain other customary covenants. Other events of default under the Credit Facility include, among other things, the following:
| • | an Interest Coverage Ratio of less than 150.0%; |
| • | an Overcollateralization Ratio of less than 175.0%; |
| • | the filing of certain ERISA or tax liens; |
| • | the occurrence of certain "Manager Events" such as: |
| • | failure by Saratoga Investment Advisors and its affiliates to maintain collectively, directly or indirectly, a cash equity investment in the Company in an amount equal to at least $5,000,000 at any time prior to the third anniversary of the closing date; |
| • | failure of the Management Agreement between Saratoga Investment Advisors and the Company to be in full force and effect; |
| • | indictment or conviction of Saratoga Investment Advisors or any "key person" for a felony offense, or any fraud, embezzlement or misappropriation of funds by Saratoga Investment Advisors or any "key person" and, in the case of "key persons," without a reputable, experienced individual reasonably satisfactory to Madison Capital Funding appointed to replace such key person within 30 days; |
65
| • | resignation, termination, disability or death of a "key person" or failure of any "key person" to provide active participation in Saratoga Investment Advisors' daily activities, all without a reputable, experienced individual reasonably satisfactory to Madison Capital Funding appointed within 30 days; or |
| • | occurrence of any event constituting "cause" under the Collateral Management Agreement between the Company and Saratoga CLO (the "CLO Management Agreement"), delivery of a notice under Section 12(c) of the CLO Management Agreement with respect to the removal of the Company as collateral manager or the Company ceases to act as collateral manager under the CLO Management Agreement. |
Conditions to Acquisitions and Pledges of Loan Assets. The Credit Facility imposes certain additional conditions to the acquisition and pledge of additional loan assets. Among other things, the Company may not acquire additional loan assets without the prior written consent of the administrative agent until such time that the administrative agent indicates in writing its satisfaction with Saratoga Investment Advisors' policies, personnel and processes relating to the loan assets.
Fees and Expenses. The Company paid certain fees and reimbursed Madison Capital Funding for the aggregate amount of all documented, out-of-pocket costs and expenses, including the reasonable fees and expenses of lawyers, incurred by Madison Capital Funding in connection with the Credit Facility and the carrying out of any and all acts contemplated thereunder up to and as of the date of closing of the stock purchase transaction with Saratoga Investment Advisors and certain of its affiliates. These amounts totaled $2.0 million.
On February 24, 2012, we amended our senior secured revolving credit facility with Madison Capital Funding LLC to, among other things:
| • | expand the borrowing capacity under the credit facility from $40.0 million to $45.0 million; |
| • | extend the Revolving Period from July 30, 2013 to February 24, 2015; and |
| • | remove the condition that we may not acquire additional loan assets without the prior written consent of the administrative agent. |
On September 17, 2014, we entered into a second amendment to the Revolving Facility with Madison Capital Funding LLC to, among other things:
| • | extend the commitment termination date from February 24, 2015 to September 17, 2017; |
| • | extend the maturity date of the Revolving Facility from February 24, 2020 to September 17, 2022 (unless terminated sooner upon certain events); |
| • | reduce the applicable margin rate on base rate borrowings from 4.50% to 3.75%, and on LIBOR borrowings from 5.50% to 4.75%; and |
| • | reduce the floor on base rate borrowings from 3.00% to 2.25%; and on LIBOR borrowings from 2.00% to 1.25%. |
As of February 28, 2015, we had $9.6 million outstanding under the Credit Facility and $79.0 million SBA-guaranteed debentures outstanding (which are discussed below). As of February 28, 2014, we had no outstanding balance under the Credit Facility and $50.0 million SBA-guaranteed debentures outstanding. Our borrowing base under the Credit Facility at February 28, 2015 and February 28, 2014 was $36.3 million and $44.6 million, respectively.
Our asset coverage ratio, as defined in the 1940 Act, was 321.1% and 348.2% for the years ended February 28, 2015 and February 28, 2014, respectively.
SBA-guaranteed debentures
In addition, we, through a wholly-owned subsidiary, sought and obtained a license from the SBA to operate an SBIC. In this regard, on March 28, 2012, our wholly-owned subsidiary, Saratoga Investment Corp. SBIC, LP, received a license from the SBA to operate as an SBIC under Section 301(c) of the Small Business Investment Act of 1958. SBICs are designated to stimulate the flow of private equity capital to eligible small businesses. Under SBA regulations, SBICs may make loans to eligible small businesses and invest in the equity securities of small businesses.
66
The SBIC license allows our SBIC subsidiary to obtain leverage by issuing SBA-guaranteed debentures. SBA-guaranteed debentures are non-recourse, interest only debentures with interest payable semi-annually and have a ten year maturity. The principal amount of SBA-guaranteed debentures is not required to be paid prior to maturity but may be prepaid at any time without penalty. The interest rate of SBA-guaranteed debentures is fixed on a semi-annual basis at a market-driven spread over U.S. Treasury Notes with 10-year maturities.
SBA regulations currently limit the amount that our SBIC subsidiary may borrow to a maximum of $150 million when it has at least $75 million in regulatory capital, receives a capital commitment from the SBA and has been through an examination by the SBA subsequent to licensing. As of February 28, 2015, our SBIC subsidiary had $59.3 million in regulatory capital and $79.0 million SBA-guaranteed debentures outstanding.
We received exemptive relief from the Securities and Exchange Commission to permit us to exclude the debt of our SBIC subsidiary guaranteed by the SBA from the definition of senior securities in the 200% asset coverage test under the 1940 Act. This allows us increased flexibility under the 200% asset coverage test by permitting us to borrow up to $150 million more than we would otherwise be able to absent the receipt of this exemptive relief.
On April 2, 2015, the SBA issued a "green light" or "go forth" letter inviting us to continue our application process to obtain a license to form and operate its second SBIC subsidiary. If approved, a second SBIC license would provide us an incremental source of long-term capital by permitting us to issue $75 million of additional SBA-guaranteed debentures in addition to the $150 million already approved under the first license. Receipt of a green light letter from the SBA does not assure an applicant that the SBA will ultimately issue an SBIC license and we have received no assurance or indication from the SBA that it will receive an SBIC license, or of the timeframe in which it would receive a license, should one be granted.
Unsecured notes
In May 2013, we issued $48.3 million in aggregate principal amount of our 7.50% unsecured notes due 2020 for net proceeds of $46.1 million after deducting underwriting commissions of $1.9 million and offering costs of $0.3 million. The proceeds included the underwriters' full exercise of their overallotment option. Interest on these notes is paid quarterly in arrears on February 15, May 15, August 15 and November 15, at a rate of 7.50% per year, beginning August 15, 2013. The notes mature on May 31, 2020 and may be redeemed in whole or in part at any time or from time to time at our option on or after May 31, 2016. In connection with the issuance of the notes, we agreed to the following covenants for the period of time during which the notes are outstanding:
| • | we will not violate (whether or not we are subject to) Section 18(a)(1)(A) as modified by Section 61(a)(1) of the 1940 Act or any successor provisions, but giving effect to any exemptive relief granted to us by the SEC. Currently, these provisions generally prohibit us from making additional borrowings, including through the issuance of additional debt or the sale of additional debt securities, unless our asset coverage, as defined in the 1940 Act, equals at least 200% after such borrowings. |
| • | we will not violate (regardless of whether we are subject to) Section 18(a)(1)(B) as modified by Section 61(a)(1) of the 1940 Act or any successor provisions, but giving effect to (i) any exemptive relief granted to us by the SEC and (ii) no-action relief granted by the SEC to another BDC (or to the Company if it determines to seek such similar no-action or other relief) permitting the BDC to declare any cash dividend or distribution notwithstanding the prohibition contained in Section 18(a)(1)(B) as modified by Section 61(a)(1) of the 1940 Act in order to maintain the BDC's status as a regulated investment company under Subchapter M of the Internal Revenue Code of 1986. Currently these provisions generally prohibit us from declaring any cash dividend or distribution upon any class of our capital stock, or purchasing any such capital stock if our asset coverage, as defined in the 1940 Act, is below 200% at the time of the declaration of the dividend or distribution or the purchase and after deducting the amount of such dividend, distribution or purchase. |
The Notes are listed on the NYSE under the trading symbol "SAQ" with a par value of $25.00 per share.
67
At February 28, 2015 and February 28, 2014, the fair value of investments, cash and cash equivalents and cash and cash equivalents, securitization accounts were as follows:
| At February 28, 2015 | At February 28, 2014 | |||||||||||||||
| Fair Value | Percent of Total | Fair Value | Percent of Total | |||||||||||||
| ($ in thousands) | ||||||||||||||||
Cash and cash equivalents | $ | 1,888 | 0.7 | % | $ | 3,294 | 1.6 | % | ||||||||
Cash and cash equivalents, securitization accounts | 18,175 | 7.0 | 3,293 | 1.6 | ||||||||||||
Syndicated loans | 18,302 | 7.0 | 32,390 | 15.2 | ||||||||||||
First lien term loans | 145,207 | 55.7 | 110,278 | 51.9 | ||||||||||||
Second lien term loans | 35,603 | 13.7 | 27,804 | 13.1 | ||||||||||||
Unsecured notes | 4,230 | 1.7 | 5,471 | 2.6 | ||||||||||||
Structured finance securities | 17,031 | 6.5 | 19,570 | 9.2 | ||||||||||||
Equity Interest | 20,165 | 7.7 | 10,332 | 4.8 | ||||||||||||
|
|
|
|
|
|
|
| |||||||||
Total | $ | 260,601 | 100.0 | % | $ | 212,432 | 100.0 | % | ||||||||
|
|
|
|
|
|
|
| |||||||||
On April 9, 2015, the Company declared a dividend of $0.27 per share payable for the fiscal quarter ended February 28, 2015, payable on May 29, 2015 to all stockholders of record at the close of business on May 4, 2015. Shareholders will have the option to receive payment of the dividend in cash, or receive shares of common stock pursuant to the Company's dividend reinvestment plan.
On September 24, 2014, the Company declared a dividend of $0.22 per share payable on February 27, 2015. Shareholders have the option to receive payment of the dividend in cash, or receive shares of common stock, pursuant our DRIP. Based on shareholder elections, the dividend consisted of approximately $0.8 million in cash and 26,858 newly issued shares of common stock, or 0.5% of our outstanding common stock prior to the dividend payment. The number of shares of common stock comprising the stock portion was calculated based on a price of $14.97 per share, which equaled the volume weighted average trading price per share of the common stock on February 13, 17, 18, 19, 20, 23, 24, 25, 26 and 27, 2015.
Also on September 24, 2014, the Company declared a dividend of $0.18 per share payable on November 28, 2014. Shareholders had the option to receive payment of the dividend in cash, or receive shares of common stock pursuant to our DRIP. Based on shareholder elections, the dividend consisted of approximately $0.6 million in cash and 22,283 newly issued shares of common stock, or 0.4% of our outstanding common stock prior to the dividend payment. The number of shares of common stock comprising the stock portion was calculated based on a price of $14.37 per share, which equaled the volume weighted average trading price per share of the common stock on November 14, 17, 18, 19, 20, 21, 24, 25, 26 and 28, 2014.
On October 30, 2013, our board of directors declared a dividend of $2.65 per share payable on December 27, 2013, to common stockholders of record on November 13, 2013. Shareholders had the option to receive payment of the dividend in cash, shares of common stock, or a combination of cash and shares of common stock, provided that the aggregate cash payable to all shareholders was limited to approximately $2.5 million or $0.53 per share. This dividend was declared in reliance on certain private letter rulings issued by the IRS concluding that a RIC may treat a distribution of its own stock as fulfilling its RIC distribution requirements if each stockholder may elect to receive his or her entire distribution in either cash or stock of the RIC subject to a limitation on the aggregate amount of cash to be distributed to all stockholders, which limitation must be at least 20.0% of the aggregate declared distribution.
Based on shareholder elections, the dividend consisted of approximately $2.5 million in cash and 649,500 shares of common stock, or 13.7% of our outstanding common stock prior to the dividend payment. The amount of cash elected to be received was greater than the cash limit of 20.0% of the aggregate dividend amount, thus resulting in the payment of a combination of cash and stock to shareholders who elected to receive cash. The number of shares of common stock comprising the stock portion was calculated based on a price of $15.439 per share, which equaled the volume weighted average trading price per share of the common stock on December 11, 13, and 16, 2013.
On November 9, 2012, our board of directors declared a dividend of $4.25 per share payable on December 31, 2012, to common stockholders of record on November 20, 2012. Shareholders had the option to receive payment of the dividend in cash, shares of common stock, or a combination of cash and shares of common stock, provided that the aggregate cash payable to all shareholders was limited to approximately $3.3 million or $0.85 per share.
Based on shareholder elections, the dividend consisted of $3.3 million in cash and 853,455 shares of common stock, or 22.0% of our outstanding common stock prior to the dividend payment. The amount of cash elected to be received was greater than the cash limit of 20.0% of the aggregate dividend amount, thus resulting in the payment of a combination of cash and stock to shareholders who elected to receive cash. The number of shares of common stock comprising the stock portion was calculated based on a price of $15.444 per share, which equaled the volume weighted average trading price per share of the common stock on December 14, 17 and 19, 2012.
68
On November 15, 2011, our board of directors declared a dividend of $3.00 per share payable on December 30, 2011, to common stockholders of record on November 25, 2011. Shareholders had the option to receive payment of the dividend in cash, shares of common stock, or a combination of cash and shares of common stock, provided that the aggregate cash payable to all shareholders was limited to $2.0 million or $0.60 per share.
Based on shareholder elections, the dividend consisted of $2.0 million in cash and 599,584 shares of common stock, or 18.0% of our outstanding common stock prior to the dividend payment. The amount of cash elected to be received was greater than the cash limit of 20.0% of the aggregate dividend amount, thus resulting in the payment of a combination of cash and stock to shareholders who elected to receive cash. The number of shares of common stock comprising the stock portion was calculated based on a price of $13.117067 per share, which equaled the volume weighted average trading price per share of the common stock on December 20, 21 and 22, 2011.
On November 12, 2010, our board of directors declared a dividend of $4.40 per share to shareholders payable in cash or shares of our common stock, in accordance with the provisions of the IRS Revenue Procedure 2010-12, which allows a publicly-traded regulated investment company to satisfy its distribution requirements with a distribution paid partly in common stock provided that at least 10.0% of the distribution is payable in cash. The dividend was paid on December 29, 2010 to common shareholders of record on November 19, 2010.
Based on shareholder elections, the dividend consisted of $1.2 million in cash and 596,235 shares of common stock, or 22.0% of our outstanding common stock prior to the dividend payment. The amount of cash elected to be received was greater than the cash limit of 10.0% of the aggregate dividend amount, thus resulting in the payment of a combination of cash and stock to shareholders who elected to receive cash. The number of shares of common stock comprising the stock portion was calculated based on a price of $17.8049 per share, which equaled the volume weighted average trading price per share of the common stock on December 20, 21 and 22, 2010.
On November 13, 2009, our board of directors declared a dividend of $18.25 per share payable on December 31, 2009, to common stockholders of record on November 25, 2009. Shareholders had the option to receive payment of the dividend in cash, shares of common stock, or a combination of cash and shares of common stock, provided that the aggregate cash payable to all shareholders was limited to $2.1 million or $0.25 per share.
Based on shareholder elections, the dividend consisted of $2.1 million in cash and 8,648,725 shares of common stock, or 104.0% of our outstanding common stock prior to the dividend payment. The amount of cash elected to be received was greater than the cash limit of 13.7% of the aggregate dividend amount, thus resulting in the payment of a combination of cash and stock to shareholders who elected to receive cash. The number of shares of common stock comprising the stock portion was calculated based on a price of $1.5099 per share, which equaled the volume weighted average trading price per share of the common stock on December 24 and 28, 2009.
We cannot provide any assurance that these measures will provide sufficient sources of liquidity to support our operations and growth.
Contractual obligations
The following table shows our payment obligations for repayment of debt and other contractual obligations at February 28, 2015:
| Payment Due by Period | ||||||||||||||||||||
| Total | Less Than 1 Year | 1 -3 Years | 3 -5 Years | More Than 5 Years | ||||||||||||||||
| ($ in thousands) | ||||||||||||||||||||
Long-Term Debt Obligations | $ | 136,900 | $ | - | $ | - | $ | - | $ | 136,900 | ||||||||||
|
|
|
|
|
|
|
|
|
| |||||||||||
69
Off-balance sheet arrangements
The Company's off-balance sheet arrangements consisted of $11.2 million and $12.2 million of unfunded commitments to provide debt financing to its portfolio companies or to fund limited partnership interests as of February 28, 2015 and 2014, respectively. Such commitments are generally up to the Company's discretion to approve, or the satisfaction of certain financial and nonfinancial covenants and involve, to varying degrees, elements of credit risk in excess of the amount recognized in the Company's Consolidated Statement of Assets and Liabilities and are not reflected in the Company's Consolidated Statements of Assets and Liabilities.
A summary of the composition of the unfunded commitments as of February 28, 2015 and 2014 is shown in the table below (dollars in thousands):
| As of | ||||||||
| February 28, 2015 | February 28, 2014 | |||||||
Bristol Hospice, LLC | $ | 7,500 | $ | 7,500 | ||||
HMN Holdco, LLC | 2,400 | - | ||||||
Avionte Holdings, LLC | 1,000 | 1,000 | ||||||
Knowland Technology Holdings, L.L.C. | 300 | - | ||||||
Easy Ice, LLC | - | 3,000 | ||||||
Oceans Acquisition, Inc. | - | 500 | ||||||
Community Investors, Inc. | - | 167 | ||||||
|
|
|
| |||||
Total | $ | 11,200 | $ | 12,167 | ||||
|
|
|
| |||||
On July 10, 2014, our board of directors appointed Henri J. Steenkamp to serve as our Chief Financial Officer and Chief Compliance Officer. As previously disclosed, Mr. Steenkamp was previously appointed to serve as our Interim Chief Financial Officer and Interim Chief Compliance Officer on March 4, 2014.
On July 10, 2014, our board of directors, including a majority of the independent directors, approved the annual continuation of our investment advisory and management agreement with Saratoga Investment Advisors, LLC. Our board of directors also approved the renewal of the administration agreement with Saratoga Investment Advisors, LLC for an additional one-year term and determined to maintain the cap on the payment or reimbursement of expenses by us thereunder to $1.0 million for the additional one-year term.
70
Item 7A. Quantitative and Qualitative Disclosures about Market Risk
Our business activities contain elements of market risk. We consider our principal market risk to be the fluctuation in interest rates. Managing this risk is essential to our business. Accordingly, we have systems and procedures designed to identify and analyze our risks, to establish appropriate policies and thresholds and to continually monitor this risk and thresholds by means of administrative and information technology systems and other policies and processes.
Interest rate risk is defined as the sensitivity of our current and future earnings to interest rate volatility, including relative changes in different interest rates, variability of spread relationships, the difference in re-pricing intervals between our assets and liabilities and the effect that interest rates may have on our cash flows. Changes in the general level of interest rates can affect our net interest income, which is the difference between the interest income earned on interest earning assets and our interest expense incurred in connection with our interest bearing debt and liabilities. Changes in interest rates can also affect, among other things, our ability to acquire leveraged loans, high yield bonds and other debt investments and the value of our investment portfolio.
Our investment income is affected by fluctuations in various interest rates, including LIBOR and the prime rate. A large portion of our portfolio is, and we expect will continue to be, comprised of floating rate investments that utilize LIBOR. Our interest expense is affected by fluctuations in LIBOR. At February 28, 2015, we had $136.9 million of borrowings outstanding.
We have analyzed the potential impact of changes in interest rates on interest income from investments net of interest expense on the Credit Facility. Assuming that our investments as of February 28, 2015 were to remain constant for a full fiscal year and no actions were taken to alter the existing interest rate terms, a hypothetical change of 1.0% in interest rates would cause a corresponding increase of approximately $0.3 million to our interest income net of interest expense.
Although management believes that this measure is indicative of our sensitivity to interest rate changes, it does not adjust for potential changes in credit quality, size and composition of the assets on the statement of assets and liabilities and other business developments that could magnify or diminish our sensitivity to interest rate changes, nor does it account for divergences in LIBOR and the commercial paper rate, which have historically moved in tandem but, in times of unusual credit dislocations, have experienced periods of divergence. Accordingly no assurances can be given that actual results would not materially differ from the potential outcome simulated by this estimate.
ITEM 8. FINANCIAL STATEMENTS AND SUPPLEMENTARY DATA
Our financial statements are annexed to this Annual Report beginning on page F-1. In addition, the Financial Statements of Saratoga Investment Corp. CLO 2013-1, Ltd. are annexed to this Annual Report beginning on page S-1.
ITEM 9. CHANGES IN AND DISAGREEMENTS WITH ACCOUNTANTS ON ACCOUNTING AND FINANCIAL DISCLOSURE
None
71
ITEM 9A. CONTROLS AND PROCEDURES
Evaluation of disclosure controls and procedures
As of the end of the period covered by this report, we carried out an evaluation, under the supervision and with the participation of our management, including our Chief Executive Officer and our Chief Financial Officer, of the effectiveness of the design and operation of our disclosure controls and procedures (as defined in Rule 13a-15(e) and 15d-15(e) of the Securities Exchange Act of 1934). Based on that evaluation, our Chief Executive Officer and our Chief Financial Officer have concluded that our current disclosure controls and procedures are effective in facilitating timely decisions regarding required disclosure of any material information relating to us that is required to be disclosed by us in the reports we file or submit under the Securities Exchange Act of 1934.
Management's annual report on internal control over financial reporting
The Company's management is responsible for establishing and maintaining adequate internal control over financial reporting (as defined in Rules 13a-15(f) and 15d-15(f) of the Exchange Act). Under the supervision and with participation of our Chief Executive Officer and Chief Financial Officer, the Company conducted an evaluation of the effectiveness of internal control over financial reporting based on the criteria established in Internal Control - Integrated Framework (2013) issued by the Committee of Sponsoring Organizations of the Treadway Commission (COSO). Based on the Company's evaluation under the framework in Internal Control - Integrated Framework (2013), management concluded that the Company's internal control over financial reporting was effective as of February 28, 2015.
Changes in internal controls over financial reporting
There have been no changes in the Company's internal control over financial reporting (as defined in Rule 13a-15(f) of Exchange Act) that occurred during our most recently completed fiscal year that have materially affected, or are reasonably likely to materially affect, the Company's internal control over financial reporting.
ITEM 9B. OTHER INFORMATION
None.
72
PART III
ITEM 10. DIRECTORS, EXECUTIVE OFFICERS AND CORPORATE GOVERNANCE
Director and Executive Officer Information
Directors
The following table sets forth the names, ages and positions held by each of our directors, followed by a brief biography of each individual, including the business experience of each individual during the past five years and the specific qualifications that led to the conclusion that each individual should serve as a director.
Name | Age | Position | Director Since | Term Expires | ||||
| Interested Directors | ||||||||
| Christian L. Oberbeck | 55 | Chairman of the Board and Chief Executive Officer | 2010 | 2015 | ||||
| Michael J. Grisius | 51 | President and Director | 2011 | 2017 | ||||
| Independent Directors | ||||||||
| Steven M. Looney | 65 | Director | 2007 | 2016 | ||||
| Charles S. Whitman III | 73 | Director | 2007 | 2016 | ||||
| G. Cabell Williams | 61 | Director | 2007 | 2017 |
Christian L. Oberbeck -Mr. Oberbeck has over 27 years of experience in leveraged finance, from distressed debt to private equity, and has been involved in originating, structuring, negotiating, consummating, managing and monitoring investments in these businesses. Mr. Oberbeck is the Managing Partner of Saratoga Partners, a middle market private equity investment firm, and has served on its investment committee since 1995. Mr. Oberbeck is also the Managing Member of Saratoga Investment Advisors, LLC, the Company's investment adviser, and the Chief Executive Officer of the Company. Mr. Oberbeck also served as our President until February 2014.
Prior to assuming management responsibility for Saratoga Partners in 2008, Mr. Oberbeck has co-managed Saratoga Partners since 1995, when he joined Dillon Read and Saratoga Partners from Castle Harlan, Inc., a corporate buyout firm which he had joined at its founding in 1987 and was a Managing Director, leading successful investments in manufacturing and financial services companies. Prior to that, he worked in the Corporate Development Group of Arthur Young and in corporate finance at Blyth Eastman Paine Webber. Mr. Oberbeck has been a director of numerous middle market companies.
Mr. Oberbeck graduated from Brown University in 1982 with a BS in Physics and a BA in Mathematics. In 1985, he earned an MBA from Columbia University. Mr. Oberbeck's qualifications as a director include his extensive experience in the investment and finance industry, as well as his intimate knowledge of the Company's operations, gained through his service as an executive officer.
Michael J. Grisius -Mr. Grisius has over 24 years of experience in leveraged finance, investment management and financial services. He has originated, structured, negotiated, consummated, managed and monitored numerous successful investments in mezzanine debt, private equity, senior debt, structured products and commercial real estate debt. Mr. Grisius is Chief Investment Officer and a Managing Director of Saratoga Investment Advisors, LLC, the Company's investment adviser, and was appointed President of the Company in February 2013. Mr. Grisius joined Saratoga Investment Advisors, LLC in July 2011.
Prior to joining Saratoga Investment Advisors, Mr. Grisius served as Managing Director at Allied Capital Corporation, where he was an investment professional for 16 years. At Allied Capital Corporation, Mr. Grisius held several senior positions including co-head of Mezzanine Finance and member of its Management Committee and its Investment Committee. In 2008, Mr. Grisius was appointed co-chairman of the Allied Capital Corporation's Investment Committee. He also had responsibility for structuring and managing Unitranche Fund, LLC. During his tenure at Allied, Mr. Grisius built and led teams that made investments in subordinated debt, control equity and real estate mortgage debt. Mr. Grisius has served on the board of directors of numerous middle market companies. Prior to joining Allied Capital Corp., Mr. Grisius worked in leveraged finance at Chemical Bank from 1989 to 1992 and held senior accountant and consultant positions with KPMG LLP from 1985 to 1988.
Mr. Grisius graduated with a BS from Georgetown University in 1985 and earned an MBA from Cornell University's Johnson Graduate School of Management in 1990. Mr. Grisius' qualifications as a director include his broad experience in leverage finance, investment management, private equity and financial services.
73
Steven M. Looney -Mr. Looney is a Managing Director of Peale Davies & Co. Inc., a consulting firm with particular expertise in financial process and IT outsourcing, and is a CPA and an attorney. Mr. Looney also serves as a consultant and director to numerous companies in the healthcare, manufacturing and technology services industries, including WH Industries Inc. Between 2000 and 2005, he served as Senior Vice President and Chief Financial Officer of PCCI, Inc., a private IT staffing and outsourcing firm. Between 1992 and 2000, Mr. Looney worked at WH Industries as Chief Financial and Administrative Officer. Mr. Looney also serves as a director of Excellent Education for Everyone, a nonprofit organization. Mr. Looney graduated summa cum laude from the University of Washington with a B.A. degree in Accounting and received a J.D. from the University of Washington School of Law where he was a member of the law review. Mr. Looney's qualifications as director include his experience as a Managing Director of Peale Davies & Co. Inc. and as Chief Financial and Administrative Officer of WH Industries, as well as his financial, accounting and legal expertise.
Charles S. Whitman III -Mr. Whitman is senior counsel (retired) at Davis Polk & Wardwell LLP. Mr. Whitman was a partner in Davis Polk's Corporate Department for 28 years, representing clients in a broad range of corporate finance matters, including shelf registrations, securities compliance for financial institutions, foreign asset privatizations, and mergers and acquisitions. From 1971 to 1973, Mr. Whitman served as Executive Assistant to three successive Chairmen of the SEC. Mr. Whitman graduated from Harvard College and graduated magna cum laude from Harvard Law School with a LL.B. Mr. Whitman also received an LL.M. from Cambridge University in England. Mr. Whitman's qualifications as director include his 28 years of experience representing clients, including AT&T, Exxon Mobil, General Motors and BP, in securities matters as a partner in Davis Polk's corporate department.
G. Cabell Williams -Mr. Williams has served as the Managing General Partner of Williams and Gallagher, a private equity partnership located in Chevy Chase, Maryland since 2004. Mr Williams is also a Senior Manager, Director of Farragut Capital Partners which is a Chevy Chase, Maryland based Mezzanine Fund. Since 2011, Mr. Williams has also served as a partner of Farragut Capital Partners, an investment firm based in Fairfax, VA. In 2004, Mr. Williams concluded a 23 year career at Allied Capital Corporation, a business development company based in Washington, DC, which was acquired by Ares Capital Corporation in 2010. While at Allied, Mr. Williams held a variety of positions, including President, COO and finally Managing Director following Allied's merger with its affiliates in 1998. From 1991 to 2004, Mr. Williams either led or co-managed the firm's Private Equity Group. For the nine years prior to 1999, Mr. Williams led Allied's Mezzanine investment activities. For 15 years, Mr. Williams served on Allied's Investment Committee where he was responsible for reviewing and approving all of the firm's investments. Prior to 1991, Mr. Williams ran Allied's Minority Small Business Investment Company. He also founded Allied Capital Commercial Corporation, a real estate investment vehicle. Mr. Williams has served on the Board of various public and private companies. Mr. Williams attended The Landon School, and graduated from Mercersburg Academy and Rollins College, receiving a B.S. in Business Administration from the latter. Mr. Williams' qualifications as director include his 28 years of experience managing investment activities at Allied Capital, where he served in a variety of positions, including President, COO and Managing Director.
Executive Officer Who Is Not also a Director
The following table sets forth the name, age and position held by our executive officer who is not also a director, followed by a brief biography, including the business experience during the past five years.
Name | Age | Position | ||
| Executive Officer | ||||
| Henri J. Steenkamp | 39 | Chief Financial Officer, Chief Compliance Officer, Treasurer and Secretary |
Henri J. Steenkamp - Mr. Steenkamp, 39 years old, had served as the Chief Financial Officer of MF Global Holdings Ltd., a broker in commodities and derivatives, from April 2011. Prior to that, Mr. Steenkamp held the position of Chief Accounting Officer and Global Controller at MF Global for four years. He joined MF Global, then Man Financial, in 2006 as Vice President of External Reporting and Accounting Policy. After MF Global filed for bankruptcy protection in October 2011, he continued to serve as Chief Financial Officer through January 2013.
Before joining MF Global, Mr. Steenkamp spent eight years with PricewaterhouseCoopers ("PwC"), including four years in Transaction Services in its New York office, managing a variety of capital-raising transactions on a global basis. His focus was also on the SEC registration and public company filing process, including technical accounting. He spent four years with PwC in South Africa, where he served as an auditor primarily for SEC registrants and assisted South African companies as they went public in the U.S. Mr. Steenkamp is a chartered accountant and holds an honors degree in Finance.
74
Section 16(a) Beneficial Ownership Reporting Compliance
Section 16(a) of the Securities Exchange Act of 1934 requires our directors and executive officers, and persons who own 10.0% or more of our voting stock, to file reports of ownership and changes in ownership of our equity securities with the SEC. Directors, executive officers and 10.0% or more holders are required by SEC regulations to furnish us with copies of all Section 16(a) forms they file. Based solely on a review of the copies of those forms furnished to us, or written representations that no such forms were required, we believe that our directors, executive officers and 10.0% or more beneficial owners complied with all Section 16(a) filing requirements during the year ended February 28, 2015.
Code of Business Conduct and Ethics
We have adopted a Code of Business Conduct and Ethics that applies to which applies to, among others, our executive officers, including our principal executive officer and principal financial officer, as well as every officer, director and employee of the Company. Requests for copies should be sent in writing to Saratoga Investment Corp., 535 Madison Avenue, New York, New York 10022. The Company's Code of Business Conduct and Ethics is also available on our website at http://saratogainvestmentcorp.com .
If we make any substantive amendment to, or grant a waiver from, a provision of our Code of Business Conduct and Ethics, we will promptly disclose the nature of the amendment or waiver on our website at http://saratogainvestmentcorp.com .
Nomination of Directors
There have been no material changes to the procedures by which stockholders may recommend nominees to our Board of Directors implemented since the filing of our Proxy Statement for our 2014 Annual Meeting of Stockholders.
Audit Committee
The current members of the audit committee are Steven M. Looney (Chairman), Charles S. Whitman III and G. Cabell Williams. The Board has determined that Mr. Looney is an "audit committee financial expert" as defined under Item 407 of Regulation S-K of the Securities Exchange Act of 1934 and that each of Messrs. Whitman and Williams are "financially literate" as required by NYSE corporate governance standards. All of these members are independent directors.
ITEM 11. EXECUTIVE COMPENSATION
Executive Compensation
Currently, none of our executive officers are compensated by us. We currently have no employees, and each of our executive officers is also an employee of Saratoga Investment Advisors. Services necessary for our business are provided by individuals who are employees of Saratoga Investment Advisors, pursuant to the terms of the Management Agreement and an administration agreement.
Director Compensation
Our independent directors receive an annual fee of $40,000. They also receive $2,500 plus reimbursement of reasonable out-of-pocket expenses incurred in connection with attending each board meeting and receive $1,000 plus reimbursement of reasonable out-of-pocket expenses incurred in connection with attending each committee meeting. In addition, the chairman of the audit committee receives an annual fee of $5,000 and the chairman of each other committee receives an annual fee of $2,000 for their additional services in these capacities. In addition, we have purchased directors' and officers' liability insurance on behalf of our directors and officers. Independent directors have the option to receive their directors' fees in the form of our common stock issued at a price per share equal to the greater of net asset value or the market price at the time of payment. No compensation is paid to directors who are "interested persons."
75
The following table sets forth information concerning total compensation earned by or paid to each of our directors during the fiscal year ended February 28, 2015:
Name | Fees Earned or Paid in Cash | Total | ||||||
Interested Director | ||||||||
Christian L. Oberbeck(1) | - | - | ||||||
Michael J. Grisius(1) | - | - | ||||||
Independent Directors | ||||||||
Steven M. Looney | $ | 75,000 | $ | 75,000 | ||||
Charles S. Whitman III | $ | 72,000 | $ | 72,000 | ||||
G. Cabell Williams | $ | 72,000 | $ | 72,000 | ||||
| (1) | No compensation was paid to directors who are interested persons of us as defined in the 1940 Act. |
Compensation Committee Interlocks and Insider Participation
The current members of the compensation committee are G. Cabell Williams (Chairman), Steven M. Looney and Charles S. Whitman III. All of these members are independent directors. The compensation committee is responsible for overseeing the Company's compensation policies generally and making recommendations to the Board with respect to incentive compensation and equity-based plans of the Company that are subject to Board approval, evaluating executive officer performance and reviewing the Company's management succession plan, overseeing and setting compensation for the Company's directors and, as applicable, its executive officers and, as applicable, preparing the report on executive officer compensation that SEC rules require to be included in our annual report on Form 10-K. Currently, none of our executive officers are compensated by the Company and as such the compensation committee is not required to produce a report on executive officer compensation for inclusion in our annual report on Form 10-K.
During fiscal year 2015, none of the Company's executive officers served on the board of directors (or a compensation committee thereof or other board committee performing equivalent functions) of any entities that had one or more executive officers serve on the compensation committee or on the board of directors. No current or past executive officers or employees of the Company or its affiliates serve on the compensation committee.
ITEM 12. SECURITY OWNERSHIP OF CERTAIN BENEFICIAL OWNERS AND MANAGEMENT AND RELATED STOCKHOLDER MATTERS
The following table sets forth, as of May 20, 2015, the beneficial ownership of each current director, the nominees for director, the Company's executive officers, each person known to us to beneficially own 5.0% or more of the outstanding shares of our common stock, and the executive officers and directors as a group.
The percentage ownership is based on 5,428,758 shares of common stock outstanding as of May 20, 2015. Shares of common stock that are subject to warrants or other convertible securities currently exercisable or exercisable within 60 days thereof, are deemed outstanding for the purposes of computing the percentage ownership of the person holding these options or convertible securities, but are not deemed outstanding for computing the percentage ownership of any other person. Beneficial ownership is determined under the rules of the SEC and generally includes voting or investment power with respect to securities. To our knowledge, unless otherwise indicated in the footnotes to this table, the persons and entities named in the table have sole voting and sole investment power with respect to all shares beneficially owned. Unless otherwise indicated by footnote, the address for each listed individual is Saratoga Investment Corp., 535 Madison Avenue, New York, New York 10022.
Name of Beneficial Owners | Number of Shares of Common Stock Beneficially Owned | Percent of Class | ||||||
Interested Directors | ||||||||
Christian L. Oberbeck | 1,558,687 | (1) | 28.7 | % | ||||
Michael J. Grisius | 67,479 | 1.24 | % | |||||
Executive Officer | ||||||||
Henri J. Steenkamp | 1,438 | * | ||||||
Independent Directors | ||||||||
Steven M. Looney | 1,547 | * | ||||||
Charles S. Whitman III | 1,833 | * | ||||||
G. Cabell Williams | 31,876 | * | ||||||
|
| |||||||
All Directors and Executive Officers as a Group | 1,662,860 | 30.6 | % | |||||
Owners of 5% or more of our common stock | ||||||||
Black Diamond Capital Management, L.L.C.(2) | 512,273 | 9.43 | % | |||||
Elizabeth Oberbeck(3) | 744,183 | 13.7 | % | |||||
Thomas V. Inglesby(4) | 272,047 | 5.0 | % | |||||
| * | Less than 1.0% |
76
Mr. Oberbeck and Mr. Inglesby are affiliates who make up 33.7% of the ownership of SAR.
| (1) | Includes 468,973 shares of common stock directly held by Mr. Oberbeck, 166,727 shares of common stock held by Saratoga Investment Advisors, which Mr. Oberbeck controls, and 178,804 shares of common stock held by CLO Partners LLC, an entity wholly owned by Mr. Oberbeck and 744,183 shares of common stock directly held by Elizabeth Oberbeck. See footnote 3 below. |
| (2) | Based on information included in Amendment No. 3 to Schedule 13G filed by Black Diamond Capital Management, L.L.C. with the SEC on February 17, 2015. The address of Black Diamond Capital Management, L.L.C. is One Sound Shore Drive, Suite 200, Greenwich, CT 06830 |
| (3) | Based on information included in Amendment No. 3 to Schedule 13D filed jointly by Christian L. Oberbeck, Elizabeth Oberbeck, Saratoga Investment Advisors and CLO Partners LLC on November 4, 2014. Pursuant to an Agreement Relating to Shares of Common Stock of Saratoga Investment Corp. (the "Transfer Agreement"), Christian L. Oberbeck transferred 744,183 shares of common stock beneficially owned by him to Elizabeth Oberbeck. Elizabeth Oberbeck has full ownership rights with respect to the shares, including without limitation, the right to (A) receive any cash and/or stock dividends and distributions paid on or with respect to the shares and (B) sell the shares in accordance with the provisions of the Transfer Agreement and receive all proceeds therefrom. However, pursuant to the terms of the Transfer Agreement, Christian L. Oberbeck has retained the right to vote the shares, except that Elizabeth Oberbeck has retained the right to vote the shares on all matters submitted to shareholders with respect to any matter that could give rise to dissenters or other rights of an objecting shareholder under Maryland General Corporation Law. The Transfer Agreement also contains a right of first refusal that requires Elizabeth Oberbeck to offer Christian L. Oberbeck the opportunity to purchase any shares of Common Stock owned by her prior to her intended sale of the shares. Any such purchases may be made either directly by Mr. Oberbeck or through entities affiliated with him. |
ITEM 13. CERTAIN RELATIONSHIPS AND RELATED TRANSACTIONS, AND DIRECTOR INDEPENDENCE
Transactions with Related Persons
We have entered into an Management Agreement with Saratoga Investment Advisors, LLC. We have also entered into a license agreement with Saratoga Investment Advisors, LLC, pursuant to which Saratoga Investment Advisors has agreed to grant us a non-exclusive, royalty-free license to use the name "Saratoga." In addition, pursuant to the terms of the administration agreement, Saratoga Investment Advisors, LLC provides us with the office facilities and administrative services necessary to conduct our day-to-day operations. Mr. Oberbeck, our chief executive officer, is the primary investor in and controls Saratoga Investment Advisors, LLC.
Review, Approval or Ratification of Transactions with Related Persons
The Audit Committee of our Board is required to review and approve any transactions with related persons (as such term is defined in Item 404 of Regulation S-K).
Director Independence
In accordance with rules of the New York Stock Exchange (the "NYSE"), the Board annually determines the independence of each director. No director is considered independent unless the Board has determined that he or she has no material relationship with the Company. The Company monitors the status of its directors and officers through the activities of the Company's Nominating and Corporate Governance Committee and through a questionnaire to be completed by each director no less frequently than annually, with updates periodically if information provided in the most recent questionnaire has changed.
In order to evaluate the materiality of any such relationship, the Board uses the definition of director independence set forth in the NYSE Listed Company Manual. Section 303A.00 of the NYSE Listed Company Manual provides that business development companies, or BDCs, such as the Company, are required to comply with all of the provisions of Section 303A applicable to domestic issuers other than Sections 303A.02, the section that defines director independence.
Section 303A.00 provides that a director of a BDC shall be considered to be independent if he or she is not an "interested person" of the Company, as defined in Section 2(a)(19) of the 1940 Act. Section 2(a)(19) of the 1940 Act defines an "interested person" to include, among other things, any person who has, or within the last two years had, a material business or professional relationship with the Company.
77
The Board has determined that each of the directors is independent and has no relationship with the Company, except as a director and stockholder of the Company, with the exception of Messrs. Oberbeck and Grisius who are interested persons of the Company due to their positions as officers of the Company and its investment adviser.
ITEM 14. PRINCIPAL ACCOUNTANT FEES AND SERVICES
Independent Registered Public Accounting Firm
For the years ended February 28, 2015 and February 28, 2014, the Company incurred the following fees for services provided by Ernst & Young LLP, including expenses:
| Fiscal Year Ended February 28, 2015 | Fiscal Year Ended February 28, 2014 | |||||||
Audit Fees | $ | 513,710 | $ | 536,600 | ||||
Audit Related Fees | 26,000 | - | ||||||
Tax Fees | 37,000 | 40,000 | ||||||
All Other Fees | - | - | ||||||
|
|
|
| |||||
Total Fees | $ | 576,710 | $ | 576,600 | ||||
Audit Fees. Audit fees include fees for services that normally would be provided by the accountant in connection with statutory and regulatory filings or engagements and that generally only the independent accountant can provide. In addition to fees for the audit of our annual financial statements, the audit of the effectiveness of our internal control over financial reporting and the review of our quarterly financial statements in accordance with generally accepted auditing standards, this category contains fees for comfort letters, statutory audits, consents, and assistance with and review of documents filed with the SEC.
Audit Related Fees. Audit related fees are assurance related services that traditionally are performed by the independent accountant, such as attest services that are not required by statute or regulation.
Tax Fees. Tax fees include services in conjunction with preparation of the Company's tax return.
All Other Fees. Fees for other services would include fees for products and services other than the services reported above.
It is the policy of the audit committee to pre-approve all audit, review or attest engagements and permissible non-audit services to be performed by our independent registered public accounting firm.
78
PART IV
ITEM 15. EXHIBITS AND CONSOLIDATED FINANCIAL STATEMENT SCHEDULES
The following documents are filed or incorporated by reference as part of this Annual Report:
1. Consolidated Financial Statements
The following financial statements of the Company are filed herewith:
Report of Independent Registered Public Accounting Firm
Consolidated Statements of Assets and Liabilities as of February 28, 2015 and February 28, 2014
Consolidated Statements of Operations for the years ended February 28, 2015, February 28, 2014, and February 28, 2013
Consolidated Schedules of Investments as of February 28, 2015 and February 28, 2014
Consolidated Statements of Changes in Net Assets for the years ended February 28, 2015, February 28, 2014, and February 28, 2013
Consolidated Statements of Cash Flows for the years ended February 28, 2015, February 28, 2014, and February 28, 2013
Notes to Consolidated Financial Statements
2. Financial Statement Schedule
Reference is made to the Index to Other Financial Statements on page S-1.
Schedule 12-14-Investments in and advances to affiliates
3. Exhibits required to be filed by Item 601 of Regulation S-K
The following exhibits are filed as part of this report or hereby incorporated by reference to exhibits previously filed with the SEC:
79
EXHIBIT INDEX
Exhibit Number | Description | |
| 3.1(a) | Articles of Incorporation of Saratoga Investment Corp. (incorporated by reference to Saratoga Investment Corp.'s Form 10-Q for the quarterly period ended May 31, 2007, File No. 001-33376). | |
| 3.1(b) | Articles of Amendment of Saratoga Investment Corp. (incorporated by reference to Saratoga Investment Corp.'s Current Report on Form 8-K filed August 3, 2010). | |
| 3.1(c) | Articles of Amendment of Saratoga Investment Corp. (incorporated by reference to Saratoga Investment Corp.'s Current Report on Form 8-K filed August 13, 2010). | |
| 3.2 | Amended and Restated Bylaws of Saratoga Investment Corp. (incorporated by reference to Saratoga Investment Corp.'s Current Report on Form 8-K filed on March 5, 2008). | |
| 4.1 | Specimen certificate of Saratoga Investment Corp.'s common stock, par value $0.001 per share. (incorporated by reference to Saratoga Investment Corp.'s Registration Statement on Form N-2, File No. 333-169135, filed on September 1, 2010). | |
| 4.2 | Registration Rights Agreement dated July 30, 2010 between GSC Investment Corp., GSC CDO III L.L.C., and the investors party thereto (incorporated by reference to Saratoga Investment Corp.'s Current Report on Form 8-K filed on August 3, 2010). | |
| 4.3 | Form of Dividend Reinvestment Plan (incorporated by reference to Amendment No. 2 to the Saratoga Investment Corp.'s Registration Statement on Form N-2, File No. 333-138051, filed on January 12, 2007). | |
| 4.4 | Form of Indenture by and between the Company and U.S. Bank National Association, as trustee (incorporated by reference to Saratoga Investment Corp.'s Pre-Effective Amendment No. 1 to the Registration Statement on Form N-2, File No. 333-186323 filed April 30, 2013). | |
| 4.5 | Form of First Supplemental Indenture between the Company and U.S. Bank National Association (incorporated by reference to Saratoga Investment Corp.'s Pre-Effective Amendment No. 1 to the Registration Statement on Form N-2, File No. 333-186323 filed April 30, 2013). | |
| 4.6 | Form of Note (Filed as Exhibit A to First Supplemental Indenture referred to in Exhibit 4.5). | |
| 10.1 | Investment Advisory and Management Agreement dated July 30, 2010 between GSC Investment Corp. and Saratoga Investment Advisors, LLC (incorporated by reference to Saratoga Investment Corp.'s Current Report on Form 8-K filed on August 3, 2010). | |
| 10.2 | Custodian Agreement dated March 21, 2007 between GSC Investment LLC and U.S. Bank National Association (incorporated by reference to Saratoga Investment Corp.'s Form 10-Q for the quarterly period ended May 31, 2007). | |
| 10.3 | Administration Agreement dated July 30, 2010 between GSC Investment Corp. and Saratoga Investment Advisors, LLC (incorporated by reference to Saratoga Investment Corp.'s Current Report on Form 8-K filed on August 3, 2010). | |
| 10.4 | Trademark License Agreement dated July 30, 2010 between Saratoga Investment Advisors, LLC and GSC Investment Corp. (incorporated by reference to Saratoga Investment Corp.'s Current Report on Form 8-K filed on August 3, 2010). | |
| 10.5 | Credit, Security and Management Agreement dated July 30, 2010 by and among GSC Investment Funding LLC, Saratoga Investment Corp., Saratoga Investment Advisors, LLC, Madison Capital Funding LLC and U.S. Bank National Association (incorporated by reference to Saratoga Investment Corp.'s Current Report on Form 8-K filed on August 3, 2010). | |
| 10.6 | Form of Indemnification Agreement between Saratoga Investment Corp. and each officer and director of Saratoga Investment Corp. (incorporated by reference to Amendment No. 2 to Saratoga Investment Corp.'s Registration Statement on Form N-2 filed on January 12, 2007). | |
80
Exhibit Number | Description | |
| 10.7 | Amendment No. 1 to Credit, Security and Management Agreement dated February 24, 2012 by and among Saratoga Investment Funding LLC, Saratoga Investment Corp., Saratoga Investment Advisors, LLC, Madison Capital Funding LLC and U.S. Bank National Association (incorporated by reference to Saratoga Investment Corp.'s Current Report on Form 8-K filed on February 29, 2012). | |
| 10.8 | Indenture, dated as of January 22, 2008, among GSC Investment Corp. CLO 2007, Ltd., GSC Investment Corp. CLO 2007, Inc. and U.S. Bank National Association (incorporated by reference to the registrant's Registration Statement on Form N-2, File No. 333-186323, filed on April 30, 2013). | |
| 10.9 | Indenture, dated as of October 17, 2013, among Saratoga Investment Corp. CLO 2013-1, Ltd., Saratoga Investment Corp. CLO 2013-1, Inc. and U.S. Bank National Association (incorporated by reference to the registrant's Registration Statement on Form N-2, File No. 333-196526, filed on December 5, 2014). | |
| 10.10 | Amended and Restated Collateral Management Agreement, dated October 17, 2013, by and between Saratoga Investment Corp. and Saratoga Investment Corp. CLO 2013-1, Ltd. (incorporated by reference to the registrant's Registration Statement on Form N-2, File No. 333-196526, filed on December 5, 2014). | |
| 10.11 | Investment Advisory and Management Agreement dated July 30, 2010 between Saratoga Investment Corp. and Saratoga Investment Advisors, LLC (incorporated by reference to the registrant's Registration Statement on Form N-2, File No. 333-196526, filed on December 5, 2014). | |
| 10.12 | Amendment No. 2 to Credit, Security and Management Agreement dated September 17, 2014 by and among Saratoga Investment Funding LLC, Saratoga Investment Corp., Saratoga Investment Advisors, LLC, Madison Capital Funding LLC and U.S. Bank National Association (incorporated by reference to Saratoga Investment Corp.'s Current Report on Form 8-K filed on September 18, 2014). | |
| 11 | Computation of Per Share Earnings (included in Note 11 to the financial statements contained in this report). | |
| 12.1 | Statement of Computation of Ratios of Earnings to Fixed Charges (incorporated by reference to the registrant's Registration Statement on Form N-2, File No. 333-196526, filed on December 5, 2014). | |
| 21.1 | List of Subsidiaries and jurisdiction of incorporation/organization: Saratoga Investment Funding LLC-Delaware; Saratoga Investment Corp. SBIC, LP-Delaware; and Saratoga Investment Corp. GP, LLC-Delaware. | |
| 31.1* | Chief Executive Officer Certification Pursuant to Rule 13a-14 of the Securities Exchange Act of 1934, as adopted pursuant to Section 302 of the Sarbanes-Oxley Act of 2002. | |
| 31.2* | Chief Financial Officer Certification Pursuant to Rule 13a-14 of the Securities Act of 1934, as adopted pursuant to Section 302 of the Sarbanes-Oxley Act of 2002. | |
| 32.1* | Certification pursuant to 18 U.S.C. Section 1350, as adopted pursuant to Section 906 of the Sarbanes-Oxley Act of 2002. | |
| * | Filed herewith |
81
SIGNATURES
Pursuant to the requirements of Section 13 or 15(d) of the Securities Exchange Act of 1934, the registrant has duly caused this report to be signed on its behalf by the undersigned, thereunto duly authorized.
| SARATOGA INVESTMENT CORP. | ||||||
| Date: May 20, 2015 | By: | /s/ CHRISTIAN L. OBERBECK | ||||
| Christian L. Oberbeck | ||||||
| Chief Executive Officer | ||||||
| By: | /s/ HENRI J. STEENKAMP | |||||
| Henri J. Steenkamp | ||||||
| Chief Financial Officer and Chief Compliance Officer | ||||||
KNOW ALL PERSONS BY THESE PRESENT, that each person whose signature appears below hereby constitutes and appoints Christian L. Oberbeck and Henri J. Steenkamp, and each of them (with full power to each of them to act alone), his true and lawful attorneys-in-fact and agents, with full power of substitution and resubstitution, for him and in his name, place, and stead, in any and all capacities, to sign this report and any and all amendments thereto, and to file the same, with the Securities and Exchange Commission, granting unto said attorneys-in-fact and agents full power and authority to do and perform each and every act and thing requisite and necessary to be done in and about the premises, as fully to all intents and purposes as he might or could do in person, hereby ratifying and confirming all that said attorneys-in-fact and agents, or their substitute or substitutes, may lawfully do or cause to be done by virtue hereof.
Pursuant to the requirements of the Securities Exchange Act of 1934, this report has been signed below by the following persons on behalf of the registrant and in the capacities and on the dates indicated.
Signature | Title | Date | ||
/s/ CHRISTIAN L. OBERBECK Christian L. Oberbeck | Chairman of the Board of Directors, Chief Executive Officer (Principal Executive Officer) | May 20, 2015 | ||
/s/ MICHAEL J. GRISIUS Michael J. Grisius | Member of the Board of Directors | May 20, 2015 | ||
/s/ HENRI J. STEENKAMP Henri J. Steenkamp | Chief Financial Officer (Principal Accounting Officer and Principal Financial Officer) | May 20, 2015 | ||
/s/ STEVEN M. LOONEY Steven M. Looney | Member of the Board of Directors | May 20, 2015 | ||
/s/ CHARLES S. WHITMAN III Charles S. Whitman III | Member of the Board of Directors | May 20, 2015 | ||
/s/ G. CABELL WILLIAMS Cabell Williams | Member of the Board of Directors | May 20, 2015 | ||
82
INDEX TO CONSOLIDATED FINANCIAL STATEMENTS
Report of Independent Registered Public Accounting Firm | F-2 | |||
Consolidated Statements of Assets and Liabilities as of February 28, 2015 and February 28, 2014 | F-3 | |||
Consolidated Statements of Operations for the years ended February 28, 2015, February 28, 2014, and February 28, 2013 | F-4 | |||
Consolidated Schedules of Investments as of February 28, 2015 and February 28, 2014 | F-5 | |||
Consolidated Statements of Changes in Net Assets for the years ended February 28, 2015, February 28, 2014, and February 28, 2013 | F-7 | |||
Consolidated Statements of Cash Flows for the years ended February 28, 2015, February 28, 2014, and February 28, 2013 | F-8 | |||
Notes to Consolidated Financial Statements | F-9 |
F-1
Report of Independent Registered Public Accounting Firm
The Board of Directors and Stockholders of Saratoga Investment Corp.
We have audited the accompanying consolidated statement of assets and liabilities of Saratoga Investment Corp. (the "Company") as of February 28, 2015 and February 28, 2014, including the consolidated schedule of investments, and the related consolidated statements of operations, cash flows and changes in net assets for the years ended February 28, 2015, February 28, 2014 and February 28, 2013. These financial statements are the responsibility of the Company's management. Our responsibility is to express an opinion on these financial statements based on our audits.
We conducted our audits in accordance with the standards of the Public Company Accounting Oversight Board (United States). Those standards require that we plan and perform the audit to obtain reasonable assurance about whether the financial statements are free of material misstatement. We were not engaged to perform an audit of the entity's internal control over financial reporting. Our audits included consideration of internal control over financial reporting as a basis for designing audit procedures that are appropriate in the circumstances, but not for the purpose of expressing an opinion on the effectiveness of the entity's internal control over financial reporting. Accordingly, we express no such opinion. An audit also includes examining, on a test basis, evidence supporting the amounts and disclosures in the financial statements, assessing the accounting principles used and significant estimates made by management, and evaluating the overall financial statement presentation. Our procedures included confirmation of securities owned as of February 28, 2015, by correspondence with the custodian, debt agents and lenders. We believe that our audits provide a reasonable basis for our opinion.
In our opinion, the financial statements referred to above present fairly, in all material respects, the consolidated financial position of Saratoga Investment Corp. at February 28, 2015 and February 28, 2014, and the consolidated results of its operations, changes in its net assets and its cash flows for the years ended February 28, 2015, February 28, 2014 and February 28, 2013, in conformity with U.S. generally accepted accounting principles.
/s/ Ernst & Young
May 20, 2015
F-2
Saratoga Investment Corp.
Consolidated Statements of Assets and Liabilities
| As of | ||||||||
| February 28, 2015 | February 28, 2014 | |||||||
ASSETS | ||||||||
Investments at fair value | ||||||||
Non-control/non-affiliate investments (amortized cost of $222,505,383 and $185,266,607, respectively) | $ | 223,506,589 | $ | 186,275,106 | ||||
Control investments (cost of $15,953,001 and $16,555,808, respectively) | 17,031,146 | 19,569,596 | ||||||
|
|
|
| |||||
Total investments at fair value (amortized cost of $238,458,384 and $201,822,415, respectively) | 240,537,735 | 205,844,702 | ||||||
Cash and cash equivalents | 1,888,158 | 3,293,898 | ||||||
Cash and cash equivalents, reserve accounts | 18,175,214 | 3,293,113 | ||||||
Interest receivable, (net of reserve of $309,498 and $150,058, respectively) | 2,469,398 | 2,571,853 | ||||||
Management fee receivable | 171,913 | 150,106 | ||||||
Other assets | 317,637 | 14,461 | ||||||
|
|
|
| |||||
Total assets | $ | 263,560,055 | $ | 215,168,133 | ||||
|
|
|
| |||||
LIABILITIES | ||||||||
Revolving credit facility | $ | 9,600,000 | $ | - | ||||
Deferred debt financing costs, revolving credit facility | (594,845 | ) | (396,898 | ) | ||||
SBA debentures payable | 79,000,000 | 50,000,000 | ||||||
Deferred debt financing costs, SBA debentures payable | (2,340,894 | ) | (1,412,829 | ) | ||||
Notes payable | 48,300,000 | 48,300,000 | ||||||
Deferred debt financing costs, notes payable | (1,847,564 | ) | (2,198,977 | ) | ||||
Dividend payable | 402,200 | - | ||||||
Base management and incentive fees payable | 5,835,941 | 5,353,051 | ||||||
Accounts payable and accrued expenses | 835,189 | 824,568 | ||||||
Interest and debt fees payable | 1,405,466 | 873,135 | ||||||
Due to manager | 365,820 | 398,154 | ||||||
|
|
|
| |||||
Total liabilities | $ | 140,961,313 | $ | 101,740,204 | ||||
|
|
|
| |||||
Commitments and contingencies (See Note 8) | ||||||||
NET ASSETS | ||||||||
Common stock, par value $.001, 100,000,000 common shares authorized, 5,401,899 and 5,379,616 common shares issued and outstanding, respectively | $ | 5,402 | $ | 5,380 | ||||
Capital in excess of par value | 184,877,680 | 184,851,154 | ||||||
Distribution in excess of net investment income | (23,905,603 | ) | (31,123,667 | ) | ||||
Accumulated net realized loss from investments and derivatives | (40,458,088 | ) | (44,327,225 | ) | ||||
Accumulated net unrealized appreciation on investments and derivatives | 2,079,351 | 4,022,287 | ||||||
|
|
|
| |||||
Total net assets | 122,598,742 | 113,427,929 | ||||||
|
|
|
| |||||
Total liabilities and net assets | $ | 263,560,055 | $ | 215,168,133 | ||||
|
|
|
| |||||
NET ASSET VALUE PER SHARE | $ | 22.70 | $ | 21.08 | ||||
|
|
|
| |||||
See accompanying notes to consolidated financial statements.
F-3
Saratoga Investment Corp.
Consolidated Statements of Operations
| For the year ended February 28, 2015 | For the year ended February 28, 2014 | For the year ended February 28, 2013 | ||||||||||
INVESTMENT INCOME | ||||||||||||
Interest from investments | ||||||||||||
Non-control/Non-affiliate investments | $ | 20,790,324 | $ | 15,832,083 | $ | 9,176,156 | ||||||
Payment-in-kind interest income from Non-control/Non-affiliate investments | 1,186,657 | 936,208 | 1,062,687 | |||||||||
Control investments | 2,707,230 | 3,410,868 | 4,205,509 | |||||||||
|
|
|
|
|
| |||||||
Total interest income | 24,684,211 | 20,179,159 | 14,444,352 | |||||||||
Interest from cash and cash equivalents | 3,801 | 7,932 | 5,956 | |||||||||
Management fee income | 1,520,205 | 1,775,141 | 2,000,072 | |||||||||
Other income | 1,167,144 | 931,513 | 556,427 | |||||||||
|
|
|
|
|
| |||||||
Total investment income | 27,375,361 | 22,893,745 | 17,006,807 | |||||||||
|
|
|
|
|
| |||||||
EXPENSES | ||||||||||||
Interest and debt financing expenses | 7,375,022 | 6,083,891 | 2,540,413 | |||||||||
Base management fees | 4,156,955 | 3,326,879 | 2,107,378 | |||||||||
Professional fees | 1,301,713 | 1,211,836 | 1,190,587 | |||||||||
Administrator expenses | 1,000,000 | 1,000,000 | 1,000,000 | |||||||||
Incentive management fees | 2,547,773 | 938,694 | 2,602,647 | |||||||||
Insurance | 337,335 | 442,977 | 516,121 | |||||||||
Directors fees and expenses | 210,761 | 204,607 | 206,705 | |||||||||
General & administrative | 478,299 | 789,208 | 368,815 | |||||||||
Excise tax expense | 293,653 | - | - | |||||||||
Other expense | - | 21,207 | 4,434 | |||||||||
|
|
|
|
|
| |||||||
Total expenses | 17,701,511 | 14,019,299 | 10,537,100 | |||||||||
|
|
|
|
|
| |||||||
NET INVESTMENT INCOME | 9,673,850 | 8,874,446 | 6,469,707 | |||||||||
|
|
|
|
|
| |||||||
REALIZED AND UNREALIZED GAIN/(LOSS) ON INVESTMENTS: | ||||||||||||
Net realized gain from investments | 3,276,450 | 1,270,765 | 561,700 | |||||||||
Net realized loss from derivatives | - | - | (131,000 | ) | ||||||||
Net unrealized appreciation/(depreciation) on investments | (1,942,936 | ) | (1,648,046 | ) | 7,012,726 | |||||||
Net unrealized appreciation on derivatives | - | - | 130,925 | |||||||||
|
|
|
|
|
| |||||||
Net gain/(loss) on investments | 1,333,514 | (377,281 | ) | 7,574,351 | ||||||||
|
|
|
|
|
| |||||||
NET INCREASE IN NET ASSETS RESULTING FROM OPERATIONS | $ | 11,007,364 | $ | 8,497,165 | $ | 14,044,058 | ||||||
|
|
|
|
|
| |||||||
WEIGHTED AVERAGE-BASIC AND DILUTED EARNINGS PER COMMON SHARE | $ | 2.04 | $ | 1.73 | $ | 3.42 | ||||||
WEIGHTED AVERAGE COMMON STOCK OUTSTANDING-BASIC AND DILUTED | 5,385,049 | 4,920,517 | 4,110,484 | |||||||||
See accompanying notes to consolidated financial statements.
F-4
Saratoga Investment Corp.
Consolidated Schedule of Investments
February 28, 2015
Company | Industry | Investment Interest Rate | Principal/ Number of Shares | Cost | Fair Value (c) | % of Net Assets | ||||||||||||||
Non-control/Non-affiliated investments-182.3% (b) | ||||||||||||||||||||
National Truck Protection Co., Inc. (d), (g) | Automotive Aftermarket | Common Stock | 1,116 | $ | 1,000,000 | $ | 1,769,432 | 1.4 | % | |||||||||||
National Truck Protection Co., Inc. (d) | Automotive Aftermarket | First Lien Term Loan 15.50% Cash, 9/13/2018 | $ | 7,737,848 | 7,737,848 | 7,737,848 | 6.3 | % | ||||||||||||
Take 5 Oil Change, L.L.C. (d), (g) | Automotive Aftermarket | Common Stock | 7,128 | 480,535 | 1,472,502 | 1.2 | % | |||||||||||||
|
|
|
|
|
| |||||||||||||||
| Total Automotive Aftermarket | 9,218,383 | 10,979,782 | 8.9 | % | ||||||||||||||||
|
|
|
|
|
| |||||||||||||||
Legacy Cabinets Holdings (d), (g) | Building Products | Common Stock Voting A-1 | 2,535 | 220,900 | 1,493,470 | 1.2 | % | |||||||||||||
Legacy Cabinets Holdings (d), (g) | Building Products | Common Stock Voting B-1 | 1,600 | 139,424 | 942,624 | 0.8 | % | |||||||||||||
Polar Holding Company, Ltd. (a), (i) | Building Products | First Lien Term Loan 10.00% Cash, 8/13/2016 | $ | 1,000,000 | 1,000,000 | 1,000,000 | 0.8 | % | ||||||||||||
|
|
|
|
|
| |||||||||||||||
| Total Building Products | 1,360,324 | 3,436,094 | 2.8 | % | ||||||||||||||||
|
|
|
|
|
| |||||||||||||||
BMC Software, Inc. (d) | Business Services | First Lien Term Loan 5.00% Cash, 9/10/2020 | $ | 5,731,667 | 5,686,622 | 5,478,327 | 4.4 | % | ||||||||||||
Dispensing Dynamics International (d) | Business Services | Senior Secured Note 12.50% Cash, 1/1/2018 | $ | 7,000,000 | 6,910,112 | 7,350,000 | 6.0 | % | ||||||||||||
Easy Ice, LLC (d) | Business Services | First Lien Term Loan 9.50% Cash, 1/15/2020 | $ | 12,000,000 | 11,872,639 | 12,000,000 | 9.7 | % | ||||||||||||
Easy Ice, LLC (m) | Business Services | Delayed Draw Term Loan 9.50% Cash, 1/15/2020 | $ | - | - | - | 0.0 | % | ||||||||||||
Emily Street Enterprises, L.L.C. | Business Services | Senior Secured Note 10.00% Cash, 1/23/2020 | $ | 8,400,000 | 8,260,787 | 8,400,000 | 6.9 | % | ||||||||||||
Emily Street Enterprises, L.L.C. (g) | Business Services | Warrant Membership Interests | 49,318 | 400,000 | 391,584 | 0.3 | % | |||||||||||||
Help/Systems Holdings, Inc.(Help/Systems, LLC) (d) | Business Services | First Lien Term Loan 5.50% Cash, 6/28/2019 | $ | 1,955,051 | 1,941,417 | 1,925,725 | 1.6 | % | ||||||||||||
Help/Systems Holdings, Inc.(Help/Systems, LLC) (d) | Business Services | Second Lien Term Loan 9.50% Cash, 6/28/2020 | $ | 2,000,000 | 1,975,767 | 1,965,000 | 1.6 | % | ||||||||||||
Knowland Technology Holdings, L.L.C. | Business Services | First Lien Term Loan 11.00% Cash, 11/29/2017 | $ | 5,259,171 | 5,205,142 | 5,259,171 | 4.3 | % | ||||||||||||
Knowland Technology Holdings, L.L.C. (j), (k), (l) | Business Services | Delayed Draw Term Loan 11.00% Cash, 11/29/2017 | $ | - | - | - | 0.0 | % | ||||||||||||
Vector Controls Holding Co., LLC (d) | Business Services | First Lien Term Loan, 14.00% (12.00% Cash/2.00% PIK), 3/6/2018 | $ | 9,436,991 | 9,312,095 | 9,295,437 | 7.6 | % | ||||||||||||
Vector Controls Holding Co., LLC (d), (g) | Business Services | Warrants to Purchase Limited Liability Company Interests | 101 | - | 62,341 | 0.1 | % | |||||||||||||
|
|
|
|
|
| |||||||||||||||
| Total Business Services | 51,564,581 | 52,127,585 | 42.5 | % | ||||||||||||||||
|
|
|
|
|
| |||||||||||||||
Targus Group International, Inc. (d) | Consumer Products | First Lien Term Loan, 12.00% (11.00% Cash/1.00 PIK), 5/24/2016 | $ | 3,569,127 | 3,537,732 | 3,283,597 | 2.7 | % | ||||||||||||
Targus Holdings, Inc. (d), (g) | Consumer Products | Common Stock | 62,413 | 566,765 | - | 0.0 | % | |||||||||||||
Targus Holdings, Inc. (d), (g) | Consumer Products | Unsecured Note 10.00% PIK, 6/14/2019 | $ | 2,054,158 | 2,054,158 | - | 0.0 | % | ||||||||||||
Targus Holdings, Inc. (d), (g) | Consumer Products | Unsecured Note 16.00% PIK, 10/26/2018 | $ | 429,797 | 425,227 | - | 0.0 | % | ||||||||||||
|
|
|
|
|
| |||||||||||||||
| Total Consumer Products | 6,583,882 | 3,283,597 | 2.7 | % | ||||||||||||||||
|
|
|
|
|
| |||||||||||||||
Avionte Holdings, LLC (g) | Consumer Services | Common Stock | 100,000 | 100,000 | 163,000 | 0.1 | % | |||||||||||||
Avionte Holdings, LLC | Consumer Services | First Lien Term Loan 9.75% Cash, 1/8/2019 | $ | 3,000,000 | 2,951,759 | 3,000,000 | 2.4 | % | ||||||||||||
Avionte Holdings, LLC (j), (l) | Consumer Services | Delayed Draw Term Loan A 9.75% Cash, 1/8/2019 | $ | - | - | - | 0.0 | % | ||||||||||||
CFF Acquisition L.L.C. (d) | Consumer Services | First Lien Term Loan 7.50% Cash, 7/31/2015 | $ | 716,179 | 714,270 | 716,179 | 0.6 | % | ||||||||||||
Expedited Travel L.L.C. (g) | Consumer Services | Common Stock | 1,000,000 | 1,000,000 | 1,069,157 | 0.9 | % | |||||||||||||
Expedited Travel L.L.C. | Consumer Services | First Lien Term Loan 10.00% Cash, 10/10/2019 | $ | 13,750,000 | 13,609,579 | 13,750,000 | 11.2 | % | ||||||||||||
PrePaid Legal Services, Inc. (d) | Consumer Services | First Lien Term Loan 6.25% Cash, 7/1/2019 | $ | 3,709,677 | 3,680,863 | 3,652,919 | 3.0 | % | ||||||||||||
PrePaid Legal Services, Inc. (d) | Consumer Services | Second Lien Term Loan 9.75% Cash, 7/1/2020 | $ | 5,000,000 | 4,937,212 | 4,981,000 | 4.1 | % | ||||||||||||
|
|
|
|
|
| |||||||||||||||
| Total Consumer Services | 26,993,683 | 27,332,255 | 22.3 | % | ||||||||||||||||
|
|
|
|
|
| |||||||||||||||
M/C Acquisition Corp., L.L.C. (d), (g) | Education | Class A Common Stock | 544,761 | 30,241 | - | 0.0 | % | |||||||||||||
M/C Acquisition Corp., L.L.C. (d) | Education | First Lien Term Loan 1.00% Cash, 3/31/2015 | $ | 2,362,978 | 1,235,695 | 100,951 | 0.1 | % | ||||||||||||
|
|
|
|
|
| |||||||||||||||
| Total Education | 1,265,936 | 100,951 | 0.1 | % | ||||||||||||||||
|
|
|
|
|
| |||||||||||||||
Group Dekko, Inc. (d) | Electronics | Second Lien Term Loan 11.00% (10.00% Cash/1.00% PIK), 5/1/2016 | $ | 6,950,048 | 6,950,048 | 6,667,181 | 5.4 | % | ||||||||||||
|
|
|
|
|
| |||||||||||||||
| Total Electronics | 6,950,048 | 6,667,181 | 5.4 | % | ||||||||||||||||
|
|
|
|
|
| |||||||||||||||
TB Corp. (d) | Food and Beverage | First Lien Term Loan 5.76% Cash, 6/19/2018 | $ | 5,050,436 | 5,038,131 | 5,037,810 | 4.0 | % | ||||||||||||
TB Corp. (d) | Food and Beverage | Unsecured Note 13.50% (12.00% Cash/1.50% PIK), 12/20/2018 | $ | 2,546,121 | 2,512,732 | 2,546,121 | 2.1 | % | ||||||||||||
TM Restaurant Group L.L.C. | Food and Beverage | First Lien Term Loan 7.75% Cash, 7/16/2017 | $ | 2,791,595 | 2,791,595 | 2,763,679 | 2.3 | % | ||||||||||||
|
|
|
|
|
| |||||||||||||||
| Total Food and Beverage | 10,342,458 | 10,347,610 | 8.4 | % | ||||||||||||||||
|
|
|
|
|
| |||||||||||||||
Bristol Hospice, LLC | Healthcare Services | Senior Secured Note 11.00% (10.00% Cash/1.00% PIK), 11/29/2018 | $ | 5,459,134 | 5,374,249 | 5,459,134 | 4.5 | % | ||||||||||||
Bristol Hospice, LLC (j), (l) | Healthcare Services | Delayed Draw Term Loan 11.00% (10.00% Cash/1.00% PIK), 11/29/2018 | $ | - | - | - | 0.0 | % | ||||||||||||
Roscoe Medical, Inc. (d), (g) | Healthcare Services | Common Stock | 5,000 | 500,000 | 294,500 | 0.1 | % | |||||||||||||
Roscoe Medical, Inc. | Healthcare Services | Second Lien Term Loan 11.25% Cash, 9/26/2019 | $ | 4,200,000 | 4,129,704 | 3,990,000 | 3.3 | % | ||||||||||||
Smile Brands Group Inc. (d) | Healthcare Services | First Lien Term Loan 7.50% Cash, 8/16/2019 | $ | 4,443,750 | 4,373,369 | 4,159,350 | 3.4 | % | ||||||||||||
Surgical Specialties Corporation (US), Inc. (d) | Healthcare Services | First Lien Term Loan 7.25% Cash, 8/22/2018 | $ | 2,312,500 | 2,295,234 | 2,277,813 | 1.9 | % | ||||||||||||
Zest Holdings, LLC (d) | Healthcare Services | First Lien Term Loan 5.25% Cash, 8/16/2020 | $ | 4,443,919 | 4,361,438 | 4,460,806 | 3.6 | % | ||||||||||||
|
|
|
|
|
| |||||||||||||||
| Total Healthcare Services | 21,033,994 | 20,641,603 | 16.8 | % | ||||||||||||||||
|
|
|
|
|
| |||||||||||||||
HMN Holdco, LLC | Media | First Lien Term Loan 14.00% (12.00% Cash/2.00% PIK), 5/16/2019 | $ | 9,368,327 | 9,206,438 | 9,579,115 | 7.9 | % | ||||||||||||
HMN Holdco, LLC | Media | First Lien Term Loan 12.00% Cash, 5/16/2020 | 1,600,000 | 1,569,149 | 1,576,000 | 1.3 | % | |||||||||||||
HMN Holdco, LLC (j), (k) | Media | Deferred Draw Term Loan 12.00% Cash, 5/16/2020 | - | - | (36,000 | ) | 0.0 | % | ||||||||||||
HMN Holdco, LLC | Media | Class A Series | 4,264 | 61,647 | 223,604 | 0.2 | % | |||||||||||||
HMN Holdco, LLC | Media | Class A Warrant | 30,320 | 438,353 | 1,247,365 | 1.0 | % | |||||||||||||
HMN Holdco, LLC (g) | Media | Warrants to Purchase Limited Liability Company Interests (Common) | 57,872 | - | 2,085,128 | 1.7 | % | |||||||||||||
HMN Holdco, LLC (g) | Media | Warrants to Purchase Limited Liability Company Interests | 8,139 | - | 350,464 | 0.3 | % | |||||||||||||
|
|
|
|
|
| |||||||||||||||
| Total Media | 11,275,587 | 15,025,676 | 12.4 | % | ||||||||||||||||
|
|
|
|
|
| |||||||||||||||
Elyria Foundry Company, L.L.C. | Metals | Common Stock | 35,000 | 9,217,563 | 6,762,000 | 5.5 | % | |||||||||||||
Elyria Foundry Company, L.L.C. | Metals | Revolver 9.00% Cash, 12/31/2020 | $ | 8,500,000 | 8,500,000 | 8,500,000 | 6.8 | % | ||||||||||||
|
|
|
|
|
| |||||||||||||||
| Total Metals | 17,717,563 | 15,262,000 | 12.3 | % | ||||||||||||||||
|
|
|
|
|
| |||||||||||||||
Network Communications, Inc. (d), (g) | Publishing | Common Stock | 380,572 | - | 300,652 | 0.2 | % | |||||||||||||
Network Communications, Inc. (d) | Publishing | Unsecured Notes 8.60% PIK, 1/14/2020 | $ | 2,732,976 | 2,374,260 | 1,684,118 | 1.4 | % | ||||||||||||
|
|
|
|
|
| |||||||||||||||
| Total Publishing | 2,374,260 | 1,984,770 | 1.6 | % | ||||||||||||||||
|
|
|
|
|
| |||||||||||||||
Censis Technologies, Inc. | Software | First Lien Term Loan B 11.00% Cash, 7/24/2019 | $ | 11,850,000 | 11,634,939 | 11,850,000 | 9.7 | % | ||||||||||||
Censis Technologies, Inc. (g), (h) | Software | Limited Partner Interests | 999 | 999,000 | 981,627 | 0.8 | % | |||||||||||||
Community Investors, Inc. (g) | Software | Common Stock | 1,282 | 1,282 | 1,769 | 0.0 | % | |||||||||||||
Community Investors, Inc. | Software | First Lien, Last Out Term Loan 11.78% Cash, 9/30/2019 | $ | 12,000,000 | 12,000,000 | 12,000,000 | 9.7 | % | ||||||||||||
Community Investors, Inc. | Software | First Lien Term Loan B 12.25% Cash, 12/31/2020 | $ | 2,500,000 | 2,500,000 | 2,500,000 | 2.0 | % | ||||||||||||
Community Investors, Inc. (g) | Software | Preferred Stock | 63,463 | 149,138 | 87,579 | 0.1 | % | |||||||||||||
Community Investors, Inc. | Software | Preferred Stock-A2 | 38,641 | 100,853 | 53,325 | 0.0 | % | |||||||||||||
Community Investors, Inc. (g) | Software | Preferred Stock-A Shares | 135,584 | 135,584 | 187,106 | 0.2 | % | |||||||||||||
Finalsite Holdings, Inc. | Software | Second Lien Term Loan 10.25% Cash, 5/21/2020 | $ | 7,500,000 | 7,429,305 | 7,500,000 | 6.1 | % | ||||||||||||
Identity Automation Systems (g) | Software | Common Stock Class A Units | 232,616 | 232,616 | 225,638 | 0.2 | % | |||||||||||||
Identity Automation Systems | Software | First Lien Term Loan 10.25% Cash, 8/25/2019 | $ | 4,475,000 | 4,433,897 | 4,475,000 | 3.7 | % | ||||||||||||
Pen-Link, Ltd. (d) | Software | Second Lien Term Loan 12.50% Cash, 5/26/2019 | $ | 10,500,000 | 10,326,376 | 10,500,000 | 8.6 | % | ||||||||||||
|
|
|
|
|
| |||||||||||||||
| Total Software | 49,942,990 | 50,362,044 | 41.1 | % | ||||||||||||||||
|
|
|
|
|
| |||||||||||||||
Advanced Air & Heat of Florida, LLC | Utilities | First Lien Term Loan 10.00% Cash, 1/31/2019 | $ | 5,955,441 | 5,881,694 | 5,955,441 | 5.0 | % | ||||||||||||
|
|
|
|
|
| |||||||||||||||
| Total Utilities | 5,881,694 | 5,955,441 | 5.0 | % | ||||||||||||||||
|
|
|
|
|
| |||||||||||||||
Sub Total Non-control/Non-affiliated investments | 222,505,383 | 223,506,589 | 182.3 | % | ||||||||||||||||
|
|
|
|
|
| |||||||||||||||
Control investments-13.9% (b) | ||||||||||||||||||||
Saratoga Investment Corp. CLO 2013-1, Ltd. (a), (d), (e), (f) | Structured Finance Securities | Other/Structured Finance Securities 14.32%, 10/17/2023 | $ | 30,000,000 | 15,953,001 | 17,031,146 | 13.9 | % | ||||||||||||
|
|
|
|
|
| |||||||||||||||
Sub Total Control investments | 15,953,001 | 17,031,146 | 13.9 | % | ||||||||||||||||
|
|
|
|
|
| |||||||||||||||
TOTAL INVESTMENTS-196.2% (b) | $ | 238,458,384 | $ | 240,537,735 | 196.2 | % | ||||||||||||||
|
|
|
|
|
| |||||||||||||||
| (a) | Represents a non-qualifyng investment as defined under Section 55 (a) of the Investment Company Act of 1940, as amended. Non-qualifying assets represent 7.5% of the Company's portfolio at fair value. As a BDC, the Company can only invest 30% of its portfolio in non-qualifying assets. |
| (b) | Percentages are based on net assets of $122,598,742, as of February 28, 2015. |
| (c) | Because there is no readily available market value for these investments, the fair value of these investments is approved in good faith by our board of directors. (see Note 3 to the consolidated financial statements). |
| (d) | These securities are pledged as collateral under a senior secured revolving credit facility (see Note 6 to the consolidated financial statements). |
| (e) | This investment does not have a stated interest rate that is payable thereon. As a result, the 14.32% interest rate in the table above represents the interest rate currently earned on the investment cost and is based on the current cash interest and other income generated by the investment. |
| (f) | As defined in the Investment Company Act, we "Control" this portfolio company because we own more than 25% of the portfolio company's outstanding voting securities. Transactions during the period in which the issuer was both an Affiliate and a portfolio company that we Control are as follows: |
Company | Purchases | Redemptions | Sales (cost) | Interest Income | Management fee income | Net Realized gains/ (losses) | Net Unrealized gains | |||||||||||||||||||||
Saratoga Investment Corp. CLO 2013-1, Ltd. | $ | - | $ | - | $ | - | $ | 2,707,230 | $ | 1,520,205 | $ | - | $ | 1,078,145 | ||||||||||||||
| (g) | Non-income producing at February 28, 2015. |
| (h) | Includes securities issued by an affiliate of the company. |
| (i) | Non-U.S. company. The principal place of business for Polar Holding Company, Ltd. is Canada. |
| (j) | The investment has an unfunded commitment as of February 28, 2015 (See note 8). |
| (k) | Includes an analysis of the value of any unfunded loan commitments. |
| (l) | The entire commitment was unfunded at February 28, 2015. As such, no interest is being earned on this investment. |
| (m) | The entire commitment was funded at February 28, 2015. |
F-5
Saratoga Investment Corp.
Consolidated Schedule of Investments
February 28, 2014
Company | Industry | Investment Interest Rate / | Principal/ Number of Shares | Cost | Fair Value (c) | % of Net Assets | ||||||||||||||
Non-control/Non-affiliated investments-164.2% (b) | ||||||||||||||||||||
PATS Aircraft, LLC | Aerospace | Common Stock | 51,813 | 89,636 | 89,636 | 0.1 | % | |||||||||||||
PATS Aircraft, LLC | Aerospace | First Lien Term Loan 8.50% Cash, 10/6/2016 | $ | 254,598 | 254,598 | 254,598 | 0.2 | % | ||||||||||||
|
|
|
|
|
| |||||||||||||||
| Total Aerospace | 344,234 | 344,234 | 0.3 | % | ||||||||||||||||
|
|
|
|
|
| |||||||||||||||
National Truck Protection Co., Inc. (d, g) | Automotive Aftermarket | Common Stock | 1,116 | 1,000,000 | 1,152,531 | 1.0 | % | |||||||||||||
National Truck Protection Co., Inc. (d) | Automotive Aftermarket | First Lien Term Loan 15.50% (13.50% Cash/2.00% PIK), 9/13/2018 | $ | 8,250,000 | 8,250,000 | 8,250,000 | 7.3 | % | ||||||||||||
Take 5 Oil Change, L.L.C. (d, g) | Automotive Aftermarket | Common Stock | 7,128 | 712,800 | 1,217,747 | 1.1 | % | |||||||||||||
|
|
|
|
|
| |||||||||||||||
| Total Automotive Aftermarket | 9,962,800 | 10,620,278 | 9.4 | % | ||||||||||||||||
|
|
|
|
|
| |||||||||||||||
Legacy Cabinets Holdings (d, g) | Building Products | Common Stock Voting A-1 | 2,535 | 220,900 | 552,351 | 0.5 | % | |||||||||||||
Legacy Cabinets Holdings (d, g) | Building Products | Common Stock Voting B-1 | 1,600 | 139,424 | 348,624 | 0.3 | % | |||||||||||||
|
|
|
|
|
| |||||||||||||||
| Total Building Products | 360,324 | 900,975 | 0.8 | % | ||||||||||||||||
|
|
|
|
|
| |||||||||||||||
ARSloane Acquistion, LLC | Business Services | First Lien Term Loan 7.50% Cash, 10/1/2019 | $ | 997,500 | 988,200 | 1,004,981 | 0.9 | % | ||||||||||||
BMC Software, Inc. (d) | Business Services | First Lien Term Loan 5.00% Cash, 9/10/2020 | $ | 6,000,000 | 5,943,801 | 6,013,800 | 5.3 | % | ||||||||||||
Dispensing Dynamics International (d) | Business Services | Senior Secured Note 12.50% Cash, 1/1/2018 | $ | 7,000,000 | 6,882,278 | 7,525,000 | 6.6 | % | ||||||||||||
Easy Ice, LLC (d) | Business Services | First Lien Term Loan 14.00% (11.00% Cash/3.00% PIK), 3/29/2018 | $ | 7,507,024 | 7,387,970 | 7,507,024 | 6.6 | % | ||||||||||||
Easy Ice, LLC (i), (j) | Business Services | Delayed Draw Term Loan 14.00% (11.00% Cash/3.00% PIK), 3/29/2018 | $ | - | - | - | 0.0 | % | ||||||||||||
Emily Street Enterprises, L.L.C. (d) | Business Services | Senior Secured Note 12.00% (11.00% Cash/1.00% PIK), 12/28/2017 | $ | 5,767,983 | 5,680,703 | 5,767,983 | 5.1 | % | ||||||||||||
Emily Street Enterprises, L.L.C. (d, g) | Business Services | Warrant Membership Interests | 49,318 | 400,000 | 601,679 | 0.5 | % | |||||||||||||
Help/Systems Holdings, Inc.(Help/Systems, LLC) (d) | Business Services | First Lien Term Loan 5.50% Cash, 6/28/2019 | $ | 3,990,000 | 3,954,385 | 3,960,075 | 3.5 | % | ||||||||||||
Help/Systems Holdings, Inc.(Help/Systems, LLC) (d) | Business Services | Second Lien Term Loan 9.50% Cash, 6/28/2020 | $ | 2,000,000 | 1,972,758 | 2,000,000 | 1.8 | % | ||||||||||||
Knowland Technology Holdings, L.L.C. (d) | Business Services | First Lien Term Loan 11.00% Cash, 11/29/2017 | $ | 6,200,000 | 6,107,034 | 6,200,000 | 5.5 | % | ||||||||||||
Trinet HR Corporation (SOI Holdings, Inc.) (d) | Business Services | First Lien Term Loan 5.00% Cash, 8/20/2020 | $ | 4,987,500 | 4,941,335 | 5,018,921 | 4.4 | % | ||||||||||||
Trinet HR Corporation (SOI Holdings, Inc.) (d) | Business Services | Second Lien Term Loan 8.75% Cash, 2/20/2021 | $ | 2,500,000 | 2,453,145 | 2,518,750 | 2.2 | % | ||||||||||||
Vector Controls Holding Co., LLC (d) | Business Services | First Lien Term Loan, 14.00% (12.00% Cash/2.00% PIK), 3/6/2018 | $ | 9,261,074 | 9,115,415 | 9,075,853 | 8.0 | % | ||||||||||||
Vector Controls Holding Co., LLC (d, g) | Business Services | Warrants to Purchase Limited Liability Company Interests | 101 | - | 136,217 | 0.1 | % | |||||||||||||
|
|
|
|
|
| |||||||||||||||
| Total Business Services | 55,827,024 | 57,330,283 | 50.5 | % | ||||||||||||||||
|
|
|
|
|
| |||||||||||||||
Targus Group International, Inc. (d) | Consumer Products | First Lien Term Loan 11.00% Cash, 5/24/2016 | $ | 3,738,369 | 3,704,766 | 3,663,602 | 3.3 | % | ||||||||||||
Targus Holdings, Inc. (d, g) | Consumer Products | Common Stock | 62,413 | 566,765 | 730,232 | 0.6 | % | |||||||||||||
Targus Holdings, Inc. (d) | Consumer Products | Unsecured Note 10.00% PIK, 6/14/2019 | $ | 2,054,158 | 2,054,158 | 1,387,848 | 1.2 | % | ||||||||||||
Targus Holdings, Inc. (d) | Consumer Products | Unsecured Note 16.00% Cash, 10/26/2018 | $ | 384,577 | 379,471 | 336,505 | 0.3 | % | ||||||||||||
|
|
|
|
|
| |||||||||||||||
| Total Consumer Products | 6,705,160 | 6,118,187 | 5.4 | % | ||||||||||||||||
|
|
|
|
|
| |||||||||||||||
Avionte Holdings, LLC | Consumer Services | Common Stock | $ | 100,000 | 100,000 | 100,000 | 0.1 | % | ||||||||||||
Avionte Holdings, LLC | Consumer Services | First Lien Term Loan 9.75% Cash, 1/8/2019 | $ | 3,000,000 | 2,940,000 | 3,000,000 | 2.6 | % | ||||||||||||
Avionte Holdings, LLC (i), (j) | Consumer Services | Delayed Draw Term Loan A 9.75% Cash, 1/8/2019 | $ | - | - | - | 0.0 | % | ||||||||||||
CFF Acquisition L.L.C. (d) | Consumer Services | First Lien Term Loan 7.50% Cash, 7/31/2015 | $ | 1,319,891 | 1,273,596 | 1,319,891 | 1.2 | % | ||||||||||||
Expedited Travel L.L.C. (d) | Consumer Services | First Lien Term Loan 9.00% Cash, 12/28/2017 | $ | 4,580,000 | 4,501,104 | 4,580,000 | 4.0 | % | ||||||||||||
PrePaid Legal Services, Inc. (d) | Consumer Services | First Lien Term Loan 6.25% Cash, 12/31/2016 | $ | 4,274,194 | 4,236,035 | 4,247,694 | 3.7 | % | ||||||||||||
PrePaid Legal Services, Inc. (d) | Consumer Services | Second Lien Term Loan 9.75% Cash, 7/1/2020 | $ | 5,000,000 | 4,931,888 | 5,044,000 | 4.5 | % | ||||||||||||
|
|
|
|
|
| |||||||||||||||
| Total Consumer Services | 17,982,623 | 18,291,585 | 16.1 | % | ||||||||||||||||
|
|
|
|
|
| |||||||||||||||
M/C Acquisition Corp., L.L.C. (d, g) | Education | Class A Common Stock | 544,761 | 30,241 | - | 0.0 | % | |||||||||||||
M/C Acquisition Corp., L.L.C. (d) | Education | First Lien Term Loan 1.00% Cash, 3/13/14 | $ | 2,512,184 | 1,358,250 | 90,128 | 0.1 | % | ||||||||||||
|
|
|
|
|
| |||||||||||||||
| Total Education | 1,388,491 | 90,128 | 0.1 | % | ||||||||||||||||
|
|
|
|
|
| |||||||||||||||
Group Dekko, Inc. (d) | Electronics | Second Lien Term Loan 11.00% (10.00% Cash/1.00% PIK), 5/1/2016 | $ | 6,901,547 | 6,901,547 | 6,741,431 | 5.9 | % | ||||||||||||
|
|
|
|
|
| |||||||||||||||
| Total Electronics | 6,901,547 | 6,741,431 | 5.9 | % | ||||||||||||||||
|
|
|
|
|
| |||||||||||||||
USS Parent Holding Corp. (d, g) | Environmental | Non Voting Common Stock | 765 | 133,002 | 220,992 | 0.2 | % | |||||||||||||
USS Parent Holding Corp. (d, g) | Environmental | Voting Common Stock | 17,396 | 3,025,798 | 5,027,574 | 4.4 | % | |||||||||||||
|
|
|
|
|
| |||||||||||||||
| Total Environmental | 3,158,800 | 5,248,566 | 4.6 | % | ||||||||||||||||
|
|
|
|
|
| |||||||||||||||
DS Waters of America, Inc. (d) | Food and Beverage | First Lien Term Loan 5.25% Cash, 8/30/2020 | $ | 2,493,750 | 2,470,506 | 2,531,156 | 2.2 | % | ||||||||||||
HOA Restaurant Group, L.L.C. (d) | Food and Beverage | Senior Secured Note 11.25% Cash, 4/1/2017 | $ | 4,000,000 | 3,918,437 | 4,240,000 | 3.7 | % | ||||||||||||
TB Corp. (d) | Food and Beverage | First Lien Term Loan 5.75% Cash, 6/19/2018 | $ | 5,101,971 | 5,082,013 | 5,127,481 | 4.5 | % | ||||||||||||
TB Corp. (d) | Food and Beverage | Unsecured Note 13.50% (12.00% Cash/1.50% PIK), 12/20/2018 | $ | 2,543,154 | 2,513,130 | 2,555,870 | 2.3 | % | ||||||||||||
TM Restaurant Group L.L.C. (d) | Food and Beverage | First Lien Term Loan 7.75% Cash, 7/16/2017 | $ | 2,845,690 | 2,831,271 | 2,831,462 | 2.5 | % | ||||||||||||
|
|
|
|
|
| |||||||||||||||
| Total Food and Beverage | 16,815,357 | 17,285,969 | 15.2 | % | ||||||||||||||||
|
|
|
|
|
| |||||||||||||||
Bristol Hospice, LLC | Healthcare Services | Senior Secured Note 11.00%(10.00% Cash/1.00% PIK), 11/29/2018 | $ | 5,509,782 | 5,405,325 | 5,509,782 | 4.9 | % | ||||||||||||
Bristol Hospice, LLC (i), (j) | Healthcare Services | Delayed Draw Term Loan 11.00%(10.00% Cash/1.00% PIK), 11/29/2018 | $ | - | - | - | 0.0 | % | ||||||||||||
Oceans Acquisition, Inc. (d) | Healthcare Services | First Lien Term A Loan 10.75% Cash, 12/27/2017 | $ | 6,373,113 | 6,273,020 | 6,373,113 | 5.5 | % | ||||||||||||
Oceans Acquisition, Inc. (d) | Healthcare Services | First Lien Term B Loan 10.75% Cash, 12/27/2017 | $ | 500,000 | 490,224 | 500,000 | 0.4 | % | ||||||||||||
Oceans Acquisition, Inc. (i) | Healthcare Services | Delayed Draw Term Loan 10.75% Cash, 12/27/2017 | $ | - | - | - | 0.0 | % | ||||||||||||
Smile Brands Group Inc. (d) | Healthcare Services | First Lien Term Loan 7.50% Cash, 8/16/2019 | $ | 4,488,750 | 4,406,559 | 4,488,750 | 4.0 | % | ||||||||||||
Surgical Specialties Corporation (US), Inc. (d) | Healthcare Services | First Lien Term Loan 7.25% Cash, 8/22/2018 | $ | 2,437,500 | 2,415,591 | 2,449,688 | 2.2 | % | ||||||||||||
Zest Holdings, LLC (d) | Healthcare Services | First Lien Term Loan 6.50% Cash, 8/16/2020 | $ | 4,488,750 | 4,405,073 | 4,488,750 | 4.0 | % | ||||||||||||
|
|
|
|
|
| |||||||||||||||
| Total Healthcare Services | 23,395,792 | 23,810,083 | 21.0 | % | ||||||||||||||||
|
|
|
|
|
| |||||||||||||||
McMillin Companies L.L.C. (d, g, h) | Homebuilding | Senior Secured Note 0% Cash, 12/31/2013 | $ | 550,000 | 558,434 | 344,355 | 0.3 | % | ||||||||||||
|
|
|
|
|
| |||||||||||||||
| Total Homebuilding | 558,434 | 344,355 | 0.3 | % | ||||||||||||||||
|
|
|
|
|
| |||||||||||||||
Distribution International, Inc. (d) | Manufacturing | First Lien Term Loan 7.50% Cash, 7/16/2019 | $ | 5,970,000 | 5,916,094 | 5,970,000 | 5.3 | % | ||||||||||||
|
|
|
|
|
| |||||||||||||||
| Total Manufacturing | 5,916,094 | 5,970,000 | 5.3 | % | ||||||||||||||||
|
|
|
|
|
| |||||||||||||||
Elyria Foundry Company, L.L.C. (d) | Metals | Senior Secured Note 17.00% (13.00% Cash/4.00% PIK), 9/14/2014 | $ | 8,859,614 | 8,859,614 | 6,644,711 | 5.9 | % | ||||||||||||
Elyria Foundry Company, L.L.C. (d, g) | Metals | Warrants to Purchase Limited Liability Company Interests (2008) | 7,000 | 20 | - | 0.0 | % | |||||||||||||
Elyria Foundry Company, L.L.C. (d, g) | Metals | Warrants to Purchase Limited Liability Company Interests (2013) | 18,227 | - | - | 0.0 | % | |||||||||||||
|
|
|
|
|
| |||||||||||||||
| Total Metals | 8,859,634 | 6,644,711 | 5.9 | % | ||||||||||||||||
|
|
|
|
|
| |||||||||||||||
Network Communications, Inc. (d, g) | Publishing | Common Stock | 380,572 | - | - | 0.0 | % | |||||||||||||
Network Communications, Inc. (d) | Publishing | Unsecured Notes 8.60% PIK, 1/14/2020 | $ | 2,601,736 | 2,202,168 | 1,190,888 | 1.0 | % | ||||||||||||
|
|
|
|
|
| |||||||||||||||
| Total Publishing | 2,202,168 | 1,190,888 | 1.0 | % | ||||||||||||||||
|
|
|
|
|
| |||||||||||||||
Community Investors, Inc. (d, g) | Software | Common Stock | 1,282 | 1,282 | 1,449 | 0.0 | % | |||||||||||||
Community Investors, Inc. (d) | Software | First Lien Term Loan 9.75% Cash, 5/9/2018 | $ | 6,983,333 | 6,863,915 | 6,983,333 | 6.2 | % | ||||||||||||
Community Investors, Inc. (d), (i), (j) | Software | Revolver | $ | 166,667 | - | - | 0.0 | % | ||||||||||||
Community Investors, Inc. (d, g) | Software | Preferred Stock | 135,584 | 135,584 | 153,210 | 0.1 | % | |||||||||||||
Pen-Link, Ltd. | Software | Second Lien Term Loan 12.50% Cash, 5/26/2019 | $ | 11,500,000 | 11,280,887 | 11,500,000 | 10.2 | % | ||||||||||||
|
|
|
|
|
| |||||||||||||||
| Total Software | 18,281,668 | 18,637,992 | 16.5 | % | ||||||||||||||||
|
|
|
|
|
| |||||||||||||||
Advanced Air & Heat of Florida, LLC | Utilities | First Lien Term Loan 10.00% Cash, 1/31/2019 | $ | 6,705,441 | 6,606,457 | 6,705,441 | 5.9 | % | ||||||||||||
|
|
|
|
|
| |||||||||||||||
| Total Utilities | 6,606,457 | 6,705,441 | 5.9 | % | ||||||||||||||||
|
|
|
|
|
| |||||||||||||||
Sub Total Non-control/Non-affiliated investments | 185,266,607 | 186,275,106 | 164.2 | % | ||||||||||||||||
|
|
|
|
|
| |||||||||||||||
Control investments-17.3% (b) | ||||||||||||||||||||
Saratoga Investment Corp. CLO 2013-1, Ltd. (a), (d), (e), (f) | Structured Finance Securities | Other/Structured Finance Securities 15.16%, 10/17/2023 | $ | 30,000,000 | 16,555,808 | 19,569,596 | 17.3 | % | ||||||||||||
|
|
|
|
|
| |||||||||||||||
Sub Total Control investments | 16,555,808 | 19,569,596 | 17.3 | % | ||||||||||||||||
|
|
|
|
|
| |||||||||||||||
TOTAL INVESTMENTS-181.5% (b) | $ | 201,822,415 | $ | 205,844,702 | 181.5 | % | ||||||||||||||
|
|
|
|
|
| |||||||||||||||
| (a) | Represents a non-qualifyng investment as defined under Section 55 (a) of the Investment Company Act of 1940, as amended. Non-qualifying assets represent 9.5% of the Company's portfolio at fair value. As a BDC, the Company can only invest 30% of its portfolio in non-qualifying assets. |
| (b) | Percentages are based on net assets of $113,427,929 as of February 28, 2014. |
| (c) | Because there is no readily available market value for these investments, the fair value of these investments is approved in good faith by our board of directors. (see Note 3 to the consolidated financial statements). |
| (d) | These securities are pledged as collateral under a senior secured revolving credit facility (see Note 6 to the consolidated financial statements). |
| (e) | This investment does not have a stated interest rate that is payable thereon. As a result, the 15.16% interest rate in the table above represents the interest rate currently earned on the investment cost and is based on the current cash interest and other income generated by the investment. |
| (f) | As defined in the Investment Company Act, we "Control" this portfolio company because we own more than 25% of the portfolio company's outstanding voting securities. Transactions during the period in which the issuer was both an Affiliate and a portfolio company that we Control are as follows: |
Company | Purchases | Redemptions | Sales (cost) | Interest Income | Management fee income | Net Realized gains/ (losses) | Net Unrealized gains/(losses) | |||||||||||||||||||||
Saratoga Investment Corp. CLO 2013-1, Ltd. | $ | - | $ | - | $ | - | $ | 3,410,868 | $ | 1,775,141 | $ | - | $ | 3,013,788 | ||||||||||||||
| (g) | Non-income producing at February 28, 2014. |
| (h) | In connection with the restructuring of this investment, the Company agreed to forego the receipt of any interest payments thereon. |
| (i) | The investment has an unfunded commitment as of February 28, 2015 (See note 8). |
| (j) | The entire commitment was unfunded at February 28, 2015. As such, no interest is being earned on this investment. |
F-6
Saratoga Investment Corp.
Consolidated Statements of Changes in Net Assets
| For the year ended February 28, 2015 | For the year ended February 28, 2014 | For the year ended February 28, 2013 | ||||||||||
INCREASE FROM OPERATIONS: | ||||||||||||
Net investment income | $ | 9,673,850 | $ | 8,874,446 | $ | 6,469,707 | ||||||
Net realized gain from investments | 3,276,450 | 1,270,765 | 561,700 | |||||||||
Net realized loss from derivatives | - | - | (131,000 | ) | ||||||||
Net unrealized appreciation (depreciation) on investments | (1,942,936 | ) | (1,648,046 | ) | 7,012,726 | |||||||
Net unrealized appreciation on derivatives | - | - | 130,925 | |||||||||
|
|
|
|
|
| |||||||
Net increase in net assets from operations | 11,007,364 | 8,497,165 | 14,044,058 | |||||||||
|
|
|
|
|
| |||||||
DECREASE FROM SHAREHOLDER DISTRIBUTIONS: | ||||||||||||
Distributions declared | (2,156,740 | ) | (12,534,807 | ) | (16,475,809 | ) | ||||||
|
|
|
|
|
| |||||||
Net decrease in net assets from shareholder distributions | (2,156,740 | ) | (12,534,807 | ) | (16,475,809 | ) | ||||||
|
|
|
|
|
| |||||||
CAPITAL SHARE TRANSACTIONS: | ||||||||||||
Stock dividend distribution | 320,189 | 10,027,697 | 13,180,503 | |||||||||
|
|
|
|
|
| |||||||
Net increase in net assets from capital share transactions | 320,189 | 10,027,697 | 13,180,503 | |||||||||
|
|
|
|
|
| |||||||
Total increase in net assets | 9,170,813 | 5,990,055 | 10,748,752 | |||||||||
Net assets at beginning of period | 113,427,929 | 107,437,874 | 96,689,122 | |||||||||
|
|
|
|
|
| |||||||
Net assets at end of period | $ | 122,598,742 | $ | 113,427,929 | $ | 107,437,874 | ||||||
|
|
|
|
|
| |||||||
Net asset value per common share | $ | 22.70 | $ | 21.08 | $ | 22.71 | ||||||
Common shares outstanding at end of period | 5,401,899 | 5,379,616 | 4,730,116 | |||||||||
Distribution in excess of net investment income | $ | (23,905,603 | ) | $ | (31,123,667 | ) | $ | (25,771,838 | ) | |||
See accompanying notes to consolidated financial statements.
F-7
Saratoga Investment Corp.
Consolidated Statements of Cash Flows
| For the year ended February 28, 2015 | For the year ended February 28, 2014 | For the year ended February 28, 2013 | ||||||||||
Operating activities | ||||||||||||
NET INCREASE IN NET ASSETS FROM OPERATIONS | $ | 11,007,364 | $ | 8,497,165 | $ | 14,044,058 | ||||||
ADJUSTMENTS TO RECONCILE NET INCREASE IN NET ASSETS FROM OPERATIONS TO NET CASH USED BY OPERATING ACTIVITIES: | ||||||||||||
Paid-in-kind interest income | (1,204,458 | ) | (1,007,494 | ) | (1,062,687 | ) | ||||||
Net accretion of discount on investments | (540,069 | ) | (666,849 | ) | (975,475 | ) | ||||||
Amortization of deferred debt financing costs | 929,773 | 903,289 | 482,306 | |||||||||
Net realized gain from investments | (3,276,450 | ) | (1,270,765 | ) | (561,700 | ) | ||||||
Net realized loss from derivatives | - | - | 131,000 | |||||||||
Net unrealized (appreciation) depreciation on investments | 1,942,936 | 1,648,046 | (7,012,726 | ) | ||||||||
Net unrealized appreciation on derivatives | - | - | (130,925 | ) | ||||||||
Proceeds from sale and redemption of investments | 73,257,332 | 71,606,736 | 21,487,698 | |||||||||
Purchase of investments | (104,872,326 | ) | (121,073,990 | ) | (71,595,649 | ) | ||||||
(Increase) decrease in operating assets: | ||||||||||||
Cash and cash equivalents, reserve accounts | (14,882,101 | ) | 8,793,029 | 13,448,053 | ||||||||
Interest receivable | 102,455 | 317,505 | (1,199,954 | ) | ||||||||
Management fee receivable | (21,807 | ) | 65,747 | 11,728 | ||||||||
Other assets | (34,930 | ) | 68,946 | 11,416 | ||||||||
Receivable from unsettled trades | - | 1,817,074 | (1,757,563 | ) | ||||||||
Increase (decrease) in operating liabilities: | ||||||||||||
Payable for unsettled trades | - | - | (4,072,500 | ) | ||||||||
Management and incentive fees payable | 482,890 | (405,158 | ) | 2,181,511 | ||||||||
Accounts payable and accrued expenses | 10,621 | 389,530 | (269,911 | ) | ||||||||
Interest and debt fees payable | 532,331 | 615,339 | 204,534 | |||||||||
Due to manager | (32,334 | ) | 175,641 | (171,581 | ) | |||||||
|
|
|
|
|
| |||||||
NET CASH USED BY OPERATING ACTIVITIES | (36,598,773 | ) | (29,526,209 | ) | (36,808,367 | ) | ||||||
|
|
|
|
|
| |||||||
Financing activities | ||||||||||||
Borrowings on debt | 52,300,000 | 18,000,000 | 55,550,000 | |||||||||
Paydowns on debt | (13,700,000 | ) | (28,300,000 | ) | (15,250,000 | ) | ||||||
Issuance of notes | - | 48,300,000 | - | |||||||||
Debt financing cost | (1,972,618 | ) | (2,821,806 | ) | (1,373,000 | ) | ||||||
Payments of cash dividends | (1,434,349 | ) | (2,507,112 | ) | (3,295,306 | ) | ||||||
|
|
|
|
|
| |||||||
NET CASH PROVIDED BY FINANCING ACTIVITIES | 35,193,033 | 32,671,082 | 35,631,694 | |||||||||
|
|
|
|
|
| |||||||
NET INCREASE (DECREASE) IN CASH AND CASH EQUIVALENTS | (1,405,740 | ) | 3,144,873 | (1,176,673 | ) | |||||||
CASH AND CASH EQUIVALENTS, BEGINNING OF PERIOD | 3,293,898 | 149,025 | 1,325,698 | |||||||||
|
|
|
|
|
| |||||||
CASH AND CASH EQUIVALENTS, END OF PERIOD | $ | 1,888,158 | $ | 3,293,898 | $ | 149,025 | ||||||
|
|
|
|
|
| |||||||
Supplemental information: | ||||||||||||
Interest paid during the period | $ | 5,912,862 | $ | 4,565,262 | $ | 1,853,573 | ||||||
Supplemental non-cash information: | ||||||||||||
Paid-in-kind interest income | $ | 1,204,458 | $ | 1,007,494 | $ | 1,062,687 | ||||||
Net accretion of discount on investments | $ | 540,069 | $ | 666,849 | $ | 975,475 | ||||||
Amortization of deferred debt financing costs | $ | 929,773 | $ | 903,289 | $ | 482,306 | ||||||
Stock dividend distribution | $ | 320,189 | $ | 10,027,697 | $ | 13,180,503 | ||||||
See accompanying notes to consolidated financial statements.
F-8
SARATOGA INVESTMENT CORP.
NOTES TO CONSOLIDATED FINANCIAL STATEMENTS
February 28, 2015
Note 1. Organization
Saratoga Investment Corp. (the "Company", "we", "our" and "us") is a non-diversified closed end management investment company incorporated in Maryland that has elected to be treated and is regulated as a business development company ("BDC") under the Investment Company Act of 1940 (the "1940 Act"). We commenced operations on March 23, 2007 as GSC Investment Corp. and completed our initial public offering ("IPO") on March 28, 2007. We have elected to be treated as a regulated investment company ("RIC") under subchapter M of the Internal Revenue Code (the "Code"). We expect to continue to qualify and to elect to be treated for tax purposes as a RIC. Our investment objective is to generate current income and, to a lesser extent, capital appreciation from our investments.
GSC Investment, LLC (the "LLC") was organized in May 2006 as a Maryland limited liability company. As of February 28, 2007, the LLC had not yet commenced its operations and investment activities.
On March 21, 2007, the Company was incorporated and concurrently therewith the LLC was merged with and into the Company, with the Company as the surviving entity, in accordance with the procedure for such merger in the LLC's limited liability company agreement and Maryland law. In connection with such merger, each outstanding limited liability company interest of the LLC was converted into a share of common stock of the Company.
On July 30, 2010, the Company changed its name from "GSC Investment Corp." to "Saratoga Investment Corp.".
We are externally managed and advised by our investment adviser, Saratoga Investment Advisors, LLC (the "Manager"), pursuant to the Management Agreement. Prior to July 30, 2010, we were managed and advised by GSCP (NJ), L.P.
On March 28, 2012, our wholly-owned subsidiary, Saratoga Investment Corp. SBIC, LP ("SBIC LP"), received a Small Business Investment Company ("SBIC") license from the Small Business Administration ("SBA").
Note 2. Summary of Significant Accounting Policies
Basis of Presentation
The accompanying consolidated financial statements have been prepared on the accrual basis of accounting in conformity with U.S. generally accepted accounting principles ("U.S. GAAP") and include the accounts of the Company and its special purpose financing subsidiary, Saratoga Investment Funding, LLC (previously known as GSC Investment Funding LLC). All intercompany accounts and transactions have been eliminated in consolidation. All references made to the "Company," "we," and "us" herein include Saratoga Investment Corp. and its consolidated subsidiary, except as stated otherwise.
The Company and SBIC are both considered to be investment companies for financial reporting purposes and have applied the guidance in Topic 946, "Financial Services - Investment Companies". There have been no changes to the Company or SBIC's status as investment companies during the year ended February 28, 2015.
Use of Estimates in the Preparation of Financial Statements
The preparation of the accompanying consolidated financial statements in conformity with U.S. GAAP requires management to make estimates and assumptions that affect the reported amounts of assets and liabilities, and disclosure of contingent assets and liabilities at the date of the financial statements, and income, gains (losses) and expenses during the period reported. Actual results could differ materially from those estimates.
Correction of Immaterial Errors Related to Prior Period
During the year ended February 28, 2015, the Company identified errors related to the accounting for the capital gains portion of the incentive fee for the years ended February 28, 2014, February 28, 2013, February 29, 2012 and February 28, 2011, as well as the cumulative impact of these errors as of February 28, 2014.
F-9
The Company assessed the materiality of these errors and concluded they were not material to any prior annual periods, but the cumulative impact of correcting them in the current period would be quantitatively material to the results of operations of the Company for the year ended February 28, 2015, if the entire adjustment was recorded in that period. Therefore, the consolidated financial statements as of and for the years ended February 28, 2014 and 2013 have been corrected.
The effects of these prior period errors on the consolidated financial statements are as follows (in thousands, except per share amounts):
Revised Consolidated Statement of Assets and Liabilities
| As of February 28, 2014 | ||||||||||||
| As Previously Reported | Adjustments | As Revised | ||||||||||
LIABILITIES | ||||||||||||
Management and incentive fees payable | $ | 3,857 | $ | 1,496 | $ | 5,353 | ||||||
Total liabilities | 104,253 | 1,496 | 105,749 | |||||||||
NET ASSETS | ||||||||||||
Distribution in excess of net investment income | (29,628 | ) | (1,496 | ) | (31,124 | ) | ||||||
Total Net Assets | $ | 114,924 | $ | (1,496 | ) | $ | 113,428 | |||||
|
|
|
|
|
| |||||||
NET ASSET VALUE PER SHARE | $ | 21.36 | $ | (0.28 | ) | $ | 21.08 | |||||
|
|
|
|
|
| |||||||
| As of November 30, 2014 | ||||||||||||
| As Previously Reported | Adjustments | As Revised | ||||||||||
LIABILITIES | ||||||||||||
Management and incentive fees payable | $ | 4,551 | $ | 1,554 | $ | 6,105 | ||||||
Total liabilities | 138,684 | 1,554 | 140,238 | |||||||||
NET ASSETS | ||||||||||||
Distribution in excess of net investment income | (23,753 | ) | (1,554 | ) | (25,307 | ) | ||||||
Total Net Assets | $ | 122,316 | $ | (1,554 | ) | $ | 120,762 | |||||
|
|
|
|
|
| |||||||
NET ASSET VALUE PER SHARE | $ | 22.74 | $ | (0.29 | ) | $ | 22.45 | |||||
|
|
|
|
|
| |||||||
| As of August 31, 2014 | ||||||||||||
| As Previously Reported | Adjustments | As Revised | ||||||||||
LIABILITIES | ||||||||||||
Management and incentive fees payable | $ | 4,221 | $ | 1,473 | $ | 5,694 | ||||||
Total liabilities | 127,412 | 1,473 | 128,885 | |||||||||
NET ASSETS | ||||||||||||
Distribution in excess of net investment income | (25,494 | ) | (1,473 | ) | (26,967 | ) | ||||||
Total Net Assets | $ | 119,818 | $ | (1,473 | ) | $ | 118,345 | |||||
|
|
|
|
|
| |||||||
NET ASSET VALUE PER SHARE | $ | 22.27 | $ | (0.27 | ) | $ | 22.00 | |||||
|
|
|
|
|
| |||||||
| As of May 31, 2014 | ||||||||||||
| As Previously Reported | Adjustments | As Revised | ||||||||||
LIABILITIES | ||||||||||||
Management and incentive fees payable | $ | 3,649 | $ | 1,494 | $ | 5,143 | ||||||
Total liabilities | 122,552 | 1,494 | 124,046 | |||||||||
NET ASSETS | ||||||||||||
Distribution in excess of net investment income | (27,567 | ) | (1,494 | ) | (29,061 | ) | ||||||
Total Net Assets | $ | 116,682 | $ | (1,494 | ) | $ | 115,188 | |||||
|
|
|
|
|
| |||||||
NET ASSET VALUE PER SHARE | $ | 21.69 | $ | (0.28 | ) | $ | 21.41 | |||||
|
|
|
|
|
| |||||||
F-10
Revised Consolidated Statements of Operations
| Year Ended February 28, 2014 | Year Ended February 28, 2013 | |||||||||||||||||||||||
| As Previously Reported | Adjustments | As Revised | As Previously Reported | Adjustments | As Revised | |||||||||||||||||||
EXPENSES | ||||||||||||||||||||||||
Incentive management fees | $ | 692 | $ | 247 | $ | 939 | $ | 2,045 | $ | 558 | $ | 2,603 | ||||||||||||
Total expenses | 13,772 | 247 | 14,019 | 9,979 | 558 | 10,537 | ||||||||||||||||||
NET INVESTMENT INCOME | 9,121 | (247 | ) | 8,874 | 7,028 | (558 | ) | 6,470 | ||||||||||||||||
NET INCREASE IN NET ASSETS RESULTING FROM OPERATIONS | $ | 8,744 | $ | (247 | ) | $ | 8,497 | $ | 14,602 | $ | (558 | ) | $ | 14,044 | ||||||||||
WEIGHTED AVERAGE-BASIC AND DILUTED EARNINGS PER COMMON SHARE | $ | 1.78 | $ | (0.05 | ) | $ | 1.73 | $ | 3.55 | $ | (0.13 | ) | $ | 3.42 | ||||||||||
|
|
|
|
|
|
|
|
|
|
|
| |||||||||||||
| Three Months Ended November 30, 2014 | Nine Months Ended November 30, 2014 | |||||||||||||||||||||||
| As Previously Reported | Adjustments | As Revised | As Previously Reported | Adjustments | As Revised | |||||||||||||||||||
EXPENSES | ||||||||||||||||||||||||
Incentive management fees | $ | 852 | $ | 81 | $ | 933 | $ | 2,022 | $ | 58 | $ | 2,080 | ||||||||||||
Total expenses | 4,595 | 81 | 4,676 | 13,081 | 58 | 13,139 | ||||||||||||||||||
NET INVESTMENT INCOME | 2,710 | (81 | ) | 2,629 | 6,843 | (58 | ) | 6,785 | ||||||||||||||||
NET INCREASE IN NET ASSETS RESULTING FROM OPERATIONS | $ | 3,466 | $ | (81 | ) | $ | 3,385 | $ | 8,360 | $ | (58 | ) | $ | 8,302 | ||||||||||
WEIGHTED AVERAGE-BASIC AND DILUTED EARNINGS PER COMMON SHARE | $ | 0.64 | $ | (0.01 | ) | $ | 0.63 | $ | 1.55 | $ | (0.01 | ) | $ | 1.54 | ||||||||||
|
|
|
|
|
|
|
|
|
|
|
| |||||||||||||
| Three Months Ended August 31, 2014 | Six Months Ended August 31, 2014 | |||||||||||||||||||||||
| As Previously Reported | Adjustments | As Revised | As Previously Reported | Adjustments | As Revised | |||||||||||||||||||
EXPENSES | ||||||||||||||||||||||||
Incentive management fees | $ | 790 | $ | (21 | ) | $ | 769 | $ | 1,170 | $ | (23 | ) | $ | 1,147 | ||||||||||
Total expenses | 4,403 | (21 | ) | 4,382 | 8,486 | (23 | ) | 8,463 | ||||||||||||||||
NET INVESTMENT INCOME | 2,072 | 21 | 2,093 | 4,133 | 23 | 4,156 | ||||||||||||||||||
NET INCREASE IN NET ASSETS RESULTING FROM OPERATIONS | $ | 3,136 | $ | 21 | $ | 3,157 | $ | 4,894 | $ | 23 | $ | 4,917 | ||||||||||||
WEIGHTED AVERAGE-BASIC AND DILUTED EARNINGS PER COMMON SHARE | $ | 0.58 | $ | 0.01 | $ | 0.59 | $ | 0.91 | $ | - | $ | 0.91 | ||||||||||||
|
|
|
|
|
|
|
|
|
|
|
| |||||||||||||
| Three Months Ended May 31, 2014 | ||||||||||||
| As Previously Reported | Adjustments | As Revised | ||||||||||
EXPENSES | ||||||||||||
Incentive management fees | $ | 380 | $ | (2 | ) | $ | 378 | |||||
Total expenses | 4,083 | (2 | ) | 4,081 | ||||||||
NET INVESTMENT INCOME | 2,061 | 2 | 2,063 | |||||||||
NET INCREASE IN NET ASSETS RESULTING FROM OPERATIONS | $ | 1,758 | $ | 2 | $ | 1,760 | ||||||
WEIGHTED AVERAGE-BASIC AND DILUTED EARNINGS PER COMMON SHARE | $ | 0.33 | $ | - | $ | 0.33 | ||||||
|
|
|
|
|
| |||||||
F-11
Revised Consolidated Statements of Changes in Net Assets
| Year Ended February 28, 2014 | Year Ended February 28, 2013 | |||||||||||||||||||||||
| As Previously Reported | Adjustments | As Revised | As Previously Reported | Adjustments | As Revised | |||||||||||||||||||
INCREASE FROM OPERATIONS | ||||||||||||||||||||||||
Net investment income | $ | 9,121 | $ | (247 | ) | $ | 8,874 | $ | 7,028 | $ | (558 | ) | $ | 6,470 | ||||||||||
Net increase in net assets from operations | 8,744 | (247 | ) | 8,497 | 14,602 | (558 | ) | 14,044 | ||||||||||||||||
Total increase in net assets | 6,237 | (247 | ) | 5,990 | 11,307 | (558 | ) | 10,749 | ||||||||||||||||
Net assets at beginning of period | 108,687 | (1,249 | ) | 107,438 | 97,380 | (691 | ) | 96,689 | ||||||||||||||||
|
|
|
|
|
|
|
|
|
|
|
| |||||||||||||
Net assets at end of period | $ | 114,924 | $ | (1,496 | ) | $ | 113,428 | $ | 108,687 | $ | (1,249 | ) | $ | 107,438 | ||||||||||
|
|
|
|
|
|
|
|
|
|
|
| |||||||||||||
Net asset value per common share | $ | 21.36 | $ | (0.28 | ) | $ | 21.08 | $ | 22.98 | $ | (0.27 | ) | $ | 22.71 | ||||||||||
Distribution in excess of net investment income | $ | (29,628 | ) | $ | (1,496 | ) | $ | (31,124 | ) | $ | (24,523 | ) | $ | (1,249 | ) | $ | (25,772 | ) | ||||||
| Nine Months Ended November 30, 2014 | ||||||||||||
| As Previously Reported | Adjustments | As Revised | ||||||||||
INCREASE FROM OPERATIONS | ||||||||||||
Net investment income | $ | 6,843 | $ | (58 | ) | $ | 6,785 | |||||
Net increase in net assets from operations | 8,360 | (58 | ) | 8,302 | ||||||||
Total increase in net assets | 7,392 | (58 | ) | 7,334 | ||||||||
Net assets at beginning of period | 114,924 | (1,496 | ) | 113,428 | ||||||||
|
|
|
|
|
| |||||||
Net assets at end of period | $ | 122,316 | $ | (1,554 | ) | $ | 120,762 | |||||
|
|
|
|
|
| |||||||
Net asset value per common share | $ | 22.74 | $ | (0.29 | ) | $ | 22.45 | |||||
Distribution in excess of net investment income | $ | (23,753 | ) | $ | (1,554 | ) | $ | (25,307 | ) | |||
| Six Months Ended August 31, 2014 | ||||||||||||
| As Previously Reported | Adjustments | As Revised | ||||||||||
INCREASE FROM OPERATIONS | ||||||||||||
Net investment income | $ | 4,133 | $ | 23 | $ | 4,156 | ||||||
Net increase in net assets from operations | 4,894 | 23 | 4,917 | |||||||||
Total increase in net assets | 4,894 | 23 | 4,917 | |||||||||
Net assets at beginning of period | 114,924 | (1,496 | ) | 113,428 | ||||||||
|
|
|
|
|
| |||||||
Net assets at end of period | $ | 119,818 | $ | (1,473 | ) | $ | 118,345 | |||||
|
|
|
|
|
| |||||||
Net asset value per common share | $ | 22.27 | $ | (0.27 | ) | $ | 22.00 | |||||
Distribution in excess of net investment income | $ | (25,494 | ) | $ | (1,473 | ) | $ | (26,967 | ) | |||
| Three Months Ended May 31, 2014 | ||||||||||||
| As Previously Reported | Adjustments | As Revised | ||||||||||
INCREASE FROM OPERATIONS | ||||||||||||
Net investment income | $ | 2,061 | $ | 2 | $ | 2,063 | ||||||
Net increase in net assets from operations | 1,758 | 2 | 1,760 | |||||||||
Total increase in net assets | 1,758 | 2 | 1,760 | |||||||||
Net assets at beginning of period | 114,924 | (1,496 | ) | 113,428 | ||||||||
|
|
|
|
|
| |||||||
Net assets at end of period | $ | 116,682 | $ | (1,494 | ) | $ | 115,188 | |||||
|
|
|
|
|
| |||||||
Net asset value per common share | $ | 21.69 | $ | (0.28 | ) | $ | 21.41 | |||||
Distribution in excess of net investment income | $ | (27,567 | ) | $ | (1,494 | ) | $ | (29,061 | ) | |||
F-12
Revised Consolidated Statements of Cash Flows
| Year Ended February 28, 2014 | Year Ended February 28, 2013 | |||||||||||||||||||||||
| As Previously Reported | Adjustments | As Revised | As Previously Reported | Adjustments | As Revised | |||||||||||||||||||
Operating activities | ||||||||||||||||||||||||
NET INCREASE IN NET ASSETS FROM OPERATIONS | $ | 8,744 | $ | (247 | ) | $ | 8,497 | $ | 14,602 | $ | (558 | ) | $ | 14,044 | ||||||||||
|
|
|
|
|
|
|
|
|
|
|
| |||||||||||||
Increase (decrease) in operating liabilities: | ||||||||||||||||||||||||
Management and incentive fees payable | (652 | ) | 247 | (405 | ) | 1,624 | 558 | 2,182 | ||||||||||||||||
| Nine Months Ended November 30, 2014 | ||||||||||||
| As Previously Reported | Adjustments | As Revised | ||||||||||
Operating activities | ||||||||||||
NET INCREASE IN NET ASSETS FROM OPERATIONS | $ | 8,360 | $ | (58 | ) | $ | 8,302 | |||||
|
|
|
|
|
| |||||||
Increase (decrease) in operating liabilities: | ||||||||||||
Management and incentive fees payable | 694 | 58 | 752 | |||||||||
| Six Months Ended August 31, 2014 | ||||||||||||
| As Previously Reported | Adjustments | As Revised | ||||||||||
Operating activities | ||||||||||||
NET INCREASE IN NET ASSETS FROM OPERATIONS | $ | 4,894 | $ | 23 | $ | 4,917 | ||||||
|
|
|
|
|
| |||||||
Increase (decrease) in operating liabilities: | ||||||||||||
Management and incentive fees payable | 364 | (23 | ) | 341 | ||||||||
| Three Months Ended May 31, 2014 | ||||||||||||
| As Previously Reported | Adjustments | As Revised | ||||||||||
Operating activities | ||||||||||||
NET INCREASE IN NET ASSETS FROM OPERATIONS | $ | 1,758 | $ | 2 | $ | 1,760 | ||||||
|
|
|
|
|
| |||||||
Increase (decrease) in operating liabilities: | ||||||||||||
Management and incentive fees payable | (208 | ) | (2 | ) | (210 | ) | ||||||
Cash and Cash Equivalents
Cash and cash equivalents include short-term, liquid investments in a money market fund. Cash and cash equivalents are carried at cost which approximates fair value. Per section 12(d)(1)(A) of the 1940 Act, the Company may not invest in another registered investment company such as, a money market fund if such investment would cause the Company to exceed any of the following limitations:
| • | we were to own more than 3.0% of the total outstanding voting stock of the money market fund; |
F-13
| • | we were to hold securities in the money market fund having an aggregate value in excess of 5.0% of the value of our total assets; or |
| • | we were to hold securities in money market funds and other registered investment companies and BDCs having an aggregate value in excess of 10.0% of the value of our total assets. |
Cash and Cash Equivalents, Reserve Accounts
Cash and cash equivalents, reserve accounts include amounts held in designated bank accounts in the form of cash and short-term liquid investments in money market funds representing payments received on secured investments or other reserved amounts associated with our $45.0 million senior secured revolving credit facility with Madison Capital Funding LLC. The Company is required to use these amounts to pay interest expense, reduce borrowings, or pay other amounts in accordance with the terms of the senior secured revolving credit facility.
Investment Classification
The Company classifies its investments in accordance with the requirements of the 1940 Act. Under the 1940 Act, "Control Investments" are defined as investments in companies in which we own more than 25.0% of the voting securities or maintain greater than 50.0% of the board representation. Under the 1940 Act, "Affiliated Investments" are defined as those non-control investments in companies in which we own between 5.0% and 25.0% of the voting securities. Under the 1940 Act, "Non-affiliated Investments" are defined as investments that are neither Control Investments nor Affiliated Investments.
Investment Valuation
The Company accounts for its investments at fair value in accordance with the Financial Accounting Standards Board ("FASB") Accounting Standards Codification ("ASC") Topic 820, Fair Value Measurements and Disclosures ("ASC 820"). ASC 820 defines fair value, establishes a framework for measuring fair value, establishes a fair value hierarchy based on the quality of inputs used to measure fair value and enhances disclosure requirements for fair value measurements. ASC 820 requires the Company to assume that its investments are to be sold at the statement of assets and liabilities date in the principal market to independent market participants, or in the absence of a principal market, in the most advantageous market, which may be a hypothetical market. Market participants are defined as buyers and sellers in the principal or most advantageous market that are independent, knowledgeable, and willing and able to transact.
Investments for which market quotations are readily available are fair valued at such market quotations obtained from independent third party pricing services and market makers subject to any decision by our board of directors to approve a fair value determination to reflect significant events affecting the value of these investments. We value investments for which market quotations are not readily available at fair value as approved, in good faith, by our board of directors based on input from our Manager, the audit committee of our board of directors and a third party independent valuation firm. Determinations of fair value may involve subjective judgments and estimates. The types of factors that may be considered in determining the fair value of our investments include the nature and realizable value of any collateral, the portfolio company's ability to make payments, market yield trend analysis, the markets in which the portfolio company does business, comparison to publicly traded companies, discounted cash flow and other relevant factors.
We undertake a multi-step valuation process each quarter when valuing investments for which market quotations are not readily available, as described below:
| • | Each investment is initially valued by the responsible investment professionals of our Manager and preliminary valuation conclusions are documented and discussed with the senior management of our Manager; and |
| • | An independent valuation firm engaged by our board of directors reviews approximately one quarter of these preliminary valuations each quarter so that the valuation of each investment for which market quotes are not readily available is reviewed by the independent valuation firm at least annually. |
In addition, all our investments are subject to the following valuation process:
| • | The audit committee of our board of directors reviews each preliminary valuation and our Manager and independent valuation firm (if applicable) will supplement the preliminary valuation to reflect any comments provided by the audit committee; and |
F-14
| • | Our board of directors discusses the valuations and approves the fair value of each investment, in good faith, based on the input of our Manager, independent valuation firm (to the extent applicable) and the audit committee of our board of directors. |
Our investment in Saratoga Investment Corp. CLO 2013-1, Ltd. ("Saratoga CLO") is carried at fair value, which is based on a discounted cash flow model that utilizes prepayment, re-investment and loss assumptions based on historical experience and projected performance, economic factors, the characteristics of the underlying cash flow, and comparable yields for equity interests in collateralized loan obligation funds similar to Saratoga CLO, when available, as determined by our Manager and recommended to our board of directors. Specifically, we use Intex cash flow models, or an appropriate substitute, to form the basis for the valuation of our investment in Saratoga CLO. The models use a set of assumptions including projected default rates, recovery rates, reinvestment rate and prepayment rates in order to arrive at estimated valuations. The assumptions are based on available market data and projections provided by third parties as well as management estimates. We use the output from the Intex models (i.e., the estimated cash flows) to perform a discounted cash flows analysis on expected future cash flows to determine a valuation for our investment in Saratoga CLO.
Because such valuations, and particularly valuations of private investments and private companies, are inherently uncertain, they may fluctuate over short periods of time and may be based on estimates. The determination of fair value may differ materially from the values that would have been used if a ready market for these investments existed. Our net asset value could be materially affected if the determinations regarding the fair value of our investments were materially higher or lower than the values that we ultimately realize upon the disposal of such investments.
Derivative Financial Instruments
We account for derivative financial instruments in accordance with ASC Topic 815, Derivatives and Hedging ("ASC 815"). ASC 815 requires recognizing all derivative instruments as either assets or liabilities on the consolidated statements of assets and liabilities at fair value. The Company values derivative contracts at the closing fair value provided by the counterparty. Changes in the values of derivative contracts are included in the consolidated statements of operations.
Investment Transactions and Income Recognition
Purchases and sales of investments and the related realized gains or losses are recorded on a trade-date basis. Interest income, adjusted for amortization of premium and accretion of discount, is recorded on an accrual basis to the extent that such amounts are expected to be collected. The Company stops accruing interest on its investments when it is determined that interest is no longer collectible. Discounts and premiums on investments purchased are accreted/amortized over the life of the respective investment using the effective yield method. The amortized cost of investments represents the original cost adjusted for the accretion of discounts and amortizations of premium on investments.
Loans are generally placed on non-accrual status when there is reasonable doubt that principal or interest will be collected. Accrued interest is generally reserved when a loan is placed on non-accrual status. Interest payments received on non-accrual loans may be recognized as a reduction in principal depending upon management's judgment regarding collectability. Non-accrual loans are restored to accrual status when past due principal and interest is paid and, in management's judgment, are likely to remain current, although we may make exceptions to this general rule if the loan has sufficient collateral value and is in the process of collection.
Interest income on our investment in Saratoga CLO is recorded using the effective interest method in accordance with the provisions of ASC Topic 325-40, Investments-Other, Beneficial Interests in Securitized Financial Assets , ("ASC 325-40"), based on the anticipated yield and the estimated cash flows over the projected life of the investment. Yields are revised when there are changes in actual or estimated cash flows due to changes in prepayments and/or re-investments, credit losses or asset pricing. Changes in estimated yield are recognized as an adjustment to the estimated yield over the remaining life of the investment from the date the estimated yield was changed.
Other Income
Other income includes dividends received, origination fees, structuring fees and advisory fees, and is recorded in income when earned.
Paid-in-Kind Interest
The Company holds debt investments in its portfolio that contain a payment-in-kind ("PIK") interest provision. The PIK interest, which represents contractually deferred interest added to the investment balance that is generally due at maturity, is generally recorded on the accrual basis to the extent such amounts are expected to be collected. We stop accruing PIK interest if we do not expect the issuer to be able to pay all principal and interest when due.
F-15
Deferred Debt Financing Costs
Financing costs incurred in connection with our credit facility are deferred and amortized using the straight line method over the life of their respective facilities. Financing costs incurred in connection with our SBA debentures are deferred and amortized using the effective yield method over the life of the debentures.
In April 2015, the FASB has issued Accounting Standards Update ("ASU") No. 2015-03, Interest-Imputation of Interest (Subtopic 835-30): Simplifying the Presentation of Debt Issuance Costs ("ASU 2015-03"). The amendments in this ASU require that debt issuance costs related to a recognized debt liability be presented in the balance sheet as a direct deduction from the carrying amount of that debt liability, consistent with debt discounts. The recognition and measurement guidance for debt issuance costs are not affected by the amendments in this ASU. The guidance is effective for fiscal years, and interim periods within those fiscal years, beginning after December 15, 2015, and early adoption is allowed, and is to be applied on a retrospective basis. The Company has adopted the provisions of ASU 2015-03 as of February 28, 2015, by reclassifying deferred debt financing costs from within total assets to within total liabilities as a contra-liability. The adoption of the provisions of ASU 2015-03 did not materially impact the Company's consolidated financial position or results of operations. Prior period amounts were reclassified to conform to the current period presentation.
Contingencies
In the ordinary course of its business, the Company may enter into contracts or agreements that contain indemnifications or warranties. Future events could occur that lead to the execution of these provisions against the Company. Based on its history and experience, management feels that the likelihood of such an event is remote.
In the ordinary course of business, the Company may directly or indirectly be a defendant or plaintiff in legal actions with respect to bankruptcy, insolvency or other types of proceedings. Such lawsuits may involve claims that could adversely affect the value of certain financial instruments owned by the Company.
Income Taxes
The Company has filed an election to be treated for tax purposes as a RIC under Subchapter M of the Code and, among other things, intends to make the requisite distributions to its stockholders which will relieve the Company from federal income taxes. Therefore, no provision has been recorded for federal income taxes.
In order to qualify as a RIC, among other requirements, the Company is required to timely distribute to its stockholders at least 90.0% of its investment company taxable income, as defined by the Code, for each fiscal tax year. The Company will be subject to a nondeductible U.S. federal excise tax of 4.0% on undistributed income if it does not distribute at least 98.0% of its ordinary income in any calendar year and 98.2% of its capital gain net income for each one-year period ending on October 31.
Depending on the level of taxable income earned in a tax year, the Company may choose to carry forward taxable income in excess of current year dividend distributions into the next tax year and pay a 4.0% excise tax on such income, as required. To the extent that the Company determines that its estimated current year annual taxable income will be in excess of estimated current year dividend distributions for excise tax purposes, the Company accrues excise tax, if any, on estimated excess taxable income as taxable income is earned.
In accordance with certain applicable Treasury regulations and private letter rulings issued by the Internal Revenue Service, a RIC may treat a distribution of its own stock as fulfilling its RIC distribution requirements if each stockholder may elect to receive his or her entire distribution in either cash or stock of the RIC subject to a limitation on the aggregate amount of cash to be distributed to all stockholders, which limitation must be at least 20.0% of the aggregate declared distribution. If too many stockholders elect to receive cash, each stockholder electing to receive cash will receive a pro rata amount of cash (with the balance of the distribution paid in stock). In no event will any stockholder, electing to receive cash, receive less than 20.0% of his or her entire distribution in cash. If these and certain other requirements are met, for U.S federal income tax purposes, the amount of the dividend paid in stock will be equal to the amount of cash that could have been received instead of stock.
ASC 740, Income Taxes , ("ASC 740"), provides guidance for how uncertain tax positions should be recognized, measured, presented and disclosed in the financial statements. ASC 740 requires the evaluation of tax positions taken or expected to be taken in the course of preparing the Company's tax returns to determine whether the tax positions are "more-likely-than-not" of being
F-16
sustained by the applicable tax authority. Tax positions deemed to meet a "more-likely-than-not" threshold would be recorded as a tax benefit or expense in the current period. The Company recognizes interest and penalties, if any, related to unrecognized tax benefits as income tax expense in the consolidated statements of operations. During the fiscal year ended February 28, 2015, the Company did not incur any interest or penalties. Although we file federal and state tax returns, our major tax jurisdiction is federal. The 2012, 2013 and 2014 federal tax years for the Company remain subject to examination by the IRS. As of February 28, 2015 and February 28, 2014, there were no uncertain tax positions.
Dividends
Dividends to common stockholders are recorded on the ex-dividend date. The amount to be paid out as a dividend is determined by the board of directors. Net realized capital gains, if any, are generally distributed at least annually, although we may decide to retain such capital gains for reinvestment.
We have adopted a dividend reinvestment plan ("DRIP") that provides for reinvestment of our dividend distributions on behalf of our stockholders unless a stockholder elects to receive cash. As a result, if our board of directors authorizes, and we declare, a cash dividend, then our stockholders who have not "opted out" of the DRIP by the dividend record date will have their cash dividends automatically reinvested into additional shares of our common stock, rather than receiving the cash dividends. We have the option to satisfy the share requirements of the DRIP through the issuance of new shares of common stock or through open market purchases of common stock by the DRIP plan administrator.
Capital Gains Incentive Fee
The Company records an expense accrual on the consolidated statements of operations, relating to the capital gains incentive fee payable on the consolidated statements of assets and liabilities, by the Company to its investment adviser when the unrealized gains on its investments exceed all realized capital losses on its investments given the fact that a capital gains incentive fee would be owed to the investment adviser if the Company were to liquidate its investment portfolio at such time. The actual incentive fee payable to the Company's investment adviser related to capital gains will be determined and payable in arrears at the end of each fiscal year and will include only realized capital gains for the period.
New Accounting Pronouncements
In February 2015, the FASB issued ASU 2015-02, Consolidation (ASC Topic 810): Amendments to the Consolidation Analysis ("ASU 2015-02"). ASU 2015-02 significantly changes the consolidation analysis required under GAAP and ends the deferral granted to investment companies from applying the variable interest entity guidance. ASU 2015-02 is effective for interim and annual reporting periods in fiscal years that begin after December 15, 2015 and early adoption is permitted. Management is currently evaluating the impact these changes will have on the Company's consolidated financial statements and disclosures.
In August 2014, the FASB issued new accounting guidance that requires management to assess an entity's ability to continue as a going concern by incorporating and expanding upon certain principles that are currently in U.S. auditing standards. The amendments provide a definition of the term "substantial doubt" and include principles for considering the mitigating effect of management's plans. The amendments also require an evaluation every reporting period, including interim periods for a period of one year after the date that the financial statements are issued (or available to be issued), and certain disclosures when substantial doubt is alleviated or not alleviated. The amendments in this update are effective for reporting periods ending after December 15, 2016. Management is currently evaluating the impact of adopting this new accounting guidance update on the company's consolidated financial statement.
In June 2014, the FASB issued ASU 2014-11, Repurchase-to-Maturity Transactions, Repurchase Financings, and Disclosures, ("ASU 2014-11"). ASU 2014-11 makes limited changes to the accounting for repurchase agreements, clarifies when repurchase agreements and securities lending transactions should be accounted for as secured borrowings, and requires additional disclosures regarding these types of transactions. The guidance is effective for fiscal years beginning on or after December 15, 2014, and for interim periods within those fiscal years. Management is currently evaluating the impact these changes will have on the Company's consolidated financial statement disclosures.
In May 2014, the Financial Accounting Standards Board ("FASB") issued Accounting Standards Update ("ASU") 2014-09, Revenue from Contracts with Customers (Topic 606) , which supersedes the revenue recognition requirements in Revenue Recognition (Topic 605). Under the new guidance, an entity should recognize revenue to depict the transfer of promised goods or services to customers in an amount that reflects the consideration to which the entity expects to be entitled in exchange for those goods or services. This guidance is effective for annual and interim reporting periods beginning after December 15, 2016, and early application is not permitted. The Company is currently evaluating the impact this ASU will have on its consolidated financial statements.
F-17
Risk Management
In the ordinary course of its business, the Company manages a variety of risks, including market risk and credit risk. Market risk is the risk of potential adverse changes to the value of investments because of changes in market conditions such as interest rate movements and volatility in investment prices.
Credit risk is the risk of default or non-performance by portfolio companies, equivalent to the investment's carrying amount.
The Company is also exposed to credit risk related to maintaining all of its cash and cash equivalents, including those in reserve accounts, at a major financial institution and credit risk related to any of its derivative counterparties.
The Company has investments in lower rated and comparable quality unrated high yield bonds and bank loans. Investments in high yield investments are accompanied by a greater degree of credit risk. The risk of loss due to default by the issuer is significantly greater for holders of high yield securities, because such investments are generally unsecured and are often subordinated to other creditors of the issuer.
Note 3. Investments
As noted above, the Company values all investments in accordance with ASC 820. ASC 820 requires enhanced disclosures about assets and liabilities that are measured and reported at fair value. As defined in ASC 820, fair value is the price that would be received to sell an asset or paid to transfer a liability in an orderly transaction between market participants at the measurement date.
ASC 820 establishes a hierarchal disclosure framework which prioritizes and ranks the level of market price observability of inputs used in measuring investments at fair value. Market price observability is affected by a number of factors, including the type of investment and the characteristics specific to the investment. Investments with readily available active quoted prices or for which fair value can be measured from actively quoted prices generally will have a higher degree of market price observability and a lesser degree of judgment used in measuring fair value.
Based on the observability of the inputs used in the valuation techniques, the Company is required to provide disclosures on fair value measurements according to the fair value hierarchy. The fair value hierarchy ranks the observability of the inputs used to determine fair values. Investments carried at fair value are classified and disclosed in one of the following three categories:
| • | Level 1-Valuations based on quoted prices in active markets for identical assets or liabilities that the Company has the ability to access. |
| • | Level 2-Valuations based on inputs other than quoted prices in active markets, which are either directly or indirectly observable. |
| • | Level 3-Valuations based on inputs that are unobservable and significant to the overall fair value measurement. The inputs used in the determination of fair value may require significant management judgment or estimation. Such information may be the result of consensus pricing information or broker quotes which include a disclaimer that the broker would not be held to such a price in an actual transaction. The non-binding nature of consensus pricing and/or quotes accompanied by disclaimer would result in classification as Level 3 asset, assuming no additional corroborating evidence. |
In addition to using the above inputs in investment valuations, the Company continues to employ the valuation policy approved by the board of directors that is consistent with ASC 820 and the 1940 Act (see Note 2). Consistent with our Company's valuation policy, we evaluate the source of inputs, including any markets in which our investments are trading, in determining fair value.
The following table presents fair value measurements of investments, by major class, as of February 28, 2015 (dollars in thousands), according to the fair value hierarchy:
| Fair Value Measurements | ||||||||||||||||
| Level 1 | Level 2 | Level 3 | Total | |||||||||||||
Syndicated loans | $ | - | $ | - | $ | 18,302 | $ | 18,302 | ||||||||
First lien term loans | - | - | 145,207 | 145,207 | ||||||||||||
Second lien term loans | - | - | 35,603 | 35,603 | ||||||||||||
Unsecured notes | - | - | 4,230 | 4,230 | ||||||||||||
Structured finance securities | - | - | 17,031 | 17,031 | ||||||||||||
Equity interest | - | - | 20,165 | 20,165 | ||||||||||||
|
|
|
|
|
|
|
| |||||||||
Total | $ | - | $ | - | $ | 240,538 | $ | 240,538 | ||||||||
|
|
|
|
|
|
|
| |||||||||
F-18
The following table presents fair value measurements of investments, by major class, as of February 28, 2014 (dollars in thousands), according to the fair value hierarchy:
| Fair Value Measurements | ||||||||||||||||
| Level 1 | Level 2 | Level 3 | Total | |||||||||||||
Syndicated loans | $ | - | $ | - | $ | 32,390 | $ | 32,390 | ||||||||
First lien term loans | - | - | 110,278 | 110,278 | ||||||||||||
Second lien term loans | - | - | 27,804 | 27,804 | ||||||||||||
Unsecured notes | - | - | 5,471 | 5,471 | ||||||||||||
Structured finance securities | - | - | 19,570 | 19,570 | ||||||||||||
Equity interest | - | - | 10,332 | 10,332 | ||||||||||||
|
|
|
|
|
|
|
| |||||||||
Total | $ | - | $ | - | $ | 205,845 | $ | 205,845 | ||||||||
|
|
|
|
|
|
|
| |||||||||
The following table provides a reconciliation of the beginning and ending balances for investments that use Level 3 inputs for the year ended February 28, 2015 (dollars in thousands):
| Syndicated loans | First lien term loans | Second lien term loans | Unsecured notes | Structured finance securities | Common stock/ equities | Total | ||||||||||||||||||||||
Balance as of February 28, 2014 | $ | 32,390 | $ | 110,278 | $ | 27,804 | $ | 5,471 | $ | 19,570 | $ | 10,332 | $ | 205,845 | ||||||||||||||
Net unrealized gains (losses) | (763 | ) | (206 | ) | (409 | ) | (1,458 | ) | (1,936 | ) | 2,829 | (1,943 | ) | |||||||||||||||
Purchases and other adjustments to cost | 56 | 83,456 | 18,667 | 217 | - | 4,221 | 106,617 | |||||||||||||||||||||
Sales and redemptions | (13,461 | ) | (42,445 | ) | (10,522 | ) | - | (603 | ) | (6,226 | ) | (73,257 | ) | |||||||||||||||
Net realized gain from investments | 80 | 387 | 63 | - | - | 2,746 | 3,276 | |||||||||||||||||||||
Transfers In/Out | - | (6,263 | ) | - | - | - | 6,263 | - | ||||||||||||||||||||
|
|
|
|
|
|
|
|
|
|
|
|
|
| |||||||||||||||
Balance as of February 28, 2015 | $ | 18,302 | $ | 145,207 | $ | 35,603 | $ | 4,230 | $ | 17,031 | $ | 20,165 | $ | 240,538 | ||||||||||||||
|
|
|
|
|
|
|
|
|
|
|
|
|
| |||||||||||||||
Purchases and other adjustments to cost include purchases of new investments at cost, effects of refinancing/restructuring, accretion/amortization of income from discount/premium on debt securities, and PIK.
Sales and redemptions represent net proceeds received from investments sold, and principal paydowns received, during the period.
The net change in unrealized gain/(loss) for the year ended February 28, 2015 on investments held as of February 28, 2015 is ($1,456,791) and is included in net unrealized appreciation (depreciation) on investments in the consolidated statements of operations.
F-19
The following table provides a reconciliation of the beginning and ending balances for investments that use Level 3 inputs for the year ended February 28, 2014 (dollars in thousands):
| Syndicated loans | First lien term loans | Second lien term loans | Unsecured notes | Structured finance securities | Common stock/ equities | Total | ||||||||||||||||||||||
Balance as of February 28, 2013 | $ | - | $ | 107,097 | $ | 9,571 | $ | 4,874 | $ | 25,517 | $ | 8,021 | $ | 155,080 | ||||||||||||||
Net unrealized gains (losses) | 407 | (354 | ) | 165 | 207 | (3,558 | ) | 1,485 | (1,648 | ) | ||||||||||||||||||
Purchases and other adjustments to cost | 37,048 | 63,743 | 20,727 | 390 | - | 841 | 122,749 | |||||||||||||||||||||
Sales and redemptions | (5,138 | ) | (60,890 | ) | (3,030 | ) | - | (2,389 | ) | (160 | ) | (71,607 | ) | |||||||||||||||
Net realized gain (loss) from investments | 73 | 682 | 371 | - | - | 145 | 1,271 | |||||||||||||||||||||
|
|
|
|
|
|
|
|
|
|
|
|
|
| |||||||||||||||
Balance as of February 28, 2014 | $ | 32,390 | $ | 110,278 | $ | 27,804 | $ | 5,471 | $ | 19,570 | $ | 10,332 | $ | 205,845 | ||||||||||||||
|
|
|
|
|
|
|
|
|
|
|
|
|
| |||||||||||||||
Purchases and other adjustments to cost include purchases of new investments at cost, effects of refinancing/restructuring, accretion/amortization of income from discount/premium on debt securities, and PIK.
Sales and redemptions represent net proceeds received from investments sold, and principal paydowns received, during the period.
The net change in unrealized gain/(loss) for the year ended February 28, 2014 on investments held as of February 28, 2014 is $(1,767,285) and is included in net unrealized appreciation (depreciation) on investments in the consolidated statements of operations.
The valuation techniques and significant unobservable inputs used in recurring Level 3 fair value measurements of assets as of February 28, 2015 were as follows (dollars in thousands):
| Fair Value | Valuation Technique | Unobservable Input | Range | |||||||
Syndicated loans | 18,302 | Market Comparables | Third-Party Bid | 93.6% -100.4% | ||||||
First lien term loans | 145,206 | Market Comparables | Market Yield (%) | 5.8% - 17.7% | ||||||
| EBITDA Multiples (x) | 3.0x | |||||||||
| Third-Party Bid | 79.3 - 105.0 | |||||||||
Second lien term loans | 35,603 | Market Comparables | Market Yield (%) | 8.5% - 15.0% | ||||||
| Third-Party Bid | 98.3% - 98.3% | |||||||||
Unsecured notes | 4,230 | Market Comparables | Market Yield (%) | 13.2% - 20.3% | ||||||
Structured finance securities | 17,031 | Discounted Cash Flow | Discount Rate (%) | 12.0% | ||||||
Equity interests | 20,165 | Market Comparables | EBITDA Multiples (x) | 5.0x - 12.1x | ||||||
F-20
The valuation techniques and significant unobservable inputs used in recurring Level 3 fair value measurements of assets as of February 28, 2014 were as follows (dollars in thousands):
| Fair Value | Valuation Technique | Unobservable Input | Range | |||||||
Syndicated loans | $ | 32,390 | Market Comparables | Third-Party Bid | 99.5 - 100.6 | |||||
First lien term loans | 110,278 | Market Comparables | Market Yield (%) | 5.1% - 42.5% | ||||||
| EBITDA Multiples (x) | 3.0x - 5.0x | |||||||||
| Third-Party Bid | 83.3 - 107.5 | |||||||||
Second lien term loans | 27,804 | Market Comparables | Market Yield (%) | 9.6% - 12.5% | ||||||
| Third-Party Bid | 100.0 - 101.8 | |||||||||
Unsecured notes | 5,471 | Market Comparables | Market Yield (%) | 12.8% - 20.3% | ||||||
Structured finance securities | 19,570 | Discounted Cash Flow | Discount Rate (%) | 9.0% | ||||||
Equity interests | 10,332 | Market Comparables | EBITDA Multiples (x) | 6.3x - 12.0x | ||||||
For investments utilizing a market comparables valuation technique, a significant increase (decrease) in the market yield, in isolation, would result in a significantly lower (higher) fair value measurement, and a significant increase (decrease) in any of the EBITDA valuation multiples, in isolation, would result in a significantly higher (lower) fair value measurement. For investments utilizing a discounted cash flow valuation technique, a significant increase (decrease) in the discount rate, in isolation, would result in a significantly lower (higher) fair value measurement.
The composition of our investments as of February 28, 2015, at amortized cost and fair value were as follows (dollars in thousands):
| Investments at Amortized Cost | Amortized Cost Percentage of Total Portfolio | Investments at Fair Value | Fair Value Percentage of Total Portfolio | |||||||||||||
Syndicated loans | $ | 18,658 | 7.8 | % | $ | 18,302 | 7.6 | % | ||||||||
First lien term loans | 144,959 | 60.8 | 145,207 | 60.3 | ||||||||||||
Second lien term loans | 35,748 | 15.0 | 35,603 | 14.8 | ||||||||||||
Unsecured notes | 7,366 | 3.1 | 4,230 | 1.8 | ||||||||||||
Structured finance securities | 15,953 | 6.7 | 17,031 | 7.1 | ||||||||||||
Equity interest | 15,774 | 6.6 | 20,165 | 8.4 | ||||||||||||
|
|
|
|
|
|
|
| |||||||||
Total | $ | 238,458 | 100.0 | % | $ | 240,538 | 100.0 | % | ||||||||
|
|
|
|
|
|
|
| |||||||||
The composition of our investments as of February 28, 2014, at amortized cost and fair value were as follows (dollars in thousands):
| Investments at Amortized Cost | Amortized Cost Percentage of Total Portfolio | Investments at Fair Value | Fair Value Percentage of Total Portfolio | |||||||||||||
Syndicated loans | $ | 31,982 | 15.8 | % | $ | 32,390 | 15.7 | % | ||||||||
First lien term loans | 112,039 | 55.6 | 110,278 | 53.6 | ||||||||||||
Second lien term loans | 27,540 | 13.6 | 27,804 | 13.5 | ||||||||||||
Unsecured notes | 7,149 | 3.5 | 5,471 | 2.7 | ||||||||||||
Structured finance securities | 16,556 | 8.2 | 19,570 | 9.5 | ||||||||||||
Equity interest | 6,556 | 3.3 | 10,332 | 5.0 | ||||||||||||
|
|
|
|
|
|
|
| |||||||||
Total | $ | 201,822 | 100.0 | % | $ | 205,845 | 100.0 | % | ||||||||
|
|
|
|
|
|
|
| |||||||||
For loans and debt securities for which market quotations are not available, we determine their fair value based on third party indicative broker quotes, where available, or the assumptions that a hypothetical market participant would use to value the security in a current hypothetical sale using a market yield valuation methodology. In applying the market yield valuation methodology, we determine the fair value based on such factors as market participant assumptions including synthetic credit ratings, estimated remaining life, current market yield and interest rate spreads of similar securities as of the measurement date. If, in our judgment, the market yield methodology is not sufficient or appropriate, we may use additional methodologies such as an asset liquidation or expected recovery model.
F-21
For equity securities of portfolio companies and partnership interests, we determine the fair value based on the market approach with value then attributed to equity or equity like securities using the enterprise value waterfall valuation methodology. Under the enterprise value waterfall valuation methodology, we determine the enterprise fair value of the portfolio company and then waterfall the enterprise value over the portfolio company's securities in order of their preference relative to one another. To estimate the enterprise value of the portfolio company, we weigh some or all of the traditional market valuation methods and factors based on the individual circumstances of the portfolio company in order to estimate the enterprise value. The methodologies for performing investments may be based on, among other things: valuations of comparable public companies, recent sales of private and public comparable companies, discounting the forecasted cash flows of the portfolio company, third party valuations of the portfolio company, considering offers from third parties to buy the company, estimating the value to potential strategic buyers and considering the value of recent investments in the equity securities of the portfolio company. For non-performing investments, we may estimate the liquidation or collateral value of the portfolio company's assets and liabilities. We also take into account historical and anticipated financial results.
Our investment in Saratoga Investment Corp. CLO 2013-1, Ltd. ("Saratoga CLO") is carried at fair value, which is based on a discounted cash flow model that utilizes prepayment, re-investment and loss assumptions based on historical experience and projected performance, economic factors, the characteristics of the underlying cash flow, and comparable yields for equity interests in collateralized loan obligation funds similar to Saratoga CLO, when available, as determined by our Manager and recommended to our board of directors. Specifically, we use Intex cash flow models, or an appropriate substitute, to form the basis for the valuation of our investment in Saratoga CLO. The models use a set of assumptions including projected default rates, recovery rates, reinvestment rate and prepayment rates in order to arrive at estimated valuations. The assumptions are based on available market data and projections provided by third parties as well as management estimates. For the quarter ended November 30, 2013, in connection with the refinancing of the Saratoga CLO liabilities, we ran Intex models based on assumptions about the refinanced Saratoga CLO's structure, including capital structure, cost of liabilities and reinvestment period. We use the output from the Intex models (i.e., the estimated cash flows) to perform a discounted cash flows analysis on expected future cash flows to determine a valuation for our investment in Saratoga CLO at February 28, 2015. The significant inputs for the valuation model include:
| • | Default rates: 2.0% |
| • | Recovery rates: 35-75% |
| • | Prepayment rate: 25.0% |
| • | Reinvestment rate / price: L+375bps / $99.75 |
Note 4. Investment in Saratoga Investment Corp. CLO 2013-1, Ltd. ("Saratoga CLO")
On January 22, 2008, we invested $30 million in all of the outstanding subordinated notes of GSC Investment Corp. CLO 2007, Ltd., a collateralized loan obligation fund managed by us that invests primarily in senior secured loans. Additionally, we entered into a collateral management agreement with GSC Investment Corp. CLO 2007, Ltd. pursuant to which we act as collateral manager to it. The Saratoga CLO was refinanced in October 2013 and its reinvestment period ends in October 2016. The Saratoga CLO remains 100% owned and managed by Saratoga Investment Corp. We receive a base management fee of 0.25% and a subordinated management fee of 0.25% of the Fee Basis Amount at the beginning of the Collection Period, paid quarterly to the extent of available proceeds. We are also entitled to an incentive management fee equal to 20.0% of the remaining interest proceeds and principal proceeds, if any, after the subordinated notes have realized the incentive management fee target return of 12.0%, in accordance with the Priority of Payments after making the prior distributions on the relevant payment date. For the years ended February 28, 2015, February 28, 2014 and February 28, 2013, we accrued $1.5 million, $1.8 million, and $2.0 million in management fee income, respectively, and $2.7 million, $3.4 million, and $4.2 million in interest income, respectively, from Saratoga CLO. We did not accrue any amounts related to the incentive management fee as the 12.0% hurdle rate has not yet been achieved.
At February 28, 2015, the Company determined that the fair value of its investment in the subordinated notes of Saratoga CLO was $17.0 million. The Company determines the fair value of its investment in the subordinated notes of Saratoga CLO based on the present value of the projected future cash flows of the subordinated notes over the life of Saratoga CLO. At February 28, 2015, Saratoga CLO had investments with a principal balance of $296.9 million and a weighted average spread over LIBOR of 4.3%, and
F-22
had debt with a principal balance of $282.4 million with a weighted average spread over LIBOR of 1.8%. As a result, Saratoga CLO earns a "spread" between the interest income it receives on its investments and the interest expense it pays on its debt and other operating expenses, which is distributed quarterly to the Company as the holder of its subordinated notes. At February 28, 2015, the total "spread", or projected future cash flows of the subordinated notes, over the life of Saratoga CLO was $17.3 million, which had a present value of approximately $17.0 million, using a 12.0% discount rate.
At February 28, 2014, the Company determined that the fair value of its investment in the subordinated notes of Saratoga CLO was $19.6 million. The Company determines the fair value of its investment in the subordinated notes of Saratoga CLO based on the present value of the projected future cash flows of the subordinated notes over the life of Saratoga CLO. At February 28, 2014, Saratoga CLO had investments with a principal balance of $301.1 million and a weighted average spread over LIBOR of 1.8%, and had debt with a principal balance of $284.1 million with a weighted average spread over LIBOR of 1.8%. As a result, Saratoga CLO earns a "spread" between the interest income it receives on its investments and the interest expense it pays on its debt and other operating expenses, which is distributed quarterly to the Company as the holder of its subordinated notes. At February 28, 2014, the total "spread", or projected future cash flows of the subordinated notes, over the life of Saratoga CLO was $24.9 million, which had a present value of approximately $20.2 million, using a 9.0% discount rate.
The separate audited financial statements of Saratoga CLO as of February 28, 2015 and 2014, pursuant to Rule 3-09 of SEC rules Regulation S-X, and for the twelve months ended February 28, 2015, 2014 and 2013, are presented on page S-1.
Note 5. Income Taxes
The Company intends to operate so as to qualify to be taxed as a RIC under Subchapter M of the Code and, as such, will not be subject to federal income tax on the portion of taxable income and gains distributed to stockholders.
The Company owns 100.0% of Saratoga CLO, an exempted company incorporated in the Cayman Islands. For financial reporting purposes, the Saratoga CLO is not included as part of the consolidated financial statements. For federal income tax purposes, the Company has requested and received approval from the Internal Revenue Service to treat the Saratoga CLO as a disregarded entity. As such, for federal income tax purposes and for purposes of meeting the RIC qualification and diversification tests, the results of operations of the Saratoga CLO are included with those of the Company.
To qualify as a RIC, the Company is required to meet certain income and asset diversification tests in addition to distributing at least 90.0% of its investment company taxable income, as defined by the Code. Because federal income tax regulations differ from U.S. GAAP, distributions in accordance with tax regulations may differ from net investment income and realized gains recognized for financial reporting purposes. Differences may be permanent or temporary in nature. Permanent differences are reclassified among capital accounts in the financial statements to reflect their tax character. Differences in classification may also result from the treatment of short-term gains as ordinary income for tax purposes. As of February 28, 2015 and February 28, 2014, the Company reclassified for book purposes amounts arising from permanent book/tax differences primarily related to nondeductible excise tax, meals & entertainment, market discount, interest income with respect to the Saratoga CLO which is consolidated for tax purposes, and the tax character of distributions as follows (dollars in thousands):
| February 28, 2015 | February 28, 2014 | |||||||
Accumulated net investment income/(loss) | $ | (299 | ) | $ | (1,691 | ) | ||
Accumulated net realized gains (losses) on investments | 593 | 1,691 | ||||||
Additional paid-in-capital | (294 | ) | - | |||||
For income tax purposes, distributions paid to shareholders are reported as ordinary income, return of capital, long term capital gains or a combination thereof. The tax character of distributions paid for the years ended February 28, 2015 and February 28, 2014 was as follows (dollars in thousands):
| February 28, 2015 | February 28, 2014 | |||||||
Ordinary Income | $ | 2,157 | $ | 12,535 | ||||
Capital gains | - | - | ||||||
Return of capital | - | - | ||||||
|
|
|
| |||||
Total | $ | 2,157 | $ | 12,535 | ||||
|
|
|
| |||||
F-23
For federal income tax purposes, as of February 28, 2015, the aggregate net unrealized depreciation for all securities is $3.6 million. The aggregate cost of securities for federal income tax purposes is $522.4 million.
For federal income tax purposes, as of February 28, 2014, the aggregate net unrealized depreciation for all securities is $0.04 million. The aggregate cost of securities for federal income tax purposes is $486.8 million.
At February 28, 2015 and February 28, 2014, the components of accumulated losses on a tax basis as detailed below differ from the amounts reflected per the Company's consolidated statements of assets and liabilities by temporary book/tax differences primarily arising from the consolidation of the Saratoga CLO for tax purposes, market discount and original issue discount income, interest income accrual on defaulted bonds, write-off of investments, and amortization of organizational expenditures (dollars in thousands).
| February 28, 2015 | February 28, 2014 | |||||||
Post October loss deferred | $ | (27,303 | ) | $ | - | |||
Accumulated capital losses | (32,308 | ) | (64,101 | ) | ||||
Other temporary differences | (2,684 | ) | (304 | ) | ||||
Undistributed ordinary income | 10,578 | 963 | ||||||
Unrealized appreciation/(depreciation) | (3,662 | ) | (41 | ) | ||||
|
|
|
| |||||
Total components of accumulated losses | $ | (55,379 | ) | $ | (63,483 | ) | ||
|
|
|
| |||||
Capital losses incurred after October 31 ("post-October losses") within the taxable year are deemed to arise on the first business day of the Company's next taxable year. For the year ended February 28, 2015, the Company will elect to defer $27.3 million of current year post-October losses.
The Company has incurred capital losses of $19.3, $13.0 million for the years ended February 28, 2011 and 2010. Such capital losses will be available to offset future capital gains if any and if unused, will expire on February 28, 2019, 2018.
The Company utilized $4.3 million of capital loss carryovers and $27.4 million of Post RIC-modernization act capital loss carryovers.
At February 28, 2015 and February 28, 2014, the Company had a short term capital loss of $0 million and $11.2 million, respectively, and a long-term capital loss of $0 million and $16.3 million, respectively, available to offset future capital gains. Post RIC-modernization act losses are deemed to arise on the first day of the fund's following fiscal year and there is no expiration for these losses.
The Company is subject to a nondeductible U.S. federal excise tax of 4% on undistributed income if it does not distribute at least 98% of its ordinary income in any calendar year and 98.2% of its capital gain net income for each one-year period ending on October 31 of such calendar year. Depending on the level of Investment Company Taxable Income ("ICTI") earned in a tax year, the Company may choose to carry forward ICTI in excess of current year dividend distributions into the next tax year and pay a 4% excise tax on such income, as required. To the extent that the Company determines that its estimated current year annual taxable income will be in excess of estimated current year dividend distributions for excise tax purposes, the Company accrues excise tax, if any, on estimated excess taxable income as taxable income is earned. Any such carryover ICTI must be distributed before the end of that next tax year through a dividend declared prior to filing the final tax return related to the year which generated such ICTI. For the calendar year ended December 31, 2014, the Company did not distribute at least 98% of its ordinary income and 98.2% of its capital gains and subsequently paid $293,653 in federal excise taxes.
Management has analyzed the Company's tax positions taken on federal income tax returns for all open years (fiscal years 2011-2015), and has concluded that no provision for uncertain income tax positions is required in the Company's financial statements.
On December 22, 2010, the Regulated Investment Company Modernization Act of 2010 (the "Modernization Act") was enacted, and the provisions with the Modernization Act are effective for the Company for the year ended February 29, 2012. The Modernization Act is the first major piece of legislation affecting RICs since 1986 and it modernizes several of the federal income and excise tax provisions related to RICs. Some highlights of the enacted provisions are as follows:
New capital losses may now be carried forward indefinitely, and retain the character of the original loss. Under pre-enactment law, capital losses could be carried forward for eight years, and carried forward as short-term capital, irrespective of the character of the original loss.
F-24
The Modernization Act contains simplification provisions, which are aimed at preventing disqualification of a RIC for "inadvertent" failures of the asset diversification and/or qualifying income tests. Additionally, the Modernization Act exempts RICs from the preferential dividend rule, and repealed the 60-day designation requirement for certain types of pay-through income and gains.
Finally, the Modernization Act contains several provisions aimed at preserving the character of distributions made by a fiscal year RIC during the portion of its taxable year ending after October 31 or December 31, reducing the circumstances under which a RIC might be required to file amended Forms 1099 to restate previously reported distributions.
Note 6. Agreements and-Related Party Transactions
On July 30, 2010, the Company entered into the Management Agreement with our Manager. The initial term of the Management Agreement is two years, with automatic, one-year renewals at the end of each year subject to certain approvals by our board of directors and/or our stockholders. On July 10, 2014, our board of directors approved the renewal of the Management Agreement for an additional one-year term. Pursuant to the Management Agreement, our Manager implements our business strategy on a day-to-day basis and performs certain services for us, subject to oversight by our board of directors. Our Manager is responsible for, among other duties, determining investment criteria, sourcing, analyzing and executing investments transactions, asset sales, financings and performing asset management duties. Under the Management Agreement, we have agreed to pay our Manager a management fee for investment advisory and management services consisting of a base management fee and an incentive fee.
The base management fee of 1.75% is calculated based on the average value of our gross assets (other than cash or cash equivalents, but including assets purchased with borrowed funds) at the end of the two most recently completed fiscal quarters, and appropriately adjusted for any share issuances or repurchases during the applicable fiscal quarter.
The incentive fee consists of the following two parts:
The first, payable quarterly in arrears, equals 20.0% of our pre-incentive fee net investment income, expressed as a rate of return on the value of our net assets at the end of the immediately preceding quarter, that exceeds a 1.875% quarterly (7.5% annualized) hurdle rate measured as of the end of each fiscal quarter, subject to a "catch-up" provision. Under this provision, in any fiscal quarter, our Manager receives no incentive fee unless our pre-incentive fee net investment income exceeds the hurdle rate of 1.875%. Our Manager will receive 100.0% of pre-incentive fee net investment income, if any, that exceeds the hurdle rate but is less than or equal to 2.344% in any fiscal quarter (9.376% annualized); and 20.0% of the amount of the our pre-incentive fee net investment income, if any, that exceeds 2.344% in any fiscal quarter (9.376% annualized).
The second part of the incentive fee is determined and payable in arrears as of the end of each fiscal year (or upon termination of the Management Agreement) and equals 20.0% of our "incentive fee capital gains," which equals our realized capital gains on a cumulative basis from May 31, 2010 through the end of the year, if any, computed net of all realized capital losses and unrealized capital depreciation on a cumulative basis, less the aggregate amount of any previously paid capital gain incentive fee. Importantly, the capital gains portion of the incentive fee is based on realized gains and realized and unrealized losses from May 31, 2010. Therefore, realized and unrealized losses incurred prior to such time will not be taken into account when calculating the capital gains portion of the incentive fee, and our Manager will be entitled to 20.0% of incentive fee capital gains that arise after May 31, 2010. In addition, for the purpose of the "incentive fee capital gains" calculations, the cost basis for computing realized gains and losses on investments held by us as of May 31, 2010 will equal the fair value of such investments as of such date.
For the years ended February 28, 2015, February 28, 2014 and February 28, 2013, we incurred $4.2 million, $3.3 million and $2.1 million in base management fees, respectively. For the years ended February 28, 2015, February 28, 2014 and February 28, 2013, we incurred $2.2 million, $1.0 million and $1.0 million in incentive fees related to pre-incentive fee net investment income. For the year ended February 28, 2015, we accrued of $0.3 million in incentive fees related to capital gains. For the year ended February 28, 2014, there was a reduction of $0.1 million in incentive fees related to capital gains. For the year ended February 28, 2013, we accrued $1.6 million in incentive management fees related to capital gains. The accrual is calculated using both realized and unrealized capital gains for the period. The actual incentive fee related to capital gains will be determined and payable in arrears at the end of the fiscal year and will include only realized capital gains for the period. As of February 28, 2015, the base management fees accrual was $1.0 million and the incentive fees accrual was $4.8 million and is included in base management and incentive fees payable in the accompanying consolidated statements of assets and liabilities. As of February 28, 2014, the base management fees accrual was $0.9 million and the incentive fees accrual was $4.5 million and is included in base management and incentive fees payable in the accompanying consolidated statements of assets and liabilities.
On July 30, 2010, the Company entered into a separate administration agreement (the "Administration Agreement") with our Manager, pursuant to which our Manager, as our administrator, has agreed to furnish us with the facilities and administrative services
F-25
necessary to conduct our day-to-day operations and provide managerial assistance on our behalf to those portfolio companies to which we are required to provide such assistance. The initial term of the Administration Agreement is two years, with automatic, one-year renewals at the end of each year subject to certain approvals by our board of directors and/or our stockholders. The amount of expenses payable or reimbursable thereunder by the Company is capped at $1.0 million for the initial two year term of the administration agreement. On July 10, 2014, our board of directors approved the renewal of the Administration Agreement for an additional one-year term and determined to maintain the cap on the payment or reimbursement of expenses by the Company thereunder to $1.0 million for the additional one-year term.
For the years ended February 28, 2015, February 28, 2014 and February 28, 2013, we recognized $1.0 million, $1.0 million and $1.0 million, in administrator expenses for the periods, respectively, pertaining to bookkeeping, record keeping and other administrative services provided to us in addition to our allocable portion of rent and other overhead related expenses. As of February 28, 2015, $0.4 million of administrator expenses were accrued and included in due to manager in the accompanying consolidated statements of assets and liabilities. As of February 28, 2014, $0.4 million of administrator expenses were accrued and included in due to manager in the accompanying consolidated statements of assets and liabilities. For the years ended February 28, 2015, 2014 and 2013, the Company bought investments fair valued at $0.0 million, $0.3 million, and $0.0 million, respectively, from the Saratoga CLO and sold no investments to related parties.
Note 7. Borrowings
Credit Facility
As a BDC, we are only allowed to employ leverage to the extent that our asset coverage, as defined in the 1940 Act, equals at least 200.0% after giving effect to such leverage. The amount of leverage that we employ at any time depends on our assessment of the market and other factors at the time of any proposed borrowing.
On April 11, 2007, we entered into a $100.0 million revolving securitized credit facility (the "Revolving Facility"). On May 1, 2007, we entered into a $25.7 million term securitized credit facility (the "Term Facility" and, together with the Revolving Facility, the "Facilities"), which was fully drawn at closing. In December 2007, we consolidated the Facilities by using a draw under the Revolving Facility to repay the Term Facility. In response to the market wide decline in financial asset prices, which negatively affected the value of our portfolio, we terminated the revolving period of the Revolving Facility effective January 14, 2009 and commenced a two-year amortization period during which all principal proceeds from the collateral was used to repay outstanding borrowings. A significant percentage of our total assets had been pledged under the Revolving Facility to secure our obligations thereunder. Under the Revolving Facility, funds were borrowed from or through certain lenders and interest was payable monthly at the greater of the commercial paper rate and our lender's prime rate plus 4.00% plus a default rate of 2.00% or, if the commercial paper market was unavailable, the greater of the prevailing LIBOR rates and our lender's prime rate plus 6.00% plus a default rate of 3.00%.
In March 2009, we amended the Revolving Facility to increase the portion of the portfolio that could be invested in "CCC" rated investments in return for an increased interest rate and expedited amortization. As a result of these transactions, we expected to have additional cushion under our borrowing base under the Revolving Facility that would allow us to better manage our capital in times of declining asset prices and market dislocation.
On July 30, 2009, we exceeded the permissible borrowing limit under the Revolving Facility for 30 consecutive days, resulting in an event of default under the Revolving Facility. As a result of this event of default, our lender had the right to accelerate repayment of the outstanding indebtedness under the Revolving Facility and to foreclose and liquidate the collateral pledged thereunder. Acceleration of the outstanding indebtedness and/or liquidation of the collateral could have had a material adverse effect on our liquidity, financial condition and operations.
On July 30, 2010, we used the net proceeds from (i) the stock purchase transaction and (ii) a portion of the funds available to us under the $45.0 million senior secured revolving credit facility (the "Credit Facility") with Madison Capital Funding LLC, in each case, described in "Note 14. Recapitalization Transaction" below, to pay the full amount of principal and accrued interest, including default interest, outstanding under the Revolving Facility. As a result, the Revolving Facility was terminated in connection therewith. Substantially all of our total assets, other than those held by SBIC LP, have been pledged under the Credit Facility to secure our obligations thereunder.
On February 24, 2012, we amended our senior secured revolving credit facility with Madison Capital Funding LLC to, among other things:
| • | expand the borrowing capacity under the credit facility from $40.0 million to $45.0 million; |
F-26
| • | extend the period during which we may make and repay borrowings under the credit facility from July 30, 2013 to February 24, 2015 (the "Revolving Period"). The Revolving Period may upon the occurrence of an event of default, by action of the lenders or automatically. All borrowings and other amounts payable under the credit facility are due and payable five years after the end of the Revolving Period; and |
| • | remove the condition that we may not acquire additional loan assets without the prior written consent of Madison Capital Funding LLC. |
On September 17, 2014, we entered into a second amendment to the Revolving Facility with Madison Capital Funding LLC to, among other things:
| • | extend the commitment termination date from February 24, 2015 to September 17, 2017; |
| • | extend the maturity date of the Revolving Facility from February 24, 2020 to September 17, 2022 (unless terminated sooner upon certain events); |
| • | reduce the applicable margin rate on base rate borrowings from 4.50% to 3.75%, and on LIBOR borrowings from 5.50% to 4.75%; and |
| • | reduce the floor on base rate borrowings from 3.00% to 2.25%; and on LIBOR borrowings from 2.00% to 1.25%. |
As of February 28, 2015, there was $9.6 million outstanding under the Credit Facility and the Company was in compliance with all of the limitations and requirements of the Credit Facility. $2.7 million of financing costs related to the Credit Facility have been capitalized and are being amortized over the term of the facility. For the years ended February 28, 2015, February 28, 2014 and February 28, 2013, we recorded $0.9 million, $1.0 million and $2.0 million of interest expense, respectively. For the years ended February 28, 2015, February 28, 2014 and February 28, 2013, we recorded $0.3 million, $0.4 million and $0.4 million of amortization of deferred financing costs related to the Credit Facility and Revolving Facility, respectively. The interest rates during the years ended February 28, 2015, February 28, 2014 and February 28, 2013 on the outstanding borrowings under the Credit Facility were 6.00%, 7.50% and 7.50%, respectively.
The Credit Facility contains limitations as to how borrowed funds may be used, such as restrictions on industry concentrations, asset size, weighted average life, currency denomination and collateral interests. The Credit Facility also includes certain requirements relating to portfolio performance, the violation of which could result in the limit of further advances and, in some cases, result in an event of default, allowing the lenders to accelerate repayment of amounts owed thereunder. The Credit Facility has an eight year term, consisting of a three year period (the "Revolving Period"), under which the Company may make and repay borrowings, and a final maturity five years from the end of the Revolving Period. Availability on the Credit Facility will be subject to a borrowing base calculation, based on, among other things, applicable advance rates (which vary from 50.0% to 75.0% of par or fair value depending on the type of loan asset) and the value of certain "eligible" loan assets included as part of the Borrowing Base. Funds may be borrowed at the greater of the prevailing LIBOR rate and 2.00%, plus an applicable margin of 5.50%. At the Company's option, funds may be borrowed based on an alternative base rate, which in no event will be less than 3.00%, and the applicable margin over such alternative base rate is 4.50%. In addition, the Company will pay the lenders a commitment fee of 0.75% per year on the unused amount of the Credit Facility for the duration of the Revolving Period.
Our borrowing base under the Credit Facility was $36.3 million subject to the Credit Facility cap of $45.0 million at February 28, 2015. For purposes of determining the borrowing base, most assets are assigned the values set forth in our most recent Annual Report on Form 10-K or Quarterly Report on Form 10-Q filed with the SEC. Accordingly, the February 28, 2015 borrowing base relies upon the valuations set forth in the Quarterly Report on Form 10-Q for the quarter ended November 30, 2014. The valuations presented in this Annual Report on Form 10-K will not be incorporated into the borrowing base until after this Annual Report on Form 10-K is filed with the SEC.
SBA Debentures
SBIC LP is able to borrow funds from the SBA against regulatory capital (which approximates equity capital) that is paid in and is subject to customary regulatory requirements including but not limited to an examination by the SBA. As of February 28, 2015, we have funded SBIC LP with $59.3 million of equity capital, and have $79.0 million of SBA-guaranteed debentures outstanding. SBA debentures are non-recourse to us, have a 10-year maturity, and may be prepaid at any time without penalty. The interest rate of SBA debentures is fixed at the time of issuance, often referred to as pooling, at a market-driven spread over 10-year U.S. Treasury Notes. SBA current regulations limit the amount that SBIC LP may borrow to a maximum of $150.0 million, which is up to twice its potential regulatory capital.
F-27
SBICs are designed to stimulate the flow of private equity capital to eligible small businesses. Under SBA regulations, SBICs may make loans to eligible small businesses and invest in the equity securities of small businesses. Under present SBA regulations, eligible small businesses include businesses that have a tangible net worth not exceeding $19.5 million and have average annual fully taxed net income not exceeding $6.5 million for the two most recent fiscal years. In addition, an SBIC must devote 25.0% of its investment activity to ‘‘smaller'' concerns as defined by the SBA. A smaller concern is one that has a tangible net worth not exceeding $6.0 million and has average annual fully taxed net income not exceeding $2.0 million for the two most recent fiscal years. SBA regulations also provide alternative size standard criteria to determine eligibility, which depend on the industry in which the business is engaged and are based on such factors as the number of employees and gross sales. According to SBA regulations, SBICs may make long-term loans to small businesses, invest in the equity securities of such businesses and provide them with consulting and advisory services.
SBIC LP is subject to regulation and oversight by the SBA, including requirements with respect to maintaining certain minimum financial ratios and other covenants. Receipt of an SBIC license does not assure that SBIC LP will receive SBA guaranteed debenture funding, which is dependent upon SBIC LP continuing to be in compliance with SBA regulations and policies. The SBA, as a creditor, will have a superior claim to SBIC LP's assets over our stockholders and debtholders in the event we liquidate SBIC LP or the SBA exercises its remedies under the SBA-guaranteed debentures issued by SBIC LP upon an event of default.
The Company received exemptive relief from the Securities and Exchange Commission to permit it to exclude the debt of SBIC LP guaranteed by the SBA from the definition of senior securities in the 200.0% asset coverage test under the 1940 Act. This allows the Company increased flexibility under the 200.0% asset coverage test by permitting it to borrow up to $150.0 million more than it would otherwise be able to absent the receipt of this exemptive relief.
As of February 28, 2015 and February 28, 2014, there was $79.0 million and $50.0 million outstanding of SBA debentures, respectively. The carrying amount of the amount outstanding of SBA debentures approximates its fair value. $3.0 million of financing costs related to the SBA debentures have been capitalized and are being amortized over the term of the commitment and drawdown. For the years ended February 28, 2015 and February 28, 2014, we recorded $2.0 million and $1.3 million of interest expense related to the SBA debentures, respectively. For the years ended February 28, 2015 and February 28, 2014, we recorded $0.3 million and $0.2 million of amortization of deferred financing costs related to the SBA debentures, respectively. The weighted average interest rate during the years ended February 28, 2015 and February 28, 2014 on the outstanding borrowings of the SBA debentures was 2.93% and 3.03%, respectively.
Notes
On May 10, 2013, the Company issued $42.0 million in aggregate principal amount of 7.50% fixed-rate notes due 2020 (the "Notes"). The Notes will mature on May 31, 2020, and may be redeemed in whole or in part at any time or from time to time at the Company's option on or after May 31, 2016. Interest will be payable quarterly beginning August 15, 2013.
On May 17, 2013, the Company closed an additional $6.3 million in aggregate principal amount of the Notes, pursuant to the full exercise of the underwriters' option to purchase additional Notes.
As of February 28, 2015, the carrying amount and fair value of the Notes was $48.3 million and $49.8 million, respectively. The fair value of the Notes, which are publicly traded, is based upon closing market quotes as of the measurement date and would be classified as a level 1 liability within the fair value hierarchy. As of February 28, 2015, $2.5 million of financing costs related to the Notes have been capitalized and are being amortized over the term of the Notes. For the year ended February 28, 2015, we recorded $3.6 million of interest expense and $0.3 million of amortization of deferred financing costs related to the Notes.
Note 8. Commitments and contingencies
Contractual obligations
The following table shows our payment obligations for repayment of debt and other contractual obligations at February 28, 2015:
| Payment Due by Period | |||||||||||||||||||
| Total | Less Than 1 Year | 1 - 3 Years | 3 - 5 Years | More Than 5 Years | ||||||||||||||||
| ($ in thousands) | ||||||||||||||||||||
Long-Term Debt Obligations | $ | 136,900 | $ | - | $ | - | $ | - | $ | 136,900 | ||||||||||
|
|
|
|
|
|
|
|
|
| |||||||||||
F-28
Off-balance sheet arrangements
The Company's off-balance sheet arrangements consisted of $11.2 million and $12.2 million of unfunded commitments to provide debt financing to its portfolio companies or to fund limited partnership interests as of February 28, 2015 and 2014, respectively. Such commitments are generally up to the Company's discretion to approve, or the satisfaction of certain financial and nonfinancial covenants and involve, to varying degrees, elements of credit risk in excess of the amount recognized in the Company's Consolidated Statement of Assets and Liabilities and are not reflected in the Company's Consolidated Statements of Assets and Liabilities.
A summary of the composition of the unfunded commitments as of February 28, 2015 and 2014 is shown in the table below (dollars in thousands):
| As of | ||||||||
| February 28, 2015 | February 28, 2014 | |||||||
Bristol Hospice, LLC | $ | 7,500 | $ | 7,500 | ||||
HMN Holdco, LLC | 2,400 | - | ||||||
Avionte Holdings, LLC | 1,000 | 1,000 | ||||||
Knowland Technology Holdings, L.L.C. | 300 | - | ||||||
Easy Ice, LLC | - | 3,000 | ||||||
Oceans Acquisition, Inc. | - | 500 | ||||||
Community Investors, Inc. | - | 167 | ||||||
|
|
|
| |||||
Total | $ | 11,200 | $ | 12,167 | ||||
|
|
|
| |||||
Note 9. Directors Fees
The independent directors receive an annual fee of $40,000. They also receive $2,500 plus reimbursement of reasonable out-of-pocket expenses incurred in connection with attending each board meeting and receive $1,000 plus reimbursement of reasonable out-of-pocket expenses incurred in connection with attending each committee meeting. In addition, the chairman of the Audit Committee receives an annual fee of $5,000 and the chairman of each other committee receives an annual fee of $2,000 for their additional services in these capacities. In addition, we have purchased directors' and officers' liability insurance on behalf of our directors and officers. Independent directors have the option to receive their directors' fees in the form of our common stock issued at a price per share equal to the greater of net asset value or the market price at the time of payment. No compensation is paid to directors who are "interested persons" of the Company (as such term is defined in the 1940 Act). For the years ended February 28, 2015, February 28, 2014, and February 28, 2013, we accrued $0.2 million, $0.2 million, and $0.2 million for directors' fees expense, respectively. As of February 28, 2015 and February 28, 2014, $0.02 million and $0.05 million in directors' fees expense were unpaid and included in accounts payable and accrued expenses in the consolidated statements of assets and liabilities. As of February 28, 2015, we had not issued any common stock to our directors as compensation for their services.
Note 10. Stockholders' Equity
On May 16, 2006, GSC Group, Inc. capitalized the LLC, by contributing $1,000 in exchange for 67 shares, constituting all of the issued and outstanding shares of the LLC.
On March 20, 2007, the Company issued 95,995.5 and 8,136.2 shares of common stock, priced at $150.00 per share, to GSC Group and certain individual employees of GSC Group, respectively, in exchange for the general partnership interest and a limited partnership interest in GSC Partners CDO III GP, LP, collectively valued at $15.6 million. At this time, the 6.7 shares owned by GSC Group in the LLC were exchanged for 6.7 shares of the Company.
On March 28, 2007, the Company completed its IPO of 725,000 shares of common stock, priced at $150.00 per share, before underwriting discounts and commissions. Total proceeds received from the IPO, net of $7.1 million in underwriter's discount and commissions, and $1.0 million in offering costs, were $100.7 million.
On November 13, 2009, we declared a dividend of $18.25 per share payable on December 31, 2009. Shareholders had the option to receive payment of the dividend in cash, shares of common stock, or a combination of cash and shares of common stock, provided that the aggregate cash payable to all shareholders was limited to $2.1 million or $2.50 per share. Based on shareholder elections, the dividend consisted of $2.1 million in cash and 864,872.5 of newly issued shares of common stock.
F-29
On July 30, 2010, our Manager and its affiliates purchased 986,842 shares of common stock at $15.20 per share. Total proceeds received from this sale were $15.0 million. See "Note 14. Recapitalization Transaction."
On August 12, 2010, we effected a one-for-ten reverse stock split of our outstanding common stock. As a result of the reverse stock split, every ten shares of our common stock were converted into one share of our common stock. Any fractional shares received as a result of the reverse stock split were redeemed for cash. The total cash payment in lieu of shares was $230. Immediately after the reverse stock split, we had 2,680,842 shares of our common stock outstanding.
On November 12, 2010, we declared a dividend of $4.40 per share payable on December 29, 2010. Shareholders had the option to receive payment of the dividend in cash, shares of common stock, or a combination of cash and shares of common stock, provided that the aggregate cash payable to all shareholders was limited to approximately $1.2 million or $0.44 per share. Based on shareholder elections, the dividend consisted of approximately $1.2 million in cash and 596,235 shares of common stock.
On November 15, 2011, we declared a dividend of $3.00 per share payable on December 30, 2011. Shareholders had the option to receive payment of the dividend in cash, shares of common stock, or a combination of cash and shares of common stock, provided that the aggregate cash payable to all shareholders was limited to approximately $2.0 million or $0.60 per share. Based on shareholder elections, the dividend consisted of approximately $2.0 million in cash and 599,584 shares of common stock.
On November 9, 2012, the Company declared a dividend of $4.25 per share payable on December 31, 2012. Shareholders had the option to receive payment of the dividend in cash, shares of common stock, or a combination of cash and shares of common stock, provided that the aggregate cash payable to all shareholders was limited to approximately $3.3 million or $0.85 per share. Based on shareholder elections, the dividend consisted of approximately $3.3 million in cash and 853,455 shares of common stock.
On October 30, 2013, the Company declared a dividend of $2.65 per share payable on December 27, 2013. Shareholders had the option to receive payment of the dividend in cash, shares of common stock, or a combination of cash and shares of common stock, provided that the aggregate cash payable to all shareholders was limited to approximately $2.5 million or $0.53 per share. Based on shareholder elections, the dividend consisted of approximately $2.5 million in cash and 649,500 shares of common stock.
On September 24, 2014, the Company declared a dividend of $0.18 per share payable on November 28, 2014. Shareholders had the option to receive payment of the dividend in cash, or receive shares of common stock pursuant to the Company's DRIP. Based on shareholder elections, the dividend consisted of approximately $0.6 million in cash and 22,283 newly issued shares of common stock.
On September 24, 2014, the Company declared a dividend of $0.22 per share payable on February 27, 2015. Shareholders have the option to receive payment of the dividend in cash, or receive shares of common stock, pursuant our DRIP. Based on shareholder elections, the dividend consisted of approximately $0.8 million in cash and 26,858 newly issued shares of common stock.
On September 24, 2014, the Company announced the approval of an open market share repurchase plan that allows it to repurchase up to 200,000 shares of its common stock at prices below its NAV as reported in its then most recently published financial statements. As of February 28, 2015, the Company had not purchased any shares of common stock pursuant to this repurchase plan.
Note 11. Earnings Per Share
In accordance with the provisions of FASB ASC 260, "Earnings per Share" ("ASC 260"), basic earnings per share is computed by dividing earnings available to common shareholders by the weighted average number of shares outstanding during the period. Other potentially dilutive common shares, and the related impact to earnings, are considered when calculating earnings per share on a diluted basis.
The following information sets forth the computation of the weighted average basic and diluted net decrease in net assets per share from operations for the years ended February 28, 2015, February 28, 2014, and February 28, 2013 (dollars in thousands except share and per share amounts):
Basic and diluted | February 28, 2015 | February 28, 2014 | February 28, 2013 | |||||||||
Net increase in net assets from operations | $ | 11,007 | $ | 8,497 | $ | 14,044 | ||||||
Weighted average common shares outstanding | 5,385,049 | 4,920,517 | 4,110,484 | |||||||||
Earnings per common share-basic and diluted | $ | 2.04 | $ | 1.73 | $ | 3.42 | ||||||
F-30
Note 12. Dividend
On September 24, 2014, the Company declared a dividend of $0.22 per share payable on February 27, 2015. Shareholders have the option to receive payment of the dividend in cash, or receive shares of common stock pursuant to the Company's DRIP. Based on shareholder elections, the dividend consisted of approximately $0.8 million in cash and 26,858 newly issued shares of common stock, or 0.5% of our outstanding common stock prior to the dividend payment. The number of shares of common stock comprising the stock portion was calculated based on a price of $14.97 per share, which equaled the volume weighted average trading price per share of the common stock on February 13, 17, 18, 19, 20, 23, 24, 25, 26 and 27, 2015.
On September 24, 2014, the Company declared a dividend of $0.18 per share payable on November 28, 2014. Shareholders had the option to receive payment of the dividend in cash, or receive shares of common stock pursuant to the Company's DRIP. Based on shareholder elections, the dividend consisted of approximately $0.6 million in cash and 22,283 newly issued shares of common stock, or 0.4% of our outstanding common stock prior to the dividend payment. The number of shares of common stock comprising the stock portion was calculated based on a price of $14.37 per share, which equaled the volume weighted average trading price per share of the common stock on November 14, 17, 18, 19, 20, 21, 24, 25, 26 and 28, 2014.
On October 30, 2013, the Company declared a dividend of $2.65 per share payable on December 27, 2013. Shareholders had the option to receive payment of the dividend in cash, shares of common stock, or a combination of cash and shares of common stock, provided that the aggregate cash payable to all shareholders was limited to approximately $2.5 million or $0.53 per share. This dividend was declared in reliance on certain private letter rulings issued by the IRS concluding that a RIC may treat a distribution of its own stock as fulfilling its RIC distribution requirements if each stockholder may elect to receive his or her entire distribution in either cash or stock of the RIC subject to a limitation on the aggregate amount of cash to be distributed to all stockholders, which limitation must be at least 20.0% of the aggregate declared distribution.
Based on shareholder elections, the dividend consisted of approximately $2.5 million in cash and 649,500 shares of common stock, or 13.7% of our outstanding common stock prior to the dividend payment. The number of shares of common stock comprising the stock portion was calculated based on a price of $15.439 per share, which equaled the volume weighted average trading price per share of the common stock on December 11, 13, and 16, 2013.
On November 9, 2012, the Company declared a dividend of $4.25 per share payable on December 31, 2012. Shareholders had the option to receive payment of the dividend in cash, shares of common stock, or a combination of cash and shares of common stock, provided that the aggregate cash payable to all shareholders was limited to approximately $3.3 million or $0.85 per share.
Based on shareholder elections, the dividend consisted of approximately $3.3 million in cash and 853,455 shares of common stock, or 22.0% of our outstanding common stock prior to the dividend payment. The amount of cash elected to be received was greater than the cash limit of 20.0% of the aggregate dividend amount, thus resulting in the payment of a combination of cash and stock to shareholders who elected to receive cash. The number of shares of common stock comprising the stock portion was calculated based on a price of $15.444 per share, which equaled the volume weighted average trading price per share of the common stock on December 14, 17, and 19, 2012.
On November 15, 2011, we declared a dividend of $3.00 per share payable on December 30, 2011. Shareholders had the option to receive payment of the dividend in cash, shares of common stock, or a combination of cash and shares of common stock, provided that the aggregate cash payable to all shareholders was limited to approximately $2.0 million or $0.60 per share.
Based on shareholder elections, the dividend consisted of approximately $2.0 million in cash and 599,584 shares of common stock, or 18.0% of our outstanding common stock prior to the dividend payment. The amount of cash elected to be received was greater than the cash limit of 20.0% of the aggregate dividend amount, thus resulting in the payment of a combination of cash and stock to shareholders who elected to receive cash. The number of shares of common stock comprising the stock portion was calculated based on a price of $13.1171 per share, which equaled the volume weighted average trading price per share of the common stock on December 20, 21 and 22, 2011.
On November 12, 2010, we declared a dividend of $4.40 per share payable on December 23, 2010. Shareholders had the option to receive payment of the dividend in cash, shares of common stock, or a combination of cash and shares of common stock, provided that the aggregate cash payable to all shareholders was limited to approximately $1.2 million or $0.44 per share.
Based on shareholder elections, the dividend consisted of approximately $1.2 million in cash and 596,235 shares of common stock, or 22.0% of our outstanding common stock prior to the dividend payment. The amount of cash elected to be received was greater than the cash limit of 10.0% of the aggregate dividend amount, thus resulting in the payment of a combination of cash and stock to shareholders who elected to receive cash. The number of shares of common stock comprising the stock portion was calculated based on a price of $17.8049 per share, which equaled the volume weighted average trading price per share of the common stock on December 20, 21 and 22, 2010. The financial statements for the period ended November 30, 2010 have been retroactively adjusted to reflect the increase in common stock as a result of the dividend in accordance with the provisions of ASC 505-20-S50 regarding disclosure of a capital structure change after the interim balance sheet but before the release of the financial statements.
F-31
The following tables summarize dividends declared during the years ended February 28, 2015, February 28, 2014, February 28, 2013, February 29, 2012 and February 28, 2011 (dollars in thousands except per share amounts):
Date Declared | Record Date | Payment Date | Amount Per Share* | Total Amount | ||||||||
September 24, 2014 | October 30, 2014 | November 28, 2014 | $ | 0.18 | $ | 968 | ||||||
September 24, 2014 | January 29, 2015 | February 27, 2015 | $ | 0.22 | $ | 1,189 | ||||||
|
|
|
| |||||||||
Total dividends declared | $ | 0.40 | $ | 2,157 | ||||||||
|
|
|
| |||||||||
Date Declared | Record Date | Payment Date | Amount Per Share* | Total Amount | ||||||||
October 30, 2013 | November 13, 2013 | December 27, 2013 | $ | 2.65 | $ | 12,535 | ||||||
|
|
|
| |||||||||
Total dividends declared | $ | 2.65 | $ | 12,535 | ||||||||
|
|
|
| |||||||||
Date Declared | Record Date | Payment Date | Amount Per Share* | Total Amount | ||||||||
November 9, 2012 | November 20, 2012 | December 31, 2012 | $ | 4.25 | $ | 16,476 | ||||||
|
|
|
| |||||||||
Total dividends declared | $ | 4.25 | $ | 16,476 | ||||||||
|
|
|
| |||||||||
Date Declared | Record Date | Payment Date | Amount Per Share* | Total Amount | ||||||||
November 15, 2011 | November 25, 2011 | December 30, 2011 | $ | 3.00 | $ | 9,831 | ||||||
|
|
|
| |||||||||
Total dividends declared | $ | 3.00 | $ | 9,831 | ||||||||
|
|
|
| |||||||||
Date Declared | Record Date | Payment Date | Amount Per Share* | Total Amount | ||||||||
November 12, 2010 | November 19, 2010 | December 29, 2010 | $ | 4.40 | $ | 11,796 | ||||||
|
|
|
| |||||||||
Total dividends declared | $ | 4.40 | $ | 11,796 | ||||||||
|
|
|
| |||||||||
| * | Amount per share is calculated based on the number of shares outstanding at the date of declaration. |
F-32
Note 13. Financial Highlights –
The following is a schedule of financial highlights for the years ended February 28, 2015, February 28, 2014, February 28, 2013, February 29, 2012, and February 28, 2011:
| February 28, 2015 | February 28, 2014 | February 28, 2013 | February 29, 2012 | February 28, 2011 | ||||||||||||||||
Per share data: | ||||||||||||||||||||
Net asset value at beginning of period | $ | 21.08 | $ | 22.71 | $ | 24.94 | $ | 26.20 | $ | 32.75 | ||||||||||
Net investment income(1) | 1.80 | 1.80 | 1.57 | 1.52 | 2.06 | |||||||||||||||
Net realized and unrealized gains and losses on investments and derivatives | 0.24 | (0.07 | ) | 1.85 | 2.21 | 4.80 | ||||||||||||||
|
|
|
|
|
|
|
|
|
| |||||||||||
Net increase in net assets from operations | 2.04 | 1.73 | 3.42 | 3.73 | 6.86 | |||||||||||||||
Distributions declared from net investment income | (0.40 | ) | (2.65 | ) | (4.25 | ) | (3.00 | ) | (4.40 | ) | ||||||||||
Distributions declared from net realized capital gains | - | - | - | - | - | |||||||||||||||
|
|
|
|
|
|
|
|
|
| |||||||||||
Total distributions to stockholders | (0.40 | ) | (2.65 | ) | (4.25 | ) | (3.00 | ) | (4.40 | ) | ||||||||||
Other(5) | (0.02 | ) | (0.71 | ) | (1.40 | ) | (1.99 | ) | (9.01 | ) | ||||||||||
Net asset value at end of period | $ | 22.70 | $ | 21. 08 | $ | 22.71 | $ | 24.94 | $ | 26.20 | ||||||||||
Net assets at end of period | $ | 122,598,742 | $ | 113,427,929 | $ | 107,437,874 | $ | 96,689,122 | $ | 85,844,605 | ||||||||||
Shares outstanding at end of period | 5,401,899 | 5,379,616 | 4,730,116 | 3,876,661 | 3,277,077 | |||||||||||||||
Per share market value at end of period | $ | 15.76 | $ | 15.85 | $ | 17.02 | $ | 15.88 | $ | 17.58 | ||||||||||
Total return based on market value(2) | 1.63 | % | 9.11 | % | 36.67 | % | 12.82 | % | 38.25 | % | ||||||||||
Total return based on net asset value(3) | 10.09 | % | 8.75 | % | 16.12 | % | 16.98 | % | (0.07 | )% | ||||||||||
Ratio/Supplemental data: | ||||||||||||||||||||
Ratio of net investment income to average, net assets(4) | 8.11 | % | 7.97 | % | 6.26 | % | 5.64 | % | 6.58 | % | ||||||||||
Ratio of operating expenses to average net assets(4) | 6.52 | % | 6.28 | % | 5.22 | % | 5.66 | % | 12.02 | % | ||||||||||
Ratio of incentive management fees to average net assets | 2.14 | % | 0.84 | % | 2.52 | % | 1.85 | % | 2.75 | % | ||||||||||
Ratio of credit facility related expenses to average net assets | 6.19 | % | 5.46 | % | 2.46 | % | 1.40 | % | 3.42 | % | ||||||||||
Ratio of total expenses to average net assets(4) | 14.85 | % | 12.59 | % | 10.19 | % | 8.91 | % | 11.99 | % | ||||||||||
Portfolio turnover rate(6) | 31.28 | % | 37.82 | % | 17.30 | % | 36.34 | % | 10.14 | % | ||||||||||
As described in Note 2 to the consolidated financial statements and notes thereto, we identified errors that impacted the years ended February 28, 2014, February 28, 2013, February 29, 2012 and February 28, 2011. The corrections for the errors, which we have concluded are immaterial to all prior period consolidated financial statements, are reflected in the consolidated financial statements and selected financial data included in this Form 10-K.
| (1) | Net investment income per share is calculated using the weighted average shares outstanding during the period. Net investment income excluding expense waiver and reimbursement equals $2.05 per share for the year ended February 28, 2011. |
| (2) | Total investment return is calculated assuming a purchase of common shares at the current market value on the first day and a sale at the current market value on the last day of the periods reported. Dividends and distributions, if any, are assumed for purposes of this calculation to be reinvested at prices obtained under the Company's dividend reinvestment plan. Total investment return does not reflect brokerage commissions. Total investment returns covering less than a full period are not annualized. |
F-33
| (3) | Total investment return is calculated assuming a purchase of common shares at the current net asset value on the first day and a sale at the current net asset value on the last day of the periods reported. Dividends and distributions, if any, are assumed for purposes of this calculation to be reinvested at prices obtained under the Company's dividend reinvestment plan. Total investment return does not reflect brokerage commissions. |
| (4) | For the year ended February 28, 2011, net of the expense waiver and reimbursement arrangement, the ratio of net investment income, operating expenses, total expenses to average net assets is 6.24%, 12.36%, and 12.33%, respectively. |
| (5) | Represents the dilutive effect of issuing common stock below net asset value per share during the period in connection with the satisfaction of the Company's annual RIC distribution requirement. See Note 12, Dividend. |
| (6) | Portfolio turnover rate is calculated using the lesser of year-to-date sales or year-to-date purchases over the average of the invested assets at fair value. |
Note 14. Selected Quarterly Data (Unaudited)
| 2015 | ||||||||||||||||
($ in thousands, except per share numbers) | Qtr 4 | Qtr 3 | Qtr 2 | Qtr 1 | ||||||||||||
Interest and related portfolio income | $ | 7,451 | $ | 7,305 | $ | 6,475 | $ | 6,144 | ||||||||
Net investment income | 2,889 | 2,629 | 2,093 | 2,063 | ||||||||||||
Net realized and unrealized gain (loss) | (184 | ) | 756 | 1,064 | (303 | ) | ||||||||||
Net increase in net assets resulting from operations | 2,705 | 3,385 | 3,157 | 1,760 | ||||||||||||
Net investment income per common share at end of each quarter | $ | 0.50 | $ | 0.49 | $ | 0.39 | $ | 0.38 | ||||||||
Net realized and unrealized gain (loss) per common share at end of each quarter | $ | (0.03 | ) | $ | 0.14 | $ | 0.20 | $ | (0.06 | ) | ||||||
Dividends declared per common share | $ | 0.22 | $ | 0.18 | $ | - | $ | - | ||||||||
Net asset value per common share | $ | 22.70 | $ | 22.45 | $ | 22.00 | $ | 21.41 | ||||||||
| 2014 | ||||||||||||||||
($ in thousands, except per share numbers) | Qtr 4 | Qtr 3 | Qtr 2 | Qtr 1 | ||||||||||||
Interest and related portfolio income | $ | 5,687 | $ | 5,801 | $ | 5,388 | $ | 6,018 | ||||||||
Net investment income | 1,525 | 2,407 | 2,629 | 2,313 | ||||||||||||
Net realized and unrealized gain (loss) | 2,236 | (1,630 | ) | (2,313 | ) | 1,330 | ||||||||||
Net increase (decrease) in net assets resulting from operations | 3,761 | 777 | 316 | 3,644 | ||||||||||||
Net investment income per common share at end of each quarter | $ | 0.28 | $ | 0.50 | $ | 0.56 | $ | 0.49 | ||||||||
Net realized and unrealized gain (loss) per common share at end of each quarter | $ | 0.42 | $ | (0.34 | ) | $ | (0.49 | ) | $ | 0.28 | ||||||
Dividends declared per common share | $ | - | $ | 2.65 | $ | - | $ | - | ||||||||
Net asset value per common share | $ | 21.08 | $ | 20.39 | $ | 23.55 | $ | 23.48 | ||||||||
| 2013 | ||||||||||||||||
($ in thousands, except per share numbers) | Qtr 4 | Qtr 3 | Qtr 2 | Qtr 1 | ||||||||||||
Interest and related portfolio income | $ | 5,191 | $ | 4,034 | $ | 4,163 | $ | 3,619 | ||||||||
Net investment income | 1,779 | 2,343 | 1,179 | 1,169 | ||||||||||||
Net realized and unrealized gain (loss) | 3,843 | (1,744 | ) | 3,557 | 1,918 | |||||||||||
Net increase in net assets resulting from operations | 5,623 | 599 | 4,735 | 3,087 | ||||||||||||
Net investment income per common share at end of each quarter | $ | 0.38 | $ | 0.59 | $ | 0.30 | $ | 0.30 | ||||||||
Net realized and unrealized gain (loss) per common share at end of each quarter | $ | 0.81 | $ | (0.44 | ) | $ | 0.92 | $ | 0.49 | |||||||
Dividends declared per common share | $ | - | $ | 4.25 | $ | - | $ | - | ||||||||
Net asset value per common share | $ | 22.71 | $ | 21.52 | $ | 26.96 | $ | 25.74 | ||||||||
F-34
As described in Note 2 to the consolidated financial statements and notes thereto, we identified errors that impacted the years ended February 28, 2014, February 28, 2013, February 29, 2012 and February 28, 2011. The corrections for the errors, which we have concluded are immaterial to all prior period consolidated financial statements, are reflected in the consolidated financial statements and selected financial data included in this Form 10-K.
Note 15. Subsequent Events
On May 14, 2015, the Company announced that its Board of Directors has declared a special dividend to shareholders of $1.00 per share, payable on June 5, 2015 to all stockholders of record at the close of business on May 26, 2015. Shareholders will have the option to receive payment of the dividend in cash, or receive shares of common stock pursuant to the Company's DRIP.
On April 9, 2015, the Company declared a dividend of $0.27 per share payable for the fiscal quarter ended February 28, 2015, payable on May 29, 2015 to all stockholders of record at the close of business on May 4, 2015. Shareholders will have the option to receive payment of the dividend in cash, or receive shares of common stock pursuant to the Company's dividend reinvestment plan.
On April 2, 2015, the SBA issued a "green light" or "go forth" letter inviting us to continue our application process to obtain a license to form and operate its second SBIC subsidiary. If approved, a second SBIC license would provide us an incremental source of long-term capital by permitting us to issue $75 million of additional SBA-guaranteed debentures in addition to the $150 million already approved under the first license. Receipt of a green light letter from the SBA does not assure an applicant that the SBA will ultimately issue an SBIC license and we have received no assurance or indication from the SBA that it will receive an SBIC license, or of the timeframe in which it would receive a license, should one be granted.
F-35
INDEX TO OTHER FINANCIAL STATEMENTS
Saratoga Investment Corp. CLO 2013-1, Ltd.
| Report of Independent Auditors | S-2 | |
| Statements of Assets and Liabilities as of February 28, 2015 and 2014 | S-3 | |
| Statements of Operations for the years ended February 28, 2015, February 28, 2014, and February 28, 2013 | S-4 | |
| Schedules of Investments as of February 28, 2015 and 2014 | S-5 | |
| Statements of Changes in Net Assets for the years ended February 28, 2015, February 28, 2014 and February 28, 2013 | S-7 | |
| Statements of Cash Flows for the years ended February 28, 2015, February 28, 2014 and February 28, 2013 | S-8 | |
| Notes to Financial Statements | S-9 |
IMPORTANT NOTE
In accordance with certain SEC rules, Saratoga Investment Corp. (the "Company") is providing additional information regarding one of its portfolio companies, Saratoga Investment Corp. CLO 2013-1, Ltd. ("Saratoga CLO"). The Company owns 100% of the subordinated notes of the Saratoga CLO. The additional financial information regarding the Saratoga CLO does not directly impact the Company's financial position, results of operations or cash flows.
S-1
Report of Independent Auditors
The Collateral Manager and Directors,
Saratoga Investment Corp. CLO 2013-1, Ltd.
We have audited the accompanying financial statements of Saratoga Investment Corp. CLO 2013-1, Ltd., which comprise the statements of assets and liabilities, as of February 28, 2015 and February 28, 2014, including the schedules of investments, and the statements of operations, changes in net assets and cash flows for the years ended February 28, 2015, February 28, 2014 and February 28, 2013, and the related notes to the financial statements.
Management's Responsibility for the Financial Statements
Management is responsible for the preparation and fair presentation of these financial statements in conformity with U.S. generally accepted accounting principles; this includes the design, implementation, and maintenance of internal control relevant to the preparation and fair presentation of financial statements that are free of material misstatement, whether due to fraud or error.
Auditor's Responsibility
Our responsibility is to express an opinion on these financial statements based on our audits. We conducted our audits in accordance with auditing standards generally accepted in the United States. Those standards require that we plan and perform the audit to obtain reasonable assurance about whether the financial statements are free of material misstatement.
An audit involves performing procedures to obtain audit evidence about the amounts and disclosures in the financial statements. The procedures selected depend on the auditor's judgment, including the assessment of the risks of material misstatement of the financial statements, whether due to fraud or error. In making those risk assessments, the auditor considers internal control relevant to the entity's preparation and fair presentation of the financial statements in order to design audit procedures that are appropriate in the circumstances, but not for the purpose of expressing an opinion on the effectiveness of the entity's internal control. Accordingly, we express no such opinion. An audit also includes evaluating the appropriateness of accounting policies used and the reasonableness of significant accounting estimates made by management, as well as evaluating the overall presentation of the financial statements.
We believe that the audit evidence we have obtained is sufficient and appropriate to provide a basis for our audit opinion.
Opinion
In our opinion, the financial statements referred to above present fairly, in all material respects, the financial position of Saratoga Investment Corp. CLO 2013-1, Ltd. at February 28, 2015 and February 28, 2014, and the results of its operations, changes in its net assets and its cash flows for the years ended February 28, 2015, February 28, 2014 and February 28, 2013, in conformity with U.S. generally accepted accounting principles.
/s/ Ernst & Young
May 20, 2015
S-2
Saratoga Investment Corp. CLO 2013-1, Ltd.
Statements of Assets and Liabilities
| As of | ||||||||
| February 28, 2015 | February 28, 2014 | |||||||
ASSETS | ||||||||
Investments | ||||||||
Fair value loans (amortized cost of $295,193,588 and $299,137,566, respectively) | $ | 294,621,817 | $ | 300,491,077 | ||||
Fair value other/structured finance securities (amortized cost of $2,566,752 and $0, respectively) | 617,451 | - | ||||||
|
|
|
| |||||
Total investments at fair value (amortized cost of $297,760,340 and $299,137,566, respectively) | 295,239,268 | 300,491,077 | ||||||
Cash and cash equivalents | 5,831,797 | 8,018,933 | ||||||
Receivable from open trades | 2,119,687 | 1,801,266 | ||||||
Interest receivable | 1,290,637 | 1,450,952 | ||||||
Other assets | - | 91,336 | ||||||
|
|
|
| |||||
Total assets | $ | 304,481,389 | $ | 311,853,564 | ||||
|
|
|
| |||||
LIABILITIES | ||||||||
Interest payable | $ | 631,886 | $ | 622,476 | ||||
Payable from open trades | 5,214,331 | 9,445,000 | ||||||
Accrued base management fee | 85,957 | 75,053 | ||||||
Accrued subordinated management fee | 85,957 | 75,053 | ||||||
Class X Notes-SIC CLO 2013-1, Ltd. | - | 1,666,666 | ||||||
Class A-1 Notes-SIC CLO 2013-1, Ltd. | 170,000,000 | 170,000,000 | ||||||
Discount on Class A-1 Notes-SIC CLO 2013-1, Ltd. | (1,495,802 | ) | (1,671,864 | ) | ||||
Class A-2 Notes-SIC CLO 2013-1, Ltd. | 20,000,000 | 20,000,000 | ||||||
Discount on Class A-2 Notes-SIC CLO 2013-1, Ltd. | (155,050 | ) | (173,300 | ) | ||||
Class B Notes-SIC CLO 2013-1, Ltd. | 44,800,000 | 44,800,000 | ||||||
Discount on Class B Notes - SIC CLO 2013-1, Ltd. | (1,007,205 | ) | (1,125,757 | ) | ||||
Class C Notes-SIC CLO 2013-1, Ltd. | 16,000,000 | 16,000,000 | ||||||
Discount on Class C Notes-SIC CLO 2013-1, Ltd. | (627,091 | ) | (700,902 | ) | ||||
Class D Notes-SIC CLO 2013-1, Ltd. | 14,000,000 | 14,000,000 | ||||||
Discount on Class D Notes - SIC CLO 2013-1, Ltd. | (814,013 | ) | (909,825 | ) | ||||
Class E Notes-SIC CLO 2013-1, Ltd. | 13,100,000 | 13,100,000 | ||||||
Discount on Class E Notes-SIC CLO 2013-1, Ltd. | (1,534,650 | ) | (1,715,285 | ) | ||||
Class F Notes-SIC CLO 2013-1, Ltd. | 4,500,000 | 4,500,000 | ||||||
Discount on Class F Notes-SIC CLO 2013-1, Ltd. | (558,180 | ) | (623,880 | ) | ||||
Deferred debt financing costs, SIC CLO 2013-1, Ltd. Notes | (1,941,595 | ) | (2,166,633 | ) | ||||
Subordinated Notes | 30,000,000 | 30,000,000 | ||||||
|
|
|
| |||||
Total liabilities | $ | 310,284,545 | $ | 315,196,802 | ||||
|
|
|
| |||||
Commitments and contingencies (See Note 6) | ||||||||
NET ASSETS | ||||||||
Ordinary equity, par value $1.00, 250 ordinary shares authorized, 250 and 250 issued and outstanding, respectively | $ | 250 | $ | 250 | ||||
Accumulated gain/(loss) | (3,343,488 | ) | 838,567 | |||||
Net loss | (2,459,918 | ) | (4,182,055 | ) | ||||
|
|
|
| |||||
Total net assets | (5,803,156 | ) | (3,343,238 | ) | ||||
|
|
|
| |||||
Total liabilities and net assets | $ | 304,481,389 | $ | 311,853,564 | ||||
|
|
|
| |||||
See accompanying notes to financial statements.
S-3
Saratoga Investment Corp. CLO 2013-1, Ltd.
Statements of Operations
| For the year ended February 28, 2015 | For the year ended February 28, 2014 | For the year ended February 28, 2013 | ||||||||||
INVESTMENT INCOME | ||||||||||||
Interest from investments | $ | 13,091,019 | $ | 15,486,413 | $ | 19,328,855 | ||||||
Interest from cash and cash equivalents | 1,446 | 6,792 | 16,587 | |||||||||
Other income | 188,180 | 945,441 | 967,991 | |||||||||
|
|
|
|
|
| |||||||
Total investment income | 13,280,645 | 16,438,646 | 20,313,433 | |||||||||
|
|
|
|
|
| |||||||
EXPENSES | ||||||||||||
Interest expense | 9,635,136 | 11,678,514 | 15,613,003 | |||||||||
Professional fees | 219,293 | 433,073 | 417,086 | |||||||||
Miscellaneous fee expense | 34,303 | 175,283 | 133,794 | |||||||||
Base management fee | 760,102 | 517,563 | 400,014 | |||||||||
Subordinated management fee | 760,102 | 1,257,578 | 1,600,057 | |||||||||
Trustee expenses | 123,999 | 83,221 | 100,820 | |||||||||
Amortization expense | 953,862 | 994,602 | 1,015,332 | |||||||||
Loss on extinguishment of debt | - | 3,442,442 | - | |||||||||
|
|
|
|
|
| |||||||
Total expenses | 12,486,797 | 18,582,276 | 19,280,106 | |||||||||
|
|
|
|
|
| |||||||
NET INVESTMENT INCOME (LOSS) | 793,848 | (2,143,630 | ) | 1,033,327 | ||||||||
|
|
|
|
|
| |||||||
REALIZED AND UNREALIZED GAIN (LOSS) ON INVESTMENTS: | ||||||||||||
Net realized gain (loss) on investments | 620,817 | (8,815,296 | ) | 2,532,558 | ||||||||
Net unrealized appreciation/(depreciation) on investments | (3,874,583 | ) | 6,776,871 | 3,235,774 | ||||||||
|
|
|
|
|
| |||||||
Net gain (loss) on investments | (3,253,766 | ) | (2,038,425 | ) | 5,768,332 | |||||||
|
|
|
|
|
| |||||||
NET INCREASE (DECREASE) IN NET ASSETS RESULTING FROM OPERATIONS | $ | (2,459,918 | ) | $ | (4,182,055 | ) | $ | 6,801,659 | ||||
|
|
|
|
|
| |||||||
See accompanying notes to financial statements.
S-4
Saratoga Investment Corp. CLO 2013-1 Ltd.
Schedule of Investments
February 28, 2015
Issuer Name | Industry | Asset Name | Asset | Current Rate | Maturity Date | Principal/ Number of Shares | Cost | Fair Value | ||||||||||||||||||
Education Management II LLC | Leisure Goods/Activities/Movies | A-1 Preferred Shares | Equity | 0.00 | % | 6,692 | $ | 669,214 | $ | 437,188 | ||||||||||||||||
Education Management II LLC | Leisure Goods/Activities/Movies | A-2 Preferred Shares | Equity | 0.00 | % | 18,975 | 1,897,538 | 180,263 | ||||||||||||||||||
24 Hour Holdings III LLC | Leisure Goods/Activities/Movies | Term Loan | Loan | 4.75 | % | 5/28/2021 | $ | 497,500 | 493,004 | 492,276 | ||||||||||||||||
Acosta Holdco Inc. | Media | Term Loan B | Loan | 5.00 | % | 9/27/2021 | $ | 1,995,000 | 1,981,328 | 2,004,416 | ||||||||||||||||
Aderant North America, Inc. | Business Equipment and Services | Term Loan (First Lien) | Loan | 5.25 | % | 12/20/2018 | $ | 3,260,898 | 3,260,898 | 3,240,517 | ||||||||||||||||
Advantage Sales & Marketing Inc. | Business Equipment and Services | Delayed Draw Term Loan | Loan | 4.25 | % | 7/25/2021 | $ | 1,995,000 | 1,993,940 | 1,984,287 | ||||||||||||||||
AECOM Technology Corporation | Business Equipment and Services | Term Loan B | Loan | 3.75 | % | 10/15/2021 | $ | 319,903 | 318,380 | 321,304 | ||||||||||||||||
Aegis Toxicology Science Corporation | Healthcare | Term B Loan | Loan | 5.50 | % | 2/24/2021 | $ | 995,000 | 995,000 | 997,488 | ||||||||||||||||
Akorn, Inc. | Healthcare | Term Loan B | Loan | 4.50 | % | 4/16/2021 | $ | 498,750 | 496,691 | 500,411 | ||||||||||||||||
Albertson's LLC | Retailers (Except Food and Drugs) | Term Loan B-4 | Loan | 5.50 | % | 8/25/2021 | $ | 3,410,000 | 3,389,632 | 3,437,723 | ||||||||||||||||
Alere Inc. (fka IM US Holdings, LLC) | Healthcare | Incremental B-1 Term Loan | Loan | 4.25 | % | 6/30/2017 | $ | 1,529,610 | 1,529,610 | 1,529,610 | ||||||||||||||||
American Tire Distributors Inc | Automotive | Term Loan | Loan | 5.75 | % | 6/1/2018 | $ | 496,487 | 496,486 | 497,108 | ||||||||||||||||
Aramark Corporation | Food Products | LC-2 Facility | Loan | 3.74 | % | 7/26/2016 | $ | 79,187 | 79,178 | 78,395 | ||||||||||||||||
Aramark Corporation | Food Products | LC-3 Facility | Loan | 3.74 | % | 7/26/2016 | $ | 43,961 | 43,961 | 43,521 | ||||||||||||||||
Aramark Corporation | Food Products | U.S. Term F Loan | Loan | 3.25 | % | 2/24/2021 | $ | 3,182,489 | 3,182,489 | 3,168,581 | ||||||||||||||||
ARG IH Corp | Food Services | Term Loan | Loan | 4.75 | % | 11/15/2020 | $ | 495,000 | 494,038 | 495,312 | ||||||||||||||||
Asurion, LLC (fka Asurion Corporation) | Insurance | Incremental Tranche B-1 Term Loan | Loan | 5.00 | % | 5/24/2019 | $ | 5,412,086 | 5,370,590 | 5,424,642 | ||||||||||||||||
Auction.Com, LLC | Business Equipment and Services | Term Loan A-4 | Loan | 4.40 | % | 2/28/2017 | $ | 914,567 | 914,567 | 905,422 | ||||||||||||||||
Avantor Performance Materials Holdings, Inc. | Chemicals/Plastics | Term Loan | Loan | 5.25 | % | 6/24/2017 | $ | 4,319,115 | 4,309,242 | 4,297,520 | ||||||||||||||||
Avast Software | Electronics/Electric | Term Loan | Loan | 4.75 | % | 3/20/2020 | $ | 1,925,000 | 1,923,275 | 1,937,031 | ||||||||||||||||
AZ Chem US Inc. | Chemicals/Plastics | Term Loan | Loan | 5.25 | % | 6/12/2021 | $ | 467,123 | 464,958 | 466,614 | ||||||||||||||||
Bass Pro Group, LLC | Retailers (Except Food and Drugs) | New Term Loan | Loan | 3.75 | % | 11/20/2019 | $ | 493,623 | 493,111 | 492,236 | ||||||||||||||||
Bayonne Energy Center | Oil & Gas | Term Loan B | Loan | 5.00 | % | 8/19/2021 | $ | 969,671 | 965,093 | 964,416 | ||||||||||||||||
Belmond Hotels | Lodging & Casinos | Term Loan | Loan | 4.00 | % | 3/19/2021 | $ | 496,250 | 494,055 | 495,009 | ||||||||||||||||
Berry Plastics Corporation | Chemicals/Plastics | Term E Loan | Loan | 3.75 | % | 1/6/2021 | $ | 1,814,499 | 1,802,403 | 1,812,648 | ||||||||||||||||
Big Heart Pet Brands (fka Del Monte Corporation) | Food/Drug Retailers | Initial Term Loan | Loan | 3.50 | % | 3/9/2020 | $ | 2,977,500 | 2,996,769 | 2,971,307 | ||||||||||||||||
Biomet, Inc. | Healthcare | Dollar Term B-2 Loan | Loan | 3.65 | % | 7/25/2017 | $ | 1,840,718 | 1,840,718 | 1,838,601 | ||||||||||||||||
BJ's Wholesale Club, Inc. | Food/Drug Retailers | New 2013 (November) Replacement Loan (First Lien) | Loan | 4.50 | % | 9/26/2019 | $ | 1,489,975 | 1,488,922 | 1,483,374 | ||||||||||||||||
Bombardier Recreational Products Inc. | Leisure Goods/Activities/Movies | Term B Loan | Loan | 4.00 | % | 1/30/2019 | $ | 754,286 | 750,287 | 747,120 | ||||||||||||||||
Brickman Group Holdings, Inc. | Brokers/Dealers/Investment Houses | Initial Term Loan (First Lien) | Loan | 4.00 | % | 12/18/2020 | $ | 1,491,237 | 1,478,800 | 1,478,935 | ||||||||||||||||
Brock Holdings III, Inc. | Industrial Equipment | Term Loan (First Lien) | Loan | 6.00 | % | 3/16/2017 | $ | 1,938,503 | 1,952,391 | 1,904,580 | ||||||||||||||||
Burlington Coat Factory Warehouse Corporation | Retailers (Except Food and Drugs) | Term B-2 Loan | Loan | 4.25 | % | 8/13/2021 | $ | 1,945,000 | 1,935,814 | 1,942,219 | ||||||||||||||||
BWAY | Leisure Goods/Activities/Movies | Term Loan B | Loan | 5.50 | % | 8/14/2020 | $ | 995,000 | 985,881 | 998,423 | ||||||||||||||||
Caesars Entertainment Corp. | Lodging & Casinos | Term B-7 Loan | Loan | 9.75 | % | 1/28/2018 | $ | 995,000 | 989,028 | 917,141 | ||||||||||||||||
Camp International Holding Company | Aerospace and Defense | 2013 Replacement Term Loan (First Lien) | Loan | 4.75 | % | 5/31/2019 | $ | 1,960,046 | 1,965,495 | 1,969,846 | ||||||||||||||||
Capital Automotive L.P. | Conglomerate | Tranche B-1 Term Loan Facility | Loan | 4.00 | % | 4/10/2019 | $ | 2,079,313 | 2,083,783 | 2,084,511 | ||||||||||||||||
Catalent Pharma Solutions, Inc | Drugs | Initial Term B Loan | Loan | 4.25 | % | 5/20/2021 | $ | 497,500 | 495,170 | 498,401 | ||||||||||||||||
Celanese US Holdings LLC | Chemicals/Plastics | Dollar Term C-2 Commitment | Loan | 2.49 | % | 10/31/2018 | $ | 2,154,560 | 2,180,598 | 2,157,533 | ||||||||||||||||
Cengage Learning | Publishing | Term Loan | Loan | 7.00 | % | 3/31/2020 | $ | 2,731,869 | 2,761,735 | 2,733,235 | ||||||||||||||||
Charter Communications Operating, LLC | Cable and Satellite Television | Term F Loan | Loan | 3.00 | % | 12/31/2020 | $ | 2,655,745 | 2,646,932 | 2,646,344 | ||||||||||||||||
CHS/Community Health Systems, Inc. | Healthcare | 2017 Term E Loan | Loan | 3.49 | % | 1/25/2017 | $ | 1,097,818 | 1,074,945 | 1,097,193 | ||||||||||||||||
CHS/Community Health Systems, Inc. | Healthcare | 2021 Term D Loan | Loan | 4.25 | % | 1/27/2021 | $ | 2,926,052 | 2,844,886 | 2,935,210 | ||||||||||||||||
Cinedigm Digital Funding I, LLC | Business Equipment and Services | Term Loan | Loan | 3.75 | % | 2/28/2018 | $ | 562,001 | 557,872 | 561,298 | ||||||||||||||||
CITGO Petroleum | Oil & Gas | Term Loan B | Loan | 4.50 | % | 7/29/2021 | $ | 997,500 | 994,095 | 979,106 | ||||||||||||||||
ClubCorp Club Operations, Inc. | Lodging & Casinos | Term Loan B | Loan | 4.50 | % | 7/24/2020 | $ | 500,000 | 496,250 | 500,315 | ||||||||||||||||
CPI International Acquisition, Inc. (f/k/a Catalyst Holdings, Inc.) | Electronics/Electric | Term B Loan | Loan | 4.25 | % | 11/17/2017 | $ | 3,595,331 | 3,595,331 | 3,570,631 | ||||||||||||||||
Crosby US Acquisition Corp. | Industrial Equipment | Initial Term Loan (First Lien) | Loan | 3.75 | % | 11/23/2020 | $ | 742,500 | 741,718 | 681,244 | ||||||||||||||||
Crown Castle Operating Company | Telecommunications/Cellular | Extended Incremental Tranche B-2 Term Loan | Loan | 3.00 | % | 1/31/2021 | $ | 2,435,594 | 2,433,546 | 2,430,723 | ||||||||||||||||
CT Technologies Intermediate Hldgs, Inc | Healthcare | Term Loan (First Lien) | Loan | 6.00 | % | 12/1/2021 | $ | 1,500,000 | 1,485,423 | 1,505,625 | ||||||||||||||||
Culligan International Company | Conglomerate | Dollar Loan (First Lien) | Loan | 6.25 | % | 12/19/2017 | $ | 779,642 | 736,275 | 765,998 | ||||||||||||||||
Culligan International Company | Conglomerate | Dollar Loan (Second Lien) | Loan | 9.50 | % | 6/19/2018 | $ | 783,162 | 739,367 | 727,033 | ||||||||||||||||
Cumulus Media Holdings Inc. | Broadcast Radio and Television | Term Loan | Loan | 4.25 | % | 12/23/2020 | $ | 470,093 | 466,100 | 466,863 | ||||||||||||||||
Custom Sensors | Industrial Equipment | Term Loan | Loan | 4.50 | % | 9/30/2021 | $ | 498,750 | 497,651 | 498,750 | ||||||||||||||||
DaVita HealthCare Partners Inc. (fka DaVita Inc.) | Healthcare | Tranche B Term Loan | Loan | 3.50 | % | 6/24/2021 | $ | 497,500 | 495,228 | 498,062 | ||||||||||||||||
DCS Business Services, Inc. | Financial Intermediaries | Term B Loan | Loan | 7.25 | % | 3/19/2018 | $ | 3,460,027 | 3,436,485 | 3,413,835 | ||||||||||||||||
Dealertrack Technologies, Inc. | Leisure Goods/Activities/Movies | Term B Loan | Loan | 3.25 | % | 2/26/2021 | $ | 477,011 | 475,991 | 474,230 | ||||||||||||||||
Dell International LLC | Retailers (Except Food and Drugs) | Term B Loan | Loan | 4.50 | % | 4/29/2020 | $ | 2,969,962 | 2,957,576 | 2,980,684 | ||||||||||||||||
Delos Finance SARL | Financial Intermediaries | Term Loan | Loan | 3.50 | % | 3/6/2021 | $ | 500,000 | 497,835 | 499,790 | ||||||||||||||||
Delta 2 (Lux) S.a.r.l. | Lodging & Casinos | Term Loan B-3 | Loan | 4.75 | % | 7/30/2021 | $ | 1,000,000 | 995,314 | 995,630 | ||||||||||||||||
Deluxe Entertainment Service Group, Inc. | Leisure Goods/Activities/Movies | Term Loan (First Lien) | Loan | 6.50 | % | 2/28/2020 | $ | 1,882,983 | 1,884,624 | 1,835,908 | ||||||||||||||||
Devix US, Inc. | Chemicals/Plastics | Term Loan | Loan | 4.25 | % | 5/2/2021 | $ | 250,000 | 247,710 | 250,938 | ||||||||||||||||
Devix US, Inc. | Chemicals/Plastics | Term Loan (Second Lien) | Loan | 8.00 | % | 5/2/2022 | $ | 497,500 | 495,324 | 497,500 | ||||||||||||||||
Diamond Resorts International | Lodging & Casinos | Term Loan | Loan | 5.50 | % | 5/9/2021 | $ | 995,000 | 990,370 | 999,975 | ||||||||||||||||
Dollar Tree | Retailers (Except Food and Drugs) | Term Loan B (3950MM) | Loan | 4.25 | % | 3/9/2022 | $ | 1,000,000 | 995,000 | 1,007,500 | ||||||||||||||||
DPX Holdings B.V. | Healthcare | Term Loan | Loan | 4.25 | % | 3/11/2021 | $ | 2,985,000 | 2,978,605 | 2,962,075 | ||||||||||||||||
Drew Marine Group Inc. | Chemicals/Plastics | Term Loan (First Lien) | Loan | 4.50 | % | 11/19/2020 | $ | 1,489,975 | 1,495,721 | 1,473,213 | ||||||||||||||||
Education Management LLC | Leisure Goods/Activities/Movies | Term Loan A | Loan | 5.50 | % | 7/2/2020 | $ | 501,970 | 482,120 | 457,295 | ||||||||||||||||
Education Management LLC | Leisure Goods/Activities/Movies | Term Loan B | Loan | 8.5 (2.00% Cash/ 6.50% PIK) | % | 7/2/2020 | $ | 836,617 | 805,283 | 672,882 | ||||||||||||||||
EIG Investors Corp. | Business Equipment and Services | Term Loan | Loan | 5.00 | % | 11/8/2019 | $ | 987,500 | 983,552 | 989,969 | ||||||||||||||||
Emerald Performance Materials, LLC | Chemicals/Plastics | Term Loan (First Lien) | Loan | 4.50 | % | 8/1/2021 | $ | 498,750 | 496,403 | 496,102 | ||||||||||||||||
Emerald Performance Materials, LLC | Chemicals/Plastics | Term Loan (Second Lien) | Loan | 7.75 | % | 8/1/2022 | $ | 500,000 | 497,553 | 484,845 | ||||||||||||||||
EnergySolutions, LLC | Oil & Gas | Term Loan B | Loan | 6.75 | % | 5/29/2020 | $ | 937,857 | 921,126 | 942,546 | ||||||||||||||||
Enviromental Resources Management | Business Equipment and Services | Term Loan | Loan | 5.00 | % | 5/14/2021 | $ | 1,000,000 | 990,000 | 985,000 | ||||||||||||||||
Evergreen Acqco 1 LP | Retailers (Except Food and Drugs) | New Term Loan | Loan | 5.00 | % | 7/9/2019 | $ | 975,056 | 972,887 | 955,555 | ||||||||||||||||
EWT Holdings III Corp. (fka WTG Holdings III Corp.) | Industrial Equipment | Term Loan (First Lien) | Loan | 4.75 | % | 1/15/2021 | $ | 1,987,481 | 1,982,274 | 1,972,575 | ||||||||||||||||
Federal-Mogul Corporation | Automotive | Tranche C Term Loan | Loan | 4.75 | % | 4/15/2021 | $ | 2,985,000 | 2,971,883 | 2,975,687 | ||||||||||||||||
First Data Corporation | Financial Intermediaries | 2017 Second New Dollar Term Loan | Loan | 3.74 | % | 3/23/2018 | $ | 2,790,451 | 2,729,399 | 2,785,568 | ||||||||||||||||
First Data Corporation | Financial Intermediaries | 2018 Dollar Term Loan | Loan | 4.24 | % | 3/24/2021 | $ | 2,111,028 | 2,021,476 | 2,115,777 | ||||||||||||||||
Fitness International, LLC | Leisure Goods/Activities/Movies | Term Loan B | Loan | 5.50 | % | 7/1/2020 | $ | 1,492,500 | 1,482,322 | 1,421,606 | ||||||||||||||||
FMG Resources (August 2006) Pty LTD (FMG America Finance, Inc.) | Nonferrous Metals/Minerals | Loan | Loan | 3.75 | % | 6/28/2019 | $ | 1,982,462 | 1,982,212 | 1,835,423 | ||||||||||||||||
Four Seasons Holdings Inc. | Lodging & Casinos | Term Loan (First Lien) | Loan | 3.50 | % | 6/27/2020 | $ | 493,750 | 493,750 | 491,281 | ||||||||||||||||
Garda World Security Corporation | Business Equipment and Services | Term B Delayed Draw Loan | Loan | 4.00 | % | 11/6/2020 | $ | 201,157 | 200,308 | 199,146 | ||||||||||||||||
Garda World Security Corporation | Business Equipment and Services | Term B Loan | Loan | 4.00 | % | 11/6/2020 | $ | 786,343 | 783,060 | 778,479 | ||||||||||||||||
Gardner Denver, Inc. | Oil & Gas | Initial Dollar Term Loan | Loan | 4.25 | % | 7/30/2020 | $ | 2,476,212 | 2,467,608 | 2,377,164 | ||||||||||||||||
Gates Global LLC | Leisure Goods/Activities/Movies | Term Loan (First Lien) | Loan | 4.25 | % | 7/3/2021 | $ | 498,750 | 493,763 | 494,885 | ||||||||||||||||
Generac Power Systems, Inc. | Industrial Equipment | Term Loan B | Loan | 3.25 | % | 5/29/2020 | $ | 802,956 | 789,932 | 797,182 | ||||||||||||||||
General Nutrition Centers, Inc. | Retailers (Except Food and Drugs) | Amended Tranche B Term Loan | Loan | 3.25 | % | 3/4/2019 | $ | 4,724,136 | 4,709,712 | 4,649,353 | ||||||||||||||||
Global Tel*Link Corporation | Business Equipment and Services | Term Loan (First Lien) | Loan | 5.00 | % | 5/26/2020 | $ | 2,755,515 | 2,747,025 | 2,719,914 | ||||||||||||||||
Goodyear Tire & Rubber Company, The | Chemicals/Plastics | Loan (Second Lien) | Loan | 4.75 | % | 4/30/2019 | $ | 3,333,333 | 3,296,753 | 3,347,933 | ||||||||||||||||
Grosvenor Capital Management Holdings, LP | Brokers/Dealers/Investment Houses | Initial Term Loan | Loan | 3.75 | % | 1/4/2021 | $ | 3,395,892 | 3,381,240 | 3,353,443 | ||||||||||||||||
GTCR Valor Companies, Inc. | Business Equipment and Services | Term Loan (First Lien) | Loan | 6.00 | % | 6/1/2021 | $ | 1,995,000 | 1,981,582 | 1,965,075 | ||||||||||||||||
Harland Clarke Holdings Corp. (fka Clarke American Corp.) | Publishing | Tranche B-4 Term Loan | Loan | 6.00 | % | 8/2/2019 | $ | 487,500 | 485,460 | 488,963 | ||||||||||||||||
HCA Inc. | Healthcare | Tranche B-4 Term Loan | Loan | 2.99 | % | 5/1/2018 | $ | 5,663,006 | 5,409,534 | 5,658,872 | ||||||||||||||||
Hertz Corporation, The | Automotive | Tranche B-1 Term Loan | Loan | 4.00 | % | 3/12/2018 | $ | 2,940,000 | 2,975,234 | 2,927,152 | ||||||||||||||||
Hoffmaster Group, Inc. | Containers/Glass Products | Term Loan | Loan | 5.25 | % | 5/8/2020 | $ | 1,990,000 | 1,972,040 | 1,999,950 | ||||||||||||||||
Huntsman International LLC | Chemicals/Plastics | Extended Term B Loan | Loan | 2.69 | % | 4/19/2017 | $ | 3,880,270 | 3,866,113 | 3,872,199 | ||||||||||||||||
Husky Injection | Business Equipment and Services | Term Loan B | Loan | 4.25 | % | 6/30/2021 | $ | 498,099 | 495,886 | 495,818 | ||||||||||||||||
Ikaria, Inc. | Healthcare | Initial Term Loan (First Lien) | Loan | 5.00 | % | 2/12/2021 | $ | 435,702 | 433,809 | 434,251 | ||||||||||||||||
Infor (US), Inc. (fka Lawson Software Inc.) | Business Equipment and Services | Tranche B-5 Term Loan | Loan | 3.75 | % | 6/3/2020 | $ | 2,211,036 | 2,194,068 | 2,190,650 | ||||||||||||||||
Insight Global | Business Equipment and Services | Term Loan | Loan | 6.00 | % | 10/29/2021 | $ | 2,000,000 | 1,990,539 | 1,993,760 | ||||||||||||||||
J. Crew Group, Inc. | Retailers (Except Food and Drugs) | Term B-1 Loan Retired 03/05/2014 | Loan | 4.00 | % | 3/5/2021 | $ | 965,206 | 965,206 | 906,493 | ||||||||||||||||
Jazz Acquisition, Inc | Aerospace and Defense | First Lien 6/14 | Loan | 4.50 | % | 6/19/2021 | $ | 497,576 | 496,332 | 492,913 | ||||||||||||||||
Kinetic Concepts, Inc. | Healthcare | Dollar Term D-1 Loan | Loan | 4.00 | % | 5/4/2018 | $ | 2,477,613 | 2,453,687 | 2,477,167 | ||||||||||||||||
Koosharem, LLC | Business Equipment and Services | Term Loan | Loan | 7.50 | % | 5/15/2020 | $ | 2,995,000 | 2,968,450 | 2,961,306 | ||||||||||||||||
La Quinta Holdings, Inc. | Lodging & Casinos | Term Loan (First Lien) | Loan | 4.00 | % | 4/14/2021 | $ | 451,283 | 449,626 | 450,719 | ||||||||||||||||
Level 3 Financing, Inc. | Telecommunications | Term Loan B | Loan | 4.50 | % | 1/31/2022 | $ | 500,000 | 496,541 | 502,085 | ||||||||||||||||
Mauser Holdings, Inc. | Containers/Glass Products | Term Loan | Loan | 4.50 | % | 7/31/2021 | $ | 498,750 | 496,409 | 491,269 | ||||||||||||||||
Michaels Stores, Inc. | Retailers (Except Food and Drugs) | Term B Loan | Loan | 3.75 | % | 1/28/2020 | $ | 491,250 | 491,250 | 488,258 | ||||||||||||||||
Michaels Stores, Inc. | Retailers (Except Food and Drugs) | Term Loan B-2 | Loan | 4.00 | % | 1/28/2020 | $ | 1,492,500 | 1,485,638 | 1,488,769 | ||||||||||||||||
Microsemi Corporation | Electronics/Electric | Incremental Term Loan | Loan | 3.50 | % | 2/19/2020 | $ | 2,393,981 | 2,389,500 | 2,381,509 | ||||||||||||||||
Microsemi Corporation | Electronics/Electric | Term Loan | Loan | 3.75 | % | 2/19/2020 | $ | 172,170 | 172,170 | 171,309 | ||||||||||||||||
Midas Intermediate Holdco II, LLC | Automotive | Delayed Draw Term Loan | Loan | 4.75 | % | 8/18/2021 | $ | 25,253 | 25,253 | 25,364 | ||||||||||||||||
Midas Intermediate Holdco II, LLC | Automotive | Term Loan B | Loan | 4.75 | % | 8/18/2021 | $ | 224,122 | 223,063 | 225,103 | ||||||||||||||||
Millenium Laboratories, LLC | Drugs | Term Loan | Loan | 5.25 | % | 4/16/2021 | $ | 1,492,500 | 1,479,041 | 1,489,396 | ||||||||||||||||
Mitel US Holdings, Inc. | Telecommunications | Term Loan | Loan | 5.25 | % | 1/31/2020 | $ | 196,558 | 195,710 | 196,411 | ||||||||||||||||
MPH Acquisition Holdings LLC | Health Insurance | Term Loan | Loan | 3.75 | % | 3/31/2021 | $ | 445,455 | 444,453 | 442,033 | ||||||||||||||||
MSC Software Corp. | Business Equipment and Services | Term Loan | Loan | 5.00 | % | 5/29/2020 | $ | 995,000 | 986,186 | 996,244 | ||||||||||||||||
National CineMedia, LLC | Leisure Goods/Activities/Movies | Term Loan (2013) | Loan | 2.95 | % | 11/26/2019 | $ | 1,086,207 | 1,058,933 | 1,067,198 | ||||||||||||||||
National Veterinary Associates, Inc | Healthcare | Term Loan B | Loan | 4.75 | % | 8/14/2021 | $ | 997,500 | 992,907 | 996,253 | ||||||||||||||||
National Vision, Inc. | Retailers (Except Food and Drugs) | Term Loan (Second Lien) | Loan | 6.75 | % | 3/11/2022 | $ | 250,000 | 249,730 | 240,418 | ||||||||||||||||
Newsday, LLC | Publishing | Term Loan | Loan | 3.69 | % | 10/12/2016 | $ | 2,215,385 | 2,214,305 | 2,201,538 | ||||||||||||||||
Nortek, Inc. | Electronics/Electric | Term B Loan | Loan | 3.75 | % | 10/30/2020 | $ | 995,000 | 992,803 | 986,921 | ||||||||||||||||
Novelis, Inc. | Conglomerate | Initial Term Loan | Loan | 3.75 | % | 3/10/2017 | $ | 4,807,530 | 4,817,740 | 4,799,502 | ||||||||||||||||
NPC International, Inc. | Food Services | Term Loan (2013) | Loan | 4.00 | % | 12/28/2018 | $ | 486,250 | 486,250 | 480,780 | ||||||||||||||||
NRG Energy, Inc. | Utilities | Term Loan (2013) | Loan | 2.75 | % | 7/2/2018 | $ | 3,861,225 | 3,842,164 | 3,850,761 | ||||||||||||||||
NuSil Technology LLC. | Chemicals/Plastics | Term Loan | Loan | 5.25 | % | 4/7/2017 | $ | 797,986 | 797,986 | 791,004 | ||||||||||||||||
Ollie's Bargain Outlet, Inc | Retailers (Except Food and Drugs) | Term Loan | Loan | 4.75 | % | 9/30/2019 | $ | 977,052 | 972,882 | 962,396 | ||||||||||||||||
On Assignment, Inc. | Business Equipment and Services | Initial Term B Loan | Loan | 3.50 | % | 5/15/2020 | $ | 1,311,364 | 1,303,451 | 1,301,528 | ||||||||||||||||
Onex Carestream Finance LP | Healthcare | Term Loan (First Lien 2013) | Loan | 5.00 | % | 6/7/2019 | $ | 4,074,401 | 4,059,378 | 4,078,842 | ||||||||||||||||
OnexYork Acquisition Co | Healthcare | Delayed Draw Term Loan | Loan | 4.75 | % | 10/1/2021 | $ | - | - | - | ||||||||||||||||
OnexYork Acquisition Co | Healthcare | Term Loan B | Loan | 4.75 | % | 10/1/2021 | $ | 498,750 | 495,208 | 496,466 | ||||||||||||||||
OpenLink International LLC | Business Equipment and Services | Term B Loan | Loan | 6.25 | % | 10/28/2017 | $ | 970,000 | 970,000 | 957,875 | ||||||||||||||||
Orbitz Worldwide, Inc. | Business Equipment and Services | Term Loan (First Lien) | Loan | 4.50 | % | 4/15/2021 | $ | 1,494,994 | 1,492,711 | 1,494,755 | ||||||||||||||||
P.F. Chang's China Bistro, Inc. (Wok Acquisition Corp.) | Food/Drug Retailers | Term Borrowing | Loan | 4.25 | % | 6/24/2019 | $ | 1,447,901 | 1,440,712 | 1,406,274 | ||||||||||||||||
P2 Upstream Acquisition Co. (P2 Upstream Canada BC ULC) | Business Equipment and Services | Term Loan (First Lien) | Loan | 5.00 | % | 10/30/2020 | $ | 990,000 | 985,444 | 947,925 | ||||||||||||||||
Par Pharmaceutical | Healthcare & Pharmaceuticals | Term Loan B3 | Loan | 4.25 | % | 9/28/2019 | $ | 500,000 | 497,502 | 499,065 | ||||||||||||||||
PetCo Animal Supplies Stores, Inc. | Retailers (Except Food and Drugs) | New Loans | Loan | 4.00 | % | 11/24/2017 | $ | 1,469,388 | 1,468,520 | 1,467,066 | ||||||||||||||||
PetSmart | Retailers (Except Food and Drugs) | Term Loan B | Loan | 5.00 | % | 3/11/2022 | $ | 1,000,000 | 995,000 | 1,007,050 | ||||||||||||||||
PGX Holdings, Inc. | Financial Intermediaries | Term Loan | Loan | 6.25 | % | 9/29/2020 | $ | 993,750 | 984,482 | 993,750 | ||||||||||||||||
Pharmaceutical Product Development, Inc. (Jaguar Holdings, LLC) | Conglomerate | 2013 Term Loan | Loan | 4.00 | % | 12/5/2018 | $ | 1,940,400 | 1,918,409 | 1,935,898 | ||||||||||||||||
Phillips-Medisize Corporation | Healthcare | Term Loan | Loan | 4.75 | % | 6/16/2021 | $ | 497,500 | 495,245 | 495,948 | ||||||||||||||||
Pinnacle Foods Finance LLC | Food Products | New Term Loan G | Loan | 3.00 | % | 4/29/2020 | $ | 2,581,332 | 2,576,466 | 2,565,560 | ||||||||||||||||
Planet Fitness Holdings LLC | Leisure Goods/Activities/Movies | Term Loan | Loan | 4.75 | % | 3/31/2021 | $ | 1,488,750 | 1,482,052 | 1,488,750 | ||||||||||||||||
Polymer Group, Inc. | Chemicals/Plastics | Initial Loan | Loan | 5.25 | % | 12/19/2019 | $ | 495,000 | 492,860 | 495,619 | ||||||||||||||||
Presidio | Business Equipment and Services | Term Loan B | Loan | 6.25 | % | 2/2/2022 | $ | 2,000,000 | 1,940,655 | 1,973,760 | ||||||||||||||||
Prestige Brands, Inc. | Drugs | Term B-1 Loan | Loan | 4.13 | % | 1/31/2019 | $ | 344,697 | 341,112 | 344,697 | ||||||||||||||||
Prestige Brands, Inc. | Leisure Goods/Activities/Movies | Term Loan | Loan | 4.50 | % | 9/3/2021 | $ | 1,861,111 | 1,858,280 | 1,860,534 | ||||||||||||||||
QoL Meds, LLC | Healthcare | Term Loan B | Loan | 5.50 | % | 7/15/2020 | $ | 1,995,000 | 1,985,909 | 1,990,013 | ||||||||||||||||
Quintiles Transnational Corp. | Conglomerate | Term B-3 Loan | Loan | 3.75 | % | 6/8/2018 | $ | 3,627,678 | 3,600,425 | 3,628,802 | ||||||||||||||||
Ranpak Holdings, Inc. | Business Equipment and Services | Term Loan | Loan | 4.75 | % | 10/1/2021 | $ | 997,500 | 995,145 | 996,882 | ||||||||||||||||
Ranpak Holdings, Inc. | Business Equipment and Services | Term Loan (Second Lien) | Loan | 8.25 | % | 9/30/2022 | $ | 500,000 | 497,672 | 496,250 | ||||||||||||||||
Redtop Acquisitions Limited | Electronics/Electric | Initial Dollar Term Loan (First Lien) | Loan | 4.50 | % | 12/3/2020 | $ | 495,000 | 491,974 | 494,381 | ||||||||||||||||
Rexnord LLC/RBS Global, Inc. | Industrial Equipment | Term B Loan | Loan | 4.00 | % | 8/21/2020 | $ | 1,646,799 | 1,648,172 | 1,642,172 | ||||||||||||||||
Reynolds Group Holdings Inc. | Industrial Equipment | Incremental U.S. Term Loan | Loan | 4.00 | % | 12/1/2018 | $ | 1,960,200 | 1,960,200 | 1,965,767 | ||||||||||||||||
Riverbed Technology | Technology | Term Loan B | Loan | 6.00 | % | 2/25/2022 | $ | 1,000,000 | 995,000 | 1,007,500 | ||||||||||||||||
Rocket Software, Inc. | Business Equipment and Services | Term Loan (First Lien) | Loan | 5.75 | % | 2/8/2018 | $ | 1,916,674 | 1,898,764 | 1,906,285 | ||||||||||||||||
Rovi Solutions Corporation / Rovi Guides, Inc. | Electronics/Electric | Tranche B-3 Term Loan | Loan | 3.75 | % | 7/2/2021 | $ | 1,492,500 | 1,485,607 | 1,479,441 | ||||||||||||||||
RPI Finance Trust | Drugs | Term B-2 Term Loan | Loan | 3.25 | % | 5/9/2018 | $ | 5,207,431 | 5,188,396 | 5,219,147 | ||||||||||||||||
SBP Holdings LP | Industrial Equipment | Term Loan (First Lien) | Loan | 5.00 | % | 3/27/2021 | $ | 992,500 | 988,065 | 863,475 | ||||||||||||||||
Scientific Games International, Inc. | Electronics/Electric | Term Loan B2 | Loan | 6.00 | % | 10/1/2021 | $ | 1,000,000 | 990,433 | 998,040 | ||||||||||||||||
Scitor Corporation | Business Equipment and Services | Term Loan | Loan | 5.00 | % | 2/15/2017 | $ | 463,977 | 462,387 | 461,077 | ||||||||||||||||
Seadrill | Oil & Gas | Term Loan B | Loan | 4.00 | % | 2/21/2021 | $ | 997,481 | 917,590 | 806,294 | ||||||||||||||||
Sensata Technologies B.V./Sensata Technology Finance Company, LLC | Industrial Equipment | Term Loan | Loan | 3.25 | % | 5/13/2019 | $ | 1,509,445 | 1,509,445 | 1,511,603 | ||||||||||||||||
Sensus USA Inc. (fka Sensus Metering Systems) | Utilities | Term Loan (First Lien) | Loan | 4.50 | % | 5/9/2017 | $ | 1,925,067 | 1,920,548 | 1,925,067 | ||||||||||||||||
ServiceMaster Company, The | Conglomerate | Tranche B Term Loan | Loan | 4.25 | % | 7/1/2021 | $ | 1,995,000 | 1,976,650 | 1,994,641 | ||||||||||||||||
Shearers Foods LLC | Food Services | Term Loan (First Lien) | Loan | 4.50 | % | 6/30/2021 | $ | 997,500 | 995,166 | 996,253 | ||||||||||||||||
Sonneborn, LLC | Chemicals/Plastics | Term Loan (First Lien) | Loan | 5.50 | % | 12/10/2020 | $ | 225,000 | 224,471 | 225,000 | ||||||||||||||||
Sonneborn, LLC | Chemicals/Plastics | Initial US Term Loan | Loan | 5.50 | % | 12/10/2020 | $ | 1,275,000 | 1,272,004 | 1,275,000 | ||||||||||||||||
Sophia, L.P. | Electronics/Electric | Term B Loan | Loan | 4.00 | % | 7/19/2018 | $ | 886,138 | 877,732 | 884,756 | ||||||||||||||||
SourceHOV LLC | Business Equipment and Services | Term Loan B (First Lien) | Loan | 7.75 | % | 10/31/2019 | $ | 2,000,000 | 1,942,284 | 1,915,000 | ||||||||||||||||
Southwire Company, LLC (f.k.a Southwire Company) | Building and Development | Initial Term Loan | Loan | 3.25 | % | 2/10/2021 | $ | 496,250 | 495,181 | 485,084 | ||||||||||||||||
SRAM, LLC | Industrial Equipment | Term Loan (First Lien) | Loan | 4.00 | % | 4/10/2020 | $ | 2,967,681 | 2,957,888 | 2,952,842 | ||||||||||||||||
Steak 'n Shake Operations, Inc. | Food Services | Term Loan | Loan | 4.75 | % | 3/19/2021 | $ | 992,500 | 983,723 | 975,131 | ||||||||||||||||
STHI Holding | Healthcare | Term Loan | Loan | 4.50 | % | 8/6/2021 | $ | 997,500 | 997,500 | 994,388 | ||||||||||||||||
SunGard Data Systems Inc. (Solar Capital Corp.) | Conglomerate | Tranche C Term Loan | Loan | 3.90 | % | 2/28/2017 | $ | 285,352 | 283,117 | 285,084 | ||||||||||||||||
SunGard Data Systems Inc. (Solar Capital Corp.) | Conglomerate | Tranche E Term Loan | Loan | 4.00 | % | 3/9/2020 | $ | 3,707,953 | 3,618,899 | 3,706,804 | ||||||||||||||||
SuperMedia Inc. (fka Idearc Inc.) | Publishing | Loan | Loan | 11.60 | % | 12/30/2016 | $ | 238,660 | 232,462 | 203,756 | ||||||||||||||||
Syniverse Holdings, Inc. | Telecommunications | Initial Term Loan | Loan | 4.00 | % | 4/23/2019 | $ | 479,913 | 476,105 | 473,314 | ||||||||||||||||
TGI Friday's | Food Services | Term Loan B | Loan | 5.25 | % | 7/15/2020 | $ | 267,977 | 266,768 | 267,642 | ||||||||||||||||
TGI Friday's | Food Services | Term Loan (Second Lien) | Loan | 9.25 | % | 7/15/2021 | $ | 2,000,000 | 2,016,250 | 2,000,000 | ||||||||||||||||
TPF II Power LLC and TPF II Covert Midco LLC | Utilities | Term Loan B | Loan | 5.50 | % | 10/2/2021 | $ | 500,000 | 496,689 | 504,790 | ||||||||||||||||
TransDigm, Inc. | Aerospace and Defense | Tranche C Term Loan | Loan | 3.75 | % | 2/28/2020 | $ | 4,847,054 | 4,856,484 | 4,824,661 | ||||||||||||||||
TransFirst | Financial Intermediaries | Term Loan | Loan | 5.50 | % | 11/12/2021 | $ | 500,000 | 495,182 | 502,815 | ||||||||||||||||
TransUnion | Financial Intermediaries | Term Loan | Loan | 4.00 | % | 4/9/2021 | $ | 496,250 | 495,138 | 493,977 | ||||||||||||||||
Tricorbraun, Inc. (fka Kranson Industries, Inc.) | Containers/Glass Products | Term Loan | Loan | 4.00 | % | 5/3/2018 | $ | 1,850,000 | 1,843,008 | 1,822,250 | ||||||||||||||||
Truven Health Analytics Inc. (fka Thomson Reuters (Healthcare) Inc.) | Healthcare | New Tranche B Term Loan | Loan | 4.50 | % | 6/6/2019 | $ | 487,566 | 479,874 | 481,471 | ||||||||||||||||
Twin River Management Group, Inc. | Lodging & Casinos | Term Loan B | Loan | 5.25 | % | 7/10/2020 | $ | 974,167 | 976,455 | 975,998 | ||||||||||||||||
U.S. Security Associates Holdings, Inc. | Business Equipment and Services | Delayed Draw Loan | Loan | 6.25 | % | 7/28/2017 | $ | 158,518 | 157,610 | 156,734 | ||||||||||||||||
U.S. Security Associates Holdings, Inc. | Business Equipment and Services | Term B Loan | Loan | 6.25 | % | 7/28/2017 | $ | 931,046 | 926,144 | 920,572 | ||||||||||||||||
United Surgical Partners International, Inc. | Healthcare | New Tranche B Term Loan | Loan | 4.75 | % | 4/3/2019 | $ | 2,431,749 | 2,408,580 | 2,431,749 | ||||||||||||||||
Univar Inc. | Chemicals/Plastics | Term B Loan | Loan | 5.00 | % | 6/30/2017 | $ | 3,844,964 | 3,844,749 | 3,813,935 | ||||||||||||||||
Univision Communications Inc. | Telecommunications | Replacement First-Lien Term Loan | Loan | 4.00 | % | 3/1/2020 | $ | 2,947,446 | 2,931,982 | 2,940,549 | ||||||||||||||||
Valeant Pharmaceuticals International, Inc. | Drugs | Series D2 Term Loan B | Loan | 3.50 | % | 2/13/2019 | $ | 2,545,588 | 2,537,415 | 2,539,683 | ||||||||||||||||
Verint Systems Inc. | Business Equipment and Services | Term Loan | Loan | 3.50 | % | 9/6/2019 | $ | 1,264,058 | 1,259,623 | 1,259,634 | ||||||||||||||||
Vertafore, Inc. | Business Equipment and Services | Term Loan (2013) | Loan | 4.25 | % | 10/3/2019 | $ | 2,881,003 | 2,881,003 | 2,878,294 | ||||||||||||||||
Vouvray US Finance | Industrial Equipment | Term Loan | Loan | 5.00 | % | 6/28/2021 | $ | 497,500 | 495,243 | 499,366 | ||||||||||||||||
Washington Inventory Service | Business Equipment and Services | U.S. Term Loan (First Lien) | Loan | 5.75 | % | 12/20/2018 | $ | 1,832,876 | 1,851,978 | 1,796,218 | ||||||||||||||||
Waste Industries | Environmental | Term Loan B | Loan | 4.25 | % | 2/27/2020 | $ | 250,000 | 249,375 | 250,520 | ||||||||||||||||
Wendy's International, Inc | Food Services | Term B Loan | Loan | 3.25 | % | 5/15/2019 | $ | 673,630 | 668,099 | 670,545 | ||||||||||||||||
West Corporation | Telecommunications | Term B-10 Loan | Loan | 3.25 | % | 6/30/2018 | $ | 2,571,560 | 2,605,923 | 2,562,998 | ||||||||||||||||
|
|
|
| |||||||||||||||||||||||
| $ | 297,760,340 | $ | 295,239,268 | |||||||||||||||||||||||
|
|
|
| |||||||||||||||||||||||
See accompanying notes to financial statements.
S-5
Saratoga Investment Corp. CLO 2013-1 Ltd.
Schedule of Investments
February 28, 2014
Issuer Name | Industry | Asset Name | Asset Type | Current Rate | Maturity Date | Principal | Cost | Fair Value | ||||||||||||||||||
| Academy, LTD. | Retailers (Except Food and Drugs) | Initial Term Loan (2012) | Loan | 4.50 | % | 8/3/2018 | $ | 1,960,187 | $ | 1,948,853 | $ | 1,969,969 | ||||||||||||||
| Acosta, Inc. | Food Products | Term B Loan (2013) | Loan | 4.25 | % | 3/2/2018 | 4,162,740 | 4,101,035 | 4,177,310 | |||||||||||||||||
| Aderant North America, Inc. | Business Equipment and Services | Term Loan (First Lien) | Loan | 6.25 | % | 12/20/2018 | 3,473,750 | 3,470,186 | 3,482,434 | |||||||||||||||||
| Aegis Toxicology Sciences Corporation | Healthcare | Initial Term Loan (First Lien) | Loan | 5.50 | % | 2/24/2021 | 1,000,000 | 990,000 | 990,000 | |||||||||||||||||
| Aegis Toxicology Sciences Corporation | Healthcare | Initial Term Loan (Second Lien) | Loan | 9.50 | % | 8/24/2021 | 500,000 | 492,500 | 492,500 | |||||||||||||||||
| Aeroflex Incorporated | Aerospace and Defense | Tranche B-1 Term Loan | Loan | 4.50 | % | 11/9/2019 | 3,208,854 | 3,194,690 | 3,223,550 | |||||||||||||||||
| Akorn, Inc. | Healthcare | Term Loan B | Loan | 4.50 | % | 11/13/2020 | 500,000 | 497,500 | 503,125 | |||||||||||||||||
| Alere Inc. (fka IM US Holdings, LLC) | Healthcare | Incremental B-1 Term Loan | Loan | 4.25 | % | 6/30/2017 | 1,960,000 | 1,930,566 | 1,968,173 | |||||||||||||||||
| Applied Systems, Inc. | Business Equipment and Services | Term Loan | Loan | 4.25 | % | 12/8/2016 | 500,000 | 498,750 | 498,750 | |||||||||||||||||
| Aramark Corporation | Food Products | LC-2 Facility | Loan | 3.69 | % | 7/26/2016 | 79,187 | 79,187 | 79,206 | |||||||||||||||||
| Aramark Corporation | Food Products | LC-3 Facility | Loan | 3.69 | % | 7/26/2016 | 43,961 | 43,961 | 43,971 | |||||||||||||||||
| Aramark Corporation | Food Products | U.S. Term C Loan | Loan | 3.25 | % | 7/26/2016 | 3,206,537 | 3,206,537 | 3,207,307 | |||||||||||||||||
| Ardagh Holdings USA Inc. (Ardagh Packaging Finance S.A.) | Containers/Glass Products | Dollar Term Loan | Loan | 4.25 | % | 12/17/2019 | 1,000,000 | 995,109 | 1,002,500 | |||||||||||||||||
| ARG IH Corporation | Food Services | Term Loan | Loan | 5.00 | % | 11/15/2020 | 500,000 | 498,797 | 502,500 | |||||||||||||||||
| Asurion, LLC (fka Asurion Corporation) | Insurance | Incremental Tranche B-1 Term Loan | Loan | 4.50 | % | 5/24/2019 | 5,508,783 | 5,462,695 | 5,516,660 | |||||||||||||||||
| Auction.Com, LLC | Business Equipment and Services | Term Loan A-4 | Loan | 4.66 | % | 2/28/2017 | 980,651 | 979,812 | 970,845 | |||||||||||||||||
| Autotrader.com, Inc. | Automotive | Tranche B-1 Term Loan | Loan | 4.00 | % | 12/15/2016 | 3,791,778 | 3,791,778 | 3,805,997 | |||||||||||||||||
| Avantor Performance Materials Holdings, Inc. | Chemicals/Plastics | Term Loan | Loan | 5.25 | % | 6/24/2017 | 4,875,000 | 4,861,403 | 4,875,000 | |||||||||||||||||
| AZ Chem US Inc. | Chemicals/Plastics | Term Loan | Loan | 5.25 | % | 12/22/2017 | 1,355,941 | 1,329,859 | 1,362,720 | |||||||||||||||||
| Bass Pro Group, LLC | Retailers (Except Food and Drugs) | New Term Loan | Loan | 3.75 | % | 11/20/2019 | 498,725 | 498,126 | 500,715 | |||||||||||||||||
| Berry Plastics Corporation | Chemicals/Plastics | Term E Loan | Loan | 3.75 | % | 1/6/2021 | 1,500,000 | 1,496,250 | 1,495,500 | |||||||||||||||||
| Big Heart Pet Brands (fka Del Monte Corporation) | Food/Drug Retailers | Initial Term Loan | Loan | 3.50 | % | 3/9/2020 | 3,000,000 | 3,022,866 | 2,999,250 | |||||||||||||||||
| Biomet, Inc. | Healthcare | Dollar Term B-2 Loan | Loan | 3.65 | % | 7/25/2017 | 1,970,137 | 1,970,137 | 1,972,797 | |||||||||||||||||
| BJ's Wholesale Club, Inc. | Food/Drug Retailers | New 2013 (November) Replacement Loan (First Lien) | Loan | 4.50 | % | 9/26/2019 | 500,000 | 497,592 | 502,750 | |||||||||||||||||
| Bombardier Recreational Products Inc. | Leisure Goods/Activities/Movies | Term B Loan | Loan | 4.00 | % | 1/30/2019 | 754,286 | 748,080 | 756,647 | |||||||||||||||||
| Brickman Group Ltd. LLC, The | Brokers/Dealers/Investment Houses | Initial Term Loan (First Lien) | Loan | 4.00 | % | 12/18/2020 | 250,000 | 248,750 | 250,937 | |||||||||||||||||
| Brock Holdings III, Inc. | Industrial Equipment | Term Loan (First Lien) | Loan | 6.75 | % | 3/16/2017 | 1,959,839 | 1,976,826 | 1,967,188 | |||||||||||||||||
| Burlington Coat Factory Warehouse Corporation | Retailers (Except Food and Drugs) | Term B-2 Loan | Loan | 4.25 | % | 2/23/2017 | 2,660,377 | 2,653,889 | 2,675,675 | |||||||||||||||||
| C.H.I. Overhead Doors, Inc. | Building and Development | Term Loan (First Lien) | Loan | 5.50 | % | 3/18/2019 | 2,739,013 | 2,692,934 | 2,745,861 | |||||||||||||||||
| Camp International Holding Company | Aerospace and Defense | 2013 Replacement Term Loan (First Lien) | Loan | 4.75 | % | 5/31/2019 | 990,000 | 990,000 | 999,900 | |||||||||||||||||
| Capital Automotive L.P. | Conglomerate | Tranche B-1 Term Loan Facility | Loan | 4.00 | % | 4/10/2019 | 2,137,369 | 2,141,920 | 2,142,712 | |||||||||||||||||
| Capstone Logistics, LLC | Business Equipment and Services | Term Note A | Loan | 6.50 | % | 9/16/2016 | 2,658,626 | 2,637,550 | 2,618,899 | |||||||||||||||||
| Capsugel Holdings US, Inc. | Drugs | Initial Term Loan | Loan | 3.50 | % | 8/1/2018 | 3,145,521 | 3,138,959 | 3,141,589 | |||||||||||||||||
| Celanese US Holdings LLC | Chemicals/Plastics | Dollar Term C-2 Commitment | Loan | 2.25 | % | 10/31/2016 | 2,176,323 | 2,201,894 | 2,192,254 | |||||||||||||||||
| Charter Communications Operating, LLC | Cable and Satellite Television | Term F Loan | Loan | 3.00 | % | 12/31/2020 | 2,682,707 | 2,672,727 | 2,666,369 | |||||||||||||||||
| CHS/Community Health Systems, Inc. | Healthcare | 2017 Term E Loan | Loan | 3.48 | % | 1/25/2017 | 1,108,908 | 1,082,718 | 1,113,987 | |||||||||||||||||
| CHS/Community Health Systems, Inc. | Healthcare | 2021 Term D Loan | Loan | 4.25 | % | 1/27/2017 | 2,955,608 | 2,862,024 | 2,980,228 | |||||||||||||||||
| Cinedigm Digital Funding I, LLC | Business Equipment and Services | Term Loan | Loan | 3.75 | % | 2/28/2018 | 825,121 | 820,892 | 825,121 | |||||||||||||||||
| Covanta Energy Corporation | Ecological Services and Equipment | Term Loan | Loan | 3.50 | % | 3/28/2019 | 491,250 | 489,468 | 492,788 | |||||||||||||||||
| CPI International Acquisition, Inc. (f/k/a Catalyst Holdings, Inc.) | Electronics/Electric | Term B Loan | Loan | 5.00 | % | 2/13/2017 | 4,622,500 | 4,611,092 | 4,622,500 | |||||||||||||||||
| Crosby US Acquisition Corp. | Industrial Equipment | Initial Term Loan (First Lien) | Loan | 4.00 | % | 11/23/2020 | 750,000 | 749,094 | 748,312 | |||||||||||||||||
| Crown Castle Operating Company | Telecommunications/Cellular | Extended Incremental Tranche B-2 Term Loan | Loan | 3.25 | % | 1/31/2019 | 2,460,196 | 2,441,025 | 2,460,316 | |||||||||||||||||
| Culligan International Company | Conglomerate | Dollar Loan (First Lien) | Loan | 6.25 | % | 12/19/2017 | 787,658 | 738,102 | 734,491 | |||||||||||||||||
| Culligan International Company | Conglomerate | Dollar Loan (Second Lien) | Loan | 9.50 | % | 6/19/2018 | 783,162 | 732,061 | 657,856 | |||||||||||||||||
| Cumulus Media Holdings Inc. | Broadcast Radio and Television | Term Loan | Loan | 4.25 | % | 12/23/2020 | 500,000 | 495,000 | 502,815 | |||||||||||||||||
| DaVita HealthCare Partners Inc. (fka DaVita Inc.) | Healthcare | Tranche B Term Loan | Loan | 4.50 | % | 10/20/2016 | 3,909,320 | 3,909,320 | 3,927,655 | |||||||||||||||||
| DCS Business Services, Inc. | Financial Intermediaries | Term B Loan | Loan | 7.25 | % | 3/19/2018 | 3,831,595 | 3,792,824 | 3,735,805 | |||||||||||||||||
| DealerTrack Technologies, Inc. | Computers & Electronics | Term Loan | Loan | 3.50 | % | 2/28/2021 | 500,000 | 498,750 | 498,750 | |||||||||||||||||
| Dell International LLC | Retailers (Except Food and Drugs) | Term B Loan | Loan | 4.50 | % | 4/29/2020 | 1,995,000 | 1,982,818 | 1,988,935 | |||||||||||||||||
| Delos Finance | Leasing | Loan | Loan | 3.50 | % | 2/26/2021 | 500,000 | 497,500 | 497,500 | |||||||||||||||||
| Deluxe Entertainment Services Group Inc. | Media | Initial Term Loan | Loan | 6.50 | % | 2/28/2020 | 1,000,000 | 1,000,000 | 1,000,000 | |||||||||||||||||
| Digitalglobe, Inc. | Ecological Services and Equipment | Term Loan | Loan | 3.75 | % | 1/31/2020 | 248,125 | 248,125 | 247,815 | |||||||||||||||||
| Drew Marine Group Inc. | Chemicals/Plastics | Term Loan (First Lien) | Loan | 4.50 | % | 11/19/2020 | 500,000 | 499,397 | 502,500 | |||||||||||||||||
| Dunkin' Brands, Inc. | Food Services | Term B-4 Loan | Loan | 3.25 | % | 2/14/2020 | 3,956,731 | 3,946,925 | 3,936,948 | |||||||||||||||||
| DynCorp International Inc. | Aerospace and Defense | Term Loan | Loan | 6.25 | % | 7/7/2016 | 486,442 | 482,619 | 488,573 | |||||||||||||||||
| Education Management LLC | Leisure Goods/Activities/Movies | Tranche C-2 Term Loan | Loan | 4.31 | % | 6/1/2016 | 3,882,152 | 3,746,734 | 3,544,405 | |||||||||||||||||
| EIG Investors Corp. | Business Equipment and Services | Term Loan | Loan | 5.00 | % | 11/9/2019 | 997,500 | 992,713 | 1,003,734 | |||||||||||||||||
| Energy Transfer Equity, L.P. | Oil & Gas | Loan | Loan | 3.25 | % | 12/2/2019 | 1,000,000 | 997,599 | 998,750 | |||||||||||||||||
| Evergreen Acqco 1 LP | Retailers (Except Food and Drugs) | New Term Loan | Loan | 5.00 | % | 7/9/2019 | 492,516 | 488,615 | 493,900 | |||||||||||||||||
| EWT Holdings III Corp. (fka WTG Holdings III Corp.) | Industrial Equipment | Term Loan (First Lien) | Loan | 4.75 | % | 1/15/2021 | 1,000,000 | 995,084 | 1,002,500 | |||||||||||||||||
| Federal-Mogul Corporation | Automotive | Tranche B Term Loan | Loan | 2.14 | % | 12/29/2014 | 2,220,981 | 2,187,068 | 2,202,747 | |||||||||||||||||
| Federal-Mogul Corporation | Automotive | Tranche C Term Loan | Loan | 2.14 | % | 12/28/2015 | 1,307,032 | 1,270,847 | 1,296,301 | |||||||||||||||||
| First Data Corporation | Financial Intermediaries | 2017 Second New Dollar Term Loan | Loan | 4.20 | % | 3/24/2017 | 2,111,028 | 2,010,799 | 2,109,276 | |||||||||||||||||
| First Data Corporation | Financial Intermediaries | 2018 Dollar Term Loan | Loan | 4.20 | % | 3/23/2018 | 2,290,451 | 2,231,370 | 2,292,741 | |||||||||||||||||
| FMG Resources (August 2006) Pty LTD (FMG America Finance, Inc.) | Nonferrous Metals/Minerals | Loan | Loan | 4.25 | % | 6/28/2019 | 997,500 | 995,122 | 1,006,438 | |||||||||||||||||
| Four Seasons Holdings Inc. | Lodging & Casinos | Term Loan (First Lien) | Loan | 3.50 | % | 6/27/2020 | 498,750 | 498,750 | 498,750 | |||||||||||||||||
| Garda World Security Corporation | Business Equipment and Services | Term B Delayed Draw Loan | Loan | 4.00 | % | 11/6/2020 | 203,194 | 202,218 | 203,363 | |||||||||||||||||
| Garda World Security Corporation | Business Equipment and Services | Term B Loan | Loan | 4.00 | % | 11/6/2020 | 794,306 | 790,489 | 794,965 | |||||||||||||||||
| Gardner Denver, Inc. | Oil & Gas | Initial Dollar Term Loan | Loan | 4.25 | % | 7/30/2020 | 1,496,250 | 1,485,394 | 1,489,337 | |||||||||||||||||
| Generac Power Systems, Inc. | Industrial Equipment | Term Loan B | Loan | 3.50 | % | 5/31/2020 | 868,414 | 852,908 | 868,258 | |||||||||||||||||
| General Nutrition Centers, Inc. | Retailers (Except Food and Drugs) | Amended Tranche B Term Loan | Loan | 3.25 | % | 3/4/2019 | 4,740,112 | 4,722,664 | 4,725,892 | |||||||||||||||||
| Global Tel*Link Corporation | Business Equipment and Services | Term Loan (First Lien) | Loan | 5.00 | % | 5/23/2020 | 1,920,175 | 1,915,905 | 1,900,014 | |||||||||||||||||
| Goodyear Tire & Rubber Company, The | Chemicals/Plastics | Loan (Second Lien) | Loan | 4.75 | % | 4/30/2019 | 4,000,000 | 3,941,039 | 4,037,000 | |||||||||||||||||
| Grosvenor Capital Management Holdings, LP | Brokers/Dealers/Investment Houses | Initial Term Loan | Loan | 3.75 | % | 1/4/2021 | 3,500,000 | 3,482,803 | 3,489,080 | |||||||||||||||||
| Harland Clarke Holdings Corp. (fka Clarke American Corp.) | Publishing | Tranche B-4 Term Loan | Loan | 6.00 | % | 8/4/2019 | 500,000 | 497,500 | 500,780 | |||||||||||||||||
| HCA Inc. | Healthcare | Tranche B-4 Term Loan | Loan | 2.94 | % | 5/1/2018 | 5,720,353 | 5,390,148 | 5,713,947 | |||||||||||||||||
| Hertz Corporation, The | Automotive | Tranche B-1 Term Loan | Loan | 3.75 | % | 3/11/2018 | 2,970,000 | 3,005,791 | 2,973,683 | |||||||||||||||||
| Hologic, Inc. | Healthcare | Refinancing Tranche A Term Loan | Loan | 2.19 | % | 8/1/2017 | 2,312,500 | 2,307,973 | 2,313,425 | |||||||||||||||||
| Hunter Defense Technologies, Inc. | Aerospace and Defense | Term Loan | Loan | 3.45 | % | 8/22/2014 | 3,470,285 | 3,460,723 | 3,262,068 | |||||||||||||||||
| Huntsman International LLC | Chemicals/Plastics | Extended Term B Loan | Loan | 2.73 | % | 4/19/2017 | 3,920,000 | 3,892,467 | 3,919,020 | |||||||||||||||||
| Ikaria, Inc. | Healthcare | Initial Term Loan (First Lien) | Loan | 5.00 | % | 2/12/2021 | 500,000 | 497,515 | 502,815 | |||||||||||||||||
| Infor (US), Inc. (fka Lawson Software Inc.) | Business Equipment and Services | Tranche B-5 Term Loan | Loan | 3.75 | % | 6/3/2020 | 1,776,183 | 1,758,861 | 1,772,488 | |||||||||||||||||
| Inventiv Health, Inc. (fka Ventive Health, Inc) | Conglomerate | Consolidated Term Loan | Loan | 7.50 | % | 8/4/2016 | 492,090 | 492,090 | 491,105 | |||||||||||||||||
| J. Crew Group, Inc. | Retailers (Except Food and Drugs) | Term B-1 Loan Retired 03/05/2014 | Loan | 4.00 | % | 3/7/2018 | 972,500 | 972,500 | 972,656 | |||||||||||||||||
| JFB Firth Rixson Inc. | Industrial Equipment | 2013 Replacement Dollar Term Facility Loan | Loan | 4.25 | % | 6/30/2017 | 2,564,311 | 2,554,534 | 2,568,054 | |||||||||||||||||
| Kinetic Concepts, Inc. | Healthcare | Dollar Term D-1 Loan | Loan | 4.00 | % | 5/4/2018 | 490,057 | 475,404 | 492,508 | |||||||||||||||||
| La Quinta Intermediate Holdings L.L.C | Gaming and Hotels | Initial Term Loan | Loan | 4.00 | % | 2/19/2021 | 500,000 | 500,000 | 500,000 | |||||||||||||||||
| Michaels Stores, Inc. | Retailers (Except Food and Drugs) | Term B Loan | Loan | 3.75 | % | 1/28/2020 | 496,250 | 496,250 | 497,302 | |||||||||||||||||
| Microsemi Corporation | Electronics/Electric | Incremental Term Loan | Loan | 3.75 | % | 2/19/2020 | 498,750 | 498,750 | 499,373 | |||||||||||||||||
| Microsemi Corporation | Electronics/Electric | Term Loan | Loan | 3.50 | % | 2/19/2020 | 2,393,981 | 2,389,463 | 2,398,482 | |||||||||||||||||
| Mitel US Holdings, Inc. | Telecommunications | Term Loan | Loan | 5.25 | % | 1/31/2020 | 250,000 | 248,753 | 252,083 | |||||||||||||||||
| National CineMedia, LLC | Leisure Goods/Activities/Movies | Term Loan (2013) | Loan | 2.95 | % | 11/26/2019 | 1,086,207 | 1,054,177 | 1,082,134 | |||||||||||||||||
| Newsday, LLC | Publishing | Term Loan | Loan | 3.69 | % | 10/12/2016 | 2,215,385 | 2,213,416 | 2,215,385 | |||||||||||||||||
| Novelis, Inc. | Conglomerate | Initial Term Loan | Loan | 3.75 | % | 3/10/2017 | 4,857,520 | 4,868,347 | 4,873,452 | |||||||||||||||||
| NPC International, Inc. | Food Services | Term Loan (2013) | Loan | 4.00 | % | 12/28/2018 | 490,833 | 490,833 | 493,597 | |||||||||||||||||
| NRG Energy, Inc. | Utilities | Term Loan (2013) | Loan | 2.75 | % | 7/1/2018 | 3,900,525 | 3,875,534 | 3,872,168 | |||||||||||||||||
| NuSil Technology LLC. | Chemicals/Plastics | Term Loan | Loan | 5.25 | % | 4/7/2017 | 809,163 | 809,163 | 799,558 | |||||||||||||||||
| OEP Pearl Dutch Acquisition B.V. | Chemicals/Plastics | Initial BV Term Loan | Loan | 6.50 | % | 3/30/2018 | 142,422 | 140,466 | 143,846 | |||||||||||||||||
| On Assignment, Inc. | Business Equipment and Services | Initial Term B Loan | Loan | 3.50 | % | 5/15/2020 | 1,311,364 | 1,303,125 | 1,312,190 | |||||||||||||||||
| Onex Carestream Finance LP | Healthcare | Term Loan (First Lien 2013) | Loan | 5.00 | % | 2/25/2017 | 4,531,159 | 4,511,264 | 4,582,135 | |||||||||||||||||
| OpenLink International, Inc. | Computers & Electronics | Replacement Term Loan | Loan | 6.25 | % | 10/30/2017 | 980,000 | 980,000 | 980,000 | |||||||||||||||||
| P.F. Chang's China Bistro, Inc. (Wok Acquisition Corp.) | Food/Drug Retailers | Term Borrowing | Loan | 5.50 | % | 6/22/2019 | 1,496,212 | 1,488,641 | 1,509,675 | |||||||||||||||||
| P2 Upstream Acquisition Co. (P2 Upstream Canada BC ULC) | Business Equipment and Services | Term Loan (First Lien) | Loan | 5.00 | % | 10/30/2020 | 1,000,000 | 995,186 | 1,008,750 | |||||||||||||||||
| Patheon Inc. | Healthcare | Term Loan | Loan | 4.25 | % | 3/11/2021 | 3,000,000 | 2,992,500 | 2,990,640 | |||||||||||||||||
| PetCo Animal Supplies, Inc. | Retailers (Except Food and Drugs) | New Loans | Loan | 4.00 | % | 11/24/2017 | 1,484,694 | 1,483,250 | 1,489,103 | |||||||||||||||||
| Pharmaceutical Product Development, Inc. (Jaguar Holdings, LLC) | Conglomerate | 2013 Term Loan | Loan | 4.00 | % | 12/5/2018 | 1,960,200 | 1,936,226 | 1,967,845 | |||||||||||||||||
| Pinnacle Foods Finance LLC | Food Products | New Term Loan G | Loan | 3.25 | % | 4/29/2020 | 4,962,500 | 4,951,514 | 4,942,352 | |||||||||||||||||
| Polymer Group, Inc. | Chemicals/Plastics | Initial Loan | Loan | 5.25 | % | 12/19/2019 | 500,000 | 497,500 | 501,875 | |||||||||||||||||
| Prestige Brands, Inc. | Drugs | Term B-1 Loan | Loan | 3.75 | % | 1/31/2019 | 435,606 | 430,195 | 437,022 | |||||||||||||||||
| Pro Mach, Inc. | Industrial Equipment | Term Loan | Loan | 4.50 | % | 7/6/2017 | 1,945,655 | 1,934,699 | 1,955,383 | |||||||||||||||||
| Progressive Waste Solutions Ltd. | Ecological Services and Equipment | Term B Loan | Loan | 3.00 | % | 10/24/2019 | 498,741 | 498,741 | 500,486 | |||||||||||||||||
| Quintiles Transnational Corp. | Conglomerate | Term B-3 Loan | Loan | 3.75 | % | 6/8/2018 | 3,681,541 | 3,646,328 | 3,685,186 | |||||||||||||||||
| Redtop Acquisitions Limited | Electronics/Electric | Initial Dollar Term Loan (First Lien) | Loan | 4.50 | % | 12/3/2020 | 500,000 | 496,369 | 502,915 | |||||||||||||||||
| Rexnord LLC/RBS Global, Inc. | Industrial Equipment | Term B Loan | Loan | 4.00 | % | 4/1/2018 | 1,663,476 | 1,663,476 | 1,667,035 | |||||||||||||||||
| Reynolds Group Holdings Inc. | Industrial Equipment | Incremental U.S. Term Loan | Loan | 4.00 | % | 9/28/2018 | 1,980,000 | 1,980,000 | 1,993,365 | |||||||||||||||||
| Rocket Software, Inc. | Business Equipment and Services | Term Loan (First Lien) | Loan | 5.75 | % | 2/8/2018 | 1,960,025 | 1,934,083 | 1,960,515 | |||||||||||||||||
| Rovi Solutions Corporation / Rovi Guides, Inc. | Electronics/Electric | Tranche A-2 Loan | Loan | 2.45 | % | 3/29/2017 | 1,562,552 | 1,552,098 | 1,562,552 | |||||||||||||||||
| Rovi Solutions Corporation / Rovi Guides, Inc. | Electronics/Electric | Tranche B-3 Term Loan | Loan | 3.50 | % | 3/29/2019 | 1,344,450 | 1,339,560 | 1,341,088 | |||||||||||||||||
| RPI Finance Trust | Drugs | Term B-2 Term Loan | Loan | 3.25 | % | 5/9/2018 | 5,308,218 | 5,283,397 | 5,339,165 | |||||||||||||||||
| Scitor Corporation | Business Equipment and Services | Term Loan | Loan | 5.00 | % | 2/15/2017 | 463,977 | 462,831 | 460,354 | |||||||||||||||||
| Sensata Technologies B.V./Sensata Technology Finance Company, LLC | Industrial Equipment | Term Loan | Loan | 3.25 | % | 5/12/2019 | 1,524,730 | 1,524,730 | 1,529,106 | |||||||||||||||||
| Sensus USA Inc. (fka Sensus Metering Systems) | Utilities | Term Loan (First Lien) | Loan | 5.75 | % | 5/9/2017 | 1,945,013 | 1,939,821 | 1,957,987 | |||||||||||||||||
| ServiceMaster Company, The | Conglomerate | Tranche B Term Loan | Loan | 4.45 | % | 1/31/2017 | 2,822,729 | 2,830,165 | 2,825,552 | |||||||||||||||||
| SI Organization, Inc., The | Aerospace and Defense | New Tranche B Term Loan | Loan | 5.50 | % | 11/22/2016 | 3,880,675 | 3,863,008 | 3,800,655 | |||||||||||||||||
| Sonneborn, LLC | Chemicals/Plastics | Initial US Term Loan | Loan | 6.50 | % | 3/30/2018 | 807,059 | 795,976 | 815,130 | |||||||||||||||||
| Sophia, L.P. | Electronics/Electric | Term B Loan | Loan | 4.50 | % | 7/19/2018 | 928,389 | 917,174 | 934,191 | |||||||||||||||||
| Southwire Company, LLC (f.k.a Southwire Company) | Building and Development | Initial Term Loan | Loan | 3.25 | % | 2/10/2021 | 500,000 | 498,758 | 499,730 | |||||||||||||||||
| SRA International Inc. | Aerospace and Defense | Term Loan | Loan | 6.50 | % | 7/20/2018 | 3,268,571 | 3,184,532 | 3,276,743 | |||||||||||||||||
| SRAM, LLC | Industrial Equipment | Term Loan (First Lien) | Loan | 4.01 | % | 4/10/2020 | 3,304,614 | 3,278,551 | 3,304,614 | |||||||||||||||||
| SS&C Technologies Holdings Europe S.A.R.L. | Business Equipment and Services | 2013 Replacement Term B-2 Loan | Loan | 3.25 | % | 6/7/2019 | 64,638 | 64,070 | 64,839 | |||||||||||||||||
| SS&C Technologies, Inc., /Sunshine Acquisition II, Inc. | Business Equipment and Services | 2013 Replacement Term B-1 Loan | Loan | 3.25 | % | 6/7/2019 | 624,838 | 619,344 | 626,782 | |||||||||||||||||
| SunCoke Energy, Inc. | Nonferrous Metals/Minerals | Tranche B Term Loan | Loan | 4.00 | % | 7/26/2018 | 1,367,311 | 1,359,200 | 1,367,311 | |||||||||||||||||
| SunGard Data Systems Inc (Solar Capital Corp.) | Conglomerate | Tranche C Term Loan | Loan | 3.95 | % | 2/28/2017 | 304,311 | 302,167 | 305,452 | |||||||||||||||||
| SunGard Data Systems Inc (Solar Capital Corp.) | Conglomerate | Tranche E Term Loan | Loan | 4.00 | % | 3/8/2020 | 4,221,845 | 4,096,936 | 4,238,944 | |||||||||||||||||
| SuperMedia Inc. (fka Idearc Inc.) | Publishing | Loan | Loan | 11.60 | % | 12/30/2016 | 264,330 | 257,131 | 196,762 | |||||||||||||||||
| Syniverse Holdings, Inc. | Telecommunications | Initial Term Loan | Loan | 4.00 | % | 4/23/2019 | 479,913 | 476,371 | 480,911 | |||||||||||||||||
| Taminco Global Chemical Corporation | Chemicals/Plastics | Initial Tranche B-3 Dollar Term Loan | Loan | 3.25 | % | 2/15/2019 | 1,473,863 | 1,464,165 | 1,473,406 | |||||||||||||||||
| Team Health, Inc. | Healthcare | Tranche B Term Loan | Loan | 3.75 | % | 6/29/2018 | 4,387,500 | 4,373,856 | 4,387,500 | |||||||||||||||||
| TECTUM HOLDINGS INC | Industrial Equipment | Term Loan | Loan | 6.50 | % | 12/3/2015 | 3,800,160 | 3,788,706 | 3,762,159 | |||||||||||||||||
| Tomkins, LLC / Tomkins, Inc. (f/k/a Pinafore, LLC / Pinafore, Inc.) | Conglomerate | Term B-2 Loan | Loan | 3.75 | % | 9/29/2016 | 2,356,680 | 2,360,795 | 2,361,982 | |||||||||||||||||
| TransDigm Inc. | Aerospace and Defense | Tranche C Term Loan | Loan | 3.75 | % | 2/28/2020 | 4,896,514 | 4,904,843 | 4,914,876 | |||||||||||||||||
| Tricorbraun Inc. (fka Kranson Industries, Inc.) | Containers/Glass Products | Term Loan | Loan | 4.00 | % | 5/3/2018 | 1,902,083 | 1,895,432 | 1,903,282 | |||||||||||||||||
| Truven Health Analytics Inc. (fka Thomson Reuters (Healthcare) Inc.) | Healthcare | New Tranche B Term Loan | Loan | 4.50 | % | 6/6/2019 | 492,528 | 484,755 | 493,513 | |||||||||||||||||
| U.S. Security Associates Holdings, Inc. | Business Equipment and Services | Delayed Draw Loan | Loan | 6.00 | % | 7/28/2017 | 160,148 | 159,235 | 160,348 | |||||||||||||||||
| U.S. Security Associates Holdings, Inc. | Business Equipment and Services | Term B Loan | Loan | 6.00 | % | 7/28/2017 | 122,494 | 122,109 | 122,648 | |||||||||||||||||
| U.S. Security Associates Holdings, Inc. | Business Equipment and Services | Term B Loan | Loan | 6.00 | % | 7/28/2017 | 818,172 | 813,513 | 819,195 | |||||||||||||||||
| U.S. Silica Company | Nonferrous Metals/Minerals | Term Loan | Loan | 4.00 | % | 7/23/2020 | 1,950,200 | 1,941,292 | 1,954,256 | |||||||||||||||||
| U.S. Xpress Enterprises, Inc. | Industrial Equipment | Extended Term Loan | Loan | 9.38 | % | 11/13/2016 | 2,805,278 | 2,766,405 | 2,777,225 | |||||||||||||||||
| United Surgical Partners International, Inc. | Healthcare | New Tranche B Term Loan | Loan | 4.75 | % | 4/3/2019 | 2,456,500 | 2,429,626 | 2,470,821 | |||||||||||||||||
| Univar Inc. | Chemicals/Plastics | Term B Loan | Loan | 5.00 | % | 6/30/2017 | 3,884,944 | 3,884,238 | 3,859,225 | |||||||||||||||||
| Univision Communications Inc. | Telecommunications | Replacement First-Lien Term Loan | Loan | 4.00 | % | 3/1/2020 | 2,977,500 | 2,959,200 | 2,984,467 | |||||||||||||||||
| UPC Financing Partnership | Broadcast Radio and Television | Facility AF | Loan | 4.00 | % | 1/31/2021 | 1,000,000 | 974,618 | 1,002,500 | |||||||||||||||||
| Valeant Pharmaceuticals International, Inc. | Drugs | Series D2 Term Loan B | Loan | 3.75 | % | 2/13/2019 | 2,947,688 | 2,936,432 | 2,955,528 | |||||||||||||||||
| Verint Systems Inc. | Business Equipment and Services | Term Loan | Loan | 4.00 | % | 9/6/2019 | 1,900,800 | 1,892,737 | 1,904,602 | |||||||||||||||||
| Verint Systems Inc. | Business Equipment and Services | Tranche B Incremental Term Loan | Loan | 3.50 | % | 9/6/2019 | 1,000,000 | 997,521 | 1,000,000 | |||||||||||||||||
| Vertafore, Inc. | Business Equipment and Services | Term Loan (2013) | Loan | 4.25 | % | 10/3/2019 | 2,899,621 | 2,899,621 | 2,909,770 | |||||||||||||||||
| Visant Corporation (fka Jostens) | Leisure Goods/Activities/Movies | Tranche B Term Loan (2011) | Loan | 5.25 | % | 12/22/2016 | 3,658,446 | 3,658,446 | 3,607,008 | |||||||||||||||||
| W.R. Grace & Co.-CONN | Chemicals/Plastics | Delayed Draw Term Loan | Loan | 0.00 | % | 2/3/2021 | - | (328 | ) | - | ||||||||||||||||
| W.R. Grace & Co.-CONN | Chemicals/Plastics | U.S. Term Loan | Loan | 3.00 | % | 2/3/2021 | 368,421 | 367,502 | 367,828 | |||||||||||||||||
| Washington Inventory Service | Business Equipment and Services | U.S. Term Loan (First Lien) | Loan | 6.75 | % | 12/20/2018 | 1,980,000 | 2,004,187 | 1,965,150 | |||||||||||||||||
| Wendy's International, Inc | Food Services | Term B Loan | Loan | 3.25 | % | 5/15/2019 | 680,469 | 674,563 | 679,197 | |||||||||||||||||
| Wesco Aircraft Hardware Corp. | Aerospace and Defense | Tranche B Term Loan | Loan | 4.75 | % | 2/28/2021 | 500,000 | 498,750 | 498,750 | |||||||||||||||||
| West Corporation | Telecommunications | Term B-10 Loan | Loan | 3.25 | % | 6/30/2018 | 2,926,111 | 2,976,179 | 2,909,666 | |||||||||||||||||
|
|
|
| |||||||||||||||||||||||
| $ | 299,137,566 | $ | 300,491,077 | |||||||||||||||||||||||
|
|
|
| |||||||||||||||||||||||
See accompanying notes to financial statements.
S-6
Saratoga Investment Corp. CLO 2013-1, Ltd.
Statements of Changes in Net Assets
| For the year ended February 28, 2015 | For the year ended February 28, 2014 | For the year ended February 28, 2013 | ||||||||||
INCREASE FROM OPERATIONS: | ||||||||||||
Net investment income (loss) | $ | 793,848 | $ | (2,143,630 | ) | $ | 1,033,327 | |||||
Net realized gain (loss) from investments | 620,817 | (8,815,296 | ) | 2,532,558 | ||||||||
Net unrealized appreciation (depreciation) on investments | (3,874,583 | ) | 6,776,871 | 3,235,774 | ||||||||
|
|
|
|
|
| |||||||
Net increase (decrease) in net assets from operations | (2,459,918 | ) | (4,182,055 | ) | 6,801,659 | |||||||
|
|
|
|
|
| |||||||
Total increase (decrease) in net assets | (2,459,918 | ) | (4,182,055 | ) | 6,801,659 | |||||||
Net assets at beginning of period | (3,343,238 | ) | 838,817 | (5,962,842 | ) | |||||||
|
|
|
|
|
| |||||||
Net assets at end of period | $ | (5,803,156 | ) | $ | (3,343,238 | ) | $ | 838,817 | ||||
|
|
|
|
|
| |||||||
See accompanying notes to financial statements.
S-7
Saratoga Investment Corp. CLO 2013-1, Ltd.
Statements of Cash Flows
| For the year ended February 28, 2015 | For the year ended February 28, 2014 | For the year ended February 28, 2013 | ||||||||||
Operating activities | ||||||||||||
NET INCREASE (DECREASE) IN NET ASSETS FROM OPERATIONS | $ | (2,459,918 | ) | $ | (4,182,055 | ) | $ | 6,801,659 | ||||
ADJUSTMENTS TO RECONCILE NET INCREASE (DECREASE) IN NET ASSETS FROM OPERATIONS TO NET CASH PROVIDED BY (USED BY) OPERATING ACTIVITIES: | ||||||||||||
Paid-in-kind interest income | (167,097 | ) | (10,122 | ) | - | |||||||
Net accretion of discount on investments | (454,809 | ) | (568,674 | ) | (1,383,978 | ) | ||||||
Amortization of deferred debt financing costs | 953,862 | 994,602 | 1,015,332 | |||||||||
Loss on extinguishment of debt | - | 3,442,442 | - | |||||||||
Net realized (gain) loss from investments | (620,817 | ) | 8,815,296 | (2,532,558 | ) | |||||||
Net unrealized appreciation on investments | 3,874,583 | (6,776,871 | ) | (3,235,774 | ) | |||||||
Proceeds from sale and redemption of investments | 141,358,326 | 128,190,654 | 165,363,963 | |||||||||
Purchase of investments | (138,738,379 | ) | (55,721,381 | ) | (151,267,166 | ) | ||||||
(Increase) decrease in operating assets: | ||||||||||||
Interest receivable | 160,315 | 134,033 | (3,547 | ) | ||||||||
Receivable from open trades | (318,421 | ) | 3,330,272 | 4,915,102 | ||||||||
Other Assets | 91,336 | (91,336 | ) | - | ||||||||
Increase (decrease) in operating liabilities: | ||||||||||||
Interest Payable | 9,410 | (43,645 | ) | (160,620 | ) | |||||||
Payable for open trades | (4,230,669 | ) | (6,901,250 | ) | (8,510,897 | ) | ||||||
Accrued base management fee | 10,904 | 31,882 | (2,345 | ) | ||||||||
Accrued subordinated management fee | 10,904 | (97,629 | ) | (9,382 | ) | |||||||
|
|
|
|
|
| |||||||
NET CASH (USED BY) PROVIDED BY OPERATING ACTIVITIES | (520,470 | ) | 70,546,218 | 10,989,789 | ||||||||
|
|
|
|
|
| |||||||
Financing activities | ||||||||||||
Borrowings on debt | - | 277,711,620 | - | |||||||||
Paydowns on debt | (1,666,666 | ) | (366,793,378 | ) | - | |||||||
Deferred debt financing costs | - | (2,250,398 | ) | - | ||||||||
|
|
|
|
|
| |||||||
NET CASH USED BY FINANCING ACTIVITIES | (1,666,666 | ) | (91,332,156 | ) | - | |||||||
|
|
|
|
|
| |||||||
NET INCREASE (DECREASE) IN CASH AND CASH EQUIVALENTS | (2,187,136 | ) | (20,785,938 | ) | 10,989,789 | |||||||
CASH AND CASH EQUIVALENTS, BEGINNING OF PERIOD | 8,018,933 | 28,804,871 | 17,815,082 | |||||||||
|
|
|
|
|
| |||||||
CASH AND CASH EQUIVALENTS, END OF PERIOD | $ | 5,831,797 | $ | 8,018,933 | $ | 28,804,871 | ||||||
|
|
|
|
|
| |||||||
Supplemental Information: | ||||||||||||
Interest paid during the period | $ | 9,625,726 | $ | 11,722,159 | $ | 15,773,621 | ||||||
Supplemental non-cash information: | ||||||||||||
Paid-in-kind interest income | $ | 167,097 | $ | 10,122 | $ | - | ||||||
Net accretion of discount on investments | $ | 454,809 | $ | 568,674 | $ | 1,383,978 | ||||||
Amortization of deferred debt financing costs | $ | 953,862 | $ | 994,602 | $ | 1,015,332 | ||||||
See accompanying notes to financial statements.
S-8
SARATOGA INVESTMENT CORP. CLO 2013-1, LTD.
NOTES TO FINANCIAL STATEMENTS
1. Organization and Purpose
Saratoga Investment Corp. CLO 2013-1, Ltd. (the "Issuer", "we", "our", "us", "CLO" and "Saratoga CLO"), an exempted company with limited liability incorporated under the laws of the Cayman Islands was formed on November 28, 2007 and commenced operations on January 22, 2008. The Issuer was established to acquire or participate in U.S. dollar-denominated corporate debt obligations.
On January 22, 2008, the Issuer issued $400.0 million of notes, consisting of Class A Floating Rate Senior Notes, Class B Floating Rate Senior Notes, Class C Deferrable Floating Rate Notes, Class D Deferrable Floating Rate Notes, Class E Deferrable Floating Rate Notes (collectively the "Secured Notes"), and Subordinated Notes. The notes were issued pursuant to an indenture, dated January 22, 2008 (the "Indenture"), with U.S. Bank National Association (the "Trustee") servicing as the Trustee there under.
On October 17, 2013, in a refinancing transaction, the Issuer issued $284.9 million of notes (the "2013-1 CLO Notes"), consisting of Class X Floating Rate Senior Notes, Class A-1 Floating Rate Senior Notes, Class A-2 Floating Rate Senior Notes, Class B Floating Rate Senior Notes, Class C Deferrable Floating Rate Notes, Class D Deferrable Floating Rate Notes, Class E Deferrable Floating Rate Notes, and Class F Deferrable Floating Rate Notes. The 2013-1 CLO Notes were issued pursuant to the Indenture with the same Trustee. Proceeds of the issuance of the 2013-1 CLO Notes were used, along with existing assets held by the Trustee, to redeem all of the Secured Notes issued in 2008. As of February 28, 2015, Saratoga Investment Corp. owned 100% of the Subordinated Notes of the CLO.
Pursuant to an investment management agreement (the "Investment Management Agreement"), Saratoga Investment Corp. (the "Investment Manager"), provides investment management services to the Issuer, and makes day-to-day investment decisions concerning the assets of the Issuer. The Investment Manager also performs certain administrative services on behalf of the Issuer under the Investment Management Agreement.
2. Significant Accounting Policies
Basis of Presentation
The accompanying financial statements have been prepared in accordance with U.S. generally accepted accounting principles ("U.S. GAAP") and are stated in U.S. dollars. The following is a summary of the significant accounting policies followed by the Issuer in the preparation of its financial statements.
The Issuer is considered to be an investment company for financial reporting purposes and has applied the guidance in Topic 946, "Financial Services-Investment Companies." There has been no change to the Issuer's status as an investment company during the year ended February 28, 2015.
Use of Estimates
The preparation of the financial statements in conformity with U.S. GAAP requires the Investment Manager to make estimates and assumptions that affect the reported amounts of assets and liabilities at the date of the financial statements, including the fair value of investments, and the amounts of income and expenses during the reporting period. Actual results could differ from these estimates and such differences could be material.
Cash and Cash Equivalents
The Issuer defines cash and cash equivalents as highly liquid financial instruments with original maturities of three months or less. Cash and cash equivalents may include investments in money market mutual funds, which are carried at fair value. At February 28, 2015 and February 28, 2014, cash and cash equivalents amounted to $5.8 million and $8.0 million, respectively, and are swept on an overnight basis into a money market deposit account and invested in shares of JP Morgan Liquidity Institutional fund held at the Trustee.
S-9
Valuation of Investments
The Issuer accounts for its investments at fair value in accordance with the Financial Accounting Standards Board ("FASB") Accounting Standards Codification ("ASC") Topic 820, Fair Value Measurements and Disclosures ("ASC 820"). ASC 820 defines fair value, establishes a framework for measuring fair value, establishes a fair value hierarchy based on the quality of inputs used to measure fair value and enhances disclosure requirements for fair value measurements. ASC 820 requires the Issuer to assume that its investments are to be sold at the Statement of Assets and Liabilities date in the principal market to independent market participants, or in the absence of a principal market, in the most advantageous market, which may be a hypothetical market. Market participants are defined as buyers and sellers in the principal or most advantageous market that are independent, knowledgeable, and willing and able to transact.
Investments for which market quotations are readily available are fair valued at such market quotations obtained from independent third party pricing services and market makers subject to any decision by the Investment Manager to approve a fair value determination to reflect significant events affecting the value of these investments. The Investment Manager values investments for which market quotations are not readily available at fair value. Determinations of fair value may involve significant judgments and estimates. The types of factors that may be considered in determining the fair value of investments include the nature and realizable value of any collateral, the portfolio company's ability to make payments, market yield trend analysis, the markets in which the portfolio company does business, comparison to publicly traded companies, discounted cash flow and other relevant factors.
Because such valuations, and particularly valuations of private investments and private companies, are inherently uncertain, they may fluctuate over short periods of time and may be based on estimates. The determination of fair value may differ materially from the values that would have been used if a ready market for these investments existed. Our net asset value could be materially affected if the determinations regarding the fair value of our investments were materially higher or lower than the values that are ultimately realized upon the disposal of such investments.
Investment Transactions and Income Recognition
Purchases and sales of investments and the related realized gains or losses are recorded on a trade-date basis. Interest income, adjusted for amortization of premium and accretion of discount, is recorded on an accrual basis to the extent that such amounts are expected to be collected. The Issuer stops accruing interest on its investments when it is determined that interest is no longer collectible. Discounts and premiums on investments purchased are accreted/amortized over the life of the respective investment using the effective yield method. The amortized cost of investments represents the original cost adjusted for the accretion of discounts and amortizations of premium on investments.
Loans are generally placed on non-accrual status when there is reasonable doubt that principal or interest will be collected. Accrued interest is generally reserved when a loan is placed on non-accrual status. Interest payments received on non-accrual loans may be recognized as a reduction in principal depending upon the Investment Manager's judgment regarding collectability. Non-accrual loans are restored to accrual status when past due principal and interest is paid and, in management's judgment, are likely to remain current, although we may make exceptions to this general rule if the loan has sufficient collateral value and is in the process of collection.
Paid-in-Kind Interest
The Issuer holds debt investments in its portfolio that contain a PIK interest provision. The PIK interest, which represents contractually deferred interest added to the investment balance that is generally due at maturity, is generally recorded on the accrual basis to the extent such amounts are expected to be collected. We stop accruing PIK interest if we do not expect the issuer to be able to pay all principal and interest when due.
Deferred Debt Financing Costs, net
In April 2015, the FASB has issued Accounting Standards Update ("ASU") No. 2015-03, Interest-Imputation of Interest (Subtopic 835-30): Simplifying the Presentation of Debt Issuance Costs ("ASU 2015-03"). The amendments in this ASU require that debt issuance costs related to a recognized debt liability be presented in the balance sheet as a direct deduction from the carrying amount of that debt liability, consistent with debt discounts. The recognition and measurement guidance for debt issuance costs are not affected by the amendments in this ASU. The guidance is effective for fiscal years, and interim periods within those fiscal years, beginning after December 15, 2015, and early adoption is allowed, and is to be applied on a retrospective basis. Management has adopted the provisions of ASU 2015-03 as of February 28, 2015, by reclassifying deferred debt financing costs from within total assets to within total liabilities as a contra-liability. The adoption of the provisions of ASU 2015-03 did not materially impact the Issuer's financial position or results of operations. Prior period amounts were reclassified to conform to the current period presentation.
S-10
Included in deferred debt financing costs of $1.9 million as of February 28, 2015 are structuring fees of the investment bank, rating agency fees and legal fees associated with the issuance of the 2013-1 CLO Notes on October 17, 2013. Such costs have been capitalized and amortized using an effective yield method, over the life of the related notes.
Included in deferred debt financing costs of $2.2 million as of February 28, 2014 are structuring fees of the investment bank, rating agency fees and legal fees associated with the issuance of the 2013-1 CLO Notes on October 17, 2013. Such costs have been capitalized and amortized using an effective yield method, over the life of the related notes.
Deferred debt financing costs of $1.6 million, incurred in connection with the issuance of the Secured Notes, were expensed when the Secured Notes were extinguished on October 17, 2013.
Management Fees
The Issuer is externally managed by the Investment Manager pursuant to the Investment Management Agreement. As compensation for the performance of its obligations under the Investment Management Agreement, the Investment Manager is entitled to receive from the Issuer a base management fee (the "Base Management Fee"), a subordinated management fee (the "Subordinated Management Fee") and an incentive management fee (the "Incentive Management Fee"). The Base Management Fee is payable in arrears quarterly (subject to availability of funds and to the satisfaction of payment obligations on the debt obligations of the Issuer (the "Priority of Payments") in an amount equal to 0.25% per annum of the Fee Basis Amount at the beginning of the Collection Period. The Subordinated Management Fee is payable in arrears quarterly (subject to availability of funds and to the Priority of Payments) in an amount equal to 0.25% per annum of the Fee Basis Amount at the beginning of the Collection Period. The Incentive Management Fee equals 20% of the remaining interest proceeds and principal proceeds, if any, after the Subordinated Notes have realized the incentive management fee target return of 12.0%, in accordance with the Priority of Payments after making the prior distributions on the relevant payment date. For the years ended February 28, 2015, 2014 and 2013, no Incentive Management Fee's have been paid.
Expenses
The Issuer bears its own organizational and offering expenses, all expenses related to its investment program and expenses incurred in connection with its operations including, but not limited to, external legal, administrative, trustee, accounting, tax and audit expenses, costs related to trading, acquiring, monitoring or disposing of investments of the Issuer, and interest and other borrowing expenses, expenses of preparing and distributing reports, financial statements, and litigation or other extraordinary expenses. The Issuer has retained the Trustee to provide trustee services. Additionally, the Trustee performs loan administration, debt covenant compliance calculations, and monitoring and reporting services. For the years ended February 28, 2015, 2014 and 2013, the Issuer paid $0.1 million, $0.1 million, $0.1 million, respectively, for trustee services provided and is included in other expenses in the Statement of Operations.
Interest Expense
The Issuer has issued rated and unrated notes to finance its operations. Interest on debt is calculated by the Trustee for the Issuer. Interest is accrued and generally paid quarterly. For the years ended February 28, 2015, 2014 and 2013, $3.7 million, $5.7 million, $8.8 million of payments to the Subordinated Notes were included in interest expense in the Statement of Operations, respectively.
Risk Management
In the ordinary course of its business, the Issuer manages a variety of risks, including market risk and credit risk. Market risk is the risk of potential adverse changes to the value of investments because of changes in market conditions such as interest rate movements and volatility in investment prices.
Credit risk is the risk of default or non-performance by portfolio companies, equivalent to the investment's carrying amount.
The Issuer is also exposed to credit risk related to maintaining all of its cash and cash equivalents, including those in reserve accounts, at a major financial institution.
S-11
The Issuer has investments in lower rated and comparable quality unrated high yield bonds and bank loans. Investments in high yield investments are accompanied by a greater degree of credit risk. The risk of loss due to default by the issuer is significantly greater for holders of high yield securities, because such investments are generally unsecured and are often subordinated to other creditors of the issuer.
New Accounting Pronouncements
In February 2015, the FASB issued ASU 2015-02, Consolidation (ASC Topic 810): Amendments to the Consolidation Analysis ("ASU 2015-02"). ASU 2015-02 significantly changes the consolidation analysis required under GAAP and ends the deferral granted to investment companies from applying the variable interest entity guidance. ASU 2015-02 is effective for interim and annual reporting periods in fiscal years that begin after December 15, 2015 and early adoption is permitted. Management is currently evaluating the impact these changes will have on the Issuer's financial statements and disclosures.
In August 2014, the FASB issued new accounting guidance that requires management to assess an entity's ability to continue as a going concern by incorporating and expanding upon certain principles that are currently in U.S. auditing standards. The amendments provide a definition of the term "substantial doubt" and include principles for considering the mitigating effect of management's plans. The amendments also require an evaluation every reporting period, including interim periods for a period of one year after the date that the financial statements are issued (or available to be issued), and certain disclosures when substantial doubt is alleviated or not alleviated. The amendments in this update are effective for reporting periods ending after December 15, 2016. Management is currently evaluating the impact of adopting this new accounting guidance update on the Issuer's financial statements.
In June 2014, the FASB issued ASU 2014-11, Repurchase-to-Maturity Transactions, Repurchase Financings, and Disclosures, ("ASU 2014-11"). ASU 2014-11 makes limited changes to the accounting for repurchase agreements, clarifies when repurchase agreements and securities lending transactions should be accounted for as secured borrowings, and requires additional disclosures regarding these types of transactions. The guidance is effective for fiscal years beginning on or after December 15, 2014, and for interim periods within those fiscal years. Management is currently evaluating the impact these changes will have on the Issuer's financial statement disclosures.
In May 2014, the Financial Accounting Standards Board ("FASB") issued Accounting Standards Update ("ASU") 2014-09, Revenue from Contracts with Customers (Topic 606) , which supersedes the revenue recognition requirements in Revenue Recognition (Topic 605). Under the new guidance, an entity should recognize revenue to depict the transfer of promised goods or services to customers in an amount that reflects the consideration to which the entity expects to be entitled in exchange for those goods or services. This guidance is effective for annual and interim reporting periods beginning after December 15, 2016, and early application is not permitted. The Issuer's currently evaluating the impact this ASU will have on its consolidated financial statements.
3. Fair Value Measurements
As noted above, the Issuer values all investments in accordance with ASC 820. ASC 820 requires enhanced disclosures about assets and liabilities that are measured and reported at fair value. As defined in ASC 820, fair value is the price that would be received to sell an asset or paid to transfer a liability in an orderly transaction between market participants at the measurement date.
ASC 820 establishes a hierarchal disclosure framework which prioritizes and ranks the level of market price observability of inputs used in measuring investments at fair value. Market price observability is affected by a number of factors, including the type of investment and the characteristics specific to the investment. Investments with readily available active quoted prices or for which fair value can be measured from actively quoted prices generally will have a higher degree of market price observability and a lesser degree of judgment used in measuring fair value.
Based on the observability of the inputs used in the valuation techniques, the Issuer is required to provide disclosures on fair value measurements according to the fair value hierarchy. The fair value hierarchy ranks the observability of the inputs used to determine fair values. Investments carried at fair value are classified and disclosed in one of the following three categories:
| • | Level 1-Valuations based on quoted prices in active markets for identical assets or liabilities that the Issuer has the ability to access. |
| • | Level 2-Valuations based on inputs other than quoted prices in active markets, which are either directly or indirectly observable. |
| • | Level 3-Valuations based on inputs that are unobservable and significant to the overall fair value measurement. The inputs used in the determination of fair value may require significant management judgment or estimation. Such information may be the result of consensus pricing information or broker quotes which include a disclaimer that the broker would not be held to such a price in an actual transaction. The non-binding nature of consensus pricing and/or quotes accompanied by disclaimer would result in classification as Level 3 asset, assuming no additional corroborating evidence. |
S-12
In addition to using the above inputs in investment valuations, the Issuer continues to employ the valuation policy that is consistent with ASC 820 and the 1940 Act.
The following table presents fair value measurements of investments, by major class, as of February 28, 2015, according to the fair value hierarchy:
| Fair Value Measurements | ||||||||||||||||
| Level 1 | Level 2 | Level 3 | Total | |||||||||||||
Term loans | $ | - | $ | 294,621,817 | $ | - | $ | 294,621,817 | ||||||||
Structured finance securities | - | - | - | - | ||||||||||||
Equity interest | - | 617,451 | - | 617,451 | ||||||||||||
|
|
|
|
|
|
|
| |||||||||
Total | $ | - | $ | 295,239,268 | $ | - | $ | 295,239,268 | ||||||||
|
|
|
|
|
|
|
| |||||||||
The following table presents fair value measurements of investments, by major class, as of February 28, 2014, according to the fair value hierarchy:
| Fair Value Measurements | ||||||||||||||||
| Level 1 | Level 2 | Level 3 | Total | |||||||||||||
Term loans | $ | - | $ | 297,872,178 | $ | 2,618,899 | $ | 300,491,077 | ||||||||
Structured finance securities | - | - | - | - | ||||||||||||
Equity interest | - | - | - | - | ||||||||||||
|
|
|
|
|
|
|
| |||||||||
Total | $ | - | $ | 297,872,178 | $ | 2,618,899 | $ | 300,491,077 | ||||||||
|
|
|
|
|
|
|
| |||||||||
Transfers into or out of Level 1, 2 or 3 are recognized at the reporting date.
The following table provides a reconciliation of the beginning and ending balances for investments that use Level 3 inputs for the year ended February 28, 2015:
| Term Loans | Structured Finance Securities | Equity Interest | ||||||||||
Balance as of February 28, 2014 | $ | 2,618,899 | $ | - | $ | - | ||||||
Net unrealized gains | 18,651 | - | - | |||||||||
Purchases and other adjustments to cost | 3,840 | - | - | |||||||||
Sales and redemptions | (2,658,626 | ) | - | - | ||||||||
Net realized gain from investments | 17,236 | - | - | |||||||||
|
|
|
|
|
| |||||||
Balance as of February 28, 2015 | $ | - | $ | - | $ | - | ||||||
|
|
|
|
|
| |||||||
The following table provides a reconciliation of the beginning and ending balances for investments that use Level 3 inputs for the year ended February 28, 2014:
| Term Loans | Structured Finance Securities | Equity Interest | ||||||||||
Balance as of February 28, 2013 | $ | 4,256,932 | $ | 10,850,000 | $ | 1,070,563 | ||||||
Net unrealized gains (losses) | (45,982 | ) | 2,189,036 | (394,438 | ) | |||||||
Purchases and other adjustments to cost | 34,872 | 203,167 | - | |||||||||
Sales and redemptions | (408,133 | ) | (13,846,450 | ) | (181,476 | ) | ||||||
Net realized gain (loss) from investments | 102,394 | 604,247 | (494,649 | ) | ||||||||
Net transfers in and/or out of Level 3(1) | (1,321,184 | ) | - | - | ||||||||
|
|
|
|
|
| |||||||
Balance as of February 28, 2014 | $ | 2,618,899 | $ | - | $ | - | ||||||
|
|
|
|
|
| |||||||
| (1) | The Issuer's investment in Tectum Holdings Inc. was transferred into Level 2 during the year ended February, 28, 2014, as the reliability of market quotes became available for this investment and have been subsequently used for valuation purposes. |
Transfers into or out of Level 3 are recognized at the reporting date.
S-13
Purchases and other adjustments to cost include purchases of new investments at cost, effects of refinancing/restructuring, accretion/amortization of income from discount/premium on debt securities, and PIK.
Sales and redemptions represent net proceeds received from investments sold, and principal paydowns received, during the period.
There were no level 3 investments held as of February 28, 2015. The net unrealized loss on level 3 investments held as of February 28, 2014, was $0.02 million, and is included in net unrealized appreciation on investments in the Statements of Operations.
Significant unobservable inputs used in the fair value measurement of the Issuer's term loans and structured finance securities include comparable market yields. For investments utilizing a yield analysis valuation technique, a significant increase (decrease) in the market yield, in isolation, would result in a significantly lower (higher) fair value measurement. Generally, a change in the assumption for comparable yields is accompanied by a directionally opposite change in the assumption used for pricing.
Significant unobservable inputs used in the fair value measurement of the Issuer's equity interests include EBITDA multiples. For investments utilizing EBITDA multiples, a significant increase (decrease) in the EBITDA multiple, in isolation, would result in a significant higher (lower) fair value measurement.
4. Financing
On January 22, 2008, the Issuer issued $400.0 million of notes, consisting of Class A Floating Rate Senior Notes, Class B Floating Rate Senior Notes, Class C Deferrable Floating Rate Notes, Class D Deferrable Floating Rate Notes, Class E Deferrable Floating Rate Notes (collectively the "Secured Notes"), and Subordinated Notes. The notes were issued pursuant to the Indenture.
The Secured Notes are limited recourse obligations of the Issuer. The Subordinated Notes are unsecured, limited recourse debt obligations of the Issuer.
On October 17, 2013, the Issuer issued $284.9 million of notes (the "2013-1 CLO Notes"), consisting of Class X Floating Rate Senior Notes, Class A-1 Floating Rate Senior Notes, Class A-2 Floating Rate Senior Notes, Class B Floating Rate Senior Notes, Class C Deferrable Floating Rate Notes, Class D Deferrable Floating Rate Notes, Class E Deferrable Floating Rate Notes, and Class F Deferrable Floating Rate Notes. The 2013-1 CLO Notes were issued pursuant to the Indenture with the same Trustee. Proceeds of the issuance of the 2013-1 CLO Notes were used along with existing assets held by the Trustee to redeem all of the Secured Notes issued in 2008. The Subordinated Notes were not included in the refinancing transaction.
The 2013-1 CLO Notes are limited recourse obligations of the Issuer. The Subordinated Notes are unsecured, limited recourse debt obligations of the Issuer.
The relative order of seniority of payment of each class of securities is, as follows: first, Class X Notes, second, Class A-1 Notes, third, Class A-2 Notes, fourth, Class B Notes, fifth, Class C Notes, sixth, Class D Notes, seventh, Class E Notes, eighth, Class F Notes, and ninth, the Subordinated Notes, with (a) each class of securities (other than the Subordinated Notes) in such list being senior to each other class of securities that follows such class of securities in such list and (b) each class of securities (other than the Class X Notes) in such list being subordinate to each other class of securities that precedes such class of securities in such list. The Subordinated Notes are subordinated to the 2013-1 CLO Notes and are entitled to periodic payments from interest proceeds available in accordance with the Priority of Payments.
The table below sets forth certain information for each outstanding class of notes issued, pursuant to the Indenture on October 17, 2013, at February 28, 2015:
Debt Security | Interest Rate | Maturity | Principal Amount | Amount Outstanding | ||||||||||
Class A-1 Floating Rate Senior Notes | LIBOR + 1.30% | October 20, 2023 | $ | 170,000,000 | $ | 170,000,000 | ||||||||
Class A-2 Floating Rate Senior Notes | LIBOR + 1.50% | October 20, 2023 | 20,000,000 | 20,000,000 | ||||||||||
Class B Floating Rate Senior Notes | LIBOR + 2.00% | October 20, 2023 | 44,800,000 | 44,800,000 | ||||||||||
Class C Deferrable Floating Rate Notes | LIBOR + 2.90% | October 20, 2023 | 16,000,000 | 16,000,000 | ||||||||||
Class D Deferrable Floating Rate Notes | LIBOR + 3.50% | October 20, 2023 | 14,000,000 | 14,000,000 | ||||||||||
Class E Deferrable Floating Rate Notes | LIBOR + 4.50% | October 20, 2023 | 13,100,000 | 13,100,000 | ||||||||||
Class F Deferrable Floating Rate Notes | LIBOR + 5.75% | October 20, 2023 | 4,500,000 | 4,500,000 | ||||||||||
Subordinated Notes | N/A | October 20, 2023 | 30,000,000 | 30,000,000 | ||||||||||
|
|
|
| |||||||||||
| $ | 312,400,000 | $ | 312,400,000 | |||||||||||
|
|
|
| |||||||||||
S-14
The table below sets forth certain information for each outstanding class of notes issued, pursuant to the Indenture on October 17, 2013, at February 28, 2014:
Debt Security | Interest Rate | Maturity | Principal Amount | Amount Outstanding | ||||||||||
Class X Floating Rate Senior Notes | LIBOR + 1.05% | October 20, 2023 | $ | 2,500,000 | $ | 1,666,666 | ||||||||
Class A-1 Floating Rate Senior Notes | LIBOR + 1.30% | October 20, 2023 | 170,000,000 | 170,000,000 | ||||||||||
Class A-2 Floating Rate Senior Notes | LIBOR + 1.50% | October 20, 2023 | 20,000,000 | 20,000,000 | ||||||||||
Class B Floating Rate Senior Notes | LIBOR + 2.00% | October 20, 2023 | 44,800,000 | 44,800,000 | ||||||||||
Class C Deferrable Floating Rate Notes | LIBOR + 2.90% | October 20, 2023 | 16,000,000 | 16,000,000 | ||||||||||
Class D Deferrable Floating Rate Notes | LIBOR + 3.50% | October 20, 2023 | 14,000,000 | 14,000,000 | ||||||||||
Class E Deferrable Floating Rate Notes | LIBOR + 4.50% | October 20, 2023 | 13,100,000 | 13,100,000 | ||||||||||
Class F Deferrable Floating Rate Notes | LIBOR + 5.75% | October 20, 2023 | 4,500,000 | 4,500,000 | ||||||||||
Subordinated Notes | N/A | October 20, 2023 | 30,000,000 | 30,000,000 | ||||||||||
|
|
|
| |||||||||||
| $ | 314,900,000 | $ | 314,066,666 | |||||||||||
|
|
|
| |||||||||||
The following table shows each outstanding class of notes issued, pursuant to the Indenture, at fair value at February 28, 2015:
Debt Security | February 28, 2015 | |||
Class A-1 Floating Rate Senior Notes | $ | 168,987,651 | ||
Class A-2 Floating Rate Senior Notes | 19,973,973 | |||
Class B Floating Rate Senior Notes | 44,569,451 | |||
Class C Deferrable Floating Rate Notes | 15,898,369 | |||
Class D Deferrable Floating Rate Notes | 13,737,672 | |||
Class E Deferrable Floating Rate Notes | 12,404,616 | |||
Class F Deferrable Floating Rate Notes | 4,234,225 | |||
Subordinated Notes | 17,031,146 | |||
|
| |||
| $ | 296,837,103 | |||
|
| |||
The following table shows each outstanding class of notes issued, pursuant to the Indenture, at fair value at February 28, 2014:
Debt Security | February 28, 2014 | |||
Class X Floating Rate Senior Notes | $ | 1,664,666 | ||
Class A-1 Floating Rate Senior Notes | 168,878,000 | |||
Class A-2 Floating Rate Senior Notes | 20,000,000 | |||
Class B Floating Rate Senior Notes | 44,679,040 | |||
Class C Deferrable Floating Rate Notes | 15,944,000 | |||
Class D Deferrable Floating Rate Notes | 13,766,200 | |||
Class E Deferrable Floating Rate Notes | 12,481,680 | |||
Class F Deferrable Floating Rate Notes | 4,398,300 | |||
Subordinated Notes | 19,569,596 | |||
|
| |||
| $ | 301,381,482 | |||
|
| |||
These notes are fair valued based on a discounted cash flow model, specifically using Intex cash flow models, to form the basis for the valuation and would be classified as level 3 liabilities within the fair value hierarchy.
S-15
The following table provides the weighted average interest rate for the years ended February 28, 2015, February 28, 2014 and February 28, 2013:
| Weighted Average Interest Rate | ||||||||||||||
Debt Security | Interest Rate | February 28, 2015 | February 28, 2014 | February 28, 2013 | ||||||||||
2013-1 CLO Notes | ||||||||||||||
Class X Floating Rate Senior Notes | LIBOR + 1.05% | 1.28 | % | 1.29 | % | N/A | ||||||||
Class A-1 Floating Rate Senior Notes | LIBOR + 1.30% | 1.53 | % | 1.54 | % | N/A | ||||||||
Class A-2 Floating Rate Senior Notes | LIBOR + 1.50% | 1.73 | % | 1.74 | % | N/A | ||||||||
Class B Floating Rate Senior Notes | LIBOR + 2.00% | 2.23 | % | 2.24 | % | N/A | ||||||||
Class C Deferrable Floating Rate Notes | LIBOR + 2.90% | 3.13 | % | 3.14 | % | N/A | ||||||||
Class D Deferrable Floating Rate Notes | LIBOR + 3.50% | 3.73 | % | 3.74 | % | N/A | ||||||||
Class E Deferrable Floating Rate Notes | LIBOR + 4.50% | 4.73 | % | 4.74 | % | N/A | ||||||||
Class F Deferrable Floating Rate Notes | LIBOR + 5.75% | 5.98 | % | 5.99 | % | N/A | ||||||||
Subordinated Notes | N/A | N/A | N/A | N/A | ||||||||||
Secured Notes | ||||||||||||||
Class A Floating Rate Senior Notes | LIBOR + 0.75% | N/A | 1.03 | % | 1.15 | % | ||||||||
Class B Floating Rate Senior Notes | LIBOR + 2.50% | N/A | 2.78 | % | 2.90 | % | ||||||||
Class C Deferrable Floating Rate Notes | LIBOR + 3.75% | N/A | 4.03 | % | 4.15 | % | ||||||||
Class D Deferrable Floating Rate Notes | LIBOR + 4.70% | N/A | 4.98 | % | 5.10 | % | ||||||||
Class E Deferrable Floating Rate Notes | LIBOR + 6.45% | N/A | 6.73 | % | 6.85 | % | ||||||||
The Indenture provides that payments on the Subordinated Notes shall rank subordinate in priority of payment to payments due on all classes of 2013-1 CLO Notes and subordinate in priority of payment to the payment of fees and expenses. Distributions on the Subordinated Notes are limited to the assets of the Issuer remaining after payment of all of the liabilities of the Issuer that rank senior in priority of payment to the Subordinated Notes. To the extent that the proceeds from the collateral are not sufficient to make distributions on the Subordinated Notes the Issuer will have no further obligation in respect of the Subordinated Notes.
Interest proceeds and, after the 2013-1 CLO Notes have been paid in full, principal proceeds, in each case will be distributed to the holders of the Subordinated Notes in accordance with the Indenture.
Distributions, if any, on the Subordinated Notes will be payable quarterly on the 20th day of each January, April, July and October of each calendar year or, if any such day is not a business day, on the next succeeding business day (each, a "Payment Date"), commencing on the first Payment Date, and on January 21, 2020 (or if any such day is not a business day, the next succeeding business day) (the "Stated Redemption Date") (if not redeemed prior to such date) sequentially in order of seniority. At the Stated Redemption Date, the Subordinated Notes will be redeemed after payment in full of all of the 2013-1 CLO Notes and the payment of all administrative and other fees and expenses. The failure to pay interest proceeds or principal proceeds to the holders of the Subordinated Notes will not be an event of default under the Indenture.
In May of 2009, the Issuer defaulted on its Class E overcollateralization ratio of 105.10%, at which point, $4.0 million of interest proceeds were used to repay the Class E Notes through November 2009. Interest on the Class C, Class D, and Class E Notes was deferred and repaid in January of 2010 upon the Issuer's return to compliance. Distributions to the Subordinated Notes resumed in April of 2010.
As of February 28, 2015, the remaining unamortized discount on the Class A-1 Notes, Class A-2 Notes, Class B Notes, Class C Notes, Class D Notes, Class E Notes, and Class F Notes were $1.5 million, $0.2 million, $1.0 million, $0.6 million, $0.8 million, $1.5 million, and $0.6 million, respectively.
As of February 28, 2014, the remaining unamortized discount on the Class X, Class A-1 Notes, Class A-2 Notes, Class B Notes, Class C Notes, Class D Notes, Class E Notes, and Class F Notes were $0.0 million, $1.7 million, $0.2 million, $1.1 million, $0.7 million, $0.9 million, $1.7 million and $0.6 million, respectively.
5. Income Tax
Under the current laws, the Issuer is not subject to net income taxation in the United States or the Cayman Islands. Accordingly, no provision for income taxes has been made in the accompanying financial statements.
Pursuant to ASC Topic 740, Accounting for Uncertainty in Income Taxes , the Issuer adopted the provisions of FASB relating to accounting for uncertainty in income taxes which clarifies the accounting for income taxes by prescribing the minimum recognition
S-16
threshold a tax position must meet before being recognized in the financial statements and applies to all open tax years as of the effective date. The Investment Manager has analyzed such tax positions for uncertain tax positions for tax years that may be open (2011-2014). The Issuer identifies its major tax jurisdictions as U.S. Federal, state and foreign jurisdictions where the Issuer makes investments. As of February 28, 2015 and 2014, there was no impact to the financial statements as a result of the Issuer's accounting for uncertainty in income taxes. The Issuer does not have any unrecognized tax benefits or liabilities for the years ended February 28, 2015, 2014, and 2013. Also, the Issuer recognizes interest and, if applicable, penalties for any uncertain tax positions, as a component of income tax expense. No interest or penalty expense was recorded by the Issuer for the years ended February 28, 2015, 2014, and 2013.
6. Commitments and Contingencies
In the ordinary course of its business, the Issuer may enter into contracts or agreements that contain indemnifications or warranties. Future events could occur that lead to the execution of these provisions against the Issuer. Based on its history and experience, the Investment Manager feels that the likelihood of such an event is remote.
In the ordinary course of business, the Issuer may directly or indirectly be a defendant or plaintiff in legal actions with respect to bankruptcy, insolvency or other types of proceedings. Such lawsuits may involve claims that could adversely affect the value of certain financial instruments owned by the Issuer. As of February 28, 2015 and 2014, the Issuer is not subject to any material legal proceedings.
The terms of Collateralized Debt Investments may require the Issuer to provide funding for any unfunded portion of a Collateralized Debt Investment at the request of the borrower. At February 28, 2015 and 2014, the Issuer had no unfunded commitments.
7. Related-Party Transactions
In the ordinary course of business and as permitted per the terms of the Indenture, the Issuer may acquire or sell investments to or from related parties at the fair value at such time. For the years ended February 28, 2015, 2014, and 2013, the Issuer bought no investments from related parties and sold investments fair valued at $0.0 million, $0.3 million, and $0.0 million, respectively, to the Investment Manager.
The Subordinated Notes are wholly owned by the Investment Manager. The Subordinated Notes do not have a stated coupon rates, but are entitled to residual cash flows from the CLO's investments after all of the other tranches of debt and certain other fees and expenses are paid. For the years ended February 28, 2015, 2014 and 2013, $3.7 million, $5.7 million, and $8.8 million of payments to the Subordinated Notes were included in interest expense in the Statement of Operations, respectively.
8. Shareholders' Capital
Capital contributions and distributions shall be made at such time and in such amounts as determined by the Investment Manager and the Indenture.
The majority holder of the Subordinated Notes has various control rights over the CLO, including the ability to call the CLO prior to its legal maturity, replace the Investment Manager under certain circumstances, and refinance any of the outstanding debt tranches. The voting structure of the Subordinated Notes may require either majority or unanimous approval depending upon the issue.
The authorized share capital of the Issuer consists of 50,000 ordinary shares, 250 of which are owned by Maples Finance Limited and are held under the terms of a declaration of trust.
As of February 28, 2015 and February 28, 2014, net assets were $(5.8) million and $(3.3) million, respectively. These amounts include accumulated losses of $(3.3) million and accumulated gains of $0.8 million, respectively, which includes cumulative net investment income or loss, cumulative amounts of gains and losses realized from investment transactions, net unrealized appreciation or depreciation of investments, as well as the cumulative effect of accounting mismatches between investments accounted for at fair value and amortized cost or accrual-basis assets and liabilities as discussed in Significant Accounting Policies, above. The Issuer's investments continue to generate sufficient liquidity to satisfy its obligations on periodic payment dates as well as comply with all performance criteria as of the Statements of Assets and Liabilities date.
S-17
9. Financial Highlights
The following is a schedule of financial highlights for the years ended February 28, 2015, 2014, and 2013:
| February 28, 2015 | February 28, 2014 | February 28, 2013 | ||||||||||
Average subordinated notes' capital balance(1) | $ | 25,077,372 | $ | 28,471,910 | $ | 27,165,497 | ||||||
Ratio and supplemental data: | ||||||||||||
Total Return(2) | 5.34 | % | 4.65 | % | 73.51 | % | ||||||
Net investment income(3) | 3.17 | % | (7.53 | )% | 3.80 | % | ||||||
Total expenses(3) | 49.79 | % | 65.27 | % | 70.97 | % | ||||||
Base management fee(3) | 3.03 | % | 1.82 | % | 1.47 | % | ||||||
Subordinated management fee(3) | 3.03 | % | 4.42 | % | 5.89 | % | ||||||
| (1) | Subordinated notes' capital balance is calculated based on the sum of the subordinated notes outstanding amount and total net assets, net of ordinary equity. |
| (2) | Total return is calculated based on a time-weighted rate of return methodology. Quarterly rates of return are compounded to derive the total return reflected above. Total return is calculated for the subordinated notes' capital taken as a whole and assumes the purchase of the subordinated notes' capital on the first day of the period and the sale of the last day of the period. |
| (3) | Calculated based on the average subordinated notes' capital balance. |
10. Subsequent Events
The Investment Manager has evaluated events or transactions that have occurred since February 28, 2015 through May 20, 2015, the date the financial statements were available for issuance. The Investment Manager has determined that there are no material events that would require the disclosure in the financial statements.
S-18