Use these links to rapidly review the document
TABLE OF CONTENTS
GENERAL GROWTH PROPERTIES, INC.
Table of Contents
|
UNITED STATES
SECURITIES AND EXCHANGE COMMISSION
Washington, D.C. 20549
FORM 10-K
(MARK ONE) |
|
|
ý |
| ANNUAL REPORT PURSUANT TO SECTION 13 OR 15(d) OF THE SECURITIES EXCHANGE ACT OF 1934 |
For the fiscal year ended December 31, 2014
or
o |
| TRANSITION REPORT PURSUANT TO SECTION 13 OR 15(d) OF THE SECURITIES EXCHANGE ACT OF 1934 |
For the transition period from to
COMMISSION FILE NUMBER 1-34948
GENERAL GROWTH PROPERTIES, INC.
(Exact name of registrant as specified in its charter)
Delaware (State or other jurisdiction of incorporation or organization) |
| 27-2963337 (I.R.S. Employer Identification Number) |
|
|
|
110 N. Wacker Dr., Chicago, IL (Address of principal executive offices) |
| 60606 (Zip Code) |
(312) 960-5000
(Registrant's telephone number, including area code)
Securities Registered Pursuant to Section 12(b) of the Act:
|
|
|
Title of Each Class: |
| Name of Each Exchange on Which Registered: |
Common Stock, $.01 par value |
| New York Stock Exchange |
Securities Registered Pursuant to Section 12(g) of the Act: 6.375% Series A Cumulative Redeemable Preferred Stock
Indicate by check mark if the registrant is a well-known seasoned issuer, as defined in Rule 405 of the Securities Act. Yes ý No o
Indicate by check mark if the registrant is not required to file reports pursuant to Section 13 or Section 15(d) of the Act. Yes o No ý
Indicate by check mark whether the registrant (1) has filed all reports required to be filed by Section 13 or 15(d) of the Securities Exchange Act of 1934 during the preceding 12 months (or for such shorter period that the registrant was required to file such reports), and (2) has been subject to such filing requirements for the past 90 days. Yes ý No o
Indicate by check mark whether the registrant has submitted electronically and posted on its corporate Website, if any, every Interactive Data File required to be submitted and posted pursuant to Rule 405 of Regulation S-T (§ 232.405 of this chapter) during the preceding 12 months (or for such shorter period that the registrant was required to submit and post such files). Yes ý No o
Indicate by check mark if disclosure of delinquent filers pursuant to Item 405 of Regulation S-K (§ 229.405 of this chapter) is not contained herein, and will not be contained, to the best of registrant's knowledge, in definitive proxy or information statements incorporated by reference in Part III of this Form 10-K or any amendment to this Form 10-K. o
|
|
|
|
|
|
|
Large accelerated filer ý |
| Accelerated filer o |
| Non-accelerated filer o (Do not check if a smaller reporting company) |
| Smaller reporting company o |
Indicate by check mark whether the registrant is a shell company (as defined in Rule 12b-2 of the Act). Yes o No ý
Indicate by check mark whether the registrant has filed all reports required to be filed by section 12, 13 or 15(d) of the Securities Exchange Act of 1934 subsequent to the distribution of securities under a plan confirmed by a court. Yes ý No o
On June 30, 2014, the last business day of the most recently completed second quarter of the registrant, the aggregate market value of the shares of common stock held by non-affiliates of the registrant was $13.5 billion based upon the closing price of the common stock on such date.
As of February 23, 2015 , there were 885,438,817 shares of the registrant's common stock outstanding.
DOCUMENTS INCORPORATED BY REFERENCE
Portions of the proxy statement for the annual stockholders meeting to be held on April 16, 2015 are incorporated by reference into Part III.
|
Table of Contents
GENERAL GROWTH PROPERTIES, INC.
Annual Report on Form 10-K
December 31, 2014
TABLE OF CONTENTS
Item No. |
| Page Number |
| Part I |
|
1. | Business | 1 |
1A. | Risk Factors | 5 |
1B. | Unresolved Staff Comments | 12 |
2. | Properties | 12 |
3. | Legal Proceedings | 22 |
4. | Mine Safety Disclosures | 23 |
| Part II |
|
5. | Market for Registrant's Common Equity, Related Stockholder Matters and Issuer Purchases of Equity Securities | 24 |
6. | Selected Financial Data | 26 |
7. | Management's Discussion and Analysis of Financial Condition and Results of Operations | 28 |
7A. | Quantitative and Qualitative Disclosures About Market Risk | 47 |
8. | Financial Statements and Supplementary Data | 48 |
9. | Changes in and Disagreements with Accountants on Accounting and Financial Disclosure | 48 |
9A. | Controls and Procedures | 48 |
9B. | Other Information | 50 |
| Part III |
|
10. | Directors, Executive Officers and Corporate Governance | 51 |
11. | Executive Compensation | 51 |
12. | Security Ownership of Certain Beneficial Owners and Management and Related Stockholder Matters | 51 |
13. | Certain Relationships and Related Transactions, and Director Independence | 52 |
14. | Principal Accountant Fees and Services | 52 |
| Part IV |
|
15. | Exhibits: Financial Statement Schedules | 52 |
Signatures | 53 | |
Consolidated Financial Statements | F - 1 | |
Consolidated Financial Statement Schedule | F - 45 | |
Exhibit Index | S-1 | |
i
Table of Contents
PART I
ITEM 1. BUSINESS
The following discussion should be read in conjunction with the Consolidated Financial Statements of General Growth Properties, Inc. ("GGP" or the "Company") and related notes, as included in this Annual Report on Form 10-K (this "Annual Report"). The terms "we," "us" and "our" may also be used to refer to GGP and its subsidiaries. GGP, a Delaware corporation, was organized in July 2010 and is a self-administered and self-managed real estate investment trust, referred to as a "REIT".
Our Company and Strategy
Our primary business is owning and operating best-in-class retail properties that provide an outstanding environment and experience for our communities, retailers, employees, consumers and shareholders. We are an S&P 500 real estate company with a property portfolio primarily comprised of Class A malls (defined by sales per square foot) and urban retail properties. Our retail properties are the core centers of retail, dining, and entertainment within their trade areas and, therefore, represent hubs of such activity. As of December 31, 2014 , we own, either entirely or with joint venture partners, 128 retail properties located throughout the United States comprising approximately 127 million square feet of gross leasable area ("GLA").
Our portfolio generated total comparable tenant sales (all less anchors) of $20.5 billion and comparable tenant sales (<10,000 square feet) of $570 per square foot during 2014 . We have 74 Class A retail properties reporting tenant sales (all less anchors) of $16.5 billion and tenant sales (<10,000 square feet) of $ 665 per square foot that contribute approximately 74% of our share of Company net operating income ("Company NOI" as defined in Item 7). The quality of our portfolio is further summarized in the table below which indicates the 74 Class A retail properties and their contribution to our 2014 share of Company NOI. Sales (all less anchors) is presented as total sales volume in millions of dollars and Sales (<10,000 sq ft) is presented as sales per square foot in dollars.
Top Retail Properties |
| 2014 Sales (all less anchors) |
| 2013 Sales (all less anchors) |
| 2014 Sales (<10,000 sq ft) |
| 2013 Sales (<10,000 sq ft) |
| Sales Growth (all less anchors) |
| Sales Growth (<10,000 sq ft) |
| % of Company NOI | |||||||||||
Top 10 |
| $ | 3,877 | |
| $ | 3,489 | |
| $ | 1,485 | |
| $ | 1,290 | |
| 11.1 | % |
| 15.1 | % |
| 17.4 | % |
Top 30 |
| 9,107 | |
| 8,596 | |
| 881 | |
| 827 | |
| 5.9 | % |
| 6.5 | % |
| 38.8 | % | ||||
Top 50 |
| 12,976 | |
| 12,470 | |
| 759 | |
| 724 | |
| 4.1 | % |
| 4.8 | % |
| 57.1 | % | ||||
Top 100 |
| 18,896 | |
| 18,319 | |
| 603 | |
| 583 | |
| 3.1 | % |
| 3.4 | % |
| 90.7 | % | ||||
Total Retail Properties |
| 20,518 | |
| 19,957 | |
| 570 | |
| 564 | |
| 2.8 | % |
| 1.1 | % |
| 100.0 | % | ||||
74 Class A Retail Properties |
| 16,492 | |
| 15,949 | |
| 665 | |
| 640 | |
| 3.4 | % |
| 3.9 | % |
| 73.6 | % | ||||
Our long-term earnings growth is driven by:
1) contractual fixed rental increases;
2) positive re-leasing spreads on a suite-to-suite basis;
3) value creation from redevelopment projects;
4) opportunistic acquisition of high quality retail properties; and
5) managing operating expenses.
As of December 31, 2014 our total leased space (as defined in Item 7) was 97.2%, representing an increase of 0.1% from December 31, 2013. On a suite-to-suite basis, the leases commencing occupancy in 2014 exhibited initial rents that were 18.3% higher than the final rents paid on expiring leases compared to 12.3% for those commencing in 2013 .
We have identified approximately $2.4 billion of income producing development and redevelopment projects within our portfolio, over 80% of which is being invested into Class A malls. We currently expect to achieve stabilized returns on cost of approximately 9-11% for all projects.
We may recycle capital by opportunistically investing in high quality retail properties. We believe our long-term strategy can provide our shareholders with a competitive risk-adjusted total return comprised of dividends and share price appreciation.
1
Table of Contents
Transactions
During 2014 , we completed transactions that promote our long-term strategy as summarized below (figures shown represent our proportionate share):
• | acquired interests in five retail properties located in New York City, Miami, and Bellevue (WA) for total consideration of $690.2 million (excluding closing costs), which included equity of $405.5 million and the assumption of debt of $310.2 million (Note 3); |
• | sold interests in four assets for total consideration of $299.9 million, which resulted in a gain of $142.5 million. We used the proceeds from these transactions to repay debt of $132.9 million. Additionally, one property, which was previously transferred to a special servicer, was sold in a lender-directed sale in full satisfaction of the debt. This resulted in a gain on extinguishment of debt of $66.7 million and a reduction of property level debt of $79 million; |
• | transferred six office properties and cash for total consideration of $268.0 million in full settlement of our $322.0 million tax indemnification liability (Note 18); |
• | sold a 49% interest in Bayside Marketplace located in Miami to a joint venture partner for total consideration of $196 million; and |
• | acquired 27.6 million of our common shares at $20.12 per share for a total price of approximately $556 million. |
Segments
We operate in a single reportable segment, which includes the operation, development and management of retail and other rental properties. Our portfolio is targeted to a range of market sizes and consumer tastes. Each of our operating properties is considered a separate operating segment, as each property earns revenues and incurs expenses, individual operating results are reviewed and discrete financial information is available. The Company's chief operating decision maker is comprised of a team of several members of executive management who use Company NOI in assessing segment operating performance. We do not distinguish or group our consolidated operations based on geography, size or type. Our operating properties have similar economic characteristics and provide similar products and services to our tenants. There are no individual operating segments that are greater than 10% of combined revenue, Company NOI, or combined assets. Further, all material operations are within the United States and no customer or tenant comprises more than 10% of consolidated revenues. As a result, the Company's operating properties are aggregated into a single reportable segment.
For the year ended December 31, 2014 , our largest tenant, Limited Brands, Inc., (based on common parent ownership) accounted for approximately 3.6% of rents. Our three largest tenants, Limited Brands, Inc., The Gap, Inc., and Foot Locker, Inc., in aggregate, comprised approximately 9.4% of rents.
Competition
In order to maintain and increase our competitive position within a marketplace we:
• | strategically locate tenants within each property to achieve a merchandising strategy that promotes cross-shopping and maximizes sales; |
• | introduce new concepts to the property which may include restaurants, theaters, and first-to-market retailers; |
• | invest capital to provide the right environment for our tenants and consumers, including aesthetic, technological, and infrastructure improvements; and |
• | ensure our properties are clean, secure and comfortable. |
We believe the high-quality nature of our properties enables us to compete effectively for retailers and consumers.
Environmental Matters
Under various federal, state or local laws, ordinances and regulations, an owner of real estate may be liable for the costs of remediation of certain hazardous or toxic substances on such real estate. These laws may impose liability without regard to whether the owner knew of the presence of such hazardous or toxic substances. The costs of remediation may be substantial and may adversely affect the owner's ability to sell or borrow against such real estate as collateral. In connection with the ownership and operation of our properties, we, or the relevant joint venture through which the property is owned, may be liable for such costs.
2
Table of Contents
Substantially all of our properties have been subject to a Phase I environmental site assessment, which is intended to evaluate the environmental condition of the subject property and its surroundings. Phase I environmental assessments typically include a historical review, a public records review, a site visit and interviews, but do not include sampling or subsurface investigations.
As of December 31, 2014 , the Phase I environmental site assessments have not revealed any environmental conditions that would have a material adverse effect on our overall business, financial condition or results of operations. However, it is possible that these assessments do not reveal all potential environmental liabilities or that conditions have changed since the assessment was prepared (typically, at the time the property was purchased or developed).
See Risk Factors regarding additional discussion of environmental matters.
Other Policies
The following is a discussion of our investment policies, financing policies, conflict of interest policies and policies with respect to certain other activities. One or more of these policies may be amended or rescinded from time to time without a stockholder vote.
Investment Policies
The Company elected to be treated as a REIT commencing with the taxable year beginning July 1, 2010, its date of incorporation. REIT limitations restrict us from making investments that would cause our real estate assets to be less than 75% of our total assets. In addition, at least 75% of our gross income must be derived directly or indirectly from investments relating to real property or mortgages on real property, including "rents from real property," dividends from other REITs and, in certain circumstances, interest from certain types of temporary investments. At least 95% of our income must be derived from such real property investments, and from dividends, interest and gains from the sale or dispositions of stock or securities or from other combinations of the foregoing.
Subject to REIT limitations, we may invest in the securities of other issuers in connection with acquisitions of indirect interests in real estate. Such an investment would normally be in the form of a general or limited partnership or membership interests in special purpose partnerships and limited liability companies that own one or more properties. We may, in the future, acquire all or substantially all of the securities or assets of other REITs, management companies or similar entities where such investments would be consistent with our investment policies.
Financing Policies
We do not have a policy limiting the number or amount of mortgages that may be placed on any particular property. We generally seek to finance individual properties on a secured basis with laddered maturities. However, mortgage financing instruments usually limit additional indebtedness on those properties. Typically, we invest in or form separate legal entities to assist us in obtaining permanent financing at attractive terms. Permanent financing may be structured as a mortgage loan on a single property, or on a group of properties, and generally requires us to provide a mortgage interest on the property in favor of an institutional third party or as a securitized financing. These legal entities are structured so that they would not necessarily be consolidated in the event we became subject to a bankruptcy proceeding or liquidation. We decide upon the structure of the financing based upon the best terms available to us and whether the proposed financing is consistent with our other business objectives. We seek to minimize corporate recourse and cross collateralization and adhere to investment grade debt levels. We include the outstanding securitized debt of legal entities owning consolidated properties as part of our consolidated indebtedness.
We are party to a revolving credit facility that requires us to satisfy certain affirmative and negative covenants and to meet financial ratios and tests, which may include ratios and tests based on leverage, interest coverage and net worth.
If our Board of Directors determines to seek additional capital, we may raise that capital through additional public equity or preferred equity offerings, public debt offerings, debt financing, by creating joint ventures with existing ownership interests in properties or a combination of these methods. Our ability to retain cash flow is limited by the requirement for REITs to distribute at least 90% of their taxable income. We are also subject to federal income tax to the extent we distribute less than 100% of our REIT taxable income, including capital gains.
If our Board of Directors determines to raise additional equity capital, it may, without stockholder approval, issue additional shares of common stock or other capital stock. The Board of Directors may issue a number of shares up to the amount of our authorized capital in any manner and on such terms and for such consideration as it deems appropriate. Such securities may be senior to the outstanding classes of common stock. Such securities also may include additional classes of preferred stock, which may be convertible into common stock. Any such offering could dilute a stockholder's investment in us. Brookfield (as defined in Note 1) has preemptive rights to purchase our common stock as necessary to allow it to maintain its respective proportional ownership interest in GGP on a fully diluted basis.
3
Table of Contents
We have a dividend reinvestment plan ("DRIP"). We may determine to pay dividends in a combination of cash and shares of common stock.
Conflict of Interest Policies
We maintain policies and have entered into agreements designed to reduce or eliminate potential conflicts of interest. We have adopted governance principles governing our affairs and the Board of Directors, as well as written charters for each of the standing committees of the Board of Directors. In addition, we have a Code of Business Conduct and Ethics that applies to all of our officers, directors, and employees. At least a majority of the members of our Board of Directors must qualify as independent under the listing standards for NYSE companies. Any transaction between us and any director, officer or 5% stockholder must be approved pursuant to our Related Party Transaction Policy, including such transactions with Brookfield (as defined in Note 1), our largest stockholder.
Policies With Respect To Certain Other Activities
We intend to make investments that are consistent with our qualification as a REIT, unless the Board of Directors determines that it is no longer in our best interests to qualify as a REIT. We have authority to offer shares of our common stock or other securities in exchange for property. We also have authority to repurchase or otherwise reacquire our shares or any other securities. We may issue shares of our common stock, or cash at our option, to holders of units of limited partnership interest in the Operating Partnerships (as defined in Note 1) in future periods upon exercise of such holders' rights under the Operating Partnerships' agreements. Our policy prohibits us from making any loans to our directors or executive officers for any purpose. We may make loans to the joint ventures in which we participate.
Bankruptcy and Reorganization
In April 2009, GGP, Inc. and certain subsidiaries filed voluntary petitions for relief under Chapter 11 of Title 11 of the United States Code in the bankruptcy court of the Southern District of New York (the "Bankruptcy Court"). On October 21, 2010, the Bankruptcy Court entered an order confirming GGP, Inc.'s plan of reorganization (the "Plan"). Pursuant to the Plan, prepetition creditor claims were satisfied in full and equity holders received newly issued common stock in GGP and in Howard Hughes Corporation ("HHC"). After that distribution, HHC became a publicly-held company. GGP has no remaining interest in HHC as of the Effective Date (as defined in Note 1).
Employees
As of January 23, 2015, we had approximately 1,800 employees.
Insurance
We have comprehensive liability, property and rental loss insurance with respect to our portfolio of properties. We believe that such insurance provides adequate coverage.
Qualification as a REIT
The Company intends to maintain REIT status, and therefore our operations will not be subject to federal income tax on real estate investment trust taxable income. A schedule detailing the taxability of dividends for 2014, 2013 and 2012 has been presented in Note 11 .
Available Information
Our Internet website address is www.ggp.com. Our Annual Reports on Form 10-K, Quarterly Reports on Form 10-Q, Interactive Data Files, Current Reports on Form 8-K and amendments to those reports are available and may be accessed free of charge through the Investors section of our Internet website under the Financial Information subsection, as soon as reasonably practicable after those documents are filed with, or furnished to, the SEC. Our Internet website and included or linked information on the website are not intended to be incorporated into this Annual Report. Additionally, the public may read and copy any materials we file with the SEC at the SEC's Public Reference Room at 100 F Street, N.E., Washington, DC 20549, and may obtain information on the operation of the Public Reference Room by calling the SEC at 1-800-SEC-0330. The SEC maintains an Internet site that contains reports, proxy and information statements, and other information regarding issuers that file electronically with the SEC, which can be accessed at http://www.sec.gov.
4
Table of Contents
ITEM 1A. RISK FACTORS
Business Risks
Our revenues and available cash are subject to conditions affecting the retail sector
Our real property investments are influenced by the retail sector, which may be negatively impacted by increased unemployment, increased federal income and payroll taxes, increased health care costs, increased state and local taxes, increased real estate taxes, industry slowdowns, lack of availability of consumer credit, weak income growth, increased levels of consumer debt, poor housing market conditions, adverse weather conditions, natural disasters, plant closings, and other factors. Similarly, local real estate conditions, such as an oversupply of, or a reduction in demand for, retail space or retail goods, and the supply and creditworthiness of current and prospective tenants may negatively impact our properties.
Given these economic conditions, we believe there is a risk that the sales at stores operating in our properties may be adversely affected, which may cause tenants to be unable to pay their rental obligations. Because substantially all of our income is derived from rentals of real property, our income and available cash would be adversely affected if a significant number of tenants are unable to meet their obligations.
We may be unable to lease space in our properties on favorable terms or at all
Our results of operations depend on our ability to continue to lease space in our properties, including vacant space and re-leasing space in properties where leases are expiring, optimizing our tenant mix, or leasing properties on economically favorable terms. Because approximately 10% to 11% percent of our total leases expire annually, we are continually focused on leasing our properties. Similarly, we are pursuing a strategy of replacing expiring short-term leases with long-term leases.
The bankruptcy or store closures of national tenants, which are tenants with chains of stores in many of our properties, may adversely affect our revenues
Our leases generally contain provisions designed to ensure the creditworthiness of the tenant. However, companies in the retail industry, including some of our tenants, have declared bankruptcy, or from time to time, have voluntarily closed certain of their stores. We may be unable to re-lease such space or to re-lease it on comparable or more favorable terms. As a result, the bankruptcy or closure of a national tenant may adversely affect our revenues. In addition, such closings may allow other tenants to modify their leases to terms that are less favorable for us, also adversely impacting our revenues. For example, certain of our lease agreements include a co-tenancy provision that allows the tenant to pay a reduced rent amount and, in certain instances, terminate the lease, if we fail to maintain certain occupancy levels. Therefore, if occupancy or tenancy falls below certain thresholds, rents we are entitled to receive from our retail tenants could be reduced.
It may be difficult to sell real estate quickly, and transfer restrictions apply to some of our properties
Real estate investments are relatively illiquid, which may limit our ability to strategically change our portfolio promptly in response to changes in economic or other conditions. If revenues from a property decline but the related expenses do not, the income and cash available to us would be adversely affected. If it becomes necessary or desirable for us to dispose of one or more of our mortgaged properties, we may not be able to obtain a release of the lien on the mortgaged property without payment of the associated debt. The foreclosure of a mortgage on a property or inability to sell a property could adversely affect the level of cash available to us.
Our business is dependent on perceptions by retailers and shoppers of the convenience and attractiveness of our retail properties, and our inability to maintain a positive perception may adversely affect our revenues
We are dependent on perceptions by retailers or shoppers of the safety, convenience and attractiveness of our retail properties. If retailers and shoppers perceive competing retail properties and other retailing options such as the Internet to be more convenient or of a higher quality, our revenues may be adversely affected.
We develop, expand and acquire properties and these activities are subject to risks due to economic factors
Capital investment to expand or develop properties is anticipated to be an ongoing part of our strategy. In connection with such projects, we will be subject to various risks, which may result in lower than expected returns or a loss. These risks include the following:
• we may not have sufficient capital to proceed with planned expansion or development activities;
• construction costs of a project may exceed original estimates;
• we may not be able to obtain zoning, occupancy or other required governmental permits and authorizations;
5
Table of Contents
• income from completed projects may not meet projections; and
• | we may not be able to obtain anchor store, mortgage lender and property partner approvals, if applicable, for expansion or development activities. |
Newly acquired properties may not perform as expected, such as not realizing expected occupancy and rental rates. In addition, we may have unexpected costs and may be unable to finance or refinance the new properties at acceptable terms. If an acquisition is not successful, we may have a loss on our investment in the property.
We are in a competitive business
There are numerous retail formats that compete with our properties in attracting retailers to lease space. In addition, retailers at our properties face continued competition from retailers at other malls, lifestyle and power centers, outlet malls and other discount shopping centers, discount shopping clubs, Internet sales, catalog companies, and telemarketing. Competition of these types could adversely affect our revenues and cash flows.
We compete with other major real estate investors with significant capital for attractive investment opportunities. These competitors include REITs, public and private financial institutions, and private institutional investors.
Our ability to realize our strategies and capitalize on our competitive strengths are dependent on our ability to effectively operate a large portfolio of high quality properties, maintain good relationships with our tenants and consumers, and remain well-capitalized. Our failure to do any of the foregoing could affect our ability to compete effectively in the markets in which we operate.
Some of our properties are subject to potential natural or other disasters
A number of our properties are located in areas that are subject to natural or other disasters, including hurricanes and earthquakes. Furthermore, many of our properties are located in coastal regions, and would therefore be affected by any future increases in sea levels. For example, certain of our properties are located in California and Hawaii or in other areas with a higher risk of natural disasters such as earthquakes or tsunamis.
Possible terrorist activity or other acts or threats of violence and threats to public safety could adversely affect our financial condition and results of operations
Terrorist attacks and threats of terrorist attacks in the United States or other acts or threats of violence may result in declining economic activity, which could harm the demand for goods and services offered by our tenants and the value of our properties and might adversely affect the value of an investment in our securities. Such a resulting decrease in retail demand could make it difficult for us to renew or re-lease our properties.
Terrorist activities or violence also could directly affect the value of our properties through damage, destruction or loss, and the availability of insurance for such acts, or of insurance generally, might be reduced or cost more, which could increase our operating expenses and adversely affect our financial condition and results of operations. To the extent that our tenants are affected by such attacks and threats of attacks, their businesses similarly could be adversely affected, including their ability to continue to meet obligations under their existing leases. These acts and threats might erode business and consumer confidence and spending and might result in increased volatility in national and international financial markets and economies. Any one of these events might decrease demand for real estate, decrease or delay the occupancy of our new or redeveloped properties, and limit our access to capital or increase our cost of raising capital.
Information technology failures and data security breaches could harm our business
We use information technology, digital telecommunications and other computer resources to carry out important operational activities and to maintain our business records. Many of these resources are provided to us and/or maintained on our behalf by third-party service providers pursuant to agreements that specify to varying degrees certain security and service level standards. Although we and our service providers employ what we believe are adequate security, disaster recovery and other preventative and corrective measures, our ability to conduct our business may be impaired if these resources are compromised, degraded, damaged or fail, whether due to a virus or other harmful circumstance, intentional penetration or disruption of our information technology resources by a third party, natural disaster, hardware or software corruption or failure or error or poor product or vendor/developer selection (including a failure of security controls incorporated into or applied to such hardware or software), telecommunications system failure, service provider error or failure, intentional or unintentional personnel actions (including the failure to follow our security protocols), or lost connectivity to our networked resources.
A significant and extended disruption in the functioning of these resources, including our primary website, could damage our reputation and cause us to lose customers, tenants, revenues, result in the unintended and/or unauthorized public disclosure or the misappropriation of proprietary, personal identifying and confidential information, and require us to incur significant
6
Table of Contents
expenses to address and remediate or otherwise resolve these kinds of issues, expenses that we may not be able to recover in whole or in any part from our service providers or responsible parties, or their or our insurers.
We may incur costs to comply with environmental laws
Under various federal, state or local laws, ordinances and regulations, a current or previous owner or operator of real estate may be required to investigate and clean up hazardous or toxic substances released at a property, and may be held liable to third parties for bodily injury or property damage (investigation and/or clean-up costs) incurred by the parties in connection with the contamination. These laws often impose liability without regard to whether the owner or operator knew of the release of the hazardous or toxic substances. The presence of contamination or the failure to remediate contamination may adversely affect the owner's ability to sell, lease or borrow with respect to the real estate. Other federal, state and local laws, ordinances and regulations require abatement or removal of asbestos-containing materials in the event of demolition or certain renovations or remodeling, the cost of which may be substantial for certain redevelopments, and also govern emissions of and exposure to asbestos fibers in the air. Federal, state and local laws also regulate the operation and removal of underground storage tanks. In connection with the ownership, operation and management of certain properties, we could be held liable for the costs of remedial action with respect to these regulated substances or tanks or related claims.
Our properties have been subjected to varying degrees of environmental assessment at various times. However, the identification of new areas of contamination, a change in the extent or known scope of contamination or changes in cleanup requirements could result in significant costs to us.
Some potential losses are not insured
We carry comprehensive liability, fire, flood, earthquake, terrorism, extended coverage and rental loss and environmental insurance on all of our properties. We believe the policy specifications and insured limits of these policies are adequate and appropriate. There are, however, some types of losses, including lease and other contract claims, and certain environmental conditions not discovered within the applicable policy period, which generally are not insured. If an uninsured loss or a loss in excess of insured limits occurs, we could lose all or a portion of the capital we have invested in a property, as well as the anticipated future revenue from the property. If this happens, we might nevertheless remain obligated for any mortgage debt or other financial obligations related to the property.
Inflation or deflation may adversely affect our financial condition and results of operations
Should the general price level increase in the future, this may have an impact on our consumers' disposable income. This may place pressure on retailer sales and margins as their costs rise and they may be unable to pass the costs along to the consumer, which in turn may affect their ability to pay rents and which could adversely impact our cash flow. Many but not all of our leases have fixed amounts for recoveries and if our costs rise we may not be able to pass these costs on to our tenants. Rising costs may also impact our ability to generate cash flows.
Inflation also poses a risk to us due to the possibility of future increases in interest rates. Such increases would result in higher interest rates on new fixed-rate debt and adversely impact us due to our outstanding variable rate debt. From time to time, we manage our exposure to interest rate fluctuations related to a portion of our variable-rate debt using interest rate cap, swap and treasury lock agreements. Such agreements allow us to replace variable-rate debt with fixed-rate debt. However, our efforts to manage risks associated with interest rate volatility may not be successful. Additionally, interest rate cap, swap and treasury-lock agreements expose us to additional risks, including that the counterparties to the agreements might not perform their obligations. We also might be subject to additional costs, such as transaction fees or breakage costs, if we terminate these agreements.
Deflation may have an impact on our ability to repay our debt. Deflation may delay consumption and thus weaken tenant sales, which may reduce our tenants' ability to pay rents. Deflationary pressure on retailers may diminish their ability to rent our space and decrease our ability to re-lease the space on favorable terms to us.
Organizational Risks
We are a holding company with no operations of our own and will depend on our subsidiaries for cash
Our operations are conducted almost entirely through our subsidiaries. Our ability to make dividends or distributions in connection with being a REIT is highly dependent on the earnings of and the receipt of funds from our subsidiaries through dividends or distributions, and our ability to generate cash to meet our debt service obligations is further limited by our subsidiaries' ability to make such dividends, distributions or intercompany loans. Our subsidiaries' ability to pay any dividends or distributions to us are limited by their obligations to satisfy their own obligations to their creditors and preferred stockholders before making any dividends or distributions to us.
Delaware law imposes requirements that could further restrict our ability to pay dividends to holders of our common stock.
7
Table of Contents
We share control of some of our properties with other investors and may have conflicts of interest with those investors
For the Unconsolidated Properties (as defined in Note 1), we are required to make decisions with the other investors who have interests in the respective property or properties. For example, the approval of certain of the other investors is required with respect to operating budgets and refinancing, encumbering, expanding or selling any of these properties, to make distributions, as well as to bankruptcy decisions related to the Unconsolidated Properties and related joint ventures. We might not have the same interests as the other investors in relation to these transactions. Accordingly, we might not be able to favorably resolve any of these issues, or we might have to provide financial or other inducements to the other investors to obtain a favorable resolution.
In addition, various restrictive provisions and rights apply to sales or transfers of interests in our jointly owned properties. As such, we might be required to make decisions about buying or selling interests in a property or properties at a time that is not desirable.
Bankruptcy of our joint venture partners could impose delays and costs on us with respect to the jointly owned retail properties
The bankruptcy of one of the other investors in any of our jointly owned properties could materially and adversely affect the respective property or properties. Pursuant to the Bankruptcy Code, we would be precluded from taking some actions affecting the estate of the other investor without prior court approval which would, in most cases, entail prior notice to other parties and a hearing. At a minimum, the requirement to obtain court approval may delay the actions we would or might want to take. If the relevant joint venture through which we have invested in a property has incurred recourse obligations, the discharge in bankruptcy of one of the other investors might result in our ultimate liability for a greater portion of those obligations than would otherwise be required.
We are impacted by tax-related obligations to some of our partners
We own certain properties through partnerships that have arrangements in place that protect the deferred tax situation of our existing third party limited partners. Violation of these arrangements could impose costs on us. As a result, we may be restricted with respect to decisions such as financing, encumbering, expanding or selling these properties.
Several of our joint venture partners are tax-exempt. As such, they are taxable to the extent of their share of unrelated business taxable income generated from these jointly owned properties. As the manager of these joint ventures, we have obligations to avoid the creation of unrelated business taxable income at these properties. As a result, we may be restricted with respect to decisions related to the financing of and revenue generation from these properties.
We provide financial support for a number of joint venture partners
We provide financing to some of our joint venture partners. As of December 31, 2014, we have provided venture partners loans of $169.4 million (of which $164.1 million is secured by the respective partnership interests). A default by a joint venture partner under their debt obligation may result in a loss.
We may not be able to maintain our status as a REIT
We have elected to be treated as a REIT in connection with the filing of our tax return for 2010, retroactive to July 1, 2010. It is possible that we may not meet the conditions for continued qualification as a REIT and that the cost of maintaining REIT status might have a material impact on the Company. In addition, once an entity is qualified as a REIT, the Internal Revenue Code (the "Code") generally requires that such entity distribute at least 90% of its taxable ordinary income to shareholders and pay tax on or distribute 100% of its taxable capital gains. We expect to distribute 100% of our taxable capital gains and taxable ordinary income to shareholders annually. There can be no assurances as to the allocation between cash and common stock of our future dividends.
If, with respect to any taxable year, we fail to maintain our qualification as a REIT, we would not be allowed to deduct distributions to shareholders in computing our taxable income and federal income tax. If any of our REIT subsidiaries fail to qualify as a REIT, such failure could result in our loss of REIT status. If we lose our REIT status, corporate level income tax, including any applicable alternative minimum tax, would apply to our taxable income at regular corporate rates. As a result, the amount available for distribution to holders of equity securities that would otherwise receive dividends would be reduced for the year or years involved, and we would no longer be required to make distributions. In addition, unless we were entitled to relief under the relevant statutory provisions, we would be disqualified from treatment as a REIT for four subsequent taxable years.
We believe that we are a domestically controlled qualified investment entity as defined by the Code. However, because our shares are publicly traded, no assurance can be given that the Company is or will continue to be a domestically controlled qualified investment entity.
An ownership limit, certain anti-takeover defenses and applicable law may hinder any attempt to acquire us
Our amended and restated certificate of incorporation and amended and restated bylaws contain the following limitations.
8
Table of Contents
The ownership limit. Generally, for us to qualify as a REIT under the Code for a taxable year, not more than 50% in value of the outstanding shares of our capital stock may be owned, directly or indirectly, by five or fewer "individuals" at any time during the last half of such taxable year. Our charter provides that no one individual may own more than 9.9% of the outstanding shares of capital stock unless our board of directors provides a waiver from the ownership restrictions. As of February 4, 2015, Brookfield's potential ownership of the Company (assuming full share settlement of the Warrants (Note 9)), including (i) the effect of shares issuable upon exercise of the Warrants owned by Brookfield or managed by Brookfield on behalf of third parties and (ii) shares managed by Brookfield on behalf of third parties, is 39.8%, which is stated in their Form 13D filed on the same date. The Code defines "individuals" for purposes of the requirement described above to include some types of entities. However, our certificate of incorporation also permits us to exempt a person from the ownership limit described therein upon the satisfaction of certain conditions which are described in our certificate of incorporation.
Selected provisions of our charter documents. Our charter authorizes the board of directors:
• to cause us to issue additional authorized but unissued shares of common stock or preferred stock;
• to classify or reclassify, in one or more series, any unissued preferred stock; and
• to set the preferences, rights and other terms of any classified or reclassified stock that we issue.
Selected provisions of our bylaws. Our amended and restated bylaws contain the following limitations:
• the inability of stockholders to act by written consent;
• | restrictions on the ability of stockholders to call a special meeting without 15% or more of the voting power of the issued and outstanding shares entitled to vote generally in the election of directors; and |
• | rules regarding how stockholders may present proposals or nominate directors for election at stockholder meetings. |
Selected provisions of Delaware law. We are a Delaware corporation, and Section 203 of the Delaware General Corporation Law applies to us. In general, Section 203 prevents an "interested stockholder" (as defined below), from engaging in a "business combination" (as defined in the statute) with us for three years following the date that person becomes an interested stockholder unless one or more of the following occurs:
• | before that person became an interested stockholder, our board of directors approved the transaction in which the interested stockholder became an interested stockholder or approved the business combination; |
• | upon completion of the transaction that resulted in the interested stockholder becoming an interested stockholder, the interested stockholder owned at least 85% of our voting stock outstanding at the time the transaction commenced, excluding for purposes of determining the voting stock outstanding (but not the outstanding voting stock owned by the interested stockholder) stock held by directors who are also officers of our company and by employee stock plans that do not provide employees with the right to determine confidentially whether shares held under the plan will be tendered in a tender or exchange offer; and |
• | following the transaction in which that person became an interested stockholder, the business combination is approved by our board of directors and authorized at a meeting of stockholders by the affirmative vote of the holders of at least two-thirds of our outstanding voting stock not owned by the interested stockholder. |
The statute defines "interested stockholder" as any person that is the owner of 15% or more of our outstanding voting stock or is an affiliate or associate of us and was the owner of 15% or more of our outstanding voting stock at any time within the three-year period immediately before the date of determination.
Each item discussed above may delay, deter or prevent a change in control of our company, even if a proposed transaction is at a premium over the then current market price for our common stock. Further, these provisions may apply in instances where some stockholders consider a transaction beneficial to them. As a result, our stock price may be negatively affected by these provisions.
9
Table of Contents
There is a risk of investor influence over our company that may be adverse to our best interests and those of our other shareholders
Brookfield owns, or manages on behalf of third parties, a significant portion of the shares of our common stock (excluding shares issuable upon the exercise of Warrants) as of December 31, 2014 . The effect of the exercise of the Warrants by Brookfield or the election to receive future dividends in the form of common stock, would further increase their ownership. Due to the Warrants, Brookfield's potential ownership amount will continue to change due to payments of dividends and changes in our stock price.
Brookfield has entered into standstill agreements to limit their influence, the concentration of ownership of our outstanding equity held or managed by Brookfield may make some transactions more difficult or impossible without their support, or more likely with their support. The interests of Brookfield, any other substantial stockholder or any of their respective affiliates could conflict with or differ from our interests or the interests of the holders of our common stock. For example, the concentration of ownership held or managed by Brookfield could delay, defer or prevent a change of control of our company or impede a merger, takeover or other business combination that may otherwise be favorable for us and the other stockholders. Brookfield may also pursue acquisition opportunities that may be complementary to our business, and as a result, those acquisition opportunities may not be available to us. We cannot assure you that the standstill agreements can fully protect against these risks.
Brookfield has the right to designate three directors of our Board of Directors as long as it owns 20% or greater of our outstanding shares as stated under the Investment Agreements (defined in Note 1). As long as Brookfield owns directly or indirectly, a substantial portion of our outstanding shares, subject to the terms of the standstill agreements, it would be able to exert significant influence over us, including:
• the composition of our board of directors;
• direction and policies, including the appointment and removal of officers;
• the determination of incentive compensation, which may affect our ability to retain key employees;
• any determinations with respect to mergers or other business combinations;
• our acquisition or disposition of assets;
• our financing decisions and our capital raising activities;
• the payment of dividends;
• conduct in regulatory and legal proceedings; and
• amendments to our certificate of incorporation.
Some of our directors are involved in other businesses including, without limitation, real estate activities and public and/or private investments and, therefore, may have competing or conflicting interests with us and our board of directors has adopted resolutions renouncing any interest or expectation in any such business opportunities. In addition, our relationship agreement with Brookfield Asset Management Inc. contains significant exclusions from Brookfield's obligation to present opportunities to us
Certain of our directors have and may in the future have interests in other real estate business activities, and may have control or influence over these activities or may serve as investment advisors, directors or officers. These interests and activities, and any duties to third parties arising from such interests and activities, could divert the attention of such directors from our operations. Additionally, certain of our directors are engaged in investment and other activities in which they may learn of real estate and other related opportunities in their non-director capacities. Our board of directors has adopted resolutions applicable to our directors that expressly provide, as permitted by Section 122(17) of the DGCL, that our non-employee directors are not obligated to limit their interests or activities in their non-director capacities or to notify us of any opportunities that may arise in connection therewith, even if the opportunities are complementary to or in competition with our businesses. Accordingly, we have, and investors in our common stock should have, no expectation that we will be able to learn of or participate in such opportunities. Additionally, the relationship agreement with Brookfield Asset Management Inc. contains significant exclusions from Brookfield's obligations to present opportunities to us.
Liquidity Risks
Our indebtedness could adversely affect our financial health and operating flexibility
As of December 31, 2014 , we had $20.0 billion aggregate principal amount of indebtedness outstanding at our proportionate share, net of noncontrolling interest, which includes $100.0 million under our revolving credit facility, $3.9 billion of our share of
10
Table of Contents
unconsolidated debt, and our Junior Subordinated Notes of $206.2 million . Our indebtedness may have important consequences to us and the value of our equity, including:
• | limiting our ability to borrow significant additional amounts for working capital, capital expenditures, debt service requirements, execution of our business strategy or other purposes; |
• | limiting our ability to use operating cash flow in other areas of our business or to pay dividends because we must dedicate a portion of these funds to service debt; |
• | increasing our vulnerability to general adverse economic and industry conditions, including increases in interest rates, particularly given the portion of our indebtedness which bears interest at variable rates; |
• | limiting our ability to capitalize on business opportunities and to react to competitive pressures and adverse changes in government regulation; and |
• | giving secured lenders the ability to foreclose on our assets. |
Our debt contains restrictions and covenants which may limit our ability to enter into or obtain funding for certain transactions or operate our business
The terms of certain of our debt will require us to satisfy certain customary affirmative and negative covenants and to meet financial ratios and tests, including ratios and tests based on leverage, interest coverage and net worth, or to satisfy similar tests as a precondition to incurring additional debt. We entered into a revolving credit facility in April 2012 that subjects us to such covenants and restrictions. The revolving credit facility was amended in October 2013, and we may draw up to $1.0 billion under it. In addition, certain of our indebtedness that was reinstated in connection with the Plan discussed in Item 1 contains restrictions. The covenants and other restrictions under our debt agreements affect, among other things, our ability to:
• incur indebtedness;
• create liens on assets;
• sell assets;
• manage our cash flows;
• transfer assets to other subsidiaries;
• make capital expenditures;
• engage in mergers and acquisitions; and
• make distributions to equity holders, including holders of our common stock.
In addition, our debt contains certain terms which include restrictive operational and financial covenants and restrictions on the distribution of cash flows from properties serving as collateral for the debt. Fees and cash flow restrictions may affect our ability to fund our on-going operations from our operating cash flows and we may be limited in our operating and financial flexibility and, thus, may be limited in our ability to respond to changes in our business or competitive activities.
We may not be able to refinance, extend or repay our Consolidated debt or our portion of indebtedness of our Unconsolidated Real Estate Affiliates
As of December 31, 2014 , our proportionate share of total debt, including the $206.2 million of Junior Subordinated Notes and $100.0 million under our revolving credit facility, aggregated $20.0 billion consisting of our consolidated debt, net of noncontrolling interest, of $16.1 billion combined with our share of the debt of our Unconsolidated Real Estate Affiliates (Note 6) of $3.9 billion . Of our proportionate share of total debt, $1.9 billion (excluding the corporate revolver) is recourse to the Company due to guarantees or other security provisions for the benefit of the note holder. There can be no assurance that we, or the joint venture, will be able to refinance or restructure this debt on acceptable terms or otherwise, or that operations of the properties or contributions by us and/or our partners will be sufficient to repay such loans. If we or the joint venture cannot service this debt, we or the joint venture may have to deed property back to the applicable lenders.
We may not be able to raise capital through financing activities
Substantially all of our assets are encumbered by property-level indebtedness; therefore, we may be limited in our ability to raise additional capital through property level or other financings. In addition, our ability to raise additional capital could be limited to
11
Table of Contents
refinancing existing secured mortgages before their maturity date which may result in yield maintenance or other prepayment penalties to the extent that the mortgage is not open for prepayment at par.
We may not be able to sell assets timely and at prices we believe are appropriate due to the illiquid nature of real estate
Our ability to sell our properties timely and for an attractive price may be limited. Limitations could be caused by the economic climate, which affects the value of our properties, and by the availability of credit, which could increase the cost and difficulty for potential purchasers to acquire financing. These factors may limit our ability to sell these properties at a price that exceeds the cost of our investment.
Risks Related to the Distribution of HHC
We have indemnified HHC for certain tax liabilities
Pursuant to the Investment Agreements, we indemnified HHC from and against 93.75% of any and all losses, claims, damages, liabilities and reasonable expenses to which HHC and its subsidiaries become subject, in each case solely to the extent directly attributable to certain taxes related to sales in GGP, Inc.'s Master Planned Communities segment prior to March 31, 2010. On December 12, 2014, we reached a settlement with HHC for $268.0 million which consisted of cash and the transfer of six office properties in full satisfaction of the $322.0 million tax indemnification liability. This payment resulted in a gain of approximately $77.2 million as reflected in our consolidated financial statements for the year ended December 31, 2014 ( Note 18 ).
FORWARD-LOOKING INFORMATION
Refer to Item 7.
ITEM 1B. UNRESOLVED STAFF COMMENTS
None.
ITEM 2. PROPERTIES
Our investments in real estate as of December 31, 2014 consisted of our interests in retail properties. We generally own the land underlying the properties; however, at certain of our properties, all or part of the underlying land is owned by a third party that leases the land to us pursuant to a long-term ground lease. We manage substantially all of our Consolidated Properties (defined in Note 1 ) and provide management, leasing, and other services to a majority of our Unconsolidated Properties. Information regarding encumbrances on our properties is included here and on Schedule III of this Annual Report.
Mall and freestanding GLA includes in-line mall shop and outparcel retail locations (locations that are not attached to the primary complex of buildings that comprise a mall) and excludes anchors and tenant-owned GLA.
Anchors have traditionally been a major component of a mall and play an important role in maintaining customer traffic and making the centers desirable locations for mall store tenants. Anchors are frequently department stores whose merchandise appeals to a broad range of shoppers. Anchors generally either own their stores, the land under them and adjacent parking areas, or enter into long-term leases at rates that are generally lower than the rents charged to mall store tenants. We also typically enter into long-term reciprocal agreements with anchors that provide for, among other things, mall and anchor operating covenants and anchor expense participation. The malls in our portfolio receive a smaller percentage of their operating income from anchors than from mall stores (other than anchors) that are typically specialty retailers who lease space in the structure including, or attached to, the primary complex of buildings that comprise a shopping center.
RETAIL PROPERTIES
Property Count |
| Property Name |
| Location |
| GGP Ownership |
| Total GLA |
| Mall and Freestanding GLA |
| Retail Percentage Leased |
| Anchors | ||||
Consolidated Retail Properties |
|
| |
|
| |
|
| |
|
| |
|
| ||||
1 |
| Ala Moana Center (1) |
| Honolulu, HI |
| 100 | % |
| 2,182,317 | |
| 955,642 | |
| 99.3 | % |
| Macy's, Neiman Marcus, Nordstrom, Bloomingdale's |
2 |
| Apache Mall (1) |
| Rochester, MN |
| 100 | % |
| 778,076 | |
| 264,960 | |
| 98.6 | % |
| Herberger's, JCPenney, Macy's, Scheel's |
3 |
| Augusta Mall (1) |
| Augusta, GA |
| 100 | % |
| 1,101,170 | |
| 503,947 | |
| 97.8 | % |
| Dillard's, JCPenney, Macy's, Sears |
12
Table of Contents
Property Count |
| Property Name |
| Location |
| GGP Ownership |
| Total GLA |
| Mall and Freestanding GLA |
| Retail Percentage Leased |
| Anchors | ||||
4 |
| Baybrook Mall |
| Friendswood (Houston), TX |
| 100 | % |
| 1,260,994 | |
| 443,458 | |
| 99.3 | % |
| Dillard's, JCPenney, Macy's, Sears |
5 |
| Beachwood Place |
| Beachwood, OH |
| 100 | % |
| 909,127 | |
| 344,780 | |
| 97.1 | % |
| Dillard's, Nordstrom, Saks Fifth Avenue |
6 |
| Bellis Fair |
| Bellingham (Seattle), WA |
| 100 | % |
| 760,967 | |
| 422,657 | |
| 98.2 | % |
| JCPenney, Kohl's, Macy's, Target |
7 |
| Boise Towne Square (1) |
| Boise, ID |
| 100 | % |
| 1,210,423 | |
| 422,466 | |
| 96.2 | % |
| Dillard's, JCPenney, Macy's, Sears, Kohl's |
8 |
| Brass Mill Center |
| Waterbury, CT |
| 100 | % |
| 1,179,405 | |
| 444,588 | |
| 97.0 | % |
| Burlington Coat Factory, JCPenney, Macy's, Sears |
9 |
| Coastland Center (1) |
| Naples, FL |
| 100 | % |
| 928,074 | |
| 337,684 | |
| 98.0 | % |
| Dillard's, JCPenney, Macy's, Sears |
10 |
| Columbia Mall |
| Columbia, MO |
| 100 | % |
| 735,688 | |
| 314,628 | |
| 91.5 | % |
| Dillard's, JCPenney, Sears, Target |
11 |
| Columbiana Centre |
| Columbia, SC |
| 100 | % |
| 820,549 | |
| 268,995 | |
| 98.1 | % |
| Belk, Dillard's, JCPenney |
12 |
| Coral Ridge Mall |
| Coralville (Iowa City), IA |
| 100 | % |
| 1,062,503 | |
| 521,542 | |
| 99.4 | % |
| Dillard's, JCPenney, Target, Younkers |
13 |
| Coronado Center (1) |
| Albuquerque, NM |
| 100 | % |
| 1,092,513 | |
| 505,866 | |
| 99.9 | % |
| JCPenney, Kohl's, Macy's, Sears |
14 |
| Crossroads Center |
| St. Cloud, MN |
| 100 | % |
| 891,733 | |
| 368,291 | |
| 97.4 | % |
| JCPenney, Macy's, Sears, Target |
15 |
| Cumberland Mall |
| Atlanta, GA |
| 100 | % |
| 1,028,223 | |
| 380,239 | |
| 99.3 | % |
| Costco, Macy's, Sears |
16 |
| Deerbrook Mall |
| Humble (Houston), TX |
| 100 | % |
| 1,210,927 | |
| 557,387 | |
| 98.3 | % |
| Dillard's, JCPenney, Macy's, Sears |
17 |
| Eastridge Mall WY |
| Casper, WY |
| 100 | % |
| 564,928 | |
| 275,132 | |
| 95.7 | % |
| JCPenney, Macy's, Sears, Target |
18 |
| Eastridge Mall CA |
| San Jose, CA |
| 100 | % |
| 1,231,118 | |
| 558,857 | |
| 98.8 | % |
| JCPenney, Macy's, Sears |
19 |
| Fashion Place (1) |
| Murray, UT |
| 100 | % |
| 1,043,071 | |
| 442,293 | |
| 97.6 | % |
| Dillard's, Nordstrom |
20 |
| Fashion Show |
| Las Vegas, NV |
| 100 | % |
| 1,842,372 | |
| 709,084 | |
| 99.0 | % |
| Dillard's, Macy's, Macy's Mens, Neiman Marcus, Nordstrom, Saks Fifth Avenue |
21 |
| Four Seasons Town Centre |
| Greensboro, NC |
| 100 | % |
| 1,078,099 | |
| 436,083 | |
| 95.7 | % |
| Belk, Dillard's, JCPenney |
22 |
| Fox River Mall |
| Appleton, WI |
| 100 | % |
| 1,191,779 | |
| 596,865 | |
| 98.4 | % |
| JCPenney, Macy's, Sears, Target, Younkers |
23 |
| Glenbrook Square |
| Fort Wayne, IN |
| 100 | % |
| 1,225,364 | |
| 448,494 | |
| 95.9 | % |
| JCPenney, Macy's, Sears, Carson's |
24 |
| Governor's Square (1) |
| Tallahassee, FL |
| 100 | % |
| 1,034,470 | |
| 342,865 | |
| 97.4 | % |
| Dillard's, JCPenney, Macy's, Sears |
25 |
| Grand Teton Mall |
| Idaho Falls, ID |
| 100 | % |
| 627,132 | |
| 209,933 | |
| 93.8 | % |
| Dillard's, JCPenney, Macy's, Sears |
26 |
| Greenwood Mall |
| Bowling Green, KY |
| 100 | % |
| 850,436 | |
| 421,383 | |
| 97.7 | % |
| Dillard's, JCPenney, Macy's, Sears |
27 |
| Hulen Mall |
| Ft. Worth, TX |
| 100 | % |
| 994,455 | |
| 397,885 | |
| 94.8 | % |
| Dillard's, Macy's, Sears |
28 |
| Jordan Creek Town Center |
| West Des Moines, IA |
| 100 | % |
| 1,351,015 | |
| 748,175 | |
| 99.1 | % |
| Dillard's, Younkers |
29 |
| Lakeside Mall |
| Sterling Heights, MI |
| 100 | % |
| 1,500,944 | |
| 480,226 | |
| 87.4 | % |
| JCPenney, Lord & Taylor, Macy's, Macy's Mens & Home, Sears |
30 |
| Lynnhaven Mall |
| Virginia Beach, VA |
| 100 | % |
| 1,131,693 | |
| 600,301 | |
| 98.9 | % |
| Dillard's, JCPenney, Macy's |
31 |
| Mall Of Louisiana |
| Baton Rouge, LA |
| 100 | % |
| 1,572,700 | |
| 623,436 | |
| 98.7 | % |
| Dillard's, Dillard's Men's & Home, JCPenney, Macy's, Sears |
32 |
| Mall St. Matthews |
| Louisville, KY |
| 100 | % |
| 1,020,271 | |
| 506,136 | |
| 97.9 | % |
| Dillard's, Dillard's Men's & Home, JCPenney |
33 |
| Market Place Shopping Center |
| Champaign, IL |
| 100 | % |
| 947,699 | |
| 411,953 | |
| 97.8 | % |
| Bergner's, JCPenney, Macy's, |
34 |
| Mayfair |
| Wauwatosa (Milwaukee), WI |
| 100 | % |
| 1,527,260 | |
| 574,959 | |
| 97.3 | % |
| Boston Store, Macy's, Nordstrom |
35 |
| Meadows Mall |
| Las Vegas, NV |
| 100 | % |
| 944,573 | |
| 307,720 | |
| 97.2 | % |
| Dillard's, JCPenney, Macy's, Sears |
36 |
| Mondawmin Mall |
| Baltimore, MD |
| 100 | % |
| 450,078 | |
| 384,726 | |
| 99.8 | % |
| - |
13
Table of Contents
Property Count |
| Property Name |
| Location |
| GGP Ownership |
| Total GLA |
| Mall and Freestanding GLA |
| Retail Percentage Leased |
| Anchors | ||||
37 |
| Newgate Mall (1) |
| Ogden (Salt Lake City), UT |
| 100 | % |
| 669,522 | |
| 331,729 | |
| 95.9 | % |
| Dillard's, Sears, Burlington Coat Factory |
38 |
| North Point Mall |
| Alpharetta (Atlanta), GA |
| 100 | % |
| 1,330,216 | |
| 427,215 | |
| 90.4 | % |
| Dillard's, JCPenney, Macy's, Sears, Von Maur |
39 |
| North Star Mall |
| San Antonio, TX |
| 100 | % |
| 1,245,959 | |
| 550,635 | |
| 99.7 | % |
| Dillard's, JCPenney, Macy's, Saks Fifth Avenue |
40 |
| Northridge Fashion Center |
| Northridge (Los Angeles), CA |
| 100 | % |
| 1,460,619 | |
| 636,176 | |
| 98.5 | % |
| JCPenney, Macy's, Sears |
41 |
| Northtown Mall (1) |
| Spokane, WA |
| 100 | % |
| 914,472 | |
| 395,592 | |
| 91.9 | % |
| JCPenney, Kohl's, Macy's, Sears |
42 |
| Oak View Mall |
| Omaha, NE |
| 100 | % |
| 860,116 | |
| 255,930 | |
| 93.9 | % |
| Dillard's, JCPenney, Sears, Younkers |
43 |
| Oakwood Center |
| Gretna, LA |
| 100 | % |
| 911,220 | |
| 397,192 | |
| 97.8 | % |
| Dillard's, JCPenney, Sears |
44 |
| Oakwood Mall |
| Eau Claire, WI |
| 100 | % |
| 818,547 | |
| 403,703 | |
| 96.5 | % |
| JCPenney, Macy's, Sears, Younkers |
45 |
| Oglethorpe Mall |
| Savannah, GA |
| 100 | % |
| 942,942 | |
| 406,358 | |
| 97.1 | % |
| Belk, JCPenney, Macy's, Sears |
46 |
| Oxmoor Center (1) |
| Louisville, KY |
| 94 | % |
| 918,794 | |
| 351,584 | |
| 98.4 | % |
| Macy's, Sears, Von Maur |
47 |
| Paramus Park (1) |
| Paramus, NJ |
| 100 | % |
| 765,650 | |
| 306,593 | |
| 96.6 | % |
| Macy's, Sears |
48 |
| Park City Center |
| Lancaster (Philadelphia), PA |
| 100 | % |
| 1,444,595 | |
| 541,430 | |
| 96.0 | % |
| The Bon Ton, Boscov's, JCPenney, Kohl's, Sears |
49 |
| Park Place |
| Tucson, AZ |
| 100 | % |
| 1,051,044 | |
| 469,587 | |
| 98.3 | % |
| Dillard's, Macy's, Sears |
50 |
| Peachtree Mall |
| Columbus, GA |
| 100 | % |
| 725,848 | |
| 290,633 | |
| 94.8 | % |
| Dillard's, JCPenney, Macy's |
51 |
| Pecanland Mall |
| Monroe, LA |
| 100 | % |
| 964,641 | |
| 349,205 | |
| 97.6 | % |
| Belk, Burlington Coat Factory, Dillard's, JCPenney, Sears |
52 |
| Pembroke Lakes Mall |
| Pembroke Pines (Fort Lauderdale), FL |
| 100 | % |
| 1,134,700 | |
| 353,425 | |
| 99.9 | % |
| Dillard's, Dillard's Men's & Home, JCPenney, Macy's, Macy's Home Store, Sears |
53 |
| Pioneer Place (1) |
| Portland, OR |
| 100 | % |
| 635,860 | |
| 348,235 | |
| 90.3 | % |
| - |
54 |
| Prince Kuhio Plaza (1) |
| Hilo, HI |
| 100 | % |
| 507,120 | |
| 320,700 | |
| 96.6 | % |
| Macy's, Sears |
55 |
| Providence Place (1) |
| Providence, RI |
| 94 | % |
| 1,252,351 | |
| 734,231 | |
| 99.8 | % |
| JCPenney, Macy's, Nordstrom |
56 |
| Provo Towne Centre (1) |
| Provo, UT |
| 75 | % |
| 792,056 | |
| 300,337 | |
| 86.9 | % |
| Dillard's, JCPenney, Sears |
57 |
| Quail Springs Mall |
| Oklahoma City, OK |
| 100 | % |
| 1,116,053 | |
| 450,457 | |
| 95.4 | % |
| Dillard's, JCPenney, Macy's, Von Maur |
58 |
| Red Cliffs Mall |
| St. George, UT |
| 100 | % |
| 442,354 | |
| 150,019 | |
| 99.7 | % |
| Dillard's, JCPenney, Sears |
59 |
| Ridgedale Center |
| Minnetonka, MN |
| 100 | % |
| 1,230,318 | |
| 305,715 | |
| 93.8 | % |
| JCPenney, Sears, Macy's, Nordstrom |
60 |
| River Hills Mall |
| Mankato, MN |
| 100 | % |
| 717,531 | |
| 353,589 | |
| 92.4 | % |
| Herberger's, JCPenney, Sears, Target |
61 |
| Rivertown Crossings |
| Grandville (Grand Rapids), MI |
| 100 | % |
| 1,267,529 | |
| 631,904 | |
| 97.5 | % |
| JCPenney, Kohl's, Macy's, Sears, Younkers |
62 |
| Rogue Valley Mall |
| Medford (Portland), OR |
| 100 | % |
| 636,850 | |
| 279,866 | |
| 85.2 | % |
| JCPenney, Kohl's, Macy's, Macy's Home Store |
63 |
| Sooner Mall |
| Norman, OK |
| 100 | % |
| 487,774 | |
| 220,869 | |
| 99.5 | % |
| Dillard's, JCPenney, Sears |
64 |
| Southwest Plaza (2) |
| Littleton, CO |
| 100 | % |
| 1,204,275 | |
| 503,977 | |
| 89.1 | % |
| Dillard's, JCPenney, Macy's, Sears |
65 |
| Spokane Valley Mall (1) |
| Spokane, WA |
| 75 | % |
| 866,196 | |
| 350,585 | |
| 95.2 | % |
| JCPenney, Macy's, Sears |
66 |
| Staten Island Mall |
| Staten Island, NY |
| 100 | % |
| 1,261,345 | |
| 529,664 | |
| 97.9 | % |
| Macy's, Sears, JCPenney |
67 |
| Stonestown Galleria |
| San Francisco, CA |
| 100 | % |
| 835,635 | |
| 407,342 | |
| 99.8 | % |
| Macy's, Nordstrom |
68 |
| The Crossroads |
| Portage (Kalamazoo), MI |
| 100 | % |
| 769,262 | |
| 266,301 | |
| 95.5 | % |
| Burlington Coat Factory, JCPenney, Macy's, Sears |
69 |
| The Gallery At Harborplace (1) |
| Baltimore, MD |
| 100 | % |
| 414,788 | |
| 131,467 | |
| 89.1 | % |
| - |
70 |
| The Maine Mall (1) |
| South Portland, ME |
| 100 | % |
| 1,005,417 | |
| 506,311 | |
| 99.3 | % |
| The Bon Ton, JCPenney, Macy's, Sears |
71 |
| The Mall In Columbia |
| Columbia, MD |
| 100 | % |
| 1,434,541 | |
| 634,373 | |
| 98.9 | % |
| JCPenney, Lord & Taylor, Macy's, Nordstrom, Sears |
14
Table of Contents
Property Count |
| Property Name |
| Location |
| GGP Ownership |
| Total GLA |
| Mall and Freestanding GLA |
| Retail Percentage Leased |
| Anchors | ||||
72 |
| The Oaks Mall |
| Gainesville, FL |
| 100 | % |
| 902,540 | |
| 344,673 | |
| 94.1 | % |
| Belk, Dillard's, JCPenney, Macy's, Sears |
73 |
| The Parks At Arlington |
| Arlington (Dallas), TX |
| 100 | % |
| 1,510,385 | |
| 761,440 | |
| 98.8 | % |
| Dillard's, JCPenney, Macy's, Sears |
74 |
| The Shoppes At Buckland Hills |
| Manchester, CT |
| 100 | % |
| 1,064,140 | |
| 551,529 | |
| 93.8 | % |
| JCPenney, Macy's, Macy's Mens & Home, Sears |
75 |
| The Shops At Fallen Timbers |
| Maumee, OH |
| 100 | % |
| 606,056 | |
| 344,554 | |
| 96.1 | % |
| Dillard's, JCPenney |
76 |
| The Shops at La Cantera |
| San Antonio, TX |
| 75 | % |
| 1,315,477 | |
| 617,702 | |
| 97.7 | % |
| Dillard's, Macy's, Neiman Marcus, Nordstrom |
77 |
| The Streets At Southpoint |
| Durham, NC |
| 94 | % |
| 1,334,710 | |
| 608,363 | |
| 99.2 | % |
| Hudson Belk, JCPenney, Macy's, Nordstrom, Sears |
78 |
| The Woodlands Mall |
| Woodlands (Houston), TX |
| 100 | % |
| 1,377,748 | |
| 624,839 | |
| 99.5 | % |
| Dillard's, JCPenney, Macy's, Nordstrom |
79 |
| Town East Mall |
| Mesquite (Dallas), TX |
| 100 | % |
| 1,222,792 | |
| 413,406 | |
| 98.6 | % |
| Dillard's, JCPenney, Macy's, Sears |
80 |
| Tucson Mall (1) |
| Tucson, AZ |
| 100 | % |
| 1,278,230 | |
| 609,467 | |
| 96.8 | % |
| Dillard's, JCPenney, Macy's, Sears |
81 |
| Tysons Galleria (1) |
| McLean (Washington, D.C.), VA |
| 100 | % |
| 820,209 | |
| 308,276 | |
| 96.3 | % |
| Macy's, Neiman Marcus, Saks Fifth Avenue |
82 |
| Valley Plaza Mall |
| Bakersfield, CA |
| 100 | % |
| 1,177,462 | |
| 520,494 | |
| 99.3 | % |
| JCPenney, Macy's, Sears, Target |
83 |
| Visalia Mall |
| Visalia, CA |
| 100 | % |
| 429,679 | |
| 172,679 | |
| 96.2 | % |
| JCPenney, Macy's |
84 |
| Westlake Center |
| Seattle, WA |
| 100 | % |
| 108,937 | |
| 108,937 | |
| 97.3 | % |
| - |
85 |
| Westroads Mall |
| Omaha, NE |
| 100 | % |
| 1,046,862 | |
| 517,826 | |
| 98.3 | % |
| JCPenney, Von Maur, Younkers |
86 |
| White Marsh Mall |
| Baltimore, MD |
| 100 | % |
| 1,161,444 | |
| 438,090 | |
| 97.9 | % |
| JCPenney, Macy's, Macy's Home Store, Sears, Boscov's |
87 |
| Willowbrook (1) |
| Wayne, NJ |
| 100 | % |
| 1,520,406 | |
| 490,346 | |
| 100.0 | % |
| Bloomingdale's, Lord & Taylor, Macy's, Sears |
88 |
| Woodbridge Center |
| Woodbridge, NJ |
| 100 | % |
| 1,667,136 | |
| 650,462 | |
| 96.6 | % |
| Boscov's, JCPenney, Lord & Taylor, Macy's, Sears |
89 |
| 200 Lafayette |
| New York, NY |
| 100 | % |
| 115,104 | |
| 31,328 | |
| 100.0 | % |
| - |
90 |
| 830 N. Michigan Ave. |
| Chicago, IL |
| 100 | % |
| 121,637 | |
| 121,637 | |
| 100.0 | % |
| - |
|
|
|
| Total Consolidated Retail Properties |
| 91,099,240 | | | 38,662,613 | |
|
|
|
| ||||
Unconsolidated Retail Properties |
|
|
|
|
|
|
|
|
|
| ||||||||
91 |
| Alderwood |
| Lynnwood (Seattle), WA |
| 50 | % |
| 1,321,928 | |
| 576,934 | |
| 97.4 | % |
| JCPenney, Macy's, Nordstrom, Sears |
92 |
| Altamonte Mall |
| Altamonte Springs (Orlando), FL |
| 50 | % |
| 1,160,335 | |
| 481,787 | |
| 95.8 | % |
| Dillard's, JCPenney, Macy's, Sears |
93 |
| Bayside Marketplace (1) |
| Miami, FL |
| 51 | % |
| 217,523 | |
| 216,420 | |
| 98.5 | % |
| - |
94 |
| Bridgewater Commons |
| Bridgewater, NJ |
| 35 | % |
| 987,677 | |
| 396,017 | |
| 98.4 | % |
| Bloomingdale's, Lord & Taylor, Macy's |
95 |
| Carolina Place |
| Pineville (Charlotte), NC |
| 50 | % |
| 1,159,892 | |
| 386,390 | |
| 96.9 | % |
| Belk, Dillard's, JCPenney, Macy's, Sears |
96 |
| Christiana Mall (1) |
| Newark, DE |
| 50 | % |
| 1,267,009 | |
| 625,697 | |
| 99.0 | % |
| JCPenney, Macy's, Nordstrom, Target |
97 |
| Clackamas Town Center |
| Happy Valley, OR |
| 50 | % |
| 1,404,794 | |
| 629,952 | |
| 96.8 | % |
| JCPenney, Macy's, Macy's Home Store, Nordstrom, Sears |
98 |
| First Colony Mall |
| Sugar Land, TX |
| 50 | % |
| 1,125,319 | |
| 506,271 | |
| 97.6 | % |
| Dillard's, Dillard's Men's & Home, JCPenney, Macy's |
99 |
| Florence Mall |
| Florence (Cincinnati, OH), KY |
| 50 | % |
| 941,107 | |
| 388,700 | |
| 92.4 | % |
| JCPenney, Macy's, Macy's Home Store, Sears |
100 |
| Galleria At Tyler (1) |
| Riverside, CA |
| 50 | % |
| 1,012,949 | |
| 544,741 | |
| 99.8 | % |
| JCPenney, Macy's, Nordstrom |
101 |
| Glendale Galleria (1) |
| Glendale, CA |
| 50 | % |
| 1,330,737 | |
| 504,149 | |
| 98.6 | % |
| JCPenney, Macy's, Target, Bloomingdale's |
102 |
| Kenwood Towne Centre (1) |
| Cincinnati, OH |
| 50 | % |
| 1,161,477 | |
| 520,156 | |
| 100.0 | % |
| Dillard's, Macy's, Nordstrom |
103 |
| Mizner Park (1) |
| Boca Raton, FL |
| 47 | % |
| 521,636 | |
| 177,615 | |
| 94.4 | % |
| Lord & Taylor |
15
Table of Contents
Property Count |
| Property Name |
| Location |
| GGP Ownership |
| Total GLA |
| Mall and Freestanding GLA |
| Retail Percentage Leased |
| Anchors | ||||
104 |
| Natick Mall |
| Natick (Boston), MA |
| 50 | % |
| 1,695,159 | |
| 747,509 | |
| 97.0 | % |
| JCPenney, Lord & Taylor, Macy's, Sears, Neiman Marcus, Nordstrom |
105 |
| Neshaminy Mall |
| Bensalem, PA |
| 50 | % |
| 1,017,515 | |
| 410,526 | |
| 96.8 | % |
| Boscov's, Macy's, Sears |
106 |
| Northbrook Court |
| Northbrook (Chicago), IL |
| 50 | % |
| 1,013,978 | |
| 477,701 | |
| 95.7 | % |
| Lord & Taylor, Macy's, Neiman Marcus |
107 |
| Oakbrook Center |
| Oak Brook (Chicago), IL |
| 48 | % |
| 2,187,807 | |
| 874,571 | |
| 98.0 | % |
| Lord & Taylor, Macy's, Neiman Marcus, Nordstrom, Sears |
108 |
| Otay Ranch Town Center |
| Chula Vista (San Diego), CA |
| 50 | % |
| 638,200 | |
| 498,200 | |
| 96.0 | % |
| Macy's |
109 |
| Park Meadows |
| Lone Tree, CO |
| 35 | % |
| 1,580,041 | |
| 757,041 | |
| 98.6 | % |
| Dillard's, JCPenney, Macy's, Nordstrom |
110 |
| Perimeter Mall |
| Atlanta, GA |
| 50 | % |
| 1,557,834 | |
| 504,560 | |
| 99.0 | % |
| Dillard's, Macy's, Nordstrom, Von Maur |
111 |
| Pinnacle Hills Promenade |
| Rogers, AR |
| 50 | % |
| 1,173,527 | |
| 359,092 | |
| 94.0 | % |
| Dillard's, JCPenney |
112 |
| Plaza Frontenac |
| St. Louis, MO |
| 55 | % |
| 484,871 | |
| 224,158 | |
| 98.2 | % |
| Neiman Marcus, Saks Fifth Avenue |
113 |
| Riverchase Galleria |
| Hoover (Birmingham), AL |
| 50 | % |
| 1,502,634 | |
| 562,576 | |
| 96.2 | % |
| Belk, JCPenney, Macy's, Sears, Von Maur |
114 |
| Saint Louis Galleria (3) |
| St. Louis, MO |
| 74 | % |
| 1,161,070 | |
| 447,018 | |
| 97.2 | % |
| Dillard's, Macy's, Nordstrom |
115 |
| Stonebriar Centre |
| Frisco (Dallas), TX |
| 50 | % |
| 1,710,689 | |
| 845,497 | |
| 98.7 | % |
| Dillard's, JCPenney, Macy's, Nordstrom, Sears |
116 |
| The Grand Canal Shoppes (1) |
| Las Vegas, NV |
| 50 | % |
| 745,632 | |
| 626,475 | |
| 99.1 | % |
| Barneys New York |
117 |
| The Shops at Bravern |
| Bellevue, WA |
| 40 | % |
| 244,869 | |
| 120,232 | |
| 91.2 | % |
| Neiman Marcus |
118 |
| The Shoppes At River Crossing |
| Macon, GA |
| 50 | % |
| 710,752 | |
| 377,533 | |
| 97.1 | % |
| Belk, Dillard's |
119 |
| Towson Town Center |
| Towson, MD |
| 35 | % |
| 1,022,864 | |
| 603,735 | |
| 95.6 | % |
| Macy's, Nordstrom |
120 |
| Village Of Merrick Park (1) |
| Coral Gables, FL |
| 55 | % |
| 840,526 | |
| 409,263 | |
| 95.7 | % |
| Neiman Marcus, Nordstrom |
121 |
| Water Tower Place |
| Chicago, IL |
| 47 | % |
| 791,785 | |
| 406,848 | |
| 97.9 | % |
| Macy's |
122 |
| Whaler's Village |
| Lahaina, HI |
| 50 | % |
| 103,959 | |
| 103,959 | |
| 96.5 | % |
| - |
123 |
| Willowbrook Mall |
| Houston, TX |
| 50 | % |
| 1,444,161 | |
| 459,789 | |
| 97.7 | % |
| Dillard's, JCPenney, Macy's, Macy's Mens, Sears |
124 |
| 522 Fifth Avenue |
| New York, NY |
| 10 | % |
| 7,978 | |
| 7,978 | |
| 100 | % |
| - |
125 |
| 530 Fifth Avenue |
| New York, NY |
| 50 | % |
| 57,720 | |
| 57,720 | |
| 54.1 | % |
| - |
126 |
| 685 Fifth Avenue |
| New York, NY |
| 50 | % |
| 121,123 | |
| 26,311 | |
| 100 | % |
| - |
127 |
| Miami Design District (4) |
| Miami, FL |
| 12.5 | % |
| 589,487 | |
| 503,455 | |
| 52 | % |
| - |
128 |
| Union Square |
| San Francisco, CA |
| 50 | % |
| 58,986 | |
| 39,479 | |
| 100 | % |
| - |
|
|
|
| Total Unconsolidated Retail Properties |
| |
| 36,075,550 | |
| 16,406,055 | |
|
|
|
| ||
|
|
|
| Total Retail Properties |
| |
| 127,174,790 | |
| 55,068,668 | |
|
|
|
| ||
|
|
|
|
|
|
|
|
|
|
|
|
|
|
| ||||
STRIP CENTERS & OTHER RETAIL | ||||||||||||||||||
Property Count |
| Property Name |
| Location |
| GGP Ownership |
| Total GLA |
| Mall and Freestanding GLA |
| Retail Percentage Leased |
| Anchors | ||||
1 |
| Lake Mead & Buffalo (5) |
| Las Vegas, NV |
| 50 | % |
| 150,948 | |
| 64,991 | |
| 95.8 | % |
| - |
2 |
| Lockport Mall |
| Lockport, NY |
| 100 | % |
| 9,114 | |
| - | |
| 100.0 | % |
| - |
3 |
| The Trails Village Center (5) |
| Las Vegas, NV |
| 50 | % |
| 174,644 | |
| - | |
| 95.7 | % |
| - |
4 |
| Shopping Leblon (6) |
| Rio de Janeiro, Brazil |
| 35 | % |
| 249,343 | |
| 249,343 | |
| 96.6 | % |
| - |
16
Table of Contents
Property Count |
| Property Name |
| Location |
| GGP Ownership |
| Total GLA |
| Mall and Freestanding GLA |
| Retail Percentage Leased |
| Anchors | ||||
5 |
| Owings Mills Mall (7) |
| Owings Mills, MD |
| 51 | % |
| 1,085,054 | |
| 438,017 | |
| 34.0 | % |
| JCPenney, Macy's |
|
|
|
| Total Strip and Other Retail |
| 1,669,103 | |
| 752,351 | |
|
|
|
| ||||
_______________________________________________________________________________
(1) A portion of the property is subject to a ground lease.
(2) Southwest Plaza is currently under redevelopment.
(3) | Ownership of Saint Louis Galleria is more than 50% but management decisions are decided by the joint venture and the entity is unconsolidated for reporting purposes. |
(4) Investment is considered cost method for reporting purposes.
(5) Third party managed strip center.
(6) GGP's investment in Brazil is through an ownership interest in Leblon.
(7) The Owings Mills Mall space is currently de-leased in preparation for future opportunities.
17
Table of Contents
MORTGAGES, NOTES AND OTHER DEBT
The following table sets forth certain information regarding the mortgages and other indebtedness encumbering our consolidated properties and our Unconsolidated Real Estate Affiliates, as well as our unsecured corporate debt (dollars in thousands).
Name |
| GGP Ownership |
| Proportionate Balance(1) |
| Maturity Year(2) |
| Balloon Pmt at Maturity |
| Interest Rate |
| Parent Recourse as of 12/31/2014(3) | |||||
Fixed Rate |
|
| |
|
| |
|
|
|
| |
|
|
|
| ||
Consolidated Property Level |
|
| |
|
| |
|
|
|
| |
|
|
|
| ||
Boise Towne Plaza |
| 100 | % |
| $ | 8,965 | |
| 2015 |
| $ | 8,765 | |
| 4.70% |
| No |
Paramus Park |
| 100 | % |
| 92,095 | |
| 2015 |
| 90,242 | |
| 4.86% |
| No | ||
Peachtree Mall |
| 100 | % |
| 78,226 | |
| 2015 |
| 77,085 | |
| 5.08% |
| No | ||
Quail Springs Mall |
| 100 | % |
| 67,517 | |
| 2015 |
| 66,864 | |
| 6.74% |
| No | ||
The Shops at La Cantera |
| 75 | % |
| 118,345 | |
| 2015 |
| 117,345 | |
| 5.95% |
| No | ||
Brass Mill Center |
| 100 | % |
| 99,814 | |
| 2016 |
| 93,347 | |
| 4.55% |
| No | ||
Glenbrook Square |
| 100 | % |
| 154,352 | |
| 2016 |
| 141,325 | |
| 4.91% |
| No | ||
Lakeside Mall |
| 100 | % |
| 154,011 | |
| 2016 |
| 144,451 | |
| 4.28% |
| No | ||
Ridgedale Center |
| 100 | % |
| 154,646 | |
| 2016 |
| 143,281 | |
| 4.86% |
| No | ||
Apache Mall |
| 100 | % |
| 96,151 | |
| 2017 |
| 91,402 | |
| 4.32% |
| No | ||
Beachwood Place |
| 100 | % |
| 213,432 | |
| 2017 |
| 190,177 | |
| 5.60% |
| No | ||
Eastridge (CA) |
| 100 | % |
| 142,933 | |
| 2017 |
| 127,418 | |
| 5.79% |
| Yes - Partial | ||
Four Seasons Town Centre |
| 100 | % |
| 82,915 | |
| 2017 |
| 72,532 | |
| 5.60% |
| No | ||
Mall of Louisiana |
| 100 | % |
| 211,522 | |
| 2017 |
| 191,409 | |
| 5.82% |
| No | ||
Provo Towne Center (4) |
| 75 | % |
| 30,246 | |
| 2017 |
| 28,886 | |
| 4.53% |
| No | ||
Hulen Mall |
| 100 | % |
| 127,529 | |
| 2018 |
| 118,702 | |
| 4.25% |
| No | ||
The Gallery at Harborplace - Other |
| 100 | % |
| 7,210 | |
| 2018 |
| 190 | |
| 6.05% |
| No | ||
Coronado Center |
| 100 | % |
| 197,534 | |
| 2019 |
| 180,278 | |
| 3.50% |
| No | ||
Governor's Square |
| 100 | % |
| 70,506 | |
| 2019 |
| 66,488 | |
| 6.69% |
| No | ||
Oak View Mall |
| 100 | % |
| 78,966 | |
| 2019 |
| 74,467 | |
| 6.69% |
| No | ||
Park City Center |
| 100 | % |
| 187,362 | |
| 2019 |
| 172,224 | |
| 5.34% |
| No | ||
Fashion Place |
| 100 | % |
| 226,730 | |
| 2020 |
| 226,730 | |
| 3.64% |
| No | ||
Mall St. Matthews |
| 100 | % |
| 186,662 | |
| 2020 |
| 170,305 | |
| 2.72% |
| No | ||
Newgate Mall |
| 100 | % |
| 58,000 | |
| 2020 |
| 58,000 | |
| 3.69% |
| No | ||
The Mall In Columbia |
| 100 | % |
| 350,000 | |
| 2020 |
| 316,928 | |
| 3.95% |
| No | ||
Town East Mall |
| 100 | % |
| 160,270 | |
| 2020 |
| 160,270 | |
| 3.57% |
| No | ||
Tucson Mall |
| 100 | % |
| 246,000 | |
| 2020 |
| 246,000 | |
| 4.01% |
| No | ||
Tysons Galleria |
| 100 | % |
| 318,100 | |
| 2020 |
| 282,081 | |
| 4.06% |
| No | ||
Visalia Mall |
| 100 | % |
| 74,000 | |
| 2020 |
| 74,000 | |
| 3.71% |
| No | ||
Deerbrook Mall |
| 100 | % |
| 145,934 | |
| 2021 |
| 127,934 | |
| 5.25% |
| No | ||
Fashion Show - Other |
| 100 | % |
| 4,570 | |
| 2021 |
| 1,577 | |
| 6.06% |
| Yes - Full | ||
Fox River Mall |
| 100 | % |
| 178,063 | |
| 2021 |
| 156,373 | |
| 5.46% |
| No | ||
Northridge Fashion Center |
| 100 | % |
| 237,466 | |
| 2021 |
| 207,503 | |
| 5.10% |
| No | ||
Oxmoor Center |
| 94 | % |
| 85,318 | |
| 2021 |
| 74,781 | |
| 5.37% |
| No | ||
Park Place |
| 100 | % |
| 189,665 | |
| 2021 |
| 165,815 | |
| 5.18% |
| No | ||
Providence Place |
| 94 | % |
| 342,702 | |
| 2021 |
| 302,577 | |
| 5.65% |
| No | ||
Rivertown Crossings |
| 100 | % |
| 160,861 | |
| 2021 |
| 141,356 | |
| 5.52% |
| No | ||
Westlake Center - Land |
| 100 | % |
| 2,437 | |
| 2021 |
| 2,437 | |
| 12.90% |
| Yes - Full | ||
White Marsh Mall |
| 100 | % |
| 190,000 | |
| 2021 |
| 190,000 | |
| 3.66% |
| No | ||
Ala Moana Center |
| 100 | % |
| 1,400,000 | |
| 2022 |
| 1,400,000 | |
| 4.23% |
| No | ||
Bellis Fair |
| 100 | % |
| 89,778 | |
| 2022 |
| 77,060 | |
| 5.23% |
| No | ||
Coastland Center |
| 100 | % |
| 125,063 | |
| 2022 |
| 102,621 | |
| 3.76% |
| No | ||
Coral Ridge Mall |
| 100 | % |
| 110,155 | |
| 2022 |
| 98,394 | |
| 5.71% |
| No | ||
Greenwood Mall |
| 100 | % |
| 63,000 | |
| 2022 |
| 57,469 | |
| 4.19% |
| No | ||
North Star Mall |
| 100 | % |
| 325,946 | |
| 2022 |
| 270,113 | |
| 3.93% |
| No | ||
Rogue Valley Mall |
| 100 | % |
| 55,000 | |
| 2022 |
| 48,245 | |
| 4.50% |
| No | ||
Spokane Valley Mall (4) |
| 75 | % |
| 45,410 | |
| 2022 |
| 38,484 | |
| 4.65% |
| No | ||
The Gallery at Harborplace |
| 100 | % |
| 79,055 | |
| 2022 |
| 68,096 | |
| 5.24% |
| No | ||
The Oaks Mall |
| 100 | % |
| 134,253 | |
| 2022 |
| 112,842 | |
| 4.55% |
| No | ||
The Shoppes at Buckland Hills |
| 100 | % |
| 124,961 | |
| 2022 |
| 107,820 | |
| 5.19% |
| No | ||
18
Table of Contents
Name |
| GGP Ownership |
| Proportionate Balance(1) |
| Maturity Year(2) |
| Balloon Pmt at Maturity |
| Interest Rate |
| Parent Recourse as of 12/31/2014(3) | |||||
The Streets at Southpoint |
| 94 | % |
| 243,094 | |
| 2022 |
| 207,909 | |
| 4.36% |
| No | ||
Westroads Mall |
| 100 | % |
| 151,638 | |
| 2022 |
| 127,455 | |
| 4.55% |
| No | ||
Augusta Mall |
| 100 | % |
| 170,000 | |
| 2023 |
| 170,000 | |
| 4.36% |
| No | ||
Boise Towne Square |
| 100 | % |
| $ | 132,841 | |
| 2023 |
| $ | 106,372 | |
| 4.79% |
| No |
Crossroads Center (MN) |
| 100 | % |
| 103,785 | |
| 2023 |
| 83,026 | |
| 3.25% |
| No | ||
Cumberland Mall |
| 100 | % |
| 160,000 | |
| 2023 |
| 160,000 | |
| 3.67% |
| No | ||
Meadows Mall |
| 100 | % |
| 159,032 | |
| 2023 |
| 118,726 | |
| 3.96% |
| No | ||
Oglethorpe Mall |
| 100 | % |
| 150,000 | |
| 2023 |
| 136,166 | |
| 3.90% |
| No | ||
Pecanland Mall |
| 100 | % |
| 90,000 | |
| 2023 |
| 75,750 | |
| 3.88% |
| No | ||
Prince Kuhio Plaza |
| 100 | % |
| 43,930 | |
| 2023 |
| 35,974 | |
| 4.10% |
| No | ||
Staten Island Mall |
| 100 | % |
| 258,187 | |
| 2023 |
| 206,942 | |
| 4.77% |
| No | ||
Stonestown Galleria |
| 100 | % |
| 180,000 | |
| 2023 |
| 164,720 | |
| 4.39% |
| No | ||
The Crossroads (MI) |
| 100 | % |
| 98,427 | |
| 2023 |
| 80,833 | |
| 4.42% |
| No | ||
The Woodlands |
| 100 | % |
| 255,242 | |
| 2023 |
| 207,057 | |
| 5.04% |
| No | ||
Baybrook Mall |
| 100 | % |
| 250,000 | |
| 2024 |
| 212,423 | |
| 5.52% |
| No | ||
Fashion Show |
| 100 | % |
| 835,000 | |
| 2024 |
| 835,000 | |
| 4.03% |
| No | ||
Jordan Creek Town Center |
| 100 | % |
| 216,782 | |
| 2024 |
| 177,448 | |
| 4.37% |
| No | ||
The Maine Mall |
| 100 | % |
| 235,000 | |
| 2024 |
| 235,000 | |
| 4.66% |
| No | ||
The Parks At Arlington |
| 100 | % |
| 250,000 | |
| 2024 |
| 212,687 | |
| 5.57% |
| No | ||
Woodbridge Center |
| 100 | % |
| 250,000 | |
| 2024 |
| 220,726 | |
| 4.80% |
| No | ||
Pembroke Lakes Mall |
| 100 | % |
| 260,000 | |
| 2025 |
| 260,000 | |
| 3.56% |
| No | ||
Valley Plaza Mall |
| 100 | % |
| 240,000 | |
| 2025 |
| 206,847 | |
| 3.75% |
| No | ||
Willowbrook Mall |
| 100 | % |
| 360,000 | |
| 2025 |
| 360,000 | |
| 3.55% |
| No | ||
North Point Mall |
| 100 | % |
| 250,000 | |
| 2026 |
| 218,205 | |
| 4.54% |
| No | ||
Providence Place - Other |
| 94 | % |
| 37,165 | |
| 2028 |
| 2,247 | |
| 7.75% |
| No | ||
Provo Towne Center Land |
| 75 | % |
| 2,249 | |
| 2095 |
| 37 | |
| 10.00% |
| Yes - Full | ||
Consolidated Property Level |
|
|
| $ | 13,466,048 | |
|
|
| $ | 12,304,239 | |
| 4.52% |
|
| |
|
|
|
|
|
|
|
|
|
|
|
|
| |||||
Unconsolidated Property Level |
|
|
|
|
|
|
|
|
|
|
|
| |||||
Alderwood |
| 50 | % |
| 121,717 | |
| 2015 |
| 120,409 | |
| 6.65% |
| No | ||
Shane Plaza |
| 50 | % |
| 3,006 | |
| 2016 |
| 2,944 | |
| 5.56% |
| No | ||
Riverchase Galleria (5) |
| 50 | % |
| 152,500 | |
| 2017 |
| 152,500 | |
| 3.86% |
| No | ||
The Shops at Bravern |
| 40 | % |
| 21,298 | |
| 2017 |
| 20,273 | |
| 3.86% |
| No | ||
Plaza Frontenac |
| 55 | % |
| 28,600 | |
| 2018 |
| 28,600 | |
| 3.04% |
| No | ||
Saint Louis Galleria |
| 74 | % |
| 158,262 | |
| 2018 |
| 158,262 | |
| 3.44% |
| No | ||
First Colony Mall |
| 50 | % |
| 92,256 | |
| 2019 |
| 84,321 | |
| 4.50% |
| No | ||
Natick Mall |
| 50 | % |
| 225,000 | |
| 2019 |
| 209,699 | |
| 4.60% |
| No | ||
The Grand Canal Shoppes |
| 50 | % |
| 313,125 | |
| 2019 |
| 313,125 | |
| 4.24% |
| No | ||
Christiana Mall |
| 50 | % |
| 117,495 | |
| 2020 |
| 108,697 | |
| 5.10% |
| No | ||
Kenwood Towne Centre |
| 70 | % |
| 155,198 | |
| 2020 |
| 137,191 | |
| 5.37% |
| No | ||
Oakbrook Center |
| 48 | % |
| 202,725 | |
| 2020 |
| 202,725 | |
| 3.66% |
| No | ||
Water Tower Place |
| 47 | % |
| 182,353 | |
| 2020 |
| 171,026 | |
| 4.36% |
| No | ||
Northbrook Court |
| 50 | % |
| 65,410 | |
| 2021 |
| 56,811 | |
| 4.25% |
| No | ||
Village of Merrick Park |
| 55 | % |
| 96,900 | |
| 2021 |
| 85,797 | |
| 5.73% |
| No | ||
Whaler's Village |
| 50 | % |
| 40,000 | |
| 2021 |
| 40,000 | |
| 5.42% |
| No | ||
Willowbrook Mall (TX) |
| 50 | % |
| 101,740 | |
| 2021 |
| 88,965 | |
| 5.13% |
| No | ||
Bridgewater Commons |
| 35 | % |
| 105,000 | |
| 2022 |
| 105,000 | |
| 3.34% |
| No | ||
Clackamas Town Center |
| 50 | % |
| 108,000 | |
| 2022 |
| 108,000 | |
| 4.18% |
| No | ||
Florence Mall |
| 50 | % |
| 45,000 | |
| 2022 |
| 45,000 | |
| 4.15% |
| No | ||
Carolina Place |
| 50 | % |
| 87,500 | |
| 2023 |
| 75,542 | |
| 3.84% |
| No | ||
Galleria at Tyler |
| 50 | % |
| 95,245 | |
| 2023 |
| 76,716 | |
| 5.05% |
| No | ||
Lake Mead and Buffalo |
| 50 | % |
| 2,069 | |
| 2023 |
| 27 | |
| 7.20% |
| No | ||
Park Meadows |
| 35 | % |
| 126,000 | |
| 2023 |
| 112,734 | |
| 4.60% |
| No | ||
The Shoppes at River Crossing |
| 50 | % |
| 38,675 | |
| 2023 |
| 35,026 | |
| 3.75% |
| No | ||
The Trails Village Center |
| 50 | % |
| 5,795 | |
| 2023 |
| 78 | |
| 8.21% |
| No | ||
Union Square Portfolio |
| 50 | % |
| 25,000 | |
| 2023 |
| 25,000 | |
| 5.12% |
| No | ||
Stonebriar Centre |
| 50 | % |
| 140,000 | |
| 2024 |
| 120,886 | |
| 4.05% |
| No | ||
Pinnacle Hills Promenade |
| 50 | % |
| 61,000 | |
| 2025 |
| 48,805 | |
| 4.13% |
| No | ||
Altamonte Mall |
| 50 | % |
| 80,000 | |
| 2025 |
| 69,045 | |
| 3.72% |
| No | ||
Towson Town Center |
| 35 | % |
| 113,761 | |
| 2025 |
| 97,713 | |
| 3.82% |
| No | ||
19
Table of Contents
Name |
| GGP Ownership |
| Proportionate Balance(1) |
| Maturity Year(2) |
| Balloon Pmt at Maturity |
| Interest Rate |
| Parent Recourse as of 12/31/2014(3) | |||||
Glendale Galleria |
| 50 | % |
| 215,000 | |
| 2026 |
| 190,451 | |
| 4.06% |
| No | ||
Perimeter Mall |
| 50 | % |
| 137,500 | |
| 2026 |
| 137,500 | |
| 3.96% |
| No | ||
Unconsolidated Property Level |
|
|
| $ | 3,463,130 | |
|
|
| $ | 3,228,868 | |
| 4.37% |
|
| |
Total Fixed - Property Level |
|
|
| $ | 16,929,178 | |
|
|
| $ | 15,533,107 | |
| 4.49% |
|
| |
|
|
|
|
|
|
|
|
|
|
|
|
| |||||
Consolidated Corporate |
|
|
|
|
|
|
|
|
|
|
|
| |||||
Arizona Two (HHC) |
| 100 | % |
| $ | 6,735 | |
| 2015 |
| $ | 573 | |
| 4.41% |
| Yes - Full |
Consolidated Corporate |
|
|
| $ | 6,735 | |
|
|
| $ | 573 | |
| 4.41% |
|
| |
Total Fixed Rate Debt |
|
|
| $ | 16,935,913 | |
|
|
| $ | 15,533,680 | |
| 4.49% |
|
| |
|
|
|
|
|
|
|
|
|
|
|
|
| |||||
Variable Rate |
|
|
|
|
|
|
|
|
|
|
|
| |||||
Consolidated Property Level |
|
|
|
|
|
|
|
|
|
|
|
| |||||
Columbia Mall |
| 100 | % |
| 100,000 | |
| 2018 |
| 100,000 | |
| Libor + 175 bps |
| Yes - Full | ||
Columbiana Centre (6) |
| 100 | % |
| 130,816 | |
| 2018 |
| 128,177 | |
| Libor + 175 bps |
| Yes - Full | ||
Eastridge (WY) (6) |
| 100 | % |
| 48,228 | |
| 2018 |
| 47,255 | |
| Libor + 175 bps |
| Yes - Full | ||
Grand Teton Mall (6) |
| 100 | % |
| 48,859 | |
| 2018 |
| 47,873 | |
| Libor + 175 bps |
| Yes - Full | ||
Market Place Shopping Center |
| 100 | % |
| 113,425 | |
| 2018 |
| 113,425 | |
| Libor + 240 bps |
| No | ||
Mayfair (6) |
| 100 | % |
| 347,813 | |
| 2018 |
| 340,796 | |
| Libor + 175 bps |
| Yes - Full | ||
Mondawmin Mall (6) |
| 100 | % |
| 81,011 | |
| 2018 |
| 79,377 | |
| Libor + 175 bps |
| Yes - Full | ||
North Town Mall (6) |
| 100 | % |
| 89,207 | |
| 2018 |
| 87,407 | |
| Libor + 175 bps |
| Yes - Full | ||
Oakwood (6) |
| 100 | % |
| 76,913 | |
| 2018 |
| 75,362 | |
| Libor + 175 bps |
| Yes - Full | ||
Oakwood Center (6) |
| 100 | % |
| 91,413 | |
| 2018 |
| 89,569 | |
| Libor + 175 bps |
| Yes - Full | ||
Pioneer Place (6) |
| 100 | % |
| 188,185 | |
| 2018 |
| 184,389 | |
| Libor + 175 bps |
| Yes - Full | ||
Red Cliffs Mall (6) |
| 100 | % |
| 30,261 | |
| 2018 |
| 29,650 | |
| Libor + 175 bps |
| Yes - Full | ||
River Hills Mall (6) |
| 100 | % |
| 76,283 | |
| 2018 |
| 74,744 | |
| Libor + 175 bps |
| Yes - Full | ||
Sooner Mall (6) |
| 100 | % |
| 78,931 | |
| 2018 |
| 77,338 | |
| Libor + 175 bps |
| Yes - Full | ||
Southwest Plaza (6) |
| 100 | % |
| 73,383 | |
| 2018 |
| 71,902 | |
| Libor + 175 bps |
| Yes - Full | ||
The Shops at Fallen Timbers (6) |
| 100 | % |
| 25,217 | |
| 2018 |
| 24,709 | |
| Libor + 175 bps |
| Yes - Full | ||
200 Lafayette |
| 100 | % |
| 100,000 | |
| 2019 |
| 100,000 | |
| Libor + 250 bps |
| No | ||
830 North Michigan |
| 100 | % |
| 85,000 | |
| 2019 |
| 85,000 | |
| Libor + 160 bps |
| No | ||
Ala Moana Construction Loan (7) |
| 100 | % |
| 228,907 | |
| 2019 |
| 228,907 | |
| Libor + 190 bps |
| Yes - Partial | ||
Lynnhaven Mall |
| 100 | % |
| 235,000 | |
| 2019 |
| 235,000 | |
| Libor + 185 bps |
| No | ||
Westlake Center |
| 100 | % |
| 42,500 | |
| 2019 |
| 42,500 | |
| Libor + 230 bps |
| No | ||
Consolidated Property Level |
|
|
| $ | 2,291,352 | |
|
|
| $ | 2,263,380 | |
| 2.00% |
|
| |
|
|
|
|
|
|
|
|
|
|
|
|
| |||||
Unconsolidated Property Level |
|
|
|
|
|
|
|
|
|
|
|
| |||||
Miami Design District (8) |
| 13 | % |
| 44,582 | |
| 2016 |
| 44,582 | |
| Libor + 487 bps |
| No | ||
530 Fifth Avenue Mezz Note |
| 50 | % |
| 15,500 | |
| 2017 |
| 15,500 | |
| Libor + 788 bps |
| No | ||
530 Fifth Avenue |
| 50 | % |
| 95,000 | |
| 2017 |
| 95,000 | |
| Libor + 325 bps |
| No | ||
Union Square Portfolio |
| 50 | % |
| 16,250 | |
| 2018 |
| 16,250 | |
| Libor + 400 bps |
| No | ||
Bayside Marketplace |
| 51 | % |
| 127,500 | |
| 2020 |
| 127,500 | |
| Libor + 205 bps |
| No | ||
522 Fifth Avenue |
| 10 | % |
| 8,328 | |
| 2019 |
| 8,328 | |
| Libor + 200 bps |
| No | ||
685 Fifth Avenue |
| 50 | % |
| 170,000 | |
| 2019 |
| 170,000 | |
| Libor + 275 bps |
| No | ||
Unconsolidated Property Level |
|
|
| $ | 477,160 | |
|
|
| $ | 477,160 | |
| 3.22% |
|
| |
|
|
|
|
|
|
|
|
|
|
|
|
| |||||
Consolidated Corporate |
|
|
|
|
|
|
|
|
|
|
|
| |||||
Junior Subordinated Notes Due 2036 |
| 100 | % |
| 206,200 | |
| 2036 |
| 206,200 | |
| Libor + 145 bps |
| Yes - Full | ||
Consolidated Corporate |
|
|
| $ | 206,200 | |
|
|
| $ | 206,200 | |
| 1.68% |
|
| |
|
|
|
|
|
|
|
|
|
|
|
|
| |||||
Total Variable Rate Debt |
|
|
| $ | 2,974,712 | |
|
|
| $ | 2,946,740 | |
| 2.18% |
|
| |
|
|
|
|
|
|
|
|
|
|
|
|
| |||||
Total, at share (9),(10) |
|
|
| $ | 19,910,625 | |
|
|
| $ | 18,480,420 | |
| 4.14% |
|
| |
20
Table of Contents
_______________________________________________________________________________
(1) | Proportionate share for Consolidated Properties presented exclusive of non-controlling interests. |
(2) | Assumes that all maturity extensions are exercised. |
(3) | Total recourse to GGP or its subsidiaries of approximately $1.9 billion. |
(4) | Loan is cross-collateralized with other properties. |
(5) | $45.0 million B-note is subordinate to return of GGP's additional contributed equity. |
(6) | Properties provide mortgage collateral as guarantors for $1.4 billion corporate borrowing and are crossed collateralized. |
(7) | Reflects the amount drawn as of December 31, 2014. |
(8) | Investment is considered cost method for reporting purposes. |
(9) | Excludes the $1.0 billion corporate revolver. As of December 31, 2014 there was $100 million drawn. |
(10) | Reflects amortization for the period subsequent to December 31, 2014 . |
Below is a reconciliation of our proportionate share of mortgages, notes and loans payable (from above) to our consolidated mortgages, notes and loans payable per our Consolidated Balance Sheet as of December 31, 2014 (dollars in thousands).
Total Mortgages, Notes, and Other Payables, from above | $ | 19,910,625 | |
Noncontrolling interests in consolidated real estate affiliates | 107,783 | | |
Our share of Unconsolidated Real Estate Affiliates | (3,940,290 | ) | |
Market rate adjustments, net | 20,784 | | |
Junior Subordinated Notes | (206,200 | ) | |
Corporate revolver | 100,000 | | |
Other loans payable | 5,587 | | |
Total | $ | 15,998,289 | |
Lease Expiration Schedule
The following table indicates various lease expiration information related to our retail properties owned as of December 31, 2014 . The table excludes expirations and rental revenue from temporary tenants and tenants that pay percent-in-lieu rent. See " Note 2 -Summary of Significant Accounting Policies" for our accounting policies for revenue recognition from our tenant leases and " Note 10 -Rentals Under Operating Leases" for the future minimum rentals of our operating leases for the consolidated properties.
21
Table of Contents
Year |
| Number of Expiring Leases |
| Expiring GLA at 100% |
| Percent of Total |
| Expiring Rent |
| Expiring Rent ($psf) | |||||||
|
|
|
| (in thousands) |
|
|
| (in thousands) |
|
| |||||||
Specialty Leasing |
| 1,027 | |
| 2,014 | |
| 3.9 | % |
| $ | 46,641 | |
| $ | 23.92 | |
2015 |
| 2,019 | |
| 6,393 | |
| 12.3 | % |
| 350,621 | |
| 57.55 | | ||
2016 |
| 1,734 | |
| 5,440 | |
| 10.4 | % |
| 323,733 | |
| 61.03 | | ||
2017 |
| 1,700 | |
| 5,511 | |
| 10.6 | % |
| 318,647 | |
| 59.43 | | ||
2018 |
| 1,410 | |
| 5,083 | |
| 9.7 | % |
| 330,422 | |
| 66.22 | | ||
2019 |
| 1,226 | |
| 5,470 | |
| 10.5 | % |
| 320,424 | |
| 59.22 | | ||
2020 |
| 747 | |
| 2,949 | |
| 5.7 | % |
| 197,317 | |
| 67.22 | | ||
2021 |
| 815 | |
| 3,039 | |
| 5.8 | % |
| 207,936 | |
| 69.25 | | ||
2022 |
| 853 | |
| 3,445 | |
| 6.6 | % |
| 231,636 | |
| 67.42 | | ||
2023 |
| 948 | |
| 3,914 | |
| 7.5 | % |
| 282,250 | |
| 73.46 | | ||
2024 |
| 880 | |
| 4,219 | |
| 8.1 | % |
| 309,282 | |
| 73.81 | | ||
Subsequent |
| 434 | |
| 4,691 | |
| 8.9 | % |
| 206,779 | |
| 45.29 | | ||
Total |
| 13,793 | |
| 52,168 | |
| 100 | % |
| $ | 3,125,688 | |
| $ | 61.19 | |
ITEM 3. LEGAL PROCEEDINGS
Other than certain cases as described below and in Note 18 , neither the Company nor any of the Unconsolidated Real Estate Affiliates is currently involved in any material pending legal proceedings nor, to our knowledge, is any material legal proceeding currently threatened against the Company or any of the Unconsolidated Real Estate Affiliates.
Urban Litigation
In October 2004, certain limited partners (the "Urban Plaintiffs") of Urban Shopping Centers, L.P. ("Urban") filed a lawsuit against Urban's general partner, Head Acquisition, L.P. ("Head"), as well as The Rouse Company, LP, Simon Property Group, Inc., Westfield America, Inc., and various of their affiliates, including Head's general partners (collectively, the "Urban Defendants"), in Circuit Court in Cook County, Illinois. GGP, GGP Operating Partnership, LP ("GGPOP") and other affiliates were later included as Urban Defendants. The lawsuit alleged, among other things, that the Urban Defendants breached the Urban partnership agreement, unjustly enriched themselves through misappropriation of partnership opportunities, failed to grow the partnership, breached their fiduciary duties, and tortiously interfered with several contractual relationships. The Urban Plaintiffs sought relief in the form of unspecified monetary damages and equitable relief requiring, among other things, the Urban Defendants, including GGP, Inc. and its affiliates, to engage in certain future transactions through Urban. On May 19, 2014 the Company settled the litigation and recorded a loss of $17.9 million, which is included in General and administrative expense in our Consolidated Statements of Operations and Comprehensive Income (Loss). The Company invested $60.0 million in Urban and contributed, at fair value, a 5.6% interest in three assets in exchange for preferred equity interests. The Company has no obligation to engage in future activity through Urban other than transactions associated with currently existing partnership assets.
Tax Indemnification Liability
Pursuant to the Investment Agreements (defined in Note 1 ), GGP previously indemnified HHC from and against 93.75% of any and all losses, claims, damages, liabilities and reasonable expenses to which HHC and its subsidiaries become subject, in each case solely to the extent directly attributable to MPC Taxes (as defined in the Investment Agreements) in an amount up to $303.8 million. Under certain circumstances, we agreed to be responsible for interest or penalties attributable to such MPC Taxes in excess of the $303.8 million. The IRS disagreed with the method used to report gains for income tax purposes that are the subject of the MPC taxes. As a result of this disagreement, The Howard Hughes Company, LLC and Howard Hughes Properties, Inc. filed petitions in the United States Tax Court on May 6, 2011, contesting this liability for the 2007 and 2008 years and a trial was held in early November 2012. The United States Tax Court rendered its opinion on June 2, 2014, in favor of the IRS. On September 15, 2014, the United States Tax Court formally entered its decision awarding the IRS $144.1 million in taxes for 2007 and 2008. On December 12, 2014, we reached an agreement with HHC for settlement, which included the transfer of six office properties with a historical cost of $106.8 million and an agreed-upon value of $130.0 million and cash of $138.0 million in full settlement of the $322.0 million tax indemnification liability ($303.8 million plus applicable interest). As a result of the settlement, GGP recognized a gain on extinguishment of tax indemnification liability of approximately $77.2 million included in discontinued operations on the Consolidated Statements of Operations and Comprehensive Income (Loss) for the year ended December 31, 2014.
22
Table of Contents
ITEM 4. MINE SAFETY DISCLOSURES
Not applicable.
23
Table of Contents
PART II
ITEM 5. MARKET FOR REGISTRANT'S COMMON EQUITY, RELATED STOCKHOLDER MATTERS AND ISSUER PURCHASES OF EQUITY SECURITIES
The following table summarizes the quarterly high and low sales prices on the NYSE for 2014 and 2013 .
|
| Stock Price | ||||||
Quarter Ended |
| High |
| Low | ||||
2014 |
|
| |
|
| | ||
December 31 |
| $ | 28.88 | |
| $ | 23.19 | |
September 30 |
| 25.14 | |
| 22.92 | | ||
June 30 |
| 24.35 | |
| 21.73 | | ||
March 31 |
| 22.71 | |
| 19.38 | | ||
2013 |
|
|
|
| ||||
December 31 |
| $ | 22.25 | |
| $ | 19.26 | |
September 30 |
| 21.94 | |
| 18.67 | | ||
June 30 |
| 23.33 | |
| 18.63 | | ||
March 31 |
| 20.97 | |
| 18.96 | | ||
The following table summarizes distributions per share of our common stock.
|
|
|
|
|
|
| ||
Declaration Date |
| Record Date |
| Payment Date |
| Dividend Per Share | ||
2014 |
|
|
|
|
|
| ||
November 14 |
| December 15 |
| January 2, 2015 |
| $ | 0.17 | |
August 12 |
| October 15 |
| October 31, 2014 |
| 0.16 | | |
May 15 |
| July 15 |
| July 31, 2014 |
| 0.15 | | |
February 26 |
| April 15 |
| April 30, 2014 |
| 0.15 | | |
2013 |
|
|
|
|
|
| ||
October 28 |
| December 13 |
| January 2, 2014 |
| $ | 0.14 | |
July 29 |
| October 15 |
| October 29, 2013 |
| 0.13 | | |
May 10 |
| July 16 |
| July 30, 2013 |
| 0.12 | | |
February 4 |
| April 16 |
| April 30, 2013 |
| 0.12 | | |
Recent Sales of Unregistered Securities and Repurchase of Shares
See Note 13 for information regarding shares of our common stock that may be issued under our equity compensation plans as of December 31, 2014 and Note 11 for information regarding redemptions of the common units of GGP Operating Partnership, L.P. held by limited partners (the "Common Units") for common stock.
The following line graph sets forth the cumulative total returns on a $100 investment in each of our Common Stock, S&P 500 and the FTSE National Association of REIT-Equity REITs from the Effective Date through December 31, 2014 .
24
Table of Contents
Total Return Performance
Effective Date to December 2014
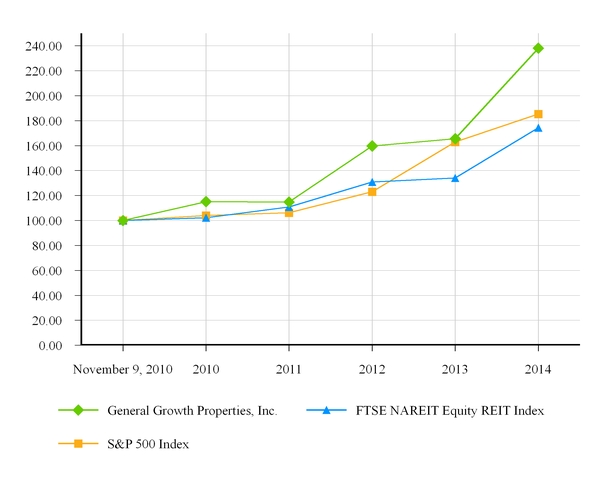
As Of |
|
| November 9, 2010 |
| December 31, 2010 |
| December 31, 2011 |
| December 31, 2012 |
| December 31, 2013 |
| December 31, 2014 | ||||||||||||
General Growth Properties, Inc. | Cum $ |
| $ | 100 | |
| $ | 115 | |
| $ | 115 | |
| $ | 160 | |
| $ | 166 | |
| $ | 238 | |
Return % |
|
|
| 15.12 | |
| 14.79 | |
| 59.73 | |
| 65.52 | |
| 138.10 | | ||||||||
FTSE NAREIT Equity REIT Index | Cum $ |
| 100 | |
| 102 | |
| 111 | |
| 131 | |
| 134 | |
| 174 | | ||||||
Return % |
|
|
| 2.32 | |
| 10.80 | |
| 30.81 | |
| 34.04 | |
| 74.44 | | ||||||||
S&P 500 Index | Cum $ |
| 100 | |
| 104 | |
| 106 | |
| 123 | |
| 163 | |
| 185 | | ||||||
| Return % |
|
| |
| 3.96 | |
| 6.15 | |
| 23.14 | |
| 63.02 | |
| 85.34 | | ||||||
25
Table of Contents
ITEM 6. SELECTED FINANCIAL DATA
The following table sets forth selected financial data which should be read in conjunction with the Consolidated Financial Statements and the related Notes and Management's Discussion and Analysis of Financial Condition and Results of Operations contained in this Annual Report.
| GGP |
| GGP, Inc. | ||||||||||||||||||||
| Year Ended December 31, 2014 |
| Year Ended December 31, 2013 |
| Year Ended December 31, 2012 |
| Year Ended December 31, 2011 |
| Period from November 10, 2010 through December 31, 2010 |
| Period from January 1, 2010 through November 9, 2010 | ||||||||||||
| (Dollars in thousands, except per share amounts) | ||||||||||||||||||||||
OPERATING DATA(1) |
| |
|
| |
|
| |
|
|
|
| |
|
| | |||||||
Total revenues | $ | 2,535,559 | |
| $ | 2,486,017 | |
| $ | 2,426,301 | |
| $ | 2,350,249 | |
| $ | 342,751 | |
| $ | 1,989,724 | |
Total expenses | 1,594,046 | |
| 1,645,601 | |
| 1,644,998 | |
| (1,742,748 | ) |
| (271,219 | ) |
| (1,209,324 | ) | ||||||
Income (loss) from continuing operations | 398,011 | |
| 328,821 | |
| (426,985 | ) |
| (189,161 | ) |
| (244,795 | ) |
| (646,110 | ) | ||||||
Net income (loss) available to common stockholders | 649,914 | |
| 288,450 | |
| (481,233 | ) |
| (313,172 | ) |
| (254,216 | ) |
| (1,185,758 | ) | ||||||
Basic (loss) earnings per share: |
| |
|
| |
|
| |
|
|
|
| |
|
| | |||||||
Continuing operations | 0.42 | |
| 0.32 | |
| (0.47 | ) |
| $ | (0.20 | ) |
| $ | (0.26 | ) |
| $ | (2.04 | ) | |||
Discontinued operations | 0.32 | |
| (0.01 | ) |
| (0.05 | ) |
| (0.13 | ) |
| (0.01 | ) |
| (1.70 | ) | ||||||
Total basic earnings (loss) per share | $ | 0.74 | |
| $ | 0.31 | |
| $ | (0.52 | ) |
| $ | (0.33 | ) |
| $ | (0.27 | ) |
| $ | (3.74 | ) |
Diluted earnings (loss) per share: |
| |
|
| |
|
| |
|
|
|
| |
|
| | |||||||
Continuing operations | 0.39 | |
| 0.32 | |
| (0.47 | ) |
| $ | (0.19 | ) |
| $ | (0.26 | ) |
| $ | (2.04 | ) | |||
Discontinued operations | 0.30 | |
| (0.01 | ) |
| (0.05 | ) |
| (0.18 | ) |
| (0.01 | ) |
| (1.70 | ) | ||||||
Total diluted earnings (loss) per share | $ | 0.69 | |
| $ | 0.31 | |
| $ | (0.52 | ) |
| $ | (0.37 | ) |
| $ | (0.27 | ) |
| $ | (3.74 | ) |
Dividends declared per share(2)(3) | $ | 0.63 | |
| $ | 0.51 | |
| $ | 0.42 | |
| $ | 0.83 | |
| $ | 0.38 | |
| $ | - | |
NET OPERATING INCOME ("NOI")(4) | $ | 2,213,885 | |
| $ | 2,117,503 | |
| $ | 2,022,072 | |
| $ | 1,956,939 | |
| $ | 278,513 | |
| $ | 1,640,419 | |
COMPANY NOI(4) | $ | 2,250,509 | |
| $ | 2,161,837 | |
| $ | 2,056,827 | |
| $ | 1,987,841 | |
| N/A | |
| N/A | | ||
EBITDA(5) | $ | 2,033,434 | |
| $ | 1,946,353 | |
| 1,871,813 | |
| 1,772,688 | |
| 180,977 | |
| 869,842 | | ||||
COMPANY EBITDA(5) | $ | 2,087,912 | |
| $ | 1,990,687 | |
| 1,906,588 | |
| 1,807,988 | |
| N/A | |
| N/A | | ||||
FUNDS FROM OPERATIONS ("FFO")(6) | $ | 1,320,196 | |
| $ | 1,030,852 | |
| $ | 521,080 | |
| $ | 908,122 | |
| $ | (81,750 | ) |
| $ | 694,427 | |
COMPANY FFO(6) | $ | 1,255,651 | |
| $ | 1,148,233 | |
| $ | 986,041 | |
| $ | 869,704 | |
| N/A | |
| N/A | | ||
CASH FLOW DATA(7) |
| |
|
| |
|
| |
|
|
|
| |
|
| | |||||||
Operating activities | 949,724 | |
| 889,531 | |
| 807,103 | |
| $ | 502,802 | |
| $ | (358,607 | ) |
| $ | 41,018 | | |||
Investing activities | (677,925 | ) |
| 166,860 | |
| (221,452 | ) |
| 485,423 | |
| 63,370 | |
| (89,160 | ) | ||||||
Financing activities | (476,599 | ) |
| (1,103,935 | ) |
| (533,708 | ) |
| (1,436,664 | ) |
| (221,051 | ) |
| 931,345 | | ||||||
26
Table of Contents
| As of December 31, | ||||||||||||||||||
| 2014 |
| 2013 |
| 2012 |
| 2011 |
| 2010 | ||||||||||
BALANCE SHEET DATA |
| |
|
| |
|
| |
|
| |
|
| | |||||
Investment in real estate assets-cost | $ | 25,582,072 | |
| $ | 25,405,973 | |
| $ | 26,327,729 | |
| $ | 27,650,474 | |
| $ | 28,293,864 | |
Total assets | 25,335,734 | |
| 25,762,303 | |
| 27,282,405 | |
| 29,518,151 | |
| 32,367,379 | | |||||
Total debt | 16,204,489 | |
| 15,878,637 | |
| 16,173,066 | |
| 17,349,214 | |
| 18,047,957 | | |||||
Redeemable preferred noncontrolling interests | 164,031 | |
| 131,881 | |
| 136,008 | |
| 120,756 | |
| 120,756 | | |||||
Redeemable common noncontrolling interests | 135,265 | |
| 97,021 | |
| 132,211 | |
| 103,039 | |
| 111,608 | | |||||
Stockholders' equity | 7,605,919 | |
| 8,103,121 | |
| 7,621,698 | |
| 8,483,329 | |
| 10,079,102 | | |||||
_______________________________________________________________________________
(1) | For all periods presented, the operating data related to continuing operations do not include the effects of amounts reported in discontinued operations. See Note 4 for further discussion of discontinued operations. |
(2) | The 2011 dividend includes the impact for the non-cash dividend distribution of Rouse Properties, Inc. ("RPI"). |
(3) | The 2010 dividend was paid 90% in Common Stock and 10% in cash in January of 2011. |
(4) | NOI and Company NOI (as defined below) are presented at our proportionate share and do not represent income from operations as defined by GAAP. |
(5) | EBITDA and Company EBITDA (as defined below) are presented at our proportionate share and are supplemental measures of operating performance and do not represent income from operations as defined by GAAP. |
(6) | FFO and Company FFO (as defined below) are presented at our proportionate share and do not represent cash flows from operations as defined by GAAP. |
(7) | Cash flow data only represents GGP's consolidated cash flows as defined by GAAP and as such, operating cash flow does not include the cash received from our Unconsolidated Real Estate Affiliates, except to the extent of contributions to or distributions from our Unconsolidated Real Estate Affiliates. |
Basis of Presentation
The Company emerged from Chapter 11 (as defined in Note 1 ) on November 9, 2010, which we refer to as the "Effective Date." The structure of the Plan Sponsors' (as defined in Note 1 ) investments triggered the application of the acquisition method of accounting. The acquisition method of accounting was applied at the Effective Date and, therefore, the Consolidated Balance Sheets as of December 31, 2014 , 2013 , 2012 , 2011 , and 2010; the Consolidated Statements of Operations and Comprehensive Income (Loss) for the years ended December 31, 2014 , 2013 , 2012 , and 2011 and for the period from November 10, 2010 to December 31, 2010, and the Consolidated Statements of Cash Flows and the Consolidated Statements of Equity for the years ended December 31, 2014 , 2013 , 2012 and 2011 , and for the period from November 10, 2010 to December 31, 2010 reflect the revaluation of GGP, Inc.'s assets and liabilities to fair value as of the Effective Date. Certain elements of our financial statements were significantly changed by these adjustments, such as depreciation which is calculated on revalued property and equipment and amortization of above and below market leases and other intangibles which is also calculated on revalued assets and liabilities. The results for GGP (as defined in Note 1 ) and GGP, Inc. (as defined in Note 1 ) are based on different bases of accounting. Due to the increased depreciation in operating expenses and the net decrease of revenues due to the amortization of above and below market leases and straight-line rent, certain line items of the statements of operations for GGP, Inc. and GGP are not directly comparable.
Non-GAAP Financial Measures
The Company presents NOI, EBITDA and FFO as they are financial measures widely used in the REIT industry. Refer to Item 7 for definitions and reconciliations.
27
Table of Contents
ITEM 7. MANAGEMENT'S DISCUSSION AND ANALYSIS OF FINANCIAL CONDITION AND RESULTS OF OPERATIONS
All references to numbered Notes are to specific footnotes to our Consolidated Financial Statements included in this Annual Report and whose descriptions are incorporated into the applicable response by reference. The following discussion should be read in conjunction with such Consolidated Financial Statements and related Notes. Capitalized terms used, but not defined, in this Management's Discussion and Analysis of Financial Condition and Results of Operations ("MD&A") have the same meanings as in such Notes.
Overview-Introduction
Our primary business is owning and operating best-in-class retail properties that provide an outstanding environment and experience for our communities, retailers, employees, consumers and shareholders. We are an S&P 500 real estate company with a property portfolio primarily comprised of Class A malls (as defined by sales per square foot) and urban retail properties. Our retail properties are the core centers of retail, dining, and entertainment within their trade areas and, therefore, represent hubs of such activity. As of December 31, 2014 , we own, either entirely or with joint venture partners, 128 retail properties located throughout the United States, comprising approximately 127 million square feet of GLA.
We provide management and other services to substantially all of our properties, including properties which we own through joint venture arrangements and which are unconsolidated for GAAP purposes. Our management operating philosophies and strategies are the same whether the properties are consolidated or unconsolidated.
We seek to increase long-term Company EBITDA (as defined below) growth through proactive management and leasing of our properties. We believe that the most significant operating factor affecting incremental cash flow and Company EBITDA growth is increased rents earned from tenants at our properties. This growth is primarily achieved by:
• contractual fixed rental increases;
• positive re-leasing spreads on a suite-to-suite basis;
• value creation from redevelopment projects;
• opportunistic acquisitions of high quality retail properties; and
• managing operating expenses.
We may also recycle capital by opportunistically investing in high quality retail properties. In addition, controlling operating expenses by leveraging our scale to maximize synergies is a critical component to Company EBITDA growth.
Overview
Our Company NOI (as defined below) increased 4.1% from $2.2 billion for the year ended December 31, 2013 to $2.3 billion for the year ended December 31, 2014 . Operating income increased 12.0% from $840.4 million for the year ended December 31, 2013 to $941.5 million for the year ended December 31, 2014 . Our Company EBITDA (as defined below) increased 4.9% from $2.0 billion for the year ended December 31, 2013 to $2.1 billion for the year ended December 31, 2014 . Our Company FFO (as defined below) increased 9.4% from $1.1 billion for the year ended December 31, 2013 to $1.3 billion for the year ended December 31, 2014 . Net income attributable to General Growth Properties, Inc. increased 120% from $302.5 million for the year ended December 31, 2013 to $665.9 million for the year ended December 31, 2014 .
See Non-GAAP Supplemental Financial Measures below for a discussion of Company NOI, Company EBITDA, and Company FFO, along with a reconciliation to the comparable GAAP measures, Operating income and Net income attributable to General Growth Properties, Inc.
During 2014 we completed transactions and achieved operational goals in order to promote our long-term strategy to enhance the quality of our overall portfolio as follows (figures shown represent our proportionate share):
• | acquired interests in five retail properties located in New York City, Miami, and Bellevue (WA) for total consideration of $690.2 million (excluding closing costs), which included equity of $405.5 million and the assumption of debt of $310.2 million ( Note 3 ); |
• | sold interests in four assets for total consideration of $299.9 million , which resulted in a gain of $142.5 million . We used the net proceeds from these transactions to repay debt of $132.9 million . Additionally, one property, which was previously transferred to a special servicer, was sold in a |
28
Table of Contents
lender-directed sale in full satisfaction of the debt. This resulted in a gain on extinguishment of debt of $66.7 million and a reduction of property level debt of $79 million ;
• | transferred six office properties and cash for total consideration of $268.0 million in full settlement of our $322.0 million tax indemnification liability (Note 18); |
• | sold a 49% interest in Bayside Marketplace located in Miami to a joint venture partner for total consideration of $196 million ; and |
• | acquired 27.6 million of our common shares at $20.12 per share for a total price of approximately $556 million. |
Operating Metrics
The following table summarizes selected operating metrics for our portfolio.
| December 31, 2014(1) |
| December 31, 2013(1) |
| % Change | |||||
In-Place Rents per square foot(2) |
|
|
| |
|
| | |||
Consolidated Retail Properties | $ | 67.41 | |
| $ | 67.61 | |
| (0.30 | )% |
Unconsolidated Retail Properties | 80.31 | |
| 80.42 | |
| (0.14 | )% | ||
Total Retail Properties | $ | 71.24 | |
| $ | 71.29 | |
| (0.07 | )% |
Percentage Leased |
| |
|
| |
|
| | ||
Consolidated Retail Properties | 97.2 | % |
| 96.9 | % |
| 30 bps | | ||
Unconsolidated Retail Properties | 97.4 | % |
| 97.6 | % |
| (20) bps | | ||
Total Retail Properties | 97.2 | % |
| 97.1 | % |
| 10 bps | | ||
|
|
|
|
|
| |||||
Tenant Sales Volume (All Less Anchors) (3) |
|
|
|
|
| |||||
Consolidated Retail Properties | $ | 13,059 | |
| $ | 13,032 | |
| 0.21 | % |
Unconsolidated Retail Properties | 7,459 | |
| 6,925 | |
| 7.71 | % | ||
Total Retail Properties | $ | 20,518 | |
| $ | 19,957 | |
| 2.81 | % |
|
|
|
|
|
| |||||
Tenant Sales per square foot (3) |
| |
|
| |
|
| | ||
Consolidated Retail Properties | $ | 507 | |
| $ | 520 | |
| (2.50 | )% |
Unconsolidated Retail Properties | 722 | |
| 677 | |
| 6.65 | % | ||
Total Retail Properties | $ | 570 | |
| $ | 564 | |
| 1.06 | % |
_______________________________________________________________________________
(1) Metrics exclude one asset that is being de-leased for redevelopment, properties acquired in the years ended December 31, 2014 and 2013 and other assets. |
(2) Rent is presented on a cash basis and consists of base minimum rent and common area costs. In 2013, in-place rent also included real estate taxes. Adjusting to the current method, the <10,000 SF of $71.29 becomes $70.14. |
(3) In-Place Rent <10,000 square feet is presented as rent per square foot in dollars, Tenant Sales Volume (All Less Anchors) is presented as total sales volume in millions of dollars and Tenant Sales <10,000 square feet is presented as sales per square foot in dollars. |
29
Table of Contents
Lease Spread Metrics
The following table summarizes signed leases that were scheduled or expected to commence in 2014 and 2015 compared to expiring leases in the same suite, for leases where the downtime between new and previous tenant was less than 24 months and the occupied space between the previous tenant and new tenant did not change by more than 10,000 square feet.
| Number of Leases |
| Square Feet |
| Term/Years |
| Initial Rent Per Square Foot(1) |
| Expiring Rent Per Square Foot(2) |
| Initial Rent Spread |
| % Change | |||||||||
Commencement 2014 | 1,668 | |
| 4,822,093 | |
| 6.7 |
| $ | 62.26 | |
| $ | 52.63 | |
| $ | 9.63 | |
| 18.3 | % |
Commencement 2015 | 477 | |
| 1,562,471 | |
| 6.4 |
| $ | 67.87 | |
| $ | 61.28 | |
| $ | 6.59 | |
| 10.8 | % |
Total 2014/2015 | 2,145 | |
| 6,384,564 | |
| 6.6 |
| $ | 63.63 | |
| $ | 54.76 | |
| $ | 8.87 | |
| 16.2 | % |
_______________________________________________________________________________
(1) Represents initial annual rent over the lease consisting of base minimum rent and common area maintenance. | |||||||||||
(2) Represents expiring rent at end of lease consisting of base minimum rent and common area maintenance. | |||||||||||
Results of Operations
Year Ended December 31, 2014 and 2013
The following table is a breakout of the components of minimum rents:
| Year Ended December 31, |
|
|
|
| |||||||||
| 2014 |
| 2013 |
| $ Change |
| % Change | |||||||
| (Dollars in thousands) |
|
|
|
| |||||||||
Components of Minimum rents: |
| |
|
| |
|
| |
|
| | |||
Base minimum rents | $ | 1,591,137 | |
| $ | 1,563,084 | |
| $ | 28,053 | |
| 1.8 | % |
Lease termination income | 10,589 | |
| 10,634 | |
| (45 | ) |
| (0.4 | ) | |||
Straight-line rent | 48,254 | |
| 47,567 | |
| 687 | |
| 1.4 | | |||
Above and below-market tenant leases, net | (66,285 | ) |
| (67,344 | ) |
| 1,059 | |
| (1.6 | ) | |||
Total Minimum rents | $ | 1,583,695 | |
| $ | 1,553,941 | |
| $ | 29,754 | |
| 1.9 | % |
Base minimum rents increased by $28.1 million primarily due to a 0.3% increase in occupancy between December 31, 2013 and December 31, 2014 , the acquisition of an additional 50% of Quail Springs Mall during the second quarter of 2013, and the acquisition of two operating properties during the fourth quarter of 2013. These increases were partially offset by our contribution of The Grand Canal Shoppes and The Shoppes at the Palazzo into a joint venture during the second quarter of 2013, which resulted in lower base minimum rents during the year ended December 31, 2014 compared to the year ended December 31, 2013 .
Tenant recoveries increased $22.5 million primarily due to higher fixed operating expense recoveries of approximately $11.5 million and higher real estate tax recoveries of approximately $9.4 million in 2014.
Overage rents decreased $4.4 million due in part to our contribution of The Grand Canal Shoppes and The Shoppes at the Palazzo into a joint venture during the second quarter of 2013. This resulted in $1.2 million less overage rents in 2014 compared to 2013, as the properties are now accounted for as Unconsolidated Real Estate Affiliates (defined in Note 1).
Real estate taxes decreased $11.8 million primarily due to a $11.1 million settlement of a multi-year real estate tax suit with a municipality during the first quarter of 2013.
Property maintenance costs decreased $2.5 million primarily due to our contribution of The Grand Canal Shoppes and The Shoppes at the Palazzo into a joint venture during the second quarter of 2013. This resulted in a $4.9 million decrease in property maintenance costs in 2014 compared to 2013, as the properties are now accounted for as Unconsolidated Real Estate Affiliates (defined in Note 1).
Other property operating costs decreased $8.0 million primarily due to our contribution of The Grand Canal Shoppes and the Shoppes at The Palazzo into a joint venture during the second quarter of 2013. This resulted in a $5.8 million decrease in other property operating costs in 2014 compared to 2013, as the properties are now accounted for as Unconsolidated Real Estate Affiliates (defined in Note 1).
30
Table of Contents
Property management and other costs decreased $9.4 million primarily due to a reduction of the self-insurance obligations in 2014.
General and administrative increased $14.8 million primarily due to a $17.9 million loss from the settlement of litigation in the second quarter of 2014 (Note 18).
There was provision for impairment of $5.3 million in 2014 (Notes 2 and 5).
Depreciation and amortization decreased by $41.3 million primarily due to in-place leases becoming fully amortized during the year leading to a $34.6 million decrease in amortization expense. In addition, our contribution of The Grand Canal Shoppes and The Shoppes at the Palazzo into a joint venture during the second quarter of 2013 resulted in $12.0 million less in depreciation and amortization in 2014 as compared to 2013, as these properties are now accounted for as Unconsolidated Real Estate Affiliates (defined in Note 1).
Interest income increased $20.9 million primarily due to interest income received from the note receivable recorded in conjunction with the sale of Aliansce in the third quarter of 2013 and secured partner loans provided in 2014.
Interest expense decreased by $23.9 million primarily due to our contribution of The Grand Canal Shoppes and The Shoppes at the Palazzo into a joint venture during the second quarter of 2013. This resulted in a $10.3 million decrease in interest expense in 2014 compared to 2013, as the properties are now accounted for as Unconsolidated Real Estate Affiliates (defined in Note 1). In addition, interest expense decreased due to the redemption of $700.5 million of unsecured corporate bonds in 2013 and refinancing activity resulting in lower interest rates (Note 7).
The loss on foreign currency is related to a note receivable denominated in Brazilian Reais, and received in conjunction with the sale of Aliansce in the third quarter of 2013 (Note 14).
The gain from change in control of investment properties of $91.2 million in 2014 is due to the partial sale of Bayside Marketplace (Note 3). The 2013 gain from change in control of investment properties of $219.8 million is due to our contribution of The Grand Canal Shoppes and The Shoppes at the Palazzo into a joint venture and the purchase of our partner's interest in Quail Springs Mall previously held in a joint venture.
The loss on extinguishment of debt of $36.5 million in 2013 is the result of fees incurred for the early payoff of debt. $20.5 million of such fees were expensed as a result of the early redemption of $608.7 million of 6.75% unsecured corporate bonds due November 9, 2015. In addition, we expensed $6.6 million in financing fees resulting from the refinancing of the $1.5 billion secured corporate loan, $3.5 million as a result of the early redemption of $91.8 million of 5.38% unsecured corporate bonds due November 26, 2013, and $5.9 million as a result of the early payoff of mortgage debt at one operating property.
Equity in income from Unconsolidated Real Estate Affiliates decreased by $7.5 million primarily due to the sale of Aliansce in the third quarter of 2013.
Preferred Stock issued during the first quarter of 2013 resulted in $15.9 million in preferred stock dividends accrued during 2014 (Note 11).
Year Ended December 31, 2013 and 2012
The following table is a breakout of the components of minimum rents:
| Year Ended December 31, |
|
|
|
| |||||||||
| 2013 |
| 2012 |
| $ Change |
| % Change | |||||||
| (Dollars in thousands) |
|
|
|
| |||||||||
Components of Minimum rents: |
| |
|
| |
|
| |
|
| | |||
Base minimum rents | $ | 1,563,084 | |
| $ | 1,528,786 | |
| $ | 34,298 | |
| 2.2 | % |
Lease termination income | 10,634 | |
| 8,544 | |
| 2,090 | |
| 24.5 | | |||
Straight-line rent | 47,567 | |
| 58,331 | |
| (10,764 | ) |
| (18.5 | ) | |||
Above and below-market tenant leases, net | (67,344 | ) |
| (78,541 | ) |
| 11,197 | |
| (14.3 | ) | |||
Total Minimum rents | $ | 1,553,941 | |
| $ | 1,517,120 | |
| $ | 36,821 | |
| 2.4 | % |
Base minimum rents increased by $34.3 million primarily due to an increase in permanent occupancy from 90.2% as of December 31, 2012 to 92.0% as of December 31, 2013.
Tenant recoveries increased $23.2 million primarily due to higher real estate tax recoveries in 2013, which were driven by increased real estate tax expense and therefore increased recovery income. Additionally in 2013, we settled a multi-year real estate tax suit
31
Table of Contents
with a municipality, which resulted in a $5.1 million recovery during the first quarter of 2013. Tenant recoveries also increased due to increased permanent occupancy.
Overage rents decreased $13.6 million due in part to our contribution of The Grand Canal Shoppes and The Shoppes at the Palazzo into a joint venture during the second quarter of 2013. This resulted in $7.5 million less overage rents in 2013 compared to 2012, as the properties are now accounted for as Unconsolidated Real Estate Affiliates (defined in Note 1).
Management fees and other corporate revenues decreased $3.2 million primarily due to higher one-time development and finance fees earned during 2012 at various joint venture properties.
Other revenue increased $16.4 million primarily due to a gain on sale of land to a municipality in the fourth quarter of 2013 for $9.6 million.
Real estate taxes increased $24.7 million primarily due to an $11.1 million settlement of a multi-year real estate tax suit with a municipality during the first quarter of 2013. In addition, certain other properties saw increased real estate tax expense in 2013.
Property maintenance costs decreased $4.9 million primarily due to lower contracted services of $3.2 million resulting from successful continued efforts to control operating expenses in 2013.
Other property operating costs decreased $8.8 million primarily due to our contribution of The Grand Canal Shoppes and The Shoppes at the Palazzo into a joint venture during the second quarter of 2013. This resulted in a $18.7 million decrease in other property operating costs in 2013 compared to 2012, as the properties are now accounted for as Unconsolidated Real Estate Affiliates (defined in Note 1). This decrease is partially offset by increased compensation and benefits and the write-off of a ground lease intangible related to a land purchase at one operating property.
Property management and other costs increased $5.1 million due to higher compensation and benefits in 2013.
General and administrative increased $10.1 million primarily due to a litigation settlement in 2012 that reduced general and administrative by $5.3 million in that year. In addition, we incurred one-time acquisition related transaction costs during the fourth quarter of 2013.
Depreciation and amortization decreased by $19.1 million primarily due to our contribution of The Grand Canal Shoppes and The Shoppes at the Palazzo into a joint venture during the second quarter of 2013, which resulted in $20.1 million less in depreciation and amortization in 2013 as compared to 2012 as these properties are now accounted for as Unconsolidated Real Estate Affiliates.
Interest income increased $5.3 million primarily due to interest income received from the note receivable recorded in conjunction with the sale of Aliansce in the third quarter of 2013.
Interest expense decreased by $58.1 million primarily due to the redemption of $700.5 million of unsecured corporate bonds in 2013. The decrease is also due to a $9.7 million increase in capitalized interest related to redevelopment projects. This decrease is partially offset by a write-off of a market rate adjustment related to the refinancing of Ala Moana Center, which reduced interest expense during 2012.
The loss on foreign currency is related to a note receivable denominated in Brazilian Reais, and received in conjunction with the sale of Aliansce in the third quarter of 2013.
The Warrant liability adjustment for the year ended December 31, 2013, represents the non-cash income or expense recognized as a result of the change in the fair value of the Warrant liability. We incurred a net Warrant liability adjustment of $40.5 million during the first quarter of 2013. This adjustment reflects our purchase of the Warrants from Fairholme and Blackstone (both defined in Note 1), as the amount paid exceeded the liability by approximately $55 million. This was partially offset by the revaluation of the remaining Warrants as of March 28, 2013. As of March 28, 2013, an amendment to the warrant agreement changed the classification of the Warrants owned by Brookfield from a liability to a component of permanent equity. As a result, the Warrants have not been revalued after March 28, 2013. Refer to Note 9 for a discussion of transactions related to the Warrants.
The Warrant liability adjustment of $502.2 million in the year ended December 31, 2012 is a result of an increase in our stock price from December 31, 2011 which was partially offset by the effect of a decrease in the implied volatility of our stock from 37% in 2011 to 33% in 2012.
The gain from change in control of investment properties of $219.8 million in 2013 is due to our contribution of The Grand Canal Shoppes and The Shoppes at the Palazzo into a joint venture, and the purchase of our partner's interest in Quail Springs Mall, previously held in a joint venture. The 2012 gain from change in control of investment properties of $18.5 million relates to the purchase of our partner's interest in two retail properties previously held in a joint venture.
32
Table of Contents
The loss on extinguishment of debt of $36.5 million in 2013 is the result of fees expensed for the early payoff of debt. $20.5 million of such fees were expensed as a result of the early redemption of the $608.7 million of 6.75% unsecured corporate bonds due November 9, 2015. In addition, we expensed $6.6 million in financing fees resulting from the refinancing of the $1.5 billion secured corporate loan, $3.5 million as a result of the early redemption of $91.8 million of 5.38% unsecured corporate bonds due November 26, 2013, and $5.9 million as a result of the early payoff of mortgage debt at one operating property. The loss on extinguishment of debt in 2012 of $15.0 million is the result of a fee expensed for the early redemption of the $600.0 million of 6.75% unsecured corporate bonds due May, 2013.
Equity in income from Unconsolidated Real Estate Affiliates decreased by $9.6 million primarily due to the $23.4 million gain from the dilution of our investment in Aliansce as a result of its secondary equity offering in 2012. This decrease is partially offset by a $10.1 million gain on the sale of a portion of our interest in Water Tower Place in 2013.
Preferred Stock issued during the first quarter of 2013 resulted in $14.1 million in preferred stock dividends accrued during 2013 (Note 11).
Liquidity and Capital Resources
Our primary source of cash is from the ownership and management of our properties. We may generate cash from refinancings or borrowings under our revolving credit facility. Our primary uses of cash include payment of operating expenses, debt service, reinvestment in and redevelopment of properties, tenant allowances and dividends.
We anticipate maintaining financial flexibility by managing our future maturities, amortization of debt, and minimizing cross collateralizations and corporate guarantees. We believe that we currently have sufficient liquidity to satisfy all of our commitments in the form of $372.5 million of consolidated unrestricted cash and $900.0 million of available credit under our credit facility as of December 31, 2014 , as well as anticipated cash provided by operations.
Our key financing objectives include:
• to obtain property-secured debt with laddered maturities,
• to minimize the amount of debt that is cross collateralized and/or recourse to us; and
• to adhere to investment-grade debt levels.
We may raise capital through public or private issuances of debt securities, preferred stock, common stock, common units of the Operating Partnerships (as defined in Note 1) or other capital raising activities.
During 2014 , the following refinancing and capital transactions (at our proportionate share) occurred:
• | acquired 27.6 million of our common shares at $20.12 per share for a total price of approximately $556 million; |
• | completed $1.9 billion of secured financings, lowering the average interest rate 90 basis points from 4.4% to 3.5% , lengthening the average term-to-maturity from 1.8 years to 7.8 years, and generating net proceeds of $935.0 million ; and |
• | amended our $1.4 billion corporate loan secured by cross-collateralized mortgages on 14 properties, lowering the interest rate from LIBOR plus 2.50% to LIBOR plus 1.75%. The loan initially matures on April 26, 2016, and has two one-year maturity date extension options. |
As of December 31, 2014 , our proportionate share of total debt aggregated $20.0 billion . Our total debt includes our consolidated debt of $16.1 billion and our share of Unconsolidated Real Estate Affiliates debt of $3.9 billion . Of our proportionate share of total debt, $1.9 billion (excluding the corporate revolver and junior subordinated notes) is recourse to the Company or its subsidiaries due to guarantees or other security provisions for the benefit of the note holder.
The amount of debt due in the next three years represents 11.0% of our total debt at maturity. The maximum amount due in any one of the next ten years is no more than $3.0 billion or approximately 16.1% of our total debt at maturity. In 2022, the $3.0 billion of debt maturing includes $1.4 billion for Ala Moana Center.
The following table illustrates the scheduled payments for our proportionate share of total debt as of December 31, 2014 . The $206.2 million of Junior Subordinated Notes are due in 2036, but we may redeem them any time after April 30, 2011 ( Note 7 ).
33
Table of Contents
| Consolidated(1) |
| Unconsolidated(1) | ||||
| (Dollars in thousands) | ||||||
2015 | $ | 513,889 | |
| $ | 136,839 | |
2016 | 693,824 | |
| 68,326 | | ||
2017 | 863,066 | |
| 306,442 | | ||
2018 | 1,931,756 | |
| 233,221 | | ||
2019 | 1,321,775 | |
| 817,992 | | ||
Subsequent | 10,746,025 | |
| 2,377,470 | | ||
| $ | 16,070,335 | |
| $ | 3,940,290 | |
_______________________________________________________________________________
(1) Excludes $20.8 million of adjustments related to debt market rate adjustments.
We believe we will be able to extend the maturity date, repay or refinance the consolidated debt that is scheduled to mature in 2015. We also believe that the joint ventures will be able to refinance the debt of our Unconsolidated Real Estate Affiliates upon maturity; however there can be no assurance that we will be able to refinance or restructure such debt on acceptable terms or otherwise, or that joint venture operations or contributions by us and/or our partners will be sufficient to repay such loans.
Acquisitions and Joint Venture Activity
From time-to-time we may acquire whole or partial interests in high-quality retail properties.
During the year ended December 31, 2014 , the following transactions (at our proportionate share) occurred:
• | On December 24, 2014, we sold 49% of our interest in Bayside Marketplace in Miami through the formation of a joint venture for total consideration of $196 million. |
• | On December 17, 2014, we entered into an agreement to acquire the Crown Building in New York City, New York located at 730 Fifth Avenue for approximately $1.775 billion through a joint venture in which we have a 50% interest. We contributed $50.0 million to the joint venture to fund a deposit related to the acquisition that is expected to close in the second quarter of 2015. |
• | On October 22, 2014, we contributed $49.1 million for a 50% interest in a joint venture that acquired the retail portion of 530 Fifth Avenue in New York, New York for a gross purchase price of $300.0 million with $190.0 million in gross property-level financing. The property comprises approximately 57,000 square feet of retail space and 456,000 square feet of office space. |
• | On September 30, 2014, we contributed $8.3 million for a 10% interest in a joint venture that acquired the retail portion of 522 Fifth Avenue in New York, New York, for a gross purchase price of $165.0 million with $83.3 million in gross property-level financing. The retail condominium comprises approximately 26,500 square feet of retail space on the ground and second level floors. |
• | On September 15, 2014, we contributed $244.7 million to a joint venture that acquired a 20% interest in a development located in Miami, Florida, and an 85.67% interest in a retail property located in Bellevue, Washington. The joint venture's 20% interest in the Miami Design District Associates, LLC ("MDDA") was acquired for a purchase price of $280.0 million. |
• | On June 27, 2014, we contributed $106.6 million for a 50% interest in a joint venture that acquired 685 Fifth Avenue in New York, New York, for a gross purchase price of $521.4 million with $340.0 million in gross property-level financing. The property comprises approximately 25,000 square feet of retail space and 115,000 square feet of office space. |
Warrants and Brookfield Ownership
Brookfield owns or manages on behalf of third parties all of the Company's outstanding Warrants ( Note 9 ) which are exercisable into approximately 59 million common shares of the Company at a weighted-average exercise price of $9.11 per share, assuming net share settlement. The strike price and common shares issuable under the Warrants will adjust for dividends declared by the Company.
As of February 4, 2015, Brookfield's potential ownership of the Company (assuming full share settlement of the Warrants) was 39.8%, which is stated in their Form 13D filed on the same date. If Brookfield held or managed this same ownership through the
34
Table of Contents
maturity date of the Warrant assuming: (a) GGP's common stock price increased $10 per share and (b) the Warrants were adjusted for the impact of regular dividends, we estimate that their ownership would be 40.0% under net share settlement, and 41.2% under full share settlement.
Redevelopments
We are currently redeveloping several consolidated and unconsolidated properties primarily to convert large-scale anchor boxes into smaller leasable areas and to create new in-line retail space and new restaurant venues. The execution of these redevelopment projects within our portfolio was identified as providing compelling risk-adjusted returns on investment.
We have identified approximately $2.4 billion of income producing development and redevelopment projects within our portfolio, over 80% of which is being invested into Class A malls. We plan to fund these developments and redevelopments with available cash flow, construction financing, proceeds from debt refinancings and net proceeds from asset sales. We continue to evaluate a number of other redevelopment projects to further enhance the quality of our assets. We currently expect to achieve returns that average 9-11% for all projects (cash on cost, first year stabilized). Expected returns are based on the completion of current and future redevelopment projects, and the success of the leasing and asset management plans in place for each project. Expected returns are subject to a number of variables, risks, and uncertainties including those disclosed within Item 1A of our Annual Report. We also refer the reader to our disclosure related to forward-looking statements, below. The following table illustrates our planned redevelopments:
35
Table of Contents
Property | Description |
| Ownership % |
| GGP's Total Projected Share of Cost |
| GGP's Investment to Date (1) |
| Expected Return on Investment (2) |
| Expected Project Opening | ||||
Major Development Summary (in millions, at share unless otherwise noted) |
|
|
|
| |
|
| |
|
|
|
| |||
|
|
|
|
|
|
|
|
|
|
|
| ||||
Open |
|
|
|
|
| |
|
| |
|
|
|
| ||
Northridge Northridge, CA | The Sports Authority, Yardhouse and Plaza |
| 100% |
| $ | 12.2 | |
| $ | 11.3 | |
| 14% |
| Open |
|
|
|
|
|
|
|
|
|
|
|
| ||||
Fashion Show Las Vegas, NV | Addition of Macy's Men's and inline |
| 100% |
| 34.4 | |
| 33.3 | |
| 22% |
| Open | ||
|
|
|
|
|
|
|
|
|
|
|
| ||||
Oakwood Center Gretna, LA | West wing redevelopment and Dick's Sporting Goods |
| 100% |
| 19.0 | |
| 16.6 | |
| 9% |
| Open | ||
|
|
|
|
|
|
|
|
|
|
|
| ||||
Glendale Galleria 3 Glendale, CA | Addition of Bloomingdale's, remerchandising, business development and renovation |
| 50% |
| 52.6 | |
| 51.0 | |
| 12% |
| Open | ||
|
|
|
|
|
|
|
|
|
|
|
| ||||
The Mall in Columbia Columbia, MD | Lifestyle expansion |
| 100% |
| 23.0 | |
| 21.2 | |
| 13% |
| Open | ||
|
|
|
|
|
|
|
|
|
|
|
| ||||
Oakbrook Center Oakbrook, IL | Conversion of former anchor space into Container Store, Pirch and inline |
| 48% |
| 13.8 | |
| 13.4 | |
| 11% |
| Open | ||
|
|
|
|
|
|
|
|
|
|
|
| ||||
The Woodlands 3 Woodlands, TX | Addition of Nordstrom in former Sears box |
| 100% |
| 44.0 | |
| 41.0 | |
| 9% |
| Open | ||
|
|
|
|
|
|
|
|
|
|
|
| ||||
Other Projects Various Malls | Redevelopment projects at various malls |
| N/A |
| 218.8 | |
| 196.5 | |
| 11% |
| Open | ||
|
|
|
|
|
|
|
|
|
|
|
| ||||
| Total Open Projects |
|
|
| $ | 417.8 | |
| $ | 384.3 | |
| 12% |
|
|
|
|
|
|
|
|
|
|
|
|
|
| ||||
Under Construction |
|
|
|
|
| |
|
| |
|
|
|
| ||
|
|
|
|
|
|
|
|
|
|
|
| ||||
Mayfair Mall 3 Wauwatosa, WI | Nordstrom |
| 100% |
| 72.3 | |
| 34.4 | |
| 6-8% |
| Q4 2015 | ||
|
|
|
|
|
|
|
|
|
|
|
| ||||
Ridgedale Center 3 Minnetonka, MN | Nordstrom, Macy's Expansion, New Inline GLA and renovation |
| 100% |
| 106.2 | |
| 49.3 | |
| 8-9% |
| Q4 2015 | ||
|
|
|
|
|
|
|
|
|
|
|
| ||||
Southwest Plaza Littleton, CO | Redevelopment |
| 100% |
| 72.6 | |
| 22.1 | |
| 7-8% |
| Q4 2015 | ||
|
|
|
|
|
|
|
|
|
|
|
| ||||
Ala Moana Center 3 Honolulu, HI | Demolish existing Sears store and expand mall, adding anchor, box and inline tenants, reconfigure center court |
| 100% |
| 573.2 | |
| 391.5 | |
| 9-10% |
| Q4 2015 | ||
|
|
|
|
|
|
|
|
|
|
|
| ||||
Baybrook Mall Friendswood, TX | Expansion |
| 53% |
| 90.5 | |
| 26.3 | |
| 9-10% |
| Q4 2015 | ||
|
|
|
|
|
|
|
|
|
|
|
| ||||
Other Projects Various Malls | Redevelopment projects at various malls |
| N/A |
| $ | 236.2 | |
| $ | 65.8 | |
| 8-9% |
| Various |
|
|
|
|
|
|
|
|
|
|
|
| ||||
| Total Projects Under Construction |
|
|
| $ | 1,151.0 | |
| $ | 589.4 | |
| 8-10% |
|
|
|
|
|
|
|
|
|
|
|
|
|
| ||||
Projects in Pipeline |
|
|
|
|
| |
|
| |
|
|
|
| ||
|
|
|
|
|
|
|
|
|
|
|
| ||||
Staten Island Mall Staten Island, NY | Expansion |
| 100% |
| 180.0 | |
| 4.8 | |
| 8-9% |
| TBD | ||
|
|
|
|
|
|
|
|
|
|
|
| ||||
New Mall Development Norwalk, CT | Ground up mall development |
| 100% |
| 285.0 | |
| 38.1 | |
| 8-10% |
| TBD | ||
|
|
|
|
|
|
|
|
|
|
|
| ||||
Ala Moana Center Honolulu, HI | Nordstrom box repositioning |
| 100% |
| 85.0 | |
| - | |
| 9-10% |
| TBD | ||
|
|
|
|
|
|
|
|
|
|
|
| ||||
Other Projects Various Malls | Redevelopment projects at various malls |
| N/A |
| 274.5 | |
| 6.5 | |
| 8-9% |
| TBD | ||
|
|
|
|
|
|
|
|
|
|
|
| ||||
| Total Projects in Pipeline |
|
|
| $ | 824.5 | |
| $ | 49.4 | |
| 8-10% |
|
|
|
|
|
|
|
|
|
|
|
|
|
| ||||
| Total Development Summary |
|
|
| $ | 2,393.3 | |
| $ | 1,023.1 | |
| 9-11% |
|
|
(1) Projected costs and investments to date exclude capitalized interest and internal overhead.
(2) Return on investment represents first year stabilized cash on cost return, based upon budgeted assumptions. Actual costs may vary.
(3) Project ROI includes income related to uplift on existing space.
36
Table of Contents
Our investment in these projects for the year ended December 31, 2014 has increased from December 31, 2013 , in conjunction with the applicable development plan and as projects near completion. The completion of the project at The Woodlands, beginning of construction at Southwest Plaza and Baybrook Mall, and the continued progression of the redevelopment project at Ala Moana Center among others resulted in increases to GGP's investment to date.
Capital Expenditures, Capitalized Interest and Overhead (at share)
The following table illustrates our capital expenditures, capitalized interest, and internal costs associated with leasing and development overhead, which primarily relate to ordinary capital projects at our operating properties. In addition, we incurred tenant allowances and capitalized leasing costs for our operating properties as outlined below. Capitalized interest is based upon qualified expenditures and interest rates; capitalized leasing and development costs are based upon time expended on these activities. These costs are amortized over lives which are consistent with the related asset.
| Year Ended December 31, | ||||||
| 2014 |
| 2013 | ||||
| (Dollars in thousands) | ||||||
Capital expenditures(1) | $ | 177,255 | |
| $ | 146,315 | |
Tenant allowances (2) | 132,242 | |
| 131,802 | | ||
Capitalized interest and capitalized overhead | 58,217 | |
| 57,425 | | ||
Total | $ | 367,714 | |
| $ | 335,542 | |
_______________________________________________________________________________
(1) Reflects only non-tenant operating capital expenditures.
(2) Tenant allowances paid on 3.6 million square feet.
The increase in capital expenditures is primarily driven by refurbishment projects that improve the quality of our properties.
Common Stock Dividends
Our Board of Directors declared common stock dividends during 2014 and 2013 as follows:
Declaration Date |
| Record Date |
| Payment Date |
| Dividend Per Share | ||
2014 |
|
|
|
|
|
| | |
November 14 |
| December 15 |
| January 2, 2015 |
| $ | 0.17 | |
August 12 |
| October 15 |
| October 31, 2014 |
| 0.16 | | |
May 15 |
| July 15 |
| July 31, 2014 |
| 0.15 | | |
February 26 |
| April 15 |
| April 30, 2014 |
| 0.15 | | |
2013 |
|
|
|
|
|
| | |
October 28 |
| December 13 |
| January 2, 2014 |
| $ | 0.14 | |
July 29 |
| October 15 |
| October 29, 2013 |
| 0.13 | | |
May 10 |
| July 16 |
| July 30, 2013 |
| 0.12 | | |
February 4 |
| April 16 |
| April 30, 2013 |
| 0.12 | | |
37
Table of Contents
Preferred Stock Dividends
On February 13, 2013, we issued 10,000,000 shares of 6.375% Series A Preferred Stock at $25.00 per share. Our Board of Directors declared preferred stock dividends during 2014 and 2013 as follows:
Declaration Date |
| Record Date |
| Payment Date |
| Dividend Per Share | ||
2014 |
|
|
|
|
|
| ||
November 14 |
| December 15 |
| January 2, 2015 |
| $ | 0.3984 | |
August 12 |
| September 15 |
| October 1, 2014 |
| 0.3984 | | |
May 15 |
| June 16 |
| July 1, 2014 |
| 0.3984 | | |
February 26 |
| March 17 |
| April 1, 2014 |
| 0.3984 | | |
2013 |
|
|
|
|
|
| | |
October 28 |
| December 13 |
| January 2, 2014 |
| $ | 0.3984 | |
July 29 |
| September 13 |
| October 1, 2013 |
| 0.3984 | | |
May 10 |
| June 14 |
| July 1, 2013 |
| 0.3984 | | |
March 4 |
| March 15 |
| April 1, 2013 |
| 0.2125 | | |
Summary of Cash Flows
Cash Flows from Operating Activities
Net cash provided by operating activities was $949.7 million for the year ended December 31, 2014 , $889.5 million for the year ended December 31, 2013 , and $807.1 million for the year ended December 31, 2012 . Significant components of net cash provided by operating activities include:
2014 Activity
• | increase in base minimum rents and related collections due to overall increase in permanent occupancy partially offset by |
• | extinguishment of the tax indemnification liability. |
2013 Activity
• increase in base minimum rents and related collections due to overall increase in permanent occupancy;
• | decrease in interest costs primarily as a result of the redemption of unsecured corporate bonds; partially offset by |
• | decrease in accounts payable and accrued expenses primarily attributable to a legal settlement. |
2012 Activity
• | increase in base minimum rents and related collections due to the overall increase in permanent occupancy; |
• decrease in operating costs consistent with our initiatives to control costs;
• decrease in interest costs primarily as a result of the refinancing of our debt; and
• increase in restricted cash due to the release of operating escrow funds.
Cash Flows from Investing Activities
Net cash (used in) provided by investing activities was $(677.9) million for the year ended December 31, 2014 , $166.9 million for the year ended December 31, 2013 , and $(221.5) million for the year ended December 31, 2012 . Significant components of net cash used in investing activities include:
2014 Activity
• development of real estate and property improvements of $(624.8) million ;
38
Table of Contents
• | distributions received from our Unconsolidated Real Estate Affiliates in excess of income of $387.2 million ; |
• | contributions of $(537.4) million to form seven new joint ventures and loans to venture partners of $(137.1) million ( Note 3 ); partially offset by |
• | proceeds from the disposition of one retail property and three other assets and the contribution of one property to a joint venture for $361.2 million ( Note 4 ). |
2013 Activity
• proceeds from the formation of a joint venture of $411.5 million ( Note 3 );
• | acquisition of our joint venture partner's 50% interest in Quail Springs for $(55.5) million, net ( Note 3 ); |
• | contribution to a joint venture that acquired a portfolio in San Francisco's Union Square area for $(40.3) million; |
• | proceeds from the sale of our investment in Aliansce Shopping Centers S.A. of $446.3 million (Note 14); and |
• the acquisition of two retail properties for $(314.8) million ( Note 3 );
2012 Activity
• | the acquisition of 11 Sears anchor pads for $(270.0) million; |
• | the acquisition of the remaining 49% of The Oaks and Westroads, which were previously owned through a joint venture for $(98.3) million; |
• | proceeds from the disposition of 21 properties and a portion of our office portfolio for $362.4 million ( Note 4 ); and |
• | distributions received from Unconsolidated Real Estate Affiliates in excess of income primarily related to distributions received from three of our joint ventures of $372.2 million. |
Cash Flows from Financing Activities
Net cash used in financing activities was $476.6 million for the year ended December 31, 2014 , $1.1 billion for the year ended December 31, 2013 , and $533.7 million for the year ended December 31, 2012 . Significant components of net cash used in financing activities include:
2014 Activity
• the acquisition of 27.6 million shares of our common stock for $(555.8) million;
• | cash distributions paid to common stockholders of $(534.2) million ; and |
• | proceeds from the refinancing or issuance of mortgages, notes, and loans payable, net of principal payments of $641.4 million . |
2013 Activity
• | net proceeds from the issuance of Preferred Stock of $242.0 million; |
• | purchase of the Fairholme and Blackstone Warrants $(633.2) million (Note 9); |
• | the acquisition of 28.3 million shares of our common stock $(566.9) million; |
• | cash distributions paid to common stockholders of $(447.2) million; and |
• | proceeds from the refinancing or issuance of mortgages, notes, and loans payable, net of principal payments $345.6 million, net. |
39
Table of Contents
2012 Activity
• | we made $5.8 billion of principal payments, which were partially offset by net proceeds of $5.6 billion received from refinanced or new mortgage notes; and |
• | cash distributions paid to common stockholders, $(384.3) million, which were offset by the cash distributions reinvested in common stock via the DRIP, $48.5 million; |
Seasonality
Although we have a year-long temporary leasing program, occupancies for short-term tenants and, therefore, rental income recognized, are higher during the fourth quarter of the year. In addition, the majority of our tenants have December or January lease years for purposes of calculating annual overage rent amounts. Accordingly, overage rent thresholds are most commonly achieved in the fourth quarter. As a result, revenue production is generally highest in the fourth quarter of each year.
Critical Accounting Policies
The preparation of financial statements in conformity with GAAP requires management to make estimates and assumptions that affect the financial statements and disclosures. Some of these estimates and assumptions require application of difficult, subjective, and/or complex judgment about the effect of matters that are inherently uncertain and that may change in subsequent periods. We are required to make such estimates and assumptions when applying the following accounting policies:
Acquisitions of Operating Properties ( Note 3 )
Acquisitions of properties are accounted for utilizing the acquisition method of accounting and, accordingly, the results of operations of acquired properties were included in the results of operations from the respective dates of acquisition. Estimates of future cash flows and other valuation techniques are used to allocate the purchase price of acquired property between land, buildings and improvements, equipment, debt liabilities assumed and identifiable intangible assets and liabilities such as amounts related to in-place tenant leases, acquired above and below-market tenant and ground leases and tenant relationships. No significant value had been ascribed to the tenant relationships.
The fair values of tangible assets are determined on an "if vacant" basis. The "if vacant" fair value is allocated to land, where applicable, buildings, equipment and tenant improvements based on comparable sales and other relevant information with respect to the property. Specifically, the "if vacant" value of the buildings and equipment was calculated using a cost approach utilizing published guidelines for current replacement cost or actual construction costs for similar, recently developed properties; and an income approach. Assumptions used in the income approach to the value of buildings include: capitalization and discount rates, lease-up time, market rents, make ready costs, land value, and site improvement value.
The estimated fair value of in-place tenant leases includes lease origination costs (the costs we would have incurred to lease the property to the current occupancy level of the property) and the lost revenues during the period necessary to lease-up from vacant to the current occupancy level. Such estimates include the fair value of leasing commissions, legal costs and tenant coordination costs that would be incurred to lease the property to this occupancy level. Additionally, we evaluate the time period over which such occupancy level would be achieved and include an estimate of the net operating costs (primarily real estate taxes, insurance and utilities) incurred during the lease-up period, which generally ranges up to one year. The fair value of acquired in-place tenant leases is included in the balance of buildings and equipment and amortized over the remaining lease term for each tenant.
Identifiable intangible assets and liabilities are calculated for above-market and below-market tenant and ground leases where we are either the lessor or the lessee. The difference between the contractual rental rates and our estimate of market rental rates is measured over a period equal to the remaining noncancelable term of the leases, including significantly below-market renewal options for which exercise of the renewal option appears to be reasonably assured. The remaining term of leases with renewal options at terms significantly below market reflect the assumed exercise of such below-market renewal options and assume the amortization period would coincide with the extended lease term. The above-market tenant leases and below-market ground leases are included in prepaid expenses and other assets (Note 15); the below-market tenant leases, above-market ground leases and above-market headquarters office lease are included in accounts payable and accrued expenses ( Note 16 ) in our Consolidated Balance Sheets.
Investments in Unconsolidated Real Estate Affiliates ( Note 6 )
We account for investments in joint ventures where we own a non-controlling joint interest using the equity method. To determine the method of accounting for partially owned joint ventures, we evaluate the characteristics of associated entities and determine whether an entity is a variable interest entity ("VIE") and, if so, determine which party is primary beneficiary by analyzing whether we have both the power to direct the entity's significant economic activities and the obligation to absorb potentially significant losses or receive potentially significant benefits. Significant judgments and assumptions inherent in this analysis include the nature
40
Table of Contents
of the entity's operations, future cash flow projections, the entity's financing and capital structure, and contractual relationship and terms. We consolidate a VIE when we have determined that we are the primary beneficiary. Primary risks associated with our VIEs include the potential of funding the entities' debt obligations or making additional contributions to fund the entities' operations.
Partially owned, non-variable interest joint ventures over which we have controlling financial interest are consolidated in our consolidated financial statements. In determining if we have a controlling financial interest, we consider factors such as ownership interest, authority to make decisions, kick-out rights and substantive participating rights. Partially owned joint ventures where we do not have a controlling financial interest, but have the ability to exercise significant influence, are accounted for using the equity method.
We continually analyze and assess reconsideration events, including changes in the factors mentioned above, to determine if the consolidation treatment remains appropriate. Decisions regarding consolidation of partially owned entities frequently require significant judgment by our management. Errors in the assessment of consolidation could result in material changes to our consolidated financial statements.
Revenue Recognition and Related Matters
Minimum rent revenues are recognized on a straight-line basis over the terms of the related operating leases. Minimum rent revenues also include lease termination income collected from tenants to allow the tenant to vacate their space prior to their scheduled termination dates, as well as, accretion related to above and below-market tenant leases on acquired properties and properties that were fair valued at emergence from bankruptcy.
In leasing tenant space, we may provide funding to the lessee through a tenant allowance. In accounting for a tenant allowance, we determine whether the allowance represents funding for the construction of leasehold improvements and evaluate the ownership of such improvements. If we are considered the owner of the leasehold improvements for accounting purposes, we capitalize the amount of the tenant allowance and depreciate it over the shorter of the useful life of the leasehold improvements or the related lease term. If the tenant allowance represents a payment for a purpose other than funding leasehold improvements, or in the event we are not considered the owner of the improvements for accounting purposes, the allowance is considered to be a lease incentive and is recognized over the lease term as a reduction of rental revenue on a straight-line basis.
Overage rent is paid by a tenant when the tenant's sales exceed an agreed upon minimum amount and is recognized on an accrual basis once tenant sales exceed contractual tenant lease thresholds and is calculated by multiplying the sales in excess of the minimum amount by a percentage defined in the lease. Recoveries from tenants are established in the leases or computed based upon a formula related to real estate taxes, insurance and other property operating expenses and are generally recognized as revenues in the period the related costs are incurred.
We provide an allowance for doubtful accounts against the portion of accounts receivable, including straight-line rents, which is estimated to be uncollectible. Such allowances are reviewed periodically based upon our recovery experience.
Impairment
Operating properties
We regularly review our consolidated properties for potential impairment indicators whenever events or changes in circumstances indicate that the carrying amount may not be recoverable. Impairment indicators are assessed separately for each property and include, but are not limited to, significant decreases in real estate property net operating income, significant decreases in occupancy percentage, debt maturities, management's intent with respect to the properties and prevailing market conditions.
If an indicator of potential impairment exists, the property is tested for recoverability by comparing its carrying amount to the estimated future undiscounted cash flows. The expected cash flows of a property are dependent on estimates and other factors subject to change, including (1) changes in the national, regional, global, and/or local economic climates, (2) competition from other shopping centers, stores, clubs, mailings, and the internet, (3) increases in operating costs and future required capital expenditures, (4) bankruptcy and/or other changes in the condition of third parties, including anchors and tenants, (5) expected holding period, (6) availability of and cost of financing, and (7) fair values including consideration of capitalization rates, discount rates, and comparable selling prices. These factors could cause our expected future cash flows from a retail property to change, and, as a result, an impairment could be considered to have occurred.
Although the carrying amount may exceed the estimated fair value of certain properties, a real estate asset is only considered to be impaired when its carrying amount cannot be recovered through estimated future undiscounted cash flows. To the extent an impairment provision is determined to be necessary, the excess of the carrying amount of the property over its estimated fair value is expensed to operations. In addition, the impairment provision is allocated proportionately to adjust the carrying amount of the asset group. The adjusted carrying amount, which represents the new cost basis of the property, is depreciated over the remaining useful life of the property.
41
Table of Contents
Although we may market a property for sale, there can be no assurance that the transaction will be complete until the sale is finalized. However, GAAP requires us to utilize the Company's expected holding period of our properties when assessing recoverability. If we cannot recover the carrying value of these properties within the planned holding period, we will estimate the fair values of the assets and record impairment charges for properties when the estimated fair value is less than their carrying value.
Impairment indicators for pre-development costs, which are typically costs incurred during the beginning stages of a potential development and construction in progress, are assessed by project and include, but are not limited to, significant changes in the Company's plans with respect to the project, significant changes in projected completion dates, tenant demand, anticipated revenues or cash flows, development costs, market factors and sustainability of development projects.
Impairment charges are recorded in the Consolidated Statements of Operations and Comprehensive Income (Loss) when the carrying value of a property is not recoverable and it exceeds the estimated fair value of the property, which can occur in accounting periods preceding disposition and / or in the period of disposition.
Investment in Unconsolidated Real Estate Affiliates
A series of operating losses of an investee or other factors may indicate that an other-than-temporary decline in value of our investment in an Unconsolidated Real Estate Affiliate has occurred. The investment in each of the Unconsolidated Real Estate Affiliates is evaluated for valuation declines below the carrying amount. Accordingly, in addition to the property-specific impairment analysis that we perform for such joint ventures (as part of our operating property impairment process described above), we also considered whether there were other-than-temporary declines with respect to the carrying values of our Unconsolidated Real Estate Affiliates.
General
Impairment charges could be taken in the future if economic conditions change or if the plans regarding our assets change. Therefore, we can provide no assurance that material impairment charges with respect to our assets, including operating properties, construction in progress and investments in Unconsolidated Real Estate Affiliates, will not occur in future periods. We will continue to monitor circumstances and events in future periods to determine whether impairments are warranted.
Capitalization of Development Costs
Construction and improvement costs incurred in connection with the development of new properties or the redevelopment of existing properties are capitalized. During development, we typically obtain land or land options, zoning and regulatory approvals, anchor commitments, and financing arrangements. This process may take several years during which we may incur significant costs. We capitalize all development costs once it is considered probable that a project will reach a successful conclusion. In the event a development is no longer deemed to be probable of occurring, the capitalized costs are expensed. Determination of when a development project is substantially complete and held available for occupancy and capitalization must cease also involves a degree of judgment. Real estate taxes, interest costs, and internal costs associated with leasing and development overhead incurred during construction periods are capitalized.
42
Table of Contents
Contractual Cash Obligations and Commitments
The following table aggregates our subsequent contractual cash obligations and commitments as of December 31, 2014 :
| 2015 |
| 2016 |
| 2017 |
| 2018 |
| 2019 |
| Subsequent/ Other |
| Total | ||||||||||||||
|
|
|
|
| (Dollars in thousands) |
|
|
|
| ||||||||||||||||||
Long-term debt-principal(1) | $ | 654,580 | |
| $ | 695,078 | |
| $ | 873,907 | |
| $ | 1,832,933 | |
| $ | 1,323,002 | |
| $ | 10,592,069 | |
| $ | 15,971,569 | |
Interest payments(2) | 656,596 | |
| 651,939 | |
| 631,527 | |
| 566,899 | |
| 497,176 | |
| 1,422,361 | |
| 4,426,498 | | |||||||
Retained debt-principal | 1,530 | |
| 1,601 | |
| 1,705 | |
| 1,801 | |
| 1,902 | |
| 80,734 | |
| 89,273 | | |||||||
Ground lease payments | 4,821 | |
| 4,820 | |
| 4,849 | |
| 4,767 | |
| 4,810 | |
| 162,764 | |
| 186,831 | | |||||||
Corporate leases | 6,794 | |
| 6,798 | |
| 6,802 | |
| 6,813 | |
| 5,834 | |
| 3,610 | |
| 36,651 | | |||||||
Purchase obligations(3) | 203,262 | |
| - | |
| - | |
| - | |
| - | |
| - | |
| 203,262 | | |||||||
Junior Subordinated Notes(4) | - | |
| - | |
| - | |
| - | |
| - | |
| 206,200 | |
| 206,200 | | |||||||
Uncertain tax position liability(5) | 6,663 | |
| - | |
| - | |
| - | |
| - | |
| - | |
| 6,663 | | |||||||
Other long-term liabilities(6) | - | |
| - | |
| - | |
| - | |
| - | |
| - | |
| - | | |||||||
Total | $ | 1,534,246 | |
| $ | 1,360,236 | |
| $ | 1,518,790 | |
| $ | 2,413,213 | |
| $ | 1,832,724 | |
| $ | 12,467,738 | |
| $ | 21,126,947 | |
_______________________________________________________________________________
(1) | Excludes $19.9 million of non-cash debt market rate adjustments. The $100.0 million outstanding on the revolving credit facility as of December 31, 2014 is included in 2015 . |
(2) | Based on rates as of December 31, 2014 . Variable rates are based on a LIBOR rate of 0.17%. Excludes interest payments related to debt market rate adjustments. |
(3) | Reflects accrued and incurred construction costs payable. Routine trade payables have been excluded. |
(4) | The $206.2 million of Junior Subordinated Notes are due in 2036, but may be redeemed by us any time after April 30, 2011. As we do not expect to redeem the notes prior to maturity, they are included in consolidated debt maturing subsequent to 2019 . |
(5) | We believe that it is reasonably possible that all of our currently remaining unrecognized tax benefits may be recognized by the end of 2015 upon the potential settlement of an audit and the expiration of the statute of limitations. |
(6) | Other long-term liabilities related to ongoing real estate taxes have not been included in the table as such amounts depend upon future applicable real estate tax rates. Real estate tax expense was $228.0 million in 2014 , $239.8 million in 2013 and $215.1 million in 2012 . |
In the normal course of business, from time to time, we are involved in legal proceedings relating to the ownership and operations of our properties (reference is made to Item 3 above, which description is incorporated into this response).
We lease land or buildings from third parties. The land leases generally provide the right of first refusal in the event of a proposed sale of the property by the owner. Rental payments are expensed as incurred and have, to the extent applicable, been straight-lined over the term of the lease. The following is a summary of our contractual rental expense, which is included in other property operating costs in our Consolidated Statements of Operations and Comprehensive Income (Loss):
| Year Ended December 31, | ||||||||||
| 2014 |
| 2013 |
| 2012 | ||||||
| (Dollars in thousands) | ||||||||||
Contractual rent expense, including participation rent | $ | 13,605 | |
| $ | 13,475 | |
| $ | 13,933 | |
Contractual rent expense, including participation rent and excluding amortization of above and below-market ground leases and straight-line rent | 9,036 | |
| 8,670 | |
| 8,906 | | |||
REIT Requirements
In order to remain qualified as a REIT for Federal income tax purposes, we must distribute at least 90% of our taxable ordinary income to stockholders. We are also subject to federal income tax to the extent we distribute less than 100% of our REIT taxable income, including capital gains. See Note 8 for more detail on our ability to remain qualified as a REIT.
43
Table of Contents
Recently Issued Accounting Pronouncements
Effective January 1, 2015, the definition of discontinued operations has been revised to limit what qualifies for this classification and presentation to disposals of components of a company that represent strategic shifts that have (or will have) a major effect on the company's operations and financial results. Required expanded disclosures for disposals or disposal groups that qualify for discontinued operations are intended to provide users of financial statements with enhanced information about the assets, liabilities, revenues and expenses of such discontinued operations. In addition, in accordance with this pronouncement, companies are required to disclose the pretax profit or loss of an individually significant component that does not qualify for discontinued operations treatment. Pursuant to its terms, we have elected to adopt this pronouncement effective January 1, 2015. This definition will be applied prospectively after the adoption and is anticipated to substantially reduce the number of transactions, going forward, that qualify for discontinued operations as compared to historical results.
Effective January 1, 2017, companies will be required to apply a five-step model in accounting for revenue arising from contracts with customers. The core principle of the revenue model is that a company recognizes revenue to depict the transfer of promised goods or services to customers in an amount that reflects the consideration to which the entity expects to be entitled in exchange for those goods or services. Lease contracts will be excluded from this revenue recognition criteria; however, the sale of real estate will be required to follow the new model. Expanded quantitative and qualitative disclosures regarding revenue recognition will be required for contracts that are subject to this pronouncement. The Company is evaluating the potential impact of this pronouncement on its consolidated financial statements.
Subsequent Events
We formed a partnership to own and operate Ala Moana Center located in Honolulu, Hawaii. Effective with the partnership formation, we own a 75% equity interest and the partner owns a 25% equity interest in Ala Moana Center. The transaction generated approximately $907 million of net proceeds, of which we received approximately $670 million of net proceeds at closing on February 27, 2015. The remaining net proceeds of approximately $237 million will be paid in late 2016 upon completion of the redevelopment and expansion. We may sell an additional 12.5% equity interest in Ala Moana Center within the next 60 days on the same economic terms.
Non-GAAP Supplemental Financial Measures and Definitions
Net Operating Income ("NOI") and Company NOI
The Company defines NOI as income from property operations after operating expenses have been deducted, but prior to deducting financing, administrative and income tax expenses. NOI has been reflected on a proportionate basis (at the Company's ownership share). Other REITs may use different methodologies for calculating NOI, and accordingly, the Company's depiction of NOI may not be comparable to other REITs. The Company considers NOI a helpful supplemental measure of its operating performance because it is a direct measure of the actual results of our properties. Because NOI excludes general and administrative expenses, interest expense, retail investment property impairment or non-recoverable development costs, depreciation and amortization, gains and losses from property dispositions, allocations to noncontrolling interests, provision for income taxes, discontinued operations, preferred stock dividends, and extraordinary items, it provides a performance measure that, when compared year over year, reflects the revenues and expenses directly associated with owning and operating commercial real estate properties and the impact on operations from trends in occupancy rates, rental rates and operating costs.
The Company also considers Company NOI to be a helpful supplemental measure of its operating performance because it excludes from NOI certain non-cash and non-comparable items such as straight-line rent and intangible asset and liability amortization, which are a result of our emergence, acquisition accounting and other capital contribution or restructuring events. However, due to the exclusions noted, Company NOI should only be used as an alternative measure of the Company's financial performance. We present Company NOI, Company EBITDA, and Company FFO (as defined below), as we believe certain investors and other users of our financial information use these measures of the Company's historical operating performance.
Earnings Before Interest Expense, Income Tax, Depreciation, and Amortization ("EBITDA") and Company EBITDA
The Company defines EBITDA as NOI less certain property management and administrative expenses, net of management fees and other operational items. EBITDA is a commonly used measure of performance in many industries, but may not be comparable to measures calculated by other companies. Management believes EBITDA provides useful information to investors regarding our results of operations because it helps us and our investors evaluate the ongoing operating performance of our properties after removing the impact of our capital structure (primarily interest expense) and our asset base (primarily depreciation and amortization). Management also believes the use of EBITDA facilitates comparisons between us and other equity REITs, retail property owners who are not REITs and other capital-intensive companies. Management uses EBITDA to evaluate property-level results and as one measure in determining the value of acquisitions and dispositions and, like FFO (discussed below), it is widely used by management in the annual budget process and for compensation programs.
44
Table of Contents
The Company also considers Company EBITDA to be a helpful supplemental measure of its operating performance because it excludes from EBITDA certain non-cash and non-comparable items such as straight-line rent and intangible asset and liability amortization, which are a result of our emergence, acquisition accounting and other capital contribution or restructuring events. However, due to the exclusions noted, Company EBITDA should only be used as an alternative measure of the Company's financial performance.
Funds From Operations ("FFO") and Company FFO
The Company determines FFO based upon the definition set forth by National Association of Real Estate Investment Trusts ("NAREIT"), which may not be comparable to measures calculated by other companies who do not use the NAREIT definition of FFO. The Company determines FFO to be our share of consolidated net income (loss) computed in accordance with GAAP, excluding real estate related depreciation and amortization, excluding gains and losses from extraordinary items, excluding cumulative effects of accounting changes, excluding gains and losses from the sales of, or any impairment charges related to, previously depreciated operating properties, plus the allocable portion of FFO of unconsolidated joint ventures based upon our economic ownership interest, and all determined on a consistent basis in accordance with GAAP. As with our presentation of NOI, FFO has been reflected on a proportionate basis.
We consider FFO a helpful supplemental measure of the operating performance for equity REITs and a complement to GAAP measures because it is a recognized measure of performance by the real estate industry. FFO facilitates an understanding of the operating performance of our properties between periods because it does not give effect to real estate depreciation and amortization since these amounts are computed to allocate the cost of a property over its useful life. Since values for well-maintained real estate assets have historically increased or decreased based upon prevailing market conditions, the Company believes that FFO provides investors with a clearer view of the Company's operating performance.
As with our presentation of Company NOI, the Company also considers Company FFO to be a helpful supplemental measure of the operating performance for equity REITs because it excludes from FFO certain items that are non-cash and certain non-comparable items such as our Company NOI adjustments, and FFO items such as FFO from discontinued operations related to the spin-off of Rouse Properties, Inc, mark-to-market adjustments on debt and gains on the extinguishment of debt, warrant liability adjustment, and interest expense on debt repaid or settled all which are a result of our emergence, acquisition accounting and other capital contribution or restructuring events
Reconciliation of Non-GAAP Financial Measures to GAAP Financial Measures
The Company presents NOI, EBITDA, and FFO as they are financial measures widely used in the REIT industry. Reconciliations have been provided as follows: Company NOI to GAAP Operating Income, Company EBITDA to GAAP Net Income Attributable to GGP, and Company FFO to GAAP Net Income Attributable to GGP. None of our non-GAAP financial measures represents cash flow from operating activities in accordance with GAAP, none should be considered as an alternative to GAAP net income (loss) attributable to General Growth Properties, Inc. and none are necessarily indicative of cash available to fund cash needs. In addition, the Company has presented such financial measures on a consolidated and unconsolidated basis (at the Company's ownership share) as the Company believes that given the significance of the Company's operations that are owned through investments accounted for on the equity method of accounting, the detail of the operations of the Company's unconsolidated properties provides important insights into the income and FFO produced by such investments for the Company as a whole.
45
Table of Contents
The following table reconciles Company NOI to GAAP Operating Income (dollars in thousands) for the year ended December 31, 2014 and 2013 :
| Year Ended December 31, | ||||||
| 2014 |
| 2013 | ||||
|
|
|
| ||||
Company NOI | $ | 2,250,509 | |
| $ | 2,161,837 | |
Adjustments for minimum rents, real estate taxes and other property operating costs | (36,624 | ) |
| (44,334 | ) | ||
Proportionate NOI | 2,213,885 | |
| 2,117,503 | | ||
Unconsolidated Properties | (428,799 | ) |
| (397,484 | ) | ||
Consolidated Properties | 1,785,086 | |
| 1,720,019 | | ||
Management fees and other corporate revenues | 70,887 | |
| 68,792 | | ||
Property management and other costs | (155,093 | ) |
| (164,457 | ) | ||
General and administrative | (64,051 | ) |
| (49,237 | ) | ||
Provisions for impairment | (5,278 | ) |
| - | | ||
Depreciation and amortization | (708,406 | ) |
| (749,722 | ) | ||
Loss on sales of investment properties | (44 | ) |
| - | | ||
Noncontrolling interest in operating income of Consolidated Properties and other | $ | 18,412 | |
| $ | 15,021 | |
Operating Income | 941,513 | |
| 840,416 | | ||
| Year Ended December 31, | ||||||
| 2014 |
| 2013 | ||||
|
|
|
| ||||
Company EBITDA | $ | 2,087,912 | |
| $ | 1,990,687 | |
Adjustments for minimum rents, real estate taxes, other property operating costs, and general and administrative | (54,478 | ) |
| (44,334 | ) | ||
Proportionate EBITDA | 2,033,434 | |
| 1,946,353 | | ||
Unconsolidated Properties | (395,933 | ) |
| (370,598 | ) | ||
Consolidated Properties | 1,637,501 | |
| 1,575,755 | | ||
Depreciation and amortization | (708,406 | ) |
| (749,722 | ) | ||
Noncontrolling interest in NOI of Consolidated Properties and other | 18,412 | |
| 15,021 | | ||
Interest income | 28,613 | |
| 7,699 | | ||
Interest expense | (699,285 | ) |
| (723,152 | ) | ||
Loss on foreign currency | (18,048 | ) |
| (7,312 | ) | ||
Warrant liability adjustment | - | |
| (40,546 | ) | ||
Provision for income taxes | (7,253 | ) |
| (345 | ) | ||
Provision for impairment excluded from FFO | (5,278 | ) |
| - | | ||
Equity in income of Unconsolidated Real Estate Affiliates | 61,278 | |
| 68,756 | | ||
Discontinued operations | 281,883 | |
| (11,622 | ) | ||
Gains from changes in control of investment properties | 91,193 | |
| 219,784 | | ||
Loss on extinguishment of debt | - | |
| (36,479 | ) | ||
Loss on sales of investment properties | (44 | ) |
| - | | ||
Allocation to noncontrolling interests | (14,716 | ) |
| (15,309 | ) | ||
Net income attributable to GGP | 665,850 | |
| 302,528 | | ||
|
|
|
| ||||
46
Table of Contents
The following table reconciles Company FFO to GAAP net income attributable to GGP for the years ended December 31, 2014 and 2013 :
| Year Ended December 31, | ||||||
| 2014 |
| 2013 | ||||
Company FFO | $ | 1,255,651 | |
| $ | 1,148,233 | |
Adjustments for minimum rents, property operating expenses, general and administrative, market rate adjustments, debt extinguishment, income taxes and FFO from discontinued operations | 64,545 | |
| (117,381 | ) | ||
Proportionate FFO (1) | 1,320,196 | |
| 1,030,852 | | ||
Depreciation and amortization of capitalized real estate costs | (893,418 | ) |
| (915,282 | ) | ||
Gain from change in control of investment properties | 91,193 | |
| 219,784 | | ||
Preferred stock dividends | 15,936 | |
| 14,078 | | ||
Gains on sales of investment properties | 141,687 | |
| 9,026 | | ||
Noncontrolling interests in depreciation of Consolidated Properties | 8,731 | |
| 7,151 | | ||
Provision for impairment excluded from FFO | (5,278 | ) |
| - | | ||
Provision for impairment excluded from FFO of discontinued operations | - | |
| (30,935 | ) | ||
Redeemable noncontrolling interests | (3,228 | ) |
| (2,289 | ) | ||
Depreciation and amortization of discontinued operations | (9,969 | ) |
| (29,857 | ) | ||
Net income attributable to GGP | 665,850 | |
| 302,528 | | ||
(1) FFO as defined by the National Association of Real Estate Investment Trusts.
Forward-Looking Statements
Certain statements made in this section or elsewhere in this report may be deemed "forward-looking statements" within the meaning of the Private Securities Litigation Reform Act of 1995. Although the Company believes the expectations reflected in any forward-looking statement are based on reasonable assumption, it can give no assurance that its expectations will be attained, and it is possible that actual results may differ materially from those indicated by these forward-looking statements due to a variety of risks, uncertainties and other factors. Such factors include, but are not limited to, the Company's ability to refinance, extend, restructure or repay near and intermediate term debt, its indebtedness, its ability to raise capital through equity issuances, asset sales or the incurrence of new debt, retail and credit market conditions, impairments, its liquidity demands and economic conditions. The Company discusses these and other risks and uncertainties in its annual and quarterly periodic reports filed with the Securities and Exchange Commission. The Company may update that discussion in its periodic reports, but otherwise takes no duty or obligation to update or revise these forward-looking statements, whether as a result of new information, future developments, or otherwise.
ITEM 7A. QUANTITATIVE AND QUALITATIVE DISCLOSURES ABOUT MARKET RISK
We are subject to market risk associated with changes in interest rates both in terms of variable-rate debt and the price of new fixed-rate debt upon maturity of existing debt and for acquisitions. As of December 31, 2014 , we had consolidated debt of $16.0 billion , including $2.4 billion of variable-rate debt. A 25 basis point movement in the interest rate on the $2.4 billion of variable-rate debt would result in a $6.0 million annualized increase or decrease in consolidated interest expense and operating cash flows.
In addition, we are subject to interest rate exposure as a result of variable-rate debt collateralized by the Unconsolidated Properties. Our share (based on our respective equity ownership interests in the Unconsolidated Real Estate Affiliates) of such variable-rate debt was $477.2 million at December 31, 2014 . A similar 25 basis point annualized movement in the interest rate on the variable-rate debt of the Unconsolidated Real Estate Affiliates would result in a $1.2 million annualized increase or decrease in our equity in the income (loss) of Unconsolidated Real Estate Affiliates.
We are subject to foreign currency exchange rate risk related to a $132.4 million note receivable denominated in Brazilian Reais ( Note 14 ). During the year ended December 31, 2014 , we recognized a $18.0 million loss on foreign currency on our Consolidated Statement of Operations and Comprehensive Income (Loss) due to changes in the value of the Brazilian Real and its impact on this note receivable. As of December 31, 2014 , a 10% increase in the value of the Brazilian Real would result in a $12.0 million loss on foreign currency, and a 10% decrease in the value of the Brazilian Real would result in a $14.7 million gain on foreign currency.
47
Table of Contents
For additional information concerning our debt, and management's estimation process to arrive at a fair value of our debt as required by GAAP, reference is made to Item 7, Liquidity and Capital Resources and Notes 5 and 7 . At December 31, 2014 , the fair value of our consolidated debt has been estimated for this purpose to be $612.5 million higher than the carrying amount of $16.0 billion .
ITEM 8. FINANCIAL STATEMENTS AND SUPPLEMENTARY DATA
Reference is made to the Consolidated Financial Statements and Consolidated Financial Statement Schedule beginning on page F-1 for the required information.
ITEM 9. CHANGES IN AND DISAGREEMENTS WITH ACCOUNTANTS ON ACCOUNTING AND FINANCIAL DISCLOSURE
None.
ITEM 9A. CONTROLS AND PROCEDURES
Disclosure Controls and Procedures
As of the end of the period covered by this report, we carried out an evaluation, under the supervision and with the participation of our management, including the Chief Executive Officer ("CEO") and Chief Financial Officer ("CFO"), of the effectiveness of the design and operation of our disclosure controls and procedures (as defined in Rules 13a-15(e) and 15(d)-15(e) under the Securities Exchange Act of 1934, as amended, (the "Exchange Act")). Based on that evaluation, the CEO and the CFO have concluded that our disclosure controls and procedures are effective.
Management's Report on Internal Control Over Financial Reporting
Our management is responsible for establishing and maintaining adequate internal control over financial reporting. Our internal control over financial reporting is a process designed under the supervision of our principal executive and principal financial officers to provide reasonable assurance regarding the reliability of financial reporting and preparation of our financial statements for external reporting purposes in accordance with accounting principles generally accepted in the United States of America.
As of December 31, 2014 , we conducted an assessment of the effectiveness of our internal control over financial reporting based on the framework utilizing the criteria set forth by the Committee of Sponsoring Organizations of the Treadway Commission in "Internal Control-Integrated Framework (2013)." Based on this assessment, management believes that, as of December 31, 2014 , the Company maintained effective internal controls over financial reporting. Deloitte & Touche LLP, the independent registered public accounting firm who audited our consolidated financial statements contained in this Form 10-K, has issued a report on our internal control over financial reporting, which is included herein.
48
Table of Contents
REPORT OF INDEPENDENT REGISTERED PUBLIC ACCOUNTING FIRM
To the Board of Directors and Stockholders of
General Growth Properties, Inc.
Chicago, Illinois
We have audited the internal control over financial reporting of General Growth Properties, Inc. and subsidiaries (the "Company") as of December 31, 2014 based on criteria established in Internal Control-Integrated Framework (2013) issued by the Committee of Sponsoring Organizations of the Treadway Commission. The Company's management is responsible for maintaining effective internal control over financial reporting and for its assessment of the effectiveness of internal control over financial reporting, included in the accompanying Management's Report on Internal Control over Financial Reporting. Our responsibility is to express an opinion on the Company's internal control over financial reporting based on our audit.
We conducted our audit in accordance with the standards of the Public Company Accounting Oversight Board (United States). Those standards require that we plan and perform the audit to obtain reasonable assurance about whether effective internal control over financial reporting was maintained in all material respects. Our audit included obtaining an understanding of internal control over financial reporting, assessing the risk that a material weakness exists, testing and evaluating the design and operating effectiveness of internal control based on the assessed risk, and performing such other procedures as we considered necessary in the circumstances. We believe that our audit provides a reasonable basis for our opinion.
A company's internal control over financial reporting is a process designed by, or under the supervision of, the company's principal executive and principal financial officers, or persons performing similar functions, and effected by the company's board of directors, management, and other personnel to provide reasonable assurance regarding the reliability of financial reporting and the preparation of financial statements for external purposes in accordance with generally accepted accounting principles. A company's internal control over financial reporting includes those policies and procedures that (1) pertain to the maintenance of records that, in reasonable detail, accurately and fairly reflect the transactions and dispositions of the assets of the company; (2) provide reasonable assurance that transactions are recorded as necessary to permit preparation of financial statements in accordance with generally accepted accounting principles, and that receipts and expenditures of the company are being made only in accordance with authorizations of management and directors of the company; and (3) provide reasonable assurance regarding prevention or timely detection of unauthorized acquisition, use, or disposition of the company's assets that could have a material effect on the financial statements.
Because of the inherent limitations of internal control over financial reporting, including the possibility of collusion or improper management override of controls, material misstatements due to error or fraud may not be prevented or detected on a timely basis. Also, projections of any evaluation of the effectiveness of the internal control over financial reporting to future periods are subject to the risk that the controls may become inadequate because of changes in conditions, or that the degree of compliance with the policies or procedures may deteriorate.
In our opinion, the Company maintained, in all material respects, effective internal control over financial reporting as of December 31, 2014 , based on the criteria established in Internal Control-Integrated Framework (2013) issued by the Committee of Sponsoring Organizations of the Treadway Commission.
We have also audited, in accordance with the standards of the Public Company Accounting Oversight Board (United States), the consolidated financial statements and financial statement schedule as of and for the year ended December 31, 2014 of the Company and our report dated March 2, 2015 expressed an unqualified opinion on those consolidated financial statements and financial statement schedule.
/s/ Deloitte & Touche LLP
Chicago, Illinois
March 2, 2015
49
Table of Contents
ITEM 9B. OTHER INFORMATION
Not applicable.
50
Table of Contents
PART III
ITEM 10. DIRECTORS, EXECUTIVE OFFICERS AND CORPORATE GOVERNANCE
The information which appears under the captions "Proposal 1-Election of Directors," "Executive Officers," "Corporate Governance-Committees of the Board of Directors-Audit Committee" and "-Nominating & Governance Committee," "Additional Information Stockholder Proposals and Nomination of Directors at the 2015 Annual Meeting of Stockholders," and "Section 16(a) Beneficial Ownership Reporting Compliance" in our proxy statement for our 2015 Annual Meeting of Stockholders is incorporated by reference into this Item 10.
We have a Code of Business Conduct and Ethics which applies to all of our employees, officers and directors, including our Chairman, Chief Executive Officer and Chief Financial Officer. The Code of Business Conduct and Ethics is available on the Corporate Governance page of our website at www.ggp.com and we will provide a copy of the Code of Business Conduct and Ethics without charge to any person who requests it in writing to: General Growth Properties, Inc., 110 N. Wacker Dr., Chicago, IL 60606, Attn: Investor Relations. We will post on our website amendments to or waivers of our Code of Ethics for executive officers, in accordance with applicable laws and regulations.
Our Chief Executive Officer and Chief Financial Officer have signed certificates under Sections 302 and 906 of the Sarbanes-Oxley Act, which are filed as Exhibits 31.1 and 31.2 and 32.1 and 32.2, respectively, to this Annual Report. In addition, our Chief Executive Officer submitted his most recent annual certification to the NYSE pursuant to Section 303.A 12(a) of the NYSE listing standards on June 16, 2014, in which he indicated that he was not aware of any violations of NYSE corporate governance listing standards.
ITEM 11. EXECUTIVE COMPENSATION
The information which appears under the caption "Executive Compensation" in our proxy statement for our 2015 Annual Meeting of Stockholders is incorporated by reference into this Item 11; provided, however, that the Report of the Compensation Committee of the Board of Directors on Executive Compensation shall not be incorporated by reference herein, in any of our previous filings under the Securities Act of 1933, as amended, or the Exchange Act, or in any of our future filings.
ITEM 12. SECURITY OWNERSHIP OF CERTAIN BENEFICIAL OWNERS AND MANAGEMENT AND RELATED STOCKHOLDER MATTERS
The information which appears under the caption "Security Ownership of Certain Beneficial Owners and Management and Related Stockholder Matters" in our proxy statement for our 2015 Annual Meeting of Stockholders is incorporated by reference into this Item 12.
The following table sets forth certain information with respect to shares of our common stock that may be issued under our equity compensation plans as of December 31, 2014 .
Plan Category |
| (a) Number of securities to be Issued upon Exercise of Outstanding Options and Rights |
| (b) Weighted Average Exercise Price of Outstanding Options Rights |
| (c) Number of Securities Remaining Available for Future Issuance Under Equity Compensation Plans (Excluding Securities Reflected in Column (a)) |
| |||
Equity compensation plans approved by security holders |
| 19,744,224 | |
| 17.26 | |
| 22,210,006 | | (1) |
Equity compensation plans not approved by security holders |
| n/a | |
| n/a | |
| n/a | |
|
|
| 19,744,224 | |
| 17.26 | |
| 22,210,006 | |
|
_______________________________________________________________________________
(1) | Reflects shares of common stock available for issuance under the Equity Plan. |
51
Table of Contents
ITEM 13. CERTAIN RELATIONSHIPS AND RELATED TRANSACTIONS, AND DIRECTOR INDEPENDENCE
The information which appears under the captions "Corporate Governance-Director Independence," and "Certain Relationships and Related Party Transactions" in our proxy statement for our 2015 Annual Meeting of Stockholders is incorporated by reference into this Item 13.
ITEM 14. PRINCIPAL ACCOUNTANT FEES AND SERVICES
The information which appears under the captions "Proposal 2-Ratification of Selection of Independent Registered Public Accounting Firm-Auditor Fees and Services" and "Audit Committee's Pre-Approval Policies and Procedures" in our proxy statement for our 2015 Annual Meeting of Stockholders is incorporated by reference into this Item 14.
PART IV
ITEM 15. EXHIBITS AND FINANCIAL STATEMENT SCHEDULES
(a) | Consolidated Financial Statements and Consolidated Financial Statement Schedule. |
The consolidated financial statements and consolidated financial statement schedule listed in the accompanying Index to Consolidated Financial Statements and Consolidated Financial Statement Schedule are filed as part of this Annual Report.
(b) | Exhibits. |
See Exhibit Index on page S-1.
(c) | Separate financial statements. |
Not applicable.
52
Table of Contents
SIGNATURES
Pursuant to the requirements of Section 13 or 15(d) of the Securities Exchange Act of 1934, the registrant has duly caused this report to be signed on its behalf by the undersigned, thereunto duly authorized.
|
|
|
GENERAL GROWTH PROPERTIES, INC. |
|
|
|
|
|
/s/ SANDEEP MATHRANI |
|
|
Sandeep Mathrani |
|
|
Chief Executive Officer |
| March 2, 2015 |
We, the undersigned officers and directors of General Growth Properties, Inc., hereby severally constitute Sandeep Mathrani and Michael B. Berman, and each of them singly, our true and lawful attorneys with full power to them, and each of them singly, to sign for us and in our names in the capacities indicated below, any and all amendments, to this Annual Report on Form 10-K and generally to do all such things in our name and behalf in such capacities to enable General Growth Properties, Inc. to comply with the applicable provisions of the Securities Exchange Act of 1934, and we hereby ratify and confirm our signatures as they may be signed by our said attorneys, or any of them, to any and all such amendments.
Pursuant to the requirements of the Securities Exchange Act of 1934, this report has been signed below by the following persons on behalf of the registrant and in the capacities and on the dates indicated.
Signature |
| Title | Date |
|
|
|
|
/s/ SANDEEP MATHRANI |
| Director and Chief Executive Officer (Principal Executive Officer) | March 2, 2015 |
Sandeep Mathrani |
|
|
|
|
|
|
|
/s/ MICHAEL B. BERMAN |
| Chief Financial Officer (Principal Financial Officer) | March 2, 2015 |
Michael B. Berman |
|
|
|
|
|
|
|
/s/ TARA L. MARSZEWSKI |
| Chief Accounting Officer (Principal Accounting Officer) | March 2, 2015 |
Tara L. Marszewski |
|
|
|
|
|
|
|
/s/ RICHARD B. CLARK |
| Director | March 2, 2015 |
Richard B. Clark |
|
|
|
|
|
|
|
/s/ MARY LOU FIALA |
| Director | March 2, 2015 |
Mary Lou Fiala |
|
|
|
53
Table of Contents
Signature |
| Title | Date |
|
|
|
|
/s/ J. BRUCE FLATT |
| Director | March 2, 2015 |
J. Bruce Flatt |
|
|
|
|
|
|
|
/s/ JOHN K. HALEY |
| Director | March 2, 2015 |
John K. Haley |
|
|
|
|
|
|
|
/s/ DANIEL B. HURWITZ |
| Director | March 2, 2015 |
Daniel B. Hurwitz |
|
|
|
|
|
|
|
/s/ BRIAN W. KINGSTON |
| Director | March 2, 2015 |
Brian W. Kingston |
|
|
|
|
|
|
|
/s/ DAVID J. NEITHERCUT |
| Director | March 2, 2015 |
David J. Neithercut |
|
|
|
|
|
|
|
/s/ MARK R. PATTERSON |
| Director | March 2, 2015 |
Mark R. Patterson |
|
|
|
54
Table of Contents
GENERAL GROWTH PROPERTIES, INC.
INDEX TO CONSOLIDATED FINANCIAL STATEMENTS
AND CONSOLIDATED FINANCIAL STATEMENT SCHEDULE
The following consolidated financial statements and consolidated financial statement schedule are included in Item 8 of this Annual Report on Form 10-K:
| Page Number |
Consolidated Financial Statements |
|
Reports of Independent Registered Public Accounting Firms: |
|
General Growth Properties, Inc. | F - 2 |
Independent Auditors Report: |
|
GGP/Homart II L.L.C | F - 3 |
GGP-TRS L.L.C. | F - 4 |
Consolidated Balance Sheets as of December 31, 2014 and 2013 | F - 5 |
Consolidated Statements of Operations and Comprehensive Income (Loss) for the years ended December 31, 2014, 2013, and 2012 | F - 6 |
Consolidated Statements of Equity for the years ended December 31, 2014, 2013, and 2012 | F - 8 |
Consolidated Statements of Cash Flows for the years ended December 31, 2014, 2013, and 2012 | F - 10 |
Notes to Consolidated Financial Statements: |
| |
Note 1 | Organization | F - 12 |
Note 2 | Summary of Significant Accounting Policies | F - 13 |
Note 3 | Acquisitions and Joint Venture Activity | F - 20 |
Note 4 | Dispositions, Discontinued Operations and Gains (Losses) on Dispositions of Interests in Operating Properties | F - 22 |
Note 5 | Fair Value | F - 23 |
Note 6 | Unconsolidated Real Estate Affiliates | F - 24 |
Note 7 | Mortgages, Notes and Loans Payable | F - 26 |
Note 8 | Income Taxes | F - 28 |
Note 9 | Warrants | F - 29 |
Note 10 | Rentals under Operating Leases | F - 31 |
Note 11 | Equity and Redeemable Noncontrolling Interests | F - 32 |
Note 12 | Earnings Per Share | F - 35 |
Note 13 | Stock-Based Compensation Plans | F - 37 |
Note 14 | Accounts and Notes Receivable | F - 39 |
Note 15 | Prepaid Expenses and Other Assets | F - 40 |
Note 16 | Accounts Payable and Accrued Expenses | F - 41 |
Note 17 | Accumulated Other Comprehensive Loss | F - 42 |
Note 18 | Litigation | F - 42 |
Note 19 | Commitments and Contingencies | F - 43 |
Note 20 | Subsequent Events | F - 44 |
Note 21 | Quarterly Financial Information (Unaudited) | F - 44 |
Consolidated Financial Statement Schedule |
| |
Schedule III-Real Estate and Accumulated Depreciation | F - 46 | |
All other schedules are omitted since the required information is either not present in any amounts, is not present in amounts sufficient to require submission of the schedule or because the information required is included in the consolidated financial statements and related notes.
F - 1
Table of Contents
REPORT OF INDEPENDENT REGISTERED PUBLIC ACCOUNTING FIRM
To the Board of Directors and Stockholders of
General Growth Properties, Inc.
Chicago, Illinois
We have audited the accompanying consolidated balance sheets of General Growth Properties, Inc. and subsidiaries (the "Company") as of December 31, 2014 and 2013, and the related consolidated statements of operations and comprehensive income (loss), equity, and cash flows for each of the three years in the period ended December 31, 2014. Our audits also included the consolidated financial statement schedule of the Company listed in the Index to Consolidated Financial Statements and Financial Statement Schedule at Item 15. These financial statements and financial statement schedule are the responsibility of the Company's management. Our responsibility is to express an opinion on these financial statements and financial statement schedule based on our audits. We did not audit the financial statements of GGP/Homart II L.L.C. and GGP TRS L.L.C., the Company's investments in which are accounted for by use of the equity method, for the year ended December 31, 2012. The Company's equity of $9,315,000 in GGP/Homart II L.L.C.'s net income and the Company's equity of $6,133,000 in GGP-TRS L.L.C.'s net income for the year ended December 31, 2012 are included in the accompanying financial statements. The financial statements of GGP/Homart II L.L.C. and GGP TRS L.L.C. for the year ended December 31, 2012 were audited by other auditors whose reports have been furnished to us, and our opinion, insofar as it relates to the amounts included for such companies for that year, is based on the reports of the other auditors and the procedures that we considered necessary in the circumstances with respect to the inclusion of the Company's equity method income in the accompanying consolidated financial statements taking into consideration the basis adjustments of the equity method investments which resulted from the application of the acquisition method of accounting in connection with the Company's emergence from bankruptcy in 2010.
We conducted our audits in accordance with the standards of the Public Company Accounting Oversight Board (United States). Those standards require that we plan and perform the audit to obtain reasonable assurance about whether the financial statements are free of material misstatement. An audit includes examining, on a test basis, evidence supporting the amounts and disclosures in the financial statements. An audit also includes assessing the accounting principles used and significant estimates made by management, as well as evaluating the overall financial statement presentation. We believe that our audits and the reports of the other auditors provide a reasonable basis for our opinion.
In our opinion, based on our audits and the reports of the other auditors, the consolidated financial statements present fairly, in all material respects, the financial position of General Growth Properties, Inc. and subsidiaries as of December 31, 2014 and 2013, and the results of their operations and their cash flows for each of the three years in the period ended December 31, 2014 in conformity with accounting principles generally accepted in the United States of America. Also, in our opinion, such consolidated financial statement schedule, when considered in relation to the basic consolidated financial statements taken as a whole, presents fairly, in all material respects, the information set forth therein.
We have also audited, in accordance with the standards of the Public Company Accounting Oversight Board (United States), the Company's internal control over financial reporting as of December 31, 2014, based on the criteria established in Internal Control- Integrated Framework (2013) issued by the Committee of Sponsoring Organizations of the Treadway Commission and our report dated March 2, 2015 expressed an unqualified opinion on the Company's internal control over financial reporting.
/s/ Deloitte & Touche LLP
Chicago, Illinois
March 2, 2015
F - 2
Table of Contents
Independent Auditors' Report
The Members
GGP/Homart II L.L.C.:
We have audited the accompanying consolidated financial statements of GGP/Homart II L.L.C. and its subsidiaries (the Company), which comprise the consolidated statements of operations and comprehensive income, changes in capital, and cash flows for the year ended December 31, 2012, and the related notes to the consolidated financial statements.
Management's Responsibility for the Financial Statements
Management is responsible for the preparation and fair presentation of these consolidated financial statements in accordance with U.S. generally accepted accounting principles; this includes the design, implementation, and maintenance of internal control relevant to the preparation and fair presentation of consolidated financial statements that are free from material misstatement, whether due to fraud or error.
Auditors' Responsibility
Our responsibility is to express an opinion on these consolidated financial statements based on our audit. We conducted our audit in accordance with auditing standards generally accepted in the United States of America and in accordance with the standards of the Public Company Accounting Oversight Board (United States). Those standards require that we plan and perform the audit to obtain reasonable assurance about whether the consolidated financial statements are free from material misstatement.
An audit involves performing procedures to obtain audit evidence about the amounts and disclosures in the consolidated financial statements. The procedures selected depend on the auditors' judgment, including the assessment of the risks of material misstatement of the consolidated financial statements, whether due to fraud or error. In making those risk assessments, the auditor considers internal control relevant to the entity's preparation and fair presentation of the consolidated financial statements in order to design audit procedures that are appropriate in the circumstances, but not for the purpose of expressing an opinion on the effectiveness of the entity's internal control. Accordingly, we express no such opinion. An audit also includes evaluating the appropriateness of accounting policies used and the reasonableness of significant accounting estimates made by management, as well as evaluating the overall presentation of the consolidated financial statements.
We believe that the audit evidence we have obtained is sufficient and appropriate to provide a basis for our audit opinion.
Opinion
In our opinion, the consolidated financial statements referred to above present fairly, in all material respects, the results of their operations and their cash flows for the year ended December 31, 2012, in accordance with U.S. generally accepted accounting principles.
/s/ KPMG LLP
Chicago, Illinois
February 28, 2013
F - 3
Table of Contents
Independent Auditors' Report
The Members
GGP-TRS L.L.C.:
We have audited the accompanying consolidated financial statements of GGP-TRS L.L.C. and its subsidiaries (the Company), which comprise the related consolidated statements of operations, changes in members' capital, and cash flows for the year ended December 31, 2012, and the related notes to the consolidated financial statements.
Management's Responsibility for the Financial Statements
Management is responsible for the preparation and fair presentation of these consolidated financial statements in accordance with U.S. generally accepted accounting principles; this includes the design, implementation, and maintenance of internal control relevant to the preparation and fair presentation of consolidated financial statements that are free from material misstatement, whether due to fraud or error.
Auditors' Responsibility
Our responsibility is to express an opinion on these consolidated financial statements based on our audit. We conducted our audit in accordance with auditing standards generally accepted in the United States of America and in accordance with the standards of the Public Company Accounting Oversight Board (United States). Those standards require that we plan and perform the audit to obtain reasonable assurance about whether the consolidated financial statements are free from material misstatement.
An audit involves performing procedures to obtain audit evidence about the amounts and disclosures in the consolidated financial statements. The procedures selected depend on the auditors' judgment, including the assessment of the risks of material misstatement of the consolidated financial statements, whether due to fraud or error. In making those risk assessments, the auditor considers internal control relevant to the entity's preparation and fair presentation of the consolidated financial statements in order to design audit procedures that are appropriate in the circumstances, but not for the purpose of expressing an opinion on the effectiveness of the entity's internal control. Accordingly, we express no such opinion. An audit also includes evaluating the appropriateness of accounting policies used and the reasonableness of significant accounting estimates made by management, as well as evaluating the overall presentation of the consolidated financial statements.
We believe that the audit evidence we have obtained is sufficient and appropriate to provide a basis for our audit opinion.
Opinion
In our opinion, the consolidated financial statements referred to above present fairly, in all material respects, the results of their operations and their cash flows for the year ended December 31, 2012, in accordance with U.S. generally accepted accounting principles.
/s/ KPMG LLP
Chicago, Illinois
February 28, 2013
F - 4
Table of Contents
GENERAL GROWTH PROPERTIES, INC.
(Dollars in thousands, except per share amounts)
CONSOLIDATED BALANCE SHEETS
| December 31, |
| December 31, | ||||
Assets: |
| |
|
| | ||
Investment in real estate: |
| |
|
| | ||
Land | $ | 4,244,607 | |
| $ | 4,320,597 | |
Buildings and equipment | 18,028,844 | |
| 18,270,748 | | ||
Less accumulated depreciation | (2,280,845 | ) |
| (1,884,861 | ) | ||
Construction in progress | 703,859 | |
| 406,930 | | ||
Net property and equipment | 20,696,465 | |
| 21,113,414 | | ||
Investment in and loans to/from Unconsolidated Real Estate Affiliates | 2,604,762 | |
| 2,407,698 | | ||
Net investment in real estate | 23,301,227 | |
| 23,521,112 | | ||
Cash and cash equivalents | 372,471 | |
| 577,271 | | ||
Accounts and notes receivable, net | 663,768 | |
| 478,899 | | ||
Deferred expenses, net | 184,491 | |
| 189,452 | | ||
Prepaid expenses and other assets | 813,777 | |
| 995,569 | | ||
Total assets | $ | 25,335,734 | |
| $ | 25,762,303 | |
Liabilities: |
| |
|
| | ||
Mortgages, notes and loans payable | $ | 15,998,289 | |
| $ | 15,672,437 | |
Investment in Unconsolidated Real Estate Affiliates | 35,598 | |
| 17,405 | | ||
Accounts payable and accrued expenses | 934,897 | |
| 970,995 | | ||
Dividend payable | 154,694 | |
| 134,476 | | ||
Deferred tax liabilities | 21,240 | |
| 24,667 | | ||
Tax indemnification liability | - | |
| 321,958 | | ||
Junior subordinated notes | 206,200 | |
| 206,200 | | ||
Total liabilities | 17,350,918 | |
| 17,348,138 | | ||
Redeemable noncontrolling interests: |
| |
|
| | ||
Preferred | 164,031 | |
| 131,881 | | ||
Common | 135,265 | |
| 97,021 | | ||
Total redeemable noncontrolling interests | 299,296 | |
| 228,902 | | ||
Commitments and Contingencies | - | |
| - | | ||
Equity: |
|
|
| | |||
Common stock: 11,000,000,000 shares authorized, $0.01 par value, 968,340,597 issued, 884,912,012 outstanding as of December 31, 2014, and 966,998,908 issued and 911,194,605 outstanding as of December 31, 2013 | 9,409 | |
| 9,395 | | ||
Preferred Stock: |
| |
|
| | ||
500,000,000 shares authorized, $.01 par value, 10,000,000 shares issued and outstanding as of December 31, 2014 and December 31, 2013 | 242,042 | |
| 242,042 | | ||
Additional paid-in capital | 11,351,625 | |
| 11,372,443 | | ||
Retained earnings (accumulated deficit) | (2,822,740 | ) |
| (2,915,723 | ) | ||
Accumulated other comprehensive loss | (51,753 | ) |
| (38,173 | ) | ||
Common stock in treasury, at cost, 55,969,390 shares as of December 31, 2014 and 28,345,108 shares as of December 31, 2013 | (1,122,664 | ) |
| (566,863 | ) | ||
Total stockholders' equity | 7,605,919 | |
| 8,103,121 | | ||
Noncontrolling interests in consolidated real estate affiliates | 79,601 | |
| 82,142 | | ||
Total equity | 7,685,520 | |
| 8,185,263 | | ||
Total liabilities and equity | $ | 25,335,734 | |
| $ | 25,762,303 | |
The accompanying notes are an integral part of these consolidated financial statements.
F - 5
Table of Contents
GENERAL GROWTH PROPERTIES, INC.
(Dollars in thousands, except per share amounts)
CONSOLIDATED STATEMENTS OF OPERATIONS AND COMPREHENSIVE INCOME (LOSS)
| Year Ended December 31, | ||||||||||
| 2014 |
| 2013 |
| 2012 | ||||||
Revenues: |
| |
|
| |
|
| | |||
Minimum rents | $ | 1,583,695 | |
| $ | 1,553,941 | |
| $ | 1,517,120 | |
Tenant recoveries | 739,411 | |
| 716,932 | |
| 693,726 | | |||
Overage rents | 51,611 | |
| 55,998 | |
| 69,574 | | |||
Management fees and other corporate revenues | 70,887 | |
| 68,792 | |
| 71,949 | | |||
Other | 89,955 | |
| 90,354 | |
| 73,932 | | |||
Total revenues | 2,535,559 | |
| 2,486,017 | |
| 2,426,301 | | |||
Expenses: |
| |
|
| |
|
| | |||
Real estate taxes | 227,992 | |
| 239,807 | |
| 215,077 | | |||
Property maintenance costs | 66,897 | |
| 69,411 | |
| 74,280 | | |||
Marketing | 23,455 | |
| 26,232 | |
| 33,068 | | |||
Other property operating costs | 334,819 | |
| 342,815 | |
| 351,647 | | |||
Provision for doubtful accounts | 8,055 | |
| 3,920 | |
| 3,679 | | |||
Property management and other costs | 155,093 | |
| 164,457 | |
| 159,332 | | |||
General and administrative | 64,051 | |
| 49,237 | |
| 39,095 | | |||
Provision for impairment | 5,278 | |
| - | |
| - | | |||
Depreciation and amortization | 708,406 | |
| 749,722 | |
| 768,820 | | |||
Total expenses | 1,594,046 | |
| 1,645,601 | |
| 1,644,998 | | |||
Operating income | 941,513 | |
| 840,416 | |
| 781,303 | | |||
Interest income | 28,613 | |
| 7,699 | |
| 2,374 | | |||
Interest expense | (699,285 | ) |
| (723,152 | ) |
| (781,221 | ) | |||
Loss on foreign currency | (18,048 | ) |
| (7,312 | ) |
| - | | |||
Warrant liability adjustment | - | |
| (40,546 | ) |
| (502,234 | ) | |||
Gains from changes in control of investment properties | 91,193 | |
| 219,784 | |
| 18,549 | | |||
Loss on extinguishment of debt | - | |
| (36,479 | ) |
| (15,007 | ) | |||
Income (loss) before income taxes, equity in income of Unconsolidated Real Estate Affiliates, discontinued operations and allocation to noncontrolling interests | 343,986 | |
| 260,410 | |
| (496,236 | ) | |||
Provision for income taxes | (7,253 | ) |
| (345 | ) |
| (9,091 | ) | |||
Equity in income of Unconsolidated Real Estate Affiliates | 61,278 | |
| 68,756 | |
| 78,342 | | |||
Income (loss) from continuing operations | 398,011 | |
| 328,821 | |
| (426,985 | ) | |||
Discontinued operations: |
| |
|
| |
|
| | |||
Income (loss) from discontinued operations, including gains (losses) on dispositions | 137,989 | |
| (37,516 | ) |
| (95,313 | ) | |||
Gain on extinguishment of tax indemnification liability | 77,215 | |
| - | |
| - | | |||
Gain on extinguishment of debt | 66,679 | |
| 25,894 | |
| 50,765 | | |||
Discontinued operations, net | 281,883 | |
| (11,622 | ) |
| (44,548 | ) | |||
Net income (loss) | 679,894 | |
| 317,199 | |
| (471,533 | ) | |||
Allocation to noncontrolling interests | (14,044 | ) |
| (14,671 | ) |
| (9,700 | ) | |||
Net income (loss) attributable to General Growth Properties, Inc. | 665,850 | |
| 302,528 | |
| (481,233 | ) | |||
Preferred Stock dividends | (15,936 | ) |
| (14,078 | ) |
| - | | |||
Net income (loss) attributable to common stockholders | $ | 649,914 | |
| $ | 288,450 | |
| $ | (481,233 | ) |
Basic Earnings (Loss) Per Share: |
| |
|
| |
|
| | |||
Continuing operations | $ | 0.42 | |
| $ | 0.32 | |
| $ | (0.47 | ) |
Discontinued operations | 0.32 | |
| (0.01 | ) |
| (0.05 | ) | |||
Total basic earnings (loss) per share | $ | 0.74 | |
| $ | 0.31 | |
| $ | (0.52 | ) |
Diluted Earnings (Loss) Per Share: |
| |
|
| |
|
| | |||
Continuing operations | $ | 0.39 | |
| $ | 0.32 | |
| $ | (0.47 | ) |
Discontinued operations | 0.30 | |
| (0.01 | ) |
| (0.05 | ) | |||
F - 6
Table of Contents
Total diluted earnings (loss) per share | $ | 0.69 | |
| $ | 0.31 | |
| $ | (0.52 | ) |
Comprehensive Income (Loss), Net: |
| |
|
| |
|
| | |||
Net income (loss) | $ | 679,894 | |
| $ | 317,199 | |
| $ | (471,533 | ) |
Other comprehensive income (loss): |
| |
|
| |
|
| | |||
Foreign currency translation (year ended December 31, 2013 includes reclassification of ($109.9 million) accumulated other comprehensive loss into Net income attributable to common stockholders) | (13,604 | ) |
| 49,644 | |
| (39,674 | ) | |||
Unrealized loss on available-for-sale securities | (54 | ) |
| (70 | ) |
| (165 | ) | |||
Other comprehensive income (loss) | (13,658 | ) |
| 49,574 | |
| (39,839 | ) | |||
Comprehensive income (loss) | 666,236 | |
| 366,773 | |
| (511,372 | ) | |||
Comprehensive income allocated to noncontrolling interests | (13,966 | ) |
| (15,064 | ) |
| (9,442 | ) | |||
Comprehensive income (loss) attributable to General Growth Properties, Inc. | 652,270 | |
| 351,709 | |
| (520,814 | ) | |||
Preferred stock dividends | (15,936 | ) |
| (14,078 | ) |
| - | | |||
Comprehensive income (loss), net, attributable to common stockholders | $ | 636,334 | |
| $ | 337,631 | |
| $ | (520,814 | ) |
The accompanying notes are an integral part of these consolidated financial statements.
F - 7
Table of Contents
GENERAL GROWTH PROPERTIES, INC.
(Dollars in thousands, except per share amounts)
CONSOLIDATED STATEMENTS OF EQUITY
| Common Stock |
| Preferred Stock |
| Additional Paid-In Capital |
| Retained Earnings (Accumulated Deficit) |
| Accumulated Other Comprehensive Income (Loss) |
| Common Stock in Treasury |
| Noncontrolling Interests in Consolidated Real Estate Affiliates |
| Total Equity | ||||||||||||||||
Balance at January 1, 2012 | $ | 9,353 | |
| $ | - | |
| $ | 10,405,318 | |
| $ | (1,883,569 | ) |
| $ | (47,773 | ) |
| $ | - | |
| $ | 96,016 | |
| $ | 8,579,345 | |
Net loss |
| |
|
| |
|
| |
| (481,233 | ) |
|
| |
|
| |
| 784 | |
| (480,449 | ) | ||||||||
Distributions to noncontrolling interests in consolidated Real Estate Affiliates |
| |
|
| |
|
| |
|
| |
|
| |
|
| |
| (13,478 | ) |
| (13,478 | ) | ||||||||
Restricted stock grants, net of forfeitures ((85,452) common shares) | (1 | ) |
|
| |
| 8,888 | |
| | |
|
| |
|
| |
|
| |
| 8,887 | | ||||||||
Employee stock purchase program (98,076 common shares) | 1 | |
|
| |
| 1,604 | |
|
|
|
|
|
|
|
|
| 1,605 | | ||||||||||||
Stock option grants, net of forfeitures (617,842 common shares) | 6 | |
|
|
| 19,853 | |
|
| |
|
| |
|
| |
|
| |
| 19,859 | | |||||||||
Cash dividends reinvested (DRIP) in stock (3,111,365 common shares) | 33 | |
|
| |
| 48,490 | |
|
| |
|
| |
|
| |
|
| |
| 48,523 | | ||||||||
Other comprehensive loss |
| |
|
| |
|
| |
|
| |
| (39,581 | ) |
|
| |
|
| |
| (39,581 | ) | ||||||||
Cash distributions declared ($0.42 per share) |
| |
|
| |
| | |
| (394,029 | ) |
|
| |
|
| |
|
| |
| (394,029 | ) | ||||||||
Cash redemptions for common units in excess of carrying value |
| |
|
| |
| (1,083 | ) |
|
| |
|
| |
|
| |
|
| |
| (1,083 | ) | ||||||||
Fair value adjustment for noncontrolling interest in Operating Partnership |
| |
|
| |
| (50,623 | ) |
|
| |
|
| |
|
| |
|
| |
| (50,623 | ) | ||||||||
Dividend for RPI Spin-off |
| |
|
| |
|
| |
| 26,044 | |
|
| |
|
| |
|
| |
| 26,044 | | ||||||||
Balance at December 31, 2012 | $ | 9,392 | |
| $ | - | |
| $ | 10,432,447 | |
| $ | (2,732,787 | ) |
| $ | (87,354 | ) |
| $ | - | |
| $ | 83,322 | |
| $ | 7,705,020 | |
Net income |
| |
|
| |
|
| |
| 302,528 | |
|
| |
|
| |
| 3,103 | |
| 305,631 | | ||||||||
Issuance of Preferred Stock, net of issuance costs |
|
| 242,042 | |
|
|
|
|
|
|
|
|
|
|
| 242,042 | | ||||||||||||||
Distributions to noncontrolling interests in consolidated Real Estate Affiliates |
| |
|
| |
|
| |
|
| |
|
| |
|
| |
| (4,283 | ) |
| (4,283 | ) | ||||||||
Restricted stock grants, net of forfeitures (18,444 common shares) | - | |
|
| |
| 8,340 | |
|
| |
|
| |
|
| |
|
| |
| 8,340 | | ||||||||
Employee stock purchase program (135,317 common shares) | - | |
|
| |
| 2,708 | |
|
| |
|
| |
|
| |
|
| |
| 2,708 | | ||||||||
Stock option grants, net of forfeitures (344,670 common shares) | 3 | |
|
| |
| 35,995 | |
|
| |
|
| |
|
| |
|
| |
| 35,998 | | ||||||||
Treasury stock purchases (28,345,108 common shares) |
|
|
|
|
|
|
|
|
|
| (566,863 | ) |
|
|
| (566,863 | ) | ||||||||||||||
Cash dividends reinvested (DRIP) in stock (28,852 common shares) | - | |
|
| |
| 613 | |
|
| |
|
| |
|
| |
|
| |
| 613 | | ||||||||
Other comprehensive loss before reclassification |
| |
|
| |
|
| |
|
| |
| (60,680 | ) |
|
| |
|
| |
| (60,680 | ) | ||||||||
Amounts reclassified from Accumulated Other Comprehensive Loss |
|
|
|
|
|
|
|
| 109,861 | |
|
|
|
|
| 109,861 | | ||||||||||||||
Cash distributions declared ($0.51 per share) |
| |
|
| |
|
| |
| (471,386 | ) |
|
| |
|
| |
|
| |
| (471,386 | ) | ||||||||
F - 8
Table of Contents
Cash distributions on Preferred Stock |
|
|
|
|
|
| (14,078 | ) |
|
|
|
|
|
|
| (14,078 | ) | ||||||||||||||
Fair value adjustment for noncontrolling interest in Operating Partnership |
| |
|
| |
| (3,173 | ) |
|
| |
|
| |
|
| |
|
| |
| (3,173 | ) | ||||||||
Common stock warrants |
|
|
|
| 895,513 | |
|
|
|
|
|
|
|
|
| 895,513 | | ||||||||||||||
Balance at December 31, 2013 | $ | 9,395 | |
| $ | 242,042 | |
| $ | 11,372,443 | |
| $ | (2,915,723 | ) |
| $ | (38,173 | ) |
| $ | (566,863 | ) |
| $ | 82,142 | |
| $ | 8,185,263 | |
Net income |
| |
|
| |
|
| |
| 665,850 | |
|
| |
|
| |
| 1,851 | |
| 667,701 | | ||||||||
Distributions to noncontrolling interests in consolidated Real Estate Affiliates |
| |
|
| |
|
| |
|
| |
|
| |
|
| |
| (4,392 | ) |
| (4,392 | ) | ||||||||
Restricted stock grants, net of forfeitures (16,112 common shares) | - | |
| - | |
| 2,496 | |
|
| |
|
| |
|
| |
|
| |
| 2,496 | | ||||||||
Employee stock purchase program (138,446 common shares) | 1 | |
|
| |
| 2,951 | |
|
| |
|
| |
|
| |
|
| |
| 2,952 | | ||||||||
Stock option grants, net of forfeitures (1,164,945 common shares) | 12 | |
|
| |
| 40,714 | |
|
| |
|
| |
|
| |
|
| |
| 40,726 | | ||||||||
Treasury stock purchases (27,624,282 common shares) |
| |
|
| |
|
| |
|
| |
|
| |
| (555,801 | ) |
|
| |
| (555,801 | ) | ||||||||
Cash dividends reinvested (DRIP) in stock (22,186 common shares) | 1 | |
| - | |
| 505 | |
|
| |
|
| |
|
| |
|
| |
| 506 | | ||||||||
Other comprehensive loss |
| |
|
| |
|
| |
|
| |
| (13,580 | ) |
|
| |
|
| |
| (13,580 | ) | ||||||||
Cash distributions declared ($0.63 per share) |
| |
|
| |
|
| |
| (556,931 | ) |
|
| |
|
| |
|
| |
| (556,931 | ) | ||||||||
Cash distributions on Preferred Stock |
| |
|
| |
|
| |
| (15,936 | ) |
|
| |
|
| |
|
| |
| (15,936 | ) | ||||||||
Fair value adjustment for noncontrolling interest in Operating Partnership |
| |
|
| |
| 3,169 | |
|
| |
|
| |
|
| |
|
| |
| 3,169 | | ||||||||
Fair value adjustment for noncontrolling interest in GGPOP |
| |
|
| |
| (70,653 | ) |
|
| |
|
| |
|
| |
|
| |
| (70,653 | ) | ||||||||
Balance at December 31, 2014 | $ | 9,409 | |
| $ | 242,042 | |
| $ | 11,351,625 | |
| $ | (2,822,740 | ) |
| $ | (51,753 | ) |
| $ | (1,122,664 | ) |
| $ | 79,601 | |
| $ | 7,685,520 | |
The accompanying notes are an integral part of these consolidated financial statements.
F - 9
Table of Contents
GENERAL GROWTH PROPERTIES, INC.
(Dollars in thousands, except per share amounts)
| Year Ended December 31, | ||||||||||
| 2014 |
| 2013 |
| 2012 | ||||||
Cash Flows provided by Operating Activities: |
| |
|
| |
|
| | |||
Net income (loss) | $ | 679,894 | |
| $ | 317,199 | |
| $ | (471,533 | ) |
Adjustments to reconcile net income (loss) to net cash provided by operating activities: |
| |
|
| |
|
| | |||
Equity in income of Unconsolidated Real Estate Affiliates | (61,278 | ) |
| (68,756 | ) |
| (78,340 | ) | |||
Distributions received from Unconsolidated Real Estate Affiliates | 46,463 | |
| 53,592 | |
| 35,399 | | |||
Provision for doubtful accounts | 8,151 | |
| 4,095 | |
| 4,807 | | |||
Depreciation and amortization | 718,064 | |
| 773,255 | |
| 813,953 | | |||
Amortization/write-off of deferred finance costs | 13,621 | |
| 9,453 | |
| 5,380 | | |||
Accretion/write-off of debt market rate adjustments | 13,442 | |
| 9,698 | |
| (39,798 | ) | |||
Amortization of intangibles other than in-place leases | 76,615 | |
| 84,229 | |
| 105,871 | | |||
Straight-line rent amortization | (48,935 | ) |
| (49,780 | ) |
| (61,963 | ) | |||
Deferred income taxes | (5,615 | ) |
| (3,847 | ) |
| 1,655 | | |||
Litigation loss | 17,854 | |
| - | |
| - | | |||
(Gain) loss on dispositions, net | (131,849 | ) |
| 811 | |
| (24,426 | ) | |||
Gains from changes in control of investment properties | (91,193 | ) |
| (219,784 | ) |
| (18,549 | ) | |||
Gain on extinguishment of debt | (66,679 | ) |
| (25,894 | ) |
| (60,676 | ) | |||
Provisions for impairment | 5,278 | |
| 30,936 | |
| 118,588 | | |||
Loss (gain) on foreign currency | 18,048 | |
| (7,312 | ) |
| - | | |||
Warrant liability adjustment | - | |
| 40,546 | |
| 502,234 | | |||
Cash paid for extinguishment of tax indemnification liability | (138,000 | ) |
| - | |
| - | | |||
Gain on extinguishment of tax indemnification liability | (77,215 | ) |
| - | |
| - | | |||
Net changes: |
| |
|
| |
|
| | |||
Accounts and notes receivable | (19,613 | ) |
| 1,697 | |
| 4,985 | | |||
Prepaid expenses and other assets | (28,966 | ) |
| 25,273 | |
| 8,956 | | |||
Deferred expenses | (24,234 | ) |
| (44,877 | ) |
| (45,518 | ) | |||
Restricted cash | (1,070 | ) |
| 16,894 | |
| 50,864 | | |||
Accounts payable and accrued expenses | 21,703 | |
| (80,902 | ) |
| (63,945 | ) | |||
Other, net | 25,238 | |
| 23,005 | |
| 19,159 | | |||
Net cash provided by operating activities | 949,724 | |
| 889,531 | |
| 807,103 | | |||
Cash Flows (used in) provided by Investing Activities: |
| |
|
| |
|
| | |||
Acquisition of real estate and property additions | (537,357 | ) |
| (433,405 | ) |
| (362,358 | ) | |||
Development of real estate and property improvements | (624,829 | ) |
| (516,906 | ) |
| (339,988 | ) | |||
Loans to joint venture partners | (137,070 | ) |
| (32,161 | ) |
| - | | |||
Proceeds from sales of investment properties and Unconsolidated Real Estate Affiliates | 361,183 | |
| 1,006,357 | |
| 397,251 | | |||
Contributions to Unconsolidated Real Estate Affiliates | (130,500 | ) |
| (87,909 | ) |
| (265,107 | ) | |||
Distributions received from Unconsolidated Real Estate Affiliates in excess of income | 387,234 | |
| 222,053 | |
| 372,205 | | |||
Increase (decrease) in restricted cash | 3,414 | |
| 8,831 | |
| (23,455 | ) | |||
Net cash (used in) provided by investing activities | (677,925 | ) |
| 166,860 | |
| (221,452 | ) | |||
Cash Flows used in Financing Activities: |
| |
|
| |
|
| | |||
Proceeds from refinancing/issuance of mortgages, notes and loans payable | 2,401,407 | |
| 5,501,047 | |
| 5,622,525 | | |||
Principal payments on mortgages, notes and loans payable | (1,760,032 | ) |
| (5,155,453 | ) |
| (5,796,656 | ) | |||
Deferred finance costs | (21,264 | ) |
| (20,548 | ) |
| (34,137 | ) | |||
Net proceeds from issuance of Preferred Stock | - | |
| 242,042 | |
| - | | |||
Purchase of Warrants | - | |
| (633,229 | ) |
| - | | |||
Treasury stock purchases | (555,801 | ) |
| (566,863 | ) |
| - | | |||
Cash distributions paid to common stockholders | (534,151 | ) |
| (447,195 | ) |
| (384,339 | ) | |||
Cash distributions reinvested (DRIP) in common stock | 506 | |
| 614 | |
| 48,523 | | |||
Cash distributions paid to preferred stockholders | (15,936 | ) |
| (10,093 | ) |
| - | | |||
Cash distributions and redemptions paid to holders of common units | (718 | ) |
| (36,894 | ) |
| (3,812 | ) | |||
Other, net | 9,390 | |
| 22,637 | |
| 14,188 | | |||
Net cash used in financing activities | (476,599 | ) |
| (1,103,935 | ) |
| (533,708 | ) | |||
Net change in cash and cash equivalents | (204,800 | ) |
| (47,544 | ) |
| 51,943 | | |||
Cash and cash equivalents at beginning of year | 577,271 | |
| 624,815 | |
| 572,872 | | |||
Cash and cash equivalents at end of year | $ | 372,471 | |
| $ | 577,271 | |
| $ | 624,815 | |
The accompanying notes are an integral part of these consolidated financial statements.
F - 10
Table of Contents
GENERAL GROWTH PROPERTIES, INC.
(Dollars in thousands, except per share amounts)
CONSOLIDATED STATEMENTS OF CASH FLOWS (Continued)
| Year Ended December 31, | ||||||||||
| 2014 |
| 2013 |
| 2012 | ||||||
Supplemental Disclosure of Cash Flow Information: |
| |
|
| |
|
| | |||
Interest paid | $ | 688,297 | |
| $ | 834,155 | |
| $ | 859,809 | |
Interest capitalized | 16,665 | |
| 11,210 | |
| 1,489 | | |||
Income taxes paid | 10,202 | |
| 6,313 | |
| 2,664 | | |||
Accrued capital expenditures included in accounts payable and accrued expenses | 198,471 | |
| 103,988 | |
| 96,300 | | |||
Settlement of Tax indemnification liability: |
|
|
|
|
| ||||||
Assets | 106,743 | |
| - | |
| - | | |||
Liability extinguished | (321,958 | ) |
| - | |
| - | | |||
Non-Cash Transactions: |
| |
|
| |
|
| | |||
Notes receivable related to sale of investment property and Aliansce | - | |
| 151,127 | |
| - | | |||
Gain on investment in Unconsolidated Real Estate Affiliates | - | |
| 9,837 | |
| 23,358 | | |||
Amendment of warrant agreement | - | |
| 895,513 | |
| - | | |||
Non-Cash Sale of Retail Property |
| |
|
| |
|
| | |||
Assets | 21,426 | |
| 71,881 | |
| 20,296 | | |||
Liabilities and equity | (21,426 | ) |
| (71,881 | ) |
| (20,296 | ) | |||
Rouse Properties, Inc. Dividend: |
| |
|
| |
|
| | |||
Non-cash dividend for RPI Spin-off | - | |
| - | |
| (26,044 | ) | |||
Non-Cash Distribution of RPI Spin-off: |
| |
|
| |
|
| | |||
Assets | - | |
| - | |
| 1,554,486 | | |||
Liabilities and equity | - | |
| - | |
| (1,554,486 | ) | |||
Non-Cash Sale of Property to RPI: |
| |
|
| |
|
| | |||
Assets | - | |
| - | |
| 63,672 | | |||
Liabilities and equity | - | |
| - | |
| (63,672 | ) | |||
Non-Cash Sale of Property to HHC: |
| |
|
| |
|
| | |||
Assets | - | |
| - | |
| 17,085 | | |||
Liabilities and equity | - | |
| - | |
| (17,085 | ) | |||
Non-Cash Acquisition of The Oaks and Westroads |
| |
|
| |
|
| | |||
Assets (Consolidated) | - | |
| - | |
| 218,071 | | |||
Liabilities and equity (Consolidated) | - | |
| - | |
| (218,071 | ) | |||
Non-Cash Acquisition of Quail Springs-Refer to Note 3 |
| |
|
| |
|
| | |||
Non-Cash Sale of The Grand Canal Shoppes and The Shoppes at The Palazzo-Refer to Note 3 |
| |
|
| |
|
| | |||
Non-Cash Sale of Bayside Marketplace-Refer to Note 3 |
|
|
|
|
| ||||||
The accompanying notes are an integral part of these consolidated financial statements.
F - 11
Table of Contents
GENERAL GROWTH PROPERTIES, INC.
NOTES TO CONSOLIDATED FINANCIAL STATEMENTS
(Dollars in thousands, except per share amounts)
NOTE 1 ORGANIZATION
General Growth Properties, Inc. ("GGP" or the "Company"), a Delaware corporation, was organized in July 2010 and is a self-administered and self-managed real estate investment trust, referred to as a "REIT". GGP is the successor registrant, by merger, on November 9, 2010 to GGP, Inc. GGP, Inc. had filed for bankruptcy protection under Chapter 11 of Title 11 of the United States Code ("Chapter 11") in the Southern District of New York on April 16, 2009 and emerged from bankruptcy, pursuant to a plan of reorganization (the "Plan") on November 9, 2010, the ("Effective Date"). In these notes, the terms "we," "us" and "our" refer to GGP and its subsidiaries or, in certain contexts, GGP, Inc. and its subsidiaries.
The Plan was based on the agreements (collectively, as amended and restated, the "Investment Agreements") with REP Investments LLC, an affiliate of Brookfield Asset Management Inc. (including certain of its affiliates, "Brookfield"), an affiliate of Fairholme Funds, Inc. ("Fairholme") and an affiliate of Pershing Square Capital Management, L.P. ("Pershing Square" and together with Brookfield and Fairholme, the "Plan Sponsors"), pursuant to which GGP, Inc. would be divided into two companies, GGP and The Howard Hughes Corporation ("HHC"), and the Plan Sponsors would invest in the Company's standalone emergence plan. In addition, GGP, Inc. entered into an investment agreement with Teachers Retirement System of Texas ("Texas Teachers") to purchase shares of GGP common stock. The Plan Sponsors also entered into an agreement with affiliates of the Blackstone Group ("Blackstone") whereby Blackstone subscribed for equity in GGP.
On the Effective Date, the Plan Sponsors, Blackstone and Texas Teachers owned a majority of the outstanding common stock of GGP. In addition, 120 million warrants (the "Warrants") to purchase our common stock were issued to the Plan Sponsors and Blackstone ( Note 9 ).
GGP, through its subsidiaries and affiliates, is an owner and operator of retail properties. As of December 31, 2014 , we are the owner, either entirely or with joint venture partners of 128 retail properties.
Substantially all of our business is conducted through GGP Operating Partnership, LP ("GGPOP"), GGP Nimbus, LP ("GGPN") and GGP Limited Partnership ("GGPLP", and together with GGPN the "Operating Partnerships"), subsidiaries of GGP. The Operating Partnerships own an interest in the properties that are part of the consolidated financial statements of GGP. As of December 31, 2014 , GGP held approximately a 99% common equity ownership (without giving effect to the potential conversion of the Preferred Units, as defined below) of the Operating Partnerships, while the remaining 1% was held by limited partners and certain previous contributors of properties to the Operating Partnerships or their predecessors.
GGPOP is the general partner of, and owns approximately 1.5% of the equity interest in, each Operating Partnership. GGPOP has common units of limited partnership ("Common Units"), which are redeemable for cash or, at our option, shares of GGP common stock. It also has preferred units of limited partnership interest ("Preferred Units"), of which, certain Preferred Units can be converted into Common Units and then redeemed for cash or, at our option, shares of GGP common stock ("Convertible Preferred Units") ( Note 11 ).
In addition to holding ownership interests in various joint ventures, the Operating Partnerships generally conduct their operations through General Growth Management, Inc. ("GGMI"), General Growth Services, Inc. ("GGSI") and GGPLP REIT Services, LLC ("GGPRS"). GGMI and GGSI are taxable REIT subsidiaries ("TRS"s), which provide management, leasing, tenant coordination, business development, marketing, strategic partnership and other services for a majority of our Unconsolidated Real Estate Affiliates (defined below) and for substantially all of our Consolidated Properties, as defined below. GGSI also serves as a contractor to GGMI for these services. GGPRS generally provides financial, accounting, tax, legal, development, and other services to our Consolidated Properties.
We refer to our ownership interests in properties in which we own a majority or controlling interest and, as a result, are consolidated under accounting principles generally accepted in the United States of America ("GAAP") as the "Consolidated Properties." We also own interests in certain properties through joint venture entities in which we own a noncontrolling interest ("Unconsolidated Real Estate Affiliates") and we refer to those properties as the "Unconsolidated Properties."
F - 12
Table of Contents
GENERAL GROWTH PROPERTIES, INC.
NOTES TO CONSOLIDATED FINANCIAL STATEMENTS (Continued)
(Dollars in thousands, except per share amounts)
NOTE 2 SUMMARY OF SIGNIFICANT ACCOUNTING POLICIES
Principles of Consolidation and Basis of Presentation
The accompanying consolidated financial statements include the accounts of GGP, our subsidiaries and joint ventures in which we have a controlling interest. For consolidated joint ventures, the noncontrolling partner's share of the assets, liabilities and operations of the joint ventures (generally computed as the joint venture partner's ownership percentage) is included in noncontrolling interests in consolidated real estate affiliates as permanent equity of the Company. Intercompany balances and transactions have been eliminated.
We operate in a single reportable segment which includes the operation, development and management of retail and other rental properties, primarily regional malls. Our portfolio is targeted to a range of market sizes and consumer tastes. Each of our operating properties is considered a separate operating segment, as each property earns revenues and incurs expenses, individual operating results are reviewed and discrete financial information is available. The Company's chief operating decision maker is comprised of a team of several members of executive management who use Company NOI in assessing segment operating performance. We do not distinguish or group our consolidated operations based on geography, size or type. Our operating properties have similar economic characteristics and provide similar products and services to our tenants. There are no individual operating segments that are greater than 10% of combined revenue, Company NOI, or combined assets. Company NOI excludes from NOI certain non-cash and non-comparable items such as straight-line rent and intangible asset and liability amortization, which are a result of our emergence, acquisition accounting and other capital contribution or restructuring events. Further, all material operations are within the United States and no customer or tenant comprises more than 10% of consolidated revenues. As a result, the Company's operating properties are aggregated into a single reportable segment.
Reclassifications
Certain prior period amounts included in the Consolidated Statements of Operations and Comprehensive Income (Loss) and related footnotes associated with properties we have disposed of have been reclassified to discontinued operations for all periods presented ( Note 4 ). Additionally, $18.4 million of accrued interest related to the tax indemnification liability ( Note 18 ) was reclassified from accounts payable and accrued expenses to tax indemnification liability in our Consolidated Balance Sheets as of December 31, 2013, as presented herein. Also, $32.2 million of notes receivable was reclassified from acquisition of real estate and property additions to loans to joint venture partners in our Consolidated Statements of Cash Flows for the year ended December 31, 2013.
Properties
Real estate assets are stated at cost less any provisions for impairments. Expenditures for significant betterments and improvements are capitalized. Maintenance and repairs are charged to expense when incurred. Construction and improvement costs incurred in connection with the development of new properties or the redevelopment of existing properties are capitalized. Real estate taxes, interest costs, and internal costs associated with leasing and development overhead incurred during construction periods are capitalized. Capitalization is based on qualified expenditures and interest rates. Capitalized real estate taxes, interest costs, and internal costs associated with leasing and development overhead are amortized over lives which are consistent with the related assets.
Pre-development costs, which generally include legal and professional fees and other third-party costs directly related to the construction assets, are capitalized as part of the property being developed. In the event a development is no longer deemed to be probable of occurring, the capitalized costs are expensed (see also our impairment policies in this note below).
We periodically review the estimated useful lives of our properties, and may adjust them as necessary. The estimated useful lives of our properties range from 10 - 45 years.
Depreciation or amortization expense is computed using the straight-line method based upon the following estimated useful lives:
| Years |
Buildings and improvements | 10 - 45 |
Equipment and fixtures | 3 - 20 |
Tenant improvements | Shorter of useful life or applicable lease term |
F - 13
Table of Contents
GENERAL GROWTH PROPERTIES, INC.
NOTES TO CONSOLIDATED FINANCIAL STATEMENTS (Continued)
(Dollars in thousands, except per share amounts)
Acquisitions of Operating Properties ( Note 3 )
Acquisitions of properties are accounted for utilizing the acquisition method of accounting and, accordingly, the results of operations of acquired properties have been included in the results of operations from the respective dates of acquisition. Estimates of future cash flows and other valuation techniques are used to allocate the purchase price of acquired property between land, buildings and improvements, equipment, assumed debt liabilities and identifiable intangible assets and liabilities such as amounts related to in-place tenant leases, acquired above and below-market tenant and ground leases, and tenant relationships. No significant value had been ascribed to tenant relationships.
The fair values of tangible assets are determined on an "if vacant" basis. The "if vacant" fair value is allocated to land, where applicable, buildings, equipment and tenant improvements based on comparable sales and other relevant information with respect to the property. Specifically, the "if vacant" value of the buildings and equipment was calculated using a cost approach utilizing published guidelines for current replacement cost or actual construction costs for similar, recently developed properties; and an income approach. Assumptions used in the income approach to the value of buildings include: capitalization and discount rates, lease-up time, market rents, make ready costs, land value, and site improvement value.
The estimated fair value of in-place tenant leases includes lease origination costs (the costs we would have incurred to lease the property to the current occupancy level of the property) and the lost revenues during the period necessary to lease-up from vacant to the current occupancy level. Such estimates include the fair value of leasing commissions, legal costs and tenant coordination costs that would be incurred to lease the property to this occupancy level. Additionally, we evaluate the time period over which such occupancy level would be achieved and include an estimate of the net operating costs (primarily real estate taxes, insurance and utilities) incurred during the lease-up period, which generally ranges up to one year. The fair value of acquired in-place tenant leases is included in the balance of buildings and equipment and amortized over the remaining lease term for each tenant.
Identifiable intangible assets and liabilities are calculated for above-market and below-market tenant and ground leases where we are either the lessor or the lessee. The difference between the contractual rental rates and our estimate of market rental rates is measured over a period equal to the remaining non-cancelable term of the leases, including significantly below-market renewal options for which exercise of the renewal option appears to be reasonably assured. The remaining term of leases with renewal options at terms significantly below market reflect the assumed exercise of such below-market renewal options and assume the amortization period would coincide with the extended lease term.
The gross asset balances of the in-place value of tenant leases are included in buildings and equipment in our Consolidated Balance Sheets.
| Gross Asset |
| Accumulated Amortization |
| Net Carrying Amount | ||||||
As of December 31, 2014 |
| |
|
| |
|
| | |||
Tenant leases: |
| |
|
| |
|
| | |||
In-place value | $ | 608,840 | |
| $ | (362,531 | ) |
| $ | 246,309 | |
As of December 31, 2013 |
| |
|
| |
|
| | |||
Tenant leases: |
| |
|
| |
|
| | |||
In-place value | $ | 797,311 | |
| $ | (420,370 | ) |
| $ | 376,941 | |
The above-market tenant leases and below-market ground leases are included in prepaid expenses and other assets ( Note 15 ); the below-market tenant leases, above-market ground leases and above-market headquarters office lease are included in accounts payable and accrued expenses ( Note 16 ) in our Consolidated Balance Sheets.
Amortization/accretion of all intangibles, including the intangibles in Note 15 and Note 16 , had the following effects on our income (loss) from continuing operations:
| Year Ended December 31, | ||||||||||
| 2014 |
| 2013 |
| 2012 | ||||||
Amortization/accretion effect on continuing operations | $ | (196,792 | ) |
| $ | (237,302 | ) |
| $ | (327,185 | ) |
F - 14
Table of Contents
GENERAL GROWTH PROPERTIES, INC.
NOTES TO CONSOLIDATED FINANCIAL STATEMENTS (Continued)
(Dollars in thousands, except per share amounts)
Future amortization/accretion of these intangibles is estimated to decrease results from continuing operations as follows:
Year |
| Amount | ||
2015 |
| $ | 133,254 | |
2016 |
| 103,718 | | |
2017 |
| 78,008 | | |
2018 |
| 51,032 | | |
2019 |
| 28,320 | | |
Investments in Unconsolidated Real Estate Affiliates ( Note 6 )
We account for investments in joint ventures where we own a non-controlling joint interest using the equity method. Under the equity method, the cost of our investment is adjusted for our share of the earnings of such Unconsolidated Real Estate Affiliates from the date of acquisition, increased by our contributions and reduced by distributions received.
To determine the method of accounting for partially owned joint ventures, we evaluate the characteristics of associated entities and determine whether an entity is a variable interest entity ("VIE") and, if so, determine which party is primary beneficiary by analyzing whether we have both the power to direct the entity's significant economic activities and the obligation to absorb potentially significant losses or receive potentially significant benefits. Significant judgments and assumptions inherent in this analysis include the nature of the entity's operations, future cash flow projections, the entity's financing and capital structure, and contractual relationship and terms. We consolidate a VIE when we have determined that we are the primary beneficiary.
Primary risks associated with our VIEs include the potential of funding the entities' debt obligations or making additional contributions to fund the entities' operations.
Generally, the operating agreements with respect to our Unconsolidated Real Estate Affiliates provide that assets, liabilities and funding obligations are shared in accordance with our ownership percentages. Therefore, we generally also share in the profit and losses, cash flows and other matters relating to our Unconsolidated Real Estate Affiliates in accordance with our respective ownership percentages. Except for Retained Debt (as described in Note 6 ), differences between the carrying amount of our investment in the Unconsolidated Real Estate Affiliates and our share of the underlying equity of our Unconsolidated Real Estate Affiliates are typically amortized over lives ranging from five to 45 years. When cumulative distributions exceed our investment in the joint venture, the investment is reported as a liability in our consolidated financial statements. The liability is limited to our maximum potential obligation to fund contractual obligations, including recourse related to certain debt obligations.
Partially owned, non-variable interest joint ventures over which we have controlling financial interest are consolidated in our consolidated financial statements. In determining if we have a controlling financial interest, we consider factors such as ownership interest, authority to make decisions, kick-out rights and substantive participating rights. Partially owned joint ventures where we do not have a controlling financial interest, but have the ability to exercise significant influence, are accounted for using the equity method.
We continually analyze and assess reconsideration events, including changes in the factors mentioned above, to determine if the consolidation treatment remains appropriate. Decisions regarding consolidation of partially owned entities frequently require significant judgment by our management.
Cash and Cash Equivalents
Highly-liquid investments with initial maturities of three months or less are classified as cash equivalents, excluding amounts restricted by certain lender and other agreements.
Leases
Our leases, in which we are the lessor or lessee, are substantially all accounted for as operating leases. Leases in which we are the lessor that transfer substantially all the risks and benefits of ownership to tenants are considered finance leases and the present values of the minimum lease payments and the estimated residual values of the leased properties, if any, are accounted for as
F - 15
Table of Contents
GENERAL GROWTH PROPERTIES, INC.
NOTES TO CONSOLIDATED FINANCIAL STATEMENTS (Continued)
(Dollars in thousands, except per share amounts)
receivables. Leases in which we are the lessee that transfer substantially all the risks and benefits of ownership to us are considered capital leases and the present values of the minimum lease payments are accounted for as assets and liabilities.
Tenant improvements, either paid directly or in the form of construction allowances paid to tenants, are capitalized as Buildings and equipment and depreciated over the shorter of the useful life or the applicable lease term.
In leasing tenant space, we may provide funding to the lessee through a tenant allowance. In accounting for a tenant allowance, we determine whether the allowance represents funding for the construction of leasehold improvements and evaluate the ownership of such improvements. If we are considered the owner of the leasehold improvements, we capitalize the amount of the tenant allowance and depreciate it over the shorter of the useful life of the leasehold improvements or the related lease term. If the tenant allowance represents a payment for a purpose other than funding leasehold improvements, or in the event we are not considered the owner of the improvements, the allowance is capitalized to deferred expenses and considered to be a lease incentive and is recognized over the lease term as a reduction of rental revenue on a straight-line basis.
Deferred Expenses
Deferred expenses primarily consist of leasing commissions and related costs and are amortized using the straight-line method over the life of the leases. Deferred expenses also include financing fees we incurred in order to obtain long-term financing and are amortized as interest expense over the terms of the respective financing agreements using the straight-line method, which approximates the effective interest method.
Revenue Recognition and Related Matters
| Year Ended December 31, | ||||||||||
| 2014 |
| 2013 |
| 2012 | ||||||
Amortization of straight-line rent | $ | 48,254 | |
| $ | 47,567 | |
| $ | 58,331 | |
Net amortization/accretion of above and below-market tenant leases | (66,285 | ) |
| (67,344 | ) |
| (78,541 | ) | |||
Lease termination income | 10,590 | |
| 10,633 | |
| 8,544 | | |||
The following is a summary of straight-line rent receivables, which are included in accounts and notes receivable, net in our Consolidated Balance Sheets and are reduced for allowances and amounts doubtful of collection:
| December 31, 2014 |
| December 31, 2013 | ||||
Straight-line rent receivables, net | $ | 228,153 | |
| $ | 188,291 | |
Overage rent is paid by a tenant when the tenant's sales exceed an agreed upon minimum amount and is recognized on an accrual basis once tenant sales exceed contractual tenant lease thresholds and is calculated by multiplying the sales in excess of the minimum amount by a percentage defined in the lease.
Tenant recoveries are established in the leases or computed based upon a formula related to real estate taxes, insurance and other property operating expenses and are generally recognized as revenues in the period the related costs are incurred.
We provide an allowance for doubtful accounts against the portion of accounts receivable, including straight-line rents, which is estimated to be uncollectible. Such allowances are reviewed periodically based upon our recovery experience. The following table summarizes the changes in allowance for doubtful accounts:
F - 16
Table of Contents
GENERAL GROWTH PROPERTIES, INC.
NOTES TO CONSOLIDATED FINANCIAL STATEMENTS (Continued)
(Dollars in thousands, except per share amounts)
| 2014 |
| 2013 |
| 2012 | ||||||
Balance as of January 1, | $ | 17,892 | |
| $ | 24,692 | |
| $ | 32,859 | |
Provision for doubtful accounts(1) | 10,934 | |
| 5,528 | |
| 7,000 | | |||
Provisions for doubtful accounts in discontinued operations | 602 | |
| 1,277 | |
| 1,235 | | |||
Write-offs | (13,807 | ) |
| (13,605 | ) |
| (16,402 | ) | |||
Balance as of December 31, | $ | 15,621 | |
| $ | 17,892 | |
| $ | 24,692 | |
_______________________________________________________________________________
(1) | Excludes recoveries of $2.7 million , $1.9 million and $3.3 million for the years ended December 31, 2014 , 2013 and 2012 , respectively. |
Management Fees and Other Corporate Revenues
Management fees and other corporate revenues primarily represent management and leasing fees, development fees, financing fees, and fees for other ancillary services performed for the benefit of certain of the Unconsolidated Real Estate Affiliates. Management fees are reported at 100% of the revenue earned from the joint venture in management fees and other corporate revenues on our Consolidated Statements of Operations and Comprehensive Income (Loss). Our share of the management fee expense incurred by the Unconsolidated Real Estate Affiliates is reported within equity in income of Unconsolidated Real Estate Affiliates on our Consolidated Statements of Operations and Comprehensive Income (Loss) and in property management and other costs in the Condensed Combined Statements of Income in Note 6 .
| Year Ended December 31, | ||||||||||
| 2014 |
| 2013 |
| 2012 | ||||||
Management fees from affiliates | $ | 70,887 | |
| $ | 68,681 | |
| $ | 70,506 | |
Management fee expense | (26,972 | ) |
| (25,551 | ) |
| (23,061 | ) | |||
Net management fees from affiliates | $ | 43,915 | |
| $ | 43,130 | |
| $ | 47,445 | |
Income Taxes ( Note 8 )
We expect to distribute 100% of our taxable capital gains and taxable ordinary income to shareholders annually. If, with respect to any taxable year, we fail to maintain our qualification as a REIT and cannot correct such failure, we would not be allowed to deduct distributions to shareholders in computing our taxable income and federal income tax. If any of our REIT subsidiaries fail to qualify as a REIT, such failure could result in our loss of REIT status. If we lose our REIT status, corporate level income tax would apply to our taxable income at regular corporate rates, or we may be subject to applicable alternative minimum tax. As a result, the amount available for distribution to holders of equity securities that would otherwise receive dividends would be reduced for the year or years involved, and we would no longer be required to make distributions. In addition, unless we were entitled to relief under the relevant statutory provisions, we would be disqualified from treatment as a REIT for four subsequent taxable years.
Deferred income taxes are accounted for using the asset and liability method. Deferred tax assets and liabilities are recognized for the expected future tax consequences of events that have been included in the financial statements or tax returns and are recorded primarily by certain of our taxable REIT subsidiaries. Under this method, deferred tax assets and liabilities are determined based on the differences between the financial reporting and tax bases of assets and liabilities using enacted tax rates in effect for the year in which the differences are expected to reverse. Deferred income taxes also reflect the impact of operating loss and tax credit carryforwards. A valuation allowance is provided if we believe it is more likely than not that all or some portion of the deferred tax asset will not be realized. An increase or decrease in the valuation allowance that results from a change in circumstances, and which causes a change in our judgment about the realizability of the related deferred tax asset, is included in the current tax provision. In 2010, GGP experienced a change in control, as a result of the transactions undertaken to emerge from bankruptcy, pursuant to Section 382 of the Internal Revenue Code that could limit the benefit of deferred tax assets. In addition, we recognize and report interest and penalties, if necessary, related to uncertain tax positions within our provision for income tax expense.
F - 17
Table of Contents
GENERAL GROWTH PROPERTIES, INC.
NOTES TO CONSOLIDATED FINANCIAL STATEMENTS (Continued)
(Dollars in thousands, except per share amounts)
Impairment
Operating properties
We regularly review our consolidated properties for potential impairment indicators whenever events or changes in circumstances indicate that the carrying amount may not be recoverable. Impairment indicators are assessed separately for each property and include, but are not limited to, significant decreases in real estate property net operating income, significant decreases in occupancy percentage, debt maturities, management's intent with respect to the properties and prevailing market conditions.
If an indicator of potential impairment exists, the property is tested for recoverability by comparing its carrying amount to the estimated future undiscounted cash flows. Although the carrying amount may exceed the estimated fair value of certain properties, a real estate asset is only considered to be impaired when its carrying amount cannot be recovered through estimated future undiscounted cash flows. To the extent an impairment provision is determined to be necessary, the excess of the carrying amount of the property over its estimated fair value is expensed to operations. In addition, the impairment provision is allocated proportionately to adjust the carrying amount of the asset group. The adjusted carrying amount, which represents the new cost basis of the property, is depreciated over the remaining useful life of the property.
Although we may market a property for sale, there can be no assurance that the transaction will be complete until the sale is finalized. However, GAAP requires us to utilize the Company's expected holding period of our properties when assessing recoverability. If we cannot recover the carrying value of these properties within the planned holding period, we will estimate the fair values of the assets and record impairment charges for properties when the estimated fair value is less than their carrying value.
Impairment indicators for pre-development costs, which are typically costs incurred during the beginning stages of a potential development and construction in progress, are assessed by project and include, but are not limited to, significant changes in the Company's plans with respect to the project, significant changes in projected completion dates, tenant demand, anticipated revenues or cash flows, development costs, market factors and sustainability of development projects.
Impairment charges are recorded in the Consolidated Statements of Operations and Comprehensive Income (Loss) when the carrying value of a property is not recoverable and it exceeds the estimated fair value of the property, which can occur in accounting periods preceding disposition and / or in the period of disposition.
During the year ended December 31, 2014 , we recorded a $5.3 million impairment charge in continuing operations of our Consolidated Statements of Operations and Comprehensive Income (Loss). This impairment charge related to one operating property and was recorded because the estimated fair value of the property, based on a bona-fide purchase offer, was less than the carrying value of the properties. During the year ended December 31, 2014 , we recorded no impairment charges in discontinued operations of our Consolidated Statement of Operations and Comprehensive Income (Loss).
During the year ended December 31, 2013 , we recorded no impairment charges in continuing operations of our Consolidated Statements of Operations and Comprehensive Income (Loss). During the year ended December 31, 2013 , we recorded $30.9 million of impairment charges in discontinued operations of our Consolidated Statement of Operations and Comprehensive Income (Loss), which related to five operating properties. We recorded a gain on extinguishment of debt in discontinued operations of approximately $66.7 million in the first quarter of 2014 related to one of these impaired properties that is included in discontinued operations of our Consolidated Statement of Operations and Comprehensive Income (Loss).
During the year ended December 31, 2012 , we recorded no impairment charge in continuing operations of our Consolidated Statements of Operations and Comprehensive Income (Loss). During the year ended December 31, 2012 , we recorded $108.7 million of impairment charges in discontinued operations of our Consolidated Statement of Operations and Comprehensive Income (Loss), which related to eight operating properties.
Investment in Unconsolidated Real Estate Affiliates
A series of operating losses of an investee or other factors may indicate that an other-than-temporary decline in value of our investment in an Unconsolidated Real Estate Affiliate has occurred. The investment in each of the Unconsolidated Real Estate Affiliates is evaluated for valuation declines below the carrying amount. Accordingly, in addition to the property-specific impairment analysis that we perform for such joint ventures (as part of our operating property impairment process described above), we also considered whether there were other-than-temporary declines with respect to the carrying values of our Unconsolidated
F - 18
Table of Contents
GENERAL GROWTH PROPERTIES, INC.
NOTES TO CONSOLIDATED FINANCIAL STATEMENTS (Continued)
(Dollars in thousands, except per share amounts)
Real Estate Affiliates. No impairments related to our investments in Unconsolidated Real Estate Affiliates were recognized for the years ended December 31, 2014 , 2013 , and 2012 .
Property Management and Other and General and Administrative Costs
Property management and other costs represent regional and home office costs and include items such as corporate payroll, rent for office space, supplies and professional fees, which represent corporate overhead costs not generated at the properties. General and administrative costs represent the costs to run the public company and include payroll and other costs for executives, audit fees, professional fees and administrative fees related to the public company.
Fair Value Measurements ( Note 5 )
The accounting principles for fair value measurements establish a three-tier fair value hierarchy, which prioritizes the inputs used in measuring fair value. These tiers include:
• | Level 1-defined as observable inputs such as quoted prices for identical assets or liabilities in active markets; |
• | Level 2-defined as inputs other than quoted prices in active markets that are either directly or indirectly observable; and |
• | Level 3-defined as unobservable inputs in which little or no market data exists, therefore requiring an entity to develop its own assumptions. |
The impairment section above includes a discussion of all impairments recognized during the years ended December 31, 2014 , 2013 and 2012 , which were based on Level 2 inputs. Note 5 includes a discussion of properties measured at fair value on a non-recurring basis using Level 2 inputs and the fair value of debt, which is estimated on a recurring basis using Level 2 and Level 3 inputs. Note 9 includes a discussion of our outstanding warrants, which were measured at fair value using Level 3 inputs until the warrant agreement was amended on March 28, 2013. Note 11 includes a discussion of certain redeemable noncontrolling interests that are measured at fair value using Level 1 inputs.
Concentrations of Credit Risk
Financial instruments that potentially subject us to significant concentrations of credit risk consist principally of cash and cash equivalents. We are exposed to credit risk with respect to cash held at various financial institutions and access to our credit facility. Our credit risk exposure with regard to our cash and the $1.5 billion available under our credit facility is spread among a diversified group of investment grade financial institutions. At December 31, 2014, we have $100.0 million outstanding under our credit facility.
Recently Issued Accounting Pronouncements
Effective January 1, 2015 with early adoption permitted January 1, 2014 the definition of discontinued operations has been revised to limit what qualifies for this classification and presentation to disposals of components of a company that represent strategic shifts that have (or will have) a major effect on the company's operations and financial results. Required expanded disclosures for disposals or disposal groups that qualify for discontinued operations are intended to provide users of financial statements with enhanced information about the assets, liabilities, revenues and expenses of such discontinued operations. In addition, in accordance with this pronouncement, companies are required to disclose the pretax profit or loss of an individually significant component that does not qualify for discontinued operations treatment. Pursuant to its terms, we have elected to adopt this pronouncement effective January 1, 2015. This definition will be applied prospectively after the adoption and is anticipated to substantially reduce the number of transactions, going forward, that qualify for discontinued operations as compared to previous periods.
Effective January 1, 2017, companies will be required to apply a five-step model in accounting for revenue arising from contracts with customers. The core principle of the revenue model is that a company recognizes revenue to depict the transfer of promised goods or services to customers in an amount that reflects the consideration to which the entity expects to be entitled in exchange for those goods or services. Lease contracts will be excluded from this revenue recognition criteria; however, the sale of real estate will be required to follow the new model. Expanded quantitative and qualitative disclosures regarding revenue recognition will be required for contracts that are subject to this pronouncement. The Company is evaluating the potential impact of this pronouncement on its consolidated financial statements.
F - 19
Table of Contents
GENERAL GROWTH PROPERTIES, INC.
NOTES TO CONSOLIDATED FINANCIAL STATEMENTS (Continued)
(Dollars in thousands, except per share amounts)
Use of Estimates
The preparation of financial statements in conformity with GAAP requires management to make estimates and assumptions. These estimates and assumptions affect the reported amounts of assets and liabilities and the disclosure of contingent assets and liabilities at the date of the financial statements and the reported amounts of revenues and expenses during the reporting periods. For example, estimates and assumptions have been made with respect to fair values of assets and liabilities for purposes of applying the acquisition method of accounting, the useful lives of assets, capitalization of development and leasing costs, provision for income taxes, recoverable amounts of receivables and deferred taxes, initial valuations and related amortization periods of deferred costs and intangibles, particularly with respect to acquisitions, impairment of long-lived assets and fair value of debt. Actual results could differ from these and other estimates.
NOTE 3 ACQUISITIONS AND JOINT VENTURE ACTIVITY
On December 24, 2014 we formed a joint venture that holds 100% of Bayside Marketplace and sold a portion of our interest to a third party. We received $71.9 million in cash, net of debt assumed of $122.5 million , and the partner received a 49% economic interest in the joint venture. We recorded gain from change in control of investment property of $91.2 million on our Consolidated Statements of Operations and Comprehensive Income (Loss) for the year ended December 31, 2014, as a result of this transaction. We are the managing member, however we account for the joint venture under the equity method of accounting because we share control over major decisions with the joint venture partner and the partner has substantive participating rights including establishing operating and capital decisions including budgets, in the ordinary course of business.
Cash received from joint venture partner | $ | 71,883 | |
Less: Proportionate share of previous investment in Bayside Marketplace | (19,310 | ) | |
Gain from change in control of investment property | $ | 91,193 | |
On December 17, 2014, we entered into an agreement to acquire the Crown Building in New York City, New York located at 730 Fifth Avenue for approximately $1.775 billion through a joint venture in which we have a 50% interest. We contributed $50.0 million to the joint venture to fund a deposit related to the acquisition that is expected to close in the second quarter of 2015.
During the year ended December 31, 2014, we acquired joint venture interests in five retail properties located in New York City, Miami, and Bellevue (WA) for total consideration of $690.2 million (excluding closing costs), which included equity of $405.5 million and the assumption of debt of $310.2 million . The five retail properties acquired are described below. We account for the joint ventures under the equity method of accounting (excluding Miami Design District Associates which is accounted for using the cost method) because we share control over major decisions with our joint venture partners. These properties will be accounted for as Unconsolidated Real Estate Affiliates, and are recorded within the investment in and loans to/from Unconsolidated Real Estate Affiliates on our Consolidated Balance Sheets ( Note 6 ).
On October 22, 2014, we contributed $49.1 million for a 50% interest in a joint venture that acquired the retail portion of 530 Fifth Avenue in New York, New York for a gross purchase price of $300 million with $190 million in gross property-level financing. We have an effective 50% interest in the joint venture. In connection with the acquisition, we provided $39.4 million in loans to our joint venture partner and $31.0 million in a mezzanine loan to the joint venture ( Note 14 ).
On September 30, 2014, we contributed $8.3 million for a 10% interest in a joint venture that acquired the retail portion of 522 Fifth Avenue in New York, New York for a gross purchase price of $165.0 million with $83.3 million in gross property-level financing. We have an effective 10% interest in the joint venture. In connection with the acquisition we provided a $5.3 million loan to our joint venture partner ( Note 14 ).
On September 15, 2014, we contributed $244.7 million to a joint venture that acquired a 20% interest in a development located in Miami, Florida and an 85.67% interest in a mall located in Bellevue, Washington. The joint venture's 20% interest in the Miami Design District Associates, LLC ("MDDA") was acquired for a purchase price of $280.0 million . Through the formation of the joint venture, we have a 12.5% share of this investment and account for it as a cost method investment. The joint venture partner
F - 20
Table of Contents
GENERAL GROWTH PROPERTIES, INC.
NOTES TO CONSOLIDATED FINANCIAL STATEMENTS (Continued)
(Dollars in thousands, except per share amounts)
contributed a property, The Shops at the Bravern, LLC ("Bravern"), for a net contribution of $79.0 million . Through the formation of the joint venture, we have a 40% interest in the property and account for the joint venture under the equity method of accounting.
On June 27, 2014, we contributed $106.6 million to a joint venture that acquired 685 Fifth Avenue in New York, New York for a gross purchase price of $521.4 million with $340.0 million in gross property-level financing. We have a 50% interest in the joint venture. In connection with the acquisition we provided an $85.3 million loan to our joint venture partner ( Note 14 ).
During the year ended December 31, 2013, we acquired four retail properties for total consideration of $396.3 million , which included cash of $355.0 million and the assumption of debt of $41.3 million . The four retail properties acquired include a 50% interest in a portfolio comprised of two properties in the Union Square area of San Francisco, which is accounted for as an Unconsolidated Real Estate Affiliate ( Note 6 ). The following table summarizes the allocation of the purchase price to the net assets acquired at the date of acquisition. These allocations were based on the relative fair values of the assets acquired and liabilities assumed.
Investment in real estate, including intangible assets and liabilities | $ | 314,750 | |
Investment in Unconsolidated Real Estate Affiliate | 39,774 | | |
Net working capital | 515 | | |
Net assets acquired | $ | 355,039 | |
On June 28, 2013, we acquired the remaining 50% interest in Quail Springs Mall, from our joint venture partner, for total consideration of $90.5 million , which included $55.5 million of cash and the assumption of the remaining 50% of debt. The investment property was previously recorded under the equity method of accounting and is now consolidated. The acquisition resulted in a remeasurement of the net assets acquired to fair value and as such, we recorded gains from changes in control of investment properties of $19.8 million for the year ended December 31, 2013, as the fair value of the net assets acquired was greater than our investment in the Unconsolidated Real Estate Affiliate and the cash paid to acquire our joint venture partner's interest. The table below summarizes the gain calculation:
Total fair value of net assets acquired | $ | 110,893 | |
Previous investment in Quail Springs Mall | (35,610 | ) | |
Cash paid to acquire our joint venture partner's interest | (55,507 | ) | |
Gains from changes in control of investment properties | $ | 19,776 | |
The following table summarizes the allocation of the purchase price to the net assets acquired at the date of acquisition. These allocations were based on the relative fair values of the assets acquired and liabilities assumed.
Investment in real estate, including intangible assets and liabilities | $ | 186,627 | |
Fair value of debt | (77,204 | ) | |
Net working capital | 1,470 | | |
Net assets acquired | $ | 110,893 | |
On May 16, 2013, we formed a joint venture that holds 100% of The Grand Canal Shoppes and The Shoppes at The Palazzo. We received $411.5 million in cash, net of debt assumed of $311.9 million , and the joint venture partner received a 49.9% economic interest in the joint venture. We recorded gains from changes in control of investment properties of $200.0 million on our Consolidated Statements of Operations and Comprehensive Income (Loss) for the year ended December 31, 2013, as a result of this transaction. We are the general partner, however we account for the joint venture under the equity method of accounting because we share control over major decisions with the partner and the partner has substantive participating rights. The table below summarizes the gain calculation:
F - 21
Table of Contents
GENERAL GROWTH PROPERTIES, INC.
NOTES TO CONSOLIDATED FINANCIAL STATEMENTS (Continued)
(Dollars in thousands, except per share amounts)
Cash received from joint venture partner | $ | 411,476 | |
Proportionate share of previous investment in The Grand Canal Shoppes and The Shoppes at The Palazzo | (211,468 | ) | |
Gains from changes in control of investment properties | $ | 200,008 | |
NOTE 4 DISPOSITIONS, DISCONTINUED OPERATIONS AND GAINS (LOSSES) ON DISPOSITIONS OF INTERESTS IN OPERATING PROPERTIES
All of our dispositions of consolidated operating properties for which there is no continuing involvement, for all periods presented, are included in discontinued operations in our Consolidated Statements of Operations and Comprehensive Income (Loss) and are summarized in the table below. Gains on disposition and gains on debt extinguishment are recorded in the Consolidated Statements of Operations and Comprehensive Income (Loss) in the period the property is disposed.
During 2014, one property, which was previously transferred to a special servicer, was sold in a lender-directed sale in full satisfaction of the debt. This resulted in a gain on extinguishment of debt of $66.7 million and a reduction of property-level debt of $79.0 million . We transferred six office properties and cash aggregating total consideration of $268.0 million in full settlement of our $322.0 million tax indemnification liability (Note 18). Additionally, we sold three operating properties for $278.6 million , which resulted in a gain of $125.2 million . We used the net proceeds from these transactions to repay debt of $127.0 million .
During 2013, we sold our interests in six retail properties for total consideration of $142.6 million , which reduced our property level debt by approximately $143.6 million . Additionally, one property, which was previously transferred to a special servicer, was sold in a lender-directed sale in full satisfaction of the debt. This resulted in a gain on debt extinguishment of $25.9 million and a reduction of property level debt of $96.9 million .
On January 12, 2012, we completed the RPI Spin-Off, a 30 -mall portfolio. The RPI Spin-Off was accomplished through a special dividend of the common stock of RPI to holders of GGP common stock as of December 30, 2011.
In addition, during 2012, we sold our interests in an office portfolio, three office properties, 18 retail properties and an anchor box for total cash proceeds of $394.5 million , and reduced our property level debt by $320.6 million .
The following table summarizes the operations of the properties included in discontinued operations.
| Year Ended December 31, | ||||||||||
| 2014 |
| 2013 |
| 2012 | ||||||
Retail and other revenue | $ | 27,276 | |
| $ | 73,329 | |
| $ | 151,856 | |
Total revenues | 27,276 | |
| 73,329 | |
| 151,856 | | |||
Retail and other operating expenses | 17,515 | |
| 56,926 | |
| 117,352 | | |||
Provisions for impairment | - | |
| 30,935 | |
| 108,681 | | |||
Total expenses | 17,515 | |
| 87,861 | |
| 226,033 | | |||
Operating income (loss) | 9,761 | | | (14,532 | ) | | (74,177 | ) | |||
Interest expense, net | (2,188 | ) |
| (22,167 | ) |
| (45,539 | ) | |||
Provision for income taxes | - | |
| - | |
| (23 | ) | |||
Gains (losses) on dispositions | 130,416 | |
| (817 | ) |
| 24,426 | | |||
Net income (loss) from operations | 137,989 | |
| (37,516 | ) |
| (95,313 | ) | |||
Gain on extinguishment of debt | 66,679 | |
| 25,894 | |
| 50,765 | | |||
Gain on extinguishment of tax indemnification liability | 77,215 | |
| - | |
| - | | |||
Net income (loss) from discontinued operations | $ | 281,883 | |
| $ | (11,622 | ) |
| $ | (44,548 | ) |
F - 22
Table of Contents
GENERAL GROWTH PROPERTIES, INC.
NOTES TO CONSOLIDATED FINANCIAL STATEMENTS (Continued)
(Dollars in thousands, except per share amounts)
NOTE 5 FAIR VALUE
Fair Value of Certain Operating Properties
The following table summarizes certain of our assets that are measured at fair value on a nonrecurring basis as a result of impairment charges recorded as of December 31, 2014 and 2013 .
| Total Fair Value Measurement |
| Quoted Prices in Active Markets for Identical Assets (Level 1) |
| Significant Other Observable Inputs (Level 2) |
| Significant Unobservable Inputs (Level 3) | ||||||||
Year Ended December 31, 2014 |
| |
|
| |
|
| |
|
| | ||||
Investments in real estate(1) | $ | 26,250 | |
| $ | - | |
| $ | 26,250 | |
| $ | - | |
Year Ended December 31, 2013 |
|
|
|
|
|
|
| ||||||||
Investments in real estate(1) | $ | 12,000 | |
| $ | - | |
| $ | 12,000 | |
| $ | - | |
_______________________________________________________________________________
(1) | Refer to Note 2 for more information regarding impairment. |
We estimated the fair value relating to impairment assessments based upon negotiated sales prices, which is classified within Level 2 of the fair value hierarchy.
Fair Value of Financial Instruments
The fair values of our financial instruments approximate their carrying amount in our consolidated financial statements except for debt. Management's estimates of fair value are presented below for our debt as of December 31, 2014 and 2013 .
| December 31, 2014 |
| December 31, 2013 | ||||||||||||
| Carrying Amount(1) |
| Estimated Fair Value |
| Carrying Amount(1) |
| Estimated Fair Value | ||||||||
Fixed-rate debt | $ | 13,606,936 | |
| $ | 14,211,247 | |
| $ | 13,919,820 | |
| $ | 13,957,952 | |
Variable-rate debt | 2,391,353 | |
| 2,399,547 | |
| 1,752,617 | |
| 1,787,139 | | ||||
| $ | 15,998,289 | |
| $ | 16,610,794 | |
| $ | 15,672,437 | |
| $ | 15,745,091 | |
_______________________________________________________________________________
(1) | Includes market rate adjustments of $19.9 million and $0.9 million as of December 31, 2014 and 2013 , respectively. |
The fair value of our Junior Subordinated Notes approximates their carrying amount as of December 31, 2014 and 2013 . We estimated the fair value of mortgages, notes and other loans payable using Level 2 and Level 3 inputs based on recent financing transactions, estimates of the fair value of the property that serves as collateral for such debt, historical risk premiums for loans of comparable quality, current London Interbank Offered Rate (" LIBOR "), U.S. treasury obligation interest rates and on the discounted estimated future cash payments to be made on such debt. The discount rates estimated reflect our judgment as to what the approximate current lending rates for loans or groups of loans with similar maturities and assume that the debt is outstanding through maturity. We have utilized market information as available or present value techniques to estimate the amounts required to be disclosed. Since such amounts are estimates that are based on limited available market information for similar transactions and do not acknowledge transfer or other repayment restrictions that may exist in specific loans, it is unlikely that the estimated fair value of any such debt could be realized by immediate settlement of the obligation.
F - 23
Table of Contents
GENERAL GROWTH PROPERTIES, INC.
NOTES TO CONSOLIDATED FINANCIAL STATEMENTS (Continued)
(Dollars in thousands, except per share amounts)
NOTE 6 UNCONSOLIDATED REAL ESTATE AFFILIATES
Following is summarized financial information for all of our Unconsolidated Real Estate Affiliates.
| December 31, 2014 |
| December 31, 2013 | ||||
Condensed Combined Balance Sheets-Unconsolidated Real Estate Affiliates |
| |
|
| | ||
Assets: |
| |
|
| | ||
Land | $ | 1,152,485 | |
| $ | 1,046,354 | |
Buildings and equipment | 10,009,490 | |
| 8,670,976 | | ||
Less accumulated depreciation | (2,591,347 | ) |
| (2,301,054 | ) | ||
Construction in progress | 125,931 | |
| 46,339 | | ||
Net property and equipment | 8,696,559 | |
| 7,462,615 | | ||
Investments in unconsolidated joint ventures | 16,462 | |
| - | | ||
Net investment in real estate | 8,713,021 | |
| 7,462,615 | | ||
Cash and cash equivalents | 308,621 | |
| 260,405 | | ||
Accounts and notes receivable, net | 203,511 | |
| 187,533 | | ||
Deferred expenses, net | 281,835 | |
| 254,949 | | ||
Prepaid expenses and other assets | 594,257 | |
| 147,182 | | ||
Total assets | $ | 10,101,245 | |
| $ | 8,312,684 | |
Liabilities and Owners' Equity: |
| |
|
| | ||
Mortgages, notes and loans payable | $ | 7,945,828 | |
| $ | 6,503,686 | |
Accounts payable, accrued expenses and other liabilities | 418,995 | |
| 324,620 | | ||
Cumulative effect of foreign currency translation ("CFCT") | (35,238 | ) |
| (22,896 | ) | ||
Owners' equity, excluding CFCT | 1,771,660 | |
| 1,507,274 | | ||
Total liabilities and owners' equity | $ | 10,101,245 | |
| $ | 8,312,684 | |
Investment In and Loans To/From Unconsolidated Real Estate Affiliates, Net: |
| |
|
| | ||
Owners' equity | $ | 1,736,422 | |
| $ | 1,484,378 | |
Less: joint venture partners' equity | (861,515 | ) |
| (760,804 | ) | ||
Plus: excess investment/basis differences | 1,694,257 | |
| 1,666,719 | | ||
Investment in and loans to/from Unconsolidated Real Estate Affiliates, net | $ | 2,569,164 | |
| $ | 2,390,293 | |
Reconciliation-Investment In and Loans To/From Unconsolidated Real Estate Affiliates: |
| |
|
| | ||
Asset-Investment in and loans to/from Unconsolidated Real Estate Affiliates | $ | 2,604,762 | |
| $ | 2,407,698 | |
Liability-Investment in Unconsolidated Real Estate Affiliates | (35,598 | ) |
| (17,405 | ) | ||
Investment in and loans to/from Unconsolidated Real Estate Affiliates, net | $ | 2,569,164 | |
| $ | 2,390,293 | |
F - 24
Table of Contents
GENERAL GROWTH PROPERTIES, INC.
NOTES TO CONSOLIDATED FINANCIAL STATEMENTS (Continued)
(Dollars in thousands, except per share amounts)
| Year Ended |
| Year Ended |
| Year Ended | ||||||
Condensed Combined Statements of Income-Unconsolidated Real Estate Affiliates |
| |
|
| |
|
| | |||
Revenues: |
| |
|
| |
|
| | |||
Minimum rents | $ | 827,436 | |
| $ | 768,353 | |
| $ | 710,895 | |
Tenant recoveries | 355,188 | |
| 327,033 | |
| 296,815 | | |||
Overage rents | 30,915 | |
| 32,500 | |
| 25,794 | | |||
Other | 39,804 | |
| 34,007 | |
| 32,755 | | |||
Total revenues | 1,253,343 | |
| 1,161,893 | |
| 1,066,259 | | |||
Expenses: |
| |
|
| |
|
| | |||
Real estate taxes | 110,665 | |
| 104,270 | |
| 95,435 | | |||
Property maintenance costs | 39,105 | |
| 34,666 | |
| 37,835 | | |||
Marketing | 14,626 | |
| 15,981 | |
| 16,573 | | |||
Other property operating costs | 172,547 | |
| 160,286 | |
| 152,866 | | |||
Provision for doubtful accounts | 3,052 | |
| 1,283 | |
| 1,937 | | |||
Property management and other costs(1) | 57,980 | |
| 52,803 | |
| 48,597 | | |||
General and administrative | 9,250 | |
| 2,333 | |
| 1,660 | | |||
Depreciation and amortization | 325,787 | |
| 279,522 | |
| 260,075 | | |||
Total expenses | 733,012 | |
| 651,144 | |
| 614,978 | | |||
Operating income | 520,331 | |
| 510,749 | |
| 451,281 | | |||
Interest income | 5,909 | |
| 1,431 | |
| 746 | | |||
Interest expense | (315,339 | ) |
| (286,917 | ) |
| (278,935 | ) | |||
Provision for income taxes | (1,497 | ) |
| (316 | ) |
| (935 | ) | |||
Equity in loss of unconsolidated joint ventures | (194 | ) |
| - | |
| - | | |||
Income from continuing operations | 209,210 | |
| 224,947 | |
| 172,157 | | |||
Net income from disposed investment | 1,415 | |
| 28,166 | |
| 52,429 | | |||
Allocation to noncontrolling interests | (58 | ) |
| 1 | |
| (74 | ) | |||
Net income attributable to the ventures | $ | 210,567 | |
| $ | 253,114 | |
| $ | 224,512 | |
Equity In Income of Unconsolidated Real Estate Affiliates: |
| |
|
| |
|
| | |||
Net income attributable to the ventures | $ | 210,567 | |
| $ | 253,114 | |
| $ | 224,512 | |
Joint venture partners' share of income | (114,263 | ) |
| (140,193 | ) |
| (131,047 | ) | |||
Amortization of capital or basis differences | (35,026 | ) |
| (44,165 | ) |
| (15,123 | ) | |||
Equity in income of Unconsolidated Real Estate Affiliates | $ | 61,278 | |
| $ | 68,756 | |
| $ | 78,342 | |
_______________________________________________________________________________
(1) | Includes management fees charged to the unconsolidated joint ventures by GGMI, GGSI and GGPLP. |
The Unconsolidated Real Estate Affiliates represent our investments in real estate joint ventures that are not consolidated. We hold interests in 24 domestic joint ventures, comprising 38 U.S. retail properties and 3 strip/other retail centers, and one joint venture in Brazil. Generally, we share in the profits and losses, cash flows and other matters relating to our investments in Unconsolidated Real Estate Affiliates in accordance with our respective ownership percentages. We manage most of the properties owned by these joint ventures. As we have joint control of these ventures with our venture partners, we account for these joint ventures under the equity method.
On December 1, 2014, we sold our interest in a joint venture, which resulted in our recognition of a gain of $9.7 million . The $9.7 million gain is recognized within equity in income of Unconsolidated Real Estate Affiliates on our Consolidated Statements of
F - 25
Table of Contents
GENERAL GROWTH PROPERTIES, INC.
NOTES TO CONSOLIDATED FINANCIAL STATEMENTS (Continued)
(Dollars in thousands, except per share amounts)
Operations and Comprehensive Income (Loss). The gain is included in amortization of capital or basis differences in the table above.
Unconsolidated Mortgages, Notes and Loans Payable and Retained Debt
Our proportionate share of the mortgages, notes and loans payable of the unconsolidated joint ventures was $3.9 billion as of December 31, 2014 and $3.2 billion as of December 31, 2013 , including Retained Debt (as defined below). There can be no assurance that the Unconsolidated Properties will be able to refinance or restructure such debt on acceptable terms or otherwise, or that joint venture operations or contributions by us and/or our partners will be sufficient to repay such loans.
We have debt obligations in excess of our pro rata share of the debt for one of our Unconsolidated Real Estate Affiliates ("Retained Debt"). This Retained Debt represents distributed debt proceeds of the Unconsolidated Real Estate Affiliates in excess of our pro rata share of the non-recourse mortgage indebtedness. The proceeds of the Retained Debt which were distributed to us are included as a reduction in our investment in Unconsolidated Real Estate Affiliates. We had retained debt of $89.3 million at one property as of December 31, 2014 , and $90.6 million as of December 31, 2013 . We are obligated to contribute funds on an ongoing basis, as needed, to our Unconsolidated Real Estate Affiliates in amounts sufficient to pay debt service on such Retained Debt. If we do not contribute such funds, our distributions from such Unconsolidated Real Estate Affiliates, or our interest in, could be reduced to the extent of such deficiencies. As of December 31, 2014 , we do not anticipate an inability to perform on our obligations with respect to Retained Debt.
NOTE 7 MORTGAGES, NOTES AND LOANS PAYABLE
Mortgages, notes and loans payable and the weighted-average interest rates are summarized as follows:
| December 31, 2014(1) |
| Weighted-Average Interest Rate(2) |
| December 31, 2013(3) |
| Weighted-Average Interest Rate(2) | ||||||
Fixed-rate debt: |
| |
|
| |
|
| |
|
| | ||
Collateralized mortgages, notes and loans payable(4) | $ | 13,600,337 | |
| 4.52 | % |
| $ | 13,907,029 | |
| 4.55 | % |
Corporate and other unsecured loans | 6,599 | |
| 4.41 | % |
| 12,791 | |
| 4.41 | % | ||
Total fixed-rate debt | 13,606,936 | |
| 4.52 | % |
| 13,919,820 | |
| 4.55 | % | ||
Variable-rate debt: |
| |
|
| |
|
| |
|
| | ||
Collateralized mortgages, notes and loans payable(4) | 2,291,353 | |
| 2.00 | % |
| 1,700,817 | |
| 2.61 | % | ||
Revolving credit facility | 100,000 | |
| 1.73 | % |
| 51,800 | |
| 1.74 | % | ||
Total variable-rate debt | 2,391,353 | |
| 1.99 | % |
| 1,752,617 | |
| 2.59 | % | ||
Total Mortgages, notes and loans payable | $ | 15,998,289 | |
| 4.14 | % |
| $ | 15,672,437 | |
| 4.33 | % |
Junior Subordinated Notes | $ | 206,200 | |
| 1.68 | % |
| $ | 206,200 | |
| 1.69 | % |
_______________________________________________________________________________
(1) | Includes net $19.9 million of debt market rate adjustments. |
(2) | Represents the weighted-average interest rates on our principal balances, excluding the effects of deferred finance costs. |
(3) | Includes net $0.9 million of debt market rate adjustments. |
(4) | $100.9 million of the fixed-rate balance and $1.4 billion of the variable-rate balance is cross-collateralized. |
Collateralized Mortgages, Notes and Loans Payable
As of December 31, 2014 , $21.9 billion of land, buildings and equipment (before accumulated depreciation) and construction in progress have been pledged as collateral for our mortgages, notes and loans payable. Certain of these consolidated secured loans, representing $1.5 billion of debt, are cross-collateralized with other properties. Although a majority of the $15.9 billion of fixed and variable rate collateralized mortgages, notes and loans payable are non-recourse, $1.7 billion of such mortgages, notes and loans payable are recourse to the Company as guarantees on secured financings. In addition, certain mortgage loans contain other credit enhancement provisions which have been provided by GGP. Certain mortgages, notes and loans payable may be prepaid
F - 26
Table of Contents
GENERAL GROWTH PROPERTIES, INC.
NOTES TO CONSOLIDATED FINANCIAL STATEMENTS (Continued)
(Dollars in thousands, except per share amounts)
but are generally subject to a prepayment penalty equal to a yield-maintenance premium, defeasance or a percentage of the loan balance.
During the year ended December 31, 2014 , we refinanced consolidated mortgage notes totaling $1.4 billion related to eight properties with net proceeds of $657.1 million . The prior loans had a weighted-average term-to-maturity of 1.6 years , and a weighted-average interest rate of 4.8% . The new loans have a weighted-average term-to-maturity of 6.7 years , and a weighted-average interest rate of 3.3% . In addition to these loans, we also obtained a $450.0 million construction loan at Ala Moana Center with an interest rate of LIBOR plus 1.9% . As of December 31, 2014, the Company has drawn $228.9 million under this loan.
On August 1, 2014, we amended our $1.4 billion corporate loan secured by cross-collateralized mortgages on 14 properties. This amendment lowered the interest rate on the loan from LIBOR plus 2.50% to LIBOR plus 1.75% . The loan matures on April 26, 2016. At our option, there are two one-year maturity date extension options available, subject to certain compliance requirements.
Corporate and Other Unsecured Loans
We have certain unsecured debt obligations, the terms of which are described below:
| December 31, 2014(2) |
| Weighted-Average Interest Rate |
| December 31, 2013(3) |
| Weighted-Average Interest Rate | ||||||
Unsecured debt: |
| |
|
| |
|
| |
|
| | ||
HHC Note(1) | 6,735 | |
| 4.41 | % |
| 13,179 | |
| 4.41 | % | ||
Revolving credit facility | 100,000 | |
| 1.73 | % |
| 51,800 | |
| 1.74 | % | ||
Total unsecured debt | $ | 106,735 | |
| 1.90 | % |
| $ | 64,979 | |
| 2.28 | % |
_______________________________________________________________________________
(1) | Matures in December 2015. |
(2) | Excludes a market rate discount of $0.1 million that decreases the total amount that appears outstanding in our Consolidated Balance Sheets. The market rate discount amortizes as an addition to interest expense over the life of the loan. |
(3) | Excludes a market rate discount of $0.4 million that decreases the total amount that appears outstanding in our Consolidated Balance Sheets. The market rate discount amortizes as an addition to interest expense over the life of the loan. |
Our Facility as amended on October 23, 2013, provides for revolving loans of up to $1.0 billion . The Facility has an uncommitted accordion feature for a total facility of up to $1.5 billion . The Facility is scheduled to mature in October 2018 and is unsecured. Borrowings under the Facility bear interest at a rate equal to LIBOR plus 132.5 to 195 basis points, which is determined by the Company's leverage level. The Facility contains certain restrictive covenants which limit material changes in the nature of our business conducted, including but not limited to, mergers, dissolutions or liquidations, dispositions of assets, liens, incurrence of additional indebtedness, dividends, transactions with affiliates, prepayment of subordinated debt, negative pledges and changes in fiscal periods. In addition, we are required not to exceed a maximum net debt-to-value ratio, a maximum leverage ratio and a minimum net cash interest coverage ratio; we are not aware of any instances of non-compliance with such covenants as of December 31, 2014 . $100.0 million was outstanding on the Facility, as of December 31, 2014 .
Junior Subordinated Notes
GGP Capital Trust I, a Delaware statutory trust (the "Trust") and a wholly-owned subsidiary of GGPN, completed a private placement of $200.0 million of trust preferred securities ("TRUPS") in 2006. The Trust also issued $6.2 million of Common Securities to GGPN. The Trust used the proceeds from the sale of the TRUPS and Common Securities to purchase $206.2 million of floating rate Junior Subordinated Notes of GGPN due 2036. Distributions on the TRUPS are equal to LIBOR plus 1.45% . Distributions are cumulative and accrue from the date of original issuance. The TRUPS mature on April 30, 2036, but may be redeemed beginning on April 30, 2011 if the Trust exercises its right to redeem a like amount of Junior Subordinated Notes. The Junior Subordinated Notes bear interest at LIBOR plus 1.45% and are fully recourse to the Company. Though the Trust is a wholly-owned subsidiary of GGPN, we are not the primary beneficiary of the Trust and, accordingly, it is not consolidated for accounting purposes. We have recorded the Junior Subordinated Notes as a liability and our common equity interest in the Trust as prepaid expenses and other assets in our Consolidated Balance Sheets as of December 31, 2014 and December 31, 2013 .
F - 27
Table of Contents
GENERAL GROWTH PROPERTIES, INC.
NOTES TO CONSOLIDATED FINANCIAL STATEMENTS (Continued)
(Dollars in thousands, except per share amounts)
Letters of Credit and Surety Bonds
We had outstanding letters of credit and surety bonds of $49.1 million as of December 31, 2014 and $19.4 million as of December 31, 2013 . These letters of credit and bonds were issued primarily in connection with insurance requirements, special real estate assessments and construction obligations.
We are not aware of any instances of non-compliance with our financial covenants related to our mortgages, notes and loans payable as of December 31, 2014 .
NOTE 8 INCOME TAXES
We have elected to be taxed as a REIT under the Internal Revenue Code. We intend to maintain REIT status. To qualify as a REIT, the Company must meet a number of organizational and operational requirements, including a requirement to distribute at least 90% of our taxable ordinary income. In addition, the Company is required to meet certain asset and income tests.
As a REIT, we will generally not be subject to corporate level Federal income tax on taxable income we distribute currently to our stockholders. If we fail to qualify as a REIT in any taxable year, we will be subject to Federal income taxes at regular corporate rates (including any applicable alternative minimum tax) and may not be able to qualify as a REIT for four subsequent taxable years. Even if we qualify for taxation as a REIT, we may be subject to certain state and local taxes on our income or property, and to Federal income and excise taxes on our undistributed taxable income and capital gains. We are currently statutorily open to audit by the Internal Revenue Service for the years ended December 31, 2011 through 2014 and are statutorily open to audit by state taxing authorities for the years ended December 31, 2010 through 2014 .
The provision for income taxes for the years ended December 31, 2014 , 2013 , and 2012 are as follows:
| December 31, 2014 |
| December 31, 2013 |
| December 31, 2012 | ||||||
Current | $ | 13,994 | |
| $ | 3,855 | |
| $ | 5,036 | |
Deferred | (6,741 | ) |
| (3,510 | ) |
| 4,055 | | |||
Total from Continuing Operations | 7,253 | |
| 345 | |
| 9,091 | | |||
Current | - | |
| - | |
| 23 | | |||
Total from Discontinued Operations | - | |
| - | |
| 23 | | |||
Total | $ | 7,253 | |
| $ | 345 | |
| $ | 9,114 | |
Realization of a deferred tax benefit is dependent upon generating sufficient taxable income in future periods. Our TRS net operating loss carryforwards of $19.5 million are currently scheduled to expire in subsequent years through 2033. Our capital loss carryforwards of $6.6 million are scheduled to expire in 2016. Substantially all of these attributes are limited under Section 382 of the Code and are subject to valuation allowances.
Each TRS and certain REIT entities subject to state income taxes are tax paying components for purposes of classifying deferred tax assets and liabilities. Net deferred tax assets (liabilities) are summarized as follows:
| December 31, 2014 |
| December 31, 2013 |
| December 31, 2012 | ||||||
Total deferred tax assets | $ | 19,347 | |
| $ | 16,077 | |
| $ | 17,778 | |
Valuation allowance | (15,127 | ) |
| (15,171 | ) |
| (16,876 | ) | |||
Net deferred tax assets | 4,220 | |
| 906 | |
| 902 | | |||
Total deferred tax liabilities | (21,240 | ) |
| (24,667 | ) |
| (28,174 | ) | |||
Net deferred tax liabilities | $ | (17,020 | ) |
| $ | (23,761 | ) |
| $ | (27,272 | ) |
Due to the uncertainty of the realization of certain tax carryforwards, we have established valuation allowances on those deferred tax assets that we do not reasonably expect to realize. Deferred tax assets that we believe have only a remote possibility of realization have not been recorded.
F - 28
Table of Contents
GENERAL GROWTH PROPERTIES, INC.
NOTES TO CONSOLIDATED FINANCIAL STATEMENTS (Continued)
(Dollars in thousands, except per share amounts)
The tax effects of temporary differences and carryforwards included in the net deferred tax liabilities as of December 31, 2014 , December 31, 2013 and December 31, 2012 are summarized as follows:
| December 31, 2014 |
| December 31, 2013 |
| December 31, 2012 | ||||||
Operating loss and tax credit carryforwards | $ | 15,699 | |
| $ | 15,477 | |
| $ | 15,051 | |
Other TRS property, primarily differences in basis of assets and liabilities | (17,592 | ) |
| (24,067 | ) |
| (25,447 | ) | |||
Valuation allowance | (15,127 | ) |
| (15,171 | ) |
| (16,876 | ) | |||
Net deferred tax liabilities | $ | (17,020 | ) |
| $ | (23,761 | ) |
| $ | (27,272 | ) |
We have unrecognized tax benefits recorded pursuant to uncertain tax positions of $6.1 million and $5.1 million as of December 31, 2014 and December 31, 2013 respectively, excluding interest, all of which would impact our effective tax rate. We believe that it is reasonably possible that all of our currently remaining unrecognized tax benefits may be recognized by the end of 2015 upon the potential settlement of an audit and the expiration of the statute of limitations.
NOTE 9 WARRANTS
Pursuant to the terms of the Investment Agreements, the Plan Sponsors and Blackstone were issued 120,000,000 warrants (the "Warrants") to purchase common stock of GGP with an initial weighted average exercise price of $10.63 . Each Warrant was originally recorded as a liability, as the holders of the Warrants could have required GGP to settle such Warrants in cash upon certain changes of control events. The Warrants were fully vested upon issuance. Each Warrant has a term of seven years and expires on November 9, 2017. Below is a summary of the Warrants initially received by the Plan Sponsors and Blackstone.
Initial Warrant Holder |
| Number of Warrants |
| Initial Exercise Price | |||
Brookfield |
| 57,500,000 | |
| $ | 10.75 | |
Blackstone-B(2) |
| 2,500,000 | |
| 10.75 | | |
Fairholme(2) |
| 41,070,000 | |
| 10.50 | | |
Pershing Square(1) |
| 16,430,000 | |
| 10.50 | | |
Blackstone-A(2) |
| 2,500,000 | |
| 10.50 | | |
|
| 120,000,000 | |
|
| | |
_______________________________________________________________________________
(1) | On December 31, 2012, the Pershing Square Warrants were purchased by the Brookfield Investor. |
(2) | On January 28, 2013, the Fairholme and Blackstone Warrants (A and B) were purchased by GGP. |
The Brookfield Warrants and the Blackstone Warrants (A and B) were immediately exercisable, while the Fairholme Warrants and the Pershing Square Warrants were exercisable (for the initial 6.5 years from the issuance) only upon 90 days prior notice, but there is no obligation to exercise at any point from the end of the 90 day notification period through maturity.
The exercise prices of the Warrants are subject to adjustment for future dividends, stock dividends, distribution of assets, stock splits or reverse splits of our common stock or certain other events. In accordance with the agreement, these calculations adjust both the exercise price and the number of shares issuable for the 120,000,000 Warrants that were initially issued to the Plan Sponsors. During 2013 and 2014 , the number of shares issuable upon exercise of the outstanding Warrants changed as follows:
F - 29
Table of Contents
GENERAL GROWTH PROPERTIES, INC.
NOTES TO CONSOLIDATED FINANCIAL STATEMENTS (Continued)
(Dollars in thousands, except per share amounts)
|
|
|
| Exercise Price | |||||||
Record Date |
| Issuable Shares (1) |
| Brookfield and Blackstone-B (2) |
| Fairholme, Pershing Square and Blackstone-A (2)(3) | |||||
April 16, 2013 |
| 83,443,178 | |
| $ | 9.53 | |
| $ | 9.30 | |
July 16, 2013 |
| 83,945,892 | |
| 9.47 | |
| 9.25 | | ||
October 15, 2013 |
| 84,507,750 | |
| 9.41 | |
| 9.19 | | ||
December 13, 2013 |
| 85,084,392 | |
| 9.34 | |
| 9.12 | | ||
April 15, 2014 |
| 85,668,428 | |
| 9.28 | |
| 9.06 | | ||
July 15, 2014 |
| 86,215,500 | |
| 9.22 | |
| 9.01 | | ||
October 15, 2014 |
| 86,806,928 | |
| 9.16 | |
| 8.94 | | ||
December 15, 2014 |
| 87,353,999 | |
| 9.10 | |
| 8.89 | | ||
_______________________________________________________________________________
(1) | Issuable shares as of April 16, 2013 exclude the Fairholme and Blackstone A and B warrants purchased by GGPLP. |
(2) | On January 28, 2013, the Fairholme and Blackstone Warrants (A and B) were purchased by GGPLP. |
(3) | On December 31, 2012, the Pershing Square Warrants were purchased by the Brookfield Investor. |
On December 31, 2012, Brookfield acquired all of the 16,430,000 Warrants held by Pershing Square for a purchase price of approximately $272 million . At the time of purchase, the Pershing Square Warrants were exercisable into approximately 10 million common shares of the Company at a weighted-average exercise price of approximately $9.36 per share, assuming net share settlement (i.e. receive shares in common stock equivalent to the intrinsic value of the warrant at the time of exercise). In connection with the transaction, Brookfield and Pershing Square are required to abide by certain undertakings outlined in their Warrant Purchase Agreement dated December 31, 2012, filed on the same date.
On January 28, 2013, GGPLP acquired the 41,070,000 Warrants held by Fairholme and the 5,000,000 Warrants held by Blackstone for an aggregate purchase price of approximately $633 million . At the time of purchase, the GGPLP Warrants were exercisable into approximately 27 million common shares of the Company at a weighted-average exercise price of approximately $9.37 per share, assuming net share settlement. On March 26, 2013, GGPLP exercised its warrants and was issued approximately 27.5 million shares of GGP's common stock, under net share settlement (See Note 12 for further discussion).
As a result of the transactions occurring on December 31, 2012, and January 28, 2013, Brookfield now owns or manages on behalf of third parties all of the outstanding Warrants. Brookfield has the option for 57,500,000 Warrants to either full share settle (i.e. deliver cash for the exercise price of the Warrants in the amount of approximately $618 million in exchange for approximately 68,000,000 shares of common stock) or net share settle. The remaining 16,430,000 Warrants owned or managed by Brookfield must be net share settled. As of December 31, 2014 , the remaining Warrants are exercisable into approximately 59 million common shares of the Company, at a weighted-average exercise price of approximately $9.11 per share. Due to their ownership of Warrants, Brookfield's potential ownership of the Company may change as a result of payments of dividends and changes in our stock price.
On March 28, 2013, we amended the warrant agreement to replace the right of warrant holders to receive cash from the Company under a change of control to the right to, instead, receive shares of the Company, changing the method of settlement. This amendment results in the classification of the Warrants as a component of permanent equity on our Consolidated Balance Sheets. Prior to the amendment, the Warrants were classified as a liability, due to the cash settlement feature, and marked to fair value, with changes in fair value recognized in earnings. As a result of the amendment, the fair value was determined as of March 28, 2013 with the change in fair value recognized in our Consolidated Statements of Operations and Comprehensive Income (Loss) and the determined fair value was reclassified to equity.
The estimated fair value of the Warrants was $895.5 million as of March 28, 2013. The fair value of the Warrants was estimated using the Black Scholes option pricing model using our stock price, the Warrant term, and Level 3 inputs ( Note 2 ). As discussed above, the modification of the warrant agreement resulted in the classification of the Warrants as equity as of March 28, 2013. From December 31, 2012 through March 28, 2013, changes in the fair value of the Warrants were recognized in earnings. An increase in GGP's common stock price or in the expected volatility of the Warrants would increase the fair value; whereas, a decrease in GGP's common stock price or an increase in the lack of marketability would decrease the fair value.
F - 30
Table of Contents
GENERAL GROWTH PROPERTIES, INC.
NOTES TO CONSOLIDATED FINANCIAL STATEMENTS (Continued)
(Dollars in thousands, except per share amounts)
The following table summarizes the change in fair value of the Warrants which is measured on a recurring basis using Level 3 inputs:
|
| Year Ended December 31, | ||||||
|
| 2013 |
| 2012 | ||||
Balance as of January 1, |
| $ | 1,488,196 | |
| $ | 985,962 | |
Warrant liability adjustment |
| 40,546 | |
| 502,234 | | ||
Purchase of Warrants by GGPLP |
| (633,229 | ) |
| - | | ||
Reclassification to equity |
| (895,513 | ) |
| - | | ||
Balance as of December 31, |
| $ | - | |
| $ | 1,488,196 | |
The following table summarizes the estimated fair value of the Warrants and significant observable and unobservable inputs used in the valuation as of March 28, 2013 and December 31, 2012:
|
| March 28, 2013 |
| December 31, 2012 |
Fair value of Warrants |
| $895,513 |
| $1,488,196 |
Observable Inputs |
|
|
|
|
GGP stock price per share |
| $19.88 |
| $19.85 |
Warrant term |
| 4.62 |
| 4.86 |
Unobservable Inputs |
|
|
|
|
Expected volatility |
| 30% |
| 33% |
Range of values considered |
| (15% - 65%) |
| (20% - 65%) |
Discount for lack of marketability |
| 3% |
| 3% |
Range of values considered |
| (3% - 7%) |
| (3% - 7%) |
NOTE 10 RENTALS UNDER OPERATING LEASES
We receive rental income from the leasing of retail and other space under operating leases. The minimum future rentals based on operating leases of our Consolidated Properties as of December 31, 2014 are as follows:
Year |
| Amount | ||
2015 |
| $ | 1,385,785 | |
2016 |
| 1,280,551 | | |
2017 |
| 1,136,836 | | |
2018 |
| 998,624 | | |
2019 |
| 858,889 | | |
Subsequent |
| 3,051,023 | | |
|
| $ | 8,711,708 | |
Minimum future rentals exclude amounts which are payable by certain tenants based upon a percentage of their gross sales or as reimbursement of operating expenses and amortization of above and below-market tenant leases. Such operating leases are with a variety of tenants, the majority of which are national and regional retail chains and local retailers, and consequently, our credit risk is concentrated in the retail industry.
F - 31
Table of Contents
GENERAL GROWTH PROPERTIES, INC.
NOTES TO CONSOLIDATED FINANCIAL STATEMENTS (Continued)
(Dollars in thousands, except per share amounts)
NOTE 11 EQUITY AND REDEEMABLE NONCONTROLLING INTERESTS
Allocation to Noncontrolling Interests
Noncontrolling interests consists of the redeemable interests related to our common and preferred Operating Partnership units and the noncontrolling interest in our consolidated joint ventures. The following table reflects the activity included in the allocation to noncontrolling interests.
| Year Ended December 31, | ||||||||||
| 2014 |
| 2013 |
| 2012 | ||||||
Distributions to preferred Operating Partnership units | $ | (8,965 | ) |
| $ | (9,287 | ) |
| $ | (12,414 | ) |
Net (income) loss allocation to noncontrolling interests in operating partnership from continuing operations (common units) | (3,228 | ) |
| (2,281 | ) |
| 3,498 | | |||
Net (income) loss allocated to noncontrolling interest in consolidated real estate affiliates | (1,851 | ) |
| (3,103 | ) |
| (784 | ) | |||
Allocation to noncontrolling interests | (14,044 | ) |
| (14,671 | ) |
| (9,700 | ) | |||
Other comprehensive loss allocated to noncontrolling interests | 78 | |
| (393 | ) |
| 258 | | |||
Comprehensive income allocated to noncontrolling interests | $ | (13,966 | ) |
| $ | (15,064 | ) |
| $ | (9,442 | ) |
Redeemable Noncontrolling Interests
The minority interest related to the Common and Preferred Units of the Operating Partnership are presented as redeemable noncontrolling interests in our Consolidated Balance Sheets since it is possible we could be required, under certain events outside of our control, to redeem the securities for cash by the holders of the securities.
The Common and Preferred Units of the Operating Partnership are recorded at the greater of the carrying amount adjusted for the noncontrolling interest's share of the allocation of income or loss (and its share of other comprehensive income or loss) and dividends or their fair value as of each measurement date. The excess of the fair value over the carrying amount from period to period is recorded within additional paid-in capital (loss) in our Consolidated Balance Sheets. Allocation to noncontrolling interests is presented as an adjustment to net income to arrive at net loss attributable to GGP.
The common redeemable noncontrolling interests have been recorded at fair value for all periods presented. One tranche of preferred redeemable noncontrolling interests has been recorded at fair value, while the other tranches of preferred redeemable noncontrolling interests have been recorded at carrying value.
Generally, the holders of the Common Units share in any distributions by the Operating Partnership with our common stockholders. However, the Operating Partnership agreement permits distributions solely to GGP if such distributions were required to allow GGP to comply with the REIT distribution requirements or to avoid the imposition of excise tax. Under certain circumstances, the conversion rate for each Common Unit is required to be adjusted to give effect to stock distributions. If the holders had requested redemption of the Common Units as of December 31, 2014 , the aggregate amount of cash we would have paid would have been $164.0 million .
The Operating Partnership issued Convertible Preferred Units that are convertible into Common Units of the Operating Partnership at the rates below (subject to adjustment). The holder may convert the Convertible Preferred Units into Common Units of the Operating Partnership at any time, subject to certain restrictions. The Common Units are convertible into common stock at a one -to- one ratio at the current stock price.
F - 32
Table of Contents
GENERAL GROWTH PROPERTIES, INC.
NOTES TO CONSOLIDATED FINANCIAL STATEMENTS (Continued)
(Dollars in thousands, except per share amounts)
| Number of Common Units for each Preferred Unit |
| Number of Contractual Convertible Preferred Units Outstanding as of December 31, 2014 |
| Converted Basis to Common Units Outstanding as of December 31, 2014 |
| Conversion Price |
| Redemption Value | |||||||
Series B(1) | 3.00000 | |
| 1,279,386 | |
| 3,990,772 | |
| $ | 16.66670 | |
| 112,260 | | |
Series D | 1.50821 | |
| 532,750 | |
| 803,498 | |
| 33.15188 | |
| 26,637 | | ||
Series E | 1.29836 | |
| 502,658 | |
| 652,631 | |
| 38.51000 | |
| 25,133 | | ||
|
| |
|
| |
|
| |
|
| |
| $ | 164,030 | | |
_______________________________________________________________________________
(1) | The conversion price of Series B preferred units is lower than the GGP December 31, 2014 closing common stock price of $28.13 . Therefore, a common stock price of $28.13 is used to calculate the Series B redemption value. |
The following table reflects the activity of the redeemable noncontrolling interests for the years ended December 31, 2014 , 2013 , and 2012 .
Balance at January 1, 2012 | $ | 223,795 | |
Net loss | (3,498 | ) | |
Distributions | (2,850 | ) | |
Redemption of operating partnership units | (2,730 | ) | |
Dividend for RPI Spin-Off | 3,137 | | |
Other comprehensive loss | (258 | ) | |
Fair value adjustment for noncontrolling interests in Operating Partnership | 50,623 | | |
Balance at December 31, 2012 | $ | 268,219 | |
Balance at January 1, 2013 | 268,219 | | |
Net income | 2,281 | | |
Distributions | (3,275 | ) | |
Redemption of operating partnership units (1) | (41,889 | ) | |
Other comprehensive income | 393 | | |
Fair value adjustment for noncontrolling interests in Operating Partnership | 3,173 | | |
Balance at December 31, 2013 | $ | 228,902 | |
Balance at January 1, 2014 | $ | 228,902 | |
Net income | 3,228 | | |
Distributions | (3,059 | ) | |
Redemption of operating partnership units | (350 | ) | |
Other comprehensive income | (78 | ) | |
Fair value adjustment for noncontrolling interests in Operating Partnership | 70,653 | | |
Balance at December 31, 2014 | $ | 299,296 | |
_______________________________________________________________________________
(1) | Operating partnership unit holders redeemed 1,756,521 units in 2013. |
F - 33
Table of Contents
GENERAL GROWTH PROPERTIES, INC.
NOTES TO CONSOLIDATED FINANCIAL STATEMENTS (Continued)
(Dollars in thousands, except per share amounts)
Common Stock Dividend and Purchase of Common Stock
Our Board of Directors declared common stock dividends during 2014 and 2013 as follows:
Declaration Date |
| Record Date |
| Payment Date |
| Dividend Per Share | ||
2014 |
|
|
|
|
|
| | |
November 14 |
| December 15 |
| January 2, 2015 |
| $ | 0.17 | |
August 12 |
| October 15 |
| October 31, 2014 |
| 0.16 | | |
May 15 |
| July 15 |
| July 31, 2014 |
| 0.15 | | |
February 26 |
| April 15 |
| April 30, 2014 |
| 0.15 | | |
2013 |
|
|
|
|
|
| | |
October 28 |
| December 13 |
| January 2, 2014 |
| $ | 0.14 | |
July 29 |
| October 15 |
| October 29, 2013 |
| 0.13 | | |
May 10 |
| July 16 |
| July 30, 2013 |
| 0.12 | | |
February 4 |
| April 16 |
| April 30, 2013 |
| 0.12 | | |
Distributions paid on our common stock and their tax status, as sent to our shareholders, is presented in the following table. The tax status of GGP distributions in 2014 , 2013 , and 2012 may not be indicative of future periods.
| Year Ended December 31, | ||||||||||
| 2014 |
| 2013 |
| 2012 | ||||||
Ordinary income | $ | 0.499 | |
| $ | 0.330 | |
| $ | 0.316 | |
Capital gain distributions | 0.034 | |
| 0.290 | |
| 0.221 | | |||
Distributions per share | $ | 0.533 | |
| $ | 0.620 | |
| $ | 0.537 | |
Our Dividend Reinvestment Plan ("DRIP") provides eligible holders of GGP's common stock with a convenient method of increasing their investment in the Company by reinvesting all or a portion of cash dividends in additional shares of common stock. Eligible stockholders who enroll in the DRIP on or before the four th business day preceding the record date for a dividend payment will be able to have that dividend reinvested. As a result of the DRIP elections, 22,186 shares were issued during the year ended December 31, 2014 and 28,852 shares were issued during the year ended December 31, 2013 .
Preferred Stock
On February 13, 2013, we issued, in a public offering, 10,000,000 shares of 6.375% Series A Cumulative Perpetual Preferred Stock (the "Preferred Stock") at a price of $25.00 per share, resulting in net proceeds of $242.0 million after issuance costs. The Preferred Stock is recorded net of issuance costs within equity on our Consolidated Balance Sheets, and accrues a quarterly dividend at an annual rate of 6.375% . The dividend is paid in arrears in preference to dividends on our common stock, and reduces net income available to common stockholders, and therefore, earnings per share.
The Preferred Stock does not have a stated maturity date but we may redeem the Preferred Stock after February 12, 2018, for $25.00 per share plus all accrued and unpaid dividends. We may redeem the Preferred Stock prior to February 12, 2018, in limited circumstances that preserve ownership limits and/or our status as a REIT, as well as during certain circumstances surrounding a change of control. Upon certain circumstances surrounding a change of control, holders of Preferred Stock may elect to convert each share of their Preferred Stock into a number of shares of GGP common stock equivalent to $25.00 plus accrued and unpaid dividends, but not to exceed a cap of 2.4679 common shares (subject to certain adjustments related to GGP common share splits, subdivisions, or combinations).
F - 34
Table of Contents
GENERAL GROWTH PROPERTIES, INC.
NOTES TO CONSOLIDATED FINANCIAL STATEMENTS (Continued)
(Dollars in thousands, except per share amounts)
Our Board of Directors declared preferred stock dividends during 2014 and 2013 as follows:
|
|
|
|
|
|
| ||
Declaration Date |
| Record Date |
| Payment Date |
| Dividend Per Share | ||
2014 |
|
|
|
|
|
| ||
November 14 |
| December 15 |
| January 2, 2015 |
| $ | 0.3984 | |
August 12 |
| September 15 |
| October 1, 2014 |
| 0.3984 | | |
May 15 |
| June 16 |
| July 1, 2014 |
| 0.3984 | | |
February 26 |
| March 17 |
| April 1, 2014 |
| 0.3984 | | |
2013 |
|
|
|
|
|
| | |
October 28 |
| December 13 |
| January 2, 2014 |
| $ | 0.3984 | |
July 29 |
| September 13 |
| October 1, 2013 |
| 0.3984 | | |
May 10 |
| June 14 |
| July 1, 2013 |
| 0.3984 | | |
March 4 |
| March 15 |
| April 1, 2013 |
| 0.2125 | | |
NOTE 12 EARNINGS PER SHARE
Basic earnings per share ("EPS") is computed by dividing net income available to common stockholders by the weighted-average number of common shares outstanding. Diluted EPS is computed after adjusting the numerator and denominator of the basic EPS computation for the effects of all potentially dilutive common shares. The dilutive effect of the Warrants and the dilutive effect of options and their equivalents (including fixed awards and nonvested stock issued under stock-based compensation plans), are computed using the "treasury" method.
Information related to our EPS calculations is summarized as follows:
F - 35
Table of Contents
GENERAL GROWTH PROPERTIES, INC.
NOTES TO CONSOLIDATED FINANCIAL STATEMENTS (Continued)
(Dollars in thousands, except per share amounts)
| Year Ended December 31, | ||||||||||
| 2014 |
| 2013 |
| 2012 | ||||||
Numerators-Basic: |
| |
|
| |
|
| | |||
Income (loss) from continuing operations | $ | 398,011 | |
| $ | 328,821 | |
| $ | (426,985 | ) |
Preferred Stock dividend | (15,936 | ) |
| (14,078 | ) |
| - | | |||
Allocation to noncontrolling interests | (12,935 | ) |
| (14,602 | ) |
| (9,663 | ) | |||
Income (loss) from continuing operations-net of noncontrolling interests | 369,140 | |
| 300,141 | |
| (436,648 | ) | |||
Discontinued operations | 281,883 | |
| (11,622 | ) |
| (44,548 | ) | |||
Allocation to noncontrolling interests | (1,109 | ) |
| (69 | ) |
| (37 | ) | |||
Discontinued operations-net of noncontrolling interests | 280,774 | |
| (11,691 | ) |
| (44,585 | ) | |||
Net income (loss) | 679,894 | |
| 317,199 | |
| (471,533 | ) | |||
Preferred Stock dividend | (15,936 | ) |
| (14,078 | ) |
| - | | |||
Allocation to noncontrolling interests | (14,044 | ) |
| (14,671 | ) |
| (9,700 | ) | |||
Net income (loss) attributable to common stockholders | $ | 649,914 | |
| $ | 288,450 | |
| $ | (481,233 | ) |
Numerators-Diluted: |
| |
|
| |
|
| | |||
Income (loss) from continuing operations-net of noncontrolling interests | $ | 369,140 | |
| $ | 300,141 | |
| $ | (436,648 | ) |
Diluted income (loss) from continuing operations | $ | 369,140 | |
| $ | 300,141 | |
| $ | (436,648 | ) |
Net income (loss) attributable to common stockholders | $ | 649,914 | |
| $ | 288,450 | |
| $ | (481,233 | ) |
Diluted net income (loss) attributable to common stockholders | $ | 649,914 | |
| $ | 288,450 | |
| $ | (481,233 | ) |
Denominators: |
| |
|
| |
|
| | |||
Weighted-average number of common shares outstanding-basic | 887,031 | |
| 930,643 | |
| 938,049 | | |||
Effect of dilutive securities | 57,690 | |
| 3,425 | |
| - | | |||
Weighted-average number of common shares outstanding-diluted | 944,721 | |
| 934,068 | |
| 938,049 | | |||
Anti-dilutive Securities: |
| |
|
| |
|
| | |||
Effect of Preferred Units | 5,505 | |
| 5,506 | |
| 5,526 | | |||
Effect of Common Units | 4,833 | |
| 6,434 | |
| 6,819 | | |||
Effect of Stock Options | - | |
| - | |
| 2,352 | | |||
Effect of Warrants | - | |
| 46,724 | |
| 61,065 | | |||
| 10,338 | |
| 58,664 | |
| 75,762 | | |||
Options were dilutive for the years ended December 31, 2014 and December 31, 2013 and are included in the denominator of EPS. Because of the net loss, options were anti-dilutive for the year ended December 31, 2012, and, their effect has not been included in the calculation of diluted net loss per share. Warrants were dilutive for the year ended December 31, 2014 and are included in the denominator of EPS. Potentially dilutive shares related to the Warrants for the years ended December 31, 2013 and December 31, 2012 are excluded from the denominator in the computation of diluted EPS because they are anti-dilutive.
Outstanding Common Units have also been excluded from the diluted earnings per share calculation because including such Common Units would also require that the share of GGPOP income attributable to such Common Units be added back to net income therefore resulting in no effect on EPS. Outstanding Preferred Units have been excluded from the diluted EPS calculation for all periods presented because including the Preferred Units would also require that the Preferred Units dividend be added back to the net income, resulting in anti-dilution.
During the year ended December 31, 2013, GGPOP repurchased 28,345,108 shares of GGP's common stock for $566.9 million . These shares are presented as common stock in treasury, at cost, on our Consolidated Balance Sheets. Accordingly, these shares have been excluded from the calculation of EPS. In addition, GGPOP was issued 27,459,195 shares of GGP common stock on March 26, 2013, as a result of GGPOP's purchase and subsequent exercising of the Fairholme and Blackstone A and B Warrants
F - 36
Table of Contents
GENERAL GROWTH PROPERTIES, INC.
NOTES TO CONSOLIDATED FINANCIAL STATEMENTS (Continued)
(Dollars in thousands, except per share amounts)
(Note 9). These shares are presented as issued, but not outstanding on our Consolidated Balance Sheets. Accordingly, these shares have been excluded from the calculation of EPS.
On February 10, 2014, GGPOP repurchased 27,624,282 shares of GGP's common stock for $555.8 million . These shares are presented as common stock in treasury, at cost, on our Consolidated Balance Sheets. Accordingly, these shares have been excluded from the calculation of EPS.
On May 1, 2014, the shares of GGP common stock owned by GGPOP were contributed to GGPN, and as a result of these transactions, GGPN owns an aggregate of 83,428,585 shares of GGP common stock as of December 31, 2014 , of which 55,969,390 , with an aggregate cost of $1,122.7 million , are shown as treasury stock and 27,459,195 are shown as issued, but not outstanding on our Consolidated Balance Sheets.
NOTE 13 STOCK-BASED COMPENSATION PLANS
Incentive Stock Plans
The General Growth Properties, Inc. 2010 Equity Plan (the "Equity Plan") which remains in effect after the Effective Date, reserved for issuance of 4% of GGP outstanding shares on a fully diluted basis as of the Effective Date. The Equity Plan provides for grants of nonqualified stock options, incentive stock options, stock appreciation rights, restricted stock, other stock-based awards and performance-based compensation (collectively, "the Awards"). Directors, officers and other employees of GGP's and its subsidiaries and affiliates are eligible for Awards. The Equity Plan is not subject to the Employee Retirement Income Security Act of 1974, as amended. No participant may be granted more than 4,000,000 shares, or the equivalent dollar value of such shares, in any year. Options granted under the Equity Plan will be designated as either nonqualified stock options or incentive stock options. An option granted as an incentive stock option will, to the extent it fails to qualify as an incentive stock option, be treated as a nonqualified option. The exercise price of an option may not be less than the fair value of a share of GGP's common stock on the date of grant. The term of each option will be determined prior to the date of grant, but may not exceed 10 years.
Stock Options
The following tables summarize stock option activity for the Equity Plan for GGP for the years ended December 31, 2014 , 2013 and 2012 :
| 2014 |
| 2013 |
| 2012 | |||||||||||||||
| Shares |
| Weighted Average Exercise Price |
| Shares |
| Weighted Average Exercise Price |
| Shares |
| Weighted Average Exercise Price | |||||||||
Stock options Outstanding at January 1, | 21,565,281 | |
| $ | 17.28 | |
| 9,692,499 | |
| $ | 13.59 | |
| 11,503,869 | |
| $ | 15.65 | |
Granted | 50,000 | |
| 22.41 | |
| 12,740,784 | |
| 19.97 | |
| - | |
| - | | |||
Exercised | (1,164,945 | ) |
| 15.47 | |
| (339,723 | ) |
| 14.33 | |
| (607,473 | ) |
| 13.89 | | |||
Forfeited | (662,820 | ) |
| 18.89 | |
| (488,969 | ) |
| 16.27 | |
| (703,183 | ) |
| 14.68 | | |||
Expired | (43,292 | ) |
| 14.58 | |
| (39,310 | ) |
| 14.35 | |
| (500,714 | ) |
| 46.28 | | |||
Stock options Outstanding at December 31, | 19,744,224 | |
| $ | 17.36 | |
| 21,565,281 | |
| $ | 17.28 | |
| 9,692,499 | |
| $ | 13.59 | |
F - 37
Table of Contents
GENERAL GROWTH PROPERTIES, INC.
NOTES TO CONSOLIDATED FINANCIAL STATEMENTS (Continued)
(Dollars in thousands, except per share amounts)
|
| Stock Options Outstanding |
| Stock Options Exercisable | ||||||||||||||||
Range of Exercise Prices |
| Shares |
| Weighted Average Remaining Contractual Term (in years) |
| Weighted Average Exercise Price |
| Shares |
| Weighted Average Remaining Contractual Term (in years) |
| Weighted Average Exercise Price | ||||||||
$8.00 - $12.00 |
| 2,000,000 | |
| 5.8 |
| $ | 9.69 | |
| 2,000,000 | |
| 5.8 |
| $ | 9.69 | | ||
$13.00 - $17.00 |
| 5,863,404 | |
| 6.4 |
| 14.62 | |
| 3,397,118 | |
| 6.4 |
| 14.58 | | ||||
$18.00 - $23.00 |
| 11,880,820 | |
| 8.4 |
| 20.00 | |
| 2,592,624 | |
| 8.4 |
| 20.07 | | ||||
Total |
| 17,746,224 | |
| 7.6 |
| $ | 17.36 | |
| 7,989,742 | |
| 6.9 |
| $ | 15.14 | | ||
|
| $ | 212,645 | |
|
|
|
| |
| $ | 103,787 | |
|
|
|
| | ||
Stock options under the Equity Plan generally vest in 25% increments annually from one year from the grant date. Options under certain previous equity plans were replaced under the Plan with options, fully vested, in GGP common stock.
The weighted-average fair value of stock options as of the grant date was $5.33 for stock options granted during the year ended December 31, 2014 and $5.11 for stock options granted during the year ended December 31, 2013 . The intrinsic value of stock options exercised during the year was $18.2 million , $4.9 million , and $3.3 million for the year ended December 31, 2014, December 31, 2013, and December 31, 2012, respectively.
Restricted Stock
Pursuant to the Equity Plan, GGP and GGP Inc. made restricted stock grants to certain employees and non-employee directors. The vesting terms of these grants are specific to the individual grant. The vesting terms varied in that a portion of the shares vested either immediately or on the first anniversary and the remainder vested in equal annual amounts over the next two to five years. Participating employees were required to remain employed for vesting to occur (subject to certain exceptions in the case of retirement). Shares that did not vest were forfeited. Dividends are paid on restricted stock and are not returnable, even if the underlying stock does not ultimately vest.
The following table summarizes restricted stock activity for the respective grant year ended December 31, 2014 , December 31, 2013 and December 31, 2012 :
| 2014 |
| 2013 |
| 2012 | |||||||||||||||
| Shares |
| Weighted Average Grant Date Fair Value |
| Shares |
| Weighted Average Grant Date Fair Value |
| Shares |
| Weighted Average Grant Date Fair Value | |||||||||
Nonvested restricted stock grants outstanding as of beginning of period | 1,242,924 | |
| $ | 13.99 | |
| 1,426,338 | |
| $ | 14.07 | |
| 1,716,932 | |
| $ | 14.19 | |
Granted | 34,100 | |
| 20.04 | |
| 37,352 | |
| 19.97 | |
| 37,731 | |
| 14.89 | | |||
Vested | (1,154,894 | ) |
| 14.08 | |
| (164,970 | ) |
| 15.69 | |
| (205,142 | ) |
| 14.73 | | |||
Canceled | (17,988 | ) |
| 14.73 | |
| (55,796 | ) |
| 15.15 | |
| (123,183 | ) |
| 14.89 | | |||
Nonvested restricted stock grants outstanding as of end of period | 104,142 | |
| $ | 14.79 | |
| 1,242,924 | |
| $ | 13.99 | |
| 1,426,338 | |
| $ | 14.07 | |
The weighted average remaining contractual term of nonvested awards as of December 31, 2014 was one year. The fair value of shares vested during the year was $29.5 million , $3.4 million , and $3.9 million for the year ended December 31, 2014, December 31, 2013, and December 31, 2012, respectively.
Other Required Disclosures
Historical data, such as the past performance of our common stock and the length of service by employees, is used to estimate expected life of the stock options and our restricted stock and represents the period of time the options or grants are expected to be outstanding. The weighted average estimated values of options granted were based on the following assumptions:
F - 38
Table of Contents
GENERAL GROWTH PROPERTIES, INC.
NOTES TO CONSOLIDATED FINANCIAL STATEMENTS (Continued)
(Dollars in thousands, except per share amounts)
| Year Ended December 31, | ||||||
| 2014 |
| 2013 |
| 2012 | ||
Risk-free interest rate(*) | 2.20 | % |
| 1.71 | % |
| No options granted |
Dividend yield(*) | 2.70 | % |
| 2.52 | % |
| No options granted |
Expected volatility | 30.00 | % |
| 32.32 | % |
| No options granted |
Expected life (in years) | 6.25 | |
| 6.5 | |
| No options granted |
_______________________________________________________________________________
(*) | Weighted average |
Compensation expense related to stock-based compensation plans is summarized in the following table:
| Year Ended December 31, | ||||||||||
| 2014 |
| 2013 |
| 2012 | ||||||
Stock options-Property management and other costs | $ | 7,468 | |
| $ | 5,104 | |
| $ | 3,111 | |
Stock options-General and administrative | 15,074 | |
| 9,553 | |
| 6,282 | | |||
Restricted stock-Property management and other costs | 1,683 | |
| 1,504 | |
| 1,553 | | |||
Restricted stock-General and administrative | 1,013 | |
| 6,855 | |
| 7,922 | | |||
Total | $ | 25,238 | |
| $ | 23,016 | |
| $ | 18,868 | |
Unrecognized compensation expense as of December 31, 2014 is as follows:
Year | Amount | ||
2015 | $ | 19,558 | |
2016 | 16,507 | | |
2017 | 13,976 | | |
2018 | 1,731 | | |
| 51,772 | | |
These amounts may be impacted by future grants, changes in forfeiture estimates or vesting terms, and actual forfeiture rates which differ from estimated forfeitures.
NOTE 14 ACCOUNTS AND NOTES RECEIVABLE
The following table summarizes the significant components of Accounts and notes receivable, net.
|
| December 31, 2014 |
| December 31, 2013 | ||||
Trade receivables |
| $ | 124,698 | |
| $ | 123,522 | |
Notes receivable |
| 320,881 | |
| 179,559 | | ||
Straight-line rent receivable |
| 230,172 | |
| 190,332 | | ||
Other accounts receivable |
| 3,638 | |
| 3,378 | | ||
Total Accounts and notes receivable |
| 679,389 | |
| 496,791 | | ||
Provision for doubtful accounts |
| (15,621 | ) |
| (17,892 | ) | ||
Total Accounts and notes receivable, net |
| $ | 663,768 | |
| $ | 478,899 | |
Notes receivable includes $88.5 million and $39.4 million due from an entity who is our partner in the joint ventures related to the acquisition of the properties at 685 and 530 5th Avenue in New York, New York ( Note 3 ). The notes receivable bear interest at a rate of 7.5% and 9% , respectively. Interest is compounded quarterly with accrued but unpaid interest increasing the loan
F - 39
Table of Contents
GENERAL GROWTH PROPERTIES, INC.
NOTES TO CONSOLIDATED FINANCIAL STATEMENTS (Continued)
(Dollars in thousands, except per share amounts)
balance, and are collateralized by our partner's ownership interest in the joint ventures, and mature on June 27, 2024 and October 22, 2024, respectively.
Also included in notes receivable is a $132.4 million note receivable issued to Rique Empreendimentos e Participacoes Ltda. ("Rique") in conjunction with our sale of Aliansce Shopping Centers, S.A. ("Aliansce") to Rique and Canada Pension Plan Investment Board on September 30, 2013. The note receivable is denominated in Brazilian Reais, bears interest at an effective interest rate of approximately 14% , is collateralized by shares of common stock in Aliansce, and requires annual principal and interest payments over the 5 year term. We recognize the impact of changes in the exchange rate on the note receivable as gain or loss on foreign currency in our Consolidated Statements of Operations and Comprehensive Income (Loss).
Within notes receivable is a $32.2 million note receivable from our joint venture partner related to the acquisition of a portfolio of two properties in the Union Square area of San Francisco in September 2013. The note receivable bears interest at an interest rate of 5.21% and is collateralized by our partner's ownership interest in the joint venture. The note receivable matures on September 16, 2023.
NOTE 15 PREPAID EXPENSES AND OTHER ASSETS
The following table summarizes the significant components of prepaid expenses and other assets.
| December 31, 2014 |
| December 31, 2013 | ||||||||||||||||||||
| Gross Asset |
| Accumulated Amortization |
| Balance |
| Gross Asset |
| Accumulated Amortization |
| Balance | ||||||||||||
Intangible assets: |
| |
|
| |
|
| |
|
| |
|
| |
|
| | ||||||
Above-market tenant leases, net | $ | 870,103 | |
| $ | (498,016 | ) |
| $ | 372,087 | |
| $ | 1,022,398 | |
| $ | (478,998 | ) |
| $ | 543,400 | |
Below-market ground leases, net | 119,866 | |
| (8,906 | ) |
| 110,960 | |
| 164,017 | |
| (13,597 | ) |
| 150,420 | | ||||||
Real estate tax stabilization agreement, net | 111,506 | |
| (26,146 | ) |
| 85,360 | |
| 111,506 | |
| (19,834 | ) |
| 91,672 | | ||||||
Total intangible assets | $ | 1,101,475 | |
| $ | (533,068 | ) |
| $ | 568,407 | |
| $ | 1,297,921 | |
| $ | (512,429 | ) |
| $ | 785,492 | |
Remaining Prepaid expenses and other assets: |
| |
|
| |
|
| |
|
| |
|
| |
|
| | ||||||
Security and escrow deposits |
| |
|
| |
| 93,676 | |
|
| |
|
| |
| 145,999 | | ||||||
Prepaid expenses |
| |
|
| |
| 76,306 | |
|
| |
|
| |
| 23,283 | | ||||||
Other non-tenant receivables |
| |
|
| |
| 28,712 | |
|
| |
|
| |
| 25,988 | | ||||||
Deferred tax, net of valuation allowances |
| |
|
| |
| 4,220 | |
|
| |
|
| |
| 906 | | ||||||
Other |
| |
|
| |
| 42,456 | |
|
| |
|
| |
| 13,901 | | ||||||
Total remaining Prepaid expenses and other assets |
| |
|
| |
| 245,370 | |
|
| |
|
| |
| 210,077 | | ||||||
Total Prepaid expenses and other assets |
| |
|
| |
| $ | 813,777 | |
|
| |
|
| |
| $ | 995,569 | | ||||
F - 40
Table of Contents
GENERAL GROWTH PROPERTIES, INC.
NOTES TO CONSOLIDATED FINANCIAL STATEMENTS (Continued)
(Dollars in thousands, except per share amounts)
NOTE 16 ACCOUNTS PAYABLE AND ACCRUED EXPENSES
The following table summarizes the significant components of accounts payable and accrued expenses.
| December 31, 2014 |
| December 31, 2013 | ||||||||||||||||||||
| Gross Liability |
| Accumulated Accretion |
| Balance |
| Gross Liability |
| Accumulated Accretion |
| Balance | ||||||||||||
Intangible liabilities: |
| |
|
| |
|
| |
|
| |
|
| |
|
| | ||||||
Below-market tenant leases, net | $ | 502,919 | |
| $ | (259,390 | ) |
| $ | 243,529 | |
| $ | 622,710 | |
| $ | (271,215 | ) |
| $ | 351,495 | |
Above-market headquarters office leases, net | 15,268 | |
| (6,867 | ) |
| 8,401 | |
| 15,268 | |
| (5,130 | ) |
| 10,138 | | ||||||
Above-market ground leases, net | 9,127 | |
| (1,522 | ) |
| 7,605 | |
| 9,756 | |
| (1,181 | ) |
| 8,575 | | ||||||
Total intangible liabilities | $ | 527,314 | |
| $ | (267,779 | ) |
| $ | 259,535 | |
| $ | 647,734 | |
| $ | (277,526 | ) |
| $ | 370,208 | |
Remaining Accounts payable and accrued expenses: |
| |
|
| |
|
| |
|
| |
|
| |
|
| | ||||||
Accrued interest |
| |
|
| |
| 54,332 | |
|
| |
|
| |
| 58,777 | | ||||||
Accounts payable and accrued expenses |
| |
|
| |
| 82,292 | |
|
| |
|
| |
| 102,246 | | ||||||
Accrued real estate taxes |
| |
|
| |
| 85,910 | |
|
| |
|
| |
| 92,663 | | ||||||
Deferred gains/income |
| |
|
| |
| 114,968 | |
|
| |
|
| |
| 115,354 | | ||||||
Accrued payroll and other employee liabilities |
| |
|
| |
| 55,059 | |
|
| |
|
| |
| 34,006 | | ||||||
Construction payable |
| |
|
| |
| 198,471 | |
|
| |
|
| |
| 103,988 | | ||||||
Tenant and other deposits |
| |
|
| |
| 21,423 | |
|
| |
|
| |
| 21,434 | | ||||||
Insurance reserve liability |
| |
|
| |
| 16,509 | |
|
| |
|
| |
| 16,643 | | ||||||
Capital lease obligations |
| |
|
| |
| 12,066 | |
|
| |
|
| |
| 12,703 | | ||||||
Conditional asset retirement obligation liability |
| |
|
| |
| 10,135 | |
|
| |
|
| |
| 10,424 | | ||||||
Uncertain tax position liability |
| |
|
| |
| 6,663 | |
|
| |
|
| |
| 5,536 | | ||||||
Other |
| |
|
| |
| 17,534 | |
|
| |
|
| |
| 27,013 | | ||||||
Total remaining Accounts payable and accrued expenses |
| |
|
| |
| 675,362 | |
|
| |
|
| |
| 600,787 | | ||||||
Total Accounts payable and accrued expenses |
| |
|
| |
| $ | 934,897 | |
|
| |
|
| |
| $ | 970,995 | | ||||
F - 41
Table of Contents
GENERAL GROWTH PROPERTIES, INC.
NOTES TO CONSOLIDATED FINANCIAL STATEMENTS (Continued)
(Dollars in thousands, except per share amounts)
NOTE 17 ACCUMULATED OTHER COMPREHENSIVE LOSS
Components of accumulated other comprehensive loss as of December 31, 2014 and 2013 are as follows:
| December 31, 2014 |
| December 31, 2013 | ||||
Net unrealized gains on financial instruments | $ | 70 | |
| $ | 124 | |
Foreign currency translation | (51,823 | ) |
| (38,297 | ) | ||
| $ | (51,753 | ) |
| $ | (38,173 | ) |
NOTE 18 LITIGATION
In the normal course of business, from time to time, we are involved in legal proceedings relating to the ownership and operations of our properties. In management's opinion, the liabilities, if any, that may ultimately result from such legal actions are not expected to have a material effect on our consolidated financial position, results of operations or liquidity.
Urban Litigation
In October 2004, certain limited partners (the "Urban Plaintiffs") of Urban Shopping Centers, L.P. ("Urban") filed a lawsuit against Urban's general partner, Head Acquisition, L.P. ("Head"), as well as The Rouse Company, LP, Simon Property Group, Inc., Westfield America, Inc., and various of their affiliates, including Head's general partners (collectively, the "Urban Defendants"), in Circuit Court in Cook County, Illinois. GGP, GGP Operating Partnership, LP ("GGPOP") and other affiliates were later included as Urban Defendants. The lawsuit alleged, among other things, that the Urban Defendants breached the Urban partnership agreement, unjustly enriched themselves through misappropriation of partnership opportunities, failed to grow the partnership, breached their fiduciary duties, and tortiously interfered with several contractual relationships. The Urban Plaintiffs sought relief in the form of unspecified monetary damages and equitable relief requiring, among other things, the Urban Defendants, including GGP, Inc. and its affiliates, to engage in certain future transactions through Urban. On May 19, 2014 the Company settled the litigation and recorded a loss of $17.9 million , which is included in general and administrative expense in our Consolidated Statements of Operations and Comprehensive Income (Loss). The Company invested $60.0 million in Urban and contributed, at fair value, a 5.6% interest in three assets in exchange for preferred equity interests. The Company has no obligation to engage in future activity through Urban other than transactions associated with currently existing partnership assets.
Default Interest
Pursuant to the Plan, the Company cured and reinstated that certain note (the "Homart Note") in the original principal amount of $254.0 million between GGPLP and The Comptroller of the State of New York as Trustee of the Common Retirement Fund ("CRF") by payment in cash of accrued interest at the contractual non-default rate. CRF, however, contended that the Company's bankruptcy caused the Company to default under the Homart Note and, therefore, post-petition interest accrued under the Homart Note at the contractual default rate was due for the period June 1, 2009 until November 9, 2010. On June 16, 2011, the United States Bankruptcy Court for the Southern District of New York (the "Bankruptcy Court") ruled in favor of CRF, and, on June 22, 2011, the Company elected to satisfy the Homart Note in full by paying CRF the outstanding default interest and principal amount on the Homart Note totaling $246.0 million . As a result of the ruling, the Company incurred and paid $11.7 million of default interest expense during the year ended December 31, 2011. The Company appealed the Bankruptcy Court's order and reserved its right to recover the payment of default interest. On March 13, 2013, the parties reached a settlement. In exchange for the Company's dismissal of its appeal, CRF waived all claims to attorneys' fees.
Pursuant to the Plan, the Company agreed to pay to the holders of claims (the "2006 Lenders") under a revolving and term loan facility (the "2006 Credit Facility") the principal amount of their claims outstanding of approximately $2.6 billion plus post-petition interest at the contractual non-default rate. However, the 2006 Lenders asserted that they were entitled to receive interest at the contractual default rate. In July 2011, the Bankruptcy Court ruled in favor of the 2006 Lenders. The Company had accrued $96.1 million as of December 31, 2012. The Company appealed the Bankruptcy Court ruling, and on March 13, 2013, the parties reached a settlement. In exchange for the Company's dismissal of its appeal, and a payment by the Company of $97.4 million , the 2006 Lenders waived all claim to attorneys' fees.
F - 42
Table of Contents
GENERAL GROWTH PROPERTIES, INC.
NOTES TO CONSOLIDATED FINANCIAL STATEMENTS (Continued)
(Dollars in thousands, except per share amounts)
Tax Indemnification Liability
Pursuant to the Investment Agreements, GGP previously indemnified HHC from and against 93.75% of any and all losses, claims, damages, liabilities and reasonable expenses to which HHC and its subsidiaries become subject, in each case solely to the extent directly attributable to MPC Taxes (as defined in the Investment Agreements) in an amount up to $303.8 million . Under certain circumstances, we agreed to be responsible for interest or penalties attributable to such MPC Taxes in excess of the $303.8 million . The IRS disagreed with the method used to report gains for income tax purposes that are the subject of the MPC taxes. As a result of this disagreement, The Howard Hughes Company, LLC and Howard Hughes Properties, Inc. filed petitions in the United States Tax Court on May 6, 2011, contesting this liability for the 2007 and 2008 years and a trial was held in early November 2012. The United States Tax Court rendered its opinion on June 2, 2014, in favor of the IRS. On September 15, 2014, the United States Tax Court formally entered its decision awarding the IRS $144.1 million in taxes for 2007 and 2008. On December 12, 2014, we reached an agreement with HHC for settlement, which included the transfer of six office properties with a historical cost of $106.8 million and an agreed-upon value of $130.0 million and cash of $138.0 million in full settlement of the $322.0 million tax indemnification liability ( $303.8 million plus applicable interest). As a result of the settlement, GGP recognized a gain on extinguishment of tax indemnification liability of approximately $77.2 million which amount is included in discontinued operations on the Consolidated Statements of Operations and Comprehensive Income (Loss) for the year ended December 31, 2014.
NOTE 19 COMMITMENTS AND CONTINGENCIES
We lease land or buildings at certain properties from third parties. The leases generally provide us with a right of first refusal in the event of a proposed sale of the property by the landlord. Rental payments are expensed as incurred and have, to the extent applicable, been straight-lined over the term of the lease. The following is a summary of our contractual rental expense as presented in our Consolidated Statements of Operations and Comprehensive Income (Loss):
|
| Year Ended December 31, | ||||||||||
|
| 2014 |
| 2013 |
| 2012 | ||||||
Contractual rent expense, including participation rent |
| $ | 13,605 | |
| $ | 13,475 | |
| $ | 13,933 | |
Contractual rent expense, including participation rent and excluding amortization of above and below-market ground leases and straight-line rent |
| 9,036 | |
| 8,670 | |
| 8,906 | | |||
See Note 8 and Note 18 for our obligations related to uncertain tax positions and for disclosure of additional contingencies.
The following table summarizes the contractual maturities of our long-term commitments. Long-term debt and ground leases include the related acquisition accounting fair value adjustments:
| 2015 |
| 2016 |
| 2017 |
| 2018 |
| 2019 |
| Subsequent/ Other |
| Total | ||||||||||||||
Mortgages, notes and loans payable(1) | $ | 650,557 | |
| $ | 692,066 | |
| $ | 877,261 | |
| $ | 1,837,460 | |
| $ | 1,327,020 | |
| $ | 10,613,925 | |
| $ | 15,998,289 | |
Retained debt-principal | 1,530 | |
| 1,601 | |
| 1,705 | |
| 1,801 | |
| 1,902 | |
| 80,734 | |
| 89,273 | | |||||||
Purchase obligations (2) | 203,262 | |
| - | |
| - | |
| - | |
| - | |
| - | |
| 203,262 | | |||||||
Ground lease payments | 4,821 | |
| 4,820 | |
| 4,849 | |
| 4,767 | |
| 4,810 | |
| 162,764 | |
| 186,831 | | |||||||
Junior Subordinated Notes(3) | - | |
| - | |
| - | |
| - | |
| - | |
| 206,200 | |
| 206,200 | | |||||||
Uncertain tax position liability(4) | 6,663 | |
| - | |
| - | |
| - | |
| - | |
| - | |
| 6,663 | | |||||||
Total | $ | 866,833 | |
| $ | 698,487 | |
| $ | 883,815 | |
| $ | 1,844,028 | |
| $ | 1,333,732 | |
| $ | 11,063,623 | |
| $ | 16,690,518 | |
_______________________________________________________________________________
(1) | The $100.0 million outstanding on the revolving credit facility as of December 31, 2014 is included in 2015 . |
(2) | Purchase obligations relate to payables for capital expenditures. |
F - 43
Table of Contents
GENERAL GROWTH PROPERTIES, INC.
NOTES TO CONSOLIDATED FINANCIAL STATEMENTS (Continued)
(Dollars in thousands, except per share amounts)
(3) | The $206.2 million of Junior Subordinated Notes are due in 2036, but may be redeemed any time after April 30, 2011. As we do not expect to redeem the notes prior to maturity, they are included in the consolidated debt maturing subsequent to 2019 . |
(4) | We believe that it is reasonably possible that all of our currently remaining unrecognized tax benefits may be recognized by the end of 2015 upon the potential settlement of an audit and the expiration of the statute of limitations. |
NOTE 20 SUBSEQUENT EVENTS
We formed a partnership to own and operate Ala Moana Center located in Honolulu, Hawaii. Effective with the partnership formation, we own a 75% equity interest and the partner owns a 25% equity interest in Ala Moana Center. The transaction generated approximately $907 million of net proceeds, of which we received approximately $670 million of net proceeds at closing on February 27, 2015. The remaining net proceeds of approximately $237 million will be paid in late 2016 upon completion of the redevelopment and expansion. We may sell an additional 12.5% equity interest in Ala Moana Center within the next 60 days on the same economic terms.
NOTE 21 QUARTERLY FINANCIAL INFORMATION (UNAUDITED)
Quarterly data for the year ended December 31, 2014 and 2013 is summarized in the table below. Figures presented below have been adjusted for discontinued operations ( Note 4 ). In Q4 2014, they include the impact of provisions for impairment ( Note 2 ). In Q1 2013, the adjustments include the Warrant liability adjustment ( Note 9 ). In Q4 2014 and Q2 2013 the adjustments include gains from changes in control of investment properties ( Note 3 ) in continuing operations.
| 2014 | ||||||||||||||
| First Quarter |
| Second Quarter |
| Third Quarter |
| Fourth Quarter | ||||||||
Total revenues | $ | 622,884 | |
| $ | 611,894 | |
| $ | 627,759 | |
| $ | 673,022 | |
Operating income | 222,905 | |
| 206,350 | |
| 237,931 | |
| 274,327 | | ||||
Income from continuing operations | 58,915 | |
| 55,237 | |
| 68,577 | |
| 215,282 | | ||||
Income from discontinued operations | 72,972 | |
| 121,853 | |
| 8,822 | |
| 78,236 | | ||||
Net income attributable to common shareholders | 124,052 | |
| 169,740 | |
| 70,624 | |
| 285,498 | | ||||
Basic Earnings Per Share: |
|
|
|
|
|
|
| ||||||||
Continuing operations | 0.06 | |
| 0.06 | |
| 0.07 | |
| 0.23 | | ||||
Discontinued operations | 0.08 | |
| 0.14 | |
| 0.01 | |
| 0.09 | | ||||
Diluted Earnings Per Share: |
|
|
|
|
|
|
| ||||||||
Continuing operations | 0.05 | |
| 0.05 | |
| 0.06 | |
| 0.22 | | ||||
Discontinued operations | 0.08 | |
| 0.13 | |
| 0.01 | |
| 0.08 | | ||||
Dividends declared per share | $ | 0.15 | |
| $ | 0.15 | |
| $ | 0.16 | |
| $ | 0.17 | |
Weighted-average shares outstanding: |
|
|
|
|
|
|
| ||||||||
Basic | 896,257 | |
| 883,763 | |
| 883,898 | |
| 884,370 | | ||||
Diluted | 947,971 | |
| 940,725 | |
| 942,923 | |
| 947,090 | | ||||
F - 44
Table of Contents
GENERAL GROWTH PROPERTIES, INC.
NOTES TO CONSOLIDATED FINANCIAL STATEMENTS (Continued)
(Dollars in thousands, except per share amounts)
| 2013 | ||||||||||||||
| First Quarter |
| Second Quarter |
| Third Quarter |
| Fourth Quarter | ||||||||
Total revenues | $ | 618,774 | |
| $ | 594,006 | |
| $ | 602,572 | |
| $ | 670,665 | |
Operating income | 196,185 | |
| 197,454 | |
| 193,933 | |
| 252,844 | | ||||
Income (loss) from continuing operations | (26,705 | ) |
| 216,477 | |
| 32,855 | |
| 106,194 | | ||||
Income (loss) from discontinued operations | 17,967 | |
| (2,555 | ) |
| (2,001 | ) |
| (25,033 | ) | ||||
Net income (loss) attributable to common shareholders | (13,653 | ) |
| 205,391 | |
| 23,499 | |
| 73,213 | | ||||
Basic Earnings (Loss) Per Share: |
|
|
|
|
|
|
| ||||||||
Continuing operations | (0.03 | ) |
| 0.22 | |
| 0.03 | |
| 0.11 | | ||||
Discontinued operations | 0.02 | |
| - | |
| - | |
| (0.03 | ) | ||||
Diluted Earnings (Loss) Per Share: |
|
|
|
|
|
|
| ||||||||
Continuing operations | (0.03 | ) |
| 0.22 | |
| 0.03 | |
| 0.10 | | ||||
Discontinued operations | 0.02 | |
| - | |
| - | |
| (0.03 | ) | ||||
Dividends declared per share | $ | 0.12 | |
| $ | 0.12 | |
| $ | 0.13 | |
| $ | 0.14 | |
Weighted-average shares outstanding: |
|
|
|
|
|
|
| ||||||||
Basic | 939,271 | |
| 939,434 | |
| 932,964 | |
| 911,185 | | ||||
Diluted | 939,271 | |
| 989,461 | |
| 980,767 | |
| 960,765 | | ||||
_______________________________________________________________________________
F - 45
Table of Contents
GENERAL GROWTH PROPERTIES, INC.
SCHEDULE III-REAL ESTATE AND ACCUMULATED DEPRECIATION
DECEMBER 31, 2014
(Dollars in thousands)
|
|
|
|
|
| Acquisition Cost(b) |
| Costs Capitalized Subsequent to Acquisition |
| Gross Amounts at Which Carried at Close of Period(c) |
|
|
|
|
|
| ||||||||||||||||||||||||||
Name of Center |
| Location |
| Encumbrances(a) |
| Land |
| Buildings and Improvements |
| Land |
| Buildings and Improvements |
| Land |
| Buildings and Improvements |
| Total |
| Accumulated Depreciation(d) |
| Date Acquired |
| Life Upon Which Latest Statement of Operation is Computed | ||||||||||||||||||
Ala Moana Center |
| Honolulu, HI |
| $ | 1,628,907 | |
| $ | 571,836 | |
| 1,738,740 | |
| $ | 954 | |
| $ | 18,610 | |
| $ | 572,790 | |
| $ | 1,757,350 | |
| $ | 2,330,140 | |
| $ | 207,950 | |
| November, 2010 |
| (d) | |
Apache Mall |
| Rochester, MN |
| 96,151 | |
| 17,738 | |
| 116,663 | |
| - | |
| 2,079 | |
| 17,738 | |
| 118,742 | |
| 136,480 | |
| 16,274 | |
| November, 2010 |
| (d) | |||||||||
Augusta Mall |
| Augusta, GA |
| 170,000 | |
| 25,450 | |
| 137,376 | |
| - | |
| 7,988 | |
| 25,450 | |
| 145,364 | |
| 170,814 | |
| 22,604 | |
| November, 2010 |
| (d) | |||||||||
Baybrook Mall |
| Friendswood, TX |
| 260,905 | |
| 76,527 | |
| 288,241 | |
| (1,091 | ) |
| 3,045 | |
| 75,436 | |
| 291,286 | |
| 366,722 | |
| 35,301 | |
| November, 2010 |
| (d) | |||||||||
Beachwood Place |
| Beachwood, OH |
| 212,291 | |
| 59,156 | |
| 196,205 | |
| - | |
| 3,486 | |
| 59,156 | |
| 199,691 | |
| 258,847 | |
| 24,870 | |
| November, 2010 |
| (d) | |||||||||
Bellis Fair |
| Bellingham, WA |
| 89,778 | |
| 14,122 | |
| 102,033 | |
| - | |
| 22,652 | |
| 14,122 | |
| 124,685 | |
| 138,807 | |
| 14,248 | |
| November, 2010 |
| (d) | |||||||||
Boise Towne Square |
| Boise, ID |
| 141,703 | |
| 44,182 | |
| 163,118 | |
| - | |
| 6,921 | |
| 44,182 | |
| 170,039 | |
| 214,221 | |
| 21,920 | |
| November, 2010 |
| (d) | |||||||||
Brass Mill Center |
| Waterbury, CT |
| 98,114 | |
| 31,496 | |
| 99,107 | |
| - | |
| 4,661 | |
| 31,496 | |
| 103,768 | |
| 135,264 | |
| 17,342 | |
| November, 2010 |
| (d) | |||||||||
Coastland Center |
| Naples, FL |
| 125,063 | |
| 24,470 | |
| 166,038 | |
| - | |
| 821 | |
| 24,470 | |
| 166,859 | |
| 191,329 | |
| 21,785 | |
| November, 2010 |
| (d) | |||||||||
Columbia Mall |
| Columbia, MO |
| - | |
| 7,943 | |
| 107,969 | |
| (154 | ) |
| (307 | ) |
| 7,789 | |
| 107,662 | |
| 115,451 | |
| 13,052 | |
| November, 2010 |
| (d) | |||||||||
Columbiana Centre |
| Columbia, SC |
| - | |
| 22,178 | |
| 125,061 | |
| - | |
| (2,675 | ) |
| 22,178 | |
| 122,386 | |
| 144,564 | |
| 17,450 | |
| November, 2010 |
| (d) | |||||||||
Coral Ridge Mall |
| Coralville, IA |
| 113,384 | |
| 20,178 | |
| 134,515 | |
| 2,219 | |
| 13,758 | |
| 22,397 | |
| 148,273 | |
| 170,670 | |
| 19,211 | |
| November, 2010 |
| (d) | |||||||||
Coronado Center |
| Albuquerque, NM |
| 197,534 | |
| 28,312 | |
| 153,526 | |
| 4,545 | |
| 39,799 | |
| 32,857 | |
| 193,325 | |
| 226,182 | |
| 23,078 | |
| November, 2010 |
| (d) | |||||||||
Crossroads Center |
| St. Cloud, MN |
| 103,785 | |
| 15,499 | |
| 103,077 | |
| - | |
| 1,464 | |
| 15,499 | |
| 104,541 | |
| 120,040 | |
| 14,001 | |
| November, 2010 |
| (d) | |||||||||
Cumberland Mall |
| Atlanta, GA |
| 160,000 | |
| 36,913 | |
| 138,795 | |
| - | |
| 8,059 | |
| 36,913 | |
| 146,854 | |
| 183,767 | |
| 21,229 | |
| November, 2010 |
| (d) | |||||||||
Deerbrook Mall |
| Humble, TX |
| 145,934 | |
| 36,761 | |
| 133,448 | |
| - | |
| 2,080 | |
| 36,761 | |
| 135,528 | |
| 172,289 | |
| 18,708 | |
| November, 2010 |
| (d) | |||||||||
Eastridge Mall |
| Casper, WY |
| - | |
| 5,484 | |
| 36,756 | |
| - | |
| 7,278 | |
| 5,484 | |
| 44,034 | |
| 49,518 | |
| 7,755 | |
| November, 2010 |
| (d) | |||||||||
Eastridge Mall |
| San Jose, CA |
| 136,203 | |
| 30,368 | |
| 135,317 | |
| (3,127 | ) |
| 3,623 | |
| 27,241 | |
| 138,940 | |
| 166,181 | |
| 22,446 | |
| November, 2010 |
| (d) | |||||||||
Fashion Place |
| Murray, UT |
| 226,730 | |
| 24,068 | |
| 232,456 | |
| 2,079 | |
| 51,224 | |
| 26,147 | |
| 283,680 | |
| 309,827 | |
| 32,440 | |
| November, 2010 |
| (d) | |||||||||
Fashion Show |
| Las Vegas, NV |
| 839,570 | |
| 564,310 | |
| 627,327 | |
| 10,013 | |
| 49,679 | |
| 574,323 | |
| 677,006 | |
| 1,251,329 | |
| 78,182 | |
| November, 2010 |
| (d) | |||||||||
Four Seasons Town Centre |
| Greensboro, NC |
| 83,254 | |
| 17,259 | |
| 126,570 | |
| - | |
| 3,732 | |
| 17,259 | |
| 130,302 | |
| 147,561 | |
| 20,331 | |
| November, 2010 |
| (d) | |||||||||
Fox River Mall |
| Appleton, WI |
| 178,063 | |
| 42,259 | |
| 217,932 | |
| - | |
| 3,051 | |
| 42,259 | |
| 220,983 | |
| 263,242 | |
| 27,405 | |
| November, 2010 |
| (d) | |||||||||
Glenbrook Square |
| Fort Wayne, IN |
| 149,782 | |
| 30,965 | |
| 147,002 | |
| 2,444 | |
| 16,060 | |
| 33,409 | |
| 163,062 | |
| 196,471 | |
| 20,680 | |
| November, 2010 |
| (d) | |||||||||
Governor's Square |
| Tallahassee, FL |
| 71,787 | |
| 18,289 | |
| 123,088 | |
| - | |
| 8,144 | |
| 18,289 | |
| 131,232 | |
| 149,521 | |
| 25,371 | |
| November, 2010 |
| (d) | |||||||||
Grand Teton Mall |
| Idaho Falls, ID |
| - | |
| 13,066 | |
| 59,658 | |
| - | |
| 1,231 | |
| 13,066 | |
| 60,889 | |
| 73,955 | |
| 9,212 | |
| November, 2010 |
| (d) | |||||||||
Greenwood Mall |
| Bowling Green, KY |
| 63,000 | |
| 12,459 | |
| 85,370 | |
| (330 | ) |
| 813 | |
| 12,129 | |
| 86,183 | |
| 98,312 | |
| 13,861 | |
| November, 2010 |
| (d) | |||||||||
Hulen Mall |
| Fort Worth, TX |
| 127,529 | |
| 8,665 | |
| 112,252 | |
| - | |
| 14,722 | |
| 8,665 | |
| 126,974 | |
| 135,639 | |
| 15,833 | |
| November, 2010 |
| (d) | |||||||||
Jordan Creek Town Center |
| West Des Moines, IA |
| 216,782 | |
| 54,663 | |
| 262,608 | |
| (226 | ) |
| 3,905 | |
| 54,437 | |
| 266,513 | |
| 320,950 | |
| 37,590 | |
| November, 2010 |
| (d) | |||||||||
Lakeside Mall |
| Sterling Heights, MI |
| 148,591 | |
| 36,993 | |
| 130,460 | |
| - | |
| 2,835 | |
| 36,993 | |
| 133,295 | |
| 170,288 | |
| 18,213 | |
| November, 2010 |
| (d) | |||||||||
Lynnhaven Mall |
| Virginia Beach, VA |
| 235,000 | |
| 54,628 | |
| 219,013 | |
| (90 | ) |
| 28,869 | |
| 54,538 | |
| 247,882 | |
| 302,420 | |
| 29,958 | |
| November, 2010 |
| (d) | |||||||||
Mall of Louisiana |
| Baton Rouge, LA |
| 216,515 | |
| 88,742 | |
| 319,097 | |
| - | |
| 1,041 | |
| 88,742 | |
| 320,138 | |
| 408,880 | |
| 36,452 | |
| November, 2010 |
| (d) | |||||||||
Mall St. Matthews |
| Louisville, KY |
| 186,662 | |
| 42,014 | |
| 155,809 | |
| (5,981 | ) |
| 9,383 | |
| 36,033 | |
| 165,192 | |
| 201,225 | |
| 20,847 | |
| November, 2010 |
| (d) | |||||||||
Market Place Shopping Center |
| Champaign, IL |
| 113,425 | |
| 21,611 | |
| 111,515 | |
| - | |
| 6,918 | |
| 21,611 | |
| 118,433 | |
| 140,044 | |
| 15,610 | |
| November, 2010 |
| (d) | |||||||||
Mayfair Mall |
| Wauwatosa, WI |
| - | |
| 84,473 | |
| 352,140 | |
| (1,950 | ) |
| 274 | |
| 82,523 | |
| 352,414 | |
| 434,937 | |
| 42,089 | |
| November, 2010 |
| (d) | |||||||||
Meadows Mall |
| Las Vegas, NV |
| 159,032 | |
| 30,275 | |
| 136,846 | |
| - | |
| 391 | |
| 30,275 | |
| 137,237 | |
| 167,512 | |
| 16,837 | |
| November, 2010 |
| (d) | |||||||||
Mondawmin Mall |
| Baltimore, MD |
| - | |
| 19,707 | |
| 63,348 | |
| - | |
| 19,328 | |
| 19,707 | |
| 82,676 | |
| 102,383 | |
| 11,399 | |
| November, 2010 |
| (d) | |||||||||
F - 46
Table of Contents
|
|
|
|
|
| Acquisition Cost(b) |
| Costs Capitalized Subsequent to Acquisition |
| Gross Amounts at Which Carried at Close of Period(c) |
|
|
|
|
|
| ||||||||||||||||||||||||||
Name of Center |
| Location |
| Encumbrances(a) |
| Land |
| Buildings and Improvements |
| Land |
| Buildings and Improvements |
| Land |
| Buildings and Improvements |
| Total |
| Accumulated Depreciation(d) |
| Date Acquired |
| Life Upon Which Latest Statement of Operation is Computed | ||||||||||||||||||
Newgate Mall |
| Ogden, UT |
| 58,000 | |
| 17,856 | |
| 70,318 | |
| - | |
| 8,075 | |
| 17,856 | |
| 78,393 | |
| 96,249 | |
| 16,845 | |
| November, 2010 |
| (d) | |||||||||
North Point Mall |
| Alpharetta, GA |
| 250,000 | |
| 57,900 | |
| 228,517 | |
| - | |
| 9,868 | |
| 57,900 | |
| 238,385 | |
| 296,285 | |
| 35,757 | |
| November, 2010 |
| (d) | |||||||||
North Star Mall |
| San Antonio, TX |
| 325,946 | |
| 91,135 | |
| 392,422 | |
| - | |
| 4,563 | |
| 91,135 | |
| 396,985 | |
| 488,120 | |
| 44,833 | |
| November, 2010 |
| (d) | |||||||||
Northridge Fashion Center |
| Northridge, CA |
| 237,466 | |
| 66,774 | |
| 238,023 | |
| - | |
| 29,729 | |
| 66,774 | |
| 267,752 | |
| 334,526 | |
| 32,401 | |
| November, 2010 |
| (d) | |||||||||
NorthTown Mall |
| Spokane, WA |
| - | |
| 12,310 | |
| 108,857 | |
| - | |
| 151 | |
| 12,310 | |
| 109,008 | |
| 121,318 | |
| 13,335 | |
| November, 2010 |
| (d) | |||||||||
Oak View Mall |
| Omaha, NE |
| 80,440 | |
| 20,390 | |
| 107,216 | |
| - | |
| (15 | ) |
| 20,390 | |
| 107,201 | |
| 127,591 | |
| 12,925 | |
| November, 2010 |
| (d) | |||||||||
Oakwood Center |
| Gretna, LA |
| - | |
| 21,105 | |
| 74,228 | |
| - | |
| 22,463 | |
| 21,105 | |
| 96,691 | |
| 117,796 | |
| 12,144 | |
| November, 2010 |
| (d) | |||||||||
Oakwood Mall |
| Eau Claire, WI |
| - | |
| 13,786 | |
| 92,114 | |
| - | |
| 4,411 | |
| 13,786 | |
| 96,525 | |
| 110,311 | |
| 12,627 | |
| November, 2010 |
| (d) | |||||||||
Oglethorpe Mall |
| Savannah, GA |
| 150,000 | |
| 27,075 | |
| 157,100 | |
| - | |
| (420 | ) |
| 27,075 | |
| 156,680 | |
| 183,755 | |
| 19,720 | |
| November, 2010 |
| (d) | |||||||||
Oxmoor Center |
| Louisville, KY |
| 90,379 | |
| - | |
| 117,814 | |
| - | |
| 11,024 | |
| - | |
| 128,838 | |
| 128,838 | |
| 15,363 | |
| November, 2010 |
| (d) | |||||||||
Paramus Park |
| Paramus, NJ |
| 91,592 | |
| 31,320 | |
| 102,054 | |
| - | |
| 4,883 | |
| 31,320 | |
| 106,937 | |
| 138,257 | |
| 15,605 | |
| November, 2010 |
| (d) | |||||||||
Park City Center |
| Lancaster, PA |
| 187,362 | |
| 42,451 | |
| 195,409 | |
| - | |
| 2,640 | |
| 42,451 | |
| 198,049 | |
| 240,500 | |
| 23,067 | |
| November, 2010 |
| (d) | |||||||||
Park Place |
| Tucson, AZ |
| 189,665 | |
| 61,907 | |
| 236,019 | |
| - | |
| 2,070 | |
| 61,907 | |
| 238,089 | |
| 299,996 | |
| 27,192 | |
| November, 2010 |
| (d) | |||||||||
Peachtree Mall |
| Columbus, GA |
| 77,889 | |
| 13,855 | |
| 92,143 | |
| - | |
| 2,368 | |
| 13,855 | |
| 94,511 | |
| 108,366 | |
| 14,287 | |
| November, 2010 |
| (d) | |||||||||
Pecanland Mall |
| Monroe, LA |
| 90,000 | |
| 12,943 | |
| 73,231 | |
| - | |
| 6,928 | |
| 12,943 | |
| 80,159 | |
| 93,102 | |
| 11,895 | |
| November, 2010 |
| (d) | |||||||||
Pembroke Lakes Mall |
| Pembroke Pines, FL |
| 260,000 | |
| 64,883 | |
| 254,910 | |
| - | |
| (11,507 | ) |
| 64,883 | |
| 243,403 | |
| 308,286 | |
| 29,783 | |
| November, 2010 |
| (d) | |||||||||
Pioneer Place |
| Portland, OR |
| - | |
| - | |
| 97,096 | |
| - | |
| 14,134 | |
| - | |
| 111,230 | |
| 111,230 | |
| 10,274 | |
| November, 2010 |
| (d) | |||||||||
Prince Kuhio Plaza |
| Hilo, HI |
| 43,930 | |
| - | |
| 52,373 | |
| - | |
| 5,461 | |
| - | |
| 57,834 | |
| 57,834 | |
| 10,592 | |
| November, 2010 |
| (d) | |||||||||
Providence Place |
| Providence, RI |
| 400,416 | |
| - | |
| 400,893 | |
| - | |
| 7,012 | |
| - | |
| 407,905 | |
| 407,905 | |
| 47,171 | |
| November, 2010 |
| (d) | |||||||||
Provo Towne Centre |
| Provo, UT |
| 44,333 | |
| 17,027 | |
| 75,871 | |
| 943 | |
| (9,874 | ) |
| 17,970 | |
| 65,997 | |
| 83,967 | |
| 18,646 | |
| November, 2010 |
| (d) | |||||||||
Quail Springs Mall |
| Oklahoma City, OK |
| 69,461 | |
| 40,523 | |
| 149,571 | |
| - | |
| 5,505 | |
| 40,523 | |
| 155,076 | |
| 195,599 | |
| 11,021 | |
| June, 2013 |
| (d) | |||||||||
Red Cliffs Mall |
| St. George, UT |
| - | |
| 6,811 | |
| 33,930 | |
| - | |
| 1,695 | |
| 6,811 | |
| 35,625 | |
| 42,436 | |
| 7,222 | |
| November, 2010 |
| (d) | |||||||||
Ridgedale Center |
| Minnetonka, MN |
| 150,971 | |
| 39,495 | |
| 151,090 | |
| (4,089 | ) |
| 6,247 | |
| 35,406 | |
| 157,337 | |
| 192,743 | |
| 17,449 | |
| November, 2010 |
| (d) | |||||||||
River Hills Mall |
| Mankato, MN |
| - | |
| 16,207 | |
| 85,608 | |
| - | |
| 1,295 | |
| 16,207 | |
| 86,903 | |
| 103,110 | |
| 11,372 | |
| November, 2010 |
| (d) | |||||||||
Rivertown Crossings |
| Grandville, MI |
| 160,861 | |
| 47,790 | |
| 181,770 | |
| - | |
| 2,563 | |
| 47,790 | |
| 184,333 | |
| 232,123 | |
| 23,104 | |
| November, 2010 |
| (d) | |||||||||
Rogue Valley Mall |
| Medford, OR |
| 55,000 | |
| 9,042 | |
| 61,558 | |
| - | |
| 1,726 | |
| 9,042 | |
| 63,284 | |
| 72,326 | |
| 7,149 | |
| November, 2010 |
| (d) | |||||||||
Sooner Mall |
| Norman, OK |
| - | |
| 9,902 | |
| 69,570 | |
| - | |
| 1,769 | |
| 9,902 | |
| 71,339 | |
| 81,241 | |
| 9,645 | |
| November, 2010 |
| (d) | |||||||||
Spokane Valley Mall |
| Spokane, WA |
| 60,437 | |
| 16,817 | |
| 100,209 | |
| - | |
| (7,417 | ) |
| 16,817 | |
| 92,792 | |
| 109,609 | |
| 14,526 | |
| November, 2010 |
| (d) | |||||||||
Staten Island Mall |
| Staten Island, NY |
| 266,659 | |
| 102,227 | |
| 375,612 | |
| - | |
| (728 | ) |
| 102,227 | |
| 374,884 | |
| 477,111 | |
| 48,221 | |
| November, 2010 |
| (d) | |||||||||
Stonestown Galleria |
| San Francisco, CA |
| 180,000 | |
| 65,962 | |
| 203,043 | |
| (13,161 | ) |
| (3,436 | ) |
| 52,801 | |
| 199,607 | |
| 252,408 | |
| 22,642 | |
| November, 2010 |
| (d) | |||||||||
The Crossroads |
| Portage, MI |
| 98,427 | |
| 20,261 | |
| 95,463 | |
| 1,110 | |
| 1,212 | |
| 21,371 | |
| 96,675 | |
| 118,046 | |
| 11,805 | |
| November, 2010 |
| (d) | |||||||||
The Gallery At Harborplace |
| Baltimore, MD |
| 86,232 | |
| 15,930 | |
| 112,117 | |
| - | |
| 5,839 | |
| 15,930 | |
| 117,956 | |
| 133,886 | |
| 17,753 | |
| November, 2010 |
| (d) | |||||||||
The Maine Mall |
| South Portland, ME |
| 235,000 | |
| 36,205 | |
| 238,067 | |
| - | |
| 9,322 | |
| 36,205 | |
| 247,389 | |
| 283,594 | |
| 29,410 | |
| November, 2010 |
| (d) | |||||||||
The Mall In Columbia |
| Columbia, MD |
| 350,000 | |
| 124,540 | |
| 479,171 | |
| - | |
| 25,204 | |
| 124,540 | |
| 504,375 | |
| 628,915 | |
| 54,442 | |
| November, 2010 |
| (d) | |||||||||
The Oaks Mall |
| Gainesville, FL |
| 134,253 | |
| 21,954 | |
| 173,353 | |
| - | |
| (4,415 | ) |
| 21,954 | |
| 168,938 | |
| 190,892 | |
| 17,806 | |
| April, 2012 |
| (d) | |||||||||
The Parks at Arlington |
| Arlington, TX |
| 258,493 | |
| 19,807 | |
| 299,708 | |
| 49 | |
| 16,704 | |
| 19,856 | |
| 316,412 | |
| 336,268 | |
| 37,660 | |
| November, 2010 |
| (d) | |||||||||
The Shoppes at Buckland Hills |
| Manchester, CT |
| 124,961 | |
| 35,180 | |
| 146,474 | |
| - | |
| 3,460 | |
| 35,180 | |
| 149,934 | |
| 185,114 | |
| 17,628 | |
| November, 2010 |
| (d) | |||||||||
The Shops At Fallen Timbers |
| Maumee, OH |
| - | |
| 3,785 | |
| 31,771 | |
| (535 | ) |
| (1,951 | ) |
| 3,250 | |
| 29,820 | |
| 33,070 | |
| 7,674 | |
| November, 2010 |
| (d) | |||||||||
The Shops At La Cantera |
| San Antonio, TX |
| 158,743 | |
| 80,016 | |
| 350,737 | |
| - | |
| 27,054 | |
| 80,016 | |
| 377,791 | |
| 457,807 | |
| 52,981 | |
| November, 2010 |
| (d) | |||||||||
The Streets At SouthPoint |
| Durham, NC |
| 257,515 | |
| 66,045 | |
| 242,189 | |
| - | |
| 103 | |
| 66,045 | |
| 242,292 | |
| 308,337 | |
| 30,426 | |
| November, 2010 |
| (d) | |||||||||
F - 47
Table of Contents
|
|
|
|
|
| Acquisition Cost(b) |
| Costs Capitalized Subsequent to Acquisition |
| Gross Amounts at Which Carried at Close of Period(c) |
|
|
|
|
|
| ||||||||||||||||||||||||||
Name of Center |
| Location |
| Encumbrances(a) |
| Land |
| Buildings and Improvements |
| Land |
| Buildings and Improvements |
| Land |
| Buildings and Improvements |
| Total |
| Accumulated Depreciation(d) |
| Date Acquired |
| Life Upon Which Latest Statement of Operation is Computed | ||||||||||||||||||
The Woodlands Mall |
| The Woodlands, TX |
| 255,242 | |
| 84,889 | |
| 349,315 | |
| 2,315 | |
| 21,145 | |
| 87,204 | |
| 370,460 | |
| 457,664 | |
| 43,535 | |
| November, 2010 |
| (d) | |||||||||
Town East Mall |
| Mesquite, TX |
| 160,270 | |
| 9,928 | |
| 168,555 | |
| - | |
| 4,744 | |
| 9,928 | |
| 173,299 | |
| 183,227 | |
| 20,553 | |
| November, 2010 |
| (d) | |||||||||
Tucson Mall |
| Tucson, AZ |
| 246,000 | |
| 2,071 | |
| 193,815 | |
| - | |
| 73,919 | |
| 2,071 | |
| 267,734 | |
| 269,805 | |
| 32,277 | |
| November, 2010 |
| (d) | |||||||||
Tysons Galleria |
| McLean, VA |
| 318,100 | |
| 90,317 | |
| 351,005 | |
| - | |
| 5,992 | |
| 90,317 | |
| 356,997 | |
| 447,314 | |
| 37,538 | |
| November, 2010 |
| (d) | |||||||||
Valley Plaza Mall |
| Bakersfield, CA |
| 240,000 | |
| 38,964 | |
| 211,930 | |
| - | |
| 536 | |
| 38,964 | |
| 212,466 | |
| 251,430 | |
| 25,969 | |
| November, 2010 |
| (d) | |||||||||
Visalia Mall |
| Visalia, CA |
| 74,000 | |
| 11,912 | |
| 80,185 | |
| - | |
| 902 | |
| 11,912 | |
| 81,087 | |
| 92,999 | |
| 9,571 | |
| November, 2010 |
| (d) | |||||||||
Westlake Center |
| Seattle, WA |
| 46,611 | |
| 19,055 | |
| 129,295 | |
| (14,819 | ) |
| (79,432 | ) |
| 4,236 | |
| 49,863 | |
| 54,099 | |
| 5,796 | |
| November, 2010 |
| (d) | |||||||||
Westroads Mall |
| Omaha, NE |
| 151,638 | |
| 32,776 | |
| 184,253 | |
| - | |
| 17,156 | |
| 32,776 | |
| 201,409 | |
| 234,185 | |
| 19,372 | |
| April, 2012 |
| (d) | |||||||||
White Marsh Mall |
| Baltimore, MD |
| 190,000 | |
| 43,880 | |
| 177,194 | |
| 4,125 | |
| 6,427 | |
| 48,005 | |
| 183,621 | |
| 231,626 | |
| 22,893 | |
| November, 2010 |
| (d) | |||||||||
Willowbrook |
| Wayne, NJ |
| 360,000 | |
| 110,660 | |
| 419,822 | |
| - | |
| (929 | ) |
| 110,660 | |
| 418,893 | |
| 529,553 | |
| 50,290 | |
| November, 2010 |
| (d) | |||||||||
Woodbridge Center |
| Woodbridge, NJ |
| 250,000 | |
| 67,825 | |
| 242,744 | |
| - | |
| 22,272 | |
| 67,825 | |
| 265,016 | |
| 332,841 | |
| 45,031 | |
| November, 2010 |
| (d) | |||||||||
Office, other and construction in progress (e)(f) |
| 1,992,723 | |
| 112,034 | |
| 472,689 | |
| 50,778 | |
| 802,417 | |
| 162,812 | |
| 1,275,106 | |
| 1,437,918 | |
| 82,088 | |
|
|
|
| |||||||||||
|
|
|
|
|
|
|
|
|
|
|
|
|
|
|
|
|
|
|
|
|
|
|
|
| ||||||||||||||||||
|
| Total |
| $ | 16,204,489 | | | $ | 4,208,586 | | | $ | 17,286,897 | | | $ | 36,021 | | | $ | 1,445,806 | | | $ | 4,244,607 | | | $ | 18,732,703 | | | $ | 22,977,310 | | | $ | 2,280,845 | |
|
|
|
|
F - 48
Table of Contents
GENERAL GROWTH PROPERTIES, INC.
SCHEDULE III-REAL ESTATE AND ACCUMULATED DEPRECIATION (Continued)
DECEMBER 31, 2014
(Dollars in thousands)
_______________________________________________________________________________
(a) | See description of mortgages, notes and other loans payable in Note 7 of Notes to Consolidated Financial Statements. |
(b) | Acquisition for individual properties represents historical cost at the end of the month acquired. |
(c) | The aggregate cost of land, buildings and improvements for federal income tax purposes is approximately $19.8 billion . |
(d) | Depreciation is computed based upon the following estimated useful lives: |
|
| Years |
Buildings and improvements |
| 10 - 45 |
Equipment and fixtures |
| 3 - 20 |
Tenant improvements |
| Shorter of useful life or applicable lease term |
(e) | Office and other retail properties, a s well a s properties, that have been de-leased for redevelopment. |
(f) | Includes $1.4 billion cross-collateralized corporate loan. |
F - 49
Table of Contents
GENERAL GROWTH PROPERTIES, INC.
NOTES TO SCHEDULE III
(Dollars in thousands)
Reconciliation of Real Estate
| 2014 |
| 2013 |
| 2012 | ||||||
(In thousands) |
| |
|
| |
|
| | |||
Balance at beginning of period | $ | 22,998,275 | |
| $ | 23,461,858 | |
| $ | 24,597,501 | |
Additions | 703,227 | |
| 1,049,417 | |
| 1,034,439 | | |||
Impairments | (5,278 | ) |
| (18,361 | ) |
| (131,156 | ) | |||
Dispositions and write-offs | (718,914 | ) |
| (1,494,639 | ) |
| (2,038,926 | ) | |||
Balance at end of period | $ | 22,977,310 | |
| $ | 22,998,275 | |
| $ | 23,461,858 | |
| 2014 |
| 2013 |
| 2012 | ||||||
(In thousands) |
| |
|
| |
|
| | |||
Balance at beginning of period | $ | 1,884,861 | |
| $ | 1,440,301 | |
| $ | 974,185 | |
Depreciation expense | 685,006 | |
| 737,565 | |
| 775,768 | | |||
Dispositions and write-offs | (289,022 | ) |
| (293,005 | ) |
| (309,652 | ) | |||
Balance at end of period | $ | 2,280,845 | |
| $ | 1,884,861 | |
| $ | 1,440,301 | |
F - 50
Table of Contents
EXHIBIT INDEX
|
|
|
| Incorporated by Reference Herein | ||||||||
Exhibit Number |
| Description |
| Form |
| Exhibit |
| Filing Date |
| File No. | ||
2* | |
| Third Amended Plan of Reorganization as filed with the United States Bankruptcy Court for the Southern District of New York on October 21, 2010 |
| 8-K |
| 2.1 | |
| 10/27/2010 |
| 001-11656 |
|
|
|
|
|
|
|
|
|
|
| ||
3.1 | |
| Amended and Restated Certificate of Incorporation of General Growth Properties, Inc., dated November 9, 2010 |
| 8-K |
| 3.1 | |
| 11/12/2010 |
| 001-34948 |
|
|
|
|
|
|
|
|
|
|
| ||
3.2 | |
| Amended and Restated Bylaws of General Growth Properties, Inc., dated November 9, 2010 |
| 8-K |
| 3.2 | |
| 11/12/2010 |
| 001-34948 |
|
|
|
|
|
|
|
|
|
|
| ||
3.3 | |
| Amendment to Amended and Restated Bylaws of General Growth Properties, Inc., dated February 25, 2011 |
| 8-K |
| 3.1 | |
| 3/1/2011 |
| 001-34948 |
|
|
|
|
|
|
|
|
|
|
| ||
3.4 | |
| Certificate of Designations, Preferences and Rights of 6.375% Series A Cumulative Redeemable Preferred Stock filed with the Delaware Secretary of State on February 11, 2013 |
| 8-K |
| 3.2 | |
| 2/13/2013 |
| 001-34948 |
|
|
|
|
|
|
|
|
|
|
| ||
4.1* | |
| Rights Agreement dated July 27, 1993, between the Predecessor and certain other parties named therein |
| 10-K |
| 4.2 | |
| 3/31/2006 |
| 001-11656 |
|
|
|
|
|
|
|
|
|
|
| ||
4.2* | |
| Amendment to Rights Agreement dated as of February 1, 2000, between the Predecessor and certain other parties named therein |
| 8-A12B |
| 4.3 | |
| 3/3/2010 |
| 001-11656 |
|
|
|
|
|
|
|
|
|
|
| ||
4.3* | |
| Redemption Rights Agreement dated October 23, 1997, among the Predecessor, the Operating Partnership and Peter Leibowits |
| 10-K |
| 4.7 | |
| 3/31/2006 |
| 001-11656 |
|
|
|
|
|
|
|
|
|
|
| ||
4.4* | |
| Redemption Rights Agreement dated April 2, 1998, among the Operating Partnership, the Predecessor and Southwest Properties Venture |
| 10-K |
| 4.8 | |
| 3/31/2006 |
| 001-11656 |
|
|
|
|
|
|
|
|
|
|
| ||
4.5* | |
| Redemption Rights Agreement dated July 21, 1998, among the Operating Partnership, the Predecessor, Nashland Associates, and HRE Altamonte, Inc. |
| 10-K |
| 4.9 | |
| 3/31/2006 |
| 001-11656 |
|
|
|
|
|
|
|
|
|
|
| ||
4.6* | |
| Redemption Rights Agreement (Series B Preferred Units) dated July 10, 2002, by and among the Operating Partnership, the Predecessor and the persons listed on the signature pages thereof |
| 10-K |
| 4.12 | |
| 2/27/2008 |
| 001-11656 |
|
|
|
|
|
|
|
|
|
|
| ||
4.7* | |
| Redemption Rights Agreement (Common Units) dated November 27, 2002, by and among the Operating Partnership, the Predecessor and JSG, LLC |
| 10-K |
| 4.13 | |
| 2/27/2009 |
| 001-11656 |
|
|
|
|
|
|
|
|
|
|
| ||
4.8* | |
| Redemption Rights Agreement dated December 11, 2003, by and among the Operating Partnership, the Predecessor and Everitt Enterprises, Inc. |
| 10-K/A |
| 4.14 | |
| 4/30/2010 |
| 001-11656 |
|
|
|
|
|
|
|
|
|
|
| ||
4.9* | |
| Redemption Rights Agreement dated March 5, 2004, by and among the Operating Partnership, the Predecessor and Koury Corporation |
| 10-K |
| 4.15 | |
| 2/27/2008 |
| 001-11656 |
|
|
|
|
|
|
|
|
|
|
| ||
S-1
Table of Contents
|
|
|
| Incorporated by Reference Herein | ||||||||
Exhibit Number |
| Description |
| Form |
| Exhibit |
| Filing Date |
| File No. | ||
4.10* | |
| Registration Rights Agreement dated April 15, 1993, between the Predecessor, Martin Bucksbaum, Matthew Bucksbaum and the other parties named therein |
| 10-K |
| 4.16 | |
| 2/27/2008 |
| 001-11656 |
|
|
|
|
|
|
|
|
|
|
| ||
10.1 | |
| Fourth Amended and Restated Agreement of Limited Partnership of GGP Operating Partnership, LP (f/k/a GGP Limited Partnership dated May 1, 2014 |
| 10-Q |
| 10.2 | |
| 8/6/2014 |
| 001-34948 |
|
|
|
|
|
|
|
|
|
|
| ||
10.2* | |
| Operating Agreement dated November 10, 1999, between the Operating Partnership, NYSCRF, and GGP/Homart II L.L.C. |
| 10-K |
| 10.20 | |
| 3/31/2006 |
| 001-11656 |
|
|
|
|
|
|
|
|
|
|
| ||
10.3* | |
| Amendment to the Operating Agreement of GGP/Homart II L.L.C. dated November 22, 2002 |
| 10-K |
| 10.21 | |
| 3/31/2006 |
| 001-11656 |
|
|
|
|
|
|
|
|
|
|
| ||
10.4* | |
| Letter Amendment to the Operating Agreement of GGP/Homart II L.L.C. dated January 31, 2003 |
| 10-K |
| 10.22 | |
| 3/31/2006 |
| 001-11656 |
|
|
|
|
|
|
|
|
|
|
| ||
10.5* | |
| Second Amendment to the Operating Agreement of GGP/Homart II L.L.C. dated January 31, 2003 |
| 10-K |
| 10.23 | |
| 3/31/2006 |
| 001-11656 |
|
|
|
|
|
|
|
|
|
|
| ||
10.6* | |
| Third Amendment to the Operating Agreement of GGP/Homart II L.L.C. dated February 8, 2008 |
| 10-K |
| 10.25 | |
| 2/27/2008 |
| 001-11656 |
|
|
|
|
|
|
|
|
|
|
| ||
10.07 | |
| Summary of Non-Employee Director Compensation Program Revised November 14, 2014 (filed herewith) |
|
|
|
|
|
|
|
| |
|
|
|
|
|
|
|
|
|
|
| ||
10.08*# | |
| General Growth Properties, Inc. 2010 Equity Incentive Plan adopted October 27, 2010 |
| 8-K |
| 4.1 | |
| 11/1/2010 |
| 001-11656 |
|
|
|
|
|
|
|
|
|
|
| ||
10.09# | |
| First Amendment to General Growth Properties, Inc. 2010 Equity Incentive Plan adopted November 12, 2013 |
| 8-K |
| 10.2 | |
| 11/18/2013 |
| 001-34948 |
|
|
|
|
|
|
|
|
|
|
| ||
10.10# | |
| Form of Nonqualified Stock Option Award Agreement (Groups B and C) pursuant to the 2010 Equity Incentive Plan |
| S-11/A |
| 10.26 | |
| 11/15/2010 |
| 333-16811 |
|
|
|
|
|
|
|
|
|
|
| ||
10.11# | |
| Form of Nonqualified Stock Option Award Agreement (employees) persuant to the 2010 Equity Incentive Plan (filed herewith) |
|
|
|
|
|
|
|
| |
|
|
|
|
|
|
|
|
|
|
| ||
10.12# | |
| Form of Restricted Stock Award Agreement (Groups B and C) pursuant to the 2010 Equity Incentive Plan |
| S-11/A |
| 10.28 | |
| 11/15/2010 |
| 333-16811 |
|
|
|
|
|
|
|
|
|
|
| ||
10.13# | |
| Form of Restricted Stock Award Agreement (employees) pursuant to the 2010 Equity Plan (filed herewith) |
|
|
|
|
|
|
|
| |
|
|
|
|
|
|
|
|
|
|
| ||
10.14# | |
| Form of Appreciation Only LTIP Unit Award Agreement (employees) pursuant to the 2010 Equity Incentive Plan (filed herewith) |
|
|
|
|
|
|
|
| |
|
|
|
|
|
|
|
|
|
|
| ||
10.15# | |
| Form of Full Value LTIP Unit Award Agreement (employees) pursuant to the 2010 Equity Incentive Plan (filed herewith) |
|
|
|
|
|
|
|
| |
|
|
|
|
|
|
|
|
|
|
| ||
S-2
Table of Contents
|
|
|
| Incorporated by Reference Herein | ||||||||
Exhibit Number |
| Description |
| Form |
| Exhibit |
| Filing Date |
| File No. | ||
10.16# | |
| Form of Restricted Stock Award Agreement (new directors) pursuant to the 2010 Equity Plan (filed herewith) |
|
|
|
|
|
|
|
| |
|
|
|
|
|
|
|
|
|
|
| ||
10.17# | |
| Form of Restricted Stock Award Agreement (directors) pursuant to the 2010 Equity Plan (filed herewith) |
|
|
|
|
|
|
|
| |
|
|
|
|
|
|
|
|
|
|
| ||
10.18# | |
| Form of Full Value LTIP Unit Award Agreement (directors) pursuant to the 2010 Equity Incentive Plan (filed herewith) |
|
|
|
|
|
|
|
| |
|
|
|
|
|
|
|
|
|
|
| ||
10.19*# | |
| Nonqualified Stock Option Award Agreement dated October 27, 2010, by and between General Growth Properties, Inc. and Sandeep Mathrani |
| 8-K |
| 10.2 | |
| 11/1/2010 |
| 001-11656 |
|
|
|
|
|
|
|
|
|
|
| ||
10.20# | |
| Restricted Stock Award Agreement between General Growth Properties, Inc. and Sandeep Mathrani, dated November 9, 2010 |
| S-11/A |
| 10.62 | |
| 11/15/2010 |
| 333-16811 |
|
|
|
|
|
|
|
|
|
|
| ||
10.21# | |
| First Amendment dated November 1, 2012 to Restricted Stock Award Agreement between General Growth Properties, Inc. and Sandeep Mathrani, dated November 9, 2010 |
| 10-K |
| 10.34 | |
| 2/28/2013 |
| 001-34948 |
|
|
|
|
|
|
|
|
|
|
| ||
10.22# | |
| Second Amendment dated November 1, 2013 to Restricted Stock Award Agreement between General Growth Properties, Inc. and Sandeep Mathrani, dated November 9, 2010 |
| 10-Q |
| 10.2 | |
| 11/6/2013 |
| 001-34948 |
|
|
|
|
|
|
|
|
|
|
| ||
10.23*# | |
| Employment Agreement, dated October 27, 2010, by and between General Growth Properties, Inc. and Sandeep Mathrani |
| 8-K |
| 10.1 | |
| 11/1/2010 |
| 001-11656 |
|
|
|
|
|
|
|
|
|
|
| ||
10.24# | |
| Employment Agreement, dated February 12, 2015, by and between the Company and Sandeep Mathrani |
| 8-K |
| 10.1 | |
| 2/17/2015 |
| 001-34948 |
|
|
|
|
|
|
|
|
|
|
| ||
10.25# | |
| Full Value LTIP Award, dated February 12, 2015, by and between the Company and Sandeep Mathrani |
| 8-K |
| 10.2 | |
| 2/17/2015 |
| 001-34948 |
|
|
|
|
|
|
|
|
|
|
| ||
10.26 | |
| Amended and Restated Cornerstone Investment Agreement, effective as of March 31, 2010, between REP Investments LLC (as predecessor to Brookfield Retail Holdings LLC), an affiliate of Brookfield Asset Management Inc. and the Predecessor |
| 8-K |
| 10.1 | |
| 11/12/2010 |
| 001-34948 |
|
|
|
|
|
|
|
|
|
|
| ||
10.27 | |
| Registration Rights Agreement between affiliates of Brookfield Asset Management, Inc. and General Growth Properties, Inc., dated November 9, 2010 |
| 8-K |
| 10.7 | |
| 11/12/2010 |
| 001-34948 |
|
|
|
|
|
|
|
|
|
|
| ||
10.28 | |
| Amended and Restated Warrant Agreement between General Growth Properties, Inc. and American Stock Transfer & Trust Company, LLC, relating to the warrants issued to affiliates of Brookfield Asset Management, Inc., The Fairholme Fund, Fairholme Focused Income Fund, Pershing Square, L.P., Pershing Square II, L.P., Pershing Square International, Ltd., Pershing Square International V, Ltd. and Blackstone Real Estate Partners VI L.P. and its permitted assigns, October 282013 |
| 10-Q |
| 10.1 | |
| 11/6/2013 |
| 001-34948 |
|
|
|
|
|
|
|
|
|
|
| ||
S-3
Table of Contents
|
|
|
| Incorporated by Reference Herein | ||||||||
Exhibit Number |
| Description |
| Form |
| Exhibit |
| Filing Date |
| File No. | ||
10.29 | |
| Relationship Agreement between Brookfield Retail Holdings LLC, Brookfield Retail Holdings II LLC, Brookfield Retail Holdings III LLC, Brookfield Retail Holdings IV-A LLC, Brookfield Retail Holdings IV-B LLC, Brookfield Retail Holdings IV-C LLC, Brookfield Retail Holdings IV-D LLC and Brookfield Retail Holdings V LP and General Growth Properties, Inc., dated November 9, 2010 |
| 10-K |
| 10.51 | |
| 3/8/2011 |
| 001-34948 |
|
|
|
|
|
|
|
|
|
|
| ||
10.30 | |
| Amending Agreement to Relationship Agreement between Brookfield Asset Management Inc. and General Growth Properties, Inc., dated January 12, 2012 |
| 10-K |
| 10.48 | |
| 2/28/2013 |
| 001-34948 |
|
|
|
|
|
|
|
|
|
|
| ||
10.31 | |
| Form of indemnification agreement for directors and executive officers |
| S-11/A |
| 10.53 | |
| 11/3/2010 |
| 333-16811 |
|
|
|
|
|
|
|
|
|
|
| ||
10.32 | |
| Standstill Agreement between Brookfield Retail Holdings LLC, Brookfield Retail Holdings II LLC, Brookfield Retail Holdings III LLC, Brookfield Retail Holdings IV-A LLC, Brookfield Retail Holdings IV-B LLC, Brookfield Retail Holdings IV-C LLC, Brookfield Retail Holdings IV-D LLC and Brookfield Retail Holdings V LP and General Growth Properties, Inc., dated November 9, 2010 |
| 8-K |
| 10.4 | |
| 11/12/2010 |
| 001-34948 |
|
|
|
|
|
|
|
|
|
|
| ||
10.33 | |
| Third Amended and Restated Credit Agreement, dated as of October 23, 2013, by and among, GGP Limited Partnership, General Growth Properties, Inc., GGPLP Real Estate 2010 Loan Pledgor Holding, LLC, GGPLPLLC 2010 Loan Pledgor Holding, LLC, GGPLP L.L.C. and GGPLP 2010 Loan Pledgor Holding, LLC, as Borrowers, the other Loan Parties party thereto from time to time, each of the financial institutions initially a signatory thereto together with their successors and assignees in accordance with Section 12.06 thereof, as Lenders, and Wells Fargo Bank, National Association, as Administrative Agent, Swingline Lender and as an Issuing Bank |
| 8-K |
| 10.1 | |
| 10/28/2013 |
| 001-34948 |
|
|
|
|
|
|
|
|
|
|
| ||
10.34 | |
| Amendment dated April 30, 2014 to the Third Amended and Restated Credit Agreement, dated October 23, 2013 |
| 10-Q |
| 10.4 | |
| 8/6/2014 |
| 001-34948 |
|
|
|
|
|
|
|
|
|
|
| ||
10.35 | |
| Loan Agreement, dated as of April 26, 2013, by and among General Growth Properties, Inc., the Guarantors party thereto, the Lenders party thereto, RBC Capital Markets and U.S. Bank National Association, as Joint Lead Arrangers and Bookrunners, U.S. Bank National Association, as Administrative Agent, and other Lenders party thereto |
| 8-K |
| 99.1 | |
| 5/2/2013 |
| 001-34948 |
|
|
|
|
|
|
|
|
|
|
| ||
10.36 | |
| First Amendment dated July 23, 2013 to the Loan Agreement dated April 26, 2013 (filed herewith) |
|
|
|
|
|
|
|
| |
|
|
|
|
|
|
|
|
|
|
| ||
10.37 | |
| Second Amendment dated August 1, 2014 to the Loan Agreement dated April 26, 2013 |
| 10-Q |
| 10.5 | |
| 8/6/2014 |
| 001-34948 |
|
|
|
|
|
|
|
|
|
|
| ||
10.38 | |
| Stock Purchase Agreement, dated as of September 12, 2013, by and among General Growth Properties, Inc., GGP Limited Partnership, Pershing Square, L.P., Pershing Square II, L.P., PSRH, Inc. and Pershing Square Holdings, Ltd. |
| 8-K |
| 10.3 | |
| 11/18/2013 |
| 001-34948 |
|
|
|
|
|
|
|
|
|
|
| ||
10.39 | |
| Stock Purchase Agreement, dated as of February 10, 2014, by and among General Growth Properties, Inc., GGP Limited Partnership, Pershing Square, L.P., Pershing Square II, L.P., PSRH, Inc. and Pershing Square Holdings, Ltd. |
| 8/K |
| 10.1 | |
| 2/10/2014 |
| 001-34948 |
|
|
|
|
|
|
|
|
|
|
| ||
10.40# | |
| Second Amended and Restated Employee Stock Purchase Plan effective May 15, 2014 |
| 10-Q |
| 10.3 | |
| 8/6/2014 |
| 001-34948 |
S-4
Table of Contents
|
|
|
| Incorporated by Reference Herein | ||||||||
Exhibit Number |
| Description |
| Form |
| Exhibit |
| Filing Date |
| File No. | ||
|
|
|
|
|
|
|
|
|
|
| ||
21.1 | |
| List of Subsidiaries of General Growth Properties, Inc. (filed herewith). |
|
|
|
| |
|
|
|
|
|
|
|
|
|
|
|
|
|
|
| ||
23.1 | |
| Consent of Deloitte & Touche LLP, Independent Registered Public Accounting Firm, relating to General Growth Properties, Inc. (filed herewith). |
|
|
|
|
|
|
|
| |
|
|
|
|
|
|
|
|
|
|
| ||
23.2 | |
| Consent of KPMG LLP, Independent Registered Public Accounting Firm, relating to GGP/Homart II L.L.C. (filed herewith). |
|
|
|
|
|
|
|
| |
|
|
|
|
|
|
|
|
|
|
| ||
23.3 | |
| Consent of KPMG LLP, Independent Registered Public Accounting Firm, relating to GGP-TRS L.L.C. (filed herewith). |
|
|
|
|
|
|
|
| |
|
|
|
|
|
|
|
|
|
|
| ||
24.1 | |
| Power of Attorney (included on signature page). |
|
|
|
|
|
|
|
| |
|
|
|
|
|
|
|
|
|
|
| ||
31.1 | |
| Certification of Chief Executive Officer Pursuant to Section 302 of the Sarbanes-Oxley Act of 2002 (filed herewith). |
|
|
|
|
|
|
|
| |
|
|
|
|
|
|
|
|
|
|
| ||
31.2 | |
| Certification of Chief Financial Officer Pursuant to Section 302 of the Sarbanes-Oxley Act of 2002 (filed herewith). |
|
|
|
|
|
|
|
| |
|
|
|
|
|
|
|
|
|
|
| ||
32.1 | |
| Certification of Chief Executive Officer Pursuant to Section 906 of the Sarbanes-Oxley Act of 2002 (filed herewith). |
|
|
|
|
|
|
|
| |
|
|
|
|
|
|
|
|
|
|
| ||
32.2 | |
| Certification of Chief Financial Officer Pursuant to Section 906 of the Sarbanes-Oxley Act of 2002 (filed herewith). |
|
|
|
|
|
|
|
| |
|
|
|
|
|
|
|
|
|
|
| ||
101 | |
| The following financial information from General Growth Properties, Inc.'s. Annual Report on Form 10-K for the year ended December 31, 2014, filed with the SEC on March 2, 2015, formatted in XBRL (Extensible Business Reporting Language): (1) Consolidated Balance Sheets, (2) Consolidated Statement of Operations and Comprehensive Income (Loss), (3) Consolidated Statements of Equity, (4) Conso1idated Statements of Cash Flows and (5) Notes to Consolidated Financial Statements. |
|
|
|
|
|
|
|
| |
_______________________________________________________________________________
* | Incorporated by reference to filings by GGP, Inc. (formerly General Growth Properties, Inc. and referred to as "the Predecessor") |
# | Management contracts and compensatory plans or arrangements required to be filed as an exhibit pursuant to Item 15(b) of Form 10-K. |
S-5