UNITED STATES
SECURITIES AND EXCHANGE COMMISSION
WASHINGTON, D.C. 20549
FORM 10-K
| x | ANNUAL REPORT PURSUANT TO SECTION 13 OR 15(d) OF THE SECURITIES EXCHANGE ACT OF 1934 |
For the fiscal year ended October 31, 2015
or
| ¨ | TRANSITION REPORT PURSUANT TO SECTION 13 OR 15(d) OF THE SECURITIES EXCHANGE ACT OF 1934 |
For the transition period from to
Commission file number: 001-00566

(Exact name of Registrant as specified in its charter)
| State of Delaware | 31-4388903 | |
(State or other jurisdiction of incorporation or organization) | (I.R.S. Employer Identification No.) | |
| 425 Winter Road, Delaware, Ohio | 43015 | |
| (Address of principal executive offices) | (Zip Code) | |
Registrant's telephone number, including area code 740-549-6000
Securities registered pursuant to Section 12(b) of the Act:
Title of Each Class | Name of Each Exchange on Which Registered | |
| Class A Common Stock | New York Stock Exchange | |
| Class B Common Stock | New York Stock Exchange |
Securities registered pursuant to Section 12(g) of the Act: None
Indicate by check mark if the Registrant is a well-known seasoned issuer, as defined in Rule 405 of the Securities Act. Yes x No ¨
Indicate by check mark if the Registrant is not required to file reports pursuant to Section 13 or Section 15(d) of the Exchange Act. Yes ¨ No x
Indicate by check mark whether the Registrant (1) has filed all reports to be filed by Section 13 or 15(d) of the Securities Exchange Act of 1934 during the preceding 12 months (or for such shorter period that the Registrant was required to file such reports) and (2) has been subject to such filing requirements for the past 90 days. Yes x No ¨
Indicate by check mark whether the Registrant has submitted electronically and posted on its corporate Web site, if any, every Interactive Data File required to be submitted and posted pursuant to Rule 405 of Regulation S-T during the preceding 12 months (or for such shorter period that the Registrant was required to submit and post such files). Yes x No ¨
Indicate by check mark if disclosure of delinquent filers pursuant to Item 405 of Regulation S-K is not contained herein, and will not be contained, to the best of the Registrant's knowledge, in the definitive proxy or information statements incorporated by reference in Part III of this Form 10-K or any amendment to this Form 10-K. ¨
Indicate by check mark whether the Registrant is a large accelerated filer, an accelerated filer, a non-accelerated filer, or a smaller reporting company. See the definition of "large accelerated filer," "accelerated filer" and "smaller reporting company" in Rule 12b-2 of the Exchange Act.
| Large accelerated filer | x | Accelerated filer | ¨ | |||
| Non-accelerated filer | ¨ (Do not check if a smaller reporting company) | Smaller reporting company | ¨ | |||
Indicate by check mark whether the Registrant is a shell company (as defined in Rule 12b-2 of the Exchange). Yes ¨ No x
The aggregate market value of voting and non-voting common equity held by non-affiliates computed by reference to the price at which the common equity was last sold as of the last business day of the Registrant's most recently completed second fiscal quarter was as follows:
Non-voting common equity (Class A Common Stock) – $998,275,979
Voting common equity (Class B Common Stock) – $262,993,353
The number of shares outstanding of each of the Registrant's classes of common stock, as of December 16, 2015, was as follows:
Class A Common Stock – 25,693,564
Class B Common Stock – 22,119,966
Listed hereunder are the documents, portions of which are incorporated by reference, and the parts of this Form 10-K into which such portions are incorporated:
1. The Registrant's Definitive Proxy Statement for use in connection with the Annual Meeting of Stockholders to be held on March 1, 2016 (the "2016 Proxy Statement"), portions of which are incorporated by reference into Parts II and III of this Form 10-K. The 2016 Proxy Statement will be filed within 120 days of October 31, 2015.
IMPORTANT INFORMATION REGARDING FORWARD-LOOKING STATEMENTS
All statements, other than statements of historical facts, included in this Annual Report on Form 10-K of Greif, Inc. and subsidiaries (this "Form 10-K") or incorporated herein, including, without limitation, statements regarding our future financial position, business strategy, budgets, projected costs, goals and plans and objectives of management for future operations and initiatives, are forward-looking statements within the meaning of Section 21E of the Securities Exchange Act of 1934, as amended (the "Exchange Act"). Forward-looking statements generally can be identified by the use of forward-looking terminology such as "may," "will," "expect," "intend," "estimate," "anticipate," "project," "believe," "continue," "on track" or "target" or the negative thereof or variations thereon or similar terminology. All forward-looking statements made in this Form 10-K are based on information currently available to our management. Forward-looking statements speak only as of the date the statements were made. Although we believe that the expectations reflected in forward-looking statements have a reasonable basis, we can give no assurance that these expectations will prove to be correct. Forward-looking statements are subject to risks and uncertainties that could cause actual events or results to differ materially from those expressed in or implied by the statements. For a discussion of the most significant risks and uncertainties that could cause our actual results to differ materially from those projected, see "Risk Factors" in Item 1A of this Form 10-K. The risks described in this Form 10-K are not all inclusive, and given these and other possible risks and uncertainties, investors should not place undue reliance on forward-looking statements as a prediction of actual results. All forward-looking statements made in this Form 10-K are expressly qualified in their entirety by reference to such risk factors. Except to the limited extent required by applicable law, we undertake no obligation to update or revise any forward-looking statements, whether as a result of new information, future events or otherwise.
1
Index to Form 10-K Annual Report for the Year ended October 31, 2015
Form 10-K Item | Description | Page | ||||||
Part I | 1. | Business | 3 | |||||
(a) General Development of Business | 3 | |||||||
(b) Financial Information about Segments | 3 | |||||||
(c) Narrative Description of Business | 3 | |||||||
(d) Financial Information about Geographic Areas | 5 | |||||||
(e) Available Information | 5 | |||||||
(f) Other Matters | 5 | |||||||
| 1A. | Risk Factors | 5 | ||||||
| 1B. | Unresolved Staff Comments | 12 | ||||||
| 2. | Properties | 13 | ||||||
| 3. | Legal Proceedings | 16 | ||||||
| 4. | Mine Safety Disclosures | 16 | ||||||
Part II | 5. | Market for the Registrant's Common Equity, Related Stockholder Matters and Issuer Purchases of Equity Securities | 17 | |||||
| 6. | Selected Financial Data | 19 | ||||||
| 7. | Management's Discussion and Analysis of Financial Condition and Results of Operations | 20 | ||||||
| 7A. | Quantitative and Qualitative Disclosures about Market Risk | 41 | ||||||
| 8. | Financial Statements and Supplementary Data | 44 | ||||||
Consolidated Statements of Income and Consolidated Statements of Comprehensive Income | 44 | |||||||
Consolidated Balance Sheets | 45 | |||||||
Consolidated Statements of Cash Flows | 47 | |||||||
Consolidated Statements of Changes in Shareholders' Equity | 48 | |||||||
Note 1 – Basis of Presentation and Summary of Significant Accounting Policies | 49 | |||||||
Note 2 – Acquisitions and Divestitures | 57 | |||||||
Note 3 – Sale of Non-United States Accounts Receivable | 58 | |||||||
Note 4 – Inventories | 59 | |||||||
Note 5 – Assets and Liabilities Held for Sale and Disposals of Property, Plant, and Equipment, Net | 59 | |||||||
Note 6 – Goodwill and Other Intangible Assets | 60 | |||||||
Note 7 – Restructuring Charges | 61 | |||||||
Note 8 – Consolidation of Variable Interest Entities | 62 | |||||||
Note 9 – Long-Term Debt | 64 | |||||||
Note 10 – Financial Instruments and Fair Value Measurements | 66 | |||||||
Note 11 – Stock-Based Compensation | 68 | |||||||
Note 12 – Income Taxes | 69 | |||||||
Note 13 – Post Retirement Benefit Plans | 72 | |||||||
Note 14 – Contingent Liabilities and Environmental Reserves | 79 | |||||||
Note 15 – Earnings Per Share | 80 | |||||||
Note 16 – Equity Earnings of Unconsolidated Affiliates, Net of Tax and Net Income Attributable to Noncontrolling Interests | 82 | |||||||
Note 17 – Leases | 82 | |||||||
Note 18 – Business Segment Information | 82 | |||||||
Note 19 – Comprehensive Income | 85 | |||||||
Note 20 – Quarterly Financial Data (Unaudited) | 85 | |||||||
Reports of Independent Registered Public Accounting Firms | 87 | |||||||
| 9. | Changes in and Disagreements with Accountants on Accounting and Financial Disclosures | 89 | ||||||
| 9A. | Controls and Procedures | 89 | ||||||
Report of Independent Registered Public Accounting Firm | 91 | |||||||
| 9B. | Other Information | 92 | ||||||
Part III | 10. | Directors, Executive Officers and Corporate Governance | 92 | |||||
| 11. | Executive Compensation | 92 | ||||||
| 12. | Security Ownership of Certain Beneficial Owners and Management and Related Stockholder Matters | 92 | ||||||
| 13. | Certain Relationships and Related Transactions, and Director Independence | 92 | ||||||
| 14. | Principal Accountant Fees and Services | 92 | ||||||
Part IV | 15. | Exhibits and Financial Statement Schedules | 93 | |||||
Signatures | 101 | |||||||
Schedules | Schedule II | 102 | ||||||
Exhibits | Exhibits and Certifications | |||||||
2
PART I
ITEM 1. BUSINESS
(a) General Development of Business
We are a leading global producer of industrial packaging products and services with manufacturing facilities located in over 50 countries. We offer a comprehensive line of rigid industrial packaging products, such as steel, fibre and plastic drums, rigid intermediate bulk containers, closure systems for industrial packaging products, transit protection products, water bottles and remanufactured and reconditioned industrial containers, and services, such as container life cycle management, blending, filling, logistics, warehousing and other packaging services. We also produce containerboard and corrugated products for niche markets in North America. We are also a leading global producer of flexible intermediate bulk containers. We sell timber to third parties from our timberland in the southeastern United States that we manage to maximize long-term value. In addition, we sell, from time to time, timberland and special use land, which consists of surplus land, higher and better use ("HBU") land, and development land. Our customers range from Fortune 500 companies to medium and small-sized companies in a cross section of industries.
We were founded in 1877 in Cleveland, Ohio, as "Vanderwyst and Greif," a cooperage shop co-founded by one of four Greif brothers. One year after our founding, the other three Greif brothers were invited to join the business, renamed Greif Bros. Company, making wooden barrels, casks and kegs to transport post-Civil War goods nationally and internationally. We later purchased nearly 300,000 acres of timberland to provide raw materials for our cooperage plants. We still own significant timber properties located in the southeastern United States. In 1926, we incorporated as a Delaware corporation and made a public offering as The Greif Bros. Cooperage Corporation. In 1951, we moved our headquarters from Cleveland, Ohio to Delaware, Ohio, which is in the Columbus metro-area, where our corporate headquarters are currently located. Since the latter half of the 1900s, we have transitioned from our keg and barrel heading mills, stave mills and cooperage facilities to a global producer of industrial packaging products. Following our acquisition of Van Leer Packaging in 2001, a global steel and plastic drum manufacturer, we changed our name to Greif, Inc.
Our fiscal year begins on November 1 and ends on October 31 of the following year. Any references in this Form 10-K to the years 2015, 2014 or 2013, or to any quarter of those years, relate to the fiscal year ended in that year.
As used in this Form 10-K, the terms "Greif," "the Company," "we," "us," and "our" refer to Greif, Inc. and its subsidiaries.
(b) Financial Information about Segments
We operate in five business segments, which are aggregated into four reportable business segments: Rigid Industrial Packaging & Services; Paper Packaging; Flexible Products & Services; and Land Management. Information related to each of these segments is included in Note 18 to the Notes to Consolidated Financial Statements included in Item 8 of this Form 10-K.
(c) Narrative Description of Business
Products and Services
In the Rigid Industrial Packaging & Services segment, we are a leading global producer of rigid industrial packaging products, including steel, fibre and plastic drums, rigid intermediate bulk containers, closure systems for industrial packaging products, transit protection products, water bottles and remanufactured and reconditioned industrial containers, and services, such as container life cycle management, blending, filling, logistics, warehousing and other packaging services. We sell our rigid industrial packaging products to customers in industries such as chemicals, paints and pigments, food and beverage, petroleum, industrial coatings, agricultural, pharmaceutical and mineral products, among others.
In the Paper Packaging segment, we sell containerboard, corrugated sheets, corrugated containers and other corrugated products to customers in North America in industries such as packaging, automotive, food and building products. Our corrugated container products are used to ship such diverse products as home appliances, small machinery, grocery products, automotive components, books and furniture, as well as numerous other applications.
In the Flexible Products & Services segment, we are a leading global producer of flexible intermediate bulk containers and related services. Our flexible intermediate bulk containers consist of a polypropylene-based woven fabric that is produced at our production sites, as well as sourced from strategic regional suppliers. Our flexible products are sold globally and service customers and market segments similar to those of our Rigid Industrial Packaging & Services segment. Additionally, our flexible products significantly expand our presence in the agricultural and food industries, among others.
3
In the Land Management segment, we are focused on the active harvesting and regeneration of our United States timber properties to achieve sustainable long-term yields. While timber sales are subject to fluctuations, we seek to maintain a consistent cutting schedule, within the limits of market and weather conditions. We also sell, from time to time, timberland and special use land, which consists of surplus land, HBU land and development land. As of October 31, 2015, we owned approximately 242,673 acres of timber property in the southeastern United States. During the fourth quarter 2015, we sold approximately 5,200 acres of development properties in Canada, which represented all of our remaining timber properties in Canada.
Customers
Due to the variety of our products, we have many customers buying different types of our products and due to the scope of our sales, no one customer is considered principal in our total operations.
Backlog
We supply a cross-section of industries, such as chemicals, paints and pigments, food and beverage, petroleum, industrial coatings, agricultural, pharmaceutical, mineral, packaging, automotive and building products, and must make spot deliveries on a day-to-day basis as our products are required by our customers. We do not operate on a backlog to any significant extent and maintain only limited levels of finished goods. Many customers place their orders weekly for delivery during the week.
Competition
The markets in which we sell our products are highly competitive with many participants. Although no single company dominates, we face significant competitors in each of our businesses. Our competitors include large vertically integrated companies as well as numerous smaller companies. The industries in which we compete are particularly sensitive to price fluctuations caused by shifts in industry capacity and other cyclical industry conditions. Other competitive factors include design, quality and service, with varying emphasis depending on product line.
In both the rigid industrial packaging industry and the flexible products industry, we compete by offering a comprehensive line of products on a global basis. In the paper packaging industry, we compete by concentrating on providing value-added, higher-margin corrugated products to niche markets. In addition, over the past several years we have closed higher cost facilities and otherwise restructured our operations, which we believe have significantly improved our cost competitiveness.
Compliance with Governmental Regulations Concerning Environmental Matters
Our operations are subject to extensive federal, state, local and international laws, regulations, rules and ordinances relating to pollution, the protection of the environment, the generation, storage, handling, transportation, treatment, disposal and remediation of hazardous substances and waste materials and numerous other environmental laws and regulations. In the ordinary course of business, we are subject to periodic environmental inspections and monitoring by governmental enforcement authorities. In addition, certain of our production facilities require environmental permits that are subject to revocation, modification and renewal.
Based on current information, we believe that the probable costs of the remediation of company-owned property will not have a material adverse effect on our financial condition or results of operations. We believe that we have adequately reserved for our liability for these matters as of October 31, 2015.
We do not believe that compliance with federal, state, local and international provisions, which have been enacted or adopted regulating the discharge of materials into the environment, or otherwise relating to the protection of the environment, has had or will have a material adverse effect upon our capital expenditures, earnings or competitive position. We do not anticipate any material capital expenditures related to environmental control in 2016.
Refer also to Note 14 to the Notes to Consolidated Financial Statements included in Item 8 of this Form 10-K for additional information concerning environmental expenses and cash expenditures for 2015, 2014 and 2013, and our reserves for environmental liabilities as of October 31, 2015.
Raw Materials
Steel, resin and containerboard, as well as used industrial packaging for reconditioning, are the principal raw materials for the Rigid Industrial Packaging & Services segment, resin is the primary raw material for the Flexible Products & Services segment, and pulpwood, old corrugated containers for recycling and containerboard are the principal raw materials for the Paper Packaging segment. We satisfy most of our needs for these raw materials through purchases on the open market or under short-term and long-term supply agreements. All of these raw materials are purchased in highly competitive, price-sensitive markets, which have historically exhibited price, demand and supply cyclicality. From time to time, some of these raw materials have been in short supply at certain of our manufacturing facilities. In those situations, we ship the raw materials in short supply from one or more of our other facilities with sufficient supply to the facility or facilities experiencing the shortage. To date, raw material shortages have not had a material adverse effect on our financial condition or results of operations.
4
Research and Development
While research and development projects are important to our continued growth, the amount expended in any year is not material in relation to our results of operations.
Other
Our businesses are not materially dependent upon patents, trademarks, licenses or franchises.
No material portion of our businesses is subject to renegotiation of profits or termination of contracts or subcontracts at the election of a governmental agency or authority.
The businesses of our segments are not seasonal to any material extent.
Employees
As of October 31, 2015, we had approximately 13,150 full time employees. A significant number of our full time employees are covered under collective bargaining agreements. We believe that our employee relations are generally good.
(d) Financial Information about Geographic Areas
Our operations are located in North and South America, Europe, the Middle East, Africa and the Asia Pacific regions. Information related to our geographic areas of operation is included in Note 18 to the Notes to Consolidated Financial Statements included in Item 8 of this Form 10-K. Refer to Quantitative and Qualitative Disclosures about Market Risk, included in Item 7A of this Form 10-K.
(e) Available Information
We maintain a website at www.greif.com. We file reports with the United States Securities and Exchange Commission ("SEC") and make available, free of charge, on or through our website, our annual reports on Form 10-K, quarterly reports on Form 10-Q, current reports on Form 8-K, proxy and information statements and amendments to these reports filed or furnished pursuant to Section 13(a) or 15(d) of the Exchange Act as soon as reasonably practicable after we have electronically filed such material with, or furnished it to, the SEC.
Any of the materials we file with the SEC may also be read and/or copied at the SEC's Public Reference Room at 100 F Street, NE, Washington, DC 20549. Information on the operation of the SEC's Public Reference Room may be obtained by calling the SEC at 1-800-SEC-0330. The SEC maintains a website that contains reports, proxy and information statements, and other information regarding issuers that file electronically with the SEC at www.sec.gov.
(f) Other Matters
Our common equity securities are listed on the New York Stock Exchange ("NYSE") under the symbols GEF and GEF.B. Our President and Chief Executive Officer has timely certified to the NYSE that, at the date of the certification, he was unaware of any violation by our Company of the NYSE's corporate governance listing standards. In addition, our Chief Executive Officer and Chief Financial Officer have provided certain certifications in this Form 10-K regarding the quality of our public disclosures. Refer to Exhibits 31.1 and 31.2 to this Form 10-K.
ITEM 1A. RISK FACTORS
Statements contained in this Form 10-K may be "forward-looking" within the meaning of Section 21E of the Exchange Act. Such forward-looking statements are subject to certain risks and uncertainties that could cause our operating results to differ materially from those projected. The following factors, among others, in some cases have affected, and in the future could affect, our actual financial or operational performance, or both.
Historically, Our Business has been Sensitive to Changes in General Economic or Business Conditions.
Our customers generally consist of other manufacturers and suppliers who purchase industrial packaging products and containerboard and related corrugated products for their own containment and shipping purposes. Because we supply a cross section of industries, such as chemicals, paints and pigments, food and beverage, petroleum, industrial coatings, agricultural, pharmaceutical, mineral products, packaging, automotive, and building products industries, and have operations in many countries, demand for our products and services has historically corresponded to changes in general economic and business conditions of the industries and countries in which we operate. Accordingly, our financial performance is substantially dependent upon the general economic and business conditions existing in these industries and countries, and any prolonged or substantial economic downturn in the markets in which we operate could have a material adverse effect on our business, results of operations and financial condition.
5
Our Operations Subject Us to Currency Exchange and Political Risks that Could Adversely Affect Our Results of Operations.
We have operations in over 50 countries. Management of global operations is extremely complex, and operations outside the United States are subject to additional risks that may not exist, or be as significant, in the United States. As a result of our global operations, we are subject to certain risks that could disrupt our operations or force us to incur unanticipated costs.
The company also has indebtedness, agreements to purchase raw materials and agreements to sell finished products that are denominated in Euros, Turkish Lira, Russian Rubles and other currencies. Our operating performance is affected by fluctuations in currency exchange rates by:
| • | translations into United States dollars for financial reporting purposes of the assets and liabilities of our non-U.S. operations conducted in local currencies; and |
| • | gains or losses from transactions conducted in currencies other than the operation's functional currency. |
We are subject to various other risks associated with operating in countries outside the U.S., such as the following:
| • | political, social, economic and labor instability which has commonly been associated with developing countries but presently is also impacting several industrialized countries; |
| • | war, invasion, civil disturbance or acts of terrorism; |
| • | taking of property by nationalization or expropriation without fair compensation; |
| • | changes in government policies and regulations; |
| • | loss or non-renewal of treaties or similar agreements with foreign tax authorities; |
| • | difficulties in enforcement of contractual obligations; |
| • | imposition of limitations on conversions of currencies into United States dollars or remittance of dividends and other payments by international subsidiaries; |
| • | imposition or increase of withholding and other taxes on income remittances and other payments by international subsidiaries; |
| • | hyperinflation, currency devaluation or defaults in certain countries; |
| • | impositions or increase of investment and other restrictions or requirements by non-United States governments |
| • | national and regional labor strikes, whether legal or illegal and other labor or social actions; and |
| • | restrictive governmental trade policies, customs, import/export and other trade compliance regulations. |
The Current and Future Challenging Global Economy and Disruption and Volatility of the Financial and Credit Markets may Adversely Affect Our Business.
The current global economic conditions are challenging to our global business operations. Such conditions have had, and may continue to have, a negative impact on our financial results. Future economic downturns, either in the United States, Europe or in other regions in which we do business could negatively affect our business and results of operations. The volatility of the current economic climate, especially in relation to ongoing uncertainties related to geopolitical events around the world, makes it difficult for us to predict the complete impact of the forgoing matters on our business and results of operations. Due to these current and future economic conditions, our customers may face financial difficulties, the unavailability of or reduction in commercial credit, or both, that may result in decreased sales by and revenues to our company. Certain of our customers may cease operations or seek bankruptcy protection, which would reduce our cash flows and adversely impact our results of operations. Our customers that are financially viable and not experiencing economic distress may nevertheless elect to reduce the volume of orders for our products or close facilities in an effort to remain financially stable or as a result of the unavailability of commercial credit which would negatively affect our results of operations. We may experience difficulties in servicing, renewing or repaying our outstanding debt due to continued volatility in the global economy. We may also have difficulty accessing the global credit markets due to the downgrade of the U.S. credit rating and the resulting tightening of commercial credit availability and the financial difficulties of our customers, which would result in decreased ability to fund capital-intensive strategic projects.
Further, we may experience challenges in forecasting revenues and operating results due to these global economic conditions. The difficulty in forecasting revenues and operating results may result in volatility in the market price of our common stock.
In addition, the lenders under our senior secured credit agreement and other borrowing facilities described in Item 7 of this Form 10-K under "Liquidity and Capital Resources – Borrowing Arrangements" and the counterparties with whom we maintain interest rate swap agreements, currency forward contracts and derivatives and other hedge agreements may be unable to perform their lending or payment obligations in whole or in part, or may cease operations or seek bankruptcy protection, which would negatively affect our cash flows and our results of operations.
A downgrade in our credit rating could also impact our ability to effectively finance our operations and could lead to increased borrowing costs and limits on our access to capital.
6
The Continuing Consolidation of Our Customer Base and Suppliers may Intensify Pricing Pressure.
Over the last few years, many of our large industrial packaging, containerboard and corrugated products customers have acquired, or been acquired by, companies with similar or complementary product lines. In addition, many of our suppliers of raw materials such as steel, resin and paper, have undergone a similar process of consolidation. This consolidation has increased the concentration of our largest customers, resulting in increased pricing pressures from our customers. The consolidation of our largest suppliers has resulted in limited sources of supply and increased cost pressures from our suppliers. Any future consolidation of our customer base or our suppliers could negatively impact our business, results of operations and financial condition. Furthermore, if one or more of our major customers reduces, delays or cancels substantial orders, if one or more of our major suppliers is unable to timely produce and deliver our orders our business, results of operations, financial condition and cash flows may be materially and adversely affected, particularly for the period in which the reduction, delay or cancellation occurs and also possibly for subsequent periods.
We Operate in Highly Competitive Industries.
Each of our business segments operates in highly competitive industries. The most important competitive factors we face are price, quality and service. To the extent that one or more of our competitors become more successful with respect to any of these key competitive factors, we could lose customers and our sales could decline. In addition, due to the tendency of certain customers to diversify their suppliers, we could be unable to increase or maintain sales volumes with particular customers. Certain of our competitors are substantially larger and have significantly greater financial resources.
Our Business is Sensitive to Changes in Industry Demands.
Industry demand for containerboard in the United States and certain of our industrial packaging products in our United States, European and other international markets has varied in recent years causing competitive pricing pressures for those products. We compete in industries that are capital intensive, which generally leads to continued production as long as prices are sufficient to cover marginal costs. As a result, changes in industry demands, including any resulting industry over-capacity, may cause substantial price competition and, in turn, negatively impact our business, results of operations and financial condition.
Raw Material and Energy Price Fluctuations and Shortages may Adversely Impact Our Manufacturing Operations and Costs.
The principal raw materials used in the manufacture of our products are steel, resin, pulpwood, old corrugated containers for recycling, used industrial packaging for reconditioning, and containerboard, which we purchase or otherwise acquire in highly competitive, price sensitive markets. These raw materials have historically exhibited price and demand cyclicality. Some of these materials have been, and in the future may be, in short supply. For example, the availability of these raw materials and/or our ability to purchase and transport these raw materials may be unexpectedly disrupted by adverse weather conditions, natural disasters or a substantial economic downturn in the industries that provide any of those products. However, we have not recently experienced any significant difficulty in obtaining our principal raw materials. We have long-term supply contracts in place for obtaining a portion of our principal raw materials. The cost of producing our products is also sensitive to the price of energy (including its impact on transport costs). We have, from time to time, entered into short-term contracts to hedge certain of our energy costs. Energy prices, in particular oil and natural gas, have fluctuated in recent years, with a corresponding effect on our production costs. Potential legislation, regulatory action and international treaties related to climate change, especially those related to the regulation of greenhouse gases, may result in significant increases in raw material and energy costs. There can be no assurance that we will be able to recoup any past or future increases in the cost of energy and raw materials.
We may Encounter Difficulties Arising from Acquisitions.
We have in recent years invested a substantial amount of capital in acquisitions, joint ventures and strategic investments and we expect that we will continue to do so in the foreseeable future. We are continually evaluating acquisitions and strategic investments that are significant to our business both in the United States and internationally. Acquisitions, joint ventures and strategic investments involve numerous risks, including the failure to identify suitable acquisition candidates, complete acquisitions on acceptable terms and conditions, retain key customers, employees and contracts, the inability to integrate businesses without material disruption, unanticipated costs incurred in connection with integrating businesses, the incurrence of liabilities greater than anticipated or operating results that are less than anticipated, the inability to realize the projected value, and the inability to realize projected synergies. In addition, acquisitions, joint ventures and strategic investments and associated integration activities require time and attention of management and other key personnel, and other companies in our industries have similar acquisition and investment strategies. There can be no assurance that any acquisitions, joint ventures and strategic investments will be successfully integrated into our operations, that competition for acquisitions will not intensify or that we will be able to complete such acquisitions, joint ventures and strategic investments on acceptable terms and conditions. The costs of unsuccessful acquisition, joint venture and strategic investment efforts may adversely affect our results of operations, financial condition or prospects.
We may Incur Additional Restructuring Costs and there is no Guarantee that Our Efforts to Reduce Costs will be Successful.
We have restructured portions of our operations from time to time in recent years, particularly following acquisitions of businesses and periods of economic downturn due to recent and current global economic conditions. We are implementing a strategy to improve our business portfolio, address underperforming assets and generate additional cash. This strategy includes SG&A reductions throughout the company and has and will likely continue to result in the rationalization of manufacturing facilities.
7
The rationalization of our manufacturing facilities may result in temporary constraints upon our ability to produce the quantity of products necessary to fill orders and thereby complete sales in a timely manner. In addition, system upgrades at our manufacturing facilities that impact ordering, production scheduling and other related manufacturing processes are complex, and could impact or delay production targets. A prolonged delay in our ability to fill orders on a timely basis could affect customer demand for our products and increase the size of our product inventories, causing future reductions in our manufacturing schedules and adversely affecting our results of operations. Moreover, our continuous development and production of new products will often involve the retooling of existing manufacturing facilities. This retooling may limit our production capacity at certain times in the future, which could adversely affect our results of operations and financial condition. In addition, the expansion and reconfiguration of existing manufacturing facilities could increase the risk of production delays, as well as require significant investments of capital.
While we expect these initiatives to result in significant profit opportunities and savings throughout our organization, our estimated profits and savings are based on several assumptions that may prove to be inaccurate, and as a result, there can be no assurance that we will realize these profits and cost savings or that, if realized, these profits and cost savings will be sustained. Failure to achieve or delays in achieving projected levels of efficiencies and cost savings from such measures, or unanticipated inefficiencies resulting from manufacturing and administrative reorganization actions in progress or contemplated, could adversely affect the Company's results of operation and, financial condition and harm our reputation.
Tax Legislation Initiatives or Challenges to Our Tax Positions May Adversely Impact Our Results or Condition.
We are a large multinational corporation with operations in the United States and international jurisdictions. As such, we are subject to the tax laws and regulations of the U.S. federal, state and local governments and of many international jurisdictions. Due to widely varying tax rates in the taxing jurisdictions applicable to our business, a change in income generation to higher taxing jurisdictions or away from lower taxing jurisdictions may have an adverse effect on our financial condition and results of operations.
From time to time, various legislative initiatives may be proposed that could adversely affect our tax positions. There can be no assurance that our effective tax rate or tax payments will not be adversely affected by these initiatives. In addition, U.S. federal, state and local, as well as international, tax laws and regulations, are extremely complex and subject to varying interpretations. There can be no assurance that our tax positions will not be challenged by relevant tax authorities or that we would be successful in any such challenge.
Full realization of our deferred tax assets may be affected by a number of factors.
We have deferred tax assets, including U.S. and foreign operating loss carryforwards, capital loss carryforwards, employee and retiree benefit items, and other accruals not yet deductible for tax purposes. We have established valuation allowances to reduce those deferred tax assets to an amount that is more likely than not to be realized. Our ability to use these deferred tax assets depends in part upon our having future taxable income during the periods in which these temporary differences reverse or our ability to carry back any losses created by the deduction of these temporary differences. We expect to realize these assets over an extended period. However, if we were unable to generate sufficient future taxable income in the U.S. and certain foreign jurisdictions, or if there were a significant change in the time period within which the underlying temporary differences became taxable or deductible, we could be required to increase our valuation allowances against our deferred tax assets, which would increase our effective tax rate which could have a material adverse effect on our reported results of operations.
Several Operations are Conducted by Joint Ventures that we cannot Operate Solely for Our Benefit.
Several operations, particularly in developing countries, are conducted through joint ventures, such as a significant joint venture in our Flexible Products & Services segment. In countries that require us to conduct business through a joint venture with a local joint venture partner, the loss of a joint venture partner or a joint venture partner's loss of its ability to conduct business in such country may impact our ability to conduct business in that country.
In joint ventures, we share ownership and, in some instances, management of a company with one or more parties who may or may not have the same goals, strategies, priorities or resources as we do. In general, joint ventures are intended to be operated for the benefit of all co-owners, rather than for our exclusive benefit. Operating a business as a joint venture often requires additional organizational formalities as well as time-consuming procedures for sharing information, accounting and making decisions. In certain cases, our joint venture partners must agree in order for the applicable joint venture to take certain actions, including acquisitions, the sale of assets, budget approvals, borrowing money and granting liens on joint venture property. Our inability to take unilateral action that we believe is in our best interests may have an adverse effect on the financial performance of the joint venture and the return on our investment. In joint ventures, we believe our relationship with our co-owners is an important factor to the success of the joint venture, and if a co-owner changes, our relationship may be adversely affected. In addition, the benefits from a successful joint venture are shared among the co-owners, so that we do not receive all the benefits from our successful joint ventures. Finally, we may be required on a legal or practical basis or both, to accept liability for obligations of a joint venture beyond our economic interest, including in cases where our co-owner becomes bankrupt or is otherwise unable to meet its commitments. For additional information with respect to the joint venture relating to our Flexible Products & Services segment, refer to Item 7, Management's Discussion and Analysis of Financial Condition and Results of Operation – Variable Interest Entities.
8
Our Ability to Attract, Develop and Retain Talented and Qualified Employees, Managers and Executives is Critical to Our Success.
Our ability to attract, develop and retain talented and qualified employees, including executives and other key managers, is important to our business. This is becoming more difficult in the current highly competitive hiring and retention environment. The retirement of or unforeseen loss of key officers and employees without appropriate succession planning or the ability to develop or hire replacements could hinder our strategic planning and execution and make it difficult to manage our business and meet our objectives resulting in a material adverse effect on our business, results of operations and financial condition.
Our Business may be Adversely Impacted by Work Stoppages and Other Labor Relations Matters.
We are subject to risk of work stoppages and other labor relations matters because a significant number of our employees are represented by unions. We have experienced work stoppages and strikes in the past, and there may be work stoppages and strikes in the future. Any prolonged work stoppage or strike at any one of our principal manufacturing facilities could have a negative impact on our business, results of operations and financial condition. In addition, upon the expiration of existing collective bargaining agreements, we may not reach new agreements without union action and any such new agreements may not be on terms satisfactory to us.
Our Pension Plans Are Underfunded and will Require Future Cash Contributions, And Our Required Future Cash Contributions Could Be Higher Than We Expect, Each Of Which Could Have A Material Adverse Effect On Our Financial Condition And Liquidity.
We sponsor various pension and similar benefit plans worldwide.
Our U.S. and non-U.S. pension plans were underfunded by an aggregate of $133.8 million and $22.2 million, respectively, as of October 31, 2015. We are legally required to make cash contributions to our pension plans in the future, and those cash contributions could be material.
In fiscal 2016, we expect to make cash contributions of approximately $13.4 million and $3.8 million to our U.S. and non-U.S. pension plans, respectively, which we believe will be sufficient to meet the minimum funding requirements under applicable laws. However, our future funding obligations for our pension plans depend upon the levels of benefits provided for by these plans, the future performance of assets set aside for these plans, the rates of interest used to determine funding levels, the impact of potential business dispositions, actuarial data and experience, and any changes in government laws and regulations. Accordingly, our 2016 funding requirements for our pension plans could be higher than expected, which could have a material adverse effect on our financial condition and liquidity.
In addition, our pension plans hold a significant amount of equity securities. If the market values of these securities decline, our pension expense and funding requirements will increase, which could have a material adverse effect on our financial condition and liquidity.
Any decrease in interest rates and asset returns, if and to the extent not offset by contributions, could increase our obligations under our pension plans. If the performance of assets held in these pension plans does not meet our expectations, our cash contributions for these plans could be higher than we expect, which could have a material adverse effect on our financial condition and liquidity.
We may be Subject to Losses that Might not be Covered in Whole or in Part by Existing Insurance Reserves or Insurance Coverage.
We are self-insured for certain of the claims made under our employee medical and dental insurance programs and for certain of our workers' compensation claims. We establish reserves for estimated costs related to pending claims, administrative fees and claims incurred but not reported. Because establishing reserves is an inherently uncertain process involving estimates, currently established reserves may not be adequate to cover the actual liability for claims made under our employee medical and dental insurance programs and for certain of our workers' compensation claims. If we conclude that our estimates are incorrect and our reserves are inadequate for these claims, we will need to increase our reserves, which could adversely affect our financial condition and results of operations.
We carry comprehensive liability, fire and extended coverage insurance on most of our facilities, with policy specifications and insured limits customarily carried for similar properties. However, there are certain types of losses, such as losses resulting from wars, acts of terrorism, wind storm, flood, earthquake or other natural disasters, that may be uninsurable or subject to restrictive policy conditions. In these instances, should a loss occur in excess of insured limits, we could lose capital invested in that property, as well as the anticipated future revenues derived from the manufacturing activities conducted at that property, while remaining obligated for any mortgage indebtedness or other financial obligations related to the property. Any such loss would adversely impact our business, financial condition and results of operations.
We purchase insurance policies covering general liability and product liability with substantial policy limits. However, there can be no assurance that any liability claim would be adequately covered by our applicable insurance policies or it would not be excluded from coverage based on the terms and conditions of the policy. This could also apply to any applicable contractual indemnity.
We also purchase environmental liability policies where legally required and may elect to purchase coverage in other circumstances in order to transfer all or a portion of environmental liability risk through insurance. However, there can be no assurance that any environmental liability claim would be adequately covered by our applicable insurance policies or that it would not be excluded from coverage based on the terms and conditions of the policy.
9
Our Business Depends on the Uninterrupted Operations of Our Facilities, Systems and B usiness Functions, including Our Information Technology (IT) and Other Business Systems.
Our business is dependent upon our ability to execute, in an efficient and uninterrupted fashion, necessary business functions, such as accessing key business data, financial information, order processing, invoicing and the operation of IT dependent manufacturing equipment. In addition, a significant portion of the communication between our employees, customers and suppliers around the world depends on our IT systems. A shut-down of or inability to access one or more of our facilities, a power outage, a pandemic, or a failure of one or more of our IT, telecommunications or other systems could significantly impair our ability to perform such functions on a timely basis.
Our IT systems exist on platforms in over 50 countries, many of which have been acquired in connection with business acquisitions, resulting in a complex technical infrastructure. Such complexity creates difficulties and inefficiencies in monitoring business results and consolidating financial data and could result in a material adverse effect on our business, results of operations and financial condition. In order to reduce this complexity, we are in the process of implementing a standard IT platform project to transition from many of the former systems to a single system. Given its scope, this project will take several years to complete and will require significant human and financial resources. There can be no assurance that this project will be successful, and even if successful, there can be no assurance that other difficulties and inefficiencies will not exist in our systems.
We have established a business continuity plan in an effort to ensure the continuation of core business operations in the event that normal operations could not be performed due to a catastrophic event. While we continue to test and assess our business continuity plan to ensure it meets the needs of our core business operations and addresses multiple business interruption events, there is no assurance that core business operations could be performed upon the occurrence of such an event.
A Security Breach of Customer, Employee, Supplier or Company Information may have a Material Adverse Effect on our Business, Financial Condition and Results of Operations.
In the conduct of our business, we collect, use, transmit, store and report data on information systems and interact with customers, vendors and employees. Increased global IT security threats and more sophisticated and targeted computer crime pose a risk to the security of our systems and networks and the confidentiality, availability and integrity of our data. Despite our security measures, our IT systems and infrastructure may be vulnerable to computer viruses, cyber-attacks, security breaches caused by employee error or malfeasance or other disruptions. Any such threat could compromise our networks and the information stored there could be accessed, publicly disclosed, lost or stolen. A security breach of our computer systems could interrupt or damage our operations or harm our reputation. In addition, we could be subject to legal claims or proceedings, liability under laws that protect the privacy of personal information and regulatory penalties if confidential information relating to customers, suppliers, employees or other parties is misappropriated from our computer system.
Similar security threats exist with respect to the IT systems of our lenders, suppliers, consultants, advisors and other third parties with whom we conduct business. A security breach of those computer systems could result in the loss, theft or disclosure of confidential information and could also interrupt or damage our operations, harm our reputation and subject us to legal claims.
Legislation/Regulation Related to Environmental and Health and Safety Matters and Corporate Social Responsibility Could Negatively Impact our Operations and Financial Performance.
We must comply with extensive laws, rules and regulations in the United States and in each of the countries where we conduct business regarding environmental matters, such as air, soil and water quality and waste disposal. We must also comply with extensive laws, rules and regulations regarding safety, health and corporate responsibility matters. There can be no assurance that compliance with existing and new laws, rules and regulations will not require significant expenditures.
For example, the Patient Protection and Affordable Care Act, which was adopted in 2010 and is being phased in over several years, could significantly increase the cost of the health care benefits provided to our U.S. employees. In addition, the failure to comply materially with such existing and new laws, rules and regulations could adversely affect our business, results of operations and financial condition.
We are also subject to transportation safety regulations promulgated by the U.S. Department of Transportation (DOT) and agencies in other jurisdictions. Both the DOT regulations and standards issued by the United Nations and adopted by various jurisdictions outside the United States set forth requirements related to the transportation of both hazardous and nonhazardous materials in some of our packaging products and subject our company to random inspections and testing to ensure compliance. Failure to comply could result in fines to our company and could affect our business, results of operations and financial condition.
We are subject to laws, rules and regulations relating to some of the raw materials, such as resins and epoxy-based coatings, used in our rigid container business. These materials may contain Bisphenol-A (BPA), a chemical monomer that can be toxic in sufficient quantities, and is used in several food contact applications. Regulatory agencies in several jurisdictions worldwide have found these materials to be safe for food contact at current levels, but a significant change in regulatory rulings concerning BPA could have an adverse effect on our business.
Our customers in the food industry are subject to increasing laws, rules and regulations relating to food safety. As a result, customers may demand that changes be made to our products or facilities, as well as other aspects of our production processes, that may require the investment of capital. The failure to comply with these requests could adversely affect our relationships with some customers and result in negative effects on our business, results of operations and financial condition.
10
In 2012, the SEC, as directed by Section 1502 of The Dodd-Frank Wall Street Reform and Consumer Protection Act, enacted new annual disclosure and reporting requirements for companies regarding the use of "conflict minerals" from the Democratic Republic of the Congo and adjoining countries. These requirements could affect the sourcing, availability and cost of minerals used in the manufacture of certain of our products. We have incurred and will continue to incur costs associated with complying with the supply chain due diligence procedures required by the SEC. In addition, because our supply chain is complex, we may face reputation challenges with our customers and other stakeholders if we are unable to sufficiently verify the origins of all minerals used in our products through the due diligence procedures that we implement.
Although there may be adverse financial impact (including compliance costs, potential permitting delays and increased cost of energy, raw materials and transportation) associated with any legislation, regulation or other action, the extent and magnitude of that impact cannot be reliably or accurately estimated due to the fact that some requirements have only recently been adopted and the present uncertainty regarding other additional measures and how they will be implemented.
Product Liability Claims and Other Legal Proceedings Could Adversely Affect our Operations and Financial Performance .
We produce products and provide services related to other parties' products. While we have built extensive operational processes to ensure that the design and manufacture of our products meet rigorous quality standards, there can be no assurance that we or our customers will not experience operational process failures that could result in potential product, safety, regulatory or environmental claims and associated litigation. We are also subject to a variety of legal proceedings and legal compliance risks in our areas of operation around the globe. Any such claims, whether with or without merit, could be time consuming and expensive to defend and could divert management's attention and resources. In accordance with customary practice, we maintain insurance against some, but not all, of these potential claims. In the future, we may not be able to maintain insurance at commercially acceptable premium levels at all. In addition, the levels of insurance we maintain may not be adequate to fully cover any and all losses or liabilities. If any significant judgment or claim is not fully insured or indemnified against, it could have a material adverse impact on our business, financial condition and results of operations.
We and the industries in which we operate are at times being reviewed or investigated by regulators and other governmental authorities, which could lead to enforcement actions, fines and penalties or the assertion of private litigation claims and damages. Simply responding to actual or threatened litigation or government investigations of our compliance with regulatory standards may require significant expenditures of time and other resources. While we believe that we have adopted appropriate risk management and compliance programs, the global and diverse nature of our operations means that legal and compliance risks will continue to exist and legal proceedings and other contingencies, the outcome of which cannot be predicted with certainty, will arise from time to time that could adversely affect our business, results of operations and financial condition.
We may Incur Fines or Penalties, Damage to Our Reputation or Other Adverse Consequences if Our Employees, Agents or Business Partners Violate, or are Alleged to Have Violated, Anti-bribery, Competition or Other Laws.
We cannot provide assurance that our internal controls will always protect us from reckless or criminal acts committed by our employees, agents or business partners that would violate U.S. and/or non-U.S. laws, including anti-bribery, competition, trade sanctions and regulation, and other laws. Any such improper actions could subject us to civil or criminal investigations in the U.S. and in other jurisdictions, could lead to substantial civil or criminal monetary and non-monetary penalties against us or our subsidiaries, and could damage our reputation. Even the allegation or appearance of our employees, agents or business partners acting improperly or illegally could damage our reputation and result in significant expenditures in investigating and responding to such actions.
Changing Climate, Climate Change Regulations and Greenhouse Gas Effects may Adversely Affect Our Operations and Financial Performance.
There is continuing concern from members of the scientific community and the general public that emissions of greenhouse gases (GHG) and other human activities have or will cause significant changes in weather patterns and increase the frequency or severity of weather events, wildfires and flooding. Climate change creates physical and financial risk. Physical risks from climate change include an increase in sea level and changes in weather conditions, such as an increase in precipitation, droughts and extreme weather events. These types of events may adversely impact the Company, our suppliers, our customers and their ability to purchase our products and our ability to manufacture and transport our products on a timely basis and could result in a material adverse effect on our business, results of operations and financial condition.
We believe it is likely that the scientific and political attention to issues concerning the extent and causes of climate change will continue, with the potential for further legislation and regulations that could affect our results of operations and financial condition. Foreign, federal, state and local regulatory and legislative bodies have proposed various legislative and regulatory measures relating to climate change, regulating GHG emissions and energy policies. If such legislation or regulations are enacted, we could incur increased energy, environmental and other costs and capital expenditures to comply with the limitations. Failure to comply with these regulations could result in fines to our company and could affect our business, results of operations and financial condition.
11
We, along with other companies in many business sectors, including our customers, are considering and implementing ways to reduce GHG emissions. As a result, our customers may request that changes be made to our products or facilities, as well as other aspects of our production processes, that increase costs and may require the investment of capital. The failure to comply with these requests could adversely affect our relationships with some customers, which in turn could adversely affect our business, results of operations and financial condition.
We could face increased costs related to defending and resolving legal claims and other litigation related to climate change and the alleged impact of our operations on climate change.
The Frequency and Volume of Our Timber and Timberland Sales will Impact Our Financial Performance.
We have a significant inventory of standing timber and timberland and approximately 21,175 acres of special use properties in the United States as of October 31, 2015. The frequency, demand for and volume of sales of timber, timberland and special use properties will have an effect on our financial condition and results of operations. In addition, volatility in the real estate market for special use properties could negatively affect our results of operations.
Changes in U.S. Generally Accepted Accounting Principles (U.S. GAAP) and SEC Rules and Regulations could Materially Impact Our Reported Results.
U.S. GAAP and SEC accounting and reporting changes have become more frequent and significant in the past several years. These changes could have significant effects on our reported results when compared to prior periods and other companies and may even require us to retrospectively adjust prior periods from time to time. Additionally, material changes to the presentation of transactions in the consolidated financial statements could impact key ratios that analysts and credit rating agencies use to rate our company, increase our cost of borrowing and ultimately our ability to access the credit markets in an efficient manner.
If the Company Fails to Maintain an Effective System of Internal Control, the Company may not be able to Accurately Report Financial Results or Prevent Fraud.
Effective internal controls are necessary to provide reliable financial reports and to assist in the effective prevention of fraud. We must annually evaluate our internal control procedures to satisfy the requirements of Section 404 of the Sarbanes-Oxley Act of 2002, which requires management and auditors to assess the effectiveness of internal controls. As further described in Item 9A of this Form 10-K, management has concluded that, because of material weaknesses in internal controls over financial reporting related to international income taxes, including accounting for deferred income taxes and uncertain tax positions, and information technology controls, our disclosure controls and procedures were not effective as of October 31, 2015. If we fail to correct these material weaknesses in our internal controls, or having corrected such material weaknesses, thereafter failing to maintain the adequacy of our internal controls, we could be subjected to regulatory scrutiny, civil or criminal penalties or shareholder litigation. In addition, continued or future failure to maintain adequate internal controls could result in financial statements that do not accurately reflect our financial condition.
The Company has a Significant Amount of Goodwill and Long-lived Assets which, if Impaired in the Future, would Adversely Impact our Results of Operations.
Our goodwill could be impaired if the fair value of any particular reporting unit is less than the carrying value of that reporting unit. Impairment of the Company's goodwill would reduce the Company's net income in the period of any such write down. At October 31, 2015, the carrying value of the Company's goodwill was $807.1 million. The Company is required to evaluate goodwill reflected on its balance sheet at least annually, or when circumstances indicate a potential impairment. If it determines that the goodwill is impaired, the Company would be required to write off a portion or all of the goodwill. As further described in Item 7 and Note 6 of Item 8 of this Form 10-K, in 2014, the Company recorded an impairment for all of the goodwill associated with the Flexible Products & Services segment.
We may be required to record future impairments of our long-lived assets as we continue to transform and restructure our business. Decisions to sell or close plants could reduce the hold period of an asset group or indicate that the fair value of the asset group is less than the carrying value. We may also experience declines in particular businesses due to competition or other outside forces indicating our long-lived assets are not recoverable. Any resulting impairments will impact net income in the period in which the triggering event occurs and could be significant, which could have a material adverse effect on our results of operations.
ITEM 1B. UNRESOLVED STAFF COMMENTS
None.
12
ITEM 2. PROPERTIES
The following are our principal operating locations and the products manufactured at such facilities or the use of such facilities. We consider our operating properties to be in satisfactory condition and adequate to meet our present needs. However, we expect to make further additions, improvements and consolidations of our properties to support our business.
Location | Products or Use | Owned | Leased | |||
RIGID INDUSTRIAL PACKAGING & SERVICES | ||||||
Algeria | Steel drums | - | 1 | |||
Argentina | Steel and plastic drums, water bottles and distribution centers | 2 | 1 | |||
Australia | Closures | - | 2 | |||
Austria | Steel drums and reconditioned containers and services | - | 1 | |||
Belgium | Steel and plastic drums, reconditioned containers and services and shared services | 3 | 1 | |||
Brazil | Steel and plastic drums, water bottles, closures, intermediate bulk containers, warehouse and general office | 5 | 7 | |||
Canada | Fibre, steel and plastic drums and blending and packaging services | 2 | 2 | |||
Chile | Steel drums, water bottles and distribution centers | 1 | 1 | |||
China | Steel drums, closures, blending and packaging services and general offices | 8 | - | |||
Colombia | Steel and plastic drums and water bottles | 1 | 1 | |||
Costa Rica | Steel Drums | - | 1 | |||
Czech Republic | Steel drums | 1 | - | |||
Denmark | Fibre drums | - | 1 | |||
Egypt | Steel drums | 1 | - | |||
France | Steel and plastic drums, closures and distribution centers | 3 | - | |||
Germany | Fibre, steel and plastic drums, closures, intermediate bulk containers, reconditioned containers and services, and distribution centers | 5 | 2 | |||
Greece | Steel drums and warehouse | 1 | - | |||
Guatemala | Steel drums | 1 | - | |||
Hungary | Steel drums and shared services | 1 | 1 | |||
Israel | Fibre, steel and plastic drums and intermediate bulk containers | - | 1 | |||
Italy | Steel and plastic drums, closures, water bottles, intermediate bulk containers and distribution center | 1 | 5 | |||
Jamaica | Water bottles and distribution center | - | 1 | |||
13
Location | Products or Use | Owned | Leased | |||
Kazakhstan | Distribution center | - | 1 | |||
Kenya | Steel and plastic drums | - | 1 | |||
Malaysia | Steel and plastic drums | 1 | - | |||
Mexico | Fibre, steel and plastic drums, closures and distribution centers | 1 | 3 | |||
Morocco | Steel and plastic drums | 1 | - | |||
Netherlands | Fibre, steel and plastic drums, closures, reconditioned containers and services, paints and linings, research center and general offices | 4 | 3 | |||
Nigeria | Steel and plastic drums | - | 1 | |||
Norway | Steel and plastic drums | - | 1 | |||
Philippines | Steel drums and water bottles | - | 1 | |||
Poland | Steel drums and water bottles | 1 | - | |||
Portugal | Steel drums | 1 | - | |||
Russia | Steel drums, water bottles and intermediate bulk containers | 6 | 1 | |||
Saudi Arabia | Steel drums | - | 1 | |||
Singapore | Steel drums, plastic drums and steel parts | 1 | - | |||
Spain | Steel drums and distribution center | 2 | 1 | |||
Sweden | Steel drums, plastic drums, intermediate bulk containers and distribution center | - | 1 | |||
Turkey | Steel drums and water bottles | 1 | - | |||
Ukraine | Distribution center and water bottles | - | 1 | |||
United Arab Emirates | Idle | - | 1 | |||
United Kingdom | Steel and plastic drums, water bottles, reconditioned containers and services and distribution centers | 3 | - | |||
United States | Fibre, steel and plastic drums, intermediate bulk containers, reconditioned containers and services, closures, steel parts, distribution centers and blending and packaging services | 19 | 27 | |||
Venezuela | Steel and plastic drums | 2 | - | |||
Vietnam | Steel drums | 1 | - |
14
Location | Products or Use | Owned | Leased | |||
FLEXIBLE PRODUCTS & SERVICES: | ||||||
Belgium | Manufacturing plant | - | 1 | |||
Brazil | Distribution center | - | 1 | |||
China | Manufacturing plant | - | 1 | |||
Chile | Distribution center | - | 1 | |||
Finland | Manufacturing plant | 1 | - | |||
France | Manufacturing plant and distribution centers | 1 | 3 | |||
Germany | Distribution centers | - | 2 | |||
India | General office | - | 1 | |||
Ireland | Distribution center | - | 1 | |||
Mexico | Manufacturing plant | - | 1 | |||
Morocco | Manufacturing plant | - | 1 | |||
Netherlands | Manufacturing plant, distribution centers and general office | - | 3 | |||
Pakistan | Manufacturing plants | - | 3 | |||
Portugal | Manufacturing plant | - | 1 | |||
Romania | Manufacturing plants | - | 2 | |||
Saudi Arabia | Idle | - | 1 | |||
Spain | Distribution center | - | 1 | |||
Turkey | Manufacturing plants | - | 3 | |||
Ukraine | Manufacturing plant | 1 | - | |||
United Kingdom | Manufacturing plant | - | 1 | |||
United States | Distribution centers | - | 2 | |||
Vietnam | Manufacturing plant | - | 1 | |||
15
Location | Products or Use | Owned | Leased | |||
PAPER PACKAGING: | ||||||
United States | Corrugated sheets, containers and other products, containerboard, investment property, general offices and distribution centers | 12 | - | |||
LAND MANAGEMENT: | ||||||
United States | General offices | 2 | 1 | |||
CORPORATE: | ||||||
Luxembourg | General office | - | 1 | |||
United States | Principal and general offices | 2 | - |
We also own a substantial amount of timber properties. Our timber properties consisted of approximately 242,673 acres in the southeastern United States as of October 31, 2015.
ITEM 3. LEGAL PROCEEDINGS
We are not a party to any pending legal proceedings that are material to our business or financial condition.
From time to time, we have been a party to legal proceedings arising at the country, state or local level involving environmental sites to which we have shipped, directly or indirectly, small amounts of toxic waste, such as paint solvents. As of the filing date of this Form 10-K, we have been classified only as a "de minimis" participant, and such proceedings do not involve monetary sanctions in excess of $100,000.
ITEM 4. MINE SAFETY DISCLOSURES
None.
16
PART II
ITEM 5. MARKET FOR THE REGISTRANT'S COMMON EQUITY, RELATED STOCKHOLDER MATTERS AND ISSUER PURCHASES OF EQUITY SECURITIES
Shares of our Class A and Class B Common Stock are listed on the New York Stock Exchange under the symbols GEF and GEF.B, respectively.
Financial information regarding our two classes of common stock, as well as the number of holders of each class and the high, low and closing sales prices for each class for each quarterly period for the two most recent years, is included in Note 20 to the Notes to Consolidated Financial Statements in Item 8 of this Form 10-K.
We pay quarterly dividends of varying amounts computed on the basis described in Note 15 to the Notes to Consolidated Financial Statements included in Item 8 of this Form 10-K. The annual dividends paid for the last two years are as follows:
2015 Dividends per Share – Class A $1.68; Class B $2.51
2014 Dividends per Share – Class A $1.68; Class B $2.51
The terms of our current credit agreement limit our ability to make "restricted payments," which include dividends and purchases, redemptions and acquisitions of our equity interests. The payment of dividends and other restricted payments are subject to the condition that certain defaults not exist under the terms of our current credit agreement and, in the event that certain defaults exist, are limited in amount by a formula based, in part, on our consolidated net income. Refer to "Liquidity and Capital Resources – Borrowing Arrangements" in Item 7 of this Form 10-K.
We did not purchase any of our shares of Class A and Class B Common Stock during 2015.
17
Performance Graph
The following graph compares the performance of shares of our Class A and B Common Stock to that of the Standard and Poor's 500 Index and our industry group (Peer Index) assuming $100 invested on October 31, 2010 and reinvestment of dividends for each subsequent year. The graph does not purport to represent our value.
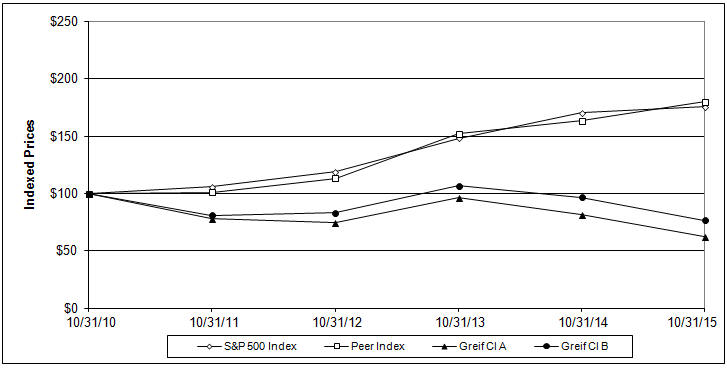
The Peer Index comprises the containers and packaging index as shown by Dow Jones.
Equity compensation plan information required by Items 201(d) of Regulation S-K will be found under the caption "Equity Compensation Plan Information" in the 2016 Proxy Statement, which information is incorporated herein by reference.
18
ITEM 6. SELECTED FINANCIAL DATA
The five-year selected financial data is as follows (Dollars in millions, except per share amounts):
| As of and for the years ended October 31, | 2015 | 2014 | 2013 | 2012 | 2011 | |||||||||||||||
Net sales | $ | 3,616.7 | $ | 4,239.1 | $ | 4,219.9 | $ | 4,129.5 | $ | 4,107.4 | ||||||||||
Net income attributable to Greif, Inc. | $ | 71.9 | $ | 91.5 | $ | 144.7 | $ | 118.1 | $ | 173.6 | ||||||||||
Total assets | $ | 3,315.7 | $ | 3,667.4 | $ | 3,886.7 | $ | 3,855.9 | $ | 4,191.0 | ||||||||||
Long-term debt, including current portion of long-term debt | $ | 1,146.9 | $ | 1,105.0 | $ | 1,217.2 | $ | 1,200.3 | $ | 1,383.9 | ||||||||||
Basic earnings per share: | ||||||||||||||||||||
Class A Common Stock | $ | 1.23 | $ | 1.56 | $ | 2.47 | $ | 2.03 | $ | 2.98 | ||||||||||
Class B Common Stock | $ | 1.83 | $ | 2.33 | $ | 3.70 | $ | 3.03 | $ | 4.46 | ||||||||||
Diluted earnings per share: | ||||||||||||||||||||
Class A Common Stock | $ | 1.23 | $ | 1.56 | $ | 2.47 | $ | 2.03 | $ | 2.97 | ||||||||||
Class B Common Stock | $ | 1.83 | $ | 2.33 | $ | 3.70 | $ | 3.03 | $ | 4.46 | ||||||||||
Dividends per share: | ||||||||||||||||||||
Class A Common Stock | $ | 1.68 | $ | 1.68 | $ | 1.68 | $ | 1.68 | $ | 1.68 | ||||||||||
Class B Common Stock | $ | 2.51 | $ | 2.51 | $ | 2.51 | $ | 2.51 | $ | 2.51 | ||||||||||
19
ITEM 7. MANAGEMENT'S DISCUSSION AND ANALYSIS OF FINANCIAL CONDITION AND RESULTS OF OPERATIONS
The terms "Greif," "the Company," "we," "us" and "our" as used in this discussion refer to Greif, Inc. and its subsidiaries.
Greif Business System and Transformation Initiative
We developed and use the "Greif Business System," a quantitative, systematic and disciplined process, to improve productivity, increase profitability, reduce costs and drive shareholder value. During the fourth quarter 2014, we announced our new transformation initiative, which is a holistic plan to improve our financial performance and reward our shareholders. At its core, this plan is intended to restructure the company by enhancing the Greif Business System through refocused efforts on operational efficiency, customer service, working capital, and sourcing and supply chain; reducing complexity; the consolidation and optimization of our manufacturing network; the sale of selected non-core assets; the reduction of SG&A costs; and implementing growth initiatives. We are currently in the execution phase of the transformation initiative and expect our work plans to continue through early 2018.
20
RESULTS OF OPERATIONS
The discussion and analysis of our financial condition and results of operations are based upon our consolidated financial statements, which have been prepared in accordance with accounting principles generally accepted in the United States ("GAAP"). The preparation of these consolidated financial statements, in accordance with these principles, require us to make estimates and assumptions that affect the reported amount of assets and liabilities, revenues and expenses, and related disclosure of contingent assets and liabilities at the date of our consolidated financial statements.
Historical revenues and earnings may or may not be representative of future operating results due to various economic and other factors.
The non-GAAP financial measure of EBITDA is used throughout the following discussion of our results of operations. EBITDA is defined as net income, plus interest expense, net, plus income tax expense, less equity earnings of unconsolidated affiliates, net of tax, plus depreciation, depletion and amortization. Since we do not calculate net income by segment, EBITDA by segment is reconciled to operating profit by segment. We use this non-GAAP financial measure to evaluate our historical and ongoing operations and believe that this non-GAAP financial measure is useful to enable investors to perform meaningful comparisons of our historical and current performance. We believe that this non-GAAP financial measure provides a stable platform on which to compare our historical performance. .
The following table sets forth the net sales, operating profit (loss) and EBITDA for each of our business segments for 2015, 2014 and 2013 (Dollars in millions):
For the year ended October 31, | 2015 | 2014 | 2013 | |||||||||
Net sales | ||||||||||||
Rigid Industrial Packaging & Services | $ | 2,586.4 | $ | 3,077.0 | $ | 3,062.1 | ||||||
Paper Packaging | 676.1 | 706.8 | 676.0 | |||||||||
Flexible Products & Services | 322.6 | 425.8 | 448.7 | |||||||||
Land Management | 31.6 | 29.5 | 33.1 | |||||||||
|
|
|
|
|
| |||||||
Total net sales | $ | 3,616.7 | $ | 4,239.1 | $ | 4,219.9 | ||||||
|
|
|
|
|
| |||||||
Operating profit (loss): | ||||||||||||
Rigid Industrial Packaging & Services | $ | 86.4 | $ | 170.1 | $ | 196.8 | ||||||
Paper Packaging | 109.3 | 125.8 | 123.8 | |||||||||
Flexible Products & Services | (36.6 | ) | (78.6 | ) | (11.7 | ) | ||||||
Land Management | 33.7 | 32.0 | 32.7 | |||||||||
|
|
|
|
|
| |||||||
Total operating profit | $ | 192.8 | $ | 249.3 | $ | 341.6 | ||||||
|
|
|
|
|
| |||||||
EBITDA: | ||||||||||||
Rigid Industrial Packaging & Services | $ | 179.1 | $ | 271.7 | $ | 295.3 | ||||||
Paper Packaging | 138.4 | 155.6 | 154.3 | |||||||||
Flexible Products & Services | (30.3 | ) | (68.0 | ) | (0.9 | ) | ||||||
Land Management | 37.0 | 36.3 | 37.4 | |||||||||
|
|
|
|
|
| |||||||
Total EBITDA | $ | 324.2 | $ | 395.6 | $ | 486.1 | ||||||
|
|
|
|
|
| |||||||
The following table sets forth EBITDA, reconciled to net income and operating profit, for our consolidated results for 2015, 2014 and 2013 (Dollars in millions):
For the year ended October 31, | 2015 | 2014 | 2013 | |||||||||
Net income | $ | 67.2 | $ | 44.9 | $ | 147.5 | ||||||
Plus: interest expense, net | 74.8 | 81.8 | 85.1 | |||||||||
Plus: income tax expense | 48.4 | 115.0 | 98.8 | |||||||||
Plus: depreciation, depletion and amortization expense | 134.6 | 155.8 | 157.6 | |||||||||
Less: equity earnings of unconsolidated affiliates, net of tax | 0.8 | 1.9 | 2.9 | |||||||||
|
|
|
|
|
| |||||||
EBITDA | $ | 324.2 | $ | 395.6 | $ | 486.1 | ||||||
|
|
|
|
|
| |||||||
Net income | $ | 67.2 | $ | 44.9 | $ | 147.5 | ||||||
Plus: interest expense, net | 74.8 | 81.8 | 85.1 | |||||||||
Plus: income tax expense | 48.4 | 115.0 | 98.8 | |||||||||
Plus: other expense, net | 3.2 | 9.5 | 13.1 | |||||||||
Less: equity earnings of unconsolidated affiliates, net of tax | 0.8 | 1.9 | 2.9 | |||||||||
|
|
|
|
|
| |||||||
Operating profit | 192.8 | 249.3 | 341.6 | |||||||||
Less: other expense, net | 3.2 | 9.5 | 13.1 | |||||||||
Plus: depreciation, depletion and amortization expense | 134.6 | 155.8 | 157.6 | |||||||||
|
|
|
|
|
| |||||||
EBITDA | $ | 324.2 | $ | 395.6 | $ | 486.1 | ||||||
|
|
|
|
|
| |||||||
21
The following table sets forth EBITDA for each of our business segments, reconciled to the operating profit (loss) for each segment, for 2015, 2014 and 2013 (Dollars in millions):
For the year ended October 31, | 2015 | 2014 | 2013 | |||||||||
Rigid Industrial Packaging & Services | ||||||||||||
Operating profit | $ | 86.4 | $ | 170.1 | $ | 196.8 | ||||||
Less: other expense, net | 1.3 | 6.8 | 8.9 | |||||||||
Plus: depreciation and amortization expense | 94.0 | 108.4 | 107.4 | |||||||||
|
|
|
|
|
| |||||||
EBITDA | $ | 179.1 | $ | 271.7 | $ | 295.3 | ||||||
|
|
|
|
|
| |||||||
Paper Packaging | ||||||||||||
Operating profit | $ | 109.3 | $ | 125.8 | $ | 123.8 | ||||||
Less: other income, net | (0.4 | ) | - | (0.2 | ) | |||||||
Plus: depreciation and amortization expense | 28.7 | 29.8 | 30.3 | |||||||||
|
|
|
|
|
| |||||||
EBITDA | $ | 138.4 | $ | 155.6 | $ | 154.3 | ||||||
|
|
|
|
|
| |||||||
Flexible Products & Services | ||||||||||||
Operating loss | $ | (36.6 | ) | $ | (78.6 | ) | $ | (11.7 | ) | |||
Less: other expense, net | 2.3 | 2.7 | 4.4 | |||||||||
Plus: depreciation and amortization expense | 8.6 | 13.3 | 15.2 | |||||||||
|
|
|
|
|
| |||||||
EBITDA | $ | (30.3 | ) | $ | (68.0 | ) | $ | (0.9 | ) | |||
|
|
|
|
|
| |||||||
Land Management | ||||||||||||
Operating profit | $ | 33.7 | $ | 32.0 | $ | 32.7 | ||||||
Plus: depreciation, depletion and amortization expense | 3.3 | 4.3 | 4.7 | |||||||||
|
|
|
|
|
| |||||||
EBITDA | 37.0 | 36.3 | 37.4 | |||||||||
Consolidated EBITDA | $ | 324.2 | $ | 395.6 | $ | 486.1 | ||||||
|
|
|
|
|
| |||||||
Year 2015 Compared to Year 2014
Net Sales
Net sales were $3,616.7 million for 2015 compared with $4,239.1 million for 2014. The 14.7 percent decrease in net sales was primarily due to the negative impact of foreign currency translation of 8.7 percent, a decrease due to volumes of 3.9 percent primarily attributable to divestitures completed during 2014, and a decrease due to selling prices/product mix of 2.1 percent due mainly to the pass-through impact of reduced steel costs.
Gross Profit
Gross profit was $669.8 million for 2015 compared with $811.0 million for 2014. Gross profit declined in each of our Rigid Industrial Packaging & Services, Paper Packaging, and Flexible Products & Services segments. The respective reasons for the decline in each segment are described below in the "Segment Review". Gross profit margin was 18.5 percent for 2015 compared to 19.1 percent for 2014.
Selling, General and Administrative Expenses
Selling, general and administrative ("SG&A") expenses decreased 16.8 percent to $413.2 million for 2015 from $496.7 million for 2014. This decrease was primarily due to divestitures of $23.4 million, the impact of foreign currency translation of $48.7 million and the impact of our SG&A reduction efforts implemented during 2015. SG&A expenses were 11.4 percent of net sales for 2015 compared with 11.7 percent of net sales for 2014.
Restructuring Charges
Restructuring charges were $40.0 million for 2015 compared with $16.1 million for 2014. Restructuring charges for 2015 were primarily related to employee separation costs, relocation fees and professional fees incurred for services specifically associated with employee separation and relocation. Restructuring activities and associated costs during 2015 are anticipated to deliver annual run-rate savings of approximately $45.7 million with payback periods ranging from one to three years among the plans. We anticipate completion of the current restructuring programs by early 2018. Refer to Note 7 – Restructuring Charges, within the Notes to Consolidated Financial Statements in Item 8 of this Form 10-K.
Impairment Charges
There were no goodwill impairment charges during 2015 compared with goodwill impairment charges of $50.3 million for 2014. The 2014 charges related to the impairment of all goodwill within the Flexible Products & Services segment.
22
Non-cash asset impairment charges were $45.9 million for 2015 compared with $35.5 million for 2014. In 2015, these charges were primarily related to Venezuelan property, plants, and equipment, information technology software identified as obsolete, and plant closures within the Rigid Industrial Packaging & Services segment. Charges in 2014 related to the fabric hub in the Kingdom of Saudi Arabia in the Flexible Products & Services segment, impairment of assets to be sold for a loss in the Rigid Industrial Packaging & Services segment, and other underutilized and damaged equipment in both the Flexible Products & Services segment and Rigid Industrial Packaging & Services segment.
Gains on Sales of Timberland
The gain on timberland sales was $24.3 million for 2015 compared with $17.1 million for 2014.
Gain on Disposal of Properties, Plants and Equipment, net
The gain on disposal of properties, plants, and equipment, net was $7.0 million and $8.3 million for 2015 and 2014, respectively. See Note 5 – Assets and Liabilities of Businesses Held for Sale and Disposals of Properties, Plants, and Equipment, Net, within the Notes to Consolidated Financial Statements in Item 8 of this Form 10-K.
(Gain) loss on Disposal of Businesses, net
The (gain) loss on disposal of businesses was $9.2 million and ($11.5) million for 2015 and 2014, respectively. For 2015, the loss was primarily related to the strategic divestments of non-core businesses in our Rigid Industrial Packaging & Services segment. For 2014, the gain was primarily related to the sale of our multiwall packaging business.
Operating Profit
Operating profit was $192.8 million for 2015 compared with $249.3 million for 2014. The $56.5 million decrease consisted of $42.0 million and $1.7 million increases in the Flexible Products & Services segment and the Land Management segment respectively offset by $83.7 million and $16.5 million decrease in the Rigid Industrial Packaging & Services segment and the Paper Packaging segment respectively. Factors that contributed to the $56.5 million decrease, when compared to 2014, were lower gross profit of $141.2 million, primarily due to foreign exchange translation and pricing pressures, higher restructuring charges of $23.9 million, higher non-cash asset impairment charges of $10.4 million, lower gains on disposal of businesses, net of $20.7 million, and lower gains on disposal of properties, plants and equipment, net of $1.3 million, which were partially offset by lower SG&A expenses of $83.5 million, lower goodwill impairment charges of $50.3 million, and higher timberland gains of $7.2 million.
EBITDA
EBITDA was $324.2 million and $395.6 million for 2015 and 2014, respectively. The $71.4 million decrease was primarily due to the same factors that impacted operating profit. Depreciation, depletion and amortization expense was $134.6 million for 2015 compared with $155.8 million for 2014. The decrease in depreciation, depletion and amortization expense was primarily due to foreign currency translation and the impact of divestitures.
Trends
In fiscal year 2016, we expect our results to benefit from further execution of our transformation efforts. These improvements are expected to be achieved despite the continuation of a sluggish global industrial economy and continued strengthening of the U.S. dollar relative to other currencies adversely impacting our results.
Segment Review
Rigid Industrial Packaging & Services
Key factors influencing profitability in the Rigid Industrial Packaging & Services segment are:
| • | Selling prices, product mix, customer demand and sales volumes; |
| • | Raw material costs (primarily steel, resin, containerboard and used industrial packaging for reconditioning); |
| • | Energy and transportation costs; |
| • | Benefits from executing the Greif Business System; |
| • | Restructuring charges; |
23
| • | Divestiture of businesses and facilities; and |
| • | Impact of foreign currency translation. |
Net sales decreased 15.9 percent to $2,586.4 million in 2015 from $3,077.0 million in 2014. The decrease in net sales was primarily due to the negative impact of foreign currency translation of 10.3 percent. Changes in prices and product mix decreased sales by 2.7 percent and a net volume decrease caused another 2.9 percent decline, primarily due to the impact of divestitures, from 2014 to 2015. Volumes improved sales by 3.6 percent in Europe, offset by a 6.2 percent impact due to decreased prices and product mix, whereas North America sales decreased 6.3 percent due to the impact of volumes and 5.2 percent due to the impact of price and product mix from 2014 to 2015.
Gross profit was $463.4 million for 2015 compared with $553.4 million for 2014. The $90.0 million decrease in gross profit was primarily due to the negative impact of foreign currency translation of $63.2 million, a writedown of the value of inventory in Venezuela of $9.3 million as part of the overall balance sheet remeasurement as discussed in Note 1 to the Consolidated Financial Statements included in Item 8 of this Form 10-K, divestitures and facility closings, a decrease in raw material prices in North America and pricing pressure in Europe and Asia. Gross profit margins increased to 17.3 percent from 14.9 percent in Asia Pacific for 2015 compared to 2014, respectively, and decreased to 11.1 percent from 14.4 percent in Latin America for 2015 compared to 2014, respectively. Gross profit margins were flat in North America and Europe.
Operating profit was $86.4 million for 2015 compared with $170.1 million for 2014. The $83.7 million decrease was primarily attributable to the approximately $20.6 million negative impact of foreign currency translation, higher restructuring and non-cash asset impairment charges of $51.8 million, and the same factors impacting the decline in gross profit, partially offset by a decrease of $7.6 million on loss on sale of properties, plants, equipment and businesses, net and reductions in SG&A as a result of our transformation efforts. On a geographic basis, for 2015, operating profit increased $10.6 million in Asia Pacific and decreased $39.8 million in Europe, $36.7 million in North America, and $25.9 million in Latin America. The improvement in Asia Pacific was primarily due to improvements in gross profit margin discussed above as well as an increase in gain on sale of properties, plants and equipment and businesses, net of $8.3 million. The decrease in Europe was primarily due to currency translation and higher non-cash asset impairment and restructuring charges of $21.4 million, partially offset by an increase in gain on sales of properties, plants and equipment and businesses, net of $11.0 million. The decrease in North America included a decrease in gain on sales of properties, plants and equipment and business, net of $14.2 million, an increase in non-cash asset impairment charges of $8.8 million, and an increase in restructuring charges of $7.1 million. Excluding the impact of the above-noted items, operating profit in North America decreased $6.6 million for 2015 compared to 2014. The decrease in Latin America was primarily due to the impact of the Venezuela inventory adjustment and non-cash asset impairment charges totaling $24.5 million.
EBITDA was $179.1 million for 2015 compared with $271.7 million for 2014. The $92.6 million decrease was due to the same factors that impacted the segment's operating profit, as described above. Depreciation, depletion and amortization expense was $94.0 million for 2015 compared with $108.4 million for 2014.
Paper Packaging
Key factors influencing profitability in the Paper Packaging segment are:
| • | Selling prices, product mix, customer demand and sales volumes; |
| • | Raw material costs, primarily old corrugated containers; |
| • | Energy and transportation costs; and |
| • | Benefits from executing the Greif Business System. |
Net sales decreased 4.3 percent to $676.1 million for 2015 compared with $706.8 million for 2014. This decrease was attributable to the impact of 2014 divestitures, the extended maintenance outage at the Riverville facility for a longer period of time in 2015 compared to 2014 due to a capital improvement project, partially offset by slightly higher volumes in our sheet business during 2015 compared to 2014.
Gross profit was $163.5 million for 2015 compared with $182.8 million for 2014. This decrease was due to the same factors that impacted the segment's sales, as described above. The adjustments primarily impacted cost of products sold. Gross profit margin was 24.2 percent and 25.9 percent for 2015 and 2014, respectively.
Operating profit was $109.3 million for 2015 compared with $125.8 million for 2014. The decrease was primarily due to the same factors impacting net sales and gross profit, as described above.
EBITDA was $138.4 million for 2015 compared with $155.6 million for 2014. This decrease was due to the same factors that impacted the segment's operating profit, as described above. Depreciation, depletion and amortization expense was $28.7 million and $29.8 million for 2015 and 2014, respectively.
24
Flexible Products & Services
Key factors influencing profitability in the Flexible Products & Services segment are:
| • | Selling prices, product mix, customer demand and sales volumes; |
| • | Raw material costs, primarily resin; |
| • | Energy and transportation costs; |
| • | Benefits from executing the Greif Business System; |
| • | Restructuring charges; |
| • | Divestiture of businesses and facilities; and |
| • | Impact of foreign currency translation. |
Net sales decreased 24.2 percent to $322.6 million for 2015 compared with $425.8 million for 2014. This decrease was attributable to volume decreases of 16.5 percent (primarily due to reduced sales of $39.5 million as a result of the sale of our multiwall packaging business in August 2014), and the negative impact of foreign currency translation of 11.7 percent for 2015 compared with 2014, partially offset by an increase in selling prices.
Gross profit was $33.8 million for 2015 compared with $62.7 million for 2014, a decrease of 46.1 percent. This decrease was due to the same factors impacting net sales, as described above. Gross profit margin decreased to 10.5 percent for 2015 from 14.7 percent for 2014.
Operating loss was $36.6 million for 2015 compared with an operating loss of $78.6 million for 2014. This decrease in operating loss was primarily due to a decrease in non-cash asset impairment charges of $72.5 million for 2015 compared with 2014 and SG&A cost savings realized as part of our transformation efforts, partially offset by the same factors impacting the segment's net sales.
EBITDA was negative $30.3 million for 2015 compared with negative $68.0 million for 2014. This improvement was due to the same factors that impacted the segment's operating loss, as described above. Depreciation, depletion and amortization expense was $8.6 million for 2015 compared with $13.3 million for 2014, respectively. This decrease was due to the impact of divestitures and facility closures.
Land Management
Key factors influencing profitability in the Land Management segment are:
| • | Planned level of timber sales; |
| • | Selling prices and customer demand; |
| • | Gains on timberland sales; and |
| • | Gains on the disposal of development, surplus and HBU properties ("special use property"). |
In order to maximize the value of our timber properties, we continue to review our current portfolio and explore the development of certain of these properties. This process has led us to characterize our property as follows:
| • | Surplus property, meaning land that cannot be efficiently or effectively managed by us, whether due to parcel size, lack of productivity, location, access limitations or for other reasons. |
| • | HBU property, meaning land that in its current state has a higher market value for uses other than growing and selling timber. |
| • | Development property, meaning HBU land that, with additional investment, may have a significantly higher market value than its HBU market value. |
| • | Core timberland, meaning land that is best suited for growing and selling timber. |
We report the disposal of surplus and HBU property in our consolidated statements of income under "gain on disposals of properties, plants and equipment, net" and report the sale of development property under "net sales" and "cost of products sold." All HBU and development property, together with surplus property, continues to be used by us to productively grow and sell timber until sold.
25
Whether timberland has a higher value for uses other than growing and selling timber is a determination based upon several variables, such as proximity to population centers, anticipated population growth in the area, the topography of the land, aesthetic considerations, including access to lakes or rivers, the condition of the surrounding land, availability of utilities, markets for timber and economic considerations both nationally and locally. Given these considerations, the characterization of land is not a static process, but requires an ongoing review and re-characterization as circumstances change.
As of October 31, 2015, we estimated that there were approximately 21,175 acres in the United States of special use property, which we expect will be available for sale in the next five to seven years.
Net sales were $31.6 million and $29.5 million for 2015 and 2014, respectively. The increase in net sales was primarily due to the sale of the remaining 5,200 acres of development properties in Canada during the fourth quarter of 2015, partially offset by lower planned timber sales. While timber sales are subject to fluctuations, we seek to maintain a consistent cutting schedule, within the limits of market and weather conditions and the age distribution of timber stands.
Operating profit was $33.7 million, including $24.3 million of gains relating to the sale of core timberland, in 2015 compared with operating profit of $32.0 million, including $17.1 million of gains relating to the sale of core timberland, in 2014.
EBITDA was $37.0 million and $36.3 million for 2015 and 2014, respectively. This increase was due to the same factors that impacted the segment's operating profit. Depreciation, depletion and amortization expense was $3.3 million for 2015 compared with $4.3 million for 2014.
Other Income Statement Changes
Interest Expense, Net
Interest expense, net was $74.8 million and $81.8 million 2015 and 2014, respectively. The $7.0 million decrease was primarily due to lower interest rates in 2015 compared to 2014.
Other Expense, Net
Other expense, net was $3.2 million and $9.5 million for 2015 and 2014, respectively. The decrease in other expense was due to other income of $4.9 million related to the remeasurement of our Venezuelan monetary assets and liabilities during the year ended October 31, 2015.
U.S. and Non-U.S. Income before Income Tax Expense
Income before income tax expense derived from non-U.S. operations as a percentage of consolidated income before income tax expense increased from negative 10.8 percent to a positive 22.5 percent for the years ended October 31, 2014 and 2015, respectively. After eliminating the impact of timberland gains, restructuring charges, non-cash asset impairment charges, acquisition-related costs, gains and losses on the sales of businesses, remeasurement of our Venezuelan monetary assets and liabilities and the Venezuelan non-monetary inventory adjustment to net realizable value, income before income tax expense derived from non-U.S. operations as a percentage of consolidated income before income tax expense increased from 38.6 percent to 43.9 percent for the years ended October 31, 2014 and 2015, respectively. Refer to the following tables for details of the U.S and non-U.S income before income taxes results for the periods presented.
26
Summary | ||||||||
| Year ended October 31, | ||||||||
| 2015 | 2014 | |||||||
Non-U.S. % of Consolidated Net Sales | 53.3 | % | 55.0 | % | ||||
U.S. % of Consolidated Net Sales | 46.7 | % | 45.0 | % | ||||
|
|
|
| |||||
| 100.0 | % | 100.0 | % | |||||
|
|
|
| |||||
Non-U.S. % of Consolidated I.B.I.T. | 22.5 | % | -10.8 | % | ||||
U.S. % of Consolidated I.B.I.T. | 77.5 | % | 110.8 | % | ||||
|
|
|
| |||||
| 100.0 | % | 100.0 | % | |||||
|
|
|
| |||||
Non-U.S. % of Consolidated I.B.I.T. before Special Items | 43.9 | % | 38.6 | % | ||||
U.S. % of Consolidated I.B.I.T. before Special Items | 56.1 | % | 61.4 | % | ||||
|
|
|
| |||||
| 100.0 | % | 100.0 | % | |||||
|
|
|
| |||||
Non-U.S. I.B.I.T. Reconciliation | ||||||||
| Year ended October 31, | ||||||||
| 2015 | 2014 | |||||||
Non-U.S. I.B.I.T. | 25.8 | (17.0 | ) | |||||
Non-cash asset impairment charges | 35.3 | 79.8 | ||||||
Restructuring charges | 27.3 | 14.9 | ||||||
(Gain) Loss on sale of businesses | (9.4 | ) | 11.5 | |||||
Impact of Venezuela devalutaion on cost of goods sold | 9.3 | - | ||||||
Impact of Venezuela devalutaion on other income/expense | (4.9 | ) | - | |||||
|
|
|
| |||||
Total Non-U.S. Special Items | 57.6 | 106.2 | ||||||
|
|
|
| |||||
Non-U.S. I.B.I.T. before Special Items | 83.4 | 89.2 | ||||||
|
|
|
| |||||
U.S. I.B.I.T. Reconciliation | ||||||||
| Year ended October 31, | ||||||||
| 2015 | 2014 | |||||||
U.S. I.B.I.T. | 89.0 | 175.0 | ||||||
Non-cash asset impairment charges | 10.6 | 6.0 | ||||||
Timberland gains | (24.3 | ) | (17.1 | ) | ||||
Restructuring charges | 12.7 | 1.2 | ||||||
(Gain) Loss on sale of businesses | 18.6 | (23.0 | ) | |||||
|
|
|
| |||||
Total U.S. Special Items | 17.6 | (32.9 | ) | |||||
|
|
|
| |||||
U.S. I.B.I.T. before Special Items | 106.6 | 142.1 | ||||||
|
|
|
| |||||
| * | Income Before Income Tax expense = I.B.I.T. |
Income Tax Expense
We have operations in over 50 countries worldwide. Operations outside of the United States are subject to additional risks that may not exist, or be as significant, within the United States. Our global operations in these countries results in the need to address complex and varying tax systems on a constantly changing basis.
Preparation of our financial statements requires the use of estimates and assumptions that affect the reported amounts of our assets and liabilities and revenues and expenses as of the balance sheet date. The multitude of tax jurisdictions, with varying laws, creates a level of uncertainty, and significant judgment is required when addressing the complex tax systems. Our effective tax rate and the amount of taxes we pay are dependent upon various factors including the following: the laws and regulations of the tax jurisdictions in which income is earned; the recognition of permanent book/tax basis differences realized through non-deductible goodwill; the ability to realize deferred tax assets at certain international subsidiaries; negotiation and dispute resolution with taxing authorities in the U.S. and international jurisdictions; and changes in tax laws, regulations, administrative rulings and common law.
The provision for income taxes is computed using the asset and liability method, under which deferred tax assets and liabilities are recognized currently for the expected future tax consequences of temporary differences between the financial reporting and the tax bases of assets and liabilities. This method includes an estimate of the future realization of tax losses. Deferred tax assets and liabilities are measured using the currently enacted tax rates that apply to taxable income in effect for the years in which those tax assets are expected to be realized or settled.
During 2015, our effective tax rate was 42.2 percent compared to 72.8 percent for 2014. The effective tax rate for 2014 was impacted by a combination of factors as described for 2015 below.
27
We record a valuation allowance to reduce deferred tax assets to the amount that is believed more likely than not to be realized. In making this assessment, we consider applicable facts and circumstances, such as the scheduled reversal of deferred tax assets and liabilities, projected future sources of taxable income, and certain tax planning strategies. A valuation allowance is recognized for the portion of the deferred tax assets that is not expected to be realized.
During 2015, the valuation allowance account decreased by $19.0 million, which consisted of the following: $17.9 million of currency translations; $3.4 million of net increases in new valuation allowances; and $4.5 million net incremental decreases against net operating losses and other net deferred tax assets. The impact of the decrease in valuation allowances were not material to our 2015 effective tax rate.
During 2014, the valuation allowance account increased by $29.5 million, which consisted of the following: $20.0 million of net increases in new valuation allowances; and $9.5 million of incremental net increases against current year net operating losses and other net deferred tax assets. The $20.0 million of increases in new valuation allowances were primarily related to the jurisdictions of Belgium, Germany, and the Netherlands. The additional $9.5 million of incremental net increases against current year net operating losses and other net deferred tax assets were primarily related to the jurisdictions of Brazil, China, Germany and the Kingdom of Saudi Arabia. As of October 31, 2014, it was estimated that it is more likely than not that these deferred tax assets will not be realized. In 2014, our total valuation allowances, substantially related to non-U.S. jurisdictions, contributed 18.7% to our effective tax rate.
We analyze potential income tax liabilities related to uncertain tax positions in the United States and international jurisdictions. The analysis of potential income tax liabilities results in estimates of income tax liabilities recognized for uncertain tax positions following the guidance of Accounting Standards Codification ("ASC") 740, "Income Taxes". The estimation of potential tax liabilities related to uncertain tax positions involves significant judgment in evaluating the impact of uncertainties in the application of ASC 740 and other complex tax laws. We periodically analyze both potential income tax liabilities and existing liabilities for uncertain tax positions resulting in both new reserves and adjustments to existing reserves in light of changing facts and circumstances. This includes the release of existing liabilities for uncertain tax positions based on the expiration of statutes of limitation. During 2015 and 2014, recognition of uncertain tax positions increased due to new positions primarily attributable to non-U.S. jurisdictions. Uncertain tax positions contributed 2.5 percent to our effective tax rate in 2015.
The ultimate resolution of potential income tax liabilities may result in a payment that is materially different from our current estimate of income tax liabilities recognized as liabilities for uncertain tax positions. If our estimates recognized under the standards of ASC 740 prove to be different than what is ultimately determined, there is inherent risk that such resolution could have a material impact on our financial condition and results of operations.
While it is often difficult to predict the final outcome or the timing of resolution of any particular tax matter, we believe that our tax accounts related to uncertain tax positions are appropriately stated.
During 2014, we disposed of certain operations, including the divestiture of a nonstrategic business in the Rigid Industrial Packaging & Services segment in third quarter and our multiwall packaging business, which resulted in gains and losses recognized, including an amount related to goodwill of $13.6 million and $21.8 million, respectively, which did not have a tax basis. Moreover, our Flexible Products & Services reporting unit recognized the impairment of goodwill of $50.3 million that did not have tax basis. For 2014, the combination of these items contributed 15.6 percent to our effective tax rate.
As of October 31, 2015, we had not recognized U.S. deferred income taxes on a cumulative total of $552 million of undistributed earnings from certain non-U.S. subsidiaries. Our intention is to reinvest these earnings indefinitely outside the U.S., or to repatriate the earnings only when it is tax-efficient to do so. Therefore, no U.S. tax provision has been accrued related to the repatriation of these earnings. It is not practicable to estimate the amount of any additional taxes which may be payable on the undistributed earnings given the various alternatives we could employ should we decide to repatriate these earnings in the future.
Refer to Note 12 to the Notes to Consolidated Financial Statements in Item 8 of this Form 10-K for further discussion.
Equity earnings of unconsolidated affiliates, net of tax
We recorded $0.8 million and $1.9 million of equity earnings of unconsolidated affiliates, net of tax, during 2015 and 2014, respectively.
Net loss attributable to noncontrolling interests
Net loss attributable to noncontrolling interests represents the portion of earnings from the operations of our majority owned subsidiaries that was added to net income to arrive at net income attributable to us. Net loss attributable to noncontrolling interests was $4.7 million and $46.6 million for 2015 and 2014, respectively. The decrease in net loss attributable to noncontrolling interests was due to the overall decrease in the net operating loss of the Flexible Packaging JV due to the goodwill impairment recorded in the year ended October 31, 2014.
Net income attributable to Greif, Inc.
Based on the factors noted above, net income attributable to Greif, Inc. decreased $19.6 million to $71.9 million in 2015 from $91.5 million in 2014.
28
Year 2014 Compared to Year 2013
Net Sales
Net sales were $4,239.1 million for 2014 compared with $4,219.9 million for 2013. The $19.2 million increase in 2014 compared with 2013 was attributable to Paper Packaging ($30.8 million increase), Rigid Industrial Packaging & Services ($14.9 million increase), Land Management ($3.6 million decrease), and Flexible Products & Services ($22.9 million decrease).
The 0.5 percent increase in net sales for 2014 compared with 2013 was primarily due to an increase in sales prices of 2.5 percent, partially offset by a decrease in sales volumes of 0.8 percent and a 1.2 percent negative impact of foreign currency translation. Volumes decreased in the Rigid Industrial Packaging & Services and the Flexible Packaging & Services segment with prices increasing in all segments.
Operating Costs
Gross profit decreased to $811.0 million for 2014 from $832.2 million for 2013. Gross profit margin was 19.1 percent for 2014 versus 19.7 percent for 2013. The decrease in gross profit margin was principally due to lower volumes in the Rigid Industrial Packaging & Services segment of 0.6 percent and the Flexible Packaging & Services segment of 5.9 percent partially offset by price and volume increases in the Paper Packaging segment of 3.2 percent and 1.4 percent, respectively.
Selling, general and administrative ("SG&A") expenses were $496.7 million, or 11.7 percent of net sales, in 2014 compared with $477.3 million, or 11.3 percent of net sales, in 2013. The $19.4 million increase in SG&A expenses was primarily due to higher professional fees of $6.7 million, salaries of $4.2 million and bad debt of $3.7 million.
Restructuring Charges
Restructuring charges were $16.1 million and $4.8 million for 2014 and 2013, respectively. Restructuring charges for 2014 consisted of $12.0 million in employee separation costs and $4.1 million in other costs primarily consisting of lease termination costs, professional fees and other miscellaneous exit costs. These charges were related to the rationalization of operations and closing underperforming assets in both the Flexible Products & Services and Rigid Industrial Packaging & Services segments. Eight plants were closed during 2014, and 850 employees were severed throughout the year as part of our restructuring efforts. Anticipated cost savings related to current year restructuring activity is expected to be approximately $16.8 million with payback periods ranging from one to five years among the plans. As of October 31, 2014, $9.2 million of restructuring charges were anticipated, but were not yet incurred. Restructuring charges for 2013 consisted of $2.8 million in employee separation costs and $2.0 million in other costs primarily consisting of lease termination costs, professional fees and other miscellaneous exit costs. These charges were related to the consolidation of operations in the Rigid Industrial Packaging & Services. No plants were closed during 2013, but 278 employees were severed during 2013 as part of our restructuring efforts. The anticipated cost savings related to fiscal year 2013 restructuring activity was expected to be approximately $7.7 million with a payback period of less than one year which were mostly realized throughout 2014. For restructuring activities entered into in 2014 and 2013, actual cost savings realized were not materially different than those anticipated. Refer to Note 7 – Restructuring Charges, within the Notes to Consolidated Financial Statements in Item 8 of this Form 10-K.
Impairment Charges
Goodwill impairment charges were $50.3 million for 2014. These charges were related to the impairment of all goodwill within our Flexible Products & Services segment. There were no goodwill impairment charges for 2013.
Non-cash asset impairment charges were $35.5 million and $31.4 million for 2014 and 2013, respectively. In 2014, these charges were primarily related to the fabric hub in the Kingdom of Saudi Arabia in the Flexible Products & Services segment and various other locations in both the Flexible Products & Services segment and Rigid Industrial Packaging & Services segment compared to impairment charges in 2013 related to various locations in the Rigid Industrial Packaging & Services segment and Flexible Products & Services segment.
Acquisition-Related Costs
Acquisition-related costs were $1.6 million and $0.8 million for 2014 and 2013, respectively. For 2014, these costs included $1.1 million of acquisition-related costs and $0.5 million of post-acquisition integration costs. For 2013, these costs included $0.4 million of acquisition-related costs and $0.4 million of post-acquisition integration costs attributable to acquisitions completed during 2011.
Operating Profit
Operating profit was $249.3 million and $341.6 million in 2014 and 2013, respectively. The $92.3 million decrease was due to lower results in Land Management ($0.7 million), Rigid Industrial Packaging & Services ($26.7 million), and Flexible Products & Services ($66.9 million), partially offset by higher results in Paper Packaging ($2.0 million); compared with 2013. The decrease compared to 2013 is primarily attributable to an increase in non-cash asset impairment charges of $54.4 million, higher SG&A costs of $19.4 million, adverse weather-related conditions in two of our business segments and the negative impact of foreign currency translation.
29
EBITDA
EBITDA was $395.6 million and $486.1 million for 2014 and 2013, respectively. The $90.5 million decrease was primarily due to the same segment results that impacted operating profit. Depreciation, depletion and amortization expense was $155.8 million for 2014 compared with $157.6 million for 2013.
Segment Review
Rigid Industrial Packaging & Services
Net sales were $3,077.0 million for 2014 compared with $3,062.1 million for 2013 The 0.5 percent increase in net sales for 2014 compared with 2013 was primarily due to a 2.8 percent increase in sales prices primarily from the pass-through of higher raw material costs to customers offset by a 0.6 percent decrease in volumes and a 1.7 percent negative impact of foreign currency translation.
Gross profit was $553.4 million and $555.5 million for 2014 and 2013, respectively. Gross profit margin decreased to 18.0 percent from 18.1 percent for 2014 and 2013, respectively.
Operating profit was $170.1 million and $196.8 million for 2014 and 2013, respectively. The $26.7 million decrease was primarily due to a $9.1 million non-cash loss on the sale of a business, increases in SG&A expenses of $20.2 million primarily due to professional fees and higher restructuring costs and the impact of adverse weather-related conditions in North America during the first two quarters of 2014.
EBITDA was $271.7 million and $295.3 million for 2014 and 2013, respectively. This decrease was due to the same factors that impacted the segment's operating profit. Depreciation, depletion and amortization expense was $108.4 million for 2014 compared with $107.4 million for 2013.
Paper Packaging
Net sales were $706.8 million for 2014 compared with $676.0 million for 2013. The 4.6 percent increase in net sales for 2014 compared with 2013 was primarily due to a 3.2 percent increase in sales prices due to implementation and realization of two containerboard price increases since the third quarter of 2012 and a 1.4 percent increase in volumes.
Gross profit was $182.8 million for 2014 compared with $179.8 million for 2013. This increase was primarily due to higher selling prices, partially offset by input and logistic costs associated with adverse weather-related conditions during the first two quarters of 2014. Gross profit margin decreased to 25.9 percent from 26.6 percent for 2014 and 2013, respectively.
Operating profit was $125.8 million and $123.8 million for 2014 and 2013, respectively. The $2.0 million increase was primarily due to higher prices and higher volumes.
EBITDA was $155.6 million and $154.3 million for 2014 and 2013, respectively. This increase was due to the same factors that impacted the segment's operating profit. Depreciation, depletion and amortization expense was $29.8 million for 2014 compared with $30.3 million for 2013.
Flexible Products & Services
Net sales were $425.8 million for 2014 compared with $448.7 million for 2013. The 5.1 percent decrease in net sales for 2014 compared with 2013 was primarily due to a 5.9 percent decrease in sales volumes related to the continuing impact of the occupation of our manufacturing facility in Turkey during the second quarter of 2014 and reduced sales of approximately $13 million as the result of the sale of our multiwall packaging business during the fourth quarter of 2014 offset by a 0.6 percent increases in prices due to the pass-through of higher polypropylene costs to customers and a positive 0.2 percent impact of foreign currency translation compared with 2013.
Gross profit was $62.7 million for 2014 versus $80.5 million for 2013. Gross profit margin was 14.7 percent and 17.9 percent for 2014 and 2013, respectively. The decrease in gross profit margin was primarily due to the impact of the occupation of our manufacturing facility in Turkey during the second quarter of 2014, which has resulted in higher costs incurred to find alternative supply sources to satisfy customers and the sale of our multiwall packaging business during the fourth quarter of 2014.
There was an operating loss of $78.6 million for 2014 compared with an operating loss of $11.7 million for 2013. The decrease was due to the negative impact of the non-cash asset impairment charges and the occupation of our manufacturing facility in Turkey during the second quarter of 2014, partially offset by the gain on the sale of our multiwall packaging business during the fourth quarter of 2014.
EBITDA was negative $68.0 million in 2014 compared with negative $0.9 million for 2013. This decrease was due to the same factors that impacted the segment's operating profit. Depreciation, depletion and amortization expense was $13.3 million for 2014 compared with $15.2 million for 2013.
30
Land Management
Net sales were $29.5 million and $33.1 million for 2014 and 2013, respectively, primarily due to lower planned timber sales. While timber sales are subject to fluctuations, we seek to maintain a consistent cutting schedule, within the limits of market and weather conditions and the age distribution of timber stands.
Operating profit was $32.0 million, including $17.1 million of gains relating to the sale of timberland, in 2014 compared with operating profit of $32.7 million, including $17.3 million of gains relating to the sale of timberland, in 2013.
EBITDA was $36.3 million and $37.4 million for 2014 and 2013, respectively. This decrease was due to the same factors that impacted the segment's operating profit. Depreciation, depletion and amortization expense was $4.3 million for 2014 compared with $4.7 million for 2013.
As of October 31, 2014, we estimated that there were approximately 31,550 acres in Canada and the United States of special use property, which we expect will be available for sale in the next five to seven years.
Other Income Statement Changes
Interest Expense, Net
Interest expense, net was $81.8 million and $83.8 million 2014 and 2013, respectively. The $2.0 million decrease was primarily due to lower interest rates in 2014 compared to 2013.
Debt Extinguishment Charges
There were no debt extinguishment charges for 2014 compared with $1.3 million for 2013. The 2013 debt extinguishment charge related to amending and restating our senior secured credit agreement during the first quarter of 2013.
Other Expense, Net
Other expense, net was $9.5 million and $13.1 million for 2014 and 2013, respectively.
Income Tax Expense
Our effective tax rate was 72.8 percent compared to 40.6 percent for 2013. The effective tax rate for 2014 was impacted by a combination of factors as described for 2014 below.
We record a valuation allowance to reduce deferred tax assets to the amount that is believed more likely than not to be realized. In making this assessment, we consider applicable facts and circumstances, such as the scheduled reversal of deferred tax assets and liabilities, projected future taxable income, and certain tax planning strategies. For the deferred tax assets we have determined will not be realized, a valuation allowance is recognized.
Our $29.5 million increase in valuation allowances during 2014 consists of the following: $20.0 million of net increases in new valuation allowances; and $9.5 million of incremental net increases against current year net operating losses and other net deferred tax assets. The $20.0 million of increases in new valuation allowances were primarily related to the jurisdictions of Belgium, Germany, and the Netherlands. The additional $9.5 million of incremental net increases against current year net operating losses and other net deferred tax assets were primarily related to the jurisdictions of Brazil, China, Germany and the Kingdom of Saudi Arabia. As of October 31, 2014, it was estimated that it is more likely than not that these deferred tax assets will not be realized.
31
For 2014, our total valuation allowances, substantially related to non-U.S. jurisdictions, contributed 18.7% to our effective tax rate.
We analyze potential income tax liabilities related to uncertain tax positions in the United States and international jurisdictions. The analysis of potential income tax liabilities results in estimates of income tax liabilities recognized for uncertain tax positions following the guidance of ASC 740, "Income Taxes". The estimation of potential tax liabilities related to uncertain tax positions involves significant judgment in evaluating the impact of uncertainties in the application of ASC 740 and other complex tax laws. We periodically analyze both potential income tax liabilities and existing liabilities for uncertain tax positions resulting in both new reserves and adjustments to existing reserves in light of changing facts and circumstances. This includes the release of existing liabilities for uncertain tax positions based on the expiration of statutes of limitation. During 2014, recognition of uncertain tax positions increased due to new positions primarily attributable to non-U.S. jurisdictions. Uncertain tax positions contributed 7.2 percent to our effective tax rate in 2014.
The ultimate resolution of potential income tax liabilities may result in a payment that is materially different from our current estimate of income tax liabilities recognized as liabilities for uncertain tax positions. If our estimates recognized under the standards of ASC 740 prove to be different than what is ultimately determined, there is inherent risk that such resolution could have a material impact on our financial condition and results of operations.
While it is often difficult to predict the final outcome or the timing of resolution of any particular tax matter, we believe that our tax accounts related to uncertain tax positions are appropriately stated.
We have estimated the reasonably possible expected net change in unrecognized tax benefits through October 31, 2015 under ASC 740. Our estimate is based on lapses of the applicable statutes of limitations, settlements and payments of uncertain tax positions. The estimated net decrease in unrecognized tax benefits for the next 12 months ranges from $0 to $5.5 million. Actual results may differ materially from this estimate.
During 2014, we disposed of certain operations including the divestiture of a nonstrategic business in the Rigid Industrial Packaging & Services segment in third quarter and our multiwall packaging business in the fourth quarter, which resulted in gains and losses recognized, including an amount related to goodwill of $13.6 million and $21.8 million, respectively, which did not have a tax basis. Moreover, our Flexible Products & Services reporting unit recognized the impairment of goodwill of $50.3 million that did not have tax basis. For 2014, the combination of these items contributed 15.6 percent to our effective tax rate.
During 2014, we completed a review of the income tax accounts of our non-U.S. subsidiaries. This process resulted in our recognition of adjustments to our income tax balances and resulted in a material weakness in the internal controls over financial reporting in our income tax accounting process related to non-U.S. subsidiaries.
As of October 31, 2014, we had not recognized U.S. deferred income taxes on a cumulative total of $566.6 million of undistributed earnings of our non-U.S. subsidiaries. It is our assertion that as of October 31, 2014 such earnings are permanently reinvested outside of the U.S. Determining the unrecognized deferred tax liability related to investments in these non-U.S. subsidiaries that are indefinitely reinvested is not practicable.
Refer to Note 12 to the Notes to Consolidated Financial Statements in Item 8 of this Form 10-K for further discussion.
Equity earnings of unconsolidated affiliates, net of tax
We recorded $1.9 million and $2.9 million of equity earnings of unconsolidated affiliates, net of tax, during 2014 and 2013, respectively.
Net( income) loss attributable to noncontrolling interests
Net (income) loss attributable to noncontrolling interests represents the portion of earnings from the operations of our majority owned subsidiaries that was (deducted from) added to net income to arrive at net income attributable to us. Net (income) loss attributable to noncontrolling interests was $46.6 million and ($2.8) million for 2014 and 2013, respectively.
Net income attributable to Greif, Inc.
Based on the foregoing, net income attributable to Greif, Inc. decreased $53.2 million to $91.5 million in 2014 from $144.7 million in 2013.
OTHER COMPREHENSIVE INCOME CHANGES
Foreign currency translation.
In accordance with ASC 830, "Foreign Currency Matters," the assets and liabilities denominated in a foreign currency are translated into United States Dollars at the rate of exchange existing at the end of the current period, and revenues and expenses are translated at average exchange rates over the month in which they are incurred. The cumulative translation adjustments, which represent the effects of translating assets and liabilities of our international operations, are presented in the consolidated statements of changes in equity in accumulated other comprehensive income (loss). Transaction gains and losses on foreign currency transactions denominated in a currency other than our functional currency are credited or charged to income. The amounts included in other (income) expense, net related to transactions, were $1.1 million, $3.9 million and $0.8 million for 2015, 2014 and 2013, respectively.
32
Minimum pension liability, net
Change in minimum pension liability, net for 2015 and 2014 was $9.0 million and ($34.7) million, respectively. The increase in comprehensive income (loss) resulting from the change in minimum pension liability, net was primarily attributable to an increase in discount rates in the United States.
BALANCE SHEET CHANGES
Working capital changes
The $97.6 million decrease in accounts receivable to $403.7 million as of October 31, 2015 from $501.3 million as of October 31, 2014 was primarily due to timing of collections and the impact of foreign currency translation.
The $84.1 million decrease in inventories to $297.0 million as of October 31, 2015 from $381.1 million as of October 31, 2014 was primarily due to the negative impact of foreign currency translation and divestitures completed during the twelve months ended October 31, 2015.
The $115.8 million decrease in accounts payable to $355.3 million as of October 31, 2015 from $471.1 million as of October 31, 2014 was primarily due to the timing of payments, benefits from early payment discounts where financially justified, impact of foreign currency translation, divestitures completed during the twelve months ended October 31, 2015, and eliminations of compensation payables resulting from a shift to an in-house labor model in a facility within our Flexible Products & Services segment.
Other balance sheet changes
The $73.1 million decrease in goodwill to $807.1 million as of October 31, 2015 from $880.2 million as of October 31, 2014 was due to the negative impact of foreign currency translation and the allocation of goodwill to divestitures and businesses held for sale.
The $33.8 million decrease in other intangible assets to $132.7 million as of October 31, 2015 from $166.5 million as of October 31, 2014 was primarily due to the negative impact of foreign currency translation and the intangible assets sold as part of the sales of businesses.
The $90.6 million decrease in properties, plants and equipment to $1,217.7 million as of October 31, 2015 from $1,308.3 million as of October 31, 2014 was primarily due to the negative impact of foreign currency translation, non-cash asset impairments, and the divestitures completed during the twelve months ended October 31, 2015.
The $28.8 million increase in long-term debt to $1,116.2 million as of October 31, 2015 from $1,087.4 million as of October 31, 2014 was attributable to increased working capital needs, partially offset by the impact of foreign currency translation.
The $112.1 million increase in foreign currency translation loss to $256.6 million as of October 31, 2015 from a loss of $144.5 million as of October 31, 2014 was primarily due to the weakening of several key foreign currencies compared with the U.S. Dollar.
LIQUIDITY AND CAPITAL RESOURCES
Our primary sources of liquidity are operating cash flows and borrowings under our senior secured credit facility and the senior notes we have issued and, to a lesser extent, proceeds from our trade accounts receivable credit facility and proceeds from the sale of our non-United States accounts receivable. We use these sources to fund our working capital needs, capital expenditures, cash dividends, common stock repurchases and acquisitions. We anticipate continuing to fund these items in a like manner. We currently expect that operating cash flows, borrowings under our senior secured credit facility, proceeds from our U.S. trade accounts receivable credit facility and proceeds from the sale of our non-United States accounts receivable will be sufficient to fund our anticipated working capital, capital expenditures, cash dividends, debt repayment, potential acquisitions of businesses and other liquidity needs for at least 12 months. However, if funds held outside the U.S. are needed for operations in the U.S., we would be required to accrue and pay U.S. taxes to repatriate them. For those international earnings considered to be permanently reinvested, we currently have no plans or intentions to repatriate such funds for U.S. operations.
We account for our operations in Venezuela using hyperinflationary accounting. As a result of recent government action and significant continued devaluation of the Bolivar, we reconsidered which of the available exchange rates best reflects the economics of our business activities there and, as a result, remeasured our local-currency denominated balance sheet using the SIMADI exchange rate during the third quarter of 2015. The impact of that remeasurement was a $19.4 million non-deductible charge to net income and a remaining net investment in Venezuela of approximately $0.5 million as of October 31, 2015. Venezuelan operations are translated using the SIMADI rate from August 1, 2015 forward. Our Venezuelan operations have not historically been, and are not expected to be, a significant portion of our consolidated operations.
33
Capital Expenditures
During 2015, 2014 and 2013, we invested $141.3 million (excluding $38.4 million for timberland properties), $137.9 million (excluding $56.8 million for timberland properties), and $136.4 million (excluding $9.0 million for timberland properties) in capital expenditures, respectively.
We anticipate future capital expenditures, excluding the potential purchase of timberland properties, of approximately $110 million during the year ending October 31, 2016. These expenditures will replace and improve existing equipment and fund new facilities.
Sale of Non-United States Accounts Receivable
Certain of our international subsidiaries have entered into discounted receivables purchase agreements and factoring agreements (collectively, the "RPAs") pursuant to which trade receivables generated from certain countries other than the United States and which meet certain eligibility requirements are sold to certain international banks or their affiliates. In particular, in April 2012, certain of our international subsidiaries entered into an RPA with affiliates of a major international bank (the "2012 RPA"). On April 20, 2015, Cooperage Receivables Finance B.V. and Greif Coordination Center BVBA amended and extended the term of the 2012 RPA for an additional two years. Under the 2012 RPA as amended, the number of entities participating in the agreement have decreased to now include only the following entities: Greif Belgium BVBA, EarthMinded Benelux N.V. (formerly Pack2pack Rumbeke N.V.), Greif Nederland B.V., Greif Italia S.p.A., Greif Plastics Italy Srl (formerly Fustiplast S.p.A.), Greif France S.A.S., Greif Packaging Spain S.A., Greif Germany GmbH, Greif Plastics Germany GmbH (formerly Fustiplast GmbH), and Greif Portugal S.A. Additionally, the terms have been amended to decrease the maximum amount of receivables that may be sold and outstanding under the agreement at any time to €100 million ($110.5 million as of October 31, 2015). A significant portion of the proceeds from the 2012 RPA was used to pay the obligations under previous RPAs, which were then terminated, and to pay expenses incurred in connection with this transaction. The subsequent proceeds from the RPAs are available for working capital and general corporate purposes. Under the terms of a performance and indemnity agreement, the performance obligations of our international subsidiaries under the 2012 RPA have been guaranteed by Greif, Inc.
Refer to Note 3 to the Consolidated Financial Statements included in Item 8 of this Form 10-K for additional information regarding these various RPAs.
Acquisitions and Divestitures
During 2015, we completed eight divestitures and no material acquisitions. The divestitures were of nonstrategic businesses, six in the Rigid Industrial Packaging & Services segment: and two in the Flexible Products & Services segment. The loss on disposal of businesses was $9.2 million for the year ended October 31, 2015 on proceeds of $19.6 million.
Refer to Note 2 to the Consolidated Financial Statements included in Item 8 of this Form 10-K for disclosures regarding our 2014 acquisitions and divestitures.
Borrowing Arrangements
Long-term debt is summarized as follows (Dollars in millions):
| October 31, 2015 | October 31, 2014 | |||||||
Amended Credit Agreement | $ | 217.4 | $ | 169.2 | ||||
Senior Notes due 2017 | 300.7 | 301.2 | ||||||
Senior Notes due 2019 | 246.0 | 245.2 | ||||||
Senior Notes due 2021 | 219.4 | 252.5 | ||||||
Amended Receivables Facility | 147.6 | 110.0 | ||||||
Other long-term debt | 15.8 | 26.9 | ||||||
|
|
|
| |||||
| 1,146.9 | 1,105.0 | |||||||
Less current portion | (30.7 | ) | (17.6 | ) | ||||
|
|
|
| |||||
Long-term debt | $ | 1,116.2 | $ | 1,087.4 | ||||
|
|
|
| |||||
Credit Agreement
We and two of our international subsidiaries have a senior secured credit agreement (the "Amended Credit Agreement") with a syndicate of financial institutions.
The Amended Credit Agreement provides us with an $800 million revolving multicurrency credit facility and a $200 million term loan, both expiring in December 2017, with an option to add $250 million to the facilities with the agreement of the lenders. The $200 million term loan is scheduled to amortize by the payment of principal in the amount of $2.5 million each quarter-end for the first eight quarters, beginning January 2013, $5.0 million each quarter-end for the next twelve quarters and the payment of the remaining balance on the maturity date. In August 2014, we made an unscheduled principal payment on the term loan of $25 million. The remaining term loan balance is scheduled to amortize, beginning January 2015, by the payment of principal in the amount of $4.3 million over the next twelve quarters and the payment of the remaining balance on the maturity date. The revolving credit facility under the Amended Credit Agreement is available to fund ongoing working capital and capital expenditure needs, for general corporate purposes and to finance acquisitions. Interest is based on a Eurodollar rate or a base rate that resets periodically plus an agreed upon margin amount. The total available borrowing under this facility was $706.3 million as of October 31, 2015, which included a reduction of $14.4 million for outstanding letters of credit, all of which is available without violating covenants. The weighted average interest rate under the Amended Credit Agreement was 1.63% for the year ended October 31, 2015.
34
The Amended Credit Agreement contains certain covenants, which include financial covenants that require us to maintain a certain leverage ratio and an interest coverage ratio. The leverage ratio generally requires that at the end of any fiscal quarter we will not permit the ratio of (a) our total consolidated indebtedness, to (b) our consolidated net income plus depreciation, depletion and amortization, interest expense (including capitalized interest), income taxes, and minus certain extraordinary gains and non-recurring gains (or plus certain extraordinary losses and non-recurring losses) and plus or minus certain other items for the preceding twelve months ("adjusted EBITDA") to be greater than 4.00 to 1. The interest coverage ratio generally requires that at the end of any fiscal quarter we will not permit the ratio of (a) our consolidated adjusted EBITDA for the preceding twelve month period to (b) our consolidated interest expense to the extent paid or payable, to be less than 3.00 to 1 (the "Interest Coverage Ratio Covenant"). As of October 31, 2015, we were in compliance with these covenants.
The terms of the Amended Credit Agreement limit our ability to make "restricted payments," which include dividends and purchases, redemptions and acquisitions of our equity interests. The repayment of amounts borrowed under the Amended Credit Agreement are secured by a security interest in the personal property of Greif, Inc. and certain of our United States subsidiaries, including equipment and inventory and certain intangible assets, as well as a pledge of the capital stock of substantially all of our United States subsidiaries. The repayment of amounts borrowed under the Amended Credit Agreement is also secured, in part, by capital stock of the non-U.S. subsidiaries that are parties to the Amended Credit Agreement. However, in the event that we receive and maintain an investment grade rating from either Moody's Investors Service, Inc. or Standard & Poor's Corporation, we may request the release of such collateral. The payment of outstanding principal under the Amended Credit Agreement and accrued interest thereon may be accelerated and become immediately due and payable upon our default in its payment or other performance obligations or its failure to comply with the financial and other covenants in the Amended Credit Agreement, subject to applicable notice requirements and cure periods as provided in the Amended Credit Agreement.
Refer to Note 9 to the Consolidated Financial Statements included in Item 8 of this Form 10-K for additional disclosures regarding the Amended Credit Agreement.
Senior Notes
We have issued $300.0 million of our 6.75% Senior Notes due February 1, 2017. Proceeds from the issuance of these Senior Notes were principally used to fund the purchase of our previously outstanding senior subordinated notes and for general corporate purposes. These Senior Notes are general unsecured obligations of Greif, Inc. only, provide for semi-annual payments of interest at a fixed rate of 6.75%, and do not require any principal payments prior to maturity on February 1, 2017. These Senior Notes are not guaranteed by any of our subsidiaries and thereby are effectively subordinated to all of our subsidiaries' existing and future indebtedness. The Indenture pursuant to which these Senior Notes were issued contains covenants, which, among other things, limit our ability to create liens on our assets to secure debt and to enter into sale and leaseback transactions. These covenants are subject to a number of limitations and exceptions as set forth in the Indenture. As of October 31, 2015, we were in compliance with these covenants.
We have issued $250.0 million of our 7.75% Senior Notes due August 1, 2019. Proceeds from the issuance of these Senior Notes were principally used for general corporate purposes, including the repayment of amounts outstanding under our revolving multicurrency credit facility under our then-existing credit agreement, without any permanent reduction of the commitments thereunder. These Senior Notes are general unsecured obligations of Greif, Inc. only, provide for semi-annual payments of interest at a fixed rate of 7.75%, and do not require any principal payments prior to maturity on August 1, 2019. These Senior Notes are not guaranteed by any of our subsidiaries and thereby are effectively subordinated to all of our subsidiaries' existing and future indebtedness. The Indenture pursuant to which these Senior Notes were issued contains covenants, which, among other things, limit our ability to create liens on our assets to secure debt and to enter into sale and leaseback transactions. These covenants are subject to a number of limitations and exceptions as set forth in the Indenture. As of October 31, 2015, we were in compliance with these covenants.
Our Luxembourg subsidiary has issued €200.0 million of 7.375% Senior Notes due July 15, 2021. These Senior Notes are fully and unconditionally guaranteed on a senior basis by Greif, Inc. A portion of the proceeds from the issuance of these Senior Notes was used to repay non-U.S. borrowings under the 2010 Credit Agreement, without any permanent reduction of the commitments thereunder, with the remaining proceeds available for general corporate purposes, including the financing of acquisitions. These Senior Notes are general unsecured obligations of the Luxembourg subsidiary and Greif, Inc. and provide for semi-annual payments of interest at a fixed rate of 7.375%, and do not require any principal payments prior to maturity on July 15, 2021. These Senior Notes are not guaranteed by any subsidiaries of the issuer or Greif, Inc. and thereby are effectively subordinated to all existing and future indebtedness of the subsidiaries of the issuer and Greif, Inc. The Indenture pursuant to which these Senior Notes were issued contains covenants, which, among other matters, limit our ability to create liens on our assets to secure debt and to enter into sale and leaseback transactions. These covenants are subject to a number of limitations and exceptions as set forth in the Indenture. As of October 31, 2015, we were in compliance with these covenants.
The assumptions used in measuring fair value of Senior Notes are considered level 2 inputs, which were based on observable market pricing for similar instruments.
Refer to Note 9 to the Consolidated Financial Statements included in Item 8 of this Form 10-K for additional disclosures regarding the Senior Notes discussed above.
35
United States Trade Accounts Receivable Credit Facility
We and certain of our domestic subsidiaries have a United States Accounts Receivable Credit Facility (the "Receivables Facility") with a financial institution. On December 1, 2015, the Receivables Facility was amended to reduce the amount of available proceeds from $170.0 million to $150.0 million. We initiated this amendment because we were not utilizing the full amount of the Receivables Facility and the reduction to the limit will reduce the facility fees payable under the Receivables Facility.
The Receivables Facility matures in September 2016. In addition, we can terminate the Receivables Facility at any time upon five days prior written notice. The Receivables Facility is secured by certain of our United States trade accounts receivables and bears interest at a variable rate based on the London InterBank Offered Rate ("LIBOR") or an applicable base rate, plus a margin, or a commercial paper rate plus a margin. Interest is payable on a monthly basis and the principal balance is payable upon termination of the Receivables Facility. The Receivables Facility also contains certain covenants and events of default, including a requirement that, at the end of any fiscal quarter, we will not permit the Interest Coverage Ratio Covenant to be less than 3.00 to 1 during the applicable trailing twelve-month period. As of October 31, 2015, we were in compliance with this covenant. Proceeds of the Receivables Facility are available for working capital and general corporate purposes. As of October 31, 2015, $147.6 million was outstanding under the Receivables Facility.
Refer to Note 9 of the Consolidated Financial Statements included in Item 8 of this Form 10-K for disclosures regarding the Receivables Facility.
Other
In addition to the amounts borrowed against the Amended Credit Agreement and proceeds from the Senior Notes and the Receivables Facility, as of October 31, 2015, we had outstanding other debt of $15.9 million in long-term debt and $40.7 million in short-term borrowings. There are no covenants associated with other debt.
As of October 31, 2015, annual maturities, including the current portion, of long-term debt under our various financing arrangements were $30.7 million in 2016, $467.0 million in 2017, $182.9 million in 2018, $246.0 million in 2019, and $220.3 million thereafter.
As of October 31, 2015 and 2014, we had deferred financing fees and debt issuance costs of $7.2 million and $10.3 million, respectively, which are included in other long-term assets.
Financial Instruments
Interest Rate Derivatives
As of October 31, 2015, we had no interest rate derivatives.
Through December 2014, we had two interest rate derivatives (floating to fixed swap agreements designated as cash flow hedges) with a total notional amount of $150 million. Under these swap agreements, we received interest based upon a variable interest rate from the counterparties and paid interest based upon a fixed interest rate. The assumptions that were used in measuring fair value of the interest rate derivatives were considered level 2 inputs, which were based on interest from the counterparties based upon LIBOR and interest paid based upon a designated fixed rate over the life of the swap agreements. These derivative instruments were designated and qualified as cash flow hedges. Accordingly, the effective portion of the gain or loss on these derivative instruments was reported as a component of other comprehensive income and reclassified into earnings in the same line item associated with the forecasted transaction and in the same period during which the hedged transaction affected earnings. The ineffective portion of the gain or loss on the derivative instrument was recognized in earnings immediately.
Losses reclassified to earnings under these contracts were $0.2 million, $0.9 million, and $0.8 million for the years ended October 31, 2015, 2014 and 2013, respectively. These losses were recorded within the consolidated statements of income as interest expense, net.
Foreign Exchange Hedges
We conduct business in major international currencies and are subject to risks associated with changing foreign exchange rates. Our objective is to reduce volatility associated with foreign exchange rate changes to allow management to focus its attention on business operations. Accordingly, we enter into various contracts that change in value as foreign exchange rates change to protect the value of certain existing foreign currency assets and liabilities, commitments and anticipated foreign currency revenues and expenses.
As of October 31, 2015, we had outstanding foreign currency forward contracts in the notional amount of $129.9 million ($122.4 million as of October 31, 2014). At October 31, 2015, these derivative instruments were designated and qualified as fair value hedges. Adjustments to fair value for fair value hedges are recognized in earnings, offsetting the impact of the hedged item. The assumptions used in measuring fair value of foreign exchange hedges are considered level 2 inputs, which were based on observable market pricing for similar instruments, principally foreign exchange futures contracts. Losses recorded under fair value contracts were $6.0 million and $6.2 million for the twelve months ended October 31, 2015 and 2014, respectively. Gains recorded under fair value contracts were immaterial for the twelve months ended October 31, 2013.
36
Contractual Obligations
As of October 31, 2015, we had the following contractual obligations (Dollars in millions):
| Payments Due by Period | ||||||||||||||||||||
| Total | Less than 1 year | 1-3 years | 3-5 years | After 5 years | ||||||||||||||||
Long-term debt | $ | 1,369.8 | 42.8 | 756.4 | 261.2 | 309.4 | ||||||||||||||
Short-term borrowing | 45.5 | 45.5 | - | - | - | |||||||||||||||
Operating and capital lease obligations | 203.5 | 47.0 | 65.4 | 37.3 | 53.8 | |||||||||||||||
Liabilities held by special purpose entities | 56.0 | 2.2 | 4.5 | 4.5 | 44.8 | |||||||||||||||
Environmental liabilities | 8.2 | 0.7 | 3.0 | 2.5 | 2.0 | |||||||||||||||
Current portion of long-term debt | 30.7 | 30.7 | - | - | - | |||||||||||||||
|
| |||||||||||||||||||
Total | $ | 1,713.7 | $ | 168.9 | $ | 829.3 | $ | 305.5 | $ | 410.0 | ||||||||||
|
| |||||||||||||||||||
| Note: | Amounts presented in the contractual obligation table include interest. |
Environmental liabilities in the table above are estimates based on remediation plans, but payments could differ.
There are no near-term pension funding obligations for the next two years and the amount of obligations in future years is not reasonably estimable, therefore, they have been excluded from the contractual obligations table.
Our unrecognized tax benefits under ASC 740, "Income Taxes" have been excluded from the contractual obligations table because of the inherent uncertainty and the inability to reasonably estimate the timing of cash outflows.
Stock Repurchase Program and Other Share Acquisitions
Our Board of Directors has authorized the purchase of up to four million shares of Class A Common Stock or Class B Common Stock or any combination of the foregoing. As of October 31, 2015, we have repurchased 3,184,272 shares, including 1,425,452 shares of Class A Common Stock and 1,758,820 shares of Class B Common Stock, under this program, all of which were repurchased in prior years. There were no shares repurchased from November 1, 2012 through October 31, 2015.
Effects of Inflation
Inflation did not have a material impact on our operations during 2015, 2014 or 2013.
Critical Accounting Policies
A summary of our significant accounting policies is included in Note 1 to the Notes to Consolidated Financial Statements included in Item 8 of this Form 10-K. We believe that the consistent application of these policies enables us to provide readers of the consolidated financial statements with useful and reliable information about our results of operations and financial condition. The following are the accounting policies that we believe are most important to the portrayal of our results of operations and financial condition and require our most difficult, subjective or complex judgments.
Other items that could have a significant impact on the financial statements include the risks and uncertainties listed in Part I, Item 1A – Risk Factors. Actual results could differ materially using different estimates and assumptions, or if conditions are significantly different in the future.
Assets and Liabilities Held for Sale. Assets and liabilities held for sale represent land, buildings and land improvements less accumulated depreciation as well as any other assets or liabilities that are held for sale in conjunction with the sale of a business. We record assets and liabilities held for sale in accordance with ASC 360 "Property, Plant, and Equipment," at the lower of carrying value or fair value less cost to sell. Fair value is based on the estimated proceeds from the sale of the facility utilizing recent purchase offers, market comparables and/or data obtained from our commercial real estate broker. Our estimate as to fair value is regularly reviewed and subject to changes in the commercial real estate markets and our continuing evaluation as to the facility's acceptable sale price.
Goodwill and Indefinite-Lived Intangibles. We account for goodwill in accordance with ASC 350, "Intangibles – Goodwill and Other." Under ASC 350, purchased goodwill is not amortized, but instead tested for impairment either annually or when events and circumstances indicate an impairment may have occurred. Our reporting units contain goodwill that is assessed for impairment. Our reporting units consist of Rigid Industrial Packaging & Services – Americas; Rigid Industrial Packaging & Services – Europe, Middle East, Africa, and Asia Pacific; Paper Packaging; Flexible Products & Services; and Land Management. A reporting unit is the operating segment, or a business one level below that operating segment (the component level) if discrete financial information is prepared and regularly reviewed by segment management. However, components are aggregated as a single reporting unit if they have similar economic characteristics. In conducting the annual impairment tests, the estimated fair value of each of our reporting units is compared to its carrying amount including goodwill. If the estimated fair value exceeds the carrying amount, then no impairment exists. If the carrying amount exceeds the estimated fair value, further analysis is performed to assess impairment. No reporting units were aggregated for purposes of conducting the annual impairment test.
37
The Rigid Industrial Packaging & Services segment consists of the following two operating segments: Rigid Industrial Packaging & Services – Americas; and Rigid Industrial Packaging & Services – Europe, Middle East, Africa, and Asia Pacific. Both of these operating segments consist of multiple components that have discrete financial information available that is reviewed by segment management on a regular basis. We have evaluated these components and concluded that they are economically similar and should be aggregated into two separate reporting units. For the purpose of aggregating our reporting units, we review the long-term performance of gross profit margin and operating profit margin. Additionally, we review qualitative factors such as common customers, similar products, similar manufacturing processes, sharing of resources, level of integration, and interdependency of processes across components. We place greater weight on the qualitative factors outlined in ASC 280 "Segment Reporting" and consider the guidance in ASC 350 in determining whether two or more components of an operating segment are economically similar and can be aggregated into a single reporting unit. However, our assessment of the aggregation includes both qualitative and quantitative factors and is based on the facts and circumstances specific to the components.
Our determination of estimated fair value of the reporting units is based on a discounted cash flow analysis utilizing the income approach. Under this method, the principal valuation focus is on the reporting unit's cash-generating capabilities. The discount rates used for impairment testing are based on our weighted average cost of capital. The use of alternative estimates, peer groups or changes in the industry, or adjusting the discount rate, earnings before interest, taxes, depreciation, depletion and amortization multiples or price earnings ratios used could affect the estimated fair value of the assets and potentially result in impairment. Any identified impairment would result in an adjustment to our results of operations.
We performed our annual impairment test in the fourth quarter of 2015 as of August 1. This test resulted in no impairment charges for reporting units Rigid Industrial Packaging & Services – Americas, Rigid Industrial Packaging & Services Europe, Middle East, Africa, and Asia Pacific, and Paper Packaging. As of October 31, 2015, the estimated fair value of each of these reporting units was deemed to be substantially in excess of the carrying amount of assets and liabilities assigned to each reporting unit. Due to triggering events in the fourth quarter of 2014, we recorded an impairment charge of $50.3 million, which represented all of the goodwill associated with the Flexible Products & Services segment as the carrying amount of the Flexible Products & Services reporting unit exceeded the fair value of the Flexible Products & Services reporting unit. Refer to Note 6 in Item 8 of this Form 10-K for further information. Our annual impairment tests in fiscal 2014 and fiscal 2013 resulted in no additional impairment charges.
The following table summarizes the carrying amount of goodwill by reporting unit for the ended October 31, 2015 and 2014 (Dollars in millions):
| Rigid Industrial Packaging & Services – Americas | Rigid Industrial Packaging & Services – Europe, Middle East, Africa, and Asia Pacific | Flexible Products & Services | Paper Packaging | Land Management | Total | |||||||||||||||||||
Goodwill Balance as of October 31, 2014 | $ | 366.9 | $ | 453.8 | $ | - | $ | 59.5 | $ | - | $ | 880.2 | ||||||||||||
Goodwill Balance as of October 31, 2015 | $ | 350.4 | $ | 397.2 | $ | - | $ | 59.5 | $ | - | $ | 807.1 | ||||||||||||
We test for impairment of indefinite-lived intangible assets during the fourth quarter of each fiscal year as of August 1, or more frequently if certain indicators are present or changes in circumstances suggest that impairment may exist.
Properties, Plants and Equipment. Depreciation on properties, plants and equipment is primarily provided on the straight-line method over the estimated useful lives of our assets.
38
We believe that the lives and methods of determining depreciation are reasonable; however, using other lives and methods could provide materially different results.
Long-lived assets are grouped together at the lowest level, generally at the plant level, for which identifiable cash flows are largely independent of cash flows of other groups of long-lived assets. As events warrant, we evaluate the recoverability of long-lived assets, other than goodwill and other intangible assets, by assessing whether the carrying value can be recovered over their remaining useful lives through the expected future undiscounted operating cash flows of the underlying asset groups. Impairment indicators include, but are not limited to, a significant decrease in the market price of a long-lived asset; a significant adverse change in the manner in which the asset is being used or in its physical condition; a significant adverse change in legal factors or the business climate that could affect the value of a long-lived asset; an accumulation of costs significantly in excess of the amount originally expected for the acquisition or construction of a long-lived asset; current period operating or cash flow losses combined with a history of operating or cash flow losses associated with the use of the asset; or a current expectation that it is more likely than not that a long-lived asset will be sold or otherwise disposed of significantly before the end of its previously estimated useful life. Future decisions to change our manufacturing processes, exit certain businesses, reduce excess capacity, temporarily idle facilities and close facilities could result in material impairment charges. Any impairment loss that may be required is determined by comparing the carrying value of the assets to their estimated fair value.
During the year ended October 31, 2015, we wrote down long-lived assets with a carrying value of $60.7 million to a fair value of $14.8 million, resulting in recognized asset impairment charges of $45.9 million. These charges include $15.0 million of impairment charges related to Venezuelan properties, plants, and equipment, net, $11.4 million of impairment charges related to assets recognized at fair value within our reconditioning business, $1.5 million of IT software assets that were identified as obsolete, $0.5 million other-than-temporary impairment of equity method investment within the Flexible Products & Services segment, $10.9 million of impairment charges related to plant closures within the Rigid Industrial Packaging & Services and Flexible Products & Services segments, and $6.6 million of various machinery and equipment determined to be obsolete.
During the year ended October 31, 2014 we wrote down long-lived assets with a carrying value of $58.0 million to a fair value of $22.5 million, resulting in recognized asset impairment charges of properties, plants and equipment of $35.5 million, consisting of: $11.5 million for assets in the Rigid Industrial Packaging & Services segment related to the third quarter 2014 impairment of assets to be sold for a loss in the fourth quarter 2014, underutilized and damaged equipment, and unutilized facilities in Europe; and $24.0 million for assets in Flexible Products & Services segment related to underutilized equipment and the shutdown of the fabric hub in the Kingdom of Saudi Arabia. The impairment charges in the Flexible Products & Services segment included $15.7 million related to assets valued based on their highest and best use.
Income Taxes. Preparation of our financial statements requires the use of estimates and assumptions that affect the reported amounts of our assets and liabilities and revenues and expenses as of October 31, 2015. The multitude of tax jurisdictions creates an inherent level of uncertainty, and significant judgment is required when applying the complex tax regulations when estimating our global tax position. Our effective tax rate and the amount of taxes we pay are dependent upon various factors including the following: the laws and regulations, and varying tax rates of the country tax jurisdictions in which income is earned; the recognition of permanent book/tax basis differences realized through divestitures and asset impairments; the ability to realize long term deferred tax assets at certain international subsidiaries; negotiation and dispute resolution with taxing authorities in the U.S. and international jurisdictions arising from federal, state and local country tax audits; changes in tax laws, regulations, administrative rulings and common law.
Refer to the Results of Operations in Management's Discussion and Analysis and Note 12 to the Notes to Consolidated Financial Statements of this Form 10-K for further discussion.
Refer to Note 12 to the Notes to Consolidated Financial Statements in Item 8 of this Form 10-K for further discussion.
Pension and Postretirement Benefits . Pension and postretirement assumptions are significant inputs to the actuarial models that measure pension and postretirement benefit obligations and related effects on operations. Two assumptions – discount rate and expected return on assets – are important elements of plan expense and asset/liability measurement. We evaluate these critical assumptions at least annually on a plan and country-specific basis. At least annually, we evaluate other assumptions involving demographic factors, such as retirement age, mortality and turnover, and update them to reflect our experience and expectations for the future. Actual results in any given year will often differ from actuarial assumptions because of economic and other factors.
Accumulated and projected benefit obligations are measured as the present value of future cash payments. We discount those cash payments using the weighted average of market-observed yields for high quality fixed income securities with maturities that correspond to the payment of benefits. Lower discount rates increase present values and subsequent-year pension expense; higher discount rates decrease present values and subsequent-year pension expense.
Our discount rates for consolidated pension plans at October 31, 2015, 2014 and 2013 were 3.71%, 3.69% and 4.30%, respectively, reflecting market interest rates.
39
To develop the expected long-term rate of return on assets assumption, we use a generally consistent approach worldwide. The approach considers various sources, primarily inputs from a range of advisors, inflation, bond yields, historical returns, and future expectations for returns for each asset class, as well as the target asset allocation of the pension portfolio. This rate is gross of any investment or administrative expenses. Assets in our principal pension plans earned 3.89% in 2015. Based on our analysis of future expectations of asset performance, past return results, and our current and expected asset allocations, we have assumed a 5.51% long-term expected return on those assets for cost recognition in 2016. This is an increase from the 5.47% long term affected return we had assumed in 2015, and a reduction from the 5.73% and 5.70% long-term affected return we had assumed in 2014 and 2013, respectively.
Changes in key assumptions for our consolidated pension and postretirement plans would have the following effects.
| • | Discount rate – A 25 basis point increase in discount rate would decrease pension and postretirement cost in the following year by $2.5 million and would decrease the pension and postretirement benefit obligation at year-end by about $27.5 million. |
| • | Expected return on assets – A 50 basis point decrease in the expected return on assets would increase pension and postretirement cost in the following year by $3.0 million. |
Further discussion of our pension and postretirement benefit plans and related assumptions is contained in Note 13 to the Notes to Consolidated Financial Statements included in Item 8 of this Form 10-K.
Revenue Recognition . We recognize revenue when title passes to customers or services have been rendered, with appropriate provision for returns and allowances. Revenue is recognized in accordance with ASC 605, "Revenue Recognition."
Timberland disposals, timber and special use property revenues are recognized when closings have occurred, required down payments have been received, title and possession have been transferred to the buyer, and all other criteria for sale and profit recognition have been satisfied.
We report the sale of surplus and HBU property in our consolidated statements of income under "gain on disposals of property, plants, and equipment, net" and report the sale of development property under "net sales" and "cost of goods sold." All HBU and development property, together with surplus property, is used by us to productively grow and sell timber until the property is sold.
Other Items. Other items that could have a significant impact on our financial statements include the risks and uncertainties listed in Item 1A under "Risk Factors." Actual results could differ materially using different estimates and assumptions, or if conditions are significantly different in the future.
Variable Interest Entities. We evaluate whether an entity is a variable interest entity ("VIE") and determine if the primary beneficiary status is appropriate on a quarterly basis. We consolidate VIE's for which we are the primary beneficiary. If we are not the primary beneficiary and an ownership interest is held, the VIE is accounted for under the equity method of accounting. When assessing the determination of the primary beneficiary, we consider all relevant facts and circumstances, including: the power to direct the activities of the VIE that most significantly impact the VIE's economic performance and the obligation to absorb the expected losses and/or the right to receive the expected returns of the VIE.
Flexible Packaging Joint Venture
In 2010, we formed a joint venture (referred to herein as the "Flexible Packaging JV") with Dabbagh Group Holding Company Limited and its subsidiary National Scientific Company Limited ("NSC"). The Flexible Packaging JV owns the operations in the Flexible Products & Services segment. The Flexible Packaging JV has been consolidated into our operations as of its formation date of September 29, 2010.
All entities contributed to the Flexible Packaging JV were existing businesses acquired by us and were reorganized under Greif Flexibles Asset Holding B.V. and Greif Flexibles Trading Holding B.V. ("Asset Co." and "Trading Co."), respectively. The Flexible Packaging JV also included Global Textile Company LLC ("Global Textile"), which owned and operated a fabric hub in the Kingdom of Saudi Arabia that commenced operations in the fourth quarter of 2012, but ceased operations in the fourth quarter of 2014. We have 51 percent ownership in Trading Co. and 49 percent ownership in Asset Co. and Global Textile. However, we and NSC have equal economic interests in the Flexible Packaging JV, notwithstanding the actual ownership interests in the various legal entities. All investments, loans and capital contributions are to be shared equally by us and NSC and each partner has committed to contribute capital of up to $150 million and obtain third party financing for up to $150 million as required.
The Flexible Packaging JV is deemed to be a VIE since the total equity investment at risk is not sufficient to permit the legal entity to finance its activities without additional subordinated financial support from us. We are the primary beneficiary because we have (1) the power to direct the activities of the VIE that most significantly impact the VIE's economic performance, and (2) the obligation to absorb losses of the VIE that could potentially be significant to the VIE or the right to receive benefits from the VIE that could potentially be significant to the VIE.
40
Recent Accounting Standards
In April 2015, the Financial Accounting Standards Board ("FASB") issued Accounting Standards Update ("ASU") No. 2015-03, "Interest – Imputation of Interest (Subtopic 835-30)". The objective of this update is to simplify the presentation of debt issuance costs in the financial statements. Under the ASU, we would present such costs in the balance sheet as a direct deduction from the related debt liability rather than as an asset; amortization of the costs is reported as interest expense. The effective date will be the first quarter of fiscal year 2016. We would apply the new guidance retrospectively to all prior periods (i.e., the balance sheet for each period would be adjusted). The ASU requires us to "disclose in the first fiscal year after the entity's adoption date, and in the interim periods within the first fiscal year, the following: (1) The nature and reason for the change in accounting principle; (2) The transition method; (3) A description of the prior-period information that has been retrospectively adjusted; and (4) The effect of the change on the financial statement line item (that is, the debt issuance costs asset and the debt liability). We are expected to adopt this guidance beginning November 1, 2015, and the adoption of the new guidance is not expected to materially impact our financial position, results of operations, comprehensive income or cash flows, other than the related disclosures.
In February 2015, the FASB issued ASU 2015-02, "Consolidation (Topic 810): Amendments to the Consolidation Analysis," which makes changes to both the variable interest model and voting interest model and eliminates the indefinite deferral of FASB Statement No. 167, included in ASU 2010-10, for certain investment funds. All reporting entities that hold a variable interest in other legal entities will need to re-evaluate their consolidation conclusions as well as disclosure requirements. This ASU is effective for annual periods beginning after December 15, 2015, and early adoption is permitted, including any interim period. We are in the process of determining the potential impact of adopting this guidance on its financial position, results of operations, comprehensive income, cash flow, and disclosures.
In May 2014, the FASB issued ASU No. 2014-09, "Revenue from Contracts with Customers (Topic 606)", which supersedes the revenue recognition requirements in ASC 605, Revenue Recognition. This ASU is based on the principle that revenue is recognized to depict the transfer of goods or services to customers in an amount that reflects the consideration to which the entity expects to be entitled in exchange for those goods or services. The ASU also requires additional disclosure about the nature, amount, timing and uncertainty of revenue and cash flows arising from customer contracts, including significant judgments and changes in judgments and assets recognized from costs incurred to obtain or fulfill a contract. The update is effective in fiscal year 2019 using one of two retrospective application methods. We are in the process of determining the potential impact of adopting this guidance on its financial position, results of operations, comprehensive income, cash flow and disclosures.
In August 2014, the FASB issued ASU 2014-15 "Presentation of Financial Statements-Going Concern: Disclosure of Uncertainties about an Entity's Ability to Continue as Going Concern". The objective of this update is to reduce the diversity in the timing and content of footnote disclosures related to going concern. The amendments require management to assess an entity's ability to continue as a going concern by incorporating and expanding upon certain principles that are currently in U.S. auditing standards. This update applies to all entities that would be required to disclose information about their potential inability to continue as a going concern when "substantial doubt" about their ability to continue as a going concern exists. We will be required to evaluate "relevant conditions and events that are known and reasonably knowable at the date that the financial statements are issued." We will have to document its consideration of the ASU, but not because we believe there is substantial doubt about its ability to continue as a going concern. We are expected to adopt this guidance beginning November 1, 2017, and the adoption of the new guidance is not expected to impact our financial position, results of operations, comprehensive income or cash flows, other than the related disclosures.
ITEM 7A. QUANTITATIVE AND QUALITATIVE DISCLOSURES ABOUT MARKET RISK
Interest Rate Risk
We are subject to interest rate risk related to our financial instruments that include borrowings under the Amended Credit Agreement, proceeds from our Senior Notes and U.S. trade accounts receivable credit facility, and interest rate swap agreements. We do not enter into financial instruments for trading or speculative purposes. The interest rate swap agreements have been entered into to manage our exposure to variability in interest rates and changes in the fair value of fixed rate debt.
We had interest rate swap agreements with an aggregate notional amount of $150.0 million as of October 31, 2014 and 2013, with various maturities through 2015. The interest rate swap agreements were used to manage our fixed and floating rate debt mix. Under certain of these agreements, we received interest monthly from the counterparties equal to LIBOR and pay interest at a fixed rate over the life of the contracts. A liability for the loss on interest rate swap contracts, which represented their fair values, in the amount of $0.2 million and $0.9 million was recorded as of October 31, 2014 and 2013, respectively. As of October 31, 2015, we have no interest rate derivatives.
The tables below provide information about our derivative financial instruments and other financial instruments that are sensitive to changes in interest rates. For the Amended Credit Agreement, Senior Notes and U.S. trade accounts receivable credit facility, the tables present scheduled amortizations of principal and the weighted average interest rate by contractual maturity dates as of October 31, 2015 and 2014. For interest rate swaps, the table as of October 31, 2014 presents annual amortizations of notional amounts and weighted average interest rates by contractual maturity dates. Under the cash flow swap agreements, we received interest monthly from the counterparties and pay interest monthly to the counterparties.
41
The fair values of our Amended Credit Agreement, Senior Notes, Amended Receivables Facility and Prior Receivables Facility are based on rates available to us for debt of the same remaining maturity as of October 31, 2015 and 2014. The fair value of the interest rate swap agreements was determined based upon the market settlement prices of comparable contracts as of October 31, 2014.
Financial Instruments
As of October 31, 2015
(Dollars in millions)
| Expected maturity Date | ||||||||||||||||||||||||||||||||
| After | Fair | |||||||||||||||||||||||||||||||
| 2016 | 2017 | 2018 | 2019 | 2020 | 2020 | Total | Value | |||||||||||||||||||||||||
Amended Credit Agreement: | ||||||||||||||||||||||||||||||||
Scheduled amortizations | $ | 17 | $ | 17 | $ | 183 | - | - | - | $ | 217 | $ | 217.0 | |||||||||||||||||||
Average interest rate (1) | 1.74 | % | 1.74 | % | 1.74 | % | - | - | - | 1.74 | % | |||||||||||||||||||||
Senior Notes due 2017: | ||||||||||||||||||||||||||||||||
Scheduled amortizations | - | $ | 300 | - | - | - | - | $ | 300 | $ | 314.8 | |||||||||||||||||||||
Average interest rate | 6.75 | % | 6.75 | % | - | - | - | - | 6.75 | % | ||||||||||||||||||||||
Senior Notes due 2019: | ||||||||||||||||||||||||||||||||
Scheduled amortizations | - | - | - | $ | 250 | - | - | $ | 250 | $ | 280.6 | |||||||||||||||||||||
Average interest rate | 7.75 | % | 7.75 | % | 7.75 | % | 7.75 | % | - | - | 7.75 | % | ||||||||||||||||||||
Senior Notes due 2021: | ||||||||||||||||||||||||||||||||
Scheduled amortizations | - | - | - | - | - | $ | 221 | $ | 221 | $ | 258.7 | |||||||||||||||||||||
Average interest rate | 7.38 | % | 7.38 | % | 7.38 | % | 7.38 | % | 7.38 | % | 7.38 | % | 7.38 | % | ||||||||||||||||||
Amended Receivables Facility: | ||||||||||||||||||||||||||||||||
Scheduled amortizations | - | $ | 148 | - | - | - | - | $ | 148 | $ | 148 | |||||||||||||||||||||
(1) Variable rate specified is based on LIBOR or an alternative base rate plus a calculated margin as of October 31, 2015. The rates presented are not intended to project our expectations for the future.
Financial Instruments
As of October 31, 2014
(Dollars in millions)
| Expected maturity Date | ||||||||||||||||||||||||||||||||
| After | Fair | |||||||||||||||||||||||||||||||
| 2015 | 2016 | 2017 | 2018 | 2019 | 2019 | Total | Value | |||||||||||||||||||||||||
Amended Credit Agreement: | ||||||||||||||||||||||||||||||||
Scheduled amortizations | $ | 17 | $ | 17 | $ | 17 | $ | 118 | - | - | $ | 169 | $ | 169.0 | ||||||||||||||||||
Average interest rate (1) | 1.65 | % | 1.65 | % | 1.65 | % | 1.65 | % | - | - | 1.65 | % | ||||||||||||||||||||
Senior Notes due 2017: | ||||||||||||||||||||||||||||||||
Scheduled amortizations | - | - | $ | 300 | - | - | - | $ | 300 | $ | 325.5 | |||||||||||||||||||||
Average interest rate | 6.75 | % | 6.75 | % | 6.75 | % | - | - | - | 6.75 | % | |||||||||||||||||||||
Senior Notes due 2019: | ||||||||||||||||||||||||||||||||
Scheduled amortizations | - | - | - | - | $ | 250 | - | $ | 250 | $ | 287.5 | |||||||||||||||||||||
Average interest rate | 7.75 | % | 7.75 | % | 7.75 | % | 7.75 | % | 7.75 | % | - | 7.75 | % | |||||||||||||||||||
Senior Notes due 2021: | ||||||||||||||||||||||||||||||||
Scheduled amortizations | - | - | - | - | - | $ | 253 | $ | 253 | $ | 297.7 | |||||||||||||||||||||
Average interest rate | 7.38 | % | 7.38 | % | 7.38 | % | 7.38 | % | 7.38 | % | 7.38 | % | 7.38 | % | ||||||||||||||||||
Amended Receivables Facility: | ||||||||||||||||||||||||||||||||
Scheduled amortizations | - | $ | 110 | - | - | - | - | $ | 110 | $ | 110.0 | |||||||||||||||||||||
Interest rate swaps: | ||||||||||||||||||||||||||||||||
Scheduled amortizations | $ | 150 | - | - | - | - | - | $ | 150 | $ | 149.8 | |||||||||||||||||||||
Average pay rate (2) | 0.75 | % | - | - | - | - | - | |||||||||||||||||||||||||
Average receive rate (3) | 0.16 | % | - | - | - | - | - | |||||||||||||||||||||||||
(1) Variable rate specified is based on LIBOR or an alternative base rate plus a calculated margin as of October 31, 2014. The rates presented are not intended to project our expectations for the future.
42
(2) The average pay rate is based upon the fixed rates we were scheduled to pay as of October 31, 2014. The rates presented are not intended to project our expectations for the future.
(3) The average receive rate is based upon the LIBOR we were scheduled to receive as of October 31, 2014. The rates presented are not intended to project our expectations for the future.
Currency Risk
As a result of our international operations, our operating results are subject to fluctuations in currency exchange rates. The geographic presence of our operations mitigates this exposure to some degree. Additionally, our transaction exposure is somewhat limited because we produce and sell a majority of our products in local currency within most countries in which we operate.
As of October 31, 2015, we had outstanding foreign currency forward contracts in the notional amount of $129.9 million ($122.4 million as of October 31, 2014). The purpose of these contracts is to hedge our exposure to foreign currency transactions and short-term intercompany loan balances in our international businesses. The fair value of these contracts as of October 31, 2015 resulted in an immaterial gain recorded in the consolidated statements of income. The fair value of similar contracts as of October 31, 2014 resulted in a $0.4 million gain recorded in the consolidated statements of income.
A sensitivity analysis (with respect only to these instruments) to changes in the foreign currencies hedged indicates that if the U.S. dollar strengthened by 10 percent, the fair value of these instruments would decrease by $4.0 million to a net liability of $3.9 million. Conversely, if the U.S. dollar weakened by 10 percent, the fair value of these instruments would increase by $4.4 million to a net asset of $4.4 million.
Commodity Price Risk
We purchase commodities such as steel, resin, containerboard, pulpwood and energy. We do not currently engage in material hedging of commodities, although in the past we have sometimes engaged in hedges in natural gas, because there has historically been a high correlation between the commodity cost and the ultimate selling price of our products. There were no commodity hedging contracts outstanding as of October 31, 2015.
43
ITEM 8. FINANCIAL STATEMENTS AND SUPPLEMENTARY DATA
GREIF, INC. AND SUBSIDIARY COMPANIES
CONSOLIDATED STATEMENTS OF INCOME
(Dollars in millions, except per share amounts)
For the years ended October 31, | 2015 | 2014 | 2013 | |||||||||
Net sales | $ | 3,616.7 | $ | 4,239.1 | $ | 4,219.9 | ||||||
Costs of products sold | 2,946.9 | 3,428.1 | 3,387.7 | |||||||||
|
|
|
|
|
| |||||||
Gross profit | 669.8 | 811.0 | 832.2 | |||||||||
Selling, general and administrative expenses | 413.2 | 496.7 | 477.3 | |||||||||
Restructuring charges | 40.0 | 16.1 | 4.8 | |||||||||
Timberland gains | (24.3 | ) | (17.1 | ) | (17.3 | ) | ||||||
Non-cash asset impairment charges | 45.9 | 35.5 | 31.4 | |||||||||
Goodwill impairment charges | - | 50.3 | - | |||||||||
Gain on disposal of properties, plants and equipment, net | (7.0 | ) | (8.3 | ) | (5.6 | ) | ||||||
(Gain) loss on disposal of businesses, net | 9.2 | (11.5 | ) | - | ||||||||
|
|
|
|
|
| |||||||
Operating profit | 192.8 | 249.3 | 341.6 | |||||||||
Interest expense, net | 74.8 | 81.8 | 83.8 | |||||||||
Debt extinguishment charges | - | - | 1.3 | |||||||||
Other expense, net | 3.2 | 9.5 | 13.1 | |||||||||
|
|
|
|
|
| |||||||
Income before income tax expense and equity earnings of unconsolidated affiliates, net | 114.8 | 158.0 | 243.4 | |||||||||
Income tax expense | 48.4 | 115.0 | 98.8 | |||||||||
Equity earnings of unconsolidated affiliates, net of tax | 0.8 | 1.9 | 2.9 | |||||||||
|
|
|
|
|
| |||||||
Net income | 67.2 | 44.9 | 147.5 | |||||||||
Net (income) loss attributable to noncontrolling interests | 4.7 | 46.6 | (2.8 | ) | ||||||||
|
|
|
|
|
| |||||||
Net income attributable to Greif, Inc. | $ | 71.9 | $ | 91.5 | $ | 144.7 | ||||||
|
|
|
|
|
| |||||||
Basic earnings per share attributable to Greif, Inc.: | ||||||||||||
Class A Common Stock | $ | 1.23 | $ | 1.56 | $ | 2.47 | ||||||
Class B Common Stock | $ | 1.83 | $ | 2.33 | $ | 3.70 | ||||||
Diluted earnings per share attributed to Greif, Inc.: | ||||||||||||
Class A Common Stock | $ | 1.23 | $ | 1.56 | $ | 2.47 | ||||||
Class B Common Stock | $ | 1.83 | $ | 2.33 | $ | 3.70 | ||||||
GREIF, INC. AND SUBSIDIARY COMPANIES
CONSOLIDATED STATEMENTS OF COMPREHENSIVE INCOME
(Dollars in millions)
For the years ended October 31, | 2015 | 2014 | 2013 | |||||||||
Net income | $ | 67.2 | $ | 44.9 | $ | 147.5 | ||||||
Other comprehensive income (loss), net of tax: | ||||||||||||
Foreign currency translation | (130.9 | ) | (86.9 | ) | 9.3 | |||||||
Reclassification of cash flow hedges to earnings, net of tax benefit of $0.1 million, $0.5 million and $0.3 million, respectively | 0.1 | 0.4 | 0.5 | |||||||||
Unrealized gain (loss) on cash flow hedges, net of tax expense of $0.0 million, $0.2 million and $0.2 million, respectively | - | 0.1 | (0.2 | ) | ||||||||
Minimum pension liabilities, net of tax expense of $0.5 million, tax benefit of $15.7 million and tax expense of $22.2 million, respectively | 9.0 | (34.7 | ) | 30.9 | ||||||||
|
|
|
|
|
| |||||||
Other comprehensive income (loss), net of tax | (121.8 | ) | (121.1 | ) | 40.5 | |||||||
|
|
|
|
|
| |||||||
Comprehensive income (loss) | (54.6 | ) | (76.2 | ) | 188.0 | |||||||
Comprehensive income (loss) attributable to noncontrolling interests | (23.5 | ) | (45.9 | ) | 4.2 | |||||||
|
|
|
|
|
| |||||||
Comprehensive income (loss) attributable to Greif, Inc. | $ | (31.1 | ) | $ | (30.3 | ) | $ | 183.8 | ||||
|
|
|
|
|
| |||||||
Refer to the accompanying Notes to Consolidated Financial Statements.
44
GREIF, INC. AND SUBSIDIARY COMPANIES
CONSOLIDATED BALANCE SHEETS
(Dollars in millions)
As of October 31, | 2015 | 2014 | ||||||
ASSETS | ||||||||
Current assets | ||||||||
Cash and cash equivalents | $ | 106.2 | $ | 85.1 | ||||
Trade accounts receivable, less allowance of $11.8 in 2015 and $16.8 in 2014 | 403.7 | 501.3 | ||||||
Inventories | 297.0 | 381.1 | ||||||
Deferred tax assets | 25.4 | 29.0 | ||||||
Assets held for sale | 16.9 | 13.0 | ||||||
Prepaid expenses and other current assets | 159.3 | 129.9 | ||||||
|
|
|
| |||||
| 1,008.5 | 1,139.4 | |||||||
|
|
|
| |||||
Long-term assets | ||||||||
Goodwill | 807.1 | 880.2 | ||||||
Other intangible assets, net of amortization | 132.7 | 166.5 | ||||||
Deferred tax assets | 7.8 | 20.9 | ||||||
Assets held by special purpose entities | 50.9 | 50.9 | ||||||
Other long-term assets | 91.0 | 101.2 | ||||||
|
|
|
| |||||
| 1,089.5 | 1,219.7 | |||||||
|
|
|
| |||||
Properties, plants and equipment | ||||||||
Timber properties, net of depletion | 277.1 | 244.8 | ||||||
Land | 106.3 | 129.3 | ||||||
Buildings | 410.4 | 459.1 | ||||||
Machinery and equipment | 1,457.9 | 1,502.4 | ||||||
Capital projects in progress | 78.0 | 97.4 | ||||||
|
|
|
| |||||
| 2,329.7 | 2,433.0 | |||||||
Accumulated depreciation | (1,112.0 | ) | (1,124.7 | ) | ||||
|
|
|
| |||||
| 1,217.7 | 1,308.3 | |||||||
|
|
|
| |||||
Total assets | $ | 3,315.7 | $ | 3,667.4 | ||||
|
|
|
| |||||
Refer to the accompanying Notes to Consolidated Financial Statements.
45
GREIF, INC. AND SUBSIDIARY COMPANIES
CONSOLIDATED BALANCE SHEETS
(Dollars in millions)
As of October 31, | 2015 | 2014 | ||||||
LIABILITIES AND SHAREHOLDERS' EQUITY | ||||||||
Current liabilities | ||||||||
Accounts payable | $ | 355.3 | $ | 471.1 | ||||
Accrued payroll and employee benefits | 83.5 | 102.4 | ||||||
Restructuring reserves | 21.3 | 4.1 | ||||||
Current portion of long-term debt | 30.7 | 17.6 | ||||||
Short-term borrowings | 40.7 | 48.1 | ||||||
Deferred tax liabilities | 2.4 | 17.8 | ||||||
Liabilities held for sale | 1.8 | 1.5 | ||||||
Other current liabilities | 111.3 | 189.1 | ||||||
|
|
|
| |||||
| 647.0 | 851.7 | |||||||
|
|
|
| |||||
Long-term liabilities | ||||||||
Long-term debt | 1,116.2 | 1,087.4 | ||||||
Deferred tax liabilities | 214.9 | 219.0 | ||||||
Pension liabilities | 141.1 | 136.0 | ||||||
Postretirement benefit obligations | 14.9 | 17.3 | ||||||
Liabilities held by special purpose entities | 43.3 | 43.3 | ||||||
Contingent liabilities and environmental reserves | 8.2 | 24.7 | ||||||
Other long-term liabilities | 70.2 | 64.8 | ||||||
|
|
|
| |||||
| 1,608.8 | 1,592.5 | |||||||
|
|
|
| |||||
Commitments and Contingencies (Note 14) | - | - | ||||||
Shareholders' equity | ||||||||
Common stock, without par value | 139.1 | 135.5 | ||||||
Treasury stock, at cost | (130.6 | ) | (130.7 | ) | ||||
Retained earnings | 1,384.5 | 1,411.7 | ||||||
Accumulated other comprehensive loss, net of tax: | ||||||||
- foreign currency translation | (256.6 | ) | (144.5 | ) | ||||
- interest rate and other derivatives | - | (0.1 | ) | |||||
- minimum pension liabilities | (120.8 | ) | (129.8 | ) | ||||
|
|
|
| |||||
Total Greif, Inc. shareholders' equity | 1,015.6 | 1,142.1 | ||||||
|
|
|
| |||||
Noncontrolling interests | 44.3 | 81.1 | ||||||
|
|
|
| |||||
Total shareholders' equity | 1,059.9 | 1,223.2 | ||||||
|
|
|
| |||||
Total liabilities and shareholders' equity | $ | 3,315.7 | $ | 3,667.4 | ||||
|
|
|
| |||||
Refer to the accompanying Notes to Consolidated Financial Statements.
46
GREIF, INC. AND SUBSIDIARY COMPANIES
CONSOLIDATED STATEMENTS OF CASH FLOWS
(Dollars in millions)
For the years ended October 31, | 2015 | 2014 | 2013 | |||||||||
Cash flows from operating activities: | ||||||||||||
Net income | 67.2 | $ | 44.9 | $ | 147.5 | |||||||
Adjustments to reconcile net income to net cash provided by operating activities: | ||||||||||||
Depreciation, depletion and amortization | 134.6 | 155.8 | 157.6 | |||||||||
Timberland gains | (24.3 | ) | (17.1 | ) | (17.3 | ) | ||||||
Non-cash asset impairment charges | 45.9 | 85.8 | 31.4 | |||||||||
Gain on disposals of properties, plants and equipment, net | (7.0 | ) | (8.3 | ) | (5.6 | ) | ||||||
(Gain)/Loss on disposals of businesses, net | 9.2 | (11.5 | ) | - | ||||||||
Unrealized foreign exchange (gain) loss | - | (3.9 | ) | 7.1 | ||||||||
Deferred income tax expense | (5.9 | ) | 14.1 | 2.6 | ||||||||
Gain from Venezuela monetary assets and liabilities remeasurement | (4.9 | ) | - | - | ||||||||
Loss for Venezuela non-monetary assets to net realizable value | 9.3 | - | - | |||||||||
Other, net | (2.2 | ) | (2.8 | ) | (2.2 | ) | ||||||
Increase (decrease) in cash from changes in certain assets and liabilities: | ||||||||||||
Trade accounts receivable | 39.5 | (45.3 | ) | (35.6 | ) | |||||||
Inventories | 38.9 | (28.7 | ) | (2.6 | ) | |||||||
Deferred purchase price on sold receivables | (5.7 | ) | 11.5 | (8.0 | ) | |||||||
Accounts payable | (56.6 | ) | 68.9 | (37.1 | ) | |||||||
Restructuring reserves | 18.8 | 1.3 | (5.0 | ) | ||||||||
Pension and postretirement benefit liabilities | (4.0 | ) | (16.9 | ) | (4.1 | ) | ||||||
Other, net | (46.5 | ) | 14.0 | 21.6 | ||||||||
|
|
|
|
|
| |||||||
Net cash provided by operating activities | 206.3 | 261.8 | 250.3 | |||||||||
|
|
|
|
|
| |||||||
Cash flows from investing activities: | ||||||||||||
Acquisitions of companies, net of cash acquired | (1.6 | ) | (53.5 | ) | - | |||||||
Issuance of subordinated note receivable | (44.2 | ) | - | - | ||||||||
Purchases of properties, plants and equipment | (135.8 | ) | (137.9 | ) | (136.4 | ) | ||||||
Purchases of timber properties | (38.4 | ) | (56.8 | ) | (9.0 | ) | ||||||
Proceeds from the sale of properties, plants, equipment and other assets | 49.3 | 49.6 | 41.5 | |||||||||
Proceeds from the sale of businesses | 19.6 | 115.3 | - | |||||||||
Proceeds on insurance recoveries | 4.6 | - | - | |||||||||
Payments on notes receivable with related party, net | - | 14.3 | 3.2 | |||||||||
|
|
|
|
|
| |||||||
Net cash used in investing activities | (146.5 | ) | (69.0 | ) | (100.7 | ) | ||||||
|
|
|
|
|
| |||||||
Cash flows from financing activities: | ||||||||||||
Proceeds from issuance of long-term debt | 912.3 | 1,120.0 | 1,253.8 | |||||||||
Payments on long-term debt | (870.1 | ) | (1,186.5 | ) | (1,266.5 | ) | ||||||
Proceeds from (payments on) short-term borrowings, net | 2.6 | 8.2 | (30.2 | ) | ||||||||
Proceeds from trade accounts receivable credit facility | 123.0 | 67.0 | 75.6 | |||||||||
Payments on trade accounts receivable credit facility | (85.4 | ) | (97.0 | ) | (45.6 | ) | ||||||
Dividends paid to Greif, Inc. shareholders | (98.7 | ) | (98.6 | ) | (98.3 | ) | ||||||
Dividends paid to noncontrolling interests | (4.0 | ) | - | - | ||||||||
Cash paid for deferred purchase price related to acquisitions | - | (1.2 | ) | (46.6 | ) | |||||||
Proceeds from the sale of membership units of a consolidated subsidiary | - | 6.0 | - | |||||||||
Fees paid for amended credit agreement | - | - | (3.4 | ) | ||||||||
Exercise of stock options | 0.2 | 1.6 | 1.3 | |||||||||
|
|
|
|
|
| |||||||
Net cash used in financing activities | (20.1 | ) | (180.5 | ) | (159.9 | ) | ||||||
|
|
|
|
|
| |||||||
Effects of exchange rates on cash | (18.6 | ) | (5.3 | ) | (3.1 | ) | ||||||
|
|
|
|
|
| |||||||
Net increase (decrease) in cash and cash equivalents | 21.1 | 7.0 | (13.4 | ) | ||||||||
|
|
|
|
|
| |||||||
Cash and cash equivalents at beginning of year | 85.1 | 78.1 | 91.5 | |||||||||
|
|
|
|
|
| |||||||
Cash and cash equivalents at end of year | $ | 106.2 | $ | 85.1 | $ | 78.1 | ||||||
|
|
|
|
|
| |||||||
Refer to the accompanying Notes to Consolidated Financial Statements.
47
GREIF, INC. AND SUBSIDIARY COMPANIES
CONSOLIDATED STATEMENTS OF CHANGES IN SHAREHOLDERS' EQUITY
(Amounts in millions, except shares amounts in thousands and per share amounts)
| Capital Stock | Treasury Stock | Retained Earnings | Accumulated Other Comprehensive Income (Loss) | Greif, Inc. Equity | Noncontrolling interests | Total Equity | ||||||||||||||||||||||||||||||
| Shares | Amount | Shares | Amount | |||||||||||||||||||||||||||||||||
As of October 31, 2012 | 47,403 | $ | 123.8 | 29,439 | $ | (131.4 | ) | $ | 1,372.2 | $ | (191.7 | ) | $ | 1,172.9 | $ | 119.0 | $ | 1,291.9 | ||||||||||||||||||
Net income | 144.7 | 144.7 | 2.8 | 147.5 | ||||||||||||||||||||||||||||||||
Other comprehensive income (loss): | ||||||||||||||||||||||||||||||||||||
– Foreign currency translation | 7.9 | 7.9 | 1.4 | 9.3 | ||||||||||||||||||||||||||||||||
– Reclassification of cash flow hedges to earnings, net of income tax benefit of $0.3 million | 0.5 | 0.5 | 0.5 | |||||||||||||||||||||||||||||||||
– Unrealized gain on cash flow hedges, net of income tax expense of $0.2 million | (0.2 | ) | (0.2 | ) | (0.2 | ) | ||||||||||||||||||||||||||||||
– Minimum pension liability adjustment, net of income tax expense of $22.2 million | 30.9 | 30.9 | 30.9 | |||||||||||||||||||||||||||||||||
|
|
|
| |||||||||||||||||||||||||||||||||
Comprehensive income | 183.8 | 188.0 | ||||||||||||||||||||||||||||||||||
|
|
|
| |||||||||||||||||||||||||||||||||
Acquisitions of noncontrolling interests and other | 0.2 | 0.2 | (7.9 | ) | (7.7 | ) | ||||||||||||||||||||||||||||||
Dividends paid ($1.68 per Class A share and $2.51 per Class B share) | (98.3 | ) | (98.3 | ) | (98.3 | ) | ||||||||||||||||||||||||||||||
Stock options exercised | 99 | 1.3 | (99 | ) | 0.2 | 1.5 | 1.5 | |||||||||||||||||||||||||||||
Restricted stock directors | 5 | 0.2 | (5 | ) | - | 0.2 | 0.2 | |||||||||||||||||||||||||||||
Restricted stock executives | 16 | 0.8 | (16 | ) | 0.1 | 0.9 | 0.9 | |||||||||||||||||||||||||||||
Stock forfeiture | - | 0.2 | - | - | 0.2 | 0.2 | ||||||||||||||||||||||||||||||
Tax benefit of stock options and other | - | 1.0 | - | - | 1.0 | 1.0 | ||||||||||||||||||||||||||||||
Long-term incentive shares issued | 54 | 2.1 | (54 | ) | 0.1 | 2.2 | 2.2 | |||||||||||||||||||||||||||||
|
|
|
|
|
|
|
|
|
|
|
|
|
|
|
|
|
| |||||||||||||||||||
As of October 31, 2013 | 47,577 | $ | 129.4 | 29,265 | $ | (131.0 | ) | $ | 1,418.8 | $ | (152.6 | ) | $ | 1,264.6 | $ | 115.3 | $ | 1,379.9 | ||||||||||||||||||
Net income | 91.5 | 91.5 | (46.6 | ) | 44.9 | |||||||||||||||||||||||||||||||
Other comprehensive income (loss): | ||||||||||||||||||||||||||||||||||||
– Foreign currency translation | (87.6 | ) | (87.6 | ) | 0.7 | (86.9 | ) | |||||||||||||||||||||||||||||
– Reclassification of cash flow hedges to earnings, net of income tax benefit of $0.5 million | 0.4 | 0.4 | 0.4 | |||||||||||||||||||||||||||||||||
– Unrealized gain on cash flow hedges, net of income tax expense of $0.2 million | 0.1 | 0.1 | 0.1 | |||||||||||||||||||||||||||||||||
– Minimum pension liability adjustment, net of income tax benefit of $15.7 million | (34.7 | ) | (34.7 | ) | (34.7 | ) | ||||||||||||||||||||||||||||||
|
|
|
| |||||||||||||||||||||||||||||||||
Comprehensive income | (30.3 | ) | (76.2 | ) | ||||||||||||||||||||||||||||||||
|
|
|
| |||||||||||||||||||||||||||||||||
Acquisitions of noncontrolling interests and other | 11.7 | 11.7 | ||||||||||||||||||||||||||||||||||
Dividends paid ($1.68 per Class A share and $2.51 per Class B share) | (98.6 | ) | (98.6 | ) | (98.6 | ) | ||||||||||||||||||||||||||||||
Stock options exercised | 69 | 1.6 | (69 | ) | 0.1 | 1.7 | 1.7 | |||||||||||||||||||||||||||||
Restricted stock directors | 22 | 1.1 | (22 | ) | 0.1 | 1.2 | 1.2 | |||||||||||||||||||||||||||||
Tax benefit of stock options and other | - | 0.5 | - | - | 0.5 | 0.5 | ||||||||||||||||||||||||||||||
Long-term incentive shares issued | 56 | 2.9 | (56 | ) | 0.1 | 3.0 | 3.0 | |||||||||||||||||||||||||||||
|
|
|
|
|
|
|
|
|
|
|
|
|
|
|
|
|
| |||||||||||||||||||
As of October 31, 2014 | 47,724 | $ | 135.5 | 29,118 | $ | (130.7 | ) | $ | 1,411.7 | $ | (274.4 | ) | $ | 1,142.1 | $ | 81.1 | $ | 1,223.2 | ||||||||||||||||||
Net income | 71.9 | 71.9 | (4.7 | ) | 67.2 | |||||||||||||||||||||||||||||||
Other comprehensive income (loss): | ||||||||||||||||||||||||||||||||||||
– Foreign currency translation | (112.1 | ) | (112.1 | ) | (18.8 | ) | (130.9 | ) | ||||||||||||||||||||||||||||
– Reclassification of cash flow hedges to earnings, net of immaterial income tax expense | 0.1 | 0.1 | 0.1 | |||||||||||||||||||||||||||||||||
– Minimum pension liability adjustment, net of income tax expense of $0.5 million | 9.0 | 9.0 | 9.0 | |||||||||||||||||||||||||||||||||
|
|
|
| |||||||||||||||||||||||||||||||||
Comprehensive income | (31.1 | ) | (54.6 | ) | ||||||||||||||||||||||||||||||||
|
|
|
| |||||||||||||||||||||||||||||||||
Acquisitions of noncontrolling interests and other | (0.4 | ) | (0.4 | ) | (9.3 | ) | (9.7 | ) | ||||||||||||||||||||||||||||
Dividends paid to Greif Inc., Shareholders ($1.68 per Class A share and $2.51 per Class B share) | (98.7 | ) | (98.7 | ) | - | (98.7 | ) | |||||||||||||||||||||||||||||
Dividends paid to non-controlling interest | - | - | (4.0 | ) | (4.0 | ) | ||||||||||||||||||||||||||||||
Stock options exercised | 10 | 0.2 | (10 | ) | - | 0.2 | 0.2 | |||||||||||||||||||||||||||||
Restricted stock directors | 30 | 1.3 | (30 | ) | - | 1.3 | 1.3 | |||||||||||||||||||||||||||||
Tax benefit of stock options and other | - | 0.2 | - | - | 0.2 | 0.2 | ||||||||||||||||||||||||||||||
Long-term incentive shares issued | 50 | 1.9 | (50 | ) | 0.1 | 2.0 | 2.0 | |||||||||||||||||||||||||||||
|
|
|
|
|
|
|
|
|
|
|
|
|
|
|
|
|
| |||||||||||||||||||
As of October 31, 2015 | 47,814 | $ | 139.1 | 29,028 | $ | (130.6 | ) | $ | 1,384.5 | $ | (377.4 | ) | $ | 1,015.6 | $ | 44.3 | $ | 1,059.9 | ||||||||||||||||||
|
|
|
|
|
|
|
|
|
|
|
|
|
|
|
|
|
| |||||||||||||||||||
Refer to the accompanying Notes to Consolidated Financial Statements.
48
GREIF, INC. AND SUBSIDIARY COMPANIES
NOTES TO CONSOLIDATED FINANCIAL STATEMENTS
NOTE 1 – BASIS OF PRESENTATION AND SUMMARY OF SIGNIFICANT ACCOUNTING POLICIES
The Business
Greif, Inc. and its subsidiaries (collectively, "Greif," "our," or the "Company") principally manufacture industrial packaging products, complemented with a variety of value-added services, including blending, packaging, reconditioning, logistics and warehousing, flexible intermediate bulk containers and containerboard and corrugated products, that they sell to customers in many industries throughout the world. The Company has operations in over 50 countries. In addition, the Company owns timber properties in the southeastern United States, which are actively harvested and regenerated.
Due to the variety of its products, the Company has many customers buying different products and, due to the scope of the Company's sales, no one customer is considered principal in the total operations of the Company.
Because the Company supplies a cross section of industries, such as chemicals, paints and pigments, food and beverage, petroleum, industrial coatings, agricultural, pharmaceutical and mineral products, and must make spot deliveries on a day-to-day basis as its products are required by its customers, the Company does not operate on a backlog to any significant extent and maintains only limited levels of finished goods. Many customers place their orders weekly for delivery during the same week.
The Company's raw materials are principally steel, resin, containerboard, old corrugated containers for recycling, used industrial packaging for reconditioning and pulpwood.
There were approximately 13,150 employees of the Company as of October 31, 2015.
Principles of Consolidation and Basis of Presentation
The consolidated financial statements include the accounts of Greif, Inc., all wholly-owned and majority-owned subsidiaries, joint ventures controlled by the Company including the joint venture relating to the Flexible Products & Services segment and equity earnings of unconsolidated affiliates. All intercompany transactions and balances have been eliminated in consolidation. Investments in unconsolidated affiliates are accounted for using the equity or cost methods based on the Company's ownership interest in the unconsolidated affiliate.
The Company's consolidated financial statements are presented in accordance with accounting principles generally accepted in the United States ("GAAP"). Certain prior year and prior quarter amounts have been reclassified to conform to the current year presentation.
The Company's fiscal year begins on November 1 and ends on October 31 of the following year. Any references to the year 2015, 2014 or 2013, or to any quarter of those years, relates to the fiscal year ended in that year.
Venezuela Currency
The Company's results of its Venezuelan businesses have been reported under highly inflationary accounting since 2010 and the functional currency was converted to US Dollars at that time. Currently, there are multiple legal mechanisms and respective exchange rates available in Venezuela to exchange currency: the CENCOEX rate (official rate or "CENCOEX"); the SICAD rate ("SICAD") and; as of February of 2015, the SIMADI rate ("SIMADI"). The SIMADI exchange mechanism was created by the Venezuelan government to establish a more market driven exchange rate and is intended to be available to individuals and both public and private companies.
The Venezuelan government also announced in February 2015 that the official rate and SICAD exchange mechanisms would be available only to companies importing essential goods (i.e. medicine, food, and raw materials) although it has not officially published rules or regulations that clarify exactly which activities, industries or transactions will be eligible to use these rates. The purpose of these rates was intended to make necessities affordable to Venezuelan citizens. The exchange mechanisms have not been able to meet the demand from the private sector due to the lack of US Dollars in the country resulting in the continued devaluation of the SIMADI rate.
Greif has historically utilized the official rate which is 6.4 Bolivars/US Dollars to measure Bolivar-denominated monetary assets and liabilities and the respective historical rate to measure Bolivar-denominated nonmonetary assets each reporting period. Due to the continued significant devaluation of the Bolivar and the change in the exchange mechanisms announced earlier this year, the Company has reconsidered which rate best reflects the economics of Grief's business activities and concluded that the Company should utilize the SIMADI rate to remeasure the Venezuelan operations as of July 31, 2015.
As a result of the change to the SIMADI rate, which reflects the recognition of a devaluation of approximately 97 percent as compared to the official exchange rate previously used, the Company recorded other income of $4.9 million related to the remeasurement of our Venezuelan monetary assets and liabilities during the year. In addition, the Company determined that an adjustment of $9.3 million to increase cost of goods sold was needed to reflect the non-monetary inventory assets at net realizable value and, upon review of long-lived assets for impairment, the Company determined that the carrying amount of the long-lived asset was not recoverable in US dollar functional currency and recorded an impairment charge of $15.0 million. The Venezuela operations were translated using the official rate through July 31, 2015 and have been translated using the SIMADI rate from August 1, 2015 forward.
49
Use of Estimates
The preparation of consolidated financial statements in conformity with accounting principles generally accepted in the United States requires management to make certain estimates, judgments, and assumptions that affect the amounts reported in the consolidated financial statements and accompanying notes. The most significant estimates are related to the expected useful lives assigned to properties, plants and equipment, goodwill and other intangible assets, estimates of fair value, environmental liabilities, pension and postretirement benefits including plan assets, income taxes, net assets held for sale, and contingencies. Actual amounts could differ from those estimates.
Cash and Cash Equivalents
The Company considers highly liquid investments with an original maturity of three months or less to be cash equivalents. The carrying value of cash equivalents approximates fair value.
The Company had total cash and cash equivalents held outside of the United States in various foreign jurisdictions of $104.2 million as of October 31, 2015. Under current tax laws and regulations, if cash and cash equivalents held outside the United States are repatriated to the United States in the form of dividends or otherwise, the Company may be subject to additional U.S. income taxes (subject to an adjustment for foreign tax credits) and foreign withholding taxes.
Allowance for Doubtful Accounts
Trade receivables represent amounts owed to the Company through its operating activities and are presented net of allowance for doubtful accounts. The allowance for doubtful accounts totaled $11.8 million and $16.8 million as of October 31, 2015 and 2014, respectively. The Company evaluates the collectability of its accounts receivable based on a combination of factors. In circumstances where the Company is aware of a specific customer's inability to meet its financial obligations to the Company, the Company records a specific allowance for bad debts against amounts due to reduce the net recognized receivable to the amount the Company reasonably believes will be collected. In addition, the Company recognizes allowances for bad debts based on the length of time receivables are past due with allowance percentages, based on its historical experiences, applied on a graduated scale relative to the age of the receivable amounts. If circumstances such as higher than expected bad debt experience or an unexpected material adverse change in a major customer's ability to meet its financial obligations to the Company were to occur, the recoverability of amounts due to the Company could change by a material amount. Amounts deemed uncollectible are written-off against an established allowance for doubtful accounts.
Concentration of Credit Risk and Major Customers
The Company maintains cash depository accounts with banks throughout the world and invests in high quality short-term liquid instruments. Such investments are made only in instruments issued by high quality institutions. These investments mature within three months and the Company has not incurred any related losses for the years ended October 31, 2015, 2014, and 2013.
Trade receivables can be potentially exposed to a concentration of credit risk with customers or in particular industries. Such credit risk is considered by management to be limited due to the Company's many customers, none of which are considered principal in the total operations of the Company, and its geographic scope of operations in a variety of industries throughout the world. The Company does not have an individual customer that exceeds 10 percent of total revenue. In addition, the Company performs ongoing credit evaluations of its customers' financial conditions and maintains reserves for credit losses. Such losses historically have been within management's expectations.
Inventory
The Company primarily uses the FIFO method of inventory valuation. Reserves for slow moving and obsolete inventories are provided based on historical experience, inventory aging and product demand. The Company continuously evaluates the adequacy of these reserves and makes adjustments to these reserves as required. The Company also evaluates reserves for losses under firm purchase commitments for goods or inventories.
The Paper Packaging segment trades certain inventories with third parties. These inventory trades are not accounted for as sales, and the Company records an asset or liability for any imbalance resulting from these trades.
Net Assets Held for Sale
Net assets held for sale represent land, buildings and land improvements for locations that have met the criteria of "held for sale" accounting, as specified by Accounting Standards Codification ("ASC") 360, "Property, Plant, and Equipment." As of October 31, 2015, there were four asset groups in the Rigid Industrial Packaging Products & Services segment and one asset group in the Flexible Products & Services segment that are recorded as assets and liabilities held for sale. The effect of suspending depreciation on the facilities held for sale is immaterial to the results of operations. The net assets held for sale are being marketed for sale and it is the Company's intention to complete the sales of these assets within the upcoming year.
50
Goodwill and Indefinite-Lived Intangibles
Goodwill is the excess of the purchase price of an acquired entity over the amounts assigned to tangible and intangible assets and liabilities assumed in the business combination. The Company accounts for purchased goodwill and indefinite-lived intangible assets in accordance with ASC 350, "Intangibles – Goodwill and Other." Under ASC 350, purchased goodwill and intangible assets with indefinite lives are not amortized, but instead are tested for impairment at least annually. The Company tests for impairment of goodwill and indefinite-lived intangible assets during the fourth quarter of each fiscal year as of August 1, or more frequently if certain indicators are present or changes in circumstances suggest that impairment may exist.
In accordance with ASC 350 the Company has the option to first assess qualitative factors to determine whether it is necessary to perform the two-step test for goodwill impairment. If the Company believes, as a result of its qualitative assessment, that it is more-likely-than-not that the fair value of a reporting unit is less than its carrying amount, the quantitative impairment test is required. The quantitative test for goodwill impairment is conducted at the reporting unit level using a two-step approach. The first step requires a comparison of the carrying value of the reporting units to the estimated fair value of these units. If the carrying value of a reporting unit exceeds its estimated fair value, the Company performs the second step of the goodwill impairment to measure the amount of impairment loss, if any. The second step of the goodwill impairment test compares the estimated implied fair value of a reporting unit's goodwill to its carrying value. The Company allocates the estimated fair value of a reporting unit to all of the assets and liabilities in that reporting unit, including intangible assets, as if the reporting unit had been acquired in a business combination. Any excess of the estimated fair value of a reporting unit over the amounts assigned to its assets and liabilities is the implied fair value of goodwill. When there is a disposition of a portion of a reporting unit, goodwill is allocated to the gain or loss on that disposition based on the relative fair values of the portion of the reporting unit subject to disposition and the portion of the reporting unit that will be retained.
The Company's determination of estimated fair value of the reporting units is based on a discounted cash flow analysis utilizing the income approach. Under this method, the principal valuation focus is on the reporting unit's cash-generating capabilities. The discount rates used for impairment testing are based on a market participant's weighted average cost of capital. The use of alternative estimates, including different peer groups or changes in the industry, or adjusting the discount rate, or earnings before interest, taxes, depreciation, depletion and amortization forecasts used could affect the estimated fair value of the reporting units and potentially result in goodwill impairment. Any identified impairment would result in an expense to the Company's results of operations. Refer to Note 6 for additional information regarding goodwill and other intangible assets.
Other Intangibles
The Company accounts for intangible assets in accordance with ASC 350. Intangible assets are amortized over their useful lives on a straight-line basis. The useful lives for finite lived intangible assets vary depending on the type of asset and the terms of contracts or the valuation performed. The Company tests for impairment of finite lived intangible assets at least annually, or more frequently if certain indicators are present to suggest that impairment may exist. Amortization expense on other intangible assets is recorded on the straight-line method over their useful lives as follows:
| Years | ||
Trade names | 10-15 | |
Non-competes | 1-10 | |
Customer relationships | 5-15 | |
Other intangibles | 3-15 |
Acquisitions
From time to time, the Company acquires businesses and/or assets that augment and complement its operations, in accordance with ASC 805, "Business Combinations." These acquisitions are accounted for under the purchase method of accounting. The consolidated financial statements include the results of operations from these business combinations from the date of acquisition.
In order to assess performance, the Company classifies costs incurred in connection with acquisitions as acquisition-related costs. These costs consist primarily of transaction costs, integration costs and changes in the fair value of contingent payments (earn-outs) and are recorded within selling, general and administrative costs. Acquisition transaction costs are incurred during the initial evaluation of a potential targeted acquisition and primarily relate to costs to analyze, negotiate and consummate the transaction as well as financial and legal due diligence activities. Post-acquisition integration activities are costs incurred to combine the operations of an acquired enterprise into the Company's operations.
Internal Use Software
Internal use software is accounted for under ASC 985, "Software." Internal use software is software that is acquired, internally developed or modified solely to meet the Company's needs and for which, during the software's development or modification, a plan does not exist to market the software externally. Costs incurred to develop the software during the application development stage and for upgrades and enhancements that provide additional functionality are capitalized and then amortized over a three to ten year period. Internal use software is capitalized as a component of machinery and equipment on the Consolidated Balance Sheets.
51
Long-Lived Assets
Properties, plants and equipment are stated at cost. Depreciation on properties, plants and equipment is provided on the straight-line method over the estimated useful lives of the assets as follows:
| Years | ||
Buildings | 30-45 | |
Machinery and equipment | 3-19 |
Depreciation expense was $113.4 million, $129.8 million and $131.9 million, in 2015, 2014 and 2013, respectively. Expenditures for repairs and maintenance are charged to expense as incurred. When properties are retired or otherwise disposed of, the cost and accumulated depreciation are eliminated from the asset and related allowance accounts. Gains or losses are credited or charged to income as incurred.
The Company capitalizes interest on long-term fixed asset projects using a rate that approximates the weighted average cost of borrowing. For the years ended October 31, 2015, 2014, and 2013, the Company capitalized interest costs of $1.5 million, $1.4 million, and $1.7 million, respectively.
The Company tests for impairment of properties, plants and equipment at least annually, or more frequently if certain indicators are present to suggest that impairment may exist. Long-lived assets are grouped together at the lowest level, generally at the plant level, for which identifiable cash flows are largely independent of cash flows of other groups of long-lived assets. As events warrant, we evaluate the recoverability of long-lived assets, other than goodwill and indefinite-lived intangible assets, by assessing whether the carrying value can be recovered over their remaining useful lives through the expected future undiscounted operating cash flows of the underlying business. Impairment indicators include, but are not limited to, a significant decrease in the market price of a long-lived asset; a significant adverse change in the manner in which the asset is being used or in its physical condition; a significant adverse change in legal factors or the business climate that could affect the value of a long-lived asset; an accumulation of costs significantly in excess of the amount originally expected for the acquisition or construction of a long-lived asset; current period operating or cash flow losses combined with a history of operating or cash flow losses associated with the use of the asset; or a current expectation that it is more likely than not that a long-lived asset will be sold or otherwise disposed of significantly before the end of its previously estimated useful life. Future decisions to change our manufacturing processes, exit certain businesses, reduce excess capacity, temporarily idle facilities and close facilities could result in material impairment charges. Any impairment loss that may be required is determined by comparing the carrying value of the assets to their estimated fair value.
The Company owns timber properties in the southeastern United States. With respect to the Company's United States timber properties, which consisted of approximately 242,673 acres as of October 31, 2015, depletion expense on timber properties is computed on the basis of cost and the estimated recoverable timber. Depletion expense was $2.8 million, $3.8 million and $4.3 million in 2015, 2014 and 2013, respectively. The Company's land costs are maintained by tract. The Company begins recording pre-merchantable timber costs at the time the site is prepared for planting. Costs capitalized during the establishment period include site preparation by aerial spray, costs of seedlings, planting costs, herbaceous weed control, woody release, labor and machinery use, refrigeration rental and trucking for the seedlings. The Company does not capitalize interest costs in the process. Property taxes are expensed as incurred. New road construction costs are capitalized as land improvements and depreciated over 20 years. Road repairs and maintenance costs are expensed as incurred. Costs after establishment of the seedlings, including management costs, pre-commercial thinning costs and fertilization costs, are expensed as incurred. Once the timber becomes merchantable, the cost is transferred from the pre-merchantable timber category to the merchantable timber category in the depletion block.
Merchantable timber costs are maintained by five product classes, pine sawtimber, pine chip-n-saw, pine pulpwood, hardwood sawtimber and hardwood pulpwood, within a depletion block, with each depletion block based upon a geographic district or subdistrict. Currently, the Company has eight depletion blocks. These same depletion blocks are used for pre-merchantable timber costs. Each year, the Company estimates the volume of the Company's merchantable timber for the five product classes by each depletion block. These estimates are based on the current state in the growth cycle and not on quantities to be available in future years. The Company's estimates do not include costs to be incurred in the future. The Company then projects these volumes to the end of the year. Upon acquisition of a new timberland tract, the Company records separate amounts for land, merchantable timber and pre-merchantable timber allocated as a percentage of the values being purchased. These acquisition volumes and costs acquired during the year are added to the totals for each product class within the appropriate depletion block(s). The total of the beginning, one-year growth and acquisition volumes are divided by the total undepleted historical cost to arrive at a depletion rate, which is then used for the current year. As timber is sold, the Company multiplies the volumes sold by the depletion rate for the current year to arrive at the depletion cost.
The Company's Canadian timber properties, which were sold during 2015, were not actively managed, and therefore, no depletion expense is recorded.
52
Contingencies
Various lawsuits, claims and proceedings have been or may be instituted or asserted against the Company, including those pertaining to environmental, product liability, and safety and health matters. While the amounts claimed may be substantial, the ultimate liability cannot currently be determined because of the considerable uncertainties that exist.
All lawsuits, claims and proceedings are considered by the Company in establishing reserves for contingencies in accordance with ASC 450, "Contingencies." In accordance with the provisions of ASC 450, the Company accrues for a litigation-related liability when it is probable that a liability has been incurred and the amount of the loss can be reasonably estimated. Based on currently available information known to the Company, the Company believes that its reserves for these litigation-related liabilities are reasonable and that the ultimate outcome of any pending matters is not likely to have a material effect on the Company's financial position or results of operations.
Environmental Cleanup Costs
The Company accounts for environmental cleanup costs in accordance with ASC 410, "Asset Retirement and Environmental Obligations." The Company expenses environmental expenditures related to existing conditions resulting from past or current operations and from which no current or future benefit is discernible. Expenditures that extend the life of the related property or mitigate or prevent future environmental contamination are capitalized. The Company determines its liability on a site-by-site basis and records a liability at the time when it is probable and can be reasonably estimated. The Company's estimated liability is reduced to reflect the anticipated participation of other potentially responsible parties in those instances where it is probable that such parties are legally responsible and financially capable of paying their respective shares of the relevant costs.
Self-Insurance
The Company is self-insured for certain of the claims made under its employee medical and dental insurance programs. The Company had recorded liabilities totaling $3.6 million and $2.8 million for estimated costs related to outstanding claims as of October 31, 2015 and 2014, respectively. These costs include an estimate for expected settlements on pending claims, administrative fees and an estimate for claims incurred but not reported. These estimates are based on management's assessment of outstanding claims, historical analyses and current payment trends. The Company recorded an estimate for the claims incurred but not reported using an estimated lag period based upon historical information. The Company believes the reserves recorded are adequate based upon current facts and circumstances.
The Company has certain deductibles applied to various insurance policies including general liability, product, auto and workers' compensation. The Company maintains liabilities totaling $12.2 million and $14.7 million for anticipated costs related to general liability, product, vehicle, and workers' compensation claims as of October 31, 2015 and 2014, respectively. These costs include an estimate for expected settlements on pending claims, defense costs and an estimate for claims incurred but not reported. These estimates are based on the Company's assessment of its deductibles, outstanding claims, historical analysis, actuarial information and current payment trends.
Income Taxes
Income taxes are accounted for under ASC 740, "Income Taxes." In accordance with ASC 740, deferred tax assets and liabilities are recognized for the future tax consequences attributable to differences between the financial statement carrying amounts of existing assets and liabilities and their respective tax bases, as measured by enacted tax rates that are expected to be in effect in the periods when the deferred tax assets and liabilities are expected to be settled or realized. Valuation allowances are established when management believes it is more likely than not that some position of the deferred tax assets will not be realized.
The Company's effective tax rate is impacted by the amount of income allocated to each taxing jurisdiction, statutory tax rates and tax planning opportunities available to the Company in the various jurisdictions in which the Company operates. Significant judgment is required in determining the Company's effective tax rate and in evaluating its tax positions.
Tax benefits from uncertain tax positions are recognized when it is more likely than not that the position will be sustained upon examination, including resolutions of any related appeals or litigation processes, based on the technical merits. The amount recognized is measured as the largest amount of tax benefit that is greater than 50 percent likely of being realized upon settlement. The Company's effective tax rate includes the impact of reserve provisions and changes to reserves that it considers appropriate as well as related interest and penalties.
A number of years may elapse before a particular matter, for which the Company has established a reserve, is audited and finally resolved. The number of years with open tax audits varies depending on the tax jurisdiction. While it is often difficult to predict the final outcome or the timing of resolution of any particular tax matter, the Company believes that its reserves reflect the probable outcome of known tax contingencies. Unfavorable settlement of any particular issue would require use of the Company's cash. Favorable resolution would be recognized as a reduction to the Company's effective tax rate in the period of resolution.
53
Other Comprehensive Income
Our other comprehensive income is significantly impacted by foreign currency translation and defined benefit pension and postretirement benefit adjustments. The impact of foreign currency translation is affected by the translation of assets and liabilities of our foreign subsidiaries which are denominated in functional currencies other than the U.S. dollar. The primary assets and liabilities affecting the adjustments are cash and cash equivalents; accounts receivable; inventory; properties, plant and equipment; accounts payable; pension and other postretirement benefit obligations; and certain intercompany loans payable and receivable. The primary currencies in which these assets and liabilities are denominated are the Euro, Brazilian Real, and Chinese Yuan. The impact of defined benefit pension and postretirement benefit adjustments is primarily affected by unrecognized actuarial gains and losses related to our defined benefit and other postretirement benefit plans, as well as the subsequent amortization of gains and losses from accumulated other comprehensive income in periods following the initial recording such items. These actuarial gains and losses are determined using various assumptions, the most significant of which are (i) the weighted average rate used for discounting the liability, (ii) the weighted average expected long-term rate of return on pension plan assets, (iii) the method used to determine market-related value of pension plan assets, (iv) the weighted average rate of future salary increases and (v) the anticipated mortality rate tables.
Restructuring Charges
The Company accounts for all exit or disposal activities in accordance with ASC 420, "Exit or Disposal Cost Obligations." Under ASC 420, a liability is measured at its fair value and recognized as incurred.
Employee-related costs primarily consist of one-time termination benefits provided to employees who have been involuntarily terminated. A one-time benefit arrangement is an arrangement established by a plan of termination that applies for a specified termination event or for a specified future period. A one-time benefit arrangement exists at the date the plan of termination meets all of the following criteria and has been communicated to employees:
| (1) | Management, having the authority to approve the action, commits to a plan of termination. |
| (2) | The plan identifies the number of employees to be terminated, their job classifications or functions and their locations, and the expected completion date. |
| (3) | The plan establishes the terms of the benefit arrangement, including the benefits that employees will receive upon termination (including but not limited to cash payments), in sufficient detail to enable employees to determine the type and amount of benefits they will receive if they are involuntarily terminated. |
| (4) | Actions required to complete the plan indicate that it is unlikely that significant changes to the plan will be made or that the plan will be withdrawn. |
Facility exit and other costs consist of equipment relocation costs and project consulting fees. A liability for other costs associated with an exit or disposal activity shall be recognized and measured at its fair value in the period in which the liability is incurred (generally, when goods or services associated with the activity are received). The liability shall not be recognized before it is incurred, even if the costs are incremental to other operating costs and will be incurred as a direct result of a plan.
Pension and Postretirement Benefits
Under ASC 715, "Compensation – Retirement Benefits," employers recognize the funded status of their defined benefit pension and other postretirement plans on the consolidated balance sheet and record as a component of other comprehensive income, net of tax, the gains or losses and prior service costs or credits that have not been recognized as components of the net periodic benefit cost.
Transfer and Servicing of Assets
An indirect wholly-owned subsidiary of Greif, Inc. agrees to sell trade receivables meeting certain eligibility requirements that it had purchased from other indirect wholly-owned subsidiaries of Greif, Inc., under a non-U.S. factoring agreement. The structure of the transactions provide for a legal true sale, on a revolving basis, of the receivables transferred from the various Greif, Inc. subsidiaries to the respective banks or their affiliates. The banks and their affiliates fund an initial purchase price of a certain percentage of eligible receivables based on a formula with the initial purchase price approximating 75 percent to 90 percent of eligible receivables. The remaining deferred purchase price is settled upon collection of the receivables. At the balance sheet reporting dates, the Company removes from accounts receivable the amount of proceeds received from the initial purchase price since they meet the applicable criteria of ASC 860, "Transfers and Servicing," and continues to recognize the deferred purchase price in its other current assets. The receivables are sold on a non-recourse basis with the total funds in the servicing collection accounts pledged to the banks between settlement dates.
Stock-Based Compensation Expense
The Company recognizes stock-based compensation expense in accordance with ASC 718, "Compensation – Stock Compensation." ASC 718 requires the measurement and recognition of compensation expense, based on estimated fair values, for all share-based awards made to employees and directors, including stock options, restricted stock, restricted stock units and participation in the Company's employee stock purchase plan.
54
ASC 718 requires companies to estimate the fair value of share-based awards on the date of grant using an option-pricing model. The value of the portion of the award that is ultimately expected to vest is recognized as expense in the Company's consolidated statements of income over the requisite service periods. No options were granted in 2015, 2014, or 2013. For any options granted in the future, compensation expense will be based on the grant date fair value estimated in accordance with the standard.
Revenue Recognition
The Company recognizes revenue when title passes and risks and rewards of ownership have transferred to customers or services have been rendered, with appropriate provision for returns and allowances. Revenue is recognized in accordance with ASC 605, "Revenue Recognition."
Timberland disposals, timber, higher and better use ("HBU") land, surplus and development property revenues are recognized when closings have occurred, required down payments have been received, title and possession have been transferred to the buyer, and all other criteria for sale and profit recognition have been satisfied.
The Company reports the sale of HBU and surplus property in our consolidated statements of income under "gain on disposal of properties, plants and equipment, net" and reports the sale of development property under "net sales" and "cost of products sold." All HBU and development property, together with surplus property, is used by the Company to productively grow and sell timber until the property is sold.
Shipping and Handling Fees and Costs
The Company includes shipping and handling fees and costs in cost of products sold.
Other Expense, Net
Other expense, net primarily represents non-United States trade receivables program fees, currency transaction gains and losses and other infrequent non-operating items.
Currency Translation
In accordance with ASC 830, "Foreign Currency Matters," the assets and liabilities denominated in a foreign currency are translated into United States dollars at the rate of exchange existing at period-end, and revenues and expenses are translated at average exchange rates.
The cumulative translation adjustments, which represent the effects of translating assets and liabilities of the Company's international operations, are presented in the consolidated statements of changes in shareholders' equity in accumulated other comprehensive income (loss). Transaction gains and losses on foreign currency transactions denominated in a currency other than an entity's functional currency are credited or charged to income. The amounts included in other expense, net related to transaction losses, net of tax were $3.8 million, $1.2 million and $3.9 million in 2015, 2014 and 2013, respectively.
Derivative Financial Instruments
In accordance with ASC 815, "Derivatives and Hedging," the Company records all derivatives in the consolidated balance sheet as either assets or liabilities measured at fair value. Dependent on the designation of the derivative instrument, changes in fair value are recorded to earnings or shareholders' equity through other comprehensive income (loss). The Company may use the following derivatives from time to time.
The Company uses interest rate swap agreements for cash flow hedging purposes. For derivative instruments that hedge the exposure of variability in interest rates, designated as cash flow hedges, the effective portion of the net gain or loss on the derivative instrument is reported as a component of other comprehensive income (loss) and reclassified into earnings in the same period or periods during which the hedged transaction affects earnings.
Interest rate swap agreements that hedge against variability in interest rates effectively convert a portion of floating rate debt to a fixed rate basis, thus reducing the impact of interest rate changes on future interest expense. The Company uses the "variable cash flow method" for assessing the effectiveness of these swaps. The effectiveness of these swaps is reviewed at least every quarter. Hedge ineffectiveness has not been material during any of the years presented herein.
The Company enters into currency forward contracts to hedge certain currency transactions and short-term intercompany loan balances with its international businesses. Such contracts limit the Company's exposure to both favorable and unfavorable currency fluctuations. These contracts are adjusted to reflect market value as of each balance sheet date, with the resulting changes in fair value being recognized in other comprehensive income (loss).
The Company has used derivative instruments to hedge a portion of its natural gas purchases. These derivatives were designated as cash flow hedges. The effective portion of the net gain or loss was reported as a component of other comprehensive income (loss) and reclassified into earnings in the same period during which the hedged transaction affects earnings.
Any derivative contract that is either not designated as a hedge, or is so designated but is ineffective, would be adjusted to market value and recognized in earnings immediately. If a cash flow or fair value hedge ceases to qualify for hedge accounting, the contract would continue to be carried on the balance sheet at fair value until settled and future adjustments to the contract's fair value would be recognized in earnings immediately. If a forecasted transaction were no longer probable to occur, amounts previously deferred in accumulated other comprehensive income (loss) would be recognized immediately in earnings.
55
Fair Value
The Company uses ASC 820, "Fair Value Measurements and Disclosures" to account for fair value. ASC 820 defines fair value, establishes a framework for measuring fair value in GAAP and expands disclosures about fair value measurements. Additionally, this standard established a three-level fair value hierarchy that prioritizes the inputs used to measure fair value. This hierarchy requires entities to maximize the use of observable inputs and minimize the use of unobservable inputs.
The three levels of inputs used to measure fair values are as follows:
| • | Level 1 – Observable inputs such as unadjusted quoted prices in active markets for identical assets and liabilities. |
| • | Level 2 – Observable inputs other than quoted prices in active markets for identical assets and liabilities. |
| • | Level 3 – Unobservable inputs that are supported by little or no market activity and that are significant to the fair value of the assets and liabilities. |
The Company presents various fair value disclosures in Notes 10 and 13 to these consolidated financial statements.
Newly Adopted Accounting Standards
In March 2013, the Financial Accounting Standards Board ("FASB") issued Accounting Standards Update ("ASU") 2013-05 "Foreign Currency Matters: Parent's Accounting for the Cumulative Translation Adjustment upon Derecognition of Certain Subsidiaries or Groups of Assets within a Foreign Entity or an Investment in a Foreign Entity." The objective of this update is to resolve the diversity in practice about whether ASC 810-10 or ASC 830-30 applies to the release of the cumulative translation adjustment into net income when a parent either sells a part or all of its investment in a foreign entity or no longer holds a controlling financial interest in a subsidiary or group of assets that is a nonprofit activity or a business (other than a sale of in substance real estate or conveyance of oil and gas rights) within a foreign entity. The Company adopted the new guidance beginning on November 1, 2013. The adoption did not have, and is not expected to have, a significant impact on the Company's financial position, results of operations, comprehensive income, cash flows and disclosures.
In July 2013, the FASB issued ASU 2013-11 "Income Taxes: Presentation of an Unrecognized Tax Benefit When a Net Operating Loss Carryforward, a Similar Tax Loss, or a Tax Credit Carryforward Exists." The objective of this update is to eliminate the diversity in practice in the presentation of unrecognized tax benefits when a net operating loss carryforward, a similar tax loss or a tax credit carryforward exists. The amendments in this update seek to attain that objective by requiring an entity to present an unrecognized tax benefit in the financial statements as a reduction to a deferred tax asset for those instances described above, except in certain situations discussed in the update. The Company adopted the new guidance beginning on November 1, 2013, and the adoption of the new guidance did not impact the Company's financial position, results of operations, comprehensive income or cash flows, other than the related disclosures.
In April 2014, the FASB issued ASU 2014-08 "Presentation of Financial Statements (Topic 205) and Property, Plant, and Equipment (Topic 360): Reporting Discontinued Operations and Disclosures of Disposals of Components of an Entity." The objective of this update is to prevent disposals of small groups of assets that are recurring in nature to qualify for discontinued operations presentation under Subtopic 205-20. The amendments in this update seek to attain this objective by only allowing disposals representing a strategic shift in operations to be presented as discontinued operations. The Company adopted the new guidance beginning on May, 1 2014, after which new disposals of components are evaluated for discontinued operations treatment using the new guidance. As a result of the adoption of this standard, businesses sold or classified as held for sale subsequent to May 1, 2014 did not qualify as discontinued operations under the new standard.
Recently Issued Accounting Standards
As of October 31, 2015, the FASB has issued ASUs through 2015-16. We have reviewed each recently issued ASU and the adoption of each ASU that is applicable to us, other than as explained below will not have a material impact on our financial position, results of operations, comprehensive income or cash flows, other than the related disclosures.
In April 2015, the FASB issued ASU No. 2015-03, "Interest-Imputation of Interest (Subtopic 835-30)". The objective of this update is to simplify the presentation of debt issuance costs in the financial statements. Under the ASU, the Company would present such costs in the balance sheet as a direct deduction from the related debt liability rather than as an asset; amortization of the costs is reported as interest expense. The effective date will be the first quarter of fiscal year 2016. The Company would apply the new guidance retrospectively to all prior periods (i.e., the balance sheet for each period would be adjusted). The ASU requires the Company to "disclose in the first fiscal year after the entity's adoption date, and in the interim periods within the first fiscal year, the following: (1) The nature and reason for the change in accounting principle; (2) The transition method; (3) A description of the prior-period information that has been retrospectively adjusted; and (4) The effect of the change on the financial statement line item (that is, the debt issuance costs asset and the debt liability). The Company is expected to adopt this guidance beginning November 1, 2015, and the adoption of the new guidance is not expected to materially impact the Company's financial position, results of operations, comprehensive income or cash flows, other than the related disclosures.
56
In February 2015, the FASB issued ASU 2015-02, "Consolidation (Topic 810): Amendments to the Consolidation Analysis," which makes changes to both the variable interest model and voting interest model and eliminates the indefinite deferral of FASB Statement No. 167, included in ASU 2010-10, for certain investment funds. All reporting entities that hold a variable interest in other legal entities will need to re-evaluate their consolidation conclusions as well as disclosure requirements. This ASU is effective for annual periods beginning after December 15, 2015, and early adoption is permitted, including any interim period. The Company is in the process of determining the potential impact of adopting this guidance on its financial position, results of operations, comprehensive income, cash flow, and disclosures.
In May 2014, the FASB issued ASU No. 2014-09, "Revenue from Contracts with Customers (Topic 606)", which supersedes the revenue recognition requirements in ASC 605, Revenue Recognition. This ASU is based on the principle that revenue is recognized to depict the transfer of goods or services to customers in an amount that reflects the consideration to which the entity expects to be entitled in exchange for those goods or services. The ASU also requires additional disclosure about the nature, amount, timing and uncertainty of revenue and cash flows arising from customer contracts, including significant judgments and changes in judgments and assets recognized from costs incurred to obtain or fulfill a contract. The update is effective in fiscal year 2019 using one of two retrospective application methods. The Company is in the process of determining the potential impact of adopting this guidance on its financial position, results of operations, comprehensive income, cash flow and disclosures.
In August 2014, the FASB issued ASU 2014-15 "Presentation of Financial Statements-Going Concern: Disclosure of Uncertainties about an Entity's Ability to Continue as Going Concern". The objective of this update is to reduce the diversity in the timing and content of footnote disclosures related to going concern. The amendments require management to assess an entity's ability to continue as a going concern by incorporating and expanding upon certain principles that are currently in U.S. auditing standards. This update applies to all entities that would be required to disclose information about their potential inability to continue as a going concern when "substantial doubt" about their ability to continue as a going concern exists. The Company will be required to evaluate "relevant conditions and events that are known and reasonably knowable at the date that the financial statements are issued." The Company will have to document its consideration of the ASU, but not because the Company believes there is substantial doubt about its ability to continue as a going concern. The Company is expected to adopt this guidance beginning November 1, 2017, and the adoption of the new guidance is not expected to impact the Company's financial position, results of operations, comprehensive income or cash flows, other than the related disclosures.
NOTE 2 – ACQUISITIONS AND DIVESTITURES
The following table summarizes the Company's significant acquisition activity in 2015, 2014 and 2013 (Dollars in millions):
| # of Acquisitions | Purchase Price, net of Cash | Tangible Assets, net | Intangible Assets | Goodwill | |||||||||||||||
Total 2015 Acquisitions | - | $ | - | - | - | - | ||||||||||||||
Total 2014 Acquisitions | 2 | $ | 53.5 | 2.5 | 22.1 | 25.9 | ||||||||||||||
Total 2013 Acquisitions | - | $ | - | - | - | - | ||||||||||||||
Note: Purchase price, net of cash acquired, represents cash paid in the period of each acquisition and does not include assumed debt, subsequent payments for deferred purchase adjustments or earn-out provisions.
During 2015, the Company completed eight divestitures and no material acquisitions. The divestitures were of nonstrategic businesses: six in the Rigid Industrial Packaging & Services segment: and two in the Flexible Products & Services segment. The loss on disposal of businesses was $9.2 million for the year ended October 31, 2015. Proceeds from divestitures were $19.6 million. Additionally, the Company has recorded notes receivable of $2.9 million for the sale of these businesses, ranging from 3 months to five years.
During 2014, the Company completed two acquisitions and nine divestitures. One acquisition was in the Rigid Industrial Packaging & Services segment in November and the other acquisition was in the Paper Packaging & Services segment in November. The rigid industrial packaging acquisition complemented the Company's existing product lines and provide growth opportunities and economies of scale. The paper packaging acquisition was made in part to obtain technologies, equipment, and customer lists. The gain on sale of businesses, net was $11.5 million for the year ended October 31, 2014. Three of the divestitures were of nonstrategic businesses in the Rigid Industrial Packaging & Services segment. Two of the divestitures in this segment resulted in losses on disposal of $9.1 million and $1.8 million, respectively, which included the write off of allocated goodwill. The third divestiture in this segment resulted in a loss of $11.4 million, which consisted of $5.5 million recorded as a loss on disposal and of $5.9 million of non-cash asset impairment charges due to the recording of an expected loss prior to the period in which the transaction was completed. There were also divestitures of businesses in the Flexible Products & Services and Paper Packaging segments that resulted in gains of $18.3 million and $4.2 million, respectively, which included the write-off of allocated goodwill. Additionally, there were divestitures of four smaller investments in the Rigid Industrial Packaging & Services segment that resulted in an aggregate net gain of $5.4 million. Proceeds from divestitures were $115.3 million.
During 2013, the Company completed no material acquisitions and no material divestitures. The Company made a $46.6 million deferred cash payment during 2013 related to an acquisition completed in 2011.
None of the above-referenced divestitures in 2015 or 2014 qualified as discontinued operations as they do not, individuals or in the aggregate, represent a strategic shift that has had a major impact on the Company's operations or financial results.
57
The Company has allocated purchase price as of the dates of acquisition based upon its understanding, obtained during due diligence and through other sources, of the fair value of the acquired assets and assumed liabilities. If additional information is obtained about these assets and liabilities within the measurement period (not to exceed one year from the date of acquisition), including through asset appraisals and learning more about the newly acquired business, the Company may refine its estimates of fair value to allocate the purchase price more accurately; however, any such revisions are not expected to be significant.
NOTE 3 – SALE OF NON-UNITED STATES ACCOUNTS RECEIVABLE
On April 27, 2012, Cooperage Receivables Finance B.V. (the "Main SPV") and Greif Coordination Center BVBA, an indirect wholly owned subsidiary of Greif, Inc. ("Seller"), entered into the Nieuw Amsterdam Receivables Purchase Agreement (the "European RPA") with affiliates of a major international bank (the "Purchasing Bank Affiliates"). On April 20, 2015, the Main SPV and Seller amended and extended the term of the existing European RPA. Under the European RPA, as amended, the number of entities participating in the agreement have decreased to now include only the following entities: Greif Belgium BVBA, EarthMinded Benelux N.V. (formerly Pack2pack Rumbeke N.V.), Greif Nederland B.V., Greif Italia S.p.A., Greif Plastics Italy Srl (formerly Fustiplast S.p.A.), Greif France S.A.S., Greif Packaging Spain S.A., Greif Germany GmbH, Greif Plastics Germany GmbH (formerly Fustiplast GmbH), and Greif Portugal S.A. Additionally, the terms have been amended to decrease the maximum amount of receivables that may be sold and outstanding under the European RPA at any time to €100 million ($110.5 million as of October 31, 2015) and to allow the Company to manage the expense incurred under the facility by loaning excess cash back to the Purchasing Bank Affiliate in exchange for a subordinated note receivable. As of October 31, 2015, the Company loaned $44.2 million of excess cash back to the Purchasing Bank Affiliate, which is included in prepaid expenses and other current assets.
Under the terms of the European RPA, the Company has agreed to sell trade receivables meeting certain eligibility requirements that the seller had purchased from other of our indirect wholly-owned subsidiaries, under a factoring agreement. The structure of the transactions provide for a legal true sale, on a revolving basis, of the receivables transferred from our various subsidiaries to the respective banks and their affiliates. The purchaser funds an initial purchase price of a certain percentage of eligible receivables based on a formula, with the initial purchase price approximating 75 percent to 90 percent of eligible receivables. The remaining deferred purchase price is settled upon collection of the receivables. At the balance sheet reporting dates, we remove from accounts receivable the amount of proceeds received from the initial purchase price since they meet the applicable criteria of ASC 860, "Transfers and Servicing" and we continue to recognize the deferred purchase price in accounts receivable. The receivables are sold on a non-recourse basis with the total funds in the servicing collection accounts pledged to the banks between settlement dates.
In October 2007, Greif Singapore Pte. Ltd., an indirect wholly-owned subsidiary of Greif, Inc., entered into the Singapore Receivable Purchase Agreement (the "Singapore RPA") with a major international bank. The maximum amount of aggregate receivables that may be financed under the Singapore RPA is 15.0 million Singapore Dollars ($10.7 million as of October 31, 2015).
In May 2009, Greif Malaysia Sdn Bhd., an indirect wholly-owned subsidiary of Greif, Inc., entered into the Malaysian Receivables Purchase Agreement (the "Malaysian Agreement") with Malaysian banks. In March 2014, the Malaysian Agreement was discontinued and therefore there were no receivables held by third party financial institutions under this agreement as of October 31, 2015 and 2014.
The table below contains information related to the Company's accounts receivables programs (Dollars in millions):
For the years ended October 31, | 2015 | 2014 | 2013 | |||||||||
European RPA | ||||||||||||
Gross accounts receivable sold to third party financial institution | $ | 715.2 | $ | 1,006.4 | $ | 1,071.3 | ||||||
Cash received for accounts receivable sold under the programs | 633.6 | 888.1 | 947.0 | |||||||||
Deferred purchase price related to accounts receivable sold | 76.2 | 118.3 | 124.3 | |||||||||
Loss associated with the programs | 1.5 | 2.5 | 2.5 | |||||||||
Expenses associated with the programs | - | - | - | |||||||||
Other | ||||||||||||
Gross accounts receivable sold to third party financial institution | $ | 48.1 | $ | 56.7 | $ | 93.4 | ||||||
Cash received for accounts receivable sold under the programs | $ | 48.1 | $ | 56.7 | $ | 93.4 | ||||||
Deferred purchase price related to accounts receivable sold | $ | - | $ | - | $ | - | ||||||
Loss associated with the programs | $ | 0.1 | $ | - | $ | 0.2 | ||||||
Expenses associated with the programs | $ | 0.1 | $ | 0.1 | $ | 0.3 | ||||||
Total RPAs and Agreements | ||||||||||||
Gross accounts receivable sold to third party financial institution | $ | 763.3 | $ | 1,063.1 | $ | 1,164.7 | ||||||
Cash received for accounts receivable sold under the program | 681.7 | 944.8 | 1,040.4 | |||||||||
Deferred purchase price related to accounts receivable sold | 76.2 | 118.3 | 124.3 | |||||||||
Loss associated with the program | 1.6 | 2.5 | 2.7 | |||||||||
Expenses associated with the program | 0.1 | 0.1 | 0.3 | |||||||||
58
| October 31, 2015 | October 31, 2014 | |||||||
European RPA | ||||||||
Accounts receivable sold to and held by third party financial institution | $ | 114.8 | $ | 164.7 | ||||
Deferred purchase price asset (liability) related to accounts receivable sold | (1.5) | (23.7) | ||||||
Other | ||||||||
Accounts receivable sold to and held by third party financial institution | $ | 4.0 | $ | 5.0 | ||||
Uncollected deferred purchase price related to accounts receivable sold | - | - | ||||||
Total RPAs and Agreements | ||||||||
Accounts receivable sold to and held by third party financial institution | $ | 118.8 | $ | 169.7 | ||||
Deferred purchase price asset (liability) related to accounts receivable sold | (1.5) | (23.7) | ||||||
The deferred purchase price related to the accounts receivable sold is reflected as prepaid expenses and other current assets or other current liabilities on the Company's consolidated balance sheet and was initially recorded at an amount which approximates its fair value due to the short-term nature of these items. The cash received initially and the deferred purchase price relate to the sale or ultimate collection of the underlying receivables and are not subject to significant other risks given their short nature; therefore, the Company reflects all cash flows under the accounts receivable sales programs as operating cash flows on the Company's consolidated statements of cash flows.
Additionally, the Company performs collections and administrative functions on the receivables sold similar to the procedures it uses for collecting all of its receivables, including receivables that are not sold under the European RPA, the Singapore RPA and the Malaysian Agreement. The servicing liability for these receivables is not material to the consolidated financial statements.
NOTE 4 – INVENTORIES
The inventories are stated at the lower of cost or market and summarized as follows as of October 31 for each year (Dollars in millions):
| 2015 | 2014 | |||||||
Finished goods | $ | 88.0 | $ | 100.9 | ||||
Raw materials | 190.7 | 235.9 | ||||||
Work-in process | 18.3 | 44.3 | ||||||
|
|
|
| |||||
| $ | 297.0 | $ | 381.1 | |||||
|
|
|
| |||||
NOTE 5 – ASSETS AND LIABILITIES HELD FOR SALE AND DISPOSALS OF PROPERTY, PLANT AND EQUIPMENT, NET
As of October 31, 2015, there were four asset groups in the Rigid Industrial Packaging Products & Services segment and one asset group in the Flexible Products & Services segment classified as assets and liabilities held for sale, and it is the Company's intention to complete the sales of these assets within the twelve months following the end of the year. During 2015, two asset groups classified as held for sale at October 31, 2014 were sold, two other asset groups previously classified as held for sale were reclassed to held and used. Two asset groups, one within the Flexible Products & Services segment and one within the Paper Packaging Segment, were added and sold subsequently during the year. The assets and liabilities held for sale are being marketed for sale and it is the Company's intention to complete the sales of these assets within the upcoming year. For additional information regarding the sale of businesses refer to Note 2 to these consolidated financial statements.
For the year ended October 31, 2015, the Company recorded a gain on disposal of properties, plants and equipment, net of $7.0 million. There were sales of HBU and surplus properties which resulted in gains of $2.7 million in the Land Management segment, a disposal of an asset group previously classified as held for sale in the Rigid Industrial Packaging & Services segment that resulted in a gain of $4.4 million, insurance recoveries which resulted in gains of $3.0 million in the Rigid Industrial Packaging & Services segment, a $3.0 million loss in the Flexible Products & Services segment resulting from the fair market value adjustment of an asset previously classified as held for sale and other miscellaneous losses of $0.1 million.
For the year ended October 31, 2014, the Company recorded a gain on disposal of properties, plants and equipment, net of $8.3 million. There were sales of HBU and surplus properties which resulted in gains of $5.4 million in the Land Management segment, a sale of equipment in the Flexible Products & Services segment that resulted in a gain of $1.1 million, a disposal of an asset in the Paper Packaging segment that resulted in a gain of $0.7 million and sales of other miscellaneous equipment which resulted in aggregate gains of $1.1 million.
For the year ended October 31, 2013, the Company recorded a gain on disposal of properties, plants and equipment, net of $5.6 million. There were sales of HBU and surplus properties which resulted in gains of $1.2 million in the Land Management segment, a sale of equipment in the Paper Packaging segment that resulted in a gain of $0.6 million, a disposal of equipment in the Rigid Industrial Packaging & Services segment that resulted in a gain of $2.5 million, a sale of property that was previously classified as held for sale in the Rigid Industrial Packaging & Services segment that resulted in a gain of $0.6 million, a sale of land adjacent to our corporate offices that resulted in a gain of $0.8 million, a sale of equipment that resulted in a loss of $0.9 million and sales of other miscellaneous equipment which resulted in aggregate gains of $0.8 million.
59
For the years ended October 31, 2015, 2014 and 2013, the Company recorded a gain of $24.3 million, $17.1 million and $17.3 million, respectively, relating to the sale of timberland.
NOTE 6 – GOODWILL AND OTHER INTANGIBLE ASSETS
The following table summarizes the changes in the carrying amount of goodwill by segment for the year ended October 31, 2015 and 2014 (Dollars in millions):
| Rigid Industrial Packaging & Services | Paper Packaging | Flexible Products & Services (1) | Land Management | Total | ||||||||||||||||
Balance at October 31, 2013 | $ | 860.2 | $ | 59.9 | $ | 78.3 | $ | - | $ | 998.4 | ||||||||||
Goodwill acquired | 25.9 | - | - | - | 25.9 | |||||||||||||||
Goodwill allocated to divestitures and businesses held for sale | (25.5 | ) | (0.4 | ) | (21.8 | ) | - | (47.7 | ) | |||||||||||
Goodwill adjustments | (0.8 | ) | - | - | - | (0.8 | ) | |||||||||||||
Goodwill impairment charge | - | - | (50.3 | ) | - | (50.3 | ) | |||||||||||||
Currency translation | (39.1 | ) | - | (6.2 | ) | - | (45.3 | ) | ||||||||||||
|
|
|
|
|
|
|
|
|
| |||||||||||
Balance at October 31, 2014 | $ | 820.7 | $ | 59.5 | $ | - | $ | - | $ | 880.2 | ||||||||||
Goodwill acquired | - | - | - | - | - | |||||||||||||||
Goodwill allocated to divestitures and businesses held for sale | (11.6 | ) | - | - | - | (11.6 | ) | |||||||||||||
Goodwill adjustments | - | - | - | - | - | |||||||||||||||
Goodwill impairment charge | - | - | - | - | - | |||||||||||||||
Currency translation | (61.5 | ) | - | - | - | (61.5 | ) | |||||||||||||
|
|
|
|
|
|
|
|
|
| |||||||||||
Balance at October 31, 2015 | $ | 747.6 | $ | 59.5 | $ | - | $ | - | $ | 807.1 | ||||||||||
|
|
|
|
|
|
|
|
|
| |||||||||||
| (1) | Accumulated goodwill impairment loss was $50.3 million, $50.3 million, and $0.0 million, as of October 31, 2015, 2014 and 2013, respectively. |
The Company reviews goodwill by reporting unit and indefinite-lived intangible assets for impairment as required by ASC 350, "Intangibles – Goodwill and Other", either annually in the fourth quarter as of August 1, or whenever events and circumstances indicate impairment may have occurred. A reporting unit is the operating segment, or a business one level below that operating segment (the component level) if discrete financial information is prepared and regularly reviewed by segment management. The components are aggregated into reporting units for purposes of goodwill impairment testing to the extent they share similar qualitative and quantitative characteristics. The Company has five operating segments: Rigid Industrial Packaging & Services – Americas; Rigid Industrial Packaging & Services Europe, Middle East, Africa, and Asia Pacific; Paper Packaging; Flexible Products & Services; and Land Management. These five operating segments are aggregated into four reportable business segments by combining the Rigid Industrial Packaging & Services – Americas and Rigid Industrial Packaging & Services Europe, Middle East, Africa, and Asia Pacific operating segments. The Company's reporting units are the same as the operating segments.
During the fourth quarter of 2014, triggering events occurred in the Flexible Products & Services reporting unit that significantly lowered the forecasted cash flow projections used by the Company during its annual impairment test. The triggering events identified were as follows:
| • | During the fourth quarter of 2014, Flexible Products & Services changed the labor mix of employees at one of its facilities in Turkey, resulting in higher expected long-term overall labor costs. |
| • | There were also certain Flexible Products & Services businesses and facilities identified during the fourth quarter of 2014 as planned divestitures and shutdowns. These planned divestitures and shutdowns were primarily distribution locations and so reduced overall sales and topline revenue for Flexible Products & Services without reducing fixed production costs, resulting in projected decreases in gross margins and operating profit margins for the business as a whole. |
| • | Finally, there was a significant devaluation of the Euro that negatively impacted expected results for Flexible Products & Services, as a significant portion of its forecasted sales are to customers in the Euro zone. The devaluation is projected to have a long-term effect on the results of the Flexible Products & Services reporting unit. |
Due to these events, the Company performed a goodwill impairment test as of October 31, 2014 for the Flexible Products & Services reporting unit. Based on the analysis performed as of October 31, 2014, the carrying amount of the Flexible Products & Services reporting unit exceeded the fair value of the Flexible Products & Services reporting unit and the goodwill of the Flexible Products & Services reporting unit as of October 31, 2014 was fully impaired and written off as of October 31, 2014.
60
The fair value was determined primarily using the income approach by discounting estimated future cash flows. Those cash flow projections were prepared based upon the evaluation of the historical performance and future growth expectations for the Flexible Products & Services segment. Revenue was based on 2015 projections with a long-term growth rate applied to future periods. The most critical assumptions within the cash flow projections are revenue growth rates and forecasted gross margin percentages. The second step of the goodwill impairment test compared the implied fair value of the reporting unit's goodwill with the carrying amount of that goodwill. The implied fair value of goodwill was calculated as the difference between the fair value of the reporting unit as a whole and the fair values of the other non-goodwill assets and liabilities making up the reporting unit. Significant assumptions used in the calculation of the implied fair value include those used in the valuation of fixed assets and intangibles. Fixed assets were valued using the indirect cost approach. The customer retention model used to value the customer list intangible asset was the multi-period excess earnings method.
The following table summarizes the carrying amount of net intangible assets by class as of October 31, 2015 and October 31, 2014 (Dollars in millions):
| Gross Intangible Assets | Accumulated Amortization | Net Intangible Assets | ||||||||||
October 31, 2015: | ||||||||||||
Indefinite lived: | ||||||||||||
Trademarks and patents | $ | 13.1 | $ | - | $ | 13.1 | ||||||
Definite lived: | ||||||||||||
Trademarks and patents | $ | 12.4 | $ | 4.2 | $ | 8.2 | ||||||
Non-compete agreements | 4.9 | 4.5 | 0.4 | |||||||||
Customer relationships | 180.7 | 81.7 | 99.0 | |||||||||
Other | 24.2 | 12.2 | 12.0 | |||||||||
|
|
|
|
|
| |||||||
Total | $ | 235.3 | $ | 102.6 | $ | 132.7 | ||||||
|
|
|
|
|
| |||||||
October 31, 2014: | ||||||||||||
Indefinite lived: | ||||||||||||
Trademarks and patents | $ | 13.8 | $ | - | $ | 13.8 | ||||||
Definite lived: | ||||||||||||
Trademarks and patents | $ | 15.3 | $ | 4.7 | $ | 10.6 | ||||||
Non-compete agreements | 6.0 | 5.1 | 0.9 | |||||||||
Customer relationships | 203.3 | 78.8 | 124.5 | |||||||||
Other | 27.8 | 11.1 | 16.7 | |||||||||
|
|
|
|
|
| |||||||
Total | $ | 266.2 | $ | 99.7 | $ | 166.5 | ||||||
|
|
|
|
|
| |||||||
Gross intangible assets decreased by $30.9 million for the year ended October 31, 2015. The decrease was attributable to $5.2 million of gross intangibles from divestitures, $4.0 million transferred to held for sale, $20.1 million of currency fluctuations and the write-off of $1.6 million of fully-amortized assets. Amortization expense was $18.4 million, $22.0 million and $21.2 million for the years ended 2015, 2014 and 2013, respectively. Amortization expense for the next five years is expected to be $17.6 million in 2016, $16.9 million in 2017, $16.5 million in 2018, $16.4 million in 2019 and $15.9 million in 2020.
All intangible assets for the periods presented are subject to amortization and are being amortized using the straight-line method over periods that are contractually or legally determined or through purchase price accounting, except for $13.1 million related to the Tri-Sure trademark and trade names related to Blagden Express, Closed-loop and Box Board, all of which have indefinite lives.
NOTE 7 – RESTRUCTURING CHARGES
The following is a reconciliation of the beginning and ended restructuring reserve balances for the years ended October 31, 2015 and 2014 (Dollars in millions):
| Employee Separation Costs | Other costs | Total | ||||||||||
Balance at October 31, 2013 | $ | 1.8 | $ | 1.2 | $ | 3.0 | ||||||
Costs incurred and charged to expense | 12.0 | 4.1 | 16.1 | |||||||||
Costs paid or otherwise settled | (10.9 | ) | (4.1 | ) | (15.0 | ) | ||||||
|
|
|
|
|
| |||||||
Balance at October 31, 2014 | $ | 2.9 | $ | 1.2 | $ | 4.1 | ||||||
|
|
|
|
|
| |||||||
Costs incurred and charged to expense | 27.8 | 12.2 | 40.0 | |||||||||
Costs paid or otherwise settled | (16.0 | ) | (6.8 | ) | (22.8 | ) | ||||||
|
|
|
|
|
| |||||||
Balance at October 31, 2015 | $ | 14.7 | $ | 6.6 | $ | 21.3 | ||||||
|
|
|
|
|
| |||||||
The focus for restructuring activities in 2015 was to continue to rationalize operations and close underperforming assets throughout all segments. During the year ended October 31, 2015, the Company recorded restructuring charges of $40.0 million, which compares to $16.1 million of
61
restructuring charges recorded during the year ended October 31, 2014. The restructuring activity for the year ended October 31, 2015 consisted of $27.8 million in employee separation costs and $12.2 million in other restructuring costs, primarily consisting of professional fees incurred for services specifically associated with employee separation and relocation. There were eight plants closed in 2015, and a total of 1,020 employees severed throughout 2015 as part of the Company's restructuring efforts.
The following is a reconciliation of the total amounts expected to be incurred from open restructuring plans or plans that are being formulated and have not been announced as of the filing date of this Form 10-K. Remaining amounts expected to be incurred were $14.7 million as of October 31, 2015. (Dollars in millions):
| Total Amounts Expected to be Incurred | Amounts Incurred During the year ended October 31, 2015 | Amounts Remaining to be Incurred | ||||||||||
Rigid Industrial Packaging & Services: | ||||||||||||
Employee separation costs | $ | 27.4 | $ | 21.7 | 5.7 | |||||||
Other restructuring costs | 12.1 | 7.8 | 4.3 | |||||||||
|
|
|
|
|
| |||||||
| 39.5 | 29.5 | 10.0 | ||||||||||
Flexible Products & Services: | ||||||||||||
Employee separation costs | 6.1 | 4.8 | 1.3 | |||||||||
Other restructuring costs | 6.7 | 3.3 | 3.4 | |||||||||
|
|
|
|
|
| |||||||
| 12.8 | 8.1 | 4.7 | ||||||||||
Paper Packaging | ||||||||||||
Employee separation costs | 1.2 | 1.2 | - | |||||||||
Other restructuring costs | 1.1 | 1.1 | - | |||||||||
|
|
|
|
|
| |||||||
| 2.3 | 2.3 | - | ||||||||||
Land Management | ||||||||||||
Employee separation costs | 0.1 | 0.1 | - | |||||||||
Other restructuring costs | - | - | - | |||||||||
|
|
|
|
|
| |||||||
| 0.1 | 0.1 | - | ||||||||||
|
|
|
|
|
| |||||||
| $ | 54.7 | $ | 40.0 | $ | 14.7 | |||||||
|
|
|
|
|
| |||||||
The focus for restructuring activities in 2014 was to rationalize operations and close underperforming assets in both the Flexible Products & Services and the Rigid Industrial Packaging & Services segments. During 2014, the Company recorded restructuring charges of $16.1 million, consisting of $12.0 million in employee separation costs and $4.1 million in other restructuring costs, primarily consisting of lease termination costs, professional fees and other miscellaneous exit costs. There were eight plants closed in 2014, and a total of 850 employees severed throughout 2014 as part of the Company's restructuring efforts.
The focus for restructuring activities in 2013 was on the rationalization of operations and contingency actions in Rigid Industrial Packaging & Services. During 2013, the Company recorded restructuring charges of $4.8 million, consisting of $2.8 million in employee separation costs and $2.0 million in other restructuring costs, primarily consisting of lease termination costs, professional fees and other miscellaneous exit costs. There were no plants closed in 2013, but there was a total of 278 employees severed throughout 2013 as part of the Company's restructuring efforts.
NOTE 8 – CONSOLIDATION OF VARIABLE INTEREST ENTITIES
The Company evaluates whether an entity is a variable interest entity ("VIE") whenever reconsideration events occur and performs reassessments of all VIE's quarterly to determine if the primary beneficiary status is appropriate. The Company consolidates VIE's for which it is the primary beneficiary. If the Company is not the primary beneficiary and an ownership interest is held, the VIE is accounted for under the equity or cost methods of accounting, as appropriate. When assessing the determination of the primary beneficiary, the Company considers all relevant facts and circumstances, including: the power to direct the activities of the VIE that most significantly impact the VIE's economic performance; and the obligation to absorb the expected losses and/or the right to receive the expected returns of the VIE.
62
Significant Nonstrategic Timberland Transactions
On March 28, 2005, Soterra LLC (a wholly owned subsidiary) entered into two real estate purchase and sale agreements with Plum Creek Timberlands, L.P. ("Plum Creek") to sell approximately 56,000 acres of timberland and related assets located primarily in Florida for an aggregate sales price of approximately $90 million, subject to closing adjustments. In connection with the closing of one of these agreements, Soterra LLC sold approximately 35,000 acres of timberland and associated assets in Florida, Georgia and Alabama for $51.0 million, resulting in a pretax gain of $42.1 million, on May 23, 2005. The purchase price was paid in the form of cash and a $50.9 million purchase note payable (the "Purchase Note") by an indirect subsidiary of Plum Creek (the "Buyer SPE"). Soterra LLC contributed the Purchase Note to STA Timber LLC ("STA Timber"), one of the Company's indirect wholly owned subsidiaries. The Purchase Note is secured by a Deed of Guarantee issued by Bank of America, N.A., London Branch, in an amount not to exceed $52.3 million (the "Deed of Guarantee"), as a guarantee of the due and punctual payment of principal and interest on the Purchase Note.
The Company completed the second and final phase of these transactions in the first and second quarter of 2006, respectively, with the sale of 15,300 acres and another approximately 5,700 acres.
On May 31, 2005, STA Timber issued in a private placement its 5.20% Senior Secured Notes due August 5, 2020 (the "Monetization Notes") in the principal amount of $43.3 million. In connection with the sale of the Monetization Notes, STA Timber entered into note purchase agreements with the purchasers of the Monetization Notes (the "Note Purchase Agreements") and related documentation. The Monetization Notes are secured by a pledge of the Purchase Note and the Deed of Guarantee. The Monetization Notes may be accelerated in the event of a default in payment or a breach of the other obligations set forth therein or in the Note Purchase Agreements or related documents, subject in certain cases to any applicable cure periods, or upon the occurrence of certain insolvency or bankruptcy related events. The Monetization Notes are subject to a mechanism that may cause them, subject to certain conditions, to be extended to November 5, 2020. The proceeds from the sale of the Monetization Notes were primarily used for the repayment of indebtedness. Greif, Inc. and its other subsidiaries have not extended any form of guaranty of the principal or interest on the Monetization Notes. Accordingly, Greif, Inc. and its other subsidiaries will not become directly or contingently liable for the payment of the Monetization Notes at any time.
The Buyer SPE is deemed to be a VIE since the assets of the Buyer SPE are not available to satisfy the liabilities of the Buyer SPE. The Buyer SPE is a separate and distinct legal entity from the Company and no ownership interest in the Buyer SPE is held by the Company, but the Company is the primary beneficiary because it has (1) the power to direct the activities of the VIE that most significantly impact the VIE's economic performance, and (2) the obligation to absorb losses of the VIE that could potentially be significant to the VIE or the right to receive benefits from the VIE that could potentially be significant to the VIE. As a result, Buyer SPE has been consolidated into the operations of the Company.
As of October 31, 2015 and 2014, assets of the Buyer SPE consisted of $50.9 million of restricted bank financial instruments which are expected to be held to maturity. For each of the years ended October 31, 2015, 2014 and 2013, the Buyer SPE recorded interest income of $2.4 million.
As of October 31, 2015 and 2014, STA Timber had long-term debt of $43.3 million. For each of the years ended October 31, 2015, 2014 and 2013, STA Timber recorded interest expense of $2.2 million. STA Timber is exposed to credit-related losses in the event of nonperformance by the issuer of the Deed of Guarantee.
Flexible Packaging Joint Venture
On September 29, 2010, Greif, Inc. and its indirect subsidiary Greif International Holding Supra C.V. ("Greif Supra,") formed a joint venture (referred to herein as the "Flexible Packaging JV") with Dabbagh Group Holding Company Limited and its subsidiary NSC. The Flexible Packaging JV owns the operations in the Flexible Products & Services segment, with the exception of the North American multiwall packaging business, which was sold in August 2014. The Flexible Packaging JV has been consolidated into the operations of the Company as of its formation date of September 29, 2010.
The Flexible Packaging JV is deemed to be a VIE since the total equity investment at risk is not sufficient to permit the legal entity to finance its activities without additional subordinated financial support. The Company is the primary beneficiary because it has (1) the power to direct the activities of the VIE that most significantly impact the VIE's economic performance, and (2) the obligation to absorb losses of the VIE that could potentially be significant to the VIE or the right to receive benefits from the VIE that could potentially be significant to the VIE.
The economic and business purpose underlying the Flexible Packaging JV is to establish a global industrial flexible products enterprise through a series of targeted acquisitions and major investments in plant, machinery and equipment. All entities contributed to the Flexible Packaging JV were existing businesses acquired by Greif Supra and that were reorganized under Greif Flexibles Asset Holding B.V. and Greif Flexibles Trading Holding B.V. ("Asset Co." and "Trading Co."), respectively. The Flexibles Packaging J.V. also includes Global Textile Company LLC ("Global Textile"), which owned and operated a fabric hub in the Kingdom of Saudi Arabia that commenced operations in the fourth quarter of 2012 and ceased operations in the fourth quarter of 2014. The Company has 51 percent ownership in Trading Co. and 49 percent ownership in Asset Co. and Global Textile. However, Greif Supra and NSC have equal economic interests in the Flexible Packaging JV, notwithstanding the actual ownership interests in the various legal entities.
All investments, loans and capital contributions are to be shared equally by Greif Supra and NSC and each partner has committed to contribute capital of up to $150 million and obtain third party financing for up to $150 million as required.
63
The following table presents the Flexible Packaging JV total net assets (Dollars in millions):
As of October 31, | 2015 | 2014 | ||||||
Cash and cash equivalents | $ | 14.5 | $ | 6.6 | ||||
Trade accounts receivable, less allowance of $3.2 in 2015 and $4.3 in 2014 | 47.5 | 60.1 | ||||||
Inventories | 44.7 | 70.0 | ||||||
Properties, plants and equipment, net | 43.1 | 57.0 | ||||||
Other assets | 36.8 | 45.8 | ||||||
Accounts payable | 27.9 | 43.7 | ||||||
Other liabilities | 50.6 | 47.7 | ||||||
During 2014, there was a conversion of short-term loans payable and accrued interest to equity. This transaction involved loans payable to another Greif entity and those payable to NSC. As of October 31, 2013, Asset Co. had outstanding advances to NSC for $0.6 million which were being used to fund certain costs incurred in the Kingdom of Saudi Arabia in respect of the fabric hub. These advances were recorded within the current portion related party notes and advances receivable on the Company's consolidated balance sheet. As of October 31, 2013, Asset Co. and Trading Co. held short term loans payable to NSC for $12.7 million, recorded within short-term borrowings on the Company's consolidated balance sheet. These loans were interest bearing and were used to fund certain operational requirements. The fabric hub ceased operations during the fourth quarter of 2014.
Net loss attributable to the noncontrolling interest in the Flexible Packaging JV for the years ended October 31, 2015, 2014 and 2013 were $14.2 million, $57.0 million and $9.1 million, respectively.
Non-United States Accounts Receivable VIE
As further described in Note 3, Cooperage Receivables Finance B.V. is a party to the European RPA. Cooperage Receivables Finance B.V. is deemed to be a VIE since this entity is not able to satisfy its liabilities without the financial support from the Company. While this entity is a separate and distinct legal entity from the Company and no ownership interest in this entity is held by the Company, the Company is the primary beneficiary because it has (1) the power to direct the activities of the VIE that most significantly impact the VIE's economic performance, and (2) the obligation to absorb losses of the VIE that could potentially be significant to the VIE. As a result, Cooperage Receivables Finance B.V. has been consolidated into the operations of the Company.
NOTE 9 – LONG-TERM DEBT
Long-term debt is summarized as follows (Dollars in millions):
| October 31, 2015 | October 31, 2014 | |||||||
Amended Credit Agreement | $ | 217.4 | $ | 169.2 | ||||
Senior Notes due 2017 | 300.7 | 301.2 | ||||||
Senior Notes due 2019 | 246.0 | 245.2 | ||||||
Senior Notes due 2021 | 219.4 | 252.5 | ||||||
Amended Receivables Facility | 147.6 | 110.0 | ||||||
Other long-term debt | 15.8 | 26.9 | ||||||
|
|
|
| |||||
| 1,146.9 | 1,105.0 | |||||||
Less current portion | (30.7 | ) | (17.6 | ) | ||||
|
|
|
| |||||
Long-term debt | $ | 1,116.2 | $ | 1,087.4 | ||||
|
|
|
| |||||
Credit Agreement
On December 19, 2012, the Company and two of its international subsidiaries amended and restated the Company's existing $1.0 billion senior secured credit agreement with a syndicate of financial institutions (the "Amended Credit Agreement"). The total available borrowing under this facility was $706.3 million as of October 31, 2015, which has been reduced by $14.4 million for outstanding letters of credit, all of which is available without violating covenants.
The Amended Credit Agreement contains financial covenants that require the Company to maintain a certain leverage ratio and an interest coverage ratio. The leverage ratio generally requires that at the end of any fiscal quarter the Company will not permit the ratio of (a) the Company's total consolidated indebtedness, to (b) the Company's consolidated net income plus depreciation, depletion and amortization, interest expense (including capitalized interest), income taxes, and minus certain extraordinary gains and non-recurring gains (or plus certain extraordinary losses and non-recurring losses) and plus or minus certain other items for the preceding twelve months ("adjusted EBITDA") to be greater than 4.00 to 1. The interest coverage ratio generally requires that at the end of any fiscal quarter the Company will not permit the ratio of (a) the Company's consolidated adjusted EBITDA to (b) the Company's consolidated interest expense to the extent paid or payable, to be less than 3.00 to 1, during the preceding twelve month period (the "Interest Coverage Ratio Covenant").
64
The terms of the Amended Credit Agreement limit the Company's ability to make "restricted payments," which include dividends and purchases, redemptions and acquisitions of the Company's equity interests. The payment of dividends and other restricted payments are subject to the condition that certain defaults not exist under the terms of the Amended Credit Agreement and, in the event that certain defaults exist, are limited in amount by a formula based, in part, on the Company's consolidated net income. The repayment of amounts borrowed under the Amended Credit Agreement are secured by a security interest in the personal property of Greif, Inc. and certain of the Company's United States subsidiaries, including equipment and inventory and certain intangible assets, as well as a pledge of the capital stock of substantially all of the Company's United States subsidiaries. The repayment of amounts borrowed under the Amended Credit Agreement is also secured, in part, by capital stock of the non-U.S. subsidiaries that are parties to the Amended Credit Agreement. However, in the event that the Company receives and maintains an investment grade rating from either Moody's Investors Service, Inc. or Standard & Poor's Corporation, the Company may request the release of such collateral. The payment of outstanding principal under the Amended Credit Agreement and accrued interest thereon may be accelerated and become immediately due and payable upon the Company's default in its payment or other performance obligations or its failure to comply with the financial and other covenants in the Amended Credit Agreement, subject to applicable notice requirements and cure periods as provided in the Amended Credit Agreement.
The Company recorded $1.3 million of debt extinguishment charges for the year ended October 31, 2013. Financing costs associated with the Amended Credit Agreement totaling $3.4 million were capitalized and included in other long term assets. The Company recorded no debt extinguishment charges for the years ended October 31, 2015 and 2014.
As of October 31, 2015, $217.4 million was outstanding under the Amended Credit Agreement. The current portion of the Amended Credit Agreement was $17.3 million and the long-term portion was $200.1 million. The weighted average interest rate on the Amended Credit Agreement was 1.63% for the year ended October 31, 2015. The actual interest rate on the Amended Credit Agreement was 1.74% as of October 31, 2015.
Senior Notes due 2017
On February 9, 2007, the Company issued $300.0 million of 6.75% Senior Notes due February 1, 2017. Interest on these Senior Notes is payable semi-annually.
Senior Notes due 2019
On July 28, 2009, the Company issued $250.0 million of 7.75% Senior Notes due August 1, 2019. Interest on these Senior Notes is payable semi-annually.
Senior Notes due 2021
On July 15, 2011, Greif, Inc.'s wholly-owned subsidiary, Greif Nevada Holdings, Inc., S.C.S. (formerly Greif Luxembourg Finance S.C.A.), issued €200.0 million of 7.375% Senior Notes due July 15, 2021. These Senior Notes are fully and unconditionally guaranteed on a senior basis by Greif, Inc. Interest on these Senior Notes is payable semi-annually.
United States Trade Accounts Receivable Credit Facility
On September 30, 2013, the Company amended and restated the Prior Receivables Facility to establish a $170.0 million United States Trade Accounts Receivable Credit Facility (the "Amended Receivables Facility") with a financial institution. On December 1, 2015, the Amended Receivables Facility was amended to reduce the amount of available proceeds from $170 million to $150 million.
Other
In addition to the amounts borrowed under the Amended Credit Agreement and proceeds from the Senior Notes and the Amended Receivables Facility, as of October 31, 2015, the Company had outstanding other debt of $15.8 million in long-term debt and $40.7 million in short-term borrowings, compared to other debt of $26.9 million in long-term debt and $48.1 million in short-term borrowings, as of October 31, 2014. There are no financial covenants associated with this other debt.
Annual maturities, including the current portion of long-term debt under the Company's various financing arrangements, are $30.7 million in 2016, $467.0 million in 2017, $182.9 million in 2018, $246.0 million in 2019, and $220.3 million thereafter. Cash paid for interest expense was $77.5 million, $86.4 million and $86.5 million in 2015, 2014 and 2013, respectively.
As of October 31, 2015 and 2014, the Company had deferred financing fees and debt issuance costs of $7.2 million and $10.3 million, respectively, which are included in other long-term assets.
65
NOTE 10 – FINANCIAL INSTRUMENTS AND FAIR VALUE MEASUREMENTS
Recurring Fair Value Measurements
The following table presents the fair value of those assets and (liabilities) measured on a recurring basis as of October 31, 2015 and 2014 (Dollars in millions):
| October 31, 2015 | Balance sheet Location | |||||||||||||||||
| Level 1 | Level 2 | Level 3 | Total | |||||||||||||||
Foreign exchange hedges | $ | - | $ | 0.3 | $ | - | $ | 0.3 | Prepaid expenses and other current assets | |||||||||
Foreign exchange hedges | - | (0.2 | ) | (0.2 | ) | Other current liabilities | ||||||||||||
Insurance Annuity** | - | - | 20.1 | 20.1 | Other long-term assets | |||||||||||||
|
|
|
|
|
|
|
| |||||||||||
Total* | $ | - | $ | 0.1 | $ | 20.1 | $ | 20.2 | ||||||||||
|
|
|
|
|
|
|
| |||||||||||
| October 31, 2014 | ||||||||||||||||||
| Balance sheet Location | ||||||||||||||||||
| Level 1 | Level 2 | Level 3 | Total | |||||||||||||||
Interest rate derivatives | $ | - | $ | (0.2 | ) | $ | - | $ | (0.2 | ) | Other long-term liabilities | |||||||
Foreign exchange hedges | - | 0.6 | - | 0.6 | Prepaid expenses and other current assets | |||||||||||||
Foreign exchange hedges | - | (0.2 | ) | - | (0.2 | ) | Other current liabilities | |||||||||||
Insurance Annuity** | - | - | 22.6 | 22.6 | Other long-term assets | |||||||||||||
|
|
|
|
|
|
|
| |||||||||||
Total* | $ | - | $ | 0.2 | $ | 22.6 | $ | 22.8 | ||||||||||
|
|
|
|
|
|
|
| |||||||||||
| * | The carrying amounts of cash and cash equivalents, trade accounts receivable, notes receivable, accounts payable, current liabilities and short-term borrowings as of October 31, 2015 and 2014 approximate their fair values because of the short-term nature of these items and are not included in this table. |
| ** | The change in the fair value of the insurance annuity is primarily due to changes in foreign currency exchange rates. |
Interest Rate Derivatives
As of October 31, 2015, the Company had no interest rate derivatives.
Through December 2014, the Company had two interest rate derivatives (floating to fixed swap agreements designated as cash flow hedges) with a total notional amount of $150 million. Under these swap agreements, the Company received interest based upon a variable interest rate from the counterparties and paid interest based upon a fixed interest rate. The assumptions that were used in measuring fair value of the interest rate derivatives were considered level 2 inputs, which were based on interest from the counterparties based upon LIBOR and interest paid based upon a designated fixed rate over the life of the swap agreements. These derivative instruments were designated and qualified as cash flow hedges. Accordingly, the effective portion of the gain or loss on these derivative instruments was reported as a component of other comprehensive income and reclassified into earnings in the same line item associated with the forecasted transaction and in the same period during which the hedged transaction affected earnings. The ineffective portion of the gain or loss on the derivative instrument was recognized in earnings immediately.
Losses reclassified to earnings under these contracts were $0.2 million, $0.9 million, and $0.8 million for the twelve months ended October 31, 2015, 2014 and 2013, respectively. These losses were recorded within the consolidated statements of income as interest expense, net.
Foreign Exchange Hedges
The Company conducts business in various international currencies and is subject to risks associated with changing foreign exchange rates. The Company's objective is to reduce volatility associated with foreign exchange rate changes. Accordingly, the Company enters into various contracts that change in value as foreign exchange rates change to protect the value of certain existing foreign currency assets and liabilities, commitments and anticipated foreign currency cash flows.
As of October 31, 2015, the Company had outstanding foreign currency forward contracts in the notional amount of $129.9 million ($122.4 million as of October 31, 2014). Adjustments to fair value are recognized in earnings, offsetting the impact of the hedged item. The assumptions used in measuring fair value of foreign exchange hedges are considered level 2 inputs, which were based on observable market pricing for similar instruments, principally foreign exchange futures contracts. Losses recorded under fair value contracts were $6.0 million and $6.2 million for the years ended October 31, 2015 and 2014, respectively. Gains recorded under fair value contracts were an immaterial amount for the years ended October 31, 2013.
Other Financial Instruments
The fair values of the Company's Amended Credit Agreement and the Amended Receivables Facility do not materially differ from carrying value as the Company's cost of borrowing is variable and approximates current borrowing rates. The fair values of the Company's long-term obligations are estimated based on either the quoted market prices for the same or similar issues or the current interest rates offered for the debt of the same remaining maturities, which are considered level 2 inputs in accordance with ASC Topic 820, "Fair Value Measurements and Disclosures."
66
The following table presents the estimated fair values for the Company's Senior Notes and Assets held by special purpose entities (Dollars in millions):
| October 31, 2015 | October 31, 2014 | |||||||
Senior Notes due 2017 Estimated fair value | $ | 314.8 | $ | 325.5 | ||||
Senior Notes due 2019 Estimated fair value | 280.6 | 287.5 | ||||||
Senior Notes due 2021 Estimated fair value | 258.7 | 297.7 | ||||||
Assets held by special purpose entities Estimated fair value | 54.4 | 54.5 | ||||||
Pension Plan Assets
On an annual basis we compare the asset holdings of our pension plan to targets established by the Company. The pension plan assets are categorized as equity securities, debt securities, fixed income securities, insurance annuities, or other assets, which are considered level 1, level 2 and level 3 fair value measurements. The typical asset holdings include:
| • | Common Stock: Valued based on quoted prices and are primarily exchange-traded. |
| • | Mutual funds: Valued at the Net Asset Value "NAV" available daily in an observable market. |
| • | Common collective trusts: Unit value calculated based on the observable NAV of the underlying investment. |
| • | Pooled separate accounts: Unit value calculated based on the observable NAV of the underlying investment. |
| • | Government and corporate debt securities: Valued based on readily available inputs such as yield or price of bonds of comparable quality, coupon, maturity and type. |
| • | Insurance annuity: Value is derived based on the value of the corresponding liability. |
Non-Recurring Fair Value Measurements
Long-Lived Assets
During the year ended October 31, 2015, the Company wrote down long-lived assets with a carrying value of $60.7 million to a fair value of $14.8 million, resulting in recognized asset impairment charges of $45.9 million. These charges include $15.0 million of impairment charges related to Venezuelan properties, plants, and equipment, net, $11.4 million of impairment charges related to assets recognized at fair value in the Company's reconditioning business, $1.5 million of IT software assets that were identified as obsolete, $0.5 million other-than-temporary impairment of equity method investment within the Flexible Products & Services segment, $10.9 million of impairment charges related to plant closures within the Rigid Industrial Packaging & Services and Flexible Products & Services segments, and $6.6 million of various machinery and equipment determined to be obsolete.
During the year ended October 31, 2014, the Company wrote down long-lived assets with a carrying value of $58.0 million to a fair value of $22.5 million, resulting in recognized asset impairment charges of properties, plants and equipment of $35.5 million, consisting of: $11.5 million for assets in the Rigid Industrial Packaging & Services segment related to the third quarter 2014 impairment of assets to be sold for a loss in the fourth quarter of 2014, underutilized and damaged equipment, and unutilized facilities in Europe; and $24.0 million for assets in Flexible Products & Services segment related to underutilized equipment and the shutdown of the fabric hub in the Kingdom of Saudi Arabia. The impairment charges in the Flexible Products & Services segment included $15.7 million related to assets valued on the basis of their highest and best use.
During the year ended October 31, 2013, the Company wrote down long-lived assets with a carrying value of $84.2 million to a fair value of $52.8 million, resulting in recognized asset impairment charges of properties, plants, and equipment of $31.4 million, consisting of: $1.6 million for assets in the Paper Packaging segment primarily for assets under contract to be sold; $18.8 million for assets in the Rigid Industrial Packaging & Services segment related to loss making facilities, underutilized and damaged equipment, and unutilized facilities in Europe; and $11.0 million for assets in Flexible Products & Services segment related to underutilized equipment which was valued on the basis of their highest and best use.
67
The assumptions used in measuring fair value of long-lived assets are considered level 3 inputs, which include bids received from third parties, recent purchase offers, market comparable information and discounted cash flows based on assumptions that market participants would use. The following table presents quantitative information about the significant unobservable inputs used to determine the fair value of the impairment of long-lived assets held and used for the twelve months ended October 31, 2015.
| Quantitative Information about Level 3 Fair Value Measurements | ||||||||||
| Fair Value of Impairment | Valuation Technique | Unobservable Input | Range of Input Values | |||||||
| (in millions) | ||||||||||
October 31, 2015 | ||||||||||
Impairment of Long-lived assets-Land & Building | $ | 28.1 | Broker Quote / Indicative Bids | Indicative Bids | N/A | |||||
Impairment of Long-lived assets-Machinery & Equipment | $ | 17.8 | Sales Value | Sales Value | N/A | |||||
Assets and Liabilities Held for Sale
The assumptions used in measuring fair value of assets and liabilities held for sale are considered level 3 inputs, which include recent purchase offers, market comparables and/or data obtained from commercial real estate brokers. During 2015, two asset groups classified as held for sale at October 31, 2014 were reclassed to held and used, resulting in a $3.0 million impairment to net realizable value. The Company has not recorded additional impairment related to assets which were previously classified as held for sale during the year ended October 31, 2013.
Goodwill and Indefinite-Lived Intangibles
On an annual basis or when events or circumstances indicate impairment may have occurred, the Company performs impairment tests for goodwill and intangibles as defined under ASC 350, "Intangibles-Goodwill and Other." As of October 31, 2014, the Company concluded that the carrying amount of the Flexible Products & Services reporting unit exceeded the fair value of the Flexible Products & Services reporting unit and the goodwill of $50.3 million on the Flexible Products & Services reporting unit as of October 31, 2014 was fully impaired. See Note 6 for additional information. The Company concluded that no impairment existed as of October 31, 2015 and 2013.
NOTE 11 – STOCK-BASED COMPENSATION
Stock-based compensation is accounted for in accordance with ASC 718, "Compensation – Stock Compensation," which requires companies to estimate the fair value of share-based awards on the date of grant using an option-pricing model. The value of the portion of the award that is ultimately expected to vest is recognized as an expense in the Company's consolidated statements of income over the requisite service periods. The Company uses the straight-line single option method of expensing stock options to recognize compensation expense in its consolidated statements of income for all share-based awards. Because share-based compensation expense is based on awards that are ultimately expected to vest, share-based compensation expense is reduced to account for estimated forfeitures. ASC 718 requires forfeitures to be estimated at the time of grant and revised, if necessary, in subsequent periods if actual forfeitures differ from those estimates. No stock options were granted in 2015, 2014 or 2013. For any options granted in the future, compensation expense will be based on the grant date fair value estimated in accordance with the provisions of ASC 718.
In 2001, the Company adopted the 2001 Management Equity Incentive and Compensation Plan (the "2001 Plan"). The provisions of the 2001 Plan allow the awarding of incentive and nonqualified stock options and restricted and performance shares of Class A Common Stock to key employees. The maximum number of shares that may be issued each year is determined by a formula that takes into consideration the total number of shares outstanding and is also subject to certain limits. In addition, the maximum number of incentive stock options that will be issued under the 2001 Plan during its term is 5,000,000 shares.
Under the terms of the 2001 Plan, stock options may be granted at exercise prices equal to the market value of the common stock on the date options are granted and become fully vested two years after date of grant. Options expire 10 years after date of grant.
In 2005, the Company adopted the 2005 Outside Directors Equity Award Plan (the "2005 Directors Plan"), which provides for the granting of stock options, restricted stock or stock appreciation rights to directors who are not employees of the Company. Prior to 2005, the Directors Stock Option Plan (the "Directors Plan") provided for the granting of stock options to directors who are not employees of the Company. The aggregate number of the Company's Class A Common Stock options, and in the case of the 2005 Directors Plan, restricted stock, that may be granted may not exceed 200,000 shares under each of these plans. Under the terms of both plans, options are granted at exercise prices equal to the market value of the common stock on the date options are granted and become exercisable immediately. Options expire 10 years after date of grant.
68
Stock option activity for the years ended October 31 was as follows (Shares in thousands):
| 2015 | 2014 | 2013 | ||||||||||||||||||||||
| Shares | Weighted Average Exercise price | Shares | Weighted Average Exercise price | Shares | Weighted Average Exercise price | |||||||||||||||||||
Beginning balance | 10 | $ | 27.36 | 79 | $ | 25.30 | 181 | $ | 19.45 | |||||||||||||||
Granted | - | - | - | - | - | - | ||||||||||||||||||
Forfeited | - | - | - | - | 3 | 19.35 | ||||||||||||||||||
Exercised | 10 | 27.36 | 69 | 25.01 | 99 | 14.79 | ||||||||||||||||||
|
|
|
|
|
|
|
|
|
|
|
| |||||||||||||
Ending balance | - | $ | - | 10 | $ | 27.36 | 79 | $ | 25.30 | |||||||||||||||
All outstanding options were exercisable as of October 31, 2015, 2014 and 2013, respectively.
The Company's Long Term Incentive Plan is intended to focus management on the key measures that drive superior performance over the longer-term. The Long Term Incentive Plan is based on three-year performance periods that commence at the start of every fiscal year. For each three-year performance period, the performance goals are based on targeted levels of earnings before interest, taxes, depreciation, depletion and amortization as determined by the Special Subcommittee of the Company's Compensation Committee of the Board of Directors (the "Special Subcommittee"). Participants are paid 50% in cash and 50% in restricted shares of the Company's Class A and/or Class B Common Stock, as determined by the Special Subcommittee.
Under the Company's Long-Term Incentive Plan, the Company will grant in January 2016 42,497 shares of restricted stock with a weighted average grant date fair value of $34.05 for 2015. The Company granted 49,702 shares of restricted stock with a weighted average grant date fair value of $45.71 under the Company's Long-Term Incentive Plan for 2014. The total stock expense recorded under the plan was $1.4 million, $2.3 million and $2.9 million for the periods ended October 31, 2015, 2014 and 2013, respectively. All restricted stock awards under the Long Term Incentive Plan are fully vested at the date of award.
Under the Company's 2005 Directors Plan, the Company granted 25,560 shares of restricted stock with a weighted average grant date fair value of $44.01 in 2015. The Company granted 22,059 shares of restricted stock with a weighted average grant date fair value of $50.99 under the Company's 2005 Directors Plan in 2014. The total expense recorded under the plan was $1.1 million, $1.1 million, and $0.8 million for the periods ended October 31, 2015, 2014, and 2013, respectively. All restricted stock awards under the 2005 Directors Plan are fully vested at the date of award.
During 2014, the Company awarded an officer, as part of the terms of his initial employment arrangement, 15,000 shares of Class A Common Stock under the 2001 Plan. These shares were issued subject to vesting and post-vesting restrictions on the sale or transfer until May 12, 2019. These shares fully vest in equal installments of 5,000 on May 12, 2015, 2016 and 2017. Share-based compensation expense was $0.3 million and $0.2 million for the periods ended October 31, 2015 and 2014, respectively.
The total stock compensation expenses recorded under the plans were $2.8 million, $3.6 million and $3.7 million for the periods ended October 31, 2015, 2014 and 2013 respectively.
NOTE 12 – INCOME TAXES
The Company files income tax returns in the U.S. federal jurisdiction, various U.S. state and local jurisdictions, and various non-U.S. jurisdictions.
The provision for income taxes consists of the following (Dollars in millions):
| For the years ended October 31, | 2015 | 2014 | 2013 | |||||||||
Current | ||||||||||||
Federal | $ | 18.3 | $ | 53.1 | $ | 54.3 | ||||||
State and local | 4.0 | 9.8 | 8.8 | |||||||||
Non-U.S. | 29.6 | 38.0 | 33.1 | |||||||||
|
|
|
|
|
| |||||||
| 51.9 | 100.9 | 96.2 | ||||||||||
Deferred | ||||||||||||
Federal | 2.4 | 2.7 | (6.3 | ) | ||||||||
State and local | 0.2 | (1.6 | ) | (0.3 | ) | |||||||
Non-U.S. | (6.1 | ) | 13.0 | 9.2 | ||||||||
|
|
|
|
|
| |||||||
| (3.5 | ) | 14.1 | 2.6 | |||||||||
|
|
|
|
|
| |||||||
| $ | 48.4 | $ | 115.0 | $ | 98.8 | |||||||
|
|
|
|
|
| |||||||
69
The non-U.S. income (loss) before income tax expense was $25.8 million, $(17.0) million and $80.3 million in 2015, 2014, and 2013, respectively. The 2014 non-U.S. pretax loss is primarily the result of the impairment of non-deductible goodwill. The U.S. income before income tax was $89.0 million, $175.0 million and $163.1 million in 2015, 2014, and 2013, respectively.
The following is a reconciliation of the provision for income taxes based on the federal statutory rate to the Company's effective income tax rate:
For the years ended October 31, | 2015 | 2014 | 2013 | |||||||||
United States federal tax rate | 35.00 | % | 35.00 | % | 35.00 | % | ||||||
Non-U.S. tax rates | (4.30 | %) | 2.90 | % | 2.20 | % | ||||||
State and local taxes, net of federal tax benefit | 2.80 | % | 4.20 | % | 2.50 | % | ||||||
U.S. domestic production activity deduction | (0.90 | %) | (3.10 | %) | (2.00 | %) | ||||||
Unrecognized tax benefits | 2.50 | % | 7.20 | % | 0.40 | % | ||||||
Net impact of released and new valuation allowances | 3.00 | % | 12.70 | % | 0.50 | % | ||||||
Withholding tax | 2.70 | % | 2.90 | % | 2.90 | % | ||||||
Foreign partnerships | (5.80 | %) | (5.30 | %) | (3.60 | %) | ||||||
Foreign income inclusion | 0.40 | % | - | 1.70 | % | |||||||
Venezuela balance sheet remeasurement | 5.90 | % | - | - | ||||||||
Nondeductible goodwill | 2.50 | % | 15.60 | % | - | |||||||
Other items | (1.60 | %) | 0.70 | % | 1.00 | % | ||||||
|
|
|
|
|
| |||||||
| 42.20 | % | 72.80 | % | 40.60 | % | |||||||
|
|
|
|
|
| |||||||
Withholding tax is assessed and accrued for interest, royalties, and dividends on a quarterly basis for transactions primarily between non-U.S. entities.
As discussed in Note 1 herein, with respect to its operations in Venezuela, the Company changed from the official exchange rate to the SIMADI rate requiring remeasurement of the Venezuelan balance sheet during 2015. The net $19.4 million charge to the income statement had no tax benefit. This balance sheet remeasurement contributed 5.90 percent to our effective tax rate.
During 2014, the Company disposed of certain operations, including the divestiture of a nonstrategic business in the Rigid Industrial Packaging & Services segment in third quarter and the multiwall packaging business in the fourth quarter, which resulted in gains and losses recognized, including an amount related to goodwill of $13.6 million and $21.8 million, respectively, which did not have a tax basis. Moreover, the Flexible Products & Services reporting unit recognized the impairment of goodwill of $50.3 million that did not have any tax basis. For 2014, the combination of these items contributed 15.6 percent to our effective tax rate.
70
The components of the Company's deferred tax assets and liabilities as of October 31 for the years indicated were as follows (Dollars in millions):
| 2015 | 2014 | |||||||
Deferred Tax Assets | ||||||||
Net operating loss and other carryforwards | $ | 80.8 | $ | 108.5 | ||||
Pension liabilities | 53.6 | 48.2 | ||||||
Insurance operations | 3.5 | 4.1 | ||||||
Incentive liabilities | 5.4 | 12.9 | ||||||
Environmental reserves | 0.4 | 5.4 | ||||||
Inventories | 6.5 | 5.7 | ||||||
State income taxes | 7.4 | 9.2 | ||||||
Postretirement benefit obligations | 3.5 | 4.1 | ||||||
Other | 11.3 | 7.6 | ||||||
Interest accrued | 1.6 | 2.3 | ||||||
Allowance for doubtful accounts | 3.4 | 4.6 | ||||||
Restructuring reserves | 6.0 | 1.4 | ||||||
Deferred compensation | 2.9 | 2.7 | ||||||
Foreign tax credits | 2.3 | 2.3 | ||||||
Vacation accruals | 1.5 | 1.8 | ||||||
Workers compensation accruals | 3.5 | 4.6 | ||||||
|
|
|
| |||||
Total Deferred Tax Assets | 193.6 | 225.4 | ||||||
Valuation allowance | (89.5 | ) | (108.5 | ) | ||||
|
|
|
| |||||
Net Deferred Tax Assets | 104.1 | 116.9 | ||||||
|
|
|
| |||||
Deferred Tax Liabilities | ||||||||
Properties, plants and equipment | 84.7 | 109.0 | ||||||
Goodwill and other intangible assets | 80.1 | 79.9 | ||||||
Foreign Income Inclusion | 1.1 | 1.1 | ||||||
Foreign exchange gains | 6.1 | 7.4 | ||||||
Timberland transactions | 116.2 | 106.4 | ||||||
|
|
|
| |||||
Total Deferred Tax Liabilities | 288.2 | 303.8 | ||||||
|
|
|
| |||||
Net Deferred Tax Liability | $ | (184.1 | ) | $ | (186.9 | ) | ||
|
|
|
| |||||
As of October 31, 2015, the Company had tax benefits from non-U.S. net operating loss and other carryforwards of approximately $79.8 million and approximately $1.0 million of U.S. federal and state net operating loss carryforwards. The Company has recorded valuation allowances of $87.2 million and $106.2 million as of October 31, 2015 and 2014, respectively, against the tax benefits from non-U.S. net deferred tax assets. The Company has also recorded valuation allowances of $2.3 million and $2.3 million as of October 31, 2015 and 2014, respectively, against tax benefits from U.S. net deferred tax assets. The Company's $19.0 million decrease in valuation allowances during 2015 consists of the following: $17.9 million of currency translations; and $3.4 million net incremental increases in new valuation allowances resulting in a 3.0% rate impact disclosed separately in the rate reconciliation above; and $4.5 million of incremental net decreases against current year net operating losses and other net deferred tax assets resulting in a (3.9%) rate impact included within the non-U.S. tax rates line of the rate reconciliation above.
As of October 31, 2015, the Company has not recognized U.S. deferred income taxes on a cumulative total of $552 million of undistributed earnings from certain non-U.S. subsidiaries. The Company's intention is to reinvest these earnings indefinitely outside of the U.S., or to repatriate the earnings only when it is tax-efficient to do so. Therefore, no U.S. tax provision has been accrued related to the repatriation of these earnings. It is not practicable to estimate the amount of any additional taxes which may be payable on the undistributed earnings given the various alternatives the Company could employ should the Company decide to repatriate these earnings in the future.
A reconciliation of the beginning and ending amount of unrecognized tax benefits is as follows:
| 2015 | 2014 | 2013 | ||||||||||
Balance at November 1 | $ | 34.3 | $ | 30.5 | $ | 55.9 | ||||||
Increases in tax positions for prior years | 8.5 | 5.7 | 4.5 | |||||||||
Decreases in tax positions for prior years | (2.2 | ) | (8.2 | ) | (11.0 | ) | ||||||
Increases in tax positions for current years | 6.2 | 10.3 | 8.8 | |||||||||
Settlements with taxing authorities | (5.7 | ) | (0.6 | ) | (30.3 | ) | ||||||
Lapse in statute of limitations | (6.2 | ) | (0.8 | ) | - | |||||||
Currency translation | (5.3 | ) | (2.6 | ) | 2.6 | |||||||
|
|
|
|
|
| |||||||
Balance at October 31 | $ | 29.6 | $ | 34.3 | $ | 30.5 | ||||||
|
|
|
|
|
| |||||||
The 2015 net decrease is primarily related to a net decrease in the lapse in statute of limitations and settlements with taxing authorities in various jurisdictions. The change in balance includes the impact of deferred items that do not impact the tax expense.
71
The Company files income tax returns in the U.S. federal jurisdiction, various U.S. state jurisdictions and various foreign jurisdictions. With a few exceptions, the Company is subject to audit by various taxing authorities for 2010 through the current fiscal year. The Company has completed its U.S. federal tax audit for the tax years through 2012.
The Company recognizes accrued interest and penalties related to unrecognized tax benefits in income tax expense net of tax, as applicable. As of October 31, 2015 and October 31, 2014, the Company had $5.4 million and $4.6 million, respectively, accrued for the payment of interest and penalties.
The October 31, 2015, 2014, 2013 balances include $28.5 million, $28.0 million and $23.0 million, respectively, of unrecognized tax benefits that, if recognized, would have an impact on the effective tax rate. The remaining unrecognized tax benefits relate to tax positions for which ultimate deductibility is highly certain, but for which there is uncertainty as to the timing of such deductibility. Recognition of these tax benefits would not affect our effective tax rate.
The Company has estimated the reasonably possible expected net change in unrecognized tax benefits through October 31, 2016 under ASC 740. The Company's estimate is based on lapses of the applicable statutes of limitations, settlements and payments of uncertain tax positions. The estimated net decrease in unrecognized tax benefits for the next 12 months ranges from $0 to $4.5 million. Actual results may differ materially from this estimate.
The Company paid income taxes of $73.5 million, $78.7 million and $74.0 million in 2015, 2014, and 2013, respectively.
NOTE 13 – POST RETIREMENT BENEFIT PLANS
Defined Benefit Pension Plans
The Company has certain non-contributory defined benefit pension plans for salaried and hourly employees in the United States, Canada, Germany, the Netherlands, South Africa and the United Kingdom. The Company uses a measurement date of October 31 for fair value purposes for its pension plans. The salaried employees plans' benefits are based primarily on years of service and earnings. The hourly employees plans' benefits are based primarily upon years of service. Certain benefit provisions are subject to collective bargaining. The Company contributes an amount that is not less than the minimum funding and not more than the maximum tax-deductible amount to these plans. Salaried employees in the United States who commence service on or after November 1, 2007 and various dates in the preceding five years for the non-U.S. plans are not eligible to participate in the defined benefit pension plans, but are eligible to participate in a defined contribution retirement program. The category "Other International" represents the noncontributory defined benefit pension plans in Canada and South Africa.
Pension plan contributions by the Company totaled $11.4 million during 2015, which consisted of $8.2 million of employer contributions and $3.2 million of benefits paid directly by the Company. Pension plan contributions, including benefits paid directly by the Company totaled $16.9 million and $15.8 million during 2014 and 2013, respectively. Contributions, including benefits paid directly by the Company, during 2016 are expected to be approximately $15.7 million.
The following table presents the number of participants in the defined benefit plans:
| October 31, 2015 | Consolidated | USA | Germany | United Kingdom | Netherlands | Other International | ||||||||||||||||||
Active participants | 1,869 | 1,509 | 105 | 133 | 74 | 48 | ||||||||||||||||||
Vested former employees | 2,083 | 1,525 | 57 | 399 | 81 | 21 | ||||||||||||||||||
Retirees and beneficiaries | 4,050 | 2,480 | 255 | 718 | 540 | 57 | ||||||||||||||||||
| Other | ||||||||||||||||||||||||
| October 31, 2014 | Consolidated | USA | Germany | United Kingdom | Netherlands | International | ||||||||||||||||||
Active participants | 2,131 | 1,772 | 112 | 133 | 66 | 48 | ||||||||||||||||||
Vested former employees | 2,149 | 1,431 | 60 | 399 | 238 | 21 | ||||||||||||||||||
Retirees and beneficiaries | 4,131 | 2,372 | 256 | 718 | 728 | 57 | ||||||||||||||||||
Other plan participants | 30 | - | - | - | 30 | - | ||||||||||||||||||
72
The actuarial assumptions are used to measure the year-end benefit obligations as of October 31, 2015 and the pension costs for the subsequent year were as follows:
For the year ended October 31, 2015 | Consolidated | United States | Germany | United Kingdom | Netherlands | Other International | ||||||||||||||||||
Discount rate | 3.71 | % | 4.37 | % | 2.10 | % | 3.45 | % | 1.98 | % | 4.82 | % | ||||||||||||
Expected return on plan assets | 5.47 | % | 6.25 | % | N/A | 6.00 | % | 2.06 | % | 5.99 | % | |||||||||||||
Rate of compensation increase | 3.01 | % | 3.00 | % | 2.75 | % | 3.50 | % | 2.25 | % | N/A | |||||||||||||
For the year ended October 31, 2014 | ||||||||||||||||||||||||
Discount rate | 3.69 | % | 4.22 | % | 2.45 | % | 3.72 | % | 2.20 | % | 4.83 | % | ||||||||||||
Expected return on plan assets | 5.73 | % | 6.25 | % | N/A | 6.25 | % | 3.25 | % | 6.09 | % | |||||||||||||
Rate of compensation increase | 2.93 | % | 3.00 | % | 2.75 | % | 3.25 | % | 2.25 | % | 2.41 | % | ||||||||||||
For the year ended October 31, 2013 | ||||||||||||||||||||||||
Discount rate | 4.30 | % | 4.75 | % | 3.40 | % | 4.25 | % | 3.25 | % | 5.28 | % | ||||||||||||
Expected return on plan assets | 5.70 | % | 6.00 | % | N/A | 6.50 | % | 3.25 | % | 5.82 | % | |||||||||||||
Rate of compensation increase | 2.99 | % | 3.00 | % | 2.75 | % | 3.50 | % | 2.25 | % | 2.35 | % | ||||||||||||
The discount rate is determined by developing a hypothetical portfolio of individual high-quality corporate bonds available at the measurement date, the coupon and principal payments of which would be sufficient to satisfy the plans' expected future benefit payments as defined for the projected benefit obligation. The discount rate by country is equivalent to the average yield on that hypothetical portfolio of bonds and is a reflection of current market settlement rates on such high quality bonds, government treasuries, and annuity purchase rates. To determine the expected long-term rate of return on pension plan assets, the Company considers current and expected asset allocations, as well as historical and expected returns on various categories of plan assets. In developing future return expectations for the defined benefit pension plans' assets; the Company formulates views on the future economic environment, both in the U.S. and globally. The Company evaluates general market trends and historical relationships among a number of key variables that impact asset class returns, such as expected earnings growth, inflation, valuations, yields and spreads, using both internal and external sources. The Company takes into account expected volatility by asset class and diversification across classes to determine expected overall portfolio results given current and expected allocations. The Company uses published mortality tables for determining the expected lives of plan participants and believe that the tables selected are most-closely associated with the expected lives of plan participants as the tables are based on the country in which the participant is employed. During 2015, the Company moved to a new published mortality table in the United States, resulting in an increase of approximately $20.0 million in the projected benefit obligation.
Based on our analysis of future expectations of asset performance, past return results, and our current and expected asset allocations, we have assumed a 5.5% long-term expected return on those assets for cost recognition in 2015. For the defined benefit pension plans, we apply our expected rate of return to a market-related value of assets, which stabilizes variability in the amounts to which we apply that expected return.
We amortize experience gains and losses as well as the effects of changes in actuarial assumptions and plan provisions over a period no longer than the average future service of employees.
73
Benefit Obligations
The components of net periodic pension cost include the following (Dollars in millions):
For the year ended October 31, 2015 | Consolidated | United States | Germany | United Kingdom | Netherlands | Other International | ||||||||||||||||||
Service cost | $ | 15.5 | $ | 11.3 | $ | 0.5 | $ | 1.8 | $ | 1.4 | $ | 0.5 | ||||||||||||
Interest cost | 27.6 | 17.3 | 0.9 | 6.5 | 2.4 | 0.5 | ||||||||||||||||||
Expected return on plan assets | (32.8 | ) | (18.7 | ) | - | (11.4 | ) | (1.9 | ) | (0.8 | ) | |||||||||||||
Amortization of prior service cost | 0.1 | 0.1 | - | - | - | - | ||||||||||||||||||
Recognized net actuarial loss | 14.2 | 10.0 | 0.9 | 2.2 | 0.8 | 0.3 | ||||||||||||||||||
Special Events | ||||||||||||||||||||||||
Curtailment | 0.5 | 0.3 | - | - | - | 0.2 | ||||||||||||||||||
Settlement | 0.1 | - | - | - | - | 0.1 | ||||||||||||||||||
Special/contractual terminatio benefits | 0.1 | - | - | - | - | 0.1 | ||||||||||||||||||
|
|
|
|
|
|
|
|
|
|
|
| |||||||||||||
Net periodic pension (benefit) cost | $ | 25.3 | $ | 20.3 | $ | 2.3 | $ | (0.9 | ) | $ | 2.7 | $ | 0.9 | |||||||||||
|
|
|
|
|
|
|
|
|
|
|
| |||||||||||||
For the year ended October 31, 2014 | Consolidated | United States | Germany | United Kingdom | Netherlands | Other International | ||||||||||||||||||
Service cost | $ | 15.7 | $ | 10.4 | $ | 0.6 | $ | 2.5 | $ | 1.6 | $ | 0.6 | ||||||||||||
Interest cost | 29.6 | 16.6 | 1.3 | 7.5 | 3.6 | 0.6 | ||||||||||||||||||
Expected return on plan assets | (33.9 | ) | (17.4 | ) | - | (12.6 | ) | (3.1 | ) | (0.8 | ) | |||||||||||||
Amortization of prior service cost | 0.2 | 0.2 | - | - | - | - | ||||||||||||||||||
Recognized net actuarial loss | 10.4 | 6.8 | 0.7 | 1.9 | 0.8 | 0.2 | ||||||||||||||||||
|
|
|
|
|
|
|
|
|
|
|
| |||||||||||||
Net periodic pension (benefit) cost | $ | 22.0 | $ | 16.6 | $ | 2.6 | $ | (0.7 | ) | $ | 2.9 | $ | 0.6 | |||||||||||
|
|
|
|
|
|
|
|
|
|
|
| |||||||||||||
For the year ended October 31, 2013 | Consolidated | United States | Germany | United Kingdom | Netherlands | Other International | ||||||||||||||||||
Service cost | $ | 16.7 | $ | 11.5 | $ | 0.6 | $ | 2.9 | $ | 1.2 | $ | 0.5 | ||||||||||||
Interest cost | 27.6 | 15.9 | 1.2 | 6.5 | 3.3 | 0.7 | ||||||||||||||||||
Expected return on plan assets | (32.1 | ) | (16.4 | ) | - | (11.7 | ) | (3.2 | ) | (0.8 | ) | |||||||||||||
Amortization of prior service cost | 0.6 | 0.5 | - | - | - | 0.1 | ||||||||||||||||||
Recognized net actuarial loss | 16.4 | 13.6 | 0.6 | 1.3 | 0.6 | 0.3 | ||||||||||||||||||
|
|
|
|
|
|
|
|
|
|
|
| |||||||||||||
Net periodic pension (benefit) cost | $ | 29.2 | $ | 25.1 | $ | 2.4 | $ | (1.0 | ) | $ | 1.9 | $ | 0.8 | |||||||||||
|
|
|
|
|
|
|
|
|
|
|
| |||||||||||||
Benefit obligations are described in the following tables. Accumulated and projected benefit obligations (ABO and PBO) represent the obligations of a pension plan for past service as of the measurement date. ABO is the present value of benefits earned to date with benefits computed based on current compensation levels. PBO is ABO increased to reflect expected future compensation.
The following table sets forth the plans' change in projected benefit obligation (Dollars in millions):
| For the year ended October 31, 2015 | Consolidated | USA | Germany | United Kingdom | Netherlands | Other International | ||||||||||||||||||
Change in benefit obligation: | ||||||||||||||||||||||||
Benefit obligation at beginning of year | $ | 786.9 | $ | 419.6 | $ | 41.9 | $ | 186.9 | $ | 123.6 | $ | 14.9 | ||||||||||||
Service cost | 15.5 | 11.3 | 0.5 | 1.8 | 1.4 | 0.5 | ||||||||||||||||||
Interest cost | 27.6 | 17.3 | 0.9 | 6.5 | 2.4 | 0.5 | ||||||||||||||||||
Plan participant contributions | 0.2 | - | - | - | 0.2 | - | ||||||||||||||||||
Expenses paid from assets | (2.7 | ) | (2.1 | ) | - | (0.7 | ) | 0.2 | (0.1 | ) | ||||||||||||||
Plan Amendments | (3.3 | ) | (2.3 | ) | - | - | (1.0 | ) | - | |||||||||||||||
Actuarial (gain) loss | 15.7 | 9.1 | 2.2 | 9.0 | (4.6 | ) | - | |||||||||||||||||
Foreign currency effect | (33.7 | ) | - | (5.6 | ) | (9.7 | ) | (16.2 | ) | (2.2 | ) | |||||||||||||
Benefits paid | (33.0 | ) | (18.4 | ) | (1.2 | ) | (7.3 | ) | (5.2 | ) | (0.9 | ) | ||||||||||||
Curtailments | (7.2 | ) | (2.1 | ) | - | (2.5 | ) | - | (2.6 | ) | ||||||||||||||
Other | (0.2 | ) | (0.3 | ) | - | - | - | 0.1 | ||||||||||||||||
|
|
|
|
|
|
|
|
|
|
|
| |||||||||||||
Benefit obligation at end of year | $ | 765.8 | $ | 432.1 | $ | 38.7 | $ | 184.0 | $ | 100.8 | $ | 10.2 | ||||||||||||
|
|
|
|
|
|
|
|
|
|
|
| |||||||||||||
| For the year ended October 31, 2014 | ||||||||||||||||||||||||
Change in benefit obligation: | ||||||||||||||||||||||||
Benefit obligation at beginning of year | $ | 703.8 | $ | 358.7 | $ | 39.0 | $ | 174.9 | $ | 116.9 | $ | 14.3 | ||||||||||||
Service cost | 15.7 | 10.4 | 0.6 | 2.5 | 1.6 | 0.6 | ||||||||||||||||||
Interest cost | 29.6 | 16.6 | 1.3 | 7.5 | 3.6 | 0.6 | ||||||||||||||||||
Plan participant contributions | 0.3 | - | - | - | 0.3 | - | ||||||||||||||||||
Expenses paid from assets | (2.5 | ) | (1.2 | ) | - | (1.1 | ) | - | (0.2 | ) | ||||||||||||||
Plan amendments | (0.5 | ) | 0.4 | - | - | (0.9 | ) | - | ||||||||||||||||
Actuarial loss | 92.8 | 51.4 | 5.7 | 15.9 | 18.1 | 1.7 | ||||||||||||||||||
Foreign currency effect | (14.6 | ) | - | (3.3 | ) | (0.4 | ) | (9.9 | ) | (1.0 | ) | |||||||||||||
Benefits paid | (37.7 | ) | (16.7 | ) | (1.4 | ) | (12.4 | ) | (6.1 | ) | (1.1 | ) | ||||||||||||
|
|
|
|
|
|
|
|
|
|
|
| |||||||||||||
Benefit obligation at end of year | $ | 786.9 | $ | 419.6 | $ | 41.9 | $ | 186.9 | $ | 123.6 | $ | 14.9 | ||||||||||||
|
|
|
|
|
|
|
|
|
|
|
| |||||||||||||
74
The following tables set forth the PBO, ABO, plan assets and instances where the ABO exceeds the plan assets for the respective years (Dollars in millions):
| Actuarial value of benefit obligations | ||||||||||||||||||||||||
| Consolidated | USA | Germany | United Kingdom | Netherlands | Other International | |||||||||||||||||||
October 31, 2015 | ||||||||||||||||||||||||
Projected benefit obligation | $ | 765.8 | $ | 432.1 | $ | 38.7 | $ | 184.0 | $ | 100.8 | $ | 10.2 | ||||||||||||
Accumulated benefit obligation | 739.9 | 409.8 | 35.9 | 184.0 | 100.0 | 10.2 | ||||||||||||||||||
Plan assets | 624.7 | 311.1 | - | 208.4 | 92.7 | 12.5 | ||||||||||||||||||
October 31, 2014 | ||||||||||||||||||||||||
Projected benefit obligation | $ | 786.9 | $ | 419.6 | $ | 41.9 | $ | 186.9 | $ | 123.6 | $ | 14.9 | ||||||||||||
Accumulated benefit obligation | 752.5 | 393.2 | 38.9 | 184.9 | 122.0 | 13.5 | ||||||||||||||||||
Plan assets | 650.8 | 325.6 | - | 202.7 | 107.8 | 14.7 | ||||||||||||||||||
| Plans with ABO in excess of Plan assets | ||||||||||||||||||||||||
October 31, 2015 | ||||||||||||||||||||||||
Accumulated benefit obligation | $ | 546.5 | $ | 409.8 | $ | 35.9 | $ | - | $ | 100.0 | $ | 0.8 | ||||||||||||
Plan assets | 404.4 | 311.1 | - | - | 92.7 | 0.6 | ||||||||||||||||||
October 31, 2014 | ||||||||||||||||||||||||
Accumulated benefit obligation | $ | 567.6 | $ | 393.2 | $ | 38.9 | $ | - | $ | 122.0 | $ | 13.5 | ||||||||||||
Plan assets | $ | 445.2 | 325.6 | - | - | 107.9 | 11.7 | |||||||||||||||||
Future benefit payments, which reflect expected future service, as appropriate, during the next five years, and in the aggregate for the five years thereafter, are as follows (Dollars in millions):
Year | Expected benefit payments | |||
2016 | $ | 41.6 | ||
2017 | $ | 41.5 | ||
2018 | $ | 42.5 | ||
2019 | $ | 44.2 | ||
2020 | $ | 44.7 | ||
2021-2025 | $ | 237.1 | ||
Plan assets
The plans' assets consist of domestic and foreign equity securities, government and corporate bonds, cash, insurance annuity mutual funds and not more than the allowable number of shares of the Company's common stock, which was 247,504 Class A shares and 160,710 Class B shares at October 31, 2015 and 2014.
The investment policy reflects the long-term nature of the plans' funding obligations. The assets are invested to provide the opportunity for both income and growth of principal. This objective is pursued as a long-term goal designed to provide required benefits for participants without undue risk. It is expected that this objective can be achieved through a well-diversified asset portfolio. All equity investments are made within the guidelines of quality, marketability and diversification mandated by the Employee Retirement Income Security Act and/or other relevant statutes. Investment managers are directed to maintain equity portfolios at a risk level approximately equivalent to that of the specific benchmark established for that portfolio.
75
The Company's weighted average asset allocations at the measurement date and the target asset allocations by category are as follows:
Asset Category | 2015 Target | 2015 Actual | 2014 Target | 2014 Actual | ||||||||||||
Equity securities | 23 | % | 28 | % | 24 | % | 28 | % | ||||||||
Debt securities | 51 | % | 40 | % | 49 | % | 39 | % | ||||||||
Other | 26 | % | 32 | % | 27 | % | 33 | % | ||||||||
|
|
|
|
|
|
|
| |||||||||
Total | 100 | % | 100 | % | 100 | % | 100 | % | ||||||||
|
|
|
|
|
|
|
| |||||||||
The fair value of the pension plans' investments is presented below. The inputs and valuation techniques used to measure the fair value of the assets are consistently applied and described in Note 10.
| For the year ended October 31, 2015 | Consolidated | USA | Germany | United Kingdom | Netherlands | Other International | ||||||||||||||||||
Change in plan assets: | ||||||||||||||||||||||||
Fair value of plan assets at beginning of year | $ | 650.8 | $ | 325.6 | $ | - | $ | 202.7 | $ | 107.8 | $ | 14.7 | ||||||||||||
Actual return on plan assets | 25.4 | (0.9 | ) | - | 21.8 | 3.9 | 0.6 | |||||||||||||||||
Expenses paid | (2.7 | ) | (2.1 | ) | - | (0.7 | ) | 0.2 | (0.1 | ) | ||||||||||||||
Plan participant contributions | 0.2 | - | - | - | 0.2 | - | ||||||||||||||||||
Foreign currency impact | (27.3 | ) | - | - | (10.6 | ) | (14.2 | ) | (2.5 | ) | ||||||||||||||
Employer contributions | 8.2 | 5.0 | - | 2.5 | - | 0.7 | ||||||||||||||||||
Benefits paid | (29.9 | ) | (16.5 | ) | - | (7.3 | ) | (5.2 | ) | (0.9 | ) | |||||||||||||
|
|
|
|
|
|
|
|
|
|
|
| |||||||||||||
Fair value of plan assets at end of year | $ | 624.7 | $ | 311.1 | $ | - | $ | 208.4 | $ | 92.7 | $ | 12.5 | ||||||||||||
|
|
|
|
|
|
|
|
|
|
|
| |||||||||||||
| For the year ended October 31, 2014 | ||||||||||||||||||||||||
Change in plan assets: | ||||||||||||||||||||||||
Fair value of plan assets at beginning of year | $ | 621.2 | $ | 301.8 | $ | - | $ | 198.9 | $ | 106.5 | $ | 14.0 | ||||||||||||
Actual return on plan assets | 62.6 | 29.8 | - | 15.7 | 15.8 | 1.3 | ||||||||||||||||||
Expenses paid | (2.5 | ) | (1.2 | ) | - | (1.1 | ) | - | (0.2 | ) | ||||||||||||||
Plan participant contributions | 0.3 | - | - | - | 0.3 | - | ||||||||||||||||||
Foreign currency impact | (10.0 | ) | - | - | (0.3 | ) | (8.7 | ) | (1.0 | ) | ||||||||||||||
Employer contributions | 15.5 | 11.9 | - | 1.9 | - | 1.7 | ||||||||||||||||||
Benefits paid | (36.3 | ) | (16.7 | ) | - | (12.4 | ) | (6.1 | ) | (1.1 | ) | |||||||||||||
|
|
|
|
|
|
|
|
|
|
|
| |||||||||||||
Fair value of plan assets at end of year | $ | 650.8 | $ | 325.6 | $ | - | $ | 202.7 | $ | 107.8 | $ | 14.7 | ||||||||||||
|
|
|
|
|
|
|
|
|
|
|
| |||||||||||||
The following table presents the fair value measurements for the pension assets:
| As of October 31, 2015 (Dollars in millions) | ||||||||||||||||
| Asset Category | Fair Value Measurement | |||||||||||||||
| Level 1 | Level 2 | Level 3 | Total | |||||||||||||
Mutual funds | $ | 124.4 | $ | 161.2 | $ | - | $ | 285.6 | ||||||||
Common stock | 26.7 | - | - | 26.7 | ||||||||||||
Cash | 20.0 | - | - | 20.0 | ||||||||||||
Money market fund | 0.6 | - | - | 0.6 | ||||||||||||
Common collective trusts | - | 128.3 | - | 128.3 | ||||||||||||
Corporate bonds | - | 19.7 | - | 19.7 | ||||||||||||
Government bonds | - | 10.0 | - | 10.0 | ||||||||||||
Insurance Annuity | - | - | 130.2 | 130.2 | ||||||||||||
Other assets | - | 3.6 | - | 3.6 | ||||||||||||
|
|
|
|
|
|
|
| |||||||||
Total | $ | 171.7 | $ | 322.8 | $ | 130.2 | $ | 624.7 | ||||||||
|
|
|
|
|
|
|
| |||||||||
| As of October 31, 2014 (Dollars in millions) | ||||||||||||||||
| Asset Category | Fair Value Measurement | |||||||||||||||
| Level 1 | Level 2 | Level 3 | Total | |||||||||||||
Mutual funds | $ | 143.0 | $ | 160.4 | $ | - | $ | 303.4 | ||||||||
Common stock | 31.0 | - | - | 31.0 | ||||||||||||
Cash | 13.7 | - | - | 13.7 | ||||||||||||
Money market fund | 0.2 | - | - | 0.2 | ||||||||||||
Common collective trusts | - | 132.5 | - | 132.5 | ||||||||||||
Government Bonds | - | 15.6 | - | 15.6 | ||||||||||||
Corporate bonds | - | 3.1 | - | 3.1 | ||||||||||||
Other assets | - | 0.2 | - | 0.2 | ||||||||||||
Insurance Annuity | - | - | 151.1 | 151.1 | ||||||||||||
|
|
|
|
|
|
|
| |||||||||
Total | $ | 187.9 | $ | 311.8 | $ | 151.1 | $ | 650.8 | ||||||||
|
|
|
|
|
|
|
| |||||||||
76
The following table presents a reconciliation of the beginning and ending balances of the fair value measurements using significant unobservable inputs (Level 3). There have been no transfers in or out of level 3:
| Pension Plan | ||||||||
| (Dollars in millions) | 2015 | 2014 | ||||||
Balance at beginning of year | $ | 151.1 | $ | 96.6 | ||||
Actual return on plan assets held at reporting date: | ||||||||
Assets still held at reporting date | 7.1 | 15.9 | ||||||
Plan participant contributions | - | 0.3 | ||||||
Net purchases (settlements) | - | 47.0 | ||||||
Transfers | (3.4 | ) | - | |||||
Currency impact | (24.6 | ) | (8.7 | ) | ||||
|
|
|
| |||||
Balance at end of year | $ | 130.2 | $ | 151.1 | ||||
|
|
|
| |||||
Financial statement presentation including other comprehensive income:
| As of October 31, 2015 | Consolidated | USA | Germany | United Kingdom | Netherlands | Other International | ||||||||||||||||||
Unrecognized net actuarial loss | $ | 192.1 | $ | 126.6 | $ | 15.9 | $ | 32.9 | $ | 14.9 | $ | 1.8 | ||||||||||||
Unrecognized prior service cost | (3.5 | ) | (1.8 | ) | - | - | (1.7 | ) | - | |||||||||||||||
Unrecognized initial net obligation | - | - | - | - | - | - | ||||||||||||||||||
|
|
|
|
|
|
|
|
|
|
|
| |||||||||||||
Accumulated other comprehensive loss (Pre-tax) | $ | 188.6 | $ | 124.8 | $ | 15.9 | $ | 32.9 | $ | 13.2 | $ | 1.8 | ||||||||||||
|
|
|
|
|
|
|
|
|
|
|
| |||||||||||||
Amounts recognized in the Consolidated Balance Sheets consist of: | ||||||||||||||||||||||||
Prepaid benefit cost | $ | 26.7 | $ | - | $ | - | $ | 24.4 | $ | - | $ | 2.3 | ||||||||||||
Accrued benefit liability | (167.8 | ) | (121.0 | ) | (38.6 | ) | - | (8.2 | ) | - | ||||||||||||||
Accumulated other comprehensive loss | 188.6 | 124.8 | 15.9 | 32.9 | 13.2 | 1.8 | ||||||||||||||||||
|
|
|
|
|
|
|
|
|
|
|
| |||||||||||||
Net amount recognized | $ | 47.5 | $ | 3.8 | $ | (22.7 | ) | $ | 57.3 | $ | 5.0 | $ | 4.1 | |||||||||||
|
|
|
|
|
|
|
|
|
|
|
| |||||||||||||
| As of October 31, 2014 | Consolidated | USA | Germany | United Kingdom | Netherlands | Other International | ||||||||||||||||||
Unrecognized net actuarial loss | $ | 198.5 | $ | 110.1 | $ | 16.8 | $ | 41.1 | $ | 25.4 | $ | 5.1 | ||||||||||||
Unrecognized prior service cost | - | 0.9 | - | - | (0.9 | ) | - | |||||||||||||||||
Unrecognized initial net obligation | 0.3 | - | - | - | - | 0.3 | ||||||||||||||||||
|
|
|
|
|
|
|
|
|
|
|
| |||||||||||||
Accumulated other comprehensive loss (Pre-tax) | $ | 198.8 | $ | 111.0 | $ | 16.8 | $ | 41.1 | $ | 24.5 | $ | 5.4 | ||||||||||||
|
|
|
|
|
|
|
|
|
|
|
| |||||||||||||
Amounts recognized in the Consolidated Balance Sheets consist of: | ||||||||||||||||||||||||
Prepaid benefit cost | $ | 18.6 | $ | - | $ | - | $ | 15.8 | $ | - | $ | 2.8 | ||||||||||||
Accrued benefit liability | (154.6 | ) | (94.0 | ) | (41.8 | ) | - | (15.7 | ) | (3.1 | ) | |||||||||||||
Accumulated other comprehensive loss | 198.8 | 111.0 | 16.8 | 41.1 | 24.5 | 5.4 | ||||||||||||||||||
|
|
|
|
|
|
|
|
|
|
|
| |||||||||||||
Net amount recognized | $ | 62.8 | $ | 17.0 | $ | (25.0 | ) | $ | 56.9 | $ | 8.8 | $ | 5.1 | |||||||||||
|
|
|
|
|
|
|
|
|
|
|
| |||||||||||||
| October 31, 2015 | October 31, 2014 | |||||||
Accumulated other comprehensive loss at beginning of year | $ | 198.8 | $ | 149.6 | ||||
Increase or (decrease) in accumulated other comprehensive (income) or loss | ||||||||
Net transition obligation amortized during fiscal year | (0.1 | ) | (0.1 | ) | ||||
Net prior service costs amortized during fiscal year | (0.1 | ) | (0.2 | ) | ||||
Net loss amortized during fiscal year | (14.2 | ) | (10.4 | ) | ||||
Prior service cost recognized during fiscal year due to curtailment | (0.3 | ) | - | |||||
Transition obligation recognized during fiscal year due to curtailment | (0.2 | ) | - | |||||
Loss recognized during fiscal year due to settlement | (0.1 | ) | - | |||||
Prior service credit occurring during fiscal year | (3.2 | ) | (0.5 | ) | ||||
Liability loss occurring during fiscal year | 8.4 | 92.8 | ||||||
Asset loss (gain) occurring during fiscal year | 7.5 | (28.6 | ) | |||||
|
|
|
| |||||
Increase (decrease) in accumulated other comprehensive loss | $ | (2.3 | ) | $ | 53.0 | |||
Foreign currency impact | (7.9 | ) | (3.8 | ) | ||||
|
|
|
| |||||
Accumulated other comprehensive (income) or loss at current fiscal year end | $ | 188.6 | $ | 198.8 | ||||
|
|
|
| |||||
In 2016, the Company expects to record an amortization loss of $11.6 million of prior service costs from shareholders' equity into pension costs.
77
Defined contribution plans
The Company has several voluntary 401(k) savings plans that cover eligible employees. For certain plans, the Company matches a percentage of each employee's contribution up to a maximum percentage of base salary. Company contributions to the 401(k) plans were $7.8 million in 2015, $7.3 million in 2014 and $6.5 million in 2013.
Supplemental Employee Retirement Plan
The Company has a supplemental employee retirement plan which is an unfunded plan providing supplementary retirement benefits primarily to certain executives and longer-service employees.
Postretirement Health Care and Life Insurance Benefits
The Company has certain postretirement health and life insurance benefit plans in the United States and South Africa. The Company uses a measurement date of October 31 for its postretirement benefit plans.
The following table presents the number of participants in the post-retirement health and life insurance benefit plan:
| October 31, 2015 | Consolidated | USA | South Africa | |||||||||
Active participants | 25 | 12 | 13 | |||||||||
Vested former employees | 0 | 0 | 0 | |||||||||
Retirees and beneficiaries | 757 | 667 | 90 | |||||||||
Other plan participants | 0 | 0 | ||||||||||
| October 31, 2014 | Consolidated | USA | South Africa | |||||||||
Active participants | 25 | 12 | 13 | |||||||||
Vested former employees | 0 | 0 | 0 | |||||||||
Retirees and beneficiaries | 779 | 683 | 96 | |||||||||
Other plan participants | 0 | 0 | 0 | |||||||||
The discount rate actuarial assumptions at October 31 are used to measure the year-end benefit obligations and the pension costs for the subsequent year were as follows:
| Consolidated | United States | South Africa | ||||||||||
For the year ended October 31, 2015 | 4.65 | % | 3.88 | % | 9.20 | % | ||||||
For the year ended October 31, 2014 | 4.45 | % | 3.70 | % | 8.20 | % | ||||||
The components of net periodic cost for the postretirement benefits include the following (Dollars in millions):
For the years ended October 31, | 2015 | 2014 | 2013 | |||||||||
Service cost | $ | - | $ | - | $ | - | ||||||
Interest cost | 0.7 | 0.8 | 0.8 | |||||||||
Amortization of prior service cost | (1.5 | ) | (1.6 | ) | (1.5 | ) | ||||||
Recognized net actuarial gain | (0.1 | ) | - | - | ||||||||
|
|
|
|
|
| |||||||
Net periodic income | $ | (0.9 | ) | $ | (0.8 | ) | $ | (0.7 | ) | |||
|
|
|
|
|
| |||||||
The following table sets forth the plans' change in benefit obligation (Dollars in millions):
| October 31, 2015 | October 31, 2014 | |||||||
Benefit obligation at beginning of year | $ | 17.3 | $ | 18.5 | ||||
Service cost | - | - | ||||||
Interest cost | 0.7 | 0.8 | ||||||
Actuarial loss | (1.0 | ) | (0.5 | ) | ||||
Foreign currency effect | (0.6 | ) | (0.3 | ) | ||||
Benefits paid | (1.5 | ) | (1.2 | ) | ||||
|
|
|
| |||||
Benefit obligation at end of year | $ | 14.9 | $ | 17.3 | ||||
|
|
|
| |||||
78
Financial statement presentation included other comprehensive income (Dollars in millions):
| October 31, 2015 | October 31, 2014 | |||||||
Unrecognized net actuarial gain | $ | 1.6 | $ | 0.8 | ||||
Unrecognized prior service credit | 5.8 | 7.4 | ||||||
|
|
|
| |||||
Accumulated other comprehensive income | $ | 7.4 | $ | 8.2 | ||||
|
|
|
| |||||
The accumulated postretirement health and life insurance benefit obligation and fair value of plan assets for the consolidated plans were $14.9 million and $0, respectively, as of October 31, 2015 compared to $17.3 million and $0, respectively, as of October 31, 2014.
The healthcare cost trend rates on gross eligible charges are as follows:
| Medical | ||||
Current trend rate | 7.2 | % | ||
Ultimate trend rate | 5.2 | % | ||
Year ultimate trend rate reached (South Africa) | 2017 | |||
Year ultimate trend rate reached (US) | 2026 | |||
A one-percentage point change in assumed health care cost trend rates would have the following effects (Dollars in thousands):
| 1-Percentage-Point Increase | 1-Percentage-Point Decrease | |||||||
Effect on total of service and interest cost components | $ | 34 | $ | (29 | ) | |||
Effect on postretirement benefit obligation | $ | 361 | $ | (309 | ) | |||
Future benefit payments, which reflect expected future service, as appropriate, during the next five years, and in the aggregate for the five years thereafter, are as follows (Dollars in millions):
Year | Expected benefit payments | |||
2016 | $ | 1.5 | ||
2017 | $ | 1.4 | ||
2018 | $ | 1.3 | ||
2019 | $ | 1.2 | ||
2020 | $ | 1.2 | ||
2021-2025 | $ | 5.3 | ||
NOTE 14 – CONTINGENT LIABILITIES AND ENVIRONMENTAL RESERVES
Litigation-related Liabilities
The Company may become involved from time-to-time in litigation and regulatory matters incidental to its business, including governmental investigations, enforcement actions, personal injury claims, product liability, employment health and safety matters, commercial disputes, intellectual property matters, disputes regarding environmental clean-up costs, litigation in connection with acquisitions and divestitures, and other matters arising out of the normal conduct of its business. The Company intends to vigorously defend itself in such litigation. The Company does not believe that the outcome of any pending litigation will have a material adverse effect on its consolidated financial statements.
The Company may accrue for contingencies related to litigation and regulatory matters if it is probable that a liability has been incurred and the amount of the loss can be reasonably estimated. Because litigation is inherently unpredictable and unfavorable resolutions can occur, assessing contingencies is highly subjective and requires judgments about future events. The Company regularly reviews contingencies to determine whether its accruals are adequate. The amount of ultimate loss may differ from these estimates.
79
Environmental Reserves
As of October 31, 2015 and 2014, environmental reserves were $8.2 million and $24.7 million, respectively, and were recorded on an undiscounted basis. These reserves are principally based on environmental studies and cost estimates provided by third parties, but also take into account management estimates. The estimated liabilities are reduced to reflect the anticipated participation of other potentially responsible parties in those instances where it is probable that such parties are legally responsible and financially capable of paying their respective shares of relevant costs. For sites that involve formal actions subject to joint and several liabilities, these actions have formal agreements in place to apportion the liability. As of October 31, 2015 and 2014, environmental reserves of the Company included $0.6 million and $13.7 million, respectively, for its blending facility in Chicago, Illinois; $4.3 million and $6.8 million, respectively, for various European drum facilities acquired from Blagden and Van Leer; $2.0 million and $2.6 million, respectively, for its various container life cycle management and recycling facilities acquired in 2011 and 2010, and $1.3 million and $1.6 million for various other facilities around the world. The $13.1 million decrease in environmental reserve for the blending facility located in Chicago is a result of the divestment during the second quarter of 2015 of the subsidiary that owns this facility.
The Company's exposure to adverse developments with respect to any individual site is not expected to be material. Although environmental remediation could have a material effect on results of operations if a series of adverse developments occur in a particular quarter or year, the Company believes that the chance of a series of adverse developments occurring in the same quarter or year is remote. Future information and developments will require the Company to continually reassess the expected impact of these environmental matters.
NOTE 15 – EARNINGS PER SHARE
The Company has two classes of common stock and, as such, applies the "two-class method" of computing earnings per share ("EPS") as prescribed in ASC 260, "Earnings Per Share." In accordance with this guidance, earnings are allocated in the same fashion as dividends would be distributed. Under the Company's articles of incorporation, any distribution of dividends in any year must be made in proportion of one cent a share for Class A Common Stock to one and one-half cents a share for Class B Common Stock, which results in a 40% to 60% split to Class A and B shareholders, respectively. In accordance with this, earnings are allocated first to Class A and Class B Common Stock to the extent that dividends are actually paid and the remainder is allocated assuming all of the earnings for the period have been distributed in the form of dividends.
The Company calculates EPS as follows:
| Basic | =
|
40% * Average Class A Shares Outstanding | * |
Undistributed Net Income | + | Class A Dividends Per Share | ||||||
| Class A EPS | 40% * Average Class A Shares Outstanding + 60% * Average Class B Shares Outstanding | Average Class A Shares Outstanding | ||||||||||
| Diluted | =
|
40% * Average Class A Shares Outstanding | * |
Undistributed Net Income | + | Class A Dividends Per Share | ||||||
| Class A EPS | 40% * Average Class A Shares Outstanding + 60% * Average Class B Shares Outstanding | Average Diluted Class A Shares Outstanding | ||||||||||
| Basic | =
|
60% * Average Class B Shares Outstanding | * |
Undistributed Net Income | + | Class B Dividends Per Share | ||||||
| Class B EPS | 40% * Average Class A Shares Outstanding + 60% * Average Class B Shares Outstanding | Average Class B Shares Outstanding | ||||||||||
* Diluted Class B EPS calculation is identical to Basic Class B calculation | ||||||||||||
80
The following table provides EPS information for each period, respectively:
(In millions except per share data) | 2015 | 2014 | 2013 | |||||||||
Numerator |
| |||||||||||
Numerator for basic and diluted EPS – | ||||||||||||
Net income attributable to Greif | $ | 71.9 | $ | 91.5 | $ | 144.7 | ||||||
Cash dividends | 98.7 | 98.6 | 98.3 | |||||||||
|
|
|
|
|
| |||||||
Undistributed net (loss) income attributable to Greif, Inc. | $ | (26.8 | ) | $ | (7.1 | ) | $ | 46.4 | ||||
Denominator | ||||||||||||
Denominator for basic EPS – | ||||||||||||
Class A common stock | 25.7 | 25.5 | 25.4 | |||||||||
Class B common stock | 22.1 | 22.1 | 22.1 | |||||||||
Denominator for diluted EPS – | ||||||||||||
Class A common stock | 25.7 | 25.5 | 25.4 | |||||||||
Class B common stock | 22.1 | 22.1 | 22.1 | |||||||||
EPS Basic | ||||||||||||
Class A common stock | $ | 1.23 | $ | 1.56 | $ | 2.47 | ||||||
Class B common stock | $ | 1.83 | $ | 2.33 | $ | 3.70 | ||||||
EPS Diluted | ||||||||||||
Class A common stock | $ | 1.23 | $ | 1.56 | $ | 2.47 | ||||||
Class B common stock | $ | 1.83 | $ | 2.33 | $ | 3.70 | ||||||
The Class A Common Stock has no voting rights unless four quarterly cumulative dividends upon the Class A Common Stock are in arrears. The Class B Common Stock has full voting rights. There is no cumulative voting for the election of directors.
Common Stock Repurchases
The Company's Board of Directors has authorized the purchase of up to four million shares of Class A Common Stock or Class B Common Stock or any combination of the foregoing. During 2015, the Company repurchased no shares of Class A or Class B Common Stock. As of October 31, 2015, the Company had repurchased 3,184,272 shares, including 1,425,452 shares of Class A Common Stock and 1,758,820 shares of Class B Common Stock, under this program, all of which were repurchased in prior years. There were no shares repurchased from November 1, 2012 through October 31, 2015.
The following table summarizes the Company's Class A and Class B common and treasury shares at the specified dates:
| Authorized Shares | Issued Shares | Outstanding Shares | Treasury Shares | |||||||||||||
October 31, 2015: | ||||||||||||||||
Class A Common Stock | 128,000,000 | 42,281,920 | 25,693,564 | 16,588,356 | ||||||||||||
Class B Common Stock | 69,120,000 | 34,560,000 | 22,119,966 | 12,440,034 | ||||||||||||
October 31, 2014: | ||||||||||||||||
Class A Common Stock | 128,000,000 | 42,281,920 | 25,603,452 | 16,678,468 | ||||||||||||
Class B Common Stock | 69,120,000 | 34,560,000 | 22,119,966 | 12,440,034 | ||||||||||||
The following is a reconciliation of the shares used to calculate basic and diluted earnings per share:
For the years ended October 31, | 2015 | 2014 | 2013 | |||||||||
Class A Common Stock: | ||||||||||||
Basic shares | 25,668,204 | 25,547,650 | 25,399,256 | |||||||||
Assumed conversion of stock options | 5,901 | 5,336 | 23,066 | |||||||||
|
|
|
|
|
| |||||||
Diluted shares | 25,674,105 | 25,552,986 | 25,422,322 | |||||||||
|
|
|
|
|
| |||||||
Class B Common Stock: | ||||||||||||
Basic and diluted shares | 22,119,966 | 22,119,966 | 22,119,966 | |||||||||
|
|
|
|
|
| |||||||
No stock options were antidilutive for the years ended October 31, 2015, 2014, or 2013.
81
NOTE 16 – EQUITY EARNINGS OF UNCONSOLIDATED AFFILIATES, NET OF TAX AND NET INCOME (LOSS) ATTRIBUTABLE TO NONCONTROLLING INTERESTS
Equity earnings of unconsolidated affiliates, net of tax
Equity earnings of unconsolidated affiliates, net of tax represent the Company's share of earnings of affiliates in which the Company does not exercise control and has a 20 percent or more voting interest. Investments in such affiliates are accounted for using the equity method of accounting. If the fair value of an investment in an affiliate is below its carrying value and the difference is deemed to be other than temporary, the difference between the fair value and the carrying value is charged to earnings. The Company has an equity interest in one such affiliate as of October 31, 2015. Equity earnings of unconsolidated affiliates, net of tax for the years ended October 31, 2015, 2014 and 2013 were $0.8 million, $1.9 million and $2.9 million, respectively. Dividends received from the Company's equity method affiliates for the years ended October 31, 2015, 2014 and 2013 were $0.2 million, $0.2 million and $0.3 million, respectively.
Net (income) loss attributable to noncontrolling interests
Net (income) loss attributable to noncontrolling interests represent the portion of earnings or losses from the operations of the Company's consolidated subsidiaries attributable to unrelated third party equity owners that were (deducted from) added to net income to arrive at net income attributable to the Company. Net (income) loss attributable to noncontrolling interests for the years ended October 31, 2015, 2014 and 2013 was $4.7 million, $46.6 million and ($2.8) million, respectively.
NOTE 17 – LEASES
The table below contains information related to the Company's rent expense (Dollars in millions):
For the years ended October 31, | 2015 | 2014 | 2013 | |||||||||
Rent Expense | $ | 50.4 | $ | 57.4 | $ | 54.7 | ||||||
|
|
|
|
|
| |||||||
The following table provides the Company's minimum rent commitments under operating and capital leases in the next five years and the remaining years thereafter:
Fiscal Year | Operating Leases | Capital Leases | ||||||
2016 | $ | 46.9 | $ | 0.2 | ||||
2017 | 37.3 | 0.1 | ||||||
2018 | 28.0 | - | ||||||
2019 | 21.8 | - | ||||||
2020 | 15.5 | - | ||||||
Thereafter | 53.8 | - | ||||||
|
|
|
| |||||
Total | $ | 203.3 | $ | 0.3 | ||||
|
|
|
| |||||
NOTE 18 – BUSINESS SEGMENT INFORMATION
The Company has five operating segments, which are aggregated into four reportable business segments: Rigid Industrial Packaging & Services; Paper Packaging; Flexible Products & Services; and Land Management. The Rigid Industrial Packaging & Services reportable business segment is the aggregation of two operating segments: Rigid Industrial Packaging & Services – Americas and Rigid Industrial Packaging & Services Europe, Middle East, Africa, and Asia Pacific.
Operations in the Rigid Industrial Packaging & Services segment involve the production and sale of rigid industrial packaging products, such as steel, fibre and plastic drums, rigid intermediate bulk containers, closure systems for industrial packaging products, transit protection products, water bottles and remanufactured and reconditioned industrial containers, and services, such as container life cycle management, blending, filling, logistics, warehousing and other packaging services. The Company's rigid industrial packaging products and services are sold to customers in industries such as chemicals, paints and pigments, food and beverage, petroleum, industrial coatings, agricultural, pharmaceutical and mineral products, among others.
Operations in the Paper Packaging segment involve the production and sale of containerboard, corrugated sheets, corrugated containers and other corrugated products to customers in North America in industries such as packaging, automotive, food and building products. The Company's corrugated container products are used to ship such diverse products as home appliances, small machinery, grocery products, automotive components, books and furniture, as well as numerous other applications.
Operations in the Flexible Products & Services segment involve the production and sale of flexible intermediate bulk containers and related services on a global basis. The Company's flexible intermediate bulk containers are constructed from a polypropylene-based woven fabric that is produced at its production sites, as well as sourced from strategic regional suppliers. Flexible products are sold to customers and in market segments similar to those of the Company's Rigid Industrial Packaging & Services segment. Additionally, the Company's flexible products significantly expand its presence in the agricultural and food industries, among others.
82
Operations in the Land Management segment involve the management and sale of timber and special use properties from approximately 242,673 acres of timber properties in the southeastern United States, which are actively managed. Land Management's operations focus on the active harvesting and regeneration of its timber properties to achieve sustainable long-term yields. While timber sales are subject to fluctuations, the Company seeks to maintain a consistent cutting schedule, within the limits of market and weather conditions. The Company also sells, from time to time, timberland and special use properties, which consists of surplus properties, HBU properties, and development properties.
In order to maximize the value of timber property, the Company continues to review its current portfolio and explore the development of certain of these properties. This process has led the Company to characterize property as follows:
| • | Surplus property, meaning land that cannot be efficiently or effectively managed by the Company, whether due to parcel size, lack of productivity, location, access limitations or for other reasons. |
| • | HBU property, meaning land that in its current state has a higher market value for uses other than growing and selling timber. |
| • | Development property, meaning HBU land that, with additional investment, may have a significantly higher market value than its HBU market value. |
| • | Timberland, meaning land that is best suited for growing and selling timber. |
The disposal of surplus and HBU property is reported in the consolidated statements of income under "gain on disposals of properties, plants and equipment, net" and the sale of development property is reported under "net sales" and "cost of products sold." All HBU, development and surplus property is used by the Company to productively grow and sell timber until sold.
Whether timberland has a higher value for uses other than growing and selling timber is a determination based upon several variables, such as proximity to population centers, anticipated population growth in the area, the topography of the land, aesthetic considerations, including access to water, the condition of the surrounding land, availability of utilities, markets for timber and economic considerations both nationally and locally. Given these considerations, the characterization of land is not a static process, but requires an ongoing review and re-characterization as circumstances change.
83
The following segment information is presented for each of the three years in the period ended October 31, 2015 (Dollars in millions):
| 2015 | 2014 | 2013 | ||||||||||
Net sales: | ||||||||||||
Rigid Industrial Packaging & Service | $ | 2,586.4 | $ | 3,077.0 | $ | 3,062.1 | ||||||
Paper Packaging | 676.1 | 706.8 | 676.0 | |||||||||
Flexible Products & Services | 322.6 | 425.8 | 448.7 | |||||||||
Land Management | 31.6 | 29.5 | 33.1 | |||||||||
|
|
|
|
|
| |||||||
Total net sales | $ | 3,616.7 | $ | 4,239.1 | $ | 4,219.9 | ||||||
|
|
|
|
|
| |||||||
Operating profit (loss): | ||||||||||||
Rigid Industrial Packaging | 86.4 | 170.1 | 196.8 | |||||||||
Paper Packaging | 109.3 | 125.8 | 123.8 | |||||||||
Flexible Products & Services | (36.6 | ) | (78.6 | ) | (11.7 | ) | ||||||
Land Management | 33.7 | 32.0 | 32.7 | |||||||||
|
|
|
|
|
| |||||||
Total operating profit | $ | 192.8 | $ | 249.3 | $ | 341.6 | ||||||
|
|
|
|
|
| |||||||
Depreciation, depletion and amortization expense: | ||||||||||||
Rigid Industrial Packaging & Services | $ | 94.0 | $ | 108.4 | $ | 107.4 | ||||||
Paper Packaging | 28.7 | 29.8 | 30.3 | |||||||||
Flexible Products & Services | 8.6 | 13.3 | 15.2 | |||||||||
Land Management | 3.3 | 4.3 | 4.7 | |||||||||
|
|
|
|
|
| |||||||
Total depreciation, depletion and amortization expense | $ | 134.6 | $ | 155.8 | $ | 157.6 | ||||||
|
|
|
|
|
| |||||||
Capital Expenditures | ||||||||||||
Rigid Industrial Packaging & Services | $ | 69.4 | $ | 73.8 | $ | 64.8 | ||||||
Paper Packaging | 56.4 | 38.9 | 21.7 | |||||||||
Flexible Products & Services | 3.2 | 4.9 | 14.0 | |||||||||
Land Management | 1.6 | 60.0 | 13.0 | |||||||||
|
|
|
|
|
| |||||||
Total segment | 130.6 | 177.6 | 113.5 | |||||||||
Corporate and other | 10.7 | 17.1 | 31.9 | |||||||||
|
|
|
|
|
| |||||||
Total capital expenditures | $ | 141.3 | $ | 194.7 | $ | 145.4 | ||||||
|
|
|
|
|
| |||||||
Assets: | ||||||||||||
Rigid Industrial Packaging & Services | $ | 2,043.3 | $ | 2,334.1 | ||||||||
Paper Packaging | 444.0 | 408.3 | ||||||||||
Flexible Products & Services | 187.0 | 251.0 | ||||||||||
Land Management | 335.2 | 319.0 | ||||||||||
|
|
|
| |||||||||
Total Segment | 3,009.5 | 3,312.4 | ||||||||||
Corporate and other | 306.2 | 355.0 | ||||||||||
|
|
|
| |||||||||
Total Assets | $ | 3,315.7 | $ | 3,667.4 | ||||||||
|
|
|
| |||||||||
The following geographic information is presented for each of the three years in the period ended October 31, 2015 (Dollars in millions):
| 2015 | 2014 | 2013 | ||||||||||
Net Sales | ||||||||||||
United States | $ | 1,688.3 | $ | 1,905.8 | $ | 1,843.6 | ||||||
Europe, Middle East, and Africa | 1,287.2 | 1,596.2 | 1,610.6 | |||||||||
Asia Pacific and other Americas | 641.2 | 737.1 | 765.7 | |||||||||
|
|
|
|
|
| |||||||
Total net sales | $ | 3,616.7 | $ | 4,239.1 | $ | 4,219.9 | ||||||
|
|
|
|
|
| |||||||
The following table presents properties, plants and equipment, net by geographic region (Dollars in millions):
| 2015 | 2014 | |||||||
Properties, plants and equipment, net |
| |||||||
United States | $ | 734.1 | $ | 716.5 | ||||
Europe, Middle East, and Africa | 335.4 | 402.8 | ||||||
Asia Pacific and other Americas | 148.2 | 189.0 | ||||||
|
|
|
| |||||
Total properites, plants and equipment, net | $ | 1,217.7 | $ | 1,308.3 | ||||
|
|
|
| |||||
84
NOTE 19 – COMPREHENSIVE (LOSS) INCOME
The following table provides the roll forward of accumulated other comprehensive income for the year ended October 31, 2015 (Dollars in millions):
| Foreign Currency Translation | Cash Flow Hedges | Minimum Pension Liability Adjustment | Accumulated Other Comprehensive Loss | |||||||||||||
Balance as of October 31, 2014 | $ | (144.5 | ) | $ | (0.1 | ) | $ | (129.8 | ) | $ | (274.4 | ) | ||||
Other Comprehensive (Loss) Income Before Reclassifications | (112.1 | ) | - | 9.0 | $ | (103.1 | ) | |||||||||
Amounts reclassified from Accumulated Other Comprehensive Loss | - | 0.1 | - | $ | 0.1 | |||||||||||
|
|
|
|
|
|
|
| |||||||||
Current-period Other Comprehensive (Loss) Income | (112.1 | ) | 0.1 | 9.0 | $ | (103.0 | ) | |||||||||
|
|
|
|
|
|
|
| |||||||||
Balance as of October 31, 2015 | $ | (256.6 | ) | $ | - | $ | (120.8 | ) | $ | (377.4 | ) | |||||
|
|
|
|
|
|
|
| |||||||||
The following table provides the roll forward of accumulated other comprehensive income for the year ended October 31, 2014 (Dollars in millions):
| Foreign Currency Translation | Cash Flow Hedges | Minimum Pension Liability Adjustment | Accumulated Other Comprehensive Loss | |||||||||||||
Balance as of October 31, 2013 | $ | (56.9 | ) | $ | (0.6 | ) | $ | (95.1 | ) | $ | (152.6 | ) | ||||
Other Comprehensive (Loss) Income Before Reclassifications | (87.6 | ) | 0.1 | (34.7 | ) | $ | (122.2 | ) | ||||||||
Amounts reclassified from Accumulated Other Comprehensive Loss | - | 0.4 | - | $ | 0.4 | |||||||||||
|
|
|
|
|
|
|
| |||||||||
Current-period Other Comprehensive (Loss) Income | (87.6 | ) | 0.5 | (34.7 | ) | $ | (121.8 | ) | ||||||||
|
|
|
|
|
|
|
| |||||||||
Balance as of October 31, 2014 | $ | (144.5 | ) | $ | (0.1 | ) | $ | (129.8 | ) | $ | (274.4 | ) | ||||
|
|
|
|
|
|
|
| |||||||||
The components of accumulated other comprehensive income above are presented net of tax, as applicable.
NOTE 20 – QUARTERLY FINANCIAL DATA (UNAUDITED)
The quarterly results of operations for 2015 and 2014 are shown below (Dollars in millions, except per share amounts):
2015 | January 31 | April 30 | July 31 | October 31 | ||||||||||||
Net sales | $ | 902.3 | $ | 915.9 | $ | 930.0 | $ | 868.5 | ||||||||
Gross profit | $ | 153.9 | $ | 181.1 | $ | 166.8 | $ | 168.0 | ||||||||
Net income (1) | $ | 28.2 | $ | 20.5 | $ | 9.3 | $ | 9.2 | ||||||||
Net income attributable to Greif, Inc. (1) | $ | 30.1 | $ | 20.8 | $ | 8.6 | $ | 12.4 | ||||||||
Earnings per share | ||||||||||||||||
Basic: | ||||||||||||||||
Class A Common Stock | $ | 0.52 | $ | 0.35 | $ | 0.15 | $ | 0.21 | ||||||||
Class B Common Stock | $ | 0.76 | $ | 0.53 | $ | 0.22 | $ | 0.32 | ||||||||
Diluted: | ||||||||||||||||
Class A Common Stock | $ | 0.52 | $ | 0.35 | $ | 0.15 | $ | 0.21 | ||||||||
Class B Common Stock | $ | 0.76 | $ | 0.53 | $ | 0.22 | $ | 0.32 | ||||||||
Earnings per share were calculated using the following number of shares: | ||||||||||||||||
Basic: | ||||||||||||||||
Class A Common Stock | 25,607,886 | 25,678,393 | 25,692,973 | 25,693,564 | ||||||||||||
Class B Common Stock | 22,119,966 | 22,119,966 | 22,119,966 | 22,119,966 | ||||||||||||
Diluted: | ||||||||||||||||
Class A Common Stock | 25,617,814 | 25,688,653 | 25,698,547 | 25,701,264 | ||||||||||||
Class B Common Stock | 22,119,966 | 22,119,966 | 22,119,966 | 22,119,966 | ||||||||||||
Market price (Class A Common Stock): | ||||||||||||||||
High | $ | 45.94 | $ | 41.97 | $ | 41.65 | $ | 35.97 | ||||||||
Low | $ | 36.43 | $ | 34.52 | $ | 29.43 | $ | 27.13 | ||||||||
Close | $ | 36.43 | $ | 39.29 | $ | 30.20 | $ | 32.33 | ||||||||
Market price (Class B Common Stock): | ||||||||||||||||
High | $ | 47.39 | $ | 45.89 | $ | 47.80 | $ | 47.97 | ||||||||
Low | $ | 41.47 | $ | 40.40 | $ | 36.59 | $ | 33.42 | ||||||||
Close | $ | 41.47 | $ | 45.89 | $ | 37.13 | $ | 37.98 | ||||||||
| (1) | We recorded the following significant transactions during the fourth quarter of 2015: (i) restructuring charges of $13.3 million, (ii) non-cash asset impairment charges of $23.6 million, (iii) loss on disposals of properties, plants, equipment, net of $2.3 million, and (iv) loss on disposals of businesses, net of $0.7 million. Refer to Form 10-Q filings, as previously filed with the SEC, for prior quarter significant transactions or trends. |
85
2014 | January 31 | April 30 | July 31 | October 31 | ||||||||||||
Net sales | $ | 1,001.5 | $ | 1,065.5 | $ | 1,124.0 | $ | 1,048.1 | ||||||||
Gross profit | $ | 186.1 | $ | 204.3 | $ | 217.7 | $ | 202.9 | ||||||||
Net income (loss) (1) | $ | 31.8 | $ | 37.1 | $ | 11.5 | $ | (35.5 | ) | |||||||
Net income attributable to Greif, Inc. (1) | $ | 30.7 | $ | 38.4 | $ | 13.7 | $ | 8.7 | ||||||||
Earnings per share | ||||||||||||||||
Basic: | ||||||||||||||||
Class A Common Stock | $ | 0.53 | $ | 0.65 | $ | 0.23 | $ | 0.15 | ||||||||
Class B Common Stock | $ | 0.78 | $ | 0.98 | $ | 0.35 | $ | 0.22 | ||||||||
Diluted: | ||||||||||||||||
Class A Common Stock | $ | 0.53 | $ | 0.65 | $ | 0.23 | $ | 0.15 | ||||||||
Class B Common Stock | $ | 0.78 | $ | 0.98 | $ | 0.35 | $ | 0.22 | ||||||||
Earnings per share were calculated using the following number of shares: | ||||||||||||||||
Basic: | ||||||||||||||||
Class A Common Stock | 25,470,354 | 25,540,341 | 25,576,452 | 25,603,452 | ||||||||||||
Class B Common Stock | 22,119,966 | 22,119,966 | 22,119,966 | 22,119,966 | ||||||||||||
Diluted: | ||||||||||||||||
Class A Common Stock | 25,495,642 | 25,560,846 | 25,581,952 | 25,554,934 | ||||||||||||
Class B Common Stock | 22,119,966 | 22,119,966 | 22,119,966 | 22,119,966 | ||||||||||||
Market price (Class A Common Stock): | ||||||||||||||||
High | $ | 56.47 | $ | 54.98 | $ | 56.53 | $ | 50.85 | ||||||||
Low | $ | 50.35 | $ | 47.91 | $ | 49.70 | $ | 41.75 | ||||||||
Close | $ | 50.63 | $ | 54.19 | $ | 50.18 | $ | 44.06 | ||||||||
Market price (Class B Common Stock): | ||||||||||||||||
High | $ | 60.00 | $ | 59.20 | $ | 61.09 | $ | 55.00 | ||||||||
Low | $ | 51.10 | $ | 53.03 | $ | 53.06 | $ | 47.90 | ||||||||
Close | $ | 55.51 | $ | 58.81 | $ | 53.62 | $ | 50.20 | ||||||||
| (1) | We recorded the following significant transactions during the fourth quarter of 2014: (i) restructuring charges of $5.6 million, (ii) non-cash asset impairment charges of $70.2 million, (iii) gain on disposals of properties, plants, equipment, net of $2.8 million, and (iv) gain on disposal of businesses, net of $21.2 million. Refer to Form 10-Q filings, as previously filed with the SEC, for prior quarter significant transactions or trends. |
Shares of the Company's Class A Common Stock and Class B Common Stock are listed on the New York Stock Exchange where the symbols are GEF and GEF.B, respectively.
As of December 16, 2015, there were 406 stockholders of record of the Class A Common Stock and 95 stockholders of record of the Class B Common Stock.
86
Report of Independent Registered Public Accounting Firm
The Board of Directors and Shareholders of Greif, Inc. and subsidiary companies:
We have audited the accompanying consolidated balance sheets of Greif, Inc. and subsidiary companies (the "Company") as of October 31, 2015 and 2014, and the related consolidated statements of income, comprehensive income, shareholders' equity, and cash flows for each of the two years in the period ended October 31, 2015. Our audits also included the financial statement schedule listed in the Index at Item 15. These financial statements and financial statement schedule are the responsibility of the Company's management. Our responsibility is to express an opinion on these financial statements and financial statement schedule based on our audits.
We conducted our audits in accordance with the standards of the Public Company Accounting Oversight Board (United States). Those standards require that we plan and perform the audit to obtain reasonable assurance about whether the financial statements are free of material misstatement. An audit includes examining, on a test basis, evidence supporting the amounts and disclosures in the financial statements. An audit also includes assessing the accounting principles used and significant estimates made by management, as well as evaluating the overall financial statement presentation. We believe that our audits provide a reasonable basis for our opinion.
In our opinion, such consolidated financial statements present fairly, in all material respects, the financial position of Greif, Inc. and subsidiary companies as of October 31, 2015 and 2014, and the results of their operations and their cash flows for each of the two years in the period ended October 31, 2015, in conformity with accounting principles generally accepted in the United States of America. Also, in our opinion, such financial statement schedule, when considered in relation to the basic consolidated financial statements taken as a whole, presents fairly, in all material respects, the information set forth therein.
We have also audited, in accordance with the standards of the Public Company Accounting Oversight Board (Unites States), the Company's internal control over financial reporting as of October 31, 2015, based on criteria established in Internal Control- Integrated Framework (1992) issued by the Committee of Sponsoring Organizations of the Treadway Commission and our report dated December 21, 2015 expressed an adverse opinion on the Company's internal control over financial reporting because of material weaknesses.
/s/ Deloitte & Touche LLP
Columbus, Ohio
December 21, 2015
87
Report of Independent Registered Public Accounting Firm
The Board of Directors and Shareholders of Greif, Inc. and subsidiary companies:
We have audited the accompanying consolidated statements of income, comprehensive income, changes in shareholders' equity, and cash flows of Greif, Inc. and subsidiary companies for the year ended October 31, 2013. Our audit also included the financial statement schedule listed in the Index at Item 15. These financial statements are the responsibility of the Company's management. Our responsibility is to express an opinion on these financial statements based on our audit.
We conducted our audit in accordance with the standards of the Public Company Accounting Oversight Board (United States). Those standards require that we plan and perform the audit to obtain reasonable assurance about whether the financial statements are free of material misstatement. An audit includes examining, on a test basis, evidence supporting the amounts and disclosures in the financial statements. An audit also includes assessing the accounting principles used and significant estimates made by management, as well as evaluating the overall financial statement presentation. We believe that our audit provides a reasonable basis for our opinion.
In our opinion, the financial statements referred to above present fairly, in all material respects, the consolidated results of operations and cash flows of Greif, Inc. and subsidiary companies for the year ended October 31, 2013, in conformity with U.S. generally accepted accounting principles. Also, in our opinion, the related financial statement schedule, when considered in relation to the basic financial statements taken as a whole, presents fairly in all material respects the information set forth therein.
/s/ Ernst & Young LLP
Columbus, Ohio
December 23, 2013, except for the impact of the matters
discussed in Notes 1, 20 and 21 pertaining to the
correction of errors and restatement included in the
Annual Report on Form 10-K of Greif, Inc. for the year
ended October 31, 2014 as filed with the Securities and
Exchange Commission on January 21, 2015, as to which
the date is January 21, 2015
88
ITEM 9. CHANGES IN AND DISAGREEMENTS WITH ACCOUNTANTS ON ACCOUNTING AND FINANCIAL DISCLOSURES
None.
ITEM 9A. CONTROLS AND PROCEDURES
Changes in Internal Control Over Financial Reporting
As previously disclosed in Item 9A of the 2013 Form 10-K (the "preceding Form 10-K"), management had then concluded that there was a material weakness in internal controls over financial reporting related to accounting for non-routine or complex transactions. Remedial actions were taken to improve these controls, including improving processes and communications around non-routine or complex transactions, supplementing the technical competence of our accounting staff with additional internal and contract resources and improving, from a holistic standpoint, the documentation of the review of the accounting, presentation and disclosure of such transactions. The Company believes these actions taken have improved the effectiveness of our internal control over financial reporting. As of October 31, 2015, testing of both the design and operating effectiveness of the new and improved controls was completed, and management concluded that the material weakness in internal controls over financial reporting related to accounting for non-routine or complex transactions has been fully remediated.
During the fourth quarter of 2014, in conjunction with the implementation of additional internal controls starting in 2013 related to the calculation and reconciliation of deferred income tax assets, deferred income tax liabilities and uncertain tax positions, management identified unreconciled differences and errors in the income tax accounts of certain of the Company's non-U.S. subsidiaries. Specifically, prior to 2014, certain calculations and reconciliations had not been accurately and consistently performed for these income tax accounts for certain non-U.S. subsidiaries nor were return-to-provision reconciliations consistently performed as non-U.S. subsidiary tax returns were filed. As a result, management concluded that there was a material weakness in internal controls over financial reporting related to accounting for international income taxes, including deferred taxes and uncertain tax positions.
The actions that have been implemented to remediate the above identified material weakness include the improvement of internal controls for the Company's non-U.S. subsidiaries related to the timely and accurate calculation and reconciliation of the income tax accounts and the completion and review of return-to-provision reconciliations. Management believes the steps taken to date have improved the effectiveness of our internal control over financial reporting. Moreover, the Company has hired additional personnel and engaged external tax advisors for the income tax accounting function in connection with remediating this material weakness. While improvements have been made, the material weakness will not be considered remediated until the applicable internal controls operate for a sufficient period of time and management has concluded, through testing, that these controls are operating effectively. Management concluded that the material weakness related to controls over the accounting for international income taxes including deferred taxes and uncertain tax positions had not been remediated as of October 31, 2015.
In the course of completing our assessment of internal control over financial reporting as of October 31, 2014, management identified a number of deficiencies related to the design and operating effectiveness of information technology general controls for certain of our information systems that are relevant to the preparation of the Company's consolidated financial statements and system of internal control over financial reporting (i.e., the affected IT systems). In particular, these deficiencies related to logical access controls and program change management controls that are intended to ensure that access to financial applications and data is adequately restricted to appropriate personnel and that all changes affecting the financial applications and underlying account records are identified, authorized, tested and implemented appropriately. Additionally, as a result of the deficiencies identified, there is a possibility that the effectiveness of business process controls that are dependent on the affected IT systems or data and financial reports generated from the affected IT systems may be adversely affected.
Management has been actively engaged in developing and implementing a remediation plan to address the material weakness in the Company's IT systems noted above. The remediation actions that were planned include the following:
| • | Improvement of the design and operation of control activities and procedures associated with user and administrator access to the affected IT systems, including both preventive and detective control activities. |
| • | Implementation of appropriate program change management control activities, including implementation of change management control setting configurations across the affected IT systems, including tracking of access and history of changes. |
| • | Implementation of business process controls that directly and precisely address the risks related to accuracy and completeness of the financial reports and data generated from the affected IT systems and used in the performance of underlying business process controls. |
In addition, the continued implementation of our global ERP platform has occurred throughout fiscal 2015 and several of the affected IT systems with deficiencies have been removed from operation with several additional locations transitioned already in fiscal 2016.
While progress was made throughout fiscal 2015 related to the planned remediation activities noted above, access and change management controls in several key systems were not designed and operating effectively as of the end of fiscal 2015 and additional deficiencies were identified related to reliance on data or financial key reports generated from those IT systems. As such, as of October 31, 2015, management concluded that the material weakness in internal controls over financial reporting related to information technology general controls in the areas of user access, change management and key reports had not been remediated.
89
As part of the process of remediating our material weaknesses discussed above, management continues to evaluate resources, change and expand roles and responsibilities of key personnel and make changes to certain processes related to financial close, systems and financial reporting. We continue to consolidate some of our transaction processing and general accounting activities onto a common, company-wide management information and accounting system and have also continued implementation of a global account reconciliation and monitoring tool. These changes are intended to further enhance our internal control over financial reporting and our operating efficiencies. No other changes occurred in our internal control over financial reporting during our most recent fiscal quarter that materially affected, or are reasonably likely to materially affect, our internal control over financial reporting.
Except as noted in the preceding paragraphs, there has been no change in our internal control over financial reporting that occurred during the most recent quarter that has materially affected, or is reasonably likely to materially affect, our internal control over financial reporting.
Disclosure Controls and Procedures
With the participation of our principal executive officer and principal financial officer, our management has evaluated the effectiveness of our disclosure controls and procedures (as defined in Rule 13a-15(e) under the Securities Exchange Act of 1934, as amended (the "Exchange Act")), as of the end of the period covered by this report. Based upon that evaluation, our principal executive officer and principal financial officer have concluded that, as of the end of the period covered by this report:
| • | Information required to be disclosed by us in the reports that we file or submit under the Exchange Act is recorded, processed, summarized and reported within the time periods specified in the rules and forms of the Securities and Exchange Commission; |
| • | Information required to be disclosed by us in the reports that we file or submit under the Exchange Act is accumulated and communicated to our management, including our principal executive officer and principal financial officer, as appropriate to allow timely decisions regarding required disclosure; and |
| • | Because of material weaknesses in our internal controls over financial reporting related to accounting for international income taxes, including deferred income taxes and uncertain tax positions, and over financial reporting related to information technology general controls in the areas of user access, change management and key reports, our disclosure controls and procedures and internal controls over financial reporting were not effective. |
Management's Annual Report on Internal Control over Financial Reporting
Management's annual report on internal control over financial reporting required by Item 308(a) of Regulation S-K follows. The report of the independent registered public accounting firm required by Item 308(b) of Regulation S-K is found under the caption "Report of Independent Registered Public Accounting Firm" below.
The following report is provided by our management on our internal control over financial reporting (as defined in Rule 13a-15(f) of the Exchange Act):
| 1. | Our management is responsible for establishing and maintaining adequate internal control over our financial reporting as such term is defined in Exchange Act Rule 13a-15(f). |
| 2. | Our management has used the Committee of Sponsoring Organizations of the Treadway Commission (1992 framework) ("COSO") framework to evaluate the effectiveness of our internal control over financial reporting. Management believes that the COSO framework is a suitable framework for its evaluation of our internal control over financial reporting because it is free from bias, permits reasonably qualitative and quantitative measurements of our internal controls, is sufficiently complete so that those relevant factors that would alter a conclusion about the effectiveness of our internal controls are not omitted and is relevant to an evaluation of internal control over financial reporting. |
| 3. | Management has assessed the effectiveness of our internal control over financial reporting as of October 31, 2015, and has concluded that, because of material weaknesses in internal controls over financial reporting related to accounting for income taxes, including deferred income taxes and uncertain tax positions, and over financial reporting related to information technology general controls in the areas of user access, change management and key reports, our internal controls over financial reporting were not effective. |
Our internal control over financial reporting as of October 31, 2015, has been audited by Deloitte & Touche LLP, an independent registered public accounting firm, as stated in their report, which follows below.
90
Report of Independent Registered Public Accounting Firm
To the Board of Directors and Shareholders of
Greif, Inc. and subsidiary companies:
We have audited Greif, Inc. and subsidiary companies' (the "Company") internal control over financial reporting as of October 31, 2015, based on criteria established in Internal Control- Integrated Framework (1992) issued by the Committee of Sponsoring Organizations of the Treadway Commission. The Company's management is responsible for maintaining effective internal control over financial reporting and for its assessment of the effectiveness of internal control over financial reporting, included in the accompanying Management's Annual Report on Internal Control over Financial Reporting . Our responsibility is to express an opinion on the Company's internal control over financial reporting based on our audit.
We conducted our audit in accordance with the standards of the Public Company Accounting Oversight Board (United States). Those standards require that we plan and perform the audit to obtain reasonable assurance about whether effective internal control over financial reporting was maintained in all material respects. Our audit included obtaining an understanding of internal control over financial reporting, assessing the risk that a material weakness exists, testing and evaluating the design and operating effectiveness of internal control based on the assessed risk, and performing such other procedures as we considered necessary in the circumstances. We believe that our audit provides a reasonable basis for our opinion.
A company's internal control over financial reporting is a process designed by, or under the supervision of, the company's principle executive and principal financial officers, or persons performing similar functions, and effected by the company's board of directors, management, and other personnel to provide reasonable assurance regarding the reliability of financial reporting and the preparation of the financial statements for external purposes in accordance with generally accepted accounting principles. A company's internal control over financial reporting includes those policies and procedures that (1) pertain to the maintenance of records that, in reasonable detail, accurately and fairly reflect the transactions and dispositions of the assets of the company; (2) provide reasonable assurance that transactions are recorded as necessary to permit preparation of financial statements in accordance with generally accepted accounting principles, and that receipts and expenditures of the company are being made only in accordance with the authorizations of management and directors of the company; and (3) provide reasonable assurance regarding prevention or timely detection of unauthorized acquisition, use, or disposition of the company's assets that could have a material effect on the financial statements.
Because of the inherent limitations of internal control over financial reporting, including the possibility of collusion or improper management override of controls, material misstatements due to error or fraud may not be prevented or detected on a timely basis. Also, projections of any evaluation of the effectiveness of the internal control over financial reporting to future periods are subject to the risk that the controls may become inadequate because of changes in conditions, or that the degree of compliance with the policies or procedures may deteriorate.
A material weakness is a deficiency, or combination of deficiencies, in internal control over financial reporting, such that there is a reasonable possibility that a material misstatement of the company's annual or interim financial statements will not be prevented or detected on a timely basis. The following material weaknesses have been identified and included in management's assessment. Management has identified material weaknesses in internal controls over financial reporting relating to income tax accounting for certain foreign subsidiaries, and logical access and program change management controls related to certain information systems that are relevant to information and reports produced by certain information systems. These material weaknesses were considered in determining the nature, timing and extent of audit tests applied in our audit of the consolidated financial statements and financial statement schedule as of and for the year ended October 31, 2015, of the Company and this report does not affect our report on such financial statements and financial statement schedule.
In our opinion, because of the effects of the material weaknesses identified above on the achievement of the objectives of the control criteria, the Company has not maintained effective internal control over financial reporting as of October 31, 2015, based on the criteria established in Internal Control-Integrated Framework (1992) issued by the Committee of Sponsoring Organizations of the Treadway Commission.
We also have audited, in accordance with the standards of the Public Company Accounting Oversight Board (United States), the consolidated financial statements and financial statement schedule of Greif, Inc. and subsidiary companies as of and for the year ended October 31, 2015, and our report dated December 21, 2015 expressed an unqualified opinion on those financial statements and financial statement schedule.
/s/ Deloitte & Touche LLP
Columbus, Ohio
December 21, 2015
91
ITEM 9B. OTHER INFORMATION
None.
PART III
ITEM 10. DIRECTORS, EXECUTIVE OFFICERS AND CORPORATE GOVERNANCE
Information regarding our directors required by Items 401(a) and (d)-(f) of Regulation S-K will be found under the caption "Proposal Number 1 – Election of Directors" in the 2016 Proxy Statement, which information is incorporated herein by reference. Information regarding our executive officers required by Items 401(b) and (d)-(f) of Regulation S-K will be contained under the caption "Executive Officers of the Company" in the 2016 Proxy Statement, which information is incorporated herein by reference.
We have a separately-designated standing Audit Committee established in accordance with Section 3(a)(58)(A) of the Exchange Act. As of the date of this filing, the members of the Audit Committee were Vicki L. Avril, Bruce A. Edwards, John F. Finn and John W. McNamara. Ms. Avril is Chairperson of the Audit Committee. Our Board of Directors has determined that Ms. Avril is an "audit committee financial expert," as that term is defined in Item 401(h)(2) of Regulation S-K, and "independent," as that term is defined in Rule 10A-3 of the Exchange Act.
Information regarding the filing of reports of ownership under Section 16(a) of the Exchange Act by our officers and directors and persons owning more than 10 percent of a registered class of our equity securities required by Item 405 of Regulation S-K will be found under the caption "Corporate Governance-Stock Holdings of Certain Owners and Management-Section 16(a) Beneficial Ownership Reporting Compliance" in the 2016 Proxy Statement, which information is incorporated herein by reference.
Information concerning the procedures by which stockholders may recommend nominees to our Board of Directors will be found under the caption "Corporate Governance-Board of Directors-Director Nominations" in the 2016 Proxy Statement. There has been no material change to the nomination procedures we previously disclosed in the proxy statement for our 2015 annual meeting of stockholders.
Our Board of Directors has adopted a code of ethics that applies to our principal executive officer, principal financial officer, principal accounting officer, controller, and persons performing similar functions. This code of ethics is posted on our Internet Web site at www.greif.com under "Investor Center-Corporate Governance." Copies of this code of ethics are also available to any person, without charge, by making a written request to us. Requests should be directed to Greif, Inc., Attention: Corporate Secretary, 425 Winter Road, Delaware, Ohio 43015. Any amendment (other than any technical, administrative or other non-substantive amendment) to, or waiver from, a provision of this code will be posted on our website described above within four business days following its occurrence.
ITEM 11. EXECUTIVE COMPENSATION
The 2016 Proxy Statement will contain information regarding the following matters: information regarding executive compensation required by Item 402 of Regulation S-K will be found under the caption "Compensation Discussion and Analysis"; information required by Item 407(e)(4) of Regulation S-K will be found under the caption "Compensation Committee Interlocks and Insider Participation," and information required by Item 407(e)(5) of Regulation S-K will be found under the caption "Compensation Committee Report." This information is incorporated herein by reference.
ITEM 12. SECURITY OWNERSHIP OF CERTAIN BENEFICIAL OWNERS AND MANAGEMENT AND RELATED STOCKHOLDER MATTERS
Information regarding security ownership of certain beneficial owners and management required by Item 403 of Regulation S-K will be found under the caption "Stock Holdings of Certain Owners and Management" in the 2016 Proxy Statement, which information is incorporated herein by reference.
Information regarding equity compensation plan information required by Item 201(d) of Regulation S-K will be found under the caption "Executive Compensation-Equity Compensation Plan Information" in the 2016 Proxy Statement, which information is incorporated herein by reference.
ITEM 13. CERTAIN RELATIONSHIPS AND RELATED TRANSACTIONS, AND DIRECTOR INDEPENDENCE
Information regarding certain relationships and related transactions required by Item 404 of Regulation S-K will be found under the caption "Certain Relationships and Related Transactions" in the 2016 Proxy Statement, which information is incorporated herein by reference.
Information regarding the independence of our directors required by Item 407(a) of Regulation S-K will be found under the caption "Corporate Governance – Director Independence" in the 2016 Proxy Statement, which information is incorporated herein by reference.
ITEM 14. PRINCIPAL ACCOUNTANT FEES AND SERVICES
Information regarding principal accounting fees and services required by Item 9(e) of Schedule 14A will be found under the caption "Independent Registered Public Accounting Firm" in the 2016 Proxy Statement, which information is incorporated herein by reference.
92
PART IV
ITEM 15. EXHIBITS AND FINANCIAL STATEMENT SCHEDULES
EXHIBIT INDEX
| Exhibit No. | Description of Exhibit | If Incorporated by Reference, Document with which Exhibit was Previously Filed with SEC | ||
| 3.1 | Amended and Restated Certificate of Incorporation of Greif, Inc. | Annual Report on Form 10-K for the fiscal year ended October 31, 1997, File No. 001-00566 (see Exhibit 3(a) therein). | ||
| 3.2 | Amendment to Amended and Restated Certificate of Incorporation of Greif, Inc. | Definitive Proxy Statement on Form 14A dated January 27, 2003, File No. 001-00566 (see Exhibit A therein). | ||
| 3.3 | Amendment to Amended and Restated Certificate of Incorporation of Greif, Inc. | Quarterly Report on Form 10-Q for the fiscal quarter ended April 30, 2007, File No. 001-00566 (see Exhibit 3.1 therein). | ||
| 3.4 | Second Amended and Restated By-Laws of Greif, Inc. | Current Report on Form 8-K dated August 29, 2008, File No. 001-00566 (see Exhibit 99.2 therein) | ||
| 3.5 | Amendment of Second Amended and Restated By-Laws of Greif, Inc. (effective November 1, 2011). | Current Report on Form 8-K dated November 2, 2011, File No. 001-00566 (see Exhibit 99.2 therein) | ||
| 3.6 | Amendment of Second Amended and Restated By-Laws of Greif, Inc. (effective September 3, 2013). | Current Report on Form 8-K dated September 6, 2013, File No. 001-00566 (see Exhibit 99.3 therein) | ||
| 4.1 | Indenture dated as of February 9, 2007, among Greif, Inc., as Issuer, and U.S. Bank National Association, as Trustee, regarding 6-3/4% Senior Notes due 2017 | Quarterly Report on Form 10-Q for the fiscal quarter ended January 31, 2007, File No. 001-00566 (see Exhibit 4.2 therein). | ||
| 4.2 | Indenture dated as of July 28, 2009, among Greif, Inc., as Issuer, and U.S. Bank National Association, as Trustee, regarding 7-3/4% Senior Notes due 2019 | Quarterly Report on Form 10-Q for the fiscal quarter ended July 31, 2009, File No. 001-00566 (see Exhibit 4(b) therein). | ||
| 4.3 | Indenture dated as of July 15, 2011, among Greif Luxembourg Finance S.C.A., as Issuer, Greif, Inc. as Guarantor, The Bank of New York Mellon, as Trustee and Principal Paying Agent, and The Bank of New York Mellon (Luxembourg) S.A., as Transfer Agent, Registrar and Luxembourg Paying Agent, regarding 7.375% Senior Notes due 2021 | Quarterly Report on Form 10-Q for the fiscal quarter ended July 31, 2011, File No. 001-00566 (see Exhibit 99.3 therein). | ||
| 10.1* | Greif, Inc. Directors' Stock Option Plan. | Registration Statement on Form S-8, File No. 333-26977 (see Exhibit 4(b) therein). | ||
| 10.2* | Greif, Inc. Incentive Stock Option Plan, as Amended and Restated. | Annual Report on Form 10-K for the fiscal year ended October 31, 1997, File No. 001-00566 (see Exhibit 10(b) therein). | ||
| 10.3* | Greif, Inc. Amended and Restated Directors' Deferred Compensation Plan. | Quarterly Report on Form 10-Q for the fiscal quarter ended April 30, 2006, File No. 001-00566 (see Exhibit 10.2 therein). | ||
| 10.5* | Supplemental Retirement Benefit Agreement. | Annual Report on Form 10-K for the fiscal year ended October 31, 1999, File No. 001-00566 (see Exhibit 10(i) therein). | ||
| 10.6* | Second Amended and Restated Supplemental Executive Retirement Plan. | Annual Report on Form 10-K for fiscal year ended October 31, 2007, File No. 001-00566 (see Exhibit 10(f) therein). | ||
93
Exhibit No. | Description of Exhibit | If Incorporated by Reference, Document with which Exhibit was Previously Filed with SEC | ||
| 10.7* | Greif, Inc. Amended and Restated Long-Term Incentive Plan. | Quarterly Report on Form 10-Q for the fiscal quarter ended April 30, 2006, File No. 001-00566 (see Exhibit 10.1 therein). | ||
| 10.8* | Amendment No. 1 to Greif, Inc. Amended and Restated Long-Term Incentive Plan. | Contained herein. | ||
| 10.9* | Greif, Inc. Performance-Based Incentive Compensation Plan. | Definitive Proxy Statement on Form 14A dated January 25, 2002, File No. 001-00566 (see Exhibit B therein). | ||
| 10.10* | Amendment No. 1 to Greif, Inc. Performance-Based Incentive Compensation Plan | Annual Report on Form 10-K for the fiscal year ended October 31, 2011, File No. 001-00566 (See Exhibit 10(i) therein). | ||
| 10.11* | Amendment No. 2 to Greif, Inc. Performance-Based Incentive Compensation Plan | Annual Report on Form 10-K for the fiscal year ended October 31, 2013, File No. 001-00566 (See Exhibit 10.10 therein). | ||
| 10.12* | Greif, Inc. 2001 Management Equity Incentive and Compensation Plan. | Definitive Proxy Statement on Form DEF 14A dated January 26, 2001, File No. 001-00566 (see Exhibit A therein). | ||
| 10.13.1* | Amendment No. 1 to Greif, Inc. 2001 Management Equity Incentive and Compensation Plan | Annual Report on Form 10-K for the fiscal year ended October 31, 2011, File No. 001-00566 (See Exhibit 10(k) therein). | ||
| 10.13.2* | Amendment No. 2 to Greif, Inc. 2001 Management Equity Incentive and Compensation Plan | Contained herein. | ||
| 10.14* | Greif, Inc. 2000 Nonstatutory Stock Option Plan. | Registration Statement on Form S-8, File No. 333-61058 (see Exhibit 4(c) therein). | ||
| 10.15* | 2005 Outside Directors Equity Award Plan | Definitive Proxy Statement on Form DEF 14A, File No. 001-00566, filed with the Securities and Exchange Commission on January 21, 2005 (see Exhibit A therein). | ||
| 10.16* | Form of Stock Option Award Agreement for the 2005 Outside Directors Equity Award Plan of Greif, Inc. | Registration Statement on Form S-8, File No. 333-123133 (see Exhibit 4(c) therein). | ||
| 10.17* | Form of Restricted Share Award Agreement for the 2005 Outside Directors Equity Award Plan of Greif, Inc. | Registration Statement on Form S-8, File No. 333-123133 (see Exhibit 4(d) therein). | ||
| 10.18* | Greif, Inc. Nonqualified Deferred Compensation Plan | Quarterly Report on Form 10-Q for the fiscal quarter ended January 31, 2008, File No. 001-00566 (see Exhibit 10.CC therein). | ||
| 10.19* | Restricted Share Award Agreement under the 2001 Management Equity Incentive and Compensation Plan dated May 12, 2014, with Lawrence A. Hilsheimer | Quarterly Report on Form 10-Q for the fiscal quarter ended July 31, 2014, File No. 001-00566 (see Exhibit 10.1 therein). | ||
94
Exhibit No. | Description of Exhibit | If Incorporated by Reference, Document with which Exhibit was Previously Filed with SEC | ||
| 10.20 | Second Amended and Restated Credit Agreement dated as of December 19, 2012 among Greif, Inc., Greif International Holding Supra C.V. and Greif International Holding B.V., as borrowers, with a syndicate of financial institutions, as lenders, Bank of America, N.A., as administrative agent and L/C issuer, Merrill Lynch, Pierce, Fenner & Smith Incorporated, JP Morgan Securities LLC and Wells Fargo Securities, LLC, as joint lead arrangers and joint book managers, JP Morgan Chase Bank, N.A. and Wells Fargo Bank, National Association, as co-syndication agents, and KeyBank National Association, Citizens Bank of Pennsylvania, ING Bank N.V. and U.S. Bank National Association, as co-documentation agents. | Current Report on Form 8-K dated December 20, 2012, File No. 001-00566 (see Exhibit 99.2 therein). | ||
| 10.21 | Transfer and Administration Agreement dated as of December 8, 2008, by and among Greif Receivables Funding LLC, Greif Packaging LLC, YC SUSI Trust, as Conduit Investor and Uncommitted Investor, and Bank of America, National Association, as Agent, a Managing Agent, an Administrator and a Committed Investor. Certain portions of this exhibit have been omitted pursuant to an order granting confidential treatment and have been filed separately with the Securities and Exchange Commission. | Quarterly Report on Form 10-Q for the fiscal quarter ended April 30, 2010, File No. 001-00566 (see Exhibit 10(bb) therein). | ||
| 10.22 | First Amendment dated as of September 11, 2009, to the Transfer and Administration Agreement dated as of December 8, 2008, by and among Greif Receivables Funding LLC, Greif Packaging LLC, YC SUSI Trust, as Conduit Investor and Uncommitted Investor, and Bank of America, National Association, as Agent, Managing Partner, an Administrator and a Committed Investor. | Registration Statement on Form S-4, File No. 333-162011 (see Exhibit 10(cc) therein). | ||
| 10.23 | Second Amendment dated as of December 7, 2009, to the Transfer and Administration Agreement dated as of December 8, 2008, by and among Greif Receivables Funding LLC, Greif Packaging LLC, YC SUSI Trust, as Conduit Investor and Uncommitted Investor, and Bank of America, National Association, as Agent, Managing Partner, an Administrator and a Committed Investor. | Annual Report on Form 10-K for fiscal year ended October 31, 2009, File No. 001-00566 (see Exhibit 10(dd) therein). | ||
95
Exhibit No. | Description of Exhibit | If Incorporated by Reference, Document with which Exhibit was Previously Filed with SEC | ||
| 10.24 | Third Amendment dated as of May 10, 2010, to the Transfer and Administration Agreement dated as of December 8, 2008 by and among Greif Receivables Funding LLC, Greif Packaging LLC, YC SUSI Trust, as Conduit Investor and Uncommitted Investor, and Bank of America National Association, as Agent, Managing Agent, an Administrator and a Committed Investor. | Quarterly Report on Form 10-Q for the fiscal quarter ended April 30, 2010, File No. 001-00566 (see Exhibit 99.1 therein). | ||
| 10.25 | Fourth Amendment dated as of June 22, 2010, to the Transfer and Administration Agreement dated as of December 8, 2008, by and among Greif Receivables Funding LLC, Greif Packaging LLC, YC SUSI Trust, as Conduit Investor and Uncommitted Investor, and Bank of America National Association, as Agent, Managing Agent, an Administrator and a Committed Investor. | Quarterly Report on Form 10-Q for the fiscal quarter ended July 31, 2010, File No. 001-00566 (see Exhibit 10.1 therein). | ||
| 10.26 | Fifth Amendment dated as of September 30, 2010, to the Transfer and Administration Agreement dated as of December 8, 2008, by and among Greif Receivables Funding LLC, Greif Packaging LLC, YC SUSI Trust, as Conduit Investor and Uncommitted Investor, and Bank of America National Association, as Agent, Managing Agent, an Administrator and a Committed Investor. | Annual Report on Form 10-K for the fiscal year ended October 31, 2010, File No. 001-00566 (see Exhibit 10(cc) therein). | ||
| 10.27 | Sixth Amendment, dated as of September 19, 2011, to the Transfer and Administration Agreement, dated as of December 8, 2008, by and among Greif Packaging LLC, Greif Receivables Funding LLC and Bank of America National Association, as Managing Agent, Administrator, Committed Investor and Agent. | Current Report on Form 8-K dated September 23, 2011, File No. 001-00566 (see Exhibit 10.1 therein). | ||
| 10.28 | Formation Agreement dated as of June 14, 2010, by and among Greif, Inc. and Greif International Holding Supra C.V. and National Scientific Company Limited and Dabbagh Group Holding Company Limited. | Quarterly Report on Form 10-Q for the fiscal quarter ended July 31, 2010, File No. 001-00566 (see Exhibit 10.2 therein). | ||
| 10.29 | Joint Venture Agreement dated as of September 29, 2010, by and among Greif, Inc. and Greif International Holding Supra C.V. and Dabbagh Group Holding Company Limited and National Scientific Company Limited. | Annual Report on Form 10-K for the fiscal year ended October 31, 2010, File No. 001-00566 (see Exhibit 10(ee) therein). | ||
| 10.30 | Sale Agreement dated as of December 8, 2008, by and between Greif Packaging LLC, each other entity from time to time a party as Originator, and Greif Receivables Funding LLC. | Annual Report on Form 10-K for the fiscal year ended October 31, 2010, File No. 001-00566 (see Exhibit 10(ff) therein). | ||
96
| 10.31 | First Amendment dated as of September 30, 2010, to the Sale Agreement dated as of December 8, 2008, by and between Greif Packaging LLC, each other entity from time to time a party as Originator, and Greif Receivables Funding LLC. | Annual Report on Form 10-K for the fiscal quarter ended October 31, 2010, File No. 001-00566 (see Exhibit 10(gg) therein). | ||
| 10.32 | Master Definitions Agreement dated as of April 27, 2012, by and among Coöperatieve Centrale Raiffeisen-Boerenleenbank B.A. (trading as Rabobank International), London Branch, Coöperatieve Centrale Raiffeisen-Boerenleenbank B.A., Nieuw Amsterdam Receivables Corporation, Cooperage Receivables Finance B.V., Stichting Cooperage Receivables Finance Holding, Greif Coordination Center BVBA, Greif, Inc., the Originators as described therein and Trust International Management (T.I.M.) B.V. (Master Definitions Agreement provides definitions for agreements listed as Exhibits 10.2, 10.3 and 10.4). | Quarterly Report on Form 10-Q for the fiscal quarter ended April 30, 2012, File No. 001-00566 (see Exhibit 10.1 therein). | ||
| 10.33 | Performance and Indemnity Agreement dated as of April 27, 2012, by and among Greif, Inc., as Performance Indemnity Provider, Cooperage Receivables Finance B.V., as Main SPV, Coöperatieve Centrale Raiffeisen-Boerenleenbank B.A., as Italian Intermediary, and Coöperatieve Centrale Raiffeisen-Boerenleenbank B.A. (trading as Rabobank International), London Branch, as Committed Purchaser, Facility Agent and Funding Administrator. | Quarterly Report on Form 10-Q for the fiscal quarter ended April 30, 2012, File No. 001-00566 (see Exhibit 10.2 therein). | ||
97
| 10.34 | Nieuw Amsterdam Receivables Purchase Agreement dated as of April 27, 2012, by and among Cooperage Receivables Finance B.V., as Main SPV, Nieuw Amsterdam Receivables Corporation, as Conduit Purchaser, Greif Coordination Center BVBA, as Master Servicer, Onward Seller and Originator Agent, Coöperatieve Centrale Raiffeisen-Boerenleenbank B.A., as Italian Intermediary, and Coöperatieve Centrale Raiffeisen-Boerenleenbank B.A. (trading as Rabobank International), London Branch, as Committed Purchaser, Facility Agent and Funding Administrator. | Quarterly Report on Form 10-Q for the fiscal quarter ended April 30, 2012, File No. 001-00566 (see Exhibit 10.3 therein). | ||
| 10.35 | Subordinated Loan Agreement dated as of April 27, 2012, by and among Cooperage Receivables Finance B.V., as Main SPV, Greif Coordination Center BVBA, as Subordinated Lender, and Coöperatieve Centrale Raiffeisen-Boerenleenbank B.A. (trading as Rabobank International), London Branch, as Facility Agent, Funding Administrator and Main SPV Administrator. | Quarterly Report on Form 10-Q for the fiscal quarter ended April 30, 2012, File No. 001-00566 (see Exhibit 10.4 therein). | ||
| 10.36 | Defined Contribution Supplemental Executive Retirement Plan. | Quarterly Report on Form 10-Q for the fiscal quarter ended April 30, 2013, File No. 001-00566 (see Exhibit 10.1 therein). | ||
| 10.37 | Amended and Restated Transfer and Administration Agreement dated as of September 30, 2013, by and among Greif Receivables Funding LLC, Greif Packaging LLC, Delta Petroleum Company, Inc., American Flange & Manufacturing Co., Inc., Olympic Oil Ltd., Trilla-St. Louis Corporation, and PNC Bank, National Association, as a Committed Investor, a Managing Agent, an Administrator, and the Agent. | Annual Report on Form 10-K for the fiscal year ended October 31, 2013, File No. 001-00566 (see Exhibit 10.44 therein). | ||
| 10.38 | Amended and Restated Sale Agreement dated as of September 30, 2013, by and between Greif Packaging LLC, Delta Petroleum Company, Inc., American Flange & Manufacturing Co., Inc., Olympic Oil Ltd., Trilla-St. Louis Corporation, each other entity from time to time party as an Originator, and Greif Receivables Funding LLC. | Annual Report on Form 10-K for the fiscal year ended October 31, 2013, File No. 001-00566 (see Exhibit 10.45 therein). | ||
| 10.39 | Amendment Agreement dated April 20, 2015, by and among Coöperatieve Centrale Raiffeisen-Boerenleenbank B.A. Trading as Rabobank London, Coöperatieve Centrale Raiffeisen-Boerenleenbank B.A., Nieuw Amsterdam Receivables Corporation S. À.R.L., Cooperage Receivables Finance B.V., Stichting Cooperage Receivables Finance Holding, Greif Services Belgium BVBA, Greif, Inc., the Originators as described therein and Trust International Management (T.I.M.) B.V. (in connection with the Master Definitions Agreement dated April 27, 2012). | Quarterly Report on Form 10-Q for the fiscal quarter ended April 30, 2015, File No. 001-00566 (see Exhibit 10.1 therein). | ||
98
| 10.40 | Amendment and Restated Master Definition Agreement dated April 20, 2015, by and among Coöperatieve Centrale Raiffeisen-Boerenleenbank B.A. Trading as Rabobank London, Coöperatieve Centrale Raiffeisen-Boerenleenbank B.A., Nieuw Amsterdam Receivables Corporation S. À.R.L., Cooperage Receivables Finance B.V., Stichting Cooperage Receivables Finance Holding, Greif Services Belgium BVBA, Greif, Inc., the Originators as described therein and Trust International Management (T.I.M.) B.V. | Quarterly Report on Form 10-Q for the fiscal quarter ended April 30, 2015, File No. 001-00566 (see Exhibit 10.2 therein). | ||
| 10.41 | Amendment No. 1, dated as of December 1, 2015, to the Amended and Restated Transfer and Administration Agreement, dated as of September 30, 2013, by and among Greif Receivables Funding LLC, Greif Packaging LLC, Delta Petroleum Company, Inc., American Flange & Manufacturing Co., Inc., and Trilla-St. Louis Corporation, as originators, and PNC Bank, National Association, as a Committed Investor, Managing Agent and Administrator and the Agent. | Current Report on Form 8-K dated December 7, 2015, File No. 001-00566 (see Exhibit 10.1 therein). | ||
| 10.42 | Separation Agreement of CEO, dated as of December 4, 2015, between David Fischer and Greif Packaging LLC. | Current Report on Form 8-K dated December 7, 2015, File No. 001-00566 (see Exhibit 10.2 therein). | ||
Exhibit No. | Description of Exhibit | If Incorporated by Reference, Document with which Exhibit was Previously Filed with SEC | ||
| 21 | Subsidiaries of the Registrant. | Contained herein. | ||
| 23(a) | Consent of Deloitte & Touche LLP. | Contained herein. | ||
| 23(b) | Consent of Ernst & Young LLP. | Contained herein. | ||
| 24 | Powers of Attorney for Peter G. Watson, Lawrence A. Hilsheimer, Michael J. Gasser, Vicki L. Avril, John F. Finn, John W. McNamara, Bruce A. Edwards, Daniel J. Gunsett, Judith D. Hook, Patrick J. Norton and Mark A. Emkes. | Contained herein. | ||
| 31.1 | Certification of Chief Executive Officer Pursuant to Rule 13a-14(a) of the Securities Exchange Act of 1934. | Contained herein. | ||
| 31.2 | Certification of Chief Financial Officer Pursuant to Rule 13a-14(a) of the Securities Exchange Act of 1934. | Contained herein. | ||
| 32.1 | Certification of Chief Executive Officer required by Rule 13a-14(b) of the Securities Exchange Act of 1934 and Section 1350 of Chapter 63 of Title 18 of the United States Code. | Contained herein. | ||
99
| 32.2 | Certification of Chief Financial Officer required by Rule 13a-14(b) of the Securities Exchange Act of 1934 and Section 1350 of Chapter 63 of Title 18 of the United States Code. | Contained herein. | ||
| 101 | The following financial statements from the Company's Annual Report on Form 10-K for the year ended October 31, 2015, formatted in XBRL (Extensive Business Reporting Language): (i) Consolidated Statements of Income, (ii) Consolidate Balance Sheets, (iii) Consolidated Statements of Cash Flow, (iv) Consolidated Statements of Changes in Shareholders' Equity and (v) Notes to Consolidated Financial Statements. | Contained herein. | ||
| * | Executive compensation plans and arrangements required to be filed pursuant to Item 601(b)(10) of Regulation S-K. |
100
SIGNATURES
Pursuant to the requirements of Section 13 or 15(d) of the Securities Exchange Act of 1934, the Company has duly caused this report to be signed on its behalf by the undersigned, thereunto duly authorized.
| Greif, Inc. | ||||||||
| (Registrant) | ||||||||
| Date: | December 21, 2015 | By: | /s/ PETER G. WATSON | |||||
| Peter G. Watson | ||||||||
| President and | ||||||||
| Chief Executive Officer | ||||||||
Pursuant to the requirements of the Securities Exchange Act of 1934, this report has been signed below by the following persons on behalf of the Company and in the capacities and on the dates indicated.
| /s/ PETER G. WATSON | /s/ LAWRENCE A. HILSHEIMER | |||
| Peter G. Watson | Lawrence A. Hilsheimer | |||
| President and Chief Executive Officer | Executive Vice President and Chief Financial Officer | |||
| Member of the Board of Directors | (principal financial officer) | |||
| (principal executive officer) | ||||
| VICKI L. AVRIL* | /s/ DAVID C. LLOYD | |||
| Vicki L. Avril | David C. Lloyd | |||
| Member of the Board of Directors | Vice President, Corporate Financial Controller | |||
| (principal accounting officer) | ||||
| JOHN W. MCNAMARA* | MICHAEL J. GASSER* | |||
| John W. McNamara | Michael J. Gasser | |||
| Member of the Board of Directors | Chairman | |||
| Member of the Board of Directors | ||||
| DANIEL J. GUNSETT* | JOHN F. FINN* | |||
| Daniel J. Gunsett | John F. Finn | |||
| Member of the Board of Directors | Member of the Board of Directors | |||
| PATRICK J. NORTON* | BRUCE A. EDWARDS* | |||
| Patrick J. Norton | Bruce A. Edwards | |||
| Member of the Board of Directors | Member of the Board of Directors | |||
| MARK A. EMKES* | JUDITH D. HOOK* | |||
| Mark A. Emkes | Judith D. Hook | |||
| Member of the Board of Directors | Member of the Board of Directors | |||
| * | The undersigned, Peter G. Watson, by signing his name hereto, does hereby execute this Form 10-K on behalf of each of the above-named persons pursuant to powers of attorney duly executed by such persons and filed as an exhibit to this Form 10-K. |
| By: | /s/ PETER G. WATSON | |
| Peter G Watson | ||
| President and | ||
| Chief Executive Officer | ||
Each of the above signatures is affixed as of December 21, 2015.
101
SCHEDULE II
GREIF, INC. AND SUBSIDIARY COMPANIES
Consolidated Valuation and Qualifying Accounts and Reserves (Dollars in millions)
| Description | Balance at Beginning of Period | Charged to Costs and Expenses | Charged to Other Accounts | Deductions | Balance at End of Period | |||||||||||||||
Year ended October 31, 2013: | ||||||||||||||||||||
Allowance for doubtful accounts | $ | 17.1 | $ | 3.8 | $ | (7.4 | ) | $ | - | $ | 13.5 | |||||||||
Environmental reserves | $ | 27.5 | $ | 2.6 | $ | (3.9 | ) | $ | 0.6 | $ | 26.8 | |||||||||
Year ended October 31, 2014: | ||||||||||||||||||||
Allowance for doubtful accounts | $ | 13.5 | $ | 7.5 | $ | (4.2 | ) | $ | - | $ | 16.8 | |||||||||
Environmental reserves | $ | 26.8 | $ | 0.7 | $ | (2.0 | ) | $ | (0.8 | ) | $ | 24.7 | ||||||||
Year ended October 31, 2015: | ||||||||||||||||||||
Allowance for doubtful accounts | $ | 16.8 | $ | 0.2 | $ | (3.7 | ) | $ | (1.5 | ) | $ | 11.8 | ||||||||
Environmental reserves | $ | 24.7 | $ | 1.7 | $ | (16.8 | ) | $ | (1.4 | ) | $ | 8.2 | ||||||||
102