United States Securities and Exchange Commission
WASHINGTON, D.C. 20549
FORM 10-K
(Mark One) |
☑ Annual Report Pursuant to Section 13 or 15(d) of the Securities Exchange Act of 1934 |
|
For the fiscal year ended December 31, 2017 |
or |
¨ Transition Report pursuant to Section 13 or 15(d) of the Securities Exchange Act of 1934 |
|
For the transition period from ___________to ___________ |
|
Commission file number 001-00035 |
 |
General Electric Company(Exact name of registrant as specified in charter) |
New York |
|
|
| 14-0689340 |
(State or other jurisdiction of incorporation or organization) |
|
|
| (I.R.S. Employer Identification No.) |
|
|
|
|
|
41 Farnsworth Street, Boston, MA |
| 02210 |
| (617) 443-3000 |
(Address of principal executive offices) |
| (Zip Code) |
| (Telephone No.) |
|
|
|
|
|
Securities Registered Pursuant to Section 12(b) of the Act: | ||||
Title of each class |
| Name of each exchange on which registered | ||
Common stock, par value $0.06 per share |
| New York Stock Exchange | ||
Securities Registered Pursuant to Section 12(g) of the Act: |
|
(Title of class) |
Indicate by check mark if the registrant is a well-known seasoned issuer, as defined in Rule 405 of the Securities Act. Yes ☑ No ¨
Indicate by check mark if the registrant is not required to file reports pursuant to Section 13 or Section 15(d) of the Act. Yes ¨ No ☑
Indicate by check mark whether the registrant (1) has filed all reports required to be filed by Section 13 or 15(d) of the Securities Exchange Act of 1934 during the preceding 12 months (or for such shorter period that the registrant was required to file such reports), and (2) has been subject to such filing requirements for the past 90 days. Yes ☑ No ¨
Indicate by check mark whether the registrant has submitted electronically and posted on its corporate Web site, if any, every Interactive Data File required to be submitted and posted pursuant to Rule 405 of Regulation S-T during the preceding 12 months (or for such shorter period that the registrant was required to submit and post such files). Yes ☑ No ¨
Indicate by check mark if disclosure of delinquent filers pursuant to Item 405 of Regulation S-K is not contained herein, and will not be contained, to the best of registrant's knowledge, in definitive proxy or information statements incorporated by reference in Part III of this Form 10-K or any amendment to this Form 10‑K. ¨
Indicate by check mark whether the registrant is a large accelerated filer, an accelerated filer, a non-accelerated filer, a smaller reporting company or an emerging growth company. See definitions of "large accelerated filer," "accelerated filer," "smaller reporting company" and "emerging growth company" in Rule 12b-2 of the Exchange Act. (Check one):
Large accelerated filer ☑ | Accelerated filer ¨ |
Non-accelerated filer ¨ | Smaller reporting company ¨ |
Emerging growth company ¨ |
|
If an emerging growth company, indicate by check mark if the registrant has elected not to use the extended transition period for complying with any new or revised financial accounting standards provided pursuant to Section 13(a) of the Exchange Act. ¨
Indicate by check mark whether the registrant is a shell company (as defined in Rule 12b-2 of the Act). Yes ¨ No ☑
The aggregate market value of the outstanding common equity of the registrant not held by affiliates as of the last business day of the registrant's most recently completed second fiscal quarter was at least $231.5 billion . There were 8,682,576,000 shares of voting common stock with a par value of $0.06 outstanding at January 31, 2018 .
DOCUMENTS INCORPORATED BY REFERENCE
The definitive proxy statement relating to the registrant's Annual Meeting of Shareowners, to be held April 25, 2018, is incorporated by reference into Part III to the extent described therein.
TABLE OF CONTENTS
| Page |
|
|
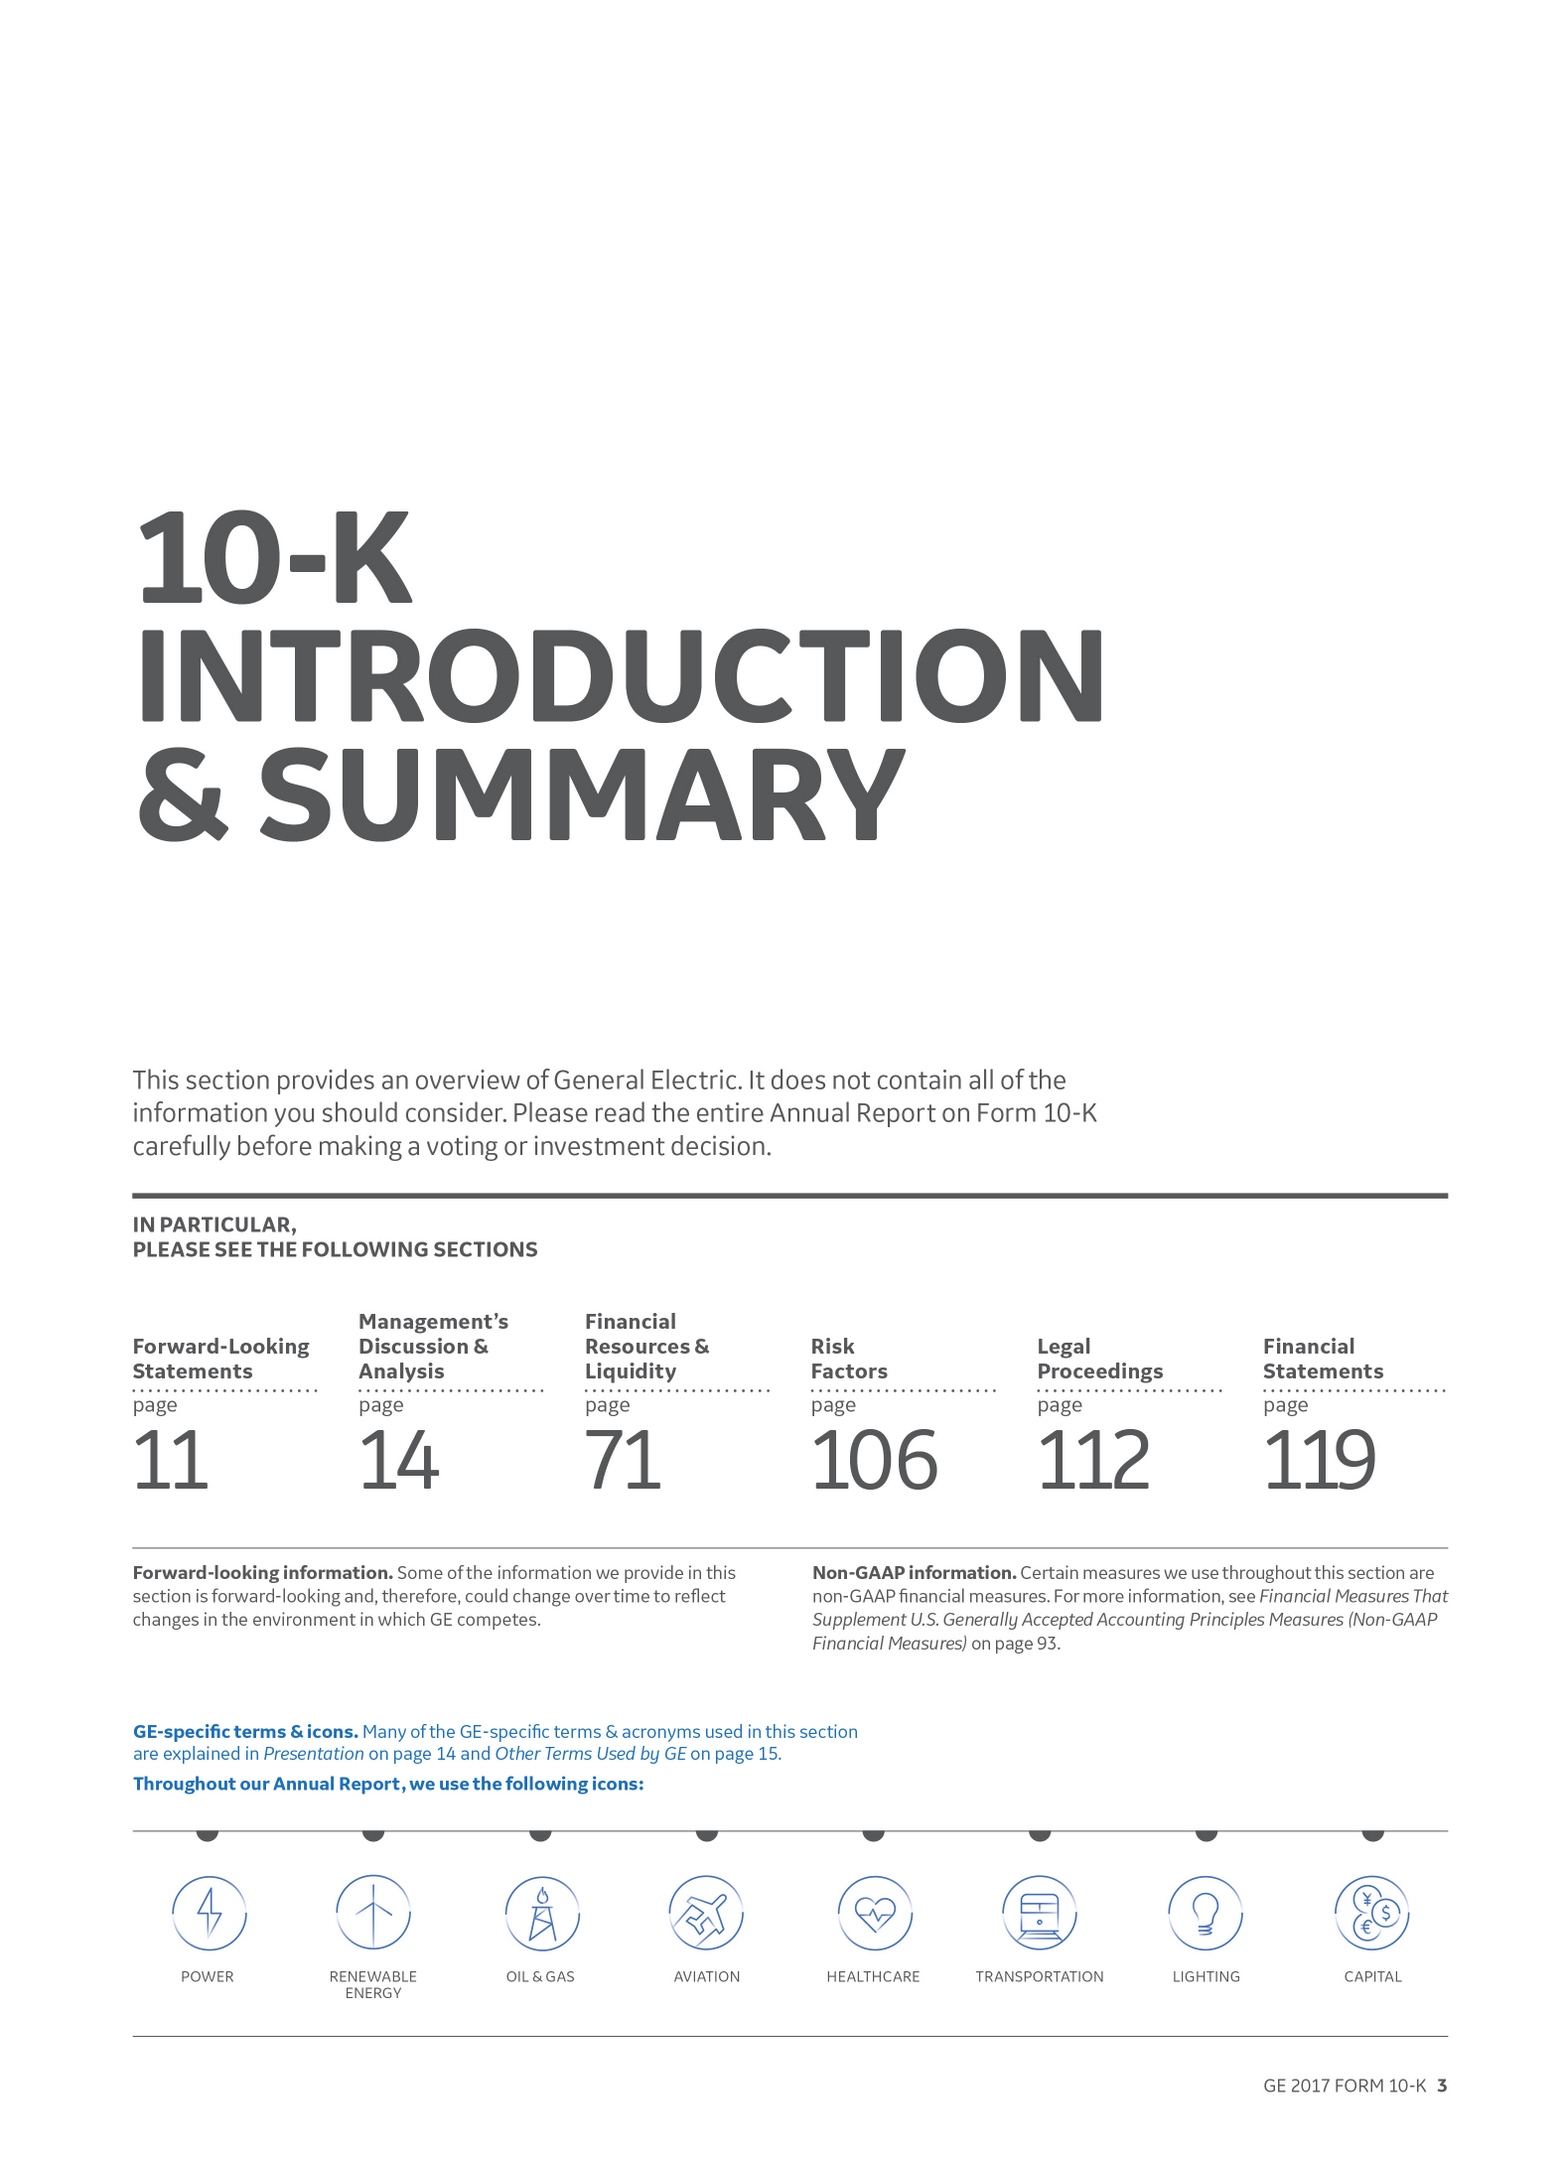
10-K Introduction & Summary | 3 |
Forward Looking Statements | 11 |
About General Electric | 12 |
Management's Discussion and Analysis of Financial Condition and Results of Operations (MD&A) | 14 |
Key Performance Indicators | 18 |
Consolidated Results | 20 |
Segment Operations | 25 |
GE Corporate Items and Eliminations | 58 |
Other Consolidated Information | 62 |
Statement of Financial Position | 69 |
Financial Resources and Liquidity | 71 |
Critical Accounting Estimates | 82 |
Other Items | 89 |
Supplemental Information | 93 |
Other Financial Data | 104 |
Risk Factors | 106 |
Legal Proceedings | 112 |
Management and Auditor's Reports | 115 |
Audited Financial Statements and Notes | 119 |
Directors, Executive Officers and Corporate Governance | 200 |
Exhibits and Financial Statement Schedules | 201 |
Form 10-K Cross Reference Index | 205 |
Signatures | 206 |

See "Key Performance Indicators" section on page 18 and "Consolidated Results" section on page 20
See "2017 Significant Developments" section on page 20 and "Supplemental Information" section on page 93

See "Segment Operations" section on page 25
See "Segment Operations" section on page 25
See "Segment Operations" section on page 25
See "GE Corporate Items & Eliminations" section on page 58 , "Financial Resources & Liquidity" section on page 71 and "Other Items" section on page 89
See "Risk Factors" section on page 106
FORWARD LOOKING STATEMENTS |
|
|
FORWARD LOOKING STATEMENTS
Our public communications and SEC filings may contain "forward-looking statements" - that is, statements related to future, not past, events. In this context, forward-looking statements often address our expected future business and financial performance and financial condition, and often contain words such as "expect," "anticipate," "intend," "plan," "believe," "seek," "see," "will," "would," "estimate," "forecast," "target," "preliminary," or "range."
Forward-looking statements by their nature address matters that are, to different degrees, uncertain, such as statements about our intention to exit $20 billion or more of assets in 2018 and 2019; charges and capital contributions that may be required in connection with GE Capital's run-off insurance operations, and related GE Capital portfolio actions; revenues; organic growth; cash flows and cash conversion, including the impact of working capital, contract assets and pension funding contributions; earnings per share, including the impact of the new revenue recognition accounting standard; growth and productivity associated with our Digital and Additive businesses; profit margins; cost structure and plans to reduce costs; restructuring, goodwill impairment or other financial charges; tax rates; transaction-related synergies, proceeds and gains; returns on capital and investment; capital allocation, including liquidity, organic investment, dividends and other priorities; or capital structure and access to funding, including credit ratings, debt-to-earnings ratios and leverage.
For us, particular uncertainties that could cause our actual results to be materially different than those expressed in our forward-looking statements include:
• | our execution of Industrial and GE Capital business or asset dispositions, including sale prices, the timing of disposition proceeds and potential trailing liabilities, as well as our ongoing portfolio review; |
• | the amount and timing of our Industrial cash flows and earnings, which may be impacted by customer, competitive, contractual and other dynamics and conditions; |
• | our capital allocation plans, as such plans may change including with respect to the timing and amount of GE dividends, organic investments, including research and development, investments in Digital and capital expenditures, pension funding contributions, acquisitions, joint ventures and other strategic actions; |
• | our ability to maintain our current short- and long-term credit ratings and the impact on our funding costs and competitive position if we do not do so; |
• | customer actions or market developments such as reduced demand for equipment and services in our Power business as a result of increased market penetration by renewables, shifts in the competitive landscape for our products and services, changes in economic conditions, including oil prices, early aircraft retirements and other factors that may affect the level of demand and financial performance of the major industries and customers we serve; |
• | changes in law, economic and financial conditions, including the enactment of tax reform or other tax law changes, interest and exchange rate volatility, commodity and equity prices and the value of financial assets; |
• | the impact of conditions in the financial and credit markets on GE Capital's ability to sell financial assets, the availability and cost of GE Capital funding and GE Capital's exposure to counterparties; |
• | pending and future mortgage loan repurchase claims, other litigation claims and the U.S. Department of Justice's investigation under the Financial Institutions Reform, Recovery and Enforcement Act of 1989 and other investigations in connection with WMC, which may affect our estimates of liability, including possible loss estimates; |
• | our ability to launch new products in a cost-effective manner; |
• | our ability to increase margins through restructuring and other cost reduction measures; |
• | our ability to convert pre-order commitments/wins into orders/bookings; |
• | the price we realize on orders/bookings since commitments/wins are stated at list prices; |
• | the impact of regulation and regulatory, investigative and legal proceedings and legal compliance risks, including the impact of WMC, Alstom and other investigative and legal proceedings; |
• | our success in completing, including obtaining regulatory approvals and satisfying other closing conditions for, announced transactions, such as our plans to sell our Industrial Solutions business, the substantial majority of our Lighting segment or other dispositions that we may pursue; |
• | our success in integrating acquired businesses and operating joint ventures, and our ability to realize revenue and cost synergies from announced transactions, acquired businesses and joint ventures, including Alstom and Baker Hughes, a GE company (BHGE); |
• | the impact of potential information technology, cybersecurity or data security breaches; |
• | the other factors that are described in "Forward-Looking Statements" in Baker Hughes, a GE company's, most recent earnings release or SEC filing; and |
• | the other factors that are described in the Risk Factors section of this Form 10-K report. |
These or other uncertainties may cause our actual future results to be materially different than those expressed in our forward-looking statements. We do not undertake to update our forward-looking statements. This document includes certain forward-looking projected financial information that is based on current estimates and forecasts. Actual results could differ materially.
GE 2017 FORM 10-K 11
ABOUT GENERAL ELECTRIC |
| |
ABOUT GENERAL ELECTRIC
OUR BUSINESS AND HOW WE TALK ABOUT IT
We are a global digital industrial company, transforming industry with software-defined machines and solutions that are connected, responsive and predictive. With products and services ranging from aircraft engines, power generation and oil and gas production equipment to medical imaging, financing and industrial products, we serve customers in over 180 countries and employ approximately 313,000 people worldwide. Since our incorporation in 1892, we have developed or acquired new technologies and services that have considerably broadened and changed the scope of our activities.
OUR INDUSTRIAL OPERATING SEGMENTS
 | Power (a) |  | Aviation |  | Lighting (a) |
 | Renewable Energy |  | Healthcare |
|
|
 | Oil & Gas (b) | Transportation |
|
| |
OUR FINANCIAL SERVICES OPERATING SEGMENT
 | Capital |
(a) | Beginning in the third quarter of 2017, the Energy Connections business within the former Energy Connections & Lighting segment was combined with the Power segment and presented as one reporting segment called Power. As a result of this combination, our GE Lighting and Current, powered by GE (Current) businesses are now reported as a separate segment called Lighting. |
(b) | Beginning in the third quarter of 2017, our Oil & Gas segment is comprised of our ownership interest of approximately 62.5% in BHGE. We consolidate 100% of BHGE's revenues and cash flows, while our Oil & Gas segment profit and net income are derived net of minority interest of approximately 37.5% attributable to BHGE's Class A shareholders. |
Business, operation and financial overviews for our operating segments are provided in the Segment Operations section within the Management's Discussion and Analysis of Financial Condition and Results of Operations (MD&A) section.
COMPETITIVE CONDITIONS AND ENVIRONMENT
In all of our global business activities, we encounter aggressive and able competition. In many instances, the competitive climate is characterized by changing technology that requires continuing research and development. With respect to manufacturing operations, we believe that, in general, we are one of the leading firms in most of the major industries in which we participate. The businesses in which GE Capital engages are subject to competition from various types of financial institutions.
As a diverse global company, we are affected by world economies, instability in certain regions, commodity prices, such as the price of oil, foreign currency volatility and policies regarding trade and imports. Other factors impacting our business include:
• | product development cycles for many of our products are long and product quality and efficiency are critical to success, |
• | research and development expenditures are important to our business, |
• | many of our products are subject to a number of regulatory standards and |
• | changing end markets, including shifts in energy sources and demand and the impact of technology changes. |
These factors are discussed throughout MD&A.
12 GE 2017 FORM 10-K
ABOUT GENERAL ELECTRIC |
| |
OUR EMPLOYEES AND EMPLOYEE RELATIONS
At year-end 2017 , General Electric Company and consolidated affiliates employed approximately 313,000 persons, of whom approximately 106,000 were employed in the United States.
Approximately 8,600 GE manufacturing and service employees in the United States are represented for collective bargaining purposes by one of 9 unions (approximately 41 different locals within such unions). A majority of such employees are represented by union locals that are affiliated with the IUE-CWA, The Industrial Division of the Communication Workers of America, AFL-CIO, CLC. In June 2015, we negotiated new four-year collective bargaining agreements with most of our U.S. unions. These agreements continue to provide employees with good wages and benefits while addressing competitive realities facing the Company.
Other GE affiliates are parties to labor contracts with various labor unions, also with varying terms and expiration dates that cover approximately 1,700 employees.
PROPERTIES
Manufacturing operations are carried out at 191 manufacturing plants located in 38 states in the United States and Puerto Rico and at 348 manufacturing plants located in 43 other countries.
CORPORATE INFORMATION AND WEBSITES
General Electric's address is 1 River Road, Schenectady, NY 12345-6999; we also maintain executive offices at 41 Farnsworth Street, Boston, MA 02210.
GE's Internet address at www.ge.com , Investor Relations website at www.ge.com/investor-relations and our corporate blog at www.gereports.com , as well as GE's Facebook page, Twitter accounts and other social media, including @GE_Reports, contain a significant amount of information about GE, including financial and other information for investors. GE encourages investors to visit these websites from time to time, as information is updated and new information is posted.
Additional information on non-financial matters, including environmental and social matters and our integrity policies, is available in GE's Integrated Summary Report and at www.ge.com/sustainability .
Website references in this report are provided as a convenience and do not constitute, and should not be viewed as, incorporation by reference of the information contained on, or available through, the websites. Therefore, such information should not be considered part of this report.
Our annual report on Form 10-K, quarterly reports on Form 10-Q, current reports on Form 8-K, and amendments to those reports are available, without charge, on our website, www.ge.com/investor-relations/events-reports , as soon as reasonably practicable after they are filed electronically with the U.S. Securities and Exchange Commission (SEC). Copies are also available, without charge, from GE Corporate Investor Communications, 41 Farnsworth Street, Boston, MA 02210.
Reports filed with the SEC may be viewed at www.sec.gov or obtained at the SEC Public Reference Room in Washington, D.C. Information about the operation of the Public Reference Room may be obtained by calling the SEC at 1-800-SEC-0330.
GE 2017 FORM 10-K 13
MD&A |
|
|
MANAGEMENT'S DISCUSSION AND ANALYSIS OF FINANCIAL CONDITION AND RESULTS OF OPERATIONS (MD&A)
PRESENTATION
The consolidated financial statements of General Electric Company (the Company) combine the industrial manufacturing and services businesses of General Electric Company (GE) with the financial services businesses of GE Capital Global Holdings, LLC (GE Capital or Financial Services) and its predecessor, General Electric Capital Corporation.
We believe that investors will gain a better understanding of our company if they understand how we measure and talk about our results. Because of the diversity in our businesses, we present our financial statements in a three-column format, which allows investors to see our industrial operations separately from our Financial Services operations. We believe that this provides useful information to investors. When used in this report, unless otherwise indicated by the context, we use the terms to mean the following:
• | General Electric or the Company – the parent company, General Electric Company. |
• | GE – the adding together of all affiliates except GE Capital, whose continuing operations are presented on a one-line basis, giving effect to the elimination of transactions among such affiliates. As GE presents the continuing operations of GE Capital on a one-line basis, certain intercompany profits resulting from transactions between GE and GE Capital have been eliminated at the GE level. We present the results of GE in the center column of our consolidated statements of earnings, financial position and cash flows. An example of a GE metric is GE cash from operating activities (GE CFOA). |
• | General Electric Capital Corporation or GECC – predecessor to GE Capital Global Holdings, LLC. |
• | GE Capital Global Holdings, LLC or GECGH – the adding together of all affiliates of GECGH, giving effect to the elimination of transactions among such affiliates. |
• | GE Capital or Financial Services – refers to GECGH, or its predecessor GECC, and is the adding together of all affiliates of GE Capital giving effect to the elimination of transactions among such affiliates. We present the results of GE Capital in the right-side column of our consolidated statements of earnings, financial position and cash flows. |
• | GE consolidated – the adding together of GE and GE Capital, giving effect to the elimination of transactions between the two. We present the results of GE consolidated in the left-side column of our consolidated statements of earnings, financial position and cash flows. |
• | GE Industrial – GE excluding the continuing operations of GE Capital. We believe that this provides investors with a view as to the results of our industrial businesses and corporate items. An example of a GE Industrial metric is GE Industrial CFOA (Non-GAAP), as defined in Other Terms Used by GE below. |
• | Industrial segment – the sum of our seven industrial reporting segments, without giving effect to the elimination of transactions among such segments and between these segments and our Financial Services segment. This provides investors with a view as to the results of our industrial segments, without inter-segment eliminations and corporate items. An example of an industrial segment metric is industrial segment revenue growth. |
• | Baker Hughes, a GE company or BHGE - following the combination of our Oil & Gas business with Baker Hughes Incorporated, our Oil & Gas segment is comprised of our ownership interest of approximately 62.5% in the new company formed in the transaction, Baker Hughes, a GE Company (BHGE). We consolidate 100% of BHGE's revenues and cash flows, while our Oil & Gas segment profit and net income are derived net of minority interest of approximately 37.5% attributable to BHGE's Class A shareholders. References to "Baker Hughes" represent legacy Baker Hughes Incorporated operating activities which, in certain cases, have been excluded from our results for comparative purposes. |
• | Total segment – the sum of our seven industrial segments and one financial services segment, without giving effect to the elimination of transactions between such segments. This provides investors with a view as to the results of all of our segments, without inter-segment eliminations and corporate items. |
• | Verticals or GE Capital Verticals – the adding together of GE Capital businesses, principally its vertical financing businesses-GE Capital Aviation Services (GECAS), Energy Financial Services (EFS) and Industrial Finance (which includes Healthcare Equipment Finance, Working Capital Solutions and Industrial Financing Solutions)-that relate to the Company's core industrial domain and other operations, including our run-off insurance operations, and allocated corporate costs. |
14 GE 2017 FORM 10-K
MD&A |
|
|
We integrate acquisitions as quickly as possible. Revenues and earnings from the date we complete the acquisition through the end of the fourth quarter following the acquisition are considered the acquisition effect of such businesses.
Amounts reported in billions in graphs within this report are computed based on the amounts in millions. As a result, the sum of the components reported in billions may not equal the total amount reported in billions due to rounding. Certain columns and rows within the tables may not add due to the use of rounded numbers. Percentages presented are calculated from the underlying numbers in millions.
Discussions throughout this MD&A are based on continuing operations unless otherwise noted.
The MD&A should be read in conjunction with the Financial Statements and Notes to the consolidated financial statements.
OTHER TERMS USED BY GE
• | Backlog – unfilled customer orders for products and product services (expected life of contract sales for product services). |
• | Borrowings as a percentage of total capital invested – for GE, the sum of borrowings and mandatorily redeemable preferred stock, divided by the sum of borrowings, mandatorily redeemable preferred stock, redeemable noncontrolling interest, noncontrolling interests and total shareowners' equity. |
• | Continuing earnings – we refer to the caption "earnings from continuing operations attributable to GE common shareowners" as continuing earnings. |
• | Continuing earnings per share (EPS) – when we refer to continuing earnings per share, it is the diluted per-share amount of "earnings from continuing operations attributable to GE common shareowners." |
• | Digital revenues – revenues related to internally developed software (including Predix TM ) and associated hardware, and software solutions that improve our customers' asset performance. In 2016, we reassessed the span of our digital product offerings, which now excludes software-enabled product upgrades. These revenues are largely generated from our operating businesses and are included in their segment results. Revenues of "Non-GE Verticals" refer to GE Digital revenues from customers operating in industries where GE does not have a presence. |
• | Equipment leased to others (ELTO) – rental equipment we own that is available to rent and is stated at cost less accumulated depreciation. |
• | GE Capital Exit Plan - our plan, announced on April 10, 2015, to reduce the size of our financial services businesses through the sale of most of the assets of GE Capital, and to focus on continued investment and growth in our industrial businesses. |
• | GE Industrial CFOA (Non-GAAP) – GE CFOA excluding the effects of dividends from GE Capital. Adjusted GE Industrial CFOA (Non-GAAP) is GE Industrial CFOA excluding deal-related taxes, GE Pension Plan funding and Oil & Gas CFOA, and including dividends received from BHGE. |
• | GE Industrial free cash flow (Non-GAAP) – Adjusted GE Industrial CFOA (Non-GAAP) adjusted for gross GE additions to property, plant and equipment and internal-use software, which are included in cash flows from investing activities, and excluding gross Oil & Gas additions to property, plant and equipment and internal-use software. |
• | GE Industrial margin – GE revenues and other income excluding GE Capital earnings (loss) from continuing operations (GE Industrial revenues) minus GE total costs and expenses less GE interest and other financial charges divided by GE Industrial revenues. |
• | GE Industrial operating profit margin (Non-GAAP) – Industrial segment profit plus corporate items and eliminations (excluding gains, restructuring, and pre-tax non-operating pension cost) divided by industrial segment revenues plus corporate items and eliminations (excluding gains and GE-GE Capital eliminations). |
• | GE Industrial return on total capital (GE Industrial ROTC) (Non-GAAP) – earnings from continuing operations attributable to GE common shareowners less GE Capital earnings from continuing operations plus GE after-tax interest, divided by average GE shareowners' equity, less average GE Capital's shareowners' equity, plus average debt and other, net. |
• | GE Industrial structural costs (Non-GAAP) – Industrial structural costs include segment structural costs excluding the impact of business acquisitions and dispositions, plus total Corporate operating profit excluding pre-tax non-operating pension cost, restructuring and other charges and gains. |
• | GE shareowners' equity and GE Capital shareowner's equity – for purposes of the GE Industrial ROTC calculation excludes the effects of discontinued operations and is calculated on an annual basis using a five-point average. |
• | Global Growth Organization (GGO ) – The GGO provides leadership in global markets, particularly within emerging and developing markets. The organization creates and identifies cross-business commercial opportunities and collaborates with businesses to capitalize on them. The GGO is heavily involved in government advocacy, shaping policy and regulation. Additionally, the GGO provides regional commercial finance capabilities and customer financing solutions, in collaboration with certain of our GE Capital businesses, and works to build the GE brand and protect GE's reputation. |
• | Net earnings – we refer to the caption "net earnings attributable to GE common shareowners" as net earnings. |
GE 2017 FORM 10-K 15
MD&A |
|
|
• | Net earnings per share (EPS) – when we refer to net earnings per share, it is the diluted per-share amount of "net earnings attributable to GE common shareowners." |
• | Non-operating pension cost (Non-GAAP) – comprises the expected return on plan assets, interest cost on benefit obligations and net actuarial gain (loss) amortization for our principal pension plans. |
• | Operating earnings (Non-GAAP) – GE earnings from continuing operations attributable to common shareowners excluding the impact of non-operating pension cost. |
• | Operating earnings per share (Non-GAAP) – when we refer to operating earnings per share, it is the diluted per-share amount of "operating earnings." |
• | Operating pension cost (Non-GAAP) – comprises the service cost of benefits earned, prior service cost amortization and curtailment gain (loss) for our principal pension plans. |
• | Organic revenues (Non-GAAP) – revenues excluding the effects of acquisitions, dispositions and translational foreign currency exchange. |
• | Product services agreements – contractual commitments, with multiple-year terms, to provide specified services for products in our Power, Renewable Energy, Oil & Gas, Aviation and Transportation installed base – for example, monitoring, maintenance, service and spare parts for a gas turbine/generator set installed in a customer's power plant. |
• | Revenues – revenues comprise sales of goods, sales of services and other income for our industrial businesses and GE Capital revenues from services for our financial services businesses. |
• | Segment profit – refers to the operating profit of the industrial segments and the net earnings of the Financial Services segment. See the Segment Operations section within the MD&A for a description of the basis for segment profits. |
• | Services – for purposes of the financial statement display of sales and costs of sales in our Statement of Earnings (Loss), "goods" is required by SEC regulations to include all sales of tangible products, and "services" must include all other sales, including other services activities. In our MD&A section of this report, we refer to sales under product services agreements and sales of both goods (such as spare parts and equipment upgrades) and related services (such as monitoring, maintenance and repairs) as sales of "services," which is an important part of our operations. |
• | Shared Services – sharing of business processes in order to standardize and consolidate services to provide value to the businesses in the form of simplified processes, reduced overall costs and increased service performance. |
16 GE 2017 FORM 10-K
MD&A |
|
|
NON-GAAP FINANCIAL MEASURES
In the accompanying analysis of financial information, we sometimes use information derived from consolidated financial data but not presented in our financial statements prepared in accordance with U.S. generally accepted accounting principles (GAAP). Certain of these data are considered "non-GAAP financial measures" under the SEC rules. Specifically, we have referred, in various sections of this report, to:
• | Industrial segment organic revenues |
• | Industrial segment organic operating profit |
• | Operating and non-operating pension cost |
• | GE Industrial structural costs and GE Industrial structural costs, excluding acquisitions and dispositions |
• | GE pre-tax earnings (loss) from continuing operations, excluding GE Capital earnings (loss) from continuing operations and the corresponding effective tax rates, and the reconciliation of the U.S. federal statutory income tax rate to GE effective tax rate, excluding GE Capital earnings |
• | GE Industrial operating earnings and GE Capital earnings (loss) from continuing operations and EPS |
• | GE Industrial operating + Verticals earnings and EPS |
• | GE Industrial operating profit and operating profit margin (excluding certain items) |
• | Average GE shareowners' equity, excluding effects of discontinued operations |
• | Average GE Capital shareowner's equity, excluding effects of discontinued operations |
• | GE Industrial return on total capital (GE Industrial ROTC) |
• | GE Industrial cash flows from operating activities (GE Industrial CFOA), adjusted GE Industrial CFOA and GE Industrial free cash flow (FCF) |
• | 2018 operating framework including 2018 Adjusted EPS and GE Industrial free cash flow |
The reasons we use these non-GAAP financial measures and the reconciliations to their most directly comparable GAAP financial measures are included in the Supplemental Information section within the MD&A. Non-GAAP financial measures referred to in this report are either labeled as "non-GAAP" or designated as such with an asterisk (*).
GE 2017 FORM 10-K 17
MD&A | KEY PERFORMANCE INDICATORS |
|
KEY PERFORMANCE INDICATORS
REVENUES PERFORMANCE |
|
| ||
| 2017 | | 2016 | |
Industrial Segment | 3 | % | 4 | % |
Industrial Segment Organic (Non-GAAP)(a) | - | % | (1)% / 1% | |
Financial Services | (17 | )% | 1 | % |
(a) Included the results of Alstom for November and December of both 2016 and 2015.
GE INDUSTRIAL ORDERS AND BACKLOG |
|
|
| ||||||
(Dollars in billions) | 2017 | | 2016 | | 2015 | | |||
|
|
|
| ||||||
Orders |
|
|
| ||||||
Equipment | $ | 58.2 | | $ | 55.2 | | $ | 56.5 | |
Services | 60.6 | | 55.7 | | 49.5 | | |||
Total(a) | $ | 118.8 | | $ | 110.9 | | $ | 105.9 | |
|
|
|
| ||||||
Backlog |
|
|
| ||||||
Equipment | $ | 84.7 | | $ | 84.1 | | $ | 88.6 | |
Services | 256.7 | | 236.8 | | 225.9 | | |||
Total | $ | 341.3 | | $ | 320.9 | | $ | 314.5 | |
(a) Included $5.2 billion related to Baker Hughes in 2017.
GE INDUSTRIAL COSTS |
|
| ||||
(Dollars in billions) | 2017 | | 2016 | | ||
|
|
| ||||
GE Industrial costs excluding interest and financial charges (GAAP) | $ | 108.3 | | $ | 101.8 | |
GE Industrial structural costs, excluding business development activity (Non-GAAP) | 23.0 | | 24.7 | | ||
GE INDUSTRIAL MARGINS (GAAP) AND GE INDUSTRIAL OPERATING PROFIT MARGINS (NON-GAAP) | ||||||
(Dollars in billions) | 2017 | | 2016 | | 2015 | |
|
|
|
| |||
GE Industrial margins (GAAP) | 5.7 | % | 11.4 | % | 11.7 | % |
GE Industrial operating profit margins (Non-GAAP)(a) | 12.1 | % | 14.0 | % | 14.8 | % |
(a) | Excluded gains on disposals, non-operating pension cost, restructuring and other charges, noncontrolling interests and GE Capital preferred stock dividends |
EARNINGS | |||||||||
(Dollars in billions; per-share amounts in dollars) | 2017 | | 2016 | | 2015 | | |||
|
|
|
| ||||||
Continuing earnings (loss) (GAAP) | $ | (5.9 | ) | $ | 9.1 | | $ | 1.7 | |
Net earnings (loss) (GAAP) | (6.2 | ) | 8.2 | | (6.1 | ) | |||
Operating earnings (loss) (Non-GAAP) | (4.4 | ) | 10.5 | | 3.5 | | |||
GE Industrial operating + verticals earnings (loss) (Non-GAAP) | (3.9 | ) | 13.6 | | 13.1 | | |||
|
|
|
| ||||||
Continuing earnings (loss) per share (GAAP) | $ | (0.68 | ) | $ | 1.00 | | $ | 0.17 | |
Net earnings (loss) per share (GAAP) | (0.72 | ) | 0.89 | | (0.61 | ) | |||
Operating earnings (loss) per share (Non-GAAP) | (0.51 | ) | 1.14 | | 0.35 | | |||
GE Industrial operating + verticals earnings (loss) per share (Non-GAAP) | (0.45 | ) | 1.49 | | 1.31 | | |||
GE CFOA AND GE INDUSTRIAL FREE CASH FLOW (NON-GAAP) |
|
|
| ||||||
(Dollars in billions) | 2017 | | 2016 | | 2015 | | |||
|
|
|
| ||||||
GE CFOA (GAAP)(a) | $ | 11.0 | | $ | 30.0 | | $ | 16.4 | |
GE Industrial CFOA (Non-GAAP)(a) | 7.0 | | 9.9 | | 12.1 | | |||
Adjusted Industrial CFOA (Non-GAAP) | 9.7 | | 11.6 | | 12.2 | | |||
GE Industrial free cash flow (Non-GAAP) | 5.6 | | 7.1 | | 7.7 | | |||
(a) | Included $0.5 billion related to Baker Hughes in 2017. |
18 GE 2017 FORM 10-K
MD&A | KEY PERFORMANCE INDICATORS |
|
KEY PERFORMANCE INDICATORS
(Dollars in billions; per-share amounts in dollars)
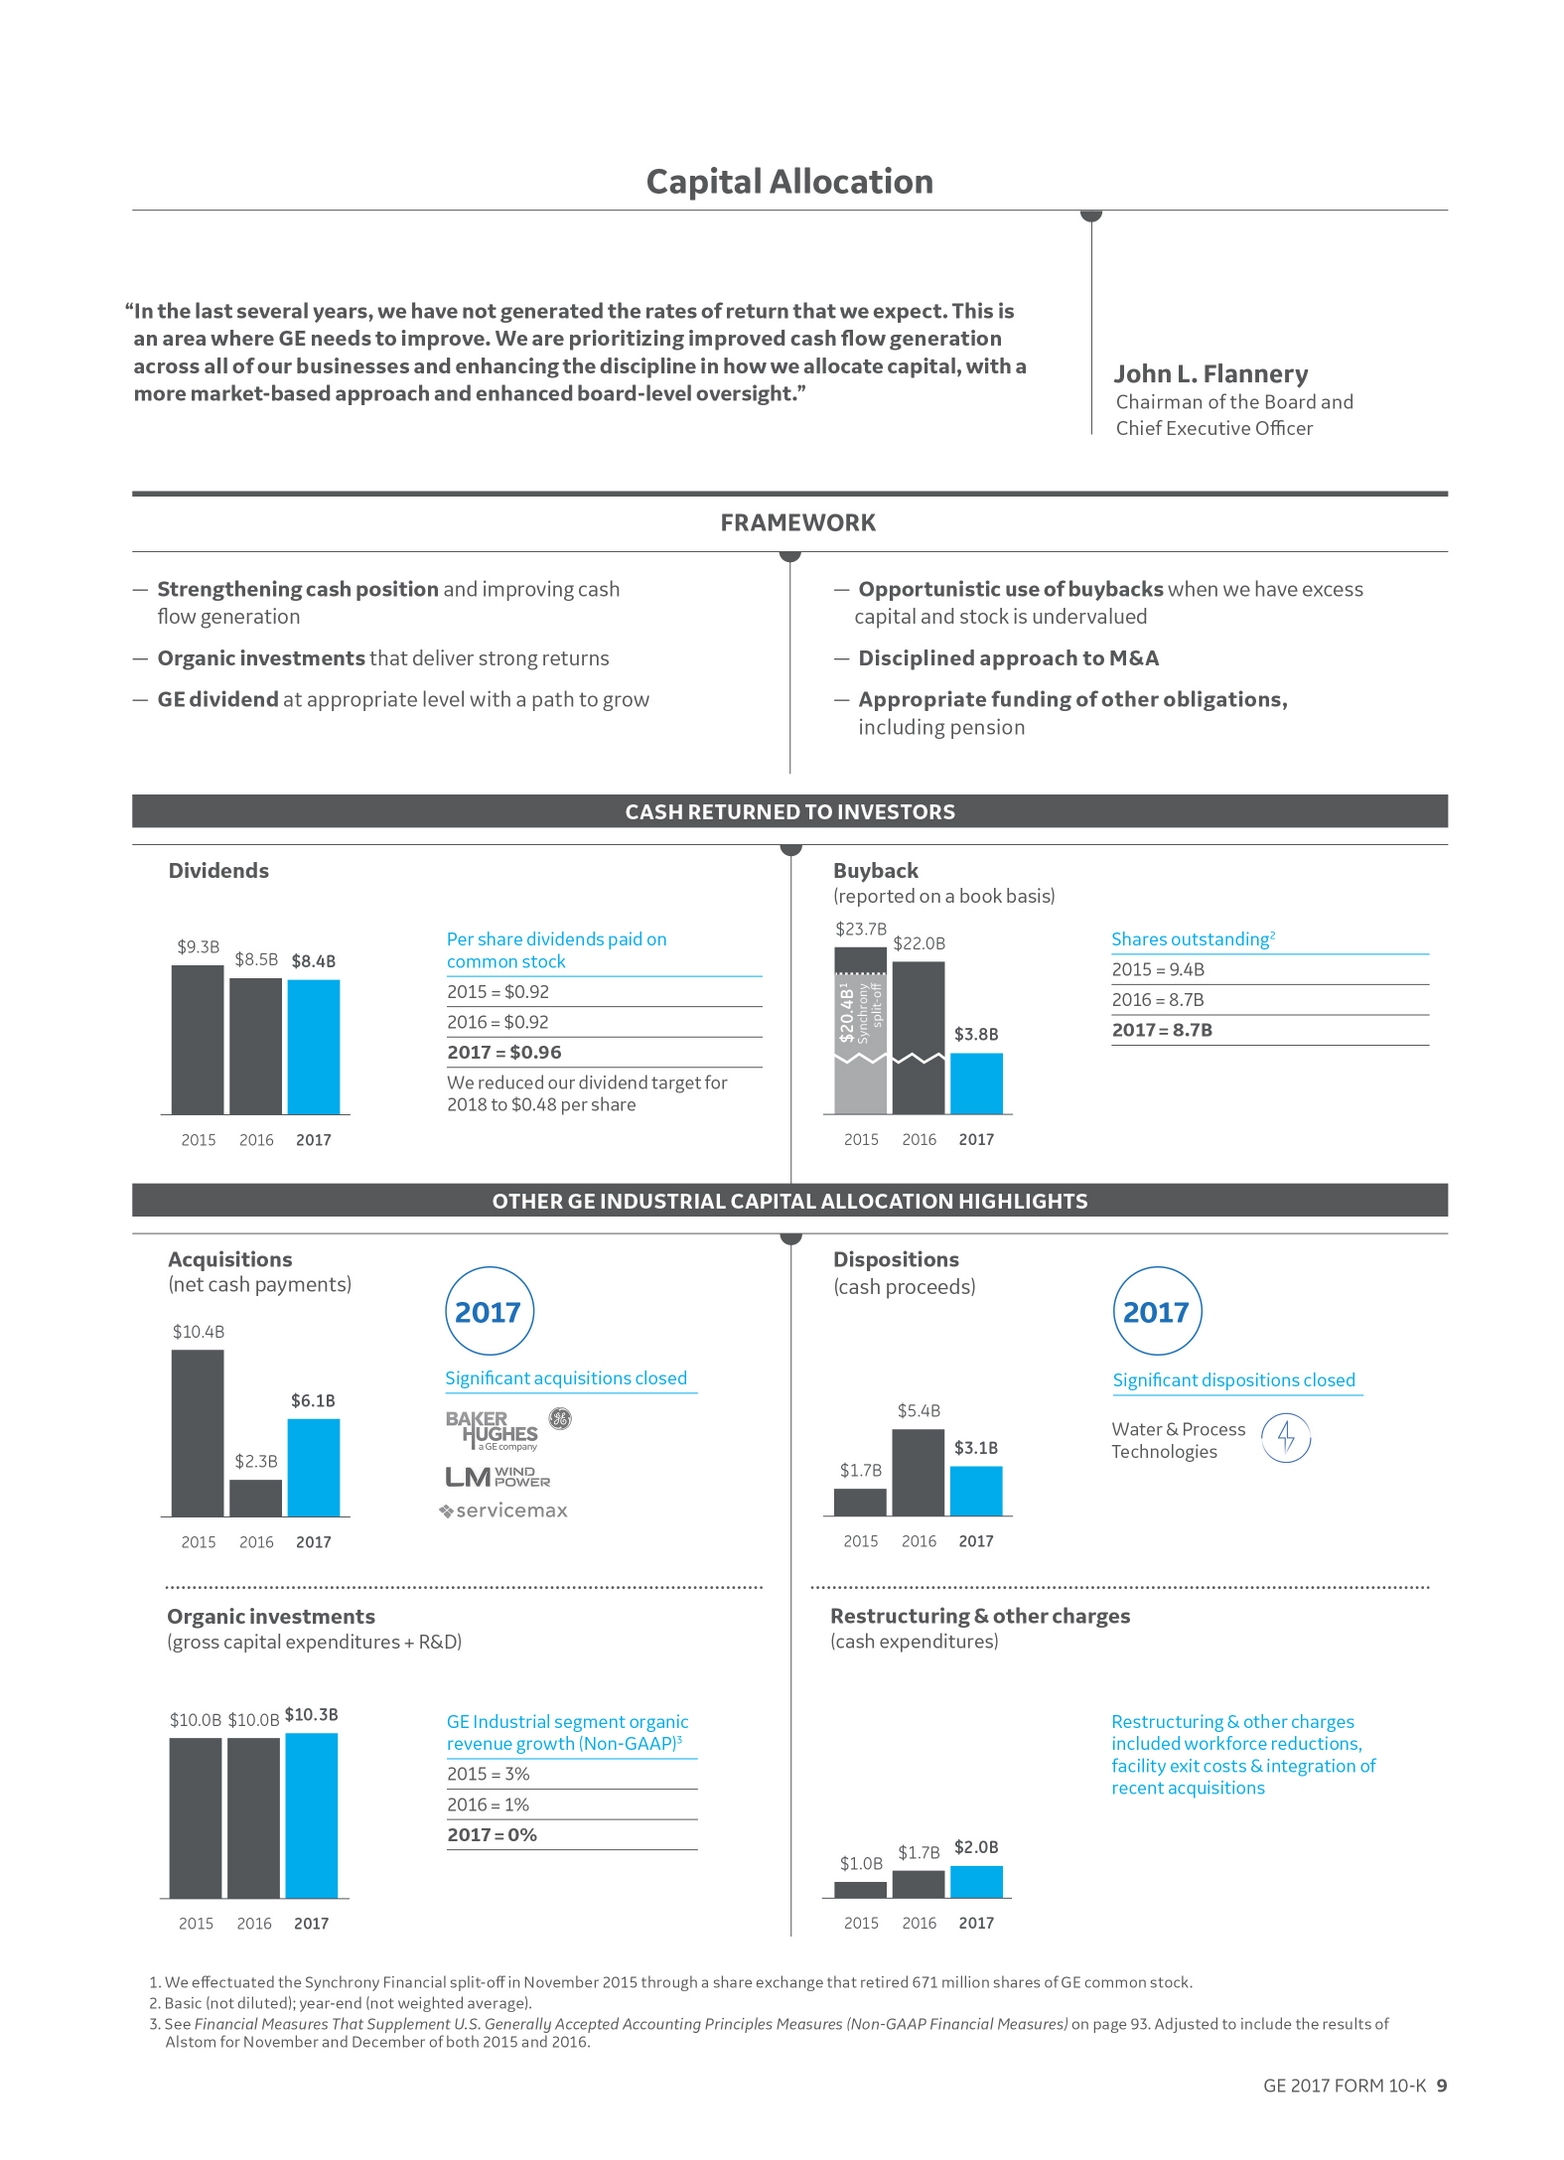
SHAREOWNER INFORMATION | |
RETURNED $12.1 BILLION TO SHAREOWNERS IN 2017 Dividends $8.4 billion Stock buyback $3.8 billion | ANNUAL MEETING General Electric's 2018 Annual Meeting of Shareowners will be held on April 25, 2018, in Imperial, PA |
FIVE-YEAR PERFORMANCE GRAPH |
 |

The annual changes for the five-year period shown in the graph on this page are based on the assumption that $100 had been invested in General Electric common stock, the Standard & Poor's 500 Stock Index (S&P 500) and the Dow Jones Industrial Average (DJIA) on December 31, 2012, and that all quarterly dividends were reinvested. The cumulative dollar returns shown on the graph represent the value that such investments would have had on December 31 for each year indicated.
STOCK PRICE RANGE AND DIVIDENDS |
 |
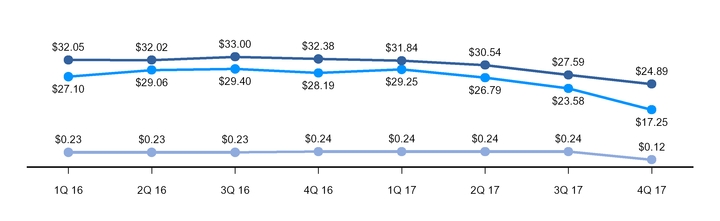
With respect to "Market Information," in the United States, General Electric common stock is listed on the New York Stock Exchange (its principal market). General Electric common stock is also listed on the London Stock Exchange, Euronext Paris, the SIX Swiss Exchange and the Frankfurt Stock Exchange. The chart above shows trading prices, as reported on the New York Stock Exchange, Inc., Composite Transactions Tape.
As of January 31, 2018, there were approximately 418,000 shareowner accounts of record.
On February 9, 2018, our Board of Directors approved a quarterly dividend of $0.12 per share of common stock, which is payable April 25, 2018, to shareowners of record at close of business on February 26, 2018.
GE 2017 FORM 10-K 19
MD&A | CONSOLIDATED RESULTS | |
CONSOLIDATED RESULTS
PRESENTATION
When used in this report, unless otherwise indicated by the context, we use the terms to mean the following:
• | Continuing earnings – we refer to the caption "earnings from continuing operations attributable to GE common shareowners" as continuing earnings. |
• | Continuing earnings per share (EPS) – when we refer to continuing earnings per share, it is the diluted per-share amount of "earnings from continuing operations attributable to GE common shareowners." |
• | GE Industrial margin – GE revenues and other income excluding GE Capital earnings (loss) from continuing operations (GE Industrial revenues) minus GE total costs and expenses less GE interest and other financial charges divided by GE Industrial revenues. |
• | Net earnings – we refer to the caption "net earnings attributable to GE common shareowners" as net earnings. |
• | Net earnings per share (EPS) – when we refer to net earnings per share, it is the diluted per-share amount of "net earnings attributable to GE common shareowners." |
• | Operating earnings (Non-GAAP) – GE earnings from continuing operations attributable to common shareowners excluding the impact of non-operating pension costs. |
• | Organic revenues (Non-GAAP) – revenues excluding the effects of acquisitions, dispositions and translational foreign currency exchange. |
• | Revenues – revenues comprise sales of goods, sales of services and other income for our industrial businesses and GE Capital revenues from services for our financial services businesses. |
• | Segment profit – refers to the operating profit of the industrial segments and the net earnings of the Financial Services segment. See the Segment Operations section within the MD&A for a description of the basis for segment profits. |
• | Services – for purposes of the financial statement display of sales and costs of sales in our Statement of Earnings (Loss), "goods" is required by SEC regulations to include all sales of tangible products, and "services" must include all other sales, including other services activities. In our MD&A section of this report, we refer to sales under product services agreements and sales of both goods (such as spare parts and equipment upgrades) and related services (such as monitoring, maintenance and repairs) as sales of "services," which is an important part of our operations. |
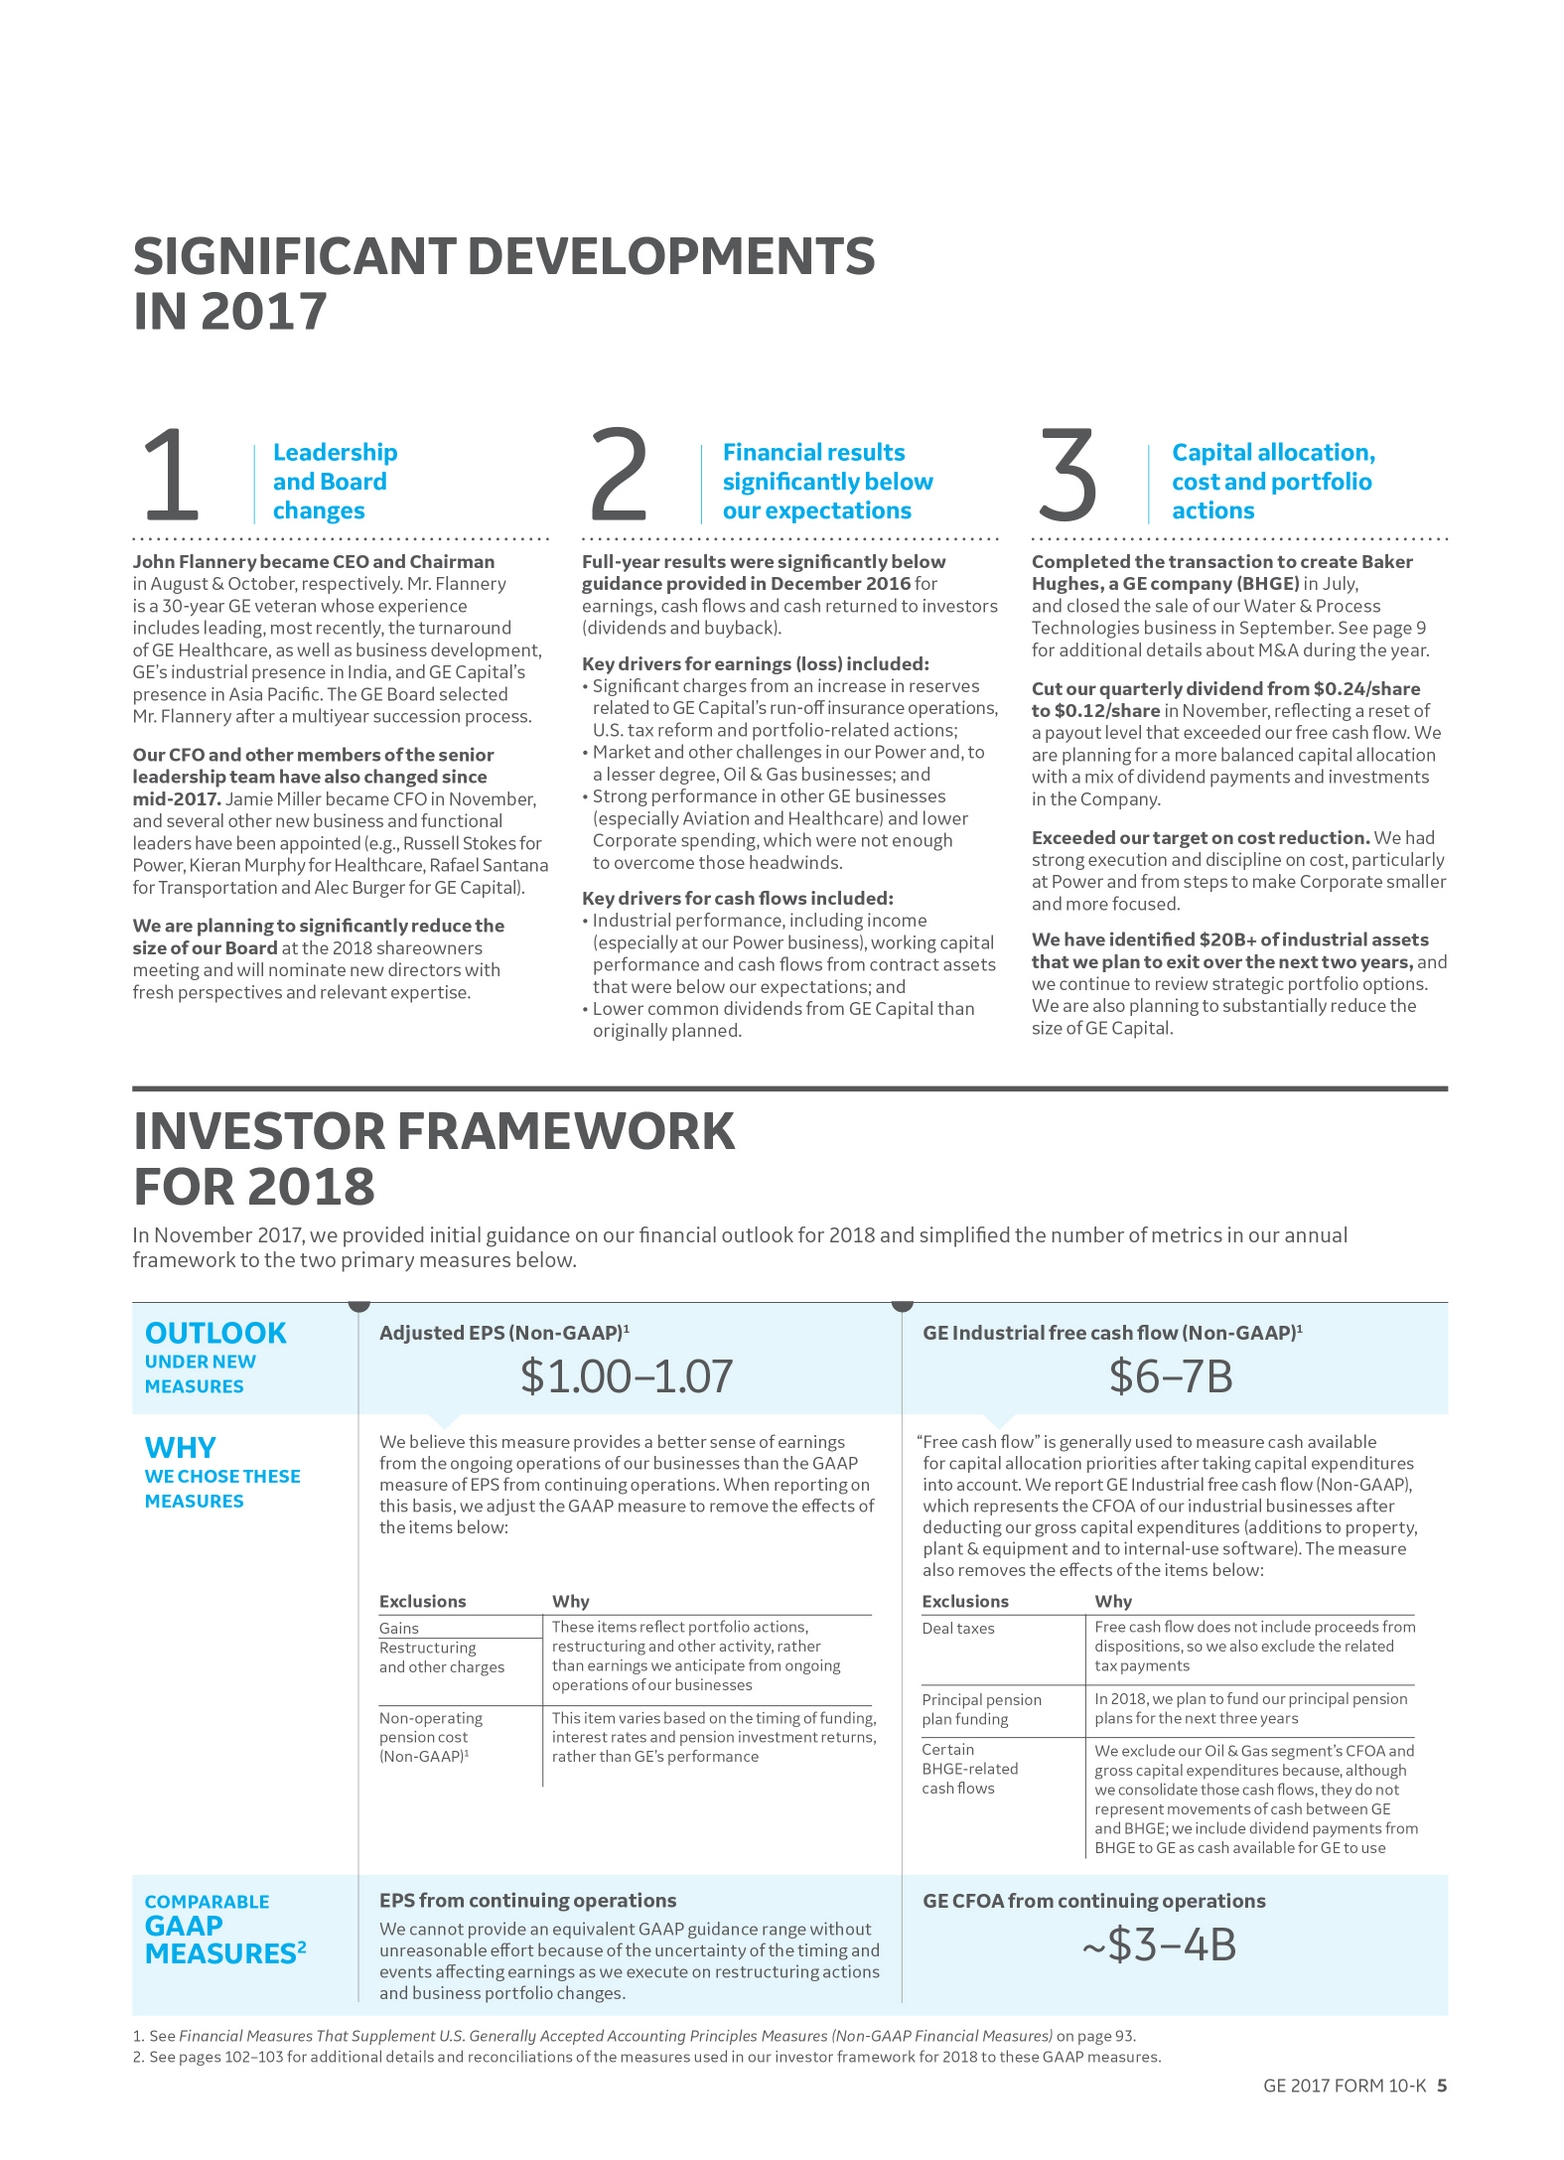
2017 SIGNIFICANT DEVELOPMENTS
LEADERSHIP CHANGES
As announced on June 12, 2017, Jeffery R. Immelt retired as Chief Executive Officer (CEO) on July 31, 2017, and John L. Flannery succeeded Mr. Immelt as CEO effective August 1, 2017. Mr. Flannery also joined the Board of Directors (the Board) on that date. Mr. Immelt remained Chairman of the Board for a transition period through October 2, 2017, at which point Mr. Flannery succeeded Mr. Immelt as Chairman.
On October 6, 2017, we announced that, effective November 1, 2017, Jamie S. Miller, would become Chief Financial Officer, succeeding Jeffrey S. Bornstein. Mr. Bornstein remained a Vice Chairman through December 31, 2017. Ms. Miller also serves as a director at Baker Hughes, a GE company.
On October 9, 2017, we announced that Robert Lane retired from the Board after 12 years of service, effective that same date. In addition, the Board elected Edward P. Garden as a director to fill the resulting vacancy, effective on that date. Mr. Garden is the Chief Investment Officer and a Founding Partner of Trian Fund Management, L.P. (Trian), an investment management firm. On December 8, 2017, we announced that Lowell C. McAdam resigned from the Board. We are also planning to significantly reduce the size of our Board at the 2018 annual meeting of shareowners and will nominate new directors with fresh perspectives and relevant expertise.
20 GE 2017 FORM 10-K
MD&A | CONSOLIDATED RESULTS | |
2017 SIGNIFICANT DEVELOPMENTS
• | On January 10, 2017, we completed the acquisition of ServiceMax, a leader in cloud-based field service management (FSM) solutions, for $0.9 billion, net of cash acquired. |
• | On April 20, 2017, we completed the acquisition of LM Wind Power, one of the world's largest wind turbine blade manufacturers for approximately $1.7 billion, net of cash acquired. |
• | On July 3, 2017, we completed the transaction to create Baker Hughes, a GE company (BHGE). We combined our Oil & Gas business and Baker Hughes Incorporated (Baker Hughes) to create a new company in which GE holds an ownership interest of approximately 62.5% and former Baker Hughes shareholders hold an ownership interest of approximately 37.5%. Baker Hughes shareholders also received a cash dividend funded by a $7.5 billion cash contribution from GE. Effective July 3, 2017, the operations of Baker Hughes are reported in our Oil & Gas segment. |
• | On March 8, 2017, we signed an agreement to sell our Water business within our Power segment to Suez Environnement S.A. (Suez). On September 30, 2017, we completed the sale for consideration of $3.1 billion , net of obligations assumed and cash transferred (including $0.1 billion from the sale of receivables originated in our Water business and sold from GE Capital to Suez), and recognized a pre-tax gain of $1.9 billion in the third quarter of 2017. |
• | In the first quarter of 2017, we classified our Industrial Solutions business within our Power segment as held for sale. In September 2017, we announced an agreement to sell the business for approximately $2.6 billion to ASEA Brown Boveri (ABB), a Swiss-based engineering company. The deal is expected to close in mid-2018, subject to customary closing conditions and regulatory approval. |
• | In the fourth quarter of 2017, we classified the substantial majority of our Lighting segment and two nonstrategic Aviation businesses as held for sale. In connection with this determination, we adjusted the carrying value of each business classified as held for sale to fair value, less cost to sell, which resulted in a pre-tax loss of $0.8 billion related to Lighting and $0.6 billion related to Aviation. These losses have been recorded at Corporate. In February 2018, we entered into an agreement to sell our GE Lighting business in Europe, the Middle East, Africa and Turkey and our Global Automotive Lighting business to a company controlled by a former GE executive in the region. The proposed transaction is expected to close in mid-2018, subject to customary closing conditions and local agreements. |
• | On December 22, 2017, the U.S. enacted the Tax Cuts and Jobs Act ("U.S. tax reform") that lowers the statutory tax rate on U.S. earnings, taxes historic foreign earnings at a reduced rate of tax, establishes a territorial tax system and enacts new taxes associated with global operations. As a result of the enactment of U.S. tax reform, we have recorded tax expense of $3.3 billion in 2017 to reflect our provisional estimate of both the transition tax on historic foreign earnings ($1.2 billion) and the revaluation of deferred taxes ($2.2 billion). |
• | On January 16, 2018, GE reported the results of a review of premium deficiency assumptions related to GE Capital's run-off insurance business. With the completion of that review and of the annual premium deficiency test, GE recorded an increase in future policy benefit reserves of $8.9 billion and $0.6 billion of related intangible asset write-off for the fourth quarter of 2017. This resulted in an after-tax charge of $6.2 billion to GE's earnings in the fourth quarter of 2017. In addition, GE Capital will contribute approximately $15 billion of capital to its run-off insurance business over the next seven years. GE Capital plans to make its first contribution of approximately $3.5 billion in the first quarter of 2018 and expects to make further contributions of approximately $2 billion per year in each of the six following years, subject to ongoing monitoring by the Kansas Insurance Department, its primary regulator. GE Capital plans to fund the capital contributions with its excess liquidity and other GE Capital portfolio actions and does not expect to make a common share dividend distribution to GE for the foreseeable future. |
• | GE also announced that it plans to take actions to make GE Capital smaller and more focused, including a substantial reduction in the size of GE Capital's Energy Financial Services and Industrial Finance businesses over the next 24 months. Those actions resulted in goodwill and other asset impairment charges of $1.8 billion on an after-tax basis in the fourth quarter of 2017. |
SUMMARY OF 2017 RESULTS
Overall, our consolidated results for the year were significantly below our expectations. After adjusting for incremental Baker Hughes revenues of $5.2 billion, the Water gain of $1.9 billion, fair market value adjustments on businesses classified as held for sale of $1.4 billion and the 2016 gains on Appliances and GE Asset Management of $3.1 billion and $0.4 billion, respectively, adjusted consolidated revenues*, which includes other income, were $116.3 billion, down $3.8 billion or 3%. This decrease was largely driven by the net effect of dispositions on industrial segment revenues of $3.3 billion, primarily attributable to Appliances. Industrial segment revenues increased $0.1 billion organically* driven principally by our Aviation, Renewable Energy and Healthcare segments. Excluding our Power and Oil & Gas segments, industrial segment revenues increased $1.7 billion, or 3%, organically*.
Continuing earnings (loss) per share was $(0.68), and Industrial operating plus Verticals earnings per share* was $(0.45), driven by a 16% decrease in industrial segment profit as well as $1.49 of charges recognized in the fourth quarter as follows: GE Capital insurance-related charges of $0.91 per share, including $0.71 related to the completion of GE Capital's insurance premium deficiency review and $0.20 related to EFS impairments; tax-reform related charges of $0.40 per share; Industrial portfolio-related charges of $0.18 per share, including $0.15 per share related to fair market value adjustments on businesses classified as held for sale and $0.13 related to goodwill impairment in our Power Conversation business.
*Non-GAAP Financial Measure
GE 2017 FORM 10-K 21
MD&A | CONSOLIDATED RESULTS | |
For the twelve months ended December 31, 2017, restructuring and other charges were $0.46 per sh are, including $0.05 per share related to BHGE integration and synergy investment. In total, restructuring and other items were $5.3 billion before tax, with restructuring charges totaling about $2.7 billion and businesses development charges totaling $0.8 billion. Subsequent to the Baker Hughes transaction and beginning in the third quarter of 2017, $0.5 billion of restructuring charges and $0.2 billion of business development charges related to BHGE are reported under our Oil & Gas segment. Restructuring charges were higher than originally planned, driven by the accelerated restructuring actions taken a t Corporate. Additionally, within restructuring and other charges, we recognized two significant impairments in the year totaling $0.16 per share, which included non-cash pre-tax impairment charges of $1.2 billion related to goodwill in our Power Conversion business and $0.3 billion related to a power plant asset. See Note 8 to the consolidated financial statements for further information.
For the twelve months ended December 31, 2017, GE Industrial profit was $6.6 billion and GE Industrial margins were 5.7%, down $6.5 billion, or 570 basis points, primarily driven by a reduction in industrial segment profit of $2.9 billion, or 16%, as well as increased non-cash charges recorded at Corporate of $2.9 billion, including impairment charges and charges associated with businesses classified as held for sale, and lower gains of $1.5 billion from disposed businesses, partially offset by decreased restructuring and other charges of $0.5 billion and lower Corporate costs of $0.5 billion. The decline in industrial segment profit was primarily due to lower results within our Power and Oil & Gas segments, partially offset by the performance of our Aviation and Healthcare segments. In 2017, we exceeded our structural cost* reduction target for the year of $1.0 billion, delivering $1.7 billion of structural cost* reduction, excluding the effects of acquisition and disposition activity.
Beginning in the third quarter of 2017, the Energy Connections business within the former Energy Connections & Lighting segment was combined with the Power segment and presented as one reporting segment called Power. For the year ended December 31, 2017, the Power segment experienced a revenue decline of 2% and a segment profit decline of 45% versus 2016. Power revenues were $36.0 billion, with service revenues down 6% and equipment revenues up 2%.
The decline in Power segment results was primarily driven by market demands that were softer than expected, resulting in 55 fewer shipments of aeroderivative units as well as 65 fewer Advanced Gas Path upgrades when compared to the year ended December 31, 2016. In addition, we recorded pre-tax charges of $0.9 billion in the fourth quarter primarily related to slow moving and obsolete inventory across several businesses within Power, a litigation settlement and a bankruptcy of a distributor.
In response to these conditions, in 2017, Power focused on cost reduction actions, removing $0.8 billion of structural costs, excluding the effects of acquisition and disposition activity. Refer to the Power segment results section within this MD&A for further information.
Beginning in the third quarter of 2017, our Oil & Gas segment is comprised of our ownership interest of approximately 62.5% in the combined BHGE entity. We consolidate 100% of BHGE's revenues and cash flows while segment profit and net income are derived net of minority ownership interest of approximately 37.5% attributable to BHGE's Class A shareholders. Also, the segment profit we report for our Oil & Gas segment is adjusted for GE reporting conventions, such as excluding restructuring and other charges. Therefore, our segment profit of approximately 62.5% will differ from BHGE's operating income as reported in its standalone financial statements.
For the year ended December 31, 2017, Oil & Gas reported revenues of $17.2 billion, an increase of 34% versus the year ended December 31, 2016, driven by the effects of the Baker Hughes transaction. Adjusting for the Baker Hughes transaction, segment revenues* were $12.0 billion in the year, down 7% due to continued weakness in the oil and gas market. Segment profit was $220 million, or $899 million after adjusting for restructuring and other charges reported in the segment*. The decline in segment profit (after adjusting for restructuring and other charges reported in the segment*) of 35% was primarily driven by longer cycle oilfield equipment business. Refer to the Oil & Gas segment results section within this MD&A for further information.
GE CFOA was $11.0 billion and $29.9 billion for the twelve months ended December 31, 2017 and 2016, respectively. The decline in GE CFOA is primarily due to a $16.1 billion decrease in dividends from GE Capital, reflecting a decrease in proceeds from disposals related to the GE Capital Exit Plan . GE CFOA was also impacted by lower earnings from Power and Oil & Gas, as well as lower cash generated from working capital compared to 2016 . Additionally, GE CFOA was negatively impacted by GE Pension Plan payments of $1.7 billion in 2017, compared to $0.3 billion in the prior year. GE did not receive a common share dividend distribution from GE Capital in the second half of 2017, and it does not expect to receive such dividend distributions from GE Capital for the foreseeable future. Refer to the GE Cash Flows and Critical Accounting Estimates sections within this MD&A for further information.
*Non-GAAP Financial Measure
22 GE 2017 FORM 10-K
MD&A | CONSOLIDATED RESULTS | |
CONSOLIDATED RESULTS
REVENUES
REVENUES |
|
|
| ||||||
(Dollars in billions) | 2017 | | 2016 | | 2015 | | |||
|
|
|
| ||||||
Consolidated revenues(a) | $ | 122.1 | | $ | 123.7 | | $ | 117.4 | |
|
|
|
| ||||||
Industrial segment revenues(b) | $ | 116.2 | | $ | 112.8 | | $ | 108.6 | |
Corporate revenues and Industrial eliminations | (1.2 | ) | 2.1 | | (0.2 | ) | |||
GE Industrial revenues(b) | $ | 114.9 | | $ | 114.9 | | $ | 108.4 | |
|
|
|
| ||||||
Financial services revenues | $ | 9.1 | | $ | 10.9 | | $ | 10.8 | |
(a) | Included $ 1.6 billion, $ 4.0 billion, and $ 2.2 billion of Other income primarily attributable to net gains on purchases and sales of business interests of $0.7 billion, $3.7 billion, and $1.0 billion in 2017, 2016, and 2015, respectively. See Note 17 to the consolidated financial statements for further information. |
(b) | GE Industrial refers to GE excluding the continuing operations of GE Capital. Industrial segment refers to the sum of our seven industrial reporting segments, without giving effect to corporate items or the elimination of transactions among such segments and between these segments and our Financial Services segment. |
REVENUES COMMENTARY: 2017 – 2016 |
Consolidated revenues decreased $ 1.6 billion, or 1% , primarily driven by decreased Financial Services revenues of $ 1.8 billion and decreased Corporate revenues of $ 3.1 billion, partially offset by increased industrial segment revenues of $ 3.3 billion. The overall foreign currency impact on consolidated revenues was an increase of $0.6 billion. Below are descriptions of the components:
• | GE Industrial revenues remained flat for the year due to an increase in industrial segment revenues of $ 3.3 billion offset by a decrease in Corporate revenues and Industrial eliminations of $3.3 billion. |
Industrial segment revenues increased $ 3.3 billion, or 3% , as increases at Oil & Gas, Renewable Energy, Aviation and Healthcare were partially offset by decreases at Power, Transportation and Lighting. This increase was driven by the net effects of acquisitions of $6.0 billion, primarily attributable to Baker Hughes, and the effects of a weaker U.S. dollar of $0.6 billion, partially offset by the net effects of dispositions of $3.4 billion, primarily attributable to Appliances. Excluding the effects of acquisitions, dispositions and translational currency exchange, industrial segment organic revenues* increased $0.1 billion.
Corporate revenues and Industrial eliminations decreased $3.3 billion primarily driven by lower gains on disposed businesses and higher non-cash held for sale charges. Included in 2016 were gains of $3.1 billion from the sale of our Appliances business and $0.4 billion from the sale of GE Asset Management, while 2017 included a gain of $1.9 billion from the sale of our Water business as well as charges associated with businesses classified as held for sale including the substantial majority of our Lighting segment for $0.8 billion and two nonstrategic Aviation businesses for $0.6 billion.
• | Financial Services revenues decreased $ 1.8 billion, or 17% , primarily due to higher impairments and organic revenue declines. |
REVENUES COMMENTARY: 2016 – 2015 |
Consolidated revenues increased $ 6.3 billion, or 5% , primarily driven by increased industrial segment revenues of $ 4.2 billion, increased Corporate revenues of $ 2.0 billion and increased Financial Services revenues of $ 0.1 billion. The overall foreign currency impact on consolidated revenues was a decrease of $1.3 billion. Below are descriptions of the components:
• | GE Industrial revenues increased $ 6.6 billion, or 6% , driven by increased industrial segment revenues of $ 4.2 billion and increased Corporate revenues and Industrial eliminations of $2.3 billion. |
Industrial segment revenues increased $ 4.2 billion, or 4% , as increases at Power, Renewable Energy, Aviation and Healthcare were partially offset by decreases at Oil & Gas, Transportation and Lighting. This increase in industrial segment revenues was driven by the net effects of acquisitions of $11.2 billion, primarily attributable to Alstom, offset by the net effects of dispositions of $5.6 billion , primarily attributable to Appliances, and the effects of a stronger U.S. dollar of $0.8 billion. Excluding the effects of acquisitions, dispositions and translational currency exchange, industrial segment organic revenues* decreased $0.5 billion.
Corporate revenues and Industrial eliminations increased $2.3 billion driven by higher gains of $1.9 billion. Included in 2016 are gains of $3.1 billion from the sale of our Appliances business and $0.4 billion from the sale of GE Asset Management, while 2015 included gains of $0.6 billion from the sale of our Signaling business and $0.5 billion from a settlement related to the NBCU transaction.
• | Financial Services revenues increased $ 0.1 billion, or 1% , primarily due to lower impairments, higher gains and the effects of acquisitions, partially offset by organic revenue declines, the effects of dispositions and the effects of translational currency exchange. |
*Non-GAAP Financial Measure
GE 2017 FORM 10-K 23
MD&A | CONSOLIDATED RESULTS | |
EARNINGS
EARNINGS (LOSS) AND EARNINGS (LOSS) PER SHARE |
|
|
| ||||||
(Dollars in billions; per-share amounts in dollars) | 2017 | | 2016 | | 2015 | | |||
|
|
|
| ||||||
Continuing earnings (loss)(a) | $ | (5.9 | ) | $ | 9.1 | | $ | 1.7 | |
|
|
|
| ||||||
Continuing earnings (loss) per share | $ | (0.68 | ) | $ | 1.00 | | $ | 0.17 | |
(a) Also referred to as "Earnings (loss) from continuing operations attributable to GE common shareowners"
EARNINGS COMMENTARY: 2017 – 2016 |
• | GE Industrial earnings decreased $ 6.5 billion, or 49% , driven by a decrease in Corporate profit of $3.6 billion and a decrease in industrial segment profit of $2.9 billion. |
Corporate profit decreased $3.6 billion primarily attributable to increased non-cash charges of $2.9 billion including goodwill impairment of $1.2 billion, a power plant asset impairment of $0.3 billion, and charges associated with businesses classified as held for sale including the substantial majority of our Lighting segment for $0.8 billion and two nonstrategic Aviation businesses for $0.6 billion. In addition, Corporate recorded lower gains of $1.5 billion. Included in 2016 were gains of $3.1 billion from the sale of our Appliances business and $0.4 billion from the disposition of GE Asset Management, while 2017 included a gain of $1.9 billion from the sale of our Water business. P ension costs were also $0.2 billion higher, partially offset by decreased restructuring and other costs of $0.5 billion and decreased adjusted Corporate operating costs* of $0.5 billion.
Industrial segment profit decreased $ 2.9 billion, or 16% , with decreases at Power, Oil & Gas and Transportation partially offset by higher earnings at Aviation, Healthcare, Renewable Energy and Lighting. This decrease in industrial segment profit was primarily driven by restructuring costs related to Baker Hughes of $0.7 billion and the net effects of dispositions of $0.2 billion, largely associated with Appliances, partially offset by the net effects of acquisitions $0.3 billion, largely associated with Baker Hughes. Excluding these items, industrial segment organic profit* decreased $2.3 billion.
• | Foreign exchange adversely affected Industrial operating earnings by an insignificant amount in 2017. |
• | Financial Services losses increased $ 5.5 billion, primarily due to a $6.2 billion after-tax charge related to the completion of GE Capital's insurance premium deficiency review, as well as EFS strategic actions resulting in $1.8 billion of after-tax charges in addition to higher impairments, partially offset by lower headquarters and treasury operation expenses associated with the GE Capital Exit Plan, higher tax benefits including the effects of U.S. tax reform and lower preferred dividend expenses associated with the January 2016 preferred equity exchange. |
EARNINGS COMMENTARY: 2016 – 2015 |
• | GE Industrial earnings increased $0.5 billion due to an increase in Corporate profit of $0.9 billion, partially offset by a decrease in industrial segment profit of $0.4 billion. |
Corporate profit increased $0.9 billion, or 17%, driven by higher gains of $1.9 billion. I ncluded in 2016 are gains of $3.1 billion from the sale of our Appliances business and $0.4 billion from the sale of GE Asset Management, while 2015 included gains of $0.6 billion from the sale of our Signaling business and $0.5 billion from a settlement related to the NBCU transaction. In addition, pension costs were $0.7 billion lower, partially offset by $1.8 billion of higher restructuring and other charges primarily related to Alstom.
Industrial segment profit decreased $0.4 billion, or 2%, with decreases at Oil & Gas, Lighting, and Transportation partially offset by increases at Aviation, Power, Healthcare and Renewable Energy. This decrease in industrial segment profit was primarily driven by the net effects of dispositions of $0.5 billion, largely associated with Appliances, offset by the net effect of acquisitions of $0.9 billion, largely associated with Alstom . Excluding these items, industrial segment organic profit* decreased $0.8 billion.
• | Interest and other financial charges increased $ 0.3 billion, while GE Industrial income taxes decreased $ 0.5 billion. |
• | Foreign exchange adversely affected Industrial operating earnings by $0.3 billion in 2016. |
• | Financial Services losses decreased $6.7 billion, or 84%, primarily due to the nonrecurrence of the 2015 charges associated with the GE Capital Exit Plan. |
See Segment Results and Corporate Items & Eliminations sections within the MD&A for more information. Also, see the Other Consolidated Information section within the MD&A for a discussion of postretirement benefit plans costs, income taxes and geographic data.
*Non-GAAP Financial Measure
24 GE 2017 FORM 10-K
MD&A | CONSOLIDATED RESULTS | |
GE DIGITAL
GE Digital's activities are focused on assisting in the market development of our digital product offerings through software design, fulfillment and product management, while also interfacing with our customers. Digital revenues include internally developed software and associated hardware, including Predix and software solutions that improve our customers' asset performance. These revenues and associated costs are largely generated from our operating businesses and are included in their segment results.
Revenues were $4.0 billion for the year ended December 31, 2017, an increase of $0.4 billion or 12% compared to revenues of $3.6 billion for the year ended December 31, 2016. These increases were principally driven by Power, Renewable Energy and Non-GE Verticals. Revenues were $3.6 billion for the year ended December 31, 2016, an increase of $0.5 billion or 16% compared to revenues of $3.1 billion for the year ended December 31, 2015. These increases were principally driven by Power, Oil & Gas and Non-GE Verticals.
Orders were $5.2 billion for the year ended December 31, 2017, an increase of $1.1 billion or 27% compared to orders of $4.1 billion for the year ended December 31, 2016. These increases were principally driven by Oil & Gas, Non-GE Verticals, Power and Renewable Energy. Orders were $4.1 billion for the year ended December 31, 2016, an increase of $0.7 billion or 22% compared to orders of $3.3 billion for the year ended December 31, 2015. These increases were principally driven by Power, Oil & Gas, Non-GE Verticals and Renewable Energy.
SEGMENT OPERATIONS
REVENUES AND PROFIT
Segment revenues include revenues and other income related to the segment.
Segment profit is determined based on internal performance measures used by the Chief Executive Officer (CEO) to assess the performance of each business in a given period. In connection with that assessment, the CEO may exclude matters, such as charges for restructuring, rationalization and other similar expenses, acquisition costs and other related charges, technology and product development costs, certain gains and losses from acquisitions or dispositions, and litigation settlements or other charges, for which responsibility preceded the current management team. Subsequent to the Baker Hughes transaction, restructuring and other charges are included in the determination of segment profit for our Oil & Gas segment. See the Corporate Items and Eliminations section within this MD&A for additional information about costs excluded from segment profit.
Segment profit excludes results reported as discontinued operations and material accounting changes. Segment profit also excludes the portion of earnings or loss attributable to noncontrolling interests of consolidated subsidiaries, and as such only includes the portion of earnings or loss attributable to our share of the consolidated earnings or loss of consolidated subsidiaries.
Segment profit excludes or includes interest and other financial charges, income taxes, and preferred stock dividends according to how a particular segment's management is measured:
• | Interest and other financial charges, income taxes and GE preferred stock dividends are excluded in determining segment profit (which we sometimes refer to as "operating profit") for the industrial segments. |
• | Interest and other financial charges, income taxes and GE Capital preferred stock dividends are included in determining segment profit (which we sometimes refer to as "net earnings") for the Capital segment. |
Certain corporate costs, such as shared services, employee benefits, and information technology, are allocated to our segments based on usage. A portion of the remaining corporate costs is allocated based on each segment's relative net cost of operations.
SIGNIFICANT SEGMENT DEVELOPMENTS
INCLUSION OF ENERGY CONNECTIONS IN POWER REPORTING SEGMENT
Beginning in the third quarter of 2017, the Energy Connections business within the former Energy Connections & Lighting segment was combined with the Power segment and presented as one reporting segment called Power. As a result of the combination, our GE Lighting and Current, powered by GE (Current) businesses are now reported as a separate segment called Lighting.
CLASSIFICATION OF THE SUBSTANTIAL MAJORITY OF OUR LIGHTING SEGMENT AS HELD FOR SALE
In the fourth quarter of 2017, we classified the substantial majority of our Lighting segment as held for sale. In connection with this determination, we adjusted the carrying value of each business classified as held for sale to fair value, less cost to sell, which resulted in a pre-tax loss of $0.8 billion. This loss has been recorded at Corporate.
GE 2017 FORM 10-K 25
MD&A | SEGMENT OPERATIONS |
|
SUMMARY OF OPERATING SEGMENTS | |||||||||||||||
|
|
|
|
|
| ||||||||||
| General Electric Company and consolidated affiliates | ||||||||||||||
(In millions) | 2017 | | 2016 | | 2015 | | 2014 | | 2013 | | |||||
|
|
|
|
|
| ||||||||||
Revenues |
|
|
|
|
| ||||||||||
Power | $ | 35,990 | | $ | 36,795 | | $ | 28,903 | | $ | 27,746 | | $ | 26,770 | |
Renewable Energy | 10,280 | | 9,033 | | 6,273 | | 6,399 | | 4,824 | | |||||
Oil & Gas | 17,231 | | 12,898 | | 16,450 | | 19,085 | | 17,341 | | |||||
Aviation | 27,375 | | 26,261 | | 24,660 | | 23,990 | | 21,911 | | |||||
Healthcare | 19,116 | | 18,291 | | 17,639 | | 18,299 | | 18,200 | | |||||
Transportation | 4,178 | | 4,713 | | 5,933 | | 5,650 | | 5,885 | | |||||
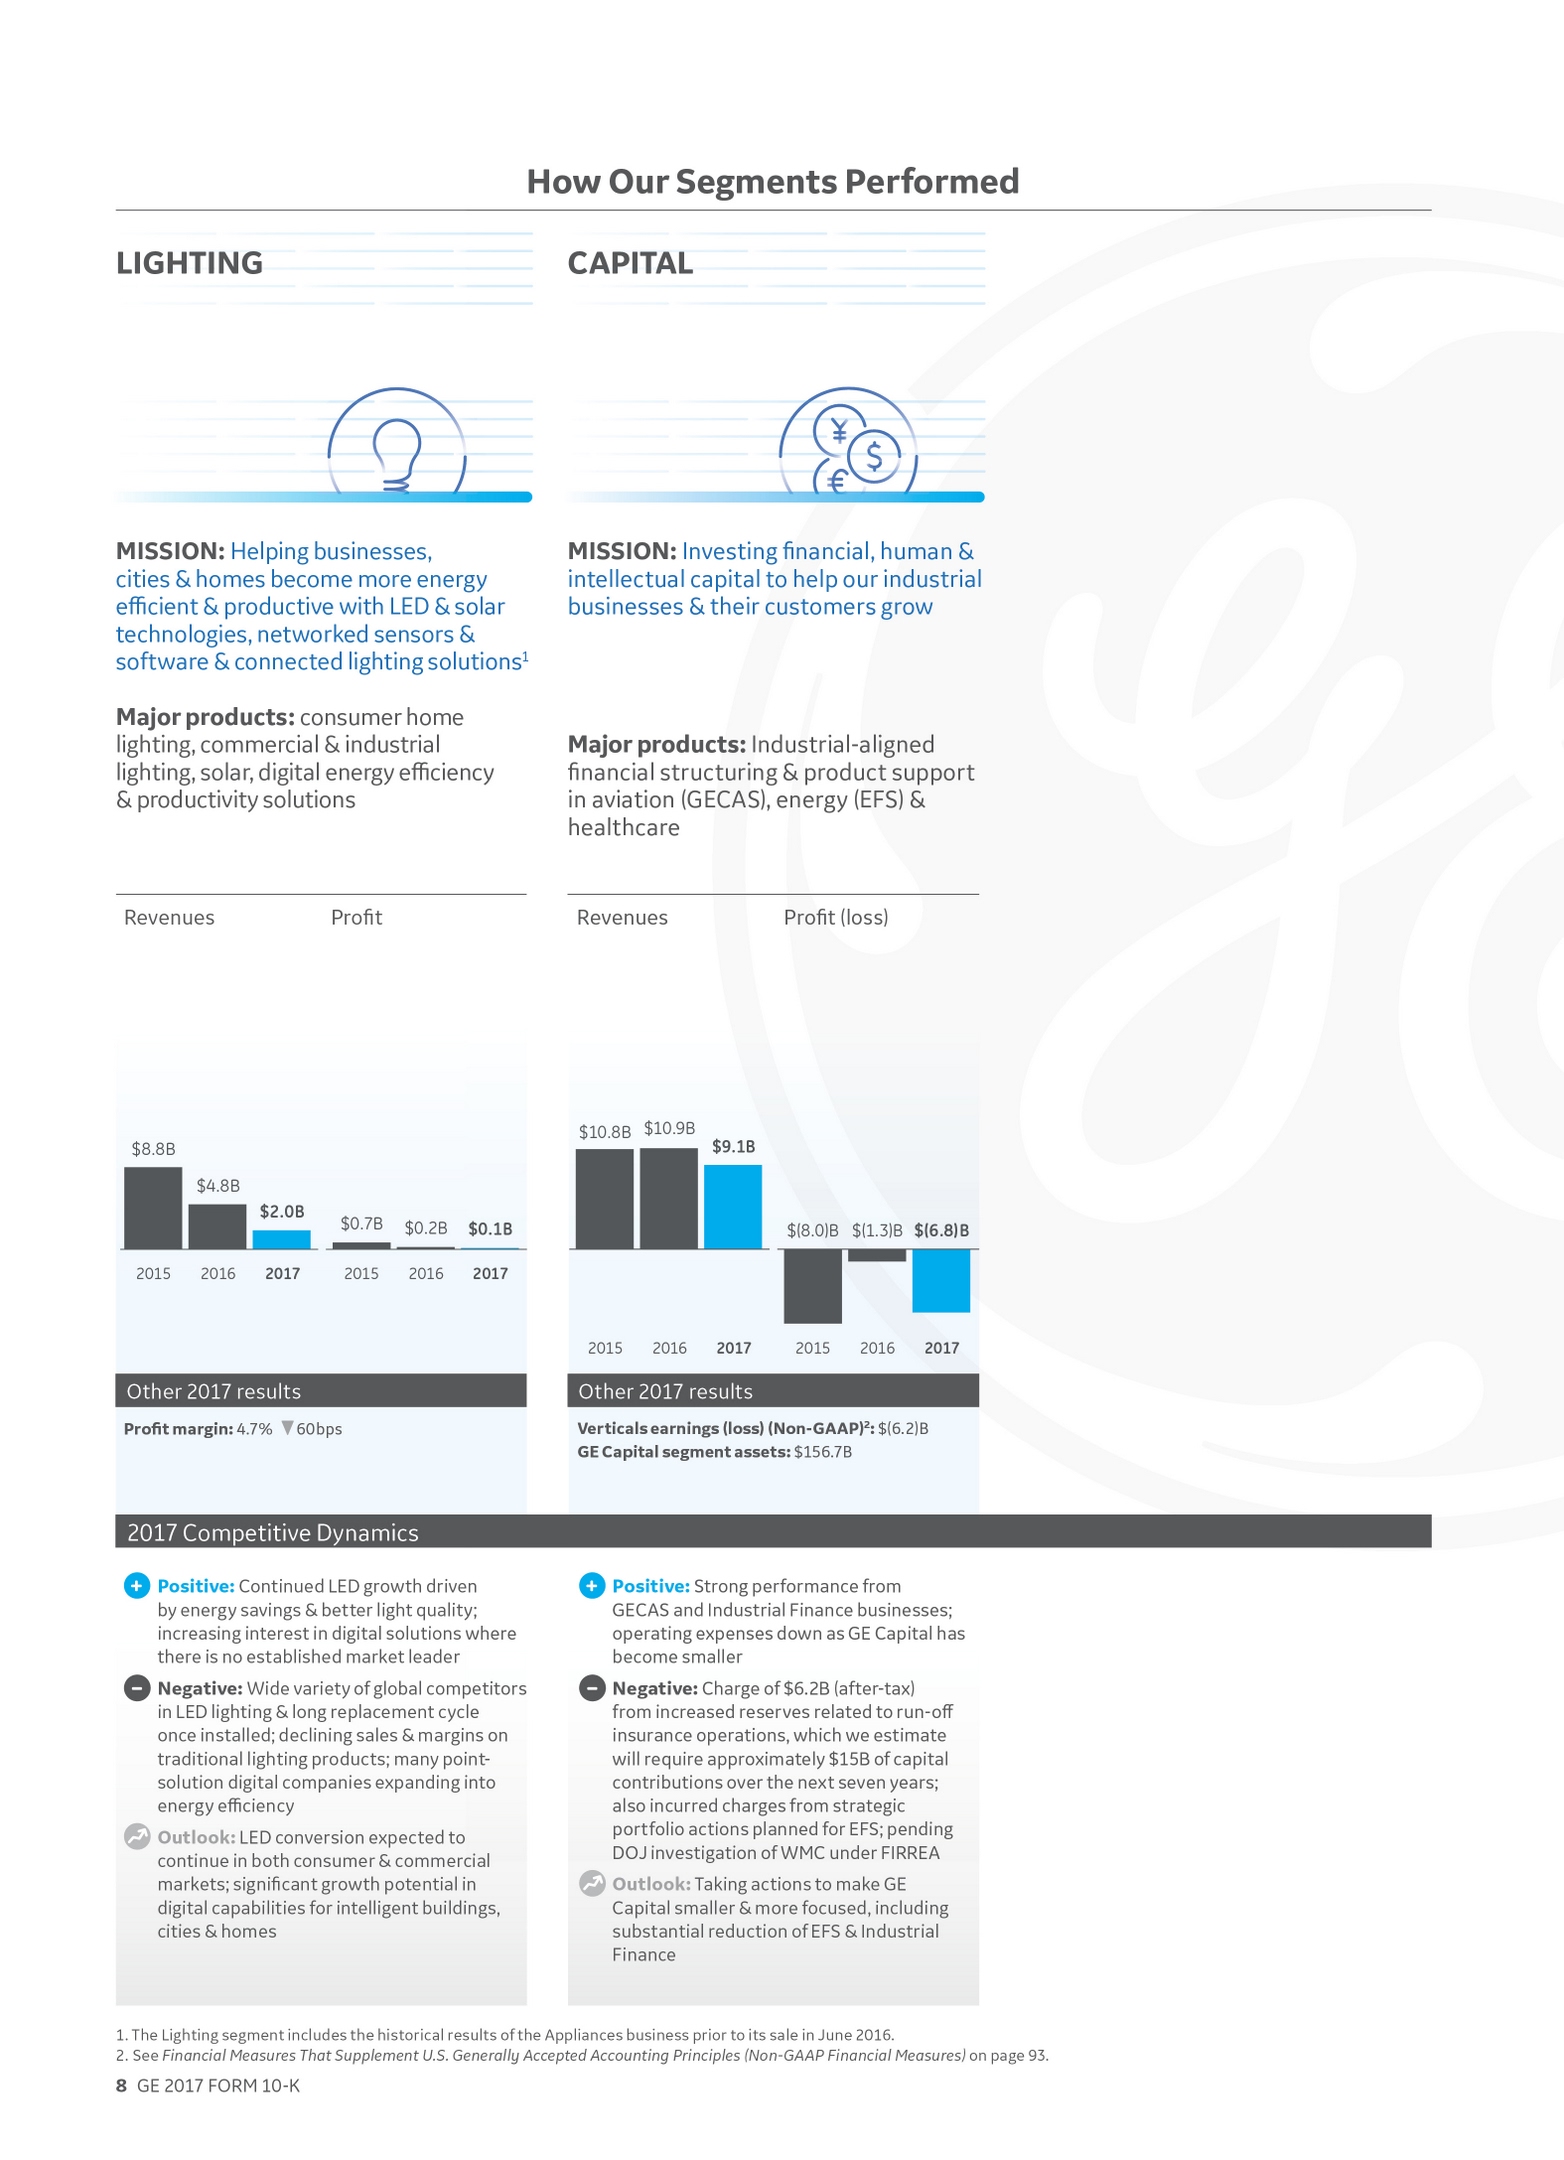
Lighting(a) | 1,987 | | 4,823 | | 8,751 | | 8,404 | | 8,338 | | |||||
Total industrial segment revenues | 116,157 | | 112,814 | | 108,609 | | 109,574 | | 103,269 | | |||||
Capital | 9,070 | | 10,905 | | 10,801 | | 11,320 | | 11,267 | | |||||
Total segment revenues | 125,227 | | 123,719 | | 119,410 | | 120,894 | | 114,536 | | |||||
Corporate items and eliminations | (3,135 | ) | (26 | ) | (2,024 | ) | (3,709 | ) | (1,292 | ) | |||||
Consolidated revenues | $ | 122,092 | | $ | 123,693 | | $ | 117,386 | | $ | 117,184 | | $ | 113,245 | |
|
|
|
|
|
| ||||||||||
Segment profit |
|
|
|
|
| ||||||||||
Power | $ | 2,786 | | $ | 5,091 | | $ | 4,772 | | $ | 4,731 | | $ | 4,437 | |
Renewable Energy | 727 | | 576 | | 431 | | 694 | | 485 | | |||||
Oil & Gas(b) | 220 | | 1,392 | | 2,427 | | 2,758 | | 2,357 | | |||||
Aviation | 6,642 | | 6,115 | | 5,507 | | 4,973 | | 4,345 | | |||||
Healthcare | 3,448 | | 3,161 | | 2,882 | | 3,047 | | 3,048 | | |||||
Transportation | 824 | | 1,064 | | 1,273 | | 1,130 | | 1,166 | | |||||
Lighting(a) | 93 | | 199 | | 674 | | 431 | | 381 | | |||||
Total industrial segment profit | 14,740 | | 17,598 | | 17,966 | | 17,764 | | 16,220 | | |||||
Capital | (6,765 | ) | (1,251 | ) | (7,983 | ) | 1,209 | | 401 | | |||||
Total segment profit | 7,975 | | 16,347 | | 9,983 | | 18,973 | | 16,621 | | |||||
Corporate items and eliminations | (7,871 | ) | (4,226 | ) | (5,108 | ) | (6,225 | ) | (6,002 | ) | |||||
GE interest and other financial charges | (2,753 | ) | (2,026 | ) | (1,706 | ) | (1,579 | ) | (1,333 | ) | |||||
GE provision for income taxes | (3,259 | ) | (967 | ) | (1,506 | ) | (1,634 | ) | (1,667 | ) | |||||
Earnings (loss) from continuing operations |
|
|
|
|
| ||||||||||
attributable to GE common shareowners | (5,907 | ) | 9,128 | | 1,663 | | 9,535 | | 7,618 | | |||||
Earnings (loss) from discontinued operations, net of taxes | (309 | ) | (954 | ) | (7,495 | ) | 5,855 | | 5,475 | | |||||
Less net earnings (loss) attributable to |
|
|
|
|
| ||||||||||
noncontrolling interests, discontinued operations | 6 | | (1 | ) | 312 | | 157 | | 36 | | |||||
Earnings (loss) from discontinued operations, |
|
|
|
|
| ||||||||||
net of taxes and noncontrolling interests | (315 | ) | (952 | ) | (7,807 | ) | 5,698 | | 5,439 | | |||||
Consolidated net earnings (loss) |
|
|
|
|
| ||||||||||
attributable to GE common shareowners | $ | (6,222 | ) | $ | 8,176 | | $ | (6,145 | ) | $ | 15,233 | | $ | 13,057 | |
(a) | Lighting segment included Appliances for the years ended December 31, 2013, 2014, 2015, and through its disposition in the second quarter of 2016. |
(b) | Subsequent to the Baker Hughes transaction, restructuring and other charges are included in the determination of segment profit for our Oil & Gas segment. Oil & Gas segment profit excluding restructuring and other charges* was $899 million for the year ended December 31, 2017. |
*Non-GAAP Financial Measure
26 GE 2017 FORM 10-K
MD&A | SEGMENT OPERATIONS |
|
SEGMENT RESULTS
INDUSTRIAL SEGMENT REVENUES |
|
|
| ||||||
(Dollars in billions) | 2017 | | 2016 | | 2015 | | |||
|
|
|
| ||||||
Revenues |
|
|
| ||||||
Equipment(a)(c) | $ | 58.5 | | $ | 60.6 | | $ | 60.9 | |
Services(b)(c) | 57.7 | | 52.3 | | 47.8 | | |||
Total(d) | $ | 116.2 | | $ | 112.8 | | $ | 108.6 | |
(a) | In 2017, $ 56.3 billion, excluding $ 2.2 billion related to Baker Hughes*. |
(b) | In 2017, $ 54.6 billion, excluding $ 3.1 billion related to Baker Hughes*. |
(c) | For the purposes of the MD&A, "services" refers to sales under product services agreements and sales of both goods (such as spare parts and equipment upgrades) and related services (such as monitoring, maintenance and repairs). For the purposes of the financial statement display of sales and costs of sales in our Statement of Earnings (Loss), "goods" is required by SEC regulations to include all sales of tangible products, and "services" must include all other sales, including other services activities. |
(d) | Industrial segment refers to the sum of our seven industrial reporting segments, without giving effect to corporate items or the elimination of transactions among such segments and between these segments and our Financial Services segment. Therefore, industrial segment revenues will not agree to GE revenues as shown in the Statement of Earnings (Loss). |
INDUSTRIAL SEGMENT PROFIT AND PROFIT MARGIN |
|
|
| ||||||
(Dollars in billions) | 2017 | | 2016 | | 2015 | | |||
|
|
|
| ||||||
Segment profit(a) | $ | 14.7 | | $ | 17.6 | | $ | 18.0 | |
Segment profit margin | 13.3 | % | 15.6 | % | 16.5 | % | |||
(a) | In 2017, $ 15.1 billion, excluding $ (0.4) billion related to Baker Hughes*. |
2017 – 2016 COMMENTARY | ||||
• | Industrial segment revenues increased $ 3.3 billion, or 3% , driven by increases at Oil & Gas primarily due to Baker Hughes, Renewable Energy, Aviation and Healthcare, partially offset by decreases at Power, Transportation and Lighting. |
• | Industrial segment profit decreased $ 2.9 billion, or 16% , primarily due to lower earnings at Power driven by negative variable cost productivity, Oil & Gas primarily due to restructuring costs associated with Baker Hughes, and Transportation driven by lower volume and negative variable cost productivity. These decreases were partially offset by higher earnings at Aviation, Healthcare, Renewable Energy and Lighting. |
• | Industrial segment margin decreased 230 basis points to 13.3% in 2017 from 15.6% in 2016 driven by negative cost productivity, price pressure and business mix. The decrease in industrial segment margin reflects decreases at Power, Oil & Gas and Transportation, offset by increases at Aviation, Renewable Energy, Healthcare and Lighting. |
2016 – 2015 COMMENTARY |
• | Industrial segment revenues increased $ 4.2 billion, or 4% , primarily driven by increases at Power and Renewable Energy, mainly due to the effects of the Alstom acquisition, as well as an organic* increase at Renewable Energy, partially offset by lower revenues at Oil & Gas and Transportation, including the effects of foreign currency exchange of $0.3 billion at Oil & Gas. |
• | Industrial segment acquisition revenues, driven by Alstom, were partially offset by the effects of disposition revenues related to the sale of Appliances in the second quarter of 2016 and sales of Meters, Intelligent Platforms Embedded Systems Products and Signaling businesses in 2015. |
• | Industrial segment profit decreased $0.4 billion, or 2%, mainly driven by lower earnings organically* at Oil & Gas, Lighting and Transportation, as well as an unfavorable impact of foreign exchange, partially offset by higher earnings at Aviation, Power, Healthcare and Renewable Energy. |
• | Industrial segment profit margin decreased 90 basis points to 15.6% in 2016 from 16.5% in 2015, primarily driven by the effects of Alstom results. Excluding Alstom*, industrial segment profit margin was 16.8%, compared with 17.0% in 2015, reflecting core decreases at Power, Oil & Gas and Lighting, that more than offset increases at Aviation, Healthcare and Transportation. |
*Non-GAAP Financial Measure
GE 2017 FORM 10-K 27
MD&A | SEGMENT OPERATIONS | POWER | |

POWER
BUSINESS OVERVIEW
Leader: Russell Stokes |
| Headquarters & Operations | ||
 | • Senior Vice President, GE and President & CEO, GE Power • Over 20 years of service with General Electric |
|  | • 29% of total segment revenues • 31% of industrial segment revenues • 19% of industrial segment profit • Headquarters: Schenectady, NY • Serving customers in 150+ countries • Employees: approximately 83,500 |
Products & Services |
 | Power serves power generation, industrial, government and other customers worldwide with products and services related to energy production and water reuse. Our products and technologies harness resources such as oil, gas, coal, diesel, nuclear and water to produce electric power and include gas and steam turbines, full balance of plant, upgrade and service solutions, as well as data-leveraging software. |
• | Gas Power Systems – offers a wide spectrum of heavy-duty and aeroderivative gas turbines for utilities, independent power producers and numerous industrial applications, ranging from small, mobile power to utility scale power plants. |
• | Steam Power Systems – offers steam power technology for coal and nuclear applications including boilers, generators, steam turbines and Air Quality Control Systems (AQCS) to help efficiently produce power and provide performance over the life of a power plant. |
• | Power Services – delivers maintenance, service and upgrade solutions across total plant assets and over their operational lifecycle, leveraging the Industrial Internet to improve the performance of such solutions. |
• | Distributed Power – provides technology-based products and services to generate reliable and efficient power at or near the point of use. The product portfolio features highly efficient, fuel flexible industrial gas engines, including Jenbacher and Waukesha engines, that generate power for numerous industries globally. |
• | GE Hitachi Nuclear – offers advanced reactor technologies solutions, including reactors, fuels and support services for boiling water reactors, through joint ventures with Hitachi and Toshiba, for safety, reliability and performance for nuclear fleets. |
• | Industrial Solutions - creates advanced technologies that safely, reliably and efficiently distribute and control electricity to protect people, property, and equipment. Offerings include high performance software, control solutions and products such as circuit breakers, relays, arresters, switchgear and panel boards. The portfolio supports the commercial, data center, healthcare, mining, renewable energy, oil & gas, water and telecommunication sectors. |
• | Grid Solutions - a GE and Alstom joint venture that offers products and services, such as high voltage equipment, power electronics, automation and protection equipment and software solutions, and serves industries such as generation, transmission, distribution, oil & gas, telecommunication, mining and water. |
• | Power Conversion - applies the science and systems of power conversion to provide motors, generators, automation and control equipment and drives for energy intensive industries such as marine, oil & gas, renewable energy, mining, rail, metals, test systems and water. |
• | Automation & Controls - serves as the Controls Center of Excellence for GE and partners with GE Digital, the Global Research Center, and GE businesses around the world to provide control solutions to help customers become more productive and efficient. |
• | Water & Process Technologies - provides comprehensive chemical and equipment solutions and services to help manage and optimize water resources across numerous industries and municipalities, including water treatment, wastewater treatment and process system solutions. This business was sold to Suez in September of 2017 for consideration of $3.1 billion , net of obligations assumed and cash transferred. |
Competition & Regulation |
Worldwide competition for power generation products and services is intense. Demand for power generation is global and, as a result, is sensitive to the economic and political environments of each country in which we do business. Our products and services sold to end customers are often subject to a number of regulatory specification and performance standards under different federal, state, foreign and energy industry standards.
28 GE 2017 FORM 10-K
MD&A | SEGMENT OPERATIONS | POWER | |
Significant Trends & Developments |
• | In June of 2017, we announced the merger of the GE Power and GE Energy Connections businesses to create one power-focused business called GE Power. |
• | In June of 2017, Steve Bolze, former President & CEO of legacy GE Power, announced his retirement with Russell Stokes assuming the role of President & CEO of the new GE Power business unit. |
• | We completed the sale of our Water & Process Technologies business to Suez in October 2017. |
• | We announced our plan to sell our Industrial Solutions business to ABB with a planned completion in the first half of 2018, subject to customary closing conditions and regulatory approval. |
• | The new, combined GE Power business, will and has driven better customer focus, fewer redundancies and lower costs. However, to establish this new structure, we have had to execute significant restructuring actions. |
• | The integration of Alstom's Thermal and Grid businesses has continued to yield significant efficiencies in supply chain, service infrastructure, new product development and SG&A costs. |
• | Digital offerings have been developed to further complement our equipment and services business and drive value and better outcomes for our customers. |
• | The business has continued to invest in new product development, such as our HA-Turbines, reciprocating engines, advanced upgrades, substation automation, connected controls, micro-grids, energy storage and digital solutions, to expand our equipment and services offerings. |
• | Subsequent to the large investment needed to develop our HA-Turbines, we expect overall research and development costs to decrease going forward in order to better align with the economic realities of the end demand markets. |
• | Changing customer behaviors and shifts in demand to new regional markets are requiring offerings that can include extended scope and financing. |
• | Significant declines in the market have prompted a deeper analysis of inventory utilization and resulted in additional charges related to slow-moving and obsolete inventory in our Power Services, Gas Power Systems and Power Conversion businesses. |
• | Power faces pressure in the market driven by a changing energy mix with more emphasis on renewables and lower demand for thermal generation affecting both new unit additions and installed base services. |
• | Macroeconomic and geopolitical environments, excess capacity in developed markets and continued pressure in oil and gas applications result in uncertainty for the industry and business. |
• | We expect the overall market for new gas orders in 2018 to be less than 35 gigawatts, and we are executing restructuring efforts in 2018 to support a market that could be as low as 30 gigawatts next year. We expect restructuring efforts to continue into 2019. |
• | In 2017, we reduced structural costs* by $0.8 billion, excluding the effects of acquisition and disposition activity, for the year and reduced our manufacturing and repair footprint by 15 sites. |
• | We have made significant changes and are heavily focused on improving our operational and project execution across every business in Power. We expect operations to stabilize in 2018, with improving execution, a refocused services strategy and strong execution on cost reduction. |
*Non-GAAP Financial Measure
GE 2017 FORM 10-K 29
MD&A | SEGMENT OPERATIONS | POWER | |
OPERATIONAL OVERVIEW
GEOGRAPHIC REVENUES |
|
| ||||
(Dollars in billions) | 2017 | | 2016 | | ||
|
|
| ||||
U.S. | $ | 11.3 | | $ | 11.7 | |
Non-U.S. |
|
| ||||
Europe | 6.3 | | 6.5 | | ||
Asia | 6.8 | | 7.0 | | ||
Americas | 3.7 | | 4.1 | | ||
Middle East and Africa | 8.0 | | 7.5 | | ||
Total Non-U.S. | $ | 24.7 | | $ | 25.1 | |
Total | $ | 36.0 | | $ | 36.8 | |
|
|
| ||||
Non-U.S. Revenues as a % of Segment Revenues | 69 | % | 68 | % | ||
SUB-SEGMENT REVENUES |
|
| ||
| 2017 | | 2016 | |
|
|
| ||
Gas Power Systems(a) | 23 | % | 21 | % |
Power Services | 38 | % | 39 | % |
Steam Power Systems | 5 | % | 5 | % |
Energy Connections(b) | 28 | % | 27 | % |
Other(c) | 6 | % | 8 | % |
(a) Includes Distributed Power |
ORDERS AND BACKLOG |
|
| ||||
(Dollars in billions) | 2017 | | 2016 | | ||
|
|
| ||||
Orders |
|
| ||||
Equipment | $ | 18.0 | | $ | 21.8 | |
Services | 19.0 | | 20.8 | | ||
Total | $ | 37.0 | | $ | 42.6 | |
|
|
| ||||
Backlog |
|
| ||||
Equipment | $ | 27.0 | | $ | 26.7 | |
Services | 71.3 | | 68.9 | | ||
Total | $ | 98.4 | | $ | 95.6 | |
UNIT SALES | |||||
| 2017 | | 2016 | V | |
Gas Turbines | 102 | | 104 | (2 | ) |
30 GE 2017 FORM 10-K
MD&A | SEGMENT OPERATIONS | POWER | |
FINANCIAL OVERVIEW
SEGMENT REVENUES |
|
|
| ||||||
(Dollars in billions) | 2017 | | 2016 | | 2015 | | |||
|
|
|
| ||||||
Revenues |
|
|
| ||||||
Equipment | $ | 17.8 | | $ | 17.5 | | $ | 13.5 | |
Services | 18.2 | | 19.3 | | 15.4 | | |||
Total | $ | 36.0 | | $ | 36.8 | | $ | 28.9 | |
|
|
|
| ||||||
SEGMENT PROFIT AND PROFIT MARGIN |
|
|
| ||||||
(Dollars in billions) | 2017 | | 2016 | | 2015 | | |||
|
|
|
| ||||||
Segment profit | $ | 2.8 | | $ | 5.1 | | $ | 4.8 | |
Segment profit margin | 7.7 | % | 13.8 | % | 16.5 | % | |||
COMMENTARY: |
2017 – 2016 |
Segment revenues down $ 0.8 billion ( 2% );
Segment profit down $ 2.3 billion ( 45% ):
• | The power market continues to be challenged by the increasing penetration of renewable energy, fleet penetration for AGPs, lower capacity payments, utilization, and service outages which decreased 8% from the prior year. In addition, e xcess capacity in developed markets, continued pressure in oil and gas applications and macroeconomic and geopolitical environments have created uncertainty in the industry. |
Services revenues decreased primarily at Power Services due to 65 fewer AGP upgrades. Equipment revenues increased primarily at Gas Power Systems due to higher balance of plant as well as 46 more Heat Recovery Steam Generator shipments, partially offset by two fewer gas turbine and 55 fewer aeroderivative units. Revenues further decreased due to the disposition of the Water business in September 2017 and price pressure, partially offset by the effects of a weaker U.S. dollar versus the euro and the Brazilian real.
• | The decrease in profit was partially driven by $0.9 billion of charges in the fourth quarter primarily related to slow moving and obsolete inventory in Power Services, Gas Power Systems, and Power Conversion, a litigation settlement and a bankruptcy of a distributor. Profit further declined due to negative variable cost productivity, unfavorable business mix due to higher revenues from lower margin balance of plant volume and fewer higher margin aeroderivative units, and price pressure. These decreases were partially offset by positive base cost productivity. |
2016 – 2015 |
Segment revenues up $ 7.9 billion ( 27% );
Segment profit up $ 0.3 billion ( 7% ):
• | The Alstom acquisition in November 2015 contributed $11.7 billion of inorganic revenue growth in 2016. Core services revenue increased primarily at Power Servic es due to 40 more AGP upgrades. Core equipment revenues decreased primarily at Gas Power Systems due to 42 fewer generators, 11 fewer gas steam turbines, and three fewer gas turbines, partially offset by nine more aeroderivative units shipped compared to the prior year. |
• | The increase in profit was mainly driven by the effects of the Alstom acquisition. Core profit decreased due to negative variable cost productivity on lower volume and unfavorable business mix attributable to a shift to the newer H-class gas turbines as these units carry a lower margin rate than the more mature gas turbine products. These decreases were partially offset by direct material deflation. |
GE 2017 FORM 10-K 31
MD&A | SEGMENT OPERATIONS | RENEWABLE ENERGY | |

RENEWABLE ENERGY
BUSINESS OVERVIEW
Leader: Jérôme Pécresse |
| Headquarters & Operations | ||
 | • Senior Vice President, GE and President & CEO, GE Renewable Energy • Former Alstom Renewable Power Executive Vice President |
|  | • 8% of total segment revenues • 9% of industrial segment revenues • 5% of industrial segment profit • Headquarters: Paris, France • Serving customers in 80+ countries • Employees: approximately 21,000 |
Products & Services |
 | GE Renewable Energy makes renewable power sources affordable, accessible and reliable for the benefit of people everywhere. With one of the broadest technology portfolios in the industry, Renewable Energy creates value for customers with solutions from onshore and offshore wind, hydro and its wind turbine blade manufacturing business. With operations in over 40 countries around the world, Renewable Energy can deliver solutions to where its customers need them most. |
• | Onshore Wind – provides technology and services for the onshore wind power industry by providing wind turbine platforms and hardware and software to optimize wind resources. Wind services help customers improve availability and value of their assets over the lifetime of the fleet. Digital Wind Farm is a site level solution, creating a dynamic, connected and adaptable ecosystem that improves our customers' fleet operations. |
• | Offshore Wind – offers its high-yield offshore wind turbine, Haliade 150-6MW, which is compatible with bottom fixed and floating foundations. It uses the innovative pure torque design and the Advanced High Density direct-drive Permanent Magnet Generator. Wind services support customers over the lifetime of their fleet. |
• | Hydro – provides a full range of solutions, products and services to serve the hydropower industry from initial design to final commissioning, from Low Head / Medium / High Head hydropower plants to pumped storage hydropower plants, small hydropower plants. |
• | LM Wind Power - designs and manufactures blades for onshore and offshore wind turbines. LM became part of GE after a $1.7 billion acquisition in April 2017 and adds value for GE, as well as external customers worldwide, through advanced rotor solutions, improved blade efficiency, increased rotor swept-area, proven reliability and a global manufacturing footprint on or close to all major markets for wind. |
Competition & Regulation |
Renewable energy is now mainstream and expected to be able to compete subsidy-free with other sources of power generation in time. While many factors, including government incentives and specific market rules, affect how renewable energy can deliver outcomes for customers in a given region, renewable energy is increasingly able to compete with fossil fuels in terms of levelized cost of electricity. However, continued competitive pressure from other wind turbine producers as well as from other energy sources, such as solar photovoltaic, reinforced by a general move to electricity auction mechanisms, increases price pressure and the need for innovation in the wind market. As a result, we are investing to keep renewable energy competitive through wind turbine product improvements, including larger rotors, taller towers and higher nameplate ratings that continue to drive down the cost of wind energy. As industry models continue to evolve, our digital strategy and investments in technical innovation will position us to add value for customers looking for clean, renewable energy.
32 GE 2017 FORM 10-K
MD&A | SEGMENT OPERATIONS | RENEWABLE ENERGY | |
Significant Trends & Developments |
• | Renewable energy has experienced a surge of development in the last decade. Renewable energy capacity additions account for more than half of all power plant additions worldwide. In the U.S. and beyond, traditional utilities and large brands are increasingly choosing renewable energy options - including onshore and offshore wind - based on cost as well as environmental benefits. |
• | Consequently, the renewable energy market is highly competitive, particularly in onshore wind, resulting in significant pricing pressure. |
• | Visible brands like Amazon, Google and Microsoft are increasingly contracting for output from wind and solar farms directly using Power Purchase Agreements (PPAs). GE's EFS business has enabled several deals of this nature that use wind turbines from GE Renewable Energy's Onshore Wind unit. |
• | The onshore wind market continues to see megawatt (MW) growth as customer preference has shifted from 1.X models to larger, more efficient units. |
• | The market to "repower" existing wind turbines – i.e., upgrade units that have been in service for a number of years to increase their efficiency and performance – is growing in the U.S. as the existing onshore wind turbine fleet is aging. Repowering allows customers to increase the annual energy output of their installed base, provide more competitively priced energy and extend the life of their assets. |
• | New Product Introductions (NPIs) continue to be a key lever as our customers show a willingness to invest in new technology that decreases the levelized cost of energy. In September 2017, we introduced a new 4.8 MW turbine with 158 meter rotor diameter designed to reach the onshore industry's highest Annual Energy Production rate, reducing the cost of energy for customers with low to medium wind speed sites. |
• | In 2016, we introduced a new software applications suite for the Digital Wind Farm that can reduce maintenance costs by up to ten percent and deliver one-to-three percent of additional revenue per site. The company announced in July 2017 that the 2,000 MW Wind Catcher project in Oklahoma, which will be the largest wind farm in the U.S., will use Digital Wind Farm solutions to support Asset Performance Management and Operations Optimization. |
• | While the uncertainty created by the U.S. tax reform debate resulted in certain orders being pushed to 2018, it had limited impact on our fourth quarter of 2017 performance. The final U.S. tax reform legislation preserved the Production Tax Credit (PTC), a positive outcome for the wind industry. However, while the tax equity market continues to function, the legislation has created some near-term uncertainty around the amount of available tax equity financing as financial institutions fully evaluate the impacts of the new tax law. |
• | Pricing for our Onshore Wind business was down in 2017 due to the impact of auctions in many international markets and the competitive environment across all renewable sources. |
• | Looking ahead, with a high level of price pressure likely persisting in 2018, we are continuing to focus on taking cost out of our NPI machines, including the 2.X, in-sourcing blade production and developing larger, more efficient turbines. |
• | We believe that North America will continue to be a solid market in the near term with two main dynamics at play. First, we expect a ramp in 2019-2020 leading up to the expiration of the PTC at 100% value in 2020. Second, we expect Repower upgrades to complement a steadily growing renewable energy market. |
• | Outside of North America, there continues to be solid growth in India, East Asia, Australia and newer markets in Latin America. Europe continues to be stable; however, given our relatively smaller market position, we are investing to grow faster than the market in that region. |
GE 2017 FORM 10-K 33
MD&A | SEGMENT OPERATIONS | RENEWABLE ENERGY | |
OPERATIONAL OVERVIEW
GEOGRAPHIC REVENUES |
|
| ||||
(Dollars in billions) | 2017 | | 2016 | | ||
|
|
| ||||
U.S. | $ | 4.8 | | $ | 5.2 | |
Non-U.S. |
|
| ||||
Europe | 1.9 | | 1.5 | | ||
Asia | 1.0 | | 0.8 | | ||
Americas | 2.0 | | 1.0 | | ||
Middle East and Africa | 0.6 | | 0.5 | | ||
Total Non-U.S. | $ | 5.4 | | $ | 3.8 | |
Total | $ | 10.3 | | $ | 9.0 | |
|
|
| ||||
Non-U.S. Revenues as a % of Segment Revenues | 53 | % | 42 | % | ||
SUB-SEGMENT REVENUES |
|
| ||
| 2017 | | 2016 | |
|
|
| ||
Onshore Wind | 86 | % | 89 | % |
Offshore Wind | 3 | % | 3 | % |
Hydro | 11 | % | 8 | % |
ORDERS AND BACKLOG |
|
| ||||
(Dollars in billions) | 2017 | | 2016 | | ||
|
|
| ||||
Orders |
|
| ||||
Equipment | $ | 8.2 | | $ | 8.5 | |
Services | 2.2 | | 1.7 | | ||
Total | $ | 10.4 | | $ | 10.3 | |
|
|
| ||||
Backlog |
|
| ||||
Equipment | $ | 8.1 | | $ | 7.8 | |
Services | 6.9 | | 5.3 | | ||
Total | $ | 15.0 | | $ | 13.1 | |
UNIT SALES | ||||||
| 2017 | | 2016 | | V | |
Wind Turbines | 2,825 | | 3,289 | | (464 | ) |
34 GE 2017 FORM 10-K
MD&A | SEGMENT OPERATIONS | RENEWABLE ENERGY | |
FINANCIAL OVERVIEW
SEGMENT REVENUES |
|
|
| ||||||
(Dollars in billions) | 2017 | | 2016 | | 2015 | | |||
|
|
|
| ||||||
Revenues |
|
|
| ||||||
Equipment | $ | 8.1 | | $ | 8.2 | | $ | 5.8 | |
Services | 2.2 | | 0.9 | | 0.5 | | |||
Total | $ | 10.3 | | $ | 9.0 | | $ | 6.3 | |
|
|
|
| ||||||
SEGMENT PROFIT AND PROFIT MARGIN |
|
|
| ||||||
(Dollars in billions) | 2017 | | 2016 | | 2015 | | |||
|
|
|
| ||||||
Segment profit | $ | 0.7 | | $ | 0.6 | | $ | 0.4 | |
Segment profit margin | 7.1 | % | 6.4 | % | 6.9 | % | |||
COMMENTARY: |
2017 – 2016 |
Segment revenues up $ 1.2 billion ( 14% );
Segment profit up $ 0.2 billion ( 26% ):
• | The renewable energy market remains competitive, particularly in onshore wind. The onshore wind market continues to see megawatt growth as customer preference has shifted from 1.X models to larger, more efficient units. However, there is significant competitive pricing pressure driven by onshore turbines. |
Services volume increased due to 975 more repower units at Onshore Wind. Equipment volume decreased due to 464 fewer wind turbine shipments on a unit basis, including the nonrecurrence of certain orders in Europe and ASEAN, or 3% fewer megawatts shipped than in the prior year. Revenues also increased due to the acquisition of LM Wind in April 2017 which contributed $0.3 billion of inorganic revenue growth in 2017, increased other income including a reduction in foreign exchange transactional losses, and the effects of a weaker U.S. dollar versus the Brazilian real, partially offset by pricing pressure.
• | The increase in profit was due to positive variable cost productivity, material deflation and increased other income including a reduction in foreign exchange transactional losses. These increases were partially offset by negative base cost productivity and price pressure. |
2016 – 2015 |
Segment revenues up $ 2.8 billion ( 44% );
Segment profit up $ 0.1 billion ( 34% ):
• | The Alstom acquisition in November 2015 contributed $1.2 billion of inorganic revenue growth in 2016. Core equipment and services revenues increased due to higher volume at Onshore Wind as a result of increased repowering projects, 420 more wind turbines shipments and 32% more megawatts shipped than in the prior year. These increases were partially offset by decreased other income including foreign exchange transactional losses, the effects of a stronger U.S. dollar versus the Brazilian real and lower prices due to competitive pressure from other wind turbine producers and other energy sources. |
• | The increase in profit was due to higher volume in Onshore Wind and Hydro due to the Alstom acquisition, material deflation, and product cost-out actions. These increases were partially offset by increased NPI spending on 2 and 3 megawatt units, price pressure and decreased other income including foreign exchange transactional losses. |
GE 2017 FORM 10-K 35
MD&A | SEGMENT OPERATIONS | OIL & GAS | |

OIL & GAS
BUSINESS OVERVIEW
Leader: Lorenzo Simonelli |
| Headquarters & Operations | ||
 | • Chairman, President & CEO Baker Hughes, a GE company • Over 20 years of service with General Electric |
|  | • 14% of total segment revenues • 15% of industrial segment revenues • 1% of industrial segment profit • Headquarters: London, UK and Houston, TX • Serving customers in ~120 countries • Employees: over 64,000 |
Products & Services |
 | Oil & Gas is a fullstream oilfield technology provider that has a unique mix of integrated oilfield products, services and digital solutions. We conduct business in more than 120 countries. We operate through our four business segments: Oilfield Services, Oilfield Equipment, Turbomachinery & Processing Solutions and Digital Solutions. |
• | Oilfield Services – provides equipment and services ranging from well evaluation to decommissioning. Products and services include diamond and tri-cone drill bits, drilling services (including directional drilling technology, measurement while drilling and logging while drilling), downhole completion tools and systems, wellbore intervention tools and services, wireline services, drilling and completions fluids, oilfield and industrial chemicals, pressure pumping and artificial lift technologies (including electrical submersible pumps). |
• | Oilfield Equipment – provides a broad portfolio of products and services required to facilitate the safe and reliable flow of hydrocarbons from the subsea wellhead to the surface. Products and services include pressure control equipment and services, subsea production systems and services, drilling equipment and flexible pipeline systems. Oilfield Equipment operation designs and manufactures onshore and offshore drilling and production systems and equipment for floating production platforms and provides a full range of services related to onshore and offshore drilling activities. |
• | Turbomachinery & Process Solutions – provides equipment and related services for mechanical-drive, compression and power-generation applications across the oil and gas industry as well as products and services to serve the downstream segments of the industry including refining, petrochemical, distributed gas, flow and process control and other industrial applications. The Turbomachinery & Process Solutions portfolio includes drivers (aero-derivative gas turbines, heavy-duty gas turbines and synchronous and induction electric motors), compressors (centrifugal and axial, direct drive high speed, integrated, subsea compressors, turbo expanders and reciprocating), turn-key solutions (industrial modules and waste heat recovery), pumps, valves and compressed natural gas (CNG) and small-scale liquefied natural gas (LNG) solutions used primarily for shale oil and gas field development. |
• | Digital Solutions – provides equipment and services for a wide range of industries, including oil & gas, power generation, aerospace, metals and transportation. The offerings include sensor-based measurement, non-destructive testing and inspection, turbine, generator and plant controls and condition monitoring, as well as pipeline integrity solutions. |
Competition & Regulation |
Demand for oil and gas equipment and services is global and, as a result, is sensitive to the economic and political environment of each country in which we do business. We are subject to the regulatory bodies of the countries in which we operate. Our products are subject to regulation by U.S. and non-U.S. energy policies.
36 GE 2017 FORM 10-K
MD&A | SEGMENT OPERATIONS | OIL & GAS | |
Significant Trends & Developments |
• | On July 3, 2017, we completed the transaction to create Baker Hughes, a GE company (BHGE). Under the terms of the deal, we combined our Oil & Gas business and Baker Hughes Incorporated (Baker Hughes) to create a new company in which GE holds an ownership interest of approximately 62.5% and former Baker Hughes shareholders hold an ownership interest of approximately 37.5%. Effective July 3, 2017, the operations of Baker Hughes are reported in our Oil & Gas segment. The combined business is a leading equipment, technology and services provider in the oil and gas industry. |
• | Continuing market weakness including lower oil prices has led to reductions in customers' forecasted capital expenditures and lower convertible orders, creating industry challenges, the effects of which are uncertain. In addition, decreased U.S. rig count and lower drilling activity versus prior peaks in the early 2000s has reduced the need for new wells, rigs, and replacement equipment. |
• | We are also impacted by volatility in foreign currency exchange rates mainly due to a high concentration of non-U.S. dollar denominated business as well as long-term contracts denominated in multiple currencies. |
• | In 2017, we experienced several indicators of improvement in activity. Demand for oil was higher than expected due to robust consumption in North American and revisions to Chinese, Russian and European demand growth expectations. |
• | In 2017, total rig count increased 27% to an average of 2,030 from an average of 1,598 in 2016. This increase was driven by an increase in North American rig count from 642 in 2016 to 1,082 in 2017, primarily attributable to an increase in land rig count, partially offset by a decrease in offshore rig count. |
• | Oil prices reached a low early in 2016 due to the impending production increases in Iran after economic sanctions were lifted. However, during the fourth quarter of 2017, OPEC announced extensions to agreed-upon production cuts, shifting Brent oil prices higher towards the end of the year. |
• | In North America, customer spending is highly driven by WTI oil prices, which fluctuated significantly throughout the year. Average WTI oil prices increased to $50.80/Bbl in 2017 from $43.29/Bbl in 2016 and ranged from a low of $42.48/Bbl in June 2017 to a high of $60.46/Bbl in December 2017. |
• | Outside of North America, customer spending is influenced by Brent oil prices, which also fluctuated significantly throughout the year. Average Brent oil prices increased to $54.12/Bbl in 2017 from $43.64/Bbl in 2016 and ranged from a low of $43.98/Bbl in June 2017 to a high of $68.80/Bbl in December 2017. |
• | While we saw an increase in commodity prices during 2017, we have yet to see a sustained change in customer spending behavior, and we expect final investment decisions to continue to remain fluid due to continued oil price volatility. |
GE 2017 FORM 10-K 37
MD&A | SEGMENT OPERATIONS | OIL & GAS | |
OPERATIONAL OVERVIEW
GEOGRAPHIC REVENUES |
|
| ||||
(Dollars in billions) | 2017 | | 2016 | | ||
|
|
| ||||
U.S. | $ | 4.4 | | $ | 3.1 | |
Non-U.S. |
|
| ||||
Europe | 3.0 | | 2.4 | | ||
Asia | 2.6 | | 2.3 | | ||
Americas | 2.5 | | 1.9 | | ||
Middle East and Africa | 4.8 | | 3.2 | | ||
Total Non-U.S. | $ | 12.8 | | $ | 9.8 | |
Total | $ | 17.2 | | $ | 12.9 | |
|
|
| ||||
Non-U.S. Revenues as a % of Segment Revenues | 75 | % | 76 | % | ||
SUB-SEGMENT REVENUES |
|
| ||
| 2017 | | 2016 | |
|
|
| ||
Turbomachinery & Process Solutions (TPS) | 37 | % | 50 | % |
Oilfield Services (OFS)(a) | 35 | % | 6 | % |
Oilfield Equipment (OFE)(b) | 14 | % | 27 | % |
Digital Solutions | 14 | % | 17 | % |
(a) Previously referred to as Surface (b) Previously referred to as Subsea Systems & Drilling |
ORDERS AND BACKLOG |
|
| ||||
(Dollars in billions) | 2017 | | 2016 | | ||
|
|
| ||||
Orders |
|
| ||||
Equipment | $ | 6.8 | | $ | 3.7 | |
Services | 10.4 | | 7.4 | | ||
Total(a) | $ | 17.2 | | $ | 11.1 | |
(a) Included $5.2 billion related to Baker Hughes in 2017 |
|
| ||||
|
|
| ||||
Backlog |
|
| ||||
Equipment | $ | 5.4 | | $ | 6.5 | |
Services | 15.7 | | 14.3 | | ||
Total | $ | 21.0 | | $ | 20.8 | |
38 GE 2017 FORM 10-K
MD&A | SEGMENT OPERATIONS | OIL & GAS | |
FINANCIAL OVERVIEW
SEGMENT REVENUES |
|
|
| ||||||
(Dollars in billions) | 2017 | | 2016 | | 2015 | | |||
|
|
|
| ||||||
Revenues |
|
|
| ||||||
Equipment(a) | $ | 7.2 | | $ | 6.0 | | $ | 8.3 | |
Services(b) | 10.0 | | 6.9 | | 8.1 | | |||
Total | $ | 17.2 | | $ | 12.9 | | $ | 16.5 | |
(a) $5.1 billion, excluding $2.2 billion related to Baker Hughes* in 2017 (b) $7.0 billion, excluding $3.1 billion related to Baker Hughes* in 2017 |
|
|
| ||||||
|
|
|
| ||||||
SEGMENT PROFIT AND PROFIT MARGIN |
|
|
| ||||||
(Dollars in billions) | 2017 | | 2016 | | 2015 | | |||
|
|
|
| ||||||
Segment profit(a) | $ | 0.2 | | $ | 1.4 | | $ | 2.4 | |
Segment profit margin | 1.3 | % | 10.8 | % | 14.8 | % | |||
(a) $0.6 billion, excluding $(0.4) billion related to Baker Hughes* in 2017 (b) 4.8%, excluding (6.8)% related to Baker Hughes* in 2017 |
|
|
| ||||||
COMMENTARY: |
2017 – 2016 |
Segment revenues up $ 4.3 billion ( 34% );
Segment profit down $ 1.2 billion ( 84% ):
• | The oil and gas market remained challenging in 2017. Despite some improvements in activity, there were no significant increases in customer capital commitments, and oil prices remained volatile for the majority of the year. While oil prices stabilized towards the end of 2017 and North American rig count increased, major equipment project awards continued to be pushed out in the Oilfield Equipment and TPS businesses. |
The Baker Hughes acquisition in July 2017 contributed $5.2 billion of inorganic revenue growth in 2017. Core equipment revenues decreased due to lower volume primarily at Oilfield Equipment as a result of the market conditions and lower opening backlog. Revenues further decreased due to lower oil prices, partially offset by the effects of a weaker U.S. dollar versus the euro and a reduction in foreign exchange transactional losses.
• | The decrease in profit was primarily driven by negative variable cost productivity, restructuring and other charges, lower prices and lower organic volume, partially offset by increased volume from Baker Hughes, deflation and increased other income including a reduction in foreign exchange transactional losses. |
2016 – 2015 |
Segment revenues down $ 3.6 billion ( 22% );
Segment profit down $ 1.0 billion ( 43% ):
• | The oil and gas market continued to be challenging in 2016, primarily due to uncertainty and volatility in oil and gas prices. While there were indications of positive trends, the industry continued to focus on cost rationalization and capital spending reductions to align its cost structure with economics conditions. |
Core equipment and services revenues decreased due to lower volume across most product lines, primarily in Oilfield Services and Oilfield Equipment, driven by difficult market conditions resulting in lower capital spending across the oil and gas industry. Revenues further decreased due to lower oil prices and the effects of a stronger U.S. dollar versus the euro. The Alstom acquisition in November 2015 contributed $0.1 billion of inorganic revenue growth in 2016.
• | The decrease in profit was primarily driven by continuing market weakness resulting in lower core volume across all sub-segments and lower oil prices, which, despite the effects of cost-out initiatives including restructuring actions, drove lower cost productivity. These decreases were partially offset by material deflation. |
*Non-GAAP Financial Measure
GE 2017 FORM 10-K 39
MD&A | SEGMENT OPERATIONS | AVIATION | |

AVIATION
BUSINESS OVERVIEW
Leader: David Joyce |
| Headquarters & Operations | ||
 | • Vice Chairman, GE and President & CEO, GE Aviation • Over 30 years of service with General Electric |
|  | • 22% of total segment revenues • 24% of industrial segment revenues • 45% of industrial segment profit • Headquarters: Cincinnati, OH • Serving customers in 120+ countries • Employees: approximately 44,500 |
Products & Services |
 | Aviation designs and produces commercial and military aircraft engines, integrated digital components, electric power and mechanical aircraft systems. We also provide aftermarket services to support our products. |
• | Commercial Engines – manufactures jet engines and turboprops for commercial airframes. Our commercial engines power aircraft in all categories; regional, narrowbody and widebody. We also manufacture engines and components for business and general aviation segments. |
• | Commercial Services – provides maintenance, component repair and overhaul services (MRO), including sales of replacement parts. |
• | Military – manufactures jet engines for military airframes. Our military engines power a wide variety of military aircraft including fighters, bombers, tankers, helicopters and surveillance aircraft, as well as marine applications. We provide maintenance, component repair and overhaul services, including sales of replacement parts. |
• | Systems – provides components, systems and services for commercial and military segments. This includes avionics systems, aviation electric power systems, flight efficiency and intelligent operation services, aircraft structures and Avio Aero. |
• | Additive – provides a wide variety of products and services including additive machines from Concept Laser and Arcam EBM, additive materials (including metal powders from AP&C), and additive engineering services through our consultancy brand AddWorks TM . In November 2017, GE Additive also acquired software simulation company GeonX. |
• | We also produce and market engines through CFM International, a company jointly owned by GE and Snecma, a subsidiary of SAFRAN of France, and Engine Alliance, LLC, a company jointly owned by GE and the Pratt & Whitney division of United Technologies Corporation. New engines are also being designed and marketed in a joint venture with Honda Aero, Inc., a division of Honda Motor Co., Ltd. |
Competition & Regulation |
The global businesses for aircraft jet engines, maintenance component repair and overhaul services (including parts sales) are highly competitive. Both U.S. and non-U.S. markets are important to the growth and success of the business. Product development cycles are long and product quality and efficiency are critical to success. Research and development expenditures are important in this business, as are focused intellectual property strategies and protection of key aircraft engine design, manufacture, repair and product upgrade technologies. Aircraft engine orders and systems tend to follow civil air travel and demand and military procurement cycles.
Our product, services and activities are subject to a number of regulators such as by the U.S. Federal Aviation Administration (FAA), European Aviation Safety Agency (EASA) and other regulatory bodies.
40 GE 2017 FORM 10-K
MD&A | SEGMENT OPERATIONS | AVIATION | |
Significant Trends & Developments |
• | Global passenger air travel continued to grow during the year. In 2017, revenue passenger kilometers (RPKs) growth outpaced the five-year average, increasing 7.6%* with strong growth both domestically and internationally and demand exceeding capacity. RPK growth is expected to remain strong in 2018 although at a lower growth rate. |
• | In 2017, air freight volume rebounded, and freight ton kilometers (FTKs) grew 9.0%*, particularly in international markets with demand exceeding capacity for the year. |
• | Passenger load factors globally remained above 80%*. |
• | Airline fuel costs are expected to rise in 2018 due to rising oil prices. |
• | The installed base continues to grow with new product launches. In 2016, through our CFM joint venture, we successfully launched the LEAP engine for application on the Airbus A320 NEO. Another variant of the engine, applied to the Boeing 737 MAX aircraft entered into in service in 2017. A third variant of the LEAP engine, for the COMAC C919, had its first flight in 2017. We are also continuing development on the Advanced Turbo Prop program and the GE9X engine, incorporating the latest technologies for application in the widebody aircraft space. In 2018, we will ship the first Passport engines, powering the Bombardier Global 7000 business jet. |
• | During 2017, Aviation delivered 459 LEAP engines with cost reductions in line with production cost curve expectations. LEAP reliability and performance specification continued to be on track. We expect to meet our ramp commitments in 2018 with a production volume of more than 2,000 engines by 2020. This ramp is a significant undertaking, and we have made extensive investments through our Supply Chain processes and plant infrastructure to manage the production ramp. In addition, we have utilized a "Run at Rate" program to stress test the system and evaluate materials, manufacturability, training, process maturity, production line readiness, logistics and vertical supply chain readiness. |
• | The LEAP ramp experienced minor issues with limited interruption to airframe delivery in 2017. All issues have been addressed within our Supply Chain and in certain cases, minor engine re-designs and field retrofits are underway. |
• | Our digital industrial business is providing insights and operational value for our customers, allowing us to deliver more productivity beyond our traditional services and assist our customers in solving challenging operational problems. Our digital initiatives, including analytics on flight operations, technical operations, and advanced manufacturing, are enabling our customers, internal operations and suppliers to reduce costs, cycle time and improve quality. |
• | On January 2, 2018, GE purchased additional shares of Arcam, AB to bring GE's total ownership to 96%. On January 11, 2018, Arcam applied to the Nasdaq Stockholm exchange to commence delisting of the remaining shares. The last day of trading was January 26, 2018, and GE announced the delisting on January 30, 2018. |
• | We expect an uptick in military shipments and continue to advance our next generation science and technology programs. 2018 will be a critical year for contract decisions on the next generation combat and helicopter engines. |
* Based on the latest available information from the International Air Transport Association
GE 2017 FORM 10-K 41
MD&A | SEGMENT OPERATIONS | AVIATION | |
OPERATIONAL OVERVIEW
GEOGRAPHIC REVENUES |
|
| ||||
(Dollars in billions) | 2017 | | 2016 | | ||
|
|
| ||||
U.S. | $ | 10.8 | | $ | 10.6 | |
Non-U.S. |
|
| ||||
Europe | 6.2 | | 4.5 | | ||
Asia | 5.6 | | 5.1 | | ||
Americas | 1.2 | | 1.6 | | ||
Middle East and Africa | 3.6 | | 4.5 | | ||
Total Non-U.S. | $ | 16.6 | | $ | 15.7 | |
Total | $ | 27.4 | | $ | 26.3 | |
|
|
| ||||
Non-U.S. Revenues as a % of Segment Revenues | 61 | % | 60 | % | ||
SUB-SEGMENT REVENUES |
|
| ||
| 2017 | | 2016 | |
|
|
| ||
Commercial Engines & Services | 73 | % | 74 | % |
Military | 14 | % | 13 | % |
Systems & Other | 13 | % | 13 | % |
ORDERS AND BACKLOG |
|
| ||||
(Dollars in billions) | 2017 | | 2016 | | ||
|
|
| ||||
Orders |
|
| ||||
Equipment | $ | 10.6 | | $ | 10.0 | |
Services | 18.9 | | 16.3 | | ||
Total | $ | 29.5 | | $ | 26.3 | |
|
|
| ||||
Backlog |
|
| ||||
Equipment | $ | 32.8 | | $ | 33.3 | |
Services | 137.7 | | 121.3 | | ||
Total | $ | 170.4 | | $ | 154.5 | |
UNIT SALES | |||||||||
| 2017 | | 2016 | | V | | |||
Commercial Engines | 2,630 | | 2,747 | | (117 | ) | |||
LEAP Engines(a) | 459 | | 77 | | 382 | | |||
Military Engines | 617 | | 571 | | 46 | | |||
Spares Rate(b) | $ | 23.5 | | $ | 18.9 | | $ | 4.6 | |
(a) LEAP engines are a subset of commercial engines (b) Commercial externally shipped spares and spares used in time & material shop visits in millions of dollars per day | |||||||||
42 GE 2017 FORM 10-K
MD&A | SEGMENT OPERATIONS | AVIATION | |
FINANCIAL OVERVIEW
SEGMENT REVENUES |
|
|
| ||||||
(Dollars in billions) | 2017 | | 2016 | | 2015 | | |||
|
|
|
| ||||||
Revenues |
|
|
| ||||||
Equipment | $ | 10.8 | | $ | 11.6 | | $ | 11.8 | |
Services | 16.6 | | 14.7 | | 12.9 | | |||
Total | $ | 27.4 | | $ | 26.3 | | $ | 24.7 | |
|
|
|
| ||||||
SEGMENT PROFIT AND PROFIT MARGIN |
|
|
| ||||||
(Dollars in billions) | 2017 | | 2016 | | 2015 | | |||
|
|
|
| ||||||
Segment profit | $ | 6.6 | | $ | 6.1 | | $ | 5.5 | |
Segment profit margin | 24.3 | % | 23.3 | % | 22.3 | % | |||
COMMENTARY: |
2017 – 2016 |
Segment revenues up $ 1.1 billion ( 4% );
Segment profit up $ 0.5 billion ( 9% ):
• | Global passenger air travel continued to grow with RPK growth outpacing the five-year average and demand exceeding capacity. Air freight volume volume rebounded, particularly in international markets, with FTK demand also exceeding capacity for the year. |
Services revenue increased primarily due to a higher commercial and military spares shipment rate, as well as higher prices. Equipment revenues decreased due to lower legacy and GEnx Commercial engine shipments, partially offset by more LEAP and Military engine shipments. Revenues also increased due to the acquisitions of Arcam AB and Concept Laser GmbH in the fourth quarter of 2016 which contributed $0.2 billion of inorganic revenue growth in 2017.
• | The increase in profit was mainly due to higher cost productivity driven by structural cost reductions, as well as material deflation, higher services volume and higher prices. These increases were partially offset by an unfavorable business mix driven by negative LEAP margin impact. |
2016 – 2015 |
Segment revenues up $ 1.6 billion ( 6% );
Segment profit up $ 0.6 billion ( 11% ):
• | Global passenger air travel continued to grow, particularly in international markets including India and China, with RPKs demand nearly reaching capacity. FTKs also increased despite continuing overcapacity in the market. |
Services volume increased due to a higher commercial spares shipment rate, as well as higher pricing in response to higher material and conversion costs. Equipment revenues decreased due lower Military shipments, partially offset by higher Commercial engine shipments driven by the introduction of the LEAP engines.
• | The increase in profit was mainly due to higher cost productivity driven by favorable SG&A and shop productivity and lower engineering spend, as well as higher services volume and higher prices. These increases were partially offset by material inflation and an unfavorable business mix driven by negative LEAP margin impact. |
GE 2017 FORM 10-K 43
MD&A | SEGMENT OPERATIONS | HEALTHCARE | |

HEALTHCARE
BUSINESS OVERVIEW
Leader: Kieran Murphy |
| Headquarters & Operations | ||
 | • Senior Vice President, GE and President & CEO, GE Healthcare • 10 years of service with General Electric |
|  | • 15% of total segment revenues • 16% of industrial segment revenues • 23% of industrial segment profit • Headquarters: Chicago, IL • Serving customers in 140+ countries • Employees: approximately 52,000 |
Products & Services |
 | Healthcare provides essential healthcare technologies to developed and emerging markets and has expertise in medical imaging, digital solutions, patient monitoring and diagnostics, drug discovery, biopharmaceutical manufacturing technologies and performance improvement solutions that are the building blocks of precision health. Products and services are sold worldwide primarily to hospitals, medical facilities, pharmaceutical and biotechnology companies, and to the life science research market. |
• | Healthcare Systems – provides a wide range of technologies and services that include diagnostic imaging and clinical systems. Diagnostic imaging systems such as X-ray, digital mammography, computed tomography (CT), magnetic resonance (MR), surgical and interventional imaging and molecular imaging technologies allow clinicians to see inside the human body more clearly. Clinical systems such as ultrasound, electrocardiography (ECG), bone densitometry, patient monitoring, incubators and infant warmers, respiratory care and anesthesia management enable clinicians to provide better care for patients every day - from wellness screening to advanced diagnostics to life-saving treatment. Healthcare Systems also offers product services that include remote diagnostic and repair services for medical equipment manufactured by GE and by others. |
• | Life Sciences – delivers products, services and manufacturing solutions for drug discovery, the biopharmaceutical industry, and cellular and gene therapy technologies, so that scientists and specialists can discover new ways to predict, diagnose and treat disease. It also researches, manufactures and markets innovative imaging agents used during medical scanning procedures to highlight organs, tissue and functions inside the human body, to aid physicians in the early detection, diagnosis and management of disease through advanced in-vivo diagnostics. |
• | Healthcare Digital – provides medical technologies, software, analytics, cloud solutions, implementation and services to drive increased access, enhanced quality and more affordable healthcare around the world. Healthcare Digital's expertise in artificial intelligence and operational excellence combines digital and industrial, software and hardware, to deliver integrated digital solutions that improve outcomes. |
Competition & Regulation |
Healthcare competes with a variety of U.S. and non-U.S. manufacturers and services providers. Customers require products and services that allow them to provide better access to healthcare, improve the affordability of care and improve the quality of patient outcomes. Technology and solution innovation to provide products that meet these customer requirements and competitive pricing are among the key factors affecting competition for these products and services. New technologies and solutions could make our products and services obsolete unless we continue to develop new and improved offerings .
Our products are subject to regulation by numerous government agencies, including the U.S. Food and Drug Administration (U.S. FDA), as well as various laws and regulations that apply to claims submitted under Medicare, Medicaid or other government funded healthcare programs .
44 GE 2017 FORM 10-K
MD&A | SEGMENT OPERATIONS | HEALTHCARE | |
Significant Trends & Developments |
• | In June 2017, Jeffery R. Immelt, former Chief Executive Officer (CEO), announced his retirement with John L. Flannery, former President & CEO of GE Healthcare, succeeding Mr. Immelt as CEO effective August 1, 2017. Kieran Murphy, former President & CEO of GE Healthcare Life Sciences, assumed the role of President & CEO of GE Healthcare effective June 12, 2017. |
• | Healthcare global markets continued to expand, predominately in China and emerging markets, and our share of these key markets grew from the prior year. The key drivers of this global growth were Ultrasound as well as Imaging across most modalities, as additional hospitals and other healthcare facilities have been built, particularly in emerging markets, and as equipment is replaced in existing facilities, primarily in developed markets. |
• | We continue to lead in technology innovation with greater focus on productivity-based technology, services and IT/cloud-based solutions as healthcare providers seek greater productivity and better outcomes. |
• | In 2017, we launched 26 new products in our Imaging and Clinical Care Solutions markets. |
• | In Life Sciences, we launched new products in our contrast imaging and bioprocess portfolios and expanded our cell therapy business through organic investments and acquisitions. |
• | In Healthcare Digital, we have upgraded our core imaging software, while continuing to enhance our products with new advances in analytics. |
• | Emerging markets are expected to grow over the long-term with short-term volatility, driven by the long-term trend of expanding access to healthcare in these markets. |
• | The China market is expected to continue to be a source of growth in 2018 with strong fundamentals in the public market and an expanding private market. |
• | In the U.S., the Affordable Care Act (ACA) has contributed to accelerated customer consolidation and driven payment reforms, causing our customers to look for more complete solutions and greater efficiency. However, while the market is strong, it continues to face uncertainty regarding the future of the ACA. This uncertainty has contributed to slower demand for smaller Ultrasound and Life Care Solutions purchases that are more subject to near-term decision making. |
• | Underlying demand for biopharmaceuticals is expected to continue to expand with new product introductions complemented by growing access to these treatments in emerging markets. These trends continue to support the underlying growth of our Life Sciences franchise which has significant exposure to these end markets. |
GE 2017 FORM 10-K 45
MD&A | SEGMENT OPERATIONS | HEALTHCARE | |
OPERATIONAL OVERVIEW
GEOGRAPHIC REVENUES |
|
| ||||
(Dollars in billions) | 2017 | | 2016 | | ||
|
|
| ||||
U.S. | $ | 8.6 | | $ | 8.5 | |
Non-U.S. |
|
| ||||
Europe | 3.8 | | 3.6 | | ||
Asia | 4.9 | | 4.5 | | ||
Americas | 1.0 | | 0.9 | | ||
Middle East and Africa | 0.9 | | 0.9 | | ||
Total Non-U.S. | $ | 10.6 | | $ | 9.8 | |
Total | $ | 19.1 | | $ | 18.3 | |
|
|
| ||||
Non-U.S. Revenues as a % of Segment Revenues | 55 | % | 54 | % | ||
SUB-SEGMENT REVENUES |
|
| ||
| 2017 | | 2016 | |
|
|
| ||
Healthcare Systems | 70 | % | 70 | % |
Healthcare Digital | 6 | % | 7 | % |
Life Sciences | 24 | % | 23 | % |
ORDERS AND BACKLOG |
|
| ||||
(Dollars in billions) | 2017 | | 2016 | | ||
|
|
| ||||
Orders |
|
| ||||
Equipment | $ | 12.4 | | $ | 11.4 | |
Services | 8.1 | | 7.8 | | ||
Total | $ | 20.4 | | $ | 19.2 | |
|
|
| ||||
Backlog |
|
| ||||
Equipment | $ | 6.5 | | $ | 5.6 | |
Services | 11.6 | | 11.2 | | ||
Total | $ | 18.1 | | $ | 16.8 | |
46 GE 2017 FORM 10-K
MD&A | SEGMENT OPERATIONS | HEALTHCARE | |
FINANCIAL OVERVIEW
SEGMENT REVENUES |
|
|
| ||||||
(Dollars in billions) | 2017 | | 2016 | | 2015 | | |||
|
|
|
| ||||||
Revenues |
|
|
| ||||||
Equipment | $ | 11.0 | | $ | 10.4 | | $ | 9.9 | |
Services | 8.1 | | 7.9 | | 7.8 | | |||
Total | $ | 19.1 | | $ | 18.3 | | $ | 17.6 | |
|
|
|
| ||||||
SEGMENT PROFIT AND PROFIT MARGIN |
|
|
| ||||||
(Dollars in billions) | 2017 | | 2016 | | 2015 | | |||
|
|
|
| ||||||
Segment profit | $ | 3.4 | | $ | 3.2 | | $ | 2.9 | |
Segment profit margin | 18.0 | % | 17.3 | % | 16.3 | % | |||
COMMENTARY: |
2017 – 2016 |
Segment revenues up $ 0.8 billion ( 5% );
Segment profit up $ 0.3 billion ( 9% ):
• | The Healthcare Systems global market continued to expand, predominately in emerging markets, including China, driven by Ultrasound as well as Imaging across most modalities. In addition, Healthcare Systems launched 26 new products in 2017, and Life Sciences continued to expand its business through product launches, organic investments and acquisitions. |
Services and equipment revenues increased due to higher volume in Healthcare Systems attributable to growth in Imaging and Ultrasound supported by new product launches and growth in developing regions such as China and emerging markets. Volume also increased in Life Sciences, driven by Bioprocess and Contrast Imaging. This growth was partially offset by price pressure at Healthcare Systems.
• | The increase in profit was primarily driven by strong volume growth and cost productivity due to cost reduction actions including increasing digital automation, sourcing and logistic initiatives, design engineering and prior year restructuring actions. In addition, profit further increased due to the recognition of small gains on the disposition of nonstrategic operations. These increases were partially offset by price pressure at Healthcare Systems and investments in programs including Digital and new product offerings. |
2016 – 2015 |
Segment revenues up $ 0.7 billion ( 4% );
Segment profit up $ 0.3 billion ( 10% ):
• | The Healthcare Systems global market continued to expand, predominately in emerging markets, including China, driven by Ultrasound as well as molecular imaging within Imaging. In addition, Life Sciences continued to expand its business through bioprocess market growth and enterprise solutions. |
Services and equipment revenues increased due to higher volume in Life Sciences, driven by Bioprocess growth. Healthcare Systems volume also increased due to increases in Ultrasound and Imaging. Regionally, volume growth was driven by emerging markets, including China. This growth was partially offset by price pressure at Healthcare Systems.
• | The increase in profit was primarily driven by strong volume growth and high cost productivity due to the effects of cost reduction actions including sourcing and logistic initiatives, design engineering, plant transfers from high cost to low cost countries and restructuring actions. These cost savings were partially offset by price pressure at Healthcare Systems and investments in programs including Digital. |
GE 2017 FORM 10-K 47
MD&A | SEGMENT OPERATIONS | TRANSPORTATION | |
TRANSPORTATION
BUSINESS OVERVIEW
Leader: Rafael Santana |
| Headquarters & Operations | ||
 | • Vice President, GE and President & CEO, GE Transportation • Over 15 years of service with General Electric |
| • 3% of total segment revenues • 4% of industrial segment revenues • 6% of industrial segment profit • Headquarters: Chicago, IL • Serving customers in 60+ countries • Employees: approximately 8,000 | |
Products & Services |
 | Transportation is a global technology leader and supplier to the railroad, mining, marine, stationary power and drilling industries. Products and services offered by Transportation include: |
• | Locomotives – provides freight and passenger locomotives as well as rail services to help solve rail challenges. We manufacture high-horsepower, diesel-electric locomotives including the Evolution Series TM , which meets or exceeds the U.S. Environmental Protection Agency's (EPA) Tier 4 requirements for freight and passenger applications. |
• | Services – develops partnerships that support advisory services, parts, integrated software solutions and data analytics. Our comprehensive offerings include tailored service programs, high-quality parts for GE and other locomotive platforms, overhaul, repair and upgrade services and wreck repair. Our portfolio provides the people, partnerships and leading software to optimize operations and asset utilization. |
• | Digital Solutions – offers a suite of software-enabled solutions to help our customers lower operational costs, increase productivity and improve service quality and reliability. |
• | Mining – provides mining equipment and services. The portfolio includes drive systems for off-highway vehicles, mining equipment, mining power and productivity. |
• | Marine, Stationary & Drilling – offers marine diesel engines and stationary power diesel engines and motors for land and offshore drilling rigs. |
Competition & Regulation |
The competitive environment for locomotives and mining equipment and services consists of large global competitors. A number of smaller competitors compete in a limited-size product range and geographic regions. North America will remain a focus of the industry due to the EPA Tier 4 emissions standard that went into effect in 2015.
Significant Trends & Developments |
• | Effective November 1, 2017, Jamie S. Miller, former President & CEO of GE Transportation, assumed the role of Chief Financial Officer, succeeding Jeffrey S. Bornstein. Effective the same date, Rafael Santana, former President & CEO of GE in Latin America, assumed the role of President & CEO of GE Transportation. |
• | Rail carload volumes, especially in North America, began to improve in 2017 from the historical lows reached early in 2017. Parked locomotives have remained historically high in 2017 but have begun to slowly decrease as carload volume has improved and velocity has slowed. |
• | Demand for natural resources began to recover in 2017, but commodity prices and mining sector activity remain well below levels seen during most recent commodity supercycle. |
• | Global locomotive deliveries were down from 749 units in 2016 to 433 units in 2017 due to excess supply of locomotive power in the North American rail market. |
• | Railroads, especially the Class 1s in North America, have begun to see some recovery in volume in both intermodal and commodity carloads. We expect railroads will continue to seek capital-efficient opportunities to improve the efficiency of their assets and network. |
48 GE 2017 FORM 10-K
MD&A | SEGMENT OPERATIONS | TRANSPORTATION | |
OPERATIONAL OVERVIEW
GEOGRAPHIC REVENUES |
|
| ||||
(Dollars in billions) | 2017 | | 2016 | | ||
|
|
| ||||
U.S. | $ | 2.4 | | $ | 3.0 | |
Non-U.S. |
|
| ||||
Europe | 0.2 | | 0.2 | | ||
Asia | 0.3 | | 0.3 | | ||
Americas | 0.6 | | 0.9 | | ||
Middle East and Africa | 0.7 | | 0.3 | | ||
Total Non-U.S. | $ | 1.8 | | $ | 1.8 | |
Total | $ | 4.2 | | $ | 4.7 | |
|
|
| ||||
Non-U.S. Revenues as a % of Segment Revenues | 43 | % | 37 | % | ||
SUB-SEGMENT REVENUES |
|
| ||
| 2017 | | 2016 | |
|
|
| ||
Locomotives | 31 | % | 44 | % |
Services | 51 | % | 42 | % |
Mining | 10 | % | 7 | % |
Other(a) | 8 | % | 7 | % |
(a) Includes Marine, Stationary, Drilling and Digital |
ORDERS AND BACKLOG |
|
| ||||
(Dollars in billions) | 2017 | | 2016 | | ||
|
|
| ||||
Orders |
|
| ||||
Equipment | $ | 2.1 | | $ | 0.4 | |
Services | 3.0 | | 3.0 | | ||
Total | $ | 5.1 | | $ | 3.4 | |
|
|
| ||||
Backlog |
|
| ||||
Equipment | $ | 4.8 | | $ | 4.4 | |
Services | 13.2 | | 15.7 | | ||
Total | $ | 17.9 | | $ | 20.1 | |
UNIT SALES | ||||||
| 2017 | | 2016 | | V | |
Locomotives | 433 | | 749 | | (316 | ) |
GE 2017 FORM 10-K 49
MD&A | SEGMENT OPERATIONS | TRANSPORTATION | |
FINANCIAL OVERVIEW
SEGMENT REVENUES |
|
|
| ||||||
(Dollars in billions) | 2017 | | 2016 | | 2015 | | |||
|
|
|
| ||||||
Revenues |
|
|
| ||||||
Equipment | $ | 1.7 | | $ | 2.3 | | $ | 3.2 | |
Services | 2.5 | | 2.4 | | 2.7 | | |||
Total | $ | 4.2 | | $ | 4.7 | | $ | 5.9 | |
|
|
|
| ||||||
SEGMENT PROFIT AND PROFIT MARGIN |
|
|
| ||||||
(Dollars in billions) | 2017 | | 2016 | | 2015 | | |||
|
|
|
| ||||||
Segment profit | $ | 0.8 | | $ | 1.1 | | $ | 1.3 | |
Segment profit margin | 19.7 | % | 22.6 | % | 21.5 | % | |||
COMMENTARY: |
2017 – 2016 |
Segment revenues down $ 0.5 billion ( 11% );
Segment profit down $ 0.2 billion ( 23% ):
• | The North American market continues to see overcapacity and spending budget cuts by the railroads limiting fleet expansion. However, carload volume increased 4.8% during the year driven by an increase in coal. With improving carload volume, the number of parked locomotives has decreased 18% from the prior year. |
Equipment volume decreased primarily driven by lower locomotive shipments in North America due to continuing challenging market conditions. Services revenues increased as railroads are running their locomotives longer, and the recently unparked locomotives tend to be older units in higher need of servicing and replacements parts, driving an increase in services volume and parts shipped.
• | The decrease in profit was driven by lower equipment volume, partially offset by favorable business mix from a higher proportion of services volume including an increase in earnings in our long-term service contracts. Additionally, cost reduction actions including restructuring, supply chain initiatives and work transfers to more cost-competitive locations continued during the year. |
2016 – 2015 |
Segment revenues down $ 1.2 billion ( 21% );
Segment profit down $ 0.2 billion ( 16% ):
• | The North American market continues to see overcapacity and spending budget cuts by the railroads limiting fleet expansion. Carload volume decreased 4.5% driven by decreases in coal and petroleum. With declining carload volume, the number of parked locomotives increased 50%. |
Equipment volume decreased primarily driven by lower locomotive shipments in North America due to continued challenging market conditions. Services revenues also decreased as the parked locomotives tend to be older units that would have been in need of servicing and replacements parts if they had continued to run, driving a decrease in services volume and parts shipped. In addition, revenues further decreased due to the disposition of the Signaling business in November 2015.
• | The decrease in profit was primarily driven by lower volume, partially offset by the effects of cost reduction actions including material deflation, lower Tier 4 locomotive spend and restructuring actions. |
50 GE 2017 FORM 10-K
MD&A | SEGMENT OPERATIONS | LIGHTING | |

LIGHTING
BUSINESS OVERVIEW
Leaders: William Lacey & Maryrose Sylvester |
| Headquarters & Operations | ||
 | • Vice President, GE and President & CEO, GE Lighting • Over 25 years of service with General Electric |
|  | • 2% of total segment revenues • 2% of industrial segment revenues • 1% of industrial segment profit • GE Lighting HQ: East Cleveland, OH • Current, powered by GE HQ: Boston, MA • Serving customers in 108 countries • Employees: approximately 7,500 |
 | • Vice President, GE and President & CEO, Current, powered by GE • Over 30 years of service with General Electric |
|
| |
Products & Services |
 | Lighting includes the GE Lighting business, which is primarily focused on consumer lighting applications in the U.S., and Current, powered by GE (Current), which is focused on providing energy efficiency and productivity solutions for commercial, industrial and municipal customers. |
• | GE Lighting – focused on driving innovation and growth in light emitting diode (LED) and connected home technology. The business offers LEDs in a variety of shapes, sizes, wattages and color temperatures. It is also investing in the growing smart home category, building a suite of connected lighting products with simple connection points that offer new opportunities to do more at home. |
• | Current – delivers energy efficiency and productivity solutions for commercial, industrial and municipal customers. We combine infrastructure technology like LED and solar with new sensor-enabled data networks and digital applications to help our customers reduce energy costs, better predict spend and gain business productivity insights. We partner with a wide variety of digital companies to help expand our application catalog, and we offer flexible financing solutions that help our customers achieve faster payback periods and better long-term value. |
Competition & Regulation |
Lighting faces competition from businesses operating with global presence and with deep energy domain expertise. Our products and services sold to end customers are often subject to a number of regulatory specification and performance standards under different federal, state, foreign and energy industry standards. The potential combination of energy technologies like lighting and solar with sensor-based data networks is unlocking new Internet of Things (IoT) capabilities for the commercial, industrial and municipal markets in which Current operates and introducing new competitors.
Significant Trends & Developments |
• | In the last decade, the lighting industry has seen a major technology pivot away from traditional lighting products, including incandescent, halogen and specialty linear fluorescent lamps, to energy-saving LEDs primarily due to continued U.S. energy efficiency regulations. We estimate half of all residential sockets in the U.S. will convert to LED by 2020. This shift aligns with our LED focus. |
• | The same LED transition is also happening in the commercial and industrial markets, coupled with an increasing trend toward digitization in commercial, industrial and retail buildings, as well as growing investment in smart city technology and digital sensing capabilities for utilities and municipalities. This change is being driven by multiple benefits, including cost reductions associated with energy savings, space utilization, worker productivity and a longer LED replacement cycle once installed. |
• | The commercial, industrial and municipal markets are largely nascent, with point solution companies gathering data on the edge or developing specialized apps; no large-scale platform solution has yet emerged in the intelligent buildings and municipal space. |
• | We classified the substantial majority of our Lighting segment as held for sale in the fourth quarter of 2017. In connection with this determination, we adjusted the carrying value of each business classified as held for sale to fair value, less cost to sell, resulting in a pre-tax loss of $0.8 billion recorded at Corporate. In February 2018, we entered into an agreement to sell our GE Lighting business in Europe, the Middle East, Africa and Turkey and our Global Automotive Lighting business to a company controlled by a former GE executive in the region. The proposed transaction is expected to close in mid-2018, subject to customary closing conditions and local agreements. |
GE 2017 FORM 10-K 51
MD&A | SEGMENT OPERATIONS | LIGHTING | |
OPERATIONAL OVERVIEW
GEOGRAPHIC REVENUES(a) |
|
| ||||
(Dollars in billions) | 2017 | | 2016 | | ||
|
|
| ||||
U.S. | $ | 1.5 | | $ | 4.2 | |
Non-U.S. |
|
| ||||
Europe | 0.2 | | 0.2 | | ||
Asia | - | | 0.1 | | ||
Americas | 0.2 | | 0.3 | | ||
Middle East and Africa | 0.1 | | 0.1 | | ||
Total Non-U.S. | $ | 0.5 | | $ | 0.7 | |
Total | $ | 2.0 | | $ | 4.8 | |
|
|
| ||||
Non-U.S. Revenues as a % of Segment Revenues | 24 | % | 14 | % | ||
SUB-SEGMENT REVENUES(a) |
|
| ||
| 2017 | | 2016 | |
|
|
| ||
Current | 54 | % | 22 | % |
GE Lighting | 46 | % | 24 | % |
Appliances | - | % | 54 | % |
ORDERS AND BACKLOG(a) |
|
| ||||
(Dollars in billions) | 2017 | | 2016 | | ||
|
|
| ||||
Orders(b) |
|
| ||||
Equipment | $ | 1.1 | | $ | 0.6 | |
Services | 0.1 | | - | | ||
Total | $ | 1.2 | | $ | 0.6 | |
|
|
| ||||
Backlog |
|
| ||||
Equipment | $ | 0.2 | | $ | 0.1 | |
Services | - | | - | | ||
Total | $ | 0.2 | | $ | 0.1 | |
(a) Lighting segment included Appliances through its disposition in the second quarter of 2016.
(b) Lighting began reporting orders in the third quarter of 2016. Therefore, the 2016 amounts shown represent a partial year of activity.
52 GE 2017 FORM 10-K
MD&A | SEGMENT OPERATIONS | LIGHTING | |
FINANCIAL OVERVIEW
SEGMENT REVENUES(a) |
|
|
| ||||||
(Dollars in billions) | 2017 | | 2016 | | 2015 | | |||
|
|
|
| ||||||
Revenues |
|
|
| ||||||
Equipment | $ | 1.9 | | $ | 4.6 | | $ | 8.3 | |
Services | 0.1 | | 0.2 | | 0.4 | | |||
Total | $ | 2.0 | | $ | 4.8 | | $ | 8.8 | |
|
|
|
| ||||||
SEGMENT PROFIT AND PROFIT MARGIN(a) |
|
|
| ||||||
(Dollars in billions) | 2017 | | 2016 | | 2015 | | |||
|
|
|
| ||||||
Segment profit | $ | 0.1 | | $ | 0.2 | | $ | 0.7 | |
Segment profit margin | 4.7 | % | 4.1 | % | 7.7 | % | |||
(a) Lighting segment included Appliances for the year ended December 31, 2015, and through its disposition in the second quarter of 2016.
COMMENTARY: |
2017 – 2016 |
Segment revenues down $ 2.8 billion ( 59% );
Segment profit down $ 0.1 billion ( 53% ):
• | The traditional lighting market continued to be challenging due to continued U.S. energy efficiency regulations and market shifts away from traditional lighting products in favor of more energy-efficient, cost-saving options. |
The main driver of the decrease in revenues was the Appliances disposition in June 2016. For the remaining Lighting business, equipment revenues decreased due to lower traditional lighting product sales and LED price pressure, partially offset by LED and solar growth in Current. In addition, revenues further decreased due to Lighting regional exits outside of North America.
• | The decrease in profit was due to lower volume driven by the Appliances disposition in June 2016. Excluding this disposition, profit increased for the remaining Lighting business driven by savings from restructuring, regional exits and decreased investment and controllable spending. These increases were partially offset by pressure in North America from declining traditional lighting product sales being only partially offset by increasing LED sales. |
2016 – 2015 |
Segment revenues down $ 3.9 billion ( 45% );
Segment profit down $ 0.5 billion ( 70% ):
• | The main driver of the decrease in revenues was the Appliances disposition in June 2016. For the remaining Lighting business, equipment revenues decreased due to lower traditional lighting product sales and LED price pressure, partially offset by LED and solar growth in Current. |
• | The decrease in profit was due to lower volume driven by the Appliances disposition in June 2016, increased investment in Current to align with market shifts, and price pressure, partially offset by the cost savings effects of regional exits outside of North America. |
GE 2017 FORM 10-K 53
MD&A | SEGMENT OPERATIONS | CAPITAL | |

CAPITAL
BUSINESS OVERVIEW
Leader: Alec Burger |
| Headquarters & Operations | ||
 | • Vice President, GE and President, GE Capital • Over 25 years of service with General Electric |
|  | • 7% of segment revenues • Headquarters: Norwalk, CT • Employees: approximately 4,000 |
Products & Services |
Capital is the financial services division of GE focused on customers and markets aligned with GE's industrial businesses, whether in developed economies or emerging markets. We provide financial products and services around the globe that are geared to utilize GE's industry specific expertise in aviation, energy, infrastructure, and healthcare to capitalize on market-specific opportunities . In addition, we continue to operate our run-off insurance operations as part of our continuing operations. Products and services include:
• | Industrial Finance (IF) – provides exclusive equipment financing solutions globally for the healthcare and additive businesses. In addition, its Working Capital Solutions business provides working capital services to GE to help optimize cash management. |
• | Energy Financial Services (EFS) – a global energy investor that provides world class financial solutions and underwriting capabilities for Power, Renewable Energy, and Oil & Gas to meet rising demand and sustainability imperatives. |
• | GE Capital Aviation Services (GECAS) – offers commercial aircraft leasing, financing, services, and consulting with the industry's broadest range of business solutions. |
Competition & Regulation |
The businesses in which we engage are subject to competition from various types of financial institutions. Our insurance operations are subject to a wide variety of laws and regulations. Our insurance operations are regulated by the insurance departments in the states in which they are domiciled or licensed, with the Kansas Insurance Department being our primary state regulator.
With the rescission of its designation as a nonbank Systemically Important Financial Institution (SIFI) in June 2016, GE Capital's activities are no longer subject to the consolidated supervision of the Federal Reserve or subject to the enhanced prudential standards set forth in the Dodd Frank Wall Street Reform and Consumer Protection Act and its implementing regulations, including minimum regulatory capital and liquidity requirements, submission of annual resolution plans, the Volcker Rule and regulatory reporting requirements.
As of March 30, 2017, GE Capital's non-U.S. activities are no longer subject to consolidated supervision by the U.K.'s Prudential Regulation Authority (PRA). This completes GE Capital's global exit from consolidated supervision, having had its designation as a nonbank SIFI removed in June 2016.
54 GE 2017 FORM 10-K
MD&A | SEGMENT OPERATIONS | CAPITAL | |
Significant Trends & Developments |
• | GE Capital paid common share dividends of $4.0 billion to GE during the year ended December 31, 2017. |
• | In December of 2017, Rich Laxer, former Chairman and CEO of GE Capital, announced his retirement from GE effective March 31, 2018. Alec Burger assumed the role of President, GE Capital on January 2, 2018. |
• | During the fourth quarter of 2017, we completed the previously reported review of premium deficiency assumptions related to our run-off insurance operations (North America Life and Health (NALH)). With the completion of that review and NALH's annual premium deficiency test, we recorded an increase to future policy benefit reserves of $8.9 billion and impairments of $0.4 billion of deferred acquisition costs and $0.2 billion of present value of future profits. This resulted in an after-tax charge of $6.2 billion to earnings in the fourth quarter of 2017. Refer to our Critical Accounting Estimates and Notes 1 and 11 to the consolidated financial statements for further information. |
• | As a regulated insurance business, NALH is subject to a statutory accounting framework for establishing reserves that requires the modification of certain assumptions to reflect moderately adverse conditions and other differences from the reserve calculation under GAAP. Under that framework, we estimate that GE Capital will need to contribute approximately $15 billion of capital to NALH over the next seven years. GE Capital plans to make a first capital contribution of approximately $3.5 billion in the first quarter of 2018 and expects to make further contributions of approximately $2 billion per year from 2019 through 2024, subject to ongoing monitoring by NALH's primary regulator, the Kansas Insurance Department. GE Capital plans to fund the capital contributions with its excess liquidity and other GE Capital portfolio actions and does not expect to make a common share dividend distribution to GE for the foreseeable future. GE is required to maintain specified capital levels at these insurance subsidiaries under capital maintenance agreements. Refer to our Financial Resources and Liquidity section for further information. |
• | On January 16, 2018, we announced plans to take actions to make GE Capital smaller and more focused, including a substantial reduction in the size of GE Capital's Energy Financial Services and Industrial Finance businesses over the next 24 months. Those actions resulted in goodwill and other asset impairment charges of $1.8 billion on an after-tax basis in the fourth quarter of 2017. Refer to Note 8 to the consolidated financial statements for further information. |
GE 2017 FORM 10-K 55
MD&A | SEGMENT OPERATIONS | CAPITAL | |
OPERATIONAL OVERVIEW
GEOGRAPHIC REVENUES |
|
| ||||
(Dollars in billions) | 2017 | | 2016 | | ||
|
|
| ||||
U.S. | $ | 4.4 | | $ | 6.4 | |
Non-U.S. |
|
| ||||
Europe | 1.5 | | 1.4 | | ||
Asia | 1.4 | | 1.7 | | ||
Americas | 0.8 | | 0.4 | | ||
Middle East and Africa | 1.0 | | 1.0 | | ||
Total Non-U.S. | 4.7 | | 4.5 | | ||
Total | $ | 9.1 | | $ | 10.9 | |
|
|
| ||||
Non-U.S. Revenues as a % of Segment Revenues | 52 | % | 41 | % | ||
SUB-SEGMENT REVENUES |
|
| ||
| 2017 | | 2016 | |
|
|
| ||
GECAS | 56 | % | 49 | % |
Industrial Finance | 17 | % | 11 | % |
Insurance and Other Financing | 33 | % | 34 | % |
EFS(a) | (6 | )% | 6 | % |
(a) EFS revenues reflect impairment charges recorded in 2017, primarily in the fourth quarter.
SUB-SEGMENT ASSETS |
|
| ||
| 2017 | | 2016 | |
|
|
| ||
GECAS | 26 | % | 25 | % |
Industrial Finance | 17 | % | 15 | % |
Insurance and Other Financing | 50 | % | 53 | % |
EFS | 7 | % | 7 | % |
56 GE 2017 FORM 10-K
MD&A | SEGMENT OPERATIONS | CAPITAL | |
FINANCIAL OVERVIEW
SEGMENT REVENUES |
|
|
| ||||||
(Dollars in billions) | 2017 | | 2016 | | 2015 | | |||
|
|
|
| ||||||
Revenues |
|
|
| ||||||
Verticals | $ | 9.0 | | $ | 10.2 | | $ | 10.4 | |
Other continuing | - | | 0.7 | | 0.4 | | |||
Total | $ | 9.1 | | $ | 10.9 | | $ | 10.8 | |
|
|
|
| ||||||
SEGMENT PROFIT(a) |
|
|
| ||||||
(Dollars in billions) | 2017 | | 2016 | | 2015 | | |||
|
|
|
| ||||||
Profit |
|
|
| ||||||
Verticals | $ | (6.2 | ) | $ | 1.9 | | $ | 1.7 | |
Other continuing | (0.6 | ) | (3.1 | ) | (9.6 | ) | |||
Total | $ | (6.8 | ) | $ | (1.3 | ) | $ | (8.0 | ) |
(a) Interest and other financial charges and income taxes are included in determining segment profit for the Capital segment.
COMMENTARY: |
2017 – 2016 |
Capital revenues decreased $1.8 billion, or 17%, primarily due to higher impairments ($1.3 billion) and organic revenue declines ($0.5 billion).
Capital losses increased $5.5 billion, primarily due to the completion of our insurance premium deficiency review ($6.2 billion), EFS strategic actions ($1.8 billion) and higher impairments ($0.4 billion), partially offset by lower headquarters and treasury operations expenses associated with the GE Capital Exit Plan ($1.6 billion), higher tax benefits ($1.0 billion) including the effects of U.S. tax reform and lower preferred dividend expenses associated with the January 2016 preferred equity exchange ($0.2 billion).
• | Within Capital, Verticals net earnings decreased $8.1 billion, primarily due to the completion of our insurance premium deficiency review ($6.2 billion), EFS strategic actions ($1.8 billion) and higher impairments ($0.4 billion), partially offset by higher tax benefits ($0.2 billion). |
• | Other Capital losses decreased $2.6 billion, or 82%, primarily associated with the GE Capital Exit Plan as follows: |
• | Lower headquarters operation expenses of $0.8 billion. |
• | Lower treasury operation expenses of $0.8 billion reflecting lower excess interest expense, including costs associated with the February and May 2016 debt tenders and derivative activities that reduce or eliminate interest rate, currency or market risk between financial assets and liabilities. |
• | Higher tax benefits of $0.8 billion. |
• | Lower preferred dividend expenses of $0.2 billion associated with the January 2016 preferred equity exchange. |
2016 – 2015 |
Capital revenues increased $0.1 billion , or 1% , primarily due to lower impairments, higher gains and the effects of acquisitions, partially offset by organic revenue declines, the effects of dispositions and the effects of currency exchange.
Capital net loss decreased by $6.7 billion , or 84% , primarily due to the absence of the 2015 charges associated with the GE Capital Exit Plan.
• | Within Capital, Verticals net earnings increased by $0.2 billion , or 14% , as a result of higher gains ( $0.2 billion ) and lower impairments ( $0.2 billion ), partially offset by the effects of dispositions ( $0.1 billion ) and core decreases ( $0.1 billion ). |
• | Other Capital net loss decreased by $6.5 billion , or 67% , primarily as a result of: |
• | Lower tax expenses of $6.2 billion primarily related to the nonrecurrence of the 2015 charges for repatriation of foreign earnings and write-off of deferred tax assets related to the GE Capital Exit Plan. |
• | 2016 tax benefits of $1.1 billion primarily related to increased tax efficiency of planned cash repatriations through increased foreign tax credit utilization of $0.8 billion and an IRS tax settlement of $0.3 billion . |
• | Lower impairment expenses of $0.8 billion resulting from the 2015 impairment of a coal-fired power plant in the U.S. |
• | Higher treasury operation expenses of $1.3 billion reflecting excess interest expense, costs associated with the February and May 2016 debt tenders and derivative activities that reduce or eliminate interest rate, currency or market risk between financial assets and liabilities. We expect to continue to have excess interest costs in 2017. We may engage in liability management actions, such as buying back debt, based on market and economic conditions. |
• | Charges of $0.3 billion associated with the preferred equity exchange that was completed in January 2016. |
• | Higher restructuring expenses of $0.2 billion . |
GE 2017 FORM 10-K 57
MD&A | CORPORATE ITEMS AND ELIMINATIONS | |
GE CORPORATE ITEMS AND ELIMINATIONS
GE Corporate Items and Eliminations is a caption used in the Segment Operations – Summary of Operating Segment table to reconcile the aggregated results of our segments to the consolidated results of the Company. As such, it includes corporate activities, including certain GE Digital activities, and the elimination of inter-segment activities. Specifically, the GE Corporate Items and Eliminations amounts related to revenues and earnings include the results of disposed businesses, certain amounts not included in industrial operating segment results because they are excluded from measurement of their operating performance for internal and external purposes and the elimination of inter-segment activities. In addition, the GE Corporate Items and Eliminations amounts related to earnings include certain costs of our principal retirement plans, restructuring and other costs reported in Corporate, and the unallocated portion of certain corporate costs (such as research and development spending and costs related to our Global Growth Organization).
REVENUES AND OPERATING PROFIT (COST) |
|
|
| |||||||
|
|
|
|
| ||||||
(In millions) | 2017 | | 2016 | | 2015 | | ||||
|
|
|
|
| ||||||
Revenues |
|
|
| |||||||
| Gains (losses) on disposals(a) | $ | 552 | | $ | 3,444 | | $ | 1,497 | |
| Eliminations and other | (3,687 | ) | (3,471 | ) | (3,521 | ) | |||
Total Corporate Items and Eliminations | $ | (3,135 | ) | $ | (26 | ) | $ | (2,024 | ) | |
|
|
|
|
| ||||||
Operating profit (cost) |
|
|
| |||||||
| Gains (losses) on disposals(a) | $ | 520 | | $ | 3,444 | | $ | 1,497 | |
| Principal retirement plans(b) | (2,236 | ) | (2,044 | ) | (2,760 | ) | |||
| Restructuring and other charges | (4,561 | ) | (3,578 | ) | (1,734 | ) | |||
| Eliminations and other | (1,593 | ) | (2,048 | ) | (2,111 | ) | |||
Total Corporate Items and Eliminations | $ | (7,871 | ) | $ | (4,226 | ) | $ | (5,108 | ) | |
(a) | Includes gains (losses) on disposed or held for sale businesses. |
(b) | Included non-operating pension cost* of $2.3 billion, $2.1 billion and $2.8 billion in 2017 , 2016 and 2015 , respectively, which includes expected return on plan assets, interest costs and non-cash amortization of actuarial gains and losses. |
Operating corporate costs* exclude non-service-related pension costs of our principal pension plans, which comprise interest costs, expected return on plan assets and amortization of actuarial gains/losses. Service cost, prior service cost and curtailment loss components of our principal pension plans are included in operating corporate costs*. We believe that these components of pension cost better reflect the ongoing service-related costs of providing pension benefits to our employees. Accordingly, we believe that our measure of operating corporate costs* (see reconciliation below) provides management and investors with a useful measure of the operational costs incurred outside of our businesses. We believe that this measure, considered along with the corresponding GAAP measure, provides management and investors with additional information for comparison of our operating corporate costs* to the operating corporate costs of other companies.
We also believe that adjusting operating corporate costs* to exclude the effects of items that are not closely associated with ongoing corporate operations (see reconciliation below), such as earnings of previously divested businesses, gains and losses on disposed and held for sale businesses, restructuring and other charges provides management and investors with a meaningful measure that increases the period-to-period comparability of our ongoing corporate costs.
CORPORATE COSTS |
|
|
| |||||||
|
|
|
|
| ||||||
(In millions) | 2017 | | 2016 | | 2015 | | ||||
|
|
|
|
| ||||||
Total Corporate Items and Eliminations (GAAP) | $ | (7,871 | ) | $ | (4,226 | ) | $ | (5,108 | ) | |
Less non-operating pension cost (Non-GAAP) | (2,278 | ) | (2,052 | ) | (2,764 | ) | ||||
Total Corporate costs (operating) (Non-GAAP) | $ | (5,592 | ) | $ | (2,175 | ) | $ | (2,344 | ) | |
|
|
|
|
| ||||||
Less restructuring and other charges and gains (losses) | (4,042 | ) | (134 | ) | (237 | ) | ||||
Adjusted Corporate costs (operating) (Non-GAAP) | $ | (1,551 | ) | $ | (2,040 | ) | $ | (2,107 | ) | |
*Non-GAAP Financial Measure
58 GE 2017 FORM 10-K
MD&A | CORPORATE ITEMS AND ELIMINATIONS | |
2017
–
2016
COMMENTARY
Revenues and other income decreased $3.1 billion, primarily a result of:
• | $1.5 billion of lower net gains from disposed businesses which included a $3.1 billion gain from the sale of our Appliance business to Haier in 2016 and a $0.4 billion gain from the sale of GE Asset Management to State Street Corporation in 2016, partially offset by a $1.9 billion gain from the sale of our Water business to Suez in 2017. |
• | $1.4 billion of held for sale losses in 2017. This included $0.8 billion related to the substantial majority of our Lighting segment and $0.6 billion related to two businesses within our Aviation segment. |
Operating costs increased by $3.6 billion, primarily as a result of:
• | $1.5 billion of lower net gains from disposed businesses which included a $3.1 billion gain from the sale of our Appliance business to Haier in 2016 and a $0.4 billion gain from the sale of GE Asset Management to State Street Corporation in 2016, partially offset by a $1.9 billion gain from the sale of our Water business to Suez in 2017. |
• | $1.4 billion of held for sale losses in 2017. This included $0.8 billion related to the substantial majority of our Lighting segment and $0.6 billion related to two businesses within our Aviation segment. |
• | $1.0 billion of higher restructuring and other charges resulting from a charge of $1.2 billion for the impairment of Power Conversion goodwill and a charge of $0.3 billion for the impairment of a power plant asset, partially offset by a decrease of $0.5 billion of Oil & Gas related charges recorded at Corporate. |
• | $0.2 billion of higher costs associated with our principal retirement plans including the effects of lower discount rates. |
• | These increases were partially offset by $0.5 billion of lower costs resulting from restructuring and cost reduction actions. |
2016
–
2015
COMMENTARY
Revenues and other income increased $2.0 billion, primarily a result of:
• | $1.9 billion of higher net gains from disposed and held for sale businesses, which included a $3.1 billion gain from the sale of our Appliances business to Haier and a $0.4 billion gain from the sale of GE Asset Management to State Street Corporation in 2016, partially offset by a $0.1 billion impairment charge related to a potential sale of a non-strategic platform in our Aviation business in 2016. Gains on disposed or held for sale businesses in 2015 included a $0.6 billion gain from the sale of our Signaling business, a $0.2 billion break-up fee paid by Electrolux AB due to the termination of the agreement to acquire our Appliances business, and $0.5 billion in other income from a settlement related to the NBCU transaction. |
Operating costs decreased $0.9 billion, primarily as a result of:
• | $1.9 billion of higher net gains from disposed and held for sale businesses, which included a $3.1 billion gain from the sale of our Appliances business to Haier and a $0.4 billion gain from the sale of GE Asset Management to State Street Corporation in 2016, partially offset by a $0.1 billion impairment charge related to a potential sale of a non-strategic platform in our Aviation business in 2016. Gains on disposed or held for sale businesses in 2015 included a $0.6 billion gain from the sale of our Signaling business, a $0.2 billion break-up fee paid by Electrolux AB due to the termination of the agreement to acquire our Appliances business, and $0.5 billion in other income from a settlement related to the NBCU transaction, and |
• | $0.7 billion of lower costs associated with our principal retirement plans including the effects of higher discount rates. |
• | These decreases were partially offset by $1.8 billion higher restructuring and other charges, which included $0.7 billion of higher restructuring and other charges associated with the Alstom acquisition. |
GE 2017 FORM 10-K 59
MD&A | CORPORATE ITEMS AND ELIMINATIONS | |
RESTRUCTURING
Restructuring actions are an essential component of our cost improvement efforts to both existing operations and those recently acquired. Restructuring and other charges relate primarily to workforce reductions, facility exit costs associated with the consolidation of sales, service and manufacturing facilities, the integration of recent acquisitions, including Alstom, the Baker Hughes transaction, and other asset write-downs. We continue to closely monitor the economic environment and may undertake further restructuring actions to more closely align our cost structure with earnings and cost reduction goals.
RESTRUCTURING & OTHER CHARGES |
|
|
| ||||||
|
|
|
| ||||||
(In billions) | 2017 | | 2016 | | 2015 | | |||
|
|
|
| ||||||
Workforce reductions | $ | 1.1 | | $ | 1.3 | | $ | 0.4 | |
Plant closures & associated costs and other asset write-downs | 1.9 | | 1.3 | | 0.6 | | |||
Acquisition/disposition net charges | 0.9 | | 0.7 | | 0.4 | | |||
Goodwill impairment(a) | 1.2 | | - | | - | | |||
Other | 0.2 | | 0.3 | | 0.3 | | |||
Total(b) | $ | 5.3 | | $ | 3.6 | | $ | 1.7 | |
(a) | The goodwill impairment charge for Power Conversion is recorded in Other costs and expenses in the Statement of Earnings (Loss). See Note 8 to the consolidated financial statements for further information. |
(b) | Subsequent to the Baker Hughes transaction, restructuring and other charges are included in the determination of segment profit for our Oil & Gas segment. |
For 2017, restructuring and other charges were $5.3 billion of which approximately $2.4 billion was reported in cost of products/services, $1.6 billion was reported in selling, general and administrative expenses (SG&A), and $1.2 billion was reported in other costs and expenses. These activities were primarily at Power, Corporate and Oil & Gas. Cash expenditures for restructuring and other charges were approximately $2.0 billion. Subsequent to the Baker Hughes transaction and beginning in the third quarter of 2017, $0.8 billion of restructuring and other charges was recorded in the Oil & Gas segment. This amounted to $0.7 billion net of noncontrolling interest. Prior to the Baker Hughes transaction, $0.2 billion of restructuring and other charges related to Oil & Gas was recorded at Corporate.
For 2016, restructuring & other charges were $3.6 billion of which approximately $2.3 billion was reported in cost of products/services and $1.2 billion was reported in other costs and expenses (SG&A). These activities were primarily at Power, Oil and Gas and Healthcare. Cash expenditures for restructuring were approximately $1.7 billion in 2016.
For 2015, restructuring and other charges were $1.7 billion of which approximately $1.0 billion was reported in cost of products/services and $0.6 billion was reported in other costs and expenses (SG&A). These activities were primarily at Oil & Gas, Power and Corporate. Cash expenditures for restructuring were approximately $1.0 billion in 2015.
60 GE 2017 FORM 10-K
MD&A | CORPORATE ITEMS AND ELIMINATIONS | |
COSTS AND GAINS NOT INCLUDED IN SEGMENT RESULTS
As discussed in the Segment Operations section within the MD&A, certain amounts are not included in industrial operating segment results because they are excluded from measurement of their operating performance for internal and external purposes. The amount of costs and gains (losses) not included in segment results follows.
COSTS |
|
|
|
|
| ||||||
|
|
|
|
|
| ||||||
(In billions) | 2017 | |
| 2016 | |
| 2015 | | |||
|
|
|
|
|
| ||||||
Power(a) | $ | 2.0 | | (f) | $ | 1.5 | | (f) | $ | 0.5 | |
Renewable Energy | 0.3 | |
| 0.3 | |
| 0.2 | | |||
Oil & Gas(b) | 0.2 | |
| 0.8 | |
| 0.5 | | |||
Aviation | 0.1 | |
| 0.1 | |
| - | | |||
Healthcare | 0.3 | |
| 0.5 | |
| 0.3 | | |||
Transportation | 0.2 | |
| 0.2 | |
| 0.1 | | |||
Lighting(a) | 0.2 | |
| 0.3 | |
| 0.1 | | |||
Total | $ | 3.3 | |
| $ | 3.7 | |
| $ | 1.7 | |
GAINS (LOSSES) |
|
|
|
|
| ||||||
|
|
|
|
|
| ||||||
(In billions) | 2017 | |
| 2016 | |
| 2015 | | |||
|
|
|
|
|
| ||||||
Power(a) | $ | 1.9 | | (d) | - | |
| $ | 0.1 | | |
Renewable Energy | - | |
| - | |
| - | | |||
Oil & Gas(b) | - | |
| - | |
| - | | |||
Aviation | (0.6 | ) | (e) | (0.2 | ) |
| - | | |||
Healthcare | - | |
| - | |
| 0.1 | | |||
Transportation | - | |
| - | |
| 0.6 | | |||
Lighting(a) | (0.8 | ) | (e) | 3.1 | | (c) | - | | |||
Total | $ | 0.5 | |
| $ | 3.0 | |
| $ | 0.9 | |
(a) | Beginning in the third quarter of 2017, the Energy Connections business within the former Energy Connections & Lighting segment has been combined with the Power segment and presented as one reporting segment called Power. As a result of this combination, our GE Lighting and Current, powered by GE (Current) businesses are now reported as a separate segment called Lighting. The Lighting segment included the Appliances business for the year ended December 31, 2015, and through its disposition in the second quarter of 2016. |
(b) | Subsequent to the Baker Hughes transaction restructuring and other charges are included in the determination of segment profit for our Oil & Gas segment. |
(c) | Related to the sale of our Appliances business in the second quarter of 2016. |
(d) | Related to the sale of our Water business in the third quarter of 2017. |
(e) | Related to held for sale charges in our Lighting and Aviation businesses in the fourth quarter of 2017. |
(f) | Included a charge of $1.2 billion for the impairment of Power Conversion goodwill in 2017 and $0.9 billion of Alstom-related restructuring and other charges in 2016. |
GE 2017 FORM 10-K 61
MD&A | OTHER CONSOLIDATED INFORMATION | |
OTHER CONSOLIDATED INFORMATION
INTEREST AND OTHER FINANCIAL CHARGES
Interest and other financial charges amounted to $4.9 billion , $5.0 billion and $3.5 billion in 2017 , 2016 and 2015 , respectively.
GE interest and other financial charges (exclusive of interest on assumed debt) amounted to $2.8 billion, $2.0 billion and $1.7 billion in 2017, 2016 and 2015, respectively. The increase in 2017 compared to 2016 was primarily due to higher interest and other financial charges primarily as a result of monetization programs with GE Capital, as well as an increase in the average long-term debt balance, partially offset by lower rates on long-term debt.
GE Capital interest and other financial charges (inclusive of interest on debt assumed by GE), was $3.1 billion , $3.8 billion and $2.3 billion in 2017 , 2016 and 2015 , respectively. Included in interest expense were an insignificant amount, $0.6 billion , and $0.2 billion of debt extinguishment costs in 2017 , 2016 and 2015 , respectively. GE Capital average borrowings were $103.8 billion , $145.0 billion and $216.8 billion in 2017 , 2016 and 2015 , respectively. The GE Capital average composite effective interest rate (including interest allocated to discontinued operations) was 3.1% in 2017 , 3.0% in 2016 and 2.6% in 2015 . Excluding the effect of debt extinguishment costs, the GE Capital average composite effective interest rate (including interest allocated to discontinued operations) was 3.1% in 2017 , 2.6% in 2016 and 2.6% in 2015 . The rate increase from 2016 to 2017 was primarily attributable to higher benchmark interest rates. See the Liquidity and Borrowings section within the MD&A for a discussion of liquidity, borrowings and interest rate risk management.
It is our policy to allocate GE Capital interest expense that is either directly attributable or related to discontinued operations. The allocation is based on a market based leverage ratio, taking into consideration the underlying characteristics of the assets for the specific discontinued operations. Interest expense that is associated with debt that is not assumed by the buyer or required to be repaid as a result of the disposal transaction is reflected in other continuing operations after the disposal occurs.
POSTRETIREMENT BENEFIT PLANS
BENEFIT PLANS COST |
|
|
| ||||||
(In billions) | 2017 | | 2016 | | 2015 | | |||
|
|
|
| ||||||
Principal pension plans | $ | 3.7 | | $ | 3.6 | | $ | 4.5 | |
Other pension plans | 0.3 | | 0.4 | | 0.4 | | |||
Principal retiree benefit plans | - | | 0.1 | | 0.2 | | |||
Total | $ | 4.0 | | $ | 4.1 | | $ | 5.0 | |
PRINCIPAL PENSION PLANS(a) |
|
|
| |||
| 2017 | | 2016 | | 2015 | |
|
|
|
| |||
Discount rates (December 31) | 3.64 | % | 4.11 | % | 4.38 | % |
Expected rate of return | 7.50 | % | 7.50 | % | 7.50 | % |
(a) Our principal pension plans are the GE Pension Plan and the GE Supplementary Pension Plan.
2017
–
2016
COMMENTARY
• | Postretirement benefit plan cost decreased $0.1 billion as lower service cost resulting from fewer active principal pension plan participants and earnings from pension plan assets were essentially offset by the effects of lower discount rates and higher loss amortization related to our principal pension plans. |
2016
–
2015
COMMENTARY
• | Postretirement benefit plans cost decreased $0.9 billion , primarily because of the effects of higher discount rates, lower service cost resulting from fewer active principal pension plans participants and lower loss amortization related to our principal pension plans. |
• | We updated our mortality assumptions at December 31, 2016 based on guidance issued by the Society of Actuaries to reflect updated rates and methodology for future mortality improvements. The new mortality assumptions decreased our principal pension plans obligations by $0.6 billion at year-end 2016. |
62 GE 2017 FORM 10-K
MD&A | OTHER CONSOLIDATED INFORMATION | |
Looking forward, our key assumptions affecting 2018 postretirement benefits cost are as follows:
• | Discount rate at 3.64% for our principal pension plans, reflecting current long-term interest rates. |
• | Assumed long-term return on our principal pension plan assets of 6.75% , a decrease from 7.5% in 2017. |
We expect 2018 postretirement benefit plans cost to be about the same as 2017 .
PENSION COSTS
GAAP AND NON-GAAP PENSION COSTS |
|
|
| ||||||
|
|
|
| ||||||
(In billions) | 2017 | | 2016 | | 2015 | | |||
|
|
|
| ||||||
Principal pension plans cost (GAAP) | $ | 3.7 | | $ | 3.6 | | $ | 4.5 | |
Operating pension cost (Non-GAAP) | 1.4 | | 1.6 | | 1.7 | | |||
Our operating pension cost* for our principal pension plans includes only those components that relate to benefits earned by active employees during the period (service cost, prior service cost amortization and curtailment loss). Non-operating pension cost* elements such as interest cost, expected return on plan assets and non-cash amortization of actuarial gains and losses are excluded from this measure.
In 2018, we will adopt ASU No. 2017-07, Improving the Presentation of Net Periodic Pension Cost and Net Periodic Postretirement Benefit Cost . See the Other Items - New Accounting Standards section within the MD&A for further information on pension cost reporting.
FUNDED STATUS OF PLANS
The table below presents the funded status of our benefit plans. The funded status represents the fair value of plan assets less benefit obligations.
FUNDED STATUS |
|
| ||||
|
|
| ||||
(In billions) | 2017 | | 2016 | | ||
|
|
| ||||
GE Pension Plan | $ | (17.9 | ) | $ | (19.1 | ) |
GE Supplementary Pension Plan | (6.7 | ) | (6.5 | ) | ||
Other pension plans | (4.1 | ) | (5.5 | ) | ||
Principal retiree benefit plans | (5.5 | ) | (5.7 | ) | ||
Our principal pension plans are the GE Pension Plan and the GE Supplementary Pension Plan.
2017
–
2016
COMMENTARY
• | The GE Pension Plan deficit decreased in 2017 primarily due to investment performance, employer contributions and changes in mortality and salary assumptions, partially offset by lower discount rates and the growth in pension liabilities. |
• | The decrease in the deficit of our other pension plans was primarily attributable to investment performance and employer contributions, partially offset by liability growth. |
• | The decrease in the principal retiree benefit plans deficit was primarily attributable to employer contributions, partially offset by the growth in retiree benefit liabilities. |
The Employee Retirement Income Security Act (ERISA) determines minimum pension funding requirements in the U.S. We made $1.7 billion and $0.3 billion contributions to the GE Pension Plan in 2017 and 2016. On an ERISA basis, our preliminary estimate is that the GE Pension Plan was approximately 94% funded at January 1, 2018. The ERISA funded status is higher than the GAAP funded status ( 74% funded) primarily because the ERISA prescribed interest rate is calculated using an average interest rate. As a result, the ERISA interest rate is higher than the year-end GAAP discount rate. The higher ERISA interest rate lowers pension liabilities for ERISA funding purposes. Our current plan is to fund approximately $6.0 billion of pension contributions to the GE Pension Plan in 2018. Our projected 2018 contributions satisfy our minimum ERISA funding requirement of $1.5 billion and the remaining $4.5 billion will be a voluntary contribution to the plan. We do not expect to make any contributions to the GE Pension Plan in 2019.
*Non-GAAP Financial Measure
GE 2017 FORM 10-K 63
MD&A | OTHER CONSOLIDATED INFORMATION | |
We expect to contribute approximately $0.6 billion to our other pension plans in 2018 , as compared to $0.9 billion in 2017 and $0.8 billion in 2016 . GE Capital is a member of certain GE Pension Plans. As a result of the GE Capital Exit Plan, GE Capital had additional funding obligations for these pension plans. These obligations did not relate to the Verticals and were recognized as expense in GE Capital's other continuing operations. The additional funding obligations recognized by GE Capital were $0.2 billion and $0.6 billion for the years ended December 31, 2017 and 2016, respectively. See the Intercompany Transactions between GE and GE Capital section within the MD&A for further information.
We also expect to contribute approximately $0.4 billion to our principal retiree benefit plans in 2018 similar to our actual contributions of $0.4 billion in both 2017 and 2016.
The funded status of our postretirement benefit plans and future effects on operating results depend on economic conditions, interest rates and investment performance. See the Critical Accounting Estimates section within the MD&A and Note 12 to the consolidated financial statements for further information about our benefit plans and the effects of this activity on our financial statements.
INCOME TAXES
GE pays the income taxes it owes in every country in which it does business. Many factors impact our income tax expense and cash tax payments. The most significant factor is that we conduct business in over 180 countries and the majority of our revenue is earned outside the U.S., often in countries with lower tax rates than in the U.S. We reinvest most of our foreign earnings overseas to be able to fund our active non-U.S. business operations. Our tax liability is also affected by U.S. and foreign tax incentives designed to encourage certain investments, like research and development; and by acquisitions, dispositions and tax law changes. On December 22, 2017, the U.S. enacted the Tax Cuts and Jobs Act ("U.S. tax reform") that lowers the statutory tax rate on our U.S. earnings, taxes historic foreign earnings at a reduced rate of tax, creates a territorial tax system and enacts new taxes associated with global operations. Our provisional estimate of the transition tax on historic foreign earnings and the effect on our deferred taxes is described below. Finally, our tax returns are routinely audited, and settlements of issues raised in these audits sometimes affect our tax rates.
GE and GE Capital file a consolidated U.S. federal income tax return. This enables GE and GE Capital to use tax deductions and credits of one member of the group to reduce the tax that otherwise would have been payable by another member of the group. The effective tax rate reflects the benefit of these tax reductions in the consolidated return. GE makes cash payments to GE Capital for tax reductions and GE Capital pays for tax increases at the time GE's tax payments are due.
CONSOLIDATED
(Dollars in billions) | 2017 | | 2016 | | 2015 | |
|
|
|
| |||
Effective tax rate (ETR) | 34.6 | % | (5.1 | )% | 79.2 | % |
Provision (benefit) for income taxes | (3.0) | (0.5) | 6.5 | |||
Cash income taxes paid(a) | 2.4 | 7.5 | 2.5 | |||
(a) | Includes taxes paid related to discontinued operations. |
2017
–
2016
COMMENTARY
• | The consolidated income tax rate for 2017 was 34.6%. This effective tax rate reflects a tax benefit on a consolidated pre-tax loss. |
• | The effective tax rate included a charge of $3.3 billion associated with the provisional estimate of the impact of the transition tax on historic foreign earnings ($1.2 billion) and the revaluation of deferred taxes ($2.2 billion) as a result of the enactment of U.S. tax reform. |
• | As discussed in Note 13 to the consolidated financial statements, the impact of U.S. tax reform on the revaluation of deferred taxes and the transition tax on historic earnings has been recorded on a provisional basis as the legislation provides for additional guidance to be issued by the U.S. Department of the Treasury on several provisions including the computation of the transition tax. Guidance during 2018 could impact the information required for, and the calculation of, the transition tax charge and could affect decisions on timing of various U.S. and foreign items, which would further impact the final 2017 amounts included in the transition charge and the revaluation of deferred taxes. In addition, analysis performed and conclusions reached as part of the tax return filing process and additional guidance on accounting for U.S. tax reform could affect the provisional amount. |
• | The consolidated tax rate excluding the effect of U.S. tax reform was 72.4%. This effective tax rate was also a tax benefit on a consolidated pre-tax loss. The tax benefit excluding the impact of tax reform was larger than 35% because of the benefit from lower-taxed international income compared to losses taxed at higher than the average rate and the benefit of the lower-taxed disposition of the Water business. |
• | The consolidated tax provision included $3.3 billion and $1.0 billion for GE (excluding GE Capital) for 2017 and 2016 , respectively. |
64 GE 2017 FORM 10-K
MD&A | OTHER CONSOLIDATED INFORMATION | |
2016
–
2015
COMMENTARY
• | The consolidated income tax rate for 2016 was (5.1)% . The effective tax rate was negative largely because of increased tax benefits from global operations including benefits from the repatriation of GE non-U.S. earnings, benefits of integrating our existing services business with Alstom's services business and foreign tax credit planning at GE Capital to reduce the tax cost of anticipated repatriations of foreign cash. |
• | The decrease in the consolidated provision for income tax was attributable to the increased benefit from global operations and the non-repeat of the 2015 charges associated with the GE Capital Exit Plan. |
• | As discussed in Note 13 to the consolidated financial statements, in 2015 in conjunction with the GE Capital Exit Plan, we incurred tax expense of $6.3 billion related to expected repatriation of foreign earnings and write-off of deferred tax assets. |
• | The consolidated tax provision included $1.0 billion and $1.5 billion for GE (excluding GE Capital) for 2016 and 2015, respectively. |
BENEFITS FROM GLOBAL OPERATIONS
Absent the effects of U.S. tax reform and the GE Capital Exit Plan, our consolidated income tax provision is reduced because of the benefits of lower-taxed global operations. There is a benefit from global operations as non-U.S. income is subject to local country tax rates that are significantly below the historic 35% U.S. statutory rate. Most of these earnings have been reinvested in active non-U.S. business operations and as of December 31, 2017, we have not decided to repatriate these earnings to the U.S. As a result of U.S. tax reform, substantially all of our prior unrepatriated tax earnings were subject to U.S. tax and accordingly we expect to have the ability to repatriate those earnings without additional U.S. federal tax cost and any foreign withholding taxes on a repatriation to the U.S. would potentially be partially offset by a U.S. foreign tax credit. We will update our analysis of investment of foreign earnings in 2018 as we consider the impact of U.S. tax reform.
The rate of tax on our indefinitely reinvested non-U.S. earnings is below the historic 35% U.S. statutory tax rate because we have significant business operations subject to tax in countries where the tax on that income is lower than the U.S. statutory rate and because GE funds certain non-U.S. operations through foreign companies that are subject to low foreign taxes.
A substantial portion of the benefit related to business operations subject to tax in countries where the tax on that income is lower than the U.S. statutory rate is derived from our GECAS aircraft leasing operations located in Ireland where the earnings are taxed at 12.5%, from our Power operations located in Switzerland and Hungary where the earnings are taxed at between 9% and 18.6%, and our Healthcare operations in Europe where tax deductions are allowed for certain intangible assets and earnings are taxed below the historic U.S. statutory rate.
We expect our ability to benefit from non-U.S. income taxed at less than the U.S. rate to continue, subject to changes in U.S. or foreign law. Because the U.S. tax rate has been reduced to 21% beginning in 2018 and because the U.S. has adopted a territorial tax system as part of U.S. tax reform, the overall tax benefit from non-U.S. operations compared to the U.S. statutory rate will be reduced or eliminated going forward.
As part of U.S. tax reform, the U.S. has enacted a tax on "base eroding" payments from the U.S. We are evaluating the impact of this new provision on our operations and intend to undertake restructuring actions to avoid a significant impact from this provision. The U.S. has also enacted a minimum tax on foreign earnings ("global intangible low-taxed income"). Because we have tangible assets outside the U.S. and pay a rate of foreign tax above the minimum tax rate, we are not expecting a significant increase in tax liability from this new U.S. minimum tax. Because aspects of the new law and the effect on our operations is uncertain and because aspects of the accounting rules associated with the tax on global intangible low-taxed income have not been resolved, we have not made an accrual for the deferred tax effects of this provision.
BENEFITS FROM LOWER-TAXED GLOBAL OPERATIONS |
|
|
| ||||||
|
|
|
| ||||||
(In billions) | 2017 | | 2016 | | 2015 | | |||
|
|
|
| ||||||
Benefit of lower foreign tax rate on indefinitely reinvested non-U.S. earnings | $ | 0.8 | | $ | 0.9 | | $ | 1.1 | |
GE Capital Exit Plan | - | | - | | (6.1 | ) | |||
Benefit of audit resolutions | - | | 0.1 | | 0.2 | | |||
Other | 2.8 | | 1.1 | | 0.4 | | |||
Total | $ | 3.6 | | $ | 2.1 | | $ | (4.4 | ) |
2017
–
2016
COMMENTARY
The amounts reported above exclude the impact of U.S. tax reform which is reported as a separate line in the reconciliation of the U.S. federal statutory income tax rate to the actual tax rate in Note 13. Those impacts include $1.2 billion for the transition tax on historic foreign earnings and $1.4 billion to write-off deferred tax assets associated with investments in foreign subisidiaries.
GE 2017 FORM 10-K 65
MD&A | OTHER CONSOLIDATED INFORMATION | |
Included in "other" was an increase in the benefit from 2016 to 2017 from planning at GE Capital to reduce the tax cost of repatriations of foreign cash and to repatriate high-taxed foreign earnings at GE, partially offset by a decrease in the benefit from repatriation of GE non-U.S. earnings due to the non-repeat of the benefit of integrating our existing services business with Alstom's services business.
2016
–
2015
COMMENTARY
Our benefit from lower-taxed global operations increased in 2016 because of the nonrecurrence of the 2015 tax expense associated with the GE Capital Exit Plan and because of benefits from the repatriation of GE non-U.S. earnings, benefits of integrating our existing services business with Alstom's services business and foreign tax credit planning at GE Capital to reduce the tax cost of anticipated repatriations of foreign cash, all of which are included in "other" in the table above.
OTHER INFORMATION
Included in the total charge associated with U.S. tax reform for 2017 is a tax charge of $1.2 billion for the provisional estimate of the tax charge associated with the transition tax on historic foreign earnings under tax reform. As described above, we expect to finalize this amount as well as the impact of U.S. tax reform on deferred taxes during 2018. The provisional transition tax is computed on earnings as measured for U.S. tax purposes, that were reduced by netting of historic tax losses and by partial U.S. tax credit for foreign taxes paid on the historic earnings. The provisional tax charge is also reduced by $2.6 billion of U.S. tax accrued in prior years on foreign earnings. We expect the transition tax liability to be offset by accelerated use of deductions and tax credits.
Included in 2015 is a tax expense of $6.1 billion related to the expected repatriation of foreign earnings and write-off of deferred tax assets in conjunction with the GE Capital Exit Plan.
The tax benefit from non-U.S. income taxed at a local country rate rather than the U.S. statutory tax rate is reported in the caption "Tax on global activities including exports" in the effective tax rate reconciliation in Note 13 to the consolidated financial statements.
A more detailed analysis of differences between the U.S. federal statutory rate and the consolidated effective rate, as well as other information about our income tax provisions, is provided in the Critical Accounting Estimates section within the MD&A and Note 13 to the consolidated financial statements. The nature of business activities and associated income taxes differ for GE and for GE Capital; therefore, a separate analysis of each is presented in the paragraphs that follow.
GE EFFECTIVE TAX RATE (EXCLUDING GE CAPITAL EARNINGS)
We believe that the GE effective tax rate and provision for income taxes are best analyzed in relation to GE earnings before income taxes excluding the GE Capital net earnings from continuing operations, as GE tax expense does not include taxes on GE Capital earnings. See the Supplemental Information section within the MD&A, for further information on this calculation.
(Dollars in billions) | 2017 | | 2016 | | 2015 | | |||
|
|
|
| ||||||
GE ETR, excluding GE Capital earnings* | 84.8 | % | 8.7 | % | 13.8 | % | |||
GE provision for income taxes | $ | 3.3 | | $ | 1.0 | | $ | 1.5 | |
2017
–
2016
COMMENTARY
• | The GE provision for income taxes increased in 2017 because of the $3.7 billion charge for the provisional estimate of the transition tax on historic foreign earnings ($2.9 billion) and effect of revaluing our deferred taxes ($0.8 billion). |
• | Excluding the charge associated with U.S. tax reform, the GE tax provision decreased by $1.4 billion. The decrease was due primarily to a decrease in pre-tax income, excluding non-deductible held-for-sale and impairment losses, which is taxed at above the average tax rate ($1.6 billion). |
2016
–
2015
COMMENTARY
• | The GE provision for income taxes decreased in 2016 because of increased benefits from lower-taxed global operations ( $0.3 billion ), including benefits from the repatriation of GE non-U.S. earnings and benefits of integrating our existing services business with Alstom's services business. |
• | The GE provision for income taxes also decreased due to increases in the benefit from deductible stock losses ( $0.4 billion ). |
• | Partially offsetting these decreases was a lower benefit of audit resolutions ( $0.1 billion ) shown below. |
*Non-GAAP Financial Measure
66 GE 2017 FORM 10-K
MD&A | OTHER CONSOLIDATED INFORMATION | |
Resolution of audit matters reduced the GE provision for income taxes by $0.1 billion, $0.2 billion and $0.3 billion in 2017 , 2016 and 2015 , respectively. The effects of such resolutions are included in the following captions in Note 13 to the consolidated financial statements.
AUDIT RESOLUTIONS - EFFECT ON GE TAX RATE, EXCLUDING GE CAPITAL EARNINGS | |||||||||
|
|
|
|
|
|
| |||
| 2017 | |
| 2016 | |
| 2015 | |
|
|
|
|
|
|
|
| |||
Tax on global activities including exports | (0.8 | ) | % | (1.4 | ) | % | (1.5 | ) | % |
U.S. business credits | - | |
| - | |
| (0.5 | ) |
|
All other - net | (0.7 | ) |
| (0.4 | ) |
| (0.3 | ) |
|
Total | (1.5 | ) | % | (1.8 | ) | % | (2.3 | ) | % |
GE CAPITAL EFFECTIVE TAX RATE
(Dollars in billions) | 2017 | | 2016 | | 2015 | | |||
|
|
|
| ||||||
GE Capital ETR | 49.9 | % | 70.3 | % | (181.8 | )% | |||
GE Capital provision (benefit) for income taxes | $ | (6.3 | ) | $ | (1.4 | ) | $ | 5.0 | |
2017
–
2016
COMMENTARY
• | The increase in the tax benefit at GE Capital from a benefit of $1.4 billion in 2016 to a benefit of $6.3 billion is primarily due to the increase in the pre-tax loss with a tax benefit above the average tax rate including the one-time charge to revalue insurance reserves. |
• | The GE Capital tax provision included a benefit of $0.4 billion for the provisional estimate of the transition tax on historic foreign earnings ($1.8 billion benefit) partially offset by the effect of revaluing our deferred taxes ($1.4 billion charge). |
2016
–
2015
COMMENTARY
• | The decrease in the income tax expense for GE Capital from an expense of $5.0 billion to a benefit of $1.4 billion is primarily due to the nonrecurrence of the $6.3 billion tax expense, discussed in Note 13 to the consolidated financial statements, related to the GE Capital Exit Plan. |
• | The GE Capital tax expense also decreased in 2016 due to higher benefits from global operations including foreign tax credit planning to reduce the tax cost of anticipated repatriations of foreign cash. |
DISCONTINUED OPERATIONS
Discontinued operations primarily relate to our financial services businesses as a result of the GE Capital Exit Plan and were previously reported in the Capital Segment. These discontinued operations primarily comprise residual assets and liabilities related to our exited U.S. mortgage business (WMC), as discussed in MD&A Legal Proceedings and Note 21 to the consolidated financial statements, as well as our mortgage portfolio in Poland, indemnification liabilities associated with the sale of our GE Capital businesses, and other litigation and tax matters.
The mortgage portfolio in Poland comprises floating rate residential mortgages, of which approximately 85% are denominated in Swiss Francs and the remainder in local currency. At December 31, 2017, the portfolio had a carrying value of $3.1 billion with a 1.3% 90-day delinquency rate and an average loan to value ratio of 74%. The portfolio is recorded at fair value less cost to sell and includes a $0.3 billion impairment, which considered our best estimate of the effect of potential legislative relief to borrowers.
At December 31, 2017, we have provided specific indemnities to buyers of GE Capital's assets that, in the aggregate, represent a maximum potential claim of $2.6 billion. The majority of these indemnifications relate to the sale of businesses and assets under the GE Capital Exit Plan. We have recorded related liabilities of $0.3 billion, which incorporates our evaluation of risk and the likelihood of making payments under the indemnities. The recognized liabilities represent the estimated fair value of the indemnities when issued as adjusted for any subsequent probable and estimable losses. Approximately 20% of these exposures are expected to expire within the next five years, while substantially all indemnifications are expected to expire within the next ten years.
Also, in connection with the 2015 public offering and sale of Synchrony Financial, GE Capital indemnified Synchrony Financial and its directors, officers, and employees against the liabilities of GECC's businesses other than historical liabilities of the businesses that are part of Synchrony Financial's ongoing operations.
GE 2017 FORM 10-K 67
MD&A | OTHER CONSOLIDATED INFORMATION | |
Included within discontinued operations at December 31, 2017 are an estimated $1.5 billion of exposure related to tax audits and tax litigation matters for which we have recorded a reserve of $0.5 billion. Additionally, ongoing lawsuits and other litigation matters represent exposures of $1.3 billion for which we have recorded reserves of $0.1 billion.
See Notes 2 and 21 to the consolidated financial statements for additional information related to discontinued operations.
GEOGRAPHIC INFORMATION AND EXPOSURES
Our global activities span all geographic regions and primarily encompass manufacturing for local and export markets, import and sale of products produced in other regions, leasing of aircraft, sourcing for our plants domiciled in other global regions and provision of financial services within these regional economies. Thus, when countries or regions experience currency and/or economic stress, we often have increased exposure to certain risks, but also often have new opportunities that include, among other things, expansion of industrial activities through purchases of companies or assets at reduced prices and lower U.S. debt financing costs.
Financial results of our non-U.S. activities reported in U.S. dollars are affected by currency exchange. We use a number of techniques to manage the effects of currency exchange, including selective borrowings in local currencies and selective hedging of significant cross-currency transactions. Such principal currencies are the euro, the pound sterling, the Brazilian real and the Chinese renminbi.
REVENUES
Revenues are classified according to the region to which products and services are sold. For purposes of this analysis, the U.S. is presented separately from the remainder of the Americas.
GEOGRAPHIC REVENUES | ||||||||||||||
|
|
|
| V% | ||||||||||
(Dollars in billions) | 2017 | | 2016 | | 2015 | | 2017-2016 |
| 2016-2015 | |||||
|
|
|
|
|
|
| ||||||||
U.S. | $ | 46.3 | | $ | 53.6 | | $ | 53.2 | | (14) | % |
| 1 | % |
Non-U.S. |
|
|
|
|
|
| ||||||||
Europe | 22.6 | | 20.1 | | 16.8 | |
|
|
| |||||
Asia | 22.3 | | 21.4 | | 19.3 | |
|
|
| |||||
Americas | 11.8 | | 10.8 | | 12.0 | |
|
|
| |||||
Middle East and Africa | 19.1 | | 17.8 | | 16.0 | |
|
|
| |||||
Total Non-U.S. | 75.8 | | 70.1 | | 64.1 | | 8 | % |
| 9 | % | |||
Total | $ | 122.1 | | $ | 123.7 | | $ | 117.4 | | (1) | % |
| 5 | % |
|
|
|
|
|
|
| ||||||||
Non-U.S. Revenues as a % of Consolidated Revenues | 62 | % | 57 | % | 55 | % |
|
|
| |||||
NON-U.S. REVENUES AND EARNINGS
The increase in non-U.S. revenues in 2017 was primarily due to increases of 12% in Europe (primarily due to Baker Hughes), 10% in Latin America, and 7% in the Middle East and Africa.
The increase in non-U.S. revenues in 2016 was primarily due to increases of 20% in Europe (primarily due to Alstom), as well as growth in Asia of 11% and Middle East and Africa of 11%, partially offset by Latin America down 10%.
The effects of currency fluctuations on reported results were as follows:
• | Increased revenues by $0.6 billion in 2017, primarily driven by the euro ($0.4 billion), the Brazilian real ($0.3 billion), and the Indian rupee ($0.1 billion), partially offset by decreases in revenue driven by the pound sterling ($0.2 billion). |
• | Decreased revenues by $1.3 billion in 2016, primarily driven by the Brazilian real ($0.2 billion), pound sterling ($0.2 billion), euro ($0.1 billion) and the Chinese renminbi ($0.1 billion). |
The effects of foreign currency fluctuations decreased earnings by an immaterial amount in 2017. The effects of foreign currency fluctuations decreased earnings in 2016 by $0.3 billion.
68 GE 2017 FORM 10-K
MD&A | OTHER CONSOLIDATED INFORMATION | |
ASSETS
We classify certain assets that cannot meaningfully be associated with specific geographic areas as "Other Global" for this purpose.
TOTAL ASSETS (CONTINUING OPERATIONS) | ||||||
|
|
| ||||
December 31 (In billions) | 2017 | | 2016 | | ||
|
|
| ||||
U.S. | $ | 188.4 | | $ | 164.2 | |
Non-U.S. |
|
| ||||
Europe | 119.9 | | 123.0 | | ||
Asia | 23.9 | | 25.5 | | ||
Americas | 21.3 | | 21.1 | | ||
Other Global | 18.6 | | 16.6 | | ||
Total Non-U.S. | $ | 183.6 | | $ | 186.2 | |
Total | $ | 372.0 | | $ | 350.4 | |
The increase in total assets included the effects of the Baker Hughes transaction. For major changes in our asset profile during 2017, see the Statement of Financial Position section within MD&A.
VENEZUELA
We have experienced delays in collecting payments on our receivables from our primary customer in Venezuela, and while our outstanding receivables are not disputed, we recorded a pre-tax impairment charge of $201 million in the fourth quarter of 2017 to reflect the expected recoverable value of the trade receivables, financing receivables, contract assets and inventories related to our operations in Venezuela to service this customer. As of December 31, 2017, our remaining net exposure to this customer was $32 million.
Also during 2017, GE recorded write offs on other customer receivables of $62 million and an impairment of two buildings of $26 million.
STATEMENT OF FINANCIAL POSITION
Because GE and GE Capital share certain significant elements of their Statements of Financial Position, the following discussion addresses significant captions in the consolidated statement. Within the following discussions, however, we distinguish between GE and GE Capital activities in order to permit meaningful analysis of each individual consolidating statement.
MAJOR CHANGES IN OUR FINANCIAL POSITION DURING
2017
• | The Baker Hughes transaction increased total assets (excluding cash assumed as a result of the transaction) by $27.5 billion , primarily due to goodwill of $13.4 billion, property, plant and equipment of $4.9 billion, other intangible assets of $4.1 billion, current receivables of $2.4 billion and inventories of $1.7 billion. See Note 8 to the consolidated financial statements for further information. |
• | Cash and equivalents decreased $4.8 billion. As of the year ended December 31, 2017, GE Cash and equivalents excluding BHGE was $11.2 billion and BHGE Cash and equivalents was $7.0 billion. |
GE Cash and equivalents increased $7.7 billion due to the issuance of long-term debt of $12.5 billion (including $4.0 billion at BHGE), GE Industrial CFOA* of $7.0 billion, net activity in loans from GE Capital of $5.9 billion, common dividends from GE Capital of $4.0 billion, proceeds from business dispositions of $3.1 billion and commercial paper issuance of $1.5 billion, partially offset by payments of common dividends to shareowners of $8.4 billion, business acquisitions of $6.1 billion (net of $4.1 billion cash assumed as a result of the Baker Hughes transaction), maturity of long-term debt of $4.0 billion, net PP&E additions of $2.7 billion, treasury stock net purchases of $2.6 billion, net settlements of derivative hedges of $1.1 billion and additions to internal-use software of $0.5 billion.
GE Capital Cash and equivalents decreased $12.5 billion primarily due to net repayments of borrowings of $18.7 billion, net activity in loans to GE of $5.9 billion and payments of dividends to shareowners of $4.3 billion, partially offset by maturities of liquidity investments of $6.5 billion, cash collections from discontinued operations of $3.1 billion, net collections of financing receivables of $2.9 billion and proceeds from borrowings assumed by the buyer in a business disposition of $1.8 billion.
See the Statement of Cash Flows section of the MD&A for further information.
*Non-GAAP Financial Measure
GE 2017 FORM 10-K 69
MD&A | STATEMENT OF FINANCIAL POSITION |
|
• | Investment securities decreased $5.6 billion , primarily due to maturities of liquidity portfolio investments at GE Capital. See Note 3 to the consolidated financial statements for further information. |
• | Inventories decreased $2.1 billion (excluding the impact of the Baker Hughes transaction), primarily due to the classification of businesses as held for sale, liquidations in excess of material inputs and inventory obsolescence write-offs. See Note 5 to the consolidated financial statements for further information. |
• | Goodwill increased $0.2 billion (excluding the impact of the Baker Hughes transaction), primarily due to the effects of currency exchange of $1.9 billion, the acquisition of LM Wind Power in our Renewable Energy segment of $1.5 billion and the acquisition of ServiceMax in Digital of $0.7 billion, partially offset by the classification of various businesses in our Lighting, Aviation, Healthcare and Power segments as held for sale of $1.6 billion, the impairment of the Energy Financial Services business goodwill in our Capital segment of $1.4 billion and an impairment of the Power Conversion business goodwill in our Power segment of $1.2 billion. See Note 8 to the consolidated financial statements for further information. |
• | Contract assets increased $3.7 billion. Revenues in excess of billings increased $2.4 billion and $1.1 billion for our long-term service and equipment agreements, respectively. The remaining increase in contract assets of $0.2 billion is primarily due to an increase in deferred inventory costs partially offset by a decrease in nonrecurring engineering costs. See Note 9 to the consolidated financial statements for further information. |
• | Deferred income taxes increased $4.4 billion, primarily due to the increase in reserves for GE Capital's run-off insurance operations and planning at GE Capital to reduce the tax cost of repatriations of foreign cash, partially offset by the impact of U.S. tax reform. See Note 13 to the consolidated financial statements for further information. |
• | Assets of businesses held for sale increased $2.5 billion, primarily due to the classification of various businesses in our Lighting, Aviation, Healthcare and Power segments as held for sale in 2017, partially offset by the sale of our Water business. See Note 2 to the consolidated financial statements for further information. |
• | Assets of discontinued operations decreased $8.9 billion, primarily due to the disposition of businesses at GE Capital. See Note 2 to the consolidated financial statements for further information. |
• | The Baker Hughes transaction increased total liabilities by $6.8 billion, primarily due to borrowings of $3.4 billion, accounts payable of $1.1 billion, other GE current liabilities of $1.1 billion and non-current compensation and benefits of $0.7 billion. See Note 8 to the consolidated financial statements for further information. |
• | Borrowings decreased $5.0 billion (excluding the impact of the Baker Hughes transaction), primarily due to net repayment of borrowings at GE Capital of $18.7 billion and maturity of long-term debt at GE of $4.0 billion, partially offset by the issuance of long-term debt at GE of $12.5 billion (including $4.0 billion at BHGE) and the effects of currency exchange of $4.9 billion. See Note 10 to the consolidated financial statements for further information. |
• | Investment contracts, insurance liabilities and insurance annuity benefits increased $12.1 billion, primarily due to the recognition of a premium deficiency arising from our annual test that assessed the adequacy of future policy benefit reserves. See the Critical Accounting Estimate section of the MD&A and Note 11 to the consolidated financial statements for further information. |
• | Liabilities of discontinued operations decreased $3.5 billion, primarily due to the disposition of businesses at GE Capital. See Note 2 to the consolidated financial statements for further information. |
• | Common stock held in treasury increased $1.9 billion, primarily due to treasury stock purchases of $3.8 billion (book basis), partially offset by treasury stock issuances of $2.0 billion. |
• | Noncontrolling interests increased $16.1 billion, primarily due to the recognition of an approximate 37.5% noncontrolling interest attributable to BHGE's Class A shareholders in conjunction with the Baker Hughes transaction. See Note 8 to the consolidated financial statements for further information. |
70 GE 2017 FORM 10-K
MD&A | FINANCIAL RESOURCES AND LIQUIDITY | |
FINANCIAL RESOURCES AND LIQUIDITY
LIQUIDITY AND BORROWINGS
We maintain a strong focus on liquidity. At both GE and GE Capital we manage our liquidity to help provide access to sufficient funding to meet our business needs and financial obligations throughout business cycles.
Our liquidity and borrowing plans for GE and GE Capital are established within the context of our financial and strategic planning processes. Our liquidity and funding plans consider the liquidity necessary to fund our operating commitments, which include purchase obligations for inventory and equipment, payroll and general expenses (including pension funding). We also consider our capital allocation and growth objectives, including paying dividends, repurchasing shares, funding debt maturities and insurance obligations, investing in research and development and acquiring industrial businesses. We define our liquidity risk tolerance under stress based on liquidity sources, and our liquidity position is targeted to meet our obligations under both normal and stressed conditions.
GE cash and equivalents were $18.2 billion at December 31, 2017, including $7.0 billion at BHGE. At GE, we rely primarily on free cash flows from our operating businesses and for 2018, proceeds from announced dispositions and planned debt issuances. Cash generation can be subject to variability based on many factors, including seasonality, receipt of down payments on large equipment orders, timing of billings on long-term contracts, the effects of changes in end markets and our ability to execute dispositions. In 2018, our focus is on strengthening our cash position, with a balanced capital allocation plan including organic investments that generate strong returns, coupled with a competitive dividend payout ratio. We intend to maintain a disciplined financial policy targeting a strong credit profile.
In 2018, GE expects to incur up to $6.0 billion of incremental long-term debt, primarily to fund the GE Pension Plan. This incremental debt may consist of new unsecured term debt issued in the external debt markets or intercompany arrangements between GE and GE Capital, utilizing GE Capital's excess unsecured term debt.
Our 2018 capital allocation plan also considers potential funding of Alstom redemption rights related to certain consolidated joint ventures, which Alstom has expressed an intent to exercise. See Note 14 to the consolidated financial statements for further information.
GE has available a variety of liquidity management tools to fund its operations, including a commercial paper program, bank operating lines and short-term intercompany loans from GE Capital which are typically repaid within the same quarter. At GE Capital, we mainly rely on cash and short-term investments, cash generated from dispositions and cash flows from our businesses to fund our debt maturities, including the current portion of long-term debt ($14.1 billion at December 31, 2017), and our operating and interest costs.
Based on asset and liability management actions we have taken, GE Capital does not plan to issue any incremental GE Capital senior unsecured term debt until 2020. GE Capital expects to maintain an adequate liquidity position, primarily as a result of cash and short-term investments, cash generated from dispositions and cash flows from our businesses. During this period, we expect to continue to have excess interest costs as asset sales have outpaced our debt maturities. Additionally, as previously communicated, GE Capital expects to fund approximately $15.0 billion to our insurance subsidiaries over the next seven years, including approximately $3.5 billion in 2018, subject to ongoing monitoring by the Kansas Insurance Department. GE is required to maintain specified capital levels at these insurance subsidiaries under capital maintenance agreements.
As of December 31, 2017, GE Capital maintained liquidity sources of $30.9 billion that consisted of cash and equivalents of $25.1 billion, high-quality investments of $5.0 billion and cash and equivalents of $0.8 billion classified within discontinued operations. We also expect to generate incremental cash of approximately $15.0 billion from planned asset reduction actions over the next two years. Additionally, while we maintain adequate liquidity levels, we may engage in liability management actions, such as buying back debt, based on market and economic conditions in order to reduce our excess interest costs.
As part of GE's previously formulated and communicated plan to incur new long-term debt primarily to fund acquisitions and to refinance existing debt, we incurred $15.9 billion of incremental long-term debt in 2017 ( excluding BHGE) , comprising $8.6 billion equivalent of euro debt issued in the external debt markets and $7.3 billion through intercompany loans from two transactions with GE Capital in the first and third quarters of 2017. The $8.6 billion equivalent of externally-issued debt consists of €1,750 million of 0.375% Notes due 2022, €2,000 million of 0.875% Notes due 2025, €2,250 million of 1.50% Notes due 2029 and €2,000 million of 2.125% Notes due 2037. In lieu of issuing the $7.3 billion of debt externally in the capital markets, GE effected the transactions through GE Capital, utilizing a portion of its excess unsecured debt resulting from the GE Capital Exit Plan. The loans from GE Capital were priced at market terms and collectively have a weighted average interest rate and term of 3.5% and 15 years, respectively, and bear the right of offset against amounts owed by GE Capital to GE under the assumed debt agreement, thereby reducing the intercompany payables and receivables between GE and GE Capital by $7.3 billion .
During the fourth quarter of 2017, BHGE completed the issuance of $4.0 billion of new senior unsecured debt, consisting of $1,250 million of 2.773% Notes due 2022, $1,350 million of 3.337% Notes due 2027, and $1,350 million of 4.080% Notes due 2047.
GE 2017 FORM 10-K 71
MD&A | FINANCIAL RESOURCES AND LIQUIDITY | |
In 2015, senior unsecured notes and commercial paper were assumed by GE upon its merger with GE Capital resulting in an intercompany receivable and payable between GE and GE Capital. On the GE Statement of Financial Position, assumed debt is presented within borrowings with an offsetting receivable from GE Capital and on the GE Capital Statement of Financial Position, this is reflected as an intercompany payable to GE within borrowings. At December 31, 2017 , the outstanding assumed debt was $47.1 billion (see Note 10 to the consolidated financial statements for additional information). The following table provides a reconciliation of total short-term and long-term borrowings as reported on the respective GE and GE Capital Statements of Financial Position to borrowings originally issued by GE and GE Capital.
December 31, 2017 (In billions) | GE | | GE Capital | | Consolidated(a) | | |||
|
|
|
| ||||||
Total short- and long-term borrowings | $ | 81.6 | | $ | 55.4 | | $ | 134.6 | |
|
|
|
| ||||||
Debt assumed by GE from GE Capital | (47.1 | ) | 47.1 | | - | | |||
Intercompany loans with right of offset | 7.3 | | (7.3 | ) | - | | |||
Total intercompany payable (receivable) between GE and GE Capital | $ | (39.8 | ) | $ | 39.8 | | $ | - | |
|
|
|
| ||||||
Total borrowings issued and outstanding | $ | 41.7 | | $ | 95.2 | | $ | 134.6 | |
(a) | Included $2.3 billion elimination of other intercompany borrowings between GE and GE Capital. |
The following table illustrates the primary components of borrowings originally issued and outstanding by GE and GE Capital.
(In billions) |
|
|
|
| ||||
GE | December 31, 2017 | |
| GE Capital | December 31, 2017 | | ||
Commercial paper | $ | 3.0 | |
| Commercial paper | $ | 5.0 | |
Senior notes | 21.0 | |
| Senior and subordinated notes | 46.4 | | ||
Intercompany loans from GE Capital(a) | 7.3 | |
| Senior and subordinated notes assumed by GE | 47.1 | | ||
Other GE borrowings | 3.2 | |
| Intercompany loans to GE(a) | (7.3 | ) | ||
Total GE excluding BHGE | $ | 34.5 | |
| Other GE Capital borrowings | 3.9 | | |
BHGE borrowings | 7.2 | |
|
|
| |||
Total borrowings issued by GE | $ | 41.7 | |
| Total borrowings issued by GE Capital | $ | 95.2 | |
(a) | The intercompany loans from GE Capital to GE bear the right of offset against amounts owed by GE Capital to GE under the assumed debt agreement. |
LIQUIDITY SOURCES
GE cash and equivalents were $18.2 billion at December 31, 2017 , including $7.0 billion in BHGE. GE Capital maintained liquidity sources of $30.9 billion that consisted of cash and equivalents of $25.1 billion , high-quality investments of $5.0 billion and cash and equivalents of $0.8 billion classified as discontinued operations. Additionally, at December 31, 2017 , GE has $5.3 billion of committed 364-day bilateral operating lines extended by nine banks, which had no outstanding balance at December 31, 2017, as well as $20.0 billion of committed unused credit lines extended by 36 banks in a syndicated credit facility agreement expiring in 2021. In January and February 2018, GE entered into $15.0 billion of additional committed operating lines extended by six banks, expiring in 2019 and 2020. GE Capital has the right to compel GE to borrow under certain of these credit lines and transfer the proceeds as loans to GE Capital.
CASH AND EQUIVALENTS | ||||||||
|
|
|
|
| ||||
(In billions) | December 31, 2017 | |
|
| December 31, 2017 | | ||
|
|
|
|
| ||||
GE(a) | $ | 18.2 | |
| U.S. | $ | 13.7 | |
GE Capital(b) | 25.1 | |
| Non-U.S.(a) | 29.6 | | ||
(a) | At December 31, 2017 , $4.1 billion of GE cash and equivalents was held in countries with currency controls that may restrict the transfer of funds to the U.S. or limit our ability to transfer funds to the U.S. without incurring substantial costs. These funds are available to fund operations and growth in these countries and we do not currently anticipate a need to transfer these funds to the U.S. Included in this amount was $1.2 billion of BHGE cash and equivalents, which is subject to similar restrictions. |
(b) | At December 31, 2017 , GE Capital cash and equivalents of about $0.6 billion were primarily in insurance entities and was subject to regulatory restrictions. |
As a result of U.S. tax reform, approximately $10 billion of GE non-U.S. cash and equivalents at December 31, 2017 can be repatriated without incremental U.S. federal income tax. Included in this amount was approximately $2 billion of BHGE cash and equivalents.
72 GE 2017 FORM 10-K
MD&A | FINANCIAL RESOURCES AND LIQUIDITY | |
COMMERCIAL PAPER | ||||||
|
|
| ||||
(In billions) | GE | | GE Capital | | ||
|
|
| ||||
Average commercial paper borrowings during the fourth quarter of 2017 | $ | 17.3 | | $ | 6.1 | |
Maximum commercial paper borrowings outstanding during the fourth quarter of 2017 | 19.7 | | 7.0 | | ||
Ending commercial paper balance at December 31, 2017 | 3.0 | | 5.0 | | ||
GE Capital's commercial paper maturities have historically been funded principally through new commercial paper issuances, and GE's are substantially repaid within the respective quarter.
We securitize financial assets as an alternative source of funding. During 2017, we completed $1.7 billion of non-recourse issuances and $0.2 billion of non-recourse borrowings matured. At December 31, 2017, consolidated non-recourse securitization borrowings were $2.0 billion.
EXCHANGE RATE AND INTEREST RATE RISKS
Exchange rate and interest rate risks are managed with a variety of techniques, including match funding and selective use of derivatives. We use derivatives to mitigate or eliminate certain financial and market risks because we conduct business in diverse markets around the world and local funding is not always efficient. In addition, we use derivatives to adjust the debt we are issuing to match the fixed or floating nature of the assets we are originating. We apply strict policies to manage each of these risks, including prohibitions on speculative activities. Following is an analysis of the potential effects of changes in interest rates and currency exchange rates using so-called "shock" tests that seek to model the effects of shifts in rates. Such tests are inherently limited based on the assumptions used (described further below) and should not be viewed as a forecast; actual effects would depend on many variables, including market factors and the composition of the Company's assets and liabilities at that time.
• | It is our policy to minimize exposure to interest rate changes and their impact to interest and other financial charges. We fund our financial investments using debt or a combination of debt and hedging instruments so that the interest rates of our borrowings match the expected interest rate profile on our assets. To test the effectiveness of our hedging actions, we assumed that, on January 1, 2017, interest rates decreased by 100 basis points across the yield curve (a "parallel shift" in that curve) and further assumed that the decrease remained in place for the next 12 months. Based on the year-end 2017 portfolio and holding all other assumptions constant, we estimated that our consolidated net earnings for the next 12 months, starting in January 2017, would decline by less than $0.1 billion as a result of this parallel shift in the yield curve. |
• | It is our policy to minimize currency exposures and to conduct operations either within functional currencies or using the protection of hedge strategies. We analyzed year-end 2017 consolidated currency exposures, including derivatives designated and effective as hedges, to identify assets and liabilities denominated in other than their relevant functional currencies. For such assets and liabilities, we then evaluated the effects of a 10% shift in exchange rates between those currencies and the U.S. dollar, holding all other assumptions constant. This analysis indicated that our 2017 consolidated net earnings would decline by less than $0.1 billion as a result of such a shift in exchange rates. This analysis excludes any translation impact from changes in exchange rates on our financial results and any offsetting effect from the forecasted future transactions that are economically hedged. |
FOREIGN CURRENCY EXPOSURE
As a result of our global operations, we generate and incur a significant portion of our revenues and expenses in currencies other than the U.S. dollar. Such principal currencies are the euro, the pound sterling, the Brazilian real and the Chinese renminbi. The results of operating entities reported in currencies other than U.S. dollar are translated to the U.S. dollar at the applicable exchange rate for inclusion in the financial statements. We use a number of techniques to manage the effects of currency exchange, including selective borrowings in local currencies and selective hedging of significant cross-currency transactions. The foreign currency effect arising from operating activities outside of the U.S., including the remeasurement of derivatives, can result in significant transactional foreign currency fluctuations at points in time, but will generally be offset as the underlying hedged item is recognized in earnings. The effects of foreign currency fluctuations, excluding the earnings impact of the underlying hedged item, decreased net earnings for the year ended December 31, 2017 by less than $0.1 billion .
As of December 31, 2017, we held the U.S. dollar equivalent of $0.6 billion of cash in Angolan kwanza. As there is no liquid derivatives market for this currency, we have used Angolan kwanza to purchase $0.4 billion equivalent bonds issued by the central bank in Angola (Banco Nacional de Angola) with various maturities through 2020 to mitigate the related currency devaluation exposure risk. The bonds are denominated in Angolan kwanza as U.S. dollar equivalents, so that, upon payment of periodic interest and principal upon maturity, payment is made in Angolan kwanza, equivalent to the respective U.S. dollars at the then-current exchange rate.
See Note 19 to the consolidated financial statements for further information about our risk exposures, our use of derivatives, and the effects of this activity on our financial statements.
GE 2017 FORM 10-K 73
MD&A | FINANCIAL RESOURCES AND LIQUIDITY | |
DEBT AND DERIVATIVE INSTRUMENTS, GUARANTEES AND COVENANTS
CREDIT RATINGS
We have relied, and may continue to rely, on the short-term and long-term debt capital markets to fund, among other things, a significant portion of our operations and significant acquisitions. The cost and availability of debt financing is influenced by our credit ratings. Moody's Investors Service (Moody's), Standard and Poor's Global Ratings (S&P), and Fitch Ratings (Fitch) currently issue ratings on GE and GE Capital short- and long-term debt.
On December 4, 2017, S&P lowered the credit ratings of GE and GE Capital short- and long-term unsecured debt to A-1 from A-1+ and to A from AA-, respectively, with a Stable outlook. On November 28, 2017, Fitch lowered the credit ratings of GE and GE Capital short- and long-term unsecured debt to F1 from F1+ and to A+ from AA-, respectively, with a Negative outlook. On November 16, 2017, Moody's lowered the credit ratings of GE and GE Capital long-term unsecured debt to A2 from A1, with a Stable outlook. The P-1 short-term rating from Moody's remained unchanged.
We are disclosing these updates and the ratings below to enhance understanding of our sources of liquidity and the effects of our ratings on our costs of funds. Our ratings may be subject to a revision or withdrawal at any time by the assigning rating organization, and each rating should be evaluated independently of any other rating. For a description of some of the potential consequences of a reduction in our credit ratings, see "Risk Factors - Financial Risks - Funding access/costs - Failure to maintain our credit ratings, or conditions in the financial and credit markets, could adversely affect our access to capital markets, funding costs and related margins, liquidity and competitive position."
The credit ratings of GE and GE Capital as of the date of this filing are set forth in the table below.
| Moody's | S&P | Fitch |
|
|
|
|
GE |
|
|
|
Outlook | Stable | Stable | Negative |
Short term | P-1 | A-1 | F1 |
Long term | A2 | A | A+ |
|
|
|
|
GE Capital |
|
|
|
Outlook | Stable | Stable | Negative |
Short term | P-1 | A-1 | F1 |
Long term | A2 | A | A+ |
PRINCIPAL DEBT AND DERIVATIVE CONDITIONS
Certain of our derivative instruments can be terminated if specified credit ratings are not maintained and certain debt and derivatives agreements of other consolidated entities have provisions that are affected by these credit ratings.
Fair values of our derivatives can change significantly from period to period based on, among other factors, market movements and changes in our positions. We manage counterparty credit risk (the risk that counterparties will default and not make payments to us according to the terms of our standard master agreements) on an individual counterparty basis. Where we have agreed to netting of derivative exposures with a counterparty, we offset our exposures with that counterparty and apply the value of collateral posted to us to determine the net exposure. We actively monitor these net exposures against defined limits and take appropriate actions in response, including requiring additional collateral.
Swap, forward and option contracts are executed under standard master agreements that typically contain mutual downgrade provisions that provide the ability of the counterparty to require termination if the long-term credit ratings of the applicable GE entity were to fall below A-/A3 or other ratings levels agreed upon with the counterparty. In certain of these master agreements, the counterparty also has the ability to require termination if the short-term ratings of the applicable GE entity were to fall below A-1/P-1. The net derivative liability after consideration of netting arrangements, outstanding interest payments and collateral posted by us under these master agreements was estimated to be $0.3 billion at December 31, 2017 .
See Note 19 to the consolidated financial statements for further information about our risk exposures, our use of derivatives, and the effects of this activity on our financial statements.
74 GE 2017 FORM 10-K
MD&A | FINANCIAL RESOURCES AND LIQUIDITY | |
STATEMENT OF CASH FLOWS – OVERVIEW FROM
2015
THROUGH
2017
We evaluate our cash flows performance by reviewing our industrial (non-GE Capital) businesses and GE Capital businesses separately. Cash from operating activities (CFOA) is the principal source of cash generation for our industrial businesses.
All other operating activities reflect cash sources and uses as well as non-cash adjustments to net earnings (loss) including those related to taxes, pensions, contract assets, intangible amortization, restructuring and gains (losses) on principal business dispositions. See Note 22 to the consolidated financial statements for further information regarding All other operating activities and All other investing activities for both GE and GE Capital, and All other financing activities for GE Capital.
GE CASH FLOWS
With respect to GE CFOA, we believe that it is useful to supplement our GE Statement of Cash Flows and to examine in a broader context the business activities that provide and require cash.
The most significant source of cash in GE CFOA is customer-related activities, the largest of which is collecting cash resulting from product or services sales. The most significant operating use of cash is to pay our suppliers, employees, tax authorities and others for a wide range of material and services. Dividends from GE Capital represent the distribution of a portion of GE Capital retained earnings, and are distinct from cash from continuing operations within the GE Capital businesses.
In the following discussion, Net earnings for cash flows represents the adding together of Net earnings (loss) attributable to the Company, (Earnings) loss from discontinued operations and (Earnings) loss from continuing operations retained by GE Capital, excluding GE Capital dividends paid to GE.
See the Intercompany Transactions between GE and GE Capital section within the MD&A and Notes 4 and 23 to the consolidated financial statements for further information regarding certain transactions affecting our consolidated Statement of Cash Flows.
2017 – 2016 COMMENTARY:
GE cash from operating activities decreased $ 18.9 billion primarily due to the following:
• | GE Capital paid common dividends to GE totaling $4.0 billion in 2017 compared with $20.1 billion in 2016 . |
• | Cash generated from GE Industrial CFOA* amounted to $7.0 billion in 2017 and $9.9 billion in 2016 , respectively, primarily due to the following: |
• | Net earnings for cash flows plus depreciation and deferred income taxes of $4.2 billion in 2017 compared with $14.1 billion in 2016 . Net earnings for cash flows included pre-tax gains of $ 1.9 billion from the sale of Water in 2017 and $3.1 billion from the sale of Appliances and $0.4 billion from the sale of GEAM in 2016 which are not included in GE Industrial CFOA* and are instead reflected as a component of total Proceeds from principal business dispositions within Cash from (used for) investing activities. Net earnings for cash flows included non-cash pre-tax charges and impairments of $2.9 billion related to the classification of certain businesses in our Lighting and Aviation segments as held for sale, Power Conversion goodwill and a power plant asset in 2017 which are reflected as adjustments to cash provided from operating activities within All other operating activities. Net earnings for cash flows also included current tax expense of $2.8 billion in 2017 compared with current tax benefit of $0.1 billion in 2016. |
• | A decrease in cash generated from working capital of $1.2 billion in 2017 compared with 2016 . This was primarily due to an increase in cash used for accounts payable of $2.1 billion, mainly in our Power, Aviation and Renewable Energy segments, a decrease in cash generated from current receivables of $0.6 billion, mainly in our Oil & Gas segment (primarily due to the cessation of sales of current receivables to GE Capital in the fourth quarter of 2017), and a decrease in progress collections of $0.6 billion, including the benefit from the timing of progress collections received in the fourth quarter of 2017 of approximately $0.7 billion. The decreases in working capital were partially offset by an increase in cash generated from inventories of $2.1 billion, mainly in our Renewable Energy, Power and Healthcare segments and in our Appliances business, due to inventory build in the first half of 2016 which did not reoccur in 2017 as a result of the sale of the business in the second quarter of 2016. |
• | Cash used for contract assets was $ 4.0 billion in 2017 compared with $ 3.9 billion in 2016 . Cash used for contract assets in 2017 was primarily due to cumulative catch up adjustments driven by lower forecasted cost to complete the contracts as well as increased forecasted revenue on our long-term service agreements and the timing of revenue recognized relative to the timing of billings and collections on both our long-term service agreements and long-term equipment contracts. |
• | GE Pension Plan contributions of $1.7 billion in 2017 compared with $0.3 billion in 2016. |
• | Higher taxes paid of $2.7 billion in 2017 compared with $2.6 billion in 2016. |
GE 2017 FORM 10-K 75
MD&A | FINANCIAL RESOURCES AND LIQUIDITY | |
GE cash used for investing activities increased $6.3 billion primarily due to the following:
• | Business acquisition activities of $6.1 billion, primarily driven by the Baker Hughes transaction for $3.4 billion ($7.5 billion cash consideration, less $4.1 billion of cash assumed), LM Wind Power for $ 1.7 billion (net of cash acquired) and ServiceMax for $0.9 billion (net of cash acquired) in 2017 , compared with business acquisitions of $2.3 billion in 2016 , which included two European 3-D printing companies in our Aviation segment for $1.1 billion (net of cash acquired) . |
• | Business disposition proceeds of $3.1 billion, primarily driven by the sale of our Water business for $2.9 billion (net of cash transferred) in 2017, compared with proceeds of $5.4 billion, primarily driven by the sale of our Appliances business for $4.8 billion and the sale of GEAM for $0.4 billion in 2016 . |
• | Net cash paid for settlements of derivative hedges of $1.1 billion in 2017 . |
GE cash from financing activities increased $32.0 billion primarily due to the following:
• | Net repurchases of GE treasury shares of $2.6 billion and $21.4 billion in 2017 and 2016 , respectively. |
• | A net increase in borrowings of $16.0 billion in 2017 , mainly driven by the issuance of long-term debt of $12.5 billion, (including $4.0 billion at BHGE) and long-term loans from GE Capital to GE of $ 7.3 billion, partially offset by maturity of long-term debt of $4.0 billion and the settlement of the remaining portion of a 2016 short-term loan from GE Capital to GE of $1.3 billion, compared with a net increase in borrowings of $2.7 billion in 2016 , including a short-term loan from GE Capital to GE of $1.3 billion. |
2016 – 2015 COMMENTARY - CONTINUING OPERATIONS:
GE cash from operating activities increased $13.6 billion, primarily due to the following:
• | GE Capital paid common dividends totaling $20.1 billion and $4.3 billion to GE in 2016 and 2015, respectively. |
• | Cash generated from GE Industrial CFOA* amounted to $9.9 billion in 2016 and $12.1 billion in 2015 , respectively, primarily due to the following: |
• | Net earnings for cash flows plus depreciation and deferred income taxes of $14.1 billion in 2016 compared with $10.3 billion in 2015. Net earnings for cash flows included pre-tax gains of $3.1 billion from the sale of Appliances and $0.4 billion from the sale of GE Asset Management in 2016 and $0.6 billion from the sale of Signaling in 2015 which are not included in GE Industrial CFOA* and are instead reflected as a component of total Proceeds from principal business dispositions within Cash from (used for) investing activities. Net earnings for cash flows included restructuring charges of $3.6 billion and current tax benefit of $0.1 billion in 2016 compared with restructuring charges of $1.7 billion and current tax expense of $3.3 billion in 2015. Net earnings for cash flows also included settlements related to the NBCU transaction of $0.5 billion and an Electrolux break-up fee of $0.2 billion in 2015 which did not reoccur in 2016. |
• | An improvement in working capital of $3.6 billion in 2016 compared with 2015. This was primarily due to an increase in progress collections of $2.9 billion, mainly in our Power and Renewable Energy segments, and an improvement in accounts payable of $1.4 billion, mainly in our Power segment, partially offset by an increase in inventory build of $1.1 billion, mainly in our Power segment. |
• | Cash used for contract assets of $3.9 billion in 2016 compared with $1.9 billion in 2015, primarily due to cumulative catch up adjustments driven by lower forecasted cost to complete the contracts as well as increased forecasted revenue and the timing of revenue recognized relative to the timing of billings and collections on our long-term service agreements. |
• | $1.0 billion increase in income tax payments, including $1.4 billion in taxes related to the 2016 sale of our Appliances business to Haier. |
• | Higher restructuring payments of $0.6 billion when compared to 2015. |
• | $0.5 billion of 2016 incentive compensation payments due to long-term performance awards. No such payments were made in 2015. |
• | 2016 GE Pension Trust funding of $0.3 billion representing net sale proceeds associated with the July 1, 2016 sale of GEAM to State Street Corporation. |
GE cash used for investing activities decreased $10.8 billion, primarily due to the following:
• | Higher proceeds from principal business dispositions of $3.6 billion, primarily driven by the sale of our Appliances business to Haier for proceeds of $4.8 billion and the sale of GEAM for proceeds of $0.4 billion in 2016, compared to $1.7 billion of total proceeds from principal business dispositions in 2015. |
• | A decrease in business acquisition activity of $8.1 billion, primarily driven by the acquisition of Alstom for $10.1 billion in 2015. |
• | These decreases were partially offset by the funding of joint ventures of $0.4 billion in 2016, principally related to our Aviation business (reflected in All other investing activities). |
76 GE 2017 FORM 10-K
MD&A | FINANCIAL RESOURCES AND LIQUIDITY | |
GE cash used for financing activities increased $19.2 billion, primarily due to the following:
• | Net purchases of GE treasury shares of $21.4 billion, including $11.4 billion paid under ASR agreements compared to $1.1 billion in 2015. |
• | This increase in cash usage was partially offset by the following decreases: |
• | A net increase in borrowings of $0.8 billion, primarily driven by a short-term loan from GE Capital to GE of $1.3 billion in 2016. |
• | Lower dividends paid to shareowners of $0.8 billion due to lower shares outstanding in 2016 as a result of repurchases of GE treasury shares. |
GE CAPITAL CASH FLOWS
2017 – 2016 COMMENTARY - CONTINUING OPERATIONS:
GE Capital cash from operating activities increased $3.9 billion , primarily due to the following:
• | Lower cash paid for income taxes and interest of $2.3 billion. |
• | Net increase in cash collateral and settlements received from counterparties on derivative contracts of $1.2 billion and a general increase in cash generated from earnings (loss) from continuing operations. |
GE Capital cash from investing activities decreased $51.8 billion , primarily due to the following:
• | Net proceeds from the sales of our discontinued operations of $1.5 billion in 2017 compared to $59.9 billion in 2016 . |
• | Maturities of $10.4 billion related to interest bearing time deposits in 2016. |
• | Long-term loans from GE Capital to GE of $7.3 billion , partially offset by the settlement of the remaining portion of 2016 short-term loan from GE Capital to GE of $1.3 billion in 2017, compared to the remaining portion of a short-term loan from GE Capital to GE of $1.3 billion in 2016. |
• | Net cash paid for derivative settlements of an insignificant amount in 2017 compared to net cash received from derivative settlements of $0.4 billion in 2016 . |
• | These decreases were partially offset by the following increases: |
• | Investment securities of $18.0 billion related to maturities of $6.5 billion in 2017 compared to purchases of investment securities of $11.5 billion in 2016 . |
• | Higher collections of financing receivables of $4.2 billion in 2017. |
• | A general reduction in funding related to discontinued operations. |
GE Capital cash used for financing activities decreased $56.7 billion , primarily due to the following:
• | Lower net repayments of borrowings of $19.0 billion in 2017 compared to $58.8 billion in 2016. |
• | GE Capital paid common dividends to GE totaling $4.0 billion in 2017 compared to $20.1 billion in 2016. |
2016 – 2015 COMMENTARY - CONTINUING OPERATIONS:
GE Capital cash used for operating activities increased $3.1 billion , primarily due to the following:
• | Higher cash paid for income taxes of $2.6 billion . |
• | Higher cash paid for interest reflecting excess interest expense, and costs associated with the February and May 2016 debt tenders. |
• | These increases were partially offset by a net increase in cash collateral received from counterparties on derivative contracts of $1.7 billion . |
GE 2017 FORM 10-K 77
MD&A | FINANCIAL RESOURCES AND LIQUIDITY | |
GE Capital cash from investing activities decreased $12.2 billion , primarily due to the following:
• | Net proceeds from the sales of our CLL, Consumer and Real Estate businesses of $59.9 billion compared to $79.6 billion in 2015 . |
• | Liquidity investments of $11.5 billion purchased in 2016 . |
• | Net cash received from derivative settlements of $0.4 billion compared to $4.4 billion in 2015 . |
• | An increase in net financing receivables of $1.5 billion , including $4.3 billion in additions, partially offset by $2.1 billion received from the refinancing of our Receivables Facility and proceeds from the sale of receivables purchased from our Appliances business of $0.8 billion in 2016. |
• | A short-term loan from GE Capital to GE with remaining principal of $1.3 billion in 2016. |
• | These decreases were partially offset by the following increases: |
• | Investment and maturity of $20.8 billion related to high quality interest bearing deposits reflecting an investment of $10.4 billion in 2015 that matured in 2016 . |
• | Other investing activities of $3.9 billion , primarily due to a reduction in net additions to property, plant & equipment of $1.6 billion and an increase in aircraft deposits received of $1.5 billion . |
• | The 2015 acquisition of Milestone Aviation Group resulting in net cash paid of $1.7 billion . |
GE Capital cash used for financing activities increased $15.0 billion , primarily due to the following:
• | GE Capital paid common dividends to GE totaling $20.1 billion compared to $4.3 billion in 2015, partially offset by; |
• | Lower net repayments of borrowings of $58.8 billion compared to $59.3 billion in 2015, reflecting $2.1 billion of repayments resulting from the refinancing of our Receivables Facility in 2016 . |
GE CAPITAL DISCONTINUED OPERATIONS CASH FLOWS
2017 – 2016 COMMENTARY – DISCONTINUED OPERATIONS:
GE Capital cash used for operating activities-discontinued operations decreased $5.3 billion , primarily due to the following:
• | Lower cash paid for income taxes and interest in 2017. |
GE Capital cash used for investing activities-discontinued operations decreased $11.9 billion , primarily due to the following:
• | The sale of bank deposits for $16.5 billion in net cash paid in conjunction with the sale of GE Capital Bank's U.S. online deposit platform during 2016. |
• | The sale of bank deposits and other investments for $1.1 billion in net cash paid related to our Consumer platform during 2016. |
• | These decreases were partially offset by the following increases: |
• | Reduction of funding from continuing operations (primarily our treasury operations). |
• | Sale of bank deposits for $0.5 billion resulting in net cash paid related to our Consumer platform during 2017 . |
GE Capital cash from financing activities-discontinued operations increased $1.1 billion , primarily due to the following:
• | Debt issued of $1.8 billion in 2017 and $1.5 billion in 2016 by a discontinued business sold during the first quarter of 2017. |
• | Lower repayments of borrowings and bank deposit activity of $0.7 billion in 2017. |
2016 – 2015 COMMENTARY – DISCONTINUED OPERATIONS:
GE Capital cash used for operating activities-discontinued operations increased $14.3 billion , primarily due to the following:
• | Lower cash generated as a result of certain dispositions in our CLL business of $9.9 billion and Consumer business of $5.9 billion (primarily resulting from the 2015 split-off of Synchrony Financial), partially offset by our Real Estate business of $2.4 billion . In connection with the GE Capital Exit Plan, we closed a vast majority of our Consumer business and substantially all of our CLL and Real Estate business dispositions in 2015 and 2016 . |
• | Lower cash paid for interest, partially offset by higher cash paid for income taxes that are included in the above. |
GE Capital cash used for investing activities-discontinued operations increased $11.4 billion , primarily due to the following:
• | The sale of bank deposits for $16.5 billion in net cash paid in conjunction with the sale of GE Capital Bank's U.S. online deposit platform during 2016 . |
• | The sale of bank deposits and other investments for $1.1 billion in net cash paid related to our Consumer platform during 2016 . |
• | These increases were partially offset by Other investing activities of $6.2 billion , primarily higher net cash received on investment securities of $3.5 billion (including the sale of investment securities resulting from the split-off of Synchrony Financial) and cash generated from 2015 collections of financing receivables and other investing assets prior to disposition of the underlying business. |
78 GE 2017 FORM 10-K
MD&A | FINANCIAL RESOURCES AND LIQUIDITY | |
GE Capital cash from financing activities-discontinued operations increased $7.3 billion , primarily due to the following:
• | Lower repayments of borrowings of $9.3 billion as a result of certain dispositions in our Consumer (including the 2015 split-off of Synchrony Financial), CLL and Real Estate businesses, partially offset by; |
• | Other financing activities of $2.1 billion primarily newly issued debt of $1.5 billion in 2016 . |
INTERCOMPANY TRANSACTIONS BETWEEN GE AND GE CAPITAL
Over the last decade, GE has made significant strides in transforming its portfolio and focusing on its industrial leadership in the power, aviation and healthcare industries. GE has grown these infrastructure platforms with major portfolio transformation, investing in adjacencies and pursuing opportunities that are closely related to these core competencies. GE will continue to focus on these industries while leveraging evolving capabilities in digital, additive, and industrial research. GE will focus on strong end markets where we have competitive advantages, where there is opportunity for digital disruption, and where we can earn premium returns.
GE Capital, the financial arm of GE, provides financial and intellectual capital to GE's industrial businesses and its customers. GE Capital enables GE orders by either providing direct financing for a GE transaction or by bringing market participants together that result in industrial sales. On January 16, 2018, we announced plans to take actions to make GE Capital smaller and more focused, including a substantial reduction in the size of GE Capital's Energy Financial Services and Industrial Finance businesses over the next 24 months. We will retain origination capabilities to support our industrial businesses, however, we will transition to more funding by the capital markets, including export credit agencies and financial institutions. The transactions where GE and GE Capital are directly involved are made on arm's length terms and are reported in the GE and GE Capital columns of our financial statements. These transactions include, but are not limited to, the following:
• | GE Capital dividends to GE, |
• | GE Capital working capital solutions to optimize GE cash management, |
• | GE Capital enabled GE industrial orders, including related GE guarantees to GE Capital, |
• | GE Capital financing of GE long-term receivables, and |
• | A ircraft engines, power equipment, renewable energy equipment and healthcare equipment manufactured by GE that are installed on GE Capital investments, including leased equipment. |
In addition to the above transactions that primarily enable growth for the GE businesses, there are routine related party transactions, which include, but are not limited to, the following:
• | Expenses related to parent-subsidiary pension plans, |
• | Buildings and equipment leased between GE and GE Capital, including sale-leaseback transactions, |
• | Information technology (IT) and other services sold to GE Capital by GE , |
• | Settlements of tax liabilities, and |
• | Various investments, loans and allocations of GE corporate overhead costs. |
CASH FLOWS
GE Capital paid $4.0 billion, $20.1 billion and $4.3 billion of common dividends to GE in the years ended December 31, 2017 , 2016 and 2015 , respectively. GE did not receive a common share dividend distribution from GE Capital in the second half of 2017 and it does not expect to for the foreseeable future.
In order to manage short-term liquidity and credit exposure, GE sells current receivables to GE Capital and other third parties in part to fund the growth of our industrial businesses. During any given period, GE receives cash from the sale of receivables to GE Capital and other third parties, and it therefore forgoes the future collections of cash on receivables sold, as GE Capital collects the cash from the customer. GE also leverages GE Capital for its expertise in receivables collection services and sales of receivables to GE Capital are made on arm's length terms. These transactions can result in cash generation or cash use. The incremental amount of cash received from sales of receivables in excess of the cash GE would have otherwise collected had these receivables not been sold represents the cash generated or used in the period relating to this activity. The impact of current receivables sold to GE Capital, including current receivables subsequently sold to third parties, decreased GE's CFOA by $2.0 billion in 2017 and increased GE's CFOA by $2.1 billion in both 2016 and 2015 .
As of December 31, 2017 , GE Capital had approximately $10.4 billion recorded on its balance sheet related to current receivables purchased from GE. Of these amounts, approximately 40% had been sold by GE to GE Capital with recourse (i.e., the GE business retains the risk of default). The evaluation of whether recourse transactions qualify for accounting derecognition is based, in part, upon the legal jurisdiction of the sale; as such, the majority of recourse transactions outside the U.S. qualify for sale treatment. The effect on GE CFOA of claims by GE Capital on receivables sold with recourse to GE has not been significant for the years ended December 31, 2017 , 2016 and 2015 .
GE 2017 FORM 10-K 79
MD&A | FINANCIAL RESOURCES AND LIQUIDITY | |
In December 2016, GE Capital entered into a Receivables Facility with members of a bank group, designed to provide extra liquidity to GE. The Receivables Facility allows us to sell eligible current receivables on a non-recourse basis for cash and a deferred purchase price to members of the bank group. The purchase commitment of the bank group increased from $3.0 billion to $3.8 billion in 2017. See Note 4 to the consolidated financial statements for further information.
In certain circumstances, GE provides customers primarily within our Power, Renewable Energy and Aviation businesses with extended payment terms for the purchase of new equipment, purchases of significant upgrades and for fixed billings within our long-term service contracts. Similar to current receivables, GE may sell these long-term receivables to GE Capital to manage short-term liquidity and fund growth. These transactions are made on arm's length terms and any fair value adjustments, primarily related to time value of money, are recognized within the Industrial business in the period these receivables are sold to GE Capital. GE Capital accretes interest and factoring fee income over the life of the receivables. Factoring fee income is eliminated in our consolidated results. In addition, the long-term portion of any remaining outstanding receivables as of the end of the period are reflected in All other assets within our consolidated statement of financial position. GE Capital had approximately $ 2.1 billion, $ 1.9 billion and $ 0.1 billion of financing receivables related to GE long-term customer receivables outstanding, net of deferred income of approximately $ 0.3 billion, $ 0.3 billion and an insignificant amount recorded in its balance sheet as of December 31, 2017 , 2016 and 2015 , respectively. The effect of cash generated from the sale of these long-term receivables with GE Capital increased GE's CFOA by $0.3 billion, $1.6 billion and $ 0.1 billion in 2017, 2016 and 2015 , respectively.
ENABLED ORDERS
Enabled orders represent the act of introducing, elevating and influencing customers and prospects that result in industrial sales, potentially coupled with captive financing or incremental products or services. During the years ended December 31, 2017 and 2016 , GE Capital enabled $ 14.4 billion and $ 13.4 billion of GE industrial orders, respectively. 2017 orders are primarily with our Power ($ 5.9 billion), Renewable Energy ($ 4.6 billion), Healthcare ($ 1.9 billion) and Oil & Gas ($ 0.7 billion) businesses. Most of these enabled orders were financed by third-parties including export credit agencies and financial institutions.
AVIATION
During the years ended December 31, 2017 and 2016 , GE Capital acquired 50 aircraft (list price totaling $6.6 billion) and 44 aircraft (list price totaling $6.5 billion), respectively, from third parties that will be leased to others, which are powered by engines that were manufactured by GE Aviation and affiliates. Additionally, GE Capital had $1.2 billion and $1.5 billion of net book value of engines, originally manufactured by GE Aviation and affiliates and subsequently leased back to GE Aviation and affiliates at December 31, 2017 and 2016 , respectively.
PENSIONS
GE Capital is a member of certain GE Pension Plans. As a result of the GE Capital Exit Plan, GE Capital will have additional funding obligations for these pension plans. These obligations do not relate to the Verticals and are recognized as an expense in GE Capital's other continuing operations when they become probable and estimable. The additional funding obligations recognized by GE Capital were $ 0.2 billion, $0.6 billion and $0.2 billion for the years ended December 31, 2017 , 2016 and 2015, respectively.
Certain of this additional funding is recorded as a contra expense for GE, and GE's related future pension obligations will be paid by GE Capital. For certain other pension plan funding obligations triggered by the GE Capital Exit Plan, GE agreed to assume the funding obligation that would have been triggered by GE Capital at the date of exit from the plan in exchange for an assumption fee that GE recorded as Other income. The total cash transferred to GE for the assumption of these GE Capital funding obligations were zero , $0.2 billion and $0.1 billion for the years ended December 31, 2017 , 2016 and 2015, respectively.
On a consolidated basis, the additional required pension funding and any related assumption fees do not affect current period earnings. Any additional required pension funding will be reflected as a reduction of the pension liability when paid.
GE GUARANTEE OF GE CAPITAL THIRD-PARTY TRANSACTIONS
In certain instances, GE provides guarantees for GE Capital transactions with third parties primarily in connection with enabled orders. In order to meet its underwriting criteria, GE Capital may obtain a direct guarantee from GE related to the performance of the third party. GE guarantees can take many forms and may include, but not be limited to, direct performance or payment guarantees, return on investment guarantees, asset value guarantees and loss pool arrangements. As of December 31, 2017 , GE had outstanding guarantees to GE Capital on $2.1 billion of funded exposure and $0.8 billion of unfunded commitments . The recorded contingent liability for these guarantees was $0.2 billion as of December 31, 2017 and is based on individual transaction level defaults, losses and/or returns.
80 GE 2017 FORM 10-K
MD&A | FINANCIAL RESOURCES AND LIQUIDITY | |
GE GUARANTEE OF CERTAIN GE CAPITAL DEBT
GE provides implicit and explicit support to GE Capital through commitments, capital contributions and operating support. As previously discussed, GE debt assumed from GE Capital in connection with the merger of GE Capital into GE was $47.1 billion and GE guaranteed $44.0 billion of GE Capital debt at December 31, 2017 . See Note 23 to the consolidated financial statements for additional information about the eliminations of intercompany transactions between GE and GE Capital.
CONTRACTUAL OBLIGATIONS
As defined by reporting regulations, our contractual obligations for estimated future payments as of December 31, 2017 , follow.
| Payments due by period | ||||||||||||||
|
|
|
|
| 2023 and | | |||||||||
(In billions) | Total | | 2018 | | 2019-2020 | | 2021-2022 | | thereafter | | |||||
|
|
|
|
|
| ||||||||||
Borrowings (Note 10) | $ | 134.6 | | $ | 24.7 | | $ | 27.7 | | $ | 18.2 | | $ | 64.0 | |
Interest on borrowings | 40.8 | | 3.7 | | 6.0 | | 4.7 | | 26.4 | | |||||
Purchase obligations(a)(b) | 63.3 | | 22.1 | | 19.2 | | 12.5 | | 9.5 | | |||||
Insurance liabilities (Note 11)(c) | 38.0 | | 2.5 | | 4.1 | | 4.0 | | 27.4 | | |||||
Operating lease obligations (Note 25) | 5.3 | | 1.1 | | 1.7 | | 1.2 | | 1.3 | | |||||
Other liabilities(d) | 71.0 | | 15.3 | | 5.5 | | 5.5 | | 44.7 | | |||||
Contractual obligations of discontinued operations(e) | 1.6 | | 1.1 | | 0.1 | | 0.2 | | 0.2 | | |||||
(a) | Included all take-or-pay arrangements, capital expenditures, contractual commitments to purchase equipment that will be leased to others, software acquisition/license commitments, contractual minimum programming commitments and any contractually required cash payments for acquisitions. |
(b) | Excluded funding commitments entered into in the ordinary course of business. See Notes 19 and 21 to the consolidated financial statements for further information on these commitments and other guarantees. |
(c) | Included all contracts associated with our run-off insurance operations and represents the present value of future policy benefit and claim reserves. |
(d) | Included an estimate of future expected funding requirements related to our postretirement benefit plans and included liabilities for unrecognized tax benefits. Because their future cash outflows are uncertain, the following non-current liabilities are excluded from the table above: derivatives, deferred revenue and other sundry items. See Notes 12, 13 and 19 to the consolidated financial statements for further information on certain of these items. |
(e) | Included payments for other liabilities. |
Alstom holds redemption rights with respect to its interest in certain joint ventures, that would require us to purchase all of their interest, and Alstom has expressed an intent to exercise those redemption rights. None of the amounts related to Alstom's redemption rights are included in the above table. See Note 14 to the consolidated financial statements for further information.
GE 2017 FORM 10-K 81
MD&A | CRITICAL ACCOUNTING ESTIMATES | |
CRITICAL ACCOUNTING ESTIMATES
Accounting estimates and assumptions discussed in this section are those that we consider to be the most critical to an understanding of our financial statements because they involve significant judgments and uncertainties. Many of these estimates include determining fair value. All of these estimates reflect our best judgment about current, and for some estimates future, economic and market conditions and their potential effects based on information available as of the date of these financial statements. If these conditions change from those expected, it is reasonably possible that the judgments and estimates described below could change, which may result in future impairments of investment securities, goodwill, intangibles and long-lived assets, revisions to estimated profitability on long-term product service agreements, incremental losses on financing receivables, increases in reserves for contingencies, establishment of valuation allowances on deferred tax assets and increased tax liabilities, among other effects. Also see Note 1 to the consolidated financial statements, which discusses our most significant accounting policies.
REVENUE RECOGNITION ON LONG-TERM PRODUCT SERVICES AGREEMENTS
We have long-term service agreements with our customers predominately within our Power, Aviation, Transportation and Oil and Gas segments. These agreements require us to maintain the customers' assets over the contract term. Contract terms are generally 5 to 25 years. However, contract modifications that extend or revise contracts are not uncommon.
We recognize revenue as we perform under the arrangements based upon costs incurred at the estimated margin rate of the contract. Revenue recognition on long-term product services agreements requires estimates of both customer payments expected to be received over the contract term as well as the costs to perform required maintenance services.
Customers generally pay us based on the utilization of the asset (per hour of usage for example) or upon the occurrence of a major event within the contract such as an overhaul. As a result, a significant estimate in determining expected revenues of a contract is estimating how customers will utilize their assets over the term of the agreement. The estimate of utilization will impact both the amount of customer payments we expect to receive and our estimate of costs to complete the agreement as asset utilization will influence the timing and extent of overhauls and other service events over the life of the contract. We generally use a combination of both historical utilization trends as well as forward-looking information such as market conditions and potential asset retirements in developing our revenue estimates.
To develop our cost estimates, we consider the timing and extent of future maintenance and overhaul events, including the amount and cost of labor, spare parts and other resources required to perform the services. In developing our cost estimates, we utilize a combination of our historical cost experience and expected cost improvements. Cost improvements are only included in future cost estimates after savings have been observed in actual results or proven effective through an extensive regulatory or engineering approval process.
We routinely review estimates under product services agreements and regularly revise them to adjust for changes in outlook. These revisions are based on objectively verifiable information that is available at the time of the review. Contract modifications to exercise purchase options, add work scope or extend the contract term are generally accounted for as revisions to our future revenues and expected costs estimates. Certain contract modifications that significantly change the nature, timing and extent of remaining cash flows are effectively accounted for as a new contract.
The difference between the timing of our revenue recognition and cash received from our customers results in either a contract asset (revenue in excess of billings) or a contract liability (billing in excess of revenue). As of December 31, 2017, and 2016, we are in a net contract asset position of $15.2 billion and $12.8 billion, including contracts in liability position totaling $3.0 billion and $3.8 billion, respectively.
We regularly assess customer credit risk inherent in the carrying amounts of receivables and contract assets and estimated earnings, including the risk that contractual penalties may not be sufficient to offset our accumulated investment in the event of customer termination. We gain insight into future utilization and cost trends, as well as credit risk, through our knowledge of the installed base of equipment and the close interaction with our customers that comes with supplying critical services and parts over extended periods. Revisions may affect a product services agreement's total estimated profitability resulting in an adjustment of earnings; such adjustments increased earnings by $2.1 billion, $2.2 billion and $1.4 billion in 2017, 2016 and 2015, respectively. We provide for probable losses when they become evident.
See Notes 1 and 9 to the consolidated financial statements for further information.
82 GE 2017 FORM 10-K
MD&A | CRITICAL ACCOUNTING ESTIMATES | |
ASSET IMPAIRMENT
Asset impairment assessment involves various estimates and assumptions as follows:
INVESTMENTS
We regularly review investment securities for impairment using both quantitative and qualitative criteria. For debt securities, if we do not intend to sell the security and it is not more likely than not that we will be required to sell the security before recovery of our amortized cost, we evaluate other qualitative criteria to determine whether a credit loss exists, such as the financial health of and specific prospects for the issuer, including whether the issuer is in compliance with the terms and covenants of the security. Quantitative criteria include determining whether there has been an adverse change in expected future cash flows. For equity securities, our criteria include the length of time and magnitude of the amount that each security is in an unrealized loss position. Our other-than-temporary impairment reviews involve our finance, risk and asset management functions as well as the portfolio management and research capabilities of our internal and third-party asset managers. See Note 1 to the consolidated financial statements, which discusses the determination of fair value of investment securities.
See Notes 1 and 3 to the consolidated financial statements for further information about actual and potential impairment losses.
LONG-LIVED ASSETS
We review long-lived assets for impairment whenever events or changes in circumstances indicate that the related carrying amounts may not be recoverable. Determining whether an impairment has occurred typically requires various estimates and assumptions, including determining which undiscounted cash flows are directly related to the potentially impaired asset, the useful life over which cash flows will occur, their amount, and the asset's residual value, if any. In turn, measurement of an impairment loss requires a determination of fair value, which is based on the best information available. We derive the required undiscounted cash flow estimates from our historical experience and our internal business plans. To determine fair value, we use quoted market prices when available, our internal cash flow estimates discounted at an appropriate discount rate and independent appraisals, as appropriate.
Our operating lease portfolio of commercial aircraft is a significant concentration of assets in Capital, and is particularly subject to market fluctuations. Therefore, we test recoverability of each aircraft in our operating lease portfolio at least annually. Additionally, we perform quarterly evaluations in circumstances such as when aircraft are re-leased, current lease terms have changed or a specific lessee's credit standing changes. We consider market conditions, such as global demand for commercial aircraft. Estimates of future rentals and residual values are based on historical experience and information received routinely from independent appraisers. Estimated cash flows from future leases are reduced for expected downtime between leases and for estimated costs required to prepare aircraft to be redeployed. Fair value used to measure impairment is based on management's best estimates which are benchmarked against third-party appraiser current market values for aircraft of similar type and age.
See Notes 7 and 21 to the consolidated financial statements for further information on impairment losses and our exposure to the commercial aviation industry.
GOODWILL AND OTHER IDENTIFIED INTANGIBLE ASSETS
We test goodwill for impairment annually in the third quarter of each year using data as of July 1. The impairment test consists of two steps: in step one, the carrying value of the reporting unit is compared with its fair value; in step two, which is applied when the carrying value is more than its fair value, the amount of goodwill impairment, if any, is derived by deducting the fair value of the reporting unit's assets and liabilities from the fair value of its equity, and comparing that amount with the carrying amount of goodwill. We determined fair values for each of the reporting units using the market approach, when available and appropriate, or the income approach, or a combination of both. We assess the valuation methodology based upon the relevance and availability of the data at the time we perform the valuation. If multiple valuation methodologies are used, the results are weighted appropriately.
Valuations using the market approach are derived from metrics of publicly traded companies or historically completed transactions of comparable businesses. The selection of comparable businesses is based on the markets in which the reporting units operate giving consideration to risk profiles, size, geography, and diversity of products and services. A market approach is limited to reporting units for which there are publicly traded companies that have the characteristics similar to our businesses.
Under the income approach, fair value is determined based on the present value of estimated future cash flows, discounted at an appropriate risk-adjusted rate. We use our internal forecasts to estimate future cash flows and include an estimate of long-term future growth rates based on our most recent views of the long-term outlook for each business. Actual results may differ from those assumed in our forecasts. We derive our discount rates using a capital asset pricing model and analyzing published rates for industries relevant to our reporting units to estimate the cost of equity financing. We use discount rates that are commensurate with the risks and uncertainty inherent in the respective businesses and in our internally developed forecasts. Discount rates used in our reporting unit valuations ranged from 9.0% to 18.0%.
GE 2017 FORM 10-K 83
MD&A | CRITICAL ACCOUNTING ESTIMATES | |
Estimating the fair value of reporting units requires the use of estimates and significant judgments that are based on a number of factors including actual operating results. It is reasonably possible that the judgments and estimates described above could change in future periods.
During the third quarter of 2017, we performed our annual impairment test of goodwill for all of our reporting units. Based on the results of our step one testing, the fair values of each of the GE reporting units exceeded their carrying values except for the Power Conversion reporting unit, within our Power segment. Therefore, we performed the second step of the impairment test and recognized a non-cash goodwill impairment loss of $947 million during the third quarter.
In the fourth quarter of 2017, we performed an interim impairment test at our Power Conversion reporting unit and Energy Financial Services reporting unit, within our Capital segment, which indicated that the carrying values for each of these reporting units were in excess of its fair value. We therefore performed the second step of the impairment test, which resulted in non-cash impairment losses of $217 million and $1,386 million at our Power Conversion and Energy Financial Services reporting units, respectively.
We review identified intangible assets with defined useful lives and subject to amortization for impairment whenever events or changes in circumstances indicate that the related carrying amounts may not be recoverable. Determining whether an impairment loss occurred requires comparing the carrying amount to the sum of undiscounted cash flows expected to be generated by the asset. We test intangible assets with indefinite lives annually for impairment using a fair value method such as discounted cash flows.
See Notes 1 and 8 to the consolidated financial statements for further information.
BUSINESSES AND ASSETS HELD FOR SALE
Businesses and assets held for sale represent components that meet the accounting requirements to be classified as held for sale and are presented as single asset and liability amounts in our financial statements with a valuation allowance, if necessary, to recognize the net carrying amount at the lower of cost or fair value, less cost to sell. Financing receivables that no longer qualify to be presented as held for investment must be classified as assets held for sale and recognized in our financial statements at the lower of cost or fair value, less cost to sell, with that amount representing a new cost basis at the date of transfer.
The determination of fair value for businesses and assets held for sale involves significant judgments and assumptions. Development of estimates of fair values in this circumstance is complex and is dependent upon, among other factors, the nature of the potential sales transaction (for example, asset sale versus sale of legal entity), composition of assets and/or businesses in the disposal group, the comparability of the disposal group to market transactions, negotiations with third party purchasers, etc. Such factors bear directly on the range of potential fair values and the selection of the best estimates. Key assumptions are developed based on market observable data and, in the absence of such data, internal information that is consistent with what market participants would use in a hypothetical transaction.
We review all businesses and assets held for sale each reporting period to determine whether the existing carrying amounts are fully recoverable in comparison to estimated fair values.
PENSION ASSUMPTIONS
Pension assumptions are significant inputs to the actuarial models that measure pension benefit obligations and related effects on operations. Two assumptions – discount rate and expected return on assets – are important elements of plan expense and asset/liability measurement. We evaluate these critical assumptions at least annually on a plan and country-specific basis. We periodically evaluate other assumptions involving demographic factors such as retirement age, mortality and turnover, and update them to reflect our experience and expectations for the future. Actual results in any given year will often differ from actuarial assumptions because of economic and other factors.
Projected benefit obligations are measured as the present value of expected payments. We discount those cash payments using the weighted average of market-observed yields for high-quality fixed-income securities with maturities that correspond to the payment of benefits. Lower discount rates increase present values and subsequent-year pension expense; higher discount rates decrease present values and subsequent-year pension expense.
Our discount rates for principal pension plans at December 31, 2017 , 2016 and 2015 were 3.64% , 4.11% and 4.38% , respectively, reflecting market interest rates.
84 GE 2017 FORM 10-K
MD&A | CRITICAL ACCOUNTING ESTIMATES | |
To determine the expected long-term rate of return on pension plan assets, we consider current and target asset allocations, as well as historical and expected returns on various categories of plan assets. In developing future long-term return expectations for our principal benefit plans' assets, we formulate views on the future economic environment, both in the U.S. and abroad. We evaluate general market trends and historical relationships among a number of key variables that impact asset class returns such as expected earnings growth, inflation, valuations, yields and spreads, using both internal and external sources. We also take into account expected volatility by asset class and diversification across classes to determine expected overall portfolio results given current and target allocations. Assets in our principal pension plans earned 13.8% in 2017 , and had average annual returns of 8.2% , 4.0% and 8.3% per year in the 5-, 10- and 25-year periods ended December 31, 2017 , respectively. The average historical 10- and 25- year returns were significantly affected by investment losses in 2008. Based on our analysis of future expectations of asset performance, past return results, and our current and target asset allocations, including our previously announced $6.0 billion expected contribution to the GE Pension Plan in 2018, we have assumed a 6.75% long-term expected return on those assets for cost recognition in 2018 as compared to 7.5% in 2017, 2016 and 2015.
Changes in key assumptions for our principal pension plans would have the following effects.
• | Discount rate – A 25 basis point increase in discount rate would decrease pension cost in the following year by $0.2 billion and would decrease the pension benefit obligation at year-end by about $2.4 billion . |
• | Expected return on assets – A 50 basis point decrease in the expected return on assets would increase pension cost in the following year by $0.3 billion . |
See Other Consolidated Information – Postretirement Benefit Plans section within the MD&A and Note 12 to the consolidated financial statements for further information on our pension plans.
INCOME TAXES
Our annual tax rate is based on our income, statutory tax rates and tax planning opportunities available to us in the various jurisdictions in which we operate. Tax laws are complex and subject to different interpretations by the taxpayer and respective governmental taxing authorities. Significant judgment is required in determining our tax expense and in evaluating our tax positions, including evaluating uncertainties. We review our tax positions quarterly and adjust the balances as new information becomes available. Our income tax rate is significantly affected by the tax rate on our global operations. In addition to local country tax laws and regulations, this rate depends on the extent earnings are indefinitely reinvested outside the U.S. Historically U.S. taxes were due upon repatriation of foreign earnings. Due to the enactment of U.S. tax reform, repatriations of foreign earnings will generally be free of U.S. federal income tax but may incur withholding or state taxes. Indefinite reinvestment is determined by management's judgment about and intentions concerning the future operations of the Company. Most of these earnings have been reinvested in active non-U.S. business operations. At December 31, 2017 , we have not changed our indefinite reinvestment decision as a result of tax reform but will reassess this during the course of 2018 as we consider the impact of U.S. tax reform.
Deferred income tax assets represent amounts available to reduce income taxes payable on taxable income in future years. Such assets arise because of temporary differences between the financial reporting and tax bases of assets and liabilities, as well as from net operating loss and tax credit carryforwards. We evaluate the recoverability of these future tax deductions and credits by assessing the adequacy of future expected taxable income from all sources, including reversal of taxable temporary differences, forecasted operating earnings and available tax planning strategies. These sources of income rely heavily on estimates. We use our historical experience and our short- and long-range business forecasts to provide insight. Further, our global and diversified business portfolio gives us the opportunity to employ various prudent and feasible tax planning strategies to facilitate the recoverability of future deductions. Amounts recorded for deferred tax assets related to non-U.S. net operating losses, net of valuation allowances, were $3.7 billion and $3.1 billion at December 31, 2017 and 2016 , including $0.3 billion and $0.3 billion at December 31, 2017 and 2016 , respectively, of deferred tax assets, net of valuation allowances, associated with losses reported in discontinued operations, primarily related to our Real Estate and Consumer businesses and our loss on the sale of GE Money Japan. Such year-end 2017 amounts are expected to be fully recoverable within the applicable statutory expiration periods. To the extent we consider it more likely than not that a deferred tax asset will not be recovered, a valuation allowance is established.
The impact of U.S. tax reform has been recorded on a provisional basis as the legislation provides for additional guidance to be issued by the U.S. Department of the Treasury on several provisions including the computation of the transition tax on historic foreign earnings. Guidance during 2018 could impact the information required for and the calculation of the transition tax charge and could affect decisions on timing of various U.S. and foreign items which would further impact the final 2017 amounts included in the transition charge and the revaluation of deferred taxes. In addition, analysis performed and conclusions reached as part of the tax return filing process and additional guidance on accounting for U.S. tax reform could affect the provisional amount.
GE 2017 FORM 10-K 85
MD&A | CRITICAL ACCOUNTING ESTIMATES | |
Additionally, as part of U.S. tax reform, the U.S. has enacted a tax on "base eroding" payments from the U.S. We are evaluating the impact of this new provision on our operations and intend to restructure ongoing operations to avoid a significant impact from this provision. The U.S. has also enacted a minimum tax on foreign earnings ("global intangible low-taxed income"). Because we have tangible assets outside the U.S. and pay a rate of foreign tax above the minimum tax rate, we are not expecting a significant increase in tax liability from this new U.S. minimum tax. Because aspects of the new law and the effect on our operations is uncertain and because aspects of the accounting rules associated with the tax on global intangible low-taxed income have not been resolved, we have not made a provisional accrual for the deferred tax effects and consequently have not yet made an accounting policy election on the deferred tax treatment of this tax.
See Other Consolidated Information – Income Taxes section within the MD&A and Note 13 to the consolidated financial statements for further information on income taxes.
DERIVATIVES AND HEDGING
We use derivatives to manage a variety of risks, including risks related to interest rates, foreign exchange and commodity prices. Accounting for derivatives as hedges requires that, at inception and over the term of the arrangement, the hedged item and related derivative meet the requirements for hedge accounting. The rules and interpretations related to derivatives accounting are complex. Failure to apply this complex guidance correctly will result in all changes in the fair value of the derivative being reported in earnings, without regard to the offsetting changes in the fair value of the hedged item.
In evaluating whether a particular relationship qualifies for hedge accounting, we test effectiveness at inception and each reporting period thereafter by determining whether changes in the fair value of the derivative offset, within a specified range, changes in the fair value of the hedged item. If fair value changes fail this test, we discontinue applying hedge accounting to that relationship prospectively. Fair values of both the derivative instrument and the hedged item are calculated using internal valuation models incorporating market-based assumptions, subject to third-party confirmation, as applicable.
See Notes 1, 10 and 19 to the consolidated financial statements for further information about our use of derivatives.
FAIR VALUE MEASUREMENTS
Assets and liabilities measured at fair value every reporting period include investments in debt and equity securities and derivatives. Other assets and liabilities are subject to fair value measurements only in certain circumstances, including purchase accounting applied to assets and liabilities acquired in a business combination, impaired loans that have been reduced based on the fair value of the underlying collateral, cost and equity method investments and long-lived assets that are written down to fair value when they are impaired. Upon closing an acquisition, we estimate the fair values of assets and liabilities acquired and integrate the acquisition as soon as practicable. The size, scope and complexity of an acquisition will affect the time it takes to obtain the necessary information to record the acquired assets and liabilities at fair value. It may take up to one year to finalize the initial fair value estimates used in the preliminary purchase accounting. Accordingly, it is reasonably likely that our initial estimates will be subsequently revised, which could affect carrying amounts of goodwill, intangibles and potentially other assets and liabilities in our financial statements. Assets that are written down to fair value, less cost to sell when impaired are not subsequently adjusted to fair value unless further impairment occurs.
A fair value measurement is determined as the price we would receive to sell an asset or pay to transfer a liability in an orderly transaction between market participants at the measurement date. In the absence of active markets for the identical assets or liabilities, such measurements involve developing assumptions based on market observable data and, in the absence of such data, internal information that is consistent with what market participants would use in a hypothetical transaction that occurs at the measurement date. The determination of fair value often involves significant judgments about assumptions such as determining an appropriate discount rate that factors in both risk and liquidity premiums, identifying the similarities and differences in market transactions, weighting those differences accordingly and then making the appropriate adjustments to those market transactions to reflect the risks specific to our asset being valued.
See Notes 1, 3, 8, 18 and 19 to the consolidated financial statements for further information on fair value measurements and related matters.
OTHER LOSS CONTINGENCIES
Other loss contingencies are uncertain and unresolved matters that arise in the ordinary course of business and result from events or actions by others that have the potential to result in a future loss. Such contingencies include, but are not limited to environmental obligations, litigation, regulatory proceedings, product quality and losses resulting from other events and developments.
86 GE 2017 FORM 10-K
MD&A | CRITICAL ACCOUNTING ESTIMATES | |
When a loss is considered probable and reasonably estimable, we record a liability in the amount of our best estimate for the ultimate loss. When there appears to be a range of possible costs with equal likelihood, liabilities are based on the low-end of such range. However, the likelihood of a loss with respect to a particular contingency is often difficult to predict and determining a meaningful estimate of the loss or a range of loss may not be practicable based on the information available and the potential effect of future events and decisions by third parties that will determine the ultimate resolution of the contingency. Moreover, it is not uncommon for such matters to be resolved over many years, during which time relevant developments and new information must be continuously evaluated to determine both the likelihood of potential loss and whether it is possible to reasonably estimate a range of possible loss. When a loss is probable but a reasonable estimate cannot be made, disclosure is provided.
Disclosure also is provided when it is reasonably possible that a loss will be incurred or when it is reasonably possible that the amount of a loss will exceed the recorded provision. We regularly review all contingencies to determine whether the likelihood of loss has changed and to assess whether a reasonable estimate of the loss or range of loss can be made. As discussed above, development of a meaningful estimate of loss or a range of potential loss is complex when the outcome is directly dependent on negotiations with or decisions by third parties, such as regulatory agencies, the court system and other interested parties. Such factors bear directly on whether it is possible to reasonably estimate a range of potential loss and boundaries of high and low estimates.
See Note 21 to the consolidated financial statements for further information.
INSURANCE AND INVESTMENT CONTRACT LIABILITIES
Insurance and investment contract liabilities amounted to $38.1 billion and $26.1 billion at December 31, 2017 and 2016, respectively. These primarily comprise a liability for future policy benefits for those claims not yet incurred and claim reserves for claims that have been incurred or are estimated to have been incurred but not yet reported.
Future policy benefit reserves amounted to $30.6 billion and $18.7 billion primarily comprising $16.5 billion and $7.6 billion related to long-term care insurance contracts and $9.4 billion and $9.3 billion related to structured settlement annuities and other life and disability insurance products at December 31, 2017 and 2016, respectively. Long-term care insurance provides defined benefit levels of protection against the cost of long-term care services provided in the insured's home, in assisted living or nursing home facilities. Structured settlement annuities typically provide fixed monthly or annual annuity payments through death of the policyholder (with some specifying a minimum duration of payments) while traditional life and disability insurance triggers a payment in the event of death or disability of the policyholder.
Future policy benefit reserves represent the present value of future policy benefits less the present value of future net premiums and were first established based on actuarial assumptions at the time the policies were issued or acquired plus a margin for adverse deviation. These assumptions include, but are not limited to, interest rates, health care experience (including type and cost of care), morbidity, mortality, the length of time a policy will remain in force and anticipated future premium increases from future in-force rate actions. Assumptions are locked-in throughout the life of a contract unless a premium deficiency develops. Our annual premium deficiency testing assesses the adequacy of future policy benefit reserves, net of capitalized acquisition costs, using current assumptions. The results of historic premium deficiency testing were mostly driven by changes in assumptions, results from line of business experience studies and the impact from changes in estimated reinvestment rates on investment securities. We have not originated new policies since 2006.
During 2017, in response to elevated claim experience for a portion of our long-term care insurance contracts that was most pronounced for policyholders with higher attained ages, we initiated a comprehensive review of premium deficiency assumptions across all insurance products, which included reconstructing our future claim cost assumptions for long-term care contracts utilizing trends observed in our emerging experience for older claimant ages and later duration policies. Certain of our long-term care policyholders only recently started to reach the prime claim paying period and our new claim cost assumptions considered the emerging credibility of this claim data. In addition to the adverse impact from the revised future claim cost assumptions over a long-term horizon, our premium deficiency assumptions considered mortality, length of time a policy will remain in force and both near-term and longer-term investment return expectations. Future investment yields estimated in 2017 were lower than in previous premium deficiency tests, primarily due to the effect of near term yields on approximately $15 billion of future expected capital contributions. The test indicated a premium deficiency resulting in the unlocking of reserves and resetting of actuarial assumptions to current assumptions. This resulted in a $9.5 billion charge to earnings, which included a $0.4 billion impairment of deferred acquisition costs, a $0.2 billion impairment of present value of future profits, and an $8.9 billion increase in future policy benefit reserves. We commenced integrating these new assumptions into our systems and processes embedded in our framework of internal controls over financial reporting and expect to continue the integration in 2018.
We cede our insurance risk to third party reinsurers for a portion of our insurance contracts. As we are not relieved from primary obligation to policyholders or cedents, we record receivables that are estimated in a manner consistent with the future policy benefit reserves and claim reserves. Reserves ceded to reinsurers, net of allowance, were $2.5 billion and $2.0 billion at December 31, 2017 and 2016, respectively and are included in the caption "Other GE Capital receivables" on our consolidated Statement of Financial Position. In connection with our premium deficiency test in 2017, additions to reinsurance recoverables of $2.4 billion were largely offset by an allowance for losses of $2.2 billion based upon our assessment of collectability that would otherwise have reduced the earnings impact of the premium deficiency. The vast majority of our remaining net reinsurance recoverables are secured by assets held in a trust for which we are the beneficiary.
GE 2017 FORM 10-K 87
MD&A | CRITICAL ACCOUNTING ESTIMATES | |
A comprehensive review of premium deficiency assumptions is a complex process and depends on a number of factors, many of which are interdependent and require evaluation individually and in the aggregate across all insurance products. The vast majority of our run-off insurance operations comprises reinsurance from multiple ceding insurance entities with underlying treaties having unique terms and conditions. Premium deficiency testing relies on claim and policy information provided by these ceding entities and considers each of the unique treaties. In order to utilize that information for purposes of completing experience studies covering all key assumptions, we perform detailed procedures to conform and validate the data received, including periodic evaluation of the operating environment at ceding entities. Our long-term care business includes coverage where credible claim experience for higher attained ages is still emerging and to the extent that future experience deviates from current expectations, new projections of claim costs extending over the expected life of the policies may be required. Significant uncertainties exist in making current projections for these long-duration insurance contracts that include consideration of a wide range of possible outcomes as well as actuarial peer reviews before a final determination can be made.
In response to the premium deficiency, our future policy benefit reserves at December 31, 2017 were unlocked and updated to reflect our most recent assumptions. The primary assumptions used in the premium deficiency tests include:
Morbidity . Morbidity assumptions used in estimating future policy benefit reserves are based on estimates of expected incidences of disability and claim costs, and include consideration of antiselection and estimates of expected future morbidity improvement. Historical premium deficiency assumptions considered the risk of antiselection by including issue age adjustments to morbidity based on an actuarial assumption that long-term care policies issued to younger individuals have exhibited lower expected incidences and claim costs than those issued to older policyholders. Recent claim experience and the development of reconstructed claim cost curves indicated minimal issue age adjustments impacting claim cost projections and accordingly, in 2017 issue age adjustments were no longer assumed in developing morbidity assumptions.
Mortality . Mortality assumptions used in estimating future policy benefit reserves are based on published mortality tables as adjusted for the results of our experience studies and estimates of expected future mortality improvement. For life insurance products, higher mortality increases our future policy benefit reserves, while for annuity and long-term care insurance contracts, higher mortality decreases our future policy benefit reserves.
Discount rate . Interest rate assumptions used in estimating future policy benefit reserves are based on expected investment yields, net of related investment expenses. In estimating future yields, we consider the actual yields on our current investment securities held by our run-off insurance operations, the future rates at which we expect to reinvest any proceeds from investment security maturities, and the average long-term yield we expect from the proceeds of estimated future capital contributions into our run-off insurance operations. Such contribution may comprise cash that will be used to purchase investment securities or other qualifying investments from GE Capital's portfolio. The adverse impact on our statutory reserves arising from our revised assumptions, including the collectability of reinsurance recoverables, is expected to require GE Capital to contribute approximately $15 billion additional capital to its run-off insurance operations in 2018-2024, subject to ongoing monitoring by the Kansas Insurance Department. GE is required to maintain specified capital levels at these insurance subsidiaries under a capital maintenance agreement. The cash component of the capital contribution will be invested at the current market yields at the time of contribution, which has the impact of lowering the average long-term investment yield used to calculate the discount rate and, as such, further adversely impacted the estimated premium deficiency. Our discount rate assumptions for purposes of performing premium deficiency assessments ranged from 2.6% - 6.0% in 2017 with a weighted-average rate of 5.7% across different tenors and 5.3% - 6.7% in 2016 with a weighted-average rate of 6.2%.
Future long-term care premium rate increases . We consider recent experience with rate increases in establishing our current expectations. As a reinsurer, we rely upon the primary insurers that underwrite the underlying policies to propose rate increases to the relevant state insurance regulator as we have no ability to institute premium rate increases on the policyholders themselves.
We perform premium deficiency testing at least annually. The results of this test are sensitive to the assumptions described above. Any future adverse changes in our assumptions could result in an increase to future policy benefit reserves. For example, a hypothetical five percent increase in future claim costs, holding all other assumptions constant, would result in a $1.5 billion increase to our future policy benefit reserves. Similarly, a hypothetical 25 basis point decline in expected investment yield, holding all other assumptions constant, would result in a $1.0 billion increase in future policy benefit reserves. Any favorable changes to these assumptions could result in additional margin in our premium deficiency test and higher income over the remaining duration of the portfolio, including higher investment income.
Claim reserves amounted to $5.1 billion and $4.6 billion of which $3.6 billion and $3.1 billion relates to long-term care insurance contracts as of December 31, 2017 and 2016, respectively. Claim reserves are established when a claim is incurred or is estimated to have been incurred and represents our best estimate of the ultimate obligations for future claim payments and claim adjustment expenses. Key inputs include actual known facts about the claims, such as the benefits available and cause of disability of the claimant, as well as assumptions derived from our actual historical experience and expected future changes in experience factors. Claim reserves are evaluated periodically for potential changes in loss estimates with the support of qualified actuaries and any changes are recorded in the period in which they are determined.
See Notes 1 and 11 to the consolidated financial statements for further information.
88 GE 2017 FORM 10-K
MD&A | OTHER ITEMS |
|
OTHER ITEMS
NEW ACCOUNTING STANDARDS
ASU NO. 2018-02, INCOME STATEMENT - REPORTING COMPREHENSIVE INCOME (TOPIC 220): RECLASSIFICATION OF CERTAIN TAX EFFECTS FROM ACCUMULATED OTHER COMPREHENSIVE INCOME
In February 2018, the Financial Accounting Standards Board (FASB) issued Accounting Standards Update (ASU) No. 2018-02, Income Statement - Reporting Comprehensive Income (Topic 220): Reclassification of Certain Tax Effects from Accumulated Other Comprehensive Income . The ASU provides that the stranded tax effects from the Tax Cuts and Jobs Act on the balance of other comprehensive earnings may be reclassified to retained earnings. The ASU is effective for periods beginning after December 15, 2018, with an election to adopt early. We are evaluating the effect of the standard on our consolidated financial statements.
ASU NO. 2017-07, COMPENSATION-RETIREMENT BENEFITS (TOPIC 715): IMPROVING THE PRESENTATION OF NET PERIODIC PENSION COST AND NET PERIODIC POSTRETIREMENT BENEFIT COST
In March 2017, the Financial Accounting Standards Board (FASB) issued ASU No. 2017-07, Compensation-Retirement Benefits (Topic 715): Improving the Presentation of Net Periodic Pension Cost and Net Periodic Postretirement Benefit Cost . The ASU is effective for annual periods beginning after December 15, 2017, and requires the service cost component of the net periodic costs for pension and postretirement plans to be presented in the same line item in the statement of earnings as other employee related compensation costs, with the non-service related costs in a separate line outside of operating income. This change to the income statement will be reflected on a retrospective basis when adopted. In addition, the ASU specifies that only the service cost component is eligible for inventory capitalization following the date of adoption, which is not expected to have a material effect to our financial statements.
ASU NO. 2016-18, STATEMENT OF CASH FLOWS: RESTRICTED CASH
In November 2016, the FASB issued ASU No. 2016-18, Statement of Cash Flows: Restricted Cash . The new standard requires the changes in the total of cash and restricted cash to be presented in the statement of cash flows. In addition, when cash and restricted cash are presented on separate lines on the balance sheet, an entity is required to reconcile the totals in the statement of cash flows to the related line items in the balance sheet. We had $0.7 billion of restricted cash reported within the Other Assets line of our Statement of Financial Position for the year ended December 31, 2017.
ASU NO. 2016-16, ACCOUNTING FOR INCOME TAXES: INTRA-ENTITY TRANSFERS OF ASSETS OTHER THAN INVENTORY
In October 2016, the FASB issued ASU No. 2016-16, Accounting for Income Taxes: Intra-Entity Asset Transfers of Assets Other than Inventory . The ASU eliminates the deferral of the tax effects of intra-entity asset transfers other than inventory. As a result, the tax expense from the intercompany sale of assets, other than inventory, and associated changes to deferred taxes will be recognized when the sale occurs even though the pre-tax effects of the transaction have not been recognized. The new standard is effective for annual periods beginning after December 15, 2017, and interim periods within those annual periods. The effect of the adoption of the standard will depend on the nature and amount of future transactions but is currently expected as an increase to retained earnings of approximately $0.6 billion . Future earnings will be reduced in total by this amount. The effect of the change on future transactions will depend on the nature of those transactions as it will affect the timing of recognition of both tax expense and tax benefits, with no change in associated cash flows.
ASU NO. 2016-15, STATEMENT OF CASH FLOWS: CLASSIFICATION OF CERTAIN CASH RECEIPTS AND CASH PAYMENTS
In August 2016, the FASB issued ASU No. 2016-15, Statement of Cash Flows: Classification of Certain Cash Receipts and Cash Payments . The new standard requires that cash receipts from payments on a transferor's beneficial interests in securitized trade receivables should be classified as cash inflows from investing activities. The new standard is effective for fiscal years beginning after December 15, 2017 and will be adopted on a retrospective basis. Note 4 to the Financial Statements describes the deferred purchase price (DPP) created by the Receivables Facility. We currently report cash receipts from the purchasing entities to reduce their DPP obligation to the Company as cash inflows from operating activities in the consolidated Statement of Cash Flows.
GE 2017 FORM 10-K 89
MD&A | OTHER ITEMS |
|
ASU NO. 2016-02, LEASES
In February 2016, the FASB issued ASU No. 2016-02, Leases . The new standard establishes a right-of-use (ROU) model that requires a lessee to record a ROU asset and a lease liability on the balance sheet for all leases with terms longer than 12 months. Leases will be classified as either finance or operating, with classification affecting the pattern of expense recognition. Similarly, lessors will be required to classify leases as sales-type, finance or operating, with classification affecting the pattern of income recognition. Classification for both lessees and lessors will be based on an assessment of whether risks and rewards as well as substantive control have been transferred through a lease contract. The new standard is effective for fiscal years beginning after December 15, 2018, including interim periods within those fiscal years, with early adoption permitted. A modified retrospective transition approach is required for leases existing at, or entered into after, the beginning of the earliest comparative period presented in the financial statements, with certain practical expedients available. While we continue to evaluate the effect of the standard on our ongoing financial reporting, we anticipate that the adoption of the ASU may materially affect our Statement of Financial Position.
ASU NO. 2014-09, REVENUE FROM CONTRACTS WITH CUSTOMERS
BACKGROUND
In May 2014, the FASB issued a new comprehensive set of revenue recognition principles (ASU No. 2014-09, Revenue from Contracts with Customers ) that supersedes most existing U.S. GAAP revenue recognition guidance (including ASC 605-35, Revenue Recognition - Construction-Type and Production-Type Contracts ). The new standard will become effective for annual reporting periods beginning after December 15, 2017. We will adopt the standard on January 1, 2018, will apply it retrospectively to all periods presented and will elect the practical expedient for contract modifications.
CHANGE IN TIMING AND PRESENTATION, NO IMPACT TO CASH OR ECONOMICS
The new standard requires companies to identify contractual performance obligations and determine whether revenue should be recognized at a point in time or over time based on when control of goods and services transfer to a customer. As a result, we expect significant changes in the presentation of our financial statements, including: (1) timing of revenue recognition, and (2) changes in classification between revenue and costs. The new standard will have no cash impact and, as such, does not affect the economics of our underlying customer contracts. The effect of applying the new guidance to our existing book of contracts will result in lower reported earnings in 2018 (and comparative periods previously reported) and in the early years after adoption. However, we expect to experience an increase in reported earnings, on that existing book of contracts, as they mature. The new standard will provide for a better alignment of cash and earnings for the affected long-term customer contracts and we expect that it will enhance comparability across industry peers.
SPECIFIC EFFECT ON GE BUSINESSES
Power and Aviation Service Agreements - For our long-term product service agreements, primarily in our Power and Aviation businesses, we expect to continue to recognize revenue based on costs incurred plus an estimated margin rate (over time model). However, the new standard provides prescriptive guidance tied to several factors for determining what constitutes the proper scope of a customer contract for accounting purposes. These factors include optional purchases, contract modifications, and termination clauses. For example, under the new standard contract modifications will be accounted for prospectively by recognizing the financial effect of the modification over the remaining life of the contract. Under existing accounting guidance revisions to estimated margin rates resulting from modifications were reflected as cumulative effect adjustments to earnings in the current period.
Aviation Commercial Engines - Consistent with industry peers, the financial presentation of our Aviation Commercial engines business will be significantly affected as they will be accounted for as of a point in time, which is a change from our current long-term contract accounting process. Our current process applies contract-specific estimated margin rates, which include the effect of estimated cost improvements, to costs incurred. This change is required because our commercial engine contracts do not transfer control to the customer during the manufacturing process. Each install and spare engine will be accounted for as a separate performance obligation, reflecting the actual price and manufacturing costs of such engines. We expect that the most significant effect of this change will be reflected when we have new engine launches, where the cost of earlier production units is higher than the cost of later production units because of cost improvements.
All Other Large Equipment - For the remainder of our equipment businesses, the new revenue standard requires emphasis on transfer of control rather than risks and rewards, which may accelerate timing of revenue recognition versus our current practices. For example, in our Renewable Energy business we wait for risk of loss to be assumed by the customer before recognizing revenue, which generally occurs later than when control is transferred.
90 GE 2017 FORM 10-K
MD&A | OTHER ITEMS |
|
CURRENT RANGE OF FINANCIAL STATEMENT EFFECT
We will adopt the new standard as of January 1, 2018. When we report our 2018 results, the comparative results for 2017 and 2016 will
be updated to reflect the application of the requirements of the new standard to these periods. Based on our assessment and best estimates to date, we expect a non-cash charge to our January 1, 2016 retained earnings balance of approximately $4.2 billion. We estimate that the charge will comprise approximately $1.0 billion related to commercial aircraft engines and $3.3 billion related primarily to our services businesses (predominately in Power and Aviation). Beyond those effects, we expect application of the new guidance will result in increases and decreases in revenue within our segments, which will largely offset overall and will be immaterial at a total company level. We estimate that our 2016 and 2017 restated earnings per share will be lower by approximately $0.13 and $0.16 (before any impact from U.S. tax reform), respectively, driven primarily by the required changes in accounting for long-term product service arrangements as described above. These estimates may be refined as we finalize the implementation effort required to adopt the standard. Upon adoption in 2018, our books and records will only reflect the results as required under the new standard limiting our ability to estimate the effect of the standard on our earnings. Given the inherent difficulty in this ongoing estimation of the effect of the standard on any future periods, we do not plan to continue to assess the effect on 2018.
To summarize, we will adopt the new standard in 2018, at which time we will update prior periods to be presented on a consistent basis. As discussed above, we anticipate a dilutive effect of the new standard in the year of adoption consistent with the effect to the restated 2016 and 2017 results and the effect will be less dilutive for years after initial adoption. However, this expectation is based on many variables, including underlying business performance, which are subject to change, making the effect of the standard on future periods difficult to estimate. Importantly, application of the new guidance has no effect on the cash we expect to receive nor the economics of these contracts. Rather, it will simply more closely align revenue with cash, which we believe will be helpful to our investors.
MINE SAFETY DISCLOSURES
Our barite mining operations, in support of our drilling fluids products and services business, are subject to regulation by the federal Mine Safety and Health Administration under the Federal Mine Safety and Health Act of 1977. There are no mine safety violations or other regulatory matters required by Section 1503(a) of the Dodd-Frank Wall Street Reform and Consumer Protection Act and Item 104 of Regulation S-K to report for the current period.
IRAN THREAT REDUCTION AND SYRIA HUMAN RIGHTS ACT OF 2012
Under Section 13(r) of the Securities Exchange Act of 1934, enacted in 2012, GE is required to disclose in its periodic reports if it or any of its affiliates knowingly engaged in business activities relating to Iran, even if those activities are conducted in accordance with authorizations subsequently issued by the U.S. Government. Reportable activities include investments that significantly enhance Iran's ability to develop petroleum resources valued at $20 million or more in the aggregate during a twelve-month period. Reporting is also required for transactions related to Iran's domestic production of refined petroleum products or Iran's ability to import refined petroleum products valued at $5 million or more in the aggregate during a twelve-month period.
In January 2016, the U.S. Department of Treasury's Office of Foreign Assets Control (OFAC) issued General License H authorizing U.S.-owned or controlled foreign entities to engage in transactions with Iran if these entities meet the requirements of the general license. Pursuant to this authorization, a non-U.S. affiliate of GE's Oil & Gas business received seven purchase orders during the fourth quarter of 2017 for the sale of goods pursuant to General License H that could potentially enhance Iran's ability to develop petroleum resources. The purchase orders cover the sale of valves and parts for industrial machinery and equipment used in gas plants, petrochemical plants and gas production projects in Iran. These purchase orders are valued at less than €0.1 million ($0.1 million), less than €0.1 million ($0.1 million), less than €0.1 million ($0.1 million), €0.3 million ($0.3 million), €0.7 million ($0.8 million), €0.1 million ($0.1 million) and €0.8 million ($1.0 million). This non-U.S. affiliate also received a cancellation of a previously reported contract for the sale of spare parts for gas turbines. This purchase order cancellation reduces previously reported contract values by €12.3 million ($12.9 million). This non-U.S. affiliate attributed €6.8 million ($8.2 million) in gross revenues and €1.4 million ($1.7 million) in net profits against previously reported transactions during the quarter ending December 31, 2017.
A second non-U.S. affiliate of GE's Oil & Gas business received three purchase orders during the fourth quarter of 2017 for the sale of spares parts to support the development of offshore petroleum resources. The three purchase orders are individually valued at less than €0.1 million ($0.1 million), less than €0.1 million ($0.1 million), and less than €0.1 million ($0.1 million) each. This non-U.S. affiliate did not recognize any revenue or profit during the quarter ending December 31, 2017.
A third non-U.S. affiliate of GE's Oil & Gas business received a purchase order pursuant to General License H valued at €0.2 million ($0.2 million) during the fourth quarter of 2017. The non-U.S. affiliate also received a purchase order in the third quarter of 2017 valued at €0.3 million ($0.3 million). Both purchase orders cover the sale of films to be used in inspection of pipelines in Iran. This non-U.S. affiliate did not recognize any revenue or profit during the quarter ending December 31, 2017.
A non-U.S. affiliate of GE's Power business incurred costs of €1.0 million ($1.2 million) during the fourth quarter of 2017 associated with previously reported transactions. This non-U.S. affiliate did not recognize any revenue associated with these transactions during the quarter ending December 31, 2017.
All of these non-U.S. affiliates intend to continue the activities described above, as permitted by all applicable laws and regulations.
GE 2017 FORM 10-K 91
MD&A | OTHER ITEMS |
|
For additional information on business activities related to Iran, please refer to the Other Items section within MD&A in our Form 10-Q for the quarter ended September 30, 2017.
ENVIRONMENTAL MATTERS
Our operations, like operations of other companies engaged in similar businesses, involve the use, disposal and cleanup of substances regulated under environmental protection laws. We are involved in a number of remediation actions to clean up hazardous wastes as required by federal and state laws. Such statutes require that responsible parties fund remediation actions regardless of fault, legality of original disposal or ownership of a disposal site. Expenditures for site remediation actions amounted to approximately $0.2 billion, $0.2 billion, and $0.3 billion for the years ended December 31, 2017, 2016, and 2015, respectively. We presently expect that such remediation actions will require average annual expenditures of about $0.2 billion in 2018 and 2019, respectively.
As previously reported, in 2000, GE and the Environmental Protection Agency (EPA) entered into a consent decree relating to PCB cleanup of the Housatonic River in Massachusetts. Following EPA's release in September 2015 of an intended final remediation decision, GE and EPA engaged in mediation and the first step of the dispute resolution process contemplated by the consent decree. In October 2016, the EPA issued its final decision pursuant to the consent decree, which GE and several other interested parties appealed to EPA's Environmental Appeals Board (EAB). The EAB issued its decision on January 26, 2018, affirming parts of EPA's decision and granting relief to GE on certain significant elements of its challenge. The EAB remanded the decision back to EPA to address those elements and reissue a revised final remedy. The revised final remedy may be appealed to the EAB and ultimately the United States Court of Appeals for the First Circuit. The full remedy will not be implemented until any appeals of the revised decision are resolved. As of December 31, 2017, and based on its assessment of current facts and circumstances and its defenses, GE believes that it has recorded adequate reserves to cover future obligations associated with an expected final remedy.
RESEARCH AND DEVELOPMENT
We conduct research and development (R&D) activities to continually enhance our existing products and services, develop new product and services to meet our customers' changing needs and requirements, and address new market opportunities.
Research and development expenses are classified in cost of goods and services sold in the Statement of Earnings (Loss). In addition, research and development funding from customers, principally the U.S. government, is recorded as an offset to such costs. We also enter into research and development arrangements with unrelated investors, which are generally formed through partnerships and consolidated within GE's financial statements. Research and development funded through consolidated partnerships is classified within net earnings/loss attributable to noncontrolling interests.
| GE funded | Customer funded(c) | Partner funded | Total R&D | ||||||||||||||||||||||||||||||||
(In millions) | 2017 | 2016 | 2015 | 2017 | 2016 | 2015 | 2017 | 2016 | 2015 | 2017 | 2016 | 2015 | ||||||||||||||||||||||||
Aviation | $ | 916 | | $ | 1,097 | | $ | 1,111 | | $ | 586 | | $ | 498 | | $ | 813 | | $ | - | | $ | - | | $ | 107 | | $ | 1,502 | | $ | 1,595 | | $ | 2,031 | |
Healthcare | 990 | | 905 | | 890 | | 26 | | 32 | | 14 | | - | | - | | - | | 1,016 | | 938 | | 905 | | ||||||||||||
Power | 885 | | 945 | | 834 | | 18 | | 4 | | 20 | | 17 | | 45 | | 108 | | 920 | | 994 | | 962 | | ||||||||||||
Oil & Gas | 418 | | 287 | | 371 | | 41 | | - | | - | | 42 | | 28 | | 10 | | 501 | | 315 | | 382 | | ||||||||||||
Renewable Energy | 299 | | 213 | | 100 | | 3 | | 7 | | 8 | | - | | - | | - | | 302 | | 220 | | 108 | | ||||||||||||
Corporate(a) | 1,129 | | 1,099 | | 587 | | 65 | | 83 | | 86 | | - | | - | | - | | 1,194 | | 1,183 | | 672 | | ||||||||||||
All Other(b) | 165 | | 235 | | 355 | | - | | - | | - | | - | | - | | - | | 165 | | 235 | | 355 | | ||||||||||||
Total | $ | 4,803 | | $ | 4,782 | | $ | 4,249 | | $ | 739 | | $ | 625 | | $ | 941 | | $ | 59 | | $ | 73 | | $ | 226 | | $ | 5,600 | | $ | 5,480 | | $ | 5,416 | |
(a) Includes Global Research Center and Digital.
(b) Includes Transportation and Lighting.
(c) Principally U.S Government funded.
OTHER
We own, or hold licenses to use, numerous patents. New patents are continuously being obtained through our research and development activities as existing patents expire. Patented inventions are used both within the Company and are licensed to others.
GE is a trademark and service mark of General Electric Company.
Because of the diversity of our products and services, as well as the wide geographic dispersion of our production facilities, we use numerous sources for the wide variety of raw materials needed for our operations. We have not been adversely affected by our inability to obtain raw materials.
Sales of goods and services to agencies of the U.S. Government as a percentage of GE revenues follow.
| 2017 | | 2016 | | 2015 | |
|
|
|
| |||
Total sales to U.S. Government agencies | 4 | % | 3 | % | 4 | % |
Aviation segment defense-related sales | 3 | % | 3 | % | 3 | % |
92 GE 2017 FORM 10-K
MD&A | SUPPLEMENTAL INFORMATION |
|
SUPPLEMENTAL INFORMATION
FINANCIAL MEASURES THAT SUPPLEMENT U.S. GENERALLY ACCEPTED ACCOUNTING PRINCIPLES MEASURES (NON-GAAP FINANCIAL MEASURES)
We sometimes use information derived from consolidated financial information but not presented in our financial statements prepared in accordance with U.S. generally accepted accounting principles (GAAP). Certain of these data are considered "non-GAAP financial measures" under U.S. Securities and Exchange Commission rules. Specifically, we have referred, in various sections of this report, to:
• | Industrial segment organic revenues |
• | Industrial segment organic operating profit |
• | Operating and non-operating pension costs |
• | GE Industrial structural costs and GE Industrial structural costs, excluding acquisitions and dispositions |
• | GE pre-tax earnings (loss) from continuing operations, excluding GE Capital earnings (loss) from continuing operations and the corresponding effective tax rates, and the reconciliation of the U.S. federal statutory income tax rate to GE effective tax rate, excluding GE Capital earnings |
• | GE Industrial operating earnings and GE Capital earnings (loss) from continuing operations and EPS |
• | GE Industrial operating + Verticals earnings and EPS |
• | GE Industrial operating profit and operating profit margin (excluding certain items) |
• | Average GE shareowners' equity, excluding effects of discontinued operations |
• | Average GE Capital shareowner's equity, excluding effects of discontinued operations |
• | GE Industrial return on total capital (GE Industrial ROTC) |
• | GE Industrial cash flows from operating activities (GE Industrial CFOA), adjusted GE Industrial CFOA and GE Industrial free cash flow (FCF) |
• | 2018 operating framework including 2018 Adjusted EPS and GE Industrial FCF |
The reasons we use these non-GAAP financial measures and the reconciliations to their most directly comparable GAAP financial measures follow.
GE 2017 FORM 10-K 93
MD&A | SUPPLEMENTAL INFORMATION |
|
INDUSTRIAL SEGMENT ORGANIC REVENUES (NON-GAAP) | ||||||||
|
|
|
| |||||
(Dollars in millions) | 2017 | | 2016 | | V% | | ||
|
|
|
| |||||
Industrial segment revenues (GAAP) | $ | 116,157 | | $ | 112,814 | | 3 | % |
Adjustments: |
|
|
| |||||
Acquisitions | 6,059 | | 37 | |
| |||
Business dispositions (other than dispositions of businesses acquired for investment) | 89 | | 3,481 | |
| |||
Currency exchange rates | 578 | | - | |
| |||
Industrial segment organic revenues (Non-GAAP) | $ | 109,430 | | $ | 109,296 | | - | % |
|
|
|
| |||||
(Dollars in millions) | 2016 | | 2015 | | V% | | ||
|
|
|
| |||||
Industrial segment revenues (GAAP) | $ | 112,814 | | $ | 108,609 | | 4 | % |
Adjustments: |
|
|
| |||||
Acquisitions | 13,207 | | 1,961 | |
| |||
Business dispositions (other than dispositions of businesses acquired for investment) | 1,256 | | 6,838 | |
| |||
Currency exchange rates | (808 | ) | - | |
| |||
Industrial segment organic revenues (Non-GAAP) | $ | 99,159 | | $ | 99,810 | | (1 | )% |
Adjustment: Plus Alstom November and December(a) | $ | 3,202 | | $ | 1,812 | |
| |
Industrial segment organic revenues including Alstom results for November and December of both 2015 and 2016 (Non-GAAP) | $ | 102,361 | | $ | 101,622 | | 1 | % |
|
|
|
| |||||
(Dollars in millions) | 2015 | | 2014 | | V% | | ||
|
|
|
| |||||
Industrial segment revenues (GAAP) | $ | 108,609 | | $ | 109,574 | | (1 | )% |
Adjustments: |
|
|
| |||||
Acquisitions | 2,204 | | 46 | |
| |||
Business dispositions (other than dispositions of businesses acquired for investment) | 108 | | 1,224 | |
| |||
Currency exchange rates | (4,791 | ) | - | |
| |||
Industrial segment organic revenues (Non-GAAP) | $ | 111,088 | | $ | 108,304 | | 3 | % |
(a) | Alstom was acquired in November 2015. This adjustment results in the inclusion of Alstom revenues from November and December of both 2015 and 2016 in the adjusted organic revenue growth* measure as described below. |
Organic revenue growth measures revenue* growth excluding the effects of acquisitions, business dispositions and currency exchange rates. We believe that this measure provides management and investors with a more complete understanding of underlying operating results and trends of established, ongoing operations by excluding the effect of acquisitions, dispositions and currency exchange, which activities are subject to volatility and can obscure underlying trends. We also believe that presenting organic revenue growth* separately for our industrial businesses provides management and investors with useful information about the trends of our industrial businesses and enables a more direct comparison to other non-financial businesses and companies. Management recognizes that the term "organic revenue growth" may be interpreted differently by other companies and under different circumstances. Although this may have an effect on comparability of absolute percentage growth from company to company, we believe that these measures are useful in assessing trends of the respective businesses or companies and may therefore be a useful tool in assessing period-to-period performance trends.
When comparing revenue growth between periods excluding the effects of acquisitions, business dispositions and currency exchange rates, those effects are different when comparing results for different periods. Revenues from acquisitions are considered inorganic from the date we complete an acquisition through the end of the fourth quarter following the acquisition and are therefore reflected as an adjustment to reported revenue to derive organic revenue for the period following the acquisition. In subsequent periods, the revenues from the acquisition become organic as these revenues are included for all periods presented. Additionally, when comparing the calculation of Industrial segment organic revenues* with 2017 in the first table, there is no adjustment to the 2016 GAAP revenues for currency exchange rates while in the calculation of 2016 organic revenues* compared to 2015 in the second table there is an adjustment to 2016 reported revenues of $(808) million for currency exchange rates. This is the case because in the comparison of 2017 to 2016 we are adjusting the 2017 reported revenues to exclude the effect of currency exchange rates to provide a more direct comparison to the 2016 results. That is, we are adjusting 2017 reported revenues to eliminate the effects of changes in foreign currency had on 2017 revenues. Additionally, when comparing 2016 to 2015, we adjust the 2016 revenue amount for the effects of currency exchange to enable a more direct comparison to 2015.
*Non-GAAP Financial Measure
94 GE 2017 FORM 10-K
MD&A | SUPPLEMENTAL INFORMATION |
|
INDUSTRIAL SEGMENT ORGANIC OPERATING PROFIT (NON-GAAP) | ||||||||
|
|
|
| |||||
(Dollars in millions) | 2017 | | 2016 | | V% | | ||
Industrial segment profit (GAAP) | $ | 14,740 | | $ | 17,598 | | (16 | )% |
Adjustments: |
|
|
| |||||
Acquisitions | (388 | ) | (7 | ) |
| |||
Business dispositions (other than dispositions of businesses acquired for investment) | 84 | | 286 | |
| |||
Currency exchange rates | (4 | ) | - | |
| |||
Industrial segment organic operating profit (Non-GAAP) | $ | 15,048 | | $ | 17,319 | | (13 | )% |
|
|
|
| |||||
(Dollars in millions) | 2016 | | 2015 | | V% | | ||
Industrial segment profit (GAAP) | $ | 17,598 | | $ | 17,966 | | (2 | )% |
Adjustments: |
|
|
| |||||
Acquisitions | 739 | | (151 | ) |
| |||
Business dispositions (other than dispositions of businesses acquired for investment) | 181 | | 649 | |
| |||
Currency exchange rates | (33 | ) | - | |
| |||
Industrial segment organic operating profit (Non-GAAP) | $ | 16,712 | | $ | 17,469 | | (4 | )% |
Industrial segment organic operating profit growth* measures industrial segment profit excluding the effects of acquisitions, business dispositions and currency exchange rates. We believe that this measure provides management and investors with a more complete understanding of underlying operating results and trends of established, ongoing operations by excluding the effect of acquisitions, dispositions and currency exchange, which activities are subject to volatility and can obscure underlying trends. We also believe that presenting industrial segment organic operating profit growth* separately for our industrial businesses provides management and investors with useful information about the trends of our industrial businesses and enables a more direct comparison to other non-financial businesses and companies. Management recognizes that the term "industrial segment organic operating profit growth" may be interpreted differently by other companies and under different circumstances. Although this may have an effect on comparability of absolute percentage growth from company to company, we believe that these measures are useful in assessing trends of the respective businesses or companies and may therefore be a useful tool in assessing period-to-period performance trends.
When comparing operating profit growth* between periods excluding the effects of acquisitions, business dispositions and currency exchange rates, those effects are different when comparing results for different periods. Operating profit* from acquisitions are considered inorganic from the date we complete an acquisition through the end of the fourth quarter following the acquisition and are therefore reflected as an adjustment to reported operating profit* to derive organic operating profit* for the period following the acquisition. In subsequent periods, the operating profit* from the acquisition become organic as these operating profits* are included for all periods presented. Additionally, when comparing the calculation of Industrial segment organic operating profit* with 2017 in the first table, there is no adjustment to the 2016 GAAP operating profit* for currency exchange rates while in the calculation of 2016 organic operating profit* compared to 2015 in the second table there is an adjustment to 2016 reported operating profit* of $(33) million for currency exchange rates. This is the case because in the comparison of 2017 to 2016 we are adjusting the 2017 reported operating profit* to exclude the effect of currency exchange rates to provide a more direct comparison to the 2016 results. That is, we are adjusting 2017 reported operating profit* to eliminate the effects of changes in foreign currency had on 2017 operating profit.* Additionally, when comparing 2016 to 2015, we adjust the 2016 operating profit* amount for the effects of currency exchange to enable a more direct comparison to 2015.
*Non-GAAP Financial Measure
GE 2017 FORM 10-K 95
MD&A | SUPPLEMENTAL INFORMATION |
|
OPERATING AND NON-OPERATING PENSION COSTS (NON-GAAP) |
|
|
| ||||||
|
|
|
| ||||||
(In millions) | 2017 | | 2016 | | 2015 | | |||
|
|
|
| ||||||
Total principal pension plans cost (GAAP) | $ | 3,687 | | $ | 3,623 | | $ | 4,498 | |
|
|
|
| ||||||
Operating pension cost (Non-GAAP) |
|
|
| ||||||
Service cost for benefits earned | $ | 1,055 | | $ | 1,237 | | $ | 1,424 | |
Prior service cost amortization | 290 | | 303 | | 205 | | |||
Curtailment loss | 64 | | 31 | | 105 | | |||
Operating pension cost (Non-GAAP) | $ | 1,409 | | $ | 1,571 | | $ | 1,734 | |
|
|
|
| ||||||
Non-operating pension cost (Non-GAAP) |
|
|
| ||||||
Expected return on plan assets | $ | (3,390 | ) | $ | (3,336 | ) | $ | (3,302 | ) |
Interest cost on benefit obligations | 2,856 | | 2,939 | | 2,778 | | |||
Net actuarial loss amortization | 2,812 | | 2,449 | | 3,288 | | |||
Non-operating pension cost (Non-GAAP) | $ | 2,278 | | $ | 2,052 | | $ | 2,764 | |
We have provided the operating and non-operating components of cost for our principal pension plans*. Operating pension cost* comprises the service cost of benefits earned, prior service cost amortization and curtailment loss for our principal pension plans. Non-operating pension cost* comprises the expected return on plan assets, interest cost on benefit obligations and net actuarial loss amortization for our principal pension plans. We believe that the operating components of pension cost better reflect the ongoing service-related cost of providing pension benefits to our employees. We believe that the operating and non-operating components of cost for our principal pension plans*, considered along with the corresponding GAAP measure, provide management and investors with additional information for comparison of our pension plan cost and operating results with the pension plan cost and operating results of other companies.
GE INDUSTRIAL STRUCTURAL COSTS AND GE INDUSTRIAL STRUCTURAL COSTS, EXCLUDING ACQUISITIONS AND DISPOSITIONS (NON-GAAP) | ||||||
|
|
| ||||
(In millions) | 2017 | | 2016 | | ||
|
|
| ||||
GE Industrial costs excluding interest and financial charges (GAAP) | $ | 108,320 | | $ | 101,834 | |
Less: Segment variable costs | 77,749 | | 72,252 | | ||
Less: Corporate revenue excluding GE-GE Capital elimination | (1,225 | ) | 2,113 | | ||
Less: Corporate gains on disposals | (1,945 | ) | (3,444 | ) | ||
Less: Corporate restructuring and other charges | 5,986 | | 3,578 | | ||
Less: Corporate non-operating pension cost (pre-tax) | 2,278 | | 2,052 | | ||
Less: Corporate noncontrolling interests | (1 | ) | (7 | ) | ||
Less: Oil & Gas restructuring and other charges | 769 | | - | | ||
GE Industrial structural costs (Non-GAAP) | $ | 24,707 | | $ | 25,291 | |
Less: Acquisitions and dispositions structural costs | 1,679 | | 568 | | ||
GE Industrial structural costs, excluding acquisitions and dispositions (Non-GAAP) | $ | 23,028 | | $ | 24,723 | |
We believe Industrial structural costs* are a meaningful measure as they are broader than selling, general and administrative costs and represent the total structural costs in the industrial segments and Corporate that generally do not vary with volume.
*Non-GAAP Financial Measure
96 GE 2017 FORM 10-K
MD&A | SUPPLEMENTAL INFORMATION |
|
GE PRE-TAX EARNINGS (LOSS) FROM CONTINUING OPERATIONS, EXCLUDING GE CAPITAL EARNINGS (LOSS) FROM | |||||||||
CONTINUING OPERATIONS AND THE CORRESPONDING EFFECTIVE TAX RATES (NON-GAAP) | |||||||||
|
|
|
| ||||||
(Dollars in millions) | 2017 | | 2016 | | 2015 | | |||
|
|
|
| ||||||
GE earnings (loss) from continuing operations before income taxes (GAAP) | $ | (2,922 | ) | $ | 9,815 | | $ | 3,252 | |
Less: GE Capital earnings (loss) from continuing operations | (6,765 | ) | (1,251 | ) | (7,672 | ) | |||
Total | $ | 3,843 | | $ | 11,066 | | $ | 10,924 | |
|
|
|
| ||||||
GE provision for income taxes (GAAP) | $ | 3,259 | | $ | 967 | | $ | 1,506 | |
GE effective tax rate, excluding GE Capital earnings (Non-GAAP) | 84.8 | % | 8.7 | % | 13.8 | % | |||
RECONCILIATION OF U.S. FEDERAL STATUTORY INCOME TAX RATE TO GE EFFECTIVE TAX RATE, | ||||||
EXCLUDING GE CAPITAL EARNINGS (NON-GAAP) | ||||||
|
|
|
| |||
| 2017 | | 2016 | | 2015 | |
|
|
|
| |||
U.S. federal statutory income tax rate | 35.0 | % | 35.0 | % | 35.0 | % |
Reduction in rate resulting from: |
|
|
| |||
Tax on global activities including exports | (54.0 | ) | (18.5 | ) | (15.8 | ) |
U.S. business credits | (2.4 | ) | (0.8 | ) | (1.2 | ) |
Tax Cuts and Jobs Acts enactment | 96.7 | | - | | - | |
All other – net | 9.5 | | (7.0 | ) | (4.2 | ) |
| 49.8 | | (26.3 | ) | (21.2 | ) |
GE effective tax rate, excluding GE Capital earnings (Non-GAAP) | 84.8 | % | 8.7 | % | 13.8 | % |
We believe that the GE effective tax rate, excluding GE Capital earnings*, is best analyzed in relation to GE earnings before income taxes excluding the GE Capital net earnings from continuing operations, as GE tax expense does not include taxes on GE Capital earnings. Management believes that in addition to the Consolidated and GE Capital tax rates shown in Note 13 to the consolidated financial statements, this supplemental measure provides investors with useful information as it presents the GE effective tax rate that can be used in comparing the GE results to other non-financial services businesses.
*Non-GAAP Financial Measure
GE 2017 FORM 10-K 97
MD&A | SUPPLEMENTAL INFORMATION |
|
GE INDUSTRIAL OPERATING EARNINGS AND GE CAPITAL EARNINGS (LOSS) FROM CONTINUING OPERATIONS AND EPS (NON-GAAP) | |||||||||
|
|
|
| ||||||
(Dollars in million; except per share amounts) | 2017 | | 2016 | | 2015 | | |||
|
|
|
| ||||||
Consolidated earnings from continuing operations attributable to GE common shareowners (GAAP) | $ | (5,907 | ) | $ | 9,128 | | $ | 1,663 | |
Non-operating pension cost (pre-tax) | 2,278 | | 2,052 | | 2,764 | | |||
Tax effect on non-operating pension cost(a) | (797 | ) | (718 | ) | (967 | ) | |||
Less: non-operating pension cost (net of tax) | 1,482 | | 1,334 | | 1,797 | | |||
Operating earnings (Non-GAAP) | $ | (4,425 | ) | $ | 10,462 | | $ | 3,460 | |
|
|
|
| ||||||
Adjustment: GE Capital earnings (loss) from continuing operations attributable to GE common shareowners | (6,765 | ) | (1,251 | ) | (7,983 | ) | |||
Industrial operating earnings (Non-GAAP) | $ | 2,339 | | $ | 11,713 | | $ | 11,443 | |
|
|
|
| ||||||
Earnings (loss) per share (EPS) - diluted(b) |
|
|
| ||||||
Consolidated EPS from continuing operations attributable to GE common shareowners (GAAP) | $ | (0.68 | ) | $ | 1.00 | | $ | 0.17 | |
Adjustment: non-operating pension cost (net of tax) | 0.17 | | 0.15 | | 0.18 | | |||
Operating EPS (Non-GAAP) | (0.51 | ) | 1.14 | | 0.35 | | |||
GE Capital EPS from continuing operations attributable to GE common shareowners (GAAP) | (0.78 | ) | (0.14 | ) | (0.80 | ) | |||
GE Industrial operating EPS (Non-GAAP) | $ | 0.27 | | $ | 1.28 | | $ | 1.14 | |
(a) | The tax effect of non-operating pension cost* was calculated using a 35% U.S. federal statutory tax rate, based on its applicability to such cost. |
(b) | Earnings-per-share amounts are computed independently. As a result, the sum of per-share amounts may not equal the total. |
Operating earnings* excludes non-service-related pension costs of our principal pension plans comprising interest cost, expected return on plan assets and amortization of actuarial gains/losses. The service cost, prior service cost and curtailment loss components of our principal pension plans are included in operating earnings. We believe that these components of pension cost better reflect the ongoing service-related costs of providing pension benefits to our employees. As such, we believe that our measure of operating earnings provides management and investors with a useful measure of the operational results of our business. Other components of GAAP pension cost are mainly driven by capital allocation decisions and market performance, and we manage these separately from the operational performance of our businesses. Neither GAAP nor operating pension costs* are necessarily indicative of the current or future cash flow requirements related to our pension plans. We also believe that this measure, considered along with the corresponding GAAP measure, provides management and investors with additional information for comparison of our operating results to the operating results of other companies. We believe that presenting operating earnings* separately for our industrial businesses also provides management and investors with useful information about the relative size of our industrial and financial services businesses in relation to the total company.
GE INDUSTRIAL OPERATING + VERTICALS EARNINGS AND EPS (NON-GAAP) |
| ||||||||
|
|
|
| ||||||
(Dollars in millions; except per share amounts) | 2017 | | 2016 | | 2015 | | |||
|
|
|
| ||||||
GE Capital earnings (loss) from continuing operations attributable to GE common shareowners (GAAP) | $ | (6,765 | ) | $ | (1,251 | ) | $ | (7,983 | ) |
Adjustment: GE Capital other continuing earnings (loss) (Other Capital) | (557 | ) | (3,143 | ) | (9,649 | ) | |||
Verticals earnings(a) | (6,208 | ) | 1,892 | | 1,666 | | |||
|
|
|
| ||||||
GE Industrial operating earnings (Non-GAAP) | $ | 2,339 | | $ | 11,713 | | $ | 11,443 | |
Verticals earnings(a) | (6,208 | ) | 1,892 | | 1,666 | | |||
GE Industrial operating earnings + Verticals earnings (Non-GAAP) | $ | (3,869 | ) | $ | 13,605 | | $ | 13,109 | |
Adjustment: Non-operating pension cost and other Capital | (2,039 | ) | (4,477 | ) | (11,446 | ) | |||
Earnings (loss) from continuing operations attributable to GE common shareowners (GAAP) | (5,907 | ) | 9,128 | | 1,663 | | |||
|
|
|
| ||||||
Earnings (loss) per share - diluted(b) |
|
|
| ||||||
GE Industrial operating EPS (Non-GAAP) | $ | 0.27 | | $ | 1.28 | | $ | 1.14 | |
Verticals EPS | (0.71 | ) | 0.21 | | 0.17 | | |||
GE Industrial operating + Verticals EPS (Non-GAAP) | $ | (0.45 | ) | $ | 1.49 | | $ | 1.31 | |
Adjustment: Non-operating pension cost* and other Capital | (0.23 | ) | (0.49 | ) | (1.14 | ) | |||
EPS from continuing operations (GAAP) | $ | (0.68 | ) | $ | 1.00 | | $ | 0.17 | |
(a) | Verticals include GECAS, Energy Financial Services, Industrial Finance and run-off insurance operations, including allocated corporate costs of $100 million, $100 million, $133 million and $233 million after tax for the years ended December 31, 2017, 2016, 2015 and 2014, respectively. |
(b) | Earnings-per-share amounts are computed independently. As a result, the sum of per-share amounts may not equal the total. |
We believe that presenting GE Industrial operating + Verticals earnings-per-share amounts* provides management and investors with a useful measure to evaluate the performance of the businesses after the disposition of most of our financial services business.
*Non-GAAP Financial Measure
98 GE 2017 FORM 10-K
MD&A | SUPPLEMENTAL INFORMATION |
|
GE INDUSTRIAL OPERATING PROFIT AND OPERATING PROFIT MARGIN (EXCLUDING CERTAIN ITEMS) (NON-GAAP) | |||||||||
|
|
|
| ||||||
(Dollars in millions) | 2017 | | 2016 | | 2015 | | |||
|
|
|
| ||||||
Revenues |
|
|
| ||||||
GE total revenues and other income | $ | 108,150 | | $ | 113,676 | | $ | 100,700 | |
Less: GE Capital earnings (loss) from continuing operations | (6,765 | ) | (1,251 | ) | (7,672 | ) | |||
GE revenues and other income excluding GE Capital earnings (loss) (Industrial revenues) (GAAP) | $ | 114,915 | | $ | 114,927 | | $ | 108,371 | |
|
|
|
| ||||||
Less: gains, net | 552 | | 3,444 | | 1,497 | | |||
Adjusted GE Industrial revenues (Non-GAAP) | $ | 114,363 | | $ | 111,483 | | $ | 106,874 | |
|
|
|
| ||||||
Costs |
|
|
| ||||||
GE total costs and expenses | $ | 111,072 | | $ | 103,860 | | $ | 97,447 | |
Less: GE interest and other financial charges | 2,753 | | 2,026 | | 1,706 | | |||
GE Industrial costs excluding interest and other financial charges (GAAP) | $ | 108,320 | | $ | 101,834 | | $ | 95,741 | |
|
|
|
| ||||||
Less adjustments for: |
|
|
| ||||||
Non-operating pension cost (pre-tax) | 2,278 | | 2,052 | | 2,764 | | |||
Restructuring and other charges | 4,561 | | 3,578 | | 1,734 | | |||
Oil & Gas restructuring | 679 | | - | | - | | |||
Held for sale curtailment charges | 33 | | - | | - | | |||
Noncontrolling interests and 2015 GE Capital preferred stock dividends | 274 | | 279 | | 229 | | |||
Adjusted GE Industrial costs (Non-GAAP) | $ | 100,494 | | $ | 95,925 | | $ | 91,015 | |
|
|
|
| ||||||
GE Industrial profit (GAAP) | $ | 6,595 | | $ | 13,093 | | $ | 12,630 | |
GE Industrial margins (GAAP) | 5.7 | % | 11.4 | % | 11.7 | % | |||
|
|
|
| ||||||
GE Industrial operating profit (Non-GAAP) | $ | 13,868 | | $ | 15,558 | | $ | 15,859 | |
GE Industrial operating profit margins (Non-GAAP) | 12.1 | % | 14.0 | % | 14.8 | % | |||
We have presented our Industrial operating profit* and operating profit margin* excluding gains, non-operating pension cost (pre-tax), restructuring and other, noncontrolling interests and GE Capital preferred stock dividends. We believe that Industrial operating profit* and operating profit margin* adjusted for these items are meaningful measures because they increase the comparability of period-to-period results.
*Non-GAAP Financial Measure
GE 2017 FORM 10-K 99
MD&A | SUPPLEMENTAL INFORMATION |
|
AVERAGE GE SHAREOWNERS' EQUITY, EXCLUDING EFFECTS OF DISCONTINUED OPERATIONS (NON-GAAP)(a) | |||||||||||||||
|
|
|
|
|
| ||||||||||
(In millions) | 2017 | | 2016 | | 2015 | | 2014 | | 2013 | | |||||
|
|
|
|
|
| ||||||||||
Average GE Shareowners' equity(a) (GAAP) | $ | 72,976 | | $ | 86,412 | | $ | 111,140 | | $ | 131,914 | | $ | 124,501 | |
Less the effects of the average net investment in discontinued operations | 4,860 | | 2,854 | | 27,910 | | 45,455 | | 44,948 | | |||||
Average GE shareowners' equity, excluding effects of discontinued operations(b) (Non-GAAP) | $ | 68,116 | | $ | 83,558 | | $ | 83,230 | | $ | 86,459 | | $ | 79,553 | |
(a) | On an annual basis, calculated using a five-point average. |
(b) | Used for computing GE Industrial return on total capital (ROTC). |
Our GE Industrial ROTC* calculation excludes earnings (losses) of discontinued operations from the numerator because GAAP requires us to display those earnings (losses) in the Statement of Earnings (Loss). Those earnings (losses) from discontinued operations include an allocation of interest expense either directly attributable or related to discontinued operations. Net investment in discontinued operations is calculated as assets of discontinued operations less liabilities of discontinued operations, including an allocation of GE Capital debt. Our calculation of average GE shareowners' equity may not be directly comparable to similarly titled measures reported by other companies. We believe that it is a clearer way to measure the ongoing trend in return on total capital for the continuing operations of our businesses given the extent that discontinued operations have affected our reported results. We believe that this results in a more relevant measure for management and investors to evaluate performance of our continuing operations, on a consistent basis, and to evaluate and compare the performance of our continuing operations with the ongoing operations of other businesses and companies.
Definitions indicating how the above-named ratios are calculated using average GE shareowners' equity, excluding effects of discontinued operations*, can be found in the Other Items and Measures section within the MD&A.
AVERAGE GE CAPITAL SHAREOWNER'S EQUITY, EXCLUDING EFFECTS OF DISCONTINUED OPERATIONS (NON-GAAP)(a) | |||||||||||||||
|
|
|
|
|
| ||||||||||
(In millions) | 2017 | | 2016 | | 2015 | | 2014 | | 2013 | | |||||
|
|
|
|
|
| ||||||||||
Average GE Capital Shareowner's equity(a) (GAAP) | $ | 20,509 | | $ | 34,382 | | $ | 67,930 | | $ | 85,370 | | $ | 83,358 | |
Less the effects of the average net investment in discontinued operations | 4,883 | | 2,955 | | 28,028 | | 45,589 | | 45,023 | | |||||
Average GE Capital shareowner's equity, excluding effects of discontinued operations(b) (Non-GAAP) | $ | 15,626 | | $ | 31,427 | | $ | 39,902 | | $ | 39,781 | | $ | 38,335 | |
(a) | On an annual basis, calculated using a five-point average. |
(b) | Used for computing GE Industrial return on total capital (ROTC). |
Our GE Industrial ROTC* calculation excludes earnings (losses) of discontinued operations from the numerator because GAAP requires us to display those earnings (losses) in the Statement of Earnings (Loss). Our calculation of average GE Capital shareowner's equity may not be directly comparable to similarly titled measures reported by other companies. We believe that it is a clearer way to measure the ongoing trend in return on total capital for the continuing operations of our businesses given the extent that discontinued operations have affected our reported results. We believe that this results in a more relevant measure for management and investors to evaluate performance of our continuing operations, on a consistent basis, and to evaluate and compare the performance of our continuing operations with the ongoing operations of other businesses and companies.
*Non-GAAP Financial Measure
100 GE 2017 FORM 10-K
MD&A | SUPPLEMENTAL INFORMATION |
|
GE INDUSTRIAL RETURN ON TOTAL CAPITAL (GE INDUSTRIAL ROTC) (NON-GAAP) |
| ||||||||||||||
|
|
|
|
|
| ||||||||||
(Dollars in millions) | 2017 | | 2016 | | 2015 | | 2014 | | 2013 | | |||||
|
|
|
|
|
| ||||||||||
Earnings (loss) from continuing operations (GAAP) | $ | (5,748 | ) | $ | 9,494 | | $ | 1,700 | | $ | 9,490 | | $ | 7,881 | |
Less: GE Capital earnings (loss) from continuing operations | (6,331 | ) | (606 | ) | (7,718 | ) | 1,537 | | 716 | | |||||
Plus: GE after-tax interest | 2,037 | | 1,499 | | 1,262 | | 1,026 | | 865 | | |||||
GE Adjusted Industrial return (Non-GAAP) | $ | 2,620 | | $ | 11,599 | | $ | 10,680 | | $ | 8,979 | | $ | 8,030 | |
|
|
|
|
|
| ||||||||||
Average GE shareowners' equity, excluding effects of discontinued operations(a) | $ | 68,116 | | $ | 83,558 | | $ | 83,230 | | $ | 86,459 | | $ | 79,553 | |
Less: average GE Capital shareowner's equity, excluding effects of discontinued operations(a) | 15,626 | | 31,427 | | 39,902 | | 39,781 | | 38,335 | | |||||
Average GE Industrial shareowners' equity, excluding effects of discontinued operations | 52,490 | | 52,131 | | 43,328 | | 46,678 | | 41,218 | | |||||
Plus: average debt(a) | 32,184 | | 21,491 | | 18,411 | | 15,724 | | 13,652 | | |||||
Plus: other, net(b) | 11,084 | | 1,924 | | 1,486 | | 1,743 | | 1,367 | | |||||
Adjusted GE Industrial capital (Non-GAAP) | $ | 95,758 | | $ | 75,546 | | $ | 63,225 | | $ | 64,145 | | $ | 56,237 | |
|
|
|
|
|
| ||||||||||
GE Industrial ROTC (Non-GAAP) | 2.7 | % | 15.4 | % | 16.9 | % | 14.0 | % | 14.3 | % | |||||
(a) | On an annual basis, calculated using a five-point average. |
(b) | Includes average noncontrolling interests, calculated using a five-point average partially offset by the estimated value of assets held by GE to support GE Capital. |
Our GE Industrial ROTC* calculation excludes earnings (losses) of discontinued operations from the numerator. We believe that this is a clearer way to measure the ongoing trend in return on GE Industrial capital for the continuing operations of the business to the extent that discontinued operations have affected our reported results. Our GE Industrial shareowners' equity, excluding effects of discontinued operations* used in the denominator is adjusted for debt, redeemable noncontrolling interests and noncontrolling interests. We believe that these adjustments provide a more meaningful denominator in measuring the return on our industrial businesses. GE Industrial ROTC* was 2.7% in 2017 versus 15.4% in 2016 and 16.9% in 2015. In 2017, a 77.4% decrease in the adjusted GE Industrial return was combined with a 26.8% increase in the adjusted GE Industrial capital. This increase in capital was principally driven by increased debt and increases in minority interest due to our acquisition of Baker Hughes. Our calculation of the adjusted return on GE Industrial capital* may not be directly comparable to similarly titled measures reported by other companies. We believe that the adjustments described above result in a more relevant measure for management and investors to evaluate performance of our Industrial continuing operations, on a consistent basis, and to evaluate and compare the performance of our GE Industrial continuing operations with the continuing operations of other businesses and companies.
*Non-GAAP Financial Measure
GE 2017 FORM 10-K 101
MD&A | SUPPLEMENTAL INFORMATION |
|
GE INDUSTRIAL CASH FLOWS FROM OPERATING ACTIVITIES (GE INDUSTRIAL CFOA), ADJUSTED GE INDUSTRIAL CFOA AND GE INDUSTRIAL FREE CASH FLOW (FCF) | |||||||||
(In millions) | 2017 | | 2016 | | 2015 | | |||
|
|
|
| ||||||
Cash from GE's operating activities (continuing operations), as reported (GAAP) | $ | 11,040 | | $ | 29,960 | | $ | 16,354 | |
Adjustment: dividends from GE Capital | 4,016 | | 20,095 | | 4,300 | | |||
GE Industrial CFOA (Non-GAAP) | $ | 7,024 | | $ | 9,865 | | $ | 12,054 | |
Less: deal-related taxes | (229 | ) | (1,398 | ) | (184 | ) | |||
Less: GE Pension Plan funding | (1,717 | ) | (347 | ) | - | | |||
Less: Oil & Gas CFOA | (477 | ) | - | | - | | |||
Add: BHGE Class B shareholder dividend | 251 | | - | | - | | |||
Adjusted GE Industrial CFOA (Non-GAAP) | $ | 9,698 | | $ | 11,610 | | $ | 12,238 | |
Adjustment: GE additions to property, plant and equipment | (4,132 | ) | (3,758 | ) | (3,785 | ) | |||
Adjustment: GE additions to internal-use software | (518 | ) | (740 | ) | (755 | ) | |||
Adjustment: Oil & Gas additions to property, plant and equipment | 488 | | - | | - | | |||
Adjustment: Oil & Gas additions to internal-use software | 34 | | - | | - | | |||
GE Industrial FCF (Non-GAAP) | $ | 5,569 | | $ | 7,112 | | $ | 7,698 | |
We define GE Industrial CFOA* as GE's cash from operating activities (continuing operations) less the amount of dividends received by GE from GE Capital. This reflects the effects of intercompany transactions, which include, but are not limited to, the following: GE Capital working capital solutions to optimize GE cash management; GE Capital enabled GE industrial orders; GE Capital financing of GE long-term receivables; aircraft engines, power equipment, renewable energy equipment and healthcare equipment manufactured by GE that are installed on GE Capital investments, including leased equipment expenses related to parent-subsidiary pension plans; buildings and equipment leased between GE and GE Capital, including sale leaseback transactions; information technology (IT) and other services sold to GE Capital by GE; and various investments, loans and allocations of GE corporate overhead costs.
We believe that investors may find it useful to compare GE's operating cash flows without the effect of GE Capital dividends, since these dividends are not representative of the operating cash flows of our industrial businesses and can vary from period to period based upon the results of the financial services businesses. We also believe that investors may find it useful to compare GE Industrial CFOA* and GE CFOA excluding the effects of taxes paid related to the 2017 Baker Hughes transaction, the sales of the Water, Appliances, Signaling and NBCU LLC businesses, contributions to our GE Pension Plan and the effects of Oil & Gas CFOA and including the effects of dividends received from BHGE. Management recognizes that these measures may not be comparable to cash flow results of companies which contain both industrial and financial services businesses, but believes that this comparison is aided by the provision of additional information about the amounts of dividends paid by our financial services business and the separate presentation in our financial statements of the GE Capital cash flows. We believe that our measure of GE Industrial CFOA* and Adjusted GE Industrial CFOA* provides management and investors with useful measures to compare the capacity of our industrial operations to generate operating cash flow with the operating cash flow of other non-financial businesses and companies and as such provides useful measures to supplement the reported GAAP CFOA measure.
We define GE Industrial free cash flow* as Adjusted GE Industrial CFOA* less GE additions to property, plant and equipment and additions to internal-use software, excluding Oil & Gas additions to property, plant and equipment and additions to internal-use software. We believe that GE Industrial free cash flow* is a useful financial metric to assess our ability to pursue opportunities to enhance our growth and we believe that our measure of GE Industrial free cash flow* provides investors with useful information about the company's actual performance against performance targets. Management recognizes that the term free cash flow may be interpreted differently by other companies and under different circumstances. Although this may have an effect on comparability of absolute percentage growth from company to company, we believe that these measures are useful in assessing trends of the respective businesses or companies and may therefore be a useful tool in assessing period-to-period performance trends.
*Non-GAAP FInancial Measure
102 GE 2017 FORM 10-K
MD&A | SUPPLEMENTAL INFORMATION |
|
2018 OPERATING FRAMEWORK INCLUDING 2018 ADJUSTED EPS AND GE INDUSTRIAL FCF (NON-GAAP) |
2018 Adjusted EPS Target* $1.00-1.07
Items not included in non-GAAP metric:
1) | Non-operating pension cost*. This amount is affected by, among other things, the timing of voluntary funding and associated asset allocation. |
2) | Gains and restructuring net income/(loss). This amount is affected by, among other things: |
• The timing and magnitude of gains associated with dispositions; and
• The timing and magnitude of the costs associated with restructuring activities.
Note: The company cannot provide an equivalent GAAP guidance range without unreasonable effort because of the uncertainty of the amount and timing of events affecting earnings as we execute on the restructuring actions and business portfolio changes we have announced since John Flannery became CEO. Although we have attempted to estimate the amount of gains and restructuring charges for the purpose of explaining the probable significance of this component, as described under number 2, this calculation involves a number of unknown variables, resulting in a GAAP range that we believe is too large and variable to be meaningful.
2018 OPERATING FRAMEWORK GE INDUSTRIAL FREE CASH FLOW | |
(In billions) | 2018F |
|
|
GE CFOA | ~$3-4 |
Adjustment: dividends from GE Capital | ~ - |
GE Industrial CFOA (Non-GAAP) | ~$3-4 |
Less: GE Pension Plan funding and deal taxes | ~(6) |
Less: Oil & Gas CFOA | ~1 |
Add: BHGE Class B shareholder dividend | ~1 |
Adjusted GE Industrial CFOA (Non-GAAP) | ~$9-10 |
Adjustment: GE additions to property, plant and equipment and internal-use software | ~(4) |
Adjustment: Oil & Gas additions to property, plant and equipment and internal-use software | ~1 |
GE Industrial FCF (Non-GAAP) | ~$6-7 |
*Non-GAAP Financial Measure
GE 2017 FORM 10-K 103
OTHER FINANCIAL DATA |
|
|
OTHER FINANCIAL DATA
SELECTED FINANCIAL DATA
(Dollars in millions; per-share amounts in dollars) | 2017 | | 2016 | | 2015 | | 2014 | | 2013 | | |||||
General Electric Company and Consolidated Affiliates |
|
|
|
|
| ||||||||||
Revenues and other income | $ | 122,092 | | $ | 123,693 | | $ | 117,386 | | $ | 117,184 | | $ | 113,245 | |
Earnings (loss) from continuing operations attributable to the Company | (5,471 | ) | 9,784 | | 1,681 | | 9,535 | | 7,618 | | |||||
Earnings (loss) from discontinued operations, net of taxes, attributable to the Company | (315 | ) | (952 | ) | (7,807 | ) | 5,698 | | 5,439 | | |||||
Net earnings (loss) attributable to the Company | (5,786 | ) | 8,831 | | (6,126 | ) | 15,233 | | 13,057 | | |||||
Dividends declared(a) | 7,741 | | 9,054 | | 9,161 | | 8,948 | | 8,060 | | |||||
Return on average GE shareowners' equity | (8.7 | )% | 10.9 | % | 1.6 | % | 10.8 | % | 9.5 | % | |||||
Per common share |
|
|
|
|
| ||||||||||
Earnings (loss) from continuing operations – diluted | $ | (0.68 | ) | $ | 1.00 | | $ | 0.17 | | $ | 0.94 | | $ | 0.74 | |
Earnings (loss) from discontinued operations – diluted | (0.04 | ) | (0.10 | ) | (0.78 | ) | 0.56 | | 0.53 | | |||||
Net earnings (loss) – diluted | (0.72 | ) | 0.89 | | (0.61 | ) | 1.50 | | 1.27 | | |||||
Earnings (loss) from continuing operations – basic | (0.68 | ) | 1.01 | | 0.17 | | 0.95 | | 0.74 | | |||||
Earnings (loss) from discontinued operations – basic | (0.04 | ) | (0.11 | ) | (0.78 | ) | 0.57 | | 0.53 | | |||||
Net earnings (loss) – basic | (0.72 | ) | 0.90 | | (0.62 | ) | 1.51 | | 1.28 | | |||||
Dividends declared | 0.84 | | 0.93 | | 0.92 | | 0.89 | | 0.79 | | |||||
Cash and equivalents | 43,299 | | 48,129 | | 70,483 | | 70,025 | | 79,175 | | |||||
Total assets | 377,945 | | 365,183 | | 493,071 | | 653,931 | | 662,202 | | |||||
Long-term borrowings | 108,575 | | 105,080 | | 144,659 | | 185,832 | | 216,640 | | |||||
Common shares outstanding – average (in thousands) | 8,687,492 | | 9,025,479 | | 9,944,179 | | 10,044,995 | | 10,222,198 | | |||||
GE funded research and development | 4,803 | | 4,782 | | 4,249 | | 4,233 | | 4,643 | | |||||
Total employees | 313,000 | | 295,000 | | 333,000 | | 305,000 | | 307,000 | | |||||
GE data |
|
|
|
|
| ||||||||||
Short-term borrowings(c) | $ | 14,548 | | $ | 20,482 | | $ | 19,792 | | $ | 3,872 | | $ | 1,841 | |
Long-term borrowings(c) | 67,040 | | 58,810 | | 83,309 | | 12,421 | | 11,484 | | |||||
Redeemable noncontrolling interests | 3,399 | | 3,025 | | 2,972 | | 98 | | 176 | | |||||
Noncontrolling interests | 17,506 | | 1,378 | | 1,378 | | 825 | | 835 | | |||||
GE shareowners' equity | 64,263 | | 75,828 | | 98,274 | | 128,159 | | 130,566 | | |||||
Total capital invested | $ | 166,755 | | $ | 159,523 | | $ | 205,725 | | $ | 145,375 | | $ | 144,903 | |
GE Industrial return on total capital(b)* | 2.7 | % | 15.4 | % | 16.9 | % | 14.0 | % | 14.3 | % | |||||
Borrowings as a percentage of total capital invested(b) | 48.9 | % | 49.7 | % | 50.1 | % | 11.2 | % | 9.2 | % | |||||
GE Capital data |
|
|
|
|
| ||||||||||
GE Capital shareowner's equity | $ | 13,493 | | $ | 24,677 | | $ | 46,227 | | $ | 87,499 | | $ | 82,694 | |
Total borrowings(d) | 95,197 | | 117,303 | | 180,178 | | 245,252 | | 283,820 | | |||||
Ratio of debt to equity at GE Capital | 7.06:1 | | 4.75:1 | | 3.90:1 | | 2.80:1 | | 3.43:1 | | |||||
Transactions between GE and GE Capital have been eliminated from the consolidated information.
(a) | Included $436 million, $656 million and $18 million of preferred stock dividends in 2017, 2016 and 2015, respectively. |
(b) | Indicated terms are defined in the Other Terms used by GE section within the MD&A. |
(c) | Excluding assumed debt of GE Capital, GE total borrowings were $41,744 million , $20,512 million and $18,397 million at December 31, 2017 , 2016 and 2015, respectively. The short-term portion of GE borrowings excluding assumed debt of GE Capital was $6,237 million, $8,786 million and $2,150 million at December 31, 2017 , 2016 and 2015, respectively. |
(d) | Included $39,844 million, $58,780 million and $84,704 million of GE Capital debt assumed by GE and maintained as intercompany payable to GE at December 31, 2017 , 2016 and 2015, respectively. |
*Non-GAAP Financial Measure
104 GE 2017 FORM 10-K
OTHER FINANCIAL DATA |
|
|
PURCHASES OF EQUITY SECURITIES BY THE ISSUER AND AFFILIATED PURCHASERS | ||||||||
Period | Total number of shares purchased | | Average price paid per share | | Total number of shares purchased as part of our share repurchase program(a) | | Approximate dollar value of shares that may yet be purchased under our share repurchase program(a) | |
(Shares in thousands) |
|
|
|
| ||||
|
|
|
|
| ||||
2017 |
|
|
|
| ||||
October | 1,764 | | $ | 22.27 | | 1,764 | |
|
November | 2,547 | | 18.94 | | 2,547 | |
| |
December | 1,431 | | 17.67 | | 1,431 | |
| |
Total | 5,741 | | $ | 19.65 | | 5,741 | | $20.9 billion |
(a) | Shares were repurchased through the GE Share Repurchase Program that we announced on April 10, 2015 (the Program). Under the program, we are authorized to repurchase up to $50.0 billion of our common stock through 2018 and, as of December 31, 2017, we had repurchased a total of approximately $29.1 billion under the Program. The Program is flexible and shares will be acquired with a combination of borrowings and free cash flow from the public markets and other sources, including GE Stock Direct, a stock purchase plan that is available to the public. |
GE 2017 FORM 10-K 105
RISK FACTORS |
|
|
RISK FACTORS
The following discussion of risk factors contains "forward-looking statements," as discussed in the Forward-Looking Statements section. These risk factors may be important to understanding any statement in this Form 10-K report or elsewhere. The risks described below should not be considered a complete list of potential risks that we may face. The following information should be read in conjunction with the Management's Discussion and Analysis of Financial Condition and Results of Operations (MD&A) section and the consolidated financial statements and related notes. We also incorporate the risks described in Baker Hughes, a GE company's Form 10-K report and other SEC filings. The risks we describe in this Form 10-K report or in our other SEC filings could have a material adverse effect on our business, reputation, financial position and results of operations.
Our businesses routinely encounter and address risks, some of which will cause our future results to be different - sometimes materially different - than we presently anticipate. Below, we describe certain important strategic, operational, financial, and legal and compliance risks. Our reactions to material future developments as well as our competitors' reactions to those developments will affect our future results.
STRATEGIC RISKS
Strategic risk relates to the Company's future business plans and strategies, including the risks associated with: the global macro-environment in which we operate; dispositions, mergers and acquisitions and restructuring activity; intellectual property; and other risks, including the demand for our products and services, competitive threats, the success of investments in our Digital and Additive businesses, technology and other product and service innovations.
Global macro-environment - Our growth is subject to global economic and political risks.
We operate in virtually every part of the world and serve customers in over 180 countries. In 2017, 62% of our revenue was attributable to activities outside the United States. Our operations and the execution of our business plans and strategies are subject to the effects of global competition and geopolitical risks. They are also affected by local and regional economic environments, including interest rates, monetary policy, inflation, recession, currency volatility, currency controls or other limitations on the ability to expatriate cash and actual or anticipated default on sovereign debt. For example, changes in local economic conditions or fluctuations in exchange rates may affect product demand or the profitability of our non-U.S. operating units, and the impact on the Company could be significant given the extent of our activities outside the U.S. Political changes and trends such as populism, protectionism, economic nationalism and sentiment toward multinational companies and resulting changes to trade, tax or other laws and policies may be disruptive, and can interfere with our global operating model, our supply chain, our customer relationships and competitive position. We also do business in many emerging markets jurisdictions, such as Egypt, Angola, Nigeria and Venezuela, where economic, political and legal risks are heightened. While some global economic risks can be hedged using derivatives or other financial instruments and some are insurable, such attempts to mitigate these risks are costly and not always successful, and our ability to engage in such mitigation may decrease or become even more costly as a result of more volatile market conditions.
Business portfolio - The success of our business depends on achieving our strategic objectives, including through dispositions, acquisitions and business integrations and joint ventures.
As previously announced, management has identified over $20 billion of assets to be exited in the next year or two and continues to review strategic portfolio options. As we seek to sell certain assets or businesses, we may encounter difficulty in finding buyers or executing alternative exit strategies on acceptable terms, which could delay or prevent the accomplishment of our strategic and financial objectives. We may dispose of assets or businesses at a price or on terms that are less favorable than we had anticipated, or with the exclusion of assets that must be divested or run off separately. We may also face limitations in the form of regulatory or governmental approvals that prevent certain prospective purchasers from completing transactions with us, or arising from our debt or other contractual obligations that limit our ability to complete certain asset or business dispositions. The effect of these dispositions over time may reduce the Company's cash flow and earnings capacity and result in a less diversified portfolio of businesses, and executing on the dispositions can divert senior management time and resources from other pursuits. Dispositions may also involve continued financial involvement in the divested business, such as through continuing equity ownership, transition service agreements, guarantees, indemnities or other current or contingent financial obligations. Under these arrangements, performance by the divested businesses or other conditions outside our control could materially affect our future financial results.
With respect to acquisitions, joint ventures and business integrations, we may not achieve expected returns and other benefits as a result of integration and collaboration challenges related to personnel, IT systems or other factors. For example, our anticipated returns from mergers and acquisitions such as the Alstom acquisition in 2015 or the combination of our Oil & Gas business with Baker Hughes that we completed in July 2017 include cost and growth synergy benefits over a multi-year period that we may not fully realize. As a result of these and other acquisitions over time, we have recorded significant goodwill and other intangible assets on our balance sheet, and if we are not able to realize the value of these assets we may be required to incur charges relating to the impairment of these assets. We also participate in a number of joint ventures with other companies or government enterprises in various markets around the world, including joint ventures where we may have a lesser degree of control over the business operations, which may expose us to additional operational, financial, legal or compliance risks.
106 GE 2017 FORM 10-K
RISK FACTORS |
|
|
Restructuring - We may not realize expected benefits from our cost reduction and restructuring efforts, and these efforts may have adverse effects on our operations, employee retention and results.
We are undertaking extensive restructuring actions that include workforce reductions, global facility consolidations and other cost reduction initiatives, both in connection with existing and recently acquired operations. These actions are a central component of our efforts to improve operational and financial performance. If we do not successfully manage our restructuring activities, expected efficiencies and benefits might be delayed or not realized, and our operations and business could be disrupted. Risks associated with these actions include unforeseen delays in implementation of workforce reductions, additional unexpected costs, adverse effects on employee morale, loss of key employees or other retention issues, inability to attract and hire talented professionals or the failure to meet operational targets due to the loss of employees or work stoppages, any of which may impair our ability to achieve anticipated cost reductions or may otherwise harm our business and have an adverse effect on our competitive position or financial performance.
Competitive environment - We are dependent on the maintenance of existing product lines and service relationships, market acceptance of new product and service introductions and innovations for revenue and earnings growth.
The markets in which we operate are highly competitive in terms of pricing, product and service quality, product development and introduction time, customer service, financing terms and shifts in market demands, and competitors are increasingly offering services for our installed base. Our businesses are also subject to technological change and require us to continually attract and retain skilled talent. Our long-term operating results and competitive position depend substantially upon our ability to continually develop, introduce, and market new and innovative products and services, to modify existing products and services, to customize products and services, to increase our productivity as we perform on long-term service agreements, to anticipate and respond to market and technological changes driven by trends such as increased digitization or automation, or by developments such as climate change that present both risks and opportunities for our businesses. A failure to be adequately market-based, or to accurately forecast customer demand and industry trends, may adversely affect our delivery of products, services and outcomes in line with our projected financial performance or cost estimates, and ultimately may result in excess costs, build-up of inventory that becomes obsolete, lower profit margins and an erosion of our competitive position. For example, increased use of alternative energy sources due to greater cost competitiveness of such sources, or changes in technology or consumer preferences, could adversely affect the demand for our products and related services that are used in power generation or other applications that use oil or natural gas as energy sources, and as a result could have a material adverse effect on the performance of our businesses or our consolidated results. The introduction of innovative and disruptive technologies in the markets in which we operate can also pose risks in the form new competitors, substitutions of existing products, services or solutions, niche players, new business models and competitors that are faster to market with new products or services than we are. We invest substantial amounts in research and development efforts to pursue advancement in a wide range of technologies, products and services. These efforts divert resources from other potential investments in our businesses, and our efforts may not lead to the development of new technologies or products on a timely basis or meet the needs of our customers as fully as competitive offerings.
Intellectual property - Our intellectual property portfolio may not prevent competitors from independently developing products and services similar to or duplicative to ours, and the value of our intellectual property may be negatively impacted by external dependencies.
Our patents and other intellectual property may not prevent competitors from independently developing or selling products and services similar to or duplicative of ours, and there can be no assurance that the resources invested by us to protect our intellectual property will be sufficient or that our intellectual property portfolio will adequately deter misappropriation or improper use of our technology. In the context of the Company's recent performance and potential portfolio actions, the value of the GE brand may be negatively impacted, and we may offer multiple long-term and concurrent trademark licenses of the GE brand in connection with dispositions that may negatively impact the overall value of the brand in the future. As a result of increased numbers of employee exits due to restructuring activities or otherwise, we also face heightened risks related to the loss or unauthorized use of the Company's intellectual property or other protected data. We could also face competition in some countries where we have not invested in an intellectual property portfolio. If we are not able to protect our intellectual property, the value of our brand and other intangible assets may be diminished, and our business may be adversely affected. We also face attempts to gain unauthorized access to our IT systems or products for the purpose of improperly acquiring our trade secrets or confidential business information. The theft or unauthorized use or publication of our trade secrets and other confidential business information as a result of such an incident could adversely affect our competitive position and the value of our investment in research and development. In addition, we may be the target of enforcement of patents by third parties, including aggressive and opportunistic enforcement claims by non-practicing entities. Regardless of the merit of such claims, responding to infringement claims can be expensive and time-consuming. If GE is found to infringe any third-party rights, we could be required to pay substantial damages or we could be enjoined from offering some of our products and services. The value of, or our ability to use, our intellectual property may also be negatively impacted by dependencies on third parties, such as our ability to obtain or renew on reasonable terms licenses that we need in the future, or our ability to secure or retain ownership or rights to use data in certain software analytics or services offerings.
GE 2017 FORM 10-K 107
RISK FACTORS |
|
|
OPERATIONAL RISKS
Operational risk relates to risks arising from systems, processes, people and external events that affect the operation of our businesses. It includes risks related to product and service life cycle and execution; product safety and performance; information management and data protection and security, including cybersecurity; and supply chain and business disruption.
Operational execution - We may face operational challenges that could have a material adverse effect on our business, reputation, financial position and results of operations.
The Company's financial results depend on the successful execution of our businesses' operating plans across all steps of the product and service development, production, marketing, sales, servicing and cash collections lifecycle. Organizational changes, including as a result of restructuring actions that lead to employee attrition or declining labor relations, could adversely affect our ability to manage operational challenges. Operational failures could result in quality problems or potential product, labor safety or environmental risks, which could have a material adverse effect on our business, reputation, financial position and results of operations. In addition, an increasing portion of our business involves large projects where we take on the full scope of engineering, procurement, construction or other services. These types of projects can pose unique risks related to their scale, complexity and duration. Performance issues can arise due to inadequate technical expertise, developments at project sites, safety issues, subcontractors, consortium partners and compliance with government regulations, and can lead to cost overruns, contractual penalties and other adverse consequences. As such projects become a more significant part of our business model, the risk will become greater that operational, quality or other issues at particular projects could adversely affect GE's business, reputation or results of operations.
Product safety - Our products and services are highly sophisticated and specialized, and a major product failure or similar event could adversely affect our business, reputation, financial position and results of operations.
We produce highly sophisticated products and provide specialized services for both our and third-party products that incorporate or use complex or leading-edge technology, including both hardware and software. Many of our products and services involve complex industrial machinery or infrastructure projects, such as commercial jet engines, offshore oil and gas drilling or nuclear power generation, and accordingly the impact of a catastrophic product failure or similar event could be significant. While we have built operational processes to ensure that our product design, manufacture, performance and servicing meet rigorous quality standards, there can be no assurance that we or our customers or other third parties will not experience operational process or product failures and other problems, including through manufacturing or design defects, process or other failures of contractors or third-party suppliers, cyber-attacks or other intentional acts, that could result in potential product, safety, regulatory or environmental risks.
Cybersecurity - Increased cybersecurity requirements, vulnerabilities, threats and more sophisticated and targeted computer crime could pose a risk to our systems, networks, products, solutions, services and data.
Increased global cybersecurity vulnerabilities, threats, computer viruses and more sophisticated and targeted cyber-related attacks, as well as cybersecurity failures resulting from human error and technological errors, pose a risk to the security of GE's and its customers', partners', suppliers' and third-party service providers' products, systems and networks and the confidentiality, availability and integrity of GE's and its customers' data. As the perpetrators of such attacks become more capable, and as critical infrastructure is increasingly becoming digitized, the risks in this area continue to grow. While we attempt to mitigate these risks by employing a number of measures, including employee training, monitoring and testing, and maintenance of protective systems and contingency plans, we remain potentially vulnerable to additional known or unknown threats, and there is no assurance that the impact from such threats will not be material. In addition to existing risks, the adoption of new technologies may also increase our exposure to cybersecurity breaches and failures. We also may have access to sensitive, confidential or personal data or information in certain of our businesses that is subject to privacy and security laws, regulations or customer-imposed controls. Despite our use of reasonable and appropriate controls to protect our systems and sensitive, confidential or personal data or information, we may be vulnerable to material security breaches, theft, misplaced, lost or corrupted data, programming errors, employee errors and/or malfeasance (including misappropriation by departing employees) that could potentially lead to the compromising of sensitive, confidential or personal data or information, improper use of our systems, software solutions or networks, unauthorized access, use, disclosure, modification or destruction of information, defective products, production downtimes and operational disruptions. Data privacy and protection laws are evolving and present increasing compliance challenges, which increase our costs, affect our competitiveness and can expose us to substantial fines or other penalties. In addition, a cyber-related attack could result in other negative consequences, including damage to our reputation or competitiveness, remediation or increased protection costs, litigation or regulatory action.
Supply chain - Significant raw material shortages, supplier capacity constraints, supplier production disruptions, supplier quality and sourcing issues or price increases could increase our operating costs and adversely impact the competitive positions of our products.
Our reliance on third-party suppliers, contract manufacturers and service providers, and commodity markets to secure raw materials, parts, components and sub-systems used in our products exposes us to volatility in the prices and availability of these materials, parts, components, systems and services. Some of these suppliers or their sub-suppliers are limited- or sole-source suppliers. A disruption in deliveries from our third-party suppliers, contract manufacturers or service providers, capacity constraints, production disruptions, price increases, or decreased availability of raw materials or commodities, including as a result of catastrophic events, could have an adverse effect on our ability to meet our commitments to customers or increase our operating costs. Quality, capability and sourcing issues experienced by third-party providers can also adversely affect our costs, margin rates and the quality and effectiveness of our products and services and result in liability and reputational harm.
108 GE 2017 FORM 10-K
RISK FACTORS |
|
|
FINANCIAL RISKS
Financial risk relates to our ability to meet financial obligations and mitigate exposure to broad market risks, including volatility in foreign currency exchange rates and interest rates and commodity prices; funding and liquidity risk, including risk related to our credit ratings and our availability and cost of funding; and credit risk. Liquidity risk refers to the potential inability to meet contractual or contingent financial obligations (whether on- or off-balance sheet) as they arise, and could potentially impact an institution's financial condition or overall safety and soundness. Credit risk is the risk of financial loss arising from a customer or counterparty failure to meet its contractual obligations, and we face credit risk arising from both our industrial businesses and from GE Capital.
Funding & liquidity - Failure to maintain our credit ratings, or conditions in the financial and credit markets, could adversely affect our access to capital markets, funding costs and related margins, liquidity, capital allocation plans and competitive position.
We rely on cash from operations and proceeds from planned dispositions, as well as access to the short- and long-term debt markets, to fund our operations, maintain liquidity and meet our financial obligations and capital allocation priorities. In particular, we rely on significant short-term borrowings in the commercial paper market to fund our operations on an intra-quarter basis. If we do not meet our cash flow objectives, whether through improved cash performance in our businesses or as a result of planned dispositions, our financial condition could be adversely affected. Our access to the debt markets, and to the commercial paper markets as a tier-1 issuer in particular, depends on our credit ratings. For additional discussion about our current credit ratings, refer to the Financial Resources and Liquidity - Debt and Derivative Instruments, Guarantees and Covenants - Credit Ratings section. There can be no assurance that we will be able to maintain our credit ratings. Failure to do so could adversely affect our cost of funds and related margins, liquidity, competitive position and, potentially, access to capital markets. For example, a downgrade of our credit ratings causing a loss of tier-1 commercial paper issuer status would reduce our borrowing capacity in the commercial paper markets, and such a downgrade could require us to draw on operating credit lines or take other actions that increase our cost of funds to replace intra-quarter funding and liquidity. A significant increase in our cost of capital could require changes to our capital allocation plan. In addition, under various debt and derivative instruments, guarantees and covenants, we could be required to post additional capital or collateral in the event of a ratings downgrade, which would increase the impact of a ratings downgrade on our liquidity and capital position.
External conditions in the financial and credit markets may also limit the availability of funding at particular times or increase the cost of funding, which could adversely affect our business, financial position and results of operations. Factors that may affect the availability of funding or cause an increase in our funding costs include disruptions in the commercial paper market, and potential market impacts arising in the United States, Europe or China from developments in sovereign debt situations, currency movements or other potential market disruptions. If GE or GE Capital's cost of funding were to increase, it may adversely affect our competitive position and result in lower net interest margins, earnings and cash flows as well as lower returns on shareowners' equity and invested capital.
Economy/counterparties - A deterioration in conditions in the global economy, the major industries we serve or the financial markets, or in the soundness of financial institutions, governments or customers we deal with, may adversely affect our business and results of operations.
The business and operating results of our industrial businesses have been, and will continue to be, affected by worldwide economic conditions, including conditions in the air and rail transportation, power generation, oil and gas, renewables, healthcare and other major industries we serve. Existing or potential customers may delay or cancel plans to purchase our products and services, including large infrastructure projects, and may not be able to fulfill their obligations to us in a timely fashion as a result of business deterioration, cash flow shortages, low oil prices or difficulty obtaining financing due to geopolitical disruptions, changes in law or other unexpected challenges affecting the strength of the global economy. The airline industry, for example, is highly cyclical, and the level of demand for air travel is correlated to the strength of the U.S. and international economies. An extended disruption of regional or international travel that results in the loss of business and leisure traffic could have a material adverse effect on our airline customers and the viability of their business. Service contract cancellations or customer dynamics such as early aircraft retirements, reduced demand in our Power business as a result of increased market penetration by renewables, reduced demand in the U.S. wind energy market from the elimination of production tax credits for new wind projects or declines in orders, project commencement delays and pricing pressures at Baker Hughes, a GE company from low oil prices could affect our ability to fully recover our contract costs and estimated earnings. Further, our vendors may experience similar conditions, which may impact their ability to fulfill their obligations to us. We may also face greater challenges collecting on receivables with customers that are sovereign governments or located in emerging markets. If there is significant deterioration in the global economy, our results of operations, financial position and cash flows could be materially adversely affected.
GE 2017 FORM 10-K 109
RISK FACTORS |
|
|
GE Capital - A smaller GE Capital continues to have exposure to credit and other risks and, in the event of future adverse developments, may not be able to meet its business and financial objectives without taking further actions at GE Capital or capital contributions by GE.
To fund the statutory capital contributions that it expects to make to its run-off insurance operations over the next several years, as well as to meet its other obligations, GE Capital plans to rely on its existing liquidity and generate additional cash through sales or other portfolio actions, including reducing the size of its Energy Financial Services and Industrial Finance businesses. However, as GE Capital's excess liquidity from past disposition proceeds runs off, and as future earnings are reduced as a result of business or other asset sales, the risk will increase that future adverse developments could cause liquidity or funding stress for GE Capital. For example, it is possible that future requirements for capital contributions to the insurance operations will be greater than currently estimated, or that contingent liabilities from GE Capital's continuing or discontinued operations (including the WMC matters described in the legal proceedings risk factor below) will need to be recognized in the future and will become payable, which would increase the likelihood of GE Capital facing liquidity or funding stress in meeting those and its other obligations. If GE Capital is unable to increase its capital levels over time, it may also face credit ratings downgrades that increase its interest costs or limit its ability to access to external funding in the future. Moreover, GE Capital has exposure to many different industries and counterparties, including sovereign governments, and routinely executes transactions with counterparties in the financial services industry, including brokers and dealers, commercial banks, investment banks and other institutional clients. Many of these transactions expose GE Capital to credit risk in the event of default of its counterparty or client. If conditions in the financial markets deteriorate, they may adversely affect the business and results of operations of GE Capital, as well as the soundness of financial institutions, governments and other counterparties we deal with. In addition, GE Capital's credit risk may be increased when the value of collateral held cannot be realized through sale or is liquidated at prices insufficient to recover the full amount of the loan or derivative exposure due to it. There can be no assurance that future liabilities, losses or impairments to the carrying value of financial assets would not materially and adversely affect GE Capital's business, financial position, results of operations and capacity to provide financing to support orders from GE's industrial businesses, or that factors causing sufficiently severe stress at GE Capital would not require GE to make capital contributions to GE Capital in the future.
Social costs - Sustained increases in pension and healthcare benefits costs may reduce our profitability.
Our results of operations may be positively or negatively affected by the amount of income or expense we record for our defined benefit pension plans. GAAP requires that we calculate income or expense for the plans using actuarial valuations. These valuations reflect assumptions about financial market and other economic conditions, which may change based on changes in key economic indicators. The most significant year-end assumptions we use to estimate pension expense for 2018 are the discount rate and the expected long-term rate of return on the plan assets. In addition, we are required to make an annual measurement of plan assets and liabilities, which may result in a significant reduction or increase to equity. At the end of 2017 , the GE Pension Plan was underfunded, on a GAAP basis, by $17.9 billion, and the GE Supplementary Pension Plan, an unfunded plan, had a projected benefit obligation of $6.7 billion. Although GAAP expense and pension funding contributions are not directly related, key economic factors that affect GAAP expense would also likely affect the amount of cash we would contribute to pension plans as required under the Employee Retirement Income Security Act (ERISA). Failure to achieve expected returns on plan assets driven by various factors, which could include a continued environment of low interest rates or sustained market volatility, could also result in an increase to the amount of cash we would be required to contribute to pension plans. In addition, there may be upward pressure on the cost of providing healthcare benefits to current employees and retirees. Although we have actively sought to control increases in these costs, there can be no assurance that we will succeed in limiting cost increases, and continued upward pressure could reduce our profitability. For a discussion regarding how our financial statements can be affected by our pension and healthcare benefit obligations, see the Other Consolidated Information – Postretirement Benefit Plans section and Note 12 to the consolidated financial statements. See also the Critical Accounting Estimates – Pension Assumptions section for a discussion regarding how our financial statements can be affected by our pension plan accounting policies.
110 GE 2017 FORM 10-K
RISK FACTORS |
|
|
LEGAL & COMPLIANCE RISKS
Legal and compliance risk relates to risks arising from the government and regulatory environment and action and from legal proceedings and compliance with integrity policies and procedures, including those relating to financial reporting, environmental health and safety. Government and regulatory risk includes the risk that the government or regulatory actions will impose additional cost on us or require us to make adverse changes to our business models or practices.
Regulatory - We are subject to a wide variety of laws, regulations and government policies that may change in significant ways.
Our businesses are subject to regulation under a wide variety of U.S. federal and state and non-U.S. laws, regulations and policies. There can be no assurance that laws, regulations and policies will not be changed in ways that will require us to modify our business models and objectives or affect our returns on investments by restricting existing activities and products, subjecting them to escalating costs or prohibiting them outright. In particular, legislative, regulatory or other areas of significance for our businesses that U.S. and non-U.S. governments have focused and continue to focus on include competition law, improper payments, data privacy and sovereignty, foreign exchange intervention in response to currency volatility, currency controls that could restrict the movement of liquidity from particular jurisdictions, trade controls or tariffs on imports and exports in the U.S. or other countries, complex economic sanctions and the enactment of U.S. tax reform and potential further changes to tax laws may have an effect on GE's, GE Capital's or other regulated subsidiaries' structure, operations, sales, liquidity, capital requirements, effective tax rate and performance. For example, legislative or regulatory measures by states or non-U.S. governments in response to the recent U.S. federal tax reform or otherwise, or rules and interpretations under the new tax laws, could increase our costs or tax rate. In addition, efforts by public and private sectors to control the growth of healthcare costs may lead to lower reimbursements and increased utilization controls related to the use of our products by healthcare providers. Regulation or government scrutiny may impact the requirements for marketing our products and slow our ability to introduce new products, resulting in an adverse impact on our business. Furthermore, we have been, and expect to continue, participating in U.S. and international governmental programs, which require us to comply with strict governmental regulations. Inability to comply with these regulations could adversely affect our status in these projects and could have collateral consequences such as limiting our ability to participate in other projects involving multilateral development banks and adversely affect our results of operations, financial position and cash flows.
Legal proceedings - We are subject to legal proceedings, investigations and legal compliance risks, including trailing liabilities from businesses that we dispose of or that are inactive.
We are subject to a variety of legal proceedings and legal compliance risks in virtually every part of the world, including the matters described in the Legal Proceedings and Environmental Matters sections. We, our representatives, and the industries in which we operate are subject to continuing scrutiny by regulators, other governmental authorities and private sector entities or individuals in the U.S., the European Union and other jurisdictions, which may, in certain circumstances, lead to enforcement actions, adverse changes to our business practices, fines and penalties, required remedial actions such as contaminated site clean-up or the assertion of private litigation claims, such as class actions based on alleged securities law violations or breaches of fiduciary duties, and damages that could be material. For example, in connection with our acquisition of Alstom's Thermal, Renewables and Grid businesses in November 2015, we are subject to legacy legal proceedings and legal compliance risks that relate to claimed anti-competitive conduct or improper payments by Alstom in the pre-acquisition period. In addition, our discontinued U.S. mortgage business, WMC, is a defendant in civil litigation arising out of its origination and sale of mortgages from 2005 through 2007, and (as discussed in the Legal Proceedings section) we believe that the U.S Department of Justice is likely to assert that WMC and GE Capital violated the Financial Institutions Reform, Recovery, and Enforcement Act of 1989 (FIRREA) in connection with WMC's origination and sale of subprime mortgage loans in 2006 and 2007.
We have established reserves for these and other legal matters when and as appropriate; however, the estimation of legal reserves or possible losses involves significant judgment and may not reflect the full range of uncertainties and unpredictable outcomes inherent in litigation and investigations, and the actual losses arising from particular matters may exceed our current estimates and adversely affect our results of operations. While we believe that we have adopted appropriate risk management and compliance programs, the global and diverse nature of our operations and the current enforcement environment mean that legal and compliance risks will continue to exist with respect to our continuing and discontinued operations, and we may also be subject to material trailing legal liabilities from businesses that we dispose of or that are inactive. We also expect that additional legal proceedings and other contingencies, the outcome of which cannot be predicted with certainty, will arise from time to time. Moreover, we are increasingly selling products and services in growth markets where claims arising from a catastrophic product failure, alleged violations of law or other incidents involving our products and services may be adjudicated within legal systems that are less developed and less reliable than those of the U.S. or other more developed markets, and this can create additional uncertainty about the outcome of proceedings before courts or other governmental bodies in such markets. See the Legal Proceedings section and Note 21 to the consolidated financial statements for further information about legal proceedings and other loss contingencies.
GE 2017 FORM 10-K 111
LEGAL PROCEEDINGS |
|
|
LEGAL PROCEEDINGS
WMC. There are five lawsuits in which our discontinued U.S. mortgage business, WMC, is a party. The adverse parties in these cases are securitization trustees or parties claiming to act on their behalf. The complaints and counterclaims in these actions generally assert claims for breach of contract, indemnification, and/or declaratory judgment, and seek specific performance (repurchase) and/or monetary damages. Beginning in the fourth quarter 2013, WMC entered into settlements that reduced its exposure on claims asserted in certain securitizations, and the claim amounts reported herein reflect the effect of these settlements.
At September 30, 2017, five WMC cases were pending in the United States District Court for the District of Connecticut. Four of these cases were initiated in 2012, and one was initiated in the third quarter 2013. Deutsche Bank National Trust Company (Deutsche Bank) is the adverse party in four cases, and TMI Trust Company (TMI), as successor to Law Debenture Trust Company of New York, is the adverse party in one case. The Deutsche Bank complaints assert claims on approximately $4,300 million of mortgage loans and seek to recover damages in excess of approximately $1,800 million. In September 2016, WMC and Deutsche Bank agreed to settle all claims arising out of the four securitizations at issue in the Connecticut lawsuits, subject to judicial approvals. In October 2016, Deutsche Bank filed petitions for instruction in California state court seeking judicial instructions that Deutsche Bank's entry into the settlement agreements was a reasonable exercise of its discretion and approving the distribution of settlement proceeds pursuant to the terms of each trust's governing documents. No bondholder in any of these securitizations has objected to the proposed settlements. On July 17, 2017, the court entered a judgment and order granting Deutsche Bank's petitions. The period to file an appeal expired October 9, 2017, and the underlying lawsuits were dismissed by stipulation on October 13, 2017. The TMI complaint asserts claims on approximately $800 million of mortgage loans, and alleges losses on these loans in excess of $425 million. Trial in this case commenced on January 16, 2018. The parties have concluded their presentation of evidence, and the court scheduled closing arguments for June 12, 2018.
Four cases are pending against WMC in New York State Supreme Court, all of which were initiated by securitization trustees or securities administrators. These cases involve, in the aggregate, claims involving approximately $4,559 million of mortgage loans. One of these lawsuits was initiated by Deutsche Bank in the second quarter 2013 and names as defendants WMC and Barclays Bank PLC. It involves claims against WMC on approximately $1,000 million of mortgage loans and does not specify the amount of damages sought. In September 2016, WMC and Deutsche Bank agreed to settle all claims arising out of the two securitizations at issue in this lawsuit, subject to judicial approvals. In October 2016, Deutsche Bank filed petitions for instruction in California state court seeking judicial instructions that Deutsche Bank's entry into the settlement agreements was a reasonable exercise of its discretion and approving the distribution of settlement proceeds pursuant to the terms of each trust's governing documents. Bondholders in these two securitizations filed objections to the proposed settlements and are taking discovery in connection with their objections. The court has scheduled the next hearing on these objections for March 29, 2018. The second case, in which the plaintiff is The Bank of New York Mellon (BNY), was initiated in the fourth quarter 2012 and names as defendants WMC, J.P. Morgan Mortgage Acquisition Corporation and JPMorgan Chase Bank, N.A. BNY asserts claims on approximately $1,300 million of mortgage loans, and seeks to recover damages in excess of $650 million. In the second quarter, WMC and J.P. Morgan reached an agreement with the securitization trustee to settle this case, subject to court approval, and the trustee filed an action in Minnesota state court seeking such approval on July 11, 2017. The court held an initial hearing in this matter on September 11, 2017, at which no bondholder objected to the settlement, and entered an order approving the settlement on October 4, 2017. The parties filed a stipulation of dismissal with prejudice in New York State Supreme Court on January 22, 2018. The third case was initiated by BNY in November 2013 and names as defendants WMC, J.P. Morgan Mortgage Acquisition Corporation and JPMorgan Chase Bank, N.A. In this case, BNY asserts claims on approximately $1,300 million of mortgage loans, and seeks to recover damages in excess of $600 million. On September 18, 2015, the court granted defendants' motion to dismiss this case on statute of limitations grounds, and the plaintiff filed a notice of appeal on October 21, 2015. On May 11, 2017, the intermediate appellate court affirmed the dismissal of WMC, and the plaintiff is seeking leave to appeal this decision to the New York Court of Appeals. The fourth case was filed in October 2014 and names as defendants WMC, J.P. Morgan Mortgage Acquisition Corporation and JPMorgan Chase Bank, N.A. The plaintiff, BNY, asserts claims on approximately $959 million of mortgage loans and seeks to recover damages in excess of $475 million. On September 7, 2016, the court granted WMC's motion to dismiss this case on statute of limitations grounds, and an appeal from this decision is pending in the intermediate appellate court. In the fourth quarter of 2017, JPMorgan and WMC reached a settlement with the trustee in each of these two cases, subject to court approval, and the trustees have filed actions in Minnesota state court seeking such approval. Both cases have been stayed pending the final outcome of these court proceedings.
112 GE 2017 FORM 10-K
LEGAL PROCEEDINGS |
|
|
At September 30, 2017, one case was pending against WMC in the United States District Court for the Southern District of New York. The case was initiated by the Federal Housing Finance Agency (FHFA) in the fourth quarter 2012. In the second quarter 2013, Deutsche Bank, in its role as securitization trustee, intervened as a plaintiff and filed a complaint relating to approximately $1,300 million of loans and alleging losses in excess of approximately $100 million. In December 2013, the District Court issued an order denying WMC's motion to dismiss but, on its own motion, ordered re-briefing on several issues raised by WMC's motion to dismiss in February 2015. On July 10, 2015, the District Court entered an order dismissing the lawsuit as time-barred under the applicable statute of limitations. Deutsche Bank filed a notice of appeal from this order of dismissal on August 13, 2015, and the United States Court of Appeals for the Second Circuit heard oral argument on June 10, 2016. In September 2016, WMC and Deutsche Bank agreed to settle all claims arising out of the securitization at issue in this lawsuit, subject to judicial approval. In October 2016, Deutsche Bank filed a petition for instruction in California state court seeking judicial instructions that Deutsche Bank's entry into the settlement agreement was a reasonable exercise of its discretion and approving the distribution of settlement proceeds pursuant to the terms of the trust's governing documents. No bondholder in this securitization has objected to the proposed settlement. On July 17, 2017, the court entered a judgment and order granting Deutsche Bank's petition. The period to file an appeal expired October 9, 2017, and the underlying lawsuit was dismissed on October 16, 2017.
The amounts of the claims at issue in these pending cases (discussed above) reflect the purchase price or unpaid principal balances of the mortgage loans at issue at the time of purchase and do not give effect to pay downs, accrued interest or fees, or potential recoveries based upon the underlying collateral. All of the mortgage loans involved in these lawsuits are included in WMC's reported claims at December 31, 2017. See Note 21 to the consolidated financial statements for further information.
On January 23, 2017, the ResCap Liquidating Trust, as successor to Residential Funding Company, LLC (RFC), filed a lawsuit seeking unspecified damages against WMC in the United States District Court for the District of Minnesota arising from alleged breaches in representations and warranties made by WMC in connection with the sale of approximately $840 million in loans to RFC over a period of time preceding RFC's filing for bankruptcy protection in May 2012. On September 27, 2017, the parties entered into a settlement agreement, and the lawsuit was dismissed October 8, 2017.
In December 2015, we learned that, as part of continuing industry-wide investigation of subprime mortgages, the Civil Division of the U.S. Department of Justice (DOJ) is investigating potential violations of the Financial Institutions Reform, Recovery, and Enforcement Act of 1989 (FIRREA) by WMC and its affiliates arising out of the origination, purchase or sale of residential mortgage loans between January 1, 2005 and December 31, 2007. The Justice Department subsequently issued subpoenas to WMC and GE Capital, and we are cooperating with the Justice Department's investigation, including providing documents and witnesses for interviews. Based on developments in the course of this investigation and the outcomes of FIRREA investigations involving other financial institutions, we believe DOJ is likely to assert that WMC and GE Capital violated FIRREA in connection with WMC's origination and sale of subprime mortgage loans in 2006 and 2007 which were then used as collateral for residential mortgage-backed securities. WMC and GE Capital will explore whether an acceptable settlement of this matter can be reached. In the event that an acceptable settlement cannot be reached, DOJ may initiate legal proceedings against WMC and GE Capital. WMC and GE Capital believe they would have defenses to any such lawsuit.
Alstom legacy matters. In connection with our acquisition of Alstom's Thermal, Renewables and Grid businesses in November 2015, we are subject to legacy legal proceedings and legal compliance risks that relate to claimed anti-competitive conduct or improper payments by Alstom in the pre-acquisition period, including the previously reported matters described below. See Note 21 to the consolidated financial statements for further information.
In September 2013, the Israeli Antitrust Authority issued a decision whereby Alstom, Siemens AG and ABB Ltd. were held liable for an alleged anti-competitive arrangement in the gas-insulated switchgears market in Israel. While there was no fine in connection with that decision, claimants brought civil actions in 2013 seeking damages of approximately $950 million and $600 million, respectively, related to the alleged conduct underlying the decision that are pending before the Central District Court in Israel. In December 2016, all parties agreed in principle to participate in a formal mediation with the goal of reaching a global settlement of the two civil actions.
In connection with alleged improper payments by Alstom relating to contracts won in 2006 and 2008 for work on a state-owned power plant in Šoštanj, Slovenia, the power plant owner in January 2017 filed an arbitration claim for damages of approximately $430 million before the International Chamber of Commerce Court of Arbitration in Vienna, Austria. In February 2017, a government investigation in Slovenia of the same underlying conduct proceeded to an investigative phase overseen by a judge of the Celje District Court.
EC merger notification objections. In July 2017, the European Commission (EC) issued a statement of objections with its preliminary conclusion that GE provided incorrect or misleading information about its research and development activities regarding high-power offshore wind turbines during the EC's review of GE's planned acquisition of LM Wind. If the EC concludes that GE's alleged violation of the merger notification rules was intentional or negligent, it could impose a fine of up to 1% of GE's annual revenues. We are cooperating with the EC's investigation.
GE 2017 FORM 10-K 113
LEGAL PROCEEDINGS |
|
|
Shareholder lawsuits. From November 1, 2017 to December 18, 2017, three putative class actions under the federal securities laws were filed in the U.S. District Court for the Southern District of New York naming as defendants GE, Jeffrey R. Immelt, Jeffrey S. Bornstein, John L. Flannery and Jamie S. Miller. Two of the complaints allege that the defendants made false and misleading statements regarding GE's expected financial performance which caused economic loss to shareowners who acquired GE stock between July 21, 2017 and October 20, 2017. The third complaint includes additional allegations that future policy benefit reserves for GE Capital's run-off insurance operations were understated and claims economic loss to shareowners who acquired GE stock between December 15, 2016 and November 10, 2017. These actions were consolidated into a single action (the Arkansas Teacher Retirement System (ATRS) case) on January 19, 2018. On February 16, 2018, another putative class action (the Cleveland Bakers and Teamsters Pension Fund (CBTPF) case) was filed in the U.S. District Court for the Southern District of New York. The CBTPF case names the same defendants and makes the same types of allegations as those in the ATRS case. It also includes allegations regarding GE's disclosure on its January 24, 2018 earnings call of the SEC investigation described below, and it claims economic loss to shareowners who acquired GE stock between February 26, 2013 and January 24, 2018. We anticipate that the CBTPF case will be combined with the ATRS case. The lead plaintiffs in the ATRS case have been ordered to file an amended consolidated complaint in March 2018.
On February 15, 2018, a GE shareholder filed a derivative lawsuit (the Gammel case) in New York state court against Jeffrey R. Immelt, John L. Flannery, other current and former members of GE's Board of Directors and GE (as nominal defendant) for alleged breaches of fiduciary duties and unjust enrichment from July 21, 2017 to the present. The allegations relate to substantially the same facts as those underlying the securities class actions described above, as well as the oversight of past GE practices regarding the use of its corporate aircraft. The plaintiff seeks unspecified damages and for GE to take steps to improve its corporate governance and internal procedures.
These cases are at an early stage; we believe we have defenses to the claims and will respond accordingly.
SEC investigation. In late November 2017, staff of the Boston office of the U.S. Securities & Exchange Commission (SEC) notified us that they are conducting an investigation of GE's revenue recognition practices and internal controls over financial reporting related to long-term service agreements. Following our investor update on January 16, 2018 about the increase in future policy benefit reserves for GE Capital's run-off insurance operations, as discussed in the Critical Accounting Estimates section, the SEC staff expanded the scope of its investigation to encompass the reserve increase and the process leading to the reserve increase. We are providing documents and other information requested by the SEC staff, and we are cooperating with their ongoing investigation.
GE Retirement Savings Plan class actions. On September 27, 2017, three individual plaintiffs filed a putative class action lawsuit in the U.S. District Court for the Southern District of California with claims regarding the oversight of GE's 401(k) plan (the GE RSP). From October 30 to November 15, 2017, three similar class action suits were filed in the U.S. District Court for the District of Massachusetts. The Massachusetts actions were consolidated, and we anticipate that the California action will also be consolidated, resulting in a single action. Together, the complaints name as defendants GE, GE Asset Management, current and former GE and GE Asset Management employees who served on fiduciary bodies responsible for overseeing the GE RSP during the class period and current and former members of GE's Board of Directors. Like similar lawsuits that have been brought against other companies in recent years, these actions allege that the defendants breached their fiduciary duties under the Employee Retirement Income Security Act of 1974 (ERISA) in their oversight of the GE RSP, principally by retaining five proprietary funds that plaintiffs allege were underperforming as investment options for plan participants and charging higher management fees than some alternative funds. The plaintiffs, purporting to act on behalf of GE RSP participants and beneficiaries from October 30, 2011 through the date of any judgment, seek damages of $700 million, but we believe we have defenses to the claims and will respond accordingly.
Environmental matters. As previously reported, in 2000, GE and the Environmental Protection Agency (EPA) entered into a consent decree relating to PCB cleanup of the Housatonic River in Massachusetts. Following EPA's release in September 2015 of an intended final remediation decision, GE and EPA engaged in mediation and the first step of the dispute resolution process contemplated by the consent decree. In October 2016, the EPA issued its final decision pursuant to the consent decree, which GE and several other interested parties appealed to EPA's Environmental Appeals Board (EAB). The EAB issued its decision on January 26, 2018, affirming parts of EPA's decision and granting relief to GE on certain significant elements of its challenge. The EAB remanded the decision back to EPA to address those elements and reissue a revised final remedy. The revised final remedy may be appealed to the EAB and ultimately the United States Court of Appeals for the First Circuit. The full remedy will not be implemented until any appeals of the revised decision are resolved. As of December 31, 2017, and based on its assessment of current facts and circumstances and its defenses, GE believes that it has recorded adequate reserves to cover future obligations associated with an expected final remedy.
The Company is reporting the following matter in compliance with SEC requirements to disclose environmental proceedings where the government is a party and that potentially involve monetary sanctions of $100,000 or greater. In January 2018, Kern County California issued an administrative enforcement order with a proposed penalty of $130,000 for alleged violations of process safety management regulations at a manufacturing facility in Taft, California that is indirectly owned by Baker Hughes, a GE company.
114 GE 2017 FORM 10-K
REPORTS |
|
|
MANAGEMENT AND AUDITOR'S REPORTS
MANAGEMENT'S DISCUSSION OF FINANCIAL RESPONSIBILITY
We believe that great companies are built on a foundation of reliable financial information and compliance with the spirit and letter of the law. For General Electric Company, that foundation includes rigorous management oversight of, and an unyielding dedication to, controllership. The financial disclosures in this report are one product of our commitment to high-quality financial reporting. In addition, we make every effort to adopt appropriate accounting policies, we devote our full resources to ensuring that those policies are applied properly and consistently and we do our best to fairly present our financial results in a manner that is complete and understandable.
Members of our corporate leadership team review each of our businesses routinely on matters that range from overall strategy and financial performance to staffing and compliance. Our business leaders monitor financial and operating systems, enabling us to identify potential opportunities and concerns at an early stage and positioning us to respond rapidly. Our Board of Directors oversees management's business conduct, and our Audit Committee, which consists entirely of independent directors, oversees our internal control over financial reporting. We continually examine our governance practices in an effort to enhance investor trust and improve the Board's overall effectiveness. The Board and its committees annually conduct a performance self-evaluation and recommend improvements. Our lead director chaired four meetings of our independent directors this year, helping us sharpen our full Board meetings to better cover significant topics. Compensation policies for our executives are aligned with the long-term interests of GE investors.
We strive to maintain a dynamic system of internal controls and procedures-including internal control over financial reporting-designed to ensure reliable financial recordkeeping, transparent financial reporting and disclosure, and protection of physical and intellectual property. We recruit, develop and retain a world-class financial team. Our internal audit function, including members of our Corporate Audit Staff, conducts thousands of financial, compliance and process improvement audits each year. Our Audit Committee oversees the scope and evaluates the overall results of these audits, and in 2017, members of that Committee attended GE Corporate Audit Staff and Controllership Council meetings. Our global integrity policies-"The Spirit & The Letter"-require compliance with law and policy, and pertain to such vital issues as upholding financial integrity and avoiding conflicts of interest. These integrity policies are available in 36 languages, and are provided to all of our employees, holding each of them accountable for compliance. Our strong compliance culture reinforces these efforts by requiring employees to raise any compliance concerns and by prohibiting retribution for doing so. To facilitate open and candid communication, we have designated ombudspersons throughout the Company to act as independent resources for reporting integrity or compliance concerns. We hold our directors, consultants, agents and independent contractors to the same integrity standards.
We are keenly aware of the importance of full and open presentation of our financial position and operating results, and rely for this purpose on our disclosure controls and procedures, including our Disclosure Committee, which comprises senior executives with detailed knowledge of our businesses and the related needs of our investors. We ask this committee to review our compliance with accounting and disclosure requirements, to evaluate the fairness of our financial and non-financial disclosures, and to report their findings to us. In 2017, we further ensured strong disclosure by holding approximately 130 analyst and investor meetings with GE leadership present.
We welcome the strong oversight of our financial reporting activities by our independent registered public accounting firm, KPMG LLP, engaged by and reporting directly to the Audit Committee. U.S. legislation requires management to report on internal control over financial reporting and for auditors to render an opinion on such controls. Our report and the KPMG LLP report for 2017 follow.
GE 2017 FORM 10-K 115
REPORTS |
|
|
MANAGEMENT'S ANNUAL REPORT ON INTERNAL CONTROL OVER FINANCIAL REPORTING
Management is responsible for establishing and maintaining adequate internal control over financial reporting for the Company. With our participation, an evaluation of the effectiveness of our internal control over financial reporting was conducted as of December 31, 2017, based on the framework and criteria established in Internal Control – Integrated Framework (2013) issued by the Committee of Sponsoring Organizations of the Treadway Commission.
Based on this evaluation, our management has concluded that our internal control over financial reporting was effective as of December 31, 2017 .
Our independent registered public accounting firm has issued an audit report on our internal control over financial reporting. Their report follows.
/s/ John L. Flannery |
| /s/ Jamie S. Miller |
John L. Flannery |
| Jamie S. Miller |
Chairman of the Board and Chief Executive Officer February 23, 2018 |
| Senior Vice President and Chief Financial Officer |
DISCLOSURE CONTROLS
Under the direction of our Chief Executive Officer and Chief Financial Officer, we evaluated our disclosure controls and procedures and internal control over financial reporting and concluded that our disclosure controls and procedures were effective as of December 31, 2017 .
There have been no changes in the Company's internal control over financial reporting during the quarter ended December 31, 2017 , that have materially affected, or are reasonably likely to materially affect, its internal control over financial reporting.
116 GE 2017 FORM 10-K
REPORTS |
|
|
REPORT OF INDEPENDENT REGISTERED PUBLIC ACCOUNTING FIRM
The Board of Directors and Shareowners
of General Electric Company:
Opinions on the Consolidated Financial Statements and Internal Control Over Financial Reporting
We have audited the accompanying statement of financial position of General Electric Company (the "Company") as of December 31, 2017 and 2016, the related consolidated statements of earnings (loss), comprehensive income (loss) and cash flows for each of the years in the three-year period ended December 31, 2017, and the related notes (collectively, the "consolidated financial statements"). We also have audited the Company's internal control over financial reporting as of December 31, 2017, based on criteria established in Internal Control - Integrated Framework (2013) issued by the Committee of Sponsoring Organizations of the Treadway Commission.
In our opinion, the consolidated financial statements referred to above present fairly, in all material respects, the financial position of the Company as of December 31, 2017 and 2016, and the results of its operations and its cash flows for each of the years in the three-year period ended December 31, 2017, in conformity with U.S. generally accepted accounting principles. Also in our opinion, the Company maintained, in all material respects, effective internal control over financial reporting as of December 31, 2017, based on criteria established in Internal Control - Integrated Framework (2013) issued by the Committee of Sponsoring Organizations of the Treadway Commission.
Basis for Opinions
The Company's management is responsible for these consolidated financial statements, for maintaining effective internal control over financial reporting, and for its assessment of the effectiveness of internal control over financial reporting, included in the accompanying Management's Annual Report on Internal Control over Financial Reporting. Our responsibility is to express an opinion on the Company's consolidated financial statements and an opinion on the Company's internal control over financial reporting based on our audits. We are a public accounting firm registered with the Public Company Accounting Oversight Board (United States) ("PCAOB") and are required to be independent with respect to the Company in accordance with the U.S. federal securities laws and the applicable rules and regulations of the Securities and Exchange Commission and the PCAOB.
We conducted our audits in accordance with the standards of the PCAOB. Those standards require that we plan and perform the audits to obtain reasonable assurance about whether the consolidated financial statements are free of material misstatement, whether due to error or fraud, and whether effective internal control over financial reporting was maintained in all material respects.
Our audits of the consolidated financial statements included performing procedures to assess the risks of material misstatement of the consolidated financial statements, whether due to error or fraud, and performing procedures that respond to those risks. Such procedures included examining, on a test basis, evidence regarding the amounts and disclosures in the consolidated financial statements. Our audits also included evaluating the accounting principles used and significant estimates made by management, as well as evaluating the overall presentation of the consolidated financial statements. Our audit of internal control over financial reporting included obtaining an understanding of internal control over financial reporting, assessing the risk that a material weakness exists, and testing and evaluating the design and operating effectiveness of internal control based on the assessed risk. Our audits also included performing such other procedures as we considered necessary in the circumstances. We believe that our audits provide a reasonable basis for our opinions.
Definition and Limitations of Internal Control Over Financial Reporting
A company's internal control over financial reporting is a process designed to provide reasonable assurance regarding the reliability of financial reporting and the preparation of financial statements for external purposes in accordance with generally accepted accounting principles. A company's internal control over financial reporting includes those policies and procedures that (1) pertain to the maintenance of records that, in reasonable detail, accurately and fairly reflect the transactions and dispositions of the assets of the company; (2) provide reasonable assurance that transactions are recorded as necessary to permit preparation of financial statements in accordance with generally accepted accounting principles, and that receipts and expenditures of the company are being made only in accordance with authorizations of management and directors of the company; and (3) provide reasonable assurance regarding prevention or timely detection of unauthorized acquisition, use, or disposition of the company's assets that could have a material effect on the financial statements.
Because of its inherent limitations, internal control over financial reporting may not prevent or detect misstatements. Also, projections of any evaluation of effectiveness to future periods are subject to the risk that controls may become inadequate because of changes in conditions, or that the degree of compliance with the policies or procedures may deteriorate.
Accompanying Supplemental Information
The accompanying consolidating information appearing on pages 121, 125, and 127 ("supplemental information") has been subjected to audit procedures performed in conjunction with the audit of the Company's consolidated financial statements. The supplemental information is the responsibility of the Company's management. Our audit procedures included determining whether the supplemental information reconciles to the consolidated financial statements or the underlying accounting and other records, as applicable, and performing procedures to test the completeness and accuracy of the information presented in the supplemental information. In our opinion, the supplemental information is fairly stated, in all material respects, in relation to the consolidated financial statements as a whole.
/s/ KPMG LLP |
KPMG LLP We have served as the Company's auditor since 1909 Boston, Massachusetts |
GE 2017 FORM 10-K 117
[PAGE INTENTIONALLY LEFT BLANK]
FINANCIAL STATEMENTS |
|
|
AUDITED FINANCIAL STATEMENTS AND NOTES
Statement of Earnings (Loss) | 120 | ||
Consolidated Statement of Comprehensive Income (Loss) | 122 | ||
Statement of Financial Position | 124 | ||
Statement of Cash Flows | 126 | ||
Notes to Consolidated Financial Statements |
| ||
1 |
| Basis of Presentation and Summary of Significant Accounting Policies | 128 |
2 |
| Businesses Held for Sale and Discontinued Operations | 136 |
3 |
| Investment Securities | 138 |
4 |
| Current Receivables | 139 |
5 |
| Inventories | 140 |
6 |
| GE Capital Financing Receivables and Allowance for Losses on Financing Receivables | 140 |
7 |
| Property, Plant and Equipment | 142 |
8 |
| Acquisitions, Goodwill and Other Intangible Assets | 142 |
9 |
| Contract Assets | 149 |
10 |
| Borrowings | 150 |
11 |
| Investment Contracts, Insurance Liabilities and Insurance Annuity Benefits | 152 |
12 |
| Postretirement Benefit Plans | 154 |
13 |
| Income Taxes | 162 |
14 |
| Shareowners' Equity | 166 |
15 |
| Other Stock-related Information | 169 |
16 |
| Earnings Per Share Information | 172 |
17 |
| Other Income | 172 |
18 |
| Fair Value Measurements | 173 |
19 |
| Financial Instruments | 175 |
20 |
| Variable Interest Entities | 180 |
21 |
| Commitments, Guarantees, Product Warranties and Other Loss Contingencies | 182 |
22 |
| Cash Flows Information | 185 |
23 |
| Intercompany Transactions | 187 |
24 |
| Operating Segments | 188 |
25 |
| Cost Information | 191 |
26 |
| Guarantor Financial Information | 192 |
27 |
| Quarterly Information (unaudited) | 199 |
GE 2017 FORM 10-K 119
FINANCIAL STATEMENTS |
|
|
FINANCIAL STATEMENTS
STATEMENT OF EARNINGS (LOSS) |
|
|
| ||||||
| General Electric Company and consolidated affiliates | ||||||||
For the years ended December 31 (In millions; per-share amounts in dollars) | 2017 | | 2016 | | 2015 | | |||
|
|
|
| ||||||
Revenues and other income |
|
|
| ||||||
Sales of goods | $ | 75,641 | | $ | 75,414 | | $ | 74,510 | |
Sales of services | 37,551 | | 34,976 | | 31,298 | | |||
Other income (Note 17) | 1,625 | | 4,005 | | 2,227 | | |||
GE Capital earnings (loss) from continuing operations | - | | - | | - | | |||
GE Capital revenues from services | 7,276 | | 9,297 | | 9,350 | | |||
Total revenues and other income | 122,092 | | 123,693 | | 117,386 | | |||
|
|
|
| ||||||
Costs and expenses (Note 25) |
|
|
| ||||||
Cost of goods sold | 64,328 | | 62,440 | | 59,905 | | |||
Cost of services sold | 27,606 | | 25,043 | | 22,788 | | |||
Selling, general and administrative expenses | 18,280 | | 18,377 | | 17,831 | | |||
Interest and other financial charges | 4,869 | | 5,025 | | 3,463 | | |||
Investment contracts, insurance losses and insurance annuity benefits | 12,168 | | 2,797 | | 2,605 | | |||
Other costs and expenses | 3,632 | | 982 | | 2,608 | | |||
Total costs and expenses | 130,883 | | 114,663 | | 109,200 | | |||
|
|
|
| ||||||
Earnings (loss) from continuing operations before income taxes | (8,791 | ) | 9,030 | | 8,186 | | |||
Benefit (provision) for income taxes (Note 13) | 3,043 | | 464 | | (6,485 | ) | |||
Earnings (loss) from continuing operations | (5,748 | ) | 9,494 | | 1,700 | | |||
Earnings (loss) from discontinued operations, net of taxes (Note 2) | (309 | ) | (954 | ) | (7,495 | ) | |||
Net earnings (loss) | (6,056 | ) | 8,540 | | (5,795 | ) | |||
Less net earnings (loss) attributable to noncontrolling interests | (270 | ) | (291 | ) | 332 | | |||
Net earnings (loss) attributable to the Company | (5,786 | ) | 8,831 | | (6,126 | ) | |||
Preferred stock dividends | (436 | ) | (656 | ) | (18 | ) | |||
Net earnings (loss) attributable to GE common shareowners | $ | (6,222 | ) | $ | 8,176 | | $ | (6,145 | ) |
|
|
|
| ||||||
Amounts attributable to GE common shareowners |
|
|
| ||||||
Earnings (loss) from continuing operations | $ | (5,748 | ) | $ | 9,494 | | $ | 1,700 | |
Less net earnings (loss) attributable to noncontrolling interests, continuing operations | (277 | ) | (290 | ) | 19 | | |||
Earnings (loss) from continuing operations attributable to the Company | (5,471 | ) | 9,784 | | 1,681 | | |||
Preferred stock dividends | (436 | ) | (656 | ) | (18 | ) | |||
Earnings (loss) from continuing operations attributable to GE common shareowners | (5,907 | ) | 9,128 | | 1,663 | | |||
Earnings (loss) from discontinued operations, net of taxes | (309 | ) | (954 | ) | (7,495 | ) | |||
Less net earnings (loss) attributable to noncontrolling interests, discontinued operations | 6 | | (1 | ) | 312 | | |||
Net earnings (loss) attributable to GE common shareowners | $ | (6,222 | ) | $ | 8,176 | | $ | (6,145 | ) |
|
|
|
| ||||||
Per-share amounts (Note 16) |
|
|
| ||||||
Earnings (loss) from continuing operations |
|
|
| ||||||
Diluted earnings (loss) per share | $ | (0.68 | ) | $ | 1.00 | | $ | 0.17 | |
Basic earnings (loss) per share | $ | (0.68 | ) | $ | 1.01 | | $ | 0.17 | |
|
|
|
| ||||||
Net earnings (loss) |
|
|
| ||||||
Diluted earnings (loss) per share | $ | (0.72 | ) | $ | 0.89 | | $ | (0.61 | ) |
Basic earnings (loss) per share | $ | (0.72 | ) | $ | 0.90 | | $ | (0.62 | ) |
|
|
|
| ||||||
Dividends declared per common share | $ | 0.84 | | $ | 0.93 | | $ | 0.92 | |
Amounts may not add due to rounding.
See accompanying notes.
120 GE 2017 FORM 10-K
FINANCIAL STATEMENTS |
|
|
STATEMENT OF EARNINGS (LOSS) (CONTINUED) |
|
|
|
|
|
| |||||||||||||
For the years ended December 31 | GE(a) |
| Financial Services (GE Capital) | ||||||||||||||||
(In millions; per-share amounts in dollars) | 2017 | | 2016 | | 2015 | |
| 2017 | | 2016 | | 2015 | | ||||||
|
|
|
|
|
|
|
| ||||||||||||
Revenues and other income |
|
|
|
|
|
|
| ||||||||||||
Sales of goods | $ | 75,718 | | $ | 75,580 | | $ | 74,565 | |
| $ | 130 | | $ | 115 | | $ | 79 | |
Sales of services | 37,761 | | 35,255 | | 31,641 | |
| - | | - | | - | | ||||||
Other income (Note 17) | 1,436 | | 4,092 | | 2,165 | |
| - | | - | | - | | ||||||
GE Capital earnings (loss) from continuing operations | (6,765 | ) | (1,251 | ) | (7,672 | ) |
| - | | - | | - | | ||||||
GE Capital revenues from services | - | | - | | - | |
| 8,940 | | 10,790 | | 10,722 | | ||||||
Total revenues and other income | 108,150 | | 113,676 | | 100,700 | |
| 9,070 | | 10,905 | | 10,801 | | ||||||
|
|
|
|
|
|
|
| ||||||||||||
Costs and expenses (Note 25) |
|
|
|
|
|
|
| ||||||||||||
Cost of goods sold | 64,433 | | 62,628 | | 59,970 | |
| 102 | | 93 | | 69 | | ||||||
Cost of services sold | 25,619 | | 23,084 | | 20,858 | |
| 2,196 | | 2,238 | | 2,273 | | ||||||
Selling, general and administrative expenses | 17,103 | | 16,123 | | 14,914 | |
| 1,676 | | 2,947 | | 3,512 | | ||||||
Interest and other financial charges | 2,753 | | 2,026 | | 1,706 | |
| 3,145 | | 3,790 | | 2,301 | | ||||||
Investment contracts, insurance losses and insurance annuity benefits | - | | - | | - | |
| 12,213 | | 2,861 | | 2,737 | | ||||||
Other costs and expenses | 1,165 | | - | | - | |
| 2,371 | | 1,013 | | 2,647 | | ||||||
Total costs and expenses | 111,072 | | 103,860 | | 97,447 | |
| 21,703 | | 12,942 | | 13,539 | | ||||||
|
|
|
|
|
|
|
| ||||||||||||
Earnings (loss) from continuing operations before income taxes | (2,922 | ) | 9,815 | | 3,252 | |
| (12,633 | ) | (2,037 | ) | (2,739 | ) | ||||||
Benefit (provision) for income taxes (Note 13) | (3,259 | ) | (967 | ) | (1,506 | ) |
| 6,302 | | 1,431 | | (4,979 | ) | ||||||
Earnings (loss) from continuing operations | (6,181 | ) | 8,849 | | 1,746 | |
| (6,331 | ) | (606 | ) | (7,718 | ) | ||||||
Earnings (loss) from discontinued operations, net of taxes (Note 2) | (315 | ) | (952 | ) | (7,807 | ) |
| (312 | ) | (954 | ) | (7,485 | ) | ||||||
Net earnings (loss) | (6,496 | ) | 7,896 | | (6,061 | ) |
| (6,643 | ) | (1,560 | ) | (15,202 | ) | ||||||
Less net earnings (loss) attributable to noncontrolling interests | (274 | ) | (279 | ) | 83 | |
| 4 | | (12 | ) | 248 | | ||||||
Net earnings (loss) attributable to the Company | (6,222 | ) | 8,176 | | (6,145 | ) |
| (6,647 | ) | (1,548 | ) | (15,450 | ) | ||||||
Preferred stock dividends | - | | - | | - | |
| (436 | ) | (656 | ) | (330 | ) | ||||||
Net earnings (loss) attributable to GE common shareowners | $ | (6,222 | ) | $ | 8,176 | | $ | (6,145 | ) |
| $ | (7,083 | ) | $ | (2,204 | ) | $ | (15,780 | ) |
|
|
|
|
|
|
|
| ||||||||||||
Amounts attributable to GE common shareowners: |
|
|
|
|
|
|
| ||||||||||||
Earnings (loss) from continuing operations | $ | (6,181 | ) | $ | 8,849 | | $ | 1,746 | |
| $ | (6,331 | ) | $ | (606 | ) | $ | (7,718 | ) |
Less net earnings (loss) attributable to noncontrolling interests, continuing operations | (274 | ) | (279 | ) | 83 | |
| (3 | ) | (10 | ) | (64 | ) | ||||||
Earnings (loss) from continuing operations attributable to the Company | (5,907 | ) | 9,128 | | 1,663 | |
| (6,328 | ) | (595 | ) | (7,654 | ) | ||||||
Preferred stock dividends | - | | - | | - | |
| (436 | ) | (656 | ) | (330 | ) | ||||||
Earnings (loss) from continuing operations attributable to GE common shareowners | (5,907 | ) | 9,128 | | 1,663 | |
| (6,765 | ) | (1,251 | ) | (7,983 | ) | ||||||
Earnings (loss) from discontinued operations, net of taxes | (315 | ) | (952 | ) | (7,807 | ) |
| (312 | ) | (954 | ) | (7,485 | ) | ||||||
Less net earnings (loss) attributable to noncontrolling interests, discontinued operations | - | | - | | - | |
| 6 | | (1 | ) | 312 | | ||||||
Net earnings (loss) attributable to GE common shareowners | $ | (6,222 | ) | $ | 8,176 | | $ | (6,145 | ) |
| $ | (7,083 | ) | $ | (2,204 | ) | $ | (15,780 | ) |
(a) | Represents the adding together of all affiliated companies except GE Capital, which is presented on a one-line basis. See Note 1. |
Amounts may not add due to rounding.
In the consolidating data on this page, "GE" means the basis of consolidation as described in Note 1 to the consolidated financial statements; "GE Capital" means GE Capital Global Holdings, LLC (GECGH) and its predecessor General Electric Capital Corporation (GECC) and all of their affiliates and associated companies. Separate information is shown for "GE" and "Financial Services (GE Capital)." Transactions between GE and GE Capital have been eliminated from the "General Electric Company and consolidated affiliates" columns on the prior page.
GE 2017 FORM 10-K 121
FINANCIAL STATEMENTS |
|
|
GENERAL ELECTRIC COMPANY AND CONSOLIDATED AFFILIATES |
|
|
| ||||||
CONSOLIDATED STATEMENT OF COMPREHENSIVE INCOME (LOSS) |
|
|
| ||||||
|
|
|
| ||||||
For the years ended December 31 (In millions) | 2017 | | 2016 | | 2015 | | |||
|
|
|
| ||||||
Net earnings (loss) | $ | (6,056 | ) | $ | 8,540 | | $ | (5,795 | ) |
Less net earnings (loss) attributable to noncontrolling interests | (270 | ) | (291 | ) | 332 | | |||
Net earnings (loss) attributable to the Company | $ | (5,786 | ) | $ | 8,831 | | $ | (6,126 | ) |
|
|
|
| ||||||
Other comprehensive income (loss) |
|
|
| ||||||
Investment securities | $ | (775 | ) | $ | 203 | | $ | (553 | ) |
Currency translation adjustments | 2,198 | | (1,311 | ) | (3,137 | ) | |||
Cash flow hedges | 51 | | 93 | | 99 | | |||
Benefit plans | 2,782 | | (1,068 | ) | 5,165 | | |||
Other comprehensive income (loss) | 4,255 | | (2,083 | ) | 1,575 | | |||
Less other comprehensive income (loss) attributable to noncontrolling interests | 53 | | (14 | ) | (69 | ) | |||
Other comprehensive income (loss) attributable to the Company | $ | 4,202 | | $ | (2,069 | ) | $ | 1,644 | |
|
|
|
| ||||||
Comprehensive income (loss) | $ | (1,801 | ) | $ | 6,457 | | $ | (4,220 | ) |
Less comprehensive income (loss) attributable to noncontrolling interests | (217 | ) | (305 | ) | 263 | | |||
Comprehensive income (loss) attributable to the Company | $ | (1,584 | ) | $ | 6,762 | | $ | (4,483 | ) |
Amounts presented net of taxes.
Amounts may not add due to rounding.
See accompanying notes.
122 GE 2017 FORM 10-K
FINANCIAL STATEMENTS |
|
|
[PAGE INTENTIONALLY LEFT BLANK]
GE 2017 FORM 10-K 123
FINANCIAL STATEMENTS |
|
|
STATEMENT OF FINANCIAL POSITION | ||||||
| General Electric Company | |||||
December 31 (In millions, except share amounts) | 2017 | | 2016 | | ||
|
|
| ||||
Assets |
|
| ||||
Cash and equivalents | $ | 43,299 | | $ | 48,129 | |
Investment securities (Note 3) | 38,696 | | 44,313 | | ||
Current receivables (Note 4) | 24,438 | | 24,076 | | ||
Inventories (Note 5) | 21,923 | | 22,354 | | ||
Financing receivables – net (Note 6) | 10,336 | | 12,242 | | ||
Other GE Capital receivables | 6,301 | | 5,944 | | ||
Property, plant and equipment – net (Note 7) | 53,874 | | 50,518 | | ||
Receivable from GE Capital (debt assumption) | - | | - | | ||
Investment in GE Capital | - | | - | | ||
Goodwill (Note 8) | 83,968 | | 70,438 | | ||
Other intangible assets – net (Note 8) | 20,273 | | 16,436 | | ||
Contract assets (Note 9) | 28,861 | | 25,162 | | ||
All other assets | 29,612 | | 27,176 | | ||
Deferred income taxes (Note 13) | 6,207 | | 1,833 | | ||
Assets of businesses held for sale (Note 2) | 4,243 | | 1,745 | | ||
Assets of discontinued operations (Note 2) | 5,912 | | 14,815 | | ||
Total assets(a) | $ | 377,945 | | $ | 365,183 | |
| | | ||||
Liabilities and equity | | | ||||
Short-term borrowings (Note 10) | $ | 24,036 | | $ | 30,714 | |
Accounts payable, principally trade accounts | 15,153 | | 14,435 | | ||
Progress collections and price adjustments accrued | 18,462 | | 16,760 | | ||
Dividends payable | 1,052 | | 2,107 | | ||
Other GE current liabilities | 18,697 | | 17,564 | | ||
Non-recourse borrowings of consolidated securitization entities (Note 10) | 1,980 | | 417 | | ||
Long-term borrowings (Note 10) | 108,575 | | 105,080 | | ||
Investment contracts, insurance liabilities and insurance annuity benefits (Note 11) | 38,136 | | 26,086 | | ||
Non-current compensation and benefits | 41,630 | | 43,780 | | ||
All other liabilities | 22,795 | | 22,912 | | ||
Liabilities of businesses held for sale (Note 2) | 1,339 | | 656 | | ||
Liabilities of discontinued operations (Note 2) | 706 | | 4,158 | | ||
Total liabilities(a) | 292,561 | | 284,668 | | ||
| | | ||||
Redeemable noncontrolling interests (Note 14) | 3,399 | | 3,025 | | ||
| | | ||||
Preferred stock (5,939,874 and 5,944,250 and shares outstanding at December 31, 2017 and December 31, 2016, respectively) | 6 | | 6 | | ||
Common stock (8,680,571,000 and 8,742,614,000 shares outstanding at December 31, 2017 and December 31, 2016, respectively) | 702 | | 702 | | ||
Accumulated other comprehensive income (loss) – net attributable to GE(b) | | | ||||
Investment securities | (102 | ) | 674 | | ||
Currency translation adjustments | (4,653 | ) | (6,816 | ) | ||
Cash flow hedges | 62 | | 12 | | ||
Benefit plans | (9,702 | ) | (12,469 | ) | ||
Other capital | 37,171 | | 37,224 | | ||
Retained earnings | 125,682 | | 139,532 | | ||
Less common stock held in treasury | (84,902 | ) | (83,038 | ) | ||
Total GE shareowners' equity | 64,263 | | 75,828 | | ||
Noncontrolling interests(c) (Note 14) | 17,723 | | 1,663 | | ||
Total equity (Note 14) | 81,986 | | 77,491 | | ||
Total liabilities, redeemable noncontrolling interests and equity | $ | 377,945 | | $ | 365,183 | |
(a) | Our consolidated assets at December 31, 2017 included total assets of $6,200 million of certain variable interest entities (VIEs) that can only be used to settle the liabilities of those VIEs. These assets included current receivables and net financing receivables of $1,720 million and investment securities of $918 million within continuing operations and assets of discontinued operations of $300 million . Our consolidated liabilities at December 31, 2017 included liabilities of certain VIEs for which the VIE creditors do not have recourse to GE. These liabilities included non-recourse borrowings of consolidated securitization entities (CSEs) of $685 million within continuing operations. See Note 20. |
(b) | The sum of accumulated other comprehensive income (loss) (AOCI) attributable to the Company was $(14,396) million and $(18,598) million at December 31, 2017 and December 31, 2016 , respectively. |
(c) | Included AOCI attributable to noncontrolling interests of $(226) million and $(278) million at December 31, 2017 and December 31, 2016 , respectively. |
Amounts may not add due to rounding.
See accompanying notes.
124 GE 2017 FORM 10-K
FINANCIAL STATEMENTS |
|
|
STATEMENT OF FINANCIAL POSITION (CONTINUED) |
|
|
|
|
| ||||||||
| GE(a) | | Financial Services (GE Capital) | ||||||||||
December 31 (In millions, except share amounts) | 2017 | | 2016 | | | 2017 | | 2016 | | ||||
|
|
|
|
|
| ||||||||
Assets |
|
|
|
|
| ||||||||
Cash and equivalents | $ | 18,211 | | $ | 10,525 | | | $ | 25,088 | | $ | 37,604 | |
Investment securities (Note 3) | 569 | | 137 | | | 38,231 | | 44,180 | | ||||
Current receivables (Note 4) | 14,867 | | 12,715 | | | - | | - | | ||||
Inventories (Note 5) | 21,848 | | 22,263 | | | 75 | | 91 | | ||||
Financing receivables – net (Note 6) | - | | - | | | 21,967 | | 26,041 | | ||||
Other GE Capital receivables | - | | - | | | 16,945 | | 15,576 | | ||||
Property, plant and equipment – net (Note 7) | 23,963 | | 19,103 | | | 30,595 | | 32,225 | | ||||
Receivable from GE Capital (debt assumption)(b) | 39,844 | | 58,780 | | | - | | - | | ||||
Investment in GE Capital | 13,493 | | 24,677 | | | - | | - | | ||||
Goodwill (Note 8) | 82,985 | | 68,070 | | | 984 | | 2,368 | | ||||
Other intangible assets – net (Note 8) | 20,014 | | 16,131 | | | 259 | | 305 | | ||||
Contract assets (Note 9) | 28,861 | | 25,162 | | | - | | - | | ||||
All other assets | 14,035 | | 12,007 | | | 15,662 | | 14,608 | | ||||
Deferred income taxes (Note 13) | 5,204 | | 6,666 | | | 999 | | (4,833 | ) | ||||
Assets of businesses held for sale (Note 2) | 3,877 | | 1,629 | | | - | | - | | ||||
Assets of discontinued operations (Note 2) | - | | 9 | | | 5,912 | | 14,806 | | ||||
Total assets | $ | 287,770 | | $ | 277,874 | | | $ | 156,716 | | $ | 182,970 | |
| | | | | | ||||||||
Liabilities and equity | | | | | | ||||||||
Short-term borrowings(b) (Note 10) | $ | 14,548 | | $ | 20,482 | | | $ | 19,602 | | $ | 23,443 | |
Accounts payable, principally trade accounts | 21,634 | | 20,876 | | | 1,853 | | 1,605 | | ||||
Progress collections and price adjustments accrued | 18,566 | | 16,838 | | | - | | - | | ||||
Dividends payable | 1,052 | | 2,107 | | | - | | - | | ||||
Other GE current liabilities | 18,697 | | 17,564 | | | - | | - | | ||||
Non-recourse borrowings of consolidated securitization entities (Note 10) | - | | - | | | 1,980 | | 417 | | ||||
Long-term borrowings(b) (Note 10) | 67,040 | | 58,810 | | | 73,614 | | 93,443 | | ||||
Investment contracts, insurance liabilities and insurance annuity benefits (Note 11) | - | | - | | | 38,587 | | 26,546 | | ||||
Non-current compensation and benefits | 40,820 | | 42,770 | | | 801 | | 1,001 | | ||||
All other liabilities | 18,884 | | 17,506 | | | 5,886 | | 7,430 | | ||||
Liabilities of businesses held for sale (Note 2) | 1,339 | | 656 | | | - | | - | | ||||
Liabilities of discontinued operations (Note 2) | 23 | | 35 | | | 683 | | 4,123 | | ||||
Total liabilities | 202,602 | | 197,644 | | | 143,007 | | 158,008 | | ||||
| | | | | | ||||||||
Redeemable noncontrolling interests (Note 14) | 3,399 | | 3,025 | | | - | | - | | ||||
| | | | | | ||||||||
Preferred stock (5,939,874 and 5,944,250 shares outstanding at December 31, 2017 and December 31, 2016, respectively) | 6 | | 6 | | | 6 | | 6 | | ||||
Common stock (8,680,571,000 and 8,742,614,000 shares outstanding at December 31, 2017 and December 31, 2016, respectively) | 702 | | 702 | | | - | | - | | ||||
Accumulated other comprehensive income (loss) – net attributable to GE | | | | | | ||||||||
Investment securities | (102 | ) | 674 | | | (99 | ) | 656 | | ||||
Currency translation adjustments | (4,653 | ) | (6,816 | ) | | (225 | ) | (740 | ) | ||||
Cash flow hedges | 62 | | 12 | | | 54 | | 43 | | ||||
Benefit plans | (9,702 | ) | (12,469 | ) | | (524 | ) | (622 | ) | ||||
Other capital | 37,171 | | 37,224 | | | 12,806 | | 12,669 | | ||||
Retained earnings | 125,682 | | 139,532 | | | 1,476 | | 12,664 | | ||||
Less common stock held in treasury | (84,902 | ) | (83,038 | ) | | - | | - | | ||||
Total GE shareowners' equity | 64,263 | | 75,828 | | | 13,493 | | 24,677 | | ||||
Noncontrolling interests (Note 14) | 17,506 | | 1,378 | | | 217 | | 285 | | ||||
Total equity (Note 14) | 81,769 | | 77,205 | | | 13,709 | | 24,962 | | ||||
Total liabilities, redeemable noncontrolling interests and equity | $ | 287,770 | | $ | 277,874 | | | $ | 156,716 | | $ | 182,970 | |
(a) | Represents the adding together of all affiliated companies except GE Capital, which is presented on a one-line basis. See Note 1. |
(b) | In 2015, senior unsecured notes and commercial paper were assumed by GE upon its merger with GE Capital, resulting in an intercompany receivable and payable between GE and GE Capital. See Note 10 for further information. |
Amounts may not add due to rounding.
In the consolidating data on this page, "GE" means the basis of consolidation as described in Note 1 to the consolidated financial statements; "GE Capital" means GE Capital Global Holdings, LLC (GECGH) and its predecessor General Electric Capital Corporation (GECC) and all of their affiliates and associated companies. Separate information is shown for "GE" and "Financial Services (GE Capital)." Transactions between GE and GE Capital have been eliminated from the "General Electric Company and consolidated affiliates" columns on the prior page.
GE 2017 FORM 10-K 125
FINANCIAL STATEMENTS |
|
|
STATEMENT OF CASH FLOWS |
|
|
| ||||||
| General Electric Company and consolidated affiliates | ||||||||
For the years ended December 31 (In millions) | 2017 | | 2016 | | 2015 | | |||
|
|
|
| ||||||
Cash flows – operating activities |
|
|
| ||||||
Net earnings (loss) | $ | (6,056 | ) | $ | 8,540 | | $ | (5,795 | ) |
Less net earnings (loss) attributable to noncontrolling interests | (270 | ) | (291 | ) | 332 | | |||
Net earnings (loss) attributable to the Company | (5,786 | ) | 8,831 | | (6,126 | ) | |||
(Earnings) loss from discontinued operations | 309 | | 954 | | 7,495 | | |||
Adjustments to reconcile net earnings attributable to the Company to cash provided from operating activities: |
|
|
| ||||||
Depreciation and amortization of property, plant and equipment | 5,139 | | 4,997 | | 4,847 | | |||
(Earnings) loss from continuing operations retained by GE Capital | - | | - | | - | | |||
Deferred income taxes | (4,845 | ) | 814 | | 383 | | |||
Decrease (increase) in GE current receivables | 1,551 | | 1,514 | | (52 | ) | |||
Decrease (increase) in inventories | 747 | | (1,389 | ) | (314 | ) | |||
Increase (decrease) in accounts payable | (335 | ) | 1,198 | | (541 | ) | |||
Increase (decrease) in GE progress collections | 1,322 | | 1,836 | | (996 | ) | |||
All other operating activities | 13,291 | | (12,655 | ) | 7,160 | | |||
Cash from (used for) operating activities – continuing operations | 11,394 | | 6,099 | | 11,856 | | |||
Cash from (used for) operating activities – discontinued operations | (968 | ) | (6,343 | ) | 8,034 | | |||
Cash from (used for) operating activities | 10,426 | | (244 | ) | 19,891 | | |||
|
|
|
| ||||||
Cash flows – investing activities |
|
|
| ||||||
Additions to property, plant and equipment | (7,371 | ) | (7,199 | ) | (7,309 | ) | |||
Dispositions of property, plant and equipment | 5,746 | | 4,424 | | 3,020 | | |||
Additions to internal-use software | (549 | ) | (749 | ) | (778 | ) | |||
Net decrease (increase) in GE Capital financing receivables | 805 | | 200 | | 1,043 | | |||
Proceeds from sale of discontinued operations | 1,464 | | 59,890 | | 79,615 | | |||
Proceeds from principal business dispositions | 3,228 | | 5,357 | | 2,283 | | |||
Net cash from (payments for) principal businesses purchased | (6,087 | ) | (2,271 | ) | (12,027 | ) | |||
All other investing activities | 6,704 | | 2,960 | | (4,235 | ) | |||
Cash from (used for) investing activities – continuing operations | 3,940 | | 62,613 | | 61,613 | | |||
Cash from (used for) investing activities – discontinued operations | (1,618 | ) | (13,412 | ) | (2,125 | ) | |||
Cash from (used for) investing activities | 2,322 | | 49,202 | | 59,488 | | |||
|
|
|
| ||||||
Cash flows – financing activities |
|
|
| ||||||
Net increase (decrease) in borrowings (maturities of 90 days or less) | 1,794 | | (1,135 | ) | (24,459 | ) | |||
Newly issued debt (maturities longer than 90 days) | 14,876 | | 1,492 | | 13,951 | | |||
Repayments and other reductions (maturities longer than 90 days) | (25,622 | ) | (58,768 | ) | (47,038 | ) | |||
Net dispositions (purchases) of GE shares for treasury | (2,550 | ) | (21,429 | ) | (1,099 | ) | |||
Dividends paid to shareowners | (8,650 | ) | (8,806 | ) | (9,295 | ) | |||
All other financing activities | (903 | ) | (1,274 | ) | (1,605 | ) | |||
Cash from (used for) financing activities – continuing operations | (21,055 | ) | (89,920 | ) | (69,547 | ) | |||
Cash from (used for) financing activities – discontinued operations | 1,909 | | 789 | | (6,507 | ) | |||
Cash from (used for) financing activities | (19,146 | ) | (89,131 | ) | (76,054 | ) | |||
Effect of currency exchange rate changes on cash and equivalents | 891 | | (1,146 | ) | (3,464 | ) | |||
Increase (decrease) in cash and equivalents | (5,507 | ) | (41,319 | ) | (138 | ) | |||
Cash and equivalents at beginning of year | 49,558 | | 90,879 | | 91,017 | | |||
Cash and equivalents at end of year | 44,051 | | 49,558 | | 90,879 | | |||
Less cash and equivalents of discontinued operations at end of year | 752 | | 1,429 | | 20,395 | | |||
Cash and equivalents of continuing operations at end of year | $ | 43,299 | | $ | 48,129 | | $ | 70,483 | |
Supplemental disclosure of cash flows information |
|
|
| ||||||
Cash paid during the year for interest | $ | (5,049 | ) | $ | (5,779 | ) | $ | (8,764 | ) |
Cash recovered (paid) during the year for income taxes | (2,436 | ) | (7,469 | ) | (2,486 | ) | |||
Amounts may not add due to rounding.
See accompanying notes.
126 GE 2017 FORM 10-K
FINANCIAL STATEMENTS |
|
|
STATEMENT OF CASH FLOWS (CONTINUED) |
|
|
|
|
|
|
| ||||||||||||
| GE(a) |
| Financial Services (GE Capital) | ||||||||||||||||
For the years ended December 31 (In millions) | 2017 | | 2016 | | 2015 | |
| 2017 | | 2016 | | 2015 | | ||||||
|
|
|
|
|
|
|
| ||||||||||||
Cash flows – operating activities |
|
|
|
|
|
|
| ||||||||||||
Net earnings (loss) | $ | (6,496 | ) | $ | 7,896 | | $ | (6,061 | ) |
| $ | (6,643 | ) | $ | (1,560 | ) | $ | (15,202 | ) |
Less net earnings (loss) attributable to noncontrolling interests | (274 | ) | (279 | ) | 83 | |
| 4 | | (12 | ) | 248 | | ||||||
Net earnings (loss) attributable to the Company | (6,222 | ) | 8,176 | | (6,145 | ) |
| (6,647 | ) | (1,548 | ) | (15,450 | ) | ||||||
(Earnings) loss from discontinued operations | 315 | | 952 | | 7,807 | |
| 312 | | 954 | | 7,485 | | ||||||
Adjustments to reconcile net earnings attributable to the Company to cash provided from operating activities: |
|
|
|
|
|
|
| ||||||||||||
Depreciation and amortization of property, plant and equipment | 2,857 | | 2,597 | | 2,473 | |
| 2,277 | | 2,384 | | 2,436 | | ||||||
(Earnings) loss from continuing operations retained by GE Capital(b) | 10,781 | | 21,345 | | 12,284 | |
| - | | - | | - | | ||||||
Deferred income taxes | 449 | | 1,107 | | (1,800 | ) |
| (5,294 | ) | (293 | ) | 2,183 | | ||||||
Decrease (increase) in GE current receivables | 297 | | 929 | | 666 | |
| - | | - | | - | | ||||||
Decrease (increase) in inventories | 764 | | (1,337 | ) | (282 | ) |
| (2 | ) | (10 | ) | (14 | ) | ||||||
Increase (decrease) in accounts payable | (370 | ) | 1,716 | | 276 | |
| (75 | ) | 17 | | (189 | ) | ||||||
Increase (decrease) in GE progress collections | 1,349 | | 1,913 | | (1,010 | ) |
| - | | - | | - | | ||||||
All other operating activities | 822 | | (7,438 | ) | 2,083 | |
| 11,802 | | (3,054 | ) | 5,087 | | ||||||
Cash from (used for) operating activities – continuing operations | 11,040 | | 29,960 | | 16,354 | |
| 2,374 | | (1,552 | ) | 1,537 | | ||||||
Cash from (used for) operating activities – discontinued operations | (1 | ) | (90 | ) | (12 | ) |
| (968 | ) | (6,253 | ) | 8,046 | | ||||||
Cash from (used for) operating activities | 11,039 | | 29,870 | | 16,342 | |
| 1,407 | | (7,805 | ) | 9,583 | | ||||||
|
|
|
|
|
|
|
| ||||||||||||
Cash flows – investing activities |
|
|
|
|
|
|
| ||||||||||||
Additions to property, plant and equipment | (4,132 | ) | (3,758 | ) | (3,785 | ) |
| (3,680 | ) | (3,769 | ) | (4,237 | ) | ||||||
Dispositions of property, plant and equipment | 1,401 | | 1,080 | | 939 | |
| 4,579 | | 3,637 | | 2,526 | | ||||||
Additions to internal-use software | (518 | ) | (740 | ) | (755 | ) |
| (31 | ) | (8 | ) | (23 | ) | ||||||
Net decrease (increase) in GE Capital financing receivables | - | | - | | - | |
| 2,897 | | (1,279 | ) | 226 | | ||||||
Proceeds from sale of discontinued operations | - | | - | | - | |
| 1,464 | | 59,890 | | 79,615 | | ||||||
Proceeds from principal business dispositions | 3,106 | | 5,357 | | 1,725 | |
| - | | - | | 532 | | ||||||
Net cash from (payments for) principal businesses purchased | (6,087 | ) | (2,271 | ) | (10,350 | ) |
| - | | - | | (1,677 | ) | ||||||
All other investing activities | (2,097 | ) | (1,652 | ) | (553 | ) |
| 3,052 | | 1,647 | | (4,667 | ) | ||||||
Cash from (used for) investing activities – continuing operations | (8,328 | ) | (1,984 | ) | (12,779 | ) |
| 8,282 | | 60,118 | | 72,295 | | ||||||
Cash from (used for) investing activities – discontinued operations | 1 | | 90 | | 12 | |
| (1,618 | ) | (13,501 | ) | (2,137 | ) | ||||||
Cash from (used for) investing activities | (8,327 | ) | (1,894 | ) | (12,767 | ) |
| 6,664 | | 46,617 | | 70,158 | | ||||||
|
|
|
|
|
|
|
| ||||||||||||
Cash flows – financing activities |
|
|
|
|
|
|
| ||||||||||||
Net increase (decrease) in borrowings (maturities of 90 days or less) | 1,680 | | 1,595 | | 603 | |
| 69 | | (1,655 | ) | (24,834 | ) | ||||||
Newly issued debt (maturities longer than 90 days) | 20,264 | | 5,307 | | 3,560 | |
| 1,909 | | 1,174 | | 10,391 | | ||||||
Repayments and other reductions (maturities longer than 90 days) | (5,981 | ) | (4,156 | ) | (2,190 | ) |
| (21,007 | ) | (58,285 | ) | (44,848 | ) | ||||||
Net dispositions (purchases) of GE shares for treasury | (2,550 | ) | (21,429 | ) | (1,099 | ) |
| - | | - | | - | | ||||||
Dividends paid to shareowners | (8,355 | ) | (8,474 | ) | (9,289 | ) |
| (4,311 | ) | (20,427 | ) | (4,620 | ) | ||||||
All other financing activities | (528 | ) | (273 | ) | 203 | |
| (280 | ) | (1,127 | ) | (1,362 | ) | ||||||
Cash from (used for) financing activities – continuing operations | 4,530 | | (27,430 | ) | (8,211 | ) |
| (23,619 | ) | (80,320 | ) | (65,273 | ) | ||||||
Cash from (used for) financing activities – discontinued operations | - | | - | | - | |
| 1,909 | | 789 | | (6,507 | ) | ||||||
Cash from (used for) financing activities | 4,530 | | (27,430 | ) | (8,211 | ) |
| (21,710 | ) | (79,531 | ) | (71,780 | ) | ||||||
Effect of currency exchange rate changes on cash and equivalents | 444 | | (392 | ) | (908 | ) |
| 447 | | (754 | ) | (2,556 | ) | ||||||
Increase (decrease) in cash and equivalents | 7,686 | | 153 | | (5,544 | ) |
| (13,193 | ) | (41,473 | ) | 5,406 | | ||||||
Cash and equivalents at beginning of year | 10,525 | | 10,372 | | 15,916 | |
| 39,033 | | 80,506 | | 75,100 | | ||||||
Cash and equivalents at end of year | 18,211 | | 10,525 | | 10,372 | |
| 25,840 | | 39,033 | | 80,506 | | ||||||
Less cash and equivalents of discontinued operations at end of year | - | | - | | - | |
| 752 | | 1,429 | | 20,395 | | ||||||
Cash and equivalents of continuing operations at end of year | $ | 18,211 | | $ | 10,525 | | $ | 10,372 | |
| $ | 25,088 | | $ | 37,604 | | $ | 60,111 | |
Supplemental disclosure of cash flows information |
|
|
|
|
|
|
| ||||||||||||
Cash paid during the year for interest | $ | (2,256 | ) | $ | (1,753 | ) | $ | (1,327 | ) |
| $ | (2,793 | ) | $ | (4,982 | ) | $ | (8,047 | ) |
Cash recovered (paid) during the year for income taxes | (2,700 | ) | (2,612 | ) | (1,636 | ) |
| 264 | | (4,857 | ) | (850 | ) | ||||||
(a) | Represents the adding together of all affiliated companies except GE Capital, which is presented on a one-line basis. |
(b) | Represents GE Capital earnings/loss from continuing operations attributable to the Company, net of GE Capital dividends paid to GE. |
Amounts may not add due to rounding.
In the consolidating data on this page, "GE" means the basis of consolidation as described in Note 1 to the consolidated financial statements; "GE Capital" means GE Capital Global Holdings, LLC (GECGH) and its predecessor General Electric Capital Corporation (GECC) and all of their affiliates and associated companies. Separate information is shown for "GE" and "Financial Services (GE Capital)." Transactions between GE and GE Capital have been eliminated from the "Consolidated" columns and are discussed in Note 23.
GE 2017 FORM 10-K 127
FINANCIAL STATEMENTS | PRESENTATION & POLICIES | |
NOTES TO CONSOLIDATED FINANCIAL STATEMENTS
NOTE 1. BASIS OF PRESENTATION AND SUMMARY OF SIGNIFICANT ACCOUNTING POLICIES
CONSOLIDATION
Our financial statements consolidate all of our affiliates – entities in which we have a controlling financial interest, most often because we hold a majority voting interest. To determine if we hold a controlling financial interest in an entity, we first evaluate if we are required to apply the variable interest entity (VIE) model to the entity; otherwise, the entity is evaluated under the voting interest model.
Where we hold current or potential rights that give us the power to direct the activities of a VIE that most significantly impact the VIE's economic performance, combined with a variable interest that gives us the right to receive potentially significant benefits or the obligation to absorb potentially significant losses, we have a controlling financial interest in that VIE. Rights held by others to remove the party with power over the VIE are not considered unless one party can exercise those rights unilaterally. When changes occur to the design of an entity, we reconsider whether it is subject to the VIE model. We continuously evaluate whether we have a controlling financial interest in a VIE.
We hold a controlling financial interest in other entities where we currently hold, directly or indirectly, more than 50% of the voting rights or where we exercise control through substantive participating rights or as a general partner. Where we are a general partner, we consider substantive removal rights held by other partners in determining if we hold a controlling financial interest. We reevaluate whether we have a controlling financial interest in these entities when our voting or substantive participating rights change.
Associated companies are unconsolidated VIEs and other entities in which we do not have a controlling financial interest, but over which we have significant influence, most often because we hold a voting interest of 20% to 50%. Associated companies are accounted for as equity method investments. Our share of the results of associated companies are presented on a one-line basis. Investments in, and advances to, associated companies are presented on a one-line basis in the caption "All other assets" in our Statement of Financial Position, net of allowance for losses, which represents our best estimate of probable losses inherent in such assets.
FINANCIAL STATEMENT PRESENTATION
We have reclassified certain prior-year amounts to conform to the current-year's presentation. Certain columns and rows may not add due to the use of rounded numbers. Percentages presented are calculated from the underlying numbers in millions.
Upon closing an acquisition, we consolidate the acquired business as soon as practicable. The size, scope and complexity of an acquisition can affect the time necessary to adjust the acquired company's accounting policies, procedures, and books and records to our standards. Accordingly, it is possible that changes will be necessary to the carrying amounts and presentation of assets and liabilities in our financial statements as the acquired company is fully assimilated.
Financial data and related measurements are presented in the following categories:
GE. This represents the adding together of all affiliates except GE Capital, whose continuing operations are presented on a one-line basis, giving effect to the elimination of transactions among such affiliates.
GE Capital . This refers to GE Capital Global Holdings, LLC (GECGH), or its predecessor General Electric Capital Corporation (GECC), and is the adding together of all affiliates of GE Capital giving effect to the elimination of transactions among such affiliates.
Consolidated . This represents the adding together of GE and GE Capital, giving effect to the elimination of transactions between GE and GE Capital.
Operating Segments . These comprise our eight businesses, focused on the broad markets they serve: Power, Renewable Energy, Oil & Gas, Aviation, Healthcare, Transportation, Lighting and Capital.
Unless otherwise indicated, information in these notes to consolidated financial statements relates to continuing operations. Certain of our operations have been presented as discontinued. See Note 2.
The effects of translating to U.S. dollars the financial statements of non-U.S. affiliates whose functional currency is other than the U.S. dollar are included in shareowners' equity. Asset and liability accounts are translated at year-end exchange rates, while revenues and expenses are translated at average rates for the respective periods.
128 GE 2017 FORM 10-K
FINANCIAL STATEMENTS | PRESENTATION & POLICIES | |
Preparing financial statements in conformity with U.S. generally accepted accounting principles (GAAP) requires us to make estimates based on assumptions about current, and for some estimates future, economic and market conditions which affect reported amounts and related disclosures in our financial statements. Although our current estimates contemplate current conditions and how we expect them to change in the future, as appropriate, it is reasonably possible that actual conditions could be worse than anticipated in those estimates, which could materially affect our results of operations and financial position. Among other effects, such changes could result in future impairments of investment securities, goodwill, intangibles and long-lived assets, revisions to estimated profitability on long-term product service agreements, incremental losses on financing receivables, establishment of valuation allowances on deferred tax assets, incremental fair value marks on businesses and assets held for sale carried at lower of cost or market less cost to sell, increased tax liabilities and insurance reserves.
ACCOUNTING PRINCIPLES AND POLICIES
Our financial statements are prepared in conformity with GAAP.
SALES OF GOODS AND SERVICES
We record all sales of goods and services only when a firm sales agreement is in place, delivery has occurred or services have been rendered and collectability of the fixed or determinable sales price is reasonably assured.
Arrangements for the sale of goods and services sometimes include multiple components. Most of our multiple component arrangements involve the sale of goods and services in the Healthcare segment. Our arrangements with multiple components usually involve an upfront deliverable of large machinery or equipment and future service deliverables such as installation, commissioning, training or the future delivery of ancillary products. In most cases, the relative values of the undelivered components are not significant to the overall arrangement and are typically delivered within three to six months after the core product has been delivered. In such agreements, selling price is determined for each component and any difference between the total of the separate selling prices and total contract consideration (i.e., discount) is allocated pro rata across each of the components in the arrangement. The value assigned to each component is objectively determined and obtained primarily from sources such as the separate selling price for that or a similar item or from competitor prices for similar items. If such evidence is not available, we use our best estimate of selling price, which is established consistent with the pricing strategy of the business and considers product configuration, geography, customer type, and other market specific factors.
Except for goods sold under long-term agreements, we recognize sales of goods under the provisions of U.S. Securities and Exchange Commission (SEC) Staff Accounting Bulletin (SAB) 104, Revenue Recognition . In arrangements where we sell products that provide the customer with a right of return, we use our accumulated experience to estimate and provide for such returns when we record the sale. In situations where arrangements include customer acceptance provisions based on seller or customer-specified objective criteria, we recognize revenue when we have reliably demonstrated that all specified acceptance criteria have been met or when formal acceptance occurs, respectively. In arrangements where we provide goods for trial and evaluation purposes, we only recognize revenue after customer acceptance occurs. Unless otherwise noted, we do not provide for anticipated losses before we record sales.
We recognize revenue on agreements for sales of goods and services under power generation unit and uprate contracts, nuclear fuel assemblies, larger oil drilling equipment projects, aeroderivative unit contracts, military development contracts, locomotive production contracts, and long-term construction projects, using long-term construction and production contract accounting. We estimate total long-term contract revenue net of price concessions as well as total contract costs. For goods sold under power generation unit and uprate contracts, nuclear fuel assemblies, aeroderivative unit contracts, military development contracts and locomotive production contracts, we recognize sales as we complete major contract-specified deliverables, most often when customers receive title to the goods or accept the services as performed. For larger oil drilling equipment projects and long-term construction projects, we recognize sales based on our progress toward contract completion measured by actual costs incurred in relation to our estimate of total expected costs. We measure long-term contract revenues by applying our contract-specific estimated margin rates to incurred costs. We routinely update our estimates of future costs for agreements in process and report any cumulative effects of such adjustments in current operations. We provide for any loss that we expect to incur on these agreements when that loss is probable.
We recognize revenue upon delivery for sales of aircraft engines and military propulsion equipment. Delivery of commercial aircraft engines and non-U.S. military equipment occurs on shipment; delivery of military propulsion equipment sold to the U.S. government or agencies thereof occurs upon receipt of a Material Inspection and Receiving Report, DD Form 250 or Memorandum of Shipment. Commercial aircraft engines are complex equipment manufactured to customer order under a variety of sometimes complex, long-term agreements. We measure sales of commercial aircraft engines by applying our contract-specific estimated margin rates to incurred costs. We routinely update our estimates of future revenues and costs for commercial aircraft engine agreements in process and report any cumulative effects of such adjustments in current operations. Significant components of our revenue and cost estimates include price concessions and performance-related guarantees as well as material, labor and overhead costs. We measure revenue for military propulsion equipment and spare parts not subject to long-term product services agreements based on the specific contract on a specifically measured output basis. We provide for any loss that we expect to incur on these agreements when that loss is probable; consistent with industry practice, for commercial aircraft engines, we make such provision only if such losses are not recoverable from future highly probable sales of spare parts and services for those engines.
GE 2017 FORM 10-K 129
FINANCIAL STATEMENTS | PRESENTATION & POLICIES | |
We sell product services under long-term product maintenance or extended warranty agreements in our Aviation, Power, Oil & Gas and Transportation segments, where costs of performing services are incurred on other than a straight-line basis. We also sell similar long-term product services in our Healthcare and Renewable Energy segments, where such costs generally are expected to be incurred on a straight-line basis. For the Aviation, Power, Oil & Gas and Transportation agreements, we recognize related sales based on the extent of our progress toward completion measured by actual costs incurred in relation to total expected costs. We routinely update our estimates of future costs for agreements in process and report any cumulative effects of such adjustments in current operations. For the Healthcare and Renewable Energy agreements, we recognize revenues on a straight-line basis and expense related costs as incurred. We provide for any loss that we expect to incur on any of these agreements when that loss is probable.
GE CAPITAL REVENUES FROM SERVICES (EARNED INCOME)
We use the interest method to recognize income on loans. Interest on loans includes origination, commitment and other non-refundable fees related to funding (recorded in earned income on the interest method). We stop accruing interest at the earlier of the time at which collection of an account becomes doubtful or the account becomes 90 days past due. Previously recognized interest income that was accrued but not collected from the borrower is reversed, unless the terms of the loan agreement permit capitalization of accrued interest to the principal balance. Payments received on nonaccrual loans are applied to reduce the principal balance of the loan.
We resume accruing interest on nonaccrual, non-restructured loans only when (a) payments are brought current according to the loan's original terms and (b) future payments are reasonably assured. When we agree to restructured terms with the borrower, we resume accruing interest only when it is reasonably assured that we will recover full contractual payments, and such loans pass underwriting reviews equivalent to those applied to new loans.
We recognize financing lease income on the interest method to produce a level yield on funds not yet recovered. Estimated unguaranteed residual values are based upon management's best estimates of the value of the leased asset at the end of the lease term. We use various sources of data in determining these estimates, including information obtained from third parties, which is adjusted for the attributes of the specific asset under lease. Guarantees of residual values by unrelated third parties are included within minimum lease payments. Significant assumptions we use in estimating residual values include estimated net cash flows over the remaining lease term, anticipated results of future remarketing, and estimated future component part and scrap metal prices, discounted at an appropriate rate.
We recognize operating lease income on a straight-line basis over the terms of underlying leases.
BUSINESSES AND ASSETS HELD FOR SALE
Businesses and assets held for sale represent components that meet accounting requirements to be classified as held for sale and are presented as single asset and liability amounts in our financial statements with a valuation allowance, if necessary, to recognize the net carrying amount at the lower of cost or fair value, less cost to sell. Financing receivables that no longer qualify to be presented as held for investment must be classified as assets held for sale and recognized in our financial statements at the lower of cost or fair value, less cost to sell, with that amount representing a new cost basis at the date of transfer.
The determination of fair value for businesses and assets held for sale involves significant judgments and assumptions. Development of estimates of fair values in this circumstance is complex and is dependent upon, among other factors, the nature of the potential sales transaction (for example, asset sale versus sale of legal entity), composition of assets and/or businesses in the disposal group, the comparability of the disposal group to market transactions and negotiations with third party purchasers. Such factors bear directly on the range of potential fair values and the selection of the best estimates. Key assumptions were developed based on market observable data and, in the absence of such data, internal information that is consistent with what market participants would use in a hypothetical transaction.
We review all businesses and assets held for sale each reporting period to determine whether the existing carrying amounts are fully recoverable in comparison to estimated fair values, less cost to sell.
DEPRECIATION AND AMORTIZATION
The cost of GE manufacturing plant and equipment is generally depreciated on a straight-line basis over its estimated economic life.
The cost of GE Capital equipment leased to others on operating leases is depreciated on a straight-line basis to estimated residual value over the lease term or over the estimated economic life of the equipment.
130 GE 2017 FORM 10-K
FINANCIAL STATEMENTS | PRESENTATION & POLICIES | |
LOSSES ON FINANCING RECEIVABLES
Our financing receivables portfolio consists of a variety of loans and leases, including both larger-balance, non-homogeneous loans and leases and smaller-balance homogeneous loans and leases. We routinely evaluate our entire portfolio for potential specific credit or collection issues that might indicate an impairment.
Losses on financing receivables are recognized when they are incurred, which requires us to make our best estimate of probable losses inherent in the portfolio. The method for calculating the best estimate of losses depends on the size, type and risk characteristics of the related financing receivable. Such an estimate requires consideration of historical loss experience, adjusted for current conditions, and judgments about the probable effects of relevant observable data, including present economic conditions such as delinquency rates, financial health of specific customers and market sectors, collateral values, and the present and expected future levels of interest rates. The underlying assumptions, estimates and assessments we use to provide for losses are updated periodically to reflect our view of current conditions. Changes in such estimates can significantly affect the allowance and provision for losses. It is possible that we will experience credit losses that are different from our current estimates. Write-offs are deducted from the allowance for losses when we judge the principal to be uncollectible and subsequent recoveries are added to the allowance at the time cash is received on a written-off account.
PARTIAL SALES OF BUSINESS INTERESTS
Gains or losses on sales of affiliate shares where we retain a controlling financial interest are recorded in equity. Gains or losses on sales that result in our loss of a controlling financial interest are recorded in earnings along with remeasurement gains or losses on any investments in the entity that we retained.
CASH AND EQUIVALENTS
Debt securities and money market instruments with original maturities of three months or less are included in cash equivalents unless designated as available-for-sale and classified as investment securities.
INVESTMENT SECURITIES
We report investments in debt and marketable equity securities, and certain other equity securities, at fair value. See Note 18 for further information on fair value. Unrealized gains and losses on available-for-sale investment securities are included in shareowners' equity, net of applicable taxes and other adjustments.
We regularly review investment securities for impairment using both quantitative and qualitative criteria. For debt securities, if we do not intend to sell the security or it is not more likely than not that we will be required to sell the security before recovery of our amortized cost, we evaluate other qualitative criteria to determine whether we do not expect to recover the amortized cost basis of the security, such as the financial health of and specific prospects for the issuer, including whether the issuer is in compliance with the terms and covenants of the security. We also evaluate quantitative criteria including determining whether there has been an adverse change in expected future cash flows. If we do not expect to recover the entire amortized cost basis of the security, we consider the security to be other-than-temporarily impaired (OTTI), and we record the difference between the security's amortized cost basis and its recoverable amount in earnings and the difference between the security's recoverable amount and fair value in other comprehensive income. If we intend to sell the security or it is more likely than not we will be required to sell the security before recovery of its amortized cost basis, the security is also considered OTTI and we recognize the entire difference between the security's amortized cost basis and its fair value in earnings. For equity securities, we consider the length of time and magnitude of the amount that each security is in an unrealized loss position. If we do not expect to recover the entire amortized cost basis of the security, we consider the security to be OTTI, and we record the difference between the security's amortized cost basis and its fair value in earnings.
Realized gains and losses are accounted for on the specific identification method. Unrealized gains and losses on investment securities classified as trading are included in earnings.
INVENTORIES
All inventories are stated at the lower of cost or realizable values. Cost for a portion of GE U.S. inventories is determined on a last-in, first-out (LIFO) basis. Cost of other GE inventories is determined on a first-in, first-out (FIFO) basis. LIFO was used for approximately 32% and 34% of GE inventories in 2017 and 2016 , respectively.
GE 2017 FORM 10-K 131
FINANCIAL STATEMENTS | PRESENTATION & POLICIES | |
GOODWILL AND OTHER INTANGIBLE ASSETS
We do not amortize goodwill, but test it at least annually for impairment at the reporting unit level. A reporting unit is the operating segment, or one level below that operating segment (the component level) if discrete financial information is prepared and regularly reviewed by segment management. However, components are aggregated as a single reporting unit if they have similar economic characteristics. We recognize an impairment charge if the carrying amount of a reporting unit exceeds its fair value and the carrying amount of the reporting unit's goodwill exceeds the implied fair value of that goodwill. We use a market approach, when available and appropriate, or the income approach, or a combination of both to establish fair values. When a portion of a reporting unit is disposed, goodwill is allocated to the gain or loss on disposition based on the relative fair values of the business or businesses disposed and the portion of the reporting unit that will be retained.
We amortize the cost of other intangibles over their estimated useful lives unless such lives are deemed indefinite. The cost of intangible assets is generally amortized on a straight-line basis over the asset's estimated economic life , except that individually significant customer-related intangible assets are amortized in relation to total related sales. Amortizable intangible assets are reviewed for impairment whenever events or changes in circumstances indicate that the related carrying amounts may not be recoverable. In these circumstances, they are tested for impairment based on undiscounted cash flows and, if impaired, written down to fair value based on either discounted cash flows or appraised values. Intangible assets with indefinite lives are tested annually for impairment and written down to fair value as required.
INVESTMENT CONTRACTS, INSURANCE LIABILITIES AND INSURANCE ANNUITY BENEFITS
Our run-off insurance operations include providing insurance and reinsurance for life and health risks and providing certain annuity products. Primary product types include long-term care, structured settlement annuities, life and disability insurance contracts and investment contracts. Insurance contracts are contracts with significant mortality and/or morbidity risks, while investment contracts are contracts without such risks.
For traditional long-duration insurance contracts, we report premiums as revenue when due. Premiums received on non-traditional long-duration insurance contracts and investment contracts (including annuities without significant mortality risk) are not reported as revenues but rather as deposit liabilities. We recognize revenues for charges and assessments on these contracts, mostly for mortality, contract initiation, administration and surrender. Amounts credited to policyholder accounts are charged to expense.
Liabilities for traditional long-duration insurance contracts includes both future policy benefit reserves and claims reserves. Future policy benefit reserves represent the present value of future policy benefits less the present value of future net premiums and were first established based on actuarial assumptions at the time the policies were issued or acquired plus a margin for adverse deviation. These assumptions include, but are not limited to, interest rates, health care experience (including type and cost of care), morbidity, mortality, the length of time a policy will remain in force and anticipated future premium increases from future in-force rate actions. Assumptions are locked-in throughout the life of a contract unless a premium deficiency develops at which time we change these assumptions to reflect our most recent assumptions. Our annual premium deficiency testing assesses the adequacy of future policy benefit reserves, net of capitalized acquisition costs, using our most recent assumptions. Liabilities for investment contracts equal the account value, that is, the amount that accrues to the benefit of the contract or policyholder including credited interest and assessments through the financial statement date.
Liabilities for unpaid claims and estimated claim settlement expenses represent our best estimate of the ultimate obligations for reported and incurred-but-not-reported claims and the related estimated claim settlement expenses. Liabilities for unpaid claims and estimated claim settlement expenses are evaluated periodically for potential changes in loss estimates with the support of qualified actuaries and any changes are recorded in the period in which they are determined. Key inputs include actual known facts about the claims, such as the benefits available and cause of disability of the claimant, as well as assumptions derived from our actual historical experience and expected future changes in experience factors.
FAIR VALUE MEASUREMENTS
The following sections describe the valuation methodologies we use to measure financial and non-financial instruments accounted for at fair value including certain assets within our pension plans and retiree benefit plans.
For financial assets and liabilities measured at fair value on a recurring basis, fair value is the price we would receive to sell an asset or pay to transfer a liability in an orderly transaction with a market participant at the measurement date. In the absence of active markets for the identical assets or liabilities, such measurements involve developing assumptions based on market observable data and, in the absence of such data, internal information that is consistent with what market participants would use in a hypothetical transaction that occurs at the measurement date.
132 GE 2017 FORM 10-K
FINANCIAL STATEMENTS | PRESENTATION & POLICIES | |
Observable inputs reflect market data obtained from independent sources, while unobservable inputs reflect our market assumptions. Preference is given to observable inputs. These two types of inputs create the following fair value hierarchy:
Level 1 – | Quoted prices for identical instruments in active markets. |
Level 2 – | Quoted prices for similar instruments in active markets; quoted prices for identical or similar instruments in markets that are not active; and model-derived valuations whose inputs are observable or whose significant value drivers are observable. |
Level 3 – | Significant inputs to the valuation model are unobservable. |
We maintain policies and procedures to value instruments using the best and most relevant data available. In addition, we have risk management teams that review valuation, including independent price validation for certain instruments. With regard to Level 3 valuations (including instruments valued by third parties), we perform a variety of procedures to assess the reasonableness of the valuations. Such reviews include an evaluation of instruments whose fair value change exceeds predefined thresholds (and/or does not change) and consider the current interest rate, currency and credit environment, as well as other published data, such as rating agency market reports and current appraisals. This detailed review may include the use of a third-party valuation firm.
RECURRING FAIR VALUE MEASUREMENTS
The following sections describe the valuation methodologies we use to measure different financial instruments at fair value on a recurring basis.
Investments in Debt and Equity Securities. When available, we use quoted market prices to determine the fair value of investment securities, and they are included in Level 1. Level 1 securities primarily include publicly traded equity securities.
For large numbers of investment securities for which market prices are observable for identical or similar investment securities but not readily accessible for each of those investments individually (that is, it is difficult to obtain pricing information for each individual investment security at the measurement date), we obtain pricing information from an independent pricing vendor. The pricing vendor uses various pricing models for each asset class that are consistent with what other market participants would use. The inputs and assumptions to the model of the pricing vendor are derived from market observable sources including: benchmark yields, reported trades, broker/dealer quotes, issuer spreads, benchmark securities, bids, offers, and other market-related data. Since many fixed income securities do not trade on a daily basis, the methodology of the pricing vendor uses available information as applicable such as benchmark curves, benchmarking of like securities, sector groupings, and matrix pricing. The pricing vendor considers available market observable inputs in determining the evaluation for a security. Thus, certain securities may not be priced using quoted prices, but rather determined from market observable information. These investments are included in Level 2 and primarily comprise our portfolio of corporate fixed income, and government, mortgage and asset-backed securities. In infrequent circumstances, our pricing vendors may provide us with valuations that are based on significant unobservable inputs, and in those circumstances we classify the investment securities in Level 3.
Annually, we conduct reviews of our primary pricing vendor to validate that the inputs used in that vendor's pricing process are deemed to be market observable as defined in the standard. While we are not provided access to proprietary models of the vendor, our reviews have included on-site walk-throughs of the pricing process, methodologies and control procedures for each asset class and level for which prices are provided. Our reviews also include an examination of the underlying inputs and assumptions for a sample of individual securities across asset classes, credit rating levels and various durations. In addition, the pricing vendor has an established challenge process in place for all security valuations, which facilitates identification and resolution of potentially erroneous prices. We believe that the prices received from our pricing vendor are representative of prices that would be received to sell the assets at the measurement date (exit prices) and are classified appropriately in the hierarchy.
We use non-binding broker quotes and other third-party pricing services as our primary basis for valuation when there is limited, or no, relevant market activity for a specific instrument or for other instruments that share similar characteristics. We have not adjusted the prices we have obtained. Investment securities priced using non-binding broker quotes and other third-party pricing services are included in Level 3. As is the case with our primary pricing vendor, third-party brokers and other third-party pricing services do not provide access to their proprietary valuation models, inputs and assumptions. Accordingly, we conduct reviews of vendors, as applicable, similar to the reviews performed of our primary pricing vendor. In addition, we conduct internal reviews of pricing for all such investment securities quarterly to ensure reasonableness of valuations used in our financial statements. These reviews are designed to identify prices that appear stale, those that have changed significantly from prior valuations, and other anomalies that may indicate that a price may not be accurate. Based on the information available, we believe that the fair values provided by the brokers and other third-party pricing services are representative of prices that would be received to sell the assets at the measurement date (exit prices).
GE 2017 FORM 10-K 133
FINANCIAL STATEMENTS | PRESENTATION & POLICIES | |
Derivatives. We use closing prices for derivatives included in Level 1, which are traded either on exchanges or liquid over-the-counter markets.
The majority of our derivatives are valued using internal models. The models maximize the use of market observable inputs including interest rate curves and both forward and spot prices for currencies and commodities. Derivative assets and liabilities included in Level 2 primarily represent interest rate swaps, cross-currency swaps and foreign currency and commodity forward and option contracts.
Derivative assets and liabilities included in Level 3 primarily represent equity derivatives and interest rate products that contain embedded optionality or prepayment features.
NONRECURRING FAIR VALUE MEASUREMENTS
Certain assets are measured at fair value on a nonrecurring basis. These assets are not measured at fair value on an ongoing basis, but are subject to fair value adjustments only in certain circumstances. These assets can include loans and long-lived assets that have been reduced to fair value when they are held for sale, impaired loans that have been reduced based on the fair value of the underlying collateral, cost and equity method investments and long-lived assets that are written down to fair value when they are impaired and the remeasurement of retained investments in formerly consolidated subsidiaries upon a change in control that results in deconsolidation of a subsidiary, if we sell a controlling interest and retain a noncontrolling stake in the entity. Assets that are written down to fair value when impaired and retained investments are not subsequently adjusted to fair value unless further impairment occurs.
The following sections describe the valuation methodologies we use to measure financial and non-financial instruments accounted for at fair value on a nonrecurring basis and for certain assets within our pension plans and retiree benefit plans at each reporting period, as applicable.
Financing Receivables and Loans Held for Sale. When available, we use observable market data, including pricing on recent closed market transactions, to value loans that are included in Level 2. When this data is unobservable, we use valuation methodologies using current market interest rate data adjusted for inherent credit risk, and such loans are included in Level 3. When appropriate, loans may be valued using collateral values (see Long-lived Assets below).
Cost and Equity Method Investments. Cost and equity method investments are valued using market observable data such as quoted prices when available. When market observable data is unavailable, investments are valued using a discounted cash flow model, comparative market multiples or a combination of both approaches as appropriate and other third-party pricing sources. These investments are generally included in Level 3.
Investments in private equity, real estate and collective funds held within our pension plans, are generally valued using the net asset value (NAV) per share as a practical expedient for fair value provided certain criteria are met. The NAVs are determined based on the fair values of the underlying investments in the funds. On January 1, 2016, we adopted guidance whereby investments that are measured at fair value using the NAV practical expedient are no longer classified in the fair value hierarchy.
Long-lived Assets . Fair values of long-lived assets, including aircraft, are primarily derived internally and are based on observed sales transactions for similar assets. In other instances, for example, collateral types for which we do not have comparable observed sales transaction data, collateral values are developed internally and corroborated by external appraisal information. Adjustments to third-party valuations may be performed in circumstances where market comparables are not specific to the attributes of the specific collateral or appraisal information may not be reflective of current market conditions due to the passage of time and the occurrence of market events since receipt of the information.
Retained Investments in Formerly Consolidated Subsidiaries. Upon a change in control that results in deconsolidation of a subsidiary, the fair value measurement of our retained noncontrolling stake is valued using market observable data such as quoted prices when available, or if not available, an income approach, a market approach, or a combination of both approaches as appropriate. In applying these methodologies, we rely on a number of factors, including actual operating results, future business plans, economic projections, market observable pricing multiples of similar businesses and comparable transactions, and possible control premium. These investments are generally included in Level 1 or Level 3, as appropriate, determined at the time of the transaction.
134 GE 2017 FORM 10-K
FINANCIAL STATEMENTS | PRESENTATION & POLICIES | |
ACCOUNTING CHANGES
On January 1, 2018, we will adopt Accounting Standards Update (ASU) 2014-09, Revenue from Contracts with Customers , and the related amendments, which will supersede most existing U.S. GAAP revenue guidance. We will adopt the new ASU on a retrospective basis, resulting in a consistent basis of presentation within our consolidated financial statements for all periods presented.
The new ASU will have a material effect on our historically reported consolidated financial statements as well as our existing processes to recognize revenue. Upon adoption, we will record a $4.2 billion non-cash charge to our January 1, 2016 retained earnings to reflect the change in timing in the recognition of revenue and certain costs primarily within our Power and Aviation businesses.
The new ASU also requires incremental disclosures, including the amount of revenue allocated to remaining performance obligations for existing customer contracts. While the remaining performance obligation disclosure is similar, in concept, to our reported backlog, the new ASU definition excludes revenue from contracts that provide the customer with the right to cancel or terminate for convenience, even if our historical experience indicates the likelihood of cancellation or termination is remote. As a result, we anticipate the remaining performance obligation disclosure will be significantly lower than our historically reported backlog.
On September 30, 2016, we adopted ASU 2016-09, Improvements to Employee Share-Based Payment Accounting , which was intended to simplify several aspects of the accounting for employee share-based payment transactions including the accounting for income taxes, forfeitures, and statutory tax withholding requirements, as well as classification in the statement of cash flows.
We adopted the standard on a prospective basis with the effect of adoption reflected for the interim periods after the year beginning January 1, 2016 as required by the standard. The primary effects of adoption were the recognition of excess tax benefits in our provision for income taxes rather than paid-in capital and the reclassification of cash flows related to excess tax benefits from financing activities to operating activities for the periods beginning January 1, 2016. We will continue to estimate the number of awards that are expected to vest in our determination of the related periodic compensation cost.
As a result of the adoption, our provision for income taxes decreased by $97 million for the nine months ended September 30, 2016, for the excess tax benefits related to share-based payments in its provision for income taxes. Application of the cash flow presentation requirements from January 1, 2016, resulted in an increase to cash from operating activities and a decrease to cash from financing activities of $137 million for the nine months ended September 30, 2016.
On January 1, 2016, we adopted ASU 2015-16, Simplifying the Accounting for Measurement-Period Adjustments , which eliminated the requirement for an acquirer in a business combination to account for measurement-period adjustments retrospectively. See Note 8 for further discussion of the purchase accounting effects of recent acquisitions.
On January 1, 2016, we adopted ASU 2015-03, Simplifying the Presentation of Debt Issuance Costs , which requires that debt issuance costs related to a recognized debt liability to be presented on the balance sheet as a direct deduction from the debt liability, similar to the presentation of debt premiums and discounts. ASU 2015-03 applies retrospectively and does not change the recognition and measurement requirements for debt issuance costs. The adoption of ASU 2015-03 resulted in the reclassification of $674 million of unamortized debt issuance costs related to the Company's borrowings from all other assets to short-term and long-term borrowings within our consolidated balance sheet as of December 31, 2015.
On January 1, 2016, we adopted ASU 2015-02, Amendments to the Consolidation Analysis . The ASU amended the consolidation guidance for VIEs and general partners' investment in limited partnerships and modified the evaluation of whether limited partnerships and similar legal entities are VIEs or voting interest entities.
Upon adoption, we deconsolidated three investment funds managed by GE Asset Management (GEAM) that had been accounted for under the guidance prior to the issuance of ASU 2009-17, Improvements to Financial Reporting by Enterprises Involved with Variable Interest Entities, by virtue of the deferral provided by ASU 2010-10, Amendments for Certain Investment Funds . We concluded that GEAM's management contracts were no longer variable interests in the three investment funds and therefore continued consolidation was not appropriate. We deconsolidated net assets and noncontrolling interests of $123 million , respectively.
In addition, many of the limited partnerships in which Energy Financial Services invests became VIEs because the limited partners have no participating rights or substantive removal rights over the general partners. The general partners continue to control these limited partnerships, however, our disclosed exposure to unconsolidated VIEs in Note 20 increased by $6,110 million as a result.
GE 2017 FORM 10-K 135
FINANCIAL STATEMENTS | HELD FOR SALE & DISCONTINUED OPERATIONS | |
NOTE 2. BUSINESSES HELD FOR SALE AND DISCONTINUED OPERATIONS
ASSETS AND LIABILITIES OF BUSINESSES HELD FOR SALE
On November 13, 2017, the Company announced its intention to exit approximately $20 billion of assets over the next one to two years. In the fourth quarter of 2017, in connection with this announcement, GE has classified various businesses with assets of $1,676 million and liabilities of $791 million as held for sale. These businesses span across our Lighting, Aviation, Healthcare and Power segments and resulted in a pre-tax loss on the planned disposals of $1,425 million ( $1,337 million after-tax) in the fourth quarter of 2017. We expect to complete the sale of these businesses within the next twelve months.
On September 25, 2017, we signed an agreement to sell our Industrial Solutions business within our Power segment with assets of $2,201 million and liabilities of $ 548 million, to ABB for approximately $2,600 million . The transaction is targeted to close in mid-2018.
On March 8, 2017, we signed an agreement to sell our Water business within our Power segment to Suez Environnement S.A. (Suez). On September 30, 2017, we completed the sale for consideration of $3,062 million , net of obligations assumed and cash transferred, (including $122 million from sale of receivables originated in our Water business and sold from GE Capital to Suez) and recognized a pre-tax gain of $1,943 million in 2017 in the caption "Other income" in our consolidated Statement of Earnings (Loss) ( $1,920 million after-tax).
FINANCIAL INFORMATION FOR ASSETS AND LIABILITIES OF BUSINESSES HELD FOR SALE | ||||||
| | | ||||
December 31 (In millions) | 2017 | | 2016 | | ||
| | | | |||
Assets | | | | |||
Current receivables(a) | $ | 703 | | $ | 366 | |
Inventories | 1,039 | | 211 | | ||
Property, plant, and equipment – net | 931 | | 632 | | ||
Goodwill | 1,619 | | 212 | | ||
Other intangible assets – net | 403 | | 123 | | ||
Contract assets | 858 | | 125 | | ||
Valuation allowance on disposal group classified as held for sale(b) | (1,378 | ) | - | | ||
Other | 67 | | 76 | | ||
Assets of businesses held for sale | $ | 4,243 | | $ | 1,745 | |
| | | ||||
Liabilities | | | ||||
Accounts payable | $ | 602 | | $ | 190 | |
Progress collections and price adjustments accrued | 38 | | 141 | | ||
Other current liabilities | 450 | | 133 | | ||
Non-current compensation and benefits | 162 | | 82 | | ||
Other | 87 | | 110 | | ||
Liabilities of businesses held for sale | $ | 1,339 | | $ | 656 | |
(a) | Included transactions in our industrial businesses that were made on arm's length terms with GE Capital, including GE current receivables sold to GE Capital of $ 366 million and $ 117 million at December 31, 2017 and December 31, 2016 , respectively. These intercompany balances included within our held for sale businesses are reported in the GE and GE Capital columns of our financial statements, but are eliminated in deriving our consolidated financial statements. |
(b) | During the fourth quarter of 2017, we adjusted the carrying value to fair value less cost to sell for certain held for sale businesses, which resulted in a pre-tax valuation allowance of $1,378 million recorded in the caption "Other income" in our consolidated Statement of Earnings (Loss). |
136 GE 2017 FORM 10-K
FINANCIAL STATEMENTS | HELD FOR SALE & DISCONTINUED OPERATIONS | |
DISCONTINUED OPERATIONS
Discontinued operations primarily relate to our financial services businesses as a result of the GE Capi tal Exit Plan (our plan announced in 2015 to reduce the size of our financial services businesses) and were previously reported in the Capital segment. These discontinued operations primarily comprise residual assets and liabilities related to our exited U.S. mortgage business (WMC) , our mortgage portfolio in Poland, and indemnification liabilities associated with the sale of our GE Capital businesses. Results of operations, financial position and cash flows for these businesses are separately reported as discontinued operations for all periods presented. See Note 21 for further information about indemnifications and further discussion on WMC.
FINANCIAL INFORMATION FOR DISCONTINUED OPERATIONS | |||||||||
|
|
|
| ||||||
(In millions) | 2017 | | 2016 | | 2015 | | |||
|
|
|
| ||||||
Operations |
|
|
| ||||||
Total revenues and other income (loss) | $ | 182 | | $ | 2,968 | | $ | 23,003 | |
|
|
|
| ||||||
Earnings (loss) from discontinued operations before income taxes | $ | (731 | ) | $ | (162 | ) | $ | 887 | |
Benefit (provision) for income taxes(a) | 295 | | 460 | | (791 | ) | |||
Earnings (loss) from discontinued operations, net of taxes | $ | (437 | ) | $ | 298 | | $ | 96 | |
|
|
|
| ||||||
Disposals |
|
|
| ||||||
Gain (loss) on disposals before income taxes | $ | 306 | | $ | (750 | ) | $ | (6,612 | ) |
Benefit (provision) for income taxes(a) | (178 | ) | (502 | ) | (979 | ) | |||
Gain (loss) on disposals, net of taxes | $ | 128 | | $ | (1,252 | ) | $ | (7,591 | ) |
|
|
|
| ||||||
Earnings (loss) from discontinued operations, net of taxes(b)(c) | $ | (309 | ) | $ | (954 | ) | $ | (7,495 | ) |
(a) | GE Capital's total tax benefit (provision) for discontinued operations and disposals included current tax benefit (provision) of $(299) million , $945 million and $(6,834) million for the years ended December 31, 2017 , 2016 and 2015 , respectively, including current U.S. Federal tax benefit (provision) of $(402) million , $1,224 million and $(6,245) million for the years ended December 31, 2017 , 2016 and 2015 , respectively, and deferred tax benefit (provision) of $416 million , $(988) million and $5,073 million for the years ended December 31, 2017 , 2016 and 2015 , respectively. |
(b) | The sum of GE industrial earnings (loss) from discontinued operations, net of taxes, and GE Capital earnings (loss) from discontinued operations, net of taxes, after adjusting for earnings (loss) attributable to noncontrolling interests related to discontinued operations, is reported within GE industrial earnings (loss) from discontinued operations, net of taxes, on the consolidated Statement of Earnings (Loss). |
(c) | Earnings (loss) from discontinued operations attributable to the Company before income taxes was $(432) million , $(911) million , and $(6,083) million for the years ended December 31, 2017 , 2016 , and 2015 , respectively. |
December 31 (In millions) | 2017 | | 2016 | | ||
|
|
| ||||
Assets | | | ||||
Cash and equivalents | $ | 752 | | $ | 1,429 | |
Investment securities | 647 | | 2,626 | | ||
Deferred income taxes | 951 | | 487 | | ||
Financing receivables held for sale | 3,215 | | 8,547 | | ||
Other assets | 347 | | 1,727 | | ||
Assets of discontinued operations | $ | 5,912 | | $ | 14,815 | |
| | | ||||
Liabilities | | | ||||
Accounts payable | $ | 51 | | $ | 164 | |
Borrowings | 1 | | 2,076 | | ||
Other liabilities | 654 | | 1,918 | | ||
Liabilities of discontinued operations | $ | 706 | | $ | 4,158 | |
GE 2017 FORM 10-K 137
FINANCIAL STATEMENTS | INVESTMENT SECURITIES | |
NOTE 3. INVESTMENT SECURITIES
Substantially all of our investment securities are classified as available-for-sale and comprise mainly investment-grade debt securities supporting obligations to annuitants and policyholders in our run-off insurance operations. We do not have any securities classified as held-to-maturity.
| 2017 |
| 2016 | ||||||||||||||||||||||
December 31 (In millions) | Amortized | | Gross | | Gross | | Estimated | | | Amortized | | Gross | | Gross | | Estimated | | ||||||||
|
|
|
|
|
|
|
|
|
| ||||||||||||||||
Debt |
|
|
|
|
|
|
|
|
| ||||||||||||||||
U.S. corporate | $ | 20,104 | | $ | 3,775 | | $ | (35 | ) | $ | 23,843 | |
| $ | 20,049 | | $ | 3,081 | | $ | (85 | ) | $ | 23,046 | |
Non-U.S. corporate | 5,455 | | 86 | | (13 | ) | 5,528 | |
| 11,917 | | 98 | | (27 | ) | 11,987 | | ||||||||
State and municipal | 3,775 | | 534 | | (40 | ) | 4,269 | |
| 3,916 | | 412 | | (92 | ) | 4,236 | | ||||||||
Mortgage and asset-backed | 2,820 | | 81 | | (23 | ) | 2,878 | |
| 2,787 | | 111 | | (37 | ) | 2,861 | | ||||||||
Government and agencies | 1,927 | | 75 | | (2 | ) | 2,000 | |
| 1,842 | | 160 | | (26 | ) | 1,976 | | ||||||||
Equity (b) | 166 | | 12 | | - | | 178 | |
| 154 | | 55 | | (1 | ) | 208 | | ||||||||
Total | $ | 34,246 | | $ | 4,564 | | $ | (114 | ) | $ | 38,696 | |
| $ | 40,665 | | $ | 3,917 | | $ | (269 | ) | $ | 44,313 | |
(a) | Included $569 million and $137 million of investment securities held by GE at December 31, 2017 and December 31, 2016, respectively, of which $141 million and $86 million are equity securities. |
(b) | Estimated fair values included $98 million and $17 million of trading securities at December 31, 2017 and December 31, 2016, respectively. Net unrealized gains (losses) recorded to earnings related to these securities were $29 million and $(2) million for the years ended December 31, 2017 and 2016, respectively. |
I nvestments with a fair value of $4,413 million and $4,406 million were classified within Level 3 (significant inputs to the valuation model are unobservable) at December 31, 2017 and 2016, respectively. The remaining investments are substantially all classified within Level 2 (determined based on significant observable inputs). During the years ended December 31, 2017 and 2016, there were no significant transfers into or out of Level 3 .
ESTIMATED FAIR VALUE AND GROSS UNREALIZED LOSSES OF AVAILABLE-FOR-SALE INVESTMENT SECURITIES | |||||||||||||
|
|
|
|
|
| ||||||||
| In loss position for | ||||||||||||
| Less than 12 months |
| 12 months or more | ||||||||||
(In millions) | Estimated fair value | | Gross unrealized losses | |
| Estimated fair value | | Gross unrealized losses | | ||||
|
|
|
|
|
| ||||||||
December 31, 2017 |
|
|
|
|
| ||||||||
Debt |
|
|
|
|
| ||||||||
U.S. corporate | $ | 502 | | $ | (6 | ) |
| $ | 605 | | $ | (30 | ) |
Non-U.S. corporate | 1,169 | | (4 | ) |
| 3,685 | | (10 | ) | ||||
State and municipal | 48 | | (1 | ) |
| 272 | | (39 | ) | ||||
Mortgage and asset-backed | 979 | | (11 | ) |
| 318 | | (12 | ) | ||||
Government and agencies | 395 | | (2 | ) |
| 69 | | - | | ||||
Equity | - | | - | |
| - | | - | | ||||
Total | $ | 3,093 | | $ | (23 | ) |
| $ | 4,949 | | $ | (91 | ) |
|
|
|
|
|
| ||||||||
December 31, 2016 |
|
|
|
|
| ||||||||
Debt |
|
|
|
|
| ||||||||
U.S. corporate | $ | 1,692 | | $ | (55 | ) | | $ | 359 | | $ | (30 | ) |
Non-U.S. corporate | 5,352 | | (26 | ) | | 14 | | (1 | ) | ||||
State and municipal | 674 | | (27 | ) | | 158 | | (64 | ) | ||||
Mortgage and asset-backed | 822 | | (21 | ) | | 132 | | (16 | ) | ||||
Government and agencies | 549 | | (26 | ) | | - | | - | | ||||
Equity | 9 | | (1 | ) | | - | | - | | ||||
Total | $ | 9,098 | | $ | (157 | ) | | $ | 663 | | $ | (111 | ) |
Unrealized losses are not indicative of the amount of credit loss that would be recognized and at December 31, 2017 are primarily due to increases in market yields subsequent to our purchase of the securities. We presently do not intend to sell the vast majority of our debt securities that are in unrealized loss positions and believe that it is not more likely than not that we will be required to sell the vast majority of these securities before anticipated recovery of our amortized cost. The methodologies and significant inputs used to measure the amount of credit loss for our investment securities during 2017 have not changed.
138 GE 2017 FORM 10-K
FINANCIAL STATEMENTS | INVESTMENT SECURITIES | |
The pre-tax, other-than-temporary impairments on investment securities recognized in earnings were $8 million, $31 million and $64 million for the years ended December 31, 2017 , 2016 and 2015.
CONTRACTUAL MATURITIES OF INVESTMENT IN AVAILABLE-FOR-SALE DEBT SECURITIES | ||||||
(EXCLUDING MORTGAGE AND ASSET-BACKED SECURITIES) | ||||||
|
|
| ||||
|
|
| ||||
(In millions) | Amortized cost | | Estimated fair value | | ||
|
|
| ||||
Due |
|
| ||||
Within one year | $ | 5,647 | | $ | 5,648 | |
After one year through five years | 3,297 | | 3,454 | | ||
After five years through ten years | 5,611 | | 6,156 | | ||
After ten years | 16,792 | | 20,483 | | ||
We expect actual maturities to differ from contractual maturities because borrowers have the right to call or prepay certain obligations.
Although we generally do not have the intent to sell any specific securities at the end of the period, in the ordinary course of managing our investment securities portfolio, we may sell securities prior to their maturities for a variety of reasons, including diversification, credit quality, yield and liquidity requirements and the funding of claims and obligations to policyholders. Gross realized gains on available-for-sale investment securities were $244 million , $61 million and $128 million , and gross realized losses were $(24) million , $(55) million and $(87) million for the years ended 2017, 2016 and 2015, respectively.
Proceeds from investment securities sales and early redemptions by issuers totaled $3,241 million , $1,718 million , and $5,746 million for the years ended December 31, 2017 , 2016 , and 2015 , respectively. In 2017 and 2016 , investment securities sales were principally of Government and agencies, Mortgage and asset-backed and U.S. corporate securities.
NOTE 4.
CURRENT RECEIVABLES
| Consolidated(a)(b) | | GE(c)(d) | ||||||||||
December 31 (In millions) | 2017 | | 2016 | | | 2017 | | 2016 | | ||||
Power | $ | 9,735 | | $ | 10,055 | | | $ | 4,664 | | $ | 5,134 | |
Renewable Energy | 1,666 | | 1,903 | | | 940 | | 1,293 | | ||||
Oil & Gas | 5,952 | | 4,259 | | | 5,830 | | 2,478 | | ||||
Aviation | 3,738 | | 3,542 | | | 1,875 | | 1,731 | | ||||
Healthcare | 3,725 | | 3,996 | | | 2,052 | | 2,068 | | ||||
Transportation | 287 | | 377 | | | 183 | | 186 | | ||||
Lighting | 105 | | 349 | | | 36 | | 173 | | ||||
Corporate and eliminations | 304 | | 454 | | | 342 | | 499 | | ||||
| 25,511 | | 24,935 | | | 15,922 | | 13,562 | | ||||
Less Allowance for losses | (1,073 | ) | (858 | ) | | (1,055 | ) | (847 | ) | ||||
Total | $ | 24,438 | | $ | 24,076 | | | $ | 14,867 | | $ | 12,715 | |
(a) | Included GE industrial customer receivables sold to a GE Capital affiliate and recorded on GE Capital's balance sheet of $10,370 million and $12,304 million at December 31, 2017 and 2016 , respectively. The consolidated total included a deferred purchase price receivable of $388 million and $483 million at December 31, 2017 and 2016 , respectively, related to our Receivables Facility. |
(b) | In order to manage short-term liquidity and credit exposure, the Company sells additional current receivables to third parties outside the Receivables Facility, substantially all of which are serviced by the Company. The outstanding balance of these current receivables was $2,541 million and $3,821 million at December 31, 2017 and 2016 , respectively. Of these balances, $1,621 million and $2,504 million was sold by GE to GE Capital prior to the sale to third parties at December 31, 2017 and 2016, respectively. At December 31, 2017 and 2016 , our maximum exposure to loss under the limited recourse arrangements is $90 million and $215 million , respectively. |
(c) | GE current receivables of $312 million and $299 million at December 31, 2017 and 2016 , respectively, arose from sales, principally of Aviation goods and services, on open account to various agencies of the U.S. government. As a percentage of GE revenues, approximately 4% of GE sales of goods and services were to the U.S. government in 2017 , compared with 3% in 2016 and 4% in 2015 . |
(d) | GE current receivables balances at December 31, 2017 and 2016 , before allowance for losses, included $10,671 million and $8,927 million , respectively, from sales of goods and services to customers. The remainder of the balances primarily relates to supplier advances, revenue sharing programs and other non-income based tax receivables. |
GE 2017 FORM 10-K 139
FINANCIAL STATEMENTS | CURRENT RECEIVABLES & INVENTORIES | |
RECEIVABLES FACILITY
The Company has a $3,750 million revolving Receivables Facility under which receivables are sold directly to third-party purchasers. The third-party purchasers have no recourse to other assets of the Company in the event of non-payment by the debtors. Where the purchasing entity is a bank multi-seller commercial paper conduit, assets transferred by other parties to that entity form a majority of the entity's assets. Upon sale of the receivables, we receive proceeds of cash and a deferred purchase price (DPP). The DPP is an interest in specified assets of the purchasers (the receivables sold by GE Capital) that entitles GE Capital to the residual cash flows of those specified assets.
During the year ended December 31, 2017 , GE Industrial sold current receivables of $20,863 million to GE Capital, which GE Capital sold immediately to third parties under the Receivables Facility. GE Capital continues to service the current receivables for the purchasers. The Company received total cash collections of $20,216 million on previously sold current receivables owed to the purchasing entities. The purchasing entities reinvested $17,884 million of those collections and paid $2,462 million to purchase newly originated current receivables from the Company. In addition, they paid $553 million to reduce the DPP obligation to the Company.
During the year ended December 31, 2017 , the Company recorded a loss of $122 million on sales of current receivables to the third-party purchasers.
At December 31, 2017 and 2016 , GE Capital, under the Receivables Facility, serviced $3,222 million and $2,575 million of transferred receivables that remain outstanding, respectively. During the year ended December 31, 2017 , the purchasers paid GE Capital servicing fees of $29 million .
Given the short-term nature of the underlying receivables, discount rates and prepayments are not factors in determining the value of the DPP. Collections on the DPP are presented within Cash flows from operating activities in the consolidated column in the Statement of Cash Flows. As the performance of the transferred current receivables is similar to the performance of our other current receivables, delinquencies are not expected to be significant.
NOTE 5. INVENTORIES
December 31 (In millions) | 2017 | | 2016 | | ||
|
|
| ||||
Raw materials and work in process | $ | 11,757 | | $ | 12,636 | |
Finished goods | 9,169 | | 8,798 | | ||
Unbilled shipments | 481 | | 536 | | ||
| 21,407 | | 21,971 | | ||
Revaluation to LIFO | 516 | | 383 | | ||
Total inventories | $ | 21,923 | | $ | 22,354 | |
NOTE 6. GE CAPITAL FINANCING RECEIVABLES AND ALLOWANCE FOR LOSSES ON FINANCING RECEIVABLES
FINANCING RECEIVABLES – NET |
|
| ||||
|
|
| ||||
December 31 (In millions) | 2017 | | 2016 | | ||
|
|
| ||||
Loans, net of deferred income | $ | 17,404 | | $ | 21,101 | |
Investment in financing leases, net of deferred income | 4,614 | | 4,998 | | ||
| 22,018 | | 26,099 | | ||
Allowance for losses(a) | (51 | ) | (58 | ) | ||
Financing receivables – net | $ | 21,967 | | $ | 26,041 | |
(a) Solely represents general reserves.
140 GE 2017 FORM 10-K
FINANCIAL STATEMENTS | FINANCING RECEIVABLES | |
NET INVESTMENT IN FINANCING LEASES | ||||||||||||||||||||
|
|
|
|
|
|
|
|
| ||||||||||||
| Total financing leases | | Direct financing leases(a) | | Leveraged leases(b) | |||||||||||||||
December 31 (In millions) | 2017 | | 2016 | |
| 2017 | | 2016 | |
| 2017 | | 2016 | | ||||||
|
|
|
|
|
|
|
|
| ||||||||||||
Total minimum lease payments receivable | $ | 4,637 | | $ | 5,466 | |
| $ | 2,952 | | $ | 3,274 | |
| $ | 1,685 | | $ | 2,191 | |
Less principal and interest on third-party non-recourse debt | (638 | ) | (1,053 | ) |
| - | | - | |
| (638 | ) | (1,053 | ) | ||||||
Net rentals receivable | 3,999 | | 4,412 | |
| 2,952 | | 3,274 | |
| 1,047 | | 1,138 | | ||||||
Estimated unguaranteed residual value of leased assets | 1,590 | | 1,985 | |
| 743 | | 927 | |
| 847 | | 1,058 | | ||||||
Less deferred income | (975 | ) | (1,400 | ) |
| (614 | ) | (909 | ) |
| (361 | ) | (491 | ) | ||||||
Investment in financing leases, net of deferred income(c) | $ | 4,614 | | $ | 4,998 | |
| $ | 3,081 | | $ | 3,292 | |
| $ | 1,533 | | $ | 1,706 | |
(a) | Included $22 million and $30 million of initial direct costs on direct financing leases at December 31, 2017 and 2016 , respectively. |
(b) | Included pre-tax income of $78 million and $74 million and income tax of $30 million and $28 million during 2017 and 2016 , respectively. Net investment credits recognized on leveraged leases during 2017 and 2016 were insignificant. |
(c) | See Note 13 for deferred tax amounts related to financing leases. |
CONTRACTUAL MATURITIES |
|
| ||||
|
|
| ||||
(In millions) | Total | | Net rentals | | ||
|
|
| ||||
Due in |
|
| ||||
2018 | $ | 10,366 | | $ | 932 | |
2019 | 2,987 | | 805 | | ||
2020 | 1,364 | | 637 | | ||
2021 | 1,158 | | 503 | | ||
2022 | 570 | | 327 | | ||
2023 and later | 959 | | 795 | | ||
Total | $ | 17,404 | | $ | 3,999 | |
We expect actual maturities to differ from contractual maturities, primarily as a result of prepayments.
We manage our financing receivables portfolio using delinquency and nonaccrual data as key performance indicators. At December 31, 2017 , $550 million ( 2.5% ), $140 million ( 0.6% ) and $252 million ( 1.1% ) of financing receivables were over 30 days past due, over 90 days past due and on nonaccrual, respectively. Of the $252 million of nonaccrual financing receivables at December 31, 2017 , the vast majority are secured by collateral and $223 million are currently paying in accordance with the contractual terms. At December 31, 2016 , $811 million ( 3.1% ), $407 million ( 1.6% ) and $322 million ( 1.2% ) of financing receivables were over 30 days past due, over 90 days past due and on nonaccrual, respectively.
The recorded investment in impaired loans at December 31, 2017 and December 31, 2016 was $286 million and $262 million , respectively. The method used to measure impairment for these loans is primarily based on collateral value. At December 31, 2017 , troubled debt restructurings included in impaired loans were $132 million .
The GE Capital financing receivable portfolio includes $890 million and $322 million of loans that are guaranteed by GE, of which $239 million and an insignificant amount of these loans are on nonaccrual at December 31, 2017 and 2016, respectively. These impaired loans are measured based on market and collateral value at a consolidated level, however are not impaired loans at GE Capital because of the GE guarantee. In addition to the allowance for loan losses recorded at GE Capital, additional allowance for loan losses of $161 million and an insignificant amount is recorded at GE and on a consolidated level for guaranteed loans at December 31, 2017 and 2016, respectively.
Due to the strategic shift to make GE Capital smaller and more focused, we classified $2,231 million of Energy Financial Services financing receivables as held for sale at December 31, 2017, as we no longer intend to hold these financing receivables for the foreseeable future. As a result, we recognized a pre-tax provision for losses on financing receivables of $137 million and write-offs of $156 million to reduce the carrying value of the financing receivables to the lower of cost or fair value, less cost to sell.
GE 2017 FORM 10-K 141
FINANCIAL STATEMENTS | PROPERTY, PLANT AND EQUIPMENT | |
NOTE 7. PROPERTY, PLANT AND EQUIPMENT
| Depreciable | |
|
|
|
|
| ||||||||||
| lives-new | | Original Cost |
| Net Carrying Value | ||||||||||||
December 31 (Dollars in millions) | (in years) | | 2017 | | 2016 | |
| 2017 | | 2016 | | ||||||
| | |
|
|
|
|
| ||||||||||
GE | | |
|
|
|
|
| ||||||||||
Land and improvements | 8 | (a) | $ | 1,175 | | $ | 932 | |
| $ | 1,154 | | $ | 915 | | ||
Buildings, structures and related equipment | 8-40 | | 11,486 | | 9,699 | |
| 6,913 | | 5,180 | | ||||||
Machinery and equipment | 4-20 | | 26,702 | | 24,599 | |
| 12,734 | | 10,181 | | ||||||
Leasehold costs and manufacturing plant under construction | 1-10 | | 3,862 | | 3,407 | |
| 3,162 | | 2,827 | | ||||||
| | | $ | 43,225 | | $ | 38,637 | | | $ | 23,963 | | $ | 19,103 | | ||
| | |
|
|
|
|
| ||||||||||
GE Capital(b) | | |
|
|
|
|
| ||||||||||
Land and improvements, buildings, structures and related equipment | 1-39 | (a) | $ | 171 | | $ | 238 | |
| $ | 45 | | $ | 68 | | ||
Equipment leased to others | | | | |
| | | ||||||||||
Aircraft(c) | 15-20 | | 46,296 | | 47,360 | |
| 30,067 | | 31,786 | | ||||||
All other | 4-35 | | 718 | | 587 | |
| 483 | | 371 | | ||||||
| | | 47,185 | | 48,185 | | | 30,595 | | 32,225 | | ||||||
Eliminations | | | (802 | ) | (925 | ) |
| (684 | ) | (809 | ) | ||||||
Total | | | $ | 89,608 | | $ | 85,897 | | $ | 0 | | $ | 53,874 | | $ | 50,518 | |
(a) | Depreciable lives exclude land. |
(b) | Included $1,414 million and $1,457 million of original cost of assets leased to GE with accumulated amortization of $193 million and $147 million at December 31, 2017 and 2016 , respectively. |
(c) | The GECAS business of GE Capital recognized impairment losses of $145 million and $99 million in 2017 and 2016 , respectively. These losses are recorded in the caption "Cost of services sold" in the Statement of Earnings (Loss) to reflect adjustments to fair value based on management's best estimates, which are benchmarked against third-party appraiser current market values for aircraft of similar type and age. |
Consolidated depreciation and amortization related to property, plant and equipment was $5,139 million , $4,997 million and $4,847 million in 2017 , 2016 and 2015 , respectively. Amortization of GE Capital equipment leased to others was $2,190 million , $2,231 million and $2,266 million in 2017 , 2016 and 2015 , respectively.
Noncancellable future rentals due from customers for equipment on operating leases at December 31, 2017 , are as follows:
(In millions) |
| ||
|
| ||
Due in |
| ||
2018 | $ | 3,298 | |
2019 | 2,902 | | |
2020 | 2,597 | | |
2021 | 2,204 | | |
2022 | 1,815 | | |
2023 and later | 5,590 | | |
Total | $ | 18,407 | |
NOTE 8. ACQUISITIONS, GOODWILL AND OTHER INTANGIBLE ASSETS
ACQUISITIONS
On April 20, 2017, we acquired LM Wind Power, the Danish maker of rotor blades for approximately $1,700 million . The preliminary purchase price allocation resulted in goodwill of approximately $1,490 million and amortizable intangible assets of approximately $200 million . The allocation of the purchase price will be finalized upon completion of post-closing procedures.
On January 10, 2017, we acquired the remaining 96% of ServiceMax, a leader in cloud-based field service management solutions, for $867 million , net of cash acquired of $91 million . Upon gaining control, we fair valued the business including our previously held 4% equity interest. The preliminary purchase price allocation resulted in goodwill of approximately $670 million and amortizable intangible assets of approximately $280 million . The allocation of the purchase price will be finalized upon completion of post-closing procedures.
On September 14, 2016, we acquired the remaining 74% of the software developer Meridium Inc. for cash proceeds of $369 million . Upon gaining control, we fair valued the business including our previously held 26% equity interest. The purchase price allocation resulted in goodwill of approximately $360 million and amortizable intangible assets of approximately $150 million .
142 GE 2017 FORM 10-K
FINANCIAL STATEMENTS | ACQUISITIONS & INTANGIBLE ASSETS |
|
On May 10, 2016, we announced the pending acquisition of the heat recovery steam generator (HRSG) business from Doosan Engineering & Construction for $250 million . On August 16, 2016, we closed on 80% of the HRSG business for approximately $220 million . On May 23, 2017, we closed an additional 15% of the remaining HRSG business for approximately $35 million . The business is included in our Power Segment. The agreement to purchase the remaining 5% of the HRSG business was terminated on October 13, 2017. The purchase price allocation resulted in goodwill of approximately $160 million and amortizable intangible assets of approximately $36 million .
In the fourth quarter of 2016, we acquired two European 3-D printing companies in our Aviation segment. On November 17, 2016, we acquired an additional 61.9% of the shares of Arcam AB, a Swedish company specializing in electron beam melting systems, for $422 million to bring our total ownership stake to 76.2% . Upon gaining control, we fair valued the business including our previously held 14.3% equity interest. The purchase price allocation resulted in goodwill of $523 million and amortizable intangible assets of $96 million . On December 8, 2016, we acquired 75% of Concept Laser GmbH, a German company specializing in powder-bed based laser metal printing, for $573 million . GE holds a call option on the 25% noncontrolling interest that is exercisable for a one -year period beginning on the third anniversary of the acquisition date. The non-controlling interest holds a put option that is exercisable for a one -year period beginning on the fifth anniversary of the closing date. The purchase price allocation resulted in goodwill of $674 million and amortizable intangible assets of $163 million .
On November 2, 2015, we acquired the Thermal, Renewables and Grid businesses from Alstom. The purchase price was €9,200 million ( $10,124 million ), net of cash acquired of approximately €1,600 million ( $1,765 million ). The purchase price allocation resulted in goodwill of approximately of $17,300 million and amortizable intangible assets of approximately $4,400 million . In connection with the Alstom acquisition, on February 25, 2016, GE sold certain of Alstom's gas-turbine assets and its Power Systems Manufacturing subsidiary to Ansaldo Energia SpA (Ansaldo) for approximately €120 million . The purchase price will be paid by Ansaldo over a period of five years .
BAKER HUGHES
On July 3, 2017, GE completed the previously announced combination of GE's Oil & Gas business (GE Oil & Gas) with Baker Hughes Incorporated (Baker Hughes). As part of the transaction, GE contributed GE Oil & Gas and $7,498 million in cash in exchange for an ownership interest of approximately 62.5% in the new combined company. The operating assets of the new combined company are held through a partnership named Baker Hughes, a GE company, LLC (BHGE LLC). GE holds an economic interest of approximately 62.5% in this partnership, and Baker Hughes' former shareholders hold an ownership interest of approximately 37.5% through a newly NYSE listed corporation, Baker Hughes, a GE company (BHGE), which controls the partnership. In turn, GE holds a controlling, voting interest of approximately 62.5% in BHGE through Class B Common Stock, which grants voting rights but no economic rights. Baker Hughes' former shareholders received one share of BHGE Class A Common Stock and a special one-time cash dividend of $17.50 per share at closing. Total consideration was $24,798 million , including the $7,498 million cash contribution.
The Baker Hughes acquisition has been accounted for as a business combination, using the acquisition method. The net assets of Baker Hughes' contributed businesses were recorded at their estimated fair value, and GE Oil & Gas continues at its historical or carryover basis. We recorded noncontrolling interest of $16,462 million for the approximate 37.5% ownership interest in the combined company held by BHGE's Class A shareholders. The noncontrolling interest is recorded at fair value for the portion attributable to Baker Hughes and at our historical cost for the portion attributable to GE Oil & Gas. The fair value of the noncontrolling interest associated with the acquired net assets was determined by the publicly traded share price of Baker Hughes at the close of the transaction. The impact of recognizing the noncontrolling interest in GE Oil & Gas resulted in a decrease to additional paid in capital of $126 million . Previously we disclosed that the impact of recognizing the noncontrolling interest was an increase to additional paid in capital of $1,131 million . During the fourth quarter of 2017, a correction for currency translation adjustments of $930 million and certain tax basis differences resulted in the decrease of $1,257 million to additional paid in capital. In the first quarter of 2018, the calculation of paid in capital will be updated to reflect the impact of adoption of ASU 2014-09, Revenues from Contracts with Customers .
The tables below present the fair value of the consideration exchanged and the preliminary allocation of purchase price to the major classes of assets and liabilities of the acquired Baker Hughes business and the associated fair value of preexisting noncontrolling interest related to the acquired net assets of Baker Hughes. The estimated values are not yet final and are subject to change, and the changes could be significant. We will finalize the amounts recognized as soon as possible as we obtain the information necessary to complete the analysis, but no later than one year from the acquisition date.
PURCHASE PRICE |
| ||
(In millions) | July 3, 2017 | | |
|
| ||
Cash consideration | $ | 7,498 | |
Fair value of the Class A Shares in BHGE issued to Baker Hughes shareholders | 17,300 | | |
Total consideration for Baker Hughes | $ | 24,798 | |
GE 2017 FORM 10-K 143
FINANCIAL STATEMENTS | ACQUISITIONS & INTANGIBLE ASSETS |
|
PRELIMINARY IDENTIFIABLE ASSETS ACQUIRED AND LIABILITIES ASSUMED |
| ||
(In millions) | July 3, 2017 | | |
|
| ||
Cash and cash equivalents | $ | 4,133 | |
Accounts receivable | 2,383 | | |
Inventories | 1,695 | | |
Property, plant, and equipment - net | 4,868 | | |
Other intangible assets - net | 4,123 | | |
All other assets | 1,544 | | |
Accounts payable | (1,106 | ) | |
Borrowings | (3,370 | ) | |
Deferred taxes(a) | (464 | ) | |
All other liabilities | (2,288 | ) | |
Total identifiable net assets | 11,518 | | |
Fair value of existing noncontrolling interest | (76 | ) | |
Goodwill | 13,356 | | |
Total allocated purchase price | $ | 24,798 | |
(a) | Includes an increase of approximately $ $1,051 million primarily related to fair value adjustments to identifiable assets and liabilities (excluding goodwill) partially offset by a tax asset of approximately $572 million associated with the recognition of foreign tax credits. |
The estimated fair value of intangible assets and related useful lives in the preliminary purchase price allocation included:
(In millions) | Estimated fair value | | Estimated useful life (in years) | |
Trademarks - Baker Hughes | $ | 2,100 | | Indefinite life |
Customer-related | 1,260 | | 15 | |
Patents and technology | 550 | | 10 | |
Trademarks - Other | 70 | | 10 | |
Capitalized software | 90 | | 3-7 | |
In-process research and development | 45 | | Indefinite life | |
Favorable lease contracts | 8 | | 10 | |
Total | $ | 4,123 | |
|
The above goodwill represents future economic benefits expected to be recognized from combining the operations of GE Oil & Gas and Baker Hughes, including expected future synergies and operating efficiencies. Goodwill resulting from the acquisition has been allocated to our Oil & Gas reporting units, of which $67 million is deductible for tax purposes.
During the fourth quarter of 2017, the Company made measurement period adjustments to reflect facts and circumstances in existence as of the acquisition date. These adjustments resulted in a decrease in goodwill of approximately $ 851 million mostly due to the step-up to fair value of property, plant and equipment of $ 682 million and a tax asset recorded through purchase accounting of $ 572 million associated with the recognition of foreign tax credits. The decrease in goodwill was offset by a reduction of intangible assets of $ 367 million and by tax adjustments associated with the fair value step up of property, plant and equipment. As a result of the increase in property, plant and equipment and the reduction of intangible assets during the fourth quarter of 2017, we recorded a net cumulative increase to depreciation and amortization expense of $63 million . In addition, we reclassified certain balances to conform to our presentation.
INCOME TAXES
BHGE LLC, will be treated as a disregarded entity for U.S. federal income tax purposes and, accordingly, will not incur any material current or deferred U.S. federal income taxes. BHGE LLC's foreign subsidiaries, however, are expected to incur current and deferred foreign income taxes.
At closing, GE and BHGE, entered into a Tax Matters Agreement. The Tax Matters Agreement governs the administration and allocation between the parties of tax liabilities and benefits arising prior to, as a result of, and subsequent to the transaction. GE will be responsible for certain taxes related to the formation of the transaction undertaken by GE and Baker Hughes and their respective subsidiaries. We have assumed approximately $33 million of tax obligations of Baker Hughes related to the formation of the transaction.
The Tax Matters Agreement will also provide for the sharing of certain tax benefits arising from the transaction. GE will be entitled to 100% of these tax benefits to the extent that GE has borne certain taxes related to the formation of the transaction. Thereafter, these tax benefits will be shared by GE and BHGE in accordance with their ownership of the partnership, which will initially be approximately 62.5% and approximately 37.5% , respectively.
144 GE 2017 FORM 10-K
FINANCIAL STATEMENTS | ACQUISITIONS & INTANGIBLE ASSETS |
|
ACQUISITION COSTS
During the twelve months ended December 31, 2017, acquisition costs of $373 million were expensed as incurred and were reported as selling, general and administrative expenses.
UNAUDITED ACTUAL AND PRO FORMA INFORMATION
Our consolidated "Revenues and other income", and "Earnings (loss) from continuing operations" from July 3, 2017 through December 31, 2017 included $5,203 million and $(709) million , respectively, related to the Baker Hughes business.
The following unaudited pro forma information has been presented as if the Baker Hughes transaction occurred on January 1, 2016. This information has been prepared by combining the historical results of the Company and historical results of Baker Hughes. The unaudited pro forma combined financial data for all periods presented were adjusted to give effect to proforma events that 1) are directly attributable to the aforementioned transaction, 2) factually supportable, and 3) expected to have a continuing impact on the consolidated results of operations.
The unaudited combined pro forma results do not include any incremental cost savings that may result from the integration. The adjustments are based on information available to the Company at this time. Accordingly, the adjustments are subject to change and the impact of such changes may be material. The unaudited combined pro forma information is for informational purposes only.
The pro forma information is not necessarily indicative of what the combined company's results actually would have been had the acquisition been completed as of the beginning of the periods as indicated. In addition, the unaudited pro forma information does not purport to project the future results of the combined company.
(In millions) | 2017 | | 2016 | | ||
Revenues and other income | $ | 126,755 | | $ | 133,526 | |
Earnings (loss) from continuing operations | (5,817 | ) | 6,379 | | ||
Significant adjustments to the pro forma information above include recognition of nonrecurring direct incremental acquisition costs in the twelve-month period ended December 31, 2016 and exclusion of those costs from all other periods presented; the amortization associated with an estimate of the acquired intangible assets; and the depreciation associated with an estimate of the fair value step-up of property, plant and equipment. A nonrecurring contractually obligated termination fee of $3,500 million ( $3,301 million net of related costs incurred) received by Baker Hughes due to an inability to obtain antitrust related approvals from a prior merger agreement is recognized in the twelve months ended December 31, 2016.
GOODWILL
CHANGES IN GOODWILL BALANCES | |||||||||||||||||||||||||
|
|
|
|
|
|
|
|
|
| ||||||||||||||||
| 2017 |
| 2016 | ||||||||||||||||||||||
(In millions) | Balance at January 1 | | Acquisitions | | Dispositions, | | Balance at December 31 | | | Balance at January 1 | | Acquisitions | | Dispositions, | | Balance at December 31 | | ||||||||
|
|
|
|
|
|
|
|
|
| ||||||||||||||||
Power | $ | 26,403 | | $ | 37 | | $ | (1,171 | ) | $ | 25,269 | |
| $ | 22,963 | | $ | 4,131 | | $ | (692 | ) | $ | 26,403 | |
Renewable Energy | 2,507 | | 1,503 | | 83 | | 4,093 | |
| 2,580 | | (46 | ) | (27 | ) | 2,507 | | ||||||||
Oil & Gas | 10,363 | | 13,364 | | 216 | | 23,943 | |
| 10,594 | | - | | (231 | ) | 10,363 | | ||||||||
Aviation | 9,455 | | 25 | | 529 | | 10,008 | |
| 8,567 | | 1,045 | | (158 | ) | 9,455 | | ||||||||
Healthcare | 17,424 | | 60 | | (178 | ) | 17,306 | |
| 17,353 | | 191 | | (120 | ) | 17,424 | | ||||||||
Transportation | 899 | | - | | 3 | | 902 | |
| 851 | | 41 | | 6 | | 899 | | ||||||||
Lighting | 281 | | - | | (281 | ) | - | |
| 214 | | 63 | | 5 | | 281 | | ||||||||
Capital | 2,368 | | - | | (1,384 | ) | 984 | |
| 2,370 | | - | | (1 | ) | 2,368 | | ||||||||
Corporate | 739 | | 727 | | (3 | ) | 1,463 | |
| 34 | | 487 | | 218 | | 739 | | ||||||||
Total | $ | 70,438 | | $ | 15,716 | | $ | (2,186 | ) | $ | 83,968 | |
| $ | 65,526 | | $ | 5,911 | | $ | (1,000 | ) | $ | 70,438 | |
Goodwill balances increased by $13,530 million in 2017 , primarily as a result of the Baker Hughes transaction, the LM Wind Power and ServiceMax acquisitions and the currency effect of a weaker U.S. dollar, partially offset by the reclassification of various businesses to Assets of businesses held for sale and impairment of our Energy Financial Services and Power Conversion goodwill.
Goodwill balances increased $4,912 million in 2016 , primarily as a result of the Alstom acquisition purchase accounting adjustments and other acquisitions, partially offset by currency exchange effects of the stronger U.S. dollar against other major currencies.
GE 2017 FORM 10-K 145
FINANCIAL STATEMENTS | ACQUISITIONS & INTANGIBLE ASSETS |
|
We test goodwill for impairment annually in the third quarter of each year using data as of July 1 of that year. The impairment test consists of two steps: in step one, the carrying value of the reporting unit is compared with its fair value; in step two, which is applied when the carrying value is more than its fair value, the amount of goodwill impairment, if any, is derived by deducting the fair value of the reporting unit's assets and liabilities from the fair value of its equity, and comparing that amount with the carrying amount of goodwill. We determined fair values for each of the reporting units using the market approach, when available and appropriate, or the income approach, or a combination of both. We assess the valuation methodology based upon the relevance and availability of the data at the time we perform the valuation. If multiple valuation methodologies are used, the results are weighted appropriately.
Valuations using the market approach are derived from metrics of publicly traded companies or historically completed transactions of comparable businesses. The selection of comparable businesses is based on the markets in which the reporting units operate giving consideration to risk profiles, size, geography, and diversity of products and services. A market approach is limited to reporting units for which there are publicly traded companies that have the characteristics similar to our businesses.
Under the income approach, fair value is determined based on the present value of estimated future cash flows, discounted at an appropriate risk-adjusted rate. We use our internal forecasts to estimate future cash flows and include an estimate of long-term future growth rates based on our most recent views of the long-term outlook for each business. Actual results may differ from those assumed in our forecasts. We derive our discount rates using a capital asset pricing model and analyzing published rates for industries relevant to our reporting units to estimate the cost of equity financing. We use discount rates that are commensurate with the risks and uncertainty inherent in the respective businesses and in our internally developed forecasts. Discount rates used in our reporting unit valuations ranged from 9.0% to 18.0% .
During the third quarter of 2017, we performed our annual impairment test of goodwill for all our reporting units. Based on the results of our step one testing, the fair values of each of the GE reporting units exceeded their carrying values except for our Power Conversion reporting unit, within our Power operating segment. The primary factors contributing to a reduction in fair value of this reporting unit were extended downturns in certain of its customer segments, most notably the marine and oil and gas markets, increased pricing and cost pressures in low margin renewable markets, and the delayed introduction of new technologies and products. Therefore, we performed a step two analysis. As a result of this analysis, we recognized a non-cash goodwill impairment loss of $947 million during the third quarter to write down the carrying values of Power Conversion's goodwill to its implied fair value. Due to the impairment taken in the third quarter, we performed an interim impairment test of our Power Conversion reporting unit in the fourth quarter of 2017, which indicated that its carrying value was greater than its fair value. Therefore, we performed a step two analysis which resulted in the impairment of the remaining reporting unit goodwill. The primary factors contributing to the further decline in the fair value of the Power Conversion reporting unit in the fourth quarter were increased competition leading to loss and cancellation of orders in the renewables customer segment and further downturn in oil and gas. In addition, Power Conversion reached an agreement to sell its low voltage motors business, which decreased the fair value of the remaining Power Conversion reporting unit. As a result, we recognized an additional non-cash impairment loss of $217 million during the fourth quarter. The total impairment loss of $1,164 million of the Power Conversion goodwill was recorded on the Statement of Earnings (Loss) to Other costs and expenses. After the impairment loss, there is no goodwill in our Power Conversion reporting unit.
In addition, we identified one reporting unit for which the fair value was not substantially in excess of its carrying value. The Grid Solutions reporting unit within our Power operating segment was formed as a result of the Alstom acquisition in November 2015. Since fair value equaled carrying value at the time of acquisition, this caused the fair value of this reporting unit not to be significantly in excess of its carrying value. In the current annual impairment test, the fair value of Grid Solutions continued to be not substantially in excess of carrying value. Therefore, we performed an interim impairment test in the fourth quarter of 2017 which resulted in the fair value being in excess of its carrying value by approximately 8% . While the goodwill of this reporting unit is not currently impaired, there could be an impairment in the future as a result of changes in certain assumptions. For example, the fair value could be adversely affected and result in an impairment of goodwill if expected synergies of the acquisition with Alstom are not realized or if the reporting unit was not able to execute on customer opportunities, the estimated cash flows are discounted at a higher risk-adjusted rate or market multiples decrease. The goodwill associated with our Grid Solutions reporting unit was $4,542 million , representing approximately 5% of our total goodwill at December 31, 2017.
Due to the overall decline in the Power market, we performed an interim step-one analysis of our Power Generation reporting unit within our Power segment, which indicated that its fair value has declined since our last impairment test; however, was still significantly in excess of its carrying value. We will continue to monitor the Power markets and the impact it may have on this reporting unit.
146 GE 2017 FORM 10-K
FINANCIAL STATEMENTS | ACQUISITIONS & INTANGIBLE ASSETS |
|
Due to the strategic shift to make our Capital segment smaller and more focused, we determined we had an impairment trigger at our Energy Financial Services reporting unit in the fourth quarter of 2017 and performed a step-one analysis which indicated that its carrying value was in excess of its fair value. The primary factor contributing to a reduction in fair value of this reporting unit is the change in strategy of long term growth to a partial exit of earning assets and restrictions on ability to originate new volume. This results in lower forecasted future cash flows and long-term growth assumptions. Based upon the results of the step-one analysis, we performed the second step of the impairment test, which indicated that the implied fair value of goodwill was zero . Therefore, we recorded a non-cash impairment loss on the Statement of Earnings (Loss) to Other costs and expenses of $1,386 million during the fourth quarter to fully impair the goodwill at our Energy Financial Services reporting unit.
While the fair values of our Oil & Gas reporting units are in excess of their carrying values, the Oilfield Equipment and Oilfield Services reporting unit continued to experience declines in orders, project commencement delays and pricing pressures, which reduced its fair value in the annual impairment test. We will continue to monitor the oil & gas industry and the impact it may have on this reporting unit. In addition, because of the Baker Hughes acquisition and related integration activities, the composition of our historical reporting units for the Oil & Gas operating segment may change. In the event that any of our reporting units change substantially, we will be required to re-test the reporting units as of the date of the reorganization, re-allocate goodwill based on the relative fair values of the new reporting units, and record any required impairment. Finally, the operating and reporting segments and associated reporting units for BHGE, as reported in their standalone financial statements, are different than GE's, as BHGE is a subsidiary and performs its reporting unit assessment one level below its operating segments.
As of December 31, 2017, we believe no other goodwill impairment exists, apart from the impairment charge s discussed above, and that the remaining goodwill is recoverable for all of our reporting units; however, there can be no assurances that additional goodwill will not be impaired in future periods.
Estimating the fair value of reporting units requires the use of estimates and significant judgments that are based on a number of factors including actual operating results. It is reasonably possible that the judgments and estimates described above could change in future periods.
OTHER INTANGIBLE ASSETS
OTHER INTANGIBLE ASSETS - NET | ||||||
|
|
| ||||
December 31 (In millions) | 2017 | | 2016 | | ||
|
|
| ||||
Intangible assets subject to amortization | $ | 18,056 | | $ | 16,336 | |
Indefinite-lived intangible assets(a) | 2,217 | | 100 | | ||
Total | $ | 20,273 | | $ | 16,436 | |
(a) | Indefinite-lived intangible assets principally comprise trademarks and in-process research and development. |
INTANGIBLE ASSETS SUBJECT TO AMORTIZATION | |||||||||||||||||||
|
|
|
|
|
|
|
| ||||||||||||
| 2017 |
| 2016 | ||||||||||||||||
December 31 (In millions) | Gross | | Accumulated | | Net | | | Gross | | Accumulated | | Net | | ||||||
|
|
|
|
|
|
|
| ||||||||||||
Customer-related | $ | 10,614 | | $ | (3,095 | ) | $ | 7,521 | |
| $ | 9,172 | | $ | (2,408 | ) | $ | 6,764 | |
Patents and technology | 10,271 | | (3,899 | ) | 6,372 | |
| 8,695 | | (3,327 | ) | 5,368 | | ||||||
Capitalized software | 8,064 | | (4,974 | ) | 3,089 | |
| 7,652 | | (4,538 | ) | 3,114 | | ||||||
Trademarks | 1,280 | | (421 | ) | 859 | |
| 1,165 | | (307 | ) | 859 | | ||||||
Lease valuations | 170 | | (80 | ) | 89 | |
| 143 | | (59 | ) | 84 | | ||||||
Present value of future profits(a) | - | | - | | - | |
| 684 | | (684 | ) | - | | ||||||
All other | 218 | | (92 | ) | 125 | |
| 273 | | (124 | ) | 149 | | ||||||
Total | $ | 30,618 | | $ | (12,561 | ) | $ | 18,056 | |
| $ | 27,783 | | $ | (11,446 | ) | $ | 16,336 | |
(a) | See Note 11 for discussion on the present value of future profits in our run-off insurance operations. |
GE 2017 FORM 10-K 147
FINANCIAL STATEMENTS | ACQUISITIONS & INTANGIBLE ASSETS |
|
GE amortization expense related to intangible assets subject to amortization was $2,154 million , $2,011 million and $1,514 million in 2017 , 2016 and 2015 , respectively. GE Capital amortization expense related to intangible assets subject to amortization was $66 million , $131 million and $148 million in 2017 , 2016 and 2015 , respectively. Estimated GE Consolidated annual pre-tax amortization for intangible assets over the next five calendar years follows.
ESTIMATED 5 YEAR CONSOLIDATED AMORTIZATION | |||||||||||||||
|
|
|
|
|
| ||||||||||
(In millions) | 2018 | | 2019 | | 2020 | | 2021 | | 2022 | | |||||
|
|
|
|
|
| ||||||||||
Estimated annual pre-tax amortization | $ | 2,274 | | $ | 2,148 | | $ | 2,039 | | $ | 1,878 | | $ | 1,713 | |
During 2017, we recorded additions to intangible assets subject to amortization of $3,765 million . The components of finite-lived intangible assets acquired during 2017 and their respective weighted-average amortizable periods follow.
COMPONENTS OF FINITE-LIVED INTANGIBLE ASSETS ACQUIRED DURING 2017 | ||||
|
|
| ||
(In millions) | Gross | | Weighted-average | |
|
|
| ||
Customer-related | $ | 1,451 | | 14.9 |
Patents and technology | 1,214 | | 10.7 | |
Capitalized software | 982 | | 5.4 | |
Trademarks | 91 | | 8.6 | |
Lease valuations | 8 | | 10.0 | |
All other | 19 | | 8.6 | |
148 GE 2017 FORM 10-K
FINANCIAL STATEMENTS | CONTRACT ASSETS | |
NOTE 9. CONTRACT ASSETS
December 31, 2017 (In millions) | Power | Aviation | Oil & Gas | Renewable Energy | Transportation | Other(a) | Total | ||||||||||||||
|
|
|
|
|
|
|
| ||||||||||||||
GE |
|
|
|
|
|
|
| ||||||||||||||
Revenue in excess of billings |
|
|
|
|
|
|
| ||||||||||||||
Long-term product service agreements(b)(f) | $ | 7,439 | | $ | 5,265 | | $ | 1,266 | | $ | 1 | | $ | 1,186 | | $ | - | | $ | 15,157 | |
Long-term equipment contract revenue(c) | 3,777 | | 1,833 | | 997 | | 254 | | 69 | | 25 | | 6,954 | | |||||||
Total revenue in excess of billings | 11,215 | | 7,098 | | 2,263 | | 255 | | 1,254 | | 25 | | 22,111 | | |||||||
|
|
|
|
|
|
|
| ||||||||||||||
Deferred inventory costs(d) | 1,565 | | 528 | | 338 | | 1,042 | | 46 | | 319 | | 3,839 | | |||||||
Nonrecurring engineering costs(e) | 7 | | 1,720 | | - | | - | | 87 | | - | | 1,814 | | |||||||
Customer advances and other | - | | 1,098 | | - | | - | | - | | - | | 1,097 | | |||||||
Contract assets | $ | 12,786 | | $ | 10,445 | | $ | 2,602 | | $ | 1,297 | | $ | 1,388 | | $ | 344 | | $ | 28,861 | |
December 31, 2016 (In millions) | Power | Aviation | Oil & Gas | Renewable Energy | Transportation | Other(a) | Total | ||||||||||||||
|
|
|
|
|
|
|
| ||||||||||||||
GE |
|
|
|
|
|
|
| ||||||||||||||
Revenue in excess of billings |
|
|
|
|
|
|
| ||||||||||||||
Long-term product service agreements(b) | $ | 6,595 | | $ | 4,861 | | $ | 508 | | $ | 1 | | $ | 787 | | $ | - | | $ | 12,752 | |
Long-term equipment contract revenue(c) | 3,062 | | 1,673 | | 709 | | 315 | | 55 | | 45 | | 5,859 | | |||||||
Total revenue in excess of billings | 9,657 | | 6,534 | | 1,217 | | 316 | | 843 | | 45 | | 18,611 | | |||||||
|
|
|
|
|
|
|
| ||||||||||||||
Deferred inventory costs(d) | 1,168 | | 650 | | 217 | | 923 | | 40 | | 350 | | 3,349 | | |||||||
Nonrecurring engineering costs(e) | 18 | | 2,083 | | - | | - | | 85 | | - | | 2,185 | | |||||||
Customer advances and other | 10 | | 993 | | - | | - | | 1 | | 13 | | 1,018 | | |||||||
Contract assets | $ | 10,852 | | $ | 10,261 | | $ | 1,433 | | $ | 1,239 | | $ | 969 | | $ | 408 | | $ | 25,162 | |
(a) | Primarily includes our Healthcare segment |
(b) | Long-term product service agreement balances are presented net of related billings in excess of revenues of $3,037 million and $3,750 million at December 31, 2017 and 2016 , respectively. |
(c) | Reflects revenues earned in excess of billings on our long-term contracts to construct technically complex equipment (such as gas power systems or commercial aircraft engines). |
(d) | Represents cost deferral for shipped goods (such as components for wind turbine assembly within our Renewable Energy segment) and labor and overhead costs on time and material service contracts (primarily originating in Power and Aviation) and other costs for which the criteria for revenue recognition has not yet been met. |
(e) | Includes costs incurred prior to production (e.g., requisition engineering) for long-term equipment production contracts, primarily within our Aviation segment, which are allocated ratably to each unit produced. |
(f) | The assets of legacy GE Oil & Gas were contributed to BHGE upon formation. The contributed assets included certain small-scale liquefied natural gas (LNG) contracts that were historically reported in our Power segment; therefore, on January 1, 2017, $236 million was transferred to Oil & Gas and additional $239 million was transferred to Oil & Gas on July 3, 2017 at the completion of the transaction. |
Contract assets increased $ 3,699 million in 2017, which was primarily driven by a change in estimated profitability of $2,131 million within our long-term product service agreement s within Power ( $1,301 million ), Transportation ( $361 million ), Aviation ( $250 million ) and Oil & Gas ( $219 million ). In addition, our long-term equipment contracts increased $ 1,095 million , primarily within Power ( $715 million ) and Oil & Gas ( $288 million ), and deferred inventory costs increased $490 million within Power ( $397 million ) and Oil & Gas ( $121 million ) due to the timing of revenue recognized for work performed relative to the timing of billings and collections.
GE 2017 FORM 10-K 149
FINANCIAL STATEMENTS | BORROWINGS |
|
NOTE 10. BORROWINGS
December 31 (Dollars in millions) |
| 2017 | |
| 2016 | |
| ||||
|
|
|
|
|
| ||||||
Short-term borrowings |
| Amount | | Average Rate(a) | | Amount | | Average Rate(a) | | ||
GE |
|
|
|
|
| ||||||
Commercial paper |
| $ | 3,000 | | 1.35 | % | $ | 1,500 | | 0.60 | % |
Current portion of long-term borrowings(e) |
| 9,452 | | 3.01 | | 17,109 | | 3.16 | | ||
Other |
| 2,095 | |
| 1,874 | |
| ||||
Total GE short-term borrowings(b) |
| $ | 14,548 | |
| $ | 20,482 | |
| ||
|
|
|
|
|
| ||||||
GE Capital |
|
|
|
|
| ||||||
Commercial paper |
| $ | 5,013 | | 1.45 | | $ | 5,002 | | 0.59 | |
Current portion of long-term borrowings(c) |
| 5,781 | | 1.26 | | 6,517 | | 1.64 | | ||
Intercompany payable to GE(d) |
| 8,310 | |
| 11,696 | |
| ||||
Other |
| 497 | |
| 229 | |
| ||||
Total GE Capital short-term borrowings |
| $ | 19,602 | |
| $ | 23,443 | |
| ||
|
|
|
|
|
| ||||||
Eliminations(d) |
| (10,114 | ) |
| (13,212 | ) |
| ||||
Total short-term borrowings |
| $ | 24,036 | |
| $ | 30,714 | |
| ||
|
|
|
|
|
| ||||||
Long-term borrowings | Maturities | Amount | | Average Rate(a) | | Amount | | Average Rate(a) | | ||
GE |
|
|
|
|
| ||||||
Senior notes(e) | 2019-2055 | $ | 62,724 | | 3.15 | % | $ | 54,396 | | 3.35 | % |
Subordinated notes | 2021-2037 | 2,913 | | 3.28 | | 2,768 | | 3.73 | | ||
Subordinated debentures(g) |
| - | | | 719 | | 6.12 | | |||
Other |
| 1,403 | |
| 928 | |
| ||||
Total GE long-term borrowings(b) |
| 67,040 | |
| 58,810 | |
| ||||
|
|
|
|
|
| ||||||
GE Capital |
|
|
|
|
| ||||||
Senior notes | 2019-2039 | 40,754 | | 3.11 | | 44,131 | | 2.45 | | ||
Subordinated notes |
| 208 | |
| 236 | | | ||||
Intercompany payable to GE(f) |
| 31,533 | |
| 47,084 | |
| ||||
Other(c) |
| 1,118 | |
| 1,992 | |
| ||||
Total GE Capital long-term borrowings |
| 73,614 | |
| 93,443 | |
| ||||
|
|
|
|
|
| ||||||
Eliminations(f) |
| (32,079 | ) |
| (47,173 | ) |
| ||||
Total long-term borrowings |
| $ | 108,575 | |
| $ | 105,080 | |
| ||
Non-recourse borrowings of consolidated securitization entities(h) | 2018-2021 | 1,980 | | 2.77 | % | 417 | | 2.23 | % | ||
Total borrowings |
| $ | 134,591 | |
| $ | 136,210 | |
| ||
(a) | Based on year-end balances and year-end local currency effective interest rates, including the effects from hedging. |
(b) | Excluding assumed debt of GE Capital, the total amount of GE borrowings was $41,744 million and $20,512 million at December 31, 2017 and December 31, 2016 , respectively. |
(c) | Included $1,466 million and $2,665 million of funding secured by aircraft and other collateral at December 31, 2017 and December 31, 2016 , respectively, of which $458 million and $1,419 million is non-recourse to GE Capital at December 31, 2017 and December 31, 2016 , respectively. |
(d) | Included a reduction of zero and $1,329 million of short-term intercompany loans from GE Capital to GE at December 31, 2017 and December 31, 2016, which bear the right of offset against amounts owed under the assumed debt agreement. Excluding intercompany loans, total short-term assumed debt was $8,310 million and $13,024 million at December 31,2017 and December 31, 2016, respectively. The remaining short-term intercompany loan balance was paid in January 2017. |
(e) | Total borrowings included $7,225 million of borrowings issued by BHGE, which primarily included current portion of long-term borrowings and senior notes of $639 million and $6,206 million , respectively, at December 31, 2017. |
(f) | Included a reduction of $7,271 million and zero for long-term intercompany loans from GE Capital to GE at December 31, 2017 and December 31, 2016, respectively, which bear the right of offset against amounts owed under the assumed debt agreement. Excluding intercompany loans, total long-term assumed debt was $38,804 million and $47,084 million at December 31, 2017 and December 31, 2016, respectively. The $7,271 million of intercompany loans collectively have a weighted average interest rate of 3.5% and a term of approximately 15 years . |
(g) | Comprises subordinated debentures which constitute the sole assets of the trusts that have issued trust preferred securities and where GE owns 100% of the common securities of the trusts. Obligations associated with these trusts are unconditionally guaranteed by GE. |
(h) | Included $621 million and $320 million of current portion of long-term borrowings at December 31, 2017 and December 31, 2016 , respectively. See Note 19 for further information. |
150 GE 2017 FORM 10-K
FINANCIAL STATEMENTS | BORROWINGS |
|
During the second quarter of 2017, GE completed issuances of €8,000 million senior unsecured debt, composed of €1,750 million of 0.375% Notes due 2022, €2,000 million of 0.875% Notes due 2025, €2,250 million of 1.50% Notes due 2029 and €2,000 million of 2.125% Notes due 2037.
During the fourth quarter of 2017, BHGE completed the issuance of $3,950 million of new senior unsecured debt, composed of $1,250 million of 2.773% Notes due 2022, $1,350 million of 3.337% Notes due 2027, and $1,350 million of 4.080% Notes due 2047.
On April 10, 2015, GE provided a full and unconditional guarantee on the payment of the principal and interest on all tradable senior and subordinated outstanding long-term debt securities and all commercial paper issued or guaranteed by GE Capital. At December 31, 2017, the guarantee applies to $43,978 million of GE Capital debt.
See Note 19 for further information about borrowings and associated swaps.
Liquidity is affected by debt maturities and our ability to repay or refinance such debt. Long-term debt maturities over the next five years follow.
(In millions) | 2018 | | 2019 | | 2020 | | 2021 | | 2022 | | |||||
|
|
|
|
|
| ||||||||||
GE excluding assumed debt(a) | $ | 1,142 | | $ | 127 | | $ | 888 | | $ | 591 | | $ | 6,351 | |
GE Capital debt assumed by GE | 8,310 | | 3,774 | | 6,208 | | 4,713 | | 1,942 | | |||||
GE Capital other debt | 5,781 | (b) | 4,462 | | 11,476 | | 2,211 | | 2,338 | | |||||
(a) | Includes maturities of BHGE borrowings of $738 million , $47 million , $14 million , $538 million and $1,255 million in 2018, 2019, 2020, 2021 and 2022, respectively. Excluding BHGE borrowings, GE maturities will be $404 million , $80 million , $875 million , $53 million and $5,095 million in 2018, 2019, 2020, 2021 and 2022, respectively. |
(b) | Fixed and floating rate notes of $447 million contain put options with exercise dates in 2018, and which have final maturity beyond 2022. |
GE 2017 FORM 10-K 151
FINANCIAL STATEMENTS | INVESTMENT CONTRACTS & INSURANCE | |
NOTE 11. INVESTMENT CONTRACTS, INSURANCE LIABILITIES AND INSURANCE ANNUITY BENEFITS
Investment contracts, insurance liabilities and insurance annuity benefits comprise mainly obligations to annuitants and insureds in our run-off insurance operations.
December 31 (In millions) | 2017 | | 2016 | | ||
|
|
| ||||
Future policy benefit reserves |
|
| ||||
Long-term care insurance contracts | $ | 16,522 | | $ | 7,629 | |
Structured settlement annuities with life contingencies and other contracts | 9,448 | | 9,267 | | ||
Shadow adjustments(a) | 4,582 | | 1,845 | | ||
| 30,552 | | 18,741 | | ||
Investment contracts | 2,569 | | 2,813 | | ||
Claim reserves(b) | 5,094 | | 4,606 | | ||
Unearned premiums and other | 372 | | 386 | | ||
| 38,587 | | 26,546 | | ||
Eliminations | (451 | ) | (460 | ) | ||
Total | $ | 38,136 | | $ | 26,086 | |
(a) | To the extent that unrealized gains on specific investment securities supporting our insurance contracts would result in a premium deficiency should those gains be realized, an increase in future policy benefit reserves is recorded, with an after-tax reduction of net unrealized gains recognized through Other comprehensive income. |
(b) | Included $3,590 million and $3,129 million related to long term-care insurance contracts and $364 million and $362 million related to short-duration contracts, net of eliminations, at December 31, 2017 and December 31, 2016, respectively. |
During 2017, in response to elevated claim experience for a portion of our long-term care insurance contracts that was most pronounced for policyholders with higher attained ages, we initiated a comprehensive review of premium deficiency assumptions across all insurance products, which included reconstructing our future claim cost assumptions for long-term care contracts utilizing trends observed in our emerging experience for older claimant ages and later duration policies. Certain of our long-term care policyholders only recently started to reach the prime claim paying period and our new claim cost assumptions considered the emerging credibility of this claim data. In addition to the adverse impact from the increased expected future claim cost assumptions over a long-term horizon, our premium deficiency assumptions considered mortality, length of time a policy will remain in force and both near-term and longer-term investment return expectations. Future investment yields estimated in 2017 were lower than in previous premium deficiency tests, primarily due to the effect of near term yields on approximately $15 billion of future expected capital contributions. The indicated premium deficiency resulted in a $9,481 million charge to earnings, which included a $398 million impairment of deferred acquisition costs, a $216 million impairment of present value of future profits, and an $8,867 million increase in future policy benefit reserves.
In response to the premium deficiency, our future policy benefit reserves at December 31, 2017 were unlocked and updated to reflect our most recent assumptions, including discount rates ranging from 2.6% - 6.0% with a weighted-average rate of 5.7% across different tenors . Any future adverse changes in our assumptions could result in an increase to future policy benefit reserves. Any favorable changes to these assumptions could result in additional margin in our premium deficiency test and higher income over the remaining duration of the portfolio, including higher investment income.
Claim reserve activity included incurred claims of $2,020 million , $1,989 million and $1,761 million of which $135 million , $123 million and $(24) million related to the recognition of adjustments to prior year claim reserves arising from our periodic reserve evaluation in the years ended December 31, 2017, 2016 and 2015, respectively. Paid claims were $1,670 million , $1,671 million and $1,679 million in the years ended December 31, 2017, 2016 and 2015, respectively. The vast majority of paid claims relate to prior year insured events primarily as a result of the length of time long-term care policyholders remain on claim.
152 GE 2017 FORM 10-K
FINANCIAL STATEMENTS | INVESTMENT CONTRACTS & INSURANCE | |
When insurance companies cede insurance risk to third parties, such as reinsurers, they are not relieved of their primary obligation to policyholders and cedents. When losses on ceded risks give rise to claims for recovery, we establish allowances for probable losses on such receivables from reinsurers as required. Reinsurance recoverables, net are included in the caption "Other GE Capital receivables" on our consolidated Statement of Financial Position, and amounted to $2,458 million and included $733 million related to ceded claim reserves at December 31, 2017. Reinsurance recoverables amounted to $2,038 million and included $594 million related to ceded claim reserves at December 31, 2016. In accordance with our premium deficiency test in 2017, additions to reinsurance recoverables of $2,399 million were largely offset by an allowance for losses of $2,185 million based upon our assessment of collectability. The vast majority of our remaining net reinsurance recoverables are secured by assets held in a trust for which we are the beneficiary.
We recognize reinsurance recoveries as a reduction of the consolidated Statement of Earnings (Loss) caption "Investment contracts, insurance losses and insurance annuity benefits." Reinsurance recoveries were $454 million , $370 million and $351 million in 2017, 2016 and 2015, respectively.
Our run-off insurance subsidiaries are required to prepare statutory financial statements in accordance with statutory accounting practices that differ in certain respects from GAAP. Statutory accounting practices are set forth by the National Association of Insurance Commissioners as well as state laws, regulation and general administrative rules. The premium deficiency described above was recorded on a GAAP basis. For statutory accounting purposes, the Kansas Insurance Department approved our request for a permitted accounting practice to recognize the reserve increase over a seven -year period. As a result, GE Capital expects to contribute capital to its insurance subsidiaries of approximately $3,500 million in 2018 and an additional $11,500 million through 2024 subject to ongoing monitoring by the Kansas Insurance Department. GE is required to maintain specified capital levels at these insurance subsidiaries under capital maintenance agreements.
GE 2017 FORM 10-K 153
FINANCIAL STATEMENTS | POSTRETIREMENT BENEFIT PLANS |
|
NOTE 12. POSTRETIREMENT BENEFIT PLANS
PENSION BENEFITS
We sponsor a number of pension plans, including our two principal pension plans for certain U.S. employees as well as other affiliate pension plans. We use a December 31 measurement date for these plans.
Our principal pension plans are the GE Pension Plan and the GE Supplementary Pension Plan. The GE Pension Plan is a defined benefit plan that covers approximately 240,000 retirees and beneficiaries, approximately 150,000 vested former employees and approximately 49,000 active employees. This plan is closed to new participants. The GE Supplementary Pension Plan is an unfunded plan that provides supplementary benefits to higher-level, longer-service employees. The GE Supplementary Pension Plan annuity benefit is closed to new participants and has been replaced by an installment benefit.
We also administer other pension plans, including legacy plans that were part of acquisitions. Other pension plans in 2017 included 51 U.S. and non-U.S. pension plans with assets or obligations greater than $50 million . These other pension plans cover approximately 63,000 retirees and beneficiaries, approximately 76,000 vested former employees and approximately 40,000 active employees.
On our balance sheet, we measure our plan assets at fair value and the obligations at the present value of the estimated payments to plan participants. Participants earn benefits based on their service and pay. Those estimated future payment amounts are determined based on assumptions. Differences between our actual results and what we assumed are recorded in a separate component of equity each period. These differences are amortized into earnings over the remaining average future service of active employees or the expected life of participants, as applicable, who participate in the plan.
THE COST OF OUR PLANS
The amount we report in our earnings as pension cost consists of the following components:
• | Service cost – the cost of benefits earned by active employees who participate in the plan. |
• | Prior service cost (credit) amortization – the cost of changes to our benefits plans (plan amendments) related to prior service performed. |
• | Expected return on plan assets – the return we expect to earn on plan investments used to pay future benefits. |
• | Interest cost – the accrual of interest on the pension obligations due to the passage of time. |
• | Net actuarial loss (gain) amortization – differences between our estimates, (for example, discount rate, expected return on plan assets) and our actual experience which are initially recorded in equity and amortized into earnings. |
• | Curtailment loss (gain) – earnings effects of amounts previously deferred which have been accelerated because of an event that shortens future service or eliminates benefits (for example, a sale of a business). |
Pension cost components follow.
COST OF PENSION PLANS |
|
|
|
|
|
|
|
|
|
|
| ||||||||||||||||||
|
|
|
|
|
|
|
|
|
|
|
| ||||||||||||||||||
| Total |
| Principal pension plans |
| Other pension plans | ||||||||||||||||||||||||
(In millions) | 2017 | | 2016 | | 2015 | |
| 2017 | | 2016 | | 2015 | |
| 2017 | | 2016 | | 2015 | | |||||||||
|
|
|
|
|
|
|
|
|
|
|
| ||||||||||||||||||
Service cost for benefits earned | $ | 1,629 | | $ | 1,699 | | $ | 1,840 | |
| $ | 1,055 | | $ | 1,237 | | $ | 1,424 | |
| $ | 574 | | $ | 462 | | $ | 416 | |
Prior service cost (credit) amortization | 285 | | 304 | | 205 | |
| 290 | | 303 | | 205 | |
| (5 | ) | 1 | | - | | |||||||||
Expected return on plan assets | (4,639 | ) | (4,370 | ) | (4,183 | ) |
| (3,390 | ) | (3,336 | ) | (3,302 | ) |
| (1,249 | ) | (1,034 | ) | (881 | ) | |||||||||
Interest cost on benefit obligations | 3,462 | | 3,609 | | 3,333 | |
| 2,856 | | 2,939 | | 2,778 | |
| 606 | | 670 | | 555 | | |||||||||
Net actuarial loss amortization | 3,241 | | 2,705 | | 3,577 | |
| 2,812 | | 2,449 | | 3,288 | |
| 429 | | 256 | | 289 | | |||||||||
Curtailment loss (gain) | 43 | | 50 | | 99 | |
| 64 | | 31 | | 105 | |
| (21 | ) | 19 | | (6 | ) | |||||||||
Pension cost | $ | 4,021 | | $ | 3,997 | | $ | 4,871 | |
| $ | 3,687 | | $ | 3,623 | | $ | 4,498 | |
| $ | 334 | | $ | 374 | | $ | 373 | |
ASSUMPTIONS USED IN PENSION CALCULATIONS
Accounting requirements necessitate the use of assumptions to reflect the uncertainties and the length of time over which the pension obligations will be paid. The actual amount of future benefit payments will depend upon when participants retire, the amount of their benefit at retirement and how long they live. To reflect the obligations in today's dollars, we discount the future payments using a rate that matches the time frame over which the payments will be made. We also need to assume a long-term rate of return that will be earned on investments used to fund these payments.
The assumptions used to measure our pension benefit obligations follow.
154 GE 2017 FORM 10-K
FINANCIAL STATEMENTS | POSTRETIREMENT BENEFIT PLANS |
|
ASSUMPTIONS USED TO MEASURE PENSION BENEFIT OBLIGATIONS |
|
|
|
|
| ||||||||
| Principal pension plans |
| Other pension plans (weighted average) | ||||||||||
December 31 | 2017 | | 2016 | | 2015 | |
| 2017 | | 2016 | | 2015 | |
|
|
|
|
|
|
|
| ||||||
Discount rate | 3.64 | % | 4.11 | % | 4.38 | % |
| 2.45 | % | 2.58 | % | 3.33 | % |
Compensation increases | 3.55 | | 3.80 | | 3.80 | |
| 3.12 | | 3.48 | | 3.32 | |
The discount rate used to measure the pension obligations at the end of the year is also used to measure pension cost in the following year. The assumptions used to measure pension cost follow.
ASSUMPTIONS USED TO MEASURE PENSION COST |
|
|
|
|
|
|
| ||||||
| Principal pension plans |
| Other pension plans (weighted average) | ||||||||||
December 31 | 2017 | | 2016 | | 2015 | |
| 2017 | | 2016 | | 2015 | |
|
|
|
|
|
|
|
| ||||||
Discount rate | 4.11 | % | 4.38 | % | 4.02 | % |
| 2.58 | % | 3.33 | % | 3.53 | % |
Expected return on assets | 7.50 | | 7.50 | | 7.50 | |
| 6.75 | | 6.36 | | 6.95 | |
We evaluate these assumptions annually. We evaluate other assumptions periodically, such as retirement age, mortality and turnover, and update them as necessary to reflect our actual experience and expectations for the future.
We determine the discount rate using the weighted-average yields on high-quality fixed-income securities that have maturities consistent with the timing of benefit payments. Lower discount rates increase the size of the benefit obligation and pension expense in the following year; higher discount rates reduce the size of the benefit obligation and subsequent-year pension expense.
The expected return on plan assets is the estimated long-term rate of return that will be earned on the investments used to fund the pension obligations. To determine this rate, we consider the current and target composition of plan investments, our historical returns earned, and our expectations about the future. Based on our analysis, we have assumed a 6.75% long-term expected return on GE Pension Plan assets for cost recognition in 2018. This is a reduction from the 7.50% we assumed in 2017, 2016 and 2015.
The compensation assumption is used to estimate the annual rate at which pay of plan participants will grow. If the rate of growth assumed increases, the size of the pension obligations will increase, as will the amount recorded in shareowners' equity and amortized to earnings in subsequent periods.
Further information about our pension assumptions, including a sensitivity analysis of certain assumptions for our principal pension plans, can be found in the Critical Accounting Estimates – Pension Assumptions within MD&A.
FUNDED STATUS |
|
|
|
|
| ||||||||
|
|
|
|
|
| ||||||||
| Principal pension plans |
| Other pension plans | ||||||||||
December 31 (in millions) | 2017 | | 2016 | |
| 2017 | | 2016 | | ||||
|
|
|
|
|
| ||||||||
Projected benefit obligations | $ | 74,985 | | $ | 71,501 | |
| $ | 25,303 | | $ | 22,543 | |
Fair value of plan assets | 50,361 | | 45,893 | |
| 21,224 | | 17,091 | | ||||
Underfunded | $ | 24,624 | | $ | 25,608 | |
| $ | 4,079 | | $ | 5,452 | |
GE 2017 FORM 10-K 155
FINANCIAL STATEMENTS | POSTRETIREMENT BENEFIT PLANS |
|
PROJECTED BENEFIT OBLIGATIONS (PBO) |
|
|
|
|
|
|
| ||||||||
|
|
|
|
|
|
|
| ||||||||
| Principal pension plans |
| Other pension plans |
| |||||||||||
(In millions) | 2017 | |
| 2016 | |
| 2017 | | 2016 | |
| ||||
|
|
|
|
|
|
|
| ||||||||
Balance at January 1 | $ | 71,501 | |
| $ | 68,722 | |
| $ | 22,543 | | $ | 21,618 | |
|
Service cost for benefits earned | 1,055 | |
| 1,237 | |
| 574 | | 462 | |
| ||||
Interest cost on benefit obligations | 2,856 | |
| 2,939 | |
| 606 | | 670 | |
| ||||
Participant contributions | 91 | |
| 115 | |
| 42 | | 43 | |
| ||||
Plan amendments | - | |
| - | |
| - | | (54 | ) |
| ||||
Actuarial loss (gain) | 3,300 | | (a) | 1,874 | | (b) | (181 | ) | 2,993 | | (a) | ||||
Benefits paid | (3,818 | ) |
| (3,386 | ) |
| (977 | ) | (842 | ) |
| ||||
Acquisitions (dispositions) / other - net | - | |
| - | |
| 1,321 | | (98 | ) |
| ||||
Exchange rate adjustments | - | |
| - | |
| 1,375 | | (2,249 | ) |
| ||||
Balance at December 31 | $ | 74,985 | | (c) | $ | 71,501 | | (c) | 25,303 | | 22,543 | |
| ||
(a) | Principally associated with discount rate changes. |
(b) | Principally associated with discount rate and mortality assumption changes. |
(c) | The PBO for the GE Supplementary Pension Plan, which is an unfunded plan, was $6,682 million and $6,531 million at year-end 2017 and 2016 , respectively. |
THE COMPOSITION OF OUR PLAN ASSETS
The fair value of our pension plans' investments is presented below. The inputs and valuation techniques used to measure the fair value of these assets are described in Note 1 and have been applied consistently.
| Principal pension plans |
| Other pension plans | ||||||||||
December 31 (in millions) | 2017 | | 2016 | |
| 2017 | | 2016 | | ||||
|
|
|
|
|
| ||||||||
Global equity | $ | 9,192 | | $ | 15,504 | |
| $ | 6,323 | | $ | 5,746 | |
Debt securities |
|
|
|
|
| ||||||||
Fixed income and cash investment funds | 1,200 | | 1,062 | |
| 6,242 | | 5,281 | | ||||
U.S. corporate(a) | 6,597 | | 5,252 | |
| 393 | | 319 | | ||||
Other debt securities(b) | 5,225 | | 5,066 | |
| 599 | | 577 | | ||||
Real estate | 2,125 | | 1,857 | |
| 222 | | 153 | | ||||
Private equities & other investments | 581 | | 258 | |
| 481 | | 346 | | ||||
Total | 24,920 | | 28,999 | |
| 14,260 | | 12,422 | | ||||
|
|
|
|
|
| ||||||||
Investments measured at net asset value (NAV) |
|
|
|
|
| ||||||||
Global equity | 13,790 | | 5,655 | |
| 1,871 | | 1,257 | | ||||
Debt securities | 4,107 | | 3,835 | |
| 1,247 | | 768 | | ||||
Real estate | 1,258 | | 1,387 | |
| 1,598 | | 1,296 | | ||||
Private equities & other investments | 6,286 | | 6,017 | |
| 2,248 | | 1,348 | | ||||
Total plan assets at fair value | $ | 50,361 | | $ | 45,893 | |
| $ | 21,224 | | $ | 17,091 | |
(a) | Primarily represented investment-grade bonds of U.S. issuers from diverse industries. |
(b) | Primarily represented investments in residential and commercial mortgage-backed securities, non-U.S. corporate and government bonds and U.S. government, federal agency, state and municipal debt. |
GE Pension Plan. Investments with a fair value of $2,891 million and $2,504 million in 2017 and 2016 , respectively, were classified within Level 3. The remaining investments were substantially all considered Level 1 and 2. Assets that were measured at fair value using NAV as practical expedient were excluded from the fair value hierarchy.
Other Pension Plans. Investments with a fair value of $154 million and $135 million in 2017 and 2016 , respectively, were classified within Level 3. The remaining investments were substantially all considered Level 1 and 2. Assets that were measured at fair value using NAV as practical expedient were excluded from the fair value hierarchy.
156 GE 2017 FORM 10-K
FINANCIAL STATEMENTS | POSTRETIREMENT BENEFIT PLANS |
|
FAIR VALUE OF PLAN ASSETS |
|
|
|
|
| ||||||||
|
|
|
|
|
| ||||||||
| Principal pension plans |
| Other pension plans | ||||||||||
(In millions) | 2017 | | 2016 | |
| 2017 | | 2016 | | ||||
|
|
|
|
|
| ||||||||
Balance at January 1 | $ | 45,893 | | $ | 45,720 | |
| $ | 17,091 | | $ | 17,368 | |
Actual gain on plan assets | 6,217 | | 2,892 | |
| 1,977 | | 1,743 | | ||||
Employer contributions | 1,978 | | 552 | |
| 870 | | 795 | | ||||
Participant contributions | 91 | | 115 | |
| 42 | | 43 | | ||||
Benefits paid | (3,818 | ) | (3,386 | ) |
| (977 | ) | (842 | ) | ||||
Acquisitions (dispositions) / other - net | - | | - | |
| 1,221 | | (81 | ) | ||||
Exchange rate adjustments | - | | - | |
| 1,000 | | (1,935 | ) | ||||
Balance at December 31 | $ | 50,361 | | $ | 45,893 | |
| $ | 21,224 | | $ | 17,091 | |
ASSET ALLOCATION |
|
|
|
|
| |||
|
|
|
|
|
| |||
| Principal pension plans |
| Other pension plans (weighted average) | |||||
| 2017 | 2017 | |
| 2017 | | 2017 | |
December 31 | Target allocation | Actual allocation | |
| Target allocation | | Actual allocation | |
|
|
|
|
|
| |||
Global equity | 33.5 - 53.5% | 46 | % |
| 37 | % | 39 | % |
Debt securities (including cash equivalents) | 15.0 - 58.5 | 34 | |
| 36 | | 40 | |
Real estate | 5.0 - 15.0 | 7 | |
| 10 | | 9 | |
Private equities & other investments | 6.5 - 16.5 | 13 | |
| 17 | | 12 | |
Plan fiduciaries of the GE Pension Plan set investment policies and strategies for the GE Pension Trust and oversee its investment allocation, which includes selecting investment managers and setting long-term strategic targets. The primary strategic investment objectives are balancing investment risk and return and monitoring the plan's liquidity position in order to meet the near-term benefit payment and other cash needs. Target allocation percentages are established at an asset class level by plan fiduciaries. Target allocation ranges are guidelines, not limitations, and occasionally plan fiduciaries will approve allocations above or below a target range.
According to statute, the aggregate holdings of all qualifying employer securities (e.g., GE common stock) and qualifying employer real property may not exceed 10% of the fair value of trust assets at the time of purchase. GE securities represented 1.0% and 2.1% of the GE Pension Trust assets at year end 2017 and 2016 , respectively.
The GE Pension Plan has a broadly diversified portfolio of investments in equities, fixed income, private equities and real estate; these investments are both U.S. and non-U.S. in nature. As of December 31, 2017 , no sector concentration of assets exceeded 15% of total GE Pension Plan assets.
AMOUNTS INCLUDED IN SHAREOWNERS' EQUITY
Amounts included in shareowners' equity that will be amortized in future reporting periods follow.
| Principal pension plans |
| Other pension plans | ||||||||||
December 31 (in millions) | 2017 | | 2016 | |
| 2017 | | 2016 | | ||||
|
|
|
|
|
| ||||||||
Prior service cost (credit) | $ | 784 | | $ | 1,138 | |
| $ | (100 | ) | $ | (88 | ) |
Net actuarial loss | 14,326 | | 16,664 | |
| 3,712 | | 4,800 | | ||||
Total | $ | 15,110 | | $ | 17,802 | |
| $ | 3,612 | | $ | 4,712 | |
In 2018, we estimate for our principal pension plans that we will amortize $145 million of prior service cost and $3,805 million of net actuarial loss from shareowners' equity into pension cost. For the other pension plans, the estimated prior service credits and net actuarial loss to be amortized in 2018 will be $10 million and $310 million , respectively. Comparable amounts in 2017 respectively, were $290 million and $2,812 million for our principal pension plans and $5 million and $429 million for the other pension plans.
GE 2017 FORM 10-K 157
FINANCIAL STATEMENTS | POSTRETIREMENT BENEFIT PLANS |
|
OUR FUNDING POLICY
Our policy for funding the GE Pension Plan is to contribute amounts sufficient to meet minimum funding requirements under employee benefit and tax laws. We may decide to contribute additional amounts beyond this level. We made contributions of $1,717 million and $330 million to the GE Pension Plan in 2017 and 2016, respectively. We expect to contribute approximately $6,000 million to the GE Pension Plan in 2018 . Our projected 2018 contributions satisfy our minimum ERISA funding requirement of $1,500 million and the remaining $4,500 million will be a voluntary contribution to the plan.
We expect to pay approximately $264 million for benefit payments under our GE Supplementary Pension Plan and administrative expenses of our principal pension plans and expect to contribute approximately $570 million to other pension plans in 2018 . In 2017 , comparative amounts were $261 million and $870 million , respectively.
ESTIMATED FUTURE BENEFIT PAYMENTS | ||||||||||||||||||
|
|
|
|
|
| 2023 - | | |||||||||||
(In millions) | 2018 | | 2019 | | 2020 | | 2021 | | 2022 | | 2027 | | ||||||
|
|
|
|
|
|
| ||||||||||||
Principal pension plans | $ | 3,600 | | $ | 3,685 | | $ | 3,775 | | $ | 3,850 | | $ | 3,910 | | $ | 20,510 | |
Other pension plans | 975 | | 995 | | 1,005 | | 1,020 | | 1,045 | | 5,520 | | ||||||
RETIREE HEALTH AND LIFE BENEFITS
We sponsor a number of postretirement health and life insurance benefit plans (retiree benefit plans).
Principal Retiree Benefit Plans provide health and life insurance benefits to eligible participants and these participants share in the cost of healthcare benefits. Principal retiree benefit plans cover approximately 184,000 retirees and dependents. Principal retiree benefit plans are discussed below. We use a December 31 measurement date for our plans.
COST OF PRINCIPAL RETIREE BENEFIT PLANS | |||||||||
|
|
|
| ||||||
(In millions) | 2017 | | 2016 | | 2015 | | |||
|
|
|
| ||||||
Service cost for benefits earned | $ | 94 | | $ | 123 | | $ | 145 | |
Prior service credit amortization | (171 | ) | (164 | ) | (8 | ) | |||
Expected return on plan assets | (36 | ) | (43 | ) | (48 | ) | |||
Interest cost on benefit obligations | 224 | | 249 | | 335 | | |||
Net actuarial gain amortization | (80 | ) | (50 | ) | (25 | ) | |||
Curtailment loss (gain)(a) | 4 | | - | | (225 | ) | |||
Benefit plans cost | $ | 35 | | $ | 115 | | $ | 174 | |
(a) | In 2015, gain principally resulting from life insurance amendment. |
ASSUMPTIONS USED IN BENEFIT CALCULATIONS
The accounting assumptions in the table below are those that are significant to the measurement of our benefit obligations.
ASSUMPTIONS USED TO MEASURE BENEFIT OBLIGATIONS | ||||||
|
|
|
| |||
December 31 | 2017 | | 2016 | | 2015 | |
|
|
|
| |||
Discount rate | 3.43 | % | 3.75 | % | 3.93 | % |
Compensation increases | 3.55 | | 3.80 | | 3.80 | |
Initial healthcare trend rate(a) | 6.00 | | 6.00 | | 6.00 | |
(a) | For 2017 , ultimately declining to 5% for 2030 and thereafter. |
The healthcare trend assumptions apply to our pre-65 retiree medical plans. Our post-65 retiree plan has a fixed subsidy and therefore is not subject to healthcare inflation.
The discount rate used to measure the benefit obligation at the end of the year is also used to measure benefit cost in the following year. The assumptions used to measure benefit cost follow.
158 GE 2017 FORM 10-K
FINANCIAL STATEMENTS | POSTRETIREMENT BENEFIT PLANS |
|
ASSUMPTIONS USED TO MEASURE BENEFIT COST | ||||||
|
|
|
| |||
December 31 | 2017 | | 2016 | | 2015 | |
|
|
|
| |||
Discount rate(a) | 3.75 | % | 3.93 | % | 3.89 | % |
Expected return on assets | 7.00 | | 7.00 | | 7.00 | |
(a) | Weighted average discount rates of 3.86% and 3.92% were used for determination of costs in 2016 and 2015 , respectively. |
FUNDED STATUS |
|
| ||||
|
|
| ||||
December 31 (In millions) | 2017 | | 2016 | | ||
|
|
| ||||
Accumulated postretirement benefit obligation | $ | 6,006 | | $ | 6,289 | |
Fair value of plan assets | 518 | | 575 | | ||
Underfunded | $ | 5,488 | | $ | 5,714 | |
ACCUMULATED POSTRETIREMENT BENEFIT OBLIGATION | ||||||
|
|
| ||||
(In millions) | 2017 | | 2016 | | ||
|
|
| ||||
Balance at January 1 | $ | 6,289 | | $ | 6,757 | |
Service cost for benefits earned | 94 | | 123 | | ||
Interest cost on benefit obligations | 224 | | 249 | | ||
Participant contributions | 54 | | 51 | | ||
Plan amendments | (8 | ) | (7 | ) | ||
Actuarial gain(a) | (94 | ) | (291 | ) | ||
Benefits paid | (580 | ) | (603 | ) | ||
Acquisitions (dispositions) / other - net | 27 | | 10 | | ||
Balance at December 31(b) | $ | 6,006 | | $ | 6,289 | |
(a) | In 2016, primarily associated with lower costs from new healthcare supplier contracts. |
(b) | The benefit obligation for retiree health plans was $4,084 million and $4,366 million at December 31, 2017 and 2016 , respectively. |
THE COMPOSITION OF OUR PLAN ASSETS
The fair value of principal retiree benefit plans' investments is presented below. The inputs and valuation techniques used to measure the fair value of the assets are consistently applied and described in Note 1.
December 31 (in millions) | 2017 | | 2016 | | ||
|
|
| ||||
Global equity | $ | - | | $ | 289 | |
Debt securities |
|
| ||||
Fixed income and cash investment funds | 16 | | 30 | | ||
U.S. corporate | 19 | | 38 | | ||
Other debt securities | 66 | | 82 | | ||
Private equities & other investments | 21 | | 3 | | ||
Total | 122 | | 442 | | ||
|
|
| ||||
Investments measured at net asset value (NAV) |
|
| ||||
Global equity | 321 | | 50 | | ||
Debt securities | 28 | | - | | ||
Private equities & other investments | 47 | | 83 | | ||
Total plan assets at fair value | $ | 518 | | $ | 575 | |
There were no Level 3 investments held in 2017 and 2016. These investments were all considered Level 1 and 2. Principal retiree benefit plan assets that were measured at fair value using NAV as practical expedient were excluded from the fair value hierarchy.
GE 2017 FORM 10-K 159
FINANCIAL STATEMENTS | POSTRETIREMENT BENEFIT PLANS |
|
FAIR VALUE OF PLAN ASSETS |
|
| ||||
|
|
| ||||
(In millions) | 2017 | | 2016 | | ||
|
|
| ||||
Balance at January 1 | $ | 575 | | $ | 695 | |
Actual gain on plan assets | 82 | | 22 | | ||
Employer contributions | 387 | | 410 | | ||
Participant contributions | 54 | | 51 | | ||
Benefits paid | (580 | ) | (603 | ) | ||
Balance at December 31 | $ | 518 | | $ | 575 | |
ASSET ALLOCATION | |||
|
|
| |
| 2017 | 2017 | |
December 31 | Target allocation | Actual allocation | |
|
|
| |
Global equity | 54 - 74% | 62 | % |
Debt securities (including cash equivalents) | 16 - 55 | 25 | |
Private equities & other investments | 0 - 12 | 13 | |
AMOUNTS INCLUDED IN SHAREOWNERS' EQUITY
Amounts included in shareowners' equity that will be amortized in future reporting periods follow.
December 31 (In millions) | 2017 | | 2016 | | ||
|
|
| ||||
Prior service credit | $ | (2,814 | ) | $ | (2,975 | ) |
Net actuarial gain | (732 | ) | (682 | ) | ||
Total | $ | (3,546 | ) | $ | (3,657 | ) |
The estimated prior service credit and net actuarial gain to be amortized in 2018 will be $230 million and $80 million , respectively. Comparable amounts amortized in 2017 were $171 million of prior service credit and $80 million of net actuarial gain.
OUR FUNDING POLICY
We fund retiree health benefits on a pay-as-you-go basis and the retiree life insurance trust at our discretion. We expect to contribute approximately $445 million in 2018 to fund such benefits. In 2017 , we contributed $387 million for these plans.
ESTIMATED FUTURE BENEFIT PAYMENTS | ||||||||||||||||||
|
|
|
|
|
| 2023 - | | |||||||||||
(In millions) | 2018 | | 2019 | | 2020 | | 2021 | | 2022 | | 2027 | | ||||||
|
|
|
|
|
|
| ||||||||||||
| $ | 585 | | $ | 555 | | $ | 525 | | $ | 500 | | $ | 485 | | $ | 2,090 | |
160 GE 2017 FORM 10-K
FINANCIAL STATEMENTS | POSTRETIREMENT BENEFIT PLANS |
|
2017 COST OF POSTRETIREMENT BENEFIT PLANS AND CHANGES IN OTHER COMPREHENSIVE INCOME | ||||||||||||
|
|
|
|
| ||||||||
(In millions) | Total postretirement benefit plans | | Principal pension plans | | Other pension plans | | Principal retiree benefit plans | | ||||
|
|
|
|
| ||||||||
Cost of postretirement benefit plans | $ | 4,056 | | $ | 3,687 | | $ | 334 | | $ | 35 | |
Changes in other comprehensive income |
|
|
|
| ||||||||
Prior service cost (credit) – current year | (8 | ) | - | | - | | (8 | ) | ||||
Net actuarial loss (gain) – current year | (310 | ) | 474 | | (656 | ) | (128 | ) | ||||
Reclassification out of AOCI: |
|
|
|
| ||||||||
Net curtailment gain (loss) | (88 | ) | (64 | ) | (20 | ) | (4 | ) | ||||
Prior service credit (cost) amortization | (114 | ) | (290 | ) | 5 | | 171 | | ||||
Net actuarial gain (loss) amortization | (3,161 | ) | (2,812 | ) | (429 | ) | 80 | | ||||
Total changes in other comprehensive income | (3,681 | ) | (2,692 | ) | (1,100 | ) | 111 | | ||||
Cost of postretirement benefit plans and changes in other comprehensive income | $ | 375 | | $ | 995 | | $ | (766 | ) | $ | 146 | |
2016 COST OF POSTRETIREMENT BENEFIT PLANS AND CHANGES IN OTHER COMPREHENSIVE INCOME | ||||||||||||
|
|
|
|
| ||||||||
(In millions) | Total postretirement benefit plans | | Principal pension plans | | Other pension plans | | Principal retiree benefit plans | | ||||
|
|
|
|
| ||||||||
Cost of postretirement benefit plans | $ | 4,112 | | $ | 3,623 | | $ | 374 | | $ | 115 | |
Changes in other comprehensive income |
|
|
|
| ||||||||
Prior service cost (credit) – current year | (61 | ) | - | | (54 | ) | (7 | ) | ||||
Net actuarial loss (gain) – current year | 4,038 | | 2,317 | | 1,989 | | (268 | ) | ||||
Reclassification out of AOCI: |
|
|
|
| ||||||||
Net curtailment gain (loss) | (50 | ) | (31 | ) | (19 | ) | - | | ||||
Prior service credit (cost) amortization | (140 | ) | (303 | ) | (1 | ) | 164 | | ||||
Net actuarial gain (loss) amortization | (2,655 | ) | (2,449 | ) | (256 | ) | 50 | | ||||
Total changes in other comprehensive income | 1,132 | | (466 | ) | 1,659 | | (61 | ) | ||||
Cost of postretirement benefit plans and changes in other comprehensive income | $ | 5,244 | | $ | 3,157 | | $ | 2,033 | | $ | 54 | |
2015 COST OF POSTRETIREMENT BENEFIT PLANS AND CHANGES IN OTHER COMPREHENSIVE INCOME | ||||||||||||
|
|
|
|
| ||||||||
(In millions) | Total postretirement benefit plans | | Principal pension plans | | Other pension plans | | Principal retiree benefit plans | | ||||
|
|
|
|
| ||||||||
Cost of postretirement benefit plans | $ | 5,045 | | $ | 4,498 | | $ | 373 | | $ | 174 | |
Changes in other comprehensive income |
|
|
|
| ||||||||
Prior service cost (credit) – current year | (2,401 | ) | 902 | | (12 | ) | (3,291 | ) | ||||
Net actuarial loss (gain) – current year | (1,604 | ) | (1,022 | ) | (164 | ) | (418 | ) | ||||
Reclassification out of AOCI: |
|
|
|
| ||||||||
Net curtailment gain (loss) | 76 | | (105 | ) | 6 | | 175 | | ||||
Prior service credit (cost) amortization | (197 | ) | (205 | ) | - | | 8 | | ||||
Net actuarial gain (loss) amortization | (3,552 | ) | (3,288 | ) | (289 | ) | 25 | | ||||
Total changes in other comprehensive income | (7,678 | ) | (3,718 | ) | (459 | ) | (3,501 | ) | ||||
Cost of postretirement benefit plans and changes in other comprehensive income | $ | (2,633 | ) | $ | 780 | | $ | (86 | ) | $ | (3,327 | ) |
GE 2017 FORM 10-K 161
FINANCIAL STATEMENTS | INCOME TAXES |
|
NOTE 13. INCOME TAXES
GE and GE Capital file a consolidated U.S. federal income tax return. This enables GE and GE Capital to use tax deductions and credits of one member of the group to reduce the tax that otherwise would have been payable by another member of the group. The effective tax rate reflects the benefit of these tax reductions in the consolidated return. GE makes cash payments to GE Capital for tax reductions and GE Capital pays for tax increases at the time GE's tax payments are due.
Our businesses are subject to regulation under a wide variety of U.S. federal, state and foreign tax laws, regulations and policies. Changes to these laws or regulations may affect our tax liability, return on investments and business operations.
U.S. TAX REFORM
On December 22, 2017, the U.S. enacted the Tax Cuts and Jobs Act ("U.S. tax reform") that lowers the statutory tax rate on U.S. earnings, taxes historic foreign earnings at a reduced rate of tax, establishes a territorial tax system and enacts new taxes associated with global operations.
The impact of U.S. tax reform has been recorded on a provisional basis as the legislation provides for additional guidance to be issued by the U.S. Department of the Treasury on several provisions including the computation of the transition tax. Guidance during 2018 could impact the information required for and the calculation of the transition tax charge and could affect decisions that affect the tax on various U.S. and foreign items which would further impact the final amounts included in the transition charge and impact the revaluation of deferred taxes. In addition, analysis performed and conclusions reached as part of the tax return filing process and additional guidance on accounting for U.S. tax reform could affect the provisional amount.
Additionally, as part of tax reform, the U.S. has enacted a minimum tax on foreign earnings ("global intangible low-taxed income"). Because aspects of the new law and effect on our operations is uncertain and aspects of the accounting rules associated with this provision have not been resolved, we have not made a provisional accrual for the deferred tax aspects of this provision and consequently have not made an accounting policy election on the deferred tax treatment of this tax.
As a result of enactment of U.S. tax reform, we have recorded tax expense of $3,325 million in 2017 to reflect our provisional estimate of both the transition tax on historic foreign earnings ( $1,155 million including $2,925 million at GE and $(1,770) million at GE Capital) and the revaluation of deferred taxes ( $2,170 million including $793 million at GE and $1,377 million at GE Capital).
(BENEFIT) PROVISION FOR INCOME TAXES | |||||||||
|
|
|
| ||||||
(In millions) | 2017 | | 2016 | | 2015 | | |||
|
|
|
| ||||||
GE |
|
|
| ||||||
Current tax expense (benefit) | $ | 2,810 | | $ | (140 | ) | $ | 3,307 | |
Deferred tax expense (benefit) from temporary differences | 449 | | 1,107 | | (1,800 | ) | |||
| 3,259 | | 967 | | 1,506 | | |||
GE Capital |
|
|
| ||||||
Current tax expense (benefit) | (1,008 | ) | (1,138 | ) | 2,796 | | |||
Deferred tax expense (benefit) from temporary differences | (5,294 | ) | (293 | ) | 2,183 | | |||
| (6,302 | ) | (1,431 | ) | 4,979 | | |||
Consolidated |
|
|
| ||||||
Current tax expense (benefit) | 1,802 | | (1,278 | ) | 6,103 | | |||
Deferred tax expense (benefit) from temporary differences | (4,845 | ) | 814 | | 383 | | |||
Total | $ | (3,043 | ) | $ | (464 | ) | $ | 6,485 | |
CONSOLIDATED EARNINGS (LOSS) FROM CONTINUING OPERATIONS BEFORE INCOME TAXES | |||||||||
|
|
|
| ||||||
(In millions) | 2017 | | 2016 | | 2015 | | |||
|
|
|
| ||||||
U.S. earnings | $ | (17,234 | ) | $ | 2,145 | | $ | (309 | ) |
Non-U.S. earnings | 8,443 | | 6,885 | | 8,495 | | |||
Total | $ | (8,791 | ) | $ | 9,030 | | $ | 8,186 | |
162 GE 2017 FORM 10-K
FINANCIAL STATEMENTS | INCOME TAXES |
|
CONSOLIDATED (BENEFIT) PROVISION FOR INCOME TAXES | |||||||||
|
|
|
| ||||||
(In millions) | 2017 | | 2016 | | 2015 | | |||
|
|
|
| ||||||
U.S. Federal |
|
|
| ||||||
Current | $ | (823 | ) | $ | (2,646 | ) | $ | 1,549 | |
Deferred | (4,261 | ) | (754 | ) | 492 | | |||
Non - U.S. |
|
|
| ||||||
Current | 2,286 | | 1,730 | | 4,867 | | |||
Deferred | (470 | ) | 1,239 | | (121 | ) | |||
Other | 225 | | (33 | ) | (301 | ) | |||
Total | $ | (3,043 | ) | $ | (464 | ) | $ | 6,485 | |
RECONCILIATION OF U.S. FEDERAL STATUTORY INCOME TAX RATE TO ACTUAL INCOME TAX RATE | ||||||||||||||||||||
|
|
|
|
|
|
|
|
|
|
|
| |||||||||
| Consolidated |
| GE |
| GE Capital | |||||||||||||||
| 2017 | | 2016 | | 2015 | |
| 2017 | | 2016 | | 2015 | |
| 2017 | | 2016 | | 2015 | |
|
|
|
|
|
|
|
|
|
|
|
| |||||||||
|
|
|
|
|
|
|
|
|
|
|
| |||||||||
U.S. federal statutory income tax rate | 35.0 | % | 35.0 | % | 35.0 | % |
| 35.0 | % | 35.0 | % | 35.0 | % |
| 35.0 | % | 35.0 | % | 35.0 | % |
Increase (reduction) in rate resulting from inclusion of after-tax earnings of GE Capital in before-tax earnings of GE | - | | - | | - | |
| (81.0 | ) | 4.5 | | 82.6 | |
| - | | - | | - | |
Tax on global activities including exports | 41.2 | | (23.7 | ) | 54.1 | |
| 71.0 | | (20.8 | ) | (52.8 | ) |
| 12.2 | | 4.9 | | (224.5 | ) |
U.S. business credits(a) | 5.7 | | (4.5 | ) | (4.7 | ) |
| 3.1 | | (0.9 | ) | (4.1 | ) |
| 3.2 | | 15.7 | | 9.2 | |
Tax Cuts and Jobs Act enactment | (37.8 | ) | - | | - | |
| (127.2 | ) | - | | - | |
| 3.1 | | - | | - | |
All other – net(b) | (9.5 | ) | (11.9 | ) | (5.2 | ) |
| (12.4 | ) | (7.9 | ) | (14.4 | ) |
| (3.6 | ) | 14.7 | | (1.5 | ) |
| (0.4 | ) | (40.1 | ) | 44.2 | |
| (146.5 | ) | (25.1 | ) | 11.3 | |
| 14.9 | | 35.3 | | (216.8 | ) |
Actual income tax rate | 34.6 | % | (5.1 | )% | 79.2 | % |
| (111.5 | )% | 9.9 | % | 46.3 | % |
| 49.9 | % | 70.3 | % | (181.8 | )% |
(a) | U.S. general business credits, primarily the credit for energy produced from renewable sources and the credit for research performed in the U.S. |
(b) | Includes, for each period, the expense or (benefit) for "Other" taxes reported above in the consolidated (benefit) provision for income taxes, net of 35.0% federal effect. |
Included in 2017 "All other-net" in the "Reconciliation of U.S. federal statutory income tax rate to the actual income tax rate" above is (14.7)% , (27.6)% and (3.8)% in consolidated, GE and GE Capital, respectively, related to losses on planned dispositions and asset impairments. Also included in 2017 is 7.3% and 22.0% in consolidated and GE, respectively, related to the disposition of the Water business. Included is (7.7)% and (7.1)% in consolidated and GE, respectively, related to deductible stock losses in 2016 and (4.2)% and (10.6)% in consolidated and GE, respectively, related to deductible stock losses in 2015.
As a result of the GE Capital Exit Plan, GE Capital recognized a tax expense of $6,327 million in continuing operations during 2015. This primarily consisted of $3,548 million of tax expense related to the repatriation of excess foreign cash and the write-off of deferred tax assets of $2,779 million that will no longer be supported under this plan. The write-off of deferred tax assets largely related to our Treasury operations in Ireland where it was no longer apparent that the tax benefits would be realized upon implementation of the GE Capital Exit Plan. These charges, which increased the 2015 Consolidated effective tax rate by 77.3 percentage points, are reported in the lines "Tax on global activities including exports", and "All other-net" in the "Reconciliation of U.S. federal statutory income tax rate to actual income tax rate."
GE 2017 FORM 10-K 163
FINANCIAL STATEMENTS | INCOME TAXES |
|
UNRECOGNIZED TAX POSITIONS
Annually, we file over 5,000 income tax returns in over 290 global taxing jurisdictions. We are under examination or engaged in tax litigation in many of these jurisdictions. The Internal Revenue Service (IRS) is currently auditing our consolidated U.S. income tax returns for 2012 - 2013 and has begun the audit for 2014-2015. In addition, certain other U.S. tax deficiency issues and refund claims for previous years are still unresolved. It is reasonably possible that a portion of the unresolved items could be resolved during the next 12 months, which could result in a decrease in our balance of "unrecognized tax benefits" – that is, the aggregate tax effect of differences between tax return positions and the benefits recognized in our financial statements. The IRS had disallowed the tax loss on our 2003 disposition of ERC Life Reinsurance Corporation. We contested the disallowance of this loss. In August 2016, the government approved a final settlement of the case and the balance of unrecognized tax benefits and associated interest was adjusted to reflect the agreed settlement. During 2015, the IRS completed the audit of our consolidated U.S. income tax returns for 2010-2011, except for certain issues that were completed in 2016. We believe that there are no other jurisdictions in which the outcome of unresolved issues or claims is likely to be material to our results of operations, financial position or cash flows. We further believe that we have made adequate provision for all income tax uncertainties. Resolution of audit matters, including the IRS audit of our consolidated U.S. income tax returns for 2010-2011 and the resolution of the ERC Life Reinsurance Corporation case, reduced our 2016 consolidated income tax rate by 5.3 percentage points. Resolution of audit matters, including the IRS audit of our consolidated U.S. income tax returns for 2010 - 2011 , reduced our 2015 consolidated income tax rate by 4.4 percentage points.
The balance of unrecognized tax benefits, the amount of related interest and penalties we have provided and what we believe to be the range of reasonably possible changes in the next 12 months were:
UNRECOGNIZED TAX BENEFITS | ||||||
|
|
| ||||
December 31 (In millions) | 2017 | | 2016 | | ||
|
|
| ||||
Unrecognized tax benefits | $ | 5,449 | | $ | 4,692 | |
Portion that, if recognized, would reduce tax expense and effective tax rate(a) | 3,626 | | 2,886 | | ||
Accrued interest on unrecognized tax benefits | 810 | | 615 | | ||
Accrued penalties on unrecognized tax benefits | 158 | | 118 | | ||
Reasonably possible reduction to the balance of unrecognized tax benefits in succeeding 12 months | 0-1,100 | | 0-600 | | ||
Portion that, if recognized, would reduce tax expense and effective tax rate(a) | 0-900 | | 0-500 | | ||
(a) | Some portion of such reduction may be reported as discontinued operations. |
UNRECOGNIZED TAX BENEFITS RECONCILIATION | ||||||
|
|
| ||||
(In millions) | 2017 | | 2016 | | ||
|
|
| ||||
Balance at January 1 | $ | 4,692 | | $ | 6,778 | |
Additions for tax positions of the current year | 260 | | 248 | | ||
Additions for tax positions of prior years(a) | 791 | | 521 | | ||
Reductions for tax positions of prior years | (113 | ) | (2,016 | ) | ||
Settlements with tax authorities | (57 | ) | (823 | ) | ||
Expiration of the statute of limitations | (124 | ) | (16 | ) | ||
Balance at December 31 | $ | 5,449 | | $ | 4,692 | |
(a) | For 2017, the amount shown as "additions for tax positions of prior years" included $326 million related to uncertain tax liabilities acquired in the Baker Hughes transaction. |
We classify interest on tax deficiencies as interest expense; we classify income tax penalties as provision for income taxes. For the years ended December 31, 2017 , 2016 and 2015 , $143 million , $(105) million and $48 million of interest expense (income), respectively, and $7 million , $(4) million and $(4) million of tax expense (income) related to penalties, respectively, were recognized in the Statement of Earnings (Loss).
DEFERRED INCOME TAXES
Deferred income tax balances reflect the effects of temporary differences between the carrying amounts of assets and liabilities and their tax bases, as well as from net operating loss and tax credit carryforwards, and are stated at enacted tax rates (including the U.S. tax rate of 21% beginning in 2018 as a result of U.S. tax reform) expected to be in effect when taxes are paid or recovered. Deferred income tax assets represent amounts available to reduce income taxes payable on taxable income in future years. We evaluate the recoverability of these future tax deductions and credits by assessing the adequacy of future expected taxable income from all sources, including reversal of taxable temporary differences, forecasted operating earnings and available tax planning strategies. To the extent we consider it more likely than not that a deferred tax asset will not be recovered, a valuation allowance is established.
164 GE 2017 FORM 10-K
FINANCIAL STATEMENTS | INCOME TAXES |
|
Deferred taxes, as needed, are provided for earnings of non-U.S. affiliates and associated companies when we plan to remit those earnings. We have not provided U.S. deferred taxes on cumulative earnings of non-U.S. affiliates and associated companies that have been reinvested indefinitely. Most of our earnings have been reinvested in active non-U.S. business operations and as of December 31, 2017, we have not decided to repatriate these earnings to the U.S. As a result of U.S. tax reform, substantially all of our prior unrepatriated tax earnings were subject to U.S. tax and accordingly we expect to have the ability to repatriate those earnings without additional U.S. federal tax cost and any foreign withholding taxes on a repatriation to the U.S. would potentially be partially offset by a U.S. foreign tax credit. We will update our analysis of investment of foreign earnings in 2018 as we consider the impact of U.S. tax reform.
Aggregated deferred income tax amounts are summarized below.
December 31 (In millions) | 2017 | | 2016 | | ||
|
|
| ||||
Assets |
|
| ||||
GE | $ | 15,586 | | $ | 21,106 | |
GE Capital | 6,176 | | 5,093 | | ||
| 21,762 | | 26,199 | | ||
Liabilities |
|
| ||||
GE | (10,382 | ) | (14,440 | ) | ||
GE Capital | (5,177 | ) | (9,926 | ) | ||
Eliminations | 4 | | - | | ||
| (15,555 | ) | (24,366 | ) | ||
Net deferred income tax asset (liability) | $ | 6,207 | | $ | 1,833 | |
COMPONENTS OF THE NET DEFERRED INCOME TAX ASSET (LIABILITY) | ||||||
|
|
| ||||
December 31 (In millions) | 2017 | | 2016 | | ||
|
|
| ||||
GE |
|
| ||||
Principal pension plans | $ | 3,911 | | $ | 8,963 | |
Other non-current compensation and benefits | 2,780 | | 4,230 | | ||
Provision for expenses | 2,499 | | 2,633 | | ||
Retiree insurance plans | 1,152 | | 2,000 | | ||
Non-U.S. loss carryforwards(a) | 2,078 | | 1,444 | | ||
U.S. credit carryforwards(b) | 1,932 | | 67 | | ||
Contract assets | (5,051 | ) | (6,677 | ) | ||
Intangible assets | (2,033 | ) | (2,962 | ) | ||
Depreciation | (1,022 | ) | (1,755 | ) | ||
Other – net | (1,042 | ) | (1,277 | ) | ||
| 5,204 | | 6,666 | | ||
GE Capital |
|
| ||||
Operating leases | (2,689 | ) | (3,582 | ) | ||
Financing leases | (877 | ) | (1,632 | ) | ||
Energy investments | (754 | ) | (1,410 | ) | ||
Intangible assets | (25 | ) | (125 | ) | ||
U.S. credit carryforwards(b) | 1,632 | | 1,092 | | ||
Insurance company loss reserves | 1,373 | | (819 | ) | ||
Non-U.S. loss carryforwards(a) | 1,271 | | 1,323 | | ||
Other – net | 1,068 | | 320 | | ||
| 999 | | (4,833 | ) | ||
Eliminations | 4 | | - | | ||
Net deferred income tax asset (liability) | $ | 6,207 | | $ | 1,833 | |
(a) | Net of valuation allowances of $4,251 million and $2,450 million for GE and $448 million and $391 million for GE Capital, for 2017 and 2016 , respectively. Of the net deferred tax asset as of December 31, 2017 of $3,349 million , $11 million relates to net operating loss carryforwards that expire in various years ending from December 31, 2018 through December 31, 2020; $342 million relates to net operating losses that expire in various years ending from December 31, 2021 through December 31, 2037 and $2,996 million relates to net operating loss carryforwards that may be carried forward indefinitely. |
(b) | Of the net deferred tax asset as of December 31, 2017 of $3,564 million for U.S. credit carryforwards, $1,194 million expires in the year ending December 31, 2027, $67 million expires in the years ending December 31, 2030 through 2032 and $2,303 million expires in various years ending from December 31, 2033 through December 31, 2037. |
GE 2017 FORM 10-K 165
FINANCIAL STATEMENTS | SHAREOWNERS' EQUITY |
|
NOTE 14. SHAREOWNERS' EQUITY
(In millions) | 2017 | | 2016 | | 2015 | | |||
| | | | ||||||
Preferred stock issued | $ | 6 | | $ | 6 | | $ | 6 | |
Common stock issued | $ | 702 | | $ | 702 | | $ | 702 | |
Accumulated other comprehensive income (loss) | | | | ||||||
Balance at January 1 | $ | (18,598 | ) | $ | (16,529 | ) | $ | (18,172 | ) |
Other comprehensive income (loss) before reclassifications |
|
|
| ||||||
Investment securities - net of deferred taxes of $(335), $84, $(270)(a) | (627) | 170 | (486) | ||||||
Currency translation adjustments (CTA) - net of deferred taxes of $(537), $719, $1,348 | 866 | (1,606) | (4,932) | ||||||
Cash flow hedges - net of deferred taxes of $31, $(41), $(21) | 171 | (234) | (732) | ||||||
Benefit plans - net of deferred taxes of $32, $(1,016), $1,506 | 550 | (2,946) | 2,768 | ||||||
Total | $ | 960 | | $ | (4,616 | ) | $ | (3,382 | ) |
Reclassifications from other comprehensive income |
|
|
| ||||||
Investment securities - net of deferred taxes of $(81), $30, $(36)(b) | (149 | ) | 34 | | (67 | ) | |||
Currency translation gains (losses) on dispositions - net of deferred taxes of $(543), $241, $(1,489)(b) | 1,332 | | 294 | | 1,794 | | |||
Cash flow hedges - net of deferred taxes of $(28), $37, $86(c) | (120 | ) | 327 | | 831 | | |||
Benefit plans - net of deferred taxes of $1,111, $966, $1,260(d) | 2,232 | | 1,878 | | 2,397 | | |||
Total(e) | $ | 3,295 | | $ | 2,533 | | $ | 4,955 | |
Other comprehensive income (loss) | 4,255 | | (2,083 | ) | 1,575 | | |||
Less other comprehensive income (loss) attributable to noncontrolling interests | 53 | | (14 | ) | (69 | ) | |||
Other comprehensive income (loss), net, attributable to GE | $ | 4,202 | | $ | (2,069 | ) | $ | 1,644 | |
Balance at December 31 | $ | (14,396 | ) | $ | (18,598 | ) | $ | (16,529 | ) |
Other capital | | | | ||||||
Balance at January 1 | $ | 37,224 | | $ | 37,613 | | $ | 32,889 | |
Gains (losses) on treasury stock dispositions and other(f)(g) | (53 | ) | (389 | ) | 4,724 | | |||
Balance at December 31 | $ | 37,171 | | $ | 37,224 | | $ | 37,613 | |
Retained earnings | | | | ||||||
Balance at January 1 | $ | 139,532 | | $ | 140,020 | | $ | 155,333 | |
Net earnings (loss) attributable to the Company | (5,786 | ) | 8,831 | | (6,126 | ) | |||
Dividends and other transactions with shareowners | (7,741 | ) | (9,054 | ) | (9,161 | ) | |||
Redemption value adjustment on redeemable noncontrolling interests(h) | (322 | ) | (266 | ) | (25 | ) | |||
Balance at December 31 | $ | 125,682 | | $ | 139,532 | | $ | 140,020 | |
Common stock held in treasury | | | | ||||||
Balance at January 1 | $ | (83,038 | ) | $ | (63,539 | ) | $ | (42,593 | ) |
Purchases(i)(j) | (3,849 | ) | (22,073 | ) | (23,762 | ) | |||
Dispositions | 1,985 | | 2,574 | | 2,816 | | |||
Balance at December 31 | $ | (84,902 | ) | $ | (83,038 | ) | $ | (63,539 | ) |
Total equity | | | | ||||||
GE shareowners' equity balance | $ | 64,263 | | $ | 75,828 | | $ | 98,274 | |
Noncontrolling interests balance | 17,723 | | 1,663 | | 1,864 | | |||
Total equity balance at December 31 | $ | 81,986 | | $ | 77,491 | | $ | 100,138 | |
(a) | Included adjustments of $(1,259) million , $(57) million and $611 million in 2017, 2016 and 2015, respectively, to deferred acquisition costs, present value of future profits, and investment contracts, insurance liabilities and annuity benefits in our run-off insurance operations to reflect the effects that would have been recognized had the related unrealized investment securities holding gains and losses been realized. See Note 11 for further information. |
(b) | Recorded in total revenues and other income and income taxes in benefit (provision) for income taxes in the Statement of Earnings (Loss). Currency translation gains (losses) on dispositions included $483 million , $211 million and $1,730 million in 2017, 2016 and 2015, respectively, in earnings (loss) from discontinued operations, net of taxes. |
(c) | Cash flow hedges primarily includes impact of foreign exchange contracts and gains (losses) on interest rate derivatives, primarily recorded in GE Capital revenue from services, interest and other financial charges and other costs and expenses. See Note 19 for further information . |
(d) | Primarily includes amortization of actuarial gains (losses), amortization of prior service cost and curtailment gain (loss). These components are included in the computation of net periodic pension cost. See Note 12 for further information. |
(e) | Included $784 million after-tax reclassification of AOCI to additional paid in capital as a result of recognition of noncontrolling interest in GE Oil & Gas as part of Baker Hughes transaction in 2017. |
(f) | Included $4,949 million related to issuance of new preferred stock in exchange for existing GE Capital preferred stock in 2015 . |
(g) | Included $(126) million decrease in additional paid in capital in 2017 as a result of Baker Hughes transaction. See Note 8 for further information. |
(h) | Amount of redemption value adjustment on redeemable noncontrolling interest shown net of deferred taxes. |
(i) | Included $(20,383) million related to the split-off of Synchrony Financial from GE, where GE shares were exchanged for shares of Synchrony Financial in 2015 . |
(j) | Included $(11,370) million of GE shares purchased under accelerated share repurchase (ASR) agreements in 2016 . |
166 GE 2017 FORM 10-K
FINANCIAL STATEMENTS | SHAREOWNERS' EQUITY |
|
SHARES OF GE PREFERRED STOCK
On January 20, 2016, we issued $5,694 million of GE Series D preferred stock following an exchange offer for existing GE series A, B and C. The Series D preferred stock bear a fixed interest rate of 5.00% through January 21, 2021 and floating rate equal to three-month LIBOR plus 3.33% thereafter. The Series D preferred stock are callable on January 21, 2021. Following the exchange offer, $250 million of GE Series A, B and C preferred stock still remain outstanding with an initial average fixed dividend rate of 4.07% . The total carrying value of GE preferred stock at December 31, 2017 was $5,424 million and will increase to $5,944 million through periodic accretion. Dividends on GE preferred stock are payable semi-annually, in June and December and accretion is recorded on a quarterly basis. Dividends on GE preferred stock totaled $ 436 million, including cash dividends of $ 295 million, $ 656 million, including cash dividends of $ 332 million and $ 18 million, including cash dividends of $ 8 million, for the years ended December 31, 2017, 2016 and 2015, respectively.
In conjunction with the exchange of the GE Capital preferred stock into GE preferred stock and the exchange of Series A, B and C preferred stock into Series D preferred stock, GE Capital issued preferred stock to GE for which the amount and terms mirror the GE preferred stock held by external investors ( $5,424 million carrying value at December 31, 2017 ).
GE has 50.0 million authorized shares of preferred stock ( $1.00 par value). 5,939,874 , 5,944,250 and 5,944,250 shares are outstanding as of December 31, 2017 , 2016 and 2015 , respectively.
SHARES OF GE COMMON STOCK
On April 10, 2015, we announced a new repurchase program of up to $50.0 billion in common stock, excluding the Synchrony Financial exchange we completed in 2015 . Under our share purchase programs, on a book basis, we repurchased shares of 129.0 million , 725.8 million and 109.8 million for a total of $3,783 million , $22,005 million and $3,320 million for the years ended 2017 , 2016 , and 2015 , respectively.
During 2016 , we repurchased $11,370 million of our common stock under accelerated share repurchase (ASR) agreements.
On November 17, 2015, we completed the split-off of Synchrony Financial through which we acquired 671,366,809 shares of GE common stock from our shareholders in exchange for 705,270,833 shares of Synchrony Financial stock we held.
GE's authorized common stock consists of 13,200,000,000 shares having a par value of $0.06 each.
Common shares issued and outstanding are summarized in the following table.
December 31 (In thousands) | 2017 | 2016 | 2015 |
|
|
|
|
Issued | 11,693,841 | 11,693,841 | 11,693,841 |
In treasury | (3,013,270) | (2,951,227) | (2,314,553) |
Outstanding | 8,680,571 | 8,742,614 | 9,379,288 |
NONCONTROLLING INTERESTS
Noncontrolling interests in equity of consolidated affiliates includes common shares in consolidated affiliates and preferred stock issued by our affiliates.
Prior to the fourth quarter of 2015 , the preferred stock issued by GECC was classified as noncontrolling interests in our consolidated Statement of Financial Position, with dividends presented as noncontrolling interest in our consolidated Statement of Earnings (Loss). This preferred stock was converted to a corresponding series of preferred stock issued by GE and on January 20, 2016 a substantial majority of those shares were exchanged into GE Series D preferred stock. Effective with these changes, the preferred stock issued by GE is reflected in our shareowners' equity and dividends are presented as a reduction of net earnings attributable to GE in the Statement of Earnings (Loss) (under the caption "Preferred stock dividends").
GE 2017 FORM 10-K 167
FINANCIAL STATEMENTS | SHAREOWNERS' EQUITY |
|
CHANGES TO NONCONTROLLING INTERESTS | |||||||||
|
|
|
| ||||||
(In millions) | 2017 | | 2016 | | 2015 | | |||
|
|
|
| ||||||
Balance at January 1 | $ | 1,663 | | $ | 1,864 | | $ | 8,674 | |
Net earnings (loss) | (17 | ) | (46 | ) | 377 | | |||
GECC preferred stock(a) | - | | - | | (4,949 | ) | |||
GECC preferred stock dividend | - | | - | | (311 | ) | |||
Dividends | (222 | ) | (72 | ) | (43 | ) | |||
Dispositions | (92 | ) | (232 | ) | 189 | | |||
Synchrony Financial(b) | - | | - | | (2,840 | ) | |||
Other (including AOCI)(c)(d)(e)(f)(g) | 16,390 | | 150 | | 767 | | |||
Balance at December 31 | $ | 17,723 | | $ | 1,663 | | $ | 1,864 | |
(a) | In 2015 , included $(4,949) million related to the issuance of GE preferred stock in exchange for existing GECC preferred stock. GE preferred stock is reflected in shareowners' equity in the consolidated Statement of Financial Position. |
(b) | Related to the split-off of Synchrony Financial from GE in 2015, where GE shares were exchanged for shares of Synchrony Financial; related to the Synchrony Financial IPO in 2014 . |
(c) | In 2017, included $16,462 million related to Baker Hughes transaction. See Note 8 for further information. |
(d) | In 2016 , included $155 million related to Arcam AB acquisition in our Aviation segment . |
(e) | In 2016 , included $(123) million for deconsolidation of investment funds managed by GE Asset Management (GEAM) upon the adoption of ASU 2015-2, Amendments to the Consolidation Analysis . |
(f) | In 2015, included $695 million related to the Alstom acquisition . |
(g) | Includes research & development partner funding arrangements, acquisitions and eliminations. |
REDEEMABLE NONCONTROLLING INTERESTS
Redeemable noncontrolling interest presented in our Statement of Financial Position includes common shares issued by our affiliates that are redeemable at the option of the holder of those interests.
As part of the Alstom acquisition, in 2015 we formed three joint ventures in grid technology, renewable energy, and global nuclear and French steam power. Noncontrolling interests in these joint ventures hold certain redemption rights. Our retained earnings will be adjusted for subsequent changes in the redemption value of the noncontrolling interest in these entities to the extent that the redemption value exceeds the carrying amount of the noncontrolling interest.
Alstom holds redemption rights with respect to its interest in the grid technology and renewable energy joint ventures, which, if exercised, would require us to purchase all of their interest during September 2018 or September 2019. Alstom also holds similar redemption rights for the global nuclear and French steam power joint venture that are exercisable during the first quarter of 2021 or the first quarter of 2022. The redemption price would generally be equal to Alstom's initial investment plus annual accretion of 3% for the grid technology and renewable energy joint ventures and plus annual accretion of 2% for the nuclear and French steam power joint venture, with potential upside sharing based on an EBITDA multiple. Alstom also holds additional redemption rights in other limited circumstances as well as a call option to require GE to sell all of its interests in the renewable energy joint venture at the higher of fair value or Alstom's initial investment plus annual accretion of 3% during the month of May in the years 2017 through 2019 and also upon a decision to IPO the joint venture.
In January 2018, Alstom informed us that they intend to exercise their redemption rights with respect to the grid technology and renewable energy joint ventures in September 2018. The minimum price that GE would be required to pay, pursuant to the agreements, to purchase Alstom's interest at that time would be a net amount of €1,828 million for the grid technology joint venture and €636 million for the renewable energy joint venture. Alstom has also informed us that they intend to exercise their redemption rights with respect to the global nuclear and French steam power joint venture in the first quarter of 2021.
GE holds a call option on Alstom's interest in the global nuclear and French steam power joint venture at the same amount as Alstom's redemption price in the event that Alstom exercises its put option in the grid technology or renewable energy joint ventures. GE also has call options on Alstom's interest in the three joint ventures in other limited circumstances. In addition, the French Government holds a preferred interest in the global nuclear and French steam power joint venture, giving it certain protective rights.
168 GE 2017 FORM 10-K
FINANCIAL STATEMENTS | SHAREOWNERS' EQUITY |
|
CHANGES TO REDEEMABLE NONCONTROLLING INTERESTS | |||||||||
|
|
|
| ||||||
(In millions) | 2017 | | 2016 | | 2015 | | |||
|
|
|
| ||||||
Balance at January 1 | $ | 3,025 | | $ | 2,972 | | $ | 98 | |
Net earnings (loss) | (254 | ) | (244 | ) | (46 | ) | |||
Dividends | (62 | ) | (17 | ) | (11 | ) | |||
Redemption value adjustment | 353 | | 266 | | 25 | | |||
Other(a)(b) | 337 | | 49 | | 2,906 | | |||
Balance at December 31(c) | $ | 3,399 | | $ | 3,025 | | $ | 2,972 | |
(a) | In 2016, included $204 million related to the Concept Laser GmbH acquisition in our Aviation segment. |
(b) | Includes impact of foreign currency changes. |
(c) | Included $3,065 million , $2,709 million and $2,859 million related to Alstom joint ventures for the years ended December 31, 2017, 2016 and 2015. respectively. |
OTHER
Dividends from GE Capital to GE totaled $4,105 million , including cash dividends of $4,016 million , $20,118 million and $4,311 million for the years ended December 31, 2017 , 2016 and 2015 , respectively.
NOTE 15. OTHER STOCK-RELATED INFORMATION
SHARE-BASED COMPENSATION
We grant stock options, restricted stock units and performance share units to employees under the 2007 Long-Term Incentive Plan. Grants made under all plans must be approved by the Management Development and Compensation Committee of GE's Board of Directors, which is composed entirely of independent directors.
STOCK OPTIONS
Under our stock option program, an employee receives an award that provides the opportunity in the future to purchase GE shares at the market price of our stock on the date the award is granted (the strike price). The options become exercisable in equal amounts over a five -year vesting period and expire 10 years from the grant date if they are not exercised. Stock options have no financial statement effect on the date they are granted but rather are reflected over time through recording compensation expense and increasing shareowners' equity. We record compensation expense based on the estimated fair value of the awards expected to vest, and that amount is amortized as compensation expense on a straight-line basis over the five -year vesting period. Accordingly, total expense related to the award is reduced by the fair value of options that are expected to be forfeited by employees that leave GE prior to vesting. We estimate forfeitures based on our experience and adjust the expense to reflect actual forfeitures over the vesting period. The offset to the expense we record is reflected as an increase in the "Other capital" component of shareowners' equity.
(In millions, after tax) | 2017 | | 2016 | | 2015 | | |||
|
|
|
| ||||||
Compensation expense | $ | 146 | | $ | 207 | | $ | 234 | |
We estimate the fair value of each stock option award on the date of grant using a Black-Scholes option pricing model. The table below provides the weighted-average grant-date fair values, key assumptions and other inputs into the pricing model. With the exception of the dividend yield assumption, an increase in any individual assumption will increase the estimated fair value of the option, all other things being equal.
GE 2017 FORM 10-K 169
FINANCIAL STATEMENTS | OTHER STOCK-RELATED INFORMATION | |
| 2017 | | 2016 | | 2015 | | |||
|
|
|
| ||||||
Weighted-average grant-date fair value of stock options | $ | 3.81 | | $ | 3.61 | | $ | 4.64 | |
|
|
|
| ||||||
Stock Option Valuation Assumptions: |
|
|
| ||||||
Risk-free interest rate | 2.3 | % | 1.4 | % | 2.0 | % | |||
Dividend yield | 3.3 | % | 3.4 | % | 3.4 | % | |||
Expected volatility | 28.0 | % | 20.0 | % | 25.0 | % | |||
Expected option life (in years) | 6.3 | | 6.5 | | 6.8 | | |||
|
|
|
| ||||||
Other pricing model inputs: |
|
|
| ||||||
Weighted-average grant-date market price of GE stock (strike price) | $ | 18.97 | | $ | 29.63 | | $ | 25.79 | |
The table below shows the amount and weighted-average strike price of options granted during 2017 , as well as those outstanding and exercisable at year-end 2017 .
As of December 31, 2017 unless, otherwise stated (in thousands, except per-share data) |
| ||
|
| ||
Stock options granted during 2017 | 30,611 | | |
Weighted-average strike price of awards granted in 2017 | $ | 18.97 | |
Stock options outstanding | 398,571 | | |
Weighted-average strike price of stock options outstanding | $ | 21.91 | |
Stock options exercisable | 309,190 | | |
Weighted-average strike price of stock options exercisable | $ | 21.25 | |
When an employee exercises an option, we issue treasury shares to satisfy the requirements of the option.
| 2017 | | 2016 | | 2015 | | |||
|
|
|
| ||||||
Stock options exercised (in thousands) | 30,774 | | 56,973 | | 65,764 | | |||
Cash received from stock options exercised (in millions) | $ | 528 | | $ | 1,037 | | $ | 1,098 | |
Outstanding stock option awards may be dilutive to earnings per share when they are in the money (i.e., the market price of GE stock is greater than the strike price of the option). When an option is dilutive, it increases the number of shares used in the diluted earnings per share calculation, which will decrease earnings per share. However, the effect stock options have on the number of shares added to the diluted earnings per share calculation is not one-for-one. The average amount of unrecognized compensation expense (the portion of the fair value of these option awards not yet amortized) and the market price of GE stock during the reporting period affect how many of these potential shares are included in the calculation. The calculation assumes that the proceeds received from the exercise and the unrecognized compensation expense are used to buy back shares, which reduces the dilutive impact.
As of December 31, 2017 , there was $329 million of unrecognized compensation expense related to unvested options, which will be amortized over the remaining vesting period (the weighted-average period is approximately 2 years). Of that total, approximately $103 million , after tax, is estimated to be recorded as compensation expense in 2018.
The dilutive effect of in-the-money options on our earnings per share from continuing operations has been $0.01 or less per share ( 1% or less) for the last three years. See Note 16 for further information about earnings per share.
RESTRICTED STOCK
A restricted stock award provides an employee with the right to receive shares of GE stock when the restrictions lapse, which occurs in equal amounts over the vesting period. Upon vesting, each unit of restricted stock is converted into GE common stock on a one-for-one basis using treasury stock shares. The expense to be recognized on a restricted stock unit is based upon the market price on the grant date (which is its fair value) multiplied by the number of units expected to vest. Accordingly, total expense related to the award is reduced by the fair value of restricted stock units that are expected to be forfeited by employees that leave GE prior to lapse of the restrictions. That amount is amortized as compensation expense on a straight-line basis over a five -year vesting period. We estimate forfeitures based on our experience and adjust the expense to reflect actual forfeitures over the vesting period. The offset to compensation expense is an increase in the "Other capital" component of shareowners' equity.
170 GE 2017 FORM 10-K
FINANCIAL STATEMENTS | OTHER STOCK-RELATED INFORMATION | |
(In millions, after tax) | 2017 | | 2016 | | 2015 | | |||
|
|
|
| ||||||
Compensation expense(a) | $ | 95 | | $ | 90 | | $ | 72 | |
(a) | Included $(6) million of compensation expense related to performance share units in 2017 . |
The fair value of a restricted stock unit at the grant date is equal to the market price of our stock on the grant date.
| 2017 | | 2016 | | 2015 | | |||
|
|
|
| ||||||
Weighted-average grant-date fair value of restricted stock awards | $ | 24.89 | | $ | 30.20 | | $ | 26.74 | |
As of December 31, 2017, unless otherwise stated (in thousands, except per-share data) |
| ||
|
| ||
Restricted stock units granted during 2017 | 7,715 | | |
Non-vested restricted stock units outstanding | 17,233 | | |
Weighted-average fair value at grant date of non-vested stock | $ | 26.94 | |
The table below provides information about the units of restricted stock that vested for each of the years presented.
(In thousands) | 2017 | | 2016 | | 2015 | |
|
|
|
| |||
Restricted stock units vested during the year ended | 6,490 | | 4,427 | | 3,899 | |
As of December 31, 2017 , there was $336 million of total unrecognized compensation expense related to unvested restricted stock units, which will be amortized over the remaining vesting period (the weighted-average period is approximately 2 years). Of that total, approximately $89 million , after tax, is estimated to be recorded as compensation expense in 2018.
OTHER INFORMATION
When options are exercised and restricted stock units vest, we issue shares from treasury stock, which increases shares outstanding. The "Other capital" component of shareowners' equity is adjusted for differences between the strike price of GE stock and the average cost of our treasury stock. We also record the difference between the tax benefits assumed (based on the fair value of the award on the grant date) and the actual tax benefit in our provision for income taxes. Any excess tax benefit is recorded as cash flows from operating activities in our Statement of Cash Flows. The table below provides information about tax benefits related to all share-based compensation arrangements.
(In millions) | 2017 | | 2016 | | 2015 | | |||
|
|
|
| ||||||
Income tax benefit recognized in earnings | $ | 138 | | $ | 274 | | $ | 148 | |
Excess of actual tax deductions over amounts assumed recognized in equity(a) | - | | - | | 167 | | |||
(a) | We adopted ASU 2016-09 in September 2016. The primary effects of adoption were the recognition of excess tax benefits in our provision for income taxes rather than paid-in capital and the reclassification of cash flows related to excess tax benefits from financing activities to operating activities for the periods beginning January 1, 2016. See Note 1 for further information. |
Share-based compensation programs serve as a means to attract and retain talented employees and are an important element of their total compensation. The intrinsic value of a stock option award is the amount by which the award is in the money and represents the potential value to the employee upon exercise of the option. The intrinsic value of restricted stock units is the value of the shares awarded at the current market price. The table below provides information about the intrinsic value of option and restricted stock awards.
As of December 31, 2017, unless otherwise stated (in millions) | Aggregate intrinsic value | | |
|
| ||
Stock options outstanding | $ | 235 | |
Stock options exercised in 2017 | 326 | | |
Non-vested restricted stock units outstanding | 301 | | |
Restricted stock units vested in 2017 | 167 | | |
GE 2017 FORM 10-K 171
FINANCIAL STATEMENTS | EARNINGS PER SHARE & OTHER INCOME | |
NOTE 16. EARNINGS PER SHARE INFORMATION
| 2017 |
| 2016 |
| 2015 | |||||||||||||||
(In millions; per-share amounts in dollars) | Diluted | | Basic | | | Diluted | | Basic | | | Diluted | | Basic | | ||||||
|
|
|
|
|
|
|
|
| ||||||||||||
Amounts attributable to the Company: |
|
|
|
|
|
|
|
| ||||||||||||
Consolidated |
|
|
|
|
|
|
|
| ||||||||||||
Earnings (loss) from continuing operations for per-share calculation(a)(b) | $ | (5,495 | ) | $ | (5,495 | ) |
| $ | 9,764 | | $ | 9,769 | |
| $ | 1,680 | | $ | 1,679 | |
Preferred stock dividends | (436 | ) | (436 | ) |
| (656 | ) | (656 | ) |
| (18 | ) | (18 | ) | ||||||
Earnings (loss) from continuing operations attributable to common shareowners for per-share calculation(a)(b) | $ | (5,931 | ) | $ | (5,931 | ) |
| $ | 9,108 | | $ | 9,113 | |
| $ | 1,662 | | $ | 1,661 | |
Earnings (loss) from discontinued operations for per-share calculation(a)(b) | (328 | ) | (328 | ) |
| (955 | ) | (950 | ) |
| (7,795 | ) | (7,795 | ) | ||||||
Net earnings (loss) attributable to GE common shareowners for per-share calculation(a)(b) | $ | (6,246 | ) | $ | (6,246 | ) |
| $ | 8,157 | | $ | 8,163 | |
| $ | (6,135 | ) | $ | (6,135 | ) |
|
|
|
|
|
|
|
|
| ||||||||||||
Average equivalent shares |
|
|
|
|
|
|
|
| ||||||||||||
Shares of GE common stock outstanding | 8,687 | | 8,687 | |
| 9,025 | | 9,025 | |
| 9,944 | | 9,944 | | ||||||
Employee compensation-related shares (including stock options) and warrants | - | | - | |
| 105 | | - | |
| 72 | | - | | ||||||
Total average equivalent shares | 8,687 | | 8,687 | |
| 9,130 | | 9,025 | |
| 10,016 | | 9,944 | | ||||||
|
|
|
|
|
|
|
|
| ||||||||||||
Per-share amounts |
|
|
|
|
|
|
|
| ||||||||||||
Earnings (loss) from continuing operations | $ | (0.68 | ) | $ | (0.68 | ) |
| $ | 1.00 | | $ | 1.01 | |
| $ | 0.17 | | $ | 0.17 | |
Earnings (loss) from discontinued operations | (0.04 | ) | (0.04 | ) |
| (0.10 | ) | (0.11 | ) |
| (0.78 | ) | (0.78 | ) | ||||||
Net earnings (loss) | (0.72 | ) | (0.72 | ) |
| 0.89 | | 0.90 | |
| (0.61 | ) | (0.62 | ) | ||||||
Our unvested restricted stock unit awards that contain non-forfeitable rights to dividends or dividend equivalents are considered participating securities and, therefore, are included in the computation of earnings per share pursuant to the two-class method. Application of this treatment had an insignificant effect.
(a) | Included a dilutive adjustment of an insignificant amount of dividend equivalents in each of the three years presented. |
(b) | Included in 2016 is a dilutive adjustment for the change in income for forward purchase contracts that may be settled in stock. |
As a result of of the loss from continuing operations for the year ended December 31, 2017, all of the outstanding stock awards, approximately 119 million , were not included in the computation of diluted earnings (loss) per share because their effect was antidilutive. For the years ended December 31, 2016 and 2015, approximately 22 million and 97 million , respectively, of outstanding stock awards were not included in the computation of diluted earnings per share because their effect was antidilutive.
Earnings-per-share amounts are computed independently for earnings (loss) from continuing operations, earnings (loss) from discontinued operations and net earnings (loss). As a result, the sum of per-share amounts from continuing operations and discontinued operations may not equal the total per-share amounts for net earnings.
NOTE 17. OTHER INCOME
(In millions) | 2017 | | 2016 | | 2015 | | |||
|
|
|
| ||||||
GE |
|
|
| ||||||
Purchases and sales of business interests(a) | $ | 656 | | $ | 3,701 | | $ | 1,020 | |
Licensing and royalty income | 193 | | 175 | | 168 | | |||
Associated companies | 202 | | 76 | | 45 | | |||
Net interest and investment income | 299 | | 167 | | 65 | | |||
Other items(b) | 86 | | (27 | ) | 868 | | |||
| 1,436 | | 4,092 | | 2,165 | | |||
Eliminations | 189 | | (87 | ) | 62 | | |||
Total | $ | 1,625 | | $ | 4,005 | | $ | 2,227 | |
(a) | Included a pre-tax gain of $1,943 million on the sale of our Water business, partially offset by a valuation allowance on businesses classified as held for sale of $1,378 million in 2017. Included a pre-tax gain of $3,136 million on the sale of our Appliances business and $398 million on the sale of GE Asset Management in 2016. Included a pre-tax gain of $623 million on the sale of our Signaling business in 2015. See Note 2. |
(b) | In 2015, included a $450 million from a settlement related to the NBCU transaction and a $175 million break-up fee from Electrolux. Included net gains on asset sales of $ 59 million, $ 101 million and $ 90 million in 2017 , 2016 and 2015 , respectively. |
172 GE 2017 FORM 10-K
FINANCIAL STATEMENTS | FAIR VALUE MEASUREMENT | |
NOTE 18. FAIR VALUE MEASUREMENTS
RECURRING FAIR VALUE MEASUREMENTS
Our assets and liabilities measured at fair value on a recurring basis include investment securities mainly supporting obligations to annuitants and policyholders in our run-off insurance operations and derivatives.
ASSETS AND LIABILITIES MEASURED AT FAIR VALUE ON A RECURRING BASIS |
|
| |||||||||||||
|
|
|
|
|
| ||||||||||
(In millions) | Level 1(a) | | Level 2(a) | | Level 3(b) | | Netting adjustment | | Net balance(c) | | |||||
December 31, 2017 |
|
|
|
|
| ||||||||||
Assets |
|
|
|
|
| ||||||||||
Investment securities | $ | 158 | | $ | 34,126 | | $ | 4,413 | | $ | - | | $ | 38,696 | |
Derivatives | - | | 3,343 | | 21 | | (2,986 | ) | 378 | | |||||
Total | $ | 158 | | $ | 37,469 | | $ | 4,433 | | $ | (2,986 | ) | $ | 39,074 | |
|
|
|
|
|
| ||||||||||
Liabilities |
|
|
|
|
| ||||||||||
Derivatives | $ | - | | $ | 2,354 | | $ | 7 | | $ | (2,034 | ) | $ | 327 | |
Other(d) | - | | 999 | | - | | - | | 999 | | |||||
Total | $ | - | | $ | 3,353 | | $ | 7 | | $ | (2,034 | ) | $ | 1,325 | |
|
|
|
|
|
| ||||||||||
December 31, 2016 |
|
|
|
|
| ||||||||||
Assets |
|
|
|
|
| ||||||||||
Investment securities | $ | 188 | | $ | 39,719 | | $ | 4,406 | | $ | - | | $ | 44,313 | |
Derivatives | - | | 5,444 | | 23 | | (5,121 | ) | 345 | | |||||
Total | $ | 188 | | $ | 45,163 | | $ | 4,429 | | $ | (5,121 | ) | $ | 44,658 | |
Liabilities |
|
|
|
|
| ||||||||||
Derivatives | $ | - | | $ | 4,880 | | $ | 2 | | $ | (4,449 | ) | $ | 434 | |
Other(d) | - | | 1,143 | | - | | - | | 1,143 | | |||||
Total | $ | - | | $ | 6,024 | | $ | 2 | | $ | (4,449 | ) | $ | 1,577 | |
(a) | There were no significant transfers between Level 1 and Level 2 for the years ended December 31, 2017 and 2016. |
(b) | Included debt securities classified within Level 3 of $3,629 million of U.S. corporate and $614 million of Government and agencies securities at December 31, 2017, and $3,399 million of U.S. corporate and $688 million of Non-U.S. corporate securities at December 31, 2016. |
(c) | See Notes 3 and 19 for further information on the composition of our investment securities and derivative portfolios. |
(d) | Primarily represents the liabilities associated with certain of our deferred incentive compensation plans. |
LEVEL 3 INSTRUMENTS
The majority of our Level 3 balances consist of investment securities classified as available-for-sale with changes in fair value recorded in shareowners' equity.
(In millions) | Balance at January 1 | | Net realized/ unrealized gains (losses included in earnings(a) | | Net realized/ unrealized gains (losses included in in AOCI | | Purchase(b) | | Sales | | Settlements | | Transfers into Level 3 | | Transfers out of Level 3 | | Balance at December 31 | | |||||||||
2017 |
|
|
|
|
|
|
|
|
| ||||||||||||||||||
Investment securities | $ | 4,406 | | $ | 54 | | $ | 66 | | $ | 1,108 | | $ | (38 | ) | $ | (641 | ) | $ | 32 | | $ | (575 | ) | $ | 4,413 | |
Derivatives | 21 | | (2 | ) | (1 | ) | - | | - | | (9 | ) | 4 | | 1 | | 14 | | |||||||||
Total | $ | 4,427 | | $ | 51 | | $ | 65 | | $ | 1,108 | | $ | (38 | ) | $ | (650 | ) | $ | 37 | | $ | (574 | ) | $ | 4,427 | |
2016 |
|
|
|
|
|
|
|
|
| ||||||||||||||||||
Investment securities | $ | 3,695 | | $ | 11 | | $ | 51 | | $ | 973 | | $ | (152 | ) | $ | (166 | ) | $ | 34 | | $ | (39 | ) | $ | 4,406 | |
Derivatives | 88 | | (18 | ) | - | | 1 | | - | | (59 | ) | - | | 8 | | 21 | | |||||||||
Other | 259 | | - | | - | | - | | - | | - | | - | | (259 | ) | - | | |||||||||
Total | $ | 4,042 | | $ | (7 | ) | $ | 51 | | $ | 974 | | $ | (152 | ) | $ | (226 | ) | $ | 35 | | $ | (290 | ) | $ | 4,427 | |
(a) | Earnings effects are primarily included in the "GE Capital revenues from services" and "Interest and other financial charges" captions in the Statement of Earnings (Loss). |
(b) | Included $675 million and $468 million of U.S. corporate debt securities for the years ended December 31, 2017 and 2016. |
GE 2017 FORM 10-K 173
FINANCIAL STATEMENTS | FAIR VALUE MEASUREMENT | |
The following table represents nonrecurring fair value amounts (as measured at the time of the adjustment) for those assets remeasured to fair value on a nonrecurring basis during the fiscal year and still held at December 31, 2017 and 2016.
| Remeasured during the years ended December 31 | ||||||||||||
| 2017 |
| 2016 | ||||||||||
(In millions) | Level 2 | Level 3 |
| Level 2 | Level 3 | ||||||||
|
|
|
|
|
| ||||||||
Financing receivables and financing receivables held for sale | $ | - | | $ | 1,541 | |
| $ | - | | $ | 30 | |
Cost and equity method investments | - | | 2,076 | |
| - | | 103 | | ||||
Long-lived assets | 177 | | 591 | |
| 17 | | 1,055 | | ||||
Goodwill | - | | - | |
| - | | - | | ||||
Total | $ | 177 | | $ | 4,208 | |
| $ | 17 | | $ | 1,189 | |
The following table represents the fair value adjustments to assets measured at fair value on a nonrecurring basis and still held at December 31, 2017 and 2016.
December 31 (In millions) | 2017 | | 2016 | | ||
|
|
| ||||
Financing receivables and financing receivables held for sale | $ | (207 | ) | $ | (14 | ) |
Cost and equity method investments | (891 | ) | (44 | ) | ||
Long-lived assets | (819 | ) | (196 | ) | ||
Goodwill | (2,564 | ) | - | | ||
Total | $ | (4,482 | ) | $ | (254 | ) |
LEVEL 3 MEASUREMENTS - SIGNIFICANT UNOBSERVABLE INPUTS | ||||||
|
|
|
|
| ||
(Dollars in millions) | Fair value | Valuation technique | Unobservable inputs | Range (weighted-average) | ||
|
|
|
|
| ||
December 31, 2017 |
|
|
|
| ||
Recurring fair value measurements |
|
|
|
| ||
Investment securities(b) | $ | 903 | | Income approach | Discount rate(a) | 3.0%-12.6% (6.2%) |
|
|
|
|
| ||
Nonrecurring fair value measurements | ||||||
Financing receivables | $ | 1,532 | | Income approach | Discount rate(a) | 3.2%-16.5% (10.0%) |
|
|
|
|
| ||
Cost and equity method investments | 2,037 | | Income approach | Discount rate(a) | 5.0%-50.00% (7.7%) | |
|
|
|
|
| ||
Long-lived assets | 554 | | Income approach | Discount rate(a) | 2.7%-18.0% (7.3%) | |
|
|
|
|
| ||
|
|
|
|
| ||
December 31, 2016 |
|
|
|
| ||
Recurring fair value measurements |
|
|
|
| ||
Investment securities(b) | $ | 830 | | Income approach | Discount rate(a) | 1.4%-17.4% (7.9%) |
|
|
|
|
| ||
|
|
|
|
| ||
Nonrecurring fair value measurements |
|
|
|
| ||
Financing receivables | $ | 30 | | Income approach | Discount rate(a) | 2.5%-30.0% (20.3%) |
|
|
|
|
| ||
Cost and equity method investments | 94 | | Income approach, | Discount rate(a) | 9.0%-30.0% (11.8%) | |
|
|
|
|
| ||
Long-lived assets | 683 | | Income approach | Discount rate(a) | 2.5%-20.0% (10.4%) | |
(a) | Discount rates are determined based on inputs that market participants would use when pricing investments, including credit and liquidity risk. An increase in the discount rate would result in a decrease in the fair value. |
(b) | Comprises substantially all of U.S. corporate securities |
At December 31, 2017 and December 31, 2016 , other Level 3 recurring fair value measurements of $3,517 million and $3,598 million , respectively, and nonrecurring measurements of $83 million and $379 million , respectively, are valued using non-binding broker quotes or other third-party sources. Other recurring and nonrecurring fair value measurements were individually insignificant and utilize a number of different unobservable inputs not subject to meaningful aggregation.
174 GE 2017 FORM 10-K
FINANCIAL STATEMENTS | FINANCIAL INSTRUMENTS | |
NOTE 19. FINANCIAL INSTRUMENTS
The following table provides information about assets and liabilities not carried at fair value. The table excludes finance leases and non-financial assets and liabilities. Substantially all of the assets discussed below are considered to be Level 3. The vast majority of our liabilities' fair values can be determined based on significant observable inputs and thus considered Level 2. Few of the instruments are actively traded and their fair values must often be determined using financial models. Realization of the fair value of these instruments depends upon market forces beyond our control, including marketplace liquidity.
| 2017 |
| 2016 | ||||||||||
December 31 (In millions) | Carrying | | Estimated | |
| Carrying | | Estimated | | ||||
|
|
|
|
|
| ||||||||
GE |
|
|
|
|
| ||||||||
Assets |
|
|
|
|
| ||||||||
Investments and notes receivable | $ | 1,341 | | $ | 1,418 | |
| $ | 1,526 | | $ | 1,595 | |
Liabilities |
|
|
|
|
| ||||||||
Borrowings(a)(b) | 34,473 | | 35,416 | |
| 19,184 | | 19,923 | | ||||
Borrowings (debt assumed)(a)(c) | 47,114 | | 53,502 | |
| 60,109 | | 66,998 | | ||||
|
|
|
|
|
| ||||||||
GE Capital |
|
|
|
|
| ||||||||
Assets |
|
|
|
|
| ||||||||
Loans | 17,363 | | 17,331 | |
| 21,060 | | 20,830 | | ||||
Other commercial mortgages | 1,489 | | 1,566 | |
| 1,410 | | 1,472 | | ||||
Loans held for sale | 3,274 | | 3,274 | |
| 473 | | 473 | | ||||
Other financial instruments(d) | 112 | | 147 | |
| 121 | | 150 | | ||||
Liabilities |
|
|
|
|
| ||||||||
Borrowings(a)(e)(f)(g) | 55,353 | | 60,415 | |
| 58,523 | | 62,024 | | ||||
Investment contracts | 2,569 | | 2,996 | |
| 2,813 | | 3,277 | | ||||
(a) | See Note 10. |
(b) | Included $217 million and $115 million of accrued interest in estimated fair value at December 31, 2017 and December 31, 2016 , respectively. |
(c) | Included $696 million and $803 million of accrued interest in estimated fair value at December 31, 2017 and December 31, 2016 , respectively. |
(d) | Principally comprises cost method investments. |
(e) | Fair values exclude interest rate and currency derivatives designated as hedges of borrowings. Had they been included, the fair value of borrowings at December 31, 2017 and December 31, 2016 would have been reduced by $1,754 million and $2,397 million , respectively. |
(f) | Included $731 million and $775 million of accrued interest in estimated fair value at December 31, 2017 and December 31, 2016 , respectively. |
(g) | Excluded $39,844 million and $58,780 million of net intercompany payable to GE at December 31, 2017 and December 31, 2016 , respectively. |
A description of how we estimate fair values follows:
Loans. Based on a discounted future cash flows methodology, using current market interest rate data adjusted for inherent credit risk or quoted market prices and recent transactions, if available.
Borrowings. Based on valuation methodologies using current market interest rate data that are comparable to market quotes adjusted for our non-performance risk or quoted market prices and recent transactions, if available.
Investment contracts. Based on expected future cash flows, discounted at currently offered rates for immediate annuity contracts or the income approach for single premium deferred annuities.
All other instruments. Based on observable market transactions and/or valuation methodologies using current market interest rate data adjusted for inherent credit risk.
Assets and liabilities that are reflected in the accompanying financial statements at fair value are not included in the above disclosures; such items include cash and equivalents, investment securities and derivative financial instruments.
Additional information about notional amounts of loan commitments follows.
GE 2017 FORM 10-K 175
FINANCIAL STATEMENTS | FINANCIAL INSTRUMENTS | |
NOTIONAL AMOUNTS OF LOAN COMMITMENTS |
|
| ||||
|
|
| ||||
December 31 (In millions) | 2017 | | 2016 | | ||
|
|
| ||||
Ordinary course of business lending commitments(a) | $ | 1,105 | | $ | 687 | |
Unused revolving credit lines | 198 | | 238 | | ||
(a) | Excluded investment commitments of $677 million and $522 million at December 31, 2017 and December 31, 2016 , respectively. |
DERIVATIVES AND HEDGING
FORMS OF HEDGING
In this section we explain the hedging methods we use and their effects on our financial statements.
Cash flow hedges – We use cash flow hedging primarily to reduce or eliminate the effects of foreign exchange rate changes on purchase and sale contracts in our industrial businesses and to convert foreign currency debt that we have issued in our financial services business back to our functional currency .
Under hedge accounting, the derivative carrying amount is measured at fair value each period and any resulting gain or loss is recorded in a separate component of shareowners' equity. Differences between the derivative and the hedged item may cause changes in their fair values to not offset completely, which is referred to as ineffectiveness. When the hedged transaction occurs, these amounts are released from shareowners' equity, in order that the transaction will be reflected in earnings at the rate locked in by the derivative. The effect of the hedge is reported in the same financial statement line item as the earnings effects of the hedged transaction .
As part of our ongoing effort to reduce borrowings, we may repurchase debt that was in a cash flow hedge accounting relationship. At the time of determining that the debt cash flows are probable of not occurring any related OCI will be released to earnings .
The following table explains the effect of changes in market rates on the fair value of derivatives we use most commonly in cash flow hedging arrangements.
Interest rate forwards/swaps | Interest rate increases | Interest rate decreases |
Pay fixed rate/receive floating rate | Fair value increases | Fair value decreases |
|
|
|
Currency forwards/swaps | U.S. dollar strengthens | U.S. dollar weakens |
Pay U.S. dollars/receive foreign currency | Fair value decreases | Fair value increases |
|
|
|
Commodity derivatives | Price increases | Price decreases |
Receive commodity/ pay fixed price | Fair value increases | Fair value decreases |
Fair value hedges – These derivatives are used to hedge the effects of interest rate and currency exchange rate changes on debt that we have issued .
Under hedge accounting, the derivative is measured at fair value and the carrying amount of the hedged debt is adjusted for the change in value related to the exposure being hedged, with both adjustments offset to earnings as interest expense. For example, the earnings effect of an increase in the fair value of the derivative will be largely offset by the earnings effect of an increase in the carrying amount of the hedged debt. Differences between the terms of the derivative and the hedged debt may cause changes in their fair values to not offset completely, which is referred to as ineffectiveness .
The effect of changes in market interest rates on the fair value of derivatives we use most commonly in fair value hedging arrangements is presented below .
Interest rate forwards/swaps | Interest rate increases | Interest rate decreases |
Pay floating rate/receive fixed rate | Fair value decreases | Fair value increases |
Net investment hedges – We invest in foreign operations that conduct their financial services activities in currencies other than the U.S. dollar. We hedge the currency risk associated with those investments primarily using non-derivative instruments such as debt denominated in a foreign currency and short-term currency exchange contracts under which we receive U.S. dollars and pay foreign currency.
176 GE 2017 FORM 10-K
FINANCIAL STATEMENTS | FINANCIAL INSTRUMENTS | |
Under hedge accounting, the portion of the fair value change of the derivative or debt instrument that relates to changes in spot currency exchange rates is offset in a separate component of shareowners' equity. For example, an increase in the fair value of the derivative related to changes in spot exchange rates will be offset by a corresponding increase in the currency translation component of shareowners' equity. The portion of the fair value change of the derivative related to differences between spot and forward rates, which primarily relates to the interest component, is recorded in earnings each period as interest expense. As a result of this hedging strategy, the investments in foreign operations of our financial services business are largely unaffected by changes in currency exchange rates. The amounts recorded in shareowners' equity only affect earnings if the hedged investment is sold, substantially liquidated, or control is lost .
The effect of changes in currency exchange rates on the fair value of derivatives we use in net investment hedging arrangements is presented below.
Currency forwards/swaps | U.S. dollar strengthens | U.S. dollar weakens |
Receive U.S. dollars/pay foreign currency | Fair value increases | Fair value decreases |
Economic Hedges - These derivatives are not designated as hedges from an accounting standpoint (and therefore we do not apply hedge accounting to the relationship) but otherwise serve the same economic purpose as other hedging arrangements. We use economic hedges when we have exposures to currency exchange risk for which we are unable to meet the requirements for hedge accounting or when changes in the carrying amount of the hedged item are already recorded in earnings in the same period as the derivative making hedge accounting unnecessary. Even though the derivative is an effective economic hedge, there may be a net effect on earnings in each period due to differences in the timing of earnings recognition between the derivative and the hedged item .
These derivatives are marked to fair value through earnings each period. For our financial services business, these gains and losses are reported in "GE Capital revenues from services". For our industrial businesses, the effects are reported in "Other income" or "Other costs and expenses". The offsetting earnings effects associated with hedged assets and liabilities are also displayed in the table below. In general, the earnings effects of the hedged item are recorded in the same financial statement line as the derivative. The earnings effect of economic hedges, after considering offsets related to earnings effects of hedged assets and liabilities, is substantially offset by changes in the fair value of forecasted transactions that have not yet affected earnings .
The table below explains the effects of market rate changes on the fair value of derivatives we use most commonly as economic hedges.
Interest rate forwards/swaps interest rate | Interest rate increases | Interest rate decreases |
Pay floating rate/receive fixed rate | Fair value decreases | Fair value increases |
|
|
|
Currency forwards/swaps | U.S. dollar strengthens | U.S. dollar weakens |
Pay U.S. dollars/receive foreign currency | Fair value decreases | Fair value increases |
Receive U.S. dollars/pay foreign currency | Fair value increases | Fair value decreases |
|
|
|
Commodity derivatives | Price increases | Price decreases |
Receive commodity/ pay fixed price | Fair value increases | Fair value decreases |
NOTIONAL AMOUNT OF DERIVATIVES
The notional amount of a derivative is the number of units of the underlying (for example, the notional principal amount of the debt in an interest rate swap). The notional amount is used to compute interest or other payment streams to be made under the contract and is a measure of our level of activity. We generally disclose derivative notional amounts on a gross basis. The majority of the outstanding notional amount of $187 billion at December 31, 2017 is related to managing interest rate and currency risk between financial assets and liabilities in our financial services business. The remaining derivative notional amount primarily relates to hedges of anticipated sales and purchases in foreign currency, commodity purchases and contractual terms in contracts that are considered embedded derivatives .
The table below provides additional information about how derivatives are reflected in our financial statements. Derivative assets and liabilities are recorded at fair value exclusive of interest earned or owed on interest rate derivatives, which is presented separately on our Statement of Financial Position. Cash collateral and securities held as collateral represent assets that have been provided by our derivative counterparties as security for amounts they owe us (derivatives that are in an asset position) .
GE 2017 FORM 10-K 177
FINANCIAL STATEMENTS | FINANCIAL INSTRUMENTS | |
FAIR VALUE OF DERIVATIVES | |||||||||||||
|
|
|
|
|
| ||||||||
| 2017 |
| 2016 | ||||||||||
December 31 (in millions) | Assets | | Liabilities | |
| Assets | | Liabilities | | ||||
|
|
|
|
|
| ||||||||
Derivatives accounted for as hedges |
|
|
|
|
| ||||||||
Interest rate contracts | $ | 1,862 | | $ | 148 | |
| $ | 3,106 | | $ | 210 | |
Currency exchange contracts | 160 | | 70 | |
| 402 | | 624 | | ||||
Other contracts | - | | - | |
| - | | - | | ||||
| $ | 2,021 | | $ | 218 | |
| $ | 3,508 | | $ | 834 | |
|
|
|
|
|
| ||||||||
Derivatives not accounted for as hedges |
|
|
|
|
| ||||||||
Interest rate contracts | 93 | | 8 | |
| 62 | | 20 | | ||||
Currency exchange contracts | 1,111 | | 2,043 | |
| 1,778 | | 4,011 | | ||||
Other contracts | 139 | | 91 | |
| 119 | | 17 | | ||||
| $ | 1,343 | | $ | 2,143 | |
| $ | 1,958 | | $ | 4,048 | |
|
|
|
|
|
| ||||||||
Gross derivatives recognized in statement of financial position |
|
|
|
|
| ||||||||
Gross derivatives | 3,364 | | 2,361 | |
| 5,467 | | 4,883 | | ||||
Gross accrued interest | 469 | | (38 | ) |
| 768 | | (24 | ) | ||||
| $ | 3,833 | | $ | 2,323 | |
| $ | 6,234 | | $ | 4,859 | |
|
|
|
|
|
| ||||||||
Amounts offset in statement of financial position |
|
|
|
|
| ||||||||
Netting adjustments(a) | (1,457 | ) | (1,456 | ) |
| (3,097 | ) | (3,094 | ) | ||||
Cash collateral(b) | (1,529 | ) | (578 | ) |
| (2,025 | ) | (1,355 | ) | ||||
| $ | (2,986 | ) | $ | (2,034 | ) |
| $ | (5,121 | ) | $ | (4,449 | ) |
|
|
|
|
|
| ||||||||
Net derivatives recognized in statement of financial position |
|
|
|
|
| ||||||||
Net derivatives | 847 | | 289 | |
| 1,113 | | 410 | | ||||
|
|
|
|
|
| ||||||||
Amounts not offset in statement of financial position |
|
|
|
|
| ||||||||
Securities held as collateral(c) | (405 | ) | - | |
| (442 | ) | - | | ||||
|
|
|
|
|
| ||||||||
Net amount | $ | 441 | | $ | 289 | |
| $ | 671 | | $ | 410 | |
Derivatives are classified in the captions "All other assets" and "All other liabilities" and the related accrued interest is classified in "Other GE Capital receivables" and "All other liabilities" in our Statement of Financial Position.
(a) | The netting of derivative receivables and payables is permitted when a legally enforceable master netting agreement exists. Amounts include fair value adjustments related to our own and counterparty non-performance risk. At December 31, 2017 and December 31, 2016 , the cumulative adjustment for non-performance risk was $(1) million and $(3) million , respectively. |
(b) | Excluded excess cash collateral received and posted of $10 million and $255 million at December 31, 2017 , respectively, and $6 million and $177 million at December 31, 2016 , respectively. |
(c) | Excluded excess securities collateral received of $16 million and zero at December 31, 2017 and December 31, 2016 , respectively. |
178 GE 2017 FORM 10-K
FINANCIAL STATEMENTS | FINANCIAL INSTRUMENTS | |
EFFECTS OF DERIVATIVES ON EARNINGS
All derivatives are marked to fair value on our balance sheet, whether they are designated in a hedging relationship for accounting purposes or are used as economic hedges. As discussed in the previous sections, each type of hedge affects the financial statements differently. In fair value and economic hedges, both the hedged item and the hedging derivative largely offset in earnings each period. In cash flow and net investment hedges, the effective portion of the hedging derivative is offset in separate components of shareowners' equity and ineffectiveness is recognized in earnings. The table below summarizes these offsets and the net effect on pre-tax earnings.
(In millions) | Effect on hedging instrument | | Effect on underlying | | Effect on earnings(a) | | |||
|
|
|
| ||||||
2017 |
|
|
| ||||||
Cash flow hedges | $ | 199 | | $ | (199 | ) | $ | - | |
Fair value hedges | (556 | ) | 371 | | (185 | ) | |||
Net investment hedges(b) | (1,833 | ) | 1,852 | | 19 | | |||
Economic hedges(c) | 1,147 | | (1,683 | ) | (536 | ) | |||
Total |
|
| $ | (702 | ) | ||||
2016 |
|
|
| ||||||
Cash flow hedges | $ | (274 | ) | $ | 274 | | $ | 1 | |
Fair value hedges | 170 | | (433 | ) | (263 | ) | |||
Net investment hedges(b) | 2,458 | | (2,376 | ) | 82 | | |||
Economic hedges(c) | (2,132 | ) | 1,784 | | (348 | ) | |||
Total |
|
| $ | (528 | ) | ||||
The amounts in the table above generally do not include associated derivative accruals in income or expense.
(a) | For cash flow and fair value hedges, the effect on earnings is primarily related to ineffectiveness. For net investment hedges, the effect on earnings is related to ineffectiveness and spot-forward differences. |
(b) | Both non-derivatives and derivatives hedging instruments are included. The carrying value of non-derivative instruments designated as net investment hedges was $(13,028) million and $(13,355) million at December 31, 2017 and December 31, 2016, respectively. Total pre-tax reclassifications from CTA to gain (loss) was $125 million and $(528) million in 2017 and 2016, respectively. Total pre-tax reclassifications from CTA to gain (loss) included $125 million and $(529) million recorded in discontinued operations in 2017 and 2016, respectively. |
(c) | Net effect is substantially offset by the change in fair value of the hedged item that will affect earnings in future periods. |
Changes in the fair value of cash flow hedges are recorded in a separate component of equity (referred to below as Accumulated Other Comprehensive Income, or AOCI) and are recorded in earnings in the period in which the hedged transaction occurs. The table below summarizes this activity by hedging instrument.
CASH FLOW HEDGE ACTIVITY |
| ||||||||||||||||||
|
|
|
|
|
|
|
| ||||||||||||
| Gain (loss) recognized in AOCI |
| Gain (loss) reclassified from AOCI into earnings | ||||||||||||||||
(In millions) | 2017 | | 2016 | | 2015 | |
| 2017 | | 2016 | | 2015 | | ||||||
|
|
|
|
|
|
|
| ||||||||||||
Interest rate contracts | $ | 4 | | $ | 6 | | $ | (1 | ) |
| $ | (27 | ) | $ | (79 | ) | $ | (130 | ) |
Currency exchange contracts | 195 | | (281 | ) | (907 | ) |
| 176 | | (282 | ) | (784 | ) | ||||||
Commodity contracts | - | | - | | (5 | ) |
| - | | (2 | ) | (4 | ) | ||||||
Total(a) | $ | 199 | | $ | (274 | ) | $ | (913 | ) |
| $ | 149 | | $ | (364 | ) | $ | (918 | ) |
(a) | Gain (loss) is recorded in "GE Capital revenues from services", "Interest and other financial charges", and "Other costs and expenses" in our Statement of Earnings (Loss) when reclassified. |
The total pre-tax amount in AOCI related to cash flow hedges of forecasted transactions was a $98 million gain at December 31, 2017 . We expect to transfer $30 million loss to earnings as an expense in the next 12 months contemporaneously with the earnings effects of the related forecasted transactions. In all the twelve months ended 2017 , 2016 and 2015 , we recognized insignificant gains and losses related to hedged forecasted transactions and firm commitments that did not occur by the end of the originally specified period. At December 31, 2017 , 2016 and 2015 , the maximum term of derivative instruments that hedge forecasted transactions was 15 years, 16 years and 17 years, respectively.
For cash flow hedges, the amount of ineffectiveness in the hedging relationship and amount of the changes in fair value of the derivatives that are not included in the measurement of ineffectiveness were insignificant for each reporting period.
GE 2017 FORM 10-K 179
FINANCIAL STATEMENTS | FINANCIAL INSTRUMENTS | |
COUNTERPARTY CREDIT RISK
Fair values of our derivatives can change significantly from period to period based on, among other factors, market movements and changes in our positions. We manage counterparty credit risk (the risk that counterparties will default and not make payments to us according to the terms of our agreements) on an individual counterparty basis. Where we have agreed to netting of derivative exposures with a counterparty, we net our exposures with that counterparty and apply the value of collateral posted to us to determine the exposure. We actively monitor these net exposures against defined limits and take appropriate actions in response, including requiring additional collateral.
As discussed above, we have provisions in certain of our master agreements that require counterparties to post collateral (typically, cash or U.S. Treasury securities) when our receivables due from the counterparties, measured at current market value, exceeds specified limits. The fair value of such collateral was $1,935 million at December 31, 2017 , of which $1,529 million was cash and $405 million was in the form of securities held by a custodian for our benefit. Under certain of these same agreements, we post collateral to our counterparties for our derivative obligations, the fair value of cash collateral posted was $578 million at December 31, 2017 . At December 31, 2017 , our exposure to counterparties (including accrued interest), net of collateral we hold, was $361 million . This excludes exposures related to embedded derivatives.
Additionally, our master agreements typically contain mutual downgrade provisions that provide the ability of each party to require termination if the long-term credit rating of the counterparty were to fall below A-/A3 or other ratings levels agreed upon with the counterparty. In certain of these master agreements, each party also has the ability to require termination if the short-term rating of the counterparty were to fall below A-1/P-1. Our master agreements also typically contain provisions that provide termination rights upon the occurrence of certain other events, such as a bankruptcy or events of default by one of the parties. If an agreement was terminated under any of these circumstances, the termination amount payable would be determined on a net basis and could also take into account any collateral posted. The net amount of our derivative liability, after consideration of collateral posted by us and outstanding interest payments was $213 million at December 31, 2017 . This excludes exposure related to embedded derivatives.
NOTE 20. VARIABLE INTEREST ENTITIES (VIE)
A VIE is an entity that has one of three characteristics: (1) it is controlled by someone other than its shareowners or partners, (2) its shareowners or partners are not economically exposed to the entity's earnings (for example, they are protected against losses), or (3) it was thinly capitalized when it was formed.
In the normal course of our business we become involved with VIEs either because we help create them or we invest in them. Our VIEs either provide goods and services to customers or provide financing to third parties for the purchase of GE goods and services. If we control the VIE, we consolidate it and provide disclosures below. However, if the VIE is a business and use of its assets is not limited to settling its liabilities, ongoing disclosures are not required.
CONSOLIDATED VARIABLE INTEREST ENTITIES
Our most significant consolidated VIEs are four joint ventures that were formed in conjunction with acquisitions. The newest of these, BHGE LLC was formed as part of the Baker Hughes transaction. BHGE LLC owns the operating assets of GE Oil & Gas and Baker Hughes. BHGE LLC is a VIE as we hold an economic interest of approximately 62.5% in the partnership, but we hold no voting or participating rights through our direct economic ownership. The assets and liabilities of BHGE VIEs are not included in the information below. BHGE LLC is a SEC Registrant with separate filing requirements with the SEC and its separate financial information can be obtained from www.sec.gov.
The remaining three joint ventures were formed as part of the Alstom acquisition.These joint ventures include grid technology, renewable energy, and global nuclear and French steam power and have combined assets, liabilities and redeemable noncontrolling interest as of December 31, 2017 and 2016 of $16,344 million , $11,463 million and $3,065 million and $14,460 million , $9,922 million and $2,709 million , respectively. These joint ventures are considered VIEs because the equity held by Alstom does not participate fully in the earnings of the ventures due to the contractual features allowing Alstom to sell their interests back to GE (see Note 14 for further information). We consolidate these ventures because we control all their significant activities. These joint ventures are in all other respects regular businesses and are therefore exempt from ongoing disclosure requirements for VIEs provided below.
The table below provides information about VIEs that are subject to ongoing disclosure requirements. Substantially all of these entities were created to help our customers finance the purchase of GE goods and services or to purchase GE current and customer notes receivable originating from sales of goods and services. These entities have no features that could expose us to losses that would significantly exceed the difference between the consolidated assets and liabilities.
180 GE 2017 FORM 10-K
FINANCIAL STATEMENTS | VARIABLE INTEREST ENTITIES | |
ASSETS AND LIABILITIES OF CONSOLIDATED VIEs | ||||||||||||
| | | | | ||||||||
| | GE Capital | | |||||||||
| | Customer | | | ||||||||
(In millions) | GE | Notes receivables(a) | Other | Total | | |||||||
|
|
|
|
| ||||||||
December 31, 2017 |
|
|
|
| ||||||||
Assets |
|
|
|
| ||||||||
Financing receivables, net | $ | - | | $ | - | | $ | 792 | | $ | 792 | |
Current receivables | 59 | | 570 | | - | | 630 | | ||||
Investment securities | - | | - | | 918 | | 918 | | ||||
Other assets | 586 | | 1,182 | | 1,920 | | 3,688 | | ||||
Total | $ | 646 | | $ | 1,752 | | $ | 3,630 | | $ | 6,028 | |
|
|
|
|
| ||||||||
Liabilities |
|
|
|
| ||||||||
Borrowings | $ | 39 | | $ | - | | $ | 1,027 | | $ | 1,066 | |
Non-recourse borrowings | - | | 669 | | 16 | | 685 | | ||||
Other liabilities | 345 | | 1,021 | | 1,525 | | 2,891 | | ||||
Total | $ | 384 | | $ | 1,690 | | $ | 2,568 | | $ | 4,642 | |
|
|
|
|
| ||||||||
December 31, 2016 |
|
|
|
| ||||||||
Assets |
|
|
|
| ||||||||
Financing receivables, net | $ | - | | $ | - | | $ | 1,035 | | $ | 1,035 | |
Current receivables | 57 | | 670 | | - | | 727 | | ||||
Investment securities | - | | - | | 982 | | 982 | | ||||
Other assets | 492 | | 1,122 | | 1,747 | | 3,361 | | ||||
Total | $ | 549 | | $ | 1,792 | | $ | 3,764 | | $ | 6,105 | |
|
|
|
|
| ||||||||
Liabilities |
|
|
|
| ||||||||
Borrowings | $ | 1 | | $ | - | | $ | 818 | | $ | 819 | |
Non-recourse borrowings | - | | 401 | | 16 | | 417 | | ||||
Other liabilities | 457 | | 1,378 | | 1,482 | | 3,317 | | ||||
Total | $ | 458 | | $ | 1,779 | | $ | 2,316 | | $ | 4,553 | |
(a) | Two funding entities were established to purchase customer notes receivable from GE, one of which is partially funded by third-party debt. |
Total revenues from our consolidated VIEs were $1,057 million , $1,141 million and $1,638 million for the years ended December 31, 2017 , 2016 and 2015 , respectively. Related expenses consisted primarily of cost of goods and services of $338 million , $692 million and $1,232 million for the years ended December 31, 2017 , 2016 and 2015 , respectively.
Where we provide servicing for third-party investors, we are contractually permitted to commingle cash collected from customers on financing receivables sold to third-party investors with our own cash prior to payment to third-party investors, provided our short-term credit rating does not fall below A-1/P1. These third-party investors also owe us amounts for purchased financial assets and scheduled interest and principal payments. At December 31, 2017 and 2016 , the amounts of commingled cash owed to the third-party investors were $119 million and $20 million , respectively.
UNCONSOLIDATED VARIABLE INTEREST ENTITIES
We become involved with unconsolidated VIEs primarily through assisting in the formation and financing of the entity. We do not consolidate these entities because we do not have power over decisions that significantly affect their economic performance. Our investments in unconsolidated VIEs, at December 31, 2017 and 2016 were $5,833 million and $5,953 million , respectively. Obligations to make additional investments in these entities are not significant.
GE 2017 FORM 10-K 181
FINANCIAL STATEMENTS | COMMITMENTS, GUARANTEES, PRODUCT WARRANTIES AND OTHER LOSS CONTINGENCIES | |
NOTE 21. COMMITMENTS, GUARANTEES, PRODUCT WARRANTIES AND OTHER LOSS CONTINGENCIES
COMMITMENTS
The GE Capital Aviation Services (GECAS) business in GE Capital had placed multiple-year orders for various Boeing, Airbus and other aircraft manufacturers with list prices approximating $37,352 million and secondary orders with airlines for used aircraft of approximately $2,583 million at December 31, 2017 . In our Aviation segment, we had committed to provide financing assistance of $2,059 million of future customer acquisitions of aircraft equipped with our engines.
GUARANTEES
Our guarantees are provided in the ordinary course of business. We underwrite these guarantees considering economic, liquidity and credit risk of the counterparty. We believe that the likelihood is remote that any such arrangements could have a significant adverse effect on our financial position, results of operations or liquidity. We record liabilities for guarantees at estimated fair value, generally the amount of the premium received, or if we do not receive a premium, the amount based on appraisal, observed market values or discounted cash flows. Any associated expected recoveries from third parties are recorded as other receivables, not netted against the liabilities.
At December 31, 2017 , we were committed under the following guarantee arrangements beyond those provided on behalf of VIEs. See Note 20.
Credit Support. We have provided $1,844 million of credit support on behalf of certain customers or associated companies, predominantly joint ventures and partnerships, using arrangements such as standby letters of credit and performance guarantees. These arrangements enable these customers and associated companies to execute transactions or obtain desired financing arrangements with third parties. Should the customer or associated company fail to perform under the terms of the transaction or financing arrangement, we would be required to perform on their behalf. Under most such arrangements, our guarantee is secured, usually by the asset being purchased or financed, or possibly by certain other assets of the customer or associated company. The length of these credit support arrangements parallels the length of the related financing arrangements or transactions. The liability for such credit support was $68 million at December 31, 2017 .
Indemnification Agreements – Continuing Operations. We have agreements that require us to fund up to $246 million at December 31, 2017 under residual value guarantees on a variety of leased equipment. Under most of our residual value guarantees, our commitment is secured by the leased asset. The liability for these indemnification agreements was $7 million at December 31, 2017 .
At December 31, 2017 , we also had $1,660 million of other indemnification commitments, substantially all of which relate to representations and warranties in sales of businesses or assets. The liability for these indemnification commitments was $251 million at December 31, 2017 .
Indemnification Agreements – Discontinued Operations At December 31, 2017, we have provided specific indemnities to buyers of GE Capital's assets that, in the aggregate, represent a maximum potential claim of $2,648 million . The majority of these indemnifications relate to the sale of businesses and assets under the GE Capital Exit Plan. We have recorded related liabilities of $295 million , which incorporates our evaluation of risk and the likelihood of making payments under the indemnities. The recognized liabilities represent the estimated fair value of the indemnities when issued as adjusted for any subsequent probable and estimable losses. In addition, in connection with the 2015 public offering and sale of Synchrony Financial, GE Capital indemnified Synchrony Financial and its directors, officers, and employees against the liabilities of GECC's businesses other than historical liabilities of the businesses that are part of Synchrony Financial's ongoing operations.
Contingent Consideration. These are agreements to provide additional consideration to a buyer or seller in a business combination if contractually specified conditions related to the acquisition or disposition are achieved. Amount of contingent consideration was insignificant at December 31, 2017 .
PRODUCT WARRANTIES
We provide for estimated product warranty expenses when we sell the related products. Because warranty estimates are forecasts that are based on the best available information – mostly historical claims experience – claims costs may differ from amounts provided. An analysis of changes in the liability for product warranties follows.
182 GE 2017 FORM 10-K
FINANCIAL STATEMENTS | COMMITMENTS, GUARANTEES, PRODUCT WARRANTIES AND OTHER LOSS CONTINGENCIES | |
(In millions) | 2017 | | 2016 | | 2015 | | |||
|
|
|
| ||||||
Balance at January 1 | $ | 1,920 | | $ | 1,723 | | $ | 1,199 | |
Current-year provisions | 985 | | 791 | | 649 | | |||
Expenditures | (827 | ) | (729 | ) | (718 | ) | |||
Other changes(a) | 286 | | 135 | | 593 | | |||
Balance at December 31 | $ | 2,364 | | $ | 1,920 | | $ | 1,723 | |
(a) | Included $634 million related to Alstom acquisition in 2015, and $172 million related to Baker Hughes and LM Wind Power acquisitions in 2017. |
OTHER LOSS CONTINGENCIES
LEGAL MATTERS
WMC. During the fourth quarter of 2007, we completed the sale of WMC, our U.S. mortgage business. WMC substantially discontinued all new loan originations by the second quarter of 2007, and was never a loan servicer. In connection with the sale, WMC retained certain representation and warranty obligations related to loans sold to third parties prior to the disposal of the business and contractual obligations to repurchase previously sold loans that had an early payment default. All claims received by WMC for early payment default have either been resolved or are no longer being pursued.
The remaining active claims have been brought by securitization trustees or administrators seeking recovery from WMC for alleged breaches of representations and warranties on mortgage loans that serve as collateral for residential mortgage-backed securities (RMBS). At December 31, 2017 , such claims consisted of $462 million of individual claims generally submitted before the filing of a lawsuit (compared to $1,060 million at December 31, 2016 ) and $3,198 million of additional claims asserted against WMC in litigation without making a prior claim (Litigation Claims) (compared to $5,456 million at December 31, 2016 ). The total amount of these claims, $3,660 million , reflects the purchase price or unpaid principal balances of the loans at the time of purchase and does not give effect to pay downs or potential recoveries based upon the underlying collateral, which in many cases are substantial, nor to accrued interest or fees. WMC believes that repurchase claims brought based upon representations and warranties made more than six years before WMC was notified of the claim would be disallowed in legal proceedings under applicable law and the June 11, 2015 decision of the New York Court of Appeals in ACE Securities Corp. v. DB Structured Products, Inc., on the statute of limitations period governing such claims.
Reserves related to repurchase claims made against WMC were $416 million at December 31, 2017 , reflecting a net decrease to reserves in the year ended December 31, 2017 of $210 million due to settlements partially offset by incremental provisions. The reserve estimate takes into account recent settlement activity and is based upon WMC's evaluation of the remaining exposures as a percentage of estimated lifetime mortgage loan losses within the pool of loans supporting each securitization for which timely claims have been asserted in litigation against WMC. Settlements in prior periods reduced WMC's exposure on claims asserted in certain securitizations and the claim amounts reported above give effect to these settlements.
ROLLFORWARD OF THE RESERVE |
|
| ||||
|
| |||||
(In millions) | 2017 | | 2016 | | ||
|
|
| ||||
Balance at January 1 | $ | 626 | | $ | 875 | |
Provision | 51 | | 91 | | ||
Claim resolutions / rescissions | (261 | ) | (340 | ) | ||
Balance at December 31 | $ | 416 | | $ | 626 | |
Given the significant litigation activity and WMC's continuing efforts to resolve the lawsuits involving claims made against WMC, it is difficult to assess whether future losses will be consistent with WMC's past experience. Adverse changes to WMC's assumptions supporting the reserve may result in an increase to these reserves. WMC estimates a range of reasonably possible loss from $0 to approximately $500 million over its recorded reserve at December 31, 2017 . This estimate involves significant judgment and may not reflect the range of uncertainties and unpredictable outcomes inherent in litigation, including the matters discussed in Legal Proceedings and potential changes in WMC's legal strategy. This estimate excludes any possible loss associated with an adverse court decision on the applicable statute of limitations or an adverse outcome in the U.S Department of Justice's (DOJ) ongoing investigation regarding potential violations of the Financial Institutions Reform, Recovery, and Enforcement Act of 1989 (FIRREA) by WMC and GE Capital discussed in Legal Proceedings, as we are unable at this time to develop such a meaningful estimate. With respect to the FIRREA investigation, this inability to develop a meaningful estimate of the range of reasonably possible loss reflects, among other factors, the wide variety and broad range of penalties and other sanctions incurred by various financial institutions in proceedings and settlements involving claims made under FIRREA by the DOJ, but a loss incurred by WMC and/or GE Capital resulting from a negotiated resolution or an adverse outcome in litigation could be material.
GE 2017 FORM 10-K 183
FINANCIAL STATEMENTS | COMMITMENTS, GUARANTEES, PRODUCT WARRANTIES AND OTHER LOSS CONTINGENCIES | |
At December 31, 2017 , there were five lawsuits involving claims made against WMC arising from alleged breaches of representations and warranties on mortgage loans included in six securitizations. The adverse parties in these cases are securitization trustees or parties claiming to act on their behalf. As discussed in Legal Proceedings , four of these remaining lawsuits have been stayed pending court approval of settlement agreements. The sole remaining active lawsuit against WMC is the TMI Trust Company (TMI) case, and a bench trial in that case began on January 16, 2018.
Although the alleged claims for relief vary from case to case, the complaints and counterclaims in these actions generally assert claims for breach of contract, indemnification, and/or declaratory judgment, and seek specific performance (repurchase of defective mortgage loans) and/or money damages. Adverse court decisions, including in cases not involving WMC, could result in new claims and lawsuits on additional loans. However, WMC continues to believe that it has defenses to the claims asserted in litigation, including, for example, based on causation and materiality requirements and applicable statutes of limitations. It is not possible to predict the outcome or impact of these defenses and other factors, any of which could materially affect the amount of any loss ultimately incurred by WMC on these claims.
WMC has also received indemnification demands, nearly all of which are unspecified, from depositors/underwriters/sponsors of RMBS in connection with lawsuits brought by RMBS investors concerning alleged misrepresentations in the securitization offering documents to which WMC is not a party, or, in two cases, involving mortgage loan repurchase claims made against RMBS sponsors. WMC believes that it has defenses to these demands.
To the extent WMC is required to repurchase loans, WMC's loss also would be affected by several factors, including pay downs, accrued interest and fees, and the value of the underlying collateral. The reserve and estimate of possible loss reflect judgment, based on currently available information, and a number of assumptions, including economic conditions, claim and settlement activity, pending and threatened litigation, court decisions regarding WMC's legal defenses, indemnification demands, government activity, and other variables in the mortgage industry. Actual losses arising from claims against WMC could exceed these amounts and additional claims and lawsuits could result if actual claim rates, governmental actions, litigation and indemnification activity, adverse court decisions, actual settlement rates or losses WMC incurs on repurchased loans differ from its assumptions. Adverse developments under any of these scenarios, or a finding of liability in the TMI case discussed above, could be in an amount exceeding the total value of WMC's assets.
Alstom legacy matters . On November 2, 2015 , we acquired the Thermal, Renewables and Grid businesses from Alstom . Prior to the acquisition, the seller was the subject of two significant cases involving anti-competitive activities and improper payments: (1) in January 2007 , Alstom was fined €65 million by the European Commission for participating in a gas insulated switchgear cartel that operated from 1988 to 2004 (that fine was later reduced to €59 million ), and (2) in December 2014 , Alstom pled guilty in the United States to multiple violations of the Foreign Corrupt Practices Act and paid a criminal penalty of $772 million . As part of GE's accounting for the acquisition, we established a reserve amounting to $858 million for legal and compliance matters related to the legacy business practices that were the subject of these and related cases in various jurisdictions.
Regardless of jurisdiction, the allegations relate to claimed anti-competitive conduct or improper payments in the pre-acquisition period as the source of legal violations and/or damages. Given the significant litigation and compliance activity related to these matters and our ongoing efforts to resolve them, it is difficult to assess whether the disbursements will ultimately be consistent with the reserve established. The estimation of this reserve involved significant judgment and may not reflect the full range of uncertainties and unpredictable outcomes inherent in litigation and investigations of this nature. Damages sought may include disgorgement of profits on the underlying business transactions, fines and/or penalties, interest, or other forms of resolution. Factors that can affect the ultimate amount of losses associated with these matters include the way cooperation is assessed and valued, prosecutorial discretion in the determination of damages, formulas for determining fines and penalties, the duration and amount of legal and investigative resources applied, and political and social influences within each jurisdiction, among other considerations. Actual losses arising from claims in these matters could exceed the amount provided. At this time, we are unable to develop a meaningful estimate of the range of reasonably possible additional losses for this exposure.
ENVIRONMENTAL MATTERS
Our operations, like operations of other companies engaged in similar businesses, involve the use, disposal and cleanup of substances
regulated under environmental protection laws. We are involved in numerous remediation actions to clean up hazardous wastes as
required by federal and state laws. Liabilities for remediation costs exclude possible insurance recoveries and, when dates and
amounts of such costs are not known, are not discounted. When there appears to be a range of possible costs with equal likelihood,
liabilities are based on the low end of such range. It is reasonably possible that our environmental remediation exposure will exceed
amounts accrued. However, due to uncertainties about the status of laws, regulations, technology and information related to individual
sites, such amounts are not reasonably estimable. Total reserves related to environmental remediation and asbestos claims were $1,745 million at December 31, 2017.
184 GE 2017 FORM 10-K
FINANCIAL STATEMENTS | CASH FLOWS INFORMATION | |
NOTE 22. CASH FLOWS INFORMATION
Changes in operating assets and liabilities are net of acquisitions and dispositions of principal businesses.
Amounts reported in the "Proceeds from sales of discontinued operations" and "Proceeds from principal business dispositions" lines in the Statement of Cash Flows are net of cash disposed and included certain deal-related costs. Amounts reported in the "Net cash from (payments for) principal businesses purchased" line is net of cash acquired and included certain deal-related costs and debt assumed and immediately repaid in acquisitions. Amounts reported in the "All other operating activities" line in the Statement of Cash Flows reflect cash sources and uses as well as non-cash adjustments to net income including those related to taxes, pension, contract assets, gains (losses) on principal business dispositions, intangible amortization and restructuring and other charges. Certain supplemental information related to our cash flows is shown below.
GE
For the years ended December 31 (In millions) | 2017 | | 2016 | | 2015 | | |||
| | | | ||||||
All other operating activities | | | | ||||||
(Gains) losses on purchases and sales of business interests(a) | $ | (656 | ) | $ | (3,701 | ) | $ | (1,020 | ) |
Contract assets (net)(b) | (3,988 | ) | (3,929 | ) | (1,919 | ) | |||
Income taxes(c) | 110 | | (2,752 | ) | 1,671 | | |||
Principal pension plans(d) | 1,709 | | 3,071 | | 4,265 | | |||
Other postretirement benefit plans(e) | (888 | ) | (716 | ) | (503 | ) | |||
Intangible asset amortization | 2,154 | | 2,011 | | 1,514 | | |||
Restructuring and other charges(f) | 3,162 | | 1,702 | | 637 | | |||
Deferred income | 55 | | (371 | ) | (86 | ) | |||
Net earnings (loss) attributable to noncontrolling interests | (274 | ) | (279 | ) | 83 | | |||
Other(g) | (562 | ) | (2,474 | ) | (2,559 | ) | |||
| $ | 822 | | $ | (7,438 | ) | $ | 2,083 | |
All other investing activities |
|
|
| ||||||
Derivative settlements (net)(h) | $ | (1,142 | ) | $ | - | | $ | - | |
Investments in intangible assets (net) | (321 | ) | (499 | ) | (158 | ) | |||
Investments in associated companies (net) | (226 | ) | (420 | ) | (182 | ) | |||
Other investments (net) | (272 | ) | (175 | ) | (181 | ) | |||
Other(i) | (136 | ) | (558 | ) | (32 | ) | |||
| $ | (2,097 | ) | $ | (1,652 | ) | $ | (553 | ) |
Net dispositions (purchases) of GE shares for treasury | | | | ||||||
Open market purchases under share repurchase program(j) | $ | (3,506 | ) | $ | (22,581 | ) | $ | (2,709 | ) |
Other purchases | (67 | ) | (399 | ) | (58 | ) | |||
Dispositions | 1,021 | | 1,550 | | 1,668 | | |||
| $ | (2,550 | ) | $ | (21,429 | ) | $ | (1,099 | ) |
(a) | Included pre-tax gains on sales of businesses reclassified to Proceeds from principal business dispositions within Cash flows from investing activities of $(1,943) million for Water in 2017, $(3,136) million for Appliances and $(398) million for GE Asset Management in 2016 , and $(623) million for Signaling in 2015 , partially offset by a valuation allowance on businesses classified as held for sale of $1,378 million in 2017 . See Notes 2 and 17. |
(b) | Contract assets are presented net of related billings in excess of revenues on our long-term product service agreements. See Note 9. |
(c) | Reflected the effects of current tax expense (benefit) of $2,810 million , $(140) million and $3,307 million and net cash paid during the year for income taxes of $(2,700) million , $(2,612) million and $(1,636) million for the years ended December 31, 2017 , 2016 and 2015 , respectively. Cash flows effects of deferred tax provisions (benefits) are shown separately within Cash flows from operating activities in the Statement of Cash Flows. See Note 13. |
(d) | Reflected the effects of pension costs of $3,687 million , $3,623 million and $4,498 million and employer contributions of $(1,978) million , $(552) million and $(233) million for the years ended December 31, 2017 , 2016 and 2015 , respectively. 2016 employer contributions included GE Pension Trust funding of $(330) million representing net sale proceeds associated with the sale of GE Asset Management. See Note12. |
(e) | Reflected the effects of other postretirement plans costs of $ 369 million, $ 489 million and $ 547 million and employer contributions of $ (1,257) million, $ (1,205) million and $ (1,050) million for the years ended December 31, 2017 , 2016 and 2015 , respectively. See Note 12. |
(f) | Reflected the effects of restructuring and other charges of $ 5,158 million (which included pre-tax impairments related to Power Conversion goodwill of $1,164 million and a power plant asset of $315 million ), $ 3,384 million and $ 1,671 million and restructuring and other cash expenditures of $ (1,996) million, $ (1,682) million and $ (1,034) million for the years ended December 31, 2017 , 2016 and 2015 , respectively. Excludes non-cash adjustments reflected as Depreciation and amortization of property, plant and equipment in the Statement of Cash Flows. |
(g) | Included other non-cash adjustments to net income, such as write-downs of assets and the impacts of acquisition accounting and changes in other assets and other liabilities classified as operating activities. |
(h) | The classification of the settlement of derivative instruments was corrected from operating cash flows to investing cash flows in 2017. Such settlements of $178 million and $(199) million in 2016 and 2015, respectively, were not reclassified and corrected in investing cash flows in those periods as they were not considered material. |
(i) | Primarily included cash collateral held on long-term financing arrangements in 2016. |
(j) | Included $(11,370) million paid under ASR agreements in 2016. |
GE 2017 FORM 10-K 185
FINANCIAL STATEMENTS | CASH FLOWS INFORMATION | |
GE CAPITAL
For the years ended December 31 (In millions) | 2017 | | 2016 | | 2015 | | |||
|
|
|
| ||||||
All other operating activities |
|
|
| ||||||
Cash collateral on derivative contracts | $ | 131 | | $ | (428 | ) | $ | (1,936 | ) |
Increase (decrease) in other liabilities | (1,566 | ) | (2,616 | ) | 4,860 | | |||
Other(a) | 13,237 | | (10 | ) | 2,163 | | |||
| $ | 11,802 | | $ | (3,054 | ) | $ | 5,087 | |
Net decrease (increase) in GE Capital financing receivables |
|
|
| ||||||
Increase in loans to customers | $ | (41,393 | ) | $ | (65,055 | ) | $ | (65,306 | ) |
Principal collections from customers - loans | 43,613 | | 60,375 | | 60,292 | | |||
Investment in equipment for financing leases | (585 | ) | (690 | ) | (417 | ) | |||
Principal collections from customers - financing leases | 1,011 | | 856 | | 734 | | |||
Sales of financing receivables | 251 | | 3,235 | | 4,923 | | |||
| $ | 2,897 | | $ | (1,279 | ) | $ | 226 | |
All other investing activities |
|
|
| ||||||
Purchases of investment securities | $ | (2,867 | ) | $ | (18,588 | ) | $ | (7,790 | ) |
Dispositions and maturities of investment securities | 10,001 | | 7,343 | | 9,587 | | |||
Decrease (increase) in other assets - investments | (8,457 | ) | 9,202 | | (1,439 | ) | |||
Other(b) | 4,375 | | 3,690 | | (5,025 | ) | |||
| $ | 3,052 | | $ | 1,647 | | $ | (4,667 | ) |
Repayments and other reductions (maturities longer than 90 days) |
|
|
| ||||||
Short-term (91 to 365 days) | $ | (18,591 | ) | $ | (44,519 | ) | $ | (42,110 | ) |
Long-term (longer than one year) | (2,054 | ) | (13,418 | ) | (2,455 | ) | |||
Principal payments - non-recourse, leveraged leases | (362 | ) | (348 | ) | (283 | ) | |||
| $ | (21,007 | ) | $ | (58,285 | ) | $ | (44,848 | ) |
All other financing activities |
|
|
| ||||||
Proceeds from sales of investment contracts | $ | 10 | | $ | 19 | | $ | 163 | |
Redemption of investment contracts | (344 | ) | (346 | ) | (1,235 | ) | |||
Other | 54 | | (800 | ) | (290 | ) | |||
| $ | (280 | ) | $ | (1,127 | ) | $ | (1,362 | ) |
(a) | Primarily included non-cash adjustments for insurance-related charges recorded in the fourth quarter of 2017. |
(b) | Primarily included net activity related to settlements between our continuing operations (primarily our treasury operations) and businesses in discontinued operations. |
186 GE 2017 FORM 10-K
FINANCIAL STATEMENTS | INTERCOMPANY TRANSACTIONS | |
NOTE 23. INTERCOMPANY TRANSACTIONS
Transactions between related companies are made on arm's length terms and are reported in the GE and GE Capital columns of our financial statements, but are eliminated in deriving our consolidated financial statements. These transactions include, but are not limited to, the following:
• | GE Capital dividends to GE, |
• | GE Capital working capital solutions to optimize GE cash management, |
• | GE Capital enabled GE industrial orders, including related GE guarantees to GE Capital, |
• | GE Capital financing of GE long-term receivables, and |
• | Aircraft engines, power equipment, renewable energy equipment and healthcare equipment manufactured by GE that are installed on GE Capital investments, including leased equipment. |
In addition to the above transactions that primarily enable growth for the GE businesses, there are routine related party transactions, which include, but are not limited to, the following:
• | Expenses related to parent-subsidiary pension plans, |
• | Buildings and equipment leased between GE and GE Capital, including sale-leaseback transactions, |
• | Information technology (IT) and other services sold to GE Capital by GE |
• | Settlements of tax liabilities, and |
• | Various investments, loans and allocations of GE corporate overhead costs. |
Presented below is a walk of intercompany eliminations from the unconsolidated GE and GE Capital totals to the consolidated cash flows.
(In millions) | 2017 | | 2016 | | 2015 | | |||
|
|
|
| ||||||
Cash from (used for) operating activities-continuing operations |
|
|
| ||||||
Combined | $ | 13,414 | | $ | 28,408 | | $ | 17,891 | |
GE current receivables sold to GE Capital | 1,800 | | 697 | | (856 | ) | |||
GE Capital dividends to GE | (4,016 | ) | (20,095 | ) | (4,300 | ) | |||
Other reclassifications and eliminations(a) | 196 | | (2,911 | ) | (879 | ) | |||
Total cash from (used for) operating activities-continuing operations | $ | 11,394 | | $ | 6,099 | | $ | 11,856 | |
Cash from (used for) investing activities-continuing operations |
|
|
| ||||||
Combined | $ | (46 | ) | $ | 58,134 | | $ | 59,516 | |
GE current receivables sold to GE Capital | (1,721 | ) | (230 | ) | 1,261 | | |||
GE Capital long-term loans to GE | 7,271 | | - | | - | | |||
GE Capital short-term loan to GE | (1,329 | ) | 1,329 | | - | | |||
Other reclassifications and eliminations(a) | (235 | ) | 3,380 | | 836 | | |||
Total cash from (used for) investing activities-continuing operations | $ | 3,940 | | $ | 62,613 | | $ | 61,613 | |
Cash from (used for) financing activities-continuing operations |
|
|
| ||||||
Combined | $ | (19,089 | ) | $ | (107,750 | ) | $ | (73,484 | ) |
GE current receivables sold to GE Capital | (79 | ) | (467 | ) | (405 | ) | |||
GE Capital dividends to GE | 4,016 | | 20,095 | | 4,300 | | |||
GE Capital long-term loans to GE | (7,271 | ) | - | | - | | |||
GE Capital short-term loan to GE | 1,329 | | (1,329 | ) | - | | |||
Other reclassifications and eliminations(a) | 39 | | (469 | ) | 42 | | |||
Total cash from (used for) financing activities-continuing operations | $ | (21,055 | ) | $ | (89,920 | ) | $ | (69,547 | ) |
(a) | Includes eliminations of other cash flows activities, including those related to GE Capital enabled GE industrial orders, long-term receivables financing, various investments, loans and allocations of GE corporate overhead costs. |
GE 2017 FORM 10-K 187
FINANCIAL STATEMENTS | OPERATING SEGMENTS | |
NOTE 24. OPERATING SEGMENTS
BASIS FOR PRESENTATION
Our operating businesses are organized based on the nature of markets and customers. Segment accounting policies are the same as described and referenced in Note 1. Segment results for our financial services businesses reflect the discrete tax effect of transactions.
A description of our operating segments as of December 31, 2017 , can be found below, and details of segment profit by operating segment can be found in the Summary of Operating Segments table in "Management's Discussion and Analysis of Financial Condition and Results of Operations" section in this Form 10-K Report.
POWER
Power serves power generation, industrial, government and other customers worldwide with products and services related to energy production and water reuse. Our products and technologies harness resources such as oil, gas, coal, diesel, nuclear and water to produce electric power and include gas and steam turbines, full balance of plant, upgrade and service solutions, as well as data-leveraging software.
RENEWABLE ENERGY
GE Renewable Energy makes renewable power sources affordable, accessible, and reliable for the benefit of people everywhere. With one of the broadest technology portfolios in the industry, Renewable Energy creates value for customers with solutions from onshore and offshore wind, hydro, and its wind turbine blade manufacturing business. With operations in over 40 countries around the world, Renewable Energy can deliver solutions to where its customers need them most.
OIL & GAS
Oil & Gas is a fullstream oilfield technology provider that has a unique mix of integrated oilfield products, services and digital solutions. We conduct business in more than 120 countries. We operate through our four business segments: Oilfield Services, Oilfield Equipment, Turbomachinery & Processing Solutions, and Digital Solutions.
AVIATION
Aviation designs and produces commercial and military aircraft engines, integrated digital components, electric power and mechanical aircraft systems, and additive machines, materials and engineering services. We also provide aftermarket services to support our products.
HEALTHCARE
Healthcare provides essential healthcare technologies to developed and emerging markets and has expertise in medical imaging, digital solutions, patient monitoring and diagnostics, drug discovery, biopharmaceutical manufacturing technologies and performance improvement solutions. Products and services are sold worldwide primarily to hospitals, medical facilities, pharmaceutical and biotechnology companies, and to the life science research market.
TRANSPORTATION
Transportation is a global technology leader and supplier to the railroad, mining, marine, stationary power and drilling industries.
LIGHTING
Lighting includes the GE Lighting business, which is primarily focused on consumer lighting applications in the U.S., and Current, powered by GE (Current), which is focused on providing energy efficiency and productivity solutions for commercial, industrial and municipal customers.
CAPITAL
Capital is the financial services division of GE focused on customers and markets aligned with GE's industrial businesses, whether in developed economies or emerging markets. We provide financial products and services around the globe that are geared to utilize GE's industry specific expertise in aviation, energy, infrastructure, and healthcare to capitalize on market-specific opportunities . In addition, we continue to operate our run-off insurance operations as part of our continuing operations.
188 GE 2017 FORM 10-K
FINANCIAL STATEMENTS | OPERATING SEGMENTS | |
REVENUES | |||||||||||||||||||||||||||||
|
|
|
|
|
|
|
|
|
|
|
| ||||||||||||||||||
| Total revenues(a) |
| Intersegment revenues(b) |
| External revenues | ||||||||||||||||||||||||
(In millions) | 2017 | | 2016 | | 2015 | |
| 2017 | | 2016 | | 2015 | |
| 2017 | | 2016 | | 2015 | | |||||||||
|
|
|
|
|
|
|
|
|
|
|
| ||||||||||||||||||
Power | $ | 35,990 | | $ | 36,795 | | $ | 28,903 | |
| $ | 1,392 | | $ | 1,330 | | $ | 1,574 | |
| $ | 34,598 | | $ | 35,465 | | $ | 27,328 | |
Renewable Energy | 10,280 | | 9,033 | | 6,273 | |
| 69 | | 11 | | 12 | |
| 10,211 | | 9,022 | | 6,261 | | |||||||||
Oil & Gas | 17,231 | | 12,898 | | 16,450 | |
| 646 | | 383 | | 387 | |
| 16,584 | | 12,515 | | 16,063 | | |||||||||
Aviation | 27,375 | | 26,261 | | 24,660 | |
| 585 | | 730 | | 418 | |
| 26,790 | | 25,530 | | 24,242 | | |||||||||
Healthcare | 19,116 | | 18,291 | | 17,639 | |
| 18 | | 15 | | 7 | |
| 19,098 | | 18,276 | | 17,633 | | |||||||||
Transportation | 4,178 | | 4,713 | | 5,933 | |
| 10 | | 1 | | 1 | |
| 4,168 | | 4,713 | | 5,932 | | |||||||||
Lighting(c) | 1,987 | | 4,823 | | 8,751 | |
| 31 | | 28 | | 22 | |
| 1,956 | | 4,795 | | 8,729 | | |||||||||
Total industrial segment revenues | 116,157 | | 112,814 | | 108,609 | |
| 2,751 | | 2,498 | | 2,421 | |
| 113,406 | | 110,316 | | 106,188 | | |||||||||
Capital | 9,070 | | 10,905 | | 10,801 | |
| 1,620 | | 1,288 | | 1,151 | |
| 7,451 | | 9,617 | | 9,650 | | |||||||||
Corporate items and eliminations | (3,135 | ) | (26 | ) | (2,024 | ) |
| (4,371 | ) | (3,786 | ) | (3,572 | ) |
| 1,236 | | 3,760 | | 1,548 | | |||||||||
Total | $ | 122,092 | | $ | 123,693 | | $ | 117,386 | |
| $ | - | | $ | - | | $ | - | |
| $ | 122,092 | | $ | 123,693 | | $ | 117,386 | |
(a) | Revenues of GE businesses include income from sales of goods and services to customers and other income. |
(b) | Sales from one component to another generally are priced at equivalent commercial selling prices. |
(c) | Lighting segment included Appliances for the year ended December 31, 2015, and through its disposition in the second quarter of 2016. |
Revenues from customers located in the United States were $46,312 million , $53,624 million and $53,238 million in 2017 , 2016 and 2015 , respectively. Revenues from customers located outside the United States were $75,780 million , $70,069 million and $64,148 million in 2017 , 2016 and 2015 , respectively.
PROFIT AND EARNINGS |
|
|
| ||||||
|
|
|
| ||||||
(In millions) | 2017 | | 2016 | | 2015 | | |||
|
|
|
| ||||||
Power | $ | 2,786 | | $ | 5,091 | | $ | 4,772 | |
Renewable Energy | 727 | | 576 | | 431 | | |||
Oil & Gas | 220 | | 1,392 | | 2,427 | | |||
Aviation | 6,642 | | 6,115 | | 5,507 | | |||
Healthcare | 3,448 | | 3,161 | | 2,882 | | |||
Transportation | 824 | | 1,064 | | 1,273 | | |||
Lighting(a) | 93 | | 199 | | 674 | | |||
Total industrial segment profit | 14,740 | | 17,598 | | 17,966 | | |||
Capital | (6,765 | ) | (1,251 | ) | (7,983 | ) | |||
Total segment profit | 7,975 | | 16,347 | | 9,983 | | |||
Corporate items and eliminations | (7,871 | ) | (4,226 | ) | (5,108 | ) | |||
GE interest and other financial charges | (2,753 | ) | (2,026 | ) | (1,706 | ) | |||
GE provision for income taxes | (3,259 | ) | (967 | ) | (1,506 | ) | |||
Earnings (loss) from continuing operations attributable to GE common shareowners | (5,907 | ) | 9,128 | | 1,663 | | |||
Earnings (loss) from discontinued operations, net of taxes | (309 | ) | (954 | ) | (7,495 | ) | |||
Less net earnings (loss) attributable to noncontrolling interests, discontinued operations | 6 | | (1 | ) | 312 | | |||
Earnings (loss) from discontinued operations, net of taxes and noncontrolling interests | (315 | ) | (952 | ) | (7,807 | ) | |||
Consolidated net earnings (loss) attributable to GE common shareowners | $ | (6,222 | ) | $ | 8,176 | | $ | (6,145 | ) |
(a) | Lighting segment included Appliances for the year ended December 31, 2015, and through its disposition in the second quarter of 2016. |
GE 2017 FORM 10-K 189
FINANCIAL STATEMENTS | OPERATING SEGMENTS | |
| Assets(a) |
| Property, plant and |
| Depreciation and amortization | ||||||||||||||||||||||||
| At December 31 |
| For the years ended December 31 |
| For the years ended December 31 | ||||||||||||||||||||||||
(In millions) | 2017 | | 2016 | | 2015 | |
| 2017 | | 2016 | | 2015 | |
| 2017 | | 2016 | | 2015 | | |||||||||
|
|
|
|
|
|
|
|
|
|
|
| ||||||||||||||||||
Power | $ | 71,133 | | $ | 71,678 | | $ | 68,793 | |
| $ | 1,072 | | $ | 963 | | $ | 3,195 | |
| $ | 1,358 | | $ | 1,549 | | $ | 1,035 | |
Renewable Energy | 10,813 | | 8,794 | | 9,468 | |
| 624 | | 166 | | 999 | |
| 259 | | 183 | | 116 | | |||||||||
Oil & Gas | 59,784 | | 24,615 | | 26,126 | |
| 5,469 | | 284 | | 422 | |
| 1,026 | | 529 | | 596 | | |||||||||
Aviation | 41,753 | | 38,899 | | 34,524 | |
| 1,426 | | 1,328 | | 1,260 | |
| 979 | | 900 | | 855 | | |||||||||
Healthcare | 28,772 | | 28,639 | | 28,162 | |
| 393 | | 432 | | 284 | |
| 806 | | 785 | | 799 | | |||||||||
Transportation | 4,490 | | 4,288 | | 4,368 | |
| 128 | | 108 | | 202 | |
| 135 | | 168 | | 188 | | |||||||||
Lighting(c) | 724 | | 1,659 | | 4,702 | |
| 34 | | 160 | | 275 | |
| 86 | | 173 | | 103 | | |||||||||
Capital(d) | 156,716 | | 187,804 | | 316,069 | |
| 3,680 | | 3,769 | | 7,570 | |
| 2,343 | | 2,515 | | 2,584 | | |||||||||
Corporate items and eliminations(e) | 3,761 | | (1,192 | ) | 858 | |
| (100 | ) | 94 | | (297 | ) |
| 367 | | 337 | | 231 | | |||||||||
Total | $ | 377,945 | | $ | 365,183 | | $ | 493,071 | |
| $ | 12,728 | | $ | 7,305 | | $ | 13,911 | |
| $ | 7,358 | | $ | 7,139 | | $ | 6,508 | |
(a) | Total assets of Power, Renewable Energy, Oil & Gas, Aviation, Healthcare, Transportation and Capital operating segments at December 31, 2017, include investments in and advances to associated companies of $1,170 million , $89 million , $476 million , $1,900 million , $392 million , $56 million and $7,294 million , respectively. Lighting held an insignificant balance as of December 31, 2017 . Investments in and advances to associated companies contributed approximately $81 million , $(4) million , $(5) million , $110 million , $17 million , $(1) million , $2 million and $(31) million to segment pre-tax income of Power, Renewable Energy, Oil & Gas, Aviation, Healthcare, Transportation, Lighting and Capital operating segments, respectively. |
(b) | Additions to property, plant and equipment include amounts relating to principal businesses purchased. |
(c) | Lighting segment included Appliances for the year ended December 31, 2015. |
(d) | Includes Capital discontinued operations. |
(e) | Includes deferred income taxes that are presented as assets for purposes of our consolidating balance sheet presentation. |
| Interest and other financial charges |
| Benefit (provision) for income taxes | ||||||||||||||||
(In millions) | 2017 | | 2016 | | 2015 | |
| 2017 | | 2016 | | 2015 | | ||||||
|
|
|
|
|
|
|
| ||||||||||||
Capital | $ | 3,145 | | $ | 3,790 | | $ | 2,301 | |
| $ | 6,302 | | $ | 1,431 | | $ | (4,979 | ) |
Corporate items and eliminations(a) | 1,724 | | 1,234 | | 1,162 | |
| (3,259 | ) | (967 | ) | (1,506 | ) | ||||||
Total | $ | 4,869 | | $ | 5,025 | | $ | 3,463 | |
| $ | 3,043 | | $ | 464 | | $ | (6,485 | ) |
(a) | Included amounts for Power, Renewable Energy, Oil & Gas, Aviation, Healthcare, Transportation and Lighting, for which our measure of segment profit excludes interest and other financial charges and income taxes. |
Property, plant and equipment – net associated with operations based in the United States were $17,643 million , $14,987 million and $14,273 million at December 31, 2017 , 2016 and 2015 , respectively. Property, plant and equipment – net associated with operations based outside the United States were $36,231 million , $35,531 million and $39,822 million at December 31, 2017 , 2016 and 2015 , respectively.
190 GE 2017 FORM 10-K
FINANCIAL STATEMENTS | COST INFORMATION |
|
NOTE 25. COST INFORMATION
COLLABORATIVE ARRANGEMENTS
Our businesses enter into collaborative arrangements primarily with manufacturers and suppliers of components used to build and maintain certain engines, under which GE and these participants share in the risks and rewards of these product programs. GE's payments to participants are primarily recorded as either cost of services sold ( $1,443 million , $1,231 million and $788 million for the years ended December 31, 2017 , 2016 and 2015 , respectively) or as cost of goods sold ( $2,160 million , $2,482 million and $2,736 million for the years ended December 31, 2017 , 2016 and 2015 , respectively).
RENTAL EXPENSE
Rental expense under operating leases is shown below.
(In millions) | 2017 | | 2016 | | 2015 | | |||
|
|
|
| ||||||
GE | $ | 1,783 | | $ | 1,686 | | $ | 1,397 | |
GE Capital | 105 | | 91 | | 107 | | |||
| 1,888 | | 1,777 | | 1,504 | | |||
Eliminations | (143 | ) | (126 | ) | (169 | ) | |||
Total | $ | 1,746 | | $ | 1,651 | | $ | 1,335 | |
At December 31, 2017 , minimum rental commitments under noncancellable operating leases aggregated $6,065 million and $276 million for GE and GE Capital, respectively. Amounts payable over the next five years follow.
(In millions) | 2018 | | 2019 | | 2020 | | 2021 | | 2022 | | |||||
|
|
|
|
|
| ||||||||||
GE | $ | 1,189 | | $ | 1,011 | | $ | 849 | | $ | 736 | | $ | 630 | |
GE Capital | 27 | | 23 | | 22 | | 22 | | 56 | | |||||
| 1,216 | | 1,035 | | 871 | | 758 | | 686 | | |||||
Eliminations | (135 | ) | (127 | ) | (123 | ) | (120 | ) | (108 | ) | |||||
Total | $ | 1,081 | | $ | 908 | | $ | 748 | | $ | 638 | | $ | 578 | |
GE 2017 FORM 10-K 191
FINANCIAL STATEMENTS | GUARANTOR FINANCIAL INFORMATION | |
NOTE 26. GUARANTOR FINANCIAL INFORMATION
GUARANTOR AND NON-GUARANTOR CONDENSED CONSOLIDATING FINANCIAL INFORMATION
On October 26, 2015, GE Capital International Funding Company Unlimited Company, formerly GE Capital International Funding Company (the Issuer), then a finance subsidiary of General Electric Capital Corporation, settled its previously announced private offers to exchange (the Exchange Offers) the Issuer's new senior unsecured notes for certain outstanding debt securities of General Electric Capital Corporation.
The new notes that were issued were fully and unconditionally, jointly and severally guaranteed by both the Company and GE Capital International Holdings Limited (GECIHL) (each a Guarantor, and together, the Guarantors).
Under the terms of a registration rights agreement entered into in connection with the Exchange Offers, the Issuer and the Company agreed to file a registration statement with the U.S. Securities and Exchange Commission (SEC) for an offer to exchange new senior notes of the Issuer registered with the SEC and guaranteed by the Guarantors for certain of the Issuer's outstanding unregistered senior notes. This exchange was completed in July 2016.
PRESENTATION
In connection with the registration of the senior notes, the Company is required to provide certain financial information regarding the Issuer and the Guarantors of the registered securities. Included are the Condensed Consolidating Statements of Earnings and Comprehensive Income for the years ended December 31, 2017 , 2016 and 2015 , Condensed Consolidating Statements of Financial Position as of December 31, 2017 and December 31, 2016 and Condensed Consolidating Statements of Cash Flows for the years ended December 31, 2017 , 2016 and 2015 for:
• | General Electric Company (the Parent Company Guarantor) - prepared with investments in subsidiaries accounted for under the equity method of accounting and excluding any inter-segment eliminations; |
• | GE Capital International Funding Company Unlimited Company (the Subsidiary Issuer) – finance subsidiary for debt; |
• | GE Capital International Holdings Limited (GECIHL) (the Subsidiary Guarantor) - prepared with investments in non-guarantor subsidiaries accounted for under the equity method of accounting; |
• | Non-Guarantor Subsidiaries - prepared on an aggregated basis excluding any elimination or consolidation adjustments and includes predominantly all non-cash adjustments for cash flows; |
• | Consolidating Adjustments - adjusting entries necessary to consolidate the Parent Company Guarantor with the Subsidiary Issuer, the Subsidiary Guarantor and Non-Guarantor Subsidiaries; and |
• | Consolidated - prepared on a consolidated basis. |
192 GE 2017 FORM 10-K
FINANCIAL STATEMENTS | GUARANTOR FINANCIAL INFORMATION | |
CONDENSED CONSOLIDATING STATEMENT OF EARNINGS (LOSS) AND COMPREHENSIVE INCOME (LOSS) | ||||||||||||||||||
FOR THE YEAR ENDED DECEMBER 31, 2017 | ||||||||||||||||||
| ||||||||||||||||||
(in millions) | Parent Company Guarantor | | Subsidiary Issuer | | Subsidiary Guarantor | | Non- Guarantor Subsidiaries | | Consolidating Adjustments | | Consolidated | | ||||||
|
|
|
|
|
|
| ||||||||||||
Revenues and other income |
|
|
|
|
|
| ||||||||||||
Sales of goods and services | $ | 35,551 | | $ | - | | $ | - | | $ | 161,158 | | $ | (83,518 | ) | $ | 113,192 | |
Other income | 3,769 | | - | | - | | 76,453 | | (78,597 | ) | 1,625 | | ||||||
Equity in earnings (loss) of affiliates | 2,014 | | - | | 1,938 | | 109,525 | | (113,477 | ) | - | | ||||||
GE Capital revenues from services | - | | 703 | | 800 | | 9,888 | | (4,115 | ) | 7,276 | | ||||||
Total revenues and other income | 41,335 | | 703 | | 2,737 | | 357,024 | | (279,706 | ) | 122,092 | | ||||||
|
|
|
|
|
|
| ||||||||||||
Costs and expenses |
|
|
|
|
|
| ||||||||||||
Interest and other financial charges | 4,396 | | 652 | | 2,006 | | 4,928 | | (7,112 | ) | 4,869 | | ||||||
Other costs and expenses | 36,013 | | - | | 18 | | 175,648 | | (85,665 | ) | 126,014 | | ||||||
Total costs and expenses | 40,409 | | 653 | | 2,023 | | 180,576 | | (92,778 | ) | 130,883 | | ||||||
Earnings (loss) from continuing operations before income taxes | 926 | | 50 | | 714 | | 176,447 | | (186,929 | ) | (8,791 | ) | ||||||
Benefit (provision) for income taxes | (2,896 | ) | (5 | ) | 115 | | 5,921 | | (92 | ) | 3,043 | | ||||||
Earnings (loss) from continuing operations | (1,969 | ) | 45 | | 829 | | 182,368 | | (187,020 | ) | (5,748 | ) | ||||||
Earnings (loss) from discontinued operations, net of taxes | (319 | ) | - | | 41 | | 4 | | (35 | ) | (309 | ) | ||||||
Net earnings (loss) | (2,288 | ) | 45 | | 870 | | 182,372 | | (187,055 | ) | (6,056 | ) | ||||||
Less net earnings (loss) attributable to noncontrolling interests | - | | - | | - | | (137 | ) | (133 | ) | (270 | ) | ||||||
Net earnings (loss) attributable to the Company | (2,288 | ) | 45 | | 870 | | 182,509 | | (186,922 | ) | (5,786 | ) | ||||||
Other comprehensive income | 4,202 | | 0 | | 567 | | (7,474 | ) | 6,908 | | 4,202 | | ||||||
Comprehensive income (loss) attributable to the Company | $ | 1,914 | | $ | 45 | | $ | 1,436 | | $ | 175,035 | | $ | (180,014 | ) | $ | (1,584 | ) |
CONDENSED CONSOLIDATING STATEMENT OF EARNINGS (LOSS) AND COMPREHENSIVE INCOME (LOSS) | ||||||||||||||||||
FOR THE YEAR ENDED DECEMBER 31, 2016 | ||||||||||||||||||
| ||||||||||||||||||
(in millions) | Parent Company Guarantor | | Subsidiary Issuer | | Subsidiary Guarantor | | Non- Guarantor Subsidiaries | | Consolidating Adjustments | | Consolidated | | ||||||
|
|
|
|
|
|
| ||||||||||||
Revenues and other income |
|
|
|
|
|
| ||||||||||||
Sales of goods and services | $ | 40,315 | | $ | - | | $ | - | | $ | 152,047 | | $ | (81,971 | ) | $ | 110,391 | |
Other income | 10,949 | | - | | - | | 63,363 | | (70,308 | ) | 4,005 | | ||||||
Equity in earnings (loss) of affiliates | 1,397 | | - | | 1,542 | | 116,897 | | (119,836 | ) | - | | ||||||
GE Capital revenues from services | - | | 897 | | 1,419 | | 12,994 | | (6,012 | ) | 9,297 | | ||||||
Total revenues and other income | 52,661 | | 897 | | 2,961 | | 345,301 | | (278,127 | ) | 123,693 | | ||||||
|
|
|
|
|
|
| ||||||||||||
Costs and expenses |
|
|
|
|
|
| ||||||||||||
Interest and other financial charges | 3,505 | | 831 | | 2,567 | | 5,429 | | (7,308 | ) | 5,025 | | ||||||
Other costs and expenses | 41,972 | | - | | 143 | | 168,245 | | (100,722 | ) | 109,638 | | ||||||
Total costs and expenses | 45,478 | | 831 | | 2,711 | | 173,674 | | (108,030 | ) | 114,663 | | ||||||
Earnings (loss) from continuing operations before income taxes | 7,183 | | 66 | | 250 | | 171,627 | | (170,097 | ) | 9,030 | | ||||||
Benefit (provision) for income taxes | 2,539 | | (10 | ) | (105 | ) | (1,911 | ) | (49 | ) | 464 | | ||||||
Earnings (loss) from continuing operations | 9,723 | | 56 | | 145 | | 169,717 | | (170,146 | ) | 9,494 | | ||||||
Earnings (loss) from discontinued operations, net of taxes | (891 | ) | - | | (1,927 | ) | 351 | | 1,514 | | (954 | ) | ||||||
Net earnings (loss) | 8,831 | | 56 | | (1,782 | ) | 170,067 | | (168,632 | ) | 8,540 | | ||||||
Less net earnings (loss) attributable to noncontrolling interests | - | | - | | - | | (149 | ) | (142 | ) | (291 | ) | ||||||
Net earnings (loss) attributable to the Company | 8,831 | | 56 | | (1,782 | ) | 170,216 | | (168,490 | ) | 8,831 | | ||||||
Other comprehensive income | (2,069 | ) | (12 | ) | 1,126 | | (3,393 | ) | 2,279 | | (2,069 | ) | ||||||
Comprehensive income (loss) attributable to the Company | $ | 6,762 | | $ | 44 | | $ | (657 | ) | $ | 166,823 | | $ | (166,211 | ) | $ | 6,762 | |
GE 2017 FORM 10-K 193
FINANCIAL STATEMENTS | GUARANTOR FINANCIAL INFORMATION | |
CONDENSED CONSOLIDATING STATEMENT OF EARNINGS (LOSS) AND COMPREHENSIVE INCOME (LOSS) | ||||||||||||||||||
FOR THE YEAR ENDED DECEMBER 31, 2015 | ||||||||||||||||||
| ||||||||||||||||||
(in millions) | Parent Company Guarantor | | Subsidiary Issuer | | Subsidiary Guarantor | | Non- Guarantor Subsidiaries | | Consolidating Adjustments | | Consolidated | | ||||||
|
|
|
|
|
|
| ||||||||||||
Revenues and other income |
|
|
|
|
|
| ||||||||||||
Sales of goods and services | $ | 43,945 | | $ | - | | $ | - | | $ | 139,158 | | $ | (77,294 | ) | $ | 105,809 | |
Other income | 2,725 | | - | | - | | 31,146 | | (31,644 | ) | 2,227 | | ||||||
Equity in earnings (loss) of affiliates | 1,815 | | - | | 437 | | 389,796 | | (392,048 | ) | - | | ||||||
GE Capital revenues from services | - | | 250 | | (460 | ) | 36,909 | | (27,349 | ) | 9,350 | | ||||||
Total revenues and other income | 48,485 | | 250 | | (23 | ) | 597,009 | | (528,335 | ) | 117,386 | | ||||||
|
|
|
|
|
|
| ||||||||||||
Costs and expenses |
|
|
|
|
|
| ||||||||||||
Interest and other financial charges | 3,127 | | 232 | | 284 | | 9,037 | | (9,216 | ) | 3,463 | | ||||||
Other costs and expenses | 45,308 | | - | | 3 | | 163,220 | | (102,795 | ) | 105,737 | | ||||||
Total costs and expenses | 48,435 | | 232 | | 287 | | 172,257 | | (112,011 | ) | 109,200 | | ||||||
Earnings (loss) from continuing operations before income taxes | 50 | | 18 | | (310 | ) | 424,752 | | (416,324 | ) | 8,186 | | ||||||
Benefit (provision) for income taxes | 1,314 | | (2 | ) | (9 | ) | (11,426 | ) | 3,639 | | (6,485 | ) | ||||||
Earnings (loss) from continuing operations | 1,364 | | 15 | | (319 | ) | 413,326 | | (412,686 | ) | 1,700 | | ||||||
Earnings (loss) from discontinued operations, net of taxes | (7,490 | ) | - | | 483 | | (738 | ) | 250 | | (7,495 | ) | ||||||
Net earnings (loss) | (6,126 | ) | 15 | | 164 | | 412,588 | | (412,436 | ) | (5,795 | ) | ||||||
Less net earnings (loss) attributable to noncontrolling interests | - | | - | | - | | 249 | | 82 | | 332 | | ||||||
Net earnings (loss) attributable to the Company | (6,126 | ) | 15 | | 164 | | 412,339 | | (412,518 | ) | (6,126 | ) | ||||||
Other comprehensive income | 1,644 | | 12 | | 1,377 | | (4,843 | ) | 3,454 | | 1,644 | | ||||||
Comprehensive income (loss) attributable to the Company | $ | (4,483 | ) | $ | 27 | | $ | 1,542 | | $ | 407,496 | | $ | (409,065 | ) | $ | (4,483 | ) |
194 GE 2017 FORM 10-K
FINANCIAL STATEMENTS | GUARANTOR FINANCIAL INFORMATION | |
CONDENSED CONSOLIDATING STATEMENT OF FINANCIAL POSITION | ||||||||||||||||||
DECEMBER 31, 2017 | ||||||||||||||||||
| ||||||||||||||||||
(In millions) | Parent Company Guarantor | | Subsidiary Issuer | | Subsidiary Guarantor | | Non- Guarantor Subsidiaries | | Consolidating Adjustments | | Consolidated | | ||||||
|
|
|
|
|
|
| ||||||||||||
Assets |
|
|
|
|
|
| ||||||||||||
Cash and equivalents | $ | 3,275 | | $ | - | | $ | 3 | | $ | 40,768 | | $ | (747 | ) | $ | 43,299 | |
Investment securities | 1 | | - | | - | | 39,809 | | (1,113 | ) | 38,696 | | ||||||
Receivables - net | 50,923 | | 17,316 | | 32,381 | | 87,776 | | (147,321 | ) | 41,076 | | ||||||
Inventories | 4,829 | | - | | - | | 22,246 | | (5,152 | ) | 21,923 | | ||||||
Property, plant and equipment - net | 5,808 | | - | | - | | 48,516 | | (450 | ) | 53,874 | | ||||||
Investment in subsidiaries(a) | 289,469 | | - | | 77,488 | | 715,936 | | (1,082,893 | ) | - | | ||||||
Goodwill and intangible assets | 8,014 | | - | | - | | 90,226 | | 6,002 | | 104,242 | | ||||||
All other assets | 30,688 | | 16 | | 32 | | 237,231 | | (199,044 | ) | 68,923 | | ||||||
Assets of discontinued operations | - | | - | | - | | - | | 5,912 | | 5,912 | | ||||||
Total assets | $ | 393,008 | | $ | 17,332 | | $ | 109,904 | | $ | 1,282,507 | | $ | (1,424,806 | ) | $ | 377,945 | |
|
|
|
|
|
|
| ||||||||||||
Liabilities and equity |
|
|
|
|
|
| ||||||||||||
Short-term borrowings | $ | 191,807 | | $ | - | | $ | 46,033 | | $ | 22,603 | | $ | (236,407 | ) | $ | 24,036 | |
Accounts payable | 7,930 | | - | | - | | 77,507 | | (70,284 | ) | 15,153 | | ||||||
Other current liabilities | 11,408 | | 8 | | 3 | | 26,666 | | 126 | | 38,211 | | ||||||
Long-term and non-recourse borrowings | 71,023 | | 16,632 | | 34,730 | | 55,367 | | (67,197 | ) | 110,556 | | ||||||
All other liabilities | 43,078 | | 475 | | 128 | | 67,845 | | (7,627 | ) | 103,899 | | ||||||
Liabilities of discontinued operations | - | | - | | - | | - | | 706 | | 706 | | ||||||
Total Liabilities | 325,247 | | 17,116 | | 80,894 | | 249,988 | | (380,684 | ) | 292,561 | | ||||||
|
|
|
|
|
|
| ||||||||||||
Redeemable noncontrolling interests | - | | - | | - | | 2,627 | | 772 | | 3,399 | | ||||||
|
|
|
|
|
|
| ||||||||||||
GE shareowners' equity | 67,761 | | 216 | | 29,010 | | 1,028,337 | | (1,061,061 | ) | 64,263 | | ||||||
Noncontrolling interests | - | | - | | - | | 1,556 | | 16,167 | | 17,723 | | ||||||
Total equity | 67,761 | | 216 | | 29,010 | | 1,029,892 | | (1,044,894 | ) | 81,986 | | ||||||
Total liabilities, redeemable noncontrolling interests and equity | $ | 393,008 | | $ | 17,332 | | $ | 109,904 | | $ | 1,282,507 | | $ | (1,424,806 | ) | $ | 377,945 | |
(a) | Included within the subsidiaries of the Subsidiary Guarantor are cash and cash equivalent balances of $15,225 million and net assets of discontinued operations of $4,318 million . |
GE 2017 FORM 10-K 195
FINANCIAL STATEMENTS | GUARANTOR FINANCIAL INFORMATION | |
CONDENSED CONSOLIDATING STATEMENT OF FINANCIAL POSITION | ||||||||||||||||||
DECEMBER 31, 2016 | ||||||||||||||||||
| ||||||||||||||||||
(In millions) | Parent Company Guarantor | | Subsidiary Issuer | | Subsidiary Guarantor | | Non- Guarantor Subsidiaries | | Consolidating Adjustments | | Consolidated | | ||||||
|
|
|
|
|
|
| ||||||||||||
Assets |
|
|
|
|
|
| ||||||||||||
Cash and equivalents | $ | 2,558 | | $ | - | | $ | 3 | | $ | 46,994 | | $ | (1,426 | ) | $ | 48,129 | |
Investment securities | 1 | | - | | - | | 47,394 | | (3,082 | ) | 44,313 | | ||||||
Receivables - net | 63,620 | | 17,157 | | 30,470 | | 79,401 | | (148,385 | ) | 42,263 | | ||||||
Inventories | 4,654 | | - | | - | | 21,076 | | (3,377 | ) | 22,354 | | ||||||
Property, plant and equipment - net | 5,768 | | - | | - | | 46,366 | | (1,615 | ) | 50,518 | | ||||||
Investment in subsidiaries(a) | 272,685 | | - | | 80,481 | | 492,674 | | (845,840 | ) | - | | ||||||
Goodwill and intangible assets | 8,128 | | - | | - | | 42,074 | | 36,673 | | 86,875 | | ||||||
All other assets | 14,692 | | 44 | | 39 | | 201,276 | | (160,134 | ) | 55,917 | | ||||||
Assets of discontinued operations | - | | - | | - | | - | | 14,815 | | 14,815 | | ||||||
Total assets | $ | 372,107 | | $ | 17,202 | | $ | 110,992 | | $ | 977,255 | | $ | (1,112,372 | ) | $ | 365,183 | |
|
|
|
|
|
|
| ||||||||||||
Liabilities and equity |
|
|
|
|
|
| ||||||||||||
Short-term borrowings | $ | 167,089 | | $ | 1 | | $ | 46,432 | | $ | 25,919 | | $ | (208,727 | ) | $ | 30,714 | |
Accounts payable | 5,412 | | - | | - | | 47,366 | | (38,343 | ) | 14,435 | | ||||||
Other current liabilities | 11,072 | | 33 | | 117 | | 25,095 | | 114 | | 36,431 | | ||||||
Long-term and non-recourse borrowings | 68,983 | | 16,486 | | 34,389 | | 68,912 | | (83,273 | ) | 105,496 | | ||||||
All other liabilities | 43,722 | | 511 | | 481 | | 58,376 | | (9,656 | ) | 93,434 | | ||||||
Liabilities of discontinued operations | - | | - | | - | | - | | 4,158 | | 4,158 | | ||||||
Total Liabilities | 296,279 | | 17,030 | | 81,419 | | 225,667 | | (335,727 | ) | 284,668 | | ||||||
|
|
|
|
|
|
| ||||||||||||
Redeemable noncontrolling interests | - | | - | | - | | 2,223 | | 802 | | 3,025 | | ||||||
|
|
|
|
|
|
| ||||||||||||
GE shareowners' equity | 75,828 | | 171 | | 29,573 | | 747,719 | | (777,463 | ) | 75,828 | | ||||||
Noncontrolling interests | - | | - | | - | | 1,647 | | 16 | | 1,663 | | ||||||
Total equity | 75,828 | | 171 | | 29,573 | | 749,366 | | (777,447 | ) | 77,491 | | ||||||
Total liabilities, redeemable noncontrolling interests and equity | $ | 372,107 | | $ | 17,202 | | $ | 110,992 | | $ | 977,255 | | $ | (1,112,372 | ) | $ | 365,183 | |
(a) | Included within the subsidiaries of the Subsidiary Guarantor are cash and cash equivalent balances of $28,516 million and net assets of discontinued operations of $6,012 million . |
196 GE 2017 FORM 10-K
FINANCIAL STATEMENTS | GUARANTOR FINANCIAL INFORMATION | |
CONDENSED CONSOLIDATING STATEMENT OF CASH FLOWS | ||||||||||||||||||
FOR THE YEAR ENDED DECEMBER 31, 2017 | ||||||||||||||||||
|
|
|
|
|
|
| ||||||||||||
(In millions) | Parent Company Guarantor | | Subsidiary Issuer | | Subsidiary Guarantor | | Non- Guarantor Subsidiaries | | Consolidating Adjustments | | Consolidated | | ||||||
|
|
|
|
|
|
| ||||||||||||
Cash flows – operating activities |
|
|
|
|
|
| ||||||||||||
Cash from (used for) operating activities - continuing operations | $ | (35,701 | ) | $ | 52 | | $ | 4,305 | | $ | 257,663 | | $ | (214,924 | ) | $ | 11,394 | |
Cash from (used for) operating activities - discontinued operations | (319 | ) | - | | - | | (656 | ) | 6 | | (968 | ) | ||||||
Cash from (used for) operating activities | (36,020 | ) | 52 | | 4,305 | | 257,007 | | (214,918 | ) | 10,426 | | ||||||
|
|
|
|
|
|
| ||||||||||||
Cash flows – investing activities |
|
|
|
|
|
| ||||||||||||
Cash from (used for) investing activities – continuing operations | 2,469 | | (52 | ) | (1,871 | ) | (333,491 | ) | 336,885 | | 3,940 | | ||||||
Cash from (used for) investing activities – discontinued operations | - | | - | | - | | (1,618 | ) | - | | (1,618 | ) | ||||||
Cash from (used for) investing activities | 2,469 | | (52 | ) | (1,871 | ) | (335,109 | ) | 336,885 | | 2,322 | | ||||||
|
|
|
|
|
|
| ||||||||||||
Cash flows – financing activities |
|
|
|
|
|
| ||||||||||||
Cash from (used for) financing activities – continuing operations | 34,268 | | - | | (2,434 | ) | 68,398 | | (121,288 | ) | (21,055 | ) | ||||||
Cash from (used for) financing activities – discontinued operations | - | | - | | - | | 1,909 | | - | | 1,909 | | ||||||
Cash from (used for) financing activities | 34,268 | | - | | (2,434 | ) | 70,307 | | (121,288 | ) | (19,146 | ) | ||||||
Effect of currency exchange rate changes on cash and equivalents | - | | - | | - | | 891 | | - | | 891 | | ||||||
Increase (decrease) in cash and equivalents | 717 | | - | | - | | (6,904 | ) | 680 | | (5,507 | ) | ||||||
Cash and equivalents at beginning of year | 2,558 | | - | | 3 | | 48,423 | | (1,426 | ) | 49,558 | | ||||||
Cash and equivalents at end of year | 3,275 | | - | | 3 | | 41,519 | | (747 | ) | 44,051 | | ||||||
Less cash and equivalents of discontinued operations at end of year | - | | - | | - | | 752 | | - | | 752 | | ||||||
Cash and equivalents of continuing operations at end of year | $ | 3,275 | | $ | - | | $ | 3 | | $ | 40,768 | | $ | (747 | ) | $ | 43,299 | |
CONDENSED CONSOLIDATING STATEMENT OF CASH FLOWS | ||||||||||||||||||
FOR THE YEAR ENDED DECEMBER 31, 2016 | ||||||||||||||||||
|
|
|
|
|
|
| ||||||||||||
(In millions) | Parent Company Guarantor | | Subsidiary Issuer | | Subsidiary Guarantor | | Non- Guarantor Subsidiaries | | Consolidating Adjustments | | Consolidated | | ||||||
|
|
|
|
|
|
| ||||||||||||
Cash flows – operating activities |
|
|
|
|
|
| ||||||||||||
Cash from (used for) operating activities - continuing operations | $ | (4,966 | ) | $ | (10 | ) | $ | (52 | ) | $ | 162,918 | | $ | (151,791 | ) | $ | 6,099 | |
Cash from (used for) operating activities - discontinued operations | (891 | ) | - | | - | | (5,039 | ) | (413 | ) | (6,343 | ) | ||||||
Cash from (used for) operating activities | (5,858 | ) | (10 | ) | (52 | ) | 157,880 | | (152,204 | ) | (244 | ) | ||||||
|
|
|
|
|
|
| ||||||||||||
Cash flows – investing activities |
|
|
|
|
|
| ||||||||||||
Cash from (used for) investing activities – continuing operations | 14,158 | | 16,384 | | 35,443 | | 72,205 | | (75,577 | ) | 62,613 | | ||||||
Cash from (used for) investing activities – discontinued operations | - | | - | | - | | (13,412 | ) | - | | (13,412 | ) | ||||||
Cash from (used for) investing activities | 14,158 | | 16,384 | | 35,443 | | 58,794 | | (75,577 | ) | 49,202 | | ||||||
|
|
|
|
|
|
| ||||||||||||
Cash flows – financing activities |
|
|
|
|
|
| ||||||||||||
Cash from (used for) financing activities – continuing operations | (9,879 | ) | (16,374 | ) | (35,388 | ) | (275,243 | ) | 246,964 | | (89,920 | ) | ||||||
Cash from (used for) financing activities – discontinued operations | - | | - | | - | | 789 | | - | | 789 | | ||||||
Cash from (used for) financing activities | (9,879 | ) | (16,374 | ) | (35,388 | ) | (274,454 | ) | 246,964 | | (89,131 | ) | ||||||
Effect of currency exchange rate changes on cash and equivalents | - | | - | | - | | (1,146 | ) | - | | (1,146 | ) | ||||||
Increase (decrease) in cash and equivalents | (1,578 | ) | - | | 3 | | (58,927 | ) | 19,183 | | (41,319 | ) | ||||||
Cash and equivalents at beginning of year | 4,137 | | - | | - | | 107,351 | | (20,609 | ) | 90,879 | | ||||||
Cash and equivalents at end of year | 2,558 | | - | | 3 | | 48,423 | | (1,426 | ) | 49,558 | | ||||||
Less cash and equivalents of discontinued operations at end of year | - | | - | | - | | 1,429 | | - | | 1,429 | | ||||||
Cash and equivalents of continuing operations at end of year | $ | 2,558 | | $ | - | | $ | 3 | | $ | 46,994 | | $ | (1,426 | ) | $ | 48,129 | |
GE 2017 FORM 10-K 197
FINANCIAL STATEMENTS | GUARANTOR FINANCIAL INFORMATION | |
CONDENSED CONSOLIDATING STATEMENT OF CASH FLOWS | ||||||||||||||||||
FOR THE YEAR ENDED DECEMBER 31, 2015 | ||||||||||||||||||
|
|
|
|
|
|
| ||||||||||||
(In millions) | Parent Company Guarantor | | Subsidiary Issuer | | Subsidiary Guarantor | | Non- Guarantor Subsidiaries | | Consolidating Adjustments | | Consolidated | | ||||||
|
|
|
|
|
|
| ||||||||||||
Cash flows – operating activities |
|
|
|
|
|
| ||||||||||||
Cash from (used for) operating activities - continuing operations | $ | 13,587 | | $ | 68 | | $ | 631 | | $ | 433,479 | | $ | (435,909 | ) | $ | 11,856 | |
Cash from (used for) operating activities - discontinued operations | (7,490 | ) | - | | (30 | ) | 27,533 | | (11,979 | ) | 8,034 | | ||||||
Cash from (used for) operating activities | 6,097 | | 68 | | 601 | | 461,013 | | (447,888 | ) | 19,891 | | ||||||
|
|
|
|
|
|
| ||||||||||||
Cash flows – investing activities |
|
|
|
|
|
| ||||||||||||
Cash from (used for) investing activities – continuing operations | 7,106 | | (248 | ) | (601 | ) | (493,933 | ) | 549,289 | | 61,613 | | ||||||
Cash from (used for) investing activities – discontinued operations | - | | - | | - | | 5,854 | | (7,979 | ) | (2,125 | ) | ||||||
Cash from (used for) investing activities | 7,106 | | (248 | ) | (601 | ) | (488,079 | ) | 541,310 | | 59,488 | | ||||||
|
|
|
|
|
|
| ||||||||||||
Cash flows – financing activities |
|
|
|
|
|
| ||||||||||||
Cash from (used for) financing activities – continuing operations | (13,886 | ) | 180 | | - | | 67,063 | | (122,904 | ) | (69,547 | ) | ||||||
Cash from (used for) financing activities – discontinued operations | - | | - | | - | | (37,582 | ) | 31,075 | | (6,507 | ) | ||||||
Cash from (used for) financing activities | (13,886 | ) | 180 | | - | | 29,481 | | (91,829 | ) | (76,054 | ) | ||||||
Effect of currency exchange rate changes on cash and equivalents | - | | - | | - | | (3,464 | ) | - | | (3,464 | ) | ||||||
Increase (decrease) in cash and equivalents | (683 | ) | - | | - | | (1,049 | ) | 1,594 | | (138 | ) | ||||||
Cash and equivalents at beginning of year | 4,820 | | - | | - | | 108,400 | | (22,203 | ) | 91,017 | | ||||||
Cash and equivalents at end of year | 4,137 | | - | | - | | 107,351 | | (20,609 | ) | 90,879 | | ||||||
Less cash and equivalents of discontinued operations at end of year | - | | - | | - | | 20,395 | | - | | 20,395 | | ||||||
Cash and equivalents of continuing operations at end of year | $ | 4,137 | | $ | - | | $ | - | | $ | 86,955 | | $ | (20,609 | ) | $ | 70,483 | |
198 GE 2017 FORM 10-K
FINANCIAL STATEMENTS | QUARTERLY INFORMATION |
|
NOTE 27. QUARTERLY INFORMATION (UNAUDITED)
| First quarter |
| Second quarter |
| Third quarter |
| Fourth quarter | ||||||||||||||||||||
(In millions; per-share amounts in dollars) | 2017 | | 2016 | |
| 2017 | | 2016 | |
| 2017 | | 2016 | |
| 2017 | | 2016 | | ||||||||
|
|
|
|
|
|
|
|
|
|
|
| ||||||||||||||||
Consolidated operations |
|
|
|
|
|
|
|
|
|
|
| ||||||||||||||||
Earnings (loss) from continuing operations | $ | 816 | | $ | 415 | |
| $ | 1,499 | | $ | 3,363 | |
| $ | 1,800 | | $ | 2,056 | |
| $ | (9,863 | ) | $ | 3,659 | |
Earnings (loss) from discontinued operations | (239 | ) | (308 | ) |
| (146 | ) | (541 | ) |
| (106 | ) | (105 | ) |
| 182 | | - | | ||||||||
Net earnings (loss) | 577 | | 107 | |
| 1,354 | | 2,823 | |
| 1,694 | | 1,951 | |
| (9,681 | ) | 3,659 | | ||||||||
Less net earnings (loss) attributable to noncontrolling interests | (76 | ) | (121 | ) |
| (14 | ) | (86 | ) |
| (142 | ) | (76 | ) |
| (39 | ) | (8 | ) | ||||||||
Net earnings (loss) attributable to the Company | $ | 653 | | $ | 228 | |
| $ | 1,367 | | $ | 2,908 | |
| $ | 1,836 | | $ | 2,027 | |
| $ | (9,642 | ) | $ | 3,667 | |
Per-share amounts – earnings (loss) from continuing operations |
|
|
|
|
|
|
|
|
|
|
| ||||||||||||||||
Diluted earnings (loss) per share | $ | 0.10 | | $ | 0.03 | |
| $ | 0.15 | | $ | 0.36 | |
| $ | 0.22 | | $ | 0.23 | |
| $ | (1.15 | ) | $ | 0.39 | |
Basic earnings (loss) per share | 0.10 | | 0.03 | |
| 0.15 | | 0.36 | |
| 0.22 | | 0.24 | |
| (1.15 | ) | 0.39 | | ||||||||
Per-share amounts – earnings (loss) from discontinued operations |
|
|
|
|
|
|
|
|
|
|
| ||||||||||||||||
Diluted earnings (loss) per share | (0.03 | ) | (0.03 | ) |
| (0.02 | ) | (0.06 | ) |
| (0.01 | ) | (0.01 | ) |
| 0.02 | | 0.00 | | ||||||||
Basic earnings (loss) per share | (0.03 | ) | (0.03 | ) |
| (0.02 | ) | (0.06 | ) |
| (0.01 | ) | (0.01 | ) |
| 0.02 | | 0.00 | | ||||||||
Per-share amounts – net earnings (loss) |
|
|
|
|
|
|
|
|
|
|
| ||||||||||||||||
Diluted earnings (loss) per share | 0.07 | | (0.01 | ) |
| 0.13 | | 0.30 | |
| 0.21 | | 0.22 | |
| (1.13 | ) | 0.39 | | ||||||||
Basic earnings (loss) per share | 0.07 | | (0.01 | ) |
| 0.14 | | 0.30 | |
| 0.21 | | 0.22 | |
| (1.13 | ) | 0.40 | | ||||||||
|
|
|
|
|
|
|
|
|
|
|
| ||||||||||||||||
|
|
|
|
|
|
|
|
|
|
|
| ||||||||||||||||
Selected data |
|
|
|
|
|
|
|
|
|
|
| ||||||||||||||||
GE |
|
|
|
|
|
|
|
|
|
|
| ||||||||||||||||
Sales of goods and services | $ | 25,392 | | $ | 25,407 | |
| $ | 27,293 | | $ | 28,150 | |
| $ | 29,438 | | $ | 26,934 | |
| $ | 31,356 | | $ | 30,345 | |
Gross profit from sales | 5,418 | | 5,516 | |
| 5,965 | | 6,192 | |
| 5,918 | | 6,388 | |
| 6,126 | | 7,027 | | ||||||||
GE Capital |
|
|
|
|
|
|
|
|
|
|
| ||||||||||||||||
Total revenues | 2,681 | | 2,885 | |
| 2,446 | | 2,771 | |
| 2,397 | | 2,600 | |
| 1,545 | | 2,649 | | ||||||||
Earnings (loss) from continuing operations attributable to the Company | (13 | ) | (603 | ) |
| 10 | | (448 | ) |
| 60 | | 59 | |
| (6,385 | ) | 397 | | ||||||||
For GE, gross profit from sales is sales of goods and services less costs of goods and services sold.
Earnings-per-share amounts are computed independently each quarter for earnings (loss) from continuing operations, earnings (loss) from discontinued operations and net earnings. As a result, the sum of each quarter's per-share amount may not equal the total per-share amount for the respective year; and the sum of per-share amounts from continuing operations and discontinued operations may not equal the total per-share amounts for net earnings (loss) for the respective quarters.
GE 2017 FORM 10-K 199
OTHER INFORMATION |
|
|
DIRECTORS, EXECUTIVE OFFICERS AND CORPORATE GOVERNANCE
Executive Officers of the Registrant (As of February 1, 2018)
|
|
|
|
|
| Date assumed |
|
|
|
|
|
| Executive |
Name |
| Position |
| Age |
| Officer Position |
|
|
|
|
|
|
|
John L. Flannery |
| Chairman of the Board & Chief Executive Officer |
| 56 |
| August 2017 |
Jamie S. Miller |
| Senior Vice President & Chief Financial Officer |
| 49 |
| November 2017 |
Alexander Dimitrief |
| Senior Vice President, General Counsel & Secretary of General Electric |
| 59 |
| November 2015 |
|
| Company; President and CEO, Global Growth Organization |
|
|
|
|
Jan R. Hauser |
| Vice President, Controller & Chief Accounting Officer |
| 58 |
| April 2013 |
David L. Joyce |
| Vice Chairman of General Electric Company; |
| 61 |
| September 2016 |
|
| President & CEO, GE Aviation |
|
|
|
|
Raghu Krishnamoorthy |
| Senior Vice President, Chief Human Resources Officer |
| 57 |
| December 2017 |
All Executive Officers are elected by the Board of Directors for an initial term that continues until the Board meeting immediately preceding the next annual statutory meeting of shareowners, and thereafter are elected for one-year terms or until their successors have been elected. All Executive Officers have been executives of General Electric Company for the last five years except for Ms. Hauser. Prior to joining GE in April 2013, Ms. Hauser served as a partner, Accounting Services, National Professional Services Group at PricewaterhouseCoopers LLP.
The remaining information called for by this item is incorporated by reference to "Election of Directors," "Section 16(a) Beneficial Ownership Reporting Compliance," "Other Governance Policies and Practices" and "Board Operations" in our definitive proxy statement for our 2018 Annual Meeting of Shareowners to be held April 25, 2018, which will be filed within 120 days of the end of our fiscal year ended December 31, 2017 (the 2018 Proxy Statement).
200 GE 2017 FORM 10-K
OTHER INFORMATION |
|
|
EXHIBITS AND FINANCIAL STATEMENT SCHEDULES
(a)1. Financial Statements
Included in the "Financial Statements and Supplementary Data" section of this report:
Management's Annual Report on Internal Control Over Financial Reporting
Report of Independent Registered Public Accounting Firm
Statement of Earnings (Loss) for the years ended December 31, 2017 , 2016 and 2015
Consolidated Statement of Comprehensive Income (Loss) for the years ended December 31, 2017 , 2016 and 2015
Statement of Financial Position at December 31, 2017 and 2016
Statement of Cash Flows for the years ended December 31, 2017 , 2016 and 2015
Notes to consolidated financial statements
Management's Discussion and Analysis of Financial Condition and Results of Operations - Summary of Operating Segments
(a)2. Financial Statement Schedules
The schedules listed in Reg. 210.5-04 have been omitted because they are not applicable or the required information is shown in the consolidated financial statements or notes thereto.
(a)3. Exhibit Index
Exhibit |
| Description | |
2(a) |
| Transaction Agreement and Plan of Merger dated as of October 30, 2016 among General Electric, Baker Hughes Incorporated, Bear Mergersub, Inc. and Bear Newco, Inc. (Incorporated by reference to Exhibit 2.1 to GE's Current Report on Form 8-K, dated November 3, 2016 (Commission file number 001-00035)). | |
|
|
| |
2(b) |
| Amendment to Transaction Agreement and Plan of Merger dated March 27, 2017 between General Electric Company, Baker Hughes Incorporated, Bear Newco, Inc., Bear MergerSub, Inc., BHI Newco, Inc., and Bear MergerSub 2, Inc. (Incorporated by reference to Bear Newco, Inc.'s Registration Statement on Form S-4, pages A-II-I through G-16, filed pursuant to Rule 424(b)(3) on May 30, 2017 (Commission file number 333-216991)). | |
|
|
| |
3(i) |
| The Restated Certificate of Incorporation of General Electric Company ( Incorporated by reference to Exhibit 3(i) to GE's Annual Report on Form 10-K for the fiscal year ended December 31, 2013 ), as amended by the Certificate of Amendment, dated December 2, 2015 ( Incorporated by reference to Exhibit 3.1 to GE's Current Report on Form 8-K, dated December 3, 2015 ), as further amended by the Certificate of Amendment, dated January 19, 2016 ( Incorporated by reference to Exhibit 3.1 to GE's Current Report on Form 8-K, dated January 20, 2016 ) and as further amended by the Certificate of Change of General Electric Company ( Incorporated by reference to Exhibit 3(1) to GE's Current Report on Form 8-K, dated September 1, 2016 (in each case, under Commission file number 001-00035). | |
| |||
3(ii) |
| The By-Laws of General Electric Company, as amended and restated on June 9, 2017 (Incorporated by reference to Exhibit 3.1 to GE's Current Report on Form 8-K dated June 9, 2017 (Commission file number 001-00035)). | |
| |||
4(a) |
| Amended and Restated General Electric Capital Corporation Standard Global Multiple Series Indenture Provisions dated as of February 27, 1997 (Incorporated by reference to Exhibit 4(a) to General Electric Capital Corporation's Registration Statement on Form S-3, File No. 333-59707 (Commission file number 001-06461)). | |
| |||
4(b) |
| Third Amended and Restated Indenture dated as of February 27, 1997, between General Electric Capital Corporation and The Bank of New York Mellon, as successor trustee (Incorporated by reference to Exhibit 4(c) to General Electric Capital Corporation's Registration Statement on Form S-3, File No. 333-59707 (Commission file number 001-06461)). | |
| |||
4(c) |
| First Supplemental Indenture dated as of May 3, 1999, supplemental to Third Amended and Restated Indenture dated as of February 27, 1997 (Incorporated by reference to Exhibit 4(dd) to General Electric Capital Corporation's Post-Effective Amendment No. 1 to Registration Statement on Form S-3, File No. 333-76479 (Commission file number 001-06461)). | |
| |||
4(d) |
| Second Supplemental Indenture dated as of July 2, 2001, supplemental to Third Amended and Restated Indenture dated as of February 27, 1997 (Incorporated by reference to Exhibit 4(f) to General Electric Capital Corporation's Post-Effective Amendment No.1 to Registration Statement on Form S-3, File No. 333-40880 (Commission file number 001-06461)). | |
| |||
4(e) |
| Third Supplemental Indenture dated as of November 22, 2002, supplemental to Third Amended and Restated Indenture dated as of February 27, 1997 (Incorporated by reference to Exhibit 4(cc) to General Electric Capital Corporation's Post-Effective Amendment No. 1 to the Registration Statement on Form S-3, File No. 333‑100527 (Commission file number 001-06461)). | |
| |||
GE 2017 FORM 10-K 201
OTHER INFORMATION |
|
|
4(f) |
| Fourth Supplemental Indenture dated as of August 24, 2007, supplemental to Third Amended and Restated Indenture dated as of February 27, 1997 (Incorporated by reference to Exhibit 4(g) to General Electric Capital Corporation's Registration Statement on Form S-3, File number 333-156929 (Commission file number 001-06461)). | |
| |||
4(g) |
| Letter from the Senior Vice President and Chief Financial Officer of General Electric to General Electric Capital Corporation dated September 15, 2006, with respect to returning dividends, distributions or other payments to General Electric Capital Corporation in certain circumstances described in the Indenture for Subordinated Debentures dated September 1, 2006, between General Electric Capital Corporation and the Bank of New York, as successor trustee (Incorporated by reference to Exhibit 4(c) to General Electric Capital Corporation's Post-Effective Amendment No. 2 to Registration Statement on Form S-3, File No. 333-132807 (Commission file number 001-06461)). | |
|
|
| |
4(h) |
| Senior Note Indenture, dated October 9, 2012, by and between the Company and The Bank of New York Mellon, as trustee (Incorporated by reference to Exhibit 4.1 of GE's Current Report on Form 8-K dated October 9, 2012 (Commission file number 001-00035)). | |
|
|
| |
4(i) |
| Indenture dated as of October 26, 2015, among GE Capital International Funding Company, as issuer, General Electric Company and General Electric Capital Corporation, as guarantors and The Bank of New York Mellon, as trustee (Incorporated by reference to Exhibit 99 to General Electric's Current Report on Form 8-K filed on October 26, 2015 (Commission file number 001-00035)). | |
|
|
| |
4(j) |
| Global Supplemental Indenture dated as of April 10, 2015, among General Electric Capital Corporation, General Electric Company and The Bank of New York Mellon, as trustee. (Incorporated by reference to Exhibit 4(i) to GE's Annual Report on Form 10-K (Commission file number 001-00035) for the fiscal year ended December 31, 2015). | |
|
|
| |
4(k) |
| Second Global Supplemental Indenture dated as of December 2, 2015, among General Electric Capital Corporation, General Electric Company and The Bank of New York Mellon, as successor trustee (Incorporated by reference to Exhibit 4.2 to General Electric's Current Report on Form 8-K filed on December 3, 2015 (Commission file number 001-00035)). | |
| |||
4(l) |
| Agreement to furnish to the Securities and Exchange Commission upon request a copy of instruments defining the rights of holders of certain long-term debt of the registrant and consolidated subsidiaries.* | |
| |||
(10) |
| Except for 10(t), (x), (y) and (z) below, all of the following exhibits consist of Executive Compensation Plans or Arrangements: | |
| |||
|
| (a) | General Electric Incentive Compensation Plan, as amended effective July 1, 1991 (Incorporated by reference to Exhibit 10(a) to GE's Annual Report on Form 10-K (Commission file number 001-00035) for the fiscal year ended December 31, 1991). |
| |||
|
| (b) | General Electric Financial Planning Program, as amended through September 1993 (Incorporated by reference to Exhibit 10(h) to GE's Annual Report on Form 10-K (Commission file number 001-00035) for the fiscal year ended December 31, 1993). |
| |||
|
| (c) | General Electric Supplemental Life Insurance Program, as amended February 8, 1991 (Incorporated by reference to Exhibit 10(i) to GE's Annual Report on Form 10-K (Commission file number 001-00035) for the fiscal year ended December 31, 1990). |
| |||
|
| (d) | General Electric Directors' Charitable Gift Plan, as amended through December 2002 (Incorporated by reference to Exhibit 10(i) to GE's Annual Report on Form 10-K (Commission file number 001-00035) for the fiscal year ended December 31, 2002). |
| |||
|
| (e) | General Electric Leadership Life Insurance Program, effective January 1, 1994 (Incorporated by reference to Exhibit 10(r) to GE's Annual Report on Form 10-K (Commission file number 001-00035) for the fiscal year ended December 31, 1993). |
| |||
|
| (f) | General Electric Supplementary Pension Plan, as amended effective July 1, 2015. (Incorporated by reference to Exhibit 10(f) to GE's Annual Report on Form 10-K (Commission file number 001-00035) for the fiscal year ended December 31, 2015). |
|
|
|
|
|
| (g) | General Electric 2003 Non-Employee Director Compensation Plan, Amended and Restated as of September 9, 2016 (Incorporated by reference to Exhibit 10(a) to GE's Quarterly Report on Form 10-Q for the quarter ended September 30, 2016 (Commission file number 000-00035)). |
| |||
|
| (h) | Amendment to Nonqualified Deferred Compensation Plans, dated as of December 14, 2004 (Incorporated by reference to Exhibit 10(w) to the GE's Annual Report on Form 10-K (Commission file number 001-00035) for the fiscal year ended December 31, 2004). |
| |||
|
| (i) | GE Retirement for the Good of the Company Program, as amended effective January 1, 2009 (Incorporated by reference to Exhibit 10(j) to GE's Annual Report on Form 10-K (Commission file number 001-00035) for the fiscal year ended December 31, 2008). |
| |||
|
| (j) | GE Excess Benefits Plan, effective January 1, 2009 (Incorporated by reference to Exhibit 10(k) to GE's Annual Report on Form 10-K (Commission file number 001-00035) for the fiscal year ended December 31, 2008). |
| |||
202 GE 2017 FORM 10-K
OTHER INFORMATION |
|
|
|
| (k) | General Electric 2006 Executive Deferred Salary Plan, as amended January 1, 2009 (Incorporated by reference to Exhibit 10(l) to GE's Annual Report on Form 10-K (Commission file number 001-00035) for the fiscal year ended December 31, 2008). |
| |||
|
| (l) | GE 2007 Long-Term Incentive Plan (as amended and restated April 26, 2017) (Incorporated by reference to Exhibit 99.1 to GE's Registration Statement on Form S-8, dated July 28, 2017, File number 333-219566 (Commission file number 001-00035)). |
| |||
|
| (m) | Form of Agreement for Stock Option Grants to Executive Officers under the General Electric Company 2007 Long-Term Incentive Plan, as amended January 1, 2009 (Incorporated by reference to Exhibit 10(n) to GE's Annual Report on Form 10-K (Commission file number 001-00035) for the fiscal year ended December 31, 2008). |
| |||
|
| (n) | Form of Agreement for Annual Restricted Stock Unit Grants to Executive Officers under the General Electric Company 2007 Long-Term Incentive Plan, as amended February 7, 2014 (Incorporated by reference to Exhibit 10(a) to GE's Quarterly Report on Form 10-Q for the quarter ended March 31, 2014 (Commission file number 001-00035)). |
| |||
|
| (o) | Form of Agreement for Periodic Restricted Stock Unit Grants to Executive Officers under the General Electric Company 2007 Long-Term Incentive Plan, as amended February 7, 2014 (Incorporated by reference to Exhibit 10(b) to GE's Quarterly Report on Form 10-Q for the quarter ended March 31, 2014 (Commission file number 001-00035)). |
| |||
|
| (p) | Form of Agreement for Long Term Performance Award Grants to Executive Officers under the General Electric Company 2007 Long-Term Incentive Plan (as amended and restated April 25, 2012) (Incorporated by reference to Exhibit 10(a) to GE's Quarterly Report on Form 10-Q for the quarter ended June 30, 2016 (Commission file number 001-00035)). |
| |||
|
| (q) | Form of Agreement for Performance Stock Unit Grants to Executive Officers under the General Electric Company 2007 Long-Term Incentive Plan (Incorporated by reference to Exhibit 10 (a) to GE's Quarterly Report on Form 10-Q for the quarter ended June 30, 2015 (Commission file number 001-00035)). |
| |||
|
| (r) | First Restatement of the General Electric International Employee Stock Purchase Plan effective May 1, 2002 (Incorporated by reference to Exhibit 4.1 to GE's Registration Statement on Form S-8, dated November 13, 2009, File No. 333-163106 (Commission file number 001-00035)). |
|
|
|
|
|
| (s) | Time Sharing Agreement dated November 22, 2010 between General Electric Company and Jeffrey R. Immelt (Incorporated by reference to Exhibit 10(z) to GE's Annual Report on Form 10-K for the fiscal year ended December 31, 2010 (Commission file number 001-00035)). |
|
|
|
|
|
| (t) | Amended and Restated Agreement, dated April 10, 2015, between General Electric Company and General Electric Capital Corporation (Incorporated by reference to Exhibit 10 to GE's Current Report on Form 8-K, dated April 10, 2015 (Commission file number 001-00035)). |
|
|
|
|
|
| (u) | Early Retirement Agreement & Release between General Electric Company and Keith Sherin effective January 8, 2017. (Incorporated by reference to Exhibit 10(u) to GE's Annual Report on Form 10-K for the fiscal year ended December 31, 2017 (Commission file number 001-00035)). |
| |||
|
| (v) | Separation Agreement & Release between General Electric Company and Jeffrey Bornstein effective October 12, 2017.* |
|
|
|
|
|
| (w) | Separation Agreement & Release between General Electric Company and Elizabeth Comstock effective October 10, 2017.* |
|
|
| |
|
| (x) | Revolving Credit Agreement dated as of January 15, 2018, among General Electric Company, as the borrower, and Citibank, N.A., as the bank.* |
|
|
| |
|
| (y) | Revolving Credit Agreement dated as of January 15, 2018, among General Electric Company, as the borrower, and Goldman Sachs Bank USA and Goldman Sachs Lending Partners, LLC, as the lenders.* |
|
|
| |
|
| (z) | Revolving Credit Agreement dated as of January 15, 2018, among General Electric Company, as the borrower, and Morgan Stanley Senior Funding, Inc., as the bank.* |
|
|
| |
(11) |
| Statement re Computation of Per Share Earnings.** | |
| |||
12(a) |
| Computation of Ratio of Earnings to Fixed Charges.* | |
| |||
12(b) |
| Computation of Ratio of Earnings to Combined Fixed Charges and Preferred Stock Dividends.* | |
| |||
(21) |
| Subsidiaries of Registrant.* | |
| |||
(23) |
| Consent of Independent Registered Public Accounting Firm.* | |
| |||
(24) |
| Power of Attorney.* | |
| |||
GE 2017 FORM 10-K 203
OTHER INFORMATION |
|
|
31(a) |
| Certification Pursuant to Rules 13a-14(a) or 15d-14(a) under the Securities Exchange Act of 1934, as amended.* | |
| |||
31(b) |
| Certification Pursuant to Rules 13a-14(a) or 15d-14(a) under the Securities Exchange Act of 1934, as amended.* | |
| |||
(32) |
| Certification Pursuant to 18 U.S.C. Section 1350.* | |
| |||
99(a) |
| Undertaking for Inclusion in Registration Statements on Form S-8 of General Electric Company (Incorporated by reference to Exhibit 99(b) to General Electric Annual Report on Form 10-K (Commission file number 001-00035) for the fiscal year ended December 31, 1992). | |
|
|
| |
99(b) |
| Computation of Ratio of Earnings to Fixed Charges (Incorporated by reference to Exhibit 12(a) to GE Capital's Annual Report on Form 10-K for the fiscal year ended December 31, 2014 (Commission file number 001-06461)). | |
|
|
| |
99(c) |
| Supplement to Present Required Information in Searchable Format.* | |
|
|
| |
(101) |
| The following materials from General Electric Company's Annual Report on Form 10-K for the year ended December 31, 2017, formatted in XBRL (eXtensible Business Reporting Language); (i) Statement of Earnings (Loss) for the years ended December 31, 2017, 2016 and 2015, (ii) Consolidated Statement of Comprehensive Income for the years ended December 31, 2017, 2016 and 2015, (iii) Statement of Financial Position at December 31, 2017 and 2016, (iv) Statement of Cash Flows for the years ended December 31, 2017, 2016 and 2015, and (v) the Notes to Consolidated Financial Statements.* | |
| |||
* | Filed electronically herewith. | ||
** | Information required to be presented in Exhibit 11 is provided in Note 16 to the consolidated financial statements in this Form 10-K Report in accordance with the provisions of Financial Accounting Standards Board Accounting Standards Codification 260, Earnings Per Share . | ||
204 GE 2017 FORM 10-K
OTHER INFORMATION |
|
|
FORM 10-K CROSS REFERENCE INDEX
Item Number |
| Page(s) | ||
Part I |
|
|
|
|
Item 1. |
| Business |
| 12-13, 25-57, 68-69 |
|
|
|
|
|
Item 1A. |
| Risk Factors |
| 106-111 |
Item 1B. |
| Unresolved Staff Comments |
| Not applicable |
|
|
|
|
|
Item 2. |
| Properties |
| 13 |
|
|
|
|
|
Item 3. |
| Legal Proceedings |
| 112-114 |
|
|
|
|
|
Item 4. |
| Mine Safety Disclosures |
| 91 |
|
|
|
|
|
Part II |
|
|
|
|
Item 5. |
| Market for Registrant's Common Equity, Related Stockholder Matters and Issuer Purchases of Equity Securities |
| 19, 105 |
|
|
|
|
|
Item 6. |
| Selected Financial Data |
| 104 |
|
|
|
|
|
Item 7. |
| Management's Discussion and Analysis of Financial Condition and Results of Operations |
| 14-103 |
|
|
|
|
|
Item 7A. |
| Quantitative and Qualitative Disclosures About Market Risk |
| 73-74, 176-180 |
|
|
|
|
|
Item 8. |
| Financial Statements and Supplementary Data |
| 119-199 |
|
|
|
|
|
Item 9. |
| Changes in and Disagreements With Accountants on Accounting and Financial Disclosure |
| Not applicable |
|
|
|
|
|
Item 9A. |
| Controls and Procedures |
| 116 |
|
|
|
|
|
Item 9B. |
| Other Information |
| Not applicable |
Part III |
|
|
|
|
Item 10. |
| Directors, Executive Officers and Corporate Governance |
| 200 |
|
|
|
|
|
Item 11. |
| Executive Compensation |
| (a) |
|
|
|
|
|
Item 12. |
| Security Ownership of Certain Beneficial Owners and Management and Related Stockholder Matters |
| (b), 169-171 |
|
|
|
|
|
Item 13. |
| Certain Relationships and Related Transactions, and Director Independence |
| (c) |
|
|
|
|
|
Item 14. |
| Principal Accountant Fees and Services |
| (d) |
Part IV |
|
|
|
|
Item 15. |
| Exhibits and Financial Statement Schedules |
| 201-204 |
Item 16. |
| Form 10-K Summary |
| 3-10, (e) |
|
|
|
|
|
Signatures |
|
| 206 | |
(a) | Incorporated by reference to "Compensation" in the 2018 Proxy Statement. |
(b) | Incorporated by reference to "Stock Ownership Information" in the 2018 Proxy Statement. |
(c) | Incorporated by reference to "Related Person Transactions" and "How We Assess Director Independence" in the 2018 Proxy Statement. |
(d) | Incorporated by reference to "Independent Auditor Information" in the 2018 Proxy Statement. |
(e) | The Introduction & Summary does not include Part III information because it will be incorporated by reference to the 2018 Proxy Statement. |
GE 2017 FORM 10-K 205
SIGNATURES
Pursuant to the requirements of Section 13 or 15(d) of the Securities Exchange Act of 1934, the registrant has duly caused this annual report on Form 10-K for the fiscal year ended December 31, 2017, to be signed on its behalf by the undersigned, and in the capacities indicated, thereunto duly authorized in the City of Boston and Commonwealth of Massachusetts on the 23 rd day of February 2018.
General Electric Company
(Registrant)
By | /s/ Jamie S. Miller |
| Jamie S. Miller Senior Vice President and Chief Financial Officer (Principal Financial Officer) |
Pursuant to the requirements of the Securities Exchange Act of 1934, this report has been signed below by the following persons on behalf of the registrant and in the capacities and on the dates indicated.
| Signer |
| Title |
| Date |
|
|
|
|
|
|
| /s/ Jamie S. Miller |
| Principal Financial Officer |
| February 23, 2018 |
| Jamie S. Miller Chief Financial Officer |
|
|
|
|
|
|
|
|
|
|
| /s/ Jan R. Hauser |
| Principal Accounting Officer |
| February 23, 2018 |
| Jan R. Hauser |
|
|
|
|
|
|
|
|
|
|
| /s/ John L. Flannery |
| Principal Executive Officer |
| February 23, 2018 |
| John L. Flannery* Chairman of the Board of Directors |
|
|
|
|
|
|
|
|
|
|
| Sébastien M. Bazin* |
| Director |
|
|
| W. Geoffrey Beattie* |
| Director |
|
|
| John J. Brennan* |
| Director |
|
|
| Francisco D'Souza* |
| Director |
|
|
| Edward P. Garden* |
| Director |
|
|
| Peter B. Henry* |
| Director |
|
|
| Susan Hockfield* |
| Director |
|
|
| Risa Lavizzo-Mourey* |
| Director |
|
|
| Rochelle B. Lazarus* |
| Director |
|
|
| James J. Mulva* |
| Director |
|
|
| James E. Rohr* |
| Director |
|
|
| Mary L. Schapiro* |
| Director |
|
|
| James S. Tisch* |
| Director |
|
|
|
|
|
|
|
|
| A majority of the Board of Directors |
|
|
|
|
|
|
|
|
|
|
|
|
|
|
|
|
*By | /s/ Christoph A. Pereira |
|
|
|
|
| Christoph A. Pereira |
|
|
|
|
206 GE 2017 FORM 10-K