Table of Contents
|
UNITED STATES
SECURITIES AND EXCHANGE COMMISSION
WASHINGTON, D.C. 20549
__________________________________________________
FORM
10-K
☑ |
| ANNUAL REPORT PURSUANT TO SECTION 13 OR 15(d) OF THE SECURITIES EXCHANGE ACT OF 1934 |
For the fiscal year ended December 31, 2013
OR
o |
| TRANSITION REPORT PURSUANT TO SECTION 13 OR 15(d) OF THE SECURITIES EXCHANGE ACT OF 1934 |
For the transition period from to
Commission file number 001-34819
GREEN DOT CORPORATION
(Exact name of Registrant as specified in its charter)
Delaware (State or other jurisdiction of incorporation or organization) |
| 95-4766827 (IRS Employer Identification No.) |
3465 E. Foothill Blvd. Pasadena, California 91107 (Address of principal executive offices, including zip code) |
| (626) 765-2000 (Registrant's telephone number, including area code) |
Securities registered pursuant to Section 12(b) of the Act: | ||
Class A Common Stock, $0.001 par value (Title of each class) |
| New York Stock Exchange (Name of each exchange on which registered) |
Securities registered pursuant to Section 12(g) of the Act: None
__________________________________________________
Indicate by check mark if the registrant is a well-known seasoned issuer, as defined in Rule 405 of the Securities Act. Yes ☑ No o
Indicate by check mark if the registrant is not required to file reports pursuant to Section 13 or Section 15(d) of the Act. Yes o No ☑
Indicate by check mark whether the registrant (1) has filed all reports required to be filed by Section 13 or 15(d) of the Securities Exchange Act of 1934 during the preceding 12 months (or for such shorter period that the registrant was required to file such reports), and (2) has been subject to such filing requirements for the past 90 days. Yes ☑ No o
Indicate by check mark whether the registrant has submitted electronically and posted on its corporate Web site, if any, every Interactive Data File required to be submitted and posted pursuant to Rule 405 of Regulation S-T (§ 232.405 of this chapter) during the preceding 12 months (or for such shorter period that the registrant was required to submit and post such files). Yes ☑ No o
Indicate by check mark if disclosure of delinquent filers pursuant to Item 405 of Regulation S-K (§ 229.405 of this chapter) is not contained herein, and will not be contained, to the best of registrant's knowledge, in definitive proxy or information statements incorporated by reference in Part III of this Form 10-K or any amendment to this Form 10-K. o
Indicate by check mark whether the registrant is a large accelerated filer, an accelerated filer, a non-accelerated filer, or a smaller reporting company. See definition of "large accelerated filer," "accelerated filer" and "smaller reporting company" in Rule 12b-2 of the Exchange Act. (Check one):
Large accelerated file r ☑ |
| Accelerated filer o |
| Non-accelerated filer o |
| Smaller reporting company o |
|
|
|
| (Do not check if a smaller reporting company) |
|
|
Indicate by check mark whether the registrant is a shell company (as defined in Rule 12b-2 of the Exchange Act). Yes o No ☑
The aggregate market value of the common equity held by non-affiliates of the registrant (assuming for these purposes, but without conceding, that all executive officers, directors and 10% or greater stockholders are "affiliates" of the registrant) as of June 30, 2013 , the last business day of the registrant's most recently completed second fiscal quarter, was approxim ately $635.1 million (b ased on the closing sale price of the registrant's common stock on that date as reported on the New York Stock Exchange).
There were 37,797,987 shares of Class A common stock, par value $.001 per share (which number does not include 6,859,000 shares of Class A common stock issuable upon conversion of Series A Convertible Junior Participating Non-Cumulative Perpetual Preferred Stock) as of January 31, 2014 .
DOCUMENTS INCORPORATED BY REFERENCE
Portions of the registrant's proxy statement relating to the registrant's 2014 Annual Meeting of Stockholders, to be held on or about May 21, 2014, are incorporated by reference into Part III of this Annual Report on Form 10-K where indicated.
|
GREEN DOT CORPORATION
TABLE OF CONTENTS
|
| Page |
|
|
|
| PART I. |
|
Item 1. | Business | 1 |
Item 1A. | Risk Factors | 13 |
Item 1B. | Unresolved Staff Comments | 27 |
Item 2. | Properties | 27 |
Item 3. | Legal Proceedings | 27 |
Item 4. | Mine Safety Disclosures | 27 |
|
|
|
| PART II. |
|
Item 5. | Market for Registrant's Common Equity, Related Stockholder Matters and Issuer Purchases of Equity Securities | 28 |
Item 6. | Selected Financial Data | 30 |
Item 7. | Management's Discussion and Analysis of Financial Condition and Results of Operations | 32 |
Item 7A. | Quantitative and Qualitative Disclosures About Market Risk | 48 |
Item 8. | Financial Statements and Supplementary Data | 50 |
Item 9. | Changes in and Disagreements with Accountants on Accounting and Financial Disclosure | 87 |
Item 9A. | Controls and Procedures | 87 |
Item 9B. | Other Information | 87 |
|
|
|
| PART III. |
|
Item 10. | Directors, Executive Officers and Corporate Governance | 89 |
Item 11. | Executive Compensation | 89 |
Item 12. | Security Ownership of Certain Beneficial Owners and Management and Related Stockholder Matters | 89 |
Item 13. | Certain Relationships and Related Transactions, and Director Independence | 89 |
Item 14. | Principal Auditor Fees and Services | 89 |
|
|
|
| PART IV. |
|
Item 15. | Exhibits, Financial Statement Schedules | 90 |
| Signature | 91 |
| Exhibit Index | 92 |
FORWARD-LOOKING STATEMENTS
This report contains forward-looking statements regarding future events and our future results that are subject to the safe harbors created under the Securities Act of 1933 (the "Securities Act") and the Securities Exchange Act of 1934 (the "Exchange Act"). All statements other than statements of historical facts are statements that could be deemed to be forward-looking statements. These statements are based on current expectations, estimates, forecasts and projections about the industries in which we operate and the beliefs and assumptions of our management. Words such as "expects," "anticipates," "targets," "goals," "projects," "intends," "plans," "believes," "seeks," "estimates," "continues," "endeavors," "strives," "may" and "assumes," variations of such words and similar expressions are intended to identify forward-looking statements. In addition, any statements that refer to projections of our future financial performance, our anticipated growth and trends in our businesses, and other characterizations of future events or circumstances are forward-looking statements. Readers are cautioned that these forward-looking statements are subject to risks, uncertainties, and assumptions that are difficult to predict, including those identified below, under "Part I, Item 1A. Risk Factors," and elsewhere herein. Therefore, actual results may differ materially and adversely from those expressed in any forward-looking statements. We undertake no obligation to revise or update any forward-looking statements for any reason.
In this report, unless otherwise specified or the context otherwise requires, "Green Dot," "we," "us," and "our" refer to Green Dot Corporation and its consolidated subsidiaries, the term "GPR cards" refers to general purpose reloadable prepaid debit cards, the term "prepaid cards" refers to prepaid debit cards and the term "our cards" refers to our Green Dot-branded and co-branded GPR cards. In addition, "prepaid financial services" refers to GPR cards and associated reload services, a segment of the prepaid card industry.
Table of Contents
PART I
ITEM 1. Business
Overview
Green Dot Corporation is a technology-centric, pro-consumer bank holding company with a mission to reinvent personal banking for the masses. We believe that we are the largest provider of prepaid debit card products and prepaid card reloading services in the United States, as well as a leader in mobile banking with our GoBank mobile bank account offering. Our products are available to consumers at more than 90,000 retailers nationwide, online and via the leading app stores. Our products and services include Green Dot-branded and co-branded GPR cards, Visa-branded gift cards, reload services through our Green Dot Network, using our MoneyPak product or through retailers' specially-enabled POS devices, and GoBank, an innovative checking account developed for distribution and use via smartphones and other mobile devices.
The combination of our innovative products and services, broad retail distribution and proprietary technology creates powerful network effects, which we believe enhance the value we deliver to our customers, our retail distributors and other participants in our network.
We were incorporated in Delaware in October 1999 as Next Estate Communications, Inc. and changed our name to Green Dot Corporation in October 2005. We completed our initial public offering of Class A common stock in July 2010. In December 2011, we became a bank holding company under the Bank Holding Company Act of 1956, as amended, or the BHC Act, as a result of our acquisition of Bonneville Bancorp, the holding company of Bonneville Bank, a state-chartered Utah bank, which was renamed Green Dot Bank and became a member bank of the Federal Reserve System after the acquisition. In February 2014, we completed the process of transitioning our card issuing program with GE Capital Retail Bank to Green Dot Bank. Upon this transition, all Green Dot-branded and Walmart MoneyCard GPR cards and the GoBank product we offer are issued by Green Dot Bank.
We manage our operations and allocate resources as a single operating segment. Financial information regarding our operations, assets and liabilities, including our total operating revenues and net income for the years ended December 31, 2013 , 2012 , and 2011 and our total assets as of December 31, 2013 and 2012 are included in our consolidated financial statements and related notes in Item 8, Financial Statements and Supplementary Data .
Our principal executive offices are located at 3465 East Foothill Boulevard, Pasadena, California 91107, and our telephone number is (626) 765-2000. We maintain a website at www.greendot.com. We make available free of charge, on or through our website via the Investor Relations section at ir.greendot.com, our annual report on Form 10-K, quarterly reports on Form 10-Q, current reports on Form 8-K, and all amendments to those reports filed or furnished pursuant to Section 13(a) or 15(d) of the Exchange Act as soon as reasonably practicable after filing such material electronically or otherwise furnishing it to the Securities and Exchange Commission, or the SEC. References to website addresses in this report are intended to be inactive textual references only, and none of the information contained on our website is part of this report or incorporated in this report by reference.
Our Business Model
Our business model focuses on three major elements: our consumers; our distribution; and our products and services.
Our Consumers
We have designed our products and services to appeal primarily to consumers living in households that earn less than $75,000 annually across the following four consumer segments:
• | Never-banked - households in which no one has ever had a bank account, |
• | Previously-banked - households in which at least one member has previously had a bank account, but no one has one currently, |
• | Underbanked - households in which at least one member currently has a bank account, but that also use non-bank financial service providers to conduct routine transactions like check cashing or bill payment, |
• | Fully-banked - households that primarily rely on traditional financial services. |
Based on data from the Federal Deposit Insurance Corporation, or FDIC, the Federal Reserve Bank, the U.S. Census, the Center for Financial Services Innovation and our proprietary data, we believe the addressable portions of these four consumer segments collectively represent a market opportunity of approximately 160 million people in the United States for our products and services.
1
Table of Contents
Customers in these different segments tend to purchase and use our products for different reasons and in different ways. For example, we believe never-banked consumers use our products as a safe, controlled way to spend cash and as a means to access channels of trade, such as online purchases, where cash cannot be used. We believe previously-banked consumers use our products as a convenient and affordable substitute for a traditional checking account by depositing payroll checks (via direct or in-store deposit) on a Green Dot GPR card and using our products to pay bills, shop online, monitor spending and withdraw cash from ATMs.
We believe underbanked consumers use our products in ways similar to those of the never- and previously-banked segments, but additionally view our products as a credit card and debit card substitute. For example, underbanked consumers use our products to make purchases at physical and online merchants, pay bills, make travel arrangements and guarantee reservations.
We believe fully-banked consumers use our products as companion products to their bank checking account, segregating funds into separate accounts for a variety of uses. For example, fully-banked consumers may use our cards to shop on the Internet without providing their bank debit card account information online. These consumers also use our products to control spending, designate funds for specific uses, prevent overdrafts in their checking accounts, or load funds into specific accounts, such as a PayPal account. As our new GoBank product gains adoption, we believe that fully-banked consumers will use it in the same way that other fully-banked customers use their bank checking accounts.
Our Products and Services
Our principal products and services consist of Green Dot-branded GPR cards, co-branded GPR cards and MoneyPak and point-of-sale, or POS, swipe reload transactions facilitated by the Green Dot Network. We also offer our recently-introduced GoBank product and we service general purpose gift cards, which have historically represented only a small percentage of our operating revenues. The Green Dot-branded and Walmart MoneyCard GPR cards and the GoBank product we offer are issued by Green Dot Bank and certain of our smaller co-branded cards are issued by third-party banks. Card balances are FDIC-insured and have either Visa or MasterCard zero liability card protection.
Card Products
Green Dot-Branded GPR Cards. Our Green Dot-branded GPR cards provide consumers with an affordable and convenient way to manage their money and make payments without undergoing a credit check or possessing a pre-existing bank account. GPR cards are designed for general spending purposes, are reloadable for ongoing long-term use, and can be used anywhere their applicable payment network, such as Visa or MasterCard, is accepted. In addition to standard prepaid Visa- or MasterCard-branded GPR cards, we also offer GPR cards positioned for a specific use or market, such as our Online Shopping card, our Prepaid Student card and our Prepaid NASCAR card.
To purchase a GPR card in a retail store location, consumers typically select the temporary GPR card from an in-store display and pay the cashier a one-time purchase fee plus the initial amount they would like to load onto their card. Consumers then go online or call a toll-free number to register their personal information with us so that we can activate their temporary prepaid card and mail them a personalized GPR card. As explained below, consumers can then reload their personalized GPR cards using a MoneyPak or, at enabled retailers, via an automated point-of-sale process, which we refer to as a POS swipe reload transaction. Funds can also be loaded on the card via direct deposit of various disbursements, such as a customer's payroll check.
Our GPR cards are issued as Visa- or MasterCard-branded cards and can be used by consumers at the more than 30 million locations worldwide that accept these brands, including for bill payments, everyday store purchases, online shopping, ATM withdrawals and electronic payments through mobile devices. Our cardholders can conduct ATM transactions at approximately 1.9 million Visa PLUS or 2.1 million MasterCard Cirrus ATMs worldwide, including more than 24,000 MoneyPass fee-free ATMs in all 50 states.
We have instituted a simple fee structure that includes a new card fee (if the card is purchased from one of our retail distributors), a monthly maintenance fee (which may be waived based on usage), a cash reload fee and an ATM withdrawal fee for out-of-network ATMs. Most of the features and functions of our cards are provided without surcharges. Our free services include direct deposit reloads, account management, and balance inquiry services via the Internet, telephone and mobile applications.
For regulatory compliance, risk management, operational and other reasons, our GPR cards and reload products have certain limitations and restrictions, including but not limited to maximum dollar reload amounts, maximum numbers of reloads in a given time period (e.g., per day), and limitations on uses of our temporary cards versus our permanent personalized cards.
2
Table of Contents
Co-Branded GPR Cards. We provide co-branded GPR cards on behalf of certain retail distributors and other business entities and affinity groups. Co-branded cards generally bear the trademarks or logos of the retail distributor or business entity or affinity group, and our trademark on the packaging and back of the card. These cards have the same features and characteristics as our Green Dot-branded GPR cards, and are accepted at the same locations. We typically are responsible for managing all aspects of these programs, including strategy, product design, marketing, customer service and operations/compliance. Representative co-branded cards include the Walmart MoneyCard, the NASCAR Prepaid Visa card, the RushCard Live Prepaid Visa card and the Mossy Oak Prepaid MasterCard.
GoBank. GoBank is an innovative new checking account product that allows customers to acquire and manage their checking account entirely through a mobile application available on smartphone devices. In June 2013, we made our GoBank product available nationwide. We expect our GoBank product to be distributed through new distribution channels with mobile partners and potentially through our existing distribution channels, including at the store locations of many of our existing retail distributors.
Reload Services
We generate cash transfer revenues when consumers purchase our reload services. We offer consumers affordable and convenient ways to reload any of our GPR cards and cards from more than 120 third-party prepaid card programs, and to conduct other cash loading transactions through our reload network, using our MoneyPak product or through retailers' specially-enabled POS devices. MoneyPak is offered in all of the retail locations where our GPR cards are sold. MoneyPak is a cash reload product that we market on a display like our Green Dot-branded GPR cards. Cash reloads using a MoneyPak involve a two-step process: consumers pay the cashier the desired amount to be added onto the MoneyPak, plus a service fee, generally ranging between $3.00 and $4.95, and then go online or call a toll-free number to submit the unique MoneyPak number and add the funds to a GPR card or other account, such as participating billers or a PayPal account. Alternatively, at many retail locations, consumers can add funds directly to their Green Dot- branded and co-branded cards at the point of sale through an automated POS swipe reload transaction. Unlike a MoneyPak, these POS swipe reload transactions involve a single-step process: consumers pay the cashier the desired amount to be reloaded, plus a service fee, and funds are reloaded onto the GPR card at the point of sale without further action required on the part of the consumer.
Our Distribution
We achieve broad distribution of our products and services through our retail distributors, the Internet and relationships with other businesses. In addition, our distribution is enhanced by businesses that accept reloads or payments through the Green Dot Network, which we refer to as our network acceptance members, because they encourage their customers to use our prepaid financial services.
Retail Distributors. Our prepaid financial services are sold in more than 90,000 retail store locations, including those of major national mass merchandisers and discount retailers, national and regional drug store and convenience store chains, national and regional supermarket chains and regional financial service centers. Our retail distributors include:
Type of Distributor |
| Representative Distributors |
Mass merchandise retailers |
| Walmart, Kmart, Home Depot |
Discount retailers |
| Dollar Tree, Dollar General, Family Dollar |
Drug store retailers |
| Walgreens, CVS, Rite Aid |
Convenience store retailers |
| 7-Eleven, The Pantry (Kangaroo Express), Circle K |
Supermarket retailers |
| Kroger, Blackhawk Network, Inc. |
Financial service centers |
| RiteCheck, Pay-O-Matic |
Other |
| Radio Shack |
Most of these retailers have been our distributors for several years and all have contracts with us, subject to termination rights, which expire at various dates from 201 4 to 2018. In g eneral, our agreements with our retail distributors give us the right to provide Green Dot-branded and/or co-branded GPR cards and reload services in their retail locations and require us to share with them by way of commissions the revenues generated by sales of these cards and reload services. We and the retail distributor generally also agree to certain marketing arrangements, such as promotions and advertising. Our operating revenues derived from products and services sold at the store locations of Walmart and our three other largest retail distributors, as a group, represented the following percentages of our total operating revenues: approximately 64% and 22% , respectively, for the year ended December 31, 2013 , 64% and 20% ,
3
Table of Contents
respectively, for the year ended December 31, 2012 , 61% and 20% , respectively, for the year ended December 31, 2011 .
Our Relationship with Walmart. Walmart is our largest retail distributor. We have been the exclusive provider of Walmart-branded GPR cards sold at Walmart since Walmart initiated its Walmart MoneyCard program in 2007. Pursuant to our agreement with Walmart and our subsidiary bank, Green Dot Bank (the card issuing bank), Green Dot designs and delivers the Walmart MoneyCard product and provides all ongoing program support, including network IT, regulatory and legal compliance, website functionality, customer service and loss management. Walmart displays and sells the cards and Green Dot Bank serves as the issuer of the cards and holds the associated FDIC-insured deposits. All Walmart MoneyCard products are reloadable exclusively on the Green Dot Network.
Walmart has the right to terminate our agreement prior to its expiration or renewal, but subject to notice periods of varying lengths and for a number of specified reasons, including, among others: our failure to meet agreed-upon service levels, certain changes in control of Green Dot Bank or us, or Green Dot Bank's or our inability or unwillingness to agree to requested pricing changes.
In October 2006, we entered into our initial agreements with Walmart and GE Capital Retail Bank, the then-card issuing bank, which set forth the terms and conditions of our relationship with Walmart. In May 2010, the term of the agreement among Green Dot, Walmart and GE Capital Retail Bank was extended through May 2015. The parties also agreed to various other changes to the terms of the agreement. In particular, the sales commission percentages that we pay to Walmart for the Walmart MoneyCard program increased significantly in May 2010 and increased by a smaller amount in May 2013.
In October 2013, we and Walmart expanded the line of cards offered at Walmart, including new card types within the Walmart MoneyCard program as well as GPR cards of other brands, including our own. Green Dot Bank is the card issuing bank for all of these new products. In February 2014, we transitioned our card issuing program with GE Capital Retail Bank to Green Dot Bank. Upon this transition, all Walmart MoneyCards are now issued by Green Dot Bank.
Other Channels. An increasing portion of our card sales are generated from our and Walmart's online distribution channels and other non-retail channels. We offer Green Dot-branded cards through our website, www.greendot.com and the Walmart MoneyCard through www.walmartmoneycard.com. We promote these distribution channels through television and online advertising. Customers who activate their cards through these channels typically receive an unfunded card in the mail and then can reload the card either through a cash reload or a payroll or other direct deposit transaction. Our GoBank product is offered as a mobile application on smartphones and other mobile devices and through our website, www.gobank.com.
Network Acceptance Members. A large number of institutions that offer their own prepaid cards accept funds through our reload network, using our MoneyPak product. We provide reload services to over 120 third-party prepaid card programs, including programs offered by UniRush, H&R Block, and AccountNow. MasterCard's RePower Reload Network also uses the Green Dot Network to facilitate cash reloads for its own member programs. In addition, we provide reload services to other kinds of institutions and their customers. For example, we enable PayPal customers to use a MoneyPak to fund a new or existing PayPal account.
Sales and Marketing
The primary objectives of our sales and marketing efforts are to educate consumers on the utility of our products and services in order to generate demand, and to instruct consumers on where they may purchase our products and services. We also seek to educate existing customers on the use of our products and services to encourage increased usage and retention of our products. We accomplish these objectives through various types of consumer-oriented marketing and advertising and by expanding our group of retail and other distributors to gain access to additional customers.
Marketing to Consumers
We market our products to a broad group of consumers, ranging from never-banked to fully-banked consumers. We are focusing our current sales and marketing efforts on acquisition of long-term users of our products, enhancing our brands and image, building market adoption and awareness of our products, improving cardholder retention and increasing card usage. To achieve these objectives, we highlight to consumers the core benefits of our products, which we believe are affordability, access to funds, utility, convenience, transparency and security.
Our marketing campaigns for our prepaid financial services involve creating a compelling in-store presence and conducting television advertising, retailer promotions such as circulars, online advertisements, and co-op advertising with select retail distributors. In addition, the marketing strategy for our new GoBank product includes a heavy reliance
4
Table of Contents
on social media and digital channels such as popular destinations for mobile application downloads, as well as financial sponsorships aimed at creating awareness of the product. We focus on raising brand awareness while educating our customers.
We also design, and provide to our retail distributors for use in their stores, innovative packaging and in-store displays that we believe generate consumer interest and differentiate our products from other card products on their racks. Our packaging and displays help ensure that our products are promoted in a consistent, visual manner that is designed to invite consumers to browse and learn about our products, and thus to increase our sales opportunities.
We employ a number of strategies to improve cardholder retention and increase card usage. These strategies are based on research we conduct on an ongoing basis to understand consumer behavior and improve consumer loyalty and satisfaction. For example, we use our points of contact with customers (e.g., our website, email, interactive voice response system, or IVR, and mobile applications) to educate our customers and promote new card features. We also provide incentives for behaviors, such as cash reloading, establishing payroll direct deposit and making frequent purchases with our cards, that we believe increase cardholder retention. In particular, we believe that our fee waiver program, which eliminates monthly maintenance fees for customers who deposit $1,000 or more to the card or conduct at least 30 transactions with the card during a monthly billing cycle, contributes significantly to cardholder retention within certain of our customer segments.
Marketing to Retail Distributors
When marketing our prepaid financial services to potential new retail distributors, we highlight several key benefits, including our leading national brand, our in-store presence and merchandising expertise, our cash reload network, the profitability to them of our products and our commitment to national television and other advertising. In addition, we communicate the peripheral benefits of our products, such as their ability to generate additional foot traffic and sales in their stores and higher average purchase amount per transaction.
Marketing to Our Network Acceptance Members
We market our reload network to a broad range of banks, third-party processors, program managers and others that have uses for our reload network's cash transfer technology. When marketing to potential network acceptance members, we highlight the key benefits of our cash loading network, including the breadth of our distribution capabilities, our leadership position in the industry, the profitability to them of our products, consumer satisfaction owing to the consistency in the user experience and our commitment to national television and other advertising and marketing support.
Customer Service
We provide customer service for all GPR card and gift card programs that we manage and for GoBank and MoneyPak on a 24-hour per day, 365-day per year basis, primarily through third-party service providers in Guatemala and the Philippines, and also through our staff in the United States. All card activations, reloads, support and lost/stolen inquiries are handled online and through various toll-free numbers at these locations. We also operate our own call center at our headquarters for handling customer and corporate escalations. Customer service is provided in both English and Spanish.
Competition
We operate in highly competitive and rapidly changing markets, which have become increasingly competitive. Unlike many companies operating in the prepaid financial services industry, we provide simple, low-cost and convenient money management solutions to a broad based of U.S. consumers through the combination of our innovative products and services, broad retail distribution and proprietary technology. Consequently, we compete against the full spectrum of companies across the prepaid financial services industry as well as companies providing traditional banking services. In addition to the direct competitors described below, we compete for access to retail distribution channels and for the attention of consumers at the retail level.
Prepaid Card Issuance and Program Management
Through Green Dot Bank, we offer Green Dot-branded and several co-branded GPR card programs and Visa-branded gift cards. We compete against the full spectrum of providers of GPR cards. We also compete with traditional providers of financial services, such as banks that offer demand deposit accounts and debit card products, and card issuers that offer credit cards, private label retail cards and gift cards. Many of these institutions are substantially larger and have greater resources, larger and more diversified customer bases and greater brand recognition than we do. Many of these companies can also leverage their extensive customer bases and adopt aggressive pricing policies to gain market share. Our primary competitors in the prepaid card issuance and program management market are traditional credit, debit and prepaid card account issuers and prepaid card program managers like American Express,
5
Table of Contents
First Data, NetSpend, AccountNow, UniRush, Western Union and MoneyGram. In addition, from time to time, new entrants, such as T-Mobile, introduce prepaid card products that could increase competition in this market. Our Green Dot-branded cards also compete with our co-branded GPR cards, such as the Walmart MoneyCard.
We believe that the principal competitive factors for the prepaid card issuance and program management market include:
• | breadth of distribution; |
• | brand recognition; |
• | the ability to reload funds; |
• | compliance and regulatory capabilities; |
• | enterprise-class and scalable IT; |
• | customer support capabilities; and |
• | pricing. |
We believe our products compete favorably on each of these factors.
Reload Networks
We offer our MoneyPak and POS swipe reload proprietary products, which enable cash loading and transfer services through our Green Dot Network. While we believe our Green Dot Network is the leading reload network for prepaid cards in the United States, a growing number of companies are attempting to establish and grow their own reload networks. In this market, new companies, or alliances among existing companies, may be formed that rapidly achieve a significant market position. Many of these companies are substantially larger than we are and have greater resources, larger and more diversified customer bases and greater name recognition than we do. Our primary competitors in the reload network services market are: Visa, Western Union, MoneyGram, Blackhawk Network, Inc., and Incomm. Visa has broad brand recognition and a large base of merchant acquiring and card issuing banks. Western Union, MoneyGram, Blackhawk Network, Inc., and Incomm each have a national network of retail and/or agent locations. In addition, we compete for consumers and billers with financial institutions that provide their retail customers with billing, payment and funds transfer services. Many of these institutions are substantially larger and have greater resources, larger and more diversified customer bases and greater brand recognition than we do.
We believe that the principal competitive factors for reload network services include:
• | the number and quality of retail locations; |
• | brand recognition; |
• | product and service functionality; |
• | number of cardholders and customers using the service; |
• | reliability of the service; |
• | consistency of the user experience; |
• | retail price; |
• | enterprise-class and scalable IT; |
• | ability to integrate quickly with multiple payment platforms and distributors; |
• | customer support capabilities; and |
• | compliance and regulatory capabilities. |
We believe the Green Dot Network competes favorably on each of these factors.
Prepaid Card Distribution
Our products and services are available to consumers at more than 90,000 retailers nationwide, online and via leading app stores. We compete against the full spectrum of prepaid card distributors and third-party processors that sell competing prepaid card programs through retail and online channels. Many of these institutions are substantially larger and have greater resources, larger and more diversified customer bases and greater brand recognition than we do. Many of these companies can also leverage their extensive customer bases and adopt aggressive pricing policies to gain market share. As new payment methods are developed, we also expect to encounter competition from new
6
Table of Contents
entrants. Our primary competitors in the prepaid card distribution market are: InComm, Blackhawk Network, Inc., First Data, NetSpend, and American Express. In addition, we face potential competition from Western Union, MoneyGram and a number of retail banks if they enter this market.
We believe that the principal competitive factors for the prepaid card distribution market include:
• | brand recognition with consumers and retailers; |
• | the ability to easily reload funds; |
• | ability to develop and maintain strong relationship with retail distributors; |
• | compliance and regulatory capabilities; |
• | pricing; and |
• | large customer base. |
We believe our products compete favorably on each of these factors.
Personal Banking Services
With the nationwide launch of GoBank in June 2013, we have expanded into the market for consumer checking accounts. In this market we compete against a wide range of both traditional and non-traditional banks, including the largest banks. Many of these banks have greater resources, larger and more diversified customer bases and greater brand recognition than we do. Many of these banks also have other assets that could give them an advantage, including broader ranges of product offerings and/or retail branch networks. We believe that our consumer checking account products will be differentiated by their innovative technological features, innovative distribution model, consumer-friendly pricing, and branding.
We believe that the principal competitive factors for personal banking services include:
• | brand recognition with consumers and distribution partners; |
• | marketing capabilities; |
• | product features; |
• | ability to develop and maintain strong relationship with distributors; |
• | compliance and regulatory capabilities; and |
• | pricing. |
We believe that our GoBank product competes favorably on each of these factors. However, investments in new products such as GoBank are speculative. Accordingly, there can be no assurance that GoBank will be adopted by consumers or otherwise achieve commercial success .
Intellectual Property
We rely on a combination of patent, trademark and copyright laws and trade secret protection in the United States, as well as confidentiality procedures and contractual provisions, to protect the intellectual property rights related to our products and services.
We own several trademarks, including Green Dot, MoneyPak, GoBank, and the Green Dot logo. These assets are essential to our business. Through agreements with our network acceptance members, retail distributors and customers, we authorize and monitor the use of our trademarks in connection with their activities with us.
Our patent portfolio currently consists of four patents and nine patent applications. The term of the patents we hold is, on average, twenty years. We feel our patents and applications are essential to our business and help to differentiate our products and services from those of our competitors.
The industry in which we compete is characterized by rapidly changing technology, a large number of patents, and frequent claims and related litigation regarding patent and other intellectual property rights. There can be no assurance that our patents and other proprietary rights will not be challenged, invalidated, or circumvented; that others will not assert intellectual property rights to technologies that are relevant to us; or that our rights will give us a competitive advantage. In addition, the laws of some foreign countries may not protect our proprietary rights to the same extent as the laws of the United States. The risks associated with patents and intellectual property are more fully discussed in "Item 1A. Risk Factors," including the risk factors entitled " We must adequately protect our brand and the intellectual
7
Table of Contents
property rights related to our products and services and avoid infringing on the proprietary rights of others ," and " We must be able to operate and scale our technology effectively to manage any future growth."
Regulation
Compliance with legal and regulatory requirements is a highly complex and integral part of our day-to-day operations. Our products and services are generally subject to federal, state and local laws and regulations, including:
• | anti-money laundering laws; |
• | money transfer and payment instrument licensing regulations; |
• | escheatment laws; |
• | privacy and information safeguard laws; |
• | banking regulations; and |
• | consumer protection laws. |
These laws are often evolving and sometimes ambiguous or inconsistent, and the extent to which they apply to us, our subsidiary bank or the banks that issue our cards, our retail distributors, our network acceptance members or our third-party processors is at times unclear. Any failure to comply with applicable law - either by us or by the card issuing banks, retail distributors, network acceptance members or third-party processors, over which we have limited legal and practical control - could result in restrictions on our ability to provide our products and services, as well as the imposition of civil fines and criminal penalties and the suspension or revocation of a license or registration required to sell our products and services.
We continually monitor and enhance our compliance program to stay current with the most recent legal and regulatory changes. We also continue to implement policies and programs and to adapt our business practices and strategies to help us comply with current legal standards, as well as with new and changing legal requirements affecting particular services or the conduct of our business generally. These programs include dedicated compliance personnel and training and monitoring programs, as well as support and guidance to our retail distributors and network acceptance members on compliance programs.
Anti-Money Laundering Laws
Our products and services are generally subject to federal anti-money laundering laws, including the Bank Secrecy Act, as amended by the USA PATRIOT Act, and similar state laws. On an ongoing basis, these laws require us, among other things, to:
• | report large cash transactions and suspicious activity; |
• | screen transactions against the U.S. government's watch-lists, such as the Specially Designated Nationals and Blocked Persons List maintained by the Office of Foreign Assets Control; |
• | prevent the processing of transactions to or from certain countries, individuals, nationals and entities; |
• | identify the dollar amounts loaded or transferred at any one time or over specified periods of time, which requires the aggregation of information over multiple transactions; |
• | gather and, in certain circumstances, report customer information; |
• | comply with consumer disclosure requirements; and |
• | register or obtain licenses with state and federal agencies in the United States and seek registration of our retail distributors and network acceptance members when necessary. |
Anti-money laundering regulations are constantly evolving. We continuously monitor our compliance with anti-money laundering regulations and implement policies and procedures in order to comply with the most current legal requirements. We cannot predict how these future regulations might affect us. Complying with future regulation could be expensive or require us to change the way we operate our business.
We are registered with the Financial Crimes Enforcement Network, or FinCEN, as a money services business. As a result of being so registered, we have established anti-money laundering compliance programs that include: (i) internal policies and controls; (ii) designation of a compliance officer; (iii) ongoing employee training and (iv) an independent review function. We have developed and implemented compliance programs comprised of policies, procedures, systems and internal controls to monitor and address various legal requirements and developments. To assist in managing and monitoring money laundering risks, we continue to enhance our anti-money laundering
8
Table of Contents
compliance program. We offer our services largely through our retail distributor and network acceptance member relationships. We have developed an anti-money laundering training manual and a program to assist in educating our retail distributors on applicable anti-money laundering laws and regulations.
Money Transmitter Licensing Regulations
We are subject to money transmitter licensing regulations. We have obtained licenses to operate as a money transmitter in 39 states, Puerto Rico and Washington, D.C. The remaining U.S. jurisdictions either do not currently regulate money transmitters or have rendered a regulatory determination or a legal interpretation that the money services laws of that jurisdiction do not require us to obtain a license in connection with the conduct of our business. As a licensee, we are subject to certain restrictions and requirements, including reporting, net worth and surety bonding requirements and requirements for regulatory approval of controlling stockholders, agent locations and consumer forms and disclosures. We are also subject to inspection by the regulators in the jurisdictions in which we are licensed, many of which conduct regular examinations.
In addition, we must at all times maintain "permissible investments" in an amount equivalent to all "outstanding payment obligations." The definition and interpretation of outstanding payment obligations may vary by jurisdiction and, in some cases, may include the balances on our card products even though technically, the outstanding payment obligations represented by the balances on our card products are liabilities of the issuing bank. Accordingly, it is possible that some states will require us to maintain permissible investments in an amount equal to the outstanding payment obligations of the bank that issues our cards. The types of securities that are considered "permissible investments" vary from state to state, but generally include cash and cash equivalents, U.S. government securities and other highly rated debt instruments.
Escheatment Laws
Unclaimed property laws of every U.S. jurisdiction require that we track certain information on our card products and services and that, if customer funds are unclaimed at the end of an applicable statutory abandonment period, the proceeds of the unclaimed property be remitted to the appropriate jurisdiction. We have agreed with the banks that issue our cards to manage escheatment law compliance with respect to our card products and services and have an ongoing program to comply with those laws. Statutory abandonment periods applicable to our card products and services typically range from three to seven years.
Privacy and Information Safeguard Laws
In the ordinary course of our business, we collect certain types of data, which subjects us to certain privacy and information security laws in the United States, including, for example, the Gramm-Leach-Bliley Act of 1999, or the GLB Act, and other laws or rules designed to regulate consumer information and mitigate identity theft. We are also subject to privacy laws of various states. These state and federal laws impose obligations with respect to the collection, processing, storage, disposal, use and disclosure of personal information, and require that financial institutions have in place policies regarding information privacy and security. In addition, under federal and certain state financial privacy laws, we must provide notice to consumers of our policies and practices for sharing nonpublic information with third parties, provide advance notice of any changes to our policies and, with limited exceptions, give consumers the right to prevent use of their nonpublic personal information and disclosure of it to unaffiliated third parties. Certain state laws may, in some circumstances, require us to notify affected individuals of security breaches of computer databases that contain their personal information. These laws may also require us to notify state law enforcement, regulators or consumer reporting agencies in the event of a data breach, as well as businesses and governmental agencies that own data. In order to comply with the privacy and information safeguard laws, we have confidentiality/information security standards and procedures in place for our business activities and with network acceptance members and our third-party vendors and service providers. Privacy and information security laws evolve regularly, requiring us to adjust our compliance program on an ongoing basis and presenting compliance challenges.
Banking Regulations
We became a bank holding company in December 2011, as a result of our acquisition of Bonneville Bancorp, the holding company of Bonneville Bank, a state-chartered Utah bank, which was renamed Green Dot Bank after the acquisition. We and our subsidiary bank are extensively regulated under federal and state laws, which, in general, results in increased compliance costs and other expenses, as we and our subsidiary bank are required to undergo regular on-site examinations and to comply with additional reporting requirements. As a bank holding company, we are subject to the supervision of, and inspection by, the Federal Reserve Board and are subject to certain regulations which, among other things, restrict our business and the activities in which we may engage. Our existing business activities and currently proposed business activities are not materially restricted by these regulations.
9
Table of Contents
Activities. Federal laws restrict the types of activities in which bank holding companies may engage, and subject them to a range of supervisory requirements, including regulatory enforcement actions for violations of laws and policies. Bank holding companies may engage in the business of banking and managing and controlling banks, as well as closely related activities. In addition, financial holding companies may engage in a wider set of activities, including with respect to securities activities and investments in companies engaged in nonbanking activities. The business activities that we currently conduct are permissible activities for bank holding companies under U.S. law, and we do not expect the limitations described above will adversely affect our current operations or materially restrict us from engaging in activities that are currently contemplated by our business strategies. It is possible, however, that these restrictions could limit our ability to enter other businesses in which we may wish to engage at some time in the future. It is also possible that in the future these laws may be amended in ways, or new laws or regulations may be adopted, that adversely affect our ability to engage in our current or additional businesses.
Even if our activities are permissible for a bank holding company, as discussed under "- Capital Adequacy" below, the Federal Reserve Board has the authority to order a bank holding company or its subsidiaries to terminate any activity or to require divestiture of ownership or control of a subsidiary in the event that it has reasonable cause to believe that the activity or continued ownership or control poses a serious risk to the financial safety, soundness or stability of the bank holding company or any of its bank subsidiaries.
Dividend Restrictions. Bank holding companies are subject to various restrictions that may affect their ability to pay dividends. Federal and state banking regulations applicable to bank holding companies and banks generally require that dividends be paid from earnings and, as described under "- Capital Adequacy" below, require minimum levels of capital, which limits the funds available for payment of dividends. Other restrictions include the Federal Reserve Board's general policy that bank holding companies should pay cash dividends on common stock only out of net income available to stockholders for the preceding year or four quarters and only if the prospective rate of earnings retention is consistent with the organization's expected future needs and financial condition, including the needs of each of its bank subsidiaries. In the current financial and economic environment, the Federal Reserve Board has indicated that bank holding companies should carefully review their dividend policies and has discouraged dividend pay-out ratios that are at the 100% level unless both their asset quality and capital are very strong. A bank holding company also should not maintain a dividend level that places undue pressure on the capital of its bank subsidiaries, or that may undermine the bank holding company's ability to serve as a source of strength for its bank subsidiaries. See "- Source of Strength" below.
As part of our financial commitments to the Federal Reserve Board and Utah Department of Financial Institutions, our subsidiary bank, Green Dot Bank, is restricted from paying dividends for 3 years from the date of acquisition.
Capital Adequacy. Bank holding companies and banks are subject to various requirements relating to capital adequacy, including limitations on leverage. As a bank holding company that is a financial holding company, we are required to be "well-capitalized," meaning we must maintain a ratio of Tier 1 capital to risk-weighted assets of at least 6% and a ratio of total capital to risk-weighted assets of at least 10%. In addition, we are also subject to the generally applicable bank holding company minimum Tier 1 leverage ratio of 4%, which is the ratio of Tier 1 capital to average total consolidated assets. Tier 1 capital, or "core" capital, generally consists of common stockholders' equity, perpetual non-cumulative preferred stock and, up to certain limits, other capital elements. Tier 2 capital consists of supplemental capital items such as the allowance for loan and lease losses, certain types of preferred stock, hybrid capital securities and certain types of debt, all subject to certain limits. Total capital is the sum of Tier 1 capital plus Tier 2 capital.
Our subsidiary bank is also subject to separate capital and leverage requirements that we have committed to with the Federal Reserve Board and Utah Department of Financial Institutions. As of December 31, 2013 , we and our subsidiary bank are each "well-capitalized" under the above standards and presently exceed our respective capital and leverage commitments.
In December 2010, the international Basel Committee on Banking Supervision reached an agreement on new risk-based capital, leverage and liquidity standards, known as "Basel III." In June 2012, the Federal Reserve and other U.S. banking regulators proposed rules to implement many aspects of Basel III in the United States. The U.S. Basel III proposals contain new capital standards that would raise the quality of capital, increase minimum capital ratios and strengthen counterparty credit risk capital requirements. The U.S. Basel III proposals also include a new definition of common equity Tier 1 capital and would require that certain levels of such common equity Tier 1 capital be maintained. The proposals also include a new capital conservation buffer, which would impose a common equity requirement above the new minimum that can be depleted under stress, and could result in restrictions on capital distributions and discretionary bonuses under certain circumstances, as well as a new standardized approach for calculating risk-weighted assets.
10
Table of Contents
In July 2013, the Federal Reserve and other U.S. banking regulators approved the final Basel III rules, which took effect on January 1, 2014 and will be phased in over several years. Basel III continues to be subject to interpretation by the U.S. banking regulators.
Under the regulatory framework that Congress has established and bank regulators have implemented, banks are either "well-capitalized," "adequately capitalized," "undercapitalized," "significantly undercapitalized" or "critically undercapitalized." Banks are generally subject to greater restrictions and supervision than bank holding companies, and these restrictions increase as the financial condition of the bank worsens. For instance, a bank that is not well-capitalized may not accept, renew or roll over brokered deposits without the consent of the FDIC. If our subsidiary bank were to become less than adequately capitalized, the bank would need to submit to bank regulators a capital restoration plan that was guaranteed by us, as its bank holding company. The bank would also likely become subject to further restrictions on activities, such as entering into new lines of business, or would be required to conduct activities that have the effect of limiting asset growth or preventing acquisitions. A bank that is undercapitalized would also be prohibited from making capital distributions, including dividends, and from paying management fees to its bank holding company if the institution would be undercapitalized after any such distribution or payment. A significantly undercapitalized institution would be subject to mandatory capital raising activities, restrictions on interest rates paid and transactions with affiliates, removal of management and other restrictions. The FDIC has only very limited discretion in dealing with a critically undercapitalized institution and is virtually required to appoint a receiver or conservator. Under these regulatory guidelines, we remain well capitalized.
Source of Strength. Under Federal Reserve Board policy, bank holding companies are expected to act as a source of strength to their bank subsidiaries. This support may theoretically be required by the Federal Reserve Board at times when the bank holding company might otherwise determine not to provide it. As noted above, if a bank becomes less than adequately capitalized, it would need to submit an acceptable capital restoration plan that, in order to be acceptable, would need to be guaranteed by the parent holding company. In the event of a bank holding company's bankruptcy, any commitment by the bank holding company to a federal bank regulator to maintain the capital of a subsidiary bank would be assumed by the bankruptcy trustee and entitled to a priority of payment. In addition, under the Dodd-Frank Wall Street Reform and Consumer Protection Act of 2010, or the Dodd-Frank Act, the Federal Reserve Board is required to adopt new regulations formally requiring bank holding companies to serve as a source of strength to their subsidiary depository institutions. The Federal Reserve Board has not yet proposed rules to implement this requirement.
Acquisitions of Bank Holding Companies. Under the BHC Act and the Change in Bank Control Act, and their respective implementing regulations, Federal Reserve Board approval is necessary prior to any person or company acquiring control of a bank or bank holding company, subject to certain exceptions. Control is conclusively presumed to exist if an individual or company acquires 25% or more of any class of voting securities, and may be presumed to exist if a person acquires 10% or more of any class of voting securities. These restrictions could affect the willingness or ability of a third party to acquire control of us for so long as we are a bank holding company particularly if the third party was not also a bank holding company.
Deposit Insurance and Deposit Insurance Assessments. Deposits accepted by banks, such as our subsidiary bank, have the benefit of FDIC insurance up to the applicable limits. The FDIC's Deposit Insurance Fund is funded by assessments on insured depository institutions, the level of which depends on the risk category of an institution and the amount of insured deposits that it holds. These rates currently range from 2.5 to 45 basis points on deposits. The FDIC may increase or decrease the assessment rate schedule semi-annually, and has in the past required and may in the future require banks to prepay their estimated assessments for future periods. The Dodd-Frank Act changes the method of calculating deposit assessments, requiring the FDIC to assess premiums on the basis of assets less tangible stockholders' equity. The FDIC has indicated that this change will likely result in a lower assessment rate because of the larger assessment base. Because of the current stress on the FDIC's Deposit Insurance Fund resulting from the banking crisis, those fees have increased and are likely to stay at a relatively high level.
Community Reinvestment Act. The Community Reinvestment Act of 1977, or CRA, and the regulations promulgated by the FDIC to implement the CRA are intended to ensure that banks meet the credit needs of their respective service areas, including low and moderate income communities and individuals, consistent with safe and sound banking practices. The CRA regulations also require the banking regulatory authorities to evaluate a bank's record in meeting the needs of its service area when considering applications to establish new offices or consummate any merger or acquisition transaction. The federal banking agencies are required to rate each insured institution's performance under the CRA and to make that information publicly available. Our subsidiary bank currently complies with the CRA through investments and other activities that are designed to benefit the needs of low and moderate income communities.
Restrictions on Transactions with Affiliates and Insiders. Transactions between a bank and its nonbanking affiliates are regulated by the Federal Reserve Board. These regulations limit the types and amount of these transactions, require certain levels of collateral for loans to affiliated parties and generally require those transactions to be on an
11
Table of Contents
arm's-length basis. As a bank holding company, our transactions with our subsidiary bank are limited by these regulations, although we do not anticipate that these restrictions will adversely affect our ability to conduct our current operations or materially prohibit us from engaging in activities that are currently contemplated by our business strategies.
Issuing Banks . All of the GPR cards that we provide and the Walmart gift cards we service are issued by Green Dot Bank or either a federally- or state-chartered third-party bank. Thus, we are subject to the oversight of the regulators for, and certain laws applicable to, these card issuing banks. These banking laws require us, as a servicer to the banks that issue our cards, among other things, to undertake compliance actions similar to those described under "Anti-Money Laundering Laws" above and to comply with the privacy regulations promulgated under the GLB Act as discussed under "Privacy and Information Safeguard Laws" above. Our subsidiary bank is subject to the additional regulatory oversight and legal obligations described above, in its capacity as issuing bank of our GPR cards.
Other. The policies of regulatory authorities, including the monetary policy of the Federal Reserve Board, have a significant effect on the operating results of bank holding companies and their subsidiaries. Moreover, additional changes to banking laws and regulations are possible in the near future. The Dodd-Frank Act made numerous changes to the regulatory framework governing banking organizations, and many of these changes require rulemakings by regulators, only a portion of which have been completed. These regulations could likewise substantially affect our business and operations. In addition, the U.S. Congress is considering various proposals relating to the activities and supervision of banks and bank holding companies, some of which could materially affect our operations and those of our subsidiary bank. Although there can be no assurance regarding the ultimate impact that adoption of these proposals will have on us, if the proposals are enacted, we expect that the benefits we seek to realize from our recent bank acquisition will be reduced.
Consumer Protection Laws
We are subject to state and federal consumer protection laws, including laws prohibiting unfair and deceptive practices, regulating electronic fund transfers and protecting consumer nonpublic information. We believe that we have appropriate procedures in place for compliance with these consumer protection laws, but many issues regarding our service have not yet been addressed by the federal and state agencies charged with interpreting the applicable laws.
In order to permit the direct deposit of Federal benefits and other Federal funds to our products, we comply with the requirements of the Electronic Fund Transfer Act of the Federal Reserve Board, or Regulation E, as they relate to payroll cards, including disclosure of the terms of our electronic fund transfer services to consumers prior to their use of the service, 21 days ' advance notice of material changes, specific error resolution procedures and timetables, and limits on customer liability for transactions that are not authorized by the consumer.
In June 2011, the Consumer Financial Protection Bureau, or CFPB, issued a notice and request for comment on defining what kinds of companies should be included as "larger participants" for its nonbank supervision program. The CFPB subsequently published its first "larger participant" proposed rule, in February 2012, defining nonbank "larger participants" as entities engaged in consumer debt collection and consumer reporting. The CFPB published final rules regarding " larger participants " engaged in consumer reporting and consumer debt collection in, respectively, July 2012 and October 2012. Although the CFPB did not include prepaid card issuers in these rules, the CFPB may take actions in the future, including other rulemakings, that subject us or our products and services to its oversight and regulation.
In May 2012, the CFPB issued an Advanced Notice of Proposed Rulemaking seeking information from the public regarding GPR cards. Although rules were not published in the Advanced Notice of Proposed Rulemaking, we believe that the CFPB is focused on whether some or all of the provisions of Regulation E should apply to GPR cards and on the product fees, disclosures and product features of GPR cards.
Payment Networks
In order to provide our products and services, we, as well as the banks that issue our cards, must register with Visa and MasterCard and, as a result, are subject to payment network rules that could subject us to a variety of fines or penalties that may be levied by the payment networks for certain acts or omissions. The banks that issue our cards are specifically registered as "members" of the Visa and/or MasterCard payment networks. Visa and MasterCard set the standards with which we and the card issuing banks must comply.
Employees
As of December 31, 2013 , we had 562 employees, including 331 in general and administrative, 80 in sales and marketing, and 151 in research and product development. None of our employees is represented by a labor union or is covered by a collective bargaining agreement. We have never experienced any employment-related work stoppages and consider relations with our employees to be good. As of December 31, 2013 , we also had arrangements with third-
12
Table of Contents
party call center providers in Guatemala and the Philippines that provided us with approximately 1,269 contractors for customer service and similar functions.
ITEM 1A. Risk Factors
Risks Related to Our Business
Our operating results may fluctuate in the future, which could cause our stock price to decline.
Our quarterly and annual results of operations may fluctuate in the future as a result of a variety of factors, many of which are outside of our control. If our results of operations fall below the expectations of investors or any securities analysts who follow our Class A common stock, the trading price of our Class A common stock could decline substantially. Fluctuations in our quarterly or annual results of operations might result from a number of factors, including, but not limited to:
• | the timing and volume of purchases, use and reloads of our prepaid cards and related products and services; |
• | the timing and success of new product or service introductions by us or our competitors; |
• | seasonality in the purchase or use of our products and services; |
• | reductions in the level of interchange rates that can be charged; |
• | fluctuations in customer retention rates; |
• | changes in the mix of products and services that we sell; |
• | changes in the mix of retail distributors through which we sell our products and services; |
• | the timing of commencement, renegotiation or termination of relationships with significant retail distributors and network acceptance members; |
• | the timing of commencement of new product development and initiatives that cause us to expand into new distribution channels, and the timing of costs of existing product roll-outs to new retail distributors and the length of time we must invest in those new products, channels or retail distributors before they generate material operating revenues; |
• | our ability to obtain timely regulatory approval for strategic initiatives; |
• | changes in our or our competitors' pricing policies or sales terms; |
• | significant changes in our risk policies and controls; |
• | the timing of costs related to fraud losses; |
• | the timing of commencement and termination of major advertising campaigns; |
• | the timing of costs related to the development or acquisition of complementary businesses; |
• | the timing of costs of any major litigation to which we are a party; |
• | the amount and timing of capital expenditures and operating costs related to the maintenance and expansion of our business, operations and infrastructure, including our investments in a processing solution to eventually replace our current processing services provider; |
• | accounting charges related to impairment of capitalized internal-use software, intangible assets and goodwill; |
• | our ability to control costs, including third-party service provider costs and sales and marketing expenses in an increasingly competitive market; |
• | volatility in the trading price of our Class A common stock, which may lead to higher or lower stock-based compensation expenses or fluctuations in the valuations of vesting equity that cause variations in our stock-based retailer incentive compensation; and |
• | changes in the political or regulatory environment affecting the banking or electronic payments industries generally or prepaid financial services specifically. |
13
Table of Contents
The loss of operating revenues from Walmart and our three other largest retail distributors would adversely affect our business.
Most of our operating revenues are derived from prepaid financial services sold at our four largest retail distributors. As a percentage of total operating revenues, operating revenues derived from products and services sold at the store locations of Walmart and from products and services sold at the store locations of our three other largest retail distributors, as a group, were approximately 64% and 22% , respectively, in the year ended December 31, 2013 . We do not expect the percentage of our 2013 total operating revenues derived from products and services sold at Walmart stores to change significantly from the percentage in the year ended December 31, 2013 , and expect that Walmart and our other three largest retail distributors will continue to have a significant impact on our operating revenues in future years. It would be difficult to replace any of our large retail distributors, particularly Walmart, and the operating revenues derived from sales of our products and services at their stores. Accordingly, the loss of Walmart or any of our other three largest retail distributors would have a material adverse effect on our business. In addition, any publicity associated with the loss of any of our large retail distributors could harm our reputation, making it more difficult to attract and retain consumers and other retail distributors, and could lessen our negotiating power with our remaining and prospective retail distributors.
Our contracts with these retail distributors have terms that expire at various dates between 2014 and 2015, but they can in limited circumstances, such as our material breach or insolvency or, in the case of Walmart, our failure to meet agreed-upon service levels, certain changes in control of us, our inability or unwillingness to agree to requested pricing changes, be terminated by these retail distributors on relatively short notice. Walmart also has the right to terminate its agreement prior to its expiration or renewal for a number of other specified reasons, including: a change by us in our card operating procedures that Walmart reasonably believes will have a material adverse effect on Walmart's operations; our inability or unwillingness to make Walmart MoneyCards reloadable outside of our reload network in the event that our reload network does not meet particular size requirements in the future; and in the event Walmart reasonably believes that it is reasonably possible, after the parties have explored and been unable to agree on any alternatives, that the Federal Reserve Board may determine that Walmart exercises a controlling influence over our management or policies. There can be no assurance that we will be able to continue our relationships with our largest retail distributors on the same or more favorable terms in future periods or that our relationships will continue beyond the terms of our existing contracts with them. Our operating revenues and operating results could suffer if, among other things, any of our retail distributors renegotiates, terminates or fails to renew, or to renew on similar or favorable terms, its agreement with us or otherwise chooses to modify the level of support it provides for our products.
Our future success depends upon our retail distributors' active and effective promotion of our products and services, but their interests and operational decisions might not always align with our interests.
Most of our operating revenues are derived from our products and services sold at the stores of our retail distributors. Revenues from our retail distributors depend on a number of factors outside our control and may vary from period to period. Because we compete with many other providers of consumer products, including competing prepaid cards, for placement and promotion of products in the stores of our retail distributors, our success depends on our retail distributors and their willingness to promote our products and services successfully. In general, our contracts with these third parties allow them to exercise significant discretion over the placement and promotion of our products in their stores; they could give higher priority to the products and services of other companies for a variety of reasons, and this risk is expected to become greater as we enter an environment in which our competitors are bringing to market at the stores of our retail distributors products and services that are, or that may be perceived to be, substantially similar to or better than ours. Accordingly, losing the support of our retail distributors might limit or reduce the sales of our cards and MoneyPak reload product. Our operating revenues may also be negatively affected by our retail distributors' operational decisions. For example, as retail distributors introduce and promote competing products at their store locations, as Walmart, Walgreens and CVS began to do in 2012, the growth of our product sales may decline at those stores. Similarly, if a retail distributor reduces shelf space for our products or implements changes in its systems that disrupt the integration between its systems and ours, our product sales could be reduced or decline. Even if our retail distributors actively and effectively promote our products and services, there can be no assurance that their efforts will maintain or result in growth of our operating revenues.
Our operating revenues for a particular period are difficult to predict, and a shortfall in our operating revenues may harm our results of operations.
Our operating revenues for a particular period are difficult to predict, especially in light of recent developments in the competitive environment of our market and related uncertainty. Our card revenues and other fees, cash transfer revenues and interchange revenues, collectively, may decline or grow at a slower rate than in prior periods. Our ability to meet financial expectations could be adversely affected by various factors such as increasing competition within the store locations of many of our largest retail distributors, and our continued implementation of enhanced risk control
14
Table of Contents
factors, which we believe is likely to, among other things, continue to adversely affect our new card activations from legitimate customers for the foreseeable future. We also expect seasonal or other influences, including potential fluctuations in stock-based retailer incentive compensation caused by variations in our stock price, to cause sequential quarterly fluctuations and periodic declines in our operating revenues, operating income and net income. For example, in recent years, our results for each of the first three quarters have been favorably affected by large numbers of taxpayers electing to receive their tax refunds via direct deposit on our cards, which caused our operating revenues to be typically higher in the first halves of those years than they were in the corresponding second halves of those years.
Our ability to increase card usage and cardholder retention and to attract new long-term users of our products can also have a significant effect on our operating revenues. We may be unable to generate increases in card usage, cardholder retention or attract new long-term users of our products for a number of reasons, including our inability to maintain our existing distribution channels, the failure of our cardholder retention and usage incentives to influence cardholder behavior, our inability to predict accurately consumer preferences or industry changes and to modify our products and services on a timely basis in response thereto, and our inability to produce new features and services that appeal to existing and prospective cardholders. As a result, our operating results could vary materially from period to period based on the degree to which we are successful in increasing card usage and cardholder attention and attracting long-term users of our products.
Any of the above factors could have a material adverse impact on our business, operating results and financial condition .
The industry in which we compete is highly competitive, which could adversely affect our operating results.
The prepaid financial services industry is highly competitive and includes a variety of financial and non-financial services vendors. We expect competition to intensify as existing competitors and new market entrants are bringing to market products and services that are substantially similar to ours or that may be perceived to be better than ours. For example, Walmart, Walgreens and CVS began selling competitive American Express-branded products at their store locations in 2012. Competition is expected to negatively impact our operating revenues, excluding stock-based retailer incentive compensation, and could cause us to compete on the basis of price or increase our sales and marketing expenses, any of which would likely seriously harm our business, operating results and financial condition. Our current and potential competitors include:
• | prepaid card program managers, such as American Express, First Data, Total Systems Services, AccountNow, and other traditional banks, such as J.P. Morgan Chase, that have entered the prepaid card market; |
• | reload network providers, such as Visa, Western Union and MoneyGram; and |
• | prepaid card distributors, such as InComm and Blackhawk Network |
Some of these vendors compete with us in more than one of the vendor categories described above, while others are primarily focused in a single category. In addition, competitors in one category have worked or are working with competitors in other categories to compete with us. A portion of our cash transfer revenues is derived from reloads to cards managed by companies that compete with us as program managers. We also face actual and potential competition from retail distributors or from other companies, such as PayPal and Visa that have decided or may in the future decide to compete, or compete more aggressively, in the prepaid financial services industry.
We also compete with businesses outside of the prepaid financial services industry, including traditional providers of financial services, such as banks that offer demand deposit accounts and card issuers that offer credit cards, private label retail cards and gift cards. In particular, our recently-introduced GoBank product is designed to compete directly with banks by providing products and services that they have traditionally provided. These and other competitors in the larger electronic payments industry are introducing new and innovative products and services, such as those involving radio frequency and proximity payment devices (such as contactless cards), e-commerce and mobile commerce, that compete with ours. We expect that this competition will intensify as the prepaid financial services industry and the larger banking and electronic payments industry continues to rapidly evolve.
Many existing and potential competitors have longer operating histories and greater name recognition than we do. In addition, many of our existing and potential competitors are substantially larger than we are, may already have or could develop substantially greater financial and other resources than we have, may offer, develop or introduce a wider range of programs and services than we offer or may use more effective advertising and marketing strategies than we do to achieve broader brand recognition, customer awareness and retail penetration. We could experience increased price competition as we are facing increased competition with a greater number of offerings from existing competitors and new market entrants at the stores of many of our retail distributors. If this happens, we expect that the purchase and use of our products and services would decline in the near term and farther into the future. If price competition
15
Table of Contents
materially intensifies, we may have to increase the incentives that we offer to our retail distributors and decrease the prices of our products and services, any of which would likely adversely affect our operating results.
Our long-term success depends on our ability to compete effectively against existing and potential competitors that seek to provide prepaid cards or other electronic payment products and services. If we fail to compete effectively against any of the foregoing threats, our revenues, operating results, prospects for future growth and overall business could be materially and adversely affected.
We make significant investments in products and services that may not be successful.
Our prospects for growth depend on our ability to innovate by offering new, and adding value to our existing, product and service offerings and on our ability to effectively commercialize such innovations. We will continue to make significant investments in research, development, and marketing for new products and services, including GoBank and other mobile or banking products arising out of our acquisitions or otherwise. Investments in new products and services are speculative. Commercial success depends on many factors, including innovativeness, price, the competitive environment and effective distribution and marketing. If customers do not perceive our new offerings as providing significant value, they may fail to accept our new products and services, which would negatively impact our operating revenues. We may not achieve significant operating revenues from new product and service investments for a number of years, if at all. Moreover, new products and services may not be profitable, and even if they are profitable, operating margins for new products and services may not be as high as the margins we have experienced in the past.
Fraudulent and other illegal activity involving our products and services could lead to reputational damage to us, reduce the use and acceptance of our cards and reload network, and may adversely affect our financial position and results of operations.
Criminals are using increasingly sophisticated methods to engage in illegal activities involving prepaid cards, reload products or cardholder information. These activities often include malicious social engineering schemes, where people are asked to provide a prepaid card or reload product in order to obtain a loan or purchase goods or services. Illegal activities may also include fraudulent payment or refund schemes and identity theft. We rely upon third parties for some transaction processing services, which subjects us and our cardholders to risks related to the vulnerabilities of those third parties. A single significant incident of fraud, or increases in the overall level of fraud, involving our cards and other products and services, could result in reputational damage to us, which could reduce the use and acceptance of our cards and other products and services, cause retail distributors or network acceptance members to cease doing business with us or lead to greater regulation that would increase our compliance costs. Fraudulent activity could also result in the imposition of regulatory sanctions, including significant monetary fines, which could adversely affect our business, operating results and financial condition. Furthermore, we have accelerated the implementation of risk control mechanisms that have made it more difficult for all customers, including legitimate customers, to obtain and use our products and services. We believe it is likely that our risk control mechanisms will continue to adversely affect our new card activations from legitimate customers for the foreseeable future and that our operating revenues, excluding stock-based retailer incentive compensation, will be negatively impacted as a result.
As a bank holding company, we are subject to extensive and potentially changing regulation and may be required to serve as a source of strength for Green Dot Bank, which may adversely affect our business, financial position and results of operations.
As a bank holding company, we are subject to comprehensive supervision and examination by the Federal Reserve Board and must comply with applicable regulations and other commitments we have agreed to, including financial commitments in respect to minimum capital and leverage requirements. If we fail to comply with any of these requirements, we may become subject to formal or informal enforcement actions, proceedings, or investigations, which could result in regulatory orders, restrictions on our business operations or requirements to take corrective actions, which may, individually or in the aggregate, affect our results of operations and restrict our ability to grow. If we fail to comply with the applicable capital and leverage requirements, or if our subsidiary bank fails to comply with its applicable capital and leverage commitments, the Federal Reserve Board may limit our ability to pay dividends, or if we become less than adequately capitalized, require us to raise additional capital. In addition, as a bank holding company and a financial holding company, we are generally prohibited from engaging, directly or indirectly, in any activities other than those permissible for bank holding companies and financial holding companies. This restriction might limit our ability to pursue future business opportunities which we might otherwise consider but which might fall outside the scope of permissible activities.
Moreover, in response to the financial crisis of 2008 and the Wall Street Reform and Consumer Protection Act, or the Dodd-Frank Act, banking supervisors in the United States continue to implement a variety of new requirements on banking entities. Some of these requirements apply or will apply directly to us or to our subsidiary bank, while certain requirements apply or will apply only to larger institutions. Although we cannot anticipate the final form of many of these
16
Table of Contents
regulations, how they will affect our business or results of operations, or how they will change the competitive landscape in which we operate, such regulations could have a material adverse impact on our business and financial condition, particularly if they make it more difficult for us or our retail distributors to sell our card products.
Changes in laws and regulations to which we are subject, or to which we may become subject, may increase our costs of operation, decrease our operating revenues and disrupt our business.
Changes in laws and regulations or the interpretation or enforcement thereof may occur that could increase our compliance and other costs of doing business, require significant systems redevelopment, or render our products or services less profitable or obsolete, any of which could have an adverse effect on our results of operations. We could face more stringent anti-money laundering rules and regulations, as well as more stringent licensing rules and regulations, compliance with which could be expensive and time consuming.
Changes in laws and regulations governing the way our products and services are sold or in the way those laws and regulations are interpreted or enforced could adversely affect our ability to distribute our products and services and the cost of providing those products and services. If onerous regulatory requirements were imposed on the sale of our products and services, the requirements could lead to a loss of retail distributors, which, in turn, could materially and adversely impact our operations. In addition, if our products are adversely impacted by the interpretation or enforcement of these regulations or we or any of our retail distributors were unwilling or unable to make any such operational changes to comply with the interpretation or enforcement thereof, we would no longer be able to sell our cards through that noncompliant retail distributor, which could have a material adverse effect on our business, financial position and results of operations.
State and federal legislators and regulatory authorities remain increasingly focused on the banking and consumer financial services industries, and may propose and adopt new legislation that could result in significant adverse changes in the regulatory landscape for financial institutions and financial services companies. For example, federal legislation, such as the bill proposed by Senator Menendez, known as the Prepaid Card Consumer Protection Act of 2013, could limit the amount of fees, including monthly fees, that we would be able to charge and could impose operational requirements, such as closing and refunding certain dormant prepaid cards, which could decrease our operating revenues and increase our operating expenses. Proposed legislation in New Jersey could, if passed, also limit the types and amounts of fees that we would be able to charge, which could decrease our operating revenues. Additionally, the Consumer Financial Protection Bureau, or CFPB, issued an advance notice of proposed rulemaking in May 2012, requesting comment on topics including the scope of regulation of prepaid cards, fees and disclosures applicable to prepaid cards, product features and other information. If the CFPB's rulemaking results in changes in the way we are regulated, these regulations could expose us to increased regulatory oversight, more burdensome regulation of our business, and increased litigation risk, each of which could increase our costs and decrease our operating revenues. Futhermore, changes to the limitations placed on fees or the disclosures that must be provided with respect to our products and services could increase our costs and decrease our operating revenues. However, as the CFPB has not yet proposed any such rules, and is not expected to until mid-2014, it is difficult to determine with any certainty what obligations the final rules might impose or what impact they might have on our business.
We operate in a highly regulated environment, and failure by us, the banks that issue our cards or the businesses that participate in our reload network to comply with applicable laws and regulations could have an adverse effect on our business, financial position and results of operations.
We operate in a highly regulated environment, and failure by us, the banks that issue our cards or the businesses that participate in our reload network to comply with the laws and regulations to which we are subject could negatively impact our business. We are subject to state money transmission licensing requirements and a wide range of federal and other state laws and regulations. In particular, our products and services are subject to an increasingly strict set of legal and regulatory requirements intended to protect consumers and to help detect and prevent money laundering, terrorist financing and other illicit activities.
Many of these laws and regulations are evolving, unclear and inconsistent across various jurisdictions, and ensuring compliance with them is difficult and costly. For example, with increasing frequency, federal and state regulators are holding businesses like ours to higher standards of training, monitoring and compliance, including monitoring for possible violations of laws by the businesses that participate in our reload network. Failure by us or those businesses to comply with the laws and regulations to which we are or may become subject could result in fines, penalties or limitations on our ability to conduct our business, or federal or state actions, any of which could significantly harm our reputation with consumers and other network participants, banks that issue our cards and regulators, and could materially and adversely affect our business, operating results and financial condition.
17
Table of Contents
Changes in rules or standards set by the payment networks, such as Visa and MasterCard, or changes in debit network fees or products or interchange rates, could adversely affect our business, financial position and results of operations.
We are subject to association rules that could subject us to a variety of fines or penalties that may be levied by the card associations or networks for acts or omissions by us or businesses that work with us, including card processors, such as Total System Services, Inc. The termination of the card association registrations held by us or any changes in card association or other debit network rules or standards, including interpretation and implementation of existing rules or standards, that increase the cost of doing business or limit our ability to provide our products and services could have an adverse effect on our business, operating results and financial condition. In addition, from time to time, card associations increase the organization and/or processing fees that they charge, which could increase our operating expenses, reduce our profit margin and adversely affect our business, operating results and financial condition.
Furthermore, a substantial portion of our operating revenues is derived from interchange fees. For the year ended December 31, 2013 , interchange revenues represented 29.9 % of our total operating revenues, and we expect interchange revenues to continue to represent a significant percentage of our total operating revenues. The amount of interchange revenues that we earn is highly dependent on the interchange rates that the payment networks set and adjust from time to time. The enactment of the Dodd-Frank Act required the Federal Reserve Board to implement regulations that have substantially limited interchange fees for many issuers. On July 31, 2013, the U.S. District Court in the District of Columbia overturned the Federal Reserve's rules regarding interchange fees and network exclusivity. The Federal Reserve is appealing the ruling and final resolution is expected in the first half of 2014. The current debit interchange cap and network exclusivity rules will remain in place until the Federal Reserve can replace the invalidated portions of the rule.
While we believe the interchange rates that may be earned by us and our subsidiary bank are exempt from the limitations imposed by the Dodd-Frank Act and will be unaffected by this ruling, there can be no assurance that future regulation or changes by the payment networks in response to this ruling will not impact our interchange revenues substantially. If interchange rates decline, whether due to actions by the payment networks or future regulation, we would likely need to change our fee structure to offset the loss of interchange revenues. However, our ability to make these changes is limited by the terms of our contracts and other commercial factors, such as price competition. To the extent we increase the pricing of our products and services, we might find it more difficult to acquire consumers and to maintain or grow card usage and customer retention, and we could suffer reputational damage and become subject to greater regulatory scrutiny. We also might have to discontinue certain products or services. As a result, our total operating revenues, operating results, prospects for future growth and overall business could be materially and adversely affected.
Our actual operating results may differ significantly from our guidance.
From time to time, we may issue guidance in our quarterly results conference calls, or otherwise, regarding our future performance that represents our management's estimates as of the date of release. This guidance, which includes forward-looking statements, is based on projections prepared by our management. These projections are not prepared with a view toward compliance with published guidelines of the American Institute of Certified Public Accountants, and neither our independent registered public accounting firm nor any other independent expert or outside party compiles or examines the projections. Accordingly, no such person expresses any opinion or any other form of assurance with respect to those projections.
Projections are based upon a number of assumptions and estimates that, while presented with numerical specificity, are inherently subject to significant business, economic and competitive uncertainties and contingencies, many of which are beyond our control, and are based upon specific assumptions with respect to future business decisions, some of which will change. We intend to state possible outcomes as high and low ranges that are intended to provide a sensitivity analysis as variables are changed but we can provide no assurances that actual results will not fall outside of the suggested ranges.
The principal reason that we release guidance is to provide a basis for our management to discuss our business outlook with analysts and investors. We do not accept any responsibility for any projections or reports published by any of these persons.
Guidance is necessarily speculative in nature, and it can be expected that some or all of the assumptions underlying the guidance furnished by us will prove to be incorrect or will vary significantly from actual results. Accordingly, our guidance is only an estimate of what management believes is realizable as of the date of release. Actual results will vary from our guidance and the variations may be material. In light of the foregoing, investors are urged not to rely upon our guidance in making an investment decision with respect to our Class A common stock.
18
Table of Contents
Any failure to implement our operating strategy successfully or the occurrence of any of the events or circumstances set forth in this Item 1A could result in our actual operating results being different from our guidance, and such differences may be adverse and material.
We receive important services from third-party vendors, including card processing from Total System Services, Inc. Replacing them would be difficult and disruptive to our business.
Some services relating to our business, including fraud management and other customer verification services, transaction processing and settlement, card production and customer service are outsourced to third-party vendors, such as Total System Services, Inc. for card processing and Genpact International, Inc. for call center services. It would be difficult to replace some of our third-party vendors, particularly Total System Services, Inc., in a timely manner if they were unwilling or unable to provide us with these services during the term of their agreements with us and our business and operations could be adversely affected. In February 2013, we amended our card processing agreement with Total System Services, Inc. to extend the term of our agreement by sixteen months to December 31, 2015.
Our business could suffer if there is a decline in the use of prepaid cards as a payment mechanism or there are adverse developments with respect to the prepaid financial services industry in general.
As the prepaid financial services industry evolves, consumers may find prepaid financial services to be less attractive than traditional or other financial services. Consumers might not use prepaid financial services for any number of reasons, including the general perception of our industry. For example, negative publicity surrounding other prepaid financial service providers could impact our business and prospects for growth to the extent it adversely impacts the perception of prepaid financial services among consumers. If consumers do not continue or increase their usage of prepaid cards, our operating revenues may remain at current levels or decline. Predictions by industry analysts and others concerning the growth of prepaid financial services as an electronic payment mechanism may overstate the growth of an industry, segment or category, and you should not rely upon them. The projected growth may not occur or may occur more slowly than estimated. If consumer acceptance of prepaid financial services does not continue to develop or develops more slowly than expected or if there is a shift in the mix of payment forms, such as cash, credit cards, traditional debit cards and prepaid cards, away from our products and services, it could have a material adverse effect on our financial position and results of operations.
A data security breach could expose us to liability and protracted and costly litigation, and could adversely affect our reputation and operating revenues.
We and our retail distributors, network acceptance members, third-party processors and the merchants that accept our cards receive, transmit and store confidential customer and other information in connection with the sale and use of our prepaid financial services. Our encryption software and the other technologies we use to provide security for storage, processing and transmission of confidential customer and other information may not be effective to protect against data security breaches by third parties. The risk of unauthorized circumvention of our security measures has been heightened by advances in computer capabilities and the increasing sophistication of hackers. Our retail distributors, network acceptance members, third-party processors and the merchants that accept our cards also may experience similar security breaches involving the receipt, transmission and storage of our confidential customer and other information. Improper access to our or these third parties' systems or databases could result in the theft, publication, deletion or modification of confidential customer and other information.
A data security breach of the systems on which sensitive cardholder data and account information are stored could lead to fraudulent activity involving our products and services, reputational damage and claims or regulatory actions against us. If we are sued in connection with any data security breach, we could be involved in protracted and costly litigation. If unsuccessful in defending that litigation, we might be forced to pay damages and/or change our business practices or pricing structure, any of which could have a material adverse effect on our operating revenues and profitability. We would also likely have to pay (or indemnify the banks that issue our cards for) fines, penalties and/or other assessments imposed by Visa or MasterCard as a result of any data security breach. Further, a significant data security breach could lead to additional regulation, which could impose new and costly compliance obligations. In addition, a data security breach at one of the third-party banks that issue our cards or at our retail distributors, network acceptance members or third-party processors could result in significant reputational harm to us and cause the use and acceptance of our cards to decline, either of which could have a significant adverse impact on our operating revenues and future growth prospects. Moreover, it may require substantial financial resources to address and remediate any such breach, which could have a significant adverse impact on our operating results.
19
Table of Contents
Litigation or investigations could result in significant settlements, fines or penalties.
We are subject to regulatory oversight in the normal course of our business, and have been and from time to time may be subject to regulatory or judicial proceedings or investigations. The outcome of securities class actions and other litigation and regulatory or judicial proceedings or investigations is difficult to predict. Plaintiffs or regulatory agencies or authorities in these matters may seek recovery of very large or indeterminate amounts, seek to have aspects of our business suspended or modified or seek to impose sanctions, including significant monetary fines. The monetary and other impact of these actions, litigations, proceedings or investigations may remain unknown for substantial periods of time. The cost to defend, settle or otherwise resolve these matters may be significant. Further, an unfavorable resolution of litigation, proceedings or investigations could have a material adverse effect on our business, operating results, or financial condition. In this regard, such costs could make it more difficult to maintain the capital, leverage and other financial commitments at levels we have agreed to with the Federal Reserve Board and the Utah Department of Financial Institutions.
If regulatory or judicial proceedings or investigations were to be initiated against us by private or governmental entities, adverse publicity that may be associated with these proceedings or investigations could negatively impact our relationships with retail distributors, network acceptance members and card processors and decrease acceptance and use of, and loyalty to, our products and related services, and could impact the price of our Class A common stock. In addition, such proceedings or investigations could increase the risk that we will be involved in litigation. The outcome of any such litigation is difficult to predict and the cost to defend, settle or otherwise resolve these matters may be significant. For the foregoing reasons, if regulatory or judicial proceedings or investigations were to be initiated against us by private or governmental entities, our business, results of operations and financial condition could be adversely affected or our stock price could decline.
We must adequately protect our brand and our intellectual property rights related to our products and services and avoid infringing on the proprietary rights of others.
The Green Dot and GoBank brands are important to our business, and we utilize trademark registrations and other means to protect them. Our business would be harmed if we were unable to protect our brand against infringement and its value was to decrease as a result.
We rely on a combination of patent, trademark and copyright laws, trade secret protection and confidentiality and license agreements to protect the intellectual property rights related to our products and services. We currently have four patents outstanding and nine patents pending. Although we generally seek patent protection for inventions and improvements that we anticipate will be incorporated into our products and services, there is always a chance that our patents or patent applications could be challenged, invalidated or circumvented, or that an issued patent will not adequately cover the scope of our inventions or improvements incorporated into our products or services. Additionally, our patents could be circumvented by third-parties.
Recent and proposed changes to U.S. patent laws and rules may also affect our ability to protect and enforce our intellectual property rights. For example, the recently passed Leahy-Smith America Invents Act, will transition the manner in which patents are issued and change the way in which issued patents are challenged. The long-term impact of these changes are unknown, but this law could cause a certain degree of uncertainty surrounding the enforcement and defense of our issued patents, as well as greater costs concerning new and existing patent applications.
We may unknowingly violate the intellectual property or other proprietary rights of others and, thus, may be subject to claims by third parties. These assertions may increase over time as a result of our growth and the general increase in the pace of patent claims assertions, particularly in the United States. Because of the existence of a large number of patents in the mobile technology field, the secrecy of some pending patents, and the rapid rate of issuance of new patents, it is not economically practical or even possible to determine in advance whether a product or any of its elements infringes or will infringe on the patent rights of others. Regardless of the merit of these claims, we may be required to devote significant time and resources to defending against these claims or to protecting and enforcing our own rights. We might also be required to develop a non-infringing technology or enter into license agreements and there can be no assurance that licenses will be available on acceptable terms and conditions, if at all. Some of our intellectual property rights may not be protected by intellectual property laws, particularly in foreign jurisdictions. The loss of our intellectual property or the inability to secure or enforce our intellectual property rights or to defend successfully against an infringement action could harm our business, results of operations, financial condition and prospects.
20
Table of Contents
We are exposed to losses from cardholder accounts.
Fraudulent activity involving our products may lead to cardholder disputed transactions, for which we may be liable under banking regulations and payment network rules. Our fraud detection and risk control mechanisms may not prevent all fraudulent or illegal activity. To the extent we incur losses from disputed transactions, our business, results of operations and financial condition could be materially and adversely affected.
Additionally, our cardholders can incur charges in excess of the funds available in their accounts, and we may become liable for these overdrafts. While we decline authorization attempts for amounts that exceed the available balance in a cardholder's account, the application of card association rules, the timing of the settlement of transactions and the assessment of the card's monthly maintenance fee, among other things, can result in overdrawn accounts.
Maintenance fee assessments accounted for approximately 96% of aggregate overdrawn account balances in the year ended December 31, 2013 , as compared to approximately 94% in the year ended December 31, 2012 . Maintenance fee assessment overdrafts occur as a result of our charging a cardholder, pursuant to the card's terms and conditions, the monthly maintenance fee at a time when he or she does not have sufficient funds in his or her account.
Our remaining overdraft exposure arises primarily from late-posting. A late-post occurs when a merchant posts a transaction within a payment network-permitted timeframe but subsequent to our release of the authorization for that transaction, as permitted by card association rules. Under card association rules, we may be liable for the amount of the transaction even if the cardholder has made additional purchases in the intervening period and funds are no longer available on the card at the time the transaction is posted.
Overdrawn account balances are funded on our behalf by the bank that issued the overdrawn card. We are responsible to this card issuing bank for any losses associated with these overdrafts. Overdrawn account balances are therefore deemed to be our receivables due from cardholders. We maintain reserves to cover the risk that we may not recover these receivables due from our cardholders, but our exposure may increase above these reserves for a variety of reasons, including our failure to predict the actual recovery rate accurately. To the extent we incur losses from overdrafts above our reserves or we determine that it is necessary to increase our reserves substantially, our business, results of operations and financial condition could be materially and adversely affected.
Acquisitions or investments could disrupt our business and harm our financial condition.
We have in the past acquired, and we expect to acquire in the future, other businesses and technologies. The process of integrating an acquired business, product, service or technology can create unforeseen operating difficulties, expenditures and other challenges such as:
• | increased regulatory and compliance requirements; |
• | regulatory restrictions on revenue streams of acquired businesses; |
• | implementation or remediation of controls, procedures and policies at the acquired company; |
• | diversion of management time and focus from operation of our then-existing business to acquisition integration challenges; |
• | coordination of product, sales, marketing and program, and systems management functions; |
• | transition of the acquired company's users and customers onto our systems; |
• | retention of employees from the acquired company; |
• | integration of employees from the acquired company into our organization; |
• | integration of the acquired company's accounting, information management, human resource and other administrative systems and operations generally with ours; |
• | liability for activities of the acquired company prior to the acquisition, including violations of law, commercial disputes, and tax and other known and unknown liabilities; and |
• | increased litigation or other claims in connection with the acquired company, including claims brought by terminated employees, customers, former stockholders or other third parties. |
If we are unable to successfully integrate an acquired business or technology or otherwise address these difficulties and challenges or other problems encountered in connection with an acquisition, we might not realize the anticipated benefits of that acquisition, we might incur unanticipated liabilities or we might otherwise suffer harm to our business generally. To integrate acquired businesses, we must implement our technology systems in the acquired operations
21
Table of Contents
and integrate and manage the personnel of the acquired operations. We also must effectively integrate the different cultures of acquired business organizations into our own in a way that aligns various interests, and may need to enter new markets in which we have no or limited experience and where competitors in such markets have stronger market positions.
To the extent we pay the consideration for any future acquisitions or investments in cash, it would reduce the amount of cash available to us for other purposes. Future acquisitions or investments could also result in dilutive issuances of our equity securities or the incurrence of debt, contingent liabilities, amortization expenses, or impairment charges against goodwill on our balance sheet, any of which could harm our financial condition and negatively impact our stockholders.
If we are unable to keep pace with the rapid technological developments in our industry and the larger electronic payments industry necessary to continue providing our network acceptance members and cardholders with new and innovative products and services, the use of our cards and other products and services could decline.
The electronic payments industry is subject to rapid and significant technological changes, including continuing advancements in the areas of radio frequency and proximity payment devices (such as contactless cards), e-commerce and mobile commerce, among others. We cannot predict the effect of technological changes on our business. We rely in part on third parties, including some of our competitors and potential competitors, for the development of, and access to, new technologies. We expect that new services and technologies applicable to our industry will continue to emerge, and these new services and technologies may be superior to, or render obsolete, the technologies we currently utilize in our products and services. Additionally, we may make future investments in, or enter into strategic alliances to develop, new technologies and services or to implement infrastructure change to further our strategic objectives, strengthen our existing businesses and remain competitive. However, our ability to transition to new services and technologies that we develop may be inhibited by a lack of industry-wide standards, by resistance from our retail distributors, network acceptance members, third-party processors or consumers to these changes, or by the intellectual property rights of third parties. Our future success will depend, in part, on our ability to develop new technologies and adapt to technological changes and evolving industry standards. These initiatives are inherently risky, and they may not be successful or may have an adverse effect on our business, financial condition and results of operations.
We face settlement risks from our retail distributors, which may increase during an economic downturn.
The vast majority of our business is conducted through retail distributors that sell our products and services to consumers at their store locations. Our retail distributors collect funds from the consumers who purchase our products and services and then must remit these funds directly to accounts established for the benefit of these consumers at the banks that issue our cards. The remittance of these funds by the retail distributor takes on average two business days. If a retail distributor becomes insolvent, files for bankruptcy, commits fraud or otherwise fails to remit proceeds to the card issuing bank from the sales of our products and services, we are liable for any amounts owed to the card issuing bank. As of December 31, 2013 , we had assets subject to settlement risk of $37.0 million . Given the possibility of recurring volatility in global financial markets, the approaches we use to assess and monitor the creditworthiness of our retail distributors may be inadequate, and we may be unable to detect and take steps to mitigate an increased credit risk in a timely manner.
Economic downturns could result in settlement losses, whether or not directly related to our business. We are not insured against these risks. Significant settlement losses could have a material adverse effect on our business, results of operations and financial condition.
Economic, political and other conditions may adversely affect trends in consumer spending.
The electronic payments industry, including the prepaid financial services segment within that industry, depends heavily upon the overall level of consumer spending. If conditions in the United States remain uncertain or deteriorate further, we may experience a reduction in the number of our cards that are purchased or reloaded, the number of transactions involving our cards and the use of our reload network and related services. A sustained reduction in the use of our products and related services, either as a result of a general reduction in consumer spending or as a result of a disproportionate reduction in the use of card-based payment systems, would materially harm our business, results of operations and financial condition.
22
Table of Contents
Our business is dependent on the efficient and uninterrupted operation of computer network systems and data centers.
Our ability to provide reliable service to cardholders and other network participants depends on the efficient and uninterrupted operation of our computer network systems and data centers as well as those of our retail distributors, network acceptance members and third-party processors. Our business involves movement of large sums of money, processing of large numbers of transactions and management of the data necessary to do both. Our success depends upon the efficient and error-free handling of the money that is collected by our retail distributors and remitted to network acceptance members or the banks that issue our cards. We rely on the ability of our employees, systems and processes and those of the banks that issue our cards, our retail distributors, our network acceptance members and third-party processors to process and facilitate these transactions in an efficient, uninterrupted and error-free manner.
In the event of a breakdown, a catastrophic event (such as fire, natural disaster, power loss, telecommunications failure or physical break-in), a security breach or malicious attack, an improper operation or any other event impacting our systems or processes, or those of our vendors, or an improper action by our employees, agents or third-party vendors, we could suffer financial loss, loss of customers, regulatory sanctions and damage to our reputation. The measures we have taken, including the implementation of disaster recovery plans and redundant computer systems, may not be successful, and we may experience other problems unrelated to system failures. We may also experience software defects, development delays and installation difficulties, any of which could harm our business and reputation and expose us to potential liability and increased operating expenses. Some of our contracts with retail distributors, including our contract with Walmart, contain service level standards pertaining to the operation of our systems, and provide the retail distributor with the right to collect damages and potentially to terminate its contract with us for system downtime exceeding stated limits. If we face system interruptions or failures, our business interruption insurance may not be adequate to cover the losses or damages that we incur.
We must be able to operate and scale our technology effectively to manage any future growth.
Our ability to continue to provide our products and services to network participants, as well as to enhance our existing products and services and offer new products and services, is dependent on our information technology systems. If we are unable to manage the technology associated with our business effectively, we could experience increased costs, reductions in system availability and losses of our network participants. Any failure of our systems in scalability and functionality would adversely impact our business, financial condition and results of operations.
Our future success depends on our ability to attract, integrate, retain and incentivize key personnel.
Our future success will depend, to a significant extent, on our ability to attract, integrate, retain and recognize key personnel, namely our management team and experienced sales, marketing and program and technology development personnel. Replacing departing key personnel can involve organizational disruption and uncertainty. We must retain and motivate existing personnel, and we must also attract, assimilate and motivate additional highly-qualified employees. We may experience difficulty in managing transitions and assimilating our newly-hired personnel, which may adversely affect our business. Competition for qualified management, sales, marketing and program and technology development personnel can be intense. Competitors have in the past and may in the future attempt to recruit our top management and employees. If we fail to attract, integrate, retain and incentivize key personnel, our ability to manage and grow our business could be harmed.
We might require additional capital to support our business in the future, and this capital might not be available on acceptable terms, or at all.
If our unrestricted cash and cash equivalents balances and any cash generated from operations are not sufficient to meet our future cash requirements, we will need to access additional capital to fund our operations. We may also need to raise additional capital to take advantage of new business or acquisition opportunities. We may seek to raise capital by, among other things:
• | issuing additional shares of our Class A common stock or other equity securities; |
• | issuing debt securities; and |
• | borrowing funds under a credit facility. |
We may not be able to raise needed cash in a timely basis on terms acceptable to us or at all. Financings, if available, may be on terms that are dilutive or potentially dilutive to our stockholders. The holders of new securities may also receive rights, preferences or privileges that are senior to those of existing holders of our Class A common stock. In addition, if we were to raise cash through a debt financing, the terms of the financing might impose additional conditions or restrictions on our operations that could adversely affect our business. If we require new sources of
23
Table of Contents
financing but they are insufficient or unavailable, we would be required to modify our operating plans to take into account the limitations of available funding, which would harm our ability to maintain or grow our business.
The occurrence of catastrophic events could damage our facilities or the facilities of third parties on which we depend, which could force us to curtail our operations.
We and some of the third-party service providers on which we depend for various support functions, such as customer service and card processing, are vulnerable to damage from catastrophic events, such as power loss, natural disasters, terrorism and similar unforeseen events beyond our control. Our principal offices, for example, are situated in the foothills of southern California near known earthquake fault zones and areas of elevated wild fire danger. If any catastrophic event were to occur, our ability to operate our business could be seriously impaired. In addition, we might not have adequate insurance to cover our losses resulting from catastrophic events or other significant business interruptions. Any significant losses that are not recoverable under our insurance policies, as well as the damage to, or interruption of, our infrastructure and processes, could seriously impair our business and financial condition.
If we fail to maintain proper and effective internal controls, our ability to produce accurate financial statements on a timely basis could be impaired, which could result in a loss of investor confidence in our financial reports and have an adverse effect on our stock price.
Our management is responsible for establishing and maintaining adequate internal control over financial reporting to provide reasonable assurance regarding the reliability of our financial reporting and the preparation of financial statements for external purposes in accordance with U.S. generally accepted accounting principles, or GAAP. If we are unable to maintain adequate internal control over financial reporting, we might be unable to report our financial information on a timely basis and might suffer adverse regulatory consequences or violate NYSE listing standards. There could also be a negative reaction in the financial markets due to a loss of investor confidence in us and the reliability of our financial statements. We have in the past and may in the future discover areas of our internal financial and accounting controls and procedures that need improvement. Our internal control over financial reporting will not prevent or detect all error and all fraud. A control system, no matter how well conceived and operated, can provide only reasonable, not absolute, assurance that the objectives of the control system will be met. Because of the inherent limitations in all control systems, no evaluation of controls can provide absolute assurance that all control issues and instances of fraud, if any, within our company will be detected. If we are unable to maintain proper and effective internal controls, we may not be able to produce accurate financial statements on a timely basis, which could adversely affect our ability to operate our business and could result in regulatory action, and could require us to restate, our financial statements. Any such restatement could result in a loss of public confidence in the reliability of our financial statements and sanctions imposed on us by the SEC.
Changes in accounting standards or inaccurate estimates or assumptions in the application of accounting policies could adversely affect our financial condition and results of operations.
Our accounting policies and methods are fundamental to how we record and report our financial condition and results of operations. Some of these policies require use of estimates and assumptions that may affect the reported value of our assets or liabilities and results of operations and are critical because they require management to make difficult, subjective and complex judgments about matters that are inherently uncertain. If those assumptions, estimates or judgments were incorrectly made, we could be required to correct and restate prior period financial statements. Accounting standard-setters and those who interpret the accounting standards (such as the Financial Accounting Standards Board, the SEC, banking regulators and our independent registered public accounting firm) may also amend or even reverse their previous interpretations or positions on how various standards should be applied. These changes can be difficult to predict and can materially impact how we record and report our financial condition and results of operations. In some cases, we could be required to apply a new or revised standard retroactively, resulting in the need to revise and republish prior period financial statements.
Risks Related to Ownership of Our Class A Common Stock
The price of our Class A common stock may be volatile.
In the recent past, stocks generally, and financial services company stocks in particular, have experienced high levels of volatility. The trading price of our Class A common stock has been highly volatile since our initial public offering and may continue to be subject to wide fluctuations. The trading price of our Class A common stock depends on a number of factors, including those described in this "Risk Factors" section, many of which are beyond our control and may not be related to our operating performance. Factors that could cause fluctuations in the trading price of our Class A common stock include the following:
• | price and volume fluctuations in the overall stock market from time to time; |
24
Table of Contents
• | significant volatility in the market prices and trading volumes of financial services company stocks; |
• | actual or anticipated changes in our results of operations or fluctuations in our operating results; |
• | actual or anticipated changes in the expectations of investors or the recommendations of any securities analysts who follow our Class A common stock; |
• | actual or anticipated developments in our business or our competitors' businesses or the competitive landscape generally; |
• | the public's reaction to our press releases, other public announcements and filings with the SEC; |
• | litigation and investigations or proceedings involving us, our industry or both or investigations by regulators into our operations or those of our competitors; |
• | new laws or regulations or new interpretations of existing laws or regulations applicable to our business; |
• | changes in accounting standards, policies, guidelines, interpretations or principles; |
• | general economic conditions; |
• | changes to the indices in which our Class A common stock is included; and |
• | sales of shares of our Class A common stock by us or our stockholders. |
In the past, many companies that have experienced volatility in the market price of their stock have become subject to securities class action litigation. We may be the target of this type of litigation in the future. Securities litigation against us could result in substantial costs and divert our management's attention from other business concerns, which could seriously harm our business.
Our charter documents, Delaware law and our status as bank holding company could discourage, delay or prevent a takeover that stockholders consider favorable and could also reduce the market price of our stock.
Our certificate of incorporation and bylaws contain provisions that could delay or prevent a change in control of our company. These provisions could also make it more difficult for stockholders to nominate directors for election to our board of directors and take other corporate actions. These provisions, among other things:
• | provide for non-cumulative voting in the election of directors; |
• | provide for a classified board of directors; |
• | authorize our board of directors, without stockholder approval, to issue preferred stock with terms determined by our board of directors and to issue additional shares of our Class A common stock; |
• | limit the voting power of a holder, or group of affiliated holders, of more than 24.9% of our common stock to 14.9%; |
• | provide that only our board of directors may set the number of directors constituting our board of directors or fill vacant directorships; |
• | prohibit stockholder action by written consent and limit who may call a special meeting of stockholders; and |
• | require advance notification of stockholder nominations for election to our board of directors and of stockholder proposals. |
These and other provisions in our certificate of incorporation and bylaws, as well as provisions under Delaware law, could discourage potential takeover attempts, reduce the price that investors might be willing to pay in the future for shares of our Class A common stock and result in the trading price of our Class A common stock being lower than it otherwise would be.
In addition to the foregoing, under the BHC Act and the Change in Bank Control Act, and their respective implementing regulations, Federal Reserve Board approval is necessary prior to any person or company acquiring control of a bank or bank holding company, subject to certain exceptions. Control, among other considerations, exists if an individual or company acquires 25% or more of any class of voting securities, and may be presumed to exist if a person acquires 10% or more of any class of voting securities. These restrictions could affect the willingness or ability of a third party to acquire control of us for so long as we are a bank holding company.
25
Table of Contents
If securities analysts do not continue to publish research or reports about our business or if they publish negative evaluations of our Class A common stock, the trading price of our Class A common stock could decline.
We expect that the trading price for our Class A common stock will be affected by any research or reports that securities analysts publish about us or our business. If one or more of the analysts who currently cover us or our business downgrade their evaluations of our Class A common stock, the price of our Class A common stock would likely decline. If one or more of these analysts cease coverage of our company, we could lose visibility in the market for our Class A common stock, which in turn could cause our stock price to decline.
26
Table of Contents
ITEM 1B. Unresolved Staff Comments
Not applicable
ITEM 2. Properties
Our headquarters is located in Pasadena, California where we lease approximately 140,000 square feet. We own the real property where our subsidiary bank's only office is located in Provo, Utah. We also lease additional technology development and sale and support offices in Tampa, Florida; Bentonville, Arkansas; Palo Alto, California; and Westlake Village, California. We believe that our existing and planned facilities are adequate to support our existing operations and that, as needed, we will be able to obtain suitable additional facilities on commercially reasonable terms.
ITEM 1. Legal Proceedings
None.
ITEM 4. Mine Safety Disclosures
Not applicable.
27
Table of Contents
PART II
ITEM 5. Market for Registrant's Common Equity, Related Stockholder Matters and Issuer Purchases of Equity Securities
Market Information
Our Class A common stock has been listed on the NYSE under the symbol "GDOT" since July 22, 2010. Prior to that date, there was no public trading market for our Class A common stock. Our initial public offering was priced at $36.00 per share on July 21, 2010. The following table sets forth for the periods indicated the high and low sales prices per share of our Class A common stock as reported on the NYSE.
| Low |
| High | ||||
Year ended December 31, 2013 |
|
|
| ||||
Fourth Quarter | $ | 19.70 | |
| $ | 26.61 | |
Third Quarter | 18.57 | |
| 26.59 | | ||
Second Quarter | 15.21 | |
| 19.99 | | ||
First Quarter | 12.31 | |
| 17.24 | | ||
|
|
|
| ||||
Year ended December 31, 2012 |
|
|
| ||||
Fourth Quarter | $ | 9.54 | |
| $ | 13.60 | |
Third Quarter | 9.05 | |
| 24.97 | | ||
Second Quarter | 19.93 | |
| 27.20 | | ||
First Quarter | 26.20 | |
| 32.49 | | ||
Holders of Record
As of January 31, 2014 , we had 127 holders of record of our Class A common stock. The actual number of stockholders is greater than this number of record holders, and includes stockholders who are beneficial owners, but whose shares are held in street name by brokers and other nominees. This number of holders of record also does not include stockholders whose shares may be held in trust by other entities.
Dividends
We have never declared or paid any cash dividends on our capital stock, and we do not currently intend to pay any cash dividends on our Class A common stock for the foreseeable future. As a bank holding company, the Federal Reserve Board's risk-based and leverage capital requirements, as well as other federal laws applicable to banks and bank holding companies, could limit our ability to pay dividends. We expect to retain future earnings, if any, to fund the development and future growth of our business. Any future determination to pay dividends on our Class A common stock, if permissible, will be at the discretion of our board of directors and will depend upon, among other factors, our financial condition, operating results, current and anticipated cash needs, plans for expansion and other factors that our board of directors may deem relevant.
Unregistered Sales of Equity Securities
None.
Purchases of Equity Securities by the Issuer and Affiliated Purchasers
None.
Stock Performance Graph
This performance graph shall not be deemed "filed" for purposes of section 18 of the Exchange Act, or otherwise subject to the liabilities under that section and shall not be deemed to be incorporated by reference into any filing of Green Dot Corporation under the Securities Act or the Exchange Act.
The graph and table below compare the cumulative total stockholder return of Green Dot Corporation Class A common stock, the Russell 2000 Index, the S&P Small Cap 600 Index and the S&P 500 Financials Index for the period beginning on the close of trading on the NYSE on July 22, 2010 (the date our Class A common stock began trading on the NYSE), and ending on the close of trading on the NYSE on December 31, 2013 . The graph assumes a $100 investment in our Class A common stock and each of the indices, and the reinvestment of dividends.
28
Table of Contents
The comparisons in the graph and table below are based on historical data and are not intended to forecast the possible future performance of our Class A common stock.
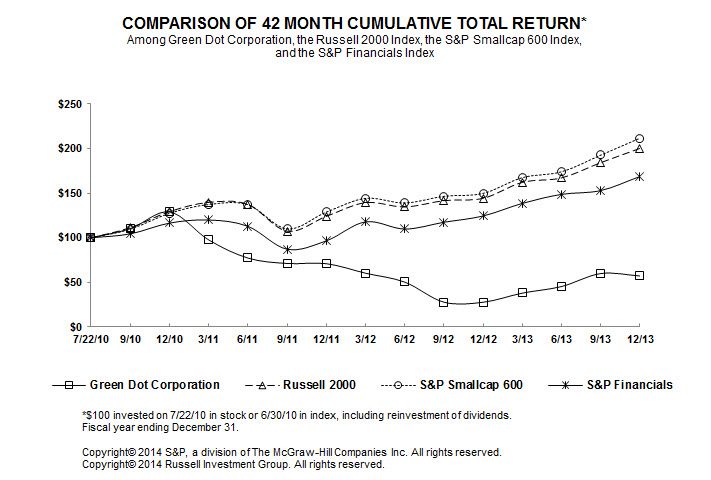
Total Return to Shareholders
(Includes reinvestment of dividends)
|
|
| Index Returns for the Months Ending | ||||||||||||||||||||||||||||||||||||||||||||||
Company/ Index | Base Period 7/22/10 |
| 2010 |
| 2011 |
| 2012 |
| 2013 | ||||||||||||||||||||||||||||||||||||||||
| Q3 | Q4 |
| Q1 | Q2 | Q3 | Q4 |
| Q1 | Q2 | Q3 | Q4 |
| Q1 | Q2 | Q3 | Q4 | ||||||||||||||||||||||||||||||||
Green Dot Corporation | $ | 100 | |
| $ | 110 | | $ | 129 | |
| $ | 98 | | $ | 77 | | $ | 71 | | $ | 71 | |
| $ | 60 | | $ | 50 | | $ | 28 | | $ | 28 | |
| $ | 38 | | $ | 45 | | $ | 60 | | $ | 57 | |
Russell 2000 | $ | 100 | |
| 111 | | 129 | |
| 140 | | 137 | | 107 | | 124 | |
| 139 | | 135 | | 142 | | 144 | |
| 162 | | 167 | | 184 | | 200 | | ||||||||||||||
S&P Smallcap 600 | $ | 100 | |
| 110 | | 127 | |
| 137 | | 137 | | 110 | | 129 | |
| 144 | | 139 | | 146 | | 150 | |
| 167 | | 174 | | 193 | | 212 | | ||||||||||||||
S&P Financials | $ | 100 | |
| $ | 104 | | $ | 116 | |
| $ | 120 | | $ | 113 | | $ | 87 | | $ | 97 | |
| $ | 118 | | $ | 110 | | $ | 117 | | $ | 124 | |
| $ | 139 | | $ | 149 | | $ | 153 | | $ | 169 | |
29
Table of Contents
ITEM 6. Selected Financial Data
The following tables present selected historical financial data for our business. You should read this information together with Item 7. Management's Discussion and Analysis of Financial Condition and Results of Operations and Item 8. Financial Statements and Supplementary Data of this report. The selected consolidated financial data in this section is not intended to replace the financial statements and is qualified in its entirety by the consolidated financial statements and related notes.
We derived the statement of operations data for the years ended December 31, 2013 , 2012 , and 2011 , respectively, and the balance sheet data as of December 31, 2013 , and 2012 from our audited consolidated financial statements included in Item 8 of this report. We derived the statement of operations data for the year ended December 31, 2010, five months ended December 31, 2009, and the year ended July 31, 2009 and balance sheet data as of December 31, 2011, December 31, 2010 and 2009, and July 31, 2009 from our audited consolidated financial statements not included in this report. Our historical results are not necessarily indicative of our results to be expected in any future period.
| Year Ended December 31, |
| Five Months Ended December 31, 2009(1) |
| Year Ended July 31, | ||||||||||||||||||
| 2013 |
| 2012 |
| 2011 |
| 2010 |
|
| 2009 | |||||||||||||
| (In thousands, except per share data) | ||||||||||||||||||||||
Consolidated Statement of Operations Data: |
|
|
|
|
|
|
|
|
|
|
| ||||||||||||
Operating revenues: |
|
|
|
|
|
|
|
|
|
|
| ||||||||||||
Card revenues and other fees | $ | 227,227 | |
| $ | 224,745 | |
| $ | 209,489 | |
| $ | 167,375 | |
| $ | 50,895 | |
| $ | 119,356 | |
Cash transfer revenues | 183,359 | |
| 165,232 | |
| 134,143 | |
| 101,502 | |
| 30,509 | |
| 62,396 | | ||||||
Interchange revenues | 171,757 | |
| 164,559 | |
| 141,103 | |
| 108,380 | |
| 31,353 | |
| 53,064 | | ||||||
Stock-based retailer incentive compensation(2) | (8,722 | ) |
| (8,251 | ) |
| (17,337 | ) |
| (13,369 | ) |
| - | |
| - | | ||||||
Total operating revenues | 573,621 | |
| 546,285 | |
| 467,398 | |
| 363,888 | |
| 112,757 | |
| 234,816 | | ||||||
Operating expenses: |
|
|
|
|
|
|
|
|
|
|
| ||||||||||||
Sales and marketing expenses | 218,370 | |
| 209,870 | |
| 168,747 | |
| 122,890 | |
| 31,333 | |
| 75,786 | | ||||||
Compensation and benefits expenses(3) | 127,287 | |
| 114,930 | |
| 87,671 | |
| 70,102 | |
| 26,610 | |
| 40,096 | | ||||||
Processing expenses | 89,856 | |
| 77,445 | |
| 70,953 | |
| 56,978 | |
| 17,480 | |
| 32,320 | | ||||||
Other general and administrative expenses | 88,976 | |
| 71,900 | |
| 56,578 | |
| 44,599 | |
| 14,020 | |
| 22,944 | | ||||||
Total operating expenses | 524,489 | |
| 474,145 | |
| 383,949 | |
| 294,569 | |
| 89,443 | |
| 171,146 | | ||||||
Operating income | 49,132 | |
| 72,140 | |
| 83,449 | |
| 69,319 | |
| 23,314 | |
| 63,670 | | ||||||
Interest income | 3,440 | |
| 4,074 | |
| 910 | |
| 365 | |
| 115 | |
| 396 | | ||||||
Interest expense | (72 | ) |
| (76 | ) |
| (346 | ) |
| (52 | ) |
| (2 | ) |
| (1 | ) | ||||||
Income before income taxes | 52,500 | |
| 76,138 | |
| 84,013 | |
| 69,632 | |
| 23,427 | |
| 64,065 | | ||||||
Income tax expense | 18,460 | |
| 28,919 | |
| 31,930 | |
| 27,400 | |
| 9,764 | |
| 26,902 | | ||||||
Net income | 34,040 | |
| 47,219 | |
| 52,083 | |
| 42,232 | |
| 13,663 | |
| 37,163 | | ||||||
Dividends, accretion and allocated earnings of preferred stock | (5,360 | ) |
| (7,599 | ) |
| (554 | ) |
| (14,659 | ) |
| (9,170 | ) |
| (29,000 | ) | ||||||
Net income allocated to common stockholders | $ | 28,680 | |
| $ | 39,620 | |
| $ | 51,529 | |
| $ | 27,573 | |
| $ | 4,493 | |
| $ | 8,163 | |
Basic earnings per common share: |
|
|
|
|
|
|
|
|
|
|
| ||||||||||||
Class A common stock | $ | 0.78 | |
| $ | 1.11 | |
| $ | 1.24 | |
| $ | 1.06 | |
| $ | - | |
| $ | - | |
Class B common stock | $ | 0.78 | |
| $ | 1.11 | |
| $ | 1.24 | |
| $ | 1.06 | |
| $ | 0.37 | |
| $ | 0.68 | |
Basic weighted-average common shares issued and outstanding: |
|
|
|
|
|
|
|
|
|
|
| ||||||||||||
Class A common stock | 33,272 | |
| 29,698 | |
| 22,238 | |
| 2,980 | |
| - | |
| - | | ||||||
Class B common stock | 2,603 | |
| 4,801 | |
| 17,718 | |
| 21,589 | |
| 12,222 | |
| 12,036 | | ||||||
Diluted earnings per common share: |
|
|
|
|
|
|
|
|
|
|
| ||||||||||||
Class A common stock | $ | 0.76 | |
| $ | 1.07 | |
| $ | 1.19 | |
| $ | 0.98 | |
| $ | - | |
| $ | - | |
Class B common stock | $ | 0.76 | |
| $ | 1.07 | |
| $ | 1.19 | |
| $ | 0.98 | |
| $ | 0.29 | |
| $ | 0.52 | |
Diluted weighted-average common shares issued and outstanding: |
|
|
|
|
|
|
|
|
|
|
| ||||||||||||
Class A common stock | 37,156 | |
| 35,933 | |
| 42,065 | |
| 27,782 | |
| - | |
| - | | ||||||
Class B common stock | 2,603 | |
| 6,150 | |
| 19,822 | |
| 24,796 | |
| 15,425 | |
| 15,712 | | ||||||
30
Table of Contents
| As of December 31, |
| As of July 31, | ||||||||||||||||||||
| 2013 |
| 2012 |
| 2011 |
| 2010 |
| 2009 |
| 2009 | ||||||||||||
| (In thousands) | ||||||||||||||||||||||
Consolidated Balance Sheet Data: |
|
|
|
|
|
|
|
|
|
|
| ||||||||||||
Cash, cash equivalents and restricted cash(4) | $ | 426,591 | |
| $ | 297,225 | |
| $ | 238,359 | |
| $ | 172,638 | |
| $ | 71,684 | |
| $ | 41,931 | |
Investment securities, available-for-sale | 198,744 | |
| 183,787 | |
| 31,210 | |
| - | |
| - | |
| - | | ||||||
Settlement assets(5) | 37,004 | |
| 36,127 | |
| 27,355 | |
| 19,968 | |
| 42,569 | |
| 35,570 | | ||||||
Loans to bank customers | 6,902 | |
| 7,552 | |
| 10,036 | |
| - | |
| - | |
| - | | ||||||
Total assets | 875,474 | |
| 725,728 | |
| 425,859 | |
| 285,758 | |
| 183,108 | |
| 123,269 | | ||||||
Deposits | 219,580 | |
| 198,451 | |
| 38,957 | |
| - | |
| - | |
| - | | ||||||
Obligations to customers(5) | 65,449 | |
| 46,156 | |
| - | |
| - | |
| - | |
| - | | ||||||
Settlement obligations(5) | 4,839 | |
| 3,639 | |
| 27,355 | |
| 19,968 | |
| 42,569 | |
| 35,570 | | ||||||
Long-term debt | - | |
| - | |
| - | |
| - | |
| - | |
| - | | ||||||
Total liabilities | 473,225 | |
| 397,964 | |
| 172,663 | |
| 120,627 | |
| 111,744 | |
| 81,031 | | ||||||
Redeemable convertible preferred stock | - | |
| - | |
| - | |
| - | |
| - | |
| - | | ||||||
Total stockholders' equity | 402,249 | |
| 327,764 | |
| 253,196 | |
| 165,131 | |
| 71,364 | |
| 42,238 | | ||||||
(1) | In September 2009, we changed our fiscal year-end from July 31 to December 31. |
(2) | Represents the recorded fair value of the shares for which our right to repurchase lapsed during the specified period pursuant to the terms of the agreement under which we issued 2,208,552 shares of our Class A common stock to Walmart. See "Management's Discussion and Analysis of Financial Condition and Results of Operations - Key components of our results of operations - Operating revenues - Stock-based retailer incentive compensation" for more information. Prior to the three months ended June 30, 2010, we did not incur any stock-based retailer incentive compensation. |
(3) | Includes stock-based compensation expense of $14.7 million , $12.7 million , $9.5 million , and $7.3 million for the years ended December 31, 2013 , 2012 , 2011 , and 2010, $6.8 million for the five months ended December 31, 2009 and $2.5 million for fiscal 2009. |
(4) | Includes $3.0 million , $0.6 million , $12.9 million , $5.1 million, $15.4 million and $15.4 million of restricted cash as of December 31, 2013, 2012, 2011, 2010, and 2009 and July 31, 2009, respectively. Also includes $0.1 million , $3.0 million , and $2.4 million of federal funds sold as of December 31, 2013, December 31, 2012, and December 31, 2011, respectively. We had no federal funds sold prior to 2011. |
(5) | Our retail distributors collect customer funds for purchases of new cards and reloads at the point of sale and then remit these funds directly to bank accounts established for the benefit of these customers by the banks that issue our cards. During the third quarter of 2012, our retail distributors began remitting these funds to our subsidiary bank as we transitioned our card issuing program with Synovus Bank to our subsidiary bank. Our retail distributors' remittance of these funds takes an average of two business days. Settlement assets represent the amounts due from our retail distributors for customer funds collected at the point of sale that have not yet been received by our subsidiary bank. Obligations to customers represents customer funds collected from or to be remitted by our retail distributors for which the underlying products have not been activated. Settlement obligations represent the customer funds received by our subsidiary bank that are due to third-party card issuing banks upon activation. |
31
Table of Contents
ITEM 7. Management's Discussion and Analysis of Financial Condition and Results of Operations
This Annual Report on Form 10-K, including this Management's Discussion and Analysis of Financial Condition and Results of Operations, contains forward-looking statements regarding future events and our future results that are subject to the safe harbors created under the Securities Act of 1933 and the Securities Exchange Act of 1934 (the "Exchange Act"). All statements other than statements of historical facts are statements that could be deemed to be forward-looking statements. These statements are based on current expectations, estimates, forecasts and projections about the industries in which we operate and the beliefs and assumptions of our management. Words such as "expects," "anticipates," "targets," "goals," "projects," "intends," "plans," "believes," "seeks," "estimates," "continues," "endeavors," "strives," "may" and "assumes," variations of such words and similar expressions are intended to identify forward-looking statements. In addition, any statements that refer to projections of our future financial performance, our anticipated growth and trends in our businesses, and other characterizations of future events or circumstances are forward-looking statements. Readers are cautioned that these forward-looking statements are subject to risks, uncertainties, and assumptions that are difficult to predict, including those identified below, under "Part II, Item 1A. Risk Factors," and elsewhere herein. Therefore, actual results may differ materially and adversely from those expressed in any forward-looking statements. We undertake no obligation to revise or update any forward-looking statements for any reason.
In this Annual Report, unless otherwise specified or the context otherwise requires, "Green Dot," "we," "us," and "our" refer to Green Dot Corporation and its consolidated subsidiaries.
Overview
Green Dot Corporation is a technology-centric, pro-consumer bank holding company with a mission to reinvent personal banking for the masses. We believe that we are the largest provider of prepaid debit card products and prepaid card reloading services in the United States, as well as a leader in mobile banking with our GoBank mobile bank account offering. Our products are available to consumers at more than 90,000 retailers nationwide, online and via the leading app stores. Our products and services include Green Dot-branded and co-branded GPR cards, Visa-branded gift cards, reload services through our Green Dot Network, using our MoneyPak product or through retailers' specially-enabled POS devices, and GoBank, an innovative checking account developed for distribution and use via smartphones and other mobile devices.
Financial Results and Trends
Total operating revenues for the year ended December 31, 2013 were $573.6 million , compared to $546.3 million for the year ended December 31, 2012 . Total operating revenues were favorably impacted by increases in cash transfer revenues, interchange revenues and card revenues and other fees. Cash transfer and interchange revenues increased primarily due to period-over-period growth in the number of cash transfers and purchase volume, respectively, which are described below. Card revenues and other fees increased primarily due to period-over-period growth in our gift card program, partially offset by declines in monthly maintenance fees, ATM fees and new card fees. Monthly maintenance fees declined primarily due to an increase in fee waivers earned by cardholders. New card fees declined as a result of a period-over-period decline in new card activations, driven by increased competition and the implementation of enhanced risk controls, as discussed further below. ATM fees declined as a result of higher usage of our fee-free ATM network.
Total operating expenses for the year ended December 31, 2013 were $524.5 million , compared to $474.1 million for the year ended December 31, 2012 . Total operating expenses were adversely impacted by increases in other general and administrative expenses, processing expenses, compensation and benefits expenses and sales and marketing expenses. Other general and administrative expenses increased primarily due to increases in depreciation and amortization of property and equipment as we invested in technology to support our new product launches and improve our core infrastructure, increases in transaction losses, primarily associated with customer disputed transactions, and impairment charges associated with capitalized internal-use software. Processing expenses increased primarily due to period-over-period growth in purchase volume. Compensation and benefits expenses increased primarily due to our efforts to attract and retain technology development personnel. Sales and marketing expenses increased primarily due to period-over-period growth in the number of cash transfers sold and an increase in the sales commission rate we pay to Walmart for the MoneyCard program, which increased in May 2013 by approximately four percentage points over the previous year. Additionally, our costs of materials increased as we rolled out products to the stores of new retail distributors, existing retail distributors, and new check cashing partners. These increases were partially offset by a decrease in advertising and marketing expenses as we reduced the level of our television and online advertising.
32
Table of Contents
Income tax expense for the year ended December 31, 2013 was $18.5 million , compared to $28.9 million for the year ended December 31, 2012 . Income tax expense declined primarily as a result of our recognition of general business credits related to 2012 and 2013 and a decline in income before income taxes. Although we expect to recognize general business credits in 2014 and beyond, we believe our effective tax rate for the foreseeable future will be higher than our effective tax rate for the year ended December 31, 2013 .
Since the second half of 2012, we have experienced increased competition at most of our largest retail distributors. Although we cannot accurately measure the precise effect of increased competition on our results of operations, we believe that it has negatively impacted our total operating revenues in 2013 . In addition, the number of active cards in our portfolio and the number of cash transfers were negatively impacted during 2013 by enhanced risk controls we began voluntarily implementing in 2012. For example, during 2013, we declined approximately two million new card activations. We believe the increased competition and enhanced risk controls will continue to have an adverse effect on our business, results of operations, and financial condition looking forward into the foreseeable future.
As previously announced, we expanded our distribution channels by more than 27,000 new retail locations, such as Dollar General, Family Dollar, Dollar Tree, and The Home Depot, we have expanded our product offerings at Walmart stores. Consequently, we expect to incur additional sales and marketing expenses during the first half of 2014 related to these initiatives as we recognize the cost of new card packages over the related sales period and the cost of personalized GPR cards, when activated, over the average card lifetime, as defined below under "Critical Accounting Policies and Estimates." We also plan to support our new products and partnerships through a mix of strategic marketing campaigns. It follows that we expect our sales and marketing expenses to increase on a year-over-year basis in absolute dollars and as a percentage of total operating revenues.
Key Metrics
We review a number of metrics to help us monitor the performance of, and identify trends affecting, our business. We believe the following measures are the primary indicators of our quarterly and annual revenues.
Number of Cash Transfers - represents the total number of MoneyPak and POS swipe reload transactions that we sell through our retail distributors in a specified period. We sold 45.44 million , 41.79 million , and 34.27 million MoneyPak and POS swipe reload transactions in the year s ended December 31, 2013 , 2012 , and 2011 , respectively.
Number of Active Cards - represents the total number of GPR cards in our portfolio that had a purchase, reload or ATM withdrawal transaction during the previous 90-day period. We had 4.49 million , 4.37 million , and 4.20 million active cards outstanding as of December 31, 2013 , 2012 , and 2011 , respectively.
Gross Dollar Volume - represents the total dollar volume of funds loaded to our GPR card and reload products. Our gross dollar volume was $18.3 billion , $17.2 billion , and $16.1 billion for the year s ended December 31, 2013 , 2012 , and 2011 respectively. While we continue to view our gross dollar volume as a key metric, we review this metric in conjunction with purchase volume and give greater weight to our purchase volume when assessing our operating performance because we believe it is a better indicator of interchange revenue performance.
Purchase Volume - represents the total dollar volume of purchase transactions made by customers using our GPR and gift card products. This metric excludes the dollar volume of ATM withdrawals. Our purchase volume was $13.4 billion , $12.6 billion , and $11.1 billion for the year s ended December 31, 2013 , 2012 , and 2011 respectively.
Key components of our results of operations
Operating Revenues
We classify our operating revenues into the following four categories:
Card Revenues and Other Fees - Card revenues consist of monthly maintenance fees, ATM fees, new card fees and other revenues. We charge maintenance fees on GPR cards to cardholders on a monthly basis pursuant to the terms and conditions in our cardholder agreements. We charge ATM fees to cardholders when they withdraw money at certain ATMs in accordance with the terms and conditions in our cardholder agreements. We charge new card fees when a consumer purchases a GPR or gift card in a retail store. Other revenues consist primarily of fees associated with optional products or services, which we generally offer to consumers during the card activation process. Optional products and services include providing a second card for an account, expediting delivery of the personalized GPR card that replaces the temporary card obtained at the retail store and upgrading a cardholder account to our premium program - the VIP program - which provides benefits for our more active cardholders.
Our aggregate monthly maintenance fee revenues vary primarily based upon the number of active cards in our portfolio and the average fee assessed per account. Our average monthly maintenance fee per active account depends upon the mix of Green Dot-branded and co-branded cards in our portfolio and upon the extent to which fees are waived
33
Table of Contents
based on significant usage. Our aggregate ATM fee revenues vary based upon the number of cardholder ATM transactions and the average fee per ATM transaction. The average fee per ATM transaction depends upon the mix of Green Dot-branded and co-branded active cards in our portfolio and the extent to which cardholders enroll in our VIP program, which has no ATM fees, or conduct ATM transactions on our fee-free ATM network, consisting of more than 24,000 nationwide ATMs as of December 2013 . Our aggregate new card fee revenues vary based upon the number of GPR cards activated and the average new card fee. The average new card fee depends primarily upon the mix of products that we sell since there are variations in new card fees between Green Dot-branded and co-branded products and between GPR cards and gift cards.
Cash Transfer Revenues - We earn cash transfer revenues when consumers purchase and use a MoneyPak or fund their cards through a POS swipe reload transaction in a retail store. Our aggregate cash transfer revenues vary based upon the total number of MoneyPak and POS swipe reload transactions and the average price per MoneyPak or POS swipe reload transaction. The average price per MoneyPak or POS swipe reload transaction depends upon the relative numbers of cash transfer sales at our different retail distributors and on the mix of MoneyPak and POS swipe reload transactions at certain retailers that have different fees for the two types of reload transactions.
Interchange Revenues - We earn interchange revenues from fees remitted by the merchant's bank, which are based on rates established by the payment networks, when customers make purchase transactions using our products. Our aggregate interchange revenues vary based primarily on the number of active cards in our portfolio, the average transactional volume of the active cards in our portfolio and on the mix of cardholder purchases between those using signature identification technologies and those using personal identification numbers.
Stock-based retailer incentive compensation - In May 2010, we issued to Walmart 2,208,552 shares of our Class A common stock, subject to our right to repurchase them at $0.01 per share upon a qualifying termination of our prepaid card program agreement with Walmart. We recognize each month the fair value of the 36,810 shares issued to Walmart for which our right to repurchase has lapsed using the then-current fair market value of our Class A common stock (and we would be required to recognize the fair value of all shares still subject to repurchase if there were an early expiration of our right to repurchase, which could occur if we experienced certain changes in our control or under certain other limited circumstances, such as a termination of our commercial agreement with Walmart. We record the fair value recognized as stock-based retailer incentive compensation, a contra-revenue component of our total operating revenues.
Operating Expenses
We classify our operating expenses into the following four categories:
Sales and Marketing Expenses - Sales and marketing expenses consist primarily of the sales commissions we pay to our retail distributors and brokers, advertising and marketing expenses, and the costs of manufacturing and distributing card packages, placards and promotional materials to our retail distributors and personalized GPR cards to consumers who have activated their cards. We generally establish sales commission percentages in long-term distribution agreements with our retail distributors, and aggregate sales commissions are determined by the number of prepaid cards and cash transfers sold at their respective retail stores and, in certain cases, by the revenue generated from the ongoing use of those cards. We incur advertising and marketing expenses for television, online and in-store promotions. Advertising and marketing expenses are recognized as incurred and typically deliver a benefit over an extended period of time. For this reason, these expenses do not always track changes in our operating revenues. Our manufacturing and distribution costs vary primarily based on the number of GPR cards activated.
Compensation and Benefits Expenses - Compensation and benefits expenses represent the compensation and benefits that we provide to our employees and the payments we make to third-party contractors. While we have an in-house customer service function, we employ third-party contractors to conduct call center operations, handle routine customer service inquiries and provide consulting support in the area of IT operations and elsewhere. Compensation and benefits expenses associated with our customer service and loss management functions generally vary in line with the size of our active card portfolio, while the expenses associated with other functions do not.
Processing Expenses - Processing expenses consist primarily of the fees charged to us by the payment networks, which process transactions for us, the third-party card processor that maintains the records of our customers ' accounts and processes transaction authorizations and postings for us, and the third-party banks that issue our prepaid cards. These costs generally vary based on the total number of active cards in our portfolio and gross dollar volume.
Other General and Administrative Expenses - Other general and administrative expenses consist primarily of professional service fees, telephone and communication costs, depreciation and amortization of our property and equipment, transaction losses (losses from customer disputed transactions, unrecovered customer purchase transaction overdrafts and fraud), rent and utilities, and insurance. We incur telephone and communication costs
34
Table of Contents
primarily from customers contacting us through our toll-free telephone numbers. These costs vary with the total number of active cards in our portfolio, as do losses from customer disputed transactions, unrecovered customer purchase transaction overdrafts and fraud. Costs associated with professional services, depreciation and amortization of our property and equipment, and rent and utilities vary based upon our investment in infrastructure, business development, risk management and internal controls and are generally not correlated with our operating revenues or other transaction metrics.
Income Tax Expense
Our income tax expense consists of the federal and state corporate income taxes accrued on income resulting from the sale of our products and services.
Critical Accounting Policies and Estimates
We prepare our consolidated financial statements in accordance with GAAP. The preparation of our consolidated financial statements requires our management to make estimates and assumptions that affect the reported amounts of assets, liabilities, revenues, costs and expenses and related disclosures. We base our estimates on historical experience, current circumstances and various other assumptions that our management believes to be reasonable under the circumstances. In many instances, we could reasonably use different accounting estimates, and in some instances changes in the accounting estimates are reasonably likely to occur from period to period. Accordingly, actual results could differ significantly from the estimates made by our management. To the extent that there are differences between our estimates and actual results, our future financial statement presentation, financial condition, results of operations and cash flows will be affected. We believe that the accounting policies discussed below are critical to understanding our historical and future performance, as these policies relate to the more significant areas involving management's judgments and estimates.
Revenue Recognition
We recognize revenue when the price is fixed or determinable, persuasive evidence of an arrangement exists, the product is sold or the service is performed, and collectability of the resulting receivable is reasonably assured.
We defer and recognize new card fee revenues on a straight-line basis over the period commensurate with our service obligation to our customers. We consider the service obligation period to be the average card lifetime. We determine the average card lifetime for each pool of homogeneous products (e.g., products that exhibit the same characteristics such as nature of service and terms and conditions) based on company-specific historical data. Currently, we determine the average card lifetime separately for our GPR cards and gift cards. For our GPR cards, we measure the card lifetime as the period of time, inclusive of reload activity, between sale (or activation) of a card and the date of the last positive balance on that card. We analyze GPR cards activated between six and thirty months prior to each balance sheet date. We use this historical look-back period as a basis for determining our average card lifetime because it provides sufficient time for meaningful behavioral trends to develop. Currently, our GPR cards have an average card lifetime of seven months. The usage of gift cards is limited to the initial funds loaded to the card. Therefore, we measure these gift cards' lifetime as the redemption period over which cardholders perform the substantial majority of their transactions. Currently, gift cards have an average lifetime of six months. We reassess average card lifetime quarterly. Average card lifetimes may vary in the future as cardholder behavior changes relative to historical experience because customers are influenced by changes in the pricing of our services, the availability of substitute products, and other factors.
We also defer and expense commissions paid to retail distributors related to new card sales ratably over the average card lifetime, which is currently seven months for our GPR cards and six months for gift cards.
We report our different types of revenues on a gross or net basis based on our assessment of whether we act as a principal or an agent in the transaction. To the extent we act as a principal in the transaction, we report revenues on a gross basis. In concluding whether or not we act as a principal or an agent, we evaluate whether we have the substantial risks and rewards under the terms of the revenue-generating arrangements, whether we are the party responsible for fulfillment of the services purchased by the cardholders, and other factors. For all of our significant revenue-generating arrangements, including GPR and gift cards, we recognize revenues on a gross basis.
Generally, customers have limited rights to a refund of the new card fee or a cash transfer fee. We have elected to recognize revenues prior to the expiration of the refund period, but reduce revenues by the amount of expected refunds, which we estimate based on actual historical refunds.
35
Table of Contents
On occasion, we enter into incentive agreements with our retail distributors and offer incentives to customers designed to increase product acceptance and sales volume. We record these incentives, including the issuance of equity instruments, as a reduction of revenues and recognize them over the period the related revenues are recognized or as services are rendered, as applicable.
Reserve for Uncollectible Overdrawn Accounts
Cardholder accounts may become overdrawn as a result of maintenance fee assessments on our GPR cards or from purchase transactions that we honor on GPR or gift cards, in each case in excess of the funds in the cardholder's account. We are responsible to the banks that issue our cards for any losses associated with these overdrawn balances. Overdrawn account balances are therefore deemed to be our receivables due from cardholders, and we include them as a component of accounts receivable, net, on our consolidated balance sheets. The banks that issue our cards fund the overdrawn account balances on our behalf. We include our obligations to them on our consolidated balance sheets as amounts due to card issuing banks for overdrawn accounts, a current liability, and we settle our obligations to them based on the terms specified in their agreements with us. These settlement terms generally require us to settle on a monthly basis or when the cardholder account is closed, depending on the card issuing bank.
We generally recover overdrawn account balances from those GPR cardholders that perform a reload transaction. In addition, we recover some overdrawn account balances related to purchase transaction through enforcement of payment network rules, which allow us to recover the amounts from the merchant where the purchase transaction was conducted. However, we are exposed to losses from any unrecovered overdrawn account balances. The probability of recovering these amounts is primarily related to the number of days that have elapsed since an account had activity, such as a purchase, ATM transaction or fee assessment. Generally, we recover 50-60% of overdrawn account balances in accounts that have had activity in the last 30 days, less than 15% in accounts that have had activity in the last 30 to 60 days, and less than 10% when more than 60 days have elapsed.
We establish a reserve for uncollectible overdrawn accounts for maintenance fees we assess and purchase transactions we honor, in each case in excess of a cardholder's account balance. We classify overdrawn accounts into age groups based on the number of days since the account last had activity. We then calculate a reserve factor for each age group based on the average recovery rate for the most recent six months. These factors are applied to these age groups to estimate our overall reserve. We rely on these historical rates because they have remained relatively consistent for several years. When more than 90 days have passed without any activity in an account, we consider recovery to be remote and charge off the full amount of the overdrawn account balance against the reserve for uncollectible overdrawn accounts. Our actual recovery rates and related estimates thereof may change in the future in response to factors such as the pricing of reloads and new cards and the availability of substitute products.
Cardholder accounts overdrawn due to maintenance fee assessments represented approximately 96% of our total overdrawn account balances due from cardholders for the year ended December 31, 2013 . We charge our GPR cardholder accounts maintenance fees on a monthly basis pursuant to the terms and conditions in the applicable cardholder agreements. Although cardholder accounts become inactive or overdrawn, we continue to provide cardholders the ongoing functionality of our GPR cards, which allows them to reload and use their cards at any time. As a result, we continue to assess a maintenance fee until a cardholder account becomes overdrawn by an amount equal to one maintenance fee, currently $3.00 for the Walmart MoneyCard and $5.95 for our Green Dot-branded GPR cards. We recognize the fees ratably over the month for which they are assessed, net of the related provision for uncollectible overdrawn accounts, as a component of card revenues and other fees in our consolidated statements of operations.
We include our provision for uncollectible overdrawn accounts related to purchase transactions in other general and administrative expenses in our consolidated statements of operations.
Employee Stock-Based Compensation
We record employee stock-based compensation expense using the fair value method of accounting. For stock options and stock purchases under our employee stock purchase plan, we base compensation expense on fair values estimated at the grant date using the Black-Scholes option-pricing model. For stock awards, including restricted stock units, we base compensation expense on the fair value of our Class A common stock at the grant date. We recognize compensation expense for awards with only service conditions that have graded vesting schedules on a straight-line basis over the vesting period of the award. Vesting is based upon continued service to our company.
We measure the fair value of equity instruments issued to non-employees as of the earlier of the date a performance commitment has been reached by the counterparty or the date performance is completed by the counterparty. We determine the fair value using the Black-Scholes option-pricing model or the fair value of our Class A common stock, as applicable, and recognize related expense in the same periods that the goods or services are received.
36
Table of Contents
Comparison of Years Ended December 31, 2013 and 2012
Operating Revenues
The following table presents a breakdown of our operating revenues among card revenues and other fees, cash transfer revenues and interchange revenues as well as contra-revenue items:
| Year Ended December 31, | ||||||||||||
| 2013 |
| 2012 | ||||||||||
| Amount |
| % of Total Operating Revenues |
| Amount |
| % of Total Operating Revenues | ||||||
| (In thousands, except percentages) | ||||||||||||
Operating revenues: |
|
|
|
|
|
|
| ||||||
Card revenues and other fees | $ | 227,227 | |
| 39.6 | % |
| $ | 224,745 | |
| 41.1 | % |
Cash transfer revenues | 183,359 | |
| 32.0 | |
| 165,232 | |
| 30.2 | | ||
Interchange revenues | 171,757 | |
| 29.9 | |
| 164,559 | |
| 30.2 | | ||
Stock-based retailer incentive compensation | (8,722 | ) |
| (1.5 | ) |
| (8,251 | ) |
| (1.5 | ) | ||
Total operating revenues | $ | 573,621 | |
| 100.0 | % |
| $ | 546,285 | |
| 100.0 | % |
Card Revenues and Other Fees - Card revenues and other fees totaled $227.2 million for the year ended December 31, 2013 , an increase of $2.5 million , or 1% , from the comparable period in 2012 . The increase was primarily the result of period-over-period growth in our gift card program. This increase was partially offset by declines in monthly maintenance fees due to an increase in fee waivers earned by cardholders, declines in new card fees as a result of a period-over-period decline in new cards activated due to enhanced risk controls and a decline in ATM fees as a result of higher usage of our fee-free ATM network.
Cash Transfer Revenues - Cash transfer revenues totaled $183.4 million for the year ended December 31, 2013 , an increase of $18.2 million , or 11% , from the comparable period in 2012 . The increase was primarily the result of period-over-period growth of 9% in the number of cash transfers sold. The increase in cash transfer volume was driven primarily by growth in cash transfer volume from third-party programs participating in our network. The proportion of total cash transfer revenues represented by third party programs increased by approximately four percentage points as compared to the comparable period in 2012.
Interchange Revenues - Interchange revenues totaled $171.8 million for the year ended December 31, 2013 , an increase of $7.2 million , or 4% , from the comparable period in 2012 . The increase was primarily the result of period-over-period growth of 6% in purchase volume, partially offset by a slight decline in the effective interchange rate we earn on purchase volume. This rate decline was the result of a shift in the mix of payment networks and payment types.
Stock-based Retailer Incentive Compensation - Stock-based retailer incentive compensation was $8.7 million for the year ended December 31, 2013 , an increase of $0.4 million , or 5% , from the comparable period in 2012 . Our right to repurchase lapsed as to 441,720 shares issued to Walmart during the year ended December 31, 2013 . We recognized the fair value of the shares using the then-current fair market value of our Class A common stock. The increase was the result of a higher average stock price in the year ended December 31, 2013 compared with the corresponding period in 2012 .
37
Table of Contents
Operating Expenses
The following table presents a breakdown of our operating expenses among sales and marketing, compensation and benefits, processing, and other general and administrative expenses:
| Year Ended December 31, | ||||||||||||
| 2013 |
| 2012 | ||||||||||
| Amount |
| % of Total Operating Revenues |
| Amount |
| % of Total Operating Revenues | ||||||
| (In thousands, except percentages) | ||||||||||||
Operating expenses: |
|
|
|
|
|
|
| ||||||
Sales and marketing expenses | $ | 218,370 | |
| 38.1 | % |
| $ | 209,870 | |
| 38.4 | % |
Compensation and benefits expenses | 127,287 | |
| 22.2 | |
| 114,930 | |
| 21.0 | | ||
Processing expenses | 89,856 | |
| 15.7 | |
| 77,445 | |
| 14.2 | | ||
Other general and administrative expenses | 88,976 | |
| 15.4 | |
| 71,900 | |
| 13.2 | | ||
Total operating expenses | $ | 524,489 | |
| 91.4 | % |
| $ | 474,145 | |
| 86.8 | % |
Sales and Marketing Expenses - Sales and marketing expenses totaled $218.4 million for the year ended December 31, 2013 , an increase of $8.5 million , or 4% from the comparable period in 2012 . This increase was primarily the result of an increase in the sales commissions, driven by period-over-period growth of 9% in the number of cash transfers sold and an increase in the sales commission rate we pay to Walmart for the MoneyCard program, which increased in May 2013 by approximately four percentage points. The increase in sales and marketing expenses was also due to higher costs of manufacturing and distributing card packages related to new product launches. The increase was partially offset by a decline in advertising and marketing expenses as we reduced our television and online advertising. In 2014, we expect to incur additional sales and marketing expenses, as discussed above under "Financial Results and Trends."
Compensation and Benefits Expenses - Compensation and benefits expenses totaled $127.3 million for the year ended December 31, 2013 , an increase of $12.4 million or 11% , from the comparable period in 2012 . This increase was primarily the result of a $14.9 million increase in employee compensation and benefits, which included a $2.0 million increase in employee stock-based compensation expense. The period-over-period growth in employee compensation and benefits is due to our efforts to attract and retain technology personnel and higher incentive compensation earned by employees. These increases were partially offset by a reduction in third-party contractor expenses.
Processing Expenses - Processing expenses totaled $89.9 million for the year ended December 31, 2013 , an increase of $12.5 million , or 16% from the comparable period in 2012 . The increase was primarily the result of period-over-period growth of 6% in purchase volume, higher usage of our fee-free ATM network and certain costs to prepare for the transition of our card issuing program with GE Capital Retail Bank to Green Dot Bank, which was completed in February 2014. Processing expenses were partially offset by a reduction in third-party issuing bank fees as we transitioned our card issuing program with Synovus Bank to our subsidiary bank in November 2012. While we expect processing expenses to be favorably impacted by the February 2014 transition of our card issuing program with GE capital Retail Bank to Green Dot Bank, there can be no assurance that our processing expenses will decline on a year-over-year basis in absolute dollars or as percentage of total operating revenues in 2014 or in future years because these expenses are subject to a variety of factors, many of which are outside our control. We benefited from volume incentives from the payment networks in 2012 and to a lesser extent in 2013. Although we expect to benefit from volume incentives in 2014, we may not benefit from the same level of volume incentives in 2014 as we did in the past.
Other General and Administrative Expenses - Other general and administrative expenses totaled $89.0 million for the year ended December 31, 2013 , an increase of $17.1 million , or 24% , from the comparable period in 2012 . This increase was primarily the result of a $9.0 million increase in depreciation and amortization of property and equipment associated with our investment in technology to support our new products launches and improve our core infrastructure, a $5.7 million increase in transaction losses, primarily associated with customer disputed transactions, and a $4.2 million increase in impairment charges associated with capitalized internal-use software. These increases were partially offset by a reduction in professional service fees and rent expense.
38
Table of Contents
Income Tax Expense
The following table presents a breakdown of our effective tax rate among federal, state and other:
| Year Ended December 31, | ||||
| 2013 |
| 2012 | ||
U.S. federal statutory tax rate | 35.0 | % |
| 35.0 | % |
State income taxes, net of federal benefit | (0.2 | ) |
| 1.9 | |
General business credits | (2.3 | ) |
| (0.4 | ) |
Employee stock-based compensation | 1.4 | |
| 1.4 | |
Other | 1.2 | |
| 0.3 | |
Effective tax rate | 35.1 | % |
| 38.2 | % |
Our income tax expense decrease d by $10.5 million to $18.5 million in the year ended December 31, 2013 from the comparable period in 2012 due to a decrease in income before income taxes over those same periods and a decrease in our effective tax rate by 3.1 percentage points from 38.2% to 35.1% , primarily driven by $1.2 million of general business credits related to 2012 and 2013. Although we expect to recognize general business credits in 2014 and beyond, we believe our effective tax rate for the foreseeable future will be higher than our effective tax rate for the year ended December 31, 2013 .
Comparison of Years Ended December 31, 2012 and 2011
Operating Revenues
The following table presents a breakdown of our operating revenues among card revenues and other fees, cash transfer revenues and interchange revenues as well as contra-revenue items:
| Year Ended December 31, | ||||||||||||
| 2012 |
| 2011 | ||||||||||
| Amount |
| % of Total Operating Revenues |
| Amount |
| % of Total Operating Revenues | ||||||
| (In thousands, except percentages) | ||||||||||||
Operating revenues: |
|
|
|
|
|
|
| ||||||
Card revenues and other fees | $ | 224,745 | |
| 41.1 | % |
| $ | 209,489 | |
| 44.8 | % |
Cash transfer revenues | 165,232 | |
| 30.2 | |
| 134,143 | |
| 28.7 | | ||
Interchange revenues | 164,559 | |
| 30.2 | |
| 141,103 | |
| 30.2 | | ||
Stock-based retailer incentive compensation | (8,251 | ) |
| (1.5 | ) |
| (17,337 | ) |
| (3.7 | ) | ||
Total operating revenues | $ | 546,285 | |
| 100.0 | % |
| $ | 467,398 | |
| 100.0 | % |
Card Revenues and Other Fees - Card revenues and other fees totaled $224.7 million for the year ended December 31, 2012, an increase of $15.3 million, or 7%, from the comparable period in 2011. The increase was primarily the result of an increase in monthly maintenance fee revenues, driven by period-over-period growth of 4% in the number of active cards in our portfolio. Card revenues and other fees also increased as a result of growth in new card fee revenues, which was driven by higher numbers of card activations from distribution channels in which we assess new card fees. The increases were partially offset by a decrease in ATM fee revenues, which was primarily driven by the discontinuation of the TurboTax program, as cardholders under this program typically performed more ATM transactions than the rest of our active card base. Additionally, we began offering our Walmart MoneyCard customers access to surcharge-free transactions via the nationwide MoneyPass ATM network in late June 2012, which also contributed to the decrease in ATM fee revenues. In addition, we believe our card revenues and other fees for the second half of 2012 were adversely impacted by changes in our competitive environment and our implementation of voluntary risk control mechanisms.
Cash Transfer Revenues - Cash transfer revenues totaled $165.2 million for the year ended December 31, 2012, an increase of $31.1 million, or 23%, from the comparable period in 2011. The increase was primarily the result of period-over-period growth of 22% in the number of cash transfers sold. The increase in cash transfer volume was driven both by growth in our active card base and growth in cash transfer volume from third-party programs participating in our network. Third party programs participating in our network contributed approximately 23% of total cash transfer revenues for the year ended December 31, 2012, versus approximately 17% of total cash transfer revenues for the year ended December 31, 2011 . We believe our cash transfer revenues for the second half of 2012 were adversely impacted by changes in our competitive environment and our implementation of voluntary risk control mechanisms.
39
Table of Contents
Interchange Revenues - Interchange revenues totaled $164.6 million for the year ended December 31, 2012, an increase of $23.5 million, or 17%, from the comparable period in 2011. The increase was primarily the result of period-over-period growth of 4% in the number of active cards in our portfolio and a 13% increase in purchase volume. We believe our interchange revenues for the second half of 2012 were adversely impacted by changes in our competitive environment and our implementation of voluntary risk control mechanisms.
Stock-based Retailer Incentive Compensation - Our right to repurchase lapsed as to 441,720 shares issued to Walmart during the year ended December 31, 2012. We recognized the fair value of the shares using the then-current fair market value of our Class A common stock, resulting in $8.3 million of stock-based retailer incentive compensation, a decrease of $9.1 million, or 53%, from the comparable period in 2011. The decrease was the result of a lower stock price in the year ended December 31, 2012 compared with the corresponding period in 2011.
Operating Expenses
The following table presents a breakdown of our operating expenses among sales and marketing, compensation and benefits, processing, and other general and administrative expenses:
| Year Ended December 31, | ||||||||||||
| 2012 |
| 2011 | ||||||||||
| Amount |
| % of Total Operating Revenues |
| Amount |
| % of Total Operating Revenues | ||||||
| (In thousands, except percentages) | ||||||||||||
Operating expenses: |
|
|
|
|
|
|
| ||||||
Sales and marketing expenses | $ | 209,870 | |
| 38.4 | % |
| $ | 168,747 | |
| 36.1 | % |
Compensation and benefits expenses | 114,930 | |
| 21.0 | |
| 87,671 | |
| 18.8 | | ||
Processing expenses | 77,445 | |
| 14.2 | |
| 70,953 | |
| 15.2 | | ||
Other general and administrative expenses | 71,900 | |
| 13.2 | |
| 56,578 | |
| 12.0 | | ||
Total operating expenses | $ | 474,145 | |
| 86.8 | % |
| $ | 383,949 | |
| 82.1 | % |
Sales and Marketing Expenses - Sales and marketing expenses totaled $209.9 million for the year ended December 31, 2012, an increase of $41.1 million, or 24% from the comparable period in 2011. The increase was primarily the result of a $24.1 million increase in sales commissions, driven by period-over-period growth of 22% in the number of cash transfers sold, 1% in the number of GPR cards activated, and 17% in total operating revenues. Costs of manufacturing and distributing card packages also increased as a result of the transition of our card issuing program with Synovus Bank to our subsidiary bank and the launch of new products. The increase in sales and marketing expenses was also due to a $7.1 million increase in advertising and marketing expenses, as we invested in our brand by running increased television and online advertising.
Compensation and Benefits Expenses - Compensation and benefits expenses totaled $114.9 million for the year ended December 31, 2012, an increase of $27.3 million or 31%, from the comparable period in 2011. This increase was primarily the result of a $20.9 million increase in employee compensation and benefits, which included $5.2 million of retention-based cash incentive payments associated with our acquisition of Loopt. This growth was also due to additional employee headcount from the Loopt acquisition as well as our continued expansion of our operations to support key growth initiatives. A $6.3 million increase in third-party contractor expenses also contributed to the increase in compensation and benefits expenses. We continued to incur additional compensation and benefits expense associated with our acquisition of Loopt, including remaining retention-based incentives of up to $5.0 million, which we recognized on a straight-line basis from January through September 2013.
Processing Expenses - Processing expenses totaled $77.4 million for the year ended December 31, 2012, an increase of $6.5 million, or 9% from the comparable period in 2011. The increase was primarily the result of period-over-period growth of 4% in the number of active cards in our portfolio. Processing expenses were partially offset by an increase in volume incentives from the payment networks.
Other General and Administrative Expenses - Other general and administrative expenses totaled $71.9 million for the year ended December 31, 2012, an increase of $15.3 million, or 27%, from the comparable period in 2011. This increase was primarily the result of a $5.8 million increase in depreciation and amortization of property and equipment, a $3.8 million increase in rent expense, and a $2.0 million increase in professional service fees. The increase in depreciation and amortization is primarily associated with investments in IT infrastructure and product development. The increase in rent expense was primarily due to additional rent expense associated with our new corporate office space located in Pasadena, California, which became our new headquarters facility in September 2012. We took control of the office space in January 2012 to construct tenant improvements, and accordingly, recorded
40
Table of Contents
rent expense thereafter. The increase in professional services fees was primarily associated with due diligence work related to our acquisition of Loopt.
Income Tax Expense
The following table presents a breakdown of our effective tax rate among federal, state and other:
| Year Ended December 31, | ||||
| 2012 |
| 2011 | ||
U.S. federal statutory tax rate | 35.0 | % |
| 35.0 | % |
State income taxes, net of federal benefit | 1.9 | |
| 1.6 | |
Employee stock-based compensation | 1.4 | |
| 1.2 | |
Other | (0.1 | ) |
| 0.2 | |
Effective tax rate | 38.2 | % |
| 38.0 | % |
Our income tax expense decreased by $3.0 million to $28.9 million in the year ended December 31, 2012 from the comparable period in 2011 due to a decrease in income before income taxes over those same periods, and our effective tax rate increased 0.2% from 38.0% to 38.2%. The increases in our effective state tax rate and non-deductible employee stock-based compensation were offset by increases in general business tax credits taken during 2012.
Capital Requirements for Bank Holding Companies
As of December 31, 2013 and December 31, 2012 , we were categorized as well capitalized under the regulatory framework. There were no conditions or events since December 31, 2013 which management believes would have changed our category as well capitalized. Our actual and the "well capitalized" minimum amounts and ratios were as follows:
| Actual |
| Regulatory "well capitalized" minimum | ||||||||||
| Amount |
| Ratio |
| Amount |
| Ratio | ||||||
| (In thousands, except ratios) | ||||||||||||
December 31, 2013 |
|
|
|
|
|
|
| ||||||
Tier 1 leverage | $ | 370,476 | |
| 45.8 | % |
| $ | 40,418 | |
| 5.0 | % |
Tier 1 capital | 370,476 | |
| 100.8 | |
| 22,057 | |
| 6.0 | | ||
Total risk-based capital | 370,476 | |
| 100.8 | |
| 36,762 | |
| 10.0 | | ||
|
|
|
|
|
|
|
| ||||||
December 31, 2012 |
|
|
|
|
|
|
| ||||||
Tier 1 leverage | $ | 289,323 | |
| 47.8 | % |
| $ | 30,266 | |
| 5.0 | % |
Tier 1 risk-based capital | 289,323 | |
| 84.3 | |
| 20,591 | |
| 6.0 | | ||
Total risk-based capital | 289,323 | |
| 84.3 | |
| 34,318 | |
| 10.0 | | ||
Liquidity and Capital Resources
The following table summarizes our major sources and uses of cash for the periods presented:
| Year Ended December 31, | ||||||||||
| 2013 |
| 2012 |
| 2011 | ||||||
| (In thousands) | ||||||||||
Total cash provided by (used in) |
|
|
|
|
| ||||||
Operating activities | $ | 122,508 | |
| $ | 102,028 | |
| $ | 94,051 | |
Investing activities | (53,396 | ) |
| (210,320 | ) |
| (50,441 | ) | |||
Financing activities | 57,918 | |
| 179,450 | |
| 14,320 | | |||
Increase in unrestricted cash and cash equivalents | $ | 127,030 | |
| $ | 71,158 | |
| $ | 57,930 | |
In the year s ended December 31, 2013 , 2012 , 2011 we financed our operations primarily through our cash flows from operations. At December 31, 2013 , our primary source of liquidity was unrestricted cash and cash equivalents totaling $423.5 million . We also consider our $198.7 million of investment securities available-for-sale to be highly-liquid instruments.
41
Table of Contents
We use trend and variance analysis as well as our detailed budgets and forecasts to project future cash needs, making adjustments to the projections when needed. We believe that our current unrestricted cash and cash equivalents and cash flows from operations will be sufficient to meet our working capital and capital expenditure requirements for at least the next year. Thereafter, we may need to raise additional funds through public or private financings or borrowings. Any additional financing we require may not be available on terms that are favorable to us, or at all. If we raise additional funds through the issuance of equity or convertible debt securities, our existing stockholders could suffer significant dilution, and any new equity securities we issue could have rights, preferences and privileges superior to those of holders of our Class A common stock and our Series A convertible junior participating non-cumulative perpetual preferred stock. No assurance can be given that additional financing will be available or that, if available, such financing can be obtained on terms favorable to our stockholders and us.
Cash Flows from Operating Activities
Our $122.5 million of net cash provided by operating activities in the year ended December 31, 2013 principally resulted from $34.0 million of net income, adjusted for certain non-cash operating expenses of $61.9 million , and an increase in accounts payable and accrued liabilities of $26.9 million related primarily to the timing of escheatment and refund liabilities. Our $102.0 million of net cash provided by operating activities in the year ended December 31, 2012 principally resulted from $47.2 million of net income, adjusted for certain non-cash operating expenses of $46.8 million . Our $94.1 million of net cash provided by operating activities in the year ended December 31, 2011 principally resulted from $52.1 million of net income, adjusted for certain non-cash operating expenses of $40.5 million.
Cash Flows from Investing Activities
Our $53.4 million of net cash used in investing activities in the year ended December 31, 2013 reflects payments for acquisition of property and equipment of purchases of $35.7 million and purchases of available-for-sale investment securities, net of sales and maturities, of $16.0 million . Our $210.3 million of net cash used in investing activities in the year ended December 31, 2012 reflects purchases of available-for-sale investment securities, net of sales and maturities, of $152.8 million , payments for acquisition of property and equipment of $40.4 million , net payments to acquire Loopt for $33.4 million , partially offset by a decrease in restricted cash of $12.3 million . Our $50.4 million of net cash used in investing activities in the year ended December 31, 2011 reflects purchases of available-for-sale investment securities, net of maturities, of $24.9 million, payments for acquisition of property and equipment of $23.1 million and an increase in restricted cash of $7.8 million.
Restricted cash on our consolidated balance sheets in 2012 and 2011 primarily represented our cash collateral requirements on our line of credit with Synovus Bank. We used the line of credit to fund timing differences between funds remitted by our retail distributors to the banks that issue our cards and funds utilized by our cardholders. In 2011, we increased our cash collateral from $5.0 million to $10.0 million. In November 2012, we transitioned all outstanding customer deposits associated with our card issuing program with Synovus Bank to our subsidiary bank. Concurrently, we terminated our line of credit with Synovus Bank, thus reducing our cash collateral to zero.
Cash Flows from Financing Activities
Our $57.9 million of net cash provided by financing activities in the year ended December 31, 2013 was primarily the result of increases of $21.1 million and $19.6 million of deposits and obligations, respectively, to customers associated with our GPR card program, and proceeds and excess tax benefits of $17.2 million associated with equity award activities. Our $179.5 million of net cash provided by financing activities in the year ended December 31, 2012 was primarily the result of $159.5 million of deposits and $13.7 million of obligations to customers we assumed as part of the transition of all outstanding customer deposits associated with our GPR card program with Synovus Bank to our subsidiary bank, and proceeds and excess tax benefits of $6.3 million associated with equity award activities. Our $14.3 million of net cash provided by financing activities for the year ended December 31, 2011 was the result of the proceeds and excess tax benefits of $9.1 million associated with equity award activities.
Commitments
We anticipate that we will continue to purchase property and equipment as necessary in the normal course of our business. The amount and timing of these purchases and the related cash outflows in future periods is difficult to predict and is dependent on a number of factors including the hiring of employees, the rate of change of computer hardware and software used in our business and our business outlook. During 2014, we intend to continue to invest in new products and programs, new features for our existing products and IT infrastructure to scale and operate effectively to meet our strategic objectives. We expect the level of our total investment in capital expenditures for 2014 to be similar to the level of investment in 2013.
42
Table of Contents
We have used cash to acquire businesses and technologies and we anticipate that we may continue to do so in the future. The nature of these transactions makes it difficult to predict the amount and timing of such cash requirements. We may also be required to raise additional financing to complete future acquisitions.
Additionally, we anticipate making ongoing cash contributions to our subsidiary bank, Green Dot Bank, to maintain its capital, leverage and other financial commitments at levels we have agreed to with our regulators. For example, in connection with the transition of our card issuing program with GE Capital Retail Bank to Green Dot Bank in February 2014, we contributed approximately $50 million in capital to Green Dot Bank and we settled our liability associated with overdrawn cardholder account balances, which is included in our consolidated balance sheet as "amounts due to card issuing banks for overdrawn accounts." Additionally, our investment securities may act as short-term collateral to Green Dot Bank to satisfy any requirements associated with its legal lending limit.
Contractual Obligations
Our contractual commitments will have an impact on our future liquidity. The following table summarizes our contractual obligations, including both on and off-balance sheet transactions that represent material expected or contractually committed future obligations, at December 31, 2013 . We believe that we will be able to fund these obligations through cash generated from operations and from our existing cash balances.
| Payments Due by Period | ||||||||||||||||||
| Total |
| Less than 1 Year |
| 1-3 Years |
| 3-5 Years |
| More than 5 Years | ||||||||||
| (In thousands) | ||||||||||||||||||
Long-term debt obligations | $ | - | |
| $ | - | |
| $ | - | |
| $ | - | |
| $ | - | |
Capital lease obligations | - | |
| - | |
| - | |
| - | |
| - | | |||||
Operating lease obligations | 38,959 | |
| 4,187 | |
| 9,322 | |
| 8,342 | |
| 17,108 | | |||||
Purchase obligations(1) | 35,393 | |
| 9,558 | |
| 8,460 | |
| 14,225 | |
| 3,150 | | |||||
Other long-term liabilities | - | |
| - | |
| - | |
| - | |
| - | | |||||
Total | $ | 74,352 | |
| $ | 13,745 | |
| $ | 17,782 | |
| $ | 22,567 | |
| $ | 20,258 | |
(1) | Primarily future minimum payments under agreements with vendors and our retail distributors. See note 16 of the notes to our audited consolidated financial statements. |
Off-Balance Sheet Arrangements
During the year s ended December 31, 2013 , 2012 , and 2011 we did not have any relationships with unconsolidated organizations or financial partnerships, such as structured finance or special purpose entities that would have been established for the purpose of facilitating off-balance sheet arrangements or other contractually narrow or limited purposes.
43
Table of Contents
Statistical Disclosure by Bank Holding Companies
As discussed in Part I, Item 1. Business, we became a bank holding company in December 2011. This section presents information required by the SEC's Industry Guide 3, " Statistical Disclosure by Bank Holding Companies ." The tables in this section include Green Dot Bank information only. All average balance data related to 2011 are calculated for the period December 8, 2011, the date of our acquisition of Green Dot Bank, to December 31, 2011.
Distribution of Assets, Liabilities and Stockholders' Equity
The following table presents average balance data and interest income and expense data for our banking operations, as well as the related interest yields and rates for the years ended December 3, 2013 and 2012 and average balance data for the period ended December 31, 2011:
| Year ended December 31, |
| Period ended December 31, | ||||||||||||||||||||||
| 2013 |
| 2012 |
| 2011 | ||||||||||||||||||||
| Average balance |
| Interest income/ interest expense |
| Yield/ rate |
| Average |
| Interest income/ |
| Yield/ |
| Average | ||||||||||||
| (In thousands) | ||||||||||||||||||||||||
Assets |
|
|
|
|
|
|
|
|
|
|
|
|
| ||||||||||||
Interest-bearing assets |
|
|
|
|
|
|
|
|
|
|
|
|
| ||||||||||||
Loans (1) | $ | 7,676 | |
| $ | 664 | |
| 8.7 | % |
| $ | 8,576 | |
| $ | 905 | |
| 10.6 | % |
| $ | 10,159 | |
Taxable investment securities | 19,415 | |
| 161 | |
| 0.8 | |
| 4,969 | |
| 53 | |
| 1.1 | |
| 4,025 | | |||||
Non-taxable investment securities | 1,539 | |
| 32 | |
| 2.1 | |
| 2,155 | |
| 39 | |
| 1.8 | |
| 2,420 | | |||||
Federal reserve stock | 1,603 | |
| 97 | |
| 6.1 | |
| 561 | |
| 34 | |
| 6.1 | |
| - | | |||||
Federal funds sold | 1,561 | |
| 2 | |
| 0.1 | |
| 2,218 | |
| 4 | |
| 0.2 | |
| 2,400 | | |||||
Cash | 310,552 | |
| 805 | |
| 0.3 | |
| 77,654 | |
| 165 | |
| 0.2 | |
| 26,612 | | |||||
Total interest-bearing assets | 342,346 | |
| 1,761 | |
| 0.5 | % |
| 96,133 | |
| 1,200 | |
| 1.2 | % |
| 45,616 | | |||||
Non-interest bearing assets | 53,792 | |
|
|
|
|
| 14,940 | |
|
|
|
|
| 13,433 | | |||||||||
Total assets | $ | 396,138 | |
|
|
|
|
| $ | 111,073 | |
|
|
|
|
| $ | 59,049 | | ||||||
|
|
|
|
|
|
|
|
|
|
|
|
|
| ||||||||||||
Liabilities |
|
|
|
|
|
|
|
|
|
|
|
| | ||||||||||||
Interest-bearing liabilities |
|
|
|
|
|
|
|
|
|
|
|
|
| ||||||||||||
Negotiable order of withdrawal (NOW) | $ | 1,607 | |
| $ | 10 | |
| 0.6 | % |
| $ | 1,650 | |
| $ | 12 | |
| 0.7 | % |
| $ | 1,634 | |
Savings deposits | 6,231 | |
| 2 | |
| - | |
| 6,742 | |
| 2 | |
| - | |
| 6,812 | | |||||
Time deposits, denominations greater than or equal to $100 | 5,825 | |
| 40 | |
| 0.7 | |
| 6,642 | |
| 62 | |
| 0.9 | |
| 1,383 | | |||||
Time deposits, denominations less than $100 | 2,288 | |
| 13 | |
| 0.6 | |
| 3,031 | |
| 32 | |
| 1.1 | |
| 9,779 | | |||||
Total interest-bearing liabilities | 15,951 | |
| 65 | |
| 0.4 | % |
| 18,065 | |
| 108 | |
| 0.6 | % |
| 19,608 | | |||||
Non-interest bearing liabilities | 314,002 | |
|
|
|
|
| 58,176 | |
|
|
|
|
| 16,770 | | |||||||||
Total liabilities | 329,953 | |
|
|
|
|
| 76,241 | |
|
|
|
|
| 19,608 | | |||||||||
Total stockholders' equity | 66,185 | |
|
|
|
|
| 34,832 | |
|
|
|
|
| 22,671 | | |||||||||
Total liabilities and stockholders' equity | $ | 396,138 | |
|
|
|
|
| $ | 111,073 | |
|
|
|
|
| $ | 42,279 | | ||||||
___________
(1) | Non-performing loans and leases are included in the respective average loan and lease balances. Income, if any, on such loans and leases is recognized on a cash basis. |
44
Table of Contents
The following table presents the rate/volume variance in interest income and expense for the year ended December 31, 2013:
| December 31, 2013 | ||||||||||
| Total Change in Interest Income/ Expense |
| Change Due to Rate (1) |
| Change Due to Volume (1) | ||||||
| (In thousands) | ||||||||||
Loans | $ | (241 | ) |
| $ | (28 | ) |
| $ | (213 | ) |
Taxable investment securities | 108 | |
| (22 | ) |
| 130 | | |||
Non-taxable investment securities | (7 | ) |
| 4 | |
| (11 | ) | |||
Federal reserve stock | 63 | |
| (7 | ) |
| 70 | | |||
Federal funds sold | (2 | ) |
| (1 | ) |
| (1 | ) | |||
Cash | 640 | |
| 152 | |
| 488 | | |||
| $ | 561 | |
| $ | 98 | |
| $ | 463 | |
|
|
|
|
|
| ||||||
Negotiable order of withdrawal (NOW) | - | |
| - | |
| - | | |||
Savings deposits | (2 | ) |
| (1 | ) |
| (1 | ) | |||
Time deposits, denominations greater than or equal to $100 | (22 | ) |
| (15 | ) |
| (7 | ) | |||
Time deposits, denominations less than $100 | (19 | ) |
| (16 | ) |
| (3 | ) | |||
| $ | (43 | ) |
| $ | (32 | ) |
| $ | (11 | ) |
___________
(1) | The change in interest income and expense not solely due to changes in volume or rate has been allocated on a pro-rata basis to the volume and rate columns. |
The change in interest income and expense from the period ended December 31, 2011 to the year ended December 31, 2012 was volume related.
Investment Portfolio
The following table presents the amortized cost and fair value of Green Dot Bank's investment portfolio at December 31, 2013 , 2012 and 2011:
| December 31, 2013 |
| December 31, 2012 |
| December 31, 2011 | ||||||||||||||||||
| Amortized Cost |
| Fair Value |
| Amortized Cost |
| Fair Value |
| Amortized Cost |
| Fair Value | ||||||||||||
| (In thousands) | ||||||||||||||||||||||
Corporate bonds | $ | 28,718 | |
| $ | 28,730 | |
| $ | - | |
| $ | - | |
| $ | - | |
| $ | - | |
Agency securities | 245 | |
| 245 | |
| 804 | |
| 811 | |
| 3,979 | |
| 3,987 | | ||||||
Mortgage-backed securities | 4,169 | |
| 4,002 | |
| - | |
| - | |
| - | |
| - | | ||||||
Municipal bonds | 1,672 | |
| 1,679 | |
| 2,022 | |
| 2,058 | |
| 2,379 | |
| 2,391 | | ||||||
U.S. treasury notes | - | |
| - | |
| 20,020 | |
| 19,956 | |
| - | |
| - | | ||||||
Total fixed-income securities | $ | 34,804 | |
| $ | 34,656 | |
| $ | 22,846 | |
| $ | 22,825 | |
| $ | 6,358 | |
| $ | 6,378 | |
The following table shows the scheduled maturities, by amortized cost, and average yields for Green Dot Bank's investment portfolio at December 31, 2013 :
| Due in one year or less |
| Due after one year through five years |
| Due after five years through ten years |
| Due after ten years |
| Total | ||||||||||
| (In thousands, except percentages) | ||||||||||||||||||
Corporate bonds | $ | 18,248 | |
| $ | 10,470 | |
| $ | - | |
| $ | - | |
| $ | 28,718 | |
Agency securities | - | |
| - | |
| 245 | |
| - | |
| 245 | | |||||
Mortgage-backed securities | - | |
| - | |
| - | |
| 4,169 | |
| 4,169 | | |||||
Municipal bonds | 107 | |
| 721 | |
| 344 | |
| 500 | |
| 1,672 | | |||||
Total fixed-income securities | $ | 18,355 | |
| $ | 11,191 | |
| $ | 589 | |
| $ | 4,669 | |
| $ | 34,804 | |
Weighted-average yield | 0.6 | % |
| 0.5 | % |
| 0.2 | % |
| 4.9 | % |
| 0.6 | % | |||||
45
Table of Contents
Loan Portfolio
The aggregate loan portfolio carrying value, gross of the related allowance for loan losses, totaled $7.4 million at December 31, 2013 or a 8% decrease compared to December 31, 2012 . The following table shows the composition of Green Dot Bank's loan portfolio as of December 31, 2013 , 2012 and 2011:
| As of December 31, | |||||||||
| 2013 |
| 2012 |
| 2011 | |||||
| (In thousands) | |||||||||
Real estate | $ | 3,383 | |
| $ | 3,556 | |
| 5,486 | |
Commercial | 1,474 | |
| 1,179 | |
| 1,417 | | ||
Installment | 2,509 | |
| 3,292 | |
| 3,133 | | ||
Total loans | 7,366 | |
| 8,027 | |
| 10,036 | | ||
|
|
|
|
|
| |||||
Loans on nonaccrual status | 473 | |
| 405 | |
| - | | ||
Loans past due 90 days or more | - | |
| - | |
| - | | ||
Total TDR | 296 | |
| 295 | |
| - | | ||
The following table presents a maturity distribution for selected loan categories. This table excludes real estate loans and installment loans as of December 31, 2013:
| Due in one year or less |
| Due after one year through five years |
| Due after five years |
| Total | ||||
| (In thousands) | ||||||||||
Commercial |
|
|
|
|
|
|
| ||||
Fixed rate | 1,333 | |
| 50 | |
| - | |
| 1,383 | |
Floating rate | - | |
| 91 | |
| - | |
| 91 | |
Allowance for Loan Losses
The allowance for loan losses totaled $0.5 million and $0.5 million at December 31, 2013 and 2012 , respectively. The consistent balance in the allowance for loan losses during the year ended December 31, 2013 was primarily due to the identification of several impaired loans and applying specific reserves to cover their potential losses. Refer to Note 2 - Summary of Significant Accounting Policies in Item 8 of this report for our accounting policy on allowance for loan losses.
46
Table of Contents
| December 31, 2013 |
| December 31, 2012 | ||||
| (In thousands) | ||||||
Allowance for loan losses: |
|
|
| ||||
Beginning balance | $ | 475 | |
| $ | - | |
Loans charged off: |
|
|
| ||||
Commercial | - | |
| - | | ||
Real Estate | - | |
| 59 | | ||
Installment | 25 | |
| 164 | | ||
Total | 25 | |
| 223 | | ||
Recoveries of loans previously charged off: |
|
|
| ||||
Commercial | - | |
| - | | ||
Real Estate | - | |
| - | | ||
Installment | 14 | |
| - | | ||
Total | 14 | |
| - | | ||
Net loans charged off | 11 | |
| 223 | | ||
Provision for allowance for loan losses | - | |
| 698 | | ||
Ending balance | $ | 464 | |
| $ | 475 | |
Allowance for loan losses to loans outstanding at year-end | 6.3 | % |
| 5.9 | % | ||
|
|
|
| ||||
Net charge-offs to average loans | - | |
| 0.03 | | ||
Total provision for (reduction of) credit losses to average loans | - | |
| 0.08 | | ||
Recoveries to gross charge-offs | - | |
| - | | ||
Allowance for loan losses as a multiple of net charge-offs | 18.56 | |
| 2.13 | | ||
At December 31, 2013 , the carrying value, gross of the related allowance for loan losses, of impaired and TDR loans totaled $0.4 million. Of these loans, $0.3 million have a specific allowance of $0.2 million and $0.1 million with no specific allowances because we expect to recover these allowances.
The components of our allowance for loan losses, by category, are as follows:
| December 31, 2013 |
| December 31, 2012 | ||||||||||
| Allowance |
| % of Loans |
| Allowance |
| % of Loans | ||||||
| (In thousands) | ||||||||||||
Loan category: |
| ||||||||||||
Commercial | $ | 64 | |
| 13.8 | % |
| $ | 96 | |
| 14.3 | % |
Real Estate | 136 | |
| 29.3 | |
| 226 | |
| 44.2 | | ||
Installment | 264 | |
| 56.9 | |
| 153 | |
| 41.5 | | ||
Total | $ | 464 | |
| 100.0 | % |
| $ | 475 | |
| 100.0 | % |
Loan Portfolio Concentrations
Green Dot Bank, our subsidiary bank, operates at a single office in Provo, Utah located in the Utah County area. As of December 31, 2013 , approximately 94.1% of our borrowers resided in the state of Utah and approximately 41.0% in the city of Provo. Consequently, we are susceptible to any adverse market or environmental conditions that may impact this specific geographic region.
47
Table of Contents
Deposits
The following table shows Green Dot Bank's average deposits and the annualized average rate paid on those deposits for the years ended December 31, 2013 , December 31, 2012 , and December 31, 2011:
| December 31, 2013 |
| December 31, 2012 |
| December 31, 2011 | |||||||||||||||
| Average Balance |
| Weighted-Average Rate |
| Average Balance |
| Weighted-Average Rate |
| Average Balance |
| Weighted-Average Rate | |||||||||
| (In thousands, except percentages) | |||||||||||||||||||
Interest-bearing deposit accounts |
|
|
|
|
|
|
|
|
|
|
| |||||||||
Negotiable order of withdrawal (NOW) | $ | 1,607 | |
| 0.1 | % |
| $ | 1,650 | |
| 0.3 | % |
| $ | 1,634 | |
| 0.3 | % |
Savings deposits | 6,230 | |
| 0.1 | |
| 6,724 | |
| 0.3 | |
| 6,812 | |
| 0.4 | | |||
Time deposits, denominations greater than or equal to $100 | 5,414 | |
| 0.9 | |
| 3,020 | |
| 0.7 | |
| 1,383 | |
| 1.1 | | |||
Time deposits, denominations less than $100 | 2,698 | |
| 0.6 | |
| 6,742 | |
| 0.8 | |
| 9,779 | |
| 1.2 | | |||
Total interest-bearing deposit accounts | 15,949 | |
| 0.5 | % |
| 18,136 | |
| 0.5 | % |
| 19,608 | |
| 0.8 | % | |||
Non-interest bearing deposit accounts | 271,422 | |
|
|
| 50,151 | |
|
|
| 16,738 | |
|
| ||||||
Total deposits | $ | 287,371 | |
|
|
| $ | 68,287 | |
|
|
| $ | 36,346 | |
|
| |||
The following table shows the scheduled maturities for Green Dot Bank's time deposits portfolio greater than $100,000 at December 31, 2013 :
| December 31, 2013 | |
| (In thousands) | |
Less than 3 months | 605 | |
3 through 6 months | 736 | |
6 through 12 months | 1,211 | |
Greater than 12 months | 867 | |
| 3,419 | |
Key Financial Ratios
The following table shows certain of Green Dot Bank's key financial ratios for the years ended December 31, 2013 , and 2012 , and the period from December 8, 2011 through December 31, 2011:
| December 31, 2013 |
| December 31, 2012 |
| December 31, 2011 | |||
Pretax return on assets | 1.1 | % |
| 2.4 | % |
| - | % |
Net return on equity | 6.5 | |
| 7.7 | |
| 0.1 | |
Equity to assets ratio | 16.7 | |
| 31.4 | |
| 38.4 | |
ITEM 7A. Quantitative and Qualitative Disclosures about Market Risk
Market risk is the potential for economic losses from changes in market factors such as foreign currency exchange rates, credit, interest rates and equity prices. We believe that we have limited exposure to risks associated with changes in foreign currency exchange rates, interest rates and equity prices. We have no foreign operations, and we do not transact business in foreign currencies. We do not hold or enter into derivatives or other financial instruments for trading or speculative purposes. We do not consider our cash and cash equivalents or our investment securities to be subject to significant interest rate risk due to their short duration.
We do have exposure to credit and liquidity risk associated with the financial institutions that hold our cash and cash equivalents, restricted cash, available-for-sale investment securities, settlement assets due from our retail distributors that collect funds and fees from our customers, and amounts due from our issuing banks for fees collected on our behalf.
We manage the credit and liquidity risk associated with our cash and cash equivalents, available-for-sale investment securities and amounts due from issuing banks by maintaining an investment policy that restricts our correspondent banking relationships to approved, well capitalized institutions and restricts investments to highly liquid, low credit risk related assets. Our policy has limits related to liquidity ratios, the concentration that we may have with a single institution or issuer and effective maturity dates as well as restrictions on the type of assets that we may invest in. The management Asset Liability Committee is responsible for monitoring compliance with our Capital Asset Liability Management policy and related limits on an ongoing basis, and reports regularly to the audit committee of our board of directors.
48
Our exposure to credit risk associated with our retail distributors is mitigated due to the short time period, currently an average of two days that retailer settlement assets are outstanding. We perform an initial credit review and assign a credit limit to each new retail distributor. We monitor each retail distributor's settlement asset exposure and its compliance with its specified contractual settlement terms on a daily basis and assess their credit limit and financial condition on a periodic basis. Our management's Enterprise Risk Management Committee is responsible for monitoring our retail distributor exposure and assigning credit limits and reports regularly to the audit committee of our board of directors.
49
Table of Contents
ITEM 8. Financial Statements and Supplementary Data
Index to Consolidated Financial Statements
| Page |
|
|
Report of Independent Registered Public Accounting Firm on Internal Control Over Financial Reporting | 51 |
Report of Independent Registered Public Accounting Firm | 52 |
Consolidated Balance Sheets | 53 |
Consolidated Statements of Operations | 54 |
Consolidated Statements of Comprehensive Income | 55 |
Consolidated Statements of Changes in Stockholders' Equity | 56 |
Consolidated Statements of Cash Flows | 57 |
Notes to Consolidated Financial Statements | 58 |
All financial statement schedules have been omitted, since the required information is not applicable or is not present in amounts sufficient to require submission of the schedule, or because the information required is included in the consolidated financial statements and notes thereto.
50
Table of Contents
Report of Independent Registered Public Accounting Firm
On Internal Control Over Financial Reporting
The Board of Directors and Stockholders
Green Dot Corporation
We have audited Green Dot Corporation's internal control over financial reporting as of December 31, 2013 , based on criteria established in Internal Control-Integrated Framework issued by the Committee of Sponsoring Organizations of the Treadway Commission (1992 framework) (the COSO criteria). Green Dot Corporation's management is responsible for maintaining effective internal control over financial reporting, and for its assessment of the effectiveness of internal control over financial reporting included in the accompanying Report of Management on Internal Control Over Financial Reporting. Our responsibility is to express an opinion on the company's internal control over financial reporting based on our audit.
We conducted our audit in accordance with the standards of the Public Company Accounting Oversight Board (United States). Those standards require that we plan and perform the audit to obtain reasonable assurance about whether effective internal control over financial reporting was maintained in all material respects. Our audit included obtaining an understanding of internal control over financial reporting, assessing the risk that a material weakness exists, testing and evaluating the design and operating effectiveness of internal control based on the assessed risk, and performing such other procedures as we considered necessary in the circumstances. We believe that our audit provides a reasonable basis for our opinion.
A company's internal control over financial reporting is a process designed to provide reasonable assurance regarding the reliability of financial reporting and the preparation of financial statements for external purposes in accordance with generally accepted accounting principles. A company's internal control over financial reporting includes those policies and procedures that (1) pertain to the maintenance of records that, in reasonable detail, accurately and fairly reflect the transactions and dispositions of the assets of the company; (2) provide reasonable assurance that transactions are recorded as necessary to permit preparation of financial statements in accordance with generally accepted accounting principles, and that receipts and expenditures of the company are being made only in accordance with authorizations of management and directors of the company; and (3) provide reasonable assurance regarding prevention or timely detection of unauthorized acquisition, use, or disposition of the company's assets that could have a material effect on the financial statements.
Because of its inherent limitations, internal control over financial reporting may not prevent or detect misstatements. Also, projections of any evaluation of effectiveness to future periods are subject to the risk that controls may become inadequate because of changes in conditions, or that the degree of compliance with the policies or procedures may deteriorate.
In our opinion, Green Dot Corporation maintained, in all material respects, effective internal control over financial reporting as of December 31, 2013 , based on the COSO criteria .
We also have audited, in accordance with the standards of the Public Company Accounting Oversight Board (United States), the consolidated balance sheets as of December 31, 2013 and 2012 , and the related consolidated statements of operations, comprehensive income, changes in stockholders' equity, and cash flows for each of the three years in the period ended December 31, 2013 of Green Dot Corporation and our report dated March 3, 2014 expressed an unqualified opinion thereon.
/s/ Ernst & Young LLP
Los Angeles, California
March 3, 2014
51
Table of Contents
Report of Independent Registered Public Accounting Firm
The Board of Directors and Stockholders
Green Dot Corporation
We have audited the accompanying consolidated balance sheets of Green Dot Corporation (the Company) as of December 31, 2013 and 2012 , and the related consolidated statements of operations, comprehensive income, changes in stockholders' equity, and cash flows for each of the three years in the period ended December 31, 2013 . These financial statements are the responsibility of the Company's management. Our responsibility is to express an opinion on these financial statements based on our audits.
We conducted our audits in accordance with the standards of the Public Company Accounting Oversight Board (United States). Those standards require that we plan and perform the audit to obtain reasonable assurance about whether the financial statements are free of material misstatement. An audit includes examining, on a test basis, evidence supporting the amounts and disclosures in the financial statements. An audit also includes assessing the accounting principles used and significant estimates made by management, as well as evaluating the overall financial statement presentation. We believe that our audits provide a reasonable basis for our opinion.
In our opinion, the financial statements referred to above present fairly, in all material respects, the consolidated financial position of Green Dot Corporation at December 31, 2013 and 2012 , and the consolidated results of its operations and its cash flows for each of the three years in the period ended December 31, 2013 , in conformity with U.S. generally accepted accounting principles.
We also have audited, in accordance with the standards of the Public Company Accounting Oversight Board (United States), Green Dot Corporation's internal control over financial reporting as of December 31, 2013 , based on criteria established in Internal Control-Integrated Framework issued by the Committee of Sponsoring Organizations of the Treadway Commission (1992 framework) and our report dated March 3, 2014 expressed an unqualified opinion thereon.
/s/ Ernst & Young LLP
Los Angeles, California
March 3, 2014
52
Table of Contents
GREEN DOT CORPORATION
CONSOLIDATED BALANCE SHEETS
| December 31, | ||||||
| 2013 |
| 2012 | ||||
Assets | (In thousands, except par value) | ||||||
Current assets: |
|
|
| ||||
Unrestricted cash and cash equivalents | $ | 423,498 | |
| $ | 293,590 | |
Federal funds sold | 123 | |
| 3,001 | | ||
Investment securities available-for-sale, at fair value | 116,159 | |
| 115,244 | | ||
Settlement assets | 37,004 | |
| 36,127 | | ||
Accounts receivable, net | 46,384 | |
| 40,441 | | ||
Prepaid expenses and other assets | 27,332 | |
| 31,952 | | ||
Income tax receivable | 15,573 | |
| 7,386 | | ||
Net deferred tax assets | - | |
| 2,478 | | ||
Total current assets | 666,073 | |
| 530,219 | | ||
Restricted cash | 2,970 | |
| 634 | | ||
Investment securities, available-for-sale, at fair value | 82,585 | |
| 68,543 | | ||
Accounts receivable, net | 5,913 | |
| 10,931 | | ||
Loans to bank customers, net of allowance for loan losses of $464 and $475 as of December 31, 2013 and December 31, 2012, respectively | 6,902 | |
| 7,552 | | ||
Prepaid expenses and other assets | 1,081 | |
| 1,530 | | ||
Property and equipment, net | 60,473 | |
| 58,376 | | ||
Deferred expenses | 15,439 | |
| 12,510 | | ||
Net deferred tax assets | 3,362 | |
| 4,629 | | ||
Goodwill and intangible assets | 30,676 | |
| 30,804 | | ||
Total assets | $ | 875,474 | |
| $ | 725,728 | |
Liabilities and Stockholders' Equity |
|
|
| ||||
Current liabilities: |
|
|
| ||||
Accounts payable | $ | 34,940 | |
| $ | 31,411 | |
Deposits | 219,580 | |
| 198,451 | | ||
Obligations to customers | 65,449 | |
| 46,156 | | ||
Settlement obligations | 4,839 | |
| 3,639 | | ||
Amounts due to card issuing banks for overdrawn accounts | 49,930 | |
| 50,724 | | ||
Other accrued liabilities | 35,878 | |
| 29,469 | | ||
Deferred revenue | 24,517 | |
| 19,557 | | ||
Net deferred tax liabilities | 3,716 | |
| - | | ||
Total current liabilities | 438,849 | |
| 379,407 | | ||
Other accrued liabilities | 34,076 | |
| 18,557 | | ||
Deferred revenue | 300 | |
| - | | ||
Total liabilities | 473,225 | |
| 397,964 | | ||
Stockholders' equity: |
|
|
| ||||
Convertible Series A preferred stock, $0.001 par value: 10 shares authorized and 7 shares issued and outstanding as of December 31, 2013 and December 31, 2012 | 7 | |
| 7 | | ||
Class A common stock, $0.001 par value; 100,000 shares authorized as of December 31, 2013 and 2012; 37,729 and 31,798 shares issued and outstanding as of December 31, 2013 and 2012, respectively | 38 | |
| 31 | | ||
Class B convertible common stock, $0.001 par value, 0 and 100,000 shares authorized as of December 31, 2013 and 2012, respectively; 0 and 4,197 shares issued and outstanding as of December 31, 2013 and 2012, respectively | - | |
| 4 | | ||
Additional paid-in capital | 199,251 | |
| 158,656 | | ||
Retained earnings | 203,000 | |
| 168,960 | | ||
Accumulated other comprehensive (loss) income | (47 | ) |
| 106 | | ||
Total stockholders' equity | 402,249 | |
| 327,764 | | ||
Total liabilities and stockholders' equity | $ | 875,474 | |
| $ | 725,728 | |
See notes to consolidated financial statements
53
Table of Contents
GREEN DOT CORPORATION
CONSOLIDATED STATEMENTS OF OPERATIONS
| Year Ended December 31, | ||||||||||
| 2013 |
| 2012 |
| 2011 | ||||||
| (In thousands, except per share data) | ||||||||||
Operating revenues: |
|
|
|
|
| ||||||
Card revenues and other fees | $ | 227,227 | |
| $ | 224,745 | |
| $ | 209,489 | |
Cash transfer revenues | 183,359 | |
| 165,232 | |
| 134,143 | | |||
Interchange revenues | 171,757 | |
| 164,559 | |
| 141,103 | | |||
Stock-based retailer incentive compensation | (8,722 | ) |
| (8,251 | ) |
| (17,337 | ) | |||
Total operating revenues | 573,621 | |
| 546,285 | |
| 467,398 | | |||
Operating expenses: |
|
|
|
|
| ||||||
Sales and marketing expenses | 218,370 | |
| 209,870 | |
| 168,747 | | |||
Compensation and benefits expenses | 127,287 | |
| 114,930 | |
| 87,671 | | |||
Processing expenses | 89,856 | |
| 77,445 | |
| 70,953 | | |||
Other general and administrative expenses | 88,976 | |
| 71,900 | |
| 56,578 | | |||
Total operating expenses | 524,489 | |
| 474,145 | |
| 383,949 | | |||
Operating income | 49,132 | |
| 72,140 | |
| 83,449 | | |||
Interest income | 3,440 | |
| 4,074 | |
| 910 | | |||
Interest expense | (72 | ) |
| (76 | ) |
| (346 | ) | |||
Income before income taxes | 52,500 | |
| 76,138 | |
| 84,013 | | |||
Income tax expense | 18,460 | |
| 28,919 | |
| 31,930 | | |||
Net income | 34,040 | |
| 47,219 | |
| 52,083 | | |||
Income attributable to preferred stock | (5,360 | ) |
| (7,599 | ) |
| (558 | ) | |||
Net income allocated to common stockholders | $ | 28,680 | |
| $ | 39,620 | |
| $ | 51,525 | |
Basic earnings per common share: |
|
|
|
|
| ||||||
Class A common stock | $ | 0.78 | |
| $ | 1.11 | |
| $ | 1.24 | |
Class B common stock | $ | 0.78 | |
| $ | 1.11 | |
| $ | 1.24 | |
Basic weighted-average common shares issued and outstanding: |
|
|
|
|
| ||||||
Class A common stock | 33,272 | |
| 29,698 | |
| 22,238 | | |||
Class B common stock | 2,603 | |
| 4,801 | |
| 17,718 | | |||
Diluted earnings per common share: |
|
|
|
|
| ||||||
Class A common stock | $ | 0.76 | |
| $ | 1.07 | |
| $ | 1.19 | |
Class B common stock | $ | 0.76 | |
| $ | 1.07 | |
| $ | 1.19 | |
Diluted weighted-average common shares issued and outstanding: |
|
|
|
|
| ||||||
Class A common stock | 37,156 | |
| 35,933 | |
| 42,065 | | |||
Class B common stock | 2,603 | |
| 6,150 | |
| 19,822 | | |||
See notes to consolidated financial statements
54
Table of Contents
GREEN DOT CORPORATION
CONSOLIDATED STATEMENTS OF COMPREHENSIVE INCOME
| Year Ended December 31, | ||||||||||
| 2013 |
| 2012 |
| 2011 | ||||||
| (In thousands) | ||||||||||
Net income | $ | 34,040 | |
| $ | 47,219 | |
| $ | 52,083 | |
Other comprehensive income (loss) |
|
|
|
|
| ||||||
Unrealized holding (losses) gains, net of tax | (153 | ) |
| 76 | |
| 30 | | |||
Comprehensive income | $ | 33,887 | |
| $ | 47,295 | |
| $ | 52,113 | |
See notes to consolidated financial statements
55
Table of Contents
GREEN DOT CORPORATION
CONSOLIDATED STATEMENTS OF CHANGES IN STOCKHOLDERS' EQUITY
| Convertible Preferred Stock |
| Class A Common Stock |
| Class B Common Stock |
| Additional Paid-in Capital |
| Retained Earnings |
| Accumulated Other Comprehensive Income (Loss) |
| Total Stockholders' Equity | |||||||||||||||||||||||
| Shares |
| Amount |
| Shares |
| Amount |
| Shares |
| Amount |
|
|
|
| |||||||||||||||||||||
| (In thousands) | |||||||||||||||||||||||||||||||||||
Balance at December 31, 2010 | - | |
| $ | - | |
| 14,762 | |
| $ | 13 | |
| 27,091 | |
| $ | 27 | |
| $ | 95,433 | |
| $ | 69,658 | |
| $ | - | |
| $ | 165,131 | |
Common stock issued under stock plans and related tax effects | - | |
| - | |
| 104 | |
| 2 | |
| 344 | |
| - | |
| 9,089 | |
| - | |
| - | |
| 9,091 | | |||||||
Stock-based compensation | - | |
| - | |
| - | |
| - | |
| - | |
| - | |
| 9,524 | |
| - | |
| - | |
| 9,524 | | |||||||
Stock-based retailer incentive compensation | - | |
| - | |
| - | |
| - | |
| - | |
| - | |
| 17,337 | |
| - | |
| - | |
| 17,337 | | |||||||
Conversion of Class B common stock by stockholders | 7 | |
| 7 | |
| 15,296 | |
| 15 | |
| (22,155 | ) |
| (22 | ) |
| - | |
| - | |
| - | |
| - | | |||||||
Net income | - | |
| - | |
| - | |
| - | |
| - | |
| - | |
| - | |
| 52,083 | |
| - | |
| 52,083 | | |||||||
Other comprehensive income | - | |
| - | |
| - | |
| - | |
| - | |
| - | |
| - | |
| - | |
| 30 | |
| 30 | | |||||||
Balance at December 31, 2011 | |
| $ | 7 | |
| 30,162 | |
| $ | 30 | |
| 5,280 | |
| $ | 5 | |
| $ | 131,383 | |
| $ | 121,741 | |
| $ | 30 | |
| $ | 253,196 | | |
Common stock issued under stock plans and related tax effects | - | |
| - | |
| 141 | |
| - | |
| 412 | |
| - | |
| 6,288 | |
| - | |
| - | |
| 6,288 | | |||||||
Stock-based compensation | - | |
| - | |
| - | |
| - | |
| - | |
| - | |
| 12,734 | |
| - | |
| - | |
| 12,734 | | |||||||
Stock-based retailer incentive compensation | - | |
| - | |
| - | |
| - | |
| - | |
| - | |
| 8,251 | |
| - | |
| - | |
| 8,251 | | |||||||
Conversion of Class B common stock by stockholders | - | |
| - | |
| 1,495 | |
| 1 | |
| (1,495 | ) |
| (1 | ) |
| - | |
| - | |
| - | |
| - | | |||||||
Net income | - | |
| - | |
| - | |
| - | |
| - | |
| - | |
| - | |
| 47,219 | |
| - | |
| 47,219 | | |||||||
Other comprehensive income | - | |
| - | |
| - | |
| - | |
| - | |
| - | |
| - | |
| - | |
| 76 | |
| 76 | | |||||||
Balance at December 31, 2012 | - | |
| $ | 7 | |
| 31,798 | |
| $ | 31 | |
| 4,197 | |
| $ | 4 | |
| $ | 158,656 | |
| $ | 168,960 | |
| $ | 106 | |
| $ | 327,764 | |
Common stock issued under stock plans and related tax effects | - | |
| - | |
| 620 | |
| 1 | |
| 1,114 | |
| 2 | |
| 17,170 | |
| - | |
| - | |
| 17,173 | | |||||||
Stock-based compensation | - | |
| - | |
| - | |
| - | |
| - | |
| - | |
| 14,703 | |
| - | |
| - | |
| 14,703 | | |||||||
Stock-based retailer incentive compensation | - | |
| - | |
| - | |
| - | |
| - | |
| - | |
| 8,722 | |
| - | |
| - | |
| 8,722 | | |||||||
Conversion of Class B common stock by stockholders | - | |
| - | |
| 5,311 | |
| 6 | |
| (5,311 | ) |
| (6 | ) |
| - | |
| - | |
| - | |
| - | | |||||||
Net income | - | |
| - | |
| - | |
| - | |
| - | |
| - | |
| - | |
| 34,040 | |
| - | |
| 34,040 | | |||||||
Other comprehensive loss | - | |
| - | |
| - | |
| - | |
| - | |
| - | |
| - | |
| - | |
| (153 | ) |
| (153 | ) | |||||||
Balance at December 31, 2013 | - | |
| $ | 7 | |
| 37,729 | |
| $ | 38 | |
| - | |
| $ | - | |
| $ | 199,251 | |
| $ | 203,000 | |
| $ | (47 | ) |
| $ | 402,249 | |
See notes to consolidated financial statements
56
Table of Contents
GREEN DOT CORPORATION
CONSOLIDATED STATEMENTS OF CASH FLOWS
| Year Ended December 31, | ||||||||||
| 2013 |
| 2012 |
| 2011 | ||||||
| (In thousands) | ||||||||||
Operating activities |
|
|
|
|
| ||||||
Net income | $ | 34,040 | |
| 47,219 | |
| 52,083 | | ||
Adjustments to reconcile net income to net cash provided by operating activities: |
|
|
|
|
| ||||||
Depreciation and amortization | 27,099 | |
| 18,131 | |
| 12,330 | | |||
Provision for uncollectible overdrawn accounts | 47,273 | |
| 62,345 | |
| 60,562 | | |||
Employee stock-based compensation | 14,703 | |
| 12,734 | |
| 9,524 | | |||
Stock-based retailer incentive compensation | 8,722 | |
| 8,251 | |
| 17,337 | | |||
Amortization of premium on available-for-sale investment securities | 778 | |
| 1,188 | |
| 251 | | |||
Realized gains on investment securities | (13 | ) |
| (11 | ) |
| - | | |||
(Recovery) Provision for uncollectible trade receivables | (23 | ) |
| (359 | ) |
| 455 | | |||
Impairment of capitalized software | 5,216 | |
| 1,029 | |
| 397 | | |||
Deferred income tax expense | 5,464 | |
| 5,792 | |
| 251 | | |||
Excess tax benefits from exercise of options | (2,748 | ) |
| (2,738 | ) |
| (2,951 | ) | |||
Changes in operating assets and liabilities: |
|
|
|
|
| ||||||
Accounts receivable, net | (48,175 | ) |
| (66,099 | ) |
| (70,510 | ) | |||
Prepaid expenses and other assets | 5,069 | |
| (21,325 | ) |
| (2,838 | ) | |||
Deferred expenses | (2,929 | ) |
| 94 | |
| (3,100 | ) | |||
Accounts payable and other accrued liabilities | 26,915 | |
| 31,475 | |
| (4,489 | ) | |||
Amounts due issuing bank for overdrawn accounts | (794 | ) |
| 7,571 | |
| 7,085 | | |||
Deferred revenue | 5,260 | |
| (1,962 | ) |
| 4,261 | | |||
Income tax receivable | (3,349 | ) |
| (1,307 | ) |
| 13,403 | | |||
Net cash provided by operating activities | 122,508 | |
| 102,028 | |
| 94,051 | | |||
|
|
|
|
|
| ||||||
Investing activities |
|
|
|
|
| ||||||
Purchases of available-for-sale investment securities | (274,072 | ) |
| (271,869 | ) |
| (45,056 | ) | |||
Proceeds from maturities of available-for-sale securities | 173,135 | |
| 37,563 | |
| 20,152 | | |||
Proceeds from sales of available-for-sale securities | 84,969 | |
| 81,474 | |
| - | | |||
(Increase) decrease in restricted cash | (2,336 | ) |
| 12,292 | |
| (7,791 | ) | |||
Payments for acquisition of property and equipment | (35,742 | ) |
| (40,441 | ) |
| (23,076 | ) | |||
Net principal collections on loans | 650 | |
| 2,484 | |
| 245 | | |||
Acquisitions, net of cash acquired | - | |
| (31,823 | ) |
| 5,085 | | |||
Net cash used in investing activities | (53,396 | ) |
| (210,320 | ) |
| (50,441 | ) | |||
|
|
|
|
|
| ||||||
Financing activities |
|
|
|
|
| ||||||
Proceeds from exercise of options | 14,425 | |
| 3,550 | |
| 6,138 | | |||
Excess tax benefits from exercise of options | 2,748 | |
| 2,738 | |
| 2,951 | | |||
Net increase in deposits | 21,129 | |
| 159,494 | |
| 5,231 | | |||
Net increase in obligations to customers | 19,616 | |
| 13,668 | |
| - | | |||
Net cash provided by financing activities | 57,918 | |
| 179,450 | |
| 14,320 | | |||
|
|
|
|
|
| ||||||
Net increase in unrestricted cash, cash equivalents, and federal funds sold | 127,030 | |
| 71,158 | |
| 57,930 | | |||
Unrestricted cash, cash equivalents, and federal funds sold, beginning of year | 296,591 | |
| 225,433 | |
| 167,503 | | |||
Unrestricted cash, cash equivalents, and federal funds sold, end of period | $ | 423,621 | |
| $ | 296,591 | |
| $ | 225,433 | |
|
|
|
|
|
| ||||||
Cash paid for interest | 73 | |
| 98 | |
| 108 | | |||
Cash paid for income taxes | 16,351 | |
| 28,203 | |
| 18,291 | | |||
See notes to consolidated financial statements
57
Table of Contents
GREEN DOT CORPORATION
NOTES TO CONSOLIDATED FINANCIAL STATEMENTS
Note 1-Organization
Green Dot Corporation ("we," "us" and "our" refer to Green Dot Corporation and its wholly-owned subsidiaries, Next Estate Communications, Inc.; Green Dot Bank; and Loopt, LLC) is a bank holding company with a mission to reinvent personal banking for the masses. Our prepaid products and services are available in more than 90,000 retail stores nationwide and online at Greendot.com. Our products include: Green Dot MasterCard and Visa-branded prepaid debit cards and several co-branded reloadable prepaid card programs, collectively referred to as our GPR cards; Visa-branded gift cards; our MoneyPak and swipe reload proprietary products, collectively referred to as our cash transfer products, which enable cash loading and transfer services through our Green Dot Network; and GoBank, an innovative checking account developed for distribution and use via mobile phones. GoBank is available online at GoBank.com and via the Apple App Store and Google Play. The Green Dot Network enables consumers to use cash to reload our prepaid debit cards or to transfer cash to any of our Green Dot Network acceptance members, including competing prepaid card programs and other online accounts.
We market our products and services to banked, underbanked and unbanked consumers in the United States using distribution channels other than traditional bank branches, such as third-party retailer locations nationwide and the Internet. Our prepaid debit cards are issued by Green Dot Bank and third-party issuing banks including GE Capital Retail Bank, The Bancorp Bank, Sunrise Banks, N.A., and prior to November 2012, Columbus Bank and Trust Company, a division of Synovus Bank. We also have multi-year distribution arrangements with many large and medium-sized retailers, such as Walmart, Walgreens, CVS, Rite Aid, 7-Eleven, Kroger, Kmart, and Dollar Tree, and with various industry resellers, such as Blackhawk Network and Incomm. We refer to participating retailers collectively as our "retail distributors."
Acquisitions
In March 2012, we acquired Loopt, Inc., or Loopt, for approximately $33.6 million in cash in exchange for all of its outstanding shares. Loopt's results of operations are included in our consolidated results of operations following the acquisition date. We paid $9.8 million in retention-based incentives for employees we hired in connection with the acquisition of Loopt. In December 2012, we converted Loopt from a corporation to a limited liability company.
Note 2-Summary of Significant Accounting Policies
Principles of Consolidation and Basis of Presentation
Our consolidated financial statements include the results of entities that we control through a 50% or more ownership interest. We have prepared the accompanying consolidated financial statements in accordance with generally accepted accounting principles in the United States of America, or GAAP. We have eliminated all significant intercompany balances and transactions in consolidation. We include the results of operations of acquired companies from the date of acquisition.
Use of Estimates and Assumptions
The preparation of financial statements in conformity with GAAP requires us to make estimates and assumptions that affect the amounts reported in the consolidated financial statements, including the accompanying notes. We base our estimates and assumptions on historical factors, current circumstances, and the experience and judgment of management. We evaluate our estimates and assumptions on an ongoing basis. Actual results could differ from those estimates.
Unrestricted Cash and Cash Equivalents and Federal Funds Sold
We consider all unrestricted highly liquid investments with an original maturity of three months or less to be unrestricted cash and cash equivalents. Federal funds sold consist of unsecured overnight advances of excess balances in our bank reserve account and are included in unrestricted cash and cash equivalents on our statements of cash flows.
Investment Securities
Our investment portfolio is primarily comprised of fixed income securities. We classify these securities as available-for-sale and report them at fair value with the related unrealized gains and losses, net of tax, included in accumulated other comprehensive income, a component of stockholders' equity. We classify investment securities with original maturities greater than 90 days, but less than or equal to 365 days as current assets.
58
Table of Contents
GREEN DOT CORPORATION
NOTES TO CONSOLIDATED FINANCIAL STATEMENTS – (CONTINUED)
Note 2-Summary of Significant Accounting Policies (continued)
We regularly evaluate each fixed income security where the value has declined below amortized cost to assess whether the decline in fair value is other-than-temporary. In determining whether an impairment is other-than-temporary, we consider the severity and duration of the decline in fair value, the length of time expected for recovery, the financial condition of the issuer, and other qualitative factors, as well as whether we either plan to sell the security or it is more-likely-than-not that we will be required to sell the security before recovery of its amortized cost. If the impairment of the investment security is credit-related, an other-than-temporary impairment is recorded in earnings. We recognize non-credit-related impairment in accumulated other comprehensive income. If we intend to sell an investment security or believe we will more-likely-than-not be required to sell a security, we record the full amount of the impairment as an other-than-temporary impairment.
Interest on fixed income securities, including amortization of premiums and accretion of discounts, is included in interest income.
Obligations to Customers and Settlement Assets and Obligations
Our retail distributors collect customer funds for purchases of new cards and reloads at the point of sale and then remit these funds directly to bank accounts established for the benefit of these customers by the banks that issue our cards. During the third quarter of 2012, our retail distributors began remitting these funds to our subsidiary bank as we transitioned our card issuing program with Synovus Bank to our subsidiary bank. Our retail distributors' remittance of these funds takes an average of two business days.
Settlement assets represent the amounts due from our retail distributors for customer funds collected at the point of sale that have not yet been received by our subsidiary bank. Obligations to customers represent customer funds collected from or to be remitted by our retail distributors for which the underlying products have not been activated. Settlement obligations represent the customer funds received by our subsidiary bank that are due to third-party card issuing banks upon activation.
Accounts Receivable, Net
Accounts receivable is comprised principally of receivables due from card issuing banks, overdrawn account balances due from cardholders, trade accounts receivable and other receivables. We record accounts receivable net of reserves for estimated uncollectible accounts. Receivables due from card issuing banks primarily represent revenue-related funds collected by the third-party card issuing banks from our retail distributors, merchant banks and cardholders that have yet to be remitted to us. These receivables are generally collected within a short period of time based on the remittance terms in our agreements with the third-party card issuing banks.
Overdrawn Account Balances Due from Cardholders and Reserve for Uncollectible Overdrawn Accounts
Cardholder account overdrafts may arise from maintenance fee assessments on our GPR cards or from purchase transactions that we honor on GPR or gift cards, in each case in excess of the funds in a cardholder's account. We are exposed to losses from unrecovered cardholder account overdrafts. We establish a reserve for uncollectible overdrawn accounts. We classify overdrawn accounts into age groups based on the number of days that have elapsed since an account has had activity, such as a purchase, ATM transaction or maintenance fee assessment. We calculate a reserve factor for each age group based on the average recovery rate for the most recent six months. These factors are applied to these age groups to estimate our overall reserve. When more than 90 days have passed without activity in an account, we consider recovery to be remote and write off the full amount of the overdrawn account balance. We include our provision for uncollectible overdrawn accounts related to maintenance fees and purchase transactions as an offset to card revenues and other fees and in other general and administrative expenses, respectively, in the accompanying consolidated statements of operations.
Restricted Cash
We maintain restricted deposits in bank accounts to collateralize a standby letter of credit that guarantees our full performance of our obligations under our ten-year office lease in Pasadena, California.
Loans to Bank Customers
We report loans measured at historical cost at their outstanding principal balances, net of any charge-offs, and for purchased loans, net of any unaccreted discounts. We recognize interest income as it is earned.
59
Table of Contents
GREEN DOT CORPORATION
NOTES TO CONSOLIDATED FINANCIAL STATEMENTS – (CONTINUED)
Note 2-Summary of Significant Accounting Policies (continued)
Purchased Credit-Impaired Loans
In connection with our acquisition of Green Dot Bank, we acquired loans and recorded them at fair value on the acquisition date. Some of our purchased loans had evidence of credit quality deterioration since origination. We consider purchased loans to be impaired if we do not expect to receive all contractually required cash flows due to concerns about credit quality. The excess of the cash flows expected to be collected measured as of the acquisition date, over the estimated fair value is referred to as the accretable yield and is recognized in interest income over the remaining life of the loan using a level yield methodology. The difference between contractually-required payments as of the acquisition date and the cash flows expected to be collected is referred to as the nonaccretable difference.
We determine the initial fair values of purchased credit-impaired loans, or PCI loans, using a discounted cash flow model based on assumptions about the amount and timing of principal and interest payments, estimates of principal losses and current market rates. If there are subsequent decreases in expected principal cash flows, we record a charge to the provision for credit losses and a corresponding increase to the allowance for loan losses. If there are subsequent increases in expected principal cash flows, we record a recovery of any previously recorded allowance for loan losses, to the extent applicable, and a reclassification from nonaccretable difference to accretable yield for any remaining increase.
Since PCI loans are recorded at fair value at the acquisition date, we do not classify these loans as nonperforming as the loans were written down to fair value at the acquisition date and the accretable yield is recognized in interest income over the remaining life of the loan.
Nonperforming Loans
Nonperforming loans generally include loans, other than PCI loans, that have been placed on nonaccrual status. We generally place loans on nonaccrual status when they are past due 90 days or more. We reverse the related accrued interest receivable and apply interest collections on nonaccruing loans as principal reductions; otherwise, we credit such collections to interest income when received. These loans may be restored to accrual status when all principal and interest is current and full repayment of the remaining contractual principal and interest is expected.
We consider a loan to be impaired when it is probable that we will be unable to collect all amounts due according to the contractual terms of the loan agreement. Once we determine a loan to be impaired, we measure the impairment based on the present value of the expected future cash flows discounted at the loan's effective interest rate. We may also measure impairment based on observable market prices, or for loans that are solely dependent on the collateral for repayment, the estimated fair value of the collateral less estimated costs to sell. If the recorded investment in impaired loans exceeds this amount, we establish a specific allowance as a component of the allowance for loan losses or by adjusting an existing valuation allowance for the impaired loan.
Allowance for Loan Losses
We establish an allowance for loan losses to account for estimated credit losses inherent in our loan portfolio. For the portfolio of loans excluding impaired and PCI loans, our estimate of inherent losses is separately calculated on an aggregate basis for groups of loans that are considered to have similar credit characteristics and risk of loss. We analyze historical loss rates for these groups and then adjust the rates for qualitative factors which in our judgment affect the expected inherent losses. Qualitative considerations include, but are not limited to, prevailing economic or market conditions, changes in the loan grading and underwriting process, changes in the estimated value of the underlying collateral for collateral dependent loans, delinquency and nonaccrual status, problem loan trends, and geographic concentrations. We separately establish specific allowances for impaired and PCI loans based on the present value of changes in cash flows expected to be collected, or for impaired loans that are considered collateral dependent, the estimated fair value of the collateral.
Property and Equipment
We carry our property and equipment at cost less accumulated depreciation and amortization. We generally compute depreciation on property and equipment using the straight-line method over the estimated useful lives of the assets, except for internal-use software in development and land, which are not depreciated. We generally compute amortization on tenant improvements using the straight-line method over the shorter of the related lease term or estimated useful lives of the improvements. We expense expenditures for maintenance and repairs as incurred.
60
Table of Contents
GREEN DOT CORPORATION
NOTES TO CONSOLIDATED FINANCIAL STATEMENTS – (CONTINUED)
Note 2-Summary of Significant Accounting Policies (continued)
The estimated useful lives of the respective classes of assets are as follows:
Land | N/A |
Building | 30 years |
Computer equipment, furniture and office equipment | 3-4 years |
Computer software purchased | 3 years |
Capitalized internal-use software | 2 years |
Tenant improvements | Shorter of the useful life or the lease term |
We capitalize certain internal and external costs incurred to develop internal-use software during the application development stage. We also capitalize the cost of specified upgrades and enhancements to internal-use software that result in additional functionality. Once a development project is substantially complete and the software is ready for its intended use, we begin depreciating these costs on a straight-line basis over the internal-use software's estimated useful life.
Impairment of Long Lived Assets
We evaluate long-lived assets for impairment whenever events or changes in circumstances indicate that the carrying amount of an asset may not be recoverable. If the sum of expected undiscounted future cash flows from an asset is less than the carrying amount of the asset, we recognize an impairment loss. We measure the loss as the amount by which the carrying amount exceeds its fair value calculated using the present value of estimated net future cash flows. Included in other general and administrative expenses in our consolidated statements of operations for the years ended December 31, 2013 , 2012 and 2011 were $5.2 million , $1.0 million and $0.4 million , respectively, of recognized impairment losses on internal-use software.
Goodwill and Intangible Assets
Goodwill is the purchase premium after adjusting for the fair value of net assets acquired. Goodwill is not amortized but is reviewed for potential impairment on an annual basis, or when events or circumstances indicate a potential impairment, at the reporting unit level. A reporting unit, as defined under applicable accounting guidance, is a business segment or one level below a business segment. We may in any given period bypass the qualitative assessment and proceed directly to a two step method to assess and measure impairment of the reporting units goodwill. We first assess qualitative factors to determine whether it is more likely-than-not (i.e., a likelihood of more than 50 percent) that the fair value of a reporting unit is less than its carrying value. This step serves as the basis for determining whether it is necessary to perform the two-step quantitative impairment test. The first step of the quantitative impairment test involves a comparison of the estimated fair value of each reporting unit to its carrying amount, including goodwill. If the estimated fair value of the reporting unit exceeds its carrying amount, goodwill of the reporting unit is not impaired; however, if the carrying amount of the reporting unit exceeds its estimated fair value, then the second step of the quantitative impairment test must be performed. The second step compares the implied fair value of the reporting unit's goodwill with its carrying amount to measure the amount of impairment loss, if any. The implied fair value of goodwill is determined in the same manner as the amount of goodwill recognized in a business combination. If the carrying amount of the reporting unit's goodwill exceeds the implied fair value of that goodwill, an impairment loss is recognized in an amount equal to that excess.
For intangible assets, we recognize an impairment loss if the carrying amount of the intangible asset is not recoverable and exceeds fair value. The carrying amount of the intangible asset is considered not recoverable if it exceeds the sum of the undiscounted cash flows expected to result from the use of the asset.
Intangible assets with finite lives are amortized on a straight-line basis over their estimated useful lives.
Amounts Due to Card Issuing Banks for Overdrawn Accounts
Our third-party card issuing banks fund overdrawn cardholder account balances on our behalf. Amounts funded are due from us to the card issuing banks based on terms specified in the agreements with the card issuing banks. Generally, we expect to settle these obligations within two months.
61
Table of Contents
GREEN DOT CORPORATION
NOTES TO CONSOLIDATED FINANCIAL STATEMENTS – (CONTINUED)
Note 2-Summary of Significant Accounting Policies (continued)
Fair Value
Under applicable accounting guidance, fair value is defined as the exchange price that would be received for an asset or paid to transfer a liability (an exit price) in the principal or most advantageous market for the asset or liability in an orderly transaction between market participants on the measurement date.
We determine the fair values of our financial instruments based on the fair value hierarchy established under applicable accounting guidance which requires an entity to maximize the use of observable inputs and minimize the use of unobservable inputs when measuring fair value. The following describes the three-level hierarchy:
Level 1 – Unadjusted quoted prices in active markets for identical assets or liabilities. Level 1 assets and liabilities include debt and equity securities and derivative contracts that are traded in an active exchange market, as well as certain U.S. Treasury securities that are highly liquid and are actively traded in over-the-counter markets
Level 2 – Observable inputs other than Level 1 prices, such as quoted prices for similar assets or liabilities, quoted prices in markets that are not active, or other inputs that are observable or can be corroborated by observable market data for substantially the full term of the assets or liabilities. Level 2 assets and liabilities include fixed income securities with quoted prices that are traded less frequently than exchange-traded instruments. This category generally includes U.S. government and agency mortgage-backed fixed income securities and corporate fixed income securities
Level 3 – Unobservable inputs that are supported by little or no market activity and that are significant to the overall fair value of the assets or liabilities. Level 3 assets and liabilities include financial instruments for which the determination of fair value requires significant management judgment or estimation. The fair value for such assets and liabilities is generally determined using pricing models, market comparables, discounted cash flow methodologies or similar techniques that incorporate the assumptions a market participant would use in pricing the asset or liability. This category generally includes certain private equity investments and certain asset-backed securities.
Revenue Recognition
Our operating revenues consist of card revenues and other fees, cash transfer revenues and interchange revenues. We recognize revenue when the price is fixed or determinable, persuasive evidence of an arrangement exists, the product is sold or the service is performed, and collectability of the resulting receivable is reasonably assured.
Card revenues and other fees consist of monthly maintenance fees, ATM fees, new card fees and other revenues. We charge maintenance fees on a monthly basis pursuant to the terms and conditions in the applicable cardholder agreements. We recognize monthly maintenance fees ratably over the month for which they are assessed. We charge ATM fees to cardholders when they withdraw money at certain ATMs in accordance with the terms and conditions in our cardholder agreements. We recognize ATM fees when the withdrawal is made by the cardholder, which is the same time our service is completed and the fees are assessed. We charge new card fees when a consumer purchases a new card in a retail store. We defer and recognize new card fee revenues on a straight-line basis over our average card lifetime, which is currently seven months for our GPR cards and six months for our gift cards. We determine the average card lifetime based on our recent historical data for comparable products. We measure card lifetime for our GPR cards as the period of time, inclusive of reload activity, between sale (or activation) of the card and the date of the last positive balance. We measure the card lifetime for our gift cards as the redemption period during which cardholders perform the substantial majority of their transactions. We reassess average card lifetime quarterly. We report the unearned portion of new card fees as a component of deferred revenue in our consolidated balance sheets. Other revenues consist primarily of fees associated with optional products or services, which we generally offer to consumers during the card activation process. Optional products and services include providing a second card for an account, expediting delivery of the personalized debit card that replaces the temporary card obtained at the retail store, and upgrading a cardholder account to one of our upgrade programs. We generally recognize revenue related to optional products and services when the underlying services are completed, but we treat revenues related to our upgrade programs in a manner similar to new card fees and monthly maintenance fees.
We generate cash transfer revenues when consumers purchase our cash transfer products (reload services) in a retail store. We recognize these revenues when the cash transfer transactions are completed, generally within two business days from the time of sale of these products.
We earn interchange revenues from fees remitted by the merchant's bank, which are based on rates established by the payment networks, such as Visa and MasterCard, when cardholders make purchase transactions using our cards. We recognize interchange revenues as these transactions occur.
62
Table of Contents
GREEN DOT CORPORATION
NOTES TO CONSOLIDATED FINANCIAL STATEMENTS – (CONTINUED)
Note 2-Summary of Significant Accounting Policies (continued)
We report our different types of revenues on a gross or net basis based on our assessment of whether we act as a principal or an agent in the transaction. To the extent we act as a principal in the transaction, we report revenues on a gross basis. In concluding whether or not we act as a principal or an agent, we evaluate whether we have the substantial risks and rewards under the terms of the revenue-generating arrangements, whether we are the party responsible for fulfillment of the services purchased by the cardholders, and other factors. For all of our significant revenue-generating arrangements, including GPR and gift cards, we record revenues on a gross basis.
Generally, customers have limited rights to a refund of a new card fee or a cash transfer fee. We have elected to recognize revenues prior to the expiration of the refund period, but reduce revenues by the amount of expected refunds, which we estimate based on actual historical refunds.
On occasion, we enter into incentive agreements with our retail distributors and offer incentives to customers designed to increase product acceptance and sales volume. We record incentive payments, including the issuance of equity instruments, as a reduction of revenues and recognize them over the period the related revenues are recognized or as services are rendered, as applicable.
Sales and Marketing Expenses
Sales and marketing expenses primarily consist of sales commissions, advertising and marketing expenses, and the costs of manufacturing and distributing card packages, placards, and promotional materials to our retail distributors' locations and personalized GPR cards to consumers who have activated their cards.
We pay our retail distributors and brokers commissions based on sales of our prepaid debit cards and cash transfer products in their stores. We defer and expense commissions related to new cards sales ratably over the average card lifetime, which is currently seven months for our GPR cards and six months for our gift cards. Absent a new card fee, we expense the related commissions immediately. We expense commissions related to cash transfer products when the cash transfer transactions are completed. We expense costs for the production of advertising as incurred. The cost of media advertising is expensed when the advertising first takes place. We record the costs associated with card packages and placards as prepaid expenses, and we record the costs associated with personalized GPR cards as deferred expenses. We recognize the prepaid cost of card packages and placards over the related sales period, and we amortize the deferred cost of personalized GPR cards, when activated, over the average card lifetime.
Our sales commissions, advertising and marketing expenses and manufacturing and distributing costs were as follows:
| Year Ended December 31, | ||||||||||
| 2013 |
| 2012 |
| 2011 | ||||||
| (In thousands) | ||||||||||
Sales commissions | $ | 161,859 | |
| $ | 145,462 | |
| $ | 121,430 | |
Advertising and marketing expenses | 10,369 | |
| 21,765 | |
| 14,673 | | |||
Manufacturing and distributing costs | 46,142 | |
| 42,643 | |
| 32,644 | | |||
Sales and marketing expenses | $ | 218,370 | |
| $ | 209,870 | |
| $ | 168,747 | |
Included in our manufacturing and distributing costs were shipping and handling costs of $4.0 million , $3.4 million and $3.4 million for the years ended December 31, 2013 , 2012 and 2011 . Also included in our manufacturing and distributing costs were liabilities that we incurred for use tax to various states related to purchases of materials since we do not charge sales tax to customers when new cards or cash transfer transactions are purchased.
Employee Stock-Based Compensation
We record employee stock-based compensation expense using the fair value method of accounting. For stock options and stock purchases under our employee stock purchase plan, or ESPP, we base compensation expense on fair values estimated at the grant date using the Black-Scholes Merton option-pricing model. For stock awards, including restricted stock units, we base compensation expense on the fair value of our common stock at the grant date. We recognize compensation expense for awards with only service conditions that have graded vesting schedules on a straight-line basis over the vesting period of the award. Vesting is based upon continued service to our company.
63
Table of Contents
GREEN DOT CORPORATION
NOTES TO CONSOLIDATED FINANCIAL STATEMENTS – (CONTINUED)
Note 2-Summary of Significant Accounting Policies (continued)
Income Taxes
Our income tax expense is comprised of current and deferred income tax expense. Current income tax expense approximates taxes to be paid or refunded for the current period. Deferred income tax expense results from the changes in deferred tax assets and liabilities during the periods. These gross deferred tax assets and liabilities represent decreases or increases in taxes expected to be paid in the future because of future reversals of temporary differences between the basis of assets and liabilities as measured by tax laws and their basis as reported in our consolidated financial statements. We also recognize deferred tax assets for tax attributes such as net operating loss carryforwards and tax credit carryforwards. We record valuation allowances to reduce deferred tax assets to the amounts we conclude are more likely-than-not to be realized in the foreseeable future.
We recognize and measure income tax benefits based upon a two-step model: 1) a tax position must be more likely-than-not to be sustained based solely on its technical merits in order to be recognized, and 2) the benefit is measured as the largest dollar amount of that position that is more likely-than-not to be sustained upon settlement. The difference between the benefit recognized for a position and the tax benefit claimed on a tax return is referred to as an unrecognized tax benefit. We accrue income tax related interest and penalties, if applicable, within income tax expense.
Earnings Per Common Share
We apply the two-class method in calculating earnings per common share, or EPS, because our preferred stockholders are entitled to participate with our common stockholders in the distributions of earnings through dividends. The two-class method requires net income, after deduction of any preferred stock dividends, deemed dividends on preferred stock redemptions, and accretions in the carrying value on preferred stock, to be allocated between each class or series of common and preferred stockholders based on their respective rights to receive dividends, whether or not declared. Basic EPS is then calculated by dividing net income allocated to each class of common stockholders by the respective weighted-average common shares issued and outstanding.
In addition, for diluted EPS, the conversion of Class B common stock will affect net income allocated to Class A common stockholders. Where the effect of this conversion is dilutive, we adjust net income allocated to Class A common stockholders by the associated allocated earnings of the convertible securities. We divide adjusted net income for each class of common stock by the respective weighted-average number of the common shares issued and outstanding for each period plus amounts representing the dilutive effect of outstanding stock options and restricted stock units and outstanding warrants, shares to be purchased under our employee stock purchase plan and the dilution resulting from the conversion of convertible securities, if applicable. We exclude the effects of convertible securities and outstanding warrants and stock options from the computation of diluted EPS in periods in which the effect would be anti-dilutive. We calculate dilutive potential common shares using the treasury stock method, if-converted method and the two-class method, as applicable.
Regulatory Matters and Capital Adequacy
We became a bank holding company on December 8, 2011. As a bank holding company, we are subject to comprehensive supervision and examination by the Federal Reserve Board and must comply with applicable regulations, including minimum capital and leverage requirements. If we fail to comply with any of these requirements, we may become subject to formal or informal enforcement actions, proceedings, or investigations, which could result in regulatory orders, restrictions on our business operations or requirements to take corrective actions, which may, individually or in the aggregate, affect our results of operations and restrict our ability to grow. If we fail to comply with the applicable capital and leverage requirements, or if our subsidiary bank fails to comply with its applicable capital and leverage requirements, the Federal Reserve Board may limit our or Green Dot Bank's ability to pay dividends. In addition, as a bank holding company and a financial holding company, we are generally prohibited from engaging, directly or indirectly, in any activities other than those permissible for bank holding companies and financial holding companies. This restriction might limit our ability to pursue future business opportunities which we might otherwise consider but which might fall outside the scope of permissible activities. We may also be required to serve as a "source of strength" to Green Dot Bank if it becomes less than adequately capitalized.
64
Table of Contents
GREEN DOT CORPORATION
NOTES TO CONSOLIDATED FINANCIAL STATEMENTS – (CONTINUED)
Note 2-Summary of Significant Accounting Policies (continued)
Recent Accounting Pronouncements
In July 2012, the FASB issued ASU 2012-02, Intangibles-Goodwill and Other , allowing an entity to perform a qualitative impairment assessment of indefinite-lived intangible assets before proceeding to the two-step impairment test. If the entity determines, on the basis of qualitative factors, that the fair value of the indefinite-lived intangible asset is not more likely than not (i.e., a likelihood of more than 50 percent) impaired, the entity would not need to calculate the fair value of the asset. In addition, the ASU does not amend the requirement to test these assets for impairment between annual tests if there is a change in events or circumstances; however, it does revise the examples of events and circumstances that an entity should consider in interim periods. ASU 2012-02 became effective for annual and interim impairment tests performed for fiscal years beginning after September 15, 2012, with early adoption being permitted. Our adoption of this ASU is did not have a material impact on our consolidated financial statements.
In February 2013, the Financial Accounting Standards Board, or FASB, issued Accounting Standards Update, or ASU, 2013-02, Comprehensive Income: Reporting of Amounts Reclassified Out of Accumulated Other Comprehensive Income , which requires companies to report, in one place, information about significant reclassifications out of accumulated other comprehensive income, or AOCI, and disclose more information about changes in AOCI balances. We adopted this ASU in the first quarter of 2013. The adoption of this standard did not have a significant impact on our consolidated financial statements.
In July 2013, the FASB issued ASU 2013-11, Presentation of an Unrecognized Tax Benefit When a Net Operating Loss Carryforward, a Similar Tax Loss, or a Tax Credit Carryforward Exists , which provides guidance for the financial statement presentation of an unrecognized tax benefit when a net operating loss carryforward, a similar tax loss, or a tax credit carryforward exists. We will adopt the standard effective January 1, 2014. Our adoption of this ASU is not expected to have a material impact on our consolidated financial statements.
Note 3 - Investment Securities
Our available-for-sale investment securities were as follows:
| Amortized cost |
| Gross unrealized gains |
| Gross unrealized losses |
| Fair value | ||||||||
| (In thousands) | ||||||||||||||
December 31, 2013 |
| ||||||||||||||
Corporate bonds | $ | 70,965 | |
| $ | 45 | |
| $ | (13 | ) |
| $ | 70,997 | |
Commercial paper | 49,307 | |
| 15 | |
| (1 | ) |
| 49,321 | | ||||
Negotiable certificate of deposit | 4,400 | |
| 3 | |
| - | |
| 4,403 | | ||||
U.S. Treasury notes | 14,265 | |
| 14 | |
| (1 | ) |
| 14,278 | | ||||
Agency securities | 14,946 | |
| 13 | |
| - | |
| 14,959 | | ||||
Mortgage-backed securities | 4,169 | |
| - | |
| (168 | ) |
| 4,001 | | ||||
Municipal bonds | 19,017 | |
| 28 | |
| (14 | ) |
| 19,031 | | ||||
Asset-backed securities | 21,750 | |
| 9 | |
| (5 | ) |
| 21,754 | | ||||
Total investment securities | $ | 198,819 | |
| $ | 127 | |
| $ | (202 | ) |
| $ | 198,744 | |
|
|
|
|
|
|
|
| ||||||||
December 31, 2012 |
|
|
|
|
|
|
| ||||||||
Corporate bonds | $ | 37,320 | |
| $ | 39 | |
| $ | (2 | ) |
| $ | 37,357 | |
Commercial paper | 55,733 | |
| 17 | |
| (2 | ) |
| 55,748 | | ||||
Negotiable certificate of deposit | 4,400 | |
| 14 | |
| - | |
| 4,414 | | ||||
U.S. Treasury notes | 22,258 | |
| 9 | |
| - | |
| 22,267 | | ||||
Agency securities | 25,845 | |
| 23 | |
| (1 | ) |
| 25,867 | | ||||
Municipal bonds | 11,528 | |
| 43 | |
| (3 | ) |
| 11,568 | | ||||
Asset-backed securities | 26,533 | |
| 33 | |
| - | |
| 26,566 | | ||||
Total investment securities | $ | 183,617 | |
| $ | 178 | |
| $ | (8 | ) |
| $ | 183,787 | |
65
Table of Contents
GREEN DOT CORPORATION
NOTES TO CONSOLIDATED FINANCIAL STATEMENTS – (CONTINUED)
Note 3 - Investment Securities (continued)
As of December 31, 2013 and December 31, 2012 , the gross unrealized losses and fair values of available-for-sale investment securities that were in unrealized loss positions were as follows:
| Less than 12 months |
| 12 months or more |
| Total fair value |
| Total unrealized loss | ||||||||||||||||
| Fair value |
| Unrealized loss |
| Fair value |
| Unrealized loss |
|
| ||||||||||||||
| (In thousands) | ||||||||||||||||||||||
December 31, 2013 |
| ||||||||||||||||||||||
Corporate bonds | $ | 24,104 | |
| $ | (13 | ) |
| $ | - | |
| $ | - | |
| $ | 24,104 | |
| $ | (13 | ) |
Commercial paper | 4,490 | |
| (1 | ) |
| - | |
| - | |
| 4,490 | |
| (1 | ) | ||||||
U.S. Treasury notes | 5,212 | |
| (1 | ) |
| - | |
| - | |
| 5,212 | |
| (1 | ) | ||||||
Mortgage-backed securities | 4,002 | |
| (168 | ) |
| - | |
| - | |
| 4,002 | |
| (168 | ) | ||||||
Municipal bonds | 8,546 | |
| (14 | ) |
| - | |
| - | |
| 8,546 | |
| (14 | ) | ||||||
Asset-backed securities | 11,797 | |
| (5 | ) |
| - | |
| - | |
| $ | 11,797 | |
| $ | (5 | ) | ||||
Total investment securities | $ | 58,151 | |
| $ | (202 | ) |
| $ | - | |
| $ | - | |
| $ | 58,151 | |
| $ | (202 | ) |
|
|
|
|
|
|
|
|
|
|
|
| ||||||||||||
December 31, 2012 |
|
|
|
|
|
|
|
|
|
|
| ||||||||||||
Corporate bonds | $ | 6,138 | |
| $ | (2 | ) |
| $ | - | |
| $ | - | |
| $ | 6,138 | |
| $ | (2 | ) |
Commercial paper | 6,390 | |
| (2 | ) |
| - | |
| - | |
| 6,390 | |
| (2 | ) | ||||||
Agency securities | 6,302 | |
| (1 | ) |
| - | |
| - | |
| 6,302 | |
| (1 | ) | ||||||
Municipal bonds | 1,602 | |
| (3 | ) |
| - | |
| - | |
| 1,602 | |
| (3 | ) | ||||||
Total investment securities | $ | 20,432 | |
| $ | (8 | ) |
| $ | - | |
| $ | - | |
| $ | 20,432 | |
| $ | (8 | ) |
We did not record any other-than-temporary impairment losses during the year s ended December 31, 2013 and 2012 on our available-for-sale investment securities. We do not intend to sell these investments or we have determined that it is more likely than not that we will not be required to sell these investments before recovery of their amortized cost bases, which may be at maturity.
As of December 31, 2013 , the contractual maturities of our available-for-sale investment securities were as follows:
| Amortized cost |
| Fair value | ||||
| (In thousands) | ||||||
Due in one year or less | $ | 115,166 | |
| $ | 116,159 | |
Due after one year through five years | 56,644 | |
| 56,700 | | ||
Due after five years through ten years | 590 | |
| 588 | | ||
Due after ten years | 500 | |
| 496 | | ||
Mortgage and asset-backed securities | 25,919 | |
| 24,801 | | ||
Total investment securities | $ | 198,819 | |
| $ | 198,744 | |
The expected payments on mortgage-backed and asset-backed securities may not coincide with their contractual maturities because the issuers have the right to call or prepay certain obligations.
66
Table of Contents
GREEN DOT CORPORATION
NOTES TO CONSOLIDATED FINANCIAL STATEMENTS – (CONTINUED)
Note 4-Accounts Receivable
Accounts receivable, net consisted of the following:
| December 31, 2013 |
| December 31, 2012 | ||||
| (In thousands) | ||||||
Overdrawn account balances due from cardholders | $ | 14,749 | |
| $ | 24,328 | |
Reserve for uncollectible overdrawn accounts | (10,363 | ) |
| (15,677 | ) | ||
Net overdrawn account balances due from cardholders | 4,386 | |
| 8,651 | | ||
|
|
|
| ||||
Trade receivables | 4,302 | |
| 5,686 | | ||
Reserve for uncollectible trade receivables | (42 | ) |
| (69 | ) | ||
Net trade receivables | 4,260 | |
| 5,617 | | ||
|
|
|
| ||||
Receivables due from card issuing banks | 42,137 | |
| 33,729 | | ||
Other receivables | 1,514 | |
| 3,375 | | ||
Accounts receivable, net | $ | 52,297 | |
| $ | 51,372 | |
Activity in the reserve for uncollectible overdrawn accounts consisted of the following:
| Year Ended December 31, | ||||||||||
| 2013 |
| 2012 |
| 2011 | ||||||
| (In thousands) | ||||||||||
Balance, beginning of period | $ | 15,677 | |
| $ | 15,309 | |
| $ | 11,823 | |
Provision for uncollectible overdrawn accounts: |
|
|
|
|
| ||||||
Fees | 45,048 | |
| 59,445 | |
| 55,048 | | |||
Purchase transactions | 2,225 | |
| 2,900 | |
| 5,514 | | |||
Charge-offs | (52,587 | ) |
| (61,977 | ) |
| (57,076 | ) | |||
Balance, end of period | $ | 10,363 | |
| $ | 15,677 | |
| $ | 15,309 | |
Note 5-Loans to Bank Customers
The following table presents total outstanding loans, gross of the related allowance for loan losses, and a summary of the related payment status:
| 30-59 Days Past Due |
| 60-89 Days Past Due |
| 90 Days or More Past Due |
| Total Past Due |
| Total Current or Less Than 30 Days Past Due |
| Total Outstanding | ||||||||||||
| (In thousands) | ||||||||||||||||||||||
December 31, 2013 |
| ||||||||||||||||||||||
Real estate | $ | - | |
| $ | - | |
| $ | 11 | |
| $ | 11 | |
| $ | 3,372 | |
| $ | 3,383 | |
Commercial | - | |
| - | |
| - | |
| - | |
| 1,474 | |
| 1,474 | | ||||||
Installment | - | |
| - | |
| 3 | |
| 3 | |
| 2,506 | |
| 2,509 | | ||||||
Total loans | $ | - | | | $ | - | |
| $ | 14 | |
| $ | 14 | |
| $ | 7,352 | |
| $ | 7,366 | |
|
|
|
|
|
|
|
|
|
|
|
| ||||||||||||
Percentage of outstanding | - | % |
| - | % |
| 0.2 | % |
| 0.2 | % |
| 99.8 | % |
| 100.0 | % | ||||||
|
|
|
|
|
|
|
|
|
|
|
| ||||||||||||
December 31, 2012 |
|
|
|
|
|
|
|
|
|
|
| ||||||||||||
Real estate | $ | 91 | |
| $ | - | |
| $ | - | |
| $ | 91 | |
| $ | 3,465 | |
| $ | 3,556 | |
Commercial | 77 | |
| - | |
| - | |
| 77 | |
| 1,102 | |
| 1,179 | | ||||||
Installment | 22 | |
| 3 | |
| - | |
| 25 | |
| 3,267 | |
| 3,292 | | ||||||
Total loans | $ | 190 | |
| $ | 3 | |
| $ | - | |
| $ | 193 | |
| $ | 7,834 | |
| $ | 8,027 | |
|
|
|
|
|
|
|
|
|
|
|
| ||||||||||||
Percentage of outstanding | 2.4 | % |
| - | % |
| - | % |
| 2.4 | % |
| 97.6 | % |
| 100.0 | % | ||||||
67
Table of Contents
GREEN DOT CORPORATION
NOTES TO CONSOLIDATED FINANCIAL STATEMENTS – (CONTINUED)
Note 5-Loans to Bank Customers (continued)
Nonperforming Loans
The following table presents the carrying value, gross of the related allowance for loan losses, of our nonperforming loans, other than purchased credit impaired, or PCI loans. See Note 2–Summary of Significant Accounting Policies for further information on the criteria for classification as nonperforming.
| December 31, 2013 |
| December 31, 2012 | ||||
| (In thousands) | ||||||
Real estate | $ | 117 | |
| $ | 96 | |
Commercial | 106 | |
| 136 | | ||
Installment | 250 | |
| 173 | | ||
Total loans | $ | 473 | |
| $ | 405 | |
Credit Quality Indicators
We closely monitor and assess the credit quality and credit risk of our loan portfolio on an ongoing basis. We continuously review and update loan risk classifications. We evaluate our loans using non-classified or classified as the primary credit quality indicator. Classified loans are those loans that have demonstrated credit weakness where we believe there is a heightened risk of principal loss, including all impaired loans. Classified loans are generally internally categorized as substandard, doubtful or loss, consistent with regulatory guidelines.
The table below presents the carrying value, gross of the related allowance for loan losses, of our loans within the primary credit quality indicators related to our loan portfolio:
| December 31, 2013 |
| December 31, 2012 | ||||||||||||
| Non-Classified |
| Classified |
| Non-Classified |
| Classified | ||||||||
| (In thousands) | ||||||||||||||
Real estate | $ | 3,003 | |
| $ | 380 | |
| $ | 3,282 | |
| $ | 274 | |
Commercial | 1,323 | |
| 151 | |
| 978 | |
| 201 | | ||||
Installment | 2,058 | |
| 451 | |
| 2,963 | |
| 329 | | ||||
Total loans | $ | 6,384 | |
| $ | 982 | |
| $ | 7,223 | |
| $ | 804 | |
Impaired Loans and Troubled Debt Restructurings
When, for economic or legal reasons related to a borrower's financial difficulties, we grant a concession for other than an insignificant period of time to a borrower that we would not otherwise consider, the related loan is classified as a Troubled Debt Restructuring, or TDR. Our TDR modifications related to extensions of the maturity dates at a stated interest rate lower than the current market rate for new debt with similar risk. The following table presents our impaired loans and loans that we modified in TDRs as of December 31, 2013 and December 31, 2012 :
| December 31, 2013 |
| December 31, 2012 | ||||||||||||
| Unpaid Principal Balance |
| Carrying Value |
| Unpaid Principal Balance |
| Carrying Value | ||||||||
| (In thousands) | ||||||||||||||
Real estate | $ | 194 | |
| $ | 117 | |
| $ | 194 | |
| $ | 96 | |
Commercial | 344 | |
| 106 | |
| 280 | |
| 136 | | ||||
Installment | 500 | |
| 250 | |
| 403 | |
| 173 | | ||||
68
Table of Contents
GREEN DOT CORPORATION
NOTES TO CONSOLIDATED FINANCIAL STATEMENTS – (CONTINUED)
Note 5-Loans to Bank Customers (continued)
Allowance for Loan Losses
Activity in the allowance for loan losses consisted of the following:
| Year Ended December 31, | ||||||||||
| 2013 |
| 2012 |
| 2011 | ||||||
| (In thousands) | ||||||||||
Balance, beginning of period | $ | 475 | |
| $ | - | |
| $ | - | |
Provision for loans | - | |
| 698 | |
| - | | |||
Loans charged off | (25 | ) |
| (223 | ) |
| - | | |||
Recoveries of loans previously charged off | 14 | |
| - | |
| - | | |||
Balance, end of period | $ | 464 | |
| $ | 475 | |
| $ | - | |
Note 6-Property and Equipment
Property and equipment consisted of the following:
| December 31, | ||||||
| 2013 |
| 2012 | ||||
| (In thousands) | ||||||
Land | $ | 205 | |
| $ | 205 | |
Building | 461 | |
| 543 | | ||
Computer equipment, furniture, and office equipment | 34,508 | |
| 23,690 | | ||
Computer software purchased | 13,123 | |
| 10,914 | | ||
Capitalized internal-use software | 62,871 | |
| 52,501 | | ||
Tenant improvements | 7,482 | |
| 7,076 | | ||
| 118,650 | |
| 94,929 | | ||
Less accumulated depreciation and amortization | (58,177 | ) |
| (36,553 | ) | ||
Property and equipment, net | $ | 60,473 | |
| $ | 58,376 | |
Depreciation and amortization expense was $27.1 million , $18.1 million and $12.3 million for the years ended December 31, 2013 , 2012 and 2011 , respectively. Included in those amounts are depreciation expense related to internal-use software of $15.0 million , $9.7 million and $6.0 million for the years ended December 31, 2013 , 2012 and 2011 , respectively. During the year ended December 31, 2013 we had impairments of $5.2 million associated with capitalized internal-use software we determined were no longer viable. The net carrying value of capitalized internal-use software was $28.1 million , and $30.3 million at December 31, 2013 and 2012 , respectively.
Note 7-Goodwill and Intangible Assets
Goodwill and intangible assets on our consolidated balance sheets consisted of the following:
| December 31, | ||||||
| 2013 |
| 2012 | ||||
| (In thousands) | ||||||
Goodwill | $ | 27,250 | |
| $ | 27,250 | |
Intangible assets, net | 3,426 | |
| 3,554 | | ||
Goodwill and intangible assets | 30,676 | |
| 30,804 | | ||
69
Table of Contents
GREEN DOT CORPORATION
NOTES TO CONSOLIDATED FINANCIAL STATEMENTS – (CONTINUED)
Note 7-Goodwill and Intangible Assets (continued)
Goodwill
Changes in the carrying amount of goodwill were as follows:
| December 31, | ||||||
| 2013 |
| 2012 | ||||
| (In thousands) | ||||||
Balance, beginning of period | $ | 27,250 | |
| $ | 10,817 | |
Acquisitions | - | |
| 16,350 | | ||
Other changes | - | |
| 83 | | ||
Balance, end of period | $ | 27,250 | |
| $ | 27,250 | |
During the three months ended December 31, 2013 , we completed our annual goodwill impairment test as of September 30, 2013 for all reporting units. Based on the results of step one of the annual goodwill impairment test, we determined that step two was not required for any of the reporting units as their fair value exceeded their carrying value indicating there was no impairment.
Intangible Assets
The gross carrying amounts and accumulated amortization related to intangibles assets were as follows:
| December 31, 2013 |
| December 31, 2012 | ||||||||||||
| Gross Carrying Value |
| Accumulated Amortization |
| Gross Carrying Value |
| Accumulated Amortization | ||||||||
| (In thousands) |
| (In thousands) | ||||||||||||
Finite-lived intangibles | $ | 926 | |
| $ | (500 | ) |
| $ | 926 | |
| $ | (372 | ) |
Indefinite-lived intangibles | 3,000 | |
| N/A | |
| 3,000 | |
| N/A | | ||||
Total intangible assets | $ | 3,926 | |
| $ | (500 | ) |
| $ | 3,926 | |
| $ | (372 | ) |
Amortization expense, a component of other general and administrative expenses, on finite-lived intangibles was $128,000 , $130,000 , and $100,000 for the years ended December 31, 2013 , 2012 , and 2011 , respectively. None of the intangible assets were impaired as of December 31, 2013 or 2012 .
Note 8-Deposits
In November 2012, we transitioned all outstanding customer deposits associated with our card issuing program with Synovus Bank to Green Dot Bank. These deposits are included as "GPR deposits" within non-interest bearing deposit accounts below. Deposits were categorized as non-interest and interest-bearing deposits as follows:
| December 31, | ||||||
| 2013 |
| 2012 | ||||
Non-interest bearing deposit accounts | (In thousands) | ||||||
GPR deposits | $ | 204,171 | |
| $ | 165,739 | |
Other demand deposits | - | |
| 16,138 | | ||
Total non-interest bearing deposit accounts | 204,171 | |
| 181,877 | | ||
Interest-bearing deposit accounts |
|
|
| ||||
Negotiable order of withdrawal (NOW) | 1,401 | |
| 1,860 | | ||
Savings | 6,410 | |
| 5,986 | | ||
Time deposits, denominations greater than or equal to $100 | 5,310 | |
| 6,417 | | ||
Time deposits, denominations less than $100 | 2,288 | |
| 2,311 | | ||
Total interest-bearing deposit accounts | 15,409 | |
| 16,574 | | ||
Total deposits | $ | 219,580 | |
| $ | 198,451 | |
70
Table of Contents
GREEN DOT CORPORATION
NOTES TO CONSOLIDATED FINANCIAL STATEMENTS – (CONTINUED)
Note 8-Deposits (continued)
The scheduled contractual maturities for total time deposits are presented in the table below:
| December 31, 2013 | ||
| (In thousands) | ||
Due in 2014 | $ | 3,551 | |
Due in 2015 | 2,207 | | |
Due in 2016 | 1,100 | | |
Due in 2017 | 694 | | |
Due in 2018 | 46 | | |
Thereafter | - | | |
Total time deposits | $ | 7,598 | |
Note 9-Stockholders' Equity
Convertible Preferred Stock
In December 2011, we filed a restated Certificate of Incorporation that authorized 10,085 shares of Series A Convertible Junior Participating Non-Cumulative Perpetual Preferred Stock, or Series A Preferred Stock. We then entered into and completed a share exchange with a significant shareholder, whereby 6,859,000 shares of our Class B common stock were exchanged for 6,859 shares of our newly created series of preferred stock. Our Certificate of Incorporation specified the following rights, preferences, and privileges for our Series A preferred stockholders.
Voting
Series A Preferred Stock is non-voting, subject to limited exceptions.
Dividends
Holders of shares of the Series A Preferred Stock are entitled to receive ratable dividends (on an as-converted basis, taking into account the conversion rate applicable to the Series A Preferred Stock at the time) only as, if and when any dividends are paid in respect of our Class A Common Stock.
Liquidation
In the event of any liquidation, dissolution or winding-up of the affairs of our company (excluding a Reorganization Event (defined below)), of the assets of our company or the proceeds thereof legally available for distribution to our stockholders are distributable ratably among the holders of our Class A Common Stock and any Series A Preferred Stock outstanding at that time after payment to the holders of shares of our Series A Preferred Stock of an amount per share equal to (i) $0.01 plus (ii) any dividends on our Series A Preferred Stock that have been declared but not paid prior to the date of payment of such distribution.
In connection with any merger, sale of all or substantially all of the assets or other reorganization involving our company (a "Reorganization Event") and in which our Class A Common Stock is converted into or exchanged for cash, securities or other consideration, holders of shares of our Series A Preferred Stock will be entitled to receive ratable amounts (on an as-converted basis, taking into account the conversion rate applicable to Series A Preferred Stock at the time) of the same consideration as is payable to holders of our Class A Common Stock pursuant to a Reorganization Event.
Conversion
Our Series A Preferred Stock is not convertible into any other security except that it converts into Class A Common Stock if it is transferred by a holder (i) in a widespread public distribution, (ii) in a private sale or transfer in which the transferee acquires no more than 2% of any class of voting shares of our company, (iii) to a transferee that owns or controls more than 50% of the voting shares of our company without regard to any transfer from the transferring shareholder or (iv) to our company. Each share of Series A Preferred Stock so transferred will automatically convert into 1,000 shares (subject to appropriate adjustment for any stock split, reverse stock split, stock dividend, recapitalization or other similar event) of our Class A Common Stock.
71
Table of Contents
GREEN DOT CORPORATION
NOTES TO CONSOLIDATED FINANCIAL STATEMENTS – (CONTINUED)
Note 9-Stockholders' Equity (continued)
Common Stock
In August 2013, the issued and outstanding shares of our Class B Common Stock declined to less than 10% of the aggregate number of issued and outstanding shares of our Class A Common Stock and Class B Common Stock. Pursuant to the terms of Article V of our Certificate of Incorporation, the issued and outstanding shares of our Class B common stock automatically converted into shares of our Class A common stock. Following this automatic conversion, there is now only a single class of our common stock outstanding.
Our Certificate of Incorporation specifies the following rights, preferences, and privileges for our common stockholders.
Voting
Holders of our Class A common stock are entitled to one vote per share.
We have not provided for cumulative voting for the election of directors in our restated Certificate of Incorporation. In addition, our Certificate of Incorporation provides that a holder, or group of affiliated holders, of more than 24.9% of our common stock may not vote shares representing more than 14.9% of the voting power represented by the outstanding shares of our Class A common stock.
Dividends
Subject to preferences that may apply to any shares of preferred stock outstanding at the time, the holders of outstanding shares of our Class A common stock are entitled to receive dividends out of funds legally available at the times and in the amounts that our board of directors may determine. In the event a dividend is paid in the form of shares of common stock or rights to acquire shares of common stock, the holders of Class A common stock will receive Class A common stock, or rights to acquire Class A common stock, as the case may be.
Liquidation
Upon our liquidation, dissolution or winding-up, the assets legally available for distribution to our stockholders would be distributable ratably among the holders of our Class A common stock and any participating preferred stock outstanding at that time after payment of liquidation preferences, if any, on any outstanding shares of our preferred stock and payment of other claims of creditors.
Preemptive or Similar Rights
Our Class A common stock is not entitled to preemptive rights or subject to redemption.
Non-Employee Stock-Based Payments
Shares Subject to Repurchase
In May 2010, we amended our commercial agreement with Walmart, our largest retail distributor, and GE Money Bank. The amendment modifies the terms of our agreement related to our co-branded GPR MoneyCard, which significantly increased the sales commission rates we pay to Walmart for our products sold in their stores. The new agreement commenced on May 1, 2010 with a five-year term. As an incentive to amend our prepaid card program agreement, we issued Walmart 2,208,552 shares of our Class A common stock. These shares are subject to our right to repurchase them at $ 0.01 per share upon termination of our agreement with Walmart other than a termination arising out of our knowing, intentional and material breach of the agreement. Our right to repurchase the shares lapses with respect to 36,810 shares per month over the sixty months term of the agreement. The repurchase right will expire as to all shares of Class A common stock that remain subject to the repurchase right if we experience a "prohibited change of control," as defined in the agreement, if we experience a "change of control," as defined in the stock issuance agreement, or under certain other limited circumstances, which we currently believe are remote. As of December 31, 2013 , 588,912 shares of Class A common stock issued to Walmart were subject to our repurchase right.
Warrant
On March 3, 2009, we entered into a sales and marketing agreement with a third party that contained a contingent warrant feature. The warrant provides the third party with an option to purchase 3,426,765 shares of our common stock at a per share price of $ 23.70 if certain sales volume or revenue targets are achieved. A further 856,691 shares become eligible for purchase under the warrant should either of these targets be achieved and additional specified marketing and promotional activities take place.
72
Table of Contents
GREEN DOT CORPORATION
NOTES TO CONSOLIDATED FINANCIAL STATEMENTS – (CONTINUED)
Note 9-Stockholders' Equity (continued)
The shares become eligible for purchase under the warrant at any time the targets are achieved prior to the earlier of March 3, 2014 or the termination of the sales and marketing agreement. Once eligible for purchase, the purchase option expires on the earliest of: (1) the date at which the sales and marketing agreement with the third party is terminated; (2) the date of a change of control transaction of our company; or (3) March 3, 2017.
The warrant is redeemable for cash by the holder if we fail to perform in accordance with the customary contractual terms of the sales and marketing agreement. Should the third party fail to perform in accordance with the terms of the sales and marketing agreement, we obtain an option to repurchase any shares previously issued under the warrant.
As the option to purchase shares under the warrant is contingent upon the achievement of certain sales volume or revenue targets, there is a possibility that no shares will become eligible for purchase. Based on different possible outcomes, we developed a range of fair values for the warrant, and we measured the warrant at its current lowest aggregate fair value within that range. As none of the performance conditions have been met, the lowest aggregate fair value is zero . Accordingly, we have not assigned any value to the warrant in our consolidated financial statements as of December 31, 2013 or 2012.
Registration Rights Agreement
We are a party to a registration rights agreement with certain of our investors, pursuant to which we have granted those persons or entities the right to register shares of common stock held by them under the Securities Act of 1933, as amended, or the Securities Act. Holders of these rights are entitled to demand that we register their shares of common stock under the Securities Act so long as certain conditions are satisfied and require us to include their shares of common stock in future registration statements that may be filed, either for our own account or for the account of other security holders exercising registration rights. In addition, after an initial public offering, these holders have the right to request that their shares of common stock be registered on a Form S-3 registration statement so long as certain conditions are satisfied and the anticipated aggregate sales price of the registered shares as of the date of filing of the Form S-3 registration statement is at least $ 1.0 million . The foregoing registration rights are subject to various conditions and limitations, including the right of underwriters of an offering to limit the number of registrable securities that may be included in an offering. The registration rights terminate as to any particular shares on the date on which the holder sells such shares to the public in a registered offering or pursuant to Rule 144 under the Securities Act. We are generally required to bear all of the expenses of these registrations, except underwriting commissions, selling discounts and transfer taxes.
We are not obligated under the registration rights agreement to transfer consideration, whether in cash, equity instruments, or adjustments to the terms of the financial instruments that are subject to the registration payment arrangement, to the investors, if the registration statement is not declared effective within the specified time or if effectiveness of the registration statement is not maintained.
Comprehensive Income
The tax impact on unrealized losses and gains on investment securities available-for-sale for the years ended December 31, 2013 and December 31, 2012 was approximat ely $(104,000) and $46,000 , respectively.
Note 10-Employee Stock-Based Compensation
Employee Stock-Based Compensation
In January 2001, we adopted the 2001 Stock Plan. The 2001 Stock Plan provided for the granting of incentive stock options, nonqualified stock options and other stock awards. Options granted under the 2001 Stock Plan generally vest over four years and expire five years or ten years from the date of grant. This stock plan is no longer in effect with the automatic conversion of all Class B Common Stock to Class A Common Stock in August 2013 as noted within Note 9-Stockholders' Equity.
In June 2010, our board of directors adopted, and in July 2010 our stockholders approved, the 2010 Equity Incentive Plan, which replaced our 2001 Stock Plan, and the 2010 Employee Stock Purchase Plan. The 2010 Equity Incentive Plan authorizes the award of stock options, restricted stock awards, stock appreciation rights, restricted stock units, performance shares and stock bonuses. Options granted under the 2010 Equity Incentive Plan generally vest over four years and expire five years or ten years from the date of grant. The 2010 Employee Stock Purchase Plan enables eligible employees to purchase shares of our Class A common stock periodically at a discount. Our 2010 Employee Stock Purchase Plan is intended to qualify as an employee stock purchase plan under Section 423 of the Internal Revenue Code.
73
Table of Contents
GREEN DOT CORPORATION
NOTES TO CONSOLIDATED FINANCIAL STATEMENTS – (CONTINUED)
Note 10-Employee Stock-Based Compensation (continued)
We reserved 2,000,000 shares and 200,000 shares of our Class A common stock for issuance under our 2010 Equity Incentive Plan and 2010 Employee Stock Purchase Plan, respectively. The number of shares reserved for issuance under our 2010 Equity Incentive Plan and our 2010 Employee Stock Purchase Plan automatically increase on the first day of January of each of 2011 through 2014 and 2011 through 2018, respectively, by up to a number of shares equal to 3% of the total outstanding shares our Class A common stock as of the immediately preceding December 31st. Our board of directors or its compensation committee may reduce the amount of the annual increase under the 2010 Equity Incentive Plan or 2010 Employee Stock Purchase Plan in any particular year. Options granted under the 2010 Equity Incentive Plan generally vest over four years and expire five or ten years from the date of grant.
Stock-based compensation for the years ended December 31, 2013 , 2012 , and 2011 includes expense related to awards of stock options and restricted stock units and purchases under the 2010 Employee Stock Purchase Plan. Total stock-based compensation expense and the related income tax benefit are as follows:
| Year Ended December 31, | ||||||||||
| 2013 |
| 2012 |
| 2011 | ||||||
| (In thousands) | ||||||||||
Total stock-based compensation expense | $ | 14,703 | |
| $ | 12,734 | |
| $ | 9,524 | |
Related income tax benefit | 1,410 | |
| 1,465 | |
| 1,890 | | |||
Options and restricted stock units granted on or after July 21, 2010 are issued under the 2010 Equity Incentive Plan and options granted prior to July 21, 2010 were issued under the 2001 Stock Plan, the predecessor to our 2010 Equity Incentive Plan. We have reserved shares of our Class A common stock common stock for issuance under the 2010 Equity Incentive Plan.
The following table summarizes stock options and restricted stock units granted:
| Year Ended December 31, | ||||||||||
| 2013 |
| 2012 |
| 2011 | ||||||
| (In thousands, except per share data) | ||||||||||
Stock options granted | 2,236 | |
| 2,247 | |
| 889 | | |||
Weighted-average exercise price | $ | 18.88 | |
| $ | 19.35 | |
| $ | 38.70 | |
Weighted-average grant-date fair value | $ | 7.20 | |
| $ | 8.92 | |
| $ | 18.62 | |
|
|
|
|
|
| ||||||
Restricted stock units granted | 1,272 | |
| 613 | |
| 111 | | |||
Weighted-average grant-date fair value | $ | 22.16 | |
| $ | 14.14 | |
| $ | 33.46 | |
We estimated the fair value of each stock option grant on the date of grant using the following weighted-average assumptions:
| Year Ended December 31, | |||||||
| 2013 |
| 2012 |
| 2011 | |||
Risk-free interest rate | 1.2 | % |
| 1.0 | % |
| 2.1 | % |
Expected term (life) of options (in years) | 5.86 | |
| 6.07 | |
| 6.06 | |
Expected dividends | - | |
| - | |
| - | |
Expected volatility | 43.4 | % |
| 47.5 | % |
| 48.3 | % |
Determining the fair value of stock-based awards at their respective grant dates requires considerable judgment, including estimating expected volatility and expected term (life). We based our expected volatility on the historical volatility of comparable public companies over the option's expected term. We calculated our expected term based on the simplified method, which is the mid-point between the weighted-average graded-vesting term and the contractual term. The simplified method was chosen as a means to determine expected term as we have limited historical option exercise experience as a public company. We derived the risk-free rate from the average yield for the five-and seven-year zero-coupon U.S. Treasury Strips. We estimate forfeitures at the grant date based on our historical forfeiture rate and revise the estimate, if necessary, in subsequent periods if actual forfeitures differ from those estimates.
74
Table of Contents
GREEN DOT CORPORATION
NOTES TO CONSOLIDATED FINANCIAL STATEMENTS – (CONTINUED)
Note 10-Employee Stock-Based Compensation (continued)
Stock option activity for the year ended December 31, 2013 was as follows:
| Options |
| Weighted-Average Exercise Price |
| Weighted-Average Remaining Contractual Life (in Years) |
| Aggregate Intrinsic Value | |||||
| (In thousands, except per share data and years) | |||||||||||
Outstanding at December 31, 2012 | 5,717 | |
| $ | 15.72 | |
|
|
|
| ||
Options granted | 2,236 | |
| 18.88 | |
|
|
|
| |||
Options exercised | (1,428 | ) |
| 9.67 | |
|
|
|
| |||
Options canceled | (1,313 | ) |
| 24.36 | |
|
|
|
| |||
Outstanding at December 31, 2013 | 5,212 | |
| $ | 16.62 | |
| 6.73 |
| $ | 48,290 | |
Vested or expected to vest at December 31, 2013 | 4,956 | |
| 16.48 | |
| 6.61 |
| $ | 46,690 | | |
Exercisable at December 31, 2013 | 2,456 | |
| 14.03 | |
| 4.26 |
| $ | 29,555 | | |
The total intrinsic value of options exercised was $17.9 million , $8.5 million and $4.4 million for the years ended December 31, 2013 , 2012 , and 2011 , respectively.
Restricted stock unit activity for the year ended December 31, 2013 was as follows:
| Shares |
| Weighted-Average Grant-Date Fair Value | |||
| (In thousands) | |||||
Outstanding at December 31, 2012 | 616 | |
| $ | 15.10 | |
Restricted stock units granted | 1,272 | |
| $ | 22.16 | |
Restricted stock units canceled | (238 | ) |
| $ | 17.54 | |
Restricted stock units vested | (196 | ) |
| $ | 15.22 | |
Outstanding at December 31, 2013 | 1,454 | |
| $ | 20.87 | |
The total fair value of shares vested for the years ended December 31, 2013 and 2012 was $4.5 million and $0.4 million , respectively, based on the price of our Class A common stock on the vesting date. No restricted stock units vested prior to 2012 .
At December 31, 2013 , there was $19.3 million and $24.4 million of aggregate unrecognized compensation cost related to unvested stock options and restricted stock units, respectively, expected to be recognized in compensation expense in future periods, with a weighted-average period of 2.9 years and 3.4 years, respectively. Approximately 0.5 million shares are available for grant under the 2010 Equity Incentive Plan as of December 31, 2013 .
Stock-Based Retailer Incentive Compensation
As discussed in Note 9 - Stockholders' Equity , we issued Walmart 2,208,552 shares of our Class A common stock. We recognize the fair value of 36,810 shares each month over the 60-month term of the commercial agreement. An early expiration of our right to repurchase as described above would, however, result in the recognition of the fair value of all the shares still subject to repurchase on the date of the expiration. We currently assess an early expiration of our repurchase right to be remote. We record the fair value recognized as stock-based retailer incentive compensation, a contra-revenue component of our total operating revenues. We recognize monthly the fair value of the shares for which our right to repurchase has lapsed using the then-current fair market value of our Class A common stock. We recognized $8.7 million , $8.3 million and $17.3 million of stock-based retailer incentive compensation for the years ended December 31, 2013 , 2012 , and 2011 , respectively.
75
Table of Contents
GREEN DOT CORPORATION
NOTES TO CONSOLIDATED FINANCIAL STATEMENTS – (CONTINUED)
Note 11-Income Taxes
The components of income tax expense included in our consolidated statements of operations were as follows:
| Year Ended December 31, | ||||||||||
| 2013 |
| 2012 |
| 2011 | ||||||
| (In thousands) | ||||||||||
Current: |
|
|
|
|
| ||||||
Federal | $ | 11,880 | |
| $ | 21,322 | |
| $ | 29,583 | |
State | 1,116 | |
| 1,805 | |
| 2,096 | | |||
Current income tax expense | 12,996 | |
| 23,127 | |
| 31,679 | | |||
Deferred: | |
|
|
|
| ||||||
Federal | $ | 6,776 | |
| 5,931 | |
| 251 | | ||
State | (1,312 | ) |
| (139 | ) |
| - | | |||
Deferred income tax expense | 5,464 | |
| 5,792 | |
| 251 | | |||
Income tax expense | $ | 18,460 | |
| $ | 28,919 | |
| $ | 31,930 | |
Income tax expense differs from the amount computed by applying the statutory federal income tax rate to income before income taxes. The sources and tax effects of the differences are as follows:
| Year Ended December 31, | |||||||
| 2013 |
| 2012 |
| 2011 | |||
U.S. federal statutory tax rate | 35.0 | % |
| 35.0 | % |
| 35.0 | % |
State income taxes, net of federal benefit | (0.2 | ) |
| 1.9 | |
| 1.6 | |
General business credits | (2.3 | ) |
| (0.4 | ) |
| - | |
Employee stock-based compensation | 1.4 | |
| 1.4 | |
| 1.2 | |
Other | 1.2 | |
| 0.3 | |
| 0.2 | |
Effective tax rate | 35.1 | % |
| 38.2 | % |
| 38.0 | % |
The effective tax rate for the year ended December 31, 2013 was impacted by our recognition of federal and state general business credits related to 2012 and 2013 of $1.2 million .
76
Table of Contents
GREEN DOT CORPORATION
NOTES TO CONSOLIDATED FINANCIAL STATEMENTS – (CONTINUED)
Note 11-Income Taxes (continued)
The tax effects of temporary difference that give rise to significant portions of our deferred tax assets and liabilities were as follows:
| December 31, | ||||||
| 2013 |
| 2012 | ||||
| (In thousands) | ||||||
Deferred tax assets: |
|
|
| ||||
Net operating loss carryforwards | $ | 12,276 | |
| $ | 13,655 | |
Stock-based compensation | 6,397 | |
| 7,057 | | ||
Reserve for overdrawn accounts | 4,088 | |
| 6,130 | | ||
Accrued liabilities | 5,354 | |
| 3,191 | | ||
Tax credit carryforwards | 2,298 | |
| - | | ||
Other | 984 | |
| 1,272 | | ||
Gross deferred tax assets | 31,397 | |
| 31,305 | | ||
Valuation allowance | (1,228 | ) |
| (1,262 | ) | ||
Total deferred tax assets, net of valuation allowance | $ | 30,169 | |
| $ | 30,043 | |
|
|
|
| ||||
Deferred tax liabilities: |
|
|
| ||||
Internal-use software costs | $ | 10,587 | |
| $ | 9,986 | |
Property and equipment, net | 5,534 | |
| 6,013 | | ||
Deferred expenses | 5,083 | |
| 4,013 | | ||
Intangible assets | 1,156 | |
| 1,386 | | ||
Gift card revenue | 6,637 | |
| 1,063 | | ||
Other | 1,526 | |
| 475 | | ||
Total deferred tax liabilities | $ | 30,523 | |
| $ | 22,936 | |
|
|
|
| ||||
Net deferred tax (liabilities) assets | $ | (354 | ) |
| $ | 7,107 | |
Total net deferred tax assets and liabilities are included in our consolidated balance sheets as follows:
| December 31, | ||||||
| 2013 |
| 2012 | ||||
| (In thousands) | ||||||
Current net deferred tax (liabilities) assets | $ | (3,716 | ) |
| $ | 2,478 | |
Noncurrent net deferred tax assets | 3,362 | |
| 4,629 | | ||
Net deferred tax (liabilities) assets | $ | (354 | ) |
| $ | 7,107 | |
We establish a valuation allowance when we consider it more-likely-than-not that some portion or all of the deferred tax assets will not be realized. We believe uncertainty exists regarding the realizability of certain operating losses and have, therefore, established a valuation allowance for this portion of the deferred tax asset. Future changes in the valuation allowance associated with these deferred tax assets will be recognized as a reduction or increase to income tax expense.
We are subject to examination by the Internal Revenue Service, or IRS, and various state tax authorities. Our consolidated federal income tax return for the year ended July 31, 2008 has been examined by the IRS, and there were no material changes in our tax liabilities for that year. Our consolidated federal income tax returns for the year ended July 31, 2009, the five-months ended December 31, 2009 and the years ended December 31, 2010 and 2011 are currently under examination by the IRS. We remain subject to examination of our federal income tax returns for the year ended December 31, 2012. We generally remain subject to examination of our various state income tax returns for a period of four to five years from the respective dates the returns were filed.
As of December 31, 2013 , we have net operating loss carryforwards of approximately $29.7 million and $28.4 million for federal and state tax purposes, respectively, which will be available to offset future income. If not used, these carryforwards will expire between 2025 and 2031. In addition, we have state business tax credits of approximately $1.2 million that will expire between 2028 and 2033 and other state business tax credits of approximately $1.1 million that can be carried forward indefinitely.
77
Table of Contents
GREEN DOT CORPORATION
NOTES TO CONSOLIDATED FINANCIAL STATEMENTS – (CONTINUED)
Note 11-Income Taxes (continued)
Certain limitations may be placed on net operating loss carryforwards as a result of changes in control as defined in Section 382 of the Internal Revenue Code. In the event a change in control occurs, it will have the effect of limiting the annual usage of the operating loss carryforwards.
As of December 31, 2013 and 2012 , we had a liability of $3.7 million and $1.5 million , respectively, for unrecognized tax benefits related to various federal and state income tax matters excluding interest, penalties and related tax benefits. The reconciliation of the beginning unrecognized tax benefits balance to the ending balance is as follows:
| Year Ended December 31, | ||||||||||
| 2013 |
| 2012 |
| 2011 | ||||||
| (In thousands) | ||||||||||
Beginning balance | $ | 1,481 | |
| $ | - | |
| $ | - | |
Increases related to positions taken during prior years | 931 | |
| 970 | |
| - | | |||
Increases related to positions taken during the current year | 1,312 | |
| 511 | |
| - | | |||
Ending balance | $ | 3,724 | |
| $ | 1,481 | |
| $ | - | |
|
|
|
|
|
| ||||||
The total amount of unrecognized tax benefits that, if recognized, would affect the effective tax rate | $ | 3,724 | |
| $ | 1,481 | |
| $ | - | |
We recognized accrued interest and penalties related to unrecognized tax benefits for the years ended December 31, 2013 and 2012 , of approximately $338,000 and $0 , respectively.
78
Table of Contents
GREEN DOT CORPORATION
NOTES TO CONSOLIDATED FINANCIAL STATEMENTS – (CONTINUED)
Note 12-Earnings per Common Share
In August 2013, the issued and outstanding shares of our Class B Common Stock declined to less than 10% of the aggregate number of issued and outstanding shares of our Class A Common Stock and Class B Common Stock. Pursuant to the terms of Article V of our Certificate of Incorporation, the issued and outstanding shares of our Class B common stock automatically converted into shares of our Class A common stock. Following this automatic conversion, there is now only a single class of our common stock outstanding. As Class B common stock was outstanding for a portion of the year, we continue to disclose earnings per common share, or EPS, for both classes of common stock.
The calculation of basic and diluted EPS was as follows:
| Year Ended December 31, | ||||||||||
| 2013 |
| 2012 |
| 2011 | ||||||
| (In thousands, except per share data) | ||||||||||
Basic earnings per Class A common share |
|
|
|
|
| ||||||
Net income | $ | 34,040 | |
| $ | 47,219 | |
| $ | 52,083 | |
Income attributable to preferred stock | (5,360 | ) |
| (7,599 | ) |
| (558 | ) | |||
Income attributable to other classes of common stock | (2,677 | ) |
| (6,719 | ) |
| (24,022 | ) | |||
Net income allocated to Class A common stockholders | $ | 26,003 | |
| $ | 32,901 | |
| $ | 27,503 | |
Weighted-average Class A shares issued and outstanding | 33,272 | |
| 29,698 | |
| 22,238 | | |||
Basic earnings per Class A common share | $ | 0.78 | |
| $ | 1.11 | |
| $ | 1.24 | |
|
|
|
|
|
| ||||||
Diluted earnings per Class A common share |
|
|
|
|
| ||||||
Net income allocated to Class A common stockholders | $ | 26,003 | |
| $ | 32,901 | |
| $ | 27,503 | |
Re-allocated earnings | 2,207 | |
| 5,612 | |
| 22,549 | | |||
Diluted net income allocated to Class A common stockholders | 28,210 | |
| 38,513 | |
| 50,052 | | |||
Weighted-average Class A shares issued and outstanding | 33,272 | |
| 29,698 | |
| 22,238 | | |||
Dilutive potential common shares: |
|
|
|
|
| ||||||
Class B common stock | 2,603 | |
| 6,150 | |
| 19,822 | | |||
Stock options | 1,078 | |
| 20 | |
| - | | |||
Restricted stock units | 203 | |
| 43 | |
| 3 | | |||
Employee stock purchase plan | - | |
| 22 | |
| 2 | | |||
Diluted weighted-average Class A shares issued and outstanding | 37,156 | |
| 35,933 | |
| 42,065 | | |||
Diluted earnings per Class A common share | $ | 0.76 | |
| $ | 1.07 | |
| $ | 1.19 | |
79
Table of Contents
GREEN DOT CORPORATION
NOTES TO CONSOLIDATED FINANCIAL STATEMENTS – (CONTINUED)
Note 12-Earnings per Common Share (continued)
| Year Ended December 31, | ||||||||||
| 2013 |
| 2012 |
| 2011 | ||||||
| (In thousands, except per share data) | ||||||||||
Basic earnings per Class B common share |
|
|
|
|
| ||||||
Net income | $ | 34,040 | |
| $ | 47,219 | |
| $ | 52,083 | |
Income attributable to preferred stock | (5,360 | ) |
| (7,599 | ) |
| (558 | ) | |||
Income attributable to other classes of common stock | (26,645 | ) |
| (34,301 | ) |
| (29,613 | ) | |||
Net income allocated to Class B common stockholders | $ | 2,035 | |
| $ | 5,319 | |
| $ | 21,912 | |
Weighted-average Class B shares issued and outstanding | 2,603 | |
| 4,801 | |
| 17,718 | | |||
Basic earnings per Class B common share | $ | 0.78 | |
| $ | 1.11 | |
| $ | 1.24 | |
|
|
|
|
|
| ||||||
Diluted earnings per Class B common share |
|
|
|
|
| ||||||
Net income allocated to Class B common stockholders | $ | 2,035 | |
| $ | 5,319 | |
| $ | 21,912 | |
Re-allocated earnings | (58 | ) |
| 1,273 | |
| 1,673 | | |||
Diluted net income allocated to Class B common stockholders | $ | 1,977 | |
| $ | 6,592 | |
| $ | 23,585 | |
Weighted-average Class B shares issued and outstanding | 2,603 | |
| 4,801 | |
| 17,718 | | |||
Dilutive potential common shares: |
|
|
|
|
| ||||||
Stock options | - | |
| 1,349 | |
| 2,104 | | |||
Diluted weighted-average Class B shares issued and outstanding | 2,603 | |
| 6,150 | |
| 19,822 | | |||
Diluted earnings per Class B common share | $ | 0.76 | |
| $ | 1.07 | |
| $ | 1.19 | |
As of December 31, 2013 , 588,912 shares of Class A common stock issued to Walmart were subject to our repurchase right. Basic and diluted EPS for these shares were the same as basic and diluted EPS for our Class A common stock for the year s ended December 31, 2013 and 2012 .
We excluded from the computation of basic EPS all shares issuable under an unvested warrant to purchase 4,283,456 shares of our Class A common stock, as the related performance conditions had not been satisfied.
For the periods presented, we excluded all shares of convertible preferred stock and certain stock options outstanding, which could potentially dilute basic EPS in the future, from the computation of diluted EPS as their effect was anti-dilutive. The following table shows the weighted-average number of anti-dilutive shares excluded from the diluted EPS calculation:
| Year Ended December 31, | |||||||
| 2013 |
| 2012 |
| 2011 | |||
| (In thousands, except per share data) | |||||||
Class A common stock |
|
|
|
|
| |||
Options to purchase Class A common stock | 994 | |
| 1,408 | |
| 258 | |
Restricted stock units | 39 | |
| 26 | |
| - | |
Conversion of convertible preferred stock | 6,859 | |
| 6,859 | |
| 451 | |
Total options, restricted stock units and convertible preferred stock | 7,892 | |
| 8,293 | |
| 709 | |
Class B common stock |
|
|
|
|
| |||
Options to purchase Class B common stock | - | |
| 122 | |
| 5 | |
Total options | - | |
| 122 | |
| 5 | |
Note 13-Fair Value Measurements
Under applicable accounting guidance, fair value is defined as the exchange price that would be received for an asset or paid to transfer a liability (an exit price) in the principal or most advantageous market for the asset or liability in an orderly transaction between market participants on the measurement date.
We determine the fair values of our financial instruments based on the fair value hierarchy established under applicable accounting guidance which requires an entity to maximize the use of observable inputs and minimize the use of unobservable inputs when measuring fair value. There are three levels of inputs used to measure fair value.
80
Table of Contents
GREEN DOT CORPORATION
NOTES TO CONSOLIDATED FINANCIAL STATEMENTS – (CONTINUED)
Note 13-Fair Value Measurements (continued)
For more information regarding the fair value hierarchy and how we measure fair value, see Note 2–Summary of Significant Accounting Policies .
As of December 31, 2013 and December 31, 2012 , our assets carried at fair value on a recurring basis were as follows:
| Level 1 |
| Level 2 |
| Level 3 |
| Total Fair Value | ||||||||
December 31, 2013 | (In thousands) | ||||||||||||||
Corporate bonds | $ | - | |
| $ | 70,997 | |
| $ | - | |
| $ | 70,997 | |
Commercial paper | - | |
| 49,321 | |
| - | |
| 49,321 | | ||||
Negotiable certificate of deposit | - | |
| 4,403 | |
| - | |
| 4,403 | | ||||
U.S. Treasury notes | - | |
| 14,278 | |
| - | |
| 14,278 | | ||||
Agency securities | - | |
| 14,959 | |
| - | |
| 14,959 | | ||||
Mortgage-backed securities | - | |
| 4,001 | |
| - | |
| 4,001 | | ||||
Municipal bonds | - | |
| 19,031 | |
| - | |
| 19,031 | | ||||
Asset-backed securities | - | |
| 21,754 | |
| - | |
| 21,754 | | ||||
Total | $ | - | |
| $ | 198,744 | |
| $ | - | |
| $ | 198,744 | |
|
|
|
|
|
|
|
| ||||||||
December 31, 2012 |
|
|
|
|
|
|
| ||||||||
Corporate bonds | $ | - | |
| $ | 37,357 | |
| $ | - | |
| $ | 37,357 | |
Commercial paper | - | |
| 55,748 | |
| - | |
| 55,748 | | ||||
Negotiable certificate of deposit | - | |
| 4,414 | |
| - | |
| 4,414 | | ||||
U.S. treasury notes | - | |
| 22,267 | |
| - | |
| 22,267 | | ||||
Agency securities | - | |
| 25,867 | |
| - | |
| 25,867 | | ||||
Municipal bonds | - | |
| 11,568 | |
| - | |
| 11,568 | | ||||
Asset-backed securities | - | |
| 26,566 | |
| - | |
| 26,566 | | ||||
Total | $ | - | |
| $ | 183,787 | |
| $ | - | |
| $ | 183,787 | |
We based the fair value of our fixed income securities held as of December 31, 2013 and December 31, 2012 on quoted prices in active markets for similar assets. We had no transfers between Level 1, Level 2 or Level 3 assets during the year s ended December 31, 2013 or 2012 .
Note 14-Fair Value of Financial Instruments
The following describes the valuation technique for determining the fair value of financial instruments, whether or not such instruments are carried at fair value on our consolidated balance sheets.
Short-term Financial Instruments
Our short-term financial instruments consist principally of unrestricted and restricted cash and cash equivalents, federal funds sold, settlement assets and obligations, and obligations to customers . These financial instruments are short-term in nature, and, accordingly, we believe their carrying amounts approximate their fair values. Under the fair value hierarchy, these instruments are classified as Level 1.
Investment Securities
The fair values of investment securities have been derived using methodologies referenced in Note 2–Summary of Significant Accounting Policies. Under the fair value hierarchy, our investment securities are classified as Level 2.
Loans
We determined the fair values of loans by discounting both principal and interest cash flows expected to be collected using a discount rate commensurate with the risk that we believe a market participant would consider in determining fair value. Under the fair value hierarchy, our loans are classified as Level 3.
81
Table of Contents
GREEN DOT CORPORATION
NOTES TO CONSOLIDATED FINANCIAL STATEMENTS – (CONTINUED)
Note 14-Fair Value of Financial Instruments (continued)
Deposits
The fair value of demand and interest checking deposits and savings deposits is the amount payable on demand at the reporting date. We determined the fair value of time deposits by discounting expected future cash flows using market-derived rates based on our market yields on certificates of deposit, by maturity, at the measurement date. Under the fair value hierarchy, our deposits are classified as Level 2.
Fair Value of Financial Instruments
The carrying values and fair values of certain financial instruments that were not carried at fair value, excluding short-term financial instruments for which the carrying value approximates fair value, at December 31, 2013 and December 31, 2012 are presented in the table below.
| December 31, 2013 |
| December 31, 2012 | ||||||||||||
| Carrying Value |
| Fair Value |
| Carrying Value |
| Fair Value | ||||||||
| (In thousands) | ||||||||||||||
Financial Assets |
|
|
|
|
|
|
| ||||||||
Loans to bank customers, net of allowance | $ | 6,902 | |
| $ | 5,926 | |
| $ | 7,552 | |
| $ | 5,719 | |
|
|
|
|
|
|
|
| ||||||||
Financial Liabilities |
|
|
|
|
|
|
| ||||||||
Deposits | $ | 219,580 | |
| $ | 219,534 | |
| $ | 198,451 | |
| $ | 198,369 | |
Note 15-Borrowing Agreements
In connection with the transition of all outstanding customer deposits associated with our card issuing program with Synovus Bank to our subsidiary bank, in November 2012, our line of credit with Columbus Bank and Trust Company was terminated. Prior to the termination, we used the line of credit to fund timing differences between funds remitted by our retail distributors to the banks that issue our cards and funds utilized by our cardholders. For the periods presented below, our line of credit had the following terms:
| Line of Credit |
| Interest Rate |
| Cash Collateral Requirements | ||||
| (In millions, except interest rates) | ||||||||
March 2012 - November 2012 | $ | 10.0 | |
| LIBOR + 2.00% |
| $ | 10.0 | |
March 2011 - March 2012 | $ | 10.0 | |
| LIBOR + 2.00% |
| $ | 10.0 | |
We present our cash collateral requirements on our consolidated balance sheets as restricted cash. There were no outstanding borrowings at December 31, 2013 .
Note 16-Concentrations of Credit Risk
Financial instruments that subject us to concentration of credit risk consist primarily of unrestricted cash and cash equivalents, restricted cash, investment securities, accounts receivable, loans and settlement assets. We deposit our unrestricted cash and cash equivalents and our restricted cash with regional and national banking institutions that we periodically monitor and evaluate for creditworthiness. Credit risk for our investment securities is mitigated by the types of investment securities in our portfolio, which must comply with strict investment guidelines that we believe appropriately ensures the preservation of invested capital. Credit risk for our accounts receivable is concentrated with card issuing banks and our customers, and this risk is mitigated by the relatively short collection period and our large customer base. We do not require or maintain collateral for accounts receivable. We maintain reserves for uncollectible overdrawn accounts and uncollectible trade receivables. Approximately 94.1% of our borrowers reside in the state of Utah and approximately 41.0% in the city of Provo. Consequently, we are susceptible to any adverse market or environmental conditions that may impact this specific geographic region. Credit risk for our settlement assets is concentrated with our retail distributors, which we periodically monitor.
82
Table of Contents
GREEN DOT CORPORATION
NOTES TO CONSOLIDATED FINANCIAL STATEMENTS – (CONTINUED)
Note 17-Defined Contribution Plan
On January 1, 2004, we established a defined contribution savings plan under Section 401(k) of the Internal Revenue Code. Employees who have attained at least 21 years of age are generally eligible to participate in the plan on the first day of the calendar month following the month in which they commence service with us. Participants may make pre-tax contributions to the plan from their eligible earnings up to the statutorily prescribed annual limit on pre-tax contributions under the code. We may contribute to the plan at the discretion of our board of directors. Effective January 1, 2010, our board elected to include a discretionary employer matching contribution equal to 50% of the first 6% of the participant's eligible compensation as defined by the Plan. Effective January 1, 2013, our board elected to cancel the discretionary employer matching contributions. Our contributions are allocated in the same manner as that of the participant's elective contributions. We made contributions to the plan of $0.1 million , $1.2 million , and $0.9 million for the years ended December 31, 2013 , 2012 and 2011 , respectively. Amounts contributed in the year ended December 31, 2013 were related to matching contributions on employee contributions during the year ended December 31, 2012 which were not received until 2013.
Note 18-Commitments and Contingencies
In December 2011, we entered into a ten-year office lease for 140,000 square feet of office space in Pasadena, California. This facility serves as our corporate headquarters. The initial term of the lease is ten years and is scheduled to expire on October 31, 2022. We are also bound to a property sub-lease agreement of approximately 5,000 square feet that expired in December 2013 and maintain smaller administrative or project offices. Our total rental expense for these and former leases amounted to $5.3 million , $6.4 million and $2.6 million for the years ended December 31, 2013 , 2012 and 2011 , respectively.
At December 31, 2013 , the future minimum aggregate rental commitment under all operating leases and minimum annual payments through various agreements with vendors and retail distributors was:
| Operating Leases |
| Vendor/Retail Distributor Commitments | ||||
Year ending December 31, | (In thousands) | ||||||
2014 | $ | 4,187 | |
| $ | 9,558 | |
2015 | 4,596 | |
| 1,910 | | ||
2016 | 4,726 | |
| 6,550 | | ||
2017 | 4,186 | |
| 1,625 | | ||
2018 | 4,156 | |
| 12,600 | | ||
Thereafter | 17,108 | |
| 3,150 | | ||
Total of future commitments | $ | 38,959 | |
| $ | 35,393 | |
In the event we terminate our processing services agreement for convenience, we are required to pay a single lump sum equal to any minimum payments remaining on the date of termination.
We monitor the laws of all 50 states to identify state laws or regulations that apply to prepaid debit cards and other stored value products. Many state laws do not specifically address stored value products and what, if any, legal or regulatory requirements (including licensing) apply to the sale of these products. We have obtained money transmitter licenses (or similar such licenses) where applicable, based on advice of counsel or when we have been requested to do so. If we were found to be in violation of any laws and regulations governing banking, money transmitters, electronic fund transfers, or money laundering in the United States or abroad, we could be subject to penalties or could be forced to change our business practices.
In the ordinary course of business, we are a party to various legal proceedings. We review these actions on an ongoing basis to determine whether it is probable that a loss has occurred and use that information when making accrual and disclosure decisions. We have not established reserves or possible ranges of losses related to these proceedings because, at this time in the proceedings, the matters do not relate to a probable loss and/or the amounts are not reasonably estimable.
83
Table of Contents
GREEN DOT CORPORATION
NOTES TO CONSOLIDATED FINANCIAL STATEMENTS – (CONTINUED)
Note 18-Commitments and Contingencies (continued)
From time to time we enter into contracts containing provisions that contingently require us to indemnify various parties against claims from third parties. These contracts primarily relate to: (i) contracts with our card issuing banks, under which we are responsible to them for any unrecovered overdrafts on cardholders' accounts; (ii) certain real estate leases, under which we may be required to indemnify property owners for environmental and other liabilities, and other claims arising from our use of the premises; (iii) certain agreements with our officers, directors, and employees, under which we may be required to indemnify these persons for liabilities arising out of their relationship with us; and (iv) contracts under which we may be required to indemnify our retail distributors, suppliers, vendors and other parties with whom we have contracts against third-party claims that our products infringe a patent, copyright, or other intellectual property right claims arising from our acts, omissions, or violation of law.
Generally, a maximum obligation under these contracts is not explicitly stated. Because the obligated amounts associated with these types of agreements are not explicitly stated, the overall maximum amount of the obligation cannot be reasonably estimated. With the exception of overdrafts on cardholders' accounts, historically, we have not been required to make payments under these and similar contingent obligations, and no liabilities have been recorded for these obligations in our consolidated balance sheets.
For additional information regarding overdrafts on cardholders' accounts, refer to Note 4 - Accounts Receivable .
Note 19-Significant Customer Concentration
A credit concentration may exist if customers are involved in similar industries, economic sectors, and geographic regions. Our retail distributors operate in similar economic sectors but diverse domestic geographic regions. The loss of a significant retail distributor could have a material adverse effect upon our card sales, profitability, and revenue growth.
Revenues derived from our products sold at our four largest retail distributors represented the following percentages of our total operating revenues:
| Year Ended December 31, | ||||
| 2013 |
| 2012 |
| 2011 |
Walmart | 64% |
| 64% |
| 61% |
Three other largest retail distributors, as a group | 22% |
| 20% |
| 20% |
Excluding stock-based retailer incentive compensation of $8.7 million , $8.3 million , $17.3 million and for the year s ended December 31, 2013 , 2012 , and 2011 , respectively, revenues derived from our products sold at our four largest retail distributors represented the following percentages of our total operating revenues:
| Year Ended December 31, | ||||
| 2013 |
| 2012 |
| 2011 |
Walmart | 65% |
| 65% |
| 62% |
Three other largest retail distributors, as a group | 21% |
| 20% |
| 19% |
The concentration of GPR cards activated (in units) and the concentration of sales of cash transfer products (in units) derived from our products sold at our four largest retail distributors was as follows:
| Year Ended December 31, | ||||
| 2013 |
| 2012 |
| 2011 |
Concentration of GPR cards activated (in units) | 82% |
| 87% |
| 80% |
Concentration of sales of cash transfer products (in units) | 87% |
| 88% |
| 90% |
Settlement assets derived from our products sold at our four largest retail distributors comprised the following percentages of the settlement assets recorded on our consolidated balance sheet:
| December 31, 2013 |
| December 31, 2012 |
Walmart | 34% |
| 35% |
Three other largest retail distributors, as a group | 39% |
| 38% |
84
Table of Contents
GREEN DOT CORPORATION
NOTES TO CONSOLIDATED FINANCIAL STATEMENTS – (CONTINUED)
Note 19-Significant Customer Concentration (continued)
At December 31, 2013 and December 31, 2012 , the customer funds underlying the Walmart co-branded GPR cards were held by GE Capital Retail Bank. These funds are held in trust for the benefit of the customers, and we have no legal rights to the customer funds. Additionally, we have receivables due from GE Capital Retail Bank that are included in accounts receivable, net, on our consolidated balance sheets. Refer to Note 22 - Subsequent Events for additional information regarding our relationship with GE Capital Retail Bank.
Note 20-Regulatory Requirements
Our subsidiary bank, Green Dot Bank, is a member bank of the Federal Reserve System and our primary regulator is the Federal Reserve Board. We are subject to various regulatory capital requirements administered by the federal banking agencies. Failure to meet minimum capital requirements can initiate certain mandatory actions by regulators that, if undertaken, could have a direct material effect on our financial statements. Under capital adequacy guidelines, we must meet specific capital guidelines that involve quantitative measures of the assets, liabilities and certain off-balance sheet items as calculated under regulatory accounting practices. The capital amounts and classification are also subject to qualitative judgments by the regulators about components, risk weightings and other factors.
As of December 31, 2013 , we were categorized as well capitalized under the regulatory framework for prompt corrective action. To be categorized as well capitalized, we must maintain specific total risk-based, Tier I risk-based, and Tier I leverage ratios as set forth in the table below. There are no conditions or events since December 31, 2013 which management believes would have changed our category as well capitalized.
The actual amounts and ratios, and required minimum capital amounts and ratios by which we exceed these minimum ratios at December 31, 2013 and 2012 were as follows:
| Actual |
| Regulatory "well capitalized" minimum | ||||||||
| Amount |
| Ratio |
| Amount |
| Ratio | ||||
December 31, 2013 | (In thousands, except ratios) | ||||||||||
Tier 1 leverage | 370,476 | |
| 45.8 | % |
| 40,418 | |
| 5.0 | % |
Tier 1 risk-based capital | 370,476 | |
| 100.8 | |
| 22,057 | |
| 6.0 | |
Total risk-based capital | 370,476 | |
| 100.8 | |
| 36,762 | |
| 10.0 | |
|
|
|
|
|
|
|
| ||||
December 31, 2012 |
|
|
|
|
|
|
| ||||
Tier 1 leverage | 289,323 | |
| 47.8 | % |
| 30,266 | |
| 5.0 | % |
Tier 1 risk-based capital | 289,323 | |
| 84.3 | |
| 20,591 | |
| 6.0 | |
Total risk-based capital | 289,323 | |
| 84.3 | |
| 34,318 | |
| 10.0 | |
85
Table of Contents
GREEN DOT CORPORATION
NOTES TO CONSOLIDATED FINANCIAL STATEMENTS – (CONTINUED)
Note 21- Selected Unaudited Quarterly Financial Information
The following tables set forth a summary of our quarterly financial information for each of the four quarters in 2013 and 2012 :
| 2013 | ||||||||||||||
| Q4 |
| Q3 |
| Q2 |
| Q1 | ||||||||
| (In thousands, except per share data) | ||||||||||||||
Total operating revenues | $ | 142,320 | |
| $ | 136,544 | |
| $ | 140,608 | |
| $ | 154,149 | |
Total operating expenses | 141,856 | |
| 128,570 | |
| 123,253 | |
| 130,810 | | ||||
Operating income | 464 | |
| 7,974 | |
| 17,355 | |
| 23,339 | | ||||
Interest income, net | 949 | |
| 778 | |
| 839 | |
| 802 | | ||||
Income before income taxes | 1,413 | |
| 8,752 | |
| 18,194 | |
| 24,141 | | ||||
Income tax expense | 377 | |
| 2,638 | |
| 6,890 | |
| 8,555 | | ||||
Net income | $ | 1,036 | |
| $ | 6,114 | |
| $ | 11,304 | |
| $ | 15,586 | |
Earnings per common share |
|
|
|
|
|
|
| ||||||||
Basic |
|
|
|
|
|
|
| ||||||||
Class A common stock | $ | 0.02 | |
| $ | 0.14 | |
| $ | 0.26 | |
| $ | 0.36 | |
Class B common stock | $ | 0.02 | |
| $ | 0.14 | |
| $ | 0.26 | |
| $ | 0.36 | |
Diluted |
|
|
|
|
|
|
| ||||||||
Class A common stock | $ | 0.02 | |
| $ | 0.13 | |
| $ | 0.25 | |
| $ | 0.35 | |
Class B common stock | $ | 0.02 | |
| $ | 0.13 | |
| $ | 0.25 | |
| $ | 0.35 | |
| 2012 | ||||||||||||||
| Q4 |
| Q3 |
| Q2 |
| Q1 | ||||||||
| (In thousands, except per share data) | ||||||||||||||
Total operating revenues | $ | 137,302 | |
| $ | 132,759 | |
| $ | 135,043 | |
| $ | 141,181 | |
Total operating expenses | 122,812 | |
| 117,882 | |
| 117,908 | |
| 115,543 | | ||||
Operating income | 14,490 | |
| 14,877 | |
| 17,135 | |
| 25,638 | | ||||
Interest income, net | 933 | |
| 962 | |
| 1,168 | |
| 935 | | ||||
Income before income taxes | 15,423 | |
| 15,839 | |
| 18,303 | |
| 26,573 | | ||||
Income tax expense | 5,053 | |
| 6,227 | |
| 7,434 | |
| 10,205 | | ||||
Net income | $ | 10,370 | |
| $ | 9,612 | |
| $ | 10,869 | |
| $ | 16,368 | |
Earnings per common share |
|
|
|
|
|
|
| ||||||||
Basic |
|
|
|
|
|
|
| ||||||||
Class A common stock | $ | 0.24 | |
| $ | 0.23 | |
| $ | 0.26 | |
| $ | 0.39 | |
Class B common stock | $ | 0.24 | |
| $ | 0.23 | |
| $ | 0.26 | |
| $ | 0.39 | |
Diluted |
|
|
|
|
|
|
| ||||||||
Class A common stock | $ | 0.24 | |
| $ | 0.22 | |
| $ | 0.25 | |
| $ | 0.37 | |
Class B common stock | $ | 0.24 | |
| $ | 0.22 | |
| $ | 0.25 | |
| $ | 0.37 | |
Note 22-Subsequent Event
In February 2014, we completed the transition of all outstanding customer deposits associated with our GPR card program with GE Capital Retail Bank to Green Dot Bank. The total funds transferred to Green Dot Bank was approximately $260.0 million and will be classified as deposits on our consolidated balance sheet. In conjunction with this transition, we made a payment of approximately $50.0 million to GE Capital Retail Bank to settle our liability associated with overdrawn cardholder account balances, which is included in our consolidated balance sheet as "amounts due to card issuing banks for overdrawn accounts." Additionally, we contributed approximately $50.0 million to Green Dot Bank to maintain its capital, leverage and other financial commitments at levels we have agreed to with our regulators.
86
Table of Contents
ITEM 9. Changes in and Disagreement With Accountants on Accounting and Financial Disclosure
None.
ITEM 9A. Controls and Procedures
Disclosure controls and procedures - Our management, with the participation of our Chief Executive Officer and Chief Financial Officer, has evaluated the effectiveness of our disclosure controls and procedures (as defined in Exchange Act Rules 13a-15(e) and 13d-15(e)), and internal control over financial reporting (as defined in Exchange Act Rules 13a-15(f) and 15d-15(f)) at the end of the period covered by this report. Based on such evaluation of our disclosure controls and procedures, our Chief Executive Officer and Chief Financial Officer have concluded that, at the end of such period, our disclosure controls and procedures were effective to ensure that information required to be disclosed by us in reports that we file or submit under the Exchange Act is recorded, processed, summarized and reported within the time periods specified in the SEC's rules and forms and is accumulated and communicated to our management, including our Chief Executive Officer and Chief Financial Officer, as appropriate, to allow timely decisions regarding required disclosure.
Report of management on internal control over financial reporting - Our management is responsible for establishing and maintaining adequate internal control over financial reporting (as defined in Exchange Act Rules 13a-15(f) and 15d-15(f)) for Green Dot Corporation. Our management, with the participation of our Chief Executive Officer and Chief Financial Officer, has conducted an evaluation of the effectiveness of our internal control over financial reporting as of December 31, 2013 , based on criteria established in Internal Control - Integrated Framework by the Committee of Sponsoring Organizations of the Treadway Commission (1992 framework). Our management concluded that, as of December 31, 2013 , our internal control over financial reporting was effective based on these criteria.
Ernst & Young LLP, an independent registered public accounting firm, has issued an unqualified opinion on the effectiveness of our internal control over financial reporting as of December 31, 2013 , which is included in Part II, Item 8 of this Annual Report on Form 10-K.
Change in internal control over financial reporting - There was no material change in our internal control over financial reporting (as defined in Exchange Act Rules 13a-15(f) and 15d-15(f)) during the three months ended December 31, 2013 that has materially affected, or is reasonably likely to materially affect, our internal control over financial reporting.
Limitations on Effectiveness of Controls - Our management, including our Chief Executive Officer and Chief Financial Officer, does not expect that our disclosure controls and procedures or our internal controls will prevent all errors and all fraud. A control system, no matter how well conceived and operated, can provide only reasonable, not absolute, assurance that the objectives of the control system are met. Further, the design of a control system must reflect the fact that there are resource constraints, and the benefits of controls must be considered relative to their costs. Because of the inherent limitations in all control systems, no evaluation of controls can provide absolute assurance that all control issues and instances of fraud, if any, within our company have been detected.
ITEM 9B. Other Information
2013 Executive Officer Bonus Plan
On February 27, 2014, the Compensation Committee of our board of directors approved our 2014 Executive Officer Incentive Bonus Plan ("Plan"), which is designed to reward designated executive officers, including executive officers identified as named executive officers in our 2013 annual meeting proxy statement, if we achieve specified adjusted EBITDA and annual revenue objectives for 2014.
The named executive officer participants in the Plan, and their 2014 on-target bonus amounts under the Plan expressed as a percentage of their respective annual base salaries, are: Steven W. Streit, Chairman, President and Chief Executive Officer - 100%; Grace Wang, Chief Financial Officer - 75%; Konstantinos Sgoutas, Chief Revenue Officer - 100%; Lewis B. Goodwin, Chief Executive Officer, Green Dot Bank - 70%: and John C. Ricci, General Counsel and Secretary - 50%.
Under the Plan, participants are eligible to receive one annual bonus, each in an amount equal to the participant's full 2014 on-target bonus for achievement of the two financial objectives described below. The actual bonus payment is the on-target bonus payment multiplied by a percentage (which may be more or less than 100% but shall not exceed 150%) that varies depending upon achievement of the financial objectives. Each of the financial objectives is given equal weight, except that no bonus shall be payable if we fail to achieve at least 90% of both financial objectives.
The financial objectives under the Plan are expressed in terms of the (i) annual goals contained in our financial plan for adjusted EBITDA, which is calculated by adding the amount of all stock-based compensation to the amount
87
Table of Contents
of earnings before interest, income taxes, depreciation and amortization reflected in our consolidated statements of operations; and (ii) annual goals contained in our financial plan for annual revenue, which is calculated by adding the amount of stock-based retailer incentive compensation to the amount of total operating revenues reflected in our consolidated statements of operations.
The financial targets under the Plan may be modified or adjusted for non-recurring or extraordinary items.
88
Table of Contents
PART III
ITEM 10. Directors, Executive Officers and Corporate Governance
The information required by this Item is incorporated by reference to our proxy statement for our 2014 Annual Meeting of Stockholders to be filed with the SEC within 120 days after the end of the year ended December 31, 2013 .
ITEM 11. Executive Compensation
The information required by this Item is incorporated by reference to our proxy statement for our 2014 Annual Meeting of Stockholders to be filed with the SEC within 120 days after the end of the year ended December 31, 2013 .
ITEM 12. Securities Ownership of Certain Beneficial Owners and Management and Related Stockholder Matters
The information required by this Item is incorporated by reference to our proxy statement for our 2014 Annual Meeting of Stockholders to be filed with the SEC within 120 days after the end of the year ended December 31, 2013 .
ITEM 13. Certain Relationships and Related Transactions, and Director Independence
The information required by this Item is incorporated by reference to our proxy statement for our 2014 Annual Meeting of Stockholders to be filed with the SEC within 120 days after the end of the year ended December 31, 2013 .
ITEM 14. Principal Accounting Fees and Services
The information required by this Item is incorporated by reference to our proxy statement for our 2014 Annual Meeting of Stockholders to be filed with the SEC within 120 days after the end of the year ended December 31, 2013 .
89
Table of Contents
PART IV
ITEM 15. Exhibits, Financial Statement Schedules
(a) The following documents are filed as exhibits to this report:
1. Financial Statements
The Index to Consolidated Financial Statements in Item 8 of this report is incorporated herein by reference as the list of financial statements required as part of this report.
2. Financial Statement Schedules
All financial statement schedules have been omitted, since the required information is not applicable or is not present in amounts sufficient to require submission of the schedule, or because the information required is included in the consolidated financial statements and notes thereto.
3. Exhibits: The following exhibits are filed as part of or furnished with this annual report on Form 10-K as applicable:
The exhibit list in the Exhibit Index is incorporated herein by reference as the list of exhibits required as part of this report.
90
Table of Contents
SIGNATURE
Pursuant to the requirements of the Securities Exchange Act of 1934, the registrant has duly caused this report to be signed on its behalf by the undersigned, thereunto duly authorized.
|
| Green Dot Corporation | ||
|
|
|
|
|
Date: | February 28, 2014 | By: |
| /s/ Steven W. Streit |
|
| Name: |
| Steven W. Streit |
|
| Title: |
| Chairman, President, Chief Executive Officer |
KNOW ALL PERSONS BY THESE PRESENTS that each individual whose signature appears below constitutes and appoints Steven W. Streit, John C. Ricci, and Grace T. Wang, and each of them, his or her true and lawful attorneys-in-fact and agents with full power of substitution, for him or her and in his or her name, place and stead, in any and all capacities, to sign any amendments to this Annual Report on Form 10-K and to file the same, with all exhibits thereto and other documents in connection therewith, with the Securities and Exchange Commission, granting unto said attorneys-in-fact and agents, and each of them, full power and authority to do and perform each and every act and thing requisite and necessary to be done in and about the premises, as fully to all intents and purposes as he or she might or could do in person, hereby ratifying and confirming all that said attorneys-in-fact and agents or any of them, or his, her or their substitute or substitutes, may lawfully do or cause to be done or by virtue hereof.
Pursuant to the requirements of the Securities Exchange Act of 1934, this report has been signed below by the following persons on behalf of the registrant in the capacities and on the dates indicated.
|
| Signature |
| Title |
| Date |
|
|
|
|
|
|
|
By: |
| /s/ Steven W. Streit |
| Chairman, President, and Chief Executive Officer (Principal Executive Officer) |
| February 28, 2014 |
Name: |
| Steven W. Streit |
|
|
| |
|
|
|
|
|
|
|
By: |
| /s/ Grace T. Wang |
| Chief Financial Officer (Principal Financial Officer and Principal Accounting Officer) |
| February 28, 2014 |
Name: |
| Grace T. Wang |
|
|
| |
|
|
|
|
|
|
|
By: |
| /s/ Kenneth C. Aldrich |
| Director |
| February 28, 2014 |
Name: |
| Kenneth C. Aldrich |
|
|
|
|
|
|
|
|
|
|
|
By: |
| /s/ Samuel Altman |
| Director |
| February 28, 2014 |
Name: |
| Samuel Altman |
|
|
|
|
|
|
|
|
|
|
|
By: |
| /s/ Mary J. Dent |
| Director |
| February 28, 2014 |
Name: |
| Mary J. Dent |
|
|
|
|
|
|
|
|
|
|
|
By: |
| /s/ Timothy R. Greenleaf |
| Director |
| February 28, 2014 |
Name: |
| Timothy R. Greenleaf |
|
|
|
|
|
|
|
|
|
|
|
By: |
| /s/ Ross E. Kendell |
| Director |
| February 28, 2014 |
Name: |
| Ross E. Kendell |
|
|
|
|
|
|
|
|
|
|
|
By: |
| /s/ Michael J. Moritz |
| Director |
| February 28, 2014 |
Name: |
| Michael J. Moritz |
|
|
|
|
|
|
|
|
|
|
|
By: |
| /s/ William H. Ott, Jr. |
| Director |
| February 28, 2014 |
Name: |
| William H. Ott, Jr. |
|
|
|
|
|
|
|
|
|
|
|
By: |
| /s/ George T. Shaheen |
| Director |
| February 28, 2014 |
Name: |
| George T. Shaheen |
|
|
|
|
91
Table of Contents
EXHIBIT INDEX
The following documents are filed as exhibits to this report:
|
|
|
| Incorporated by Reference |
|
| ||||
Exhibit Number |
| Exhibit Title |
| Form |
| Date |
| Number |
| Filed Herewith |
3.1 |
| Tenth Amended and Restated Certificate of Incorporation of the Registrant. |
| S-1(A2) |
| April 26, 2010 |
| 3.02 |
|
|
|
|
|
|
|
|
|
|
|
|
|
3.2 |
| Amended and Restated Bylaws of the Registrant. |
| S-1(A4) |
| June 29, 2010 |
| 3.04 |
|
|
|
|
|
|
|
|
|
|
|
|
|
3.3 |
| Certificate of Designations of Series A Convertible Junior Participating Non-Cumulative Perpetual Preferred Stock of Green Dot Corporation dated as of December 8, 2011. |
| 8-K |
| December 14, 2011 |
| 3.01 |
|
|
|
|
|
|
|
|
|
|
|
|
|
4.1 |
| Ninth Amended and Restated Registration Rights Agreement by and among the Registrant, certain stockholders and certain warrant holders of the Registrant. |
| S-1(A4) |
| June 29, 2010 |
| 4.01 |
|
|
|
|
|
|
|
|
|
|
|
|
|
4.2 |
| First Amendment to Ninth Amended and Restated Registration Rights Agreement by and among the Registrant, certain stockholders and certain warrant holders of the Registrant. |
| S-1(A7) |
| July 19, 2010 |
| 4.02 |
|
|
|
|
|
|
|
|
|
|
|
|
|
4.3 |
| Second Amendment to Ninth Amended and Restated Registration Rights Agreement , dated as of December 8, 2011, by and among the Registrant and certain stockholders of the Registrant . |
| 8-K |
| December 11, 2011 |
| 4.01 |
|
|
|
|
|
|
|
|
|
|
|
|
|
10.1 |
| Form of Indemnity Agreement. |
| S-1(A4) |
| June 29, 2010 |
| 10.01 |
|
|
|
|
|
|
|
|
|
|
|
|
|
10.2* |
| Second Amended and Restated 2001 Stock Plan and forms of notice of stock option grant, stock option agreement and stock option exercise letter. |
| S-1(A3) |
| June 2, 2010 |
| 10.02 |
|
|
|
|
|
|
|
|
|
|
|
|
|
10.3* |
| 2010 Equity Incentive Plan and forms of notice of stock option grant, stock option award agreement, notice of restricted stock award, restricted stock agreement, notice of stock bonus award, stock bonus award agreement, notice of stock appreciation right award, stock appreciation right award agreement, notice of restricted stock unit award, restricted stock unit award agreement, notice of performance shares award and performance shares agreement. |
| S-1(A4) |
| June 29, 2010 |
| 10.03 |
|
|
|
|
|
|
|
|
|
|
|
|
|
10.4* |
| 2010 Employee Stock Purchase Plan. |
| S-1(A4) |
| June 29, 2010 |
| 10.19 |
|
|
|
|
|
|
|
|
|
|
|
|
|
10.5 |
| Lease Agreement between the Registrant and Wells REIT II - Pasadena Corporate Park L.P., dated December 5, 2011 |
| 10-K |
| February 29, 2012 |
| 10.8 |
|
|
|
|
|
|
|
|
|
|
|
|
|
10.6† |
| Amended and Restated Prepaid Card Program Agreement, dated as of May 27, 2010, by and among the Registrant, Wal-Mart Stores, Inc., Wal-Mart Stores Texas, L.P., Wal-Mart Louisiana, LLC, Wal-Mart Stores East, L.P., Wal-Mart Stores, L.P. and GE Money Bank. |
| S-1(A6) |
| July 13, 2010 |
| 10.05 |
|
|
|
|
|
|
|
|
|
|
|
|
|
10.7† |
| First Amendment To Walmart MoneyCard Program Agreement dated as of January 12, 2012, by and among the Registrant, Walmart Stores Texas L.P., Wal-Mart Louisiana, LLC, Wal-Mart Stores Arkansas, LLC, Wal-Mart Stores East, L.P., Wal-Mart Stores, Inc., and GE Capital Retail Bank. |
| 10-K |
| February 29, 2012 |
| 10.10 |
|
|
|
|
|
|
|
|
|
|
|
|
|
10.8† |
| Amendment To the Walmart MoneyCard Program Agreement, dated as of August 31, 2012, by and among the Registrant, Wal-Mart Stores, Inc., Wal-Mart Stores Texas, L.P., Wal-Mart Louisiana, LLC, Wal-Mart Stores Arkansas, LLC, Wal-Mart Stores East, L.P., and GE Capital Retail Bank. |
| 10-Q |
| November 9, 2012 |
| 10.2 |
|
|
Table of Contents
|
|
|
| Incorporated by Reference |
|
| ||||
Exhibit Number |
| Exhibit Title |
| Form |
| Date |
| Number |
| Filed Herewith |
10.9 |
| Agreement to Purchase Assets and Assume Liabilities from GE Retail Bank, dated as of June 7, 2013, by and between Green Dot Bank, the subsidiary bank of Green Dot Corporation, and GE Capital Retail Bank |
| 8-K |
| June 10, 2013 |
| 10.01 |
|
|
|
|
|
|
|
|
|
|
|
|
|
10.10†† |
| Amendment to Walmart MoneyCard Program Agreement dated as of May 27, 2010, as amended as of March 14, 2013, by and among Green Dot Corporation and Wal-Mart Stores, Inc., Wal-Mart Stores Texas L.P., Wal-Mart Louisiana, LLC, Wal-Mart Stores Arkansas, LLC, and Wal-Mart Stores East, L.P. and GE Capital Retail Bank |
| 10-Q |
| August 9, 2013 |
| 10.2 |
|
|
|
|
|
|
|
|
|
|
|
|
|
10.11†† |
| Additional Product Amendment to Walmart MoneyCard Program Agreement dated as of May 27, 2010, as amended, by and among Green Dot Corporation and Wal-Mart Stores, Inc., Walmart Stores Texas L.P., Wal-Mart Louisiana, LLC, Wal-Mart Stores Arkansas, LLC, and Wal-Mart Stores East, L.P., and GE Capital Retail Bank. |
| 10-Q |
| February 28, 2014 |
| 10.3 |
|
|
|
|
|
|
|
|
|
|
|
|
|
10.12† |
| Card Program Services Agreement, dated as of October 27, 2006, by and between the Registrant and GE Money Bank, as amended. |
| S-1(A6) |
| July 13, 2010 |
| 10.06 |
|
|
|
|
|
|
|
|
|
|
|
|
|
10.13† |
| Agreement for Services, dated as of September 1, 2009, by and between the Registrant and Total System Services, Inc. |
| S-1(A6) |
| July 13, 2010 |
| 10.08 |
|
|
|
|
|
|
|
|
|
|
|
|
|
10.14† |
| Material Terms Amendment to Agreement for Services, dated as of January 19, 2012, by and between the Registrant and Total System Services, Inc. |
| 10-K |
| February 29, 2012 |
| 10.14 |
|
|
|
|
|
|
|
|
|
|
|
|
|
10.15† |
| Second Material Terms Amendment to Agreement for Services, dated as of February 20, 2013, by and between the Registrant and Total System Services, Inc. |
| 10-K (A1) |
| August 9, 2013 |
| 10.12 |
|
|
|
|
|
|
|
|
|
|
|
|
|
10.16† |
| Master Services Agreement, dated as of May 28, 2009, by and between the Registrant and Genpact International, Inc. |
| S-1(A6) |
| July 13, 2010 |
| 10.09 |
|
|
|
|
|
|
|
|
|
|
|
|
|
10.17 |
| Amendment No. 1 to Master Services Agreement, dated as of November 3, 2010, by and between the Registrant and Genpact International, Inc. |
| 10-K |
| February 28, 2011 |
| 10.11 |
|
|
|
|
|
|
|
|
|
|
|
|
|
10.18* |
| Form of Executive Severance Agreement. |
| S-1(A2) |
| April 26, 2010 |
| 10.12 |
|
|
|
|
|
|
|
|
|
|
|
|
|
10.19* |
| 2013 Executive Officer Incentive Bonus Plan |
| 10-Q |
| May 9, 2013 |
| 10.4 |
|
|
|
|
|
|
|
|
|
|
|
|
|
10.20* |
| 2014 Executive Officer Incentive Bonus Plan |
|
|
|
|
|
|
| X |
|
|
|
|
|
|
|
|
|
|
|
10.21 |
| Warrant to purchase shares of common stock of the Registrant. |
| S-1(A6) |
| July 13, 2010 |
| 10.15 |
|
|
|
|
|
|
|
|
|
|
|
|
|
10.22 |
| Amendment No.1 to Warrant to purchase shares of common stock of the Registrant. |
| 10-K |
| February 29, 2012 |
| 10.24 |
|
|
|
|
|
|
|
|
|
|
|
|
|
10.23 |
| Class A Common Stock Issuance Agreement, dated as of May 27, 2010, between the Registrant and Wal-Mart Stores, Inc. |
| S-1(A6) |
| July 13, 2010 |
| 10.17 |
|
|
|
|
|
|
|
|
|
|
|
|
|
10.24 |
| Voting Agreement, dated as of May 27, 2010, between the Registrant and Wal-Mart Stores, Inc. |
| S-1(A4) |
| June 29, 2010 |
| 10.18 |
|
|
|
|
|
|
|
|
|
|
|
|
|
10.25* |
| Offer letter to Samuel Altman from the Registrant, dated March 5, 2012. |
| 10-Q |
| May 9, 2013 |
| 10.2 |
|
|
|
|
|
|
|
|
|
|
|
|
|
10.26* |
| Retention Agreement, dated as of March 8, 2012, by and between the registrant and Samuel Altman. |
| 10-Q |
| May 9, 2013 |
| 10.3 |
|
|
|
|
|
|
|
|
|
|
|
|
|
10.27* |
| Offer letter to Grace Wang from the Registrant, dated August 27, 2013. |
| 10-Q |
| November 11, 2013 |
| 10.1 |
|
|
Table of Contents
|
|
|
| Incorporated by Reference |
|
| ||||
Exhibit Number |
| Exhibit Title |
| Form |
| Date |
| Number |
| Filed Herewith |
23.1 |
| Consent of Ernst & Young LLP, independent registered public accounting firm. |
|
|
|
|
|
|
| X |
|
|
|
|
|
|
|
|
|
|
|
24.1 |
| Power of Attorney (included on the signature page of this Annual Report on Form 10-K). |
|
|
|
|
|
|
| X |
|
|
|
|
|
|
|
|
|
|
|
31.1 |
| Certification of Steven W. Streit, Chief Executive Officer and Chairman of the Board of Directors, pursuant to Rule 13a-14(a)/15d-14(a), as adopted pursuant to Section 302 of the Sarbanes-Oxley Act of 2002. |
|
|
|
|
|
|
| X |
|
|
|
|
|
|
|
|
|
|
|
31.2 |
| Certification of Grace T. Wang, Chief Financial Officer, pursuant to Rule 13a-14(a)/15d-14(a), as adopted pursuant to Section 302 of the Sarbanes-Oxley Act of 2002. |
|
|
|
|
|
|
| X |
|
|
|
|
|
|
|
|
|
|
|
32.1 |
| Certification of Steven W. Streit, Chief Executive Officer and Chairman of the Board of Directors, pursuant to 18 U.S.C. Section 1350, as adopted pursuant to Section 906 of the Sarbanes-Oxley Act of 2002. |
|
|
|
|
|
|
| X |
|
|
|
|
|
|
|
|
|
|
|
32.2 |
| Certification of Grace T. Wang, Chief Financial Officer, pursuant to 18 U.S.C. Section 1350, as adopted pursuant to Section 906 of the Sarbanes-Oxley Act of 2002. |
|
|
|
|
|
|
| X |
|
|
|
|
|
|
|
|
|
|
|
101.INS |
| XBRL Instance Document** |
|
|
|
|
|
|
| X |
|
|
|
|
|
|
|
|
|
|
|
101.SCH |
| XBRL Taxonomy Extension Schema Document** |
|
|
|
|
|
|
| X |
|
|
|
|
|
|
|
|
|
|
|
101.CAL |
| XBRL Taxonomy Extension Calculation Linkbase Document** |
|
|
|
|
|
|
| X |
|
|
|
|
|
|
|
|
|
|
|
101.DEF |
| XBRL Taxonomy Extension Definition Linkbase Document** |
|
|
|
|
|
|
| X |
|
|
|
|
|
|
|
|
|
|
|
101.LAB |
| XBRL Taxonomy Extension Label Linkbase Document** |
|
|
|
|
|
|
| X |
|
|
|
|
|
|
|
|
|
|
|
101.PRE |
| XBRL Taxonomy Extension Presentation Linkbase Document** |
|
|
|
|
|
|
| X |
* | Indicates management contract or compensatory plan or arrangement. |
** | Pursuant to Rule 406T of Regulation S-T, the Interactive Data Files on Exhibit 101 hereto are deemed not filed or part of a registration statement or prospectus for purposes of Sections 11 or 12 of the Securities Act of 1933, as amended ("Securities Act"), are deemed not filed for purposes of Section 18 of the Securities and Exchange Act of 1934, as amended ("Exchange Act"), and otherwise are not subject to liability under those sections. The Interactive Data File will be filed by amendment to this Form 10-K within 30 days of the filing date of this Form 10-K, as permitted by Rule 405(a)(2)(ii) of Regulation S-T. |
† | Registrant has omitted portions of the referenced exhibit and filed such exhibit separately with the Securities and Exchange Commission pursuant to a grant of confidential treatment under Rule 406 or Rule 24b-2 promulgated under the Securities Act or Rule 24b-2 promulgated under the Exchange Act. |
†† | Confidential treatment has been requested with regard to certain portions of this document. Such portions were filed separately with the Commission. |