UNITED STATES
SECURITIES AND EXCHANGE COMMISSION
Washington, D.C. 20549
FORM 10-Q
(Mark One)
☒ | QUARTERLY REPORT PURSUANT TO SECTION 13 OR 15(d) OF THE SECURITIES EXCHANGE ACT OF 1934 |
FOR THE QUARTERLY PERIOD ENDED November 30, 2017
OR
☐ | TRANSITION REPORT PURSUANT TO SECTION 13 OR 15(d) OF THE SECURITIES EXCHANGE ACT OF 1934 |
FOR THE TRANSITION PERIOD FROM TO
Commission File Number: 1-15829
FEDEX CORPORATION
(Exact name of registrant as specified in its charter)
Delaware | 62-1721435 |
(State or other jurisdiction of incorporation or organization) | (I.R.S. Employer Identification No.) |
|
|
942 South Shady Grove Road Memphis, Tennessee | 38120 |
(Address of principal executive offices) | (ZIP Code) |
(901) 818-7500
(Registrant's telephone number, including area code)
Indicate by check mark whether the registrant (1) has filed all reports required to be filed by Section 13 or 15(d) of the Securities Exchange Act of 1934 during the preceding 12 months (or for such shorter period that the registrant was required to file such reports), and (2) has been subject to such filing requirements for the past 90 days. Yes ☒ No ☐
Indicate by check mark whether the registrant has submitted electronically and posted on its corporate website, if any, every Interactive Data File required to be submitted and posted pursuant to Rule 405 of Regulation S-T (§ 232.405 of this chapter) during the preceding 12 months (or for such shorter period that the registrant was required to submit and post such files). Yes ☒ No ☐
Indicate by check mark whether the registrant is a large accelerated filer, an accelerated filer, a non-accelerated filer, smaller reporting company, or an emerging growth company. See the definitions of "large accelerated filer," "accelerated filer," "smaller reporting company," and "emerging growth company" in Rule 12b-2 of the Exchange Act.
Large accelerated filer ☑ | Accelerated filer ☐ | Non-accelerated filer ☐ | Smaller reporting company ☐ | Emerging growth company ☐ |
|
| (Do not check if a smaller reporting company) |
|
|
If an emerging growth company, indicate by check mark if the registrant has elected not to use the extended transition period for complying with any new or revised financial accounting standards provided pursuant to Section 13(a) of the Exchange Act. ☐
Indicate by check mark whether the registrant is a shell company (as defined in Rule 12b-2 of the Exchange Act). Yes ☐ No ☒
Indicate the number of shares outstanding of each of the issuer's classes of common stock, as of the latest practicable date.
Common Stock |
| Outstanding Shares at December 18, 2017 |
Common Stock, par value $0.10 per share |
| 267,889,623 |
FEDEX CORPORATION
INDEX
|
| PAGE |
|
|
|
PART I. FINANCIAL INFORMATION |
|
|
|
|
|
ITEM 1. Financial Statements |
|
|
Condensed Consolidated Balance Sheets |
| 3 |
Condensed Consolidated Statements of Income |
| 5 |
Condensed Consolidated Statements of Comprehensive Income |
| 6 |
Condensed Consolidated Statements of Cash Flows |
| 7 |
Notes to Condensed Consolidated Financial Statements |
| 8 |
Report of Independent Registered Public Accounting Firm |
| 26 |
ITEM 2. Management's Discussion and Analysis of Results of Operations and Financial Condition |
| 27 |
ITEM 3. Quantitative and Qualitative Disclosures About Market Risk |
| 49 |
ITEM 4. Controls and Procedures |
| 49 |
|
|
|
PART II. OTHER INFORMATION |
|
|
|
|
|
ITEM 1. Legal Proceedings |
| 50 |
ITEM 1A. Risk Factors |
| 50 |
ITEM 2. Unregistered Sales of Equity Securities and Use of Proceeds |
| 51 |
ITEM 6. Exhibits |
| 52 |
Signature |
| 53 |
Exhibit Index |
| E-1 |
|
|
|
Exhibit 10.1 |
|
|
Exhibit 10.2 |
|
|
Exhibit 10.3 |
|
|
Exhibit 10.4 |
|
|
Exhibit 10.5 |
|
|
Exhibit 10.6 |
|
|
Exhibit 10.7 |
|
|
Exhibit 10.8 |
|
|
Exhibit 10.9 |
|
|
Exhibit 10.10 |
|
|
Exhibit 10.11 |
|
|
Exhibit 10.12 |
|
|
Exhibit 12.1 |
|
|
Exhibit 15.1 |
|
|
Exhibit 31.1 |
|
|
Exhibit 31.2 |
|
|
Exhibit 32.1 |
|
|
Exhibit 32.2 |
|
|
Exhibit 101.1 Interactive Data Files |
|
|
- 2 -
FEDEX CORPORATION
CONDENSED CONSOLIDATED BALANCE SHEETS
(IN MILLIONS)
|
| November 30, 2017 (Unaudited) |
|
| May 31, 2017 |
| ||
ASSETS |
|
|
|
|
|
|
|
|
CURRENT ASSETS |
|
|
|
|
|
|
|
|
Cash and cash equivalents |
| $ | 2,768 |
|
| $ | 3,969 |
|
Receivables, less allowances of $353 and $252 |
|
| 8,655 |
|
|
| 7,599 |
|
Spare parts, supplies and fuel, less allowances of $248 and $237 |
|
| 533 |
|
|
| 514 |
|
Prepaid expenses and other |
|
| 925 |
|
|
| 546 |
|
Total current assets |
|
| 12,881 |
|
|
| 12,628 |
|
PROPERTY AND EQUIPMENT, AT COST |
|
| 53,240 |
|
|
| 50,626 |
|
Less accumulated depreciation and amortization |
|
| 25,950 |
|
|
| 24,645 |
|
Net property and equipment |
|
| 27,290 |
|
|
| 25,981 |
|
OTHER LONG-TERM ASSETS |
|
|
|
|
|
|
|
|
Goodwill |
|
| 7,325 |
|
|
| 7,154 |
|
Other assets |
|
| 2,785 |
|
|
| 2,789 |
|
Total other long-term assets |
|
| 10,110 |
|
|
| 9,943 |
|
|
| $ | 50,281 |
|
| $ | 48,552 |
|
The accompanying notes are an integral part of these condensed consolidated financial statements.
- 3 -
FEDEX CORPORATION
CONDENSED CONSOLIDATED BALANCE SHEETS
(IN MILLIONS, EXCEPT SHARE DATA)
|
| November 30, 2017 (Unaudited) |
|
| May 31, 2017 |
| ||
LIABILITIES AND STOCKHOLDERS' INVESTMENT |
|
|
|
|
|
|
|
|
CURRENT LIABILITIES |
|
|
|
|
|
|
|
|
Short-term borrowings |
| $ | 250 |
|
| $ | - |
|
Current portion of long-term debt |
|
| 11 |
|
|
| 22 |
|
Accrued salaries and employee benefits |
|
| 1,912 |
|
|
| 1,914 |
|
Accounts payable |
|
| 3,147 |
|
|
| 2,752 |
|
Accrued expenses |
|
| 2,907 |
|
|
| 3,230 |
|
Total current liabilities |
|
| 8,227 |
|
|
| 7,918 |
|
LONG-TERM DEBT, LESS CURRENT PORTION |
|
| 15,180 |
|
|
| 14,909 |
|
OTHER LONG-TERM LIABILITIES |
|
|
|
|
|
|
|
|
Deferred income taxes |
|
| 3,088 |
|
|
| 2,485 |
|
Pension, postretirement healthcare and other benefit obligations |
|
| 3,868 |
|
|
| 4,487 |
|
Self-insurance accruals |
|
| 1,651 |
|
|
| 1,494 |
|
Deferred lease obligations |
|
| 633 |
|
|
| 531 |
|
Deferred gains, principally related to aircraft transactions |
|
| 122 |
|
|
| 137 |
|
Other liabilities |
|
| 457 |
|
|
| 518 |
|
Total other long-term liabilities |
|
| 9,819 |
|
|
| 9,652 |
|
COMMITMENTS AND CONTINGENCIES |
|
|
|
|
|
|
|
|
COMMON STOCKHOLDERS' INVESTMENT |
|
|
|
|
|
|
|
|
Common stock, $0.10 par value; 800 million shares authorized; 318 million shares issued as of November 30, 2017 and May 31, 2017 |
|
| 32 |
|
|
| 32 |
|
Additional paid-in capital |
|
| 3,055 |
|
|
| 3,005 |
|
Retained earnings |
|
| 21,785 |
|
|
| 20,833 |
|
Accumulated other comprehensive loss |
|
| (434 | ) |
|
| (415 | ) |
Treasury stock, at cost |
|
| (7,383 | ) |
|
| (7,382 | ) |
Total common stockholders' investment |
|
| 17,055 |
|
|
| 16,073 |
|
|
| $ | 50,281 |
|
| $ | 48,552 |
|
The accompanying notes are an integral part of these condensed consolidated financial statements.
- 4 -
FEDEX CORPORATION
CONDENSED CONSOLIDATED STATEMENTS OF INCOME
(UNAUDITED)
(IN MILLIONS, EXCEPT PER SHARE AMOUNTS)
|
| Three Months Ended |
|
| Six Months Ended |
| ||||||||||
|
| November 30, |
|
| November 30, |
| ||||||||||
|
| 2017 |
|
| 2016 |
|
| 2017 |
|
| 2016 |
| ||||
REVENUES |
| $ | 16,313 |
|
| $ | 14,931 |
|
| $ | 31,610 |
|
| $ | 29,594 |
|
OPERATING EXPENSES: |
|
|
|
|
|
|
|
|
|
|
|
|
|
|
|
|
Salaries and employee benefits |
|
| 5,742 |
|
|
| 5,353 |
|
|
| 11,260 |
|
|
| 10,664 |
|
Purchased transportation |
|
| 3,840 |
|
|
| 3,431 |
|
|
| 7,285 |
|
|
| 6,671 |
|
Rentals and landing fees |
|
| 835 |
|
|
| 802 |
|
|
| 1,653 |
|
|
| 1,592 |
|
Depreciation and amortization |
|
| 756 |
|
|
| 740 |
|
|
| 1,507 |
|
|
| 1,479 |
|
Fuel |
|
| 818 |
|
|
| 658 |
|
|
| 1,521 |
|
|
| 1,308 |
|
Maintenance and repairs |
|
| 665 |
|
|
| 579 |
|
|
| 1,340 |
|
|
| 1,177 |
|
Other |
|
| 2,395 |
|
|
| 2,201 |
|
|
| 4,665 |
|
|
| 4,272 |
|
|
|
| 15,051 |
|
|
| 13,764 |
|
|
| 29,231 |
|
|
| 27,163 |
|
OPERATING INCOME |
|
| 1,262 |
|
|
| 1,167 |
|
|
| 2,379 |
|
|
| 2,431 |
|
OTHER INCOME (EXPENSE): |
|
|
|
|
|
|
|
|
|
|
|
|
|
|
|
|
Interest, net |
|
| (124 | ) |
|
| (119 | ) |
|
| (238 | ) |
|
| (232 | ) |
Other, net |
|
| 1 |
|
|
| 30 |
|
|
| (20 | ) |
|
| 21 |
|
|
|
| (123 | ) |
|
| (89 | ) |
|
| (258 | ) |
|
| (211 | ) |
INCOME BEFORE INCOME TAXES |
|
| 1,139 |
|
|
| 1,078 |
|
|
| 2,121 |
|
|
| 2,220 |
|
PROVISION FOR INCOME TAXES |
|
| 364 |
|
|
| 378 |
|
|
| 750 |
|
|
| 805 |
|
NET INCOME |
| $ | 775 |
|
| $ | 700 |
|
| $ | 1,371 |
|
| $ | 1,415 |
|
EARNINGS PER COMMON SHARE: |
|
|
|
|
|
|
|
|
|
|
|
|
|
|
|
|
Basic |
| $ | 2.89 |
|
| $ | 2.63 |
|
| $ | 5.12 |
|
| $ | 5.32 |
|
Diluted |
| $ | 2.84 |
|
| $ | 2.59 |
|
| $ | 5.03 |
|
| $ | 5.24 |
|
DIVIDENDS DECLARED PER COMMON SHARE |
| $ | 0.50 |
|
| $ | 0.40 |
|
| $ | 1.50 |
|
| $ | 1.20 |
|
The accompanying notes are an integral part of these condensed consolidated financial statements.
- 5 -
FEDEX CORPORATION
CONDENSED CONSOLIDATED STATEMENTS OF COMPREHENSIVE INCOME
(UNAUDITED)
(IN MILLIONS)
|
| Three Months Ended |
|
| Six Months Ended |
| ||||||||||
|
| November 30, |
|
| November 30, |
| ||||||||||
|
| 2017 |
|
| 2016 |
|
| 2017 |
|
| 2016 |
| ||||
NET INCOME |
| $ | 775 |
|
| $ | 700 |
|
| $ | 1,371 |
|
| $ | 1,415 |
|
OTHER COMPREHENSIVE INCOME (LOSS): |
|
|
|
|
|
|
|
|
|
|
|
|
|
|
|
|
Foreign currency translation adjustments, net of tax of $7, $21, $18, and $16 |
|
| (90 | ) |
|
| (230 | ) |
|
| 19 |
|
|
| (218 | ) |
Amortization of prior service credit, net of tax of $11, $11, $22, and $22 |
|
| (19 | ) |
|
| (19 | ) |
|
| (38 | ) |
|
| (38 | ) |
|
|
| (109 | ) |
|
| (249 | ) |
|
| (19 | ) |
|
| (256 | ) |
COMPREHENSIVE INCOME |
| $ | 666 |
|
| $ | 451 |
|
| $ | 1,352 |
|
| $ | 1,159 |
|
The accompanying notes are an integral part of these condensed consolidated financial statements.
- 6 -
FEDEX CORPORATION
CONDENSED CONSOLIDATED STATEMENTS OF CASH FLOWS
(UNAUDITED)
(IN MILLIONS)
|
| Six Months Ended |
| |||||
|
| November 30, |
| |||||
|
| 2017 |
|
| 2016 |
| ||
Operating Activities: |
|
|
|
|
|
|
|
|
Net income |
| $ | 1,371 |
|
| $ | 1,415 |
|
Adjustments to reconcile net income to cash provided by operating activities: |
|
|
|
|
|
|
|
|
Depreciation and amortization |
|
| 1,507 |
|
|
| 1,479 |
|
Provision for uncollectible accounts |
|
| 116 |
|
|
| 76 |
|
Stock-based compensation |
|
| 103 |
|
|
| 93 |
|
Deferred income taxes and other noncash items |
|
| 327 |
|
|
| 320 |
|
Gain from sale of investment |
|
| - |
|
|
| (35 | ) |
Changes in assets and liabilities: |
|
|
|
|
|
|
|
|
Receivables |
|
| (983 | ) |
|
| (513 | ) |
Other assets |
|
| (338 | ) |
|
| (250 | ) |
Accounts payable and other liabilities |
|
| (564 | ) |
|
| 67 |
|
Other, net |
|
| (41 | ) |
|
| (17 | ) |
Cash provided by operating activities |
|
| 1,498 |
|
|
| 2,635 |
|
Investing Activities: |
|
|
|
|
|
|
|
|
Capital expenditures |
|
| (2,621 | ) |
|
| (2,681 | ) |
Business acquisitions, net of cash acquired |
|
| (44 | ) |
|
| - |
|
Proceeds from asset dispositions and other |
|
| 12 |
|
|
| 100 |
|
Cash used in investing activities |
|
| (2,653 | ) |
|
| (2,581 | ) |
Financing Activities: |
|
|
|
|
|
|
|
|
Proceeds from short-term borrowings |
|
| 250 |
|
|
| - |
|
Principal payments on debt |
|
| (28 | ) |
|
| (43 | ) |
Proceeds from stock issuances |
|
| 205 |
|
|
| 164 |
|
Dividends paid |
|
| (268 | ) |
|
| (213 | ) |
Purchase of treasury stock |
|
| (270 | ) |
|
| (334 | ) |
Other, net |
|
| 3 |
|
|
| (5 | ) |
Cash used in financing activities |
|
| (108 | ) |
|
| (431 | ) |
Effect of exchange rate changes on cash |
|
| 62 |
|
|
| (98 | ) |
Net decrease in cash and cash equivalents |
|
| (1,201 | ) |
|
| (475 | ) |
Cash and cash equivalents at beginning of period |
|
| 3,969 |
|
|
| 3,534 |
|
Cash and cash equivalents at end of period |
| $ | 2,768 |
|
| $ | 3,059 |
|
The accompanying notes are an integral part of these condensed consolidated financial statements.
- 7 -
FEDEX CORPORATION
NOTES TO CONDENSED CONSOLIDATED FINANCIAL STATEMENTS
(UNAUDITED)
(1) General
SUMMARY OF SIGNIFICANT ACCOUNTING POLICIES. These interim financial statements of FedEx Corporation ("FedEx") have been prepared in accordance with accounting principles generally accepted in the United States and Securities and Exchange Commission ("SEC") instructions for interim financial information, and should be read in conjunction with our Annual Report on Form 10-K for the year ended May 31, 2017 ("Annual Report"). Accordingly, significant accounting policies and other disclosures normally provided have been omitted since such items are disclosed in our Annual Report.
In the opinion of management, the accompanying unaudited condensed consolidated financial statements reflect all adjustments (including normal recurring adjustments) necessary to present fairly our financial position as of November 30, 2017, the results of our operations for the three- and six-month periods ended November 30, 2017 and 2016, and cash flows for the six-month periods ended November 30, 2017 and 2016. Operating results for the three- and six-month periods ended November 30, 2017 are not necessarily indicative of the results that may be expected for the year ending May 31, 2018.
Except as otherwise specified, references to years indicate our fiscal year ending May 31, 2018 or ended May 31 of the year referenced and comparisons are to the corresponding period of the prior year.
BUSINESS ACQUISITION. On October 13, 2017, FedEx acquired Northwest Research, Inc., a leader in inventory research and management, for $50 million in cash from operations. The majority of the purchase price was allocated to property, plant and equipment. The financial results of this acquired business are included in the FedEx Corporate Services, Inc. ("FedEx Services") segment from the date of acquisition and were not material to our results of operations. Therefore, pro forma financial information has not been provided.
EMPLOYEES UNDER COLLECTIVE BARGAINING ARRANGEMENTS. The pilots of Federal Express Corporation ("FedEx Express"), who represent a small number of its total employees, are employed under a collective bargaining agreement that took effect on November 2, 2015. This collective bargaining agreement is scheduled to become amendable in November 2021, after a six-year term. In addition to our pilots at FedEx Express, FedEx Supply Chain Distribution System, Inc. ("FedEx Supply Chain") has a small number of employees who are members of unions, and certain non-U.S. employees are unionized.
STOCK-BASED COMPENSATION. We have two types of equity-based compensation: stock options and restricted stock. The key terms of the stock option and restricted stock awards granted under our incentive stock plans and all financial disclosures about these programs are set forth in our Annual Report.
Our stock-based compensation expense was $41 million for the three-month period ended November 30, 2017 and $103 million for the six-month period ended November 30, 2017. Our stock-based compensation expense was $36 million for the three-month period ended November 30, 2016 and $93 million for the six-month period ended November 30, 2016. Due to its immateriality, additional disclosures related to stock-based compensation have been excluded from this quarterly report.
RECENT ACCOUNTING GUIDANCE. New accounting rules and disclosure requirements can significantly impact our reported results and the comparability of our financial statements. We believe the following new accounting guidance is relevant to the readers of our financial statements.
During the first quarter of 2018, we early adopted the Accounting Standards Update issued by the Financial Accounting Standards Board ("FASB") related to Intra-Entity Transfers of Assets Other Than Inventory. This update requires companies to recognize the income tax consequences of intra-entity transfers of assets other than inventory when the transfer occurs, as opposed to when the assets are ultimately sold to an outside party. This new guidance had a minimal impact on our accounting and financial reporting for the second quarter and first half of 2018.
- 8 -
On May 28, 2014, the FASB and International Accounting Standards Board issued a new accounting standard that will supersede virtually all existing revenue recognition guidance under generally accepted accounting principles in the United States. This standard will be effective for us beginning June 1, 2018 (fis cal 2019). The fundamental principles of the new guidance are that companies should recognize revenue in a manner that reflects the timing of the transfer of services to customers and the amount of revenue recognized reflects the consideration that a compa ny expects to receive for the goods and services provided. The new guidance establishes a five-step approach for the recognition of revenue. We are continuing to complete the assessment of the impact this new standard will have on our consolidated financia l statements and related disclosures, including ongoing contract reviews. We do not anticipate that the new guidance will have a material impact on our revenue recognition policies, practices or systems.
On February 25, 2016, the FASB issued a new lease accounting standard which requires lessees to put most leases on their balance sheets but recognize the expenses in their income statements in a manner similar to current practice. The new standard states that a lessee will recognize a lease liability for the obligation to make lease payments and a right-of-use asset for the right to use the underlying asset for the lease term. Expenses related to leases determined to be operating leases will be recognized on a straight-line basis, while those determined to be financing leases will be recognized following a front-loaded expense profile in which interest and amortization are presented separately in the income statement. Based on our lease portfolio, we currently anticipate recognizing a lease liability and related right-of-use asset on the balance sheet in excess of $13 billion with an immaterial impact on our income statement compared to the current lease accounting model. However, the ultimate impact of the standard will depend on the company's lease portfolio as of the adoption date. We are currently in the process of evaluating our existing lease portfolios, including accumulating all of the necessary information required to properly account for the leases under the new standard. Additionally, we are implementing an enterprise-wide lease management system to assist in the accounting and are evaluating additional changes to our processes and internal controls to ensure we meet the standard's reporting and disclosure requirements. These changes will be effective for our fiscal year beginning June 1, 2019 (fiscal 2020), with a modified retrospective adoption method to the beginning of 2018.
In March 2017, the FASB issued an Accounting Standards Update that changes how employers that sponsor defined benefit pension or other postretirement benefit plans present the net periodic benefit cost in the income statement. This new guidance requires entities to report the service cost component in the same line item or items as other compensation costs. The other components of net benefit cost are required to be presented in the income statement separately from the service cost component outside of income from operations. This standard will impact our operating income but will have no impact on our net income or earnings per share. For example, adoption of this guidance would have reduced operating income by $146 million in the second quarter and $292 million in the first half of 2018, and by $112 million in the second quarter and $224 million in the first half of 2017, but would not have impacted our net income in these periods. This new guidance will be effective for our fiscal year beginning June 1, 2018 (fiscal 2019) and will be applied retrospectively.
TREASURY SHARES. In January 2016, our Board of Directors authorized a share repurchase program of up to 25 million shares. Shares under the current repurchase program may be repurchased from time to time in the open market or in privately negotiated transactions. The timing and volume of repurchases are at the discretion of management, based on the capital needs of the business, the market price of FedEx common stock and general market conditions. No time limit was set for the completion of the program, and the program may be suspended or discontinued at any time.
During the second quarter of 2018, we repurchased 0.8 million shares of FedEx common stock at an average price of $220.67 per share for a total of $184 million. During the first half of 2018, we repurchased 1.2 million shares of FedEx common stock at an average price of $216.45 per share for a total of $270 million. As of November 30, 2017, 14.8 million shares remained under the share repurchase authorization.
DIVIDENDS DECLARED PER COMMON SHARE. On November 17, 2017, our Board of Directors declared a quarterly dividend of $0.50 per share of common stock. The dividend will be paid on January 2, 2018 to stockholders of record as of the close of business on December 11, 2017. Each quarterly dividend payment is subject to review and approval by our Board of Directors, and we evaluate our dividend payment amount on an annual basis at the end of each fiscal year.
- 9 -
(2) Accumulated Other Comprehensive Income (Loss)
The following table provides changes in accumulated other comprehensive income (loss) ("AOCI"), net of tax, reported in our unaudited condensed consolidated financial statements for the periods ended November 30 (in millions; amounts in parentheses indicate debits to AOCI):
|
| Three Months Ended |
|
| Six Months Ended |
| ||||||||||
|
| 2017 |
|
| 2016 |
|
| 2017 |
|
| 2016 |
| ||||
Foreign currency translation loss: |
|
|
|
|
|
|
|
|
|
|
|
|
|
|
|
|
Balance at beginning of period |
| $ | (576 | ) |
| $ | (502 | ) |
| $ | (685 | ) |
| $ | (514 | ) |
Translation adjustments |
|
| (90 | ) |
|
| (230 | ) |
|
| 19 |
|
|
| (218 | ) |
Balance at end of period |
|
| (666 | ) |
|
| (732 | ) |
|
| (666 | ) |
|
| (732 | ) |
Retirement plans adjustments: |
|
|
|
|
|
|
|
|
|
|
|
|
|
|
|
|
Balance at beginning of period |
|
| 251 |
|
|
| 326 |
|
|
| 270 |
|
|
| 345 |
|
Reclassifications from AOCI |
|
| (19 | ) |
|
| (19 | ) |
|
| (38 | ) |
|
| (38 | ) |
Balance at end of period |
|
| 232 |
|
|
| 307 |
|
|
| 232 |
|
|
| 307 |
|
Accumulated other comprehensive (loss) at end of period |
| $ | (434 | ) |
| $ | (425 | ) |
| $ | (434 | ) |
| $ | (425 | ) |
The following table presents details of the reclassifications from AOCI for the periods ended November 30 (in millions; amounts in parentheses indicate debits to earnings):
|
| Amount Reclassified from AOCI |
|
| Affected Line Item in the Income Statement | |||||||||||||
|
| Three Months Ended |
|
| Six Months Ended |
|
|
| ||||||||||
|
| 2017 |
|
| 2016 |
|
| 2017 |
|
| 2016 |
|
|
| ||||
Amortization of retirement plans prior service credits, before tax |
| $ | 30 |
|
| $ | 30 |
|
| $ | 60 |
|
| $ | 60 |
|
| Salaries and employee benefits |
Income tax benefit |
|
| (11 | ) |
|
| (11 | ) |
|
| (22 | ) |
|
| (22 | ) |
| Provision for income taxes |
AOCI reclassifications, net of tax |
| $ | 19 |
|
| $ | 19 |
|
| $ | 38 |
|
| $ | 38 |
|
| Net income |
(3) Financing Arrangements
We have a shelf registration statement with the SEC that allows us to sell, in one or more future offerings, any combination of our unsecured debt securities and common stock.
We have a five-year $1.75 billion revolving credit facility that expires in November 2020. The facility, which includes a $500 million letter of credit sublimit, is available to finance our operations and other cash flow needs. The agreement contains a financial covenant, which requires us to maintain a ratio of debt to consolidated earnings (excluding non-cash pension mark-to-market adjustments and non-cash asset impairment charges) before interest, taxes, depreciation and amortization ("adjusted EBITDA") of not more than 3.5 to 1.0, calculated as of the end of the applicable quarter on a rolling four-quarters basis. The ratio of our debt to adjusted EBITDA was 1.9 to 1.0 at November 30, 2017. We believe this covenant is the only significant restrictive covenant in our revolving credit agreement. Our revolving credit agreement contains other customary covenants that do not, individually or in the aggregate, materially restrict the conduct of our business. We are in compliance with the financial covenant and all other covenants of our revolving credit agreement and do not expect the covenants to affect our operations, including our liquidity or expected funding needs.
During the second quarter of 2018, we issued $250 million of commercial paper, providing us with additional short-term liquidity flexibility. Our commercial paper program is backed by unused commitments under the revolving credit facility and borrowings under the program reduce the amount available under the credit facility. As of November 30, 2017, $250 million of commercial paper and $255 million in letters of credit were outstanding, leaving $1.245 billion available under the revolving credit facility for future borrowings.
Long-term debt, exclusive of capital leases, had carrying values of $15.1 billion at November 30, 2017 and $14.9 billion at May 31, 2017, compared with estimated fair values of $15.9 billion at November 30, 2017 and $15.5 billion at May 31, 2017. The annualized weighted average interest rate on long-term debt was 3.6% for the six-months ended November 30, 2017. The estimated fair values were determined based on quoted market prices and the current rates offered for debt with similar terms and maturities. The fair value of our long-term debt is classified as Level 2 within the fair value hierarchy. This classification is defined as a fair value determined using market-based inputs other than quoted prices that are observable for the liability, either directly or indirectly.
- 10 -
(4) Computation of Earnings Per Share
The calculation of basic and diluted earnings per common share for the periods ended November 30 was as follows (in millions, except per share amounts):
|
| Three Months Ended |
|
| Six Months Ended |
| ||||||||||
|
| 2017 |
|
| 2016 |
|
| 2017 |
|
| 2016 |
| ||||
Basic earnings per common share: |
|
|
|
|
|
|
|
|
|
|
|
|
|
|
|
|
Net earnings allocable to common shares (1) |
| $ | 774 |
|
| $ | 700 |
|
| $ | 1,369 |
|
| $ | 1,414 |
|
Weighted-average common shares |
|
| 268 |
|
|
| 266 |
|
|
| 268 |
|
|
| 266 |
|
Basic earnings per common share |
| $ | 2.89 |
|
| $ | 2.63 |
|
| $ | 5.12 |
|
| $ | 5.32 |
|
Diluted earnings per common share: |
|
|
|
|
|
|
|
|
|
|
|
|
|
|
|
|
Net earnings allocable to common shares (1) |
| $ | 774 |
|
| $ | 700 |
|
| $ | 1,369 |
|
| $ | 1,414 |
|
Weighted-average common shares |
|
| 268 |
|
|
| 266 |
|
|
| 268 |
|
|
| 266 |
|
Dilutive effect of share-based awards |
|
| 4 |
|
|
| 4 |
|
|
| 4 |
|
|
| 4 |
|
Weighted-average diluted shares |
|
| 272 |
|
|
| 270 |
|
|
| 272 |
|
|
| 270 |
|
Diluted earnings per common share |
| $ | 2.84 |
|
| $ | 2.59 |
|
| $ | 5.03 |
|
| $ | 5.24 |
|
Anti-dilutive options excluded from diluted earnings per common share |
|
| 2.9 |
|
|
| 5.1 |
|
|
| 3.0 |
|
|
| 5.1 |
|
(1) | Net earnings available to participating securities were immaterial in all periods presented. |
(5) Retirement Plans
We sponsor programs that provide retirement benefits to most of our employees. These programs include defined benefit pension plans, defined contribution plans and postretirement healthcare plans. Key terms of our retirement plans are provided in our Annual Report. Our retirement plans costs for the periods ended November 30 were as follows (in millions):
|
| Three Months Ended |
|
| Six Months Ended |
| ||||||||||
|
| 2017 |
|
| 2016 |
|
| 2017 |
|
| 2016 |
| ||||
Defined benefit pension plans |
| $ | 37 |
|
| $ | 58 |
|
| $ | 74 |
|
| $ | 116 |
|
Defined contribution plans |
|
| 124 |
|
|
| 112 |
|
|
| 251 |
|
|
| 231 |
|
Postretirement healthcare plans |
|
| 18 |
|
|
| 19 |
|
|
| 37 |
|
|
| 38 |
|
|
| $ | 179 |
|
| $ | 189 |
|
| $ | 362 |
|
| $ | 385 |
|
- 11 -
Net periodic benefit cost of the pension and postretirement healthcare plans for the periods ended November 30 included the following components (in millions):
|
| Three Months Ended |
| |||||||||||||||||||||
|
| U.S. Pension Plans |
|
| International Pension Plans |
|
| Postretirement Healthcare Plans |
| |||||||||||||||
|
| 2017 |
|
| 2016 |
|
| 2017 |
|
| 2016 |
|
| 2017 |
|
| 2016 |
| ||||||
Service cost |
| $ | 170 |
|
| $ | 160 |
|
| $ | 23 |
|
| $ | 20 |
|
| $ | 9 |
|
| $ | 9 |
|
Interest cost |
|
| 278 |
|
|
| 282 |
|
|
| 13 |
|
|
| 11 |
|
|
| 9 |
|
|
| 10 |
|
Expected return on plan assets |
|
| (406 | ) |
|
| (375 | ) |
|
| (11 | ) |
|
| (11 | ) |
|
| - |
|
|
| - |
|
Amortization of prior service credit and other |
|
| (29 | ) |
|
| (30 | ) |
|
| (1 | ) |
|
| 1 |
|
|
| - |
|
|
| - |
|
|
| $ | 13 |
|
| $ | 37 |
|
| $ | 24 |
|
| $ | 21 |
|
| $ | 18 |
|
| $ | 19 |
|
|
|
|
|
|
|
|
|
|
|
|
|
|
|
|
|
|
|
|
|
|
|
|
|
|
|
| Six Months Ended |
| |||||||||||||||||||||
|
| U.S. Pension Plans |
|
| International Pension Plans |
|
| Postretirement Healthcare Plans |
| |||||||||||||||
|
| 2017 |
|
| 2016 |
|
| 2017 |
|
| 2016 |
|
| 2017 |
|
| 2016 |
| ||||||
Service cost |
| $ | 340 |
|
| $ | 319 |
|
| $ | 46 |
|
| $ | 41 |
|
| $ | 18 |
|
| $ | 18 |
|
Interest cost |
|
| 557 |
|
|
| 564 |
|
|
| 25 |
|
|
| 22 |
|
|
| 19 |
|
|
| 20 |
|
Expected return on plan assets |
|
| (812 | ) |
|
| (751 | ) |
|
| (22 | ) |
|
| (21 | ) |
|
| - |
|
|
| - |
|
Amortization of prior service credit and other |
|
| (59 | ) |
|
| (59 | ) |
|
| (1 | ) |
|
| 1 |
|
|
| - |
|
|
| - |
|
|
| $ | 26 |
|
| $ | 73 |
|
| $ | 48 |
|
| $ | 43 |
|
| $ | 37 |
|
| $ | 38 |
|
Contributions to our tax-qualified U.S. domestic pension plans for the six-month periods ended November 30 were as follows (in millions):
|
| 2017 |
|
| 2016 |
| ||
Required |
| $ | 268 |
|
| $ | 250 |
|
Voluntary |
|
| 482 |
|
|
| 250 |
|
|
| $ | 750 |
|
| $ | 500 |
|
(6) Business Segment Information
We provide a broad portfolio of transportation, e-commerce and business services through companies competing collectively, operating independently and managed collaboratively, under the respected FedEx brand. Our primary operating companies are FedEx Express, including TNT Express B.V. ("TNT Express"), the world's largest express transportation company; FedEx Ground Package System, Inc. ("FedEx Ground"), a leading North American provider of small-package ground delivery services; and FedEx Freight, Inc. ("FedEx Freight"), a leading U.S. provider of less-than-truckload ("LTL") freight services. These companies represent our major service lines and, along with FedEx Services, form the core of our reportable segments.
- 12 -
Our reportable segments include the following businesses:
|
|
|
|
FedEx Express Segment | FedEx Express (express transportation) |
| TNT Express (international express transportation, small-package ground delivery and freight transportation) |
| FedEx Trade Networks (air and ocean freight forwarding, customs brokerage and cross-border enablement technology and solutions) |
|
|
|
|
FedEx Ground Segment | FedEx Ground (small-package ground delivery) |
| FedEx Supply Chain (third-party logistics) |
|
|
|
|
FedEx Freight Segment | FedEx Freight (LTL freight transportation) |
| FedEx Custom Critical (time-critical transportation) |
|
|
|
|
FedEx Services Segment | FedEx Services (sales, marketing, information technology, communications, customer service, technical support, billing and collection services and back-office functions) |
| FedEx Office (document and business services and package acceptance) |
As discussed in our Annual Report, in the first quarter of 2018, we began to report TNT Express as part of the FedEx Express segment. Prior year amounts have been revised to conform to the current year presentation.
FedEx Services Segment
The FedEx Services segment operates combined sales, marketing, administrative and information technology functions that support our transportation businesses and allow us to obtain synergies from the combination of these functions. For the international regions of FedEx Express, some of these functions are performed on a regional basis and reported in their natural expense line items. The FedEx Services segment includes: FedEx Services, which provides sales, marketing, information technology, communications, customer service, technical support, billing and collection services for U.S. customers of our major business units and certain back-office support to our other companies; and FedEx Office and Print Services, Inc. ("FedEx Office"), which provides an array of document and business services and retail access to our customers for our package transportation businesses.
The FedEx Services segment provides direct and indirect support to our transportation businesses, and we allocate all of the net operating costs of the FedEx Services segment (including the net operating results of FedEx Office) to reflect the full cost of operating our transportation businesses in the results of those segments. Within the FedEx Services segment allocation, the net operating results of FedEx Office, which are an immaterial component of our allocations, are allocated to FedEx Express and FedEx Ground. We review and evaluate the performance of our transportation segments based on operating income (inclusive of FedEx Services segment allocations). For the FedEx Services segment, performance is evaluated based on the impact of its total allocated net operating costs on our transportation segments.
Operating expenses for each of our transportation segments include the allocations from the FedEx Services segment to the respective transportation segments. These allocations also include charges and credits for administrative services provided between operating companies. The allocations of net operating costs are based on metrics such as relative revenues or estimated services provided. We believe these allocations approximate the net cost of providing these functions. Our allocation methodologies are refined periodically, as necessary, to reflect changes in our businesses.
Eliminations, Corporate and Other
Certain FedEx operating companies provide transportation and related services for other FedEx companies outside their reportable segment. Billings for such services are based on negotiated rates, which we believe approximate fair value, and are reflected as revenues of the billing segment. These rates are adjusted from time to time based on market conditions. Such intersegment revenues and expenses are eliminated in our consolidated results and are not separately identified in the following segment information because the amounts are not material.
Corporate and other includes corporate headquarters costs for executive officers and certain legal and financial functions, as well as certain other costs and credits not attributed to our core business. These costs are not allocated to the business segments.
- 13 -
The following table provides a reconciliation of reportable segment revenues and operating income to our unaudited condensed consolidated financial statement totals for the periods ended November 30 (in millions):
|
| Three Months Ended |
|
| Six Months Ended |
| ||||||||||
|
| 2017 |
|
| 2016 |
|
| 2017 |
|
| 2016 |
| ||||
Revenues |
|
|
|
|
|
|
|
|
|
|
|
|
|
|
|
|
FedEx Express segment |
| $ | 9,354 |
|
| $ | 8,642 |
|
| $ | 18,006 |
|
| $ | 17,102 |
|
FedEx Ground segment |
|
| 4,929 |
|
|
| 4,419 |
|
|
| 9,568 |
|
|
| 8,709 |
|
FedEx Freight segment |
|
| 1,762 |
|
|
| 1,597 |
|
|
| 3,514 |
|
|
| 3,255 |
|
FedEx Services segment |
|
| 416 |
|
|
| 414 |
|
|
| 816 |
|
|
| 809 |
|
Eliminations and other |
|
| (148 | ) |
|
| (141 | ) |
|
| (294 | ) |
|
| (281 | ) |
|
| $ | 16,313 |
|
| $ | 14,931 |
|
| $ | 31,610 |
|
| $ | 29,594 |
|
Operating Income |
|
|
|
|
|
|
|
|
|
|
|
|
|
|
|
|
FedEx Express segment |
| $ | 717 |
|
| $ | 706 |
|
| $ | 1,150 |
|
| $ | 1,316 |
|
FedEx Ground segment |
|
| 521 |
|
|
| 465 |
|
|
| 1,147 |
|
|
| 1,075 |
|
FedEx Freight segment |
|
| 118 |
|
|
| 88 |
|
|
| 294 |
|
|
| 223 |
|
Eliminations, corporate and other |
|
| (94 | ) |
|
| (92 | ) |
|
| (212 | ) |
|
| (183 | ) |
|
| $ | 1,262 |
|
| $ | 1,167 |
|
| $ | 2,379 |
|
| $ | 2,431 |
|
(7) Commitments
As of November 30, 2017, our purchase commitments under various contracts for the remainder of 2018 and annually thereafter were as follows (in millions):
|
| Aircraft and Aircraft-Related |
|
| Other (1) |
|
| Total |
| |||
2018 (remainder) |
| $ | 870 |
|
| $ | 469 |
|
| $ | 1,339 |
|
2019 |
|
| 1,723 |
|
|
| 679 |
|
|
| 2,402 |
|
2020 |
|
| 1,965 |
|
|
| 525 |
|
|
| 2,490 |
|
2021 |
|
| 1,488 |
|
|
| 386 |
|
|
| 1,874 |
|
2022 |
|
| 1,451 |
|
|
| 235 |
|
|
| 1,686 |
|
Thereafter |
|
| 3,334 |
|
|
| 499 |
|
|
| 3,833 |
|
Total |
| $ | 10,831 |
|
| $ | 2,793 |
|
| $ | 13,624 |
|
| (1) | Primarily equipment and advertising contracts. |
The amounts reflected in the table above for purchase commitments represent noncancelable agreements to purchase goods or services. As of November 30, 2017, our obligation to purchase four Boeing 767-300 Freighter ("B767F") aircraft and six Boeing 777 Freighter ("B777F") aircraft is conditioned upon there being no event that causes FedEx Express or its employees not to be covered by the Railway Labor Act of 1926, as amended. Open purchase orders that are cancelable are not considered unconditional purchase obligations for financial reporting purposes and are not included in the table above.
During the second quarter of 2018, FedEx Express entered into an agreement to purchase 50 Cessna SkyCourier 408 aircraft with options to purchase up to 50 additional Cessna SkyCourier 408 aircraft. The 50 firm-order Cessna SkyCourier 408 aircraft are expected to be delivered from fiscal 2021 through 2024.
During the second quarter of 2018, FedEx Express entered into an agreement to purchase 30 ATR 72-600F aircraft with options to purchase up to 20 additional ATR 72-600F aircraft. The 30 firm-order ATR 72-600F aircraft are expected to be delivered from fiscal 2021 through 2026.
- 14 -
We had $684 million in deposits and progress payments as of November 30, 2017 on aircraft purchases and other planned aircraft-related transactions. These deposits are classified in the "Other assets" caption of our consolidated balance sheets. Aircraft and aircraft-related con tracts are subject to price escalations. The following table is a summary of the key aircraft we are committed to purchase as of November 30, 2017 with the year of expected delivery:
|
| Cessna SkyCourier 408 |
|
| ATR 72-600F |
|
| B767F |
|
| B777F |
|
| Total |
| |||||
2018 (remainder) |
|
| - |
|
|
| - |
|
|
| 8 |
|
|
| 1 |
|
|
| 9 |
|
2019 |
|
| - |
|
|
| - |
|
|
| 15 |
|
|
| 2 |
|
|
| 17 |
|
2020 |
|
| - |
|
|
| - |
|
|
| 16 |
|
|
| 3 |
|
|
| 19 |
|
2021 |
|
| 12 |
|
|
| 5 |
|
|
| 10 |
|
|
| 3 |
|
|
| 30 |
|
2022 |
|
| 12 |
|
|
| 6 |
|
|
| 10 |
|
|
| 4 |
|
|
| 32 |
|
Thereafter |
|
| 26 |
|
|
| 19 |
|
|
| 6 |
|
|
| - |
|
|
| 51 |
|
Total |
|
| 50 |
|
|
| 30 |
|
|
| 65 |
|
|
| 13 |
|
|
| 158 |
|
A summary of future minimum lease payments under noncancelable operating leases with an initial or remaining term in excess of one year at November 30, 2017 is as follows (in millions):
|
| Aircraft and Related Equipment |
|
| Facilities and Other |
|
| Total Operating Leases |
| |||
2018 (remainder) |
| $ | 335 |
|
| $ | 1,113 |
|
| $ | 1,448 |
|
2019 |
|
| 343 |
|
|
| 2,014 |
|
|
| 2,357 |
|
2020 |
|
| 261 |
|
|
| 1,799 |
|
|
| 2,060 |
|
2021 |
|
| 203 |
|
|
| 1,623 |
|
|
| 1,826 |
|
2022 |
|
| 185 |
|
|
| 1,464 |
|
|
| 1,649 |
|
Thereafter |
|
| 175 |
|
|
| 8,746 |
|
|
| 8,921 |
|
Total |
| $ | 1,502 |
|
| $ | 16,759 |
|
| $ | 18,261 |
|
Future minimum lease payments under capital leases were immaterial at November 30, 2017. While certain of our lease agreements contain covenants governing the use of the leased assets or require us to maintain certain levels of insurance, none of our lease agreements include material financial covenants or limitations.
(8) Contingencies
Independent Contractor - Lawsuits and Administrative Proceedings. During the second quarter of 2018, the final objector to the $228 million settlement in the case that was remanded by the multidistrict litigation court to California and appealed to the Ninth Circuit Court of Appeals settled with plaintiffs' counsel and FedEx Ground paid the settlement amount.
FedEx Ground is involved in lawsuits and administrative proceedings claiming that owner-operators engaged under a contractor model no longer in use should have been treated as employees of FedEx Ground, rather than independent contractors. In addition, we are defending joint-employer cases where it is alleged that FedEx Ground should be treated as an employer of the drivers employed by owner-operators engaged by FedEx Ground. These cases are in varying stages of litigation, and we are not currently able to estimate an amount or range of potential loss in all of these matters. However, we do not expect to incur, individually or in the aggregate, a material loss in these matters. Nevertheless, adverse determinations in matters related to owner-operators engaged by FedEx Ground could, among other things, entitle certain owner-operators to the reimbursement of certain expenses, and their drivers to the benefit of wage-and-hour laws, and result in employment and withholding tax and benefit liability for FedEx Ground. We believe that owner-operators engaged by FedEx Ground are properly classified as independent contractors and that FedEx Ground is not an employer of the drivers employed by these owner-operators.
- 15 -
City and State of New York Cigarette Suit. The City of New York and the State of New Yor k filed two related lawsuits against FedEx Ground in December 2013 and November 2014 arising from FedEx Ground's alleged shipments of cigarettes to New York residents in contravention of several statutes, including the Racketeer Influenced and Corrupt Orga nizations Act ("RICO") and New York's Public Health Law, as well as common law nuisance claims. In April 2016, the two lawsuits were consolidated and will now proceed as one lawsuit. The first-filed lawsuit alleges that FedEx Ground provided delivery servi ces on behalf of four shippers, and the second-filed lawsuit alleges that FedEx Ground provided delivery services on behalf of six additional shippers; none of these shippers continue to ship in our network. Following motions to dismiss filed in both lawsu its, some of the claims were dismissed entirely or limited. In the first-filed lawsuit, the New York Public Health Law and common law nuisance claims were dismissed and the plaintiffs voluntarily dismissed another claim. In the second-filed lawsuit, the co mmon law nuisance claim was dismissed entirely and the New York Public Health Law claim has been limited to claims arising after September 27, 2013, when an amendment to that law provided enforcement authority to the City of New York and State of New York. Other claims, including the RICO claims, remain in both lawsuits. The likelihood of loss is reasonably possible, but the amount or range of loss, if any, cannot be estimated at this stage of the litigation, but we expect the amount of any loss to be immat erial.
On July 10, 2017, the City of New York and the State of New York filed a third lawsuit against FedEx Ground and included FedEx Freight as a co-defendant. This new case identifies no shippers or shipments, but generally alleges violations of the same laws that are the subject of the other two lawsuits. The amount or range of loss, if any, cannot be estimated at this stage of the lawsuit.
Environmental Matters . SEC regulations require disclosure of certain environmental matters when a governmental authority is a party to the proceedings and the proceedings involve potential monetary sanctions that management reasonably believes could exceed $100,000.
On September 9, 2016, FedEx Supply Chain received a written offer from several District Attorneys' Offices in California to settle a civil action that the District Attorneys intend to file against FedEx Supply Chain for alleged violations of the state's hazardous waste regulations. Specifically, the District Attorneys' Offices allege FedEx Supply Chain unlawfully disposed of hazardous waste at one of its California facilities and caused the illegal transportation and disposal of hazardous waste from the retail stores of a FedEx Supply Chain customer at this same facility. The District Attorneys allege these violations began in 2006 and continued until the facility closed in the spring of 2015. We believe an immaterial loss in this matter is probable, and we will pursue all available remedies against the sellers of GENCO to recover any losses in this matter.
Other Matters. During the third quarter of 2017, FedEx Trade Networks informed U.S. Customs and Border Protection ("CBP") that in connection with certain customs entries it may have made improper claims for (i) reduced-duty treatment and (ii) duty-free treatment. In the fourth quarter of 2017 we established accruals totaling $39.3 million for the then-current estimated probable loss for these matters. In the first quarter of 2018, FedEx Trade Networks tendered payments to CBP in these matters totaling $46.5 million, and an additional expense of $7.2 million was recognized. CBP acknowledged receipt of the amounts tendered in these matters, and we are awaiting a response indicating whether these matters are fully resolved.
FedEx and its subsidiaries are subject to other legal proceedings that arise in the ordinary course of business, including certain lawsuits containing various class-action allegations of wage-and-hour violations in which plaintiffs claim, among other things, that they were forced to work "off the clock," were not paid overtime or were not provided work breaks or other benefits. In the opinion of management, the aggregate liability, if any, with respect to these other actions will not have a material adverse effect on our financial position, results of operations or cash flows.
(9) Supplemental Cash Flow Information
Cash paid for interest expense and income taxes for the six-month periods ended November 30 was as follows (in millions):
|
| 2017 |
|
| 2016 |
| ||
Cash payments for: |
|
|
|
|
|
|
|
|
Interest (net of capitalized interest) |
| $ | 238 |
|
| $ | 232 |
|
Income taxes |
| $ | 617 |
|
| $ | 216 |
|
Income tax refunds received |
|
| (19 | ) |
|
| (13 | ) |
Cash tax payments, net |
| $ | 598 |
|
| $ | 203 |
|
- 16 -
(10) Condensed Consolidating Financial Statements
We are required to present condensed consolidating financial information in order for the subsidiary guarantors of our public debt to continue to be exempt from reporting under the Securities Exchange Act of 1934, as amended.
The guarantor subsidiaries, which are 100% owned by FedEx, guarantee $15.0 billion of our long-term debt. The guarantees are full and unconditional and joint and several. Our guarantor subsidiaries were not determined using geographic, service line or other similar criteria, and as a result, the "Guarantor Subsidiaries" and "Non-guarantor Subsidiaries" columns each include portions of our domestic and international operations. Accordingly, this basis of presentation is not intended to present our financial condition, results of operations or cash flows for any purpose other than to comply with the specific requirements for subsidiary guarantor reporting.
- 17 -
Condensed consolidating financial statements for our guarantor subsidiaries and non-guarantor subsidiaries are presented in the following tables (in millions):
CONDENSED CONSOLIDATING BALANCE SHEETS
(UNAUDITED)
November 30, 2017
|
|
|
|
|
| Guarantor |
|
| Non-guarantor |
|
|
|
|
|
|
|
|
| ||
|
| Parent |
|
| Subsidiaries |
|
| Subsidiaries |
|
| Eliminations |
|
| Consolidated |
| |||||
ASSETS |
|
|
|
|
|
|
|
|
|
|
|
|
|
|
|
|
|
|
|
|
CURRENT ASSETS |
|
|
|
|
|
|
|
|
|
|
|
|
|
|
|
|
|
|
|
|
Cash and cash equivalents |
| $ | 959 |
|
| $ | 342 |
|
| $ | 1,495 |
|
| $ | (28 | ) |
| $ | 2,768 |
|
Receivables, less allowances |
|
| 2 |
|
|
| 5,340 |
|
|
| 3,441 |
|
|
| (128 | ) |
|
| 8,655 |
|
Spare parts, supplies, fuel, prepaid expenses and other, less allowances |
|
| 286 |
|
|
| 931 |
|
|
| 241 |
|
|
| - |
|
|
| 1,458 |
|
Total current assets |
|
| 1,247 |
|
|
| 6,613 |
|
|
| 5,177 |
|
|
| (156 | ) |
|
| 12,881 |
|
PROPERTY AND EQUIPMENT, AT COST |
|
| 22 |
|
|
| 49,585 |
|
|
| 3,633 |
|
|
| - |
|
|
| 53,240 |
|
Less accumulated depreciation and amortization |
|
| 18 |
|
|
| 24,349 |
|
|
| 1,583 |
|
|
| - |
|
|
| 25,950 |
|
Net property and equipment |
|
| 4 |
|
|
| 25,236 |
|
|
| 2,050 |
|
|
| - |
|
|
| 27,290 |
|
INTERCOMPANY RECEIVABLE |
|
| 1,175 |
|
|
| 3,184 |
|
|
| - |
|
|
| (4,359 | ) |
|
| - |
|
GOODWILL |
|
| - |
|
|
| 1,571 |
|
|
| 5,754 |
|
|
| - |
|
|
| 7,325 |
|
INVESTMENT IN SUBSIDIARIES |
|
| 29,116 |
|
|
| 2,903 |
|
|
| - |
|
|
| (32,019 | ) |
|
| - |
|
OTHER ASSETS |
|
| 3,501 |
|
|
| 1,197 |
|
|
| 1,297 |
|
|
| (3,210 | ) |
|
| 2,785 |
|
|
| $ | 35,043 |
|
| $ | 40,704 |
|
| $ | 14,278 |
|
| $ | (39,744 | ) |
| $ | 50,281 |
|
LIABILITIES AND STOCKHOLDERS' INVESTMENT |
|
|
|
|
|
|
|
|
|
|
|
|
|
|
|
|
|
|
|
|
CURRENT LIABILITIES |
|
|
|
|
|
|
|
|
|
|
|
|
|
|
|
|
|
|
|
|
Short-term borrowings |
| $ | 250 |
|
| $ | - |
|
| $ | - |
|
| $ | - |
|
| $ | 250 |
|
Current portion of long-term debt |
|
| - |
|
|
| 1 |
|
|
| 10 |
|
|
| - |
|
|
| 11 |
|
Accrued salaries and employee benefits |
|
| 59 |
|
|
| 1,325 |
|
|
| 528 |
|
|
| - |
|
|
| 1,912 |
|
Accounts payable |
|
| 153 |
|
|
| 1,636 |
|
|
| 1,514 |
|
|
| (156 | ) |
|
| 3,147 |
|
Accrued expenses |
|
| 451 |
|
|
| 1,621 |
|
|
| 835 |
|
|
| - |
|
|
| 2,907 |
|
Total current liabilities |
|
| 913 |
|
|
| 4,583 |
|
|
| 2,887 |
|
|
| (156 | ) |
|
| 8,227 |
|
LONG-TERM DEBT, LESS CURRENT PORTION |
|
| 14,872 |
|
|
| 289 |
|
|
| 19 |
|
|
| - |
|
|
| 15,180 |
|
INTERCOMPANY PAYABLE |
|
| - |
|
|
| - |
|
|
| 4,359 |
|
|
| (4,359 | ) |
|
| - |
|
OTHER LONG-TERM LIABILITIES |
|
|
|
|
|
|
|
|
|
|
|
|
|
|
|
|
|
|
|
|
Deferred income taxes |
|
| - |
|
|
| 6,102 |
|
|
| 196 |
|
|
| (3,210 | ) |
|
| 3,088 |
|
Other liabilities |
|
| 2,203 |
|
|
| 3,642 |
|
|
| 886 |
|
|
| - |
|
|
| 6,731 |
|
Total other long-term liabilities |
|
| 2,203 |
|
|
| 9,744 |
|
|
| 1,082 |
|
|
| (3,210 | ) |
|
| 9,819 |
|
STOCKHOLDERS' INVESTMENT |
|
| 17,055 |
|
|
| 26,088 |
|
|
| 5,931 |
|
|
| (32,019 | ) |
|
| 17,055 |
|
|
| $ | 35,043 |
|
| $ | 40,704 |
|
| $ | 14,278 |
|
| $ | (39,744 | ) |
| $ | 50,281 |
|
|
|
|
|
|
|
|
|
|
|
|
|
|
|
|
|
|
|
|
|
|
- 18 -
CONDENSED CONSOLIDATING BALANCE SHEETS
May 31, 2017
|
|
|
|
|
| Guarantor |
|
| Non-guarantor |
|
|
|
|
|
|
|
|
| ||
|
| Parent |
|
| Subsidiaries |
|
| Subsidiaries |
|
| Eliminations |
|
| Consolidated |
| |||||
ASSETS |
|
|
|
|
|
|
|
|
|
|
|
|
|
|
|
|
|
|
|
|
CURRENT ASSETS |
|
|
|
|
|
|
|
|
|
|
|
|
|
|
|
|
|
|
|
|
Cash and cash equivalents |
| $ | 1,884 |
|
| $ | 325 |
|
| $ | 1,807 |
|
| $ | (47 | ) |
| $ | 3,969 |
|
Receivables, less allowances |
|
| 3 |
|
|
| 4,729 |
|
|
| 2,928 |
|
|
| (61 | ) |
|
| 7,599 |
|
Spare parts, supplies, fuel, prepaid expenses and other, less allowances |
|
| 25 |
|
|
| 787 |
|
|
| 248 |
|
|
| - |
|
|
| 1,060 |
|
Total current assets |
|
| 1,912 |
|
|
| 5,841 |
|
|
| 4,983 |
|
|
| (108 | ) |
|
| 12,628 |
|
PROPERTY AND EQUIPMENT, AT COST |
|
| 22 |
|
|
| 47,201 |
|
|
| 3,403 |
|
|
| - |
|
|
| 50,626 |
|
Less accumulated depreciation and amortization |
|
| 18 |
|
|
| 23,211 |
|
|
| 1,416 |
|
|
| - |
|
|
| 24,645 |
|
Net property and equipment |
|
| 4 |
|
|
| 23,990 |
|
|
| 1,987 |
|
|
| - |
|
|
| 25,981 |
|
INTERCOMPANY RECEIVABLE |
|
| 1,521 |
|
|
| 2,607 |
|
|
| - |
|
|
| (4,128 | ) |
|
| - |
|
GOODWILL |
|
| - |
|
|
| 1,571 |
|
|
| 5,583 |
|
|
| - |
|
|
| 7,154 |
|
INVESTMENT IN SUBSIDIARIES |
|
| 27,712 |
|
|
| 2,636 |
|
|
| - |
|
|
| (30,348 | ) |
|
| - |
|
OTHER ASSETS |
|
| 3,494 |
|
|
| 1,271 |
|
|
| 1,249 |
|
|
| (3,225 | ) |
|
| 2,789 |
|
|
| $ | 34,643 |
|
| $ | 37,916 |
|
| $ | 13,802 |
|
| $ | (37,809 | ) |
| $ | 48,552 |
|
LIABILITIES AND STOCKHOLDERS' INVESTMENT |
|
|
|
|
|
|
|
|
|
|
|
|
|
|
|
|
|
|
|
|
CURRENT LIABILITIES |
|
|
|
|
|
|
|
|
|
|
|
|
|
|
|
|
|
|
|
|
Current portion of long-term debt |
| $ | - |
|
| $ | 9 |
|
| $ | 13 |
|
| $ | - |
|
| $ | 22 |
|
Accrued salaries and employee benefits |
|
| 72 |
|
|
| 1,335 |
|
|
| 507 |
|
|
| - |
|
|
| 1,914 |
|
Accounts payable |
|
| 10 |
|
|
| 1,411 |
|
|
| 1,439 |
|
|
| (108 | ) |
|
| 2,752 |
|
Accrued expenses |
|
| 991 |
|
|
| 1,522 |
|
|
| 717 |
|
|
| - |
|
|
| 3,230 |
|
Total current liabilities |
|
| 1,073 |
|
|
| 4,277 |
|
|
| 2,676 |
|
|
| (108 | ) |
|
| 7,918 |
|
LONG-TERM DEBT, LESS CURRENT PORTION |
|
| 14,641 |
|
|
| 244 |
|
|
| 24 |
|
|
| - |
|
|
| 14,909 |
|
INTERCOMPANY PAYABLE |
|
| - |
|
|
| - |
|
|
| 4,128 |
|
|
| (4,128 | ) |
|
| - |
|
OTHER LONG-TERM LIABILITIES |
|
|
|
|
|
|
|
|
|
|
|
|
|
|
|
|
|
|
|
|
Deferred income taxes |
|
| - |
|
|
| 5,472 |
|
|
| 238 |
|
|
| (3,225 | ) |
|
| 2,485 |
|
Other liabilities |
|
| 2,856 |
|
|
| 3,448 |
|
|
| 863 |
|
|
| - |
|
|
| 7,167 |
|
Total other long-term liabilities |
|
| 2,856 |
|
|
| 8,920 |
|
|
| 1,101 |
|
|
| (3,225 | ) |
|
| 9,652 |
|
STOCKHOLDERS' INVESTMENT |
|
| 16,073 |
|
|
| 24,475 |
|
|
| 5,873 |
|
|
| (30,348 | ) |
|
| 16,073 |
|
|
| $ | 34,643 |
|
| $ | 37,916 |
|
| $ | 13,802 |
|
| $ | (37,809 | ) |
| $ | 48,552 |
|
- 19 -
CONDENSED CONSOLIDATING STATEMENTS OF COMPREHENSIVE INCOME
(UNAUDITED)
Three Months Ended November 30, 2017
|
| Parent |
|
| Guarantor Subsidiaries |
|
| Non-guarantor Subsidiaries |
|
| Eliminations |
|
| Consolidated |
| |||||
REVENUES |
| $ | - |
|
| $ | 12,044 |
|
| $ | 4,362 |
|
| $ | (93 | ) |
| $ | 16,313 |
|
OPERATING EXPENSES: |
|
|
|
|
|
|
|
|
|
|
|
|
|
|
|
|
|
|
|
|
Salaries and employee benefits |
|
| 35 |
|
|
| 4,439 |
|
|
| 1,268 |
|
|
| - |
|
|
| 5,742 |
|
Purchased transportation |
|
| - |
|
|
| 2,314 |
|
|
| 1,576 |
|
|
| (50 | ) |
|
| 3,840 |
|
Rentals and landing fees |
|
| 1 |
|
|
| 640 |
|
|
| 197 |
|
|
| (3 | ) |
|
| 835 |
|
Depreciation and amortization |
|
| - |
|
|
| 649 |
|
|
| 107 |
|
|
| - |
|
|
| 756 |
|
Fuel |
|
| - |
|
|
| 746 |
|
|
| 72 |
|
|
| - |
|
|
| 818 |
|
Maintenance and repairs |
|
| - |
|
|
| 584 |
|
|
| 81 |
|
|
| - |
|
|
| 665 |
|
Intercompany charges, net |
|
| (95 | ) |
|
| - |
|
|
| 95 |
|
|
| - |
|
|
| - |
|
Other |
|
| 59 |
|
|
| 1,592 |
|
|
| 784 |
|
|
| (40 | ) |
|
| 2,395 |
|
|
|
| - |
|
|
| 10,964 |
|
|
| 4,180 |
|
|
| (93 | ) |
|
| 15,051 |
|
OPERATING INCOME |
|
| - |
|
|
| 1,080 |
|
|
| 182 |
|
|
| - |
|
|
| 1,262 |
|
OTHER INCOME (EXPENSE): |
|
|
|
|
|
|
|
|
|
|
|
|
|
|
|
|
|
|
|
|
Equity in earnings of subsidiaries |
|
| 775 |
|
|
| 40 |
|
|
| - |
|
|
| (815 | ) |
|
| - |
|
Interest, net |
|
| (130 | ) |
|
| 11 |
|
|
| (5 | ) |
|
| - |
|
|
| (124 | ) |
Intercompany charges, net |
|
| 132 |
|
|
| (71 | ) |
|
| (61 | ) |
|
| - |
|
|
| - |
|
Other, net |
|
| (2 | ) |
|
| (8 | ) |
|
| 11 |
|
|
| - |
|
|
| 1 |
|
INCOME BEFORE INCOME TAXES |
|
| 775 |
|
|
| 1,052 |
|
|
| 127 |
|
|
| (815 | ) |
|
| 1,139 |
|
Provision for income taxes |
|
| - |
|
|
| 225 |
|
|
| 139 |
|
|
| - |
|
|
| 364 |
|
NET INCOME |
| $ | 775 |
|
| $ | 827 |
|
| $ | (12 | ) |
| $ | (815 | ) |
| $ | 775 |
|
COMPREHENSIVE INCOME |
| $ | 756 |
|
| $ | 817 |
|
| $ | (92 | ) |
| $ | (815 | ) |
| $ | 666 |
|
- 20 -
CONDENSED CONSOLIDATING STATEMENTS OF COMPREHENSIVE INCOME
(UNAUDITED)
Three Months Ended November 30, 2016
|
| Parent |
|
| Guarantor Subsidiaries |
|
| Non-guarantor Subsidiaries |
|
| Eliminations |
|
| Consolidated |
| |||||
REVENUES |
| $ | - |
|
| $ | 10,997 |
|
| $ | 4,004 |
|
| $ | (70 | ) |
| $ | 14,931 |
|
OPERATING EXPENSES: |
|
|
|
|
|
|
|
|
|
|
|
|
|
|
|
|
|
|
|
|
Salaries and employee benefits |
|
| 29 |
|
|
| 4,161 |
|
|
| 1,163 |
|
|
| - |
|
|
| 5,353 |
|
Purchased transportation |
|
| - |
|
|
| 2,074 |
|
|
| 1,383 |
|
|
| (26 | ) |
|
| 3,431 |
|
Rentals and landing fees |
|
| 2 |
|
|
| 625 |
|
|
| 177 |
|
|
| (2 | ) |
|
| 802 |
|
Depreciation and amortization |
|
| - |
|
|
| 634 |
|
|
| 106 |
|
|
| - |
|
|
| 740 |
|
Fuel |
|
| - |
|
|
| 584 |
|
|
| 74 |
|
|
| - |
|
|
| 658 |
|
Maintenance and repairs |
|
| - |
|
|
| 504 |
|
|
| 75 |
|
|
| - |
|
|
| 579 |
|
Intercompany charges, net |
|
| (89 | ) |
|
| 38 |
|
|
| 51 |
|
|
| - |
|
|
| - |
|
Other |
|
| 58 |
|
|
| 1,429 |
|
|
| 756 |
|
|
| (42 | ) |
|
| 2,201 |
|
|
|
| - |
|
|
| 10,049 |
|
|
| 3,785 |
|
|
| (70 | ) |
|
| 13,764 |
|
OPERATING INCOME |
|
| - |
|
|
| 948 |
|
|
| 219 |
|
|
| - |
|
|
| 1,167 |
|
OTHER INCOME (EXPENSE): |
|
|
|
|
|
|
|
|
|
|
|
|
|
|
|
|
|
|
|
|
Equity in earnings of subsidiaries |
|
| 700 |
|
|
| 54 |
|
|
| - |
|
|
| (754 | ) |
|
| - |
|
Interest, net |
|
| (123 | ) |
|
| 4 |
|
|
| - |
|
|
| - |
|
|
| (119 | ) |
Intercompany charges, net |
|
| 124 |
|
|
| (64 | ) |
|
| (60 | ) |
|
| - |
|
|
| - |
|
Other, net |
|
| (1 | ) |
|
| (5 | ) |
|
| 36 |
|
|
| - |
|
|
| 30 |
|
INCOME BEFORE INCOME TAXES |
|
| 700 |
|
|
| 937 |
|
|
| 195 |
|
|
| (754 | ) |
|
| 1,078 |
|
Provision for income taxes |
|
| - |
|
|
| 291 |
|
|
| 87 |
|
|
| - |
|
|
| 378 |
|
NET INCOME |
| $ | 700 |
|
| $ | 646 |
|
| $ | 108 |
|
| $ | (754 | ) |
| $ | 700 |
|
COMPREHENSIVE INCOME |
| $ | 682 |
|
| $ | 635 |
|
| $ | (112 | ) |
| $ | (754 | ) |
| $ | 451 |
|
- 21 -
CONDENSED CONSOLIDATING STATEMENTS OF COMPREHENSIVE INCOME
(UNAUDITED)
Six Months Ended November 30, 2017
|
| Parent |
|
| Guarantor Subsidiaries |
|
| Non-guarantor Subsidiaries |
|
| Eliminations |
|
| Consolidated |
| |||||
REVENUES |
| $ | - |
|
| $ | 23,611 |
|
| $ | 8,216 |
|
| $ | (217 | ) |
| $ | 31,610 |
|
OPERATING EXPENSES: |
|
|
|
|
|
|
|
|
|
|
|
|
|
|
|
|
|
|
|
|
Salaries and employee benefits |
|
| 73 |
|
|
| 8,666 |
|
|
| 2,521 |
|
|
| - |
|
|
| 11,260 |
|
Purchased transportation |
|
| - |
|
|
| 4,377 |
|
|
| 3,040 |
|
|
| (132 | ) |
|
| 7,285 |
|
Rentals and landing fees |
|
| 2 |
|
|
| 1,267 |
|
|
| 388 |
|
|
| (4 | ) |
|
| 1,653 |
|
Depreciation and amortization |
|
| - |
|
|
| 1,288 |
|
|
| 219 |
|
|
| - |
|
|
| 1,507 |
|
Fuel |
|
| - |
|
|
| 1,383 |
|
|
| 138 |
|
|
| - |
|
|
| 1,521 |
|
Maintenance and repairs |
|
| - |
|
|
| 1,186 |
|
|
| 154 |
|
|
| - |
|
|
| 1,340 |
|
Intercompany charges, net |
|
| (211 | ) |
|
| 113 |
|
|
| 98 |
|
|
| - |
|
|
| - |
|
Other |
|
| 136 |
|
|
| 3,068 |
|
|
| 1,542 |
|
|
| (81 | ) |
|
| 4,665 |
|
|
|
| - |
|
|
| 21,348 |
|
|
| 8,100 |
|
|
| (217 | ) |
|
| 29,231 |
|
OPERATING INCOME |
|
| - |
|
|
| 2,263 |
|
|
| 116 |
|
|
| - |
|
|
| 2,379 |
|
OTHER INCOME (EXPENSE): |
|
|
|
|
|
|
|
|
|
|
|
|
|
|
|
|
|
|
|
|
Equity in earnings of subsidiaries |
|
| 1,371 |
|
|
| 37 |
|
|
| - |
|
|
| (1,408 | ) |
|
| - |
|
Interest, net |
|
| (259 | ) |
|
| 24 |
|
|
| (3 | ) |
|
| - |
|
|
| (238 | ) |
Intercompany charges, net |
|
| 263 |
|
|
| (142 | ) |
|
| (121 | ) |
|
| - |
|
|
| - |
|
Other, net |
|
| (4 | ) |
|
| (16 | ) |
|
| - |
|
|
| - |
|
|
| (20 | ) |
INCOME BEFORE INCOME TAXES |
|
| 1,371 |
|
|
| 2,166 |
|
|
| (8 | ) |
|
| (1,408 | ) |
|
| 2,121 |
|
Provision for income taxes |
|
| - |
|
|
| 624 |
|
|
| 126 |
|
|
| - |
|
|
| 750 |
|
NET INCOME |
| $ | 1,371 |
|
| $ | 1,542 |
|
| $ | (134 | ) |
| $ | (1,408 | ) |
| $ | 1,371 |
|
COMPREHENSIVE INCOME |
| $ | 1,334 |
|
| $ | 1,536 |
|
| $ | (110 | ) |
| $ | (1,408 | ) |
| $ | 1,352 |
|
- 22 -
CONDENSED CONSOLIDATING STATEMENTS OF COMPREHENSIVE INCOME
(UNAUDITED)
Six Months Ended November 30, 2016
|
| Parent |
|
| Guarantor Subsidiaries |
|
| Non-guarantor Subsidiaries |
|
| Eliminations |
|
| Consolidated |
| |||||
REVENUES |
| $ | - |
|
| $ | 21,900 |
|
| $ | 7,834 |
|
| $ | (140 | ) |
| $ | 29,594 |
|
OPERATING EXPENSES: |
|
|
|
|
|
|
|
|
|
|
|
|
|
|
|
|
|
|
|
|
Salaries and employee benefits |
|
| 65 |
|
|
| 8,267 |
|
|
| 2,332 |
|
|
| - |
|
|
| 10,664 |
|
Purchased transportation |
|
| - |
|
|
| 3,991 |
|
|
| 2,734 |
|
|
| (54 | ) |
|
| 6,671 |
|
Rentals and landing fees |
|
| 3 |
|
|
| 1,245 |
|
|
| 347 |
|
|
| (3 | ) |
|
| 1,592 |
|
Depreciation and amortization |
|
| - |
|
|
| 1,245 |
|
|
| 234 |
|
|
| - |
|
|
| 1,479 |
|
Fuel |
|
| - |
|
|
| 1,162 |
|
|
| 146 |
|
|
| - |
|
|
| 1,308 |
|
Maintenance and repairs |
|
| - |
|
|
| 1,030 |
|
|
| 147 |
|
|
| - |
|
|
| 1,177 |
|
Intercompany charges, net |
|
| (179 | ) |
|
| 100 |
|
|
| 79 |
|
|
| - |
|
|
| - |
|
Other |
|
| 111 |
|
|
| 2,802 |
|
|
| 1,442 |
|
|
| (83 | ) |
|
| 4,272 |
|
|
|
| - |
|
|
| 19,842 |
|
|
| 7,461 |
|
|
| (140 | ) |
|
| 27,163 |
|
OPERATING INCOME |
|
| - |
|
|
| 2,058 |
|
|
| 373 |
|
|
| - |
|
|
| 2,431 |
|
OTHER INCOME (EXPENSE): |
|
|
|
|
|
|
|
|
|
|
|
|
|
|
|
|
|
|
|
|
Equity in earnings of subsidiaries |
|
| 1,415 |
|
|
| 110 |
|
|
| - |
|
|
| (1,525 | ) |
|
| - |
|
Interest, net |
|
| (245 | ) |
|
| 13 |
|
|
| - |
|
|
| - |
|
|
| (232 | ) |
Intercompany charges, net |
|
| 246 |
|
|
| (145 | ) |
|
| (101 | ) |
|
| - |
|
|
| - |
|
Other, net |
|
| (1 | ) |
|
| (10 | ) |
|
| 32 |
|
|
| - |
|
|
| 21 |
|
INCOME BEFORE INCOME TAXES |
|
| 1,415 |
|
|
| 2,026 |
|
|
| 304 |
|
|
| (1,525 | ) |
|
| 2,220 |
|
Provision for income taxes |
|
| - |
|
|
| 671 |
|
|
| 134 |
|
|
| - |
|
|
| 805 |
|
NET INCOME |
| $ | 1,415 |
|
| $ | 1,355 |
|
| $ | 170 |
|
| $ | (1,525 | ) |
| $ | 1,415 |
|
COMPREHENSIVE INCOME |
| $ | 1,378 |
|
| $ | 1,337 |
|
| $ | (31 | ) |
| $ | (1,525 | ) |
| $ | 1,159 |
|
- 23 -
CONDENSED CONSOLIDATING STATEMENTS OF CASH FLOWS
(UNAUDITED)
Six Months Ended November 30, 2017
|
| Parent |
|
| Guarantor Subsidiaries |
|
| Non-guarantor Subsidiaries |
|
| Eliminations |
|
| Consolidated |
| |||||
CASH PROVIDED BY (USED IN) OPERATING ACTIVITIES |
| $ | (1,959 | ) |
| $ | 3,504 |
|
| $ | (66 | ) |
| $ | 19 |
|
| $ | 1,498 |
|
INVESTING ACTIVITIES |
|
|
|
|
|
|
|
|
|
|
|
|
|
|
|
|
|
|
|
|
Capital expenditures |
|
| - |
|
|
| (2,474 | ) |
|
| (147 | ) |
|
| - |
|
|
| (2,621 | ) |
Business acquisitions, net of cash acquired |
|
| - |
|
|
| (44 | ) |
|
| - |
|
|
| - |
|
|
| (44 | ) |
Proceeds from asset dispositions and other |
|
| - |
|
|
| 12 |
|
|
| - |
|
|
| - |
|
|
| 12 |
|
CASH USED IN INVESTING ACTIVITIES |
|
| - |
|
|
| (2,506 | ) |
|
| (147 | ) |
|
| - |
|
|
| (2,653 | ) |
FINANCING ACTIVITIES |
|
|
|
|
|
|
|
|
|
|
|
|
|
|
|
|
|
|
|
|
Net transfers from (to) Parent |
|
| 947 |
|
|
| (1,019 | ) |
|
| 72 |
|
|
| - |
|
|
| - |
|
Payment on loan between subsidiaries |
|
| 167 |
|
|
| - |
|
|
| (167 | ) |
|
| - |
|
|
| - |
|
Proceeds from short-term borrowings |
|
| 250 |
|
|
| - |
|
|
| - |
|
|
| - |
|
|
| 250 |
|
Principal payments on debt |
|
| - |
|
|
| (18 | ) |
|
| (10 | ) |
|
| - |
|
|
| (28 | ) |
Proceeds from stock issuances |
|
| 205 |
|
|
| - |
|
|
| - |
|
|
| - |
|
|
| 205 |
|
Dividends paid |
|
| (268 | ) |
|
| - |
|
|
| - |
|
|
| - |
|
|
| (268 | ) |
Purchase of treasury stock |
|
| (270 | ) |
|
| - |
|
|
| - |
|
|
| - |
|
|
| (270 | ) |
Other, net |
|
| 3 |
|
|
| - |
|
|
| - |
|
|
| - |
|
|
| 3 |
|
CASH (USED IN) PROVIDED BY FINANCING ACTIVITIES |
|
| 1,034 |
|
|
| (1,037 | ) |
|
| (105 | ) |
|
| - |
|
|
| (108 | ) |
Effect of exchange rate changes on cash |
|
| - |
|
|
| 56 |
|
|
| 6 |
|
|
| - |
|
|
| 62 |
|
Net (decrease) increase in cash and cash equivalents |
|
| (925 | ) |
|
| 17 |
|
|
| (312 | ) |
|
| 19 |
|
|
| (1,201 | ) |
Cash and cash equivalents at beginning of period |
|
| 1,884 |
|
|
| 325 |
|
|
| 1,807 |
|
|
| (47 | ) |
|
| 3,969 |
|
Cash and cash equivalents at end of period |
| $ | 959 |
|
| $ | 342 |
|
| $ | 1,495 |
|
| $ | (28 | ) |
| $ | 2,768 |
|
- 24 -
CONDENSED CONSOLIDATING STATEMENTS OF CASH FLOWS
(UNAUDITED)
Six Months Ended November 30, 2016
|
| Parent |
|
| Guarantor Subsidiaries |
|
| Non-guarantor Subsidiaries |
|
| Eliminations |
|
| Consolidated |
| |||||
CASH PROVIDED BY (USED IN) OPERATING ACTIVITIES |
| $ | (376 | ) |
| $ | 2,550 |
|
| $ | 473 |
|
| $ | (12 | ) |
| $ | 2,635 |
|
INVESTING ACTIVITIES |
|
|
|
|
|
|
|
|
|
|
|
|
|
|
|
|
|
|
|
|
Capital expenditures |
|
| - |
|
|
| (2,455 | ) |
|
| (226 | ) |
|
| - |
|
|
| (2,681 | ) |
Proceeds from asset dispositions and other |
|
| 84 |
|
|
| 13 |
|
|
| 3 |
|
|
| - |
|
|
| 100 |
|
CASH USED IN INVESTING ACTIVITIES |
|
| 84 |
|
|
| (2,442 | ) |
|
| (223 | ) |
|
| - |
|
|
| (2,581 | ) |
FINANCING ACTIVITIES |
|
|
|
|
|
|
|
|
|
|
|
|
|
|
|
|
|
|
|
|
Net transfers from (to) Parent |
|
| 24 |
|
|
| (94 | ) |
|
| 70 |
|
|
| - |
|
|
| - |
|
Payment on loan between subsidiaries |
|
| 8 |
|
|
| (15 | ) |
|
| 7 |
|
|
| - |
|
|
| - |
|
Intercompany dividends |
|
| - |
|
|
| 1 |
|
|
| (1 | ) |
|
| - |
|
|
| - |
|
Principal payments on debt |
|
| - |
|
|
| (31 | ) |
|
| (12 | ) |
|
| - |
|
|
| (43 | ) |
Proceeds from stock issuances |
|
| 164 |
|
|
| - |
|
|
| - |
|
|
| - |
|
|
| 164 |
|
Dividends paid |
|
| (213 | ) |
|
| - |
|
|
| - |
|
|
| - |
|
|
| (213 | ) |
Purchase of treasury stock |
|
| (334 | ) |
|
| - |
|
|
| - |
|
|
| - |
|
|
| (334 | ) |
Other, net |
|
| 4 |
|
|
| (2 | ) |
|
| (7 | ) |
|
| - |
|
|
| (5 | ) |
CASH (USED IN) PROVIDED BY FINANCING ACTIVITIES |
|
| (347 | ) |
|
| (141 | ) |
|
| 57 |
|
|
| - |
|
|
| (431 | ) |
Effect of exchange rate changes on cash |
|
| (5 | ) |
|
| 1 |
|
|
| (94 | ) |
|
| - |
|
|
| (98 | ) |
Net (decrease) increase in cash and cash equivalents |
|
| (644 | ) |
|
| (32 | ) |
|
| 213 |
|
|
| (12 | ) |
|
| (475 | ) |
Cash and cash equivalents at beginning of period |
|
| 1,974 |
|
|
| 326 |
|
|
| 1,277 |
|
|
| (43 | ) |
|
| 3,534 |
|
Cash and cash equivalents at end of period |
| $ | 1,330 |
|
| $ | 294 |
|
| $ | 1,490 |
|
| $ | (55 | ) |
| $ | 3,059 |
|
- 25 -
REPORT OF INDEPE NDENT REGISTERED
PUBLIC ACCOUNTING FIRM
The Board of Directors and Stockholders
FedEx Corporation
We have reviewed the condensed consolidated balance sheet of FedEx Corporation as of November 30, 2017, and the related condensed consolidated statements of income and comprehensive income for the three-month and six-month periods ended November 30, 2017 and November 30, 2016 and the condensed consolidated statements of cash flows for the six-month periods ended November 30, 2017 and November 30, 2016. These financial statements are the responsibility of the Company's management.
We conducted our review in accordance with the standards of the Public Company Accounting Oversight Board (United States). A review of interim financial information consists principally of applying analytical procedures and making inquiries of persons responsible for financial and accounting matters. It is substantially less in scope than an audit conducted in accordance with the standards of the Public Company Accounting Oversight Board (United States), the objective of which is the expression of an opinion regarding the financial statements taken as a whole. Accordingly, we do not express such an opinion.
Based on our review, we are not aware of any material modifications that should be made to the condensed consolidated financial statements referred to above for them to be in conformity with U.S. generally accepted accounting principles.
We have previously audited, in accordance with the standards of the Public Company Accounting Oversight Board (United States), the consolidated balance sheet of FedEx Corporation as of May 31, 2017, and the related consolidated statements of income, comprehensive income, changes in stockholders' investment, and cash flows for the year then ended (not presented herein) and we expressed an unqualified audit opinion on those consolidated financial statements in our report dated July 17, 2017. In our opinion, the accompanying condensed consolidated balance sheet of FedEx Corporation as of May 31, 2017, is fairly stated, in all material respects, in relation to the consolidated balance sheet from which it has been derived.
/s/ Ernst & Young LLP
Memphis, Tennessee
December 20, 2017
- 26 -
Item 2. Management's Discussion and Analysis of Results of Operations and Financial Condition
GENERAL
The following Management's Discussion and Analysis of Results of Operations and Financial Condition ("MD&A") describes the principal factors affecting the results of operations, liquidity, capital resources, contractual cash obligations and critical accounting estimates of FedEx Corporation ("FedEx"). This discussion should be read in conjunction with the accompanying quarterly unaudited condensed consolidated financial statements and our Annual Report on Form 10-K for the year ended May 31, 2017 ("Annual Report"). Our Annual Report includes additional information about our significant accounting policies, practices and the transactions that underlie our financial results, as well as a detailed discussion of the most significant risks and uncertainties associated with our financial condition and operating results.
We provide a broad portfolio of transportation, e-commerce and business services through companies competing collectively, operating independently and managed collaboratively, under the respected FedEx brand. Our primary operating companies are Federal Express Corporation ("FedEx Express"), including TNT Express B.V. ("TNT Express"), the world's largest express transportation company; FedEx Ground Package System, Inc. ("FedEx Ground"), a leading North American provider of small-package ground delivery services; and FedEx Freight, Inc. ("FedEx Freight"), a leading U.S. provider of less-than-truckload ("LTL") freight services. These companies represent our major service lines and, along with FedEx Corporate Services, Inc. ("FedEx Services"), form the core of our reportable segments.
As noted in our Annual Report, beginning in the first quarter of 2018, we began to report TNT Express as part of the FedEx Express segment. Prior year amounts have been revised to conform to the current year presentation. See Note 6 of the accompanying unaudited condensed consolidated financial statements for further discussion.
Our FedEx Services segment provides sales, marketing, information technology, communications, customer service, technical support, billing and collection services and certain back-office support functions that support our transportation segments. In addition, the FedEx Services segment provides customers with retail access to FedEx Express and FedEx Ground shipping services through FedEx Office and Print Services, Inc. ("FedEx Office"). See "Reportable Segments" for further discussion. Additional information on our businesses can also be found in our Annual Report.
The key indicators necessary to understand our operating results include:
• | the overall customer demand for our various services based on macro-economic factors and the global economy; |
• | the volumes of transportation services provided through our networks, primarily measured by our average daily volume and shipment weight and size; |
• | the mix of services purchased by our customers; |
• | the prices we obtain for our services, primarily measured by yield (revenue per package or pound or revenue per shipment or hundredweight for LTL freight shipments); |
• | our ability to manage our network capacity and cost structure (capital expenditures and operating expenses) to match shifting volume levels; and |
• | the timing and amount of fluctuations in fuel prices and our ability to recover incremental fuel costs through our fuel surcharges. |
The majority of our operating expenses are directly impacted by revenue and volume levels. Accordingly, we expect these operating expenses to fluctuate on a year-over-year basis consistent with the change in revenues and volumes. Therefore, the discussion of operating expense captions focuses on the key drivers and trends impacting expenses other than changes in revenues and volume. The line item "Other operating expenses" predominantly includes costs associated with outside service contracts (such as security, facility services and cargo handling), insurance, professional fees, uniforms and taxes and licenses.
Except as otherwise specified, references to years indicate our fiscal year ending May 31, 2018 or ended May 31 of the year referenced and comparisons are to the corresponding period of the prior year. References to our transportation segments include, collectively, the FedEx Express segment, the FedEx Ground segment and the FedEx Freight segment.
- 27 -
RESULTS OF OPERATIONS
CONSOLIDATED RESULTS
The following tables compare summary operating results and changes in revenue and operating income (dollars in millions, except per share amounts) for the periods ended November 30:
|
| Three Months Ended |
|
| Percent |
|
|
| Six Months Ended |
|
| Percent |
|
| ||||||||||||
|
| 2017 |
|
| 2016 |
|
| Change |
|
|
| 2017 |
|
| 2016 |
|
| Change |
|
| ||||||
Revenues |
| $ | 16,313 |
|
| $ | 14,931 |
|
|
| 9 |
|
|
| $ | 31,610 |
|
| $ | 29,594 |
|
|
| 7 |
|
|
Operating income: |
|
|
|
|
|
|
|
|
|
|
|
|
|
|
|
|
|
|
|
|
|
|
|
|
|
|
FedEx Express segment |
|
| 717 |
|
|
| 706 |
|
|
| 2 |
|
|
|
| 1,150 |
|
|
| 1,316 |
|
|
| (13 | ) |
|
FedEx Ground segment |
|
| 521 |
|
|
| 465 |
|
|
| 12 |
|
|
|
| 1,147 |
|
|
| 1,075 |
|
|
| 7 |
|
|
FedEx Freight segment |
|
| 118 |
|
|
| 88 |
|
|
| 34 |
|
|
|
| 294 |
|
|
| 223 |
|
|
| 32 |
|
|
Eliminations, corporate and other |
|
| (94 | ) |
|
| (92 | ) |
|
| (2 | ) |
|
|
| (212 | ) |
|
| (183 | ) |
|
| (16 | ) |
|
Consolidated operating income |
|
| 1,262 |
|
|
| 1,167 |
|
|
| 8 |
|
|
|
| 2,379 |
|
|
| 2,431 |
|
|
| (2 | ) |
|
Operating margin: |
|
|
|
|
|
|
|
|
|
|
|
|
|
|
|
|
|
|
|
|
|
|
|
|
|
|
FedEx Express segment |
|
| 7.7 | % |
|
| 8.2 | % |
|
| (50 | ) | bp |
|
| 6.4 | % |
|
| 7.7 | % |
|
| (130 | ) | bp |
FedEx Ground segment |
|
| 10.6 | % |
|
| 10.5 | % |
|
| 10 |
| bp |
|
| 12.0 | % |
|
| 12.3 | % |
|
| (30 | ) | bp |
FedEx Freight segment |
|
| 6.7 | % |
|
| 5.5 | % |
|
| 120 |
| bp |
|
| 8.4 | % |
|
| 6.9 | % |
|
| 150 |
| bp |
Consolidated operating margin |
|
| 7.7 | % |
|
| 7.8 | % |
|
| (10 | ) | bp |
|
| 7.5 | % |
|
| 8.2 | % |
|
| (70 | ) | bp |
Consolidated net income |
| $ | 775 |
|
| $ | 700 |
|
|
| 11 |
|
|
| $ | 1,371 |
|
| $ | 1,415 |
|
|
| (3 | ) |
|
Diluted earnings per share |
| $ | 2.84 |
|
| $ | 2.59 |
|
|
| 10 |
|
|
| $ | 5.03 |
|
| $ | 5.24 |
|
|
| (4 | ) |
|
|
| Change in Revenue |
|
| Change in Operating Income |
| ||||||||||
|
| Three Months Ended |
|
| Six Months Ended |
|
| Three Months Ended |
|
| Six Months Ended |
| ||||
FedEx Express segment |
| $ | 712 |
|
| $ | 904 |
|
| $ | 11 |
|
| $ | (166 | ) |
FedEx Ground segment |
|
| 510 |
|
|
| 859 |
|
|
| 56 |
|
|
| 72 |
|
FedEx Freight segment |
|
| 165 |
|
|
| 259 |
|
|
| 30 |
|
|
| 71 |
|
FedEx Services segment |
|
| 2 |
|
|
| 7 |
|
|
| - |
|
|
| - |
|
Eliminations, corporate and other |
|
| (7 | ) |
|
| (13 | ) |
|
| (2 | ) |
|
| (29 | ) |
|
| $ | 1,382 |
|
| $ | 2,016 |
|
| $ | 95 |
|
| $ | (52 | ) |
Overview
Our results improved in the second quarter of 2018 primarily due to increased yields, volume growth and the favorable net impact of fuel at all of our transportation segments. These factors were partially offset by the continued impact of the NotPetya cyberattack described below. The cyberattack also drove declining results in the first half of 2018, which were partially offset by the same positive factors noted above.
Our results were negatively impacted by the NotPetya cyberattack by an estimated $100 million or $0.31 per diluted share in the second quarter of 2018 and by an estimated $400 million or $1.10 per diluted share in the first half of 2018, primarily from loss of revenue due to decreased shipments in the TNT Express network, as well as incremental costs to restore information technology systems.
As previously announced, on June 27, 2017, the worldwide operations of TNT Express were significantly affected by the cyberattack known as NotPetya. Immediately following the attack, contingency plans were implemented to recover TNT Express operations and communications systems, and substantially all TNT Express services were fully restored during the first quarter of 2018. All of TNT Express's critical operational systems have now been fully restored, critical business data has been recovered and shipping services and solutions are back in place. However, not all customers are shipping at pre-attack volume levels. For a description of the ongoing impact of the cyberattack, see the discussion under the heading "Outlook" below.
- 28 -
We also incurred TNT Express integration expenses totaling an aggregate of $122 million ($91 million, net of tax, or $0.33 per dilu ted share) in the second quarter of 2018, a $64 million increase from the second quarter of 2017. TNT Express integration expenses were an aggregate $234 million ($173 million, net of tax, or $0.64 per diluted share) in the first half of 2018, a $108 milli on increase from the first half of 2017. The integration expenses are incremental costs directly associated with the integration of TNT Express, including professional and legal fees, salaries and wages, advertising expenses and travel. Internal salaries a nd wages are included only to the extent the individuals are assigned full time to integration activities. These costs were incurred at FedEx Express and FedEx Corporation. The identification of these costs as integration-related expenditures is subject to our disclosure controls and procedures.
In addition, our results include a tax benefit of approximately $80 million ($0.29 per diluted share) in the second quarter of 2018 attributable to foreign tax credits associated with a dividend paid from our foreign operations.
- 29 -
The following graphs for FedEx Express, FedEx Ground and FedEx Freight show selected volume trends (in thousands) over the five most recent quarters:
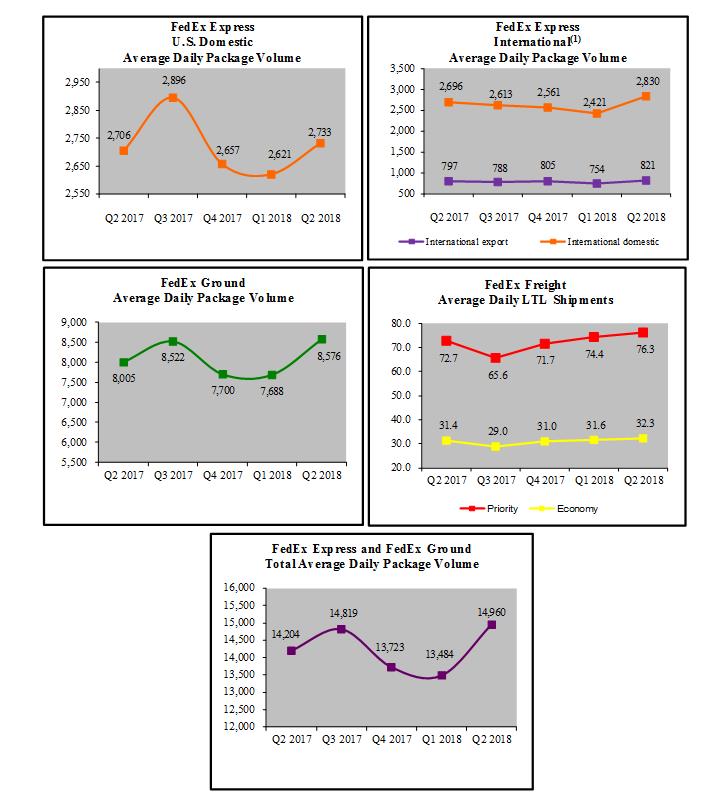
(1) | International domestic average daily package volume represents our international intra-country operations. |
- 30 -
The following graphs for FedEx Express, FedEx Ground and FedEx Freight show selected yield trends over the five most recent quarters:
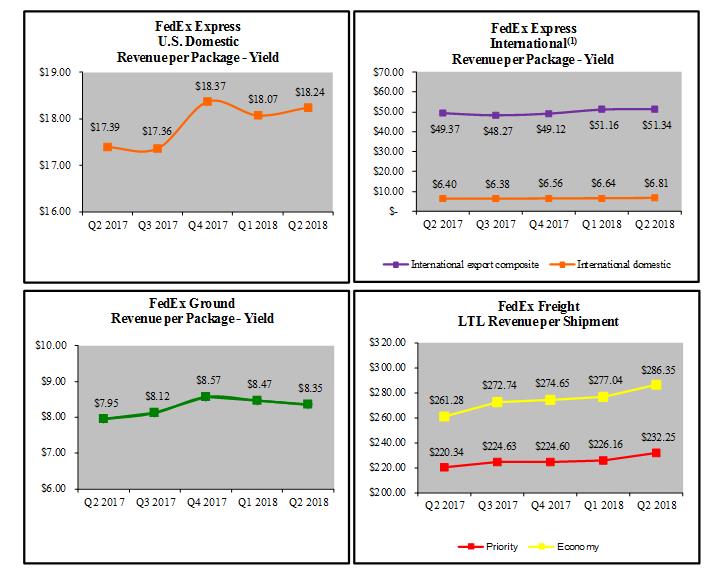
(1) | International domestic revenue per package represents our international intra-country operations. |
Revenue
Revenues increased 9% in the second quarter and 7% in the first half of 2018 due to improved performance at all of our transportation segments. Revenues at FedEx Express increased 8% in the second quarter and 5% in the first half of 2018 due to improved base yields, volume growth and favorable exchange rates, which were partially offset by the loss of volume due to the NotPetya cyberattack. At FedEx Ground, revenues increased 12% in the second quarter and 10% in the first half of 2018 due to volume growth and increased yields. FedEx Freight revenues increased 10% in the second quarter and 8% in the first half of 2018 due to higher LTL revenue per shipment and average daily LTL shipments. Higher fuel surcharges had a positive impact on revenues at all of our transportation segments in the second quarter and first half of 2018.
- 31 -
Operating Expenses
The following tables compare operating expenses expressed as dollar amounts (in millions) and as a percent of revenue for the periods ended November 30:
|
| Three Months Ended |
|
| Six Months Ended |
| ||||||||||
|
| 2017 |
|
| 2016 |
|
| 2017 |
|
| 2016 |
| ||||
Operating expenses: |
|
|
|
|
|
|
|
|
|
|
|
|
|
|
|
|
Salaries and employee benefits |
| $ | 5,742 |
|
| $ | 5,353 |
|
| $ | 11,260 |
|
| $ | 10,664 |
|
Purchased transportation |
|
| 3,840 |
|
|
| 3,431 |
|
|
| 7,285 |
|
|
| 6,671 |
|
Rentals and landing fees |
|
| 835 |
|
|
| 802 |
|
|
| 1,653 |
|
|
| 1,592 |
|
Depreciation and amortization |
|
| 756 |
|
|
| 740 |
|
|
| 1,507 |
|
|
| 1,479 |
|
Fuel |
|
| 818 |
|
|
| 658 |
|
|
| 1,521 |
|
|
| 1,308 |
|
Maintenance and repairs |
|
| 665 |
|
|
| 579 |
|
|
| 1,340 |
|
|
| 1,177 |
|
Other |
|
| 2,395 |
|
|
| 2,201 |
|
|
| 4,665 |
|
|
| 4,272 |
|
Total operating expenses |
| $ | 15,051 |
|
| $ | 13,764 |
|
| $ | 29,231 |
|
| $ | 27,163 |
|
Operating income |
| $ | 1,262 |
|
| $ | 1,167 |
|
| $ | 2,379 |
|
| $ | 2,431 |
|
|
| Percent of Revenue |
|
| ||||||||||||||||
|
| Three Months Ended |
|
|
| Six Months Ended |
|
| ||||||||||||
|
| 2017 |
|
|
| 2016 |
|
|
| 2017 |
|
|
| 2016 |
|
| ||||
Operating expenses: |
|
|
|
|
|
|
|
|
|
|
|
|
|
|
|
|
|
|
|
|
Salaries and employee benefits |
|
| 35.2 |
| % |
|
| 35.8 |
| % |
|
| 35.6 |
| % |
|
| 36.1 |
| % |
Purchased transportation |
|
| 23.6 |
|
|
|
| 23.0 |
|
|
|
| 23.1 |
|
|
|
| 22.5 |
|
|
Rentals and landing fees |
|
| 5.1 |
|
|
|
| 5.4 |
|
|
|
| 5.2 |
|
|
|
| 5.4 |
|
|
Depreciation and amortization |
|
| 4.6 |
|
|
|
| 5.0 |
|
|
|
| 4.8 |
|
|
|
| 5.0 |
|
|
Fuel |
|
| 5.0 |
|
|
|
| 4.4 |
|
|
|
| 4.8 |
|
|
|
| 4.4 |
|
|
Maintenance and repairs |
|
| 4.1 |
|
|
|
| 3.9 |
|
|
|
| 4.2 |
|
|
|
| 4.0 |
|
|
Other |
|
| 14.7 |
|
|
|
| 14.7 |
|
|
|
| 14.8 |
|
|
|
| 14.4 |
|
|
Total operating expenses |
|
| 92.3 |
|
|
|
| 92.2 |
|
|
|
| 92.5 |
|
|
|
| 91.8 |
|
|
Operating margin |
|
| 7.7 |
| % |
|
| 7.8 |
| % |
|
| 7.5 |
| % |
|
| 8.2 |
| % |
Operating margin declined in the second quarter and first half of 2018 primarily as a result of the NotPetya cyberattack discussed above and increased TNT Express integration expenses.
Purchased transportation costs increased 12% in the second quarter and 9% in the first half of 2018 primarily due to higher volumes at all of our transportation segments, higher rates at FedEx Ground and unfavorable exchange rates at FedEx Express. Salaries and employee benefits expense increased 7% in the second quarter and 6% in the first half of 2018 primarily due to volume growth and merit increases at our transportation segments. Other expenses increased 9% in the second quarter and first half of 2018 primarily due to TNT Express integration expenses at FedEx Express and higher self-insurance reserves at FedEx Ground. Maintenance and repairs expense increased 15% in the second quarter and 14% in the first half of 2018 primarily due to the timing of aircraft maintenance events at FedEx Express.
- 32 -
Fuel
The following graph for our transportation segments shows our average cost of jet and vehicle fuel per gallon for the five most recent quarters:
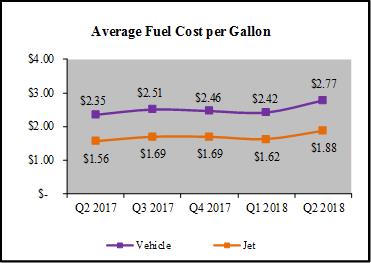
Fuel expense increased 24% in the second quarter and 16% in the first half of 2018 primarily due to increased fuel prices. Fuel prices represent only one component of the two factors we consider meaningful in understanding the impact of fuel on our business. Consideration must also be given to the fuel surcharge revenue we collect. Accordingly, we believe discussion of the net impact of fuel on our results, which is a comparison of the year-over-year change in these two factors, is important to understand the impact of fuel on our business. In order to provide information about the impact of fuel surcharges on the trend in revenue and yield growth, we have included the comparative weighted-average fuel surcharge percentages in effect for the second quarter of 2018 and 2017 in the accompanying discussions of each of our transportation segments.
Effective February 6, 2017, FedEx Express and FedEx Ground fuel surcharges are adjusted on a weekly basis. The fuel surcharge is based on a weekly fuel price from two weeks prior to the week in which it is assessed. The index used to determine the fuel surcharge percentage for our FedEx Freight business continues to adjust weekly. Some FedEx Express international fuel surcharges continue to incorporate a timing lag of approximately six to eight weeks.
Prior to February 6, 2017, our fuel surcharges for the FedEx Express and FedEx Ground businesses incorporated a timing lag of approximately six to eight weeks before they were adjusted for changes in fuel prices. For example, the fuel surcharge index in effect at FedEx Express in January 2017 was set based on November 2016 fuel prices.
Beyond these factors, the manner in which we purchase fuel also influences the net impact of fuel on our results. For example, our contracts for jet fuel purchases at FedEx Express are tied to various indices, including the U.S. Gulf Coast index. While many of these indices are aligned, each index may fluctuate at a different pace, driving variability in the prices paid for jet fuel. Furthermore, under these contractual arrangements, approximately 70% of our jet fuel is purchased based on the index price for the preceding week, with the remainder of our purchases tied to the index price for the preceding month, rather than based on daily spot rates. These contractual provisions mitigate the impact of rapidly changing daily spot rates on our jet fuel purchases.
Because of the factors described above, our operating results may be affected should the market price of fuel suddenly change by a significant amount or change by amounts that do not result in an adjustment in our fuel surcharges, which can significantly affect our earnings either positively or negatively in the short-term.
The net impact of fuel had a significant benefit to operating income in the second quarter and first half of 2018 as higher fuel surcharges more than offset increased fuel prices.
The net impact of fuel on our operating results does not consider the effects that fuel surcharge levels may have on our business, including changes in demand and shifts in the mix of services purchased by our customers. While fluctuations in fuel surcharge percentages can be significant from period to period, fuel surcharges represent one of the many individual components of our pricing structure that impact our overall revenue and yield. Additional components include the mix of services sold, the base price and extra service charges we obtain for these services and the level of pricing discounts offered.
- 33 -
Income Taxes
Our effective tax rate was 32.0% for the second quarter and 35.4% for the first half of 2018, compared with 35.1% in the second quarter and 36.3% for the first half of 2017. The 2018 effective tax rate benefited from foreign tax credits associated with a dividend paid from our foreign operations. We recognized approximately $80 million of this benefit in the second quarter and the full-year benefit from this dividend will be considered in our annual effective tax rate for 2018. These benefits were partially offset by the effect of the cyberattack on lower-taxed foreign earnings, changes in uncertain tax positions and tax costs incurred in the first quarter of 2018 in connection with the integration of TNT Express. For a description of pending U.S. tax legislation, see the "Outlook" section below.
We are subject to taxation in the United States and various U.S. state, local and foreign jurisdictions. We are currently under examination by the Internal Revenue Service for the 2014 and 2015 tax years. It is reasonably possible that certain income tax return proceedings will be completed during the next twelve months and could result in a change in our balance of unrecognized tax benefits. The expected impact of any changes would not be material to our consolidated financial statements. As of November 30, 2017, there were no material changes to our liabilities for unrecognized tax benefits from May 31, 2017.
Business Acquisition
On October 13, 2017, FedEx acquired Northwest Research, Inc., a leader in inventory research and management, for $50 million in cash from operations. The majority of the purchase price was allocated to property, plant and equipment. The financial results of this acquired business are included in the FedEx Services segment from the date of acquisition and were not material to our results of operations.
Outlook
We expect yield and volume growth at all of our transportation segments to support revenue and earnings growth in the second half of 2018, prior to any mark-to-market benefit plans adjustment. In addition, we are implementing various cost reduction plans at FedEx Ground for the remainder of 2018. We expect ongoing, but diminishing, financial impacts from the cyberattack in the second half of 2018 in the form of lower revenues. However, we are highly focused on improving TNT Express revenues and volumes. Consequences and risks associated with the ongoing impact of the cyberattack that could negatively impact results of operations and financial condition in the future, particularly if our continuing recovery efforts do not proceed as expected, are described in Part II, Item 1A Risk Factors of this Quarterly Report on Form 10-Q. In addition, our third quarter and full-year 2018 results will be negatively affected by our TNT Express integration activities.
Our expectations for earnings growth in 2018 assumes moderate economic growth and continued recovery from the cyberattack.
During the remainder of 2018, we will continue to execute our TNT Express integration plans. The integration process is complex as it spans over 200 countries and involves combining our pickup and delivery operations at a local level, our global and regional air and ground networks, and our extensive operations, customs clearance, sales and back-office information technology systems. The integration is expected to be substantially complete by the end of 2020. We are targeting operating income improvement at the FedEx Express segment of $1.2 billion to $1.5 billion in 2020 from 2017 assuming moderate economic growth, current accounting rules and U.S. tax laws and continued recovery from the NotPetya cyberattack. This target includes TNT Express synergies, as well as base business and other operational improvements across the global FedEx Express network.
We expect the aggregate integration program expense, including restructuring charges at TNT Express, over the four years to be up to $1.4 billion and expect to incur approximately $450 million of these costs during 2018. Our expected integration expenses have increased from our previous estimates of $350 million for 2018 and $800 million in total based on our decision to accelerate the integration process and to increase investments to move TNT Express information technology, operations and commercial infrastructure to FedEx infrastructure due to the recent cyberattack at TNT Express. In addition, we have identified opportunities to improve the capabilities of the integrated business for future profitability, including in periods beyond 2020. Further, a portion of the incremental integration expenses relate to the ongoing establishment of our new international corporate structure which will leverage synergies to maximize our international profitability, ultimately benefiting our effective tax rate. The timing and amount of integration expenses and capital investments in any future period may change as we implement our plans.
As of the date of this filing, Congress has passed and the President is expected to sign the Tax Cuts and Jobs Act of 2017 into law. If enacted, we estimate a tax benefit between $1.2 billion and $1.5 billion for 2018, primarily due to the revaluation of our net deferred tax liabilities as well as a lower tax rate on 2018 earnings.
- 34 -
Other Outlook Matters. For details on key 2018 capital projects, refer to the "Liquidity Outlook" section of this MD&A.
FedEx Ground previously announced plans to implement the Independent Service Provider ("ISP") model throughout its entire U.S. pickup and delivery network, including the 29 states that had not yet begun transitioning to the ISP model. The transition to the ISP model in these 29 states is being accomplished on a district-by-district basis and is expected to be completed in the second half of calendar 2020. As of November 30, 2017, 64% of FedEx Ground volume was being delivered by small businesses operating under the ISP model. The costs associated with these transitions will be recognized in the periods incurred and are not expected to be material to any future quarter.
See "Forward-Looking Statements" for a discussion of these and other potential risks and uncertainties that could materially affect our future performance.
RECENT ACCOUNTING GUIDANCE
New accounting rules and disclosure requirements can significantly impact our reported results and the comparability of our financial statements. We believe the following new accounting guidance is relevant to the readers of our financial statements.
During the first quarter of 2018, we early adopted the Accounting Standards Update issued by the Financial Accounting Standards Board ("FASB") related to Intra-Entity Transfers of Assets Other Than Inventory. This update requires companies to recognize the income tax consequences of intra-entity transfers of assets other than inventory when the transfer occurs, as opposed to when the assets are ultimately sold to an outside party. This new guidance had a minimal impact on our accounting and financial reporting for the second quarter and first half of 2018.
On May 28, 2014, the FASB and International Accounting Standards Board issued a new accounting standard that will supersede virtually all existing revenue recognition guidance under generally accepted accounting principles in the United States. This standard will be effective for us beginning June 1, 2018 (fiscal 2019). The fundamental principles of the new guidance are that companies should recognize revenue in a manner that reflects the timing of the transfer of services to customers and the amount of revenue recognized reflects the consideration that a company expects to receive for the goods and services provided. The new guidance establishes a five-step approach for the recognition of revenue. We are continuing to complete the assessment of the impact this new standard will have on our consolidated financial statements and related disclosures, including ongoing contract reviews. We do not anticipate that the new guidance will have a material impact on our revenue recognition policies, practices or systems.
On February 25, 2016, the FASB issued a new lease accounting standard which requires lessees to put most leases on their balance sheets but recognize the expenses in their income statements in a manner similar to current practice. The new standard states that a lessee will recognize a lease liability for the obligation to make lease payments and a right-of-use asset for the right to use the underlying asset for the lease term. Expenses related to leases determined to be operating leases will be recognized on a straight-line basis, while those determined to be financing leases will be recognized following a front-loaded expense profile in which interest and amortization are presented separately in the income statement. Based on our lease portfolio, we currently anticipate recognizing a lease liability and related right-of-use asset on the balance sheet in excess of $13 billion with an immaterial impact on our income statement compared to the current lease accounting model. However, the ultimate impact of the standard will depend on the company's lease portfolio as of the adoption date. We are currently in the process of evaluating our existing lease portfolios, including accumulating all of the necessary information required to properly account for the leases under the new standard. Additionally, we are implementing an enterprise-wide lease management system to assist in the accounting and are evaluating additional changes to our processes and internal controls to ensure we meet the standard's reporting and disclosure requirements. These changes will be effective for our fiscal year beginning June 1, 2019 (fiscal 2020), with a modified retrospective adoption method to the beginning of 2018.
In March 2017, the FASB issued an Accounting Standards Update that changes how employers that sponsor defined benefit pension or other postretirement benefit plans present the net periodic benefit cost in the income statement. This new guidance requires entities to report the service cost component in the same line item or items as other compensation costs. The other components of net benefit cost are required to be presented in the income statement separately from the service cost component outside of income from operations. This standard will impact our operating income but will have no impact on our net income or earnings per share. For example, adoption of this guidance would have reduced operating income by $146 million in the second quarter and $292 million in the first half of 2018, and by $112 million in the second quarter and $224 million in the first half of 2017, but would not have impacted our net income in these periods. This new guidance will be effective for our fiscal year beginning June 1, 2018 (fiscal 2019) and will be applied retrospectively.
- 35 -
REPORTABLE SEGMENTS
FedEx Express, FedEx Ground and FedEx Freight represent our major service lines and, along with FedEx Services, form the core of our reportable segments. Our reportable segments include the following businesses:
FedEx Express Segment | FedEx Express (express transportation) |
| TNT Express (international express transportation, small-package ground delivery and freight transportation) |
| FedEx Trade Networks (air and ocean freight forwarding, customs brokerage and cross-border enablement technology and solutions) |
|
|
FedEx Ground Segment | FedEx Ground (small-package ground delivery) |
| FedEx Supply Chain (third-party logistics) |
|
|
FedEx Freight Segment | FedEx Freight (LTL freight transportation) |
| FedEx Custom Critical (time-critical transportation) |
|
|
FedEx Services Segment | FedEx Services (sales, marketing, information technology, communications, customer service, technical support, billing and collection services and back-office functions) |
| FedEx Office (document and business services and package acceptance) |
FEDEX SERVICES SEGMENT
The line item "Intercompany charges" on the accompanying unaudited condensed consolidated financial statements of our transportation segments reflects the allocations from the FedEx Services segment to the respective transportation segments. The allocations of net operating costs are based on metrics such as relative revenues or estimated services provided.
The FedEx Services segment provides direct and indirect support to our transportation businesses, and we allocate all of the net operating costs of the FedEx Services segment (including the net operating results of FedEx Office) to reflect the full cost of operating our transportation businesses in the results of those segments. Within the FedEx Services segment allocation, the net operating results of FedEx Office, which are an immaterial component of our allocations, are allocated to FedEx Express and FedEx Ground. We review and evaluate the performance of our transportation segments based on operating income (inclusive of FedEx Services segment allocations). For the FedEx Services segment, performance is evaluated based on the impact of its total allocated net operating costs on our transportation segments. We believe these allocations approximate the net cost of providing these functions. Our allocation methodologies are refined periodically, as necessary, to reflect changes in our businesses.
ELIMINATIONS, CORPORATE AND OTHER
Certain FedEx operating companies provide transportation and related services for other FedEx companies outside their reportable segment. Billings for such services are based on negotiated rates, which we believe approximate fair value, and are reflected as revenues of the billing segment. These rates are adjusted from time to time based on market conditions. Such intersegment revenues and expenses are eliminated in our consolidated results and are not separately identified in the following segment information, because the amounts are not material.
Corporate and other includes corporate headquarters costs for executive officers and certain legal and financial functions, as well as certain other costs and credits not attributed to our core business. These costs are not allocated to the business segments.
- 36 -
FEDEX EXPRESS SEGMENT
FedEx Express offers a wide range of U.S. domestic and international shipping services for delivery of packages and freight including priority, deferred or economy services, which provide delivery on a time-definite or day-definite basis. As discussed in our Annual Report, we are reporting TNT Express as part of the FedEx Express segment. Prior year amounts have been revised to conform to the current year presentation. The following tables compare revenues, operating expenses, operating expenses as a percent of revenue, operating income (dollars in millions) and operating margin for the periods ended November 30:
|
| Three Months Ended |
|
| Percent |
|
|
| Six Months Ended |
|
| Percent |
|
| ||||||||||||
|
| 2017 |
|
| 2016 |
|
| Change |
|
|
| 2017 |
|
| 2016 |
|
| Change |
|
| ||||||
Revenues: |
|
|
|
|
|
|
|
|
|
|
|
|
|
|
|
|
|
|
|
|
|
|
|
|
|
|
Package: |
|
|
|
|
|
|
|
|
|
|
|
|
|
|
|
|
|
|
|
|
|
|
|
|
|
|
U.S. overnight box |
| $ | 1,787 |
|
| $ | 1,709 |
|
|
| 5 |
|
|
| $ | 3,537 |
|
| $ | 3,431 |
|
|
| 3 |
|
|
U.S. overnight envelope |
|
| 432 |
|
|
| 422 |
|
|
| 2 |
|
|
|
| 882 |
|
|
| 865 |
|
|
| 2 |
|
|
U.S. deferred |
|
| 922 |
|
|
| 834 |
|
|
| 11 |
|
|
|
| 1,800 |
|
|
| 1,644 |
|
|
| 9 |
|
|
Total U.S. domestic package revenue |
|
| 3,141 |
|
|
| 2,965 |
|
|
| 6 |
|
|
|
| 6,219 |
|
|
| 5,940 |
|
|
| 5 |
|
|
International priority |
|
| 1,839 |
|
|
| 1,762 |
|
|
| 4 |
|
|
|
| 3,580 |
|
|
| 3,477 |
|
|
| 3 |
|
|
International economy |
|
| 815 |
|
|
| 716 |
|
|
| 14 |
|
|
|
| 1,585 |
|
|
| 1,409 |
|
|
| 12 |
|
|
Total international export package revenue |
|
| 2,654 |
|
|
| 2,478 |
|
|
| 7 |
|
|
|
| 5,165 |
|
|
| 4,886 |
|
|
| 6 |
|
|
International domestic (1) |
|
| 1,214 |
|
|
| 1,088 |
|
|
| 12 |
|
|
|
| 2,258 |
|
|
| 2,103 |
|
|
| 7 |
|
|
Total package revenue |
|
| 7,009 |
|
|
| 6,531 |
|
|
| 7 |
|
|
|
| 13,642 |
|
|
| 12,929 |
|
|
| 6 |
|
|
Freight: |
|
|
|
|
|
|
|
|
|
|
|
|
|
|
|
|
|
|
|
|
|
|
|
|
|
|
U.S. |
|
| 688 |
|
|
| 612 |
|
|
| 12 |
|
|
|
| 1,301 |
|
|
| 1,228 |
|
|
| 6 |
|
|
International priority |
|
| 560 |
|
|
| 476 |
|
|
| 18 |
|
|
|
| 1,030 |
|
|
| 925 |
|
|
| 11 |
|
|
International economy |
|
| 481 |
|
|
| 419 |
|
|
| 15 |
|
|
|
| 862 |
|
|
| 828 |
|
|
| 4 |
|
|
International airfreight |
|
| 90 |
|
|
| 93 |
|
|
| (3 | ) |
|
|
| 173 |
|
|
| 186 |
|
|
| (7 | ) |
|
Total freight revenue |
|
| 1,819 |
|
|
| 1,600 |
|
|
| 14 |
|
|
|
| 3,366 |
|
|
| 3,167 |
|
|
| 6 |
|
|
Other (2) |
|
| 526 |
|
|
| 511 |
|
|
| 3 |
|
|
|
| 998 |
|
|
| 1,006 |
|
|
| (1 | ) |
|
Total revenues |
|
| 9,354 |
|
|
| 8,642 |
|
|
| 8 |
|
|
|
| 18,006 |
|
|
| 17,102 |
|
|
| 5 |
|
|
Operating expenses: |
|
|
|
|
|
|
|
|
|
|
|
|
|
|
|
|
|
|
|
|
|
|
|
|
|
|
Salaries and employee benefits |
|
| 3,321 |
|
|
| 3,114 |
|
|
| 7 |
|
|
|
| 6,517 |
|
|
| 6,223 |
|
|
| 5 |
|
|
Purchased transportation |
|
| 1,502 |
|
|
| 1,352 |
|
|
| 11 |
|
|
|
| 2,868 |
|
|
| 2,677 |
|
|
| 7 |
|
|
Rentals and landing fees |
|
| 498 |
|
|
| 485 |
|
|
| 3 |
|
|
|
| 988 |
|
|
| 972 |
|
|
| 2 |
|
|
Depreciation and amortization |
|
| 412 |
|
|
| 412 |
|
|
| - |
|
|
|
| 829 |
|
|
| 832 |
|
|
| - |
|
|
Fuel |
|
| 703 |
|
|
| 565 |
|
|
| 24 |
|
|
|
| 1,306 |
|
|
| 1,120 |
|
|
| 17 |
|
|
Maintenance and repairs |
|
| 447 |
|
|
| 379 |
|
|
| 18 |
|
|
|
| 907 |
|
|
| 772 |
|
|
| 17 |
|
|
Intercompany charges |
|
| 505 |
|
|
| 468 |
|
|
| 8 |
|
|
|
| 993 |
|
|
| 930 |
|
|
| 7 |
|
|
Other |
|
| 1,249 |
|
|
| 1,161 |
|
|
| 8 |
|
|
|
| 2,448 |
|
|
| 2,260 |
|
|
| 8 |
|
|
Total operating expenses |
|
| 8,637 |
|
|
| 7,936 |
|
|
| 9 |
|
|
|
| 16,856 |
|
|
| 15,786 |
|
|
| 7 |
|
|
Operating income |
| $ | 717 |
|
| $ | 706 |
|
|
| 2 |
|
|
| $ | 1,150 |
|
| $ | 1,316 |
|
|
| (13 | ) |
|
Operating margin |
|
| 7.7 | % |
|
| 8.2 | % |
|
| (50 | ) | bp |
|
| 6.4 | % |
|
| 7.7 | % |
|
| (130 | ) | bp |
(1) | International domestic revenues represent our international intra-country operations. |
(2) | Includes FedEx Trade Networks. |
- 37 -
|
| Percent of Revenue |
|
| ||||||||||||||||
|
| Three Months Ended |
|
|
| Six Months Ended |
|
| ||||||||||||
|
| 2017 |
|
|
| 2016 |
|
|
| 2017 |
|
|
| 2016 |
|
| ||||
Operating expenses: |
|
|
|
|
|
|
|
|
|
|
|
|
|
|
|
|
|
|
|
|
Salaries and employee benefits |
|
| 35.5 |
| % |
|
| 36.0 |
| % |
|
| 36.2 |
| % |
|
| 36.4 |
| % |
Purchased transportation |
|
| 16.1 |
|
|
|
| 15.7 |
|
|
|
| 15.9 |
|
|
|
| 15.7 |
|
|
Rentals and landing fees |
|
| 5.3 |
|
|
|
| 5.6 |
|
|
|
| 5.5 |
|
|
|
| 5.7 |
|
|
Depreciation and amortization |
|
| 4.4 |
|
|
|
| 4.8 |
|
|
|
| 4.6 |
|
|
|
| 4.9 |
|
|
Fuel |
|
| 7.5 |
|
|
|
| 6.5 |
|
|
|
| 7.3 |
|
|
|
| 6.5 |
|
|
Maintenance and repairs |
|
| 4.8 |
|
|
|
| 4.4 |
|
|
|
| 5.0 |
|
|
|
| 4.5 |
|
|
Intercompany charges |
|
| 5.4 |
|
|
|
| 5.4 |
|
|
|
| 5.5 |
|
|
|
| 5.4 |
|
|
Other |
|
| 13.3 |
|
|
|
| 13.4 |
|
|
|
| 13.6 |
|
|
|
| 13.2 |
|
|
Total operating expenses |
|
| 92.3 |
|
|
|
| 91.8 |
|
|
|
| 93.6 |
|
|
|
| 92.3 |
|
|
Operating margin |
|
| 7.7 |
| % |
|
| 8.2 |
| % |
|
| 6.4 |
| % |
|
| 7.7 |
| % |
The following table compares selected statistics (in thousands, except yield amounts) for the periods ended November 30:
|
| Three Months Ended |
|
| Percent |
|
| Six Months Ended |
|
| Percent |
| ||||||||||||
|
| 2017 |
|
| 2016 |
|
| Change |
|
| 2017 |
|
| 2016 |
|
| Change |
| ||||||
Package Statistics (1) |
|
|
|
|
|
|
|
|
|
|
|
|
|
|
|
|
|
|
|
|
|
|
|
|
Average daily package volume (ADV): |
|
|
|
|
|
|
|
|
|
|
|
|
|
|
|
|
|
|
|
|
|
|
|
|
U.S. overnight box |
|
| 1,248 |
|
|
| 1,283 |
|
|
| (3 | ) |
|
| 1,217 |
|
|
| 1,269 |
|
|
| (4 | ) |
U.S. overnight envelope |
|
| 547 |
|
|
| 557 |
|
|
| (2 | ) |
|
| 552 |
|
|
| 563 |
|
|
| (2 | ) |
U.S. deferred |
|
| 938 |
|
|
| 866 |
|
|
| 8 |
|
|
| 907 |
|
|
| 845 |
|
|
| 7 |
|
Total U.S. domestic ADV |
|
| 2,733 |
|
|
| 2,706 |
|
|
| 1 |
|
|
| 2,676 |
|
|
| 2,677 |
|
|
| - |
|
International priority |
|
| 544 |
|
|
| 538 |
|
|
| 1 |
|
|
| 523 |
|
|
| 519 |
|
|
| 1 |
|
International economy |
|
| 277 |
|
|
| 259 |
|
|
| 7 |
|
|
| 265 |
|
|
| 248 |
|
|
| 7 |
|
Total international export ADV |
|
| 821 |
|
|
| 797 |
|
|
| 3 |
|
|
| 788 |
|
|
| 767 |
|
|
| 3 |
|
International domestic (2) |
|
| 2,830 |
|
|
| 2,696 |
|
|
| 5 |
|
|
| 2,622 |
|
|
| 2,500 |
|
|
| 5 |
|
Total ADV |
|
| 6,384 |
|
|
| 6,199 |
|
|
| 3 |
|
|
| 6,086 |
|
|
| 5,944 |
|
|
| 2 |
|
Revenue per package (yield): |
|
|
|
|
|
|
|
|
|
|
|
|
|
|
|
|
|
|
|
|
|
|
|
|
U.S. overnight box |
| $ | 22.73 |
|
| $ | 21.15 |
|
|
| 7 |
|
| $ | 22.70 |
|
| $ | 21.13 |
|
|
| 7 |
|
U.S. overnight envelope |
|
| 12.53 |
|
|
| 12.00 |
|
|
| 4 |
|
|
| 12.48 |
|
|
| 11.98 |
|
|
| 4 |
|
U.S. deferred |
|
| 15.58 |
|
|
| 15.30 |
|
|
| 2 |
|
|
| 15.51 |
|
|
| 15.21 |
|
|
| 2 |
|
U.S. domestic composite |
|
| 18.24 |
|
|
| 17.39 |
|
|
| 5 |
|
|
| 18.15 |
|
|
| 17.33 |
|
|
| 5 |
|
International priority |
|
| 53.67 |
|
|
| 52.06 |
|
|
| 3 |
|
|
| 53.47 |
|
|
| 52.41 |
|
|
| 2 |
|
International economy |
|
| 46.77 |
|
|
| 43.80 |
|
|
| 7 |
|
|
| 46.86 |
|
|
| 44.28 |
|
|
| 6 |
|
International export composite |
|
| 51.34 |
|
|
| 49.37 |
|
|
| 4 |
|
|
| 51.25 |
|
|
| 49.78 |
|
|
| 3 |
|
International domestic (2) |
|
| 6.81 |
|
|
| 6.40 |
|
|
| 6 |
|
|
| 6.73 |
|
|
| 6.57 |
|
|
| 2 |
|
Composite package yield |
|
| 17.43 |
|
|
| 16.72 |
|
|
| 4 |
|
|
| 17.51 |
|
|
| 16.99 |
|
|
| 3 |
|
Freight Statistics (1) |
|
|
|
|
|
|
|
|
|
|
|
|
|
|
|
|
|
|
|
|
|
|
|
|
Average daily freight pounds: |
|
|
|
|
|
|
|
|
|
|
|
|
|
|
|
|
|
|
|
|
|
|
|
|
U.S. |
|
| 8,475 |
|
|
| 8,177 |
|
|
| 4 |
|
|
| 8,095 |
|
|
| 8,121 |
|
|
| - |
|
International priority |
|
| 5,706 |
|
|
| 5,417 |
|
|
| 5 |
|
|
| 5,300 |
|
|
| 5,099 |
|
|
| 4 |
|
International economy |
|
| 13,231 |
|
|
| 12,593 |
|
|
| 5 |
|
|
| 11,733 |
|
|
| 11,863 |
|
|
| (1 | ) |
International airfreight |
|
| 2,016 |
|
|
| 1,959 |
|
|
| 3 |
|
|
| 1,895 |
|
|
| 1,913 |
|
|
| (1 | ) |
Total average daily freight pounds |
|
| 29,428 |
|
|
| 28,146 |
|
|
| 5 |
|
|
| 27,023 |
|
|
| 26,996 |
|
|
| - |
|
Revenue per pound (yield): |
|
|
|
|
|
|
|
|
|
|
|
|
|
|
|
|
|
|
|
|
|
|
|
|
U.S. |
| $ | 1.29 |
|
| $ | 1.19 |
|
|
| 8 |
|
| $ | 1.26 |
|
| $ | 1.18 |
|
|
| 7 |
|
International priority |
|
| 1.56 |
|
|
| 1.39 |
|
|
| 12 |
|
|
| 1.52 |
|
|
| 1.42 |
|
|
| 7 |
|
International economy |
|
| 0.58 |
|
|
| 0.53 |
|
|
| 9 |
|
|
| 0.57 |
|
|
| 0.55 |
|
|
| 4 |
|
International airfreight |
|
| 0.71 |
|
|
| 0.76 |
|
|
| (7 | ) |
|
| 0.71 |
|
|
| 0.76 |
|
|
| (7 | ) |
Composite freight yield |
|
| 0.98 |
|
|
| 0.90 |
|
|
| 9 |
|
|
| 0.97 |
|
|
| 0.92 |
|
|
| 5 |
|
(1) | Package and freight statistics include only the operations of FedEx Express and TNT Express. |
(2) | International domestic statistics represent our international intra-country operations. |
- 38 -
FedEx Express Segment Revenues
FedEx Express segment revenues increased 8% in the second quarter and 5% in the first half of 2018 primarily due to improved base yields and growth in international services, as well as higher fuel surcharges and favorable exchange rates. These factors were partially offset by the NotPetya cyberattack discussed above.
U.S. domestic package yields increased 5% in the second quarter and the first half of 2018 primarily due to higher base rates and fuel surcharges. U.S. domestic average daily volume increased 1% in the second quarter and remained flat in the first half of 2018 driven by our U.S. deferred service, offset by declines in our overnight service offerings. International export package yields increased 4% in the second quarter and 3% in the first half of 2018 due to higher fuel surcharges, favorable exchange rates and favorable service mix, partially offset by lower base rates. International export average daily volumes increased 3% in the second quarter and the first half of 2018 primarily due to increased international economy shipments, partially offset by the decrease in volume due to the NotPetya cyberattack. Freight yields increased 9% in the second quarter and 5% in the first half of 2018 primarily due to higher base rates, higher fuel surcharges and favorable exchange rates. Freight average daily pounds increased 5% in the second quarter of 2018 primarily due to higher international volume, partially offset by the NotPetya cyberattack.
Our U.S. domestic and outbound fuel surcharge and the international fuel surcharges ranged as follows for the periods ended November 30:
|
| Three Months Ended |
|
| Six Months Ended |
| ||||||||||
|
| 2017 |
|
| 2016 |
|
| 2017 |
|
| 2016 |
| ||||
U.S. Domestic and Outbound Fuel Surcharge: |
|
|
|
|
|
|
|
|
|
|
|
|
|
|
|
|
Low |
|
| 4.42 | % |
|
| 2.00 | % |
|
| 2.21 | % |
|
| 0.96 | % |
High |
|
| 4.87 |
|
|
| 2.28 |
|
|
| 4.87 |
|
|
| 2.53 |
|
Weighted-average |
|
| 4.63 |
|
|
| 2.09 |
|
|
| 3.67 |
|
|
| 1.96 |
|
International Fuel Surcharges: |
|
|
|
|
|
|
|
|
|
|
|
|
|
|
|
|
Low |
|
| 5.65 |
|
|
| 2.11 |
|
|
| 3.38 |
|
|
| 1.16 |
|
High |
|
| 12.16 |
|
|
| 9.33 |
|
|
| 13.75 |
|
|
| 9.51 |
|
Weighted-average |
|
| 10.54 |
|
|
| 7.20 |
|
|
| 9.66 |
|
|
| 7.12 |
|
On September 18, 2017, FedEx Express announced a 4.9% average list price increase for U.S. domestic, U.S. export and U.S. import services effective January 1, 2018. Effective February 6, 2017, FedEx Express fuel surcharges are adjusted on a weekly basis compared to the previous monthly adjustment. On January 2, 2017, FedEx Express implemented a 3.9% average list price increase for U.S. domestic, U.S. export and U.S. import services and a change to the U.S. domestic dimensional weight divisor.
FedEx Express Segment Operating Income
FedEx Express operating income increased in the second quarter of 2018 due to higher revenues, the positive net impact of fuel and continued cost efficiencies. However, impacts from the NotPetya cyberattack and higher TNT Express integration expenses drove a decline in operating margin in the second quarter and also drove a decline in operating income and margin in the first half of 2018.
The NotPetya cyberattack negatively affected results by an estimated $100 million in the second quarter and $400 million in the first half of 2018. Results also included $96 million of TNT Express integration expenses in the second quarter and $184 million in the first half of 2018, a $68 million increase from the second quarter and $114 million increase from the first half of 2017.
Salaries and employee benefits increased 7% in the second quarter and 5% in the first half of 2018 primarily due to merit increases, increased volume and unfavorable exchange rates. Purchased transportation increased 11% in the second quarter and 7% in the first half of 2018 due to increased volume and unfavorable exchange rates. Other expenses increased 8% in the second quarter and first half of 2018 due to increased outside service contracts primarily related to the NotPetya cyberattack, TNT Express integration expenses and unfavorable exchange rates. Maintenance and repairs increased 18% in the second quarter and 17% in the first half of 2018 due primarily to the timing of aircraft maintenance events.
Fuel expense increased 24% in the second quarter and 17% in the first half of 2018 due to increased fuel prices. However, the net impact of fuel had a moderate benefit to operating income in the second quarter and first half of 2018 as higher fuel surcharges more than offset increased fuel prices. See the "Fuel" section of this MD&A for a description and additional discussion of the net impact of fuel on our operating results.
- 39 -
FEDEX GROUND SEGMENT
FedEx Ground service offerings include day-certain delivery to businesses in the U.S. and Canada and to 100% of U.S. residences. The following tables compare revenues, operating expenses, operating expenses as a percent of revenue, operating income (dollars in millions), operating margin and selected package statistics (in thousands, except yield amounts) for the periods ended November 30:
|
| Three Months Ended |
|
| Percent |
|
|
| Six Months Ended |
|
| Percent |
|
| ||||||||||||
|
| 2017 |
|
| 2016 |
|
| Change |
|
|
| 2017 |
|
| 2016 |
|
| Change |
|
| ||||||
Revenues: |
|
|
|
|
|
|
|
|
|
|
|
|
|
|
|
|
|
|
|
|
|
|
|
|
|
|
FedEx Ground |
| $ | 4,521 |
|
| $ | 4,015 |
|
|
| 13 |
|
|
| $ | 8,762 |
|
| $ | 7,906 |
|
|
| 11 |
|
|
FedEx Supply Chain |
|
| 408 |
|
|
| 404 |
|
|
| 1 |
|
|
|
| 806 |
|
|
| 803 |
|
|
| - |
|
|
Total revenues |
|
| 4,929 |
|
|
| 4,419 |
|
|
| 12 |
|
|
|
| 9,568 |
|
|
| 8,709 |
|
|
| 10 |
|
|
Operating expenses: |
|
|
|
|
|
|
|
|
|
|
|
|
|
|
|
|
|
|
|
|
|
|
|
|
|
|
Salaries and employee benefits |
|
| 919 |
|
|
| 820 |
|
|
| 12 |
|
|
|
| 1,755 |
|
|
| 1,586 |
|
|
| 11 |
|
|
Purchased transportation |
|
| 2,100 |
|
|
| 1,861 |
|
|
| 13 |
|
|
|
| 3,959 |
|
|
| 3,553 |
|
|
| 11 |
|
|
Rentals |
|
| 207 |
|
|
| 189 |
|
|
| 10 |
|
|
|
| 408 |
|
|
| 370 |
|
|
| 10 |
|
|
Depreciation and amortization |
|
| 177 |
|
|
| 168 |
|
|
| 5 |
|
|
|
| 350 |
|
|
| 331 |
|
|
| 6 |
|
|
Fuel |
|
| 4 |
|
|
| 3 |
|
|
| 33 |
|
|
|
| 6 |
|
|
| 5 |
|
|
| 20 |
|
|
Maintenance and repairs |
|
| 85 |
|
|
| 78 |
|
|
| 9 |
|
|
|
| 167 |
|
|
| 154 |
|
|
| 8 |
|
|
Intercompany charges |
|
| 362 |
|
|
| 328 |
|
|
| 10 |
|
|
|
| 716 |
|
|
| 653 |
|
|
| 10 |
|
|
Other |
|
| 554 |
|
|
| 507 |
|
|
| 9 |
|
|
|
| 1,060 |
|
|
| 982 |
|
|
| 8 |
|
|
Total operating expenses |
|
| 4,408 |
|
|
| 3,954 |
|
|
| 11 |
|
|
|
| 8,421 |
|
|
| 7,634 |
|
|
| 10 |
|
|
Operating income |
| $ | 521 |
|
| $ | 465 |
|
|
| 12 |
|
|
| $ | 1,147 |
|
| $ | 1,075 |
|
|
| 7 |
|
|
Operating margin |
|
| 10.6 | % |
|
| 10.5 | % |
|
| 10 |
| bp |
|
| 12.0 | % |
|
| 12.3 | % |
|
| (30 | ) | bp |
Average daily package volume |
|
|
|
|
|
|
|
|
|
|
|
|
|
|
|
|
|
|
|
|
|
|
|
|
|
|
FedEx Ground |
|
| 8,576 |
|
|
| 8,005 |
|
|
| 7 |
|
|
|
| 8,125 |
|
|
| 7,692 |
|
|
| 6 |
|
|
Revenue per package (yield) |
|
|
|
|
|
|
|
|
|
|
|
|
|
|
|
|
|
|
|
|
|
|
|
|
|
|
FedEx Ground |
| $ | 8.35 |
|
| $ | 7.95 |
|
|
| 5 |
|
|
| $ | 8.41 |
|
| $ | 8.02 |
|
|
| 5 |
|
|
|
| Percent of Revenue |
|
| ||||||||||||||||
|
| Three Months Ended |
|
|
| Six Months Ended |
|
| ||||||||||||
|
| 2017 |
|
|
| 2016 |
|
|
| 2017 |
|
|
| 2016 |
|
| ||||
Operating expenses: |
|
|
|
|
|
|
|
|
|
|
|
|
|
|
|
|
|
|
|
|
Salaries and employee benefits |
|
| 18.6 |
| % |
|
| 18.5 |
| % |
|
| 18.3 |
| % |
|
| 18.2 |
| % |
Purchased transportation |
|
| 42.6 |
|
|
|
| 42.1 |
|
|
|
| 41.4 |
|
|
|
| 40.8 |
|
|
Rentals |
|
| 4.2 |
|
|
|
| 4.3 |
|
|
|
| 4.3 |
|
|
|
| 4.2 |
|
|
Depreciation and amortization |
|
| 3.6 |
|
|
|
| 3.8 |
|
|
|
| 3.6 |
|
|
|
| 3.8 |
|
|
Fuel |
|
| 0.1 |
|
|
|
| 0.1 |
|
|
|
| 0.1 |
|
|
|
| 0.1 |
|
|
Maintenance and repairs |
|
| 1.7 |
|
|
|
| 1.8 |
|
|
|
| 1.7 |
|
|
|
| 1.8 |
|
|
Intercompany charges |
|
| 7.4 |
|
|
|
| 7.4 |
|
|
|
| 7.5 |
|
|
|
| 7.5 |
|
|
Other |
|
| 11.2 |
|
|
|
| 11.5 |
|
|
|
| 11.1 |
|
|
|
| 11.3 |
|
|
Total operating expenses |
|
| 89.4 |
|
|
|
| 89.5 |
|
|
|
| 88.0 |
|
|
|
| 87.7 |
|
|
Operating margin |
|
| 10.6 |
| % |
|
| 10.5 |
| % |
|
| 12.0 |
| % |
|
| 12.3 |
| % |
FedEx Ground Segment Revenues
FedEx Ground segment revenues increased 12% in the second quarter and 10% in the first half of 2018 due to volume growth and increased yields. Average daily volume at FedEx Ground increased 7% in the second quarter and 6% in the first half of 2018 due to continued growth in our residential and commercial services. FedEx Ground yield increased 5% during the second quarter and first half of 2018 primarily driven by higher base rates in our commercial services and higher fuel surcharges.
- 40 -
The FedEx Ground fuel surcharge is based on a rounded average of the national U.S. on-highway average price for a gallo n of diesel fuel, as published by the Department of Energy. Our fuel surcharge ranged as follows for the periods ended November 30:
|
| Three Months Ended |
|
| Six Months Ended |
| ||||||||||
|
| 2017 |
|
| 2016 |
|
| 2017 |
|
| 2016 |
| ||||
Low |
|
| 4.50 | % |
|
| 3.80 | % |
|
| 4.00 | % |
|
| 3.30 | % |
High |
|
| 5.25 |
|
|
| 4.00 |
|
|
| 5.25 |
|
|
| 4.00 |
|
Weighted-average |
|
| 5.02 |
|
|
| 3.90 |
|
|
| 4.68 |
|
|
| 3.80 |
|
On September 18, 2017, FedEx Ground announced a 4.9% average list price increase effective January 1, 2018. In addition, as announced on September 18, 2017, dimensional weight pricing will apply to all FedEx SmartPost shipments effective January 22, 2018. Effective February 6, 2017, FedEx Ground fuel surcharges are adjusted on a weekly basis compared to the previous monthly adjustment. On January 2, 2017, FedEx Ground implemented a 4.9% average list price increase and a change to the U.S. domestic dimensional weight divisor. On January 4, 2016, FedEx Ground implemented a 4.9% increase in average list price.
FedEx Ground Segment Operating Income
FedEx Ground segment operating income increased 12% in the second quarter and 7% in the first half of 2018 due to volume growth and increased yields. Higher purchased transportation, network expansion and staffing costs and increased self-insurance reserves partially offset these benefits and also drove the operating margin decline in the first half of 2018.
Purchased transportation expense increased 13% in the second quarter and 11% in the first half of 2018 primarily due to higher volumes and increased rates. Salaries and employee benefits expense increased 12% in the second quarter and 11% in the first half of 2018 primarily due to additional staffing to support volume growth, network expansion and merit increases. Other expense increased 9% in the second quarter and 8% in the first half of 2018 due to higher self-insurance reserves. Intercompany charges increased 10% in the second quarter and first half of 2018 due to higher allocated information technology and marketing and sales costs. Rentals and depreciation and amortization expense increased 8% in the second quarter and first half of 2018 due to network expansion.
Independent Contractor Model
FedEx Ground is involved in lawsuits and administrative proceedings claiming that owner-operators engaged under a contractor model no longer in use should have been treated as employees of FedEx Ground, rather than independent contractors. In addition, we are defending joint-employer cases where it is alleged that FedEx Ground should be treated as an employer of the drivers employed by owner-operators engaged by FedEx Ground. These cases are in varying stages of litigation. We will continue to vigorously defend ourselves in these proceedings and continue to believe that owner-operators engaged by FedEx Ground are properly classified as independent contractors and that FedEx Ground is not an employer of the drivers employed by these owner-operators.
For additional information on the FedEx Ground Independent Service Provider model, see "Other Outlook Matters" under Consolidated Results of this MD&A.
- 41 -
FEDEX FREIGHT SEGMENT
FedEx Freight service offerings include priority services when speed is critical and economy services when time can be traded for savings. The following tables compare revenues, operating expenses, operating expenses as a percent of revenue, operating income (dollars in millions), operating margin and selected statistics for the periods ended November 30:
|
| Three Months Ended |
|
| Percent |
|
|
| Six Months Ended |
|
| Percent |
|
| ||||||||||||
|
| 2017 |
|
| 2016 |
|
| Change |
|
|
| 2017 |
|
| 2016 |
|
| Change |
|
| ||||||
Revenues |
| $ | 1,762 |
|
| $ | 1,597 |
|
|
| 10 |
|
|
| $ | 3,514 |
|
| $ | 3,255 |
|
|
| 8 |
|
|
Operating expenses: |
|
|
|
|
|
|
|
|
|
|
|
|
|
|
|
|
|
|
|
|
|
|
|
|
|
|
Salaries and employee benefits |
|
| 828 |
|
|
| 761 |
|
|
| 9 |
|
|
|
| 1,630 |
|
|
| 1,533 |
|
|
| 6 |
|
|
Purchased transportation |
|
| 271 |
|
|
| 250 |
|
|
| 8 |
|
|
|
| 529 |
|
|
| 509 |
|
|
| 4 |
|
|
Rentals |
|
| 37 |
|
|
| 35 |
|
|
| 6 |
|
|
|
| 73 |
|
|
| 65 |
|
|
| 12 |
|
|
Depreciation and amortization |
|
| 73 |
|
|
| 66 |
|
|
| 11 |
|
|
|
| 142 |
|
|
| 130 |
|
|
| 9 |
|
|
Fuel |
|
| 112 |
|
|
| 92 |
|
|
| 22 |
|
|
|
| 209 |
|
|
| 183 |
|
|
| 14 |
|
|
Maintenance and repairs |
|
| 60 |
|
|
| 55 |
|
|
| 9 |
|
|
|
| 117 |
|
|
| 109 |
|
|
| 7 |
|
|
Intercompany charges |
|
| 128 |
|
|
| 124 |
|
|
| 3 |
|
|
|
| 254 |
|
|
| 250 |
|
|
| 2 |
|
|
Other |
|
| 135 |
|
|
| 126 |
|
|
| 7 |
|
|
|
| 266 |
|
|
| 253 |
|
|
| 5 |
|
|
Total operating expenses |
|
| 1,644 |
|
|
| 1,509 |
|
|
| 9 |
|
|
|
| 3,220 |
|
|
| 3,032 |
|
|
| 6 |
|
|
Operating income |
| $ | 118 |
|
| $ | 88 |
|
|
| 34 |
|
|
| $ | 294 |
|
| $ | 223 |
|
|
| 32 |
|
|
Operating margin |
|
| 6.7 | % |
|
| 5.5 | % |
|
| 120 |
| bp |
|
| 8.4 | % |
|
| 6.9 | % |
|
| 150 |
| bp |
Average daily LTL shipments (in thousands) |
|
|
|
|
|
|
|
|
|
|
|
|
|
|
|
|
|
|
|
|
|
|
|
|
|
|
Priority |
|
| 76.3 |
|
|
| 72.7 |
|
|
| 5 |
|
|
|
| 75.3 |
|
|
| 72.6 |
|
|
| 4 |
|
|
Economy |
|
| 32.3 |
|
|
| 31.4 |
|
|
| 3 |
|
|
|
| 32.0 |
|
|
| 31.9 |
|
|
| - |
|
|
Total average daily LTL shipments |
|
| 108.6 |
|
|
| 104.1 |
|
|
| 4 |
|
|
|
| 107.3 |
|
|
| 104.5 |
|
|
| 3 |
|
|
Weight per LTL shipment (lbs) |
|
|
|
|
|
|
|
|
|
|
|
|
|
|
|
|
|
|
|
|
|
|
|
|
|
|
Priority |
|
| 1,201 |
|
|
| 1,165 |
|
|
| 3 |
|
|
|
| 1,192 |
|
|
| 1,171 |
|
|
| 2 |
|
|
Economy |
|
| 1,153 |
|
|
| 1,113 |
|
|
| 4 |
|
|
|
| 1,150 |
|
|
| 1,105 |
|
|
| 4 |
|
|
Composite weight per LTL shipment |
|
| 1,187 |
|
|
| 1,149 |
|
|
| 3 |
|
|
|
| 1,180 |
|
|
| 1,151 |
|
|
| 3 |
|
|
LTL revenue per shipment |
|
|
|
|
|
|
|
|
|
|
|
|
|
|
|
|
|
|
|
|
|
|
|
|
|
|
Priority |
| $ | 232.25 |
|
| $ | 220.34 |
|
|
| 5 |
|
|
| $ | 229.17 |
|
| $ | 218.89 |
|
|
| 5 |
|
|
Economy |
|
| 286.35 |
|
|
| 261.28 |
|
|
| 10 |
|
|
|
| 281.64 |
|
|
| 258.26 |
|
|
| 9 |
|
|
Composite LTL revenue per shipment |
| $ | 248.36 |
|
| $ | 232.70 |
|
|
| 7 |
|
|
| $ | 244.81 |
|
| $ | 230.90 |
|
|
| 6 |
|
|
LTL yield (revenue per hundredweight) |
|
|
|
|
|
|
|
|
|
|
|
|
|
|
|
|
|
|
|
|
|
|
|
|
|
|
Priority |
| $ | 19.34 |
|
| $ | 18.92 |
|
|
| 2 |
|
|
| $ | 19.22 |
|
| $ | 18.70 |
|
|
| 3 |
|
|
Economy |
|
| 24.84 |
|
|
| 23.48 |
|
|
| 6 |
|
|
|
| 24.49 |
|
|
| 23.37 |
|
|
| 5 |
|
|
Composite LTL yield |
| $ | 20.93 |
|
| $ | 20.25 |
|
|
| 3 |
|
|
| $ | 20.75 |
|
| $ | 20.07 |
|
|
| 3 |
|
|
|
| Percent of Revenue |
|
| ||||||||||||||||
|
| Three Months Ended |
|
|
| Six Months Ended |
|
| ||||||||||||
|
| 2017 |
|
|
| 2016 |
|
|
| 2017 |
|
|
| 2016 |
|
| ||||
Operating expenses: |
|
|
|
|
|
|
|
|
|
|
|
|
|
|
|
|
|
|
|
|
Salaries and employee benefits |
|
| 47.0 |
| % |
|
| 47.6 |
| % |
|
| 46.4 |
| % |
|
| 47.1 |
| % |
Purchased transportation |
|
| 15.4 |
|
|
|
| 15.7 |
|
|
|
| 15.1 |
|
|
|
| 15.6 |
|
|
Rentals |
|
| 2.1 |
|
|
|
| 2.2 |
|
|
|
| 2.1 |
|
|
|
| 2.0 |
|
|
Depreciation and amortization |
|
| 4.1 |
|
|
|
| 4.1 |
|
|
|
| 4.0 |
|
|
|
| 4.0 |
|
|
Fuel |
|
| 6.3 |
|
|
|
| 5.8 |
|
|
|
| 5.9 |
|
|
|
| 5.6 |
|
|
Maintenance and repairs |
|
| 3.4 |
|
|
|
| 3.4 |
|
|
|
| 3.3 |
|
|
|
| 3.3 |
|
|
Intercompany charges |
|
| 7.3 |
|
|
|
| 7.8 |
|
|
|
| 7.2 |
|
|
|
| 7.7 |
|
|
Other |
|
| 7.7 |
|
|
|
| 7.9 |
|
|
|
| 7.6 |
|
|
|
| 7.8 |
|
|
Total operating expenses |
|
| 93.3 |
|
|
|
| 94.5 |
|
|
|
| 91.6 |
|
|
|
| 93.1 |
|
|
Operating margin |
|
| 6.7 |
| % |
|
| 5.5 |
| % |
|
| 8.4 |
| % |
|
| 6.9 |
| % |
- 42 -
FedEx Freight Segment Revenues
FedEx Freight segment revenues increased 10% in the second quarter and 8% in the first half of 2018 primarily due to higher LTL revenue per shipment and average daily LTL shipments. LTL revenue per shipment increased 7% in the second quarter and 6% in the first half of 2018 primarily due to higher base rates driven by our ongoing yield management initiatives and higher fuel surcharges. Average daily LTL shipments increased 4% in the second quarter and 3% in the first half of 2018 due to higher demand for our LTL service offerings.
The indexed LTL fuel surcharge is based on the average of the national U.S. on-highway average prices for a gallon of diesel fuel, as published by the Department of Energy. The indexed LTL fuel surcharge ranged as follows for the periods ended November 30:
|
| Three Months Ended |
|
| Six Months Ended |
| ||||||||||
|
| 2017 |
|
| 2016 |
|
| 2017 |
|
| 2016 |
| ||||
Low |
|
| 22.40 | % |
|
| 20.50 | % |
|
| 20.90 | % |
|
| 20.20 | % |
High |
|
| 23.20 |
|
|
| 21.00 |
|
|
| 23.20 |
|
|
| 21.00 |
|
Weighted-average |
|
| 22.70 |
|
|
| 20.75 |
|
|
| 21.96 |
|
|
| 20.64 |
|
On September 18, 2017, FedEx Freight announced a 4.9% average increase in certain U.S. and other shipping rates effective January 1, 2018. On January 2, 2017, FedEx Freight implemented a 4.9% average increase in certain U.S. and other shipping rates.
FedEx Freight Segment Operating Income
FedEx Freight segment operating income increased 34% in the second quarter and 32% in the first half of 2018 primarily driven by higher LTL revenue per shipment. Salaries and employee benefits increased 9% in the second quarter and 6% in the first half of 2018 driven primarily by higher staffing levels to support volume growth and merit increases. Purchased transportation increased 8% in the second quarter and 4% in the first half of 2018 due to higher volumes and increased rates, which were partially offset by the movement of certain services within FedEx Custom Critical to the FedEx Ground segment.
Fuel expense increased 22% in the second quarter and 14% in the first half of 2018 due to higher fuel prices. The net impact of fuel had a slight benefit to operating income in the second quarter and first half of 2018 as higher fuel surcharges more than offset increased fuel prices.
- 43 -
FINANCIAL CONDITION
LIQUIDITY
Cash and cash equivalents totaled $2.8 billion at November 30, 2017, compared to $4.0 billion at May 31, 2017. The following table provides a summary of our cash flows for the six-month periods ended November 30 (in millions):
|
| 2017 |
|
| 2016 |
| ||
Operating activities: |
|
|
|
|
|
|
|
|
Net income |
| $ | 1,371 |
|
| $ | 1,415 |
|
Noncash charges and credits |
|
| 2,053 |
|
|
| 1,968 |
|
Gain from sale of investment |
|
| - |
|
|
| (35 | ) |
Changes in assets and liabilities |
|
| (1,926 | ) |
|
| (713 | ) |
Cash provided by operating activities |
|
| 1,498 |
|
|
| 2,635 |
|
Investing activities: |
|
|
|
|
|
|
|
|
Capital expenditures |
|
| (2,621 | ) |
|
| (2,681 | ) |
Business acquisitions, net of cash acquired |
|
| (44 | ) |
|
| - |
|
Proceeds from asset dispositions and other |
|
| 12 |
|
|
| 100 |
|
Cash used in investing activities |
|
| (2,653 | ) |
|
| (2,581 | ) |
Financing activities: |
|
|
|
|
|
|
|
|
Proceeds from short-term borrowings |
|
| 250 |
|
|
| - |
|
Principal payments on debt |
|
| (28 | ) |
|
| (43 | ) |
Proceeds from stock issuances |
|
| 205 |
|
|
| 164 |
|
Dividends paid |
|
| (268 | ) |
|
| (213 | ) |
Purchase of treasury stock |
|
| (270 | ) |
|
| (334 | ) |
Other |
|
| 3 |
|
|
| (5 | ) |
Cash used in financing activities |
|
| (108 | ) |
|
| (431 | ) |
Effect of exchange rate changes on cash |
|
| 62 |
|
|
| (98 | ) |
Net decrease in cash and cash equivalents |
| $ | (1,201 | ) |
| $ | (475 | ) |
Cash and cash equivalents at the end of period |
| $ | 2,768 |
|
| $ | 3,059 |
|
Cash flows from operating activities decreased $1.1 billion in the first half of 2018 primarily due to the NotPetya cyberattack, higher income tax payments, pension contributions and the payment of a previously accrued legal settlement. Capital expenditures decreased slightly during the first half of 2018 primarily due to lower spending related to package handling and ground support equipment at FedEx Ground and FedEx Express, partially offset by increased facilities and other at FedEx Ground. See "Capital Resources" for a discussion of capital expenditures during 2018 and 2017.
During the second quarter of 2018, we issued $250 million of commercial paper, providing us with additional short-term liquidity flexibility. Upon maturity in January 2018, we will re-evaluate our short-term liquidity needs and assess whether to issue additional commercial paper in order to maintain this short-term liquidity flexibility.
On January 26, 2016, our Board of Directors approved a share repurchase program of up to 25 million shares. During the second quarter of 2018, we repurchased 0.8 million shares of FedEx common stock at an average price of $220.67 per share for a total of $184 million. During the first half of 2018, we repurchased 1.2 million shares of FedEx common stock at an average price of $216.45 per share for a total of $270 million. As of November 30, 2017, 14.8 million shares remained under the share repurchase authorization. Shares under the current repurchase program may be repurchased from time to time in the open market or in privately negotiated transactions. The timing and volume of repurchases are at the discretion of management, based on the capital needs of the business, the market price of FedEx common stock and general market conditions. No time limit was set for the completion of the program, and the program may be suspended or discontinued at any time.
CAPITAL RESOURCES
Our operations are capital intensive, characterized by significant investments in aircraft, vehicles, technology, facilities, and package handling and sort equipment. The amount and timing of capital additions depend on various factors, including pre-existing contractual commitments, anticipated volume growth, domestic and international economic conditions, new or enhanced services, geographical expansion of services, availability of satisfactory financing, tax laws and actions of regulatory authorities.
- 44 -
The following table compares capital expenditures by asset category and reportable segment for the periods ended November 30 (in millions):
|
|
|
|
|
|
|
|
|
|
|
|
|
|
|
|
|
| Percent Change |
| |||||
|
|
|
|
|
|
|
|
|
|
|
|
|
|
|
|
|
| 2017/2016 |
| |||||
|
| Three Months Ended |
|
| Six Months Ended |
|
| Three Months |
|
| Six Months |
| ||||||||||||
|
| 2017 |
|
| 2016 |
|
| 2017 |
|
| 2016 |
|
| Ended |
|
| Ended |
| ||||||
Aircraft and related equipment |
| $ | 629 |
|
| $ | 443 |
|
| $ | 1,040 |
|
| $ | 1,035 |
|
|
| 42 |
|
|
| - |
|
Package handling and ground support equipment |
|
| 217 |
|
|
| 326 |
|
|
| 414 |
|
|
| 524 |
|
|
| (33 | ) |
|
| (21 | ) |
Vehicles |
|
| 390 |
|
|
| 369 |
|
|
| 511 |
|
|
| 518 |
|
|
| 6 |
|
|
| (1 | ) |
Information technology |
|
| 135 |
|
|
| 119 |
|
|
| 261 |
|
|
| 278 |
|
|
| 13 |
|
|
| (6 | ) |
Facilities and other |
|
| 206 |
|
|
| 209 |
|
|
| 395 |
|
|
| 326 |
|
|
| (1 | ) |
|
| 21 |
|
Total capital expenditures |
| $ | 1,577 |
|
| $ | 1,466 |
|
| $ | 2,621 |
|
| $ | 2,681 |
|
|
| 8 |
|
|
| (2 | ) |
FedEx Express segment |
| $ | 873 |
|
| $ | 723 |
|
| $ | 1,455 |
|
| $ | 1,555 |
|
|
| 21 |
|
|
| (6 | ) |
FedEx Ground segment |
|
| 420 |
|
|
| 504 |
|
|
| 747 |
|
|
| 740 |
|
|
| (17 | ) |
|
| 1 |
|
FedEx Freight segment |
|
| 172 |
|
|
| 162 |
|
|
| 199 |
|
|
| 208 |
|
|
| 6 |
|
|
| (4 | ) |
FedEx Services segment |
|
| 112 |
|
|
| 77 |
|
|
| 220 |
|
|
| 178 |
|
|
| 45 |
|
|
| 24 |
|
Total capital expenditures |
| $ | 1,577 |
|
| $ | 1,466 |
|
| $ | 2,621 |
|
| $ | 2,681 |
|
|
| 8 |
|
|
| (2 | ) |
Capital expenditures decreased slightly during the first half of 2018 primarily due to lower spending related to package handling and ground support equipment at FedEx Ground and FedEx Express, partially offset by increased facilities and other at FedEx Ground. Aircraft and related equipment purchases at FedEx Express during the first half of 2018 included the delivery of six Boeing 767-300 Freighter aircraft and three Boeing 777 Freighter aircraft.
LIQUIDITY OUTLOOK
We believe that our cash and cash equivalents, cash flow from operations and available financing sources are adequate to meet our liquidity needs, including working capital, capital expenditure requirements and debt payment obligations. Our cash and cash equivalents balance at November 30, 2017 included $1.1 billion of cash in foreign jurisdictions associated with our permanent reinvestment strategy. We do not believe that the indefinite reinvestment of these funds impairs our ability to meet our domestic debt or working capital obligations. Although we expect higher capital expenditures in 2018, we anticipate that our cash flow from operations will be sufficient to fund these expenditures. Historically, we have been successful in obtaining unsecured financing, from both domestic and international sources, although the marketplace for such investment capital can become restricted depending on a variety of economic factors.
Our capital expenditures are expected to be approximately $5.9 billion in 2018 and include spending for aircraft and aircraft-related equipment at FedEx Express, sort facility expansion, primarily at FedEx Ground, and new and replacement vehicles at all of our transportation segments. We expect to invest an additional $1.2 billion for aircraft and aircraft-related equipment during the remainder of 2018. However, we may increase our capital expenditures in 2018 if the Tax Cuts and Jobs Act of 2017 is enacted.
During the second quarter of 2018, FedEx Express entered into an agreement to purchase 50 Cessna SkyCourier 408 aircraft with options to purchase up to 50 additional Cessna SkyCourier 408 aircraft. The 50 firm-order Cessna SkyCourier 408 aircraft are expected to be delivered from fiscal 2021 through 2024.
During the second quarter of 2018, FedEx Express entered into an agreement to purchase 30 ATR 72-600F aircraft with options to purchase up to 20 additional ATR 72-600F aircraft. The 30 firm-order ATR 72-600F aircraft are expected to be delivered from fiscal 2021 through 2026.
We have a shelf registration statement filed with the Securities and Exchange Commission ("SEC") that allows us to sell, in one or more future offerings, any combination of our unsecured debt securities and common stock.
We have a five-year $1.75 billion revolving credit facility that expires in November 2020. See Note 3 of the accompanying unaudited condensed consolidated financial statements for a description of the term and significant covenants of our revolving credit facility.
During the first half of 2018, we made contributions totaling $750 million to our tax-qualified U.S. domestic pension plans ("U.S. Pension Plans"), of which $268 million were required. We expect to make an additional $250 million contribution to our U.S. Pension Plans during 2018. Our U.S. Pension Plans have ample funds to meet expected benefit payments.
- 45 -
Standard & Poor's has assig ned us a senior unsecured debt credit rating of BBB and commercial paper rating of A-2 and a ratings outlook of "stable." Moody's Investors Service has assigned our unsecured debt a credit rating of Baa2 and our commercial paper a rating of P-2 and a ratin gs outlook of "stable." If our credit ratings drop, our interest expense may increase. If our commercial paper ratings drop below current levels, we may have difficulty utilizing the commercial paper market. If our senior unsecured debt credit ratings drop below investment grade, our access to financing may become limited.
CONTRACTUAL CASH OBLIGATIONS AND OFF-BALANCE SHEET ARRANGEMENTS
The following table sets forth a summary of our contractual cash obligations as of November 30, 2017. Certain of these contractual obligations are reflected in our balance sheet, while others are disclosed as future obligations under accounting principles generally accepted in the United States. Except for the current portion of interest on long-term debt, this table does not include amounts already recorded in our balance sheet as current liabilities at November 30, 2017. We have certain contingent liabilities that are not accrued in our balance sheet in accordance with accounting principles generally accepted in the United States. These contingent liabilities are not included in the table below. We have other long-term liabilities reflected in our balance sheet, including deferred income taxes, qualified and nonqualified pension and postretirement healthcare plan liabilities and other self-insurance accruals. The payment obligations associated with these liabilities are not reflected in the table below due to the absence of scheduled maturities. Accordingly, this table is not meant to represent a forecast of our total cash expenditures for any of the periods presented.
|
| Payments Due by Fiscal Year (Undiscounted) (in millions) |
| |||||||||||||||||||||||||
|
| 2018 (1) |
|
| 2019 |
|
| 2020 |
|
| 2021 |
|
| 2022 |
|
| Thereafter |
|
| Total |
| |||||||
Operating activities: |
|
|
|
|
|
|
|
|
|
|
|
|
|
|
|
|
|
|
|
|
|
|
|
|
|
|
|
|
Operating leases |
| $ | 1,448 |
|
| $ | 2,357 |
|
| $ | 2,060 |
|
| $ | 1,826 |
|
| $ | 1,649 |
|
| $ | 8,921 |
|
| $ | 18,261 |
|
Non-capital purchase obligations and other |
|
| 426 |
|
|
| 677 |
|
|
| 524 |
|
|
| 385 |
|
|
| 234 |
|
|
| 492 |
|
|
| 2,738 |
|
Interest on long-term debt |
|
| 291 |
|
|
| 546 |
|
|
| 484 |
|
|
| 472 |
|
|
| 472 |
|
|
| 8,719 |
|
|
| 10,984 |
|
Quarterly contributions to our U.S. Pension Plans |
|
| 15 |
|
|
| - |
|
|
| - |
|
|
| - |
|
|
| - |
|
|
| - |
|
|
| 15 |
|
Investing activities: |
|
|
|
|
|
|
|
|
|
|
|
|
|
|
|
|
|
|
|
|
|
|
|
|
|
|
|
|
Aircraft and aircraft-related capital commitments |
|
| 870 |
|
|
| 1,723 |
|
|
| 1,965 |
|
|
| 1,488 |
|
|
| 1,451 |
|
|
| 3,334 |
|
|
| 10,831 |
|
Other capital purchase obligations |
|
| 66 |
|
|
| 2 |
|
|
| 1 |
|
|
| 1 |
|
|
| 1 |
|
|
| 7 |
|
|
| 78 |
|
Financing activities: |
|
|
|
|
|
|
|
|
|
|
|
|
|
|
|
|
|
|
|
|
|
|
|
|
|
|
|
|
Debt |
|
| 3 |
|
|
| 1,350 |
|
|
| 997 |
|
|
| - |
|
|
| - |
|
|
| 12,928 |
|
|
| 15,278 |
|
Total |
| $ | 3,119 |
|
| $ | 6,655 |
|
| $ | 6,031 |
|
| $ | 4,172 |
|
| $ | 3,807 |
|
| $ | 34,401 |
|
| $ | 58,185 |
|
(1) | Cash obligations for the remainder of 2018. |
Open purchase orders that are cancelable are not considered unconditional purchase obligations for financial reporting purposes and are not included in the table above. Such purchase orders often represent authorizations to purchase rather than binding agreements. See Note 7 of the accompanying unaudited condensed consolidated financial statements for more information.
Operating Activities
The amounts reflected in the table above for operating leases represent future minimum lease payments under noncancelable operating leases (principally aircraft and facilities) with an initial or remaining term in excess of one year at November 30, 2017.
Included in the table above within the caption entitled "Non-capital purchase obligations and other" is our estimate of the current portion of the liability ($38 million) for uncertain tax positions and amounts for purchase obligations that represent noncancelable agreements to purchase goods or services that are not capital related. Such contracts include those for printing and advertising and promotions contracts. We cannot reasonably estimate the timing of the long-term payments or the amount by which the liability for uncertain tax positions will increase or decrease over time; therefore, the long-term portion of the liability for uncertain tax positions ($39 million) is excluded from the table.
The amounts reflected in the table above for interest on long-term debt represent future interest payments due on our long-term debt.
We had $684 million in deposits and progress payments as of November 30, 2017 on aircraft purchases and other planned aircraft-related transactions.
- 46 -
Investing Activities
The amounts reflected in the table above for capital purchase obligations represent noncancelable agreements to purchase capital-related equipment. Such contracts include those for certain purchases of aircraft, aircraft modifications, vehicles, facilities, computers and other equipment.
Financing Activities
The amounts reflected in the table above for long-term debt represent future scheduled principal payments on our long-term debt.
Additional information on amounts included within the operating, investing and financing activities captions in the table above can be found in our Annual Report.
CRITICAL ACCOUNTING ESTIMATES
The preparation of financial statements in accordance with accounting principles generally accepted in the United States requires management to make significant judgments and estimates to develop amounts reflected and disclosed in the financial statements. In many cases, there are alternative policies or estimation techniques that could be used. We maintain a thorough process to review the application of our accounting policies and to evaluate the appropriateness of the many estimates that are required to prepare the financial statements of a complex, global corporation. However, even under optimal circumstances, estimates routinely require adjustment based on changing circumstances and new or better information.
GOODWILL. Goodwill is tested for impairment between annual tests whenever events or circumstances make it more likely than not that the fair value of a reporting unit has fallen below its carrying value. We do not believe there has been any other change of events or circumstances that would indicate that a reevaluation of the goodwill of our reporting units is required as of November 30, 2017, nor do we believe the goodwill of our reporting units is at risk of failing impairment testing. For additional details on goodwill impairment testing, refer to Note 1 of our Annual Report.
Information regarding our critical accounting estimates can be found in our Annual Report, including Note 1 to the financial statements therein. Management has discussed the development and selection of these critical accounting estimates with the Audit Committee of our Board of Directors and with our independent registered public accounting firm.
FORWARD-LOOKING STATEMENTS
Certain statements in this report, including (but not limited to) those contained in "Income Taxes," "Outlook," "Recent Accounting Guidance," "Liquidity," "Liquidity Outlook," "Contractual Cash Obligations and Off-Balance Sheet Arrangements" and "Critical Accounting Estimates," and the "General," "Retirement Plans," "Commitments" and "Contingencies" notes to the consolidated financial statements, are "forward-looking" statements within the meaning of the Private Securities Litigation Reform Act of 1995 with respect to our financial condition, results of operations, cash flows, plans, objectives, future performance and business. Forward-looking statements include those preceded by, followed by or that include the words "may," "could," "would," "should," "will," "believes," "expects," "anticipates," "plans," "estimates," "targets," "projects," "intends" or similar expressions. These forward-looking statements involve risks and uncertainties. Actual results may differ materially from those contemplated (expressed or implied) by such forward-looking statements because of, among other things, potential risks and uncertainties, such as:
• | economic conditions in the global markets in which we operate; |
• | significant changes in the volumes of shipments transported through our networks, customer demand for our various services or the prices we obtain for our services; |
• | a significant data breach or other disruption to our technology infrastructure, which can adversely affect our reputation, business or results of operations; |
• | the ongoing impact of the significant cyberattack that TNT Express experienced in the first quarter of fiscal 2018; |
• | our ability to successfully integrate the businesses and operations of FedEx Express and TNT Express in the expected time frame or at the expected cost; |
• | damage to our reputation or loss of brand equity; |
• | the price and availability of jet and vehicle fuel; |
- 47 -
• | our ability to manage our network capacity and cost structure for capital expenditures and operating expenses, and match it to shifting and future customer volume levels; |
• | the impact of intense competition on our ability to maintain or increase our prices (including our fuel surcharges in response to fluctuating fuel prices) or to maintain or grow our market share; |
• | our ability to effectively operate, integrate, leverage and grow acquired businesses, and to continue to support the value we allocate to these acquired businesses, including their goodwill; |
• | our ability to achieve the FedEx Express profit improvement goal; |
• | our ability to maintain good relationships with our employees and avoid attempts by labor organizations to organize groups of our employees, which could significantly increase our operating costs and reduce our operational flexibility; |
• | the impact of costs related to (i) challenges to the status of owner-operators engaged by FedEx Ground as independent contractors and direct employers of drivers providing services on their behalf, and (ii) any related changes to our relationship with these owner-operators and their drivers; |
• | the impact of the United Kingdom's vote to leave the European Union; |
• | any impact on our business from disruptions or modifications in service by, or changes in the business or financial soundness of, the U.S. Postal Service, which is a significant customer and vendor of FedEx; |
• | the impact of any international conflicts or terrorist activities on the United States and global economies in general, the transportation industry or us in particular, and what effects these events will have on our costs or the demand for our services; |
• | any impacts on our businesses resulting from evolving or new domestic or international government laws and regulation, which could be unfavorable to our business, including regulatory actions affecting global aviation or other transportation rights, increased air cargo and other security or safety requirements, and tax, accounting, trade (such as protectionist measures or restrictions on free trade), labor (such as card-check legislation, joint employment standards or changes to the Railway Labor Act of 1926, as amended, affecting FedEx Express employees), environmental (such as global climate change legislation) or postal rules; |
• | adverse weather conditions or localized natural disasters in key geographic areas, such as earthquakes, volcanoes, and hurricanes, which can disrupt our electrical service, damage our property, disrupt our operations, increase our fuel costs and adversely affect our shipment levels; |
• | increasing costs, the volatility of costs and funding requirements and other legal mandates for employee benefits, especially pension and healthcare benefits; |
• | the increasing costs of compliance with federal, state and foreign governmental agency mandates (including the Foreign Corrupt Practices Act and the U.K. Bribery Act) and defending against inappropriate or unjustified enforcement or other actions by such agencies; |
• | changes in foreign currency exchange rates, especially in the euro, Chinese yuan, British pound, Brazilian real, Canadian dollar and Mexican peso, which can affect our sales levels and foreign currency sales prices; |
• | market acceptance of our new service and growth initiatives; |
• | any liability resulting from and the costs of defending against class-action litigation, such as wage-and-hour, joint employment, and discrimination and retaliation claims, and any other legal or governmental proceedings; |
• | the outcome of future negotiations to reach new collective bargaining agreements - including with the union that represents the pilots of FedEx Express (the current pilot agreement is scheduled to become amendable in November 2021) and with the union elected in 2015 to represent drivers at a FedEx Freight facility; |
• | the impact of technology developments on our operations and on demand for our services, and our ability to continue to identify and eliminate unnecessary information technology redundancy and complexity throughout the organization; |
• | governmental underinvestment in transportation infrastructure, which could increase our costs and adversely impact our service levels due to traffic congestion or sub-optimal routing of our vehicles and aircraft; |
• | widespread outbreak of an illness or any other communicable disease, or any other public health crisis; |
• | availability of financing on terms acceptable to us and our ability to maintain our current credit ratings, especially given the capital intensity of our operations; and |
• | other risks and uncertainties you can find in our press releases and SEC filings, including the risk factors identified under the heading "Risk Factors" in "Management's Discussion and Analysis of Results of Operations and Financial Condition" in our Annual Report, as updated by our quarterly reports on Form 10-Q. |
- 48 -
As a result of these and other factors, no assurance can be given as to our future results and achievements. Accordingly, a forward-looking statement is neither a prediction nor a guarantee of future events or circumstances and those future events or circumstances may not occur. You should not place undue reliance on the forward-looking statements, which speak only as of the date of this report. We are under no obligation, and we expressly disclaim any obligation, to update or alter any forward-looking statements, whether as a result of new information, future events or otherwise.
Item 3. Quantitative and Qualitative Disclosures About Market Risk
As of November 30, 2017, there had been no material changes in our market risk sensitive instruments and positions since our disclosures in our Annual Report.
The principal foreign currency exchange rate risks to which we are exposed are in the euro, Chinese yuan, British pound, Brazilian real, Canadian dollar and Mexican peso. Historically, our exposure to foreign currency fluctuations is more significant with respect to our revenues than our expenses, as a significant portion of our expenses are denominated in U.S. dollars, such as aircraft and fuel expenses. During the first half of 2018, the U.S. dollar strengthened relative to the currencies of the foreign countries in which we operate, as compared to May 31, 2017, and this strengthening had a slightly negative impact on our results.
While we have market risk for changes in the price of jet and vehicle fuel, this risk is largely mitigated by our indexed fuel surcharges. For additional discussion of our indexed fuel surcharges see the "Fuel" section of "Management's Discussion and Analysis of Results of Operations and Financial Condition."
Item 4. Controls and Procedures
The management of FedEx, with the participation of our principal executive and financial officers, has evaluated the effectiveness of our disclosure controls and procedures in ensuring that the information required to be disclosed in our filings under the Securities Exchange Act of 1934, as amended, is recorded, processed, summarized and reported within the time periods specified in the SEC's rules and forms, including ensuring that such information is accumulated and communicated to FedEx management as appropriate to allow timely decisions regarding required disclosure. Based on such evaluation, our principal executive and financial officers have concluded that such disclosure controls and procedures were effective as of November 30, 2017 (the end of the period covered by this Quarterly Report on Form 10-Q).
During our fiscal quarter ended November 30, 2017, no change occurred in our internal control over financial reporting that has materially affected, or is reasonably likely to materially affect, our internal control over financial reporting.
- 49 -
PART II. OTHER INFORMATION
Item 1. Legal Proceedings
For a description of all material pending legal proceedings, see Note 8 of the accompanying unaudited condensed consolidated financial statements.
Item 1A. Risk Factors
Other than the risk factor set forth below, there have been no material changes from the risk factors disclosed in our Annual Report (under the heading "Risk Factors" in "Management's Discussion and Analysis of Results of Operations and Financial Condition") in response to Part I, Item 1A of Form 10-K.
TNT Express experienced a significant cyberattack in the first quarter of fiscal 2018 and the ongoing impact could negatively affect our results of operations and financial condition in the future, particularly if our continuing recovery efforts do not proceed as expected.
On June 28, 2017, we announced that the worldwide operations of TNT Express were significantly affected by the cyberattack known as NotPetya, which involved the spread of an information technology virus that infiltrated TNT Express systems and encrypted its data. While TNT Express's critical operational systems have been fully restored, critical business data has been recovered and shipping services and solutions are back in place, not all customers are shipping at pre-attack volume levels and we are continuing to engage in related recovery efforts. Our results of operations and financial condition could be negatively impacted in the future if our recovery efforts do not proceed as expected, particularly if lost revenues or incremental costs associated with the cyberattack exceed our expectations. The following consequences or potential consequences of the cyberattack could have an adverse impact on our results of operations and financial condition in the future:
| • | loss of revenue due to permanent customer loss; |
| • | additional costs due to claims for service failures; |
| • | higher effective tax rate due to reduced international earnings; |
| • | longer and more costly integration (due to increased expenses and capital spending requirements) of TNT Express and FedEx Express; |
| • | investments in enhanced systems in order to prevent future attacks; |
| • | cost of incentives offered to customers to restore confidence and maintain business relationships; |
| • | reputational damage resulting in the failure to retain or attract customers; |
| • | costs associated with potential litigation or governmental investigations; |
| • | costs associated with any data breach or data loss to third parties that is discovered; and |
| • | other consequences of which we are not currently aware but may subsequently discover. |
- 50 -
Item 2. Unregistered Sales of Equi ty Securities and Use of Proceeds
The following table provides information on FedEx's repurchases of our common stock during the second quarter of 2018:
ISSUER PURCHASES OF EQUITY SECURITIES
Period |
| Total Number of Shares Purchased |
|
| Average Price Paid per Share |
|
| Total Number of Shares Purchased as Part of Publicly Announced Program |
|
| Maximum Number of Shares That May Yet Be Purchased Under the Program |
| ||||
Sep. 1-30, 2017 |
|
| 195,000 |
|
| $ | 216.32 |
|
|
| 195,000 |
|
|
| 15,412,500 |
|
Oct. 1-31, 2017 |
|
| 330,000 |
|
|
| 223.80 |
|
|
| 330,000 |
|
|
| 15,082,500 |
|
Nov. 1-30, 2017 |
|
| 307,500 |
|
|
| 220.08 |
|
|
| 307,500 |
|
|
| 14,775,000 |
|
Total |
|
| 832,500 |
|
| $ | 220.67 |
|
|
| 832,500 |
|
|
|
|
|
The repurchases were made under the stock repurchase program approved by our Board of Directors and announced on January 26, 2016 and through which we are authorized to purchase, in the open market or in privately negotiated transactions, up to an aggregate of 25 million shares of our common stock. As of December 19, 2017, 14.6 million shares remained authorized for purchase under the January 2016 stock repurchase program, which is the only such program that currently exists. The program does not have an expiration date.
- 51 -
Item 6. Exhibits
Exhibit Number |
| Description of Exhibit |
|
|
|
10.1 |
| Amendment dated October 16, 2017 (but effective as of May 1, 2017), amending the Transportation Agreement dated April 23, 2013 between the United States Postal Service and Federal Express Corporation (the "USPS Transportation Agreement"). Confidential treatment has been requested for confidential commercial and financial information, pursuant to Rule 24b-2 under the Securities Exchange Act of 1934, as amended (the "Exchange Act"). |
|
|
|
10.2 |
| Amendment dated October 16, 2017 (but effective as of June 5, 2017), amending the USPS Transportation Agreement. Confidential treatment has been requested for confidential commercial and financial information, pursuant to Rule 24b-2 under the Exchange Act. |
|
|
|
10.3 |
| Amendment dated October 16, 2017 (but effective as of July 3, 2017), amending the USPS Transportation Agreement. Confidential treatment has been requested for confidential commercial and financial information, pursuant to Rule 24b-2 under the Exchange Act. |
|
|
|
10.4 |
| Amendment dated October 16, 2017 (but effective as of August 28, 2017), amending the USPS Transportation Agreement. Confidential treatment has been requested for confidential commercial and financial information, pursuant to Rule 24b-2 under the Exchange Act. |
|
|
|
10.5 |
| Amendment dated October 16, 2017 (but effective as of July 31, 2017), amending the USPS Transportation Agreement. Confidential treatment has been requested for confidential commercial and financial information, pursuant to Rule 24b-2 under the Exchange Act. |
|
|
|
10.6 |
| Amendment dated October 16, 2017 (but effective as of August 28, 2017), amending the USPS Transportation Agreement. Confidential treatment has been requested for confidential commercial and financial information, pursuant to Rule 24b-2 under the Exchange Act. |
|
|
|
10.7 |
| Amendment dated October 16, 2017 (but effective as of January 2, 2017), amending the USPS Transportation Agreement. Confidential treatment has been requested for confidential commercial and financial information, pursuant to Rule 24b-2 under the Exchange Act. |
|
|
|
10.8 |
| Amendment dated November 7, 2017 (but effective as of October 2, 2017), amending the USPS Transportation Agreement. Confidential treatment has been requested for confidential commercial and financial information, pursuant to Rule 24b-2 under the Exchange Act. |
|
|
|
10.9 |
| Amendment dated November 7, 2017 (but effective as of October 2, 2017), amending the USPS Transportation Agreement. |
|
|
|
10.10 |
| Amendment dated November 7, 2017 (but effective as of October 30, 2017), amending the USPS Transportation Agreement. Confidential treatment has been requested for confidential commercial and financial information, pursuant to Rule 24b-2 under the Exchange Act. |
|
|
|
10.11 |
| Supplemental Agreement No. 27 (and related side letter) dated as of October 12, 2017, amending the Boeing 777 Freighter Purchase Agreement dated as of November 7, 2006, between The Boeing Company and Federal Express Corporation. Confidential treatment has been requested for confidential commercial and financial information, pursuant to Rule 24b-2 under the Exchange Act. |
|
|
|
10.12 |
| FedEx Corporation 2010 Omnibus Stock Incentive Plan, as amended. |
|
|
|
12.1 |
| Computation of Ratio of Earnings to Fixed Charges. |
|
|
|
15.1 |
| Letter re: Unaudited Interim Financial Statements. |
|
|
|
31.1 |
| Certification of Principal Executive Officer Pursuant to Rules 13a-14(a) and 15d-14(a) under the Securities Exchange Act of 1934, as Adopted Pursuant to Section 302 of the Sarbanes-Oxley Act of 2002. |
|
|
|
31.2 |
| Certification of Principal Financial Officer Pursuant to Rules 13a-14(a) and 15d-14(a) under the Securities Exchange Act of 1934, as Adopted Pursuant to Section 302 of the Sarbanes-Oxley Act of 2002. |
|
|
|
32.1 |
| Certification of Principal Executive Officer Pursuant to 18 U.S.C. Section 1350, as Adopted Pursuant to Section 906 of the Sarbanes-Oxley Act of 2002. |
|
|
|
32.2 |
| Certification of Principal Financial Officer Pursuant to 18 U.S.C. Section 1350, as Adopted Pursuant to Section 906 of the Sarbanes-Oxley Act of 2002. |
|
|
|
101.1 |
| Interactive Data Files. |
- 52 -
SIGNA TURE
Pursuant to the requirements of the Securities Exchange Act of 1934, as amended, the Registrant has duly caused this report to be signed on its behalf by the undersigned thereunto duly authorized.
|
|
| FEDEX CORPORATION |
|
|
|
|
Date: December 20, 2017 |
|
| /s/ JOHN L. MERINO |
|
|
| JOHN L. MERINO |
|
|
| CORPORATE VICE PRESIDENT AND |
|
|
| PRINCIPAL ACCOUNTING OFFICER |
- 53 -
EXHIBIT INDEX
Exhibit Number |
| Description of Exhibit |
|
|
|
10.1 |
| Amendment dated October 16, 2017 (but effective as of May 1, 2017), amending the Transportation Agreement dated April 23, 2013 between the United States Postal Service and Federal Express Corporation (the "USPS Transportation Agreement"). Confidential treatment has been requested for confidential commercial and financial information, pursuant to Rule 24b-2 under the Securities Exchange Act of 1934, as amended (the "Exchange Act"). |
|
|
|
10.2 |
| Amendment dated October 16, 2017 (but effective as of June 5, 2017), amending the USPS Transportation Agreement. Confidential treatment has been requested for confidential commercial and financial information, pursuant to Rule 24b-2 under the Exchange Act. |
|
|
|
10.3 |
| Amendment dated October 16, 2017 (but effective as of July 3, 2017), amending the USPS Transportation Agreement. Confidential treatment has been requested for confidential commercial and financial information, pursuant to Rule 24b-2 under the Exchange Act. |
|
|
|
10.4 |
| Amendment dated October 16, 2017 (but effective as of August 28, 2017), amending the USPS Transportation Agreement. Confidential treatment has been requested for confidential commercial and financial information, pursuant to Rule 24b-2 under the Exchange Act. |
|
|
|
10.5 |
| Amendment dated October 16, 2017 (but effective as of July 31, 2017), amending the USPS Transportation Agreement. Confidential treatment has been requested for confidential commercial and financial information, pursuant to Rule 24b-2 under the Exchange Act. |
|
|
|
10.6 |
| Amendment dated October 16, 2017 (but effective as of August 28, 2017), amending the USPS Transportation Agreement. Confidential treatment has been requested for confidential commercial and financial information, pursuant to Rule 24b-2 under the Exchange Act. |
|
|
|
10.7 |
| Amendment dated October 16, 2017 (but effective as of January 2, 2017), amending the USPS Transportation Agreement. Confidential treatment has been requested for confidential commercial and financial information, pursuant to Rule 24b-2 under the Exchange Act. |
|
|
|
10.8 |
| Amendment dated November 7, 2017 (but effective as of October 2, 2017), amending the USPS Transportation Agreement. Confidential treatment has been requested for confidential commercial and financial information, pursuant to Rule 24b-2 under the Exchange Act. |
|
|
|
10.9 |
| Amendment dated November 7, 2017 (but effective as of October 2, 2017), amending the USPS Transportation Agreement. |
|
|
|
10.10 |
| Amendment dated November 7, 2017 (but effective as of October 30, 2017), amending the USPS Transportation Agreement. Confidential treatment has been requested for confidential commercial and financial information, pursuant to Rule 24b-2 under the Exchange Act. |
|
|
|
10.11 |
| Supplemental Agreement No. 27 (and related side letter) dated as of October 12, 2017, amending the Boeing 777 Freighter Purchase Agreement dated as of November 7, 2006, between The Boeing Company and Federal Express Corporation. Confidential treatment has been requested for confidential commercial and financial information, pursuant to Rule 24b-2 under the Exchange Act. |
|
|
|
10.12 |
| FedEx Corporation 2010 Omnibus Stock Incentive Plan, as amended. |
|
|
|
12.1 |
| Computation of Ratio of Earnings to Fixed Charges. |
|
|
|
15.1 |
| Letter re: Unaudited Interim Financial Statements. |
|
|
|
31.1 |
| Certification of Principal Executive Officer Pursuant to Rules 13a-14(a) and 15d-14(a) under the Securities Exchange Act of 1934, as Adopted Pursuant to Section 302 of the Sarbanes-Oxley Act of 2002. |
|
|
|
31.2 |
| Certification of Principal Financial Officer Pursuant to Rules 13a-14(a) and 15d-14(a) under the Securities Exchange Act of 1934, as Adopted Pursuant to Section 302 of the Sarbanes-Oxley Act of 2002. |
|
|
|
32.1 |
| Certification of Principal Executive Officer Pursuant to 18 U.S.C. Section 1350, as Adopted Pursuant to Section 906 of the Sarbanes-Oxley Act of 2002. |
|
|
|
32.2 |
| Certification of Principal Financial Officer Pursuant to 18 U.S.C. Section 1350, as Adopted Pursuant to Section 906 of the Sarbanes-Oxley Act of 2002. |
|
|
|
101.1 |
| Interactive Data Files. |
E-1