UNITED STATES
SECURITIES AND EXCHANGE COMMISSION
WASHINGTON, D.C. 20549
FORM 10-K
x | ANNUAL REPORT UNDER SECTION 13 OR 15(d) OF THE SECURITIES EXCHANGE ACT OF 1934 |
FOR THE FISCAL YEAR ENDED DECEMBER 31, 2010
COMMISSION FILE NUMBER 333-90273
FIDELITY D & D BANCORP, INC.
COMMONWEALTH OF PENNSYLVANIA I.R.S. EMPLOYER IDENTIFICATION NO: 23-3017653
BLAKELY AND DRINKER STREETS
DUNMORE, PENNSYLVANIA 18512
TELEPHONE NUMBER (570) 342-8281
SECURITIES REGISTERED UNDER SECTION 12(b) OF THE ACT:
None
SECURITIES REGISTERED UNDER SECTION 12(g) OF THE ACT:
Common Stock, without par value
Indicate by check mark if the registrant is a well-known seasoned issuer, as defined in Rule 405 of the Securities Act. Yes ¨ No x
Indicate by check mark if the registrant is not required to file reports pursuant to Section 13 or Section 15(d) of the Act. Yes ¨ No x
Indicate by check mark whether the registrant (1) has filed all reports required to be filed by Section 13 or 15(d) of the Securities Exchange Act of 1934 during the preceding 12 months (or for such shorter period that the registrant was required to file such reports), and (2) has been subject to such filing requirements for the past 90 days. Yes x No ¨
Indicate by check mark whether the registrant has submitted electronically and posted on its corporate Web site, if any, every Interactive Data File required to be submitted and posted pursuant to Rule 405 of Regulation S-T (§ 232.405 of this chapter) during the preceding 12 months (or for such shorter period that the registrant was required to submit and post such files). Yes ¨ No ¨
Indicate by check mark if disclosure of delinquent filers pursuant to Item 405 of Regulation S-K is not contained herein, and will not be contained, to the best of the registrant's knowledge, in definitive proxy or information statements incorporated by references in Part III of this Form 10-K or any amendment to this Form 10-K. x
Indicate by check mark whether the registrant is a large accelerated filer, an accelerated filer, a non-accelerated filer or a smaller reporting company. See definition of "large accelerated filer," "accelerated filer" and "smaller reporting company" in Rule 12b-2 of the Exchange Act. (Check One)
Large accelerated filer ¨ | Accelerated filer ¨ | |
Non-accelerated filer ¨ | Smaller reporting company x | |
(Do not check if a smaller reporting company) |
Indicate by check mark whether the registrant is a shell company (as defined in Rule 12b-2 of the Act). Yes ¨ No x
The aggregate market value of the voting common stock held by non-affiliates of the registrant was $24,818,987 as of June 30, 2010, based on the closing price of $14.00. The number of shares of common stock outstanding as of February 28, 2011, was 2,182,829.
DOCUMENTS INCORPORATED BY REFERENCE
Excerpts from the Registrant's 2010 Annual Report to Shareholders are incorporated herein by reference in response to Part I. Portions of the Registrant's definitive Proxy Statement to be used in connection with the 2011 Annual Meeting of Shareholders are incorporated herein by reference in partial response to Part II and Part III.
Fidelity D & D Bancorp, Inc.
2010 Annual Report on Form 10-K
Table of Contents
Part I. | ||||
Item 1. | Business | 3 | ||
Item 1A. | Risk Factors | 5 | ||
Item 1B. | Unresolved Staff Comments | 10 | ||
Item 2. | Properties | 10 | ||
Item 3. | Legal Proceedings | 11 | ||
Item 4. | Removed and Reserved | 11 | ||
Part II. | ||||
Item 5. | Market for Registrant's Common Equity, Related Stockholder Matters and Issuer Purchases of Equity Securities | 12 | ||
Item 6. | Selected Financial Data | 14 | ||
Item 7. | Management's Discussion and Analysis of Financial Condition and Results of Operation | 15 | ||
Item 7A. | Quantitative and Qualitative Disclosures About Market Risk | 47 | ||
Item 8. | Financial Statements and Supplementary Data | 48 | ||
Item 9. | Changes in and Disagreements with Accountants on Accounting and Financial Disclosure | 89 | ||
Item 9A (T). | Controls and Procedures | 89 | ||
Item 9B. | Other Information | 89 | ||
Part III. | ||||
Item 10. | Directors, Executive Officers and Corporate Governance | 90 | ||
Item 11. | Executive Compensation | 90 | ||
Item 12. | Security Ownership of Certain Beneficial Owners and Management and Related Stockholder Matters | 90 | ||
Item 13. | Certain Relationships and Related Transactions, and Director Independence | 90 | ||
Item 14. | Principal Accountant Fees and Services | 90 | ||
Part IV. | ||||
Item 15. | Exhibits and Financial Statement Schedules | 90 | ||
Signatures | 93 | |||
Exhibit Index | 94 | |||
Certifications |
| |||
2
FIDELITY D & D BANCORP, INC.
PART I
Forward-Looking Statements
Certain of the matters discussed in this Annual Report on Form 10-K may constitute forward-looking statements for purposes of the Securities Act of 1933, as amended, and the Securities Exchange Act of 1934, as amended, and as such may involve known and unknown risks, uncertainties and other factors which may cause the actual results, performance or achievements of the Company to be materially different from future results, performance or achievements expressed or implied by such forward-looking statements. The words "expect," "anticipate," "intend," "plan," "believe," "estimate," and similar expressions are intended to identify such forward-looking statements.
The Company's actual results may differ materially from the results anticipated in these forward-looking statements due to a variety of factors, including, without limitation:
| § | the effects of economic deterioration on current customers, specifically the effect of the economy on loan customers' ability to repay loans; |
| § | the costs and effects of litigation and of unexpected or adverse outcomes in such litigation; |
| § | the impact of new laws and regulations, including the Dodd-Frank Wall Street Reform and Consumer Protection Act of 2010 and the regulations promulgated there under. |
| § | governmental monetary and fiscal policies, as well as legislative and regulatory changes; |
| § | the effect of changes in accounting policies and practices, as may be adopted by the regulatory agencies, as well as the Financial Accounting Standards Board and other accounting standard setters; |
| § | the risks of changes in interest rates on the level and composition of deposits, loan demand, and the values of loan collateral, securities and interest rate protection agreements, as well as interest rate risks; |
| § | the effects of competition from other commercial banks, thrifts, mortgage banking firms, consumer finance companies, credit unions, securities brokerage firms, insurance companies, money market and other mutual funds and other financial institutions operating in our market area and elsewhere, including institutions operating locally, regionally, nationally and internationally, together with such competitors offering banking products and services by mail, telephone, computer and the internet; |
| § | technological changes; |
| § | acquisitions and integration of acquired businesses; |
| § | the failure of assumptions underlying the establishment of reserves for loan losses and estimations of values of collateral and various financial assets and liabilities; |
| § | volatilities in the securities markets; |
| § | deteriorating economic conditions |
| § | acts of war or terrorism; and |
| § | disruption of credit and equity markets. |
The Company cautions readers not to place undue reliance on forward-looking statements, which reflect analyses only as of the date of this document. The Company has no obligation to update any forward-looking statements to reflect events or circumstances after the date of this document.
Readers should review the risk factors described in this document and other documents that we file or furnish, from time- to-time, with the Securities and Exchange Commission, including quarterly reports filed on Form 10-Q and any current reports filed or furnished on Form 8-K.
ITEM 1: BUSINESS
Fidelity D & D Bancorp, Inc. (the Company) was incorporated in the Commonwealth of Pennsylvania, on August 10, 1999, and is a bank holding company, whose wholly-owned state chartered commercial bank is The Fidelity Deposit and Discount Bank (the Bank) (collectively, the Company). The Company is headquartered at Blakely and Drinker Streets in Dunmore, Pennsylvania.
The Bank has offered a full range of traditional banking services since it commenced operations in 1903. The Bank has a personal and corporate trust department and also provides alternative financial and insurance products with asset management services. A full list of services provided by the Bank is detailed in the section entitled "Products and Services" contained within the 2010 Annual Report to Shareholders, incorporated by reference. The service area is comprised of the Borough of Dunmore and the surrounding communities within Lackawanna and Luzerne counties in Northeastern Pennsylvania.
3
The banking business is highly competitive, and the profitability of the Company depends principally upon the Company's ability to compete in its market area. Competition includes, among other sources, the following:
§ local community banks | § insurance companies |
§ savings banks | § money market funds |
§ regional banks | § mutual funds |
§ credit unions | § small loan companies |
§ savings & loans | § other financial service companies |
The Company has been able to compete effectively with other financial institutions by emphasizing technology and customer service, including local decision making on loans. These efforts enabled the Company to establish long-term customer relationships and build customer loyalty by providing products and services designed to address their specific needs.
There are no concentrations of loans that, if lost, would have a materially adverse effect on the continued business of the Company. There are no material concentrations within a single industry or group of related industries that are vulnerable to the risk of a near-term severe impact. However, the Company's success is dependent, to a significant degree, on economic conditions in Northeastern Pennsylvania, especially Lackawanna and Luzerne counties which the Company defines as its primary market area. The banking industry is affected by general economic conditions including the effects of inflation, recession, unemployment, real estate values, trends in national and global economies and other factors beyond the Company's control. An economic recession or a delayed economic recovery over a prolonged period of time in the Company's primary market area could cause an increase in the level of the Company's non-performing assets and loan losses, and thereby cause operating losses, impairment of liquidity and erosion of capital. We cannot assure you that adverse changes in the local economy would not have a material effect on the Company's future consolidated financial condition, results of operations and cash flows. Refer to Item 1A, "Risk Factors" for material risks and uncertainties that management believes affect the Company.
The Company had 159 full-time equivalent employees on December 31, 2010, which includes exempt officers, exempt, non-exempt and part-time employees.
Federal and state banking laws contain numerous provisions that affect various aspects of the business and operations of the Company and the Bank. The Company is subject to, among others, the regulations of the Securities and Exchange Commission (the SEC) and the Federal Reserve Board (the FRB) and the Bank is subject to, among others, the regulations of the Pennsylvania Department of Banking and the Federal Deposit Insurance Corporation (the FDIC). Refer to Part II, Item 7 "Supervision and Regulation" for descriptions of and references to applicable statutes and regulations which are not intended to be complete descriptions of these provisions or their effects on the Company or the Bank. They are summaries only and are qualified in their entirety by reference to such statutes and regulations. Applicable regulations relate to, among other things:
§ operations | § consolidation |
§ securities | § reserves |
§ risk management | § dividends |
§ consumer compliance | § branches |
§ mergers | § capital adequacy |
Annually, the Bank is examined by the Pennsylvania Department of Banking and/or the FDIC. The last examination was conducted by the Pennsylvania Department of Banking as of March 31, 2010.
The Company's website address is http://www.bankatfidelity.com. The Company makes available through this website the annual reports on Form 10-K, quarterly reports on Form 10-Q and current reports on Form 8-K and amendments to those reports as soon as reasonably practical after filing with the SEC. You may read and copy any materials filed with the SEC at the SEC's Public Reference Room at 100 F Street, NE, Washington, DC 20549. You may obtain information on the operation of the Public Reference Room by calling the SEC at (202) 551-8090. The SEC also maintains an internet site that contains reports, proxy and information statements and other information about the Company at http://www.sec.gov.
The Company's accounting policies and procedures are designed to comply with accounting principles generally accepted in the United States of America (GAAP). Refer to "Critical Accounting Policies," which are incorporated by reference in Part II, Item 7.
4
ITEM 1A: RISK FACTORS
An investment in the Company's common stock is subject to risks inherent to the Company's business. The material risks and uncertainties that management believes affect the Company are described below. Before making an investment decision, you should carefully consider the risks and uncertainties described below together with all of the other information included or incorporated by reference in this report. The risks and uncertainties described below are not the only ones facing the Company. Additional risks and uncertainties that management is not aware of or focused on or that management currently deems immaterial may also impair the Company's business operations. This report is qualified in its entirety by these risk factors.
If any of the following risks actually occur, the Company's financial condition and results of operations could be materially and adversely affected. If this were to happen, the value of the Company's common stock could decline significantly, and you could lose all or part of your investment.
Risks Related to the Company's Business
The Company's business is subject to interest rate risk and variations in interest rates may negatively affect its financial performance.
Changes in the interest rate environment may reduce profits. The Company's earnings and cash flows are largely dependent upon its net interest income. Net interest income is the difference between the interest earned on loans, securities and other interest-earning assets, and interest paid on deposits, borrowings and other interest-bearing liabilities. As prevailing interest rates change, net interest spreads are affected by the difference between the maturities and re-pricing characteristics of interest-earning assets and interest-bearing liabilities. In addition, loan volume and yields are affected by market interest rates on loans, and rising interest rates generally are associated with a lower volume of loan originations. An increase in the general level of interest rates may also adversely affect the ability of certain borrowers to pay the interest on and principal of their obligations. Accordingly, changes in levels of market interest rates could materially adversely affect the Company's net interest spread, asset quality, loan origination volume and overall profitability.
The Company is subject to lending risk.
There are inherent risks associated with the Company's lending activities. These risks include, among other things, the impact of changes in interest rates and changes in the economic conditions in the markets where the Company operates as well as those across the Commonwealth of Pennsylvania and the United States. Increases in interest rates and/or weakening economic conditions could adversely impact the ability of borrowers to repay outstanding loans or the value of the collateral securing these loans. The Company is also subject to various laws and regulations that affect its lending activities. Failure to comply with applicable laws and regulations could subject the Company to regulatory enforcement action that could result in the assessment of significant civil money penalties against the Company.
Commercial, commercial real estate and real estate construction loans are generally viewed as having more risk of default than residential real estate loans or consumer loans. These types of loans are also typically larger than residential real estate loans and consumer loans. Because these loans generally have larger balances than residential real estate loans and consumer loans, the deterioration of one or a few of these loans could cause a significant increase in non-performing loans. An increase in non-performing loans could result in a net loss of earnings from these loans, an increase in the provision for possible loan losses and an increase in loan charge-offs, all of which could have a material adverse effect on the Company's financial condition and results of operations.
The Company's allowance for possible loan losses may be insufficient.
The Company maintains an allowance for possible loan losses, which is a reserve established through a provision for possible loan losses charged to expense, that represents management's best estimate of probable losses that have been incurred within the existing portfolio of loans. The allowance, in the judgment of management, is necessary to reserve for estimated loan losses and risks inherent in the loan portfolio. The level of the allowance reflects management's continuing evaluation of industry concentrations; specific credit risks; loan loss experience; current loan portfolio quality; present economic, political and regulatory conditions and unidentified losses inherent in the current loan portfolio. The determination of the appropriate level of the allowance for possible loan losses inherently involves a high degree of subjectivity and requires the Company to make significant estimates of current credit risks and future trends, all of which may undergo material changes. Changes in economic conditions affecting borrowers, new information regarding existing loans, identification of additional problem loans and other factors, both within and outside of the Company's control, may require an increase in the allowance for possible loan losses. In addition, bank regulatory agencies periodically review the Company's allowance for loan losses and may require an increase in the provision for possible loan losses or the recognition of further loan charge-offs, based on judgments different than those of management. In addition, if charge-offs in future periods exceed the allowance for possible loan losses, the Company will need additional provisions to increase the allowance for possible loan losses. Any increases in the allowance for loan losses will result in a decrease in net income and capital and may have a material adverse effect on the Company's financial condition and results of operations.
5
The Company may need or be compelled to raise additional capital in the future, but that capital may not be available when it is needed and on terms favorable to current shareholders.
Federal banking regulators require the Company and Bank to maintain adequate levels of capital to support their operations. These capital levels are determined and dictated by law, regulation and banking regulatory agencies. In addition, capital levels are also determined by the Company's management and board of directors based on capital levels that they believe are necessary to support the Company's business operations. The Company is evaluating its present and future capital requirements and needs, is developing a comprehensive capital plan and is analyzing capital raising alternatives, methods and options. Even if the Company succeeds in meeting the current regulatory capital requirements, the Company may need to raise additional capital in the near future to support possible loan losses during future periods or to meet future regulatory capital requirements.
Further, the Company's regulators may require it to increase its capital levels. If the Company raises capital through the issuance of additional shares of its common stock or other securities, it would likely dilute the ownership interests of current investors and would likely dilute the per-share book value and earnings per share of its common stock. Furthermore, it may have an adverse impact on the Company's stock price. New investors may also have rights, preferences and privileges senior to the Company's current shareholders, which may adversely impact its current shareholders. The Company's ability to raise additional capital will depend on conditions in the capital markets at that time, which are outside its control, and on its financial performance. Accordingly, the Company cannot assure you of its ability to raise additional capital on terms and time frames acceptable to it or to raise additional capital at all. If the Company cannot raise additional capital in sufficient amounts when needed, its ability to comply with regulatory capital requirements could be materially impaired. Additionally, the inability to raise capital in sufficient amounts may adversely affect the Company's operations, financial condition and results of operations.
If we conclude that the decline in value of any of our investment securities is other-than-temporary, we will be required to write down the credit-related portion of the impairment of that security through a charge to earnings.
We review our investment securities portfolio at each quarter-end reporting period to determine whether the fair value is below the current carrying value. When the fair value of any of our investment securities has declined below its carrying value, we are required to assess whether the decline is other-than-temporary. If we conclude that the decline is other-than-temporary, we will be required to write down the credit-related portion of the impairment of that security through a charge to earnings. As of December 31, 2010, the book value of the Company's pooled trust preferred securities was $6,873,000 with an estimated fair value of $1,453,000. Changes in the expected cash flows of these securities and/or prolonged price declines have resulted and may result in our concluding in future periods that there is additional impairment of these securities that is other-than-temporary, which would require a charge to earnings for the portion of the impairment that is deemed to be credit-related. Due to the complexity of the calculations and assumptions used in determining whether an asset, such as pooled trust preferred securities, is impaired, the impairment disclosed may not accurately reflect the actual impairment in the future.
The Company is subject to environmental liability risk associated with lending activities.
A significant portion of the Company's loan portfolio is secured by real property. During the ordinary course of business, the Company may foreclose on and take title to properties securing certain loans. In doing so, there is a risk that hazardous or toxic substances could be found on these properties. If hazardous or toxic substances are found, the Company may be liable for remediation costs, as well as for personal injury and property damage. Environmental laws may require the Company to incur substantial expense and may materially reduce the affected property's value or limit the Company's ability to use or sell the affected property. In addition, future laws or more stringent interpretations or enforcement policies with respect to existing laws may increase the Company's exposure to environmental liability. Although the Company has policies and procedures to perform an environmental review before initiating any foreclosure action on real property, these reviews may not be sufficient to detect all potential environmental hazards. The remediation costs and any other financial liabilities associated with an environmental hazard could have a material adverse effect on the Company's financial condition and results of operations.
6
The Company's profitability depends significantly on economic conditions in the Commonwealth of Pennsylvania and the local region in which it conducts business.
The Company's success depends primarily on the general economic conditions of the Commonwealth of Pennsylvania and the specific local markets in which the Company operates. Unlike larger national or other regional banks that are more geographically diversified, the Company provides banking and financial services to customers primarily in Lackawanna and Luzerne Counties in Northeastern Pennsylvania. The local economic conditions in these areas have a significant impact on the demand for the Company's products and services as well as the ability of the Company's customers to repay loans, the value of the collateral securing loans and the stability of the Company's deposit funding sources. A significant decline in general economic conditions, caused by inflation, recession, acts of terrorism, an outbreak of hostilities or other international or domestic occurrences, unemployment, changes in securities markets or other factors could impact these local economic conditions and, in turn, have a material adverse effect on the Company's financial condition and results of operations.
There is no assurance that the Company will be able to successfully compete with others for business.
The Company competes for loans, deposits and investment dollars with numerous regional and national banks and other community banking institutions, as well as other kinds of financial institutions and enterprises, such as securities firms, insurance companies, savings associations, credit unions, mortgage brokers and private lenders. Many competitors have substantially greater resources than the Company does, and operate under less stringent regulatory environments. The differences in resources and regulations may make it more difficult for the Company to compete profitably, reduce the rates that it can earn on loans and on its investments, increase the rates it must offer on deposits and other funds, and adversely affect its overall financial condition and earnings.
The Company is subject to extensive government regulation and supervision.
The Company, primarily through the Bank, is subject to extensive federal and state regulation and supervision. Banking regulations are primarily intended to protect depositors' funds, federal deposit insurance funds and the banking system as a whole, not shareholders. These regulations affect the Company's lending practices, capital structure, investment practices, dividend policy and growth, among other things. Federal or commonwealth regulatory agencies continually review banking laws, regulations and policies for possible changes. Changes to statutes, regulations or regulatory policies, including changes in interpretation or implementation of statutes, regulations or policies, could affect the Company in substantial and unpredictable ways. Such changes could subject the Company to additional costs, limit the types of financial services and products the Company may offer and/or increase the ability of non-banks to offer competing financial services and products, among other things. Failure to comply with laws, regulations or policies could result in sanctions by regulatory agencies, civil money penalties and/or reputation damage, which could have a material adverse effect on the Company's business, financial condition and results of operations. While the Company has policies and procedures designed to prevent any such violations, there can be no assurance that such violations will not occur.
The Company's controls and procedures may fail or be circumvented.
Management regularly reviews and updates the Company's internal controls, disclosure controls and procedures, and corporate governance policies and procedures. Any system of controls, however well designed and operated, is based in part on certain assumptions and can provide only reasonable, not absolute, assurances that the objectives of the system are met. Any failure or circumvention of the Company's controls and procedures or failure to comply with regulations related to controls and procedures could have a material adverse effect on the Company's business, results of operations and financial condition.
New lines of business or new products and services may subject the Company to additional risks.
From time-to-time, the Company may implement new lines of business or offer new products and services within existing lines of business. There are substantial risks and uncertainties associated with these efforts, particularly in instances where the markets are not fully developed. In developing and marketing new lines of business and/or new products and services the Company may invest significant time and resources. Initial timetables for the introduction and development of new lines of business and/or new products or services may not be achieved and price and profitability targets may not prove feasible. External factors, such as compliance with regulations, competitive alternatives, and shifting market preferences, may also impact the successful implementation of a new line of business or a new product or service. Furthermore, any new line of business and/or new product or service could have a significant impact on the effectiveness of the Company's system of internal controls. Failure to successfully manage these risks in the development and implementation of new lines of business or new products or services could have a material adverse effect on the Company's business, results of operations and financial condition.
7
The Company's future acquisitions could dilute your ownership and may cause it to become more susceptible to adverse economic events.
The Company may use its common stock to acquire other companies or make investments in banks and other complementary businesses in the future. The Company may issue additional shares of common stock to pay for future acquisitions, which would dilute your ownership interest in the Company. Future business acquisitions could be material to the Company, and the degree of success achieved in acquiring and integrating these businesses into the Company could have a material effect on the value of the Company's common stock. In addition, any acquisition could require it to use substantial cash or other liquid assets or to incur debt. In those events, it could become more susceptible to economic downturns and competitive pressures.
The Company may not be able to attract and retain skilled people.
The Company's success depends, in large part, on its ability to attract and retain key people. Competition for the best people in most activities engaged in by the Company can be intense and the Company may not be able to hire people or to retain them. The unexpected loss of services of one or more of the Company's key personnel could have a material adverse impact on the Company's business because of their skills, knowledge of the Company's market, years of industry experience and the difficulty of promptly finding qualified replacement personnel.
The Company's information systems may experience an interruption or breach in security.
The Company relies heavily on communications and information systems to conduct its business. Any failure, interruption or breach in security of these systems could result in failures or disruptions in the Company's customer relationship management, general ledger, deposit, loan and other systems. While the Company has policies and procedures designed to prevent or limit the effect of the failure, interruption or security breach of its information systems, there can be no assurance that any such failures, interruptions or security breaches will not occur or, if they do occur, that they will be adequately addressed. The occurrence of any failures, interruptions or security breaches of the Company's information systems could damage the Company's reputation, result in a loss of customer business, subject the Company to additional regulatory scrutiny, or expose the Company to civil litigation and possible financial liability, any of which could have a material adverse effect on the Company's financial condition and results of operations.
The Company continually encounters technological change.
The financial services industry is continually undergoing rapid technological change with frequent introductions of new technology-driven products and services. The effective use of technology increases efficiency and enables financial institutions to better serve customers and to reduce costs. The Company's future success depends, in part, upon its ability to address the needs of its customers by using technology to provide products and services that will satisfy customer demands, as well as to create additional efficiencies in the Company's operations. Many of the Company's competitors have substantially greater resources to invest in technological improvements. The Company may not be able to effectively implement new technology-driven products and services or be successful in marketing these products and services to its customers. Failure to successfully keep pace with technological change affecting the financial services industry could have a material adverse impact on the Company's business and, in turn, the Company's financial condition and results of operations.
The Company is subject to claims and litigation pertaining to fiduciary responsibility.
From time-to-time, customers make claims and take legal action pertaining to the Company's performance of its fiduciary responsibilities. Whether customer claims and legal action related to the Company's performance of its fiduciary responsibilities are founded or unfounded, if such claims and legal actions are not resolved in a manner favorable to the Company, they may result in significant financial liability and/or adversely affect the market perception of the Company and its products and services as well as impact customer demand for those products and services. Any financial liability or reputation damage could have a material adverse effect on the Company's business, which, in turn, could have a material adverse effect on the Company's financial condition and results of operations.
Severe weather, natural disasters, acts of war or terrorism and other external events could significantly impact the Company's business.
Severe weather, natural disasters, acts of war or terrorism and other adverse external events could have a significant impact on the Company's ability to conduct business. Such events could affect the stability of the Company's deposit base, impair the ability of borrowers to repay outstanding loans, impair the value of collateral securing loans, cause significant property damage, result in loss of revenue and/or cause the Company to incur additional expenses. Severe weather or natural disasters, acts of war or terrorism or other adverse external events may occur in the future. Although management has established disaster recovery policies and procedures, the occurrence of any such event could have a material adverse effect on the Company's business, which, in turn, could have a material adverse effect on the Company's financial condition and results of operations.
8
Readers should review the risk factors described in other documents that we file or furnish, from time-to-time, with the Securities and Exchange Commission, including Annual Reports to Shareholders, Annual Reports filed on Form 10-K and other current reports filed or furnished on Form 8-K.
Risks Associated with the Company's Common Stock
The Company's stock price can be volatile.
Stock price volatility may make it more difficult for you to resell your common stock when you want and at prices you find attractive. The Company's stock price can fluctuate significantly in response to a variety of factors including, among other things:
· | Actual or anticipated variations in quarterly results of operations. |
· | Recommendations by securities analysts. |
· | Operating and stock price performance of other companies that investors deem comparable to the Company. |
· | News reports relating to trends, concerns and other issues in the financial services industry. |
· | Perceptions in the marketplace regarding the Company and/or its competitors. |
· | New technology used, or services offered, by competitors. |
· | Significant acquisitions or business combinations, strategic partnerships, joint ventures or capital commitments by or involving the Company or its competitors. |
· | Failure to integrate acquisitions or realize anticipated benefits from acquisitions. |
· | Changes in government regulations. |
· | Geopolitical conditions such as acts or threats of terrorism or military conflicts. |
General market fluctuations, industry factors and general economic and political conditions and events, such as economic slowdowns or recessions, interest rate changes or credit loss trends, could also cause the Company's stock price to decrease regardless of operating results.
The trading volume in the Company's common stock is less than that of other larger financial services companies.
The Company's common stock is listed for trading on the over-the-counter bulletin board and the trading volume in its common stock is less than that of other larger financial services companies. A public trading market having the desired characteristics of depth, liquidity and orderliness depends on the presence in the marketplace of willing buyers and sellers of the Company's common stock at any given time. This presence depends on the individual decisions of investors and general economic and market conditions over which the Company has no control. Given the lower trading volume of the Company's common stock, significant sales of the Company's common stock, or the expectation of these sales, could cause the Company's stock price to fall.
Risks Associated with the Company's Industry
Future governmental regulation and legislation could limit the Company's future growth.
The Company is a registered bank holding company, and its subsidiary bank is a depository institution whose deposits are insured by the FDIC. As a result, the Company is subject to various regulations and examinations by various regulatory authorities. In general, statutes establish the corporate governance and eligible business activities for the Company, certain acquisition and merger restrictions, limitations on inter-company transactions such as loans and dividends, capital adequacy requirements, requirements for anti-money laundering programs and other compliance matters, among other regulations. The Company is extensively regulated under federal and state banking laws and regulations that are intended primarily for the protection of depositors, federal deposit insurance funds and the banking system as a whole. Compliance with these statutes and regulations is important to the Company's ability to engage in new activities and consummate additional acquisitions.
In addition, the Company is subject to changes in federal and state tax laws as well as changes in banking and credit regulations, accounting principles and governmental economic and monetary policies. The Company cannot predict whether any of these changes may adversely and materially affect it. Federal and state banking regulators also possess broad powers to take supervisory actions as they deem appropriate. These supervisory actions may result in higher capital requirements, higher insurance premiums and limitations on the Company's activities that could have a material adverse effect on its business and profitability. While these statutes are generally designed to minimize potential loss to depositors and the FDIC insurance funds, they do not eliminate risk, and compliance with such statutes increases the Company's expense, requires management's attention and can be a disadvantage from a competitive standpoint with respect to non-regulated competitors.
9
The earnings of financial services companies are significantly affected by general business and economic conditions.
The Company's operations and profitability are impacted by general business and economic conditions in the United States and abroad. These conditions include short-term and long-term interest rates, inflation, money supply, political issues, legislative and regulatory changes, fluctuations in both debt and equity capital markets, broad trends in industry and finance, and the strength of the U.S. economy and the local economies in which the Company operates, all of which are beyond the Company's control. Deterioration in economic conditions could result in an increase in loan delinquencies and non-performing assets, decreases in loan collateral values and a decrease in demand for the Company's products and services, among other things, any of which could have a material adverse impact on the Company's financial condition and results of operations.
Financial services companies depend on the accuracy and completeness of information about customers and counterparties.
In deciding whether to extend credit or enter into other transactions, the Company may rely on information furnished by or on behalf of customers and counterparties, including financial statements, credit reports and other financial information. The Company may also rely on representations of those customers, counterparties or other third parties, such as independent auditors, as to the accuracy and completeness of that information. Reliance on inaccurate or misleading financial statements, credit reports or other financial information could have a material adverse impact on the Company's business and, in turn, the Company's financial condition and results of operations.
Consumers may decide not to use banks to complete their financial transactions.
Technology and other changes are allowing parties to complete financial transactions that historically have involved banks through alternative methods. For example, consumers can now maintain funds that would have historically been held as bank deposits in brokerage accounts or mutual funds. Consumers can also complete transactions such as paying bills and/or transferring funds directly without the assistance of banks. The process of eliminating banks as intermediaries, known as "disintermediation," could result in the loss of fee income, as well as the loss of customer deposits and the related income generated from those deposits. The loss of these revenue streams and the lower cost deposits as a source of funds could have a material adverse effect on the Company's financial condition and results of operations.
ITEM 1B: UNRESOLVED STAFF COMMENTS
None
ITEM 2: PROPERTIES
As of December 31, 2010, the Company operated 11 full-service banking offices, of which four were owned and seven were leased. None of the lessors of the properties leased by the Company are affiliated with the Company and all of the properties are located in the Commonwealth of Pennsylvania. The Company is headquartered at its owner-occupied main branch located on the corner of Blakely and Drinker Streets in Dunmore, PA.
The following table provides information with respect to the principal properties from which the Bank conducts business:
Location | Owned / leased* | Type of use | Full service | Drive-thru | ATM | |||||
Drinker & Blakely Sts., Dunmore, PA | Owned | Main Branch (1) (2) | x | x | x | |||||
111 Green Ridge St., Scranton, PA | Leased | Green Ridge Branch (2) | x | x | x | |||||
1311 Morgan Hwy., Clarks Summit, PA | Leased | Abington Branch (3) | x | x | x | |||||
1232 Keystone Industrial Park Rd., Dunmore, PA | Owned | Keystone Industrial Park Branch | x | x | x | |||||
338 North Washington Ave., Scranton, PA | Owned | Financial Center Branch (4) | x | x | ||||||
4010 Birney Ave., Moosic, PA | Leased | Moosic Branch | x | x | x | |||||
801 Wyoming Ave., West Pittston, PA | Leased | West Pittston Branch | x | x | ||||||
1598 Main St., Peckville, PA | Leased | Peckville Branch | x | x | x | |||||
247 Wyoming Ave., Kingston, PA | Leased | Kingston Branch | x | x | x | |||||
511 Scranton-Carbondale Hwy., Eynon, PA | Leased | Eynon Branch | x | x | x | |||||
400 S. Main St., Scranton, PA | Owned | West Scranton Branch (2) | x | x | x |
10
*All of the owned properties are free of encumbrances
(1) Executive and administrative, commercial lending, trust and asset management services are located at the Main Branch.
(2) This office has two automated teller machines (ATMs).
(3) In addition, there is a banking facility located in the Clarks Summit State Hospital. The office is leased from the hospital under a lease-for-service-provided agreement with service limited to employees and patients of the hospital.
(4) Executive, mortgage and consumer lending, finance and operational offices are located in this building. A portion of the building is leased to a non-related entity.
The Bank maintains several free-standing 24-hour ATMs located at the following locations in Pennsylvania:
| · | 139 Wyoming Ave., Scranton (former location of the Company's Scranton branch. This ATM was removed in February 2011.) |
| · | Marywood University, 2300 Adams Ave., Nazareth and Regina Halls, Scranton |
| · | Snö Mountain Ski Resort, 1000 Montage Mountain Rd., Moosic |
| · | Shoppes at Montage, 1035 Shoppes Blvd., Moosic |
Other real estate owned includes all foreclosed properties listed for sale. Upon possession, foreclosed properties are recorded on the Company's balance sheet at the lower of cost or fair value.
ITEM 3: LEGAL PROCEEDINGS
The nature of the Company's business generates some litigation involving matters arising in the ordinary course of business. However, in the opinion of the Company after consulting with legal counsel, no legal proceedings are pending, which, if determined adversely to the Company or the Bank, would have a material effect on the Company's undivided profits or financial condition. No legal proceedings are pending other than ordinary routine litigation incidental to the business of the Company and the Bank. In addition, to management's knowledge, no governmental authorities have initiated or contemplated any material legal actions against the Company or the Bank.
ITEM 4: REMOVED AND RESERVED
11
PART II
ITEM 5: MARKET FOR REGISTRANT'S COMMON EQUITY, RELATED STOCKHOLDER MATTERS AND ISSUER PURCHASES OF EQUITY SECURITIES
The common stock of the Company is traded on the over-the-counter bulletin board under the symbol "FDBC." Shareholders requesting information about the Company's common stock may contact:
Salvatore R. DeFrancesco, Jr., Treasurer
Fidelity D & D Bancorp, Inc.
Blakely and Drinker Sts.
Dunmore, PA 18512
(570) 342-8281
The following table lists the quarterly cash dividends paid per share and the range of high and low bid prices for the Company's common stock based on information obtained from on-line published sources. Such over-the-counter prices do not include retail mark-ups, markdowns or commissions:
2010 Prices | Dividends | 2009 Prices | Dividends | |||||||||||||||||||||
High | Low | paid | High | Low | paid | |||||||||||||||||||
1st Quarter | $ | 16.00 | $ | 14.75 | $ | 0.25 | $ | 26.50 | $ | 19.50 | $ | 0.25 | ||||||||||||
2nd Quarter | $ | 15.10 | $ | 12.05 | $ | 0.25 | $ | 24.00 | $ | 18.40 | $ | 0.25 | ||||||||||||
3rd Quarter | $ | 19.00 | $ | 12.75 | $ | 0.25 | $ | 22.00 | $ | 18.35 | $ | 0.25 | ||||||||||||
4th Quarter | $ | 20.00 | $ | 16.80 | $ | 0.25 | $ | 19.00 | $ | 14.60 | $ | 0.25 | ||||||||||||
Dividends are determined and declared by the Board of Directors of the Company. The Company expects to continue to pay cash dividends in the future; however, future dividends are dependent upon earnings, financial condition, capital strength and other factors of the Company. For a further discussion of regulatory capital requirements see Note 14, "Regulatory Matters," contained within the notes to the consolidated financial statements, incorporated by reference in Part II, Item 8.
The Company has established a dividend reinvestment plan (DRP) for its shareholders. The plan provides shareholders with a convenient and economical method of investing cash dividends payable on their common stock and the opportunity to make voluntary optional cash payments to purchase additional shares of the Company's common stock. Participants pay no brokerage commissions or service charges when they acquire additional shares of common stock through the plan. The administrator may purchase shares directly from the Company, in the open market, in negotiated transactions, or using a combination of these methods.
The Company had approximately 1,293 shareholders at December 31, 2010 and 1,290 shareholders as of February 28, 2011. The number of shareholders is the actual number of individual shareholders of record. Each security depository is considered a single shareholder for purposes of determining the approximate number of shareholders.
Securities authorized for issuance under equity compensation plans
The information required under this section is incorporated by reference herein, to the information presented in the Company's definitive Proxy Statement for its 2011 Annual Meeting of Shareholders to be filed with the SEC.
12
Performance graph
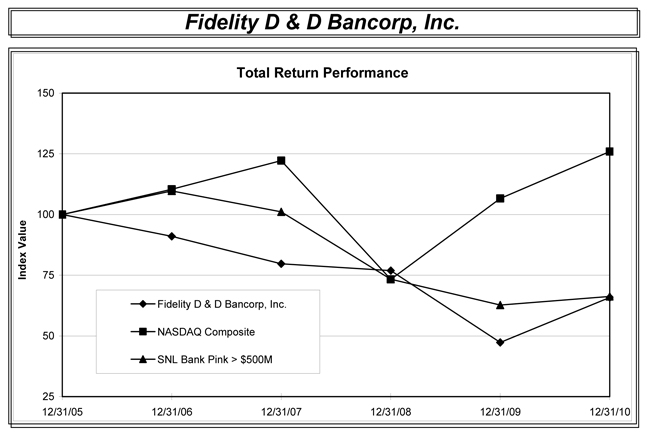
The following graph and table compare the cumulative total shareholder return on the Company's common stock against the cumulative total return of the NASDAQ Composite and the SNL index of greater than $500 million in-asset banks traded on the OTC-BB and Pink Sheet (the SNL index) for the period of five fiscal years commencing January 1, 2006, and ending December 31, 2010. As of December 31, 2010, the SNL index consisted of 81 banks. The graph illustrates the cumulative investment return to shareholders, based on the assumption that a $100 investment was made on December 31, 2005, in each of: the Company's common stock, the NASDAQ Composite and the SNL index. All cumulative total returns are computed assuming the reinvestment of dividends into the applicable securities. The shareholder return shown on the graph and table below is not necessarily indicative of future performance:
Period ending | ||||||||||||||||||||||||
Index | 12/31/05 | 12/31/06 | 12/31/07 | 12/31/08 | 12/31/09 | 12/31/10 | ||||||||||||||||||
Fidelity D & D Bancorp, Inc. | 100.00 | 91.03 | 79.73 | 76.90 | 47.28 | 65.81 | ||||||||||||||||||
NASDAQ Composite | 100.00 | 110.39 | 122.15 | 73.32 | 106.57 | 125.91 | ||||||||||||||||||
SNL > $500M OTC-BB and Pink Sheet Banks | 100.00 | 109.72 | 101.10 | 73.36 | 62.72 | 66.25 | ||||||||||||||||||
13
ITEM 6: SELECTED FINANCIAL DATA
Set forth below are our selected consolidated financial and other data. This financial data is derived in part from, and should be read in conjunction with the consolidated financial statements and notes thereto included in Part II, Item 8 of this report:
2010 | 2009 | 2008 | 2007 | 2006 | ||||||||||||||||
Balance sheet data: | ||||||||||||||||||||
Total assets | $ | 561,673,152 | $ | 556,017,271 | $ | 575,718,997 | $ | 587,412,555 | $ | 562,317,988 | ||||||||||
Total investment securities | 83,431,371 | 76,529,998 | 84,187,579 | 122,984,160 | 100,410,736 | |||||||||||||||
Net loans | 407,903,329 | 423,124,054 | 436,207,460 | 421,424,379 | 417,199,048 | |||||||||||||||
Loans held-for-sale | 213,000 | 1,221,365 | 84,000 | 827,250 | 122,000 | |||||||||||||||
Total deposits | 482,447,692 | 458,994,458 | 433,311,932 | 425,708,361 | 410,334,595 | |||||||||||||||
Short-term borrowings | 8,548,400 | 16,533,107 | 38,129,704 | 39,656,354 | 33,656,150 | |||||||||||||||
Long-term debt | 21,000,000 | 32,000,000 | 52,000,000 | 62,708,677 | 62,536,210 | |||||||||||||||
Total shareholders' equity | 46,774,015 | 45,674,547 | 48,960,651 | 55,191,294 | 51,611,863 | |||||||||||||||
Operating data for the year ended: | ||||||||||||||||||||
Total interest income | $ | 27,579,974 | $ | 29,909,273 | $ | 33,961,434 | $ | 35,279,357 | $ | 33,529,710 | ||||||||||
Total interest expense | 6,827,015 | 10,796,854 | 14,684,133 | 17,660,075 | 16,361,109 | |||||||||||||||
Net interest income | 20,752,959 | 19,112,419 | 19,277,301 | 17,619,282 | 17,168,601 | |||||||||||||||
Provision (credit) for loan losses | 2,085,000 | 5,050,000 | 940,000 | (60,000 | ) | 325,000 | ||||||||||||||
Net interest income after provision | ||||||||||||||||||||
(credit) for loan losses | 18,667,959 | 14,062,419 | 18,337,301 | 17,679,282 | 16,843,601 | |||||||||||||||
Other-than-temporary impairment | (11,835,918 | ) | (3,300,094 | ) | (435,665 | ) | - | - | ||||||||||||
Other income | 5,423,920 | 5,461,281 | 5,013,966 | 5,205,215 | 4,522,138 | |||||||||||||||
Other operating expense | 18,016,724 | 19,241,125 | 18,210,683 | 16,636,760 | 15,878,376 | |||||||||||||||
(Loss) income before income taxes | (5,760,763 | ) | (3,017,519 | ) | 4,704,919 | 6,247,737 | 5,487,363 | |||||||||||||
(Credit) provision for income taxes | (2,556,369 | ) | (1,617,314 | ) | 1,068,971 | 1,636,165 | 1,362,080 | |||||||||||||
Net (loss) income | $ | (3,204,394 | ) | $ | (1,400,205 | ) | $ | 3,635,948 | $ | 4,611,572 | $ | 4,125,283 | ||||||||
Per share data: | ||||||||||||||||||||
Net (loss) income per share, basic | $ | (1.50 | ) | $ | (0.67 | ) | $ | 1.76 | $ | 2.23 | $ | 2.01 | ||||||||
Net (loss) income per share, diluted | $ | (1.50 | ) | $ | (0.67 | ) | $ | 1.76 | $ | 2.23 | $ | 2.01 | ||||||||
Dividends declared | $ | 2,137,349 | $ | 2,078,171 | $ | 2,068,680 | $ | 1,921,533 | $ | 1,801,361 | ||||||||||
Dividends per share | $ | 1.00 | $ | 1.00 | $ | 1.00 | $ | 0.93 | $ | 0.88 | ||||||||||
Book value per share | $ | 21.48 | $ | 21.69 | $ | 23.73 | $ | 26.62 | $ | 25.09 | ||||||||||
Weighted-average shares outstanding | 2,141,323 | 2,080,507 | 2,068,851 | 2,066,683 | 2,047,975 | |||||||||||||||
Shares outstanding | 2,178,028 | 2,105,860 | 2,062,927 | 2,072,929 | 2,057,433 | |||||||||||||||
Ratios: | ||||||||||||||||||||
Return on average assets | -0.55 | % | -0.25 | % | 0.62 | % | 0.80 | % | 0.73 | % | ||||||||||
Return on average equity | -6.69 | % | -2.91 | % | 6.81 | % | 8.65 | % | 8.31 | % | ||||||||||
Net interest margin | 3.89 | % | 3.71 | % | 3.60 | % | 3.34 | % | 3.31 | % | ||||||||||
Efficiency ratio | 65.38 | % | 72.51 | % | 72.98 | % | 71.61 | % | 71.67 | % | ||||||||||
Expense ratio | 2.07 | % | 2.37 | % | 2.25 | % | 2.01 | % | 2.02 | % | ||||||||||
Allowance for loan losses to loans | 1.90 | % | 1.75 | % | 1.08 | % | 1.13 | % | 1.29 | % | ||||||||||
Dividend payout ratio | N/M | * | N/M | * | 56.90 | % | 41.67 | % | 43.67 | % | ||||||||||
Equity to assets | 8.33 | % | 8.21 | % | 8.50 | % | 9.40 | % | 9.18 | % | ||||||||||
Equity to deposits | 9.70 | % | 9.95 | % | 11.30 | % | 12.96 | % | 12.58 | % | ||||||||||
* The result of this calculation is not meaningful.
14
ITEM 7: | MANAGEMENT'S DISCUSSION AND ANALYSIS OF FINANCIAL CONDITION AND RESULTS OF OPERATION |
Critical accounting policies
The presentation of financial statements in conformity with U.S. GAAP requires management to make estimates and assumptions that affect many of the reported amounts and disclosures. Actual results could differ from these estimates.
A material estimate that is particularly susceptible to significant change relates to the determination of the allowance for loan losses. Management believes that the allowance for loan losses at December 31, 2010 is adequate and reasonable. Given the subjective nature of identifying and valuing loan losses, it is likely that well-informed individuals could make different assumptions, and could, therefore calculate a materially different allowance value. While management uses available information to recognize losses on loans, changes in economic conditions may necessitate revisions in the future. In addition, various regulatory agencies, as an integral part of their examination process, periodically review the Company's allowance for loan losses. Such agencies may require the Company to recognize adjustments to the allowance based on their judgment of information available to them at the time of their examination.
Another material estimate is the calculation of fair values of the Company's investment securities. Except for the Company's investment in corporate bonds, consisting of pooled trust preferred securities, fair values on the other investment securities are determined by prices provided by a third-party vendor, who is a provider of financial market data, analytics and related services to financial institutions. For the pooled trust preferred securities, management is unable to obtain readily attainable and realistic pricing from market traders due to a lack of active market participants and therefore management has determined the market for these securities to be inactive. In order to determine the fair value of the pooled trust preferred securities, management relied on the use of an income valuation approach (present value technique) that maximizes the use of relevant observable inputs and minimizes the use of unobservable inputs, the results of which are more representative of fair value than the market approach valuation technique used for the other investment securities.
Based on experience, management is aware that estimated fair values of investment securities tend to vary among valuation services. Accordingly, when selling investment securities, price quotes may be obtained from more than one source. As described in Notes 1 and 3 of the consolidated financial statements, incorporated by reference in Part II, Item 8, the majority of the Company's investment securities are classified as available-for-sale (AFS). AFS securities are carried at fair value on the consolidated balance sheets, with unrealized gains and losses, net of income tax, reported separately within shareholders' equity as a component of accumulated other comprehensive income (loss) (OCI).
The fair value of residential mortgage loans, classified as held-for-sale (HFS), is obtained from the Federal National Mortgage Association (FNMA) or the Federal Home Loan Bank (FHLB). Generally, the market to which the Company sells mortgages it originates for sale is restricted and price quotes from other sources are not typically obtained. On occasion, the Company may transfer loans from the loan portfolio to loans HFS. Under these rare circumstances, pricing may be obtained from other entities and the loans are transferred at the lower of cost or market value and simultaneously sold. For a further discussion on the accounting treatment of HFS loans, see the section entitled "Loans held-for-sale," contained within management's discussion and analysis. As of December 31, 2010 and 2009, loans classified as HFS consisted of residential mortgages.
All significant accounting policies are contained in Note 1, "Nature of Operations and Summary of Significant Accounting Policies", within the notes to consolidated financial statements and incorporated by reference in Part II, Item 8.
The following discussion and analysis presents the significant changes in the financial condition and in the results of operations of the Company as of December 31, 2010 and December 31, 2009 and for each of the years then ended. This discussion should be read in conjunction with the consolidated financial statements and notes thereto included in Part II, Item 8 of this report.
Comparison of Financial Condition as of December 31, 2010
and 2009 and Results of Operations for each of the Years then Ended
Financial Condition
Overview
The national economy shows signs of improvement as evidenced by, among other things, a decrease in the unemployment rate from December 2009 and moderate job growth. However, softness in the housing and real estate markets persist and unemployment levels remain elevated with a national unemployment rate of 9.4% for December 2010. Although we remain cautiously optimistic with respect to the outlook for credit quality and expect credit costs to decline in 2011, resulting in improved core financial performance, the uncertainty in the financial markets related to the Company's investments in pooled trust preferred securities, could continue to negatively impact the overall operating results. We anticipate maintaining a relatively stable net interest margin which, when coupled with lower credit costs and other cost containment measures should mitigate the earnings impact of any further write-downs of pooled trust preferred securities. Thus, capital improvement from sound financial performance and improved asset quality will be the tone for the upcoming year. In an effort to stimulate economic growth, the Federal Open Market Committee (FOMC) has not adjusted the short-term federal funds rate which has remained near zero percent over the past two years. Lower interest rates are expected to be the catalyst that will stimulate jobs creation. Though low interest rates help lower funding costs, at the same time their effect can be unfavorable to resetting floating-rate asset yields and re-financed fixed-rate assets thereby pressuring margins. The shape of the interest rate yield curve continued to be positively sloped throughout 2010 but the overall interest rate environment remained historically low. The management team of the Company is prepared to address these issues and will implement strategies to continue the journey through these uncertain times that will maximize financial performance and continue to strengthen the financial condition of the Company.
15
Consolidated assets increased $5,656,000, or 1%, during the year ended December 31, 2010 to $561,673,000. The increase was the result of increased deposits of $23,453,000, or 5%, and increased shareholders' equity of $1,099,000, or 2%. The cash inflow from deposits enabled the Company to reduce total borrowings by $18,985,000, or 39%. The increase in shareholders' equity was predominantly from $1.0 million of common stock issued via the Company's dividend reinvestment and employee stock purchase plans.
The following table is a comparison of condensed balance sheet accounts and percentage to total assets at December 31, 2010, 2009 and 2008 (dollars in thousands):
2010 | 2009 | 2008 | ||||||||||||||||||||||
Amount | % | Amount | % | Amount | % | |||||||||||||||||||
Assets: | ||||||||||||||||||||||||
Cash and cash equivalents | $ | 22,967 | 4.1 | % | $ | 8,328 | 1.5 | % | $ | 12,771 | 2.2 | % | ||||||||||||
Investment securities | 83,431 | 14.9 | 76,530 | 13.8 | 84,188 | 14.6 | ||||||||||||||||||
Federal Home Loan Bank Stock | 4,542 | 0.8 | 4,781 | 0.9 | 4,781 | 0.8 | ||||||||||||||||||
Loans and leases, net | 408,116 | 72.7 | 424,345 | 76.3 | 436,291 | 75.8 | ||||||||||||||||||
Bank premises and equipment | 14,764 | 2.6 | 15,362 | 2.8 | 16,056 | 2.8 | ||||||||||||||||||
Life insurance cash surrender value | 9,425 | 1.7 | 9,117 | 1.6 | 8,808 | 1.5 | ||||||||||||||||||
Other assets | 18,428 | 3.2 | 17,554 | 3.1 | 12,824 | 2.3 | ||||||||||||||||||
Total assets | $ | 561,673 | 100.0 | % | $ | 556,017 | 100.0 | % | $ | 575,719 | 100.0 | % | ||||||||||||
Liabilities: | ||||||||||||||||||||||||
Total deposits | $ | 482,448 | 85.9 | % | $ | 458,994 | 82.6 | % | $ | 433,312 | 75.3 | % | ||||||||||||
Short-term borrowings | 8,548 | 1.5 | 16,533 | 3.0 | 38,130 | 6.6 | ||||||||||||||||||
Long-term debt | 21,000 | 3.7 | 32,000 | 5.8 | 52,000 | 9.0 | ||||||||||||||||||
Other liabilities | 2,903 | 0.6 | 2,815 | 0.4 | 3,316 | 0.6 | ||||||||||||||||||
Total liabilities | 514,899 | 91.7 | 510,342 | 91.8 | 526,758 | 91.5 | ||||||||||||||||||
Shareholders' equity | 46,774 | 8.3 | 45,675 | 8.2 | 48,961 | 8.5 | ||||||||||||||||||
Total liabilities and shareholders' equity | $ | 561,673 | 100.0 | % | $ | 556,017 | 100.0 | % | $ | 575,719 | 100.0 | % | ||||||||||||
A comparison of net changes in selected balance sheet categories as of December 31, are as follows (dollars in thousands):
Earning | Short-term | Other | ||||||||||||||||||||||||||||||||||||||
Assets | % | assets* | % | Deposits | % | borrowings | % | borrowings | % | |||||||||||||||||||||||||||||||
2010 | $ | 5,656 | 1 | $ | 7,352 | 1 | $ | 23,453 | 5 | $ | (7,985 | ) | (48 | ) | $ | (11,000 | ) | (34 | ) | |||||||||||||||||||||
2009 | (19,702 | ) | (3 | ) | (26,475 | ) | (5 | ) | 25,683 | 6 | (21,597 | ) | (57 | ) | (20,000 | ) | (38 | ) | ||||||||||||||||||||||
2008 | (11,694 | ) | (2 | ) | (22,809 | ) | (4 | ) | 7,604 | 2 | (1,527 | ) | (4 | ) | (10,709 | ) | (17 | ) | ||||||||||||||||||||||
2007 | 25,095 | 4 | 26,074 | 5 | 15,374 | 4 | 6,000 | 18 | 172 | - | ||||||||||||||||||||||||||||||
2006 | 18,257 | 3 | 21,202 | 4 | 30,836 | 8 | 4,883 | 17 | (21,168 | ) | (25 | ) | ||||||||||||||||||||||||||||
* Earning assets exclude: loans and securities placed on non-accrual status.
16
Deposits
The Bank is a community based commercial financial institution, member FDIC, which offers a variety of deposit products with varying ranges of interest rates and terms. Deposit products include savings, clubs, interest-bearing checking (NOW), money market, non-interest bearing checking (DDA) and certificates of deposit. Certificates of deposit, or CDs, are deposits with stated maturities which can range from seven days to ten years. The flow of deposits is influenced by economic conditions, changes in the interest rate environment, pricing and competition. To determine interest rates on its deposit products, the Company considers local competition, spreads to earning-asset yields, liquidity position and rates charged for alternative sources of funding such as borrowings and FHLB advances. Though the Company competes for deposits, the interest rate setting strategy also considers the Company's balance sheet structure and cost effective strategies that are mindful of the current economic backdrop.
The following table represents the components of total deposits as of December 31, 2010 and 2009 (dollars in thousands):
2010 | 2009 | |||||||||||||||
Amount | % | Amount | % | |||||||||||||
Money market | $ | 79,610 | 16.5 | % | $ | 91,488 | 19.9 | % | ||||||||
NOW | 67,572 | 14.0 | 62,031 | 13.5 | ||||||||||||
Savings and clubs | 105,835 | 21.9 | 86,335 | 18.8 | ||||||||||||
Certificates of deposit | 143,651 | 29.8 | 148,250 | 32.4 | ||||||||||||
Total interest-bearing | 396,668 | 82.2 | 388,104 | 84.6 | ||||||||||||
Non-interest bearing | 85,780 | 17.8 | 70,890 | 15.4 | ||||||||||||
Total deposits | $ | 482,448 | 100.0 | % | $ | 458,994 | 100.0 | % | ||||||||
In 2009, the Company began to use the Certificate of Deposit Account Registry Service (CDARS) reciprocal program to obtain FDIC insurance protection for customers who have large deposits that at times exceed the FDIC maximum amount of $250,000. In the CDARS program, deposits with varying terms and interest rates, originated in the Company's own markets, are exchanged for deposits of other financial institutions that are members in the CDARS network. By placing these deposits in other participating institutions, the deposits of our customers are fully insured by the FDIC. In return for deposits placed with network institutions, the Company receives from network institutions deposits that are approximately equal in amount and contain similar terms as those placed for our customers. Deposits the Company receives, or reciprocal deposits, from other institutions are considered brokered deposits by regulatory definitions. As of December 31, 2010, CDARS represented $11,876,000, or 2%, of total deposits, compared to $8,748,000, or 2%, of total deposits at December 31, 2009.
Total deposits increased $23,453,000, or 5%, during 2010 to $482,448,000. The increase stems from growth in savings and clubs of $19,500,000, NOW accounts of $5,541,000 and non-interest bearing DDAs of $14,890,000, partially offset by a $4,599,000 decline in CDs and money market accounts of $11,878,000. Deposits are obtained mostly from consumers and businesses within the communities that surround the Company's 11 branch offices and all deposits are insured by the FDIC up to the full extent permitted by law. The Company's forte has been to develop some highly innovative deposit-gathering techniques. The savings product campaigns have bolstered deposit levels and possibly have provided a foundation on which to grow, retain and maintain core deposits to a new, higher plateau. Most notable was the introduction of the tiered interest rate savings account which has increased savings deposit balances back to all-time highs. This increase in conjunction with higher non-interest bearing DDAs and the Company's dedication to exemplary customer service will strengthen the low-cost funding base of the Company. The prolonged low interest rate environment has resulted in a wide-spread preference for customers not to renew maturing CDs. When market rates begin to rise, the Company will vigilantly develop and promote a CD gathering strategy that will capture new time deposits without significantly eroding its low-costing core deposit foundation.
17
The maturity distribution of certificates of deposit at December 31, 2010 is as follows (dollars in thousands):
More than | More than | More | ||||||||||||||||||
Three months | three months | six months to | than twelve | |||||||||||||||||
or less | to six months | twelve months | months | Total | ||||||||||||||||
CDs of $100,000 or more | $ | 16,012 | $ | 3,505 | $ | 9,302 | $ | 22,521 | $ | 51,340 | ||||||||||
CDs of less than $100,000 | 12,492 | 12,491 | 20,383 | 35,069 | 80,435 | |||||||||||||||
CDARS | - | 1,064 | 2,871 | 7,941 | 11,876 | |||||||||||||||
Total CDs | $ | 28,504 | $ | 17,060 | $ | 32,556 | $ | 65,531 | $ | 143,651 | ||||||||||
Including CDARS, approximately 54% of the CDs are scheduled to mature within one year. Renewing CDs may re-price to lower or higher market rates depending on the direction of interest rate movements, the shape of the yield curve, competition, the rate profile of the maturing accounts and depositor preference for alternative products.
Short-term borrowings
In addition to deposits, other funding sources available to the Company are short-term borrowings consisting of overnight funds purchased from the Federal Home Loan Bank of Pittsburgh (FHLB), fed funds purchased from correspondent banks, short-term advances from the FHLB and repurchase agreements with businesses and public entities. The Company uses overnight and short-term funding for asset growth, deposit run-off and short-term liquidity needs. Because of the success in deposit growth, during 2010 the Company's usage of overnight borrowings was minimal and allowed the reduction of overnight funding entirely, or by $8.6 million from 2009. During 2010 the Company borrowed and repaid a $9.5 million advance with the FHLB. The advance was a low-cost, short-term means to accommodate a match funded commercial loan with a municipal customer.
Repurchase agreements are non-insured interest-bearing liabilities that have a perfected security interest in qualified investments of the Company. The FDIC Depositor Protection Act of 2009 requires banks to provide a perfected security interest to the purchasers of uninsured repurchase agreements. Repurchase agreements are offered through a sweep product. A sweep account is designed to ensure that on a daily basis, an attached DDA is adequately funded and excess funds are transferred, or "swept", into an interest-bearing overnight repurchase agreement account. Due to the constant flow of funds into and out of the sweep product, their balances tend to be somewhat volatile, mimicking the likes of a DDA. Customer liquidity is the typical cause for variances in repurchase agreements, which during 2010 declined $199,000 from $7,747,000 at December 31, 2009 to $7,548,000 as of December 31, 2010.
Overnight borrowings and repurchase agreements are included with short-term borrowings on the consolidated balance sheets. For a further discussion on short-term borrowings, see Note 7, "Short-Term Borrowings", contained in the notes to consolidated financial statements in Part II, Item 8.
Long-term debt
Long-term debt consists of borrowings from the FHLB. The weighted-average rate in effect on funds borrowed at December 31, 2010 was 4.87% compared to 5.11% as of December 31, 2009. The 2010 weighted-average rate was 25 basis points below the tax-equivalent yield of 5.12% earned from the Company's portfolio of average interest-earning assets for the year ended December 31, 2010. Interest rates on the $21,000,000 balances of two long-term advances are currently fixed until 2013 and 2016, but are structured to adjust quarterly should market interest rates increase beyond the issues' original or strike rates. Significant prepayment penalties are attached to the borrowings thereby creating a disincentive from paying off the higher cost advances. However, in the event underlying market rates drift above the rates currently paid on these borrowings, the fixed-rate would convert to a floating rate advance and at that time, the Company would have the option to repay or to renegotiate the converted advance rate. As of December 31, 2010, the Company had the ability to borrow an additional $163,585,000 from the FHLB.
Investments
The Company's investment policy is designed to complement its lending activities, provide monthly cash flow, manage interest rate sensitivity, generate a favorable return above cash holdings, without incurring undue interest rate and credit risk and manage liquidity at acceptable levels. In establishing investment strategies, the Company considers its business, growth or restructuring plans, the economic environment, the interest rate sensitivity position, the types of securities held, permissible purchases, credit quality, maturity and re-pricing terms, call or average-life intervals and investment concentrations. The policy prescribes permissible investment categories that meet the policy standards and management is responsible for structuring and executing the specific investment purchases within these policy parameters. Management buys and sells investment securities from time-to-time depending on market conditions, business trends, liquidity needs, capital levels and structuring strategies. Investment security purchases provide a way to quickly invest excess liquidity in order to generate additional earnings. The Company generally earns a positive interest spread by assuming interest rate risk and using deposits and/or borrowings to purchase securities with longer maturities.
18
At the time of purchase, management classifies investment securities into one of three categories: trading, available-for-sale (AFS) or held-to-maturity (HTM). To date, management has not purchased any securities for trading purposes. Most of the securities purchased are classified as AFS even though there is no immediate intent to sell them. The AFS designation affords management the flexibility to sell securities and position the balance sheet in response to capital levels, liquidity needs or changes in market conditions. Securities AFS are carried at their net fair values in the consolidated balance sheets with an adjustment to shareholders' equity, net of tax, presented under the caption "Accumulated other comprehensive income (loss)." As of December 31, 2010, AFS debt securities were recorded with an unrealized net loss of $5,937,000 while equity securities were recorded with an unrealized gain of $154,000. Investment securities designated as HTM represent debt securities that the Company has the ability and intent to hold until maturity and are carried at amortized cost. As of December 31, 2010 and December 31, 2009, the aggregate fair value of securities HTM exceeded their respective aggregate amortized cost by $48,000 and $56,000, respectively.
As of December 31, 2010, the carrying value of investment securities totaled $83,431,000, or 15% of total assets, compared to $76,530,000, or 14% of total assets at December 31, 2009. At December 31, 2010, approximately 49% of the carrying value of the investment portfolio was comprised of U.S. Government Sponsored Enterprise residential mortgage-backed securities (MBS – GSE residential) that amortize and provide monthly cash flow. Municipal general obligations, Agency Government Sponsored Enterprise (Agency – GSE) securities and pooled trust preferred securities comprised 29%, 20% and 2%, respectively, of the investment portfolio at December 31, 2010.
A comparison of total investment securities as of December 31 follows:
2010 | 2009 | |||||||||||||||
Amount | % | Amount | % | |||||||||||||
MBS - GSE residential | $ | 41,043,828 | 49.2 | % | $ | 14,456,037 | 43.3 | % | ||||||||
State & municipal subdivisions | 24,171,094 | 29.0 | 23,270,289 | 18.9 | ||||||||||||
Agency - GSE | 16,287,953 | 19.5 | 33,132,301 | 30.4 | ||||||||||||
Pooled trust preferred securities | 1,452,795 | 1.7 | 5,241,844 | 6.8 | ||||||||||||
Equity securities - financial services | 475,701 | 0.6 | 429,527 | 0.6 | ||||||||||||
Total | $ | 83,431,371 | 100.0 | % | $ | 76,529,998 | 100.0 | % | ||||||||
The distribution of debt securities by stated maturity date at December 31, 2010 is as follows:
More than | More than | |||||||||||||||||||
One year | one year to | five years to | More than | |||||||||||||||||
or less | five years | ten years | ten years | Total | ||||||||||||||||
MBS - GSE residential | $ | - | $ | 24,030 | $ | 6,165,809 | $ | 34,853,989 | $ | 41,043,828 | ||||||||||
State & municipal subdivisions | - | - | 1,511,963 | 22,659,131 | 24,171,094 | |||||||||||||||
Agency - GSE | - | 982,500 | 8,032,933 | 7,272,520 | 16,287,953 | |||||||||||||||
Pooled trust preferred securities | - | - | - | 1,452,795 | 1,452,795 | |||||||||||||||
Total debt securities | $ | - | $ | 1,006,530 | $ | 15,710,705 | $ | 66,238,435 | $ | 82,955,670 | ||||||||||
19
The tax-equivalent yield on debt securities by stated maturity date at December 31, 2010 is as follows:
More than | More than | |||||||||||||||||||
One year | one year to | five years to | More than | |||||||||||||||||
or less | five years | ten years | ten years | Total | ||||||||||||||||
MBS - GSE residential | - | % | 6.08 | % | 2.65 | % | 4.40 | % | 3.10 | % | ||||||||||
State & municipal subdivisions | - | - | 5.87 | 6.19 | 6.18 | |||||||||||||||
Agency - GSE | - | 1.01 | 2.62 | 5.35 | 3.73 | |||||||||||||||
Pooled trust preferred securities | - | - | - | 1.67 | 1.67 | |||||||||||||||
Total debt securities | - | % | 1.13 | % | 2.94 | % | 3.94 | % | 3.75 | % | ||||||||||
In the above table, the book yields on state & municipal subdivisions were adjusted to a tax-equivalent basis using the corporate federal tax rate of 34%. In addition, average yields on securities AFS are based on amortized cost and do not reflect unrealized gains or losses.
Though stabilizing, uncertainty continues to reign in the financial markets which has increased the volatility in fair value estimates for the securities in the Company's investment portfolio. Though market values still remain below amortized cost, net of credit-related OTTI in the Company's portfolio of pooled trust preferred securities, fair values of the Company's investment securities have improved since year-end 2009. Management believes fair value changes are due mainly to the interest rate environment, and the unrealized losses are the result of what is perceived as instability in the capital markets, limited trading activity and illiquid conditions, not deterioration in the creditworthiness of the issuers. Nearly all of the securities in the portfolio have fixed rates or have predetermined scheduled rate changes, and many have call features that allow the issuer to call the security at par before its stated maturity without penalty. As of December 31, 2010, the debt securities with unrealized losses have 14.7% depreciation; an improvement compared to 25.9% at December 31, 2009. The most significant component of the $5.9 million net unrealized loss position in the AFS debt securities portfolio was $5.4 million from the Company's investments in pooled trust preferred securities.
Quarterly, management performs a review of the investment portfolio to determine the cause of declines in the fair value of each security. The Company uses inputs provided by independent third parties to determine the fair value of its investment securities portfolio. Inputs provided by the third party are reviewed and corroborated by management. Evaluations of the causes of the unrealized losses are performed to determine whether impairment is temporary or other-than-temporary. Considerations such as the Company's intent and ability to hold the securities to maturity, recoverability of the invested amounts over the intended holding period, the length of time and the severity in pricing decline below cost, the interest rate environment, the receipt of amounts contractually due and whether or not there is an active market for the security, for example, are applied, along with the financial condition of the issuer for management to make a realistic judgment of the probability that the Company will be unable to collect all amounts (principal and interest) due in determining whether a security is other-than-temporarily impaired. If a decline in value is deemed to be other-than-temporary, the amortized cost of the security is reduced by the credit impairment amount and a corresponding charge to earnings is recognized. If at the time of sale, call or maturity the proceeds exceed the security's amortized cost, the impairment charge may be fully or partially recovered.
The Company owns 13 tranches of pooled trust preferred securities (PreTSLs). The market for these securities and other issues of PreTSLs at December 31, 2010 remained inactive. The inactivity was evidenced first by a significant widening of the bid-ask spread in the brokered markets in which PreTSLs trade, then by a significant decrease in the volume of trades relative to historical levels and the lack of a new-issue market since 2007. There are currently very few market participants who are willing and/or able to transact for these securities. Given the conditions in the debt markets and in the absence of observable transactions in the secondary and a new-issue market, management has made the following observations and has determined:
| · | The few observable transactions and market quotations that were available were not reliable for purposes of determining fair value at December 31, 2010; |
| · | An income valuation approach (present value technique) that maximizes the use of relevant observable market inputs and minimizes the use of unobservable inputs are equally or more representative of fair value than the market approach valuation technique; and |
| · | The thirteen PreTSLs are classified within "Level 3" (as defined in current accounting guidance and explained in Note 12, "Fair Value of Financial Instruments" of the consolidated financial statements, incorporated by reference in Part II, Item 8) of the fair value hierarchy because significant adjustments are required to determine fair value at the measurement date. For December 31, 2010 the Company engaged a new independent third party, that is a structured products specialist firm, to analyze the PreTSL portfolio. The approach and results were reviewed and corroborated by management. The approach to determine OTTI involves the following: |
20
| o | Data about the transaction structure, as defined in the offering documents and the underlying collateral, were collected; |
| o | The credit worthiness of each collateral is determined by reviewing the obligor and estimating the credit risk existing or inherent for such obligor; |
| o | Using the credit risk estimates and making assumptions about default correlation, simulate 10,000 Monte Carlo scenarios with respect to default timing for each security; |
| o | Project tranche cash flows over 10,000 Monte Carlo scenarios; Determine the percentage of the total scenarios that result in a loss to the tranche. If the number of scenarios resulting in a loss exceeded 50%, OTTI is presumed to exist; |
| o | Utilize several high-level financial factors to construct an appropriate discount rate for each tranche within each transaction. Factors include the portfolio's weighted average credit rating, the average life of the collateral pool, the Bloomberg US Bank Benchmark discount rate, an appropriate spread differential to account for the rating assumed by the Bloomberg US Bank Benchmark and the actual average rating of the collateral pool. Lastly, credit loss already assumed under Monte Carlo simulation is subtracted from the discount rate construction in the previous step to avoid double-counting of credit risk; |
| o | With an appropriate discount rate for each tranche, an appropriate book price is determined; |
| o | With a projected discount rate, an estimated cash flow test was performed on each issue to compare the present value of the currently estimated cash flows as of December 31, 2010 to the amount projected as of the last measurement date, September 30, 2010; |
| o | If the results of the cash flow tests resulted in a significant adverse change in projected cash flows, credit-related OTTI is present. |
Based on the technique described, the Company determined that as of December 31, 2010, the amortized cost of 12 PreTSLs: IV, V, VII, IX, XI, XV, XVI, XVII, XVIII, XIX, XXIV and XXV had declined $11,947,000 in total during 2010 and since the present value of the security's expected cash flows were insufficient to recover the entire amortized cost, the securities are deemed to have experienced credit-related OTTI in the amount of $11,836,000 which was charged to current earnings as a component of other income in the consolidated statement of income for the year ended December 31, 2010. Future analyses could yield results that may indicate further impairment has occurred and would therefore require additional write-downs and corresponding OTTI charges to current earnings.
Prior to December 31, 2010, the valuation process used by the Company was different than the process currently used. The inputs used in the past also consisted of a mix of both observable and unobservable, however they were more global applications and not as security-specific as those currently used. For example, prior to December 31, 2010, to project a default rate, universal adjustments were applied to the historical average default rates. The historical average default rates were obtained from the FDIC for U.S. Banks and Thrifts for the period spanning 1988 to 1991. This rate was tripled, and then adjusted downward for actual deferrals/defaults in all PreTSLs for the years 2008 and 2009. The results were then stratified beginning with a higher rate of default and then regressing to normal, with projected global recoveries and prepayment speeds. The resulting rate was then applied to all of the PreTSLs in the Company's portfolio to determine period-end valuations and the existence of OTTI. Management of the Company has determined that a security-specific analysis is more representative of the performance and credit-worthiness of the collateral within each of the securities. Accordingly, the Company's intent is to use the new analysis in future OTTI determinations.
Federal Home Loan Bank Stock
Investment in FHLB stock is required for membership in the organization and is carried at cost since there is no market value available. The amount the Company is required to invest is dependent upon the relative size of outstanding borrowings the Company has with the FHLB. The Company was not required to purchase FHLB stock during 2010 and 2009. Excess stock is typically repurchased from the Company at par if the level of borrowings decline to a predetermined level. In addition, the Company normally earns a return or dividend on the amount invested. In December 2008, in order to preserve capital, the FHLB declared a suspension on the redemption of its stock and ceased payment of quarterly dividends until such time it becomes prudent to reinstate either or both. During the fourth quarter of 2010, the FHLB announced a partial lifting and limited repurchase of the stock redemption provision of the suspension. As a result, the Company was able to redeem $239,000 of its FHLB stock. The FHLB also announced that the dividend suspension remains in effect. Future redemptions and dividend payments will be predicated on the financial performance and health of the FHLB. Management believes that the FHLB will continue to be a primary source of wholesale liquidity for both short- and long-term funding and has concluded that its investment in FHLB stock is not other than temporarily impaired. Management reviews for impairment based on the ultimate recoverability of the cost basis in the FHLB stock. There can be no assurance that future negative changes to the financial condition of the FHLB may not require the Company to recognize an impairment charge with respect to such holdings. The Company will continue to monitor the financial condition of the FHLB and assess its future ability to resume normal dividend payments and stock redemption activities. Based on the financial results of the FHLB for the years December 31, 2010 and 2009, management had concluded that the suspension of both the dividend payments and excess capital stock redemptions is temporary in nature.
21
Loans
The Company originates commercial and industrial (commercial), commercial real estate (CRE), residential mortgages, consumer, home equity and construction loans. The relative volume of originations is dependent upon customer demand, current interest rates and the perception and duration of future interest levels. As part of the overall strategy to serve the business community in which it operates, the Company is focused on developing and implementing products and services to the broad spectrum of businesses that operate in its marketplace. The Company's goals center on building relationships by providing credit and cash management products and services, continuing to diversify its loan portfolio and utilizing loan participations to reduce risk in larger credit transactions. A loan participation is a tool that allows a community bank to meet the needs of its local customer base. Certain customers, from time-to-time, may require funding that is out of the ability of a local community bank. In such circumstances, it allows a bank to originate the loan, and subsequently sell a portion, or portions, of that loan to other financial institutions, thereby mitigating the risk the Company will take on with one loan. These sold portions of the loan are referred to as loan participations. During 2010, the Company originated and participated over $13,000,000 in commercial and commercial real estate loans. As of December 31, 2010, the Company has approximately $41,000,000 in sold loan participations outstanding. The policies, procedures and credit risk of the Company are reflective of the current economy. The risks associated with interest rates are being managed by utilizing floating versus long-term fixed rates and exploring programs where we can match our cost of funds. As a result of the continued low interest rate environment throughout 2010, long-term fixed-rate residential mortgage demand remained high. To manage interest rate risk, the Company originated $55,928,000 for sale into the secondary market rather than for portfolio retention.
As a part of the risk management practices of the Company, gross loans were strategically reduced $14,897,000, or 3%, from $430,698,000 at December 31, 2009 to $415,801,000 as of December 31, 2010. Gross loans represented 74% of total assets at December 31, 2010, compared to 77% of total assets as of December 31, 2009.
Net of loan participations, in 2010 the Company originated $26,041,000 of commercial and industrial loans and $12,022,000 of commercial real estate loans compared to $22,959,000 and $9,726,000, respectively in 2009. Also, during 2010, the Company originated $13,725,000 of residential real estate loans for portfolio retention and $15,986,000 of consumer loans, compared to $13,809,000 and $20,602,000, respectively, in 2009. Included in mortgage loans are $4,727,000 of residential real estate construction lines in 2010 and $8,307,000 in 2009. In addition for 2010, the Company had net originations of lines of credit in the amounts of $20,154,000 for commercial borrowers and $16,758,000 in home equity and other consumer lines of credit.
As previously stated, in keeping with the risk management strategy of the Company, net origination activity declined 1% in 2010 compared to 2009. The decline in the commercial and CRE originations was due to weak economic conditions and the related strict underwriting practices that the Company employs to help ensure against possible future losses, as well as selling participations in commercial and industrial and commercial real estate loans.
Commercial and industrial
Commercial and industrial lending increased $8,059,000, or 10%, to $85,129,000 during 2010. While the majority of this portfolio remained unchanged, with originations replacing scheduled run-off, the Company saw an increase in municipal tax anticipation loans. Tax anticipation loan activity provides the Company an opportunity to establish deposit and trust relationships in addition to provide for the funding needs of the local municipal and school district communities.
Commercial real estate
Commercial real estate lending saw a decrease of $20,294,000, or 11%, from $189,488,000 at December 31, 2009 to $169,194,000 as of December 31, 2010. There were several factors contributing to this overall decrease, including the selling of participations, the Company's decision to maintain its pricing standards and the resolution of several large commercial credits that were not renewed due to the strict underwriting standards of the Company, which are reflective of the current economic conditions.
22
Residential real estate
Residential real estate saw a decline of $4,190,000, or 5%, to $74,304,000 during 2010. The majority of this decrease was due to refinance activity associated with the low interest rate environment. Loans within the Company's residential real estate portfolio were refinanced, to long-term, fixed-rate loans, and subsequently sold into the secondary market, consistent with the risk management practices of the Company.
Consumer loans
Consumer loans saw a modest increase of $1,529,000, or 2%, from $85,645,000 at December 31, 2009 to $87,174,000 at December 31, 2010. While the consumer portfolio remained relatively stable during 2010, there was a flux in a few of the classes within this segment. Home equity installment loans saw a decrease of $8,088,000, which was almost entirely offset by a $7,334,000 increase in home equity lines of credit. The Company credits this fluctuation within the portfolio to home equity installment loan pay-offs from mortgage loan refinancing partially offset by promotions run during 2010 featuring home equity lines of credit with a floating rate that was tied to the national prime rate.
A comparison of domestic loans and related percentage of gross loans, at December 31, for the five previous periods as is as follows:
2010 | % | 2009 | % | |||||||||||||||||||||
Commercial and industrial | $ | 85,129,274 | 20.5 | % | $ | 77,070,743 | 17.9 | % | ||||||||||||||||
Commercial real estate: | ||||||||||||||||||||||||
Non-owner occupied | 69,337,940 | 16.7 | 79,012,903 | 18.3 | ||||||||||||||||||||
Owner occupied | 87,355,325 | 21.0 | 99,396,996 | 23.1 | ||||||||||||||||||||
Construction | 12,500,834 | 3.0 | 11,078,435 | 2.6 | ||||||||||||||||||||
Consumer: | ||||||||||||||||||||||||
Home equity installment | 40,089,001 | 9.6 | 48,176,530 | 11.2 | ||||||||||||||||||||
Home equity line of credit | 29,185,099 | 7.0 | 21,851,428 | 5.1 | ||||||||||||||||||||
Auto | 10,734,367 | 2.6 | 9,857,017 | 2.3 | ||||||||||||||||||||
Other | 7,165,328 | 1.7 | 5,759,825 | 1.3 | ||||||||||||||||||||
Residential: | ||||||||||||||||||||||||
Real estate | 68,159,514 | 16.4 | 70,958,261 | 16.5 | ||||||||||||||||||||
Construction | 6,144,469 | 1.5 | 7,535,519 | 1.7 | ||||||||||||||||||||
Gross loans | 415,801,151 | 100.0 | % | 430,697,657 | 100.0 | % | ||||||||||||||||||
Less: | ||||||||||||||||||||||||
Allowance for loan losses | 7,897,822 | 7,573,603 | ||||||||||||||||||||||
Net loans | $ | 407,903,329 | $ | 423,124,054 | ||||||||||||||||||||
Loans held-for-sale | $ | 213,000 | $ | 1,221,365 | ||||||||||||||||||||
| 2008 | % | 2007 | % | 2006 | % | |||||||||||||||||||
Real estate: | ||||||||||||||||||||||||
Commercial | $ | 164,772,236 | 37.4 | % | $ | 143,596,397 | 33.7 | % | $ | 158,446,052 | 37.5 | % | ||||||||||||
Residential | 98,510,562 | 22.3 | 116,978,378 | 27.5 | 112,742,692 | 26.7 | ||||||||||||||||||
Construction | 11,426,978 | 2.6 | 10,703,249 | 2.5 | 13,369,712 | 3.2 | ||||||||||||||||||
Commercial and industrial | 80,707,756 | 18.3 | 72,461,485 | 17.0 | 59,767,164 | 14.1 | ||||||||||||||||||
Consumer | 85,091,205 | 19.3 | 81,998,093 | 19.2 | 77,729,520 | 18.4 | ||||||||||||||||||
Direct financing leases | 443,957 | 0.1 | 511,178 | 0.1 | 588,211 | 0.1 | ||||||||||||||||||
Gross loans | 440,952,694 | 100.0 | % | 426,248,780 | 100.0 | % | 422,643,351 | 100.0 | % | |||||||||||||||
Less: | ||||||||||||||||||||||||
Allowance for loan losses | 4,745,234 | 4,824,401 | 5,444,303 | |||||||||||||||||||||
Net loans | $ | 436,207,460 | $ | 421,424,379 | $ | 417,199,048 | ||||||||||||||||||
Loans held-for-sale | $ | 84,000 | $ | 827,250 | $ | 122,000 | ||||||||||||||||||
23
The following table sets forth the maturity distribution of select components of the loan portfolio at December 31, 2010. Excluded from the table are residential real estate loans and consumer loans (dollars in thousands):
More than | ||||||||||||||||
One year | one year to | More than | ||||||||||||||
or less | five years | five years | Total | |||||||||||||
Commercial and industrial | $ | 30,116 | $ | 26,158 | $ | 28,855 | $ | 85,129 | ||||||||
Commercial real estate | 34,539 | 75,268 | 46,887 | 156,694 | ||||||||||||
Commercial real estate construction | 12,501 | - | - | 12,501 | ||||||||||||
Residential real estate construction | 6,144 | - | - | 6,144 | ||||||||||||
Total | $ | 83,300 | $ | 101,426 | $ | 75,742 | $ | 260,468 | ||||||||
Both residential and commercial real estate construction loans are included in the one-year or less category since, by their nature, these loans are converted into residential and CRE loans within one year from the date the real estate construction loan was consummated. Upon conversion, the residential and CRE loans would normally mature after five years.
The following table sets forth the greater than one-year sensitivity changes in interest rates for performing commercial and CRE loans at December 31, 2010 (dollars in thousands):
One to five | More than | |||||||||||
years | five years | Total | ||||||||||
Fixed interest rate | $ | 26,192 | $ | 36,509 | $ | 62,701 | ||||||
Variable interest rate | 69,578 | 41,514 | 111,092 | |||||||||
Total | $ | 95,770 | $ | 78,023 | $ | 173,793 | ||||||
Non-refundable fees and costs associated with all loan originations are deferred. Using the principal reduction method, the deferral is released as charges or credits to loan interest income over the life of the loan.
There are no concentrations of loans to a number of borrowers engaged in similar activities exceeding 10% of total loans that are not otherwise disclosed as a category in the tables above. There are no concentrations of loans that, if resulted in a loss, would have a material adverse effect on the business of the Company. The Company's loan portfolio does not have a material concentration within a single industry or group of related industries that is vulnerable to the risk of a near-term severe negative business impact.
Loans held-for-sale
Upon origination, certain residential mortgages are classified as held-for-sale (HFS). In the event market rates increase, fixed-rate loans and adjustable-rate loans not immediately scheduled to re-price would no longer produce yields consistent with the current market. In a declining interest rate environment, the Company would be exposed to prepayment risk and, as rates on adjustable-rate loans decrease, interest income would be negatively affected. Consideration is given to the Company's current liquidity position and projected future liquidity needs. To better manage interest rate and prepayment risk, loans meeting these conditions may be classified as HFS. The carrying value of loans HFS is at the lower of cost or estimated fair value. If the fair values of loans HFS fall below their original cost, the difference is written down and charged to current earnings. Any subsequent appreciation in the portfolio is credited to current earnings but only to the extent of previous write-downs.
Loans HFS as of December 31, 2010 were $213,000 with a corresponding fair value of $217,000 compared to $1,221,000 and $1,233,000, respectively, at December 31, 2009. During 2010, the Company originated $55,928,000 of residential mortgages HFS, compared to $87,896,000 in 2009. The higher volume in 2009 was a function of the low interest rate environment which produced a spike in the refinance of existing home debt. During 2010, residential mortgage loans with principal balances of $61,320,000 were sold into the secondary market and the Company recognized net gains of approximately $798,000, compared to $98,213,000 and $1,060,000, respectively during 2009. The Company expects residential mortgage loan origination activity to continue to recede during 2011.
The Company retains mortgage servicing rights (MSRs) on loans sold into the secondary market. MSRs are retained so that the Company can foster personal relationships with its loyal customer base. At December 31, 2010 and 2009, the servicing portfolio balance of sold residential mortgage loans was $188,627,000 and $157,516,000, respectively.
24
Allowance for loan losses
Management continually evaluates the credit quality of the Company's loan portfolio and performs a formal review of the adequacy of the allowance for loan losses (the allowance) on a quarterly basis. The allowance reflects management's best estimate of the amount of credit losses in the loan portfolio. Management's judgment is based on the evaluation of individual loans, past experience, the assessment of current economic conditions and other relevant factors including the amounts and timing of cash flows expected to be received on impaired loans. Those estimates may be susceptible to significant change. The provision for loan losses represents the amount necessary to maintain an appropriate allowance. Loan losses are charged directly against the allowance when loans are deemed to be uncollectible. Recoveries from previously charged-off loans are added to the allowance when received.
Management applies two primary components during the loan review process to determine proper allowance levels. The two components are a specific loan loss allocation for loans that are deemed impaired and a general loan loss allocation for those loans not specifically allocated. The methodology to analyze the adequacy of the allowance for loan losses is as follows:
§ | identification of specific impaired loans by loan category; |
§ | specific loans that could have potential loss; |
| § | calculation of specific allowances where required for the impaired loans based on collateral and other objective and quantifiable evidence; |
§ | determination of homogenous pools by loan category and eliminating the impaired loans; |
§ | application of historical loss percentages (two-year average) to pools to determine the allowance allocation; and |
| § | application of qualitative factor adjustment percentages to historical losses for trends or changes in the loan portfolio. |
Allocation of the allowance for different categories of loans is based on the methodology as explained above. A key element of the methodology to determine the allowance is the Company's credit risk evaluation process, which includes credit risk grading of individual commercial loans. Commercial loans are assigned credit risk grades based on the Company's assessment of conditions that affect the borrower's ability to meet its contractual obligations under the loan agreement. That process includes reviewing borrowers' current financial information, historical payment experience, credit documentation, public information and other information specific to each individual borrower. Upon review, the commercial loan credit risk grade is revised or reaffirmed as the case may be. The credit risk grades may be changed at any time management feels an upgrade or downgrade may be warranted. The credit risk grades for the commercial loan portfolio are taken into account in the reserve methodology and loss factors are applied based upon the credit risk grades. The loss factors applied are based upon the Company's historical experience as well as what we believe to be best practices and common industry standards. Historical experience reveals there is a direct correlation between the credit risk grades and loan charge-offs. The changes in allocations in the commercial loan portfolio from period-to-period are based upon the credit risk grading system and from periodic reviews of the loan portfolio.
Each quarter, management performs an assessment of the allowance and the provision for loan losses. The Company's Special Assets Committee meets quarterly and the applicable lenders discuss each relationship under review and reach a consensus on the appropriate estimated loss amount based on current accounting guidelines. The Special Assets Committee's focus is on ensuring the pertinent facts are considered and the reserve amounts pursuant to the accounting principles are reasonable. The assessment process includes the review of all loans on a non-accruing basis as well as a review of certain loans to which the lenders or the Company's Credit Administration function have assigned a criticized or classified risk rating.
Total charge-offs, net of recoveries, for the twelve months ending December 31, 2010, were $1,761,000, compared to $2,221,000 in the twelve months of 2009. The $460,000 decrease resulted primarily from fewer charge-offs of impaired loans in the current year. Commercial real estate loan net charge-offs of $889,000 were recorded during the twelve months ending December 31, 2010 versus $842,000 at December 31, 2009. Commercial and industrial loan net charge-offs were $448,000 for the twelve months ending December 31, 2010 compared to net charge-offs of $948,000 in the same period of 2009. There were no residential real estate loan net charge-offs for the twelve months ended December 31, 2010 compared to $9,000 in the like period of 2009. Consumer loan net charge-offs of $424,000 were recorded during the twelve months ending December 31, 2010 versus $422,000 at December 31, 2009. For a discussion on the provision for loan losses, see the "Provision for loan losses," located in the results of operations section of management's discussion and analysis contained herein.
The allowance for loan losses was $7,898,000 at December 31, 2010, an increase of $324,000 from December 31, 2009. The increase in the allowance was primarily driven by increased historical loss percentages applied to the loan pools in the allowance calculation.
25
Management believes that the current balance in the allowance for loan losses of $7,898,000 is sufficient to withstand the identified potential credit quality issues that may arise and others unidentified but inherent to the portfolio. Potential problem loans are those where there is known information that leads management to believe repayment of principal and/or interest is in jeopardy and the loans are currently neither on non-accrual status nor past due 90 days or more. Given continuing pressure on property values and the generally uncertain economic backdrop, there could be additional instances, which become identified in future periods that may require additional charge-offs and/or increases to the allowance. At December 31, 2010 the ratio of the allowance for loans losses was increased to 1.90% of total loans compared to 1.75% at December 31, 2009. While the allowance to non-performing loans is below a 1:1 coverage in 2009 and 2010, the level of the allowance is deemed adequate as a substantial amount of the non-accrual loans are collateralized by real estate at sufficient values. The 30-89 day past due loans at December 31, 2010 were $2,611,000 compared to $5,173,000 at December 31, 2009. The decrease in the 30-89 day past due loans can be attributed to a general improvement in economic conditions, along with increasing employment and stabilizing real estate values, each having an impact on borrowers' ability to make their payments in a timely fashion.
The following table sets forth the activity in the allowance for loan losses and certain key ratios for the periods indicated (dollars in thousands):
2010 | 2009 | 2008 | 2007 | 2006 | ||||||||||||||||
Balance at beginning of period | $ | 7,574 | $ | 4,745 | $ | 4,824 | $ | 5,444 | $ | 5,985 | ||||||||||
Charge-offs: | ||||||||||||||||||||
Commercial and industrial | 452 | 983 | 168 | 376 | 630 | |||||||||||||||
Commercial real estate | 892 | 844 | 565 | - | 31 | |||||||||||||||
Consumer | 463 | 433 | 351 | 256 | 285 | |||||||||||||||
Residential | 2 | 9 | 45 | 90 | 109 | |||||||||||||||
Total | 1,809 | 2,269 | 1,129 | 722 | 1,055 | |||||||||||||||
Recoveries: | ||||||||||||||||||||
Commercial and industrial | 4 | 35 | 61 | 16 | 37 | |||||||||||||||
Commercial real estate | 3 | 2 | 18 | 2 | 27 | |||||||||||||||
Consumer | 39 | 11 | 31 | 19 | 124 | |||||||||||||||
Residential | 2 | - | - | 125 | 1 | |||||||||||||||
Total | 48 | 48 | 110 | 162 | 189 | |||||||||||||||
Net charge-offs | 1,761 | 2,221 | 1,019 | 560 | 866 | |||||||||||||||
Provision (credit) for loan losses | 2,085 | 5,050 | 940 | (60 | ) | 325 | ||||||||||||||
Balance at end of period | $ | 7,898 | $ | 7,574 | $ | 4,745 | $ | 4,824 | $ | 5,444 | ||||||||||
Net charge-offs to average total loans outstanding | 0.41 | % | 0.51 | % | 0.24 | % | 0.13 | % | 0.21 | % | ||||||||||
Allowance for loan losses to net charge-offs | 4.48 | x | 3.41 | x | 4.66 | x | 8.62 | x | 6.29 | x | ||||||||||
Allowance for loan losses to total loans | 1.90 | % | 1.75 | % | 1.08 | % | 1.13 | % | 1.29 | % | ||||||||||
Loans 30 - 89 days past due and accruing | $ | 2,611 | $ | 5,173 | $ | 1,858 | $ | 4,698 | $ | 2,571 | ||||||||||
Loans 90 days or more past due and accruing | $ | 288 | $ | 555 | $ | 604 | $ | 26 | $ | 81 | ||||||||||
Non-accrual loans | $ | 9,969 | $ | 12,329 | $ | 3,493 | $ | 3,811 | $ | 3,358 | ||||||||||
Allowance for loan losses to loans 90 days or more past due and accruing | 27.36 | x | 13.65 | x | 7.85 | x | 189.41 | x | 67.54 | x | ||||||||||
Allowance for loan losses to non-accrual loans | 0.79 | x | 0.61 | x | 1.36 | x | 1.27 | x | 1.62 | x | ||||||||||
Allowance for loan losses to non-performing loans | 0.77 | x | 0.59 | x | 1.16 | x | 1.26 | x | 1.58 | x | ||||||||||
Average total loans | $ | 427,464 | $ | 432,642 | $ | 420,834 | $ | 424,781 | $ | 418,389 | ||||||||||
The allowance for loan losses can generally absorb losses throughout the loan portfolio. However, in some instances an allocation is made for specific loans or groups of loans. Allocation of the allowance for loan losses for different categories of loans is based on the methodology used by the Company, as previously explained. The changes in the allocations from year-to-year are based upon year-end reviews of the loan portfolio.
Allocation of the allowance among major categories of loans for the past five years is summarized in the following table. This table should not be interpreted as an indication that charge-offs in future periods will occur in these amounts or proportions, or that the allocation indicates future charge-off trends. The portion of the allowance designated as unallocated is within the Company's policy guidelines.
26
2010 | % | 2009 | % | |||||||||||||||||||||
Category | ||||||||||||||||||||||||
Commercial real estate | $ | 4,238,272 | 53.7 | % | $ | 4,313,897 | 56.9 | % | ||||||||||||||||
Commercial and industrial | 1,367,531 | 17.3 | 1,406,102 | 18.6 | ||||||||||||||||||||
Consumer | 1,249,306 | 15.8 | 1,252,826 | 16.5 | ||||||||||||||||||||
Residential real estate | 862,654 | 10.9 | 505,259 | 6.7 | ||||||||||||||||||||
Unallocated | 180,059 | 2.3 | 95,519 | 1.3 | ||||||||||||||||||||
Total | $ | 7,897,822 | 100.0 | % | $ | 7,573,603 | 100.0 | % | ||||||||||||||||
| 2008 | % | 2007 | % | 2006 | % | |||||||||||||||||||
Category | ||||||||||||||||||||||||
Real estate: | ||||||||||||||||||||||||
Commercial | $ | 1,930,511 | 40.7 | % | $ | 1,989,267 | 41.2 | % | $ | 2,586,967 | 47.5 | % | ||||||||||||
Residential | 710,981 | 15.0 | 636,899 | 13.2 | 578,117 | 10.6 | ||||||||||||||||||
Construction | 67,141 | 1.4 | 52,634 | 1.1 | 59,617 | 1.1 | ||||||||||||||||||
Commercial and industrial | 929,548 | 19.6 | 990,105 | 20.5 | 962,903 | 17.7 | ||||||||||||||||||
Consumer | 973,356 | 20.5 | 960,505 | 19.9 | 1,157,091 | 21.2 | ||||||||||||||||||
Direct financing leases | 6,837 | 0.1 | 9,355 | 0.2 | 14,058 | 0.3 | ||||||||||||||||||
Unallocated | 126,860 | 2.7 | 185,636 | 3.9 | 85,550 | 1.6 | ||||||||||||||||||
Total | $ | 4,745,234 | 100.0 | % | $ | 4,824,401 | 100.0 | % | $ | 5,444,303 | 100.0 | % | ||||||||||||
The allocation of the allowance for the commercial loan portfolio which is comprised of commercial real estate loans and commercial and industrial loans, accounted for approximately 71%, or $5,606,000 of the total allowance for loan losses at December 31, 2010. Collateral values were prudently calculated to provide a conservative and realistic value supporting these loans. The Company uses information from its ongoing review process as well as appraisals from independent third parties and other current market information to support the valuations. The allocations to the other categories of loans are adequate compared to the actual two-year historical net charge-offs. Approximately $1,008,000, or 13%, of the allowance is allocated to specifically identified impaired loans.
Non-performing assets
The Company defines non-performing assets as accruing loans past due 90 days or more, non-accrual loans, troubled debt restructured loans (TDRs), other real estate owned (ORE), repossessed assets and non-accrual investment securities. As of December 31, 2010, non-performing assets represented 2.38% of total assets compared to 2.58% at December 31, 2009.
27
The following table sets forth non-performing assets at December 31 (dollars in thousands):
2010 | 2009 | 2008 | 2007 | 2006 | ||||||||||||||||
Total loans, including loans held-for-sale | $ | 416,014 | $ | 431,919 | $ | 441,037 | $ | 427,076 | $ | 422,765 | ||||||||||
Loans past due 90 days or more and accruing | $ | 288 | $ | 555 | $ | 604 | $ | 26 | $ | 81 | ||||||||||
Non-accrual loans | 9,969 | 12,329 | 3,493 | 3,811 | 3,358 | |||||||||||||||
Total non-performing loans | 10,257 | 12,884 | 4,097 | 3,837 | 3,439 | |||||||||||||||
Restructured loans | 783 | - | - | - | - | |||||||||||||||
Other real estate owned | 1,261 | 887 | 1,451 | 107 | 197 | |||||||||||||||
Non-accrual securities | 1,091 | 583 | - | - | - | |||||||||||||||
Total non-performing assets | $ | 13,392 | $ | 14,354 | $ | 5,548 | $ | 3,944 | $ | 3,636 | ||||||||||
Non-accrual loans to total loans | 2.40 | % | 2.85 | % | 0.79 | % | 0.89 | % | 0.79 | % | ||||||||||
Non-performing loans to total loans | 2.47 | % | 2.98 | % | 0.93 | % | 0.90 | % | 0.81 | % | ||||||||||
Non-performing assets to total assets | 2.38 | % | 2.58 | % | 0.96 | % | 0.67 | % | 0.65 | % | ||||||||||
The composition of non-performing loans as of December 31, 2010 is as follows (dollars in thousands):
Gross | Past due 90 | Non- | Total non- | % of | ||||||||||||||||
loan | days or more | accrual | performing | gross | ||||||||||||||||
balances | and still accruing | loans | loans | loans | ||||||||||||||||
Commercial and industrial | $ | 85,129 | $ | 98 | $ | 165 | $ | 263 | 0.31 | % | ||||||||||
Commercial real estate: | ||||||||||||||||||||
Owner occupied | 87,355 | 15 | 2,768 | 2,783 | 3.19 | % | ||||||||||||||
Non-owner occupied | 69,338 | - | 2,000 | 2,000 | 2.88 | % | ||||||||||||||
Construction | 12,501 | - | - | - | 0.00 | % | ||||||||||||||
Consumer: | ||||||||||||||||||||
Home equity installment | 40,089 | 111 | 601 | 712 | 1.78 | % | ||||||||||||||
Home equity line of credit | 29,185 | - | 508 | 508 | 1.74 | % | ||||||||||||||
Auto | 10,734 | 2 | 14 | 16 | 0.15 | % | ||||||||||||||
Other | 7,165 | - | 13 | 13 | 0.19 | % | ||||||||||||||
Residential: | ||||||||||||||||||||
Real estate | 68,160 | 62 | 3,806 | 3,868 | 5.67 | % | ||||||||||||||
Construction | 6,145 | - | 94 | 94 | 1.54 | % | ||||||||||||||
Total | $ | 415,801 | $ | 288 | $ | 9,969 | $ | 10,257 | 2.47 | % | ||||||||||
In the review of loans for both delinquency and collateral sufficiency, management concluded that there were a number of loans that lacked the ability to repay in accordance with contractual terms. The decision to place loans on a non-accrual status is made on an individual basis after considering factors pertaining to each specific loan. The commercial loans are placed on non-accrual status when management has determined that payment of all contractual principal and interest is in doubt or the loan is past due 90 days or more as to principal and interest, unless well-secured and in the process of collection. Consumer loans secured by real estate and residential mortgage loans are placed on non-accrual status at 120 days past due as to principal and interest, and, unsecured consumer loans are charged-off when the loan is 90 days or more past due as to principal and interest. Securities are placed on non-accrual status when principal has been impaired and the receipt of cash interest has ceased. Uncollected accrued interest is reversed and charged against interest income when loans and securities are placed on non-accrual status.
28
The majority of the decrease in non-performing assets for the period is mainly attributed to a reduction of the non-accrual loans. However, during the period $1,091,000 of corporate bonds consisting of pooled trust preferred securities were on non-accrual status, compared to $583,000 in 2009. There were no non-accrual securities prior to 2009. For a further discussion on the Company's securities portfolio, see Note 3, "Investment Securities", within the notes to the consolidated financial statements, and incorporated by reference in Part II, Item 8, and the section entitled, "Investments", contained within management's discussion and analysis. Most of the non-accrual loans are collateralized, thereby mitigating the Company's potential for loss. In 2009, non-performing loans were $12,884,000 and $10,257,000 at year-end 2010. The decrease occurred mainly in the commercial loan portfolio as several borrowers were able to meet their contractual repayment obligations as a result of the improved economic conditions. Action plans for the resolutions of each of the Company's non-performing loans have been developed, monitored and are periodically updated as needed. There were no repossessed assets at December 31, 2010 or 2009. ORE at December 31, 2010 consisted of five properties which are listed for sale with realtors. ORE at year-end 2009 consisted of three properties. The non-accrual loans aggregated $9,969,000 at December 31, 2010 and were $12,329,000 at December 31, 2009. During 2010, approximately $8,338,000 of loans were placed on non-accrual status. These were partially offset by reductions or payoffs of $7,948,000, charge-offs of $1,289,000, $1,053,000 of transfers to ORE and $409,000 of loans that returned to performing status. Loans past due 90 days or more and accruing totaled $288,000 at December 31, 2010 compared to $555,000, at December 31, 2009. The percentage of non-performing assets to total assets was 2.38% at December 31, 2010, a decrease from 2.58% at December 31, 2009. Non-performing loans to total loans were 2.47% at December 31, 2010, and 2.98% at December 31, 2009.
There were two troubled debt restructured loans (TDRs) at December 31, 2010. The TDRs are accruing and performing loans on which the Company has granted certain concessions to provide payment relief to the borrower. These concessions generally consist of the deferral of principal and or interest payments for a period of time, or a partial reduction in interest payments.
Payments received on non-accrual loans are recognized on a cash basis. Payments are first applied against the outstanding principal balance, then to the recovery of any charged-off loan amounts. Any excess is treated as a recovery of interest income. During 2010, the Company collected approximately $38,000 of interest income recognized on the cash basis. If the non-accrual loans that were outstanding as of December 31, 2010 had been performing in accordance with their original terms, the Company would have recognized interest income with respect to such loans of $221,000 for the year ended December 31, 2010.
Bank premises and equipment, net
Net of accumulated depreciation, premises and equipment decreased $598,000, or 4%, during 2010. The Company purchased premises and equipment or transferred assets from construction in process, a component of other assets in the consolidated balance sheet, of approximately $958,000 in total during 2010 compared to $908,000 in 2009. During 2010, the Company entered into a new lease agreement with a new owner-landlord of its Eynon branch. Under the terms of the new operating lease, as defined in the accounting guidance, the terms contain an initial ten-year period supplemented with four renewal options of five years each. The terms under the new lease agreement are not materially different than the terms of the original, terminated lease, however the minimum lease payments have been reduced due to the initial period being only ten years.
Foreclosed assets held-for-sale
Other Real Estate Owned
ORE was $1,261,000 at December 31, 2010 consisting of five properties, all of which were listed for sale with realtors. Two of the properties were in the ORE account during 2009 at a fair value $337,000. These two properties were written down by $129,000 during 2010 to the current fair value of $208,000 based upon updated appraisals and market conditions. As of December 31, 2009 ORE consisted of three properties at an aggregate value of $887,000.
Cash surrender value of bank owned life insurance
The Company maintains bank owned life insurance (BOLI) for a chosen group of employees, namely its officers, where the Company is the owner and sole beneficiary of the policies. BOLI is classified as a non-interest earning asset. Increases in the cash surrender value are recorded as components of non-interest income. The BOLI is profitable from the appreciation of the cash surrender values of the pool of insurance and its tax-free advantage to the Company. This profitability is used to offset a portion of current and future employee benefit costs. The BOLI can be liquidated if necessary with associated tax costs. However, the Company intends to hold this pool of insurance, because it provides income that enhances the Company's capital position. Therefore, the Company has not provided for deferred income taxes on the earnings from the increase in cash surrender value.
Other assets
Other assets increased 4% to $14,938,000 as of December 31, 2010 from $14,416,000 at December 31, 2009. The increase was caused by a $1.2 million increase in the net deferred tax asset from the current year impairment charges recognized partially offset by the tax effect of the decrease in the net unrealized loss position in the AFS securities portfolio. The net increase in the net deferred tax asset was partially offset by $738,000 in amortization, or a decrease of the prepaid FDIC insurance premium that was established in 2009. The $2,025,000 prepaid FDIC insurance premium will be released as a charge to earnings over the next two years.
29
Results of Operations
Earnings Summary
The Company's results of operations depend primarily on net interest income. Net interest income is the difference between interest income and interest expense. Interest income is generated from yields on interest-earning assets, which consist principally of loans and investment securities. Interest expense is incurred from rates paid on interest-bearing liabilities, which consist of deposits and borrowings. Net interest income is determined by the Company's interest rate spread (the difference between the yields earned on its interest-earning assets and the rates paid on its interest-bearing liabilities) and the relative amounts of interest-earning assets and interest-bearing liabilities. The interest rate spread is significantly impacted by: changes in interest rates and market yield curves and their related impact on cash flows; the composition and characteristics of interest-earning assets and interest-bearing liabilities; differences in the maturity and re-pricing characteristics of assets compared to the maturity and re-pricing characteristics of the liabilities that fund them and by the competition in our marketplace.
The Company's profitability is also affected by the level of non-interest income and expense, provision for loan losses and provision for income taxes. Non-interest income consists mostly of service charges on the Bank's deposit and loan products, trust and asset management service fees, increases in the cash surrender value of the bank owned life insurance, net gains or losses from the sales of loans, securities and foreclosed properties held-for-sale, write-down to market value of foreclosed properties held-for-sale and from credit-related other-than-temporary impairment (OTTI) charges from investment securities. Non-interest expense consists of compensation and related employee benefit expenses, occupancy, equipment, data processing, advertising, marketing, FDIC insurance, professional fees, supplies and other operating overhead.
The Company's profitability is significantly affected by general economic and competitive conditions, changes in market interest rates, government policies and actions of regulatory authorities. The Company's loan portfolio is comprised principally of commercial and commercial real estate loans. The properties underlying the Company's mortgages are concentrated in Northeastern Pennsylvania. Credit risk, which represents the possibility of the Company not recovering amounts due from its borrowers, is significantly related to local economic conditions in the areas where the properties are located as well as the Company's underwriting standards. Economic conditions affect the market value of the underlying collateral as well as the levels of adequate cash flow and revenue generation from income-producing commercial properties.
Overview
For the year ended 2010, the Company incurred a net loss of $3,204,000, or $1.50 per diluted share, compared to a net loss of $1,400,000, or $0.67 per diluted share, for the year ended December 31, 2009. For the year ended December 31, 2010, the Company's return on average assets (ROA) and return on average shareholders' equity (ROE) were -0.55% and -6.69% compared to -0.25% and -2.91%, respectively, for the year ended December 31, 2009. The current year included a non-operating, non-cash, after-tax charge of $7,812,000 related to OTTI in the Company's AFS securities portfolio, compared to $2,178,000 for the year ended December 31, 2009. Partially offsetting the OTTI charges in 2010 were increased net interest income of $1,641,000, or 9%, a lower provision for loan losses of $2,965,000 and 6% lower operating expenses of $1,224,000. The increase in the net loss in 2010 caused a more negative ROA and ROE.
30
Net interest income
The following table sets forth a comparison of average balances of assets and liabilities and their related net tax equivalent yields and rates for 2010, 2009 and 2008 (dollars in thousands):
2010 | 2009 | 2008 | ||||||||||||||||||||||||||||||||||
Average | Yield / | Average | Yield / | Average | Yield / | |||||||||||||||||||||||||||||||
| balance | Interest | rate | balance | Interest | rate | balance | Interest | rate | |||||||||||||||||||||||||||
Assets | ||||||||||||||||||||||||||||||||||||
Interest-earning assets | ||||||||||||||||||||||||||||||||||||
Interest-bearing deposits | $ | 25,701 | $ | 65 | 0.25 | % | $ | 562 | $ | 1 | 0.10 | % | $ | 233 | $ | 3 | 1.36 | % | ||||||||||||||||||
Investments: | ||||||||||||||||||||||||||||||||||||
Agency - GSE | 23,872 | 856 | 3.58 | 36,842 | 1,769 | 4.80 | 49,034 | 2,576 | 5.25 | |||||||||||||||||||||||||||
MBS - GSE residential | 26,216 | 786 | 3.00 | 11,072 | 618 | 5.58 | 35,294 | 1,833 | 5.19 | |||||||||||||||||||||||||||
State and municipal | 23,100 | 1,543 | 6.68 | 24,278 | 1,610 | 6.63 | 15,813 | 1,014 | 6.41 | |||||||||||||||||||||||||||
Other | 22,984 | 218 | 0.95 | 25,988 | 475 | 1.83 | 25,967 | 1,252 | 4.82 | |||||||||||||||||||||||||||
Total investments | 96,172 | 3,403 | 3.54 | 98,180 | 4,472 | 4.56 | 126,108 | 6,675 | 5.29 | |||||||||||||||||||||||||||
Loans: | ||||||||||||||||||||||||||||||||||||
Commercial and CRE | 265,193 | 15,200 | 5.73 | 261,842 | 15,829 | 6.05 | 231,721 | 15,869 | 6.85 | |||||||||||||||||||||||||||
Consumer | 61,050 | 4,329 | 7.09 | 65,916 | 4,559 | 6.92 | 71,089 | 4,872 | 6.85 | |||||||||||||||||||||||||||
Residential real estate | 100,894 | 5,375 | 5.33 | 104,481 | 5,787 | 5.54 | 117,547 | 6,985 | 5.94 | |||||||||||||||||||||||||||
Direct financing leases | 327 | 20 | 6.10 | 403 | 25 | 6.12 | 477 | 29 | 6.15 | |||||||||||||||||||||||||||
Total loans | 427,464 | 24,924 | 5.83 | 432,642 | 26,200 | 6.06 | 420,834 | 27,755 | 6.60 | |||||||||||||||||||||||||||
Federal funds sold | 5,812 | 14 | 0.24 | 4,603 | 11 | 0.25 | 3,342 | 91 | 2.73 | |||||||||||||||||||||||||||
Total interest-earning assets | 555,149 | 28,406 | 5.12 | % | 535,987 | 30,684 | 5.72 | % | 550,517 | 34,524 | 6.27 | % | ||||||||||||||||||||||||
Non-interest earning assets | 32,405 | 29,289 | 33,301 | |||||||||||||||||||||||||||||||||
Total Assets | $ | 587,554 | $ | 565,276 | $ | 583,818 | ||||||||||||||||||||||||||||||
Liabilities and shareholders' equity | ||||||||||||||||||||||||||||||||||||
Interest-bearing liabilities | ||||||||||||||||||||||||||||||||||||
Deposits: | ||||||||||||||||||||||||||||||||||||
Savings | $ | 99,638 | $ | 854 | 0.86 | % | $ | 53,690 | $ | 404 | 0.75 | % | $ | 38,425 | $ | 331 | 0.86 | % | ||||||||||||||||||
NOW | 76,178 | 190 | 0.25 | 62,090 | 197 | 0.32 | 59,130 | 616 | 1.04 | |||||||||||||||||||||||||||
MMDA | 82,676 | 640 | 0.77 | 106,115 | 1,624 | 1.53 | 93,465 | 2,460 | 2.63 | |||||||||||||||||||||||||||
CDs < $100,000 | 92,734 | 1,777 | 1.92 | 101,286 | 3,217 | 3.18 | 98,410 | 4,052 | 4.12 | |||||||||||||||||||||||||||
CDs > $100,000 | 52,691 | 1,610 | 3.05 | 63,436 | 2,435 | 3.84 | 80,389 | 3,638 | 4.53 | |||||||||||||||||||||||||||
Clubs | 1,602 | 8 | 0.51 | 1,687 | 19 | 1.14 | 1,764 | 21 | 1.19 | |||||||||||||||||||||||||||
Total interest-bearing deposits | 405,519 | 5,079 | 1.25 | 388,304 | 7,896 | 2.03 | 371,583 | 11,118 | 2.99 | |||||||||||||||||||||||||||
Repurchase agreements | 12,692 | 89 | 0.70 | 8,743 | 28 | 0.32 | 12,074 | 103 | 0.85 | |||||||||||||||||||||||||||
Borrowed funds | 41,131 | 1,660 | 4.03 | 45,979 | 2,873 | 6.25 | 74,530 | 3,463 | 4.65 | |||||||||||||||||||||||||||
Total interest-bearing liabilities | 459,342 | 6,828 | 1.49 | % | 443,026 | 10,797 | 2.44 | % | 458,187 | 14,684 | 3.20 | % | ||||||||||||||||||||||||
Non-interest bearing deposits | 76,707 | 70,285 | 67,717 | |||||||||||||||||||||||||||||||||
Non-interest bearing liabilities | 3,627 | 3,828 | 4,503 | |||||||||||||||||||||||||||||||||
Total liabilities | 539,676 | 517,139 | 530,407 | |||||||||||||||||||||||||||||||||
Shareholders' equity | 47,878 | 48,137 | 53,411 | |||||||||||||||||||||||||||||||||
Total liabilities and shareholders' equity | $ | 587,554 | $ | 565,276 | $ | 583,818 | ||||||||||||||||||||||||||||||
Net interest income | $ | 21,578 | $ | 19,887 | $ | 19,840 | ||||||||||||||||||||||||||||||
Net interest spread | 3.63 | % |
| 3.28 | % |
| 3.07 | % | ||||||||||||||||||||||||||||
Net interest margin | 3.89 | % |
| 3.71 | % |
| 3.60 | % | ||||||||||||||||||||||||||||
In the preceding table, interest income was adjusted to a tax-equivalent basis, using the corporate federal tax rate of 34% to recognize the income from tax-exempt interest-earning assets as if the interest was taxable. This treatment allows a uniform comparison between yields on interest-earning assets. Loans include loans HFS and non-accrual loans but exclude the allowance for loan losses. Securities include non-accrual securities. Average balances are based on amortized cost and do not reflect net unrealized gains or losses. Net interest margin is calculated by dividing net interest income by total average interest-earning assets .
31
Changes in net interest income are a function of both changes in interest rates and changes in volume of interest-earning assets and interest-bearing liabilities. The following table presents the extent to which changes in interest rates and changes in volumes of interest-earning assets and interest-bearing liabilities have affected the Company's interest income and interest expense during the periods indicated. Information is provided in each category with respect to (1) the changes attributable to changes in volume (changes in volume multiplied by the prior period rate), (2) the changes attributable to changes in interest rates (changes in rates multiplied by prior period volume) and (3) the net change. The combined effect of changes in both volume and rate has been allocated proportionately to the change due to volume and the change due to rate. Tax-exempt income was not converted to a tax-equivalent basis on the rate/volume analysis (dollars in thousands):
Years ended December 31, | ||||||||||||||||||||||||
2010 compared to 2009 | 2009 compared to 2008 | |||||||||||||||||||||||
Increase (decrease) due to | ||||||||||||||||||||||||
Volume | Rate | Total | Volume | Rate | Total | |||||||||||||||||||
Interest income: | ||||||||||||||||||||||||
Loans and leases: | ||||||||||||||||||||||||
Residential real estate | $ | (195 | ) | $ | (217 | ) | $ | (412 | ) | $ | (744 | ) | $ | (454 | ) | $ | (1,198 | ) | ||||||
Commercial and CRE | 198 | (913 | ) | (715 | ) | 1,912 | (1,992 | ) | (80 | ) | ||||||||||||||
Consumer | (348 | ) | 114 | (234 | ) | (362 | ) | 45 | (317 | ) | ||||||||||||||
Total loans and leases | (345 | ) | (1,016 | ) | (1,361 | ) | 806 | (2,401 | ) | (1,595 | ) | |||||||||||||
Investment securities, interest-bearing deposits and | ||||||||||||||||||||||||
Federal funds sold | 792 | (1,760 | ) | (968 | ) | (1,159 | ) | (1,298 | ) | (2,457 | ) | |||||||||||||
Total interest income | 447 | (2,776 | ) | (2,329 | ) | (353 | ) | (3,699 | ) | (4,052 | ) | |||||||||||||
Interest expense: | ||||||||||||||||||||||||
Deposits: | ||||||||||||||||||||||||
Certificates of deposit greater than $100,000 | (374 | ) | (452 | ) | (826 | ) | (700 | ) | (503 | ) | (1,203 | ) | ||||||||||||
Other | 436 | (2,428 | ) | (1,992 | ) | 790 | (2,809 | ) | (2,019 | ) | ||||||||||||||
Total deposits | 62 | (2,880 | ) | (2,818 | ) | 90 | (3,312 | ) | (3,222 | ) | ||||||||||||||
Other interest-bearing liabilities | (47 | ) | (1,105 | ) | (1,152 | ) | (1,525 | ) | 860 | (665 | ) | |||||||||||||
Total interest expense | 15 | (3,985 | ) | (3,970 | ) | (1,435 | ) | (2,452 | ) | (3,887 | ) | |||||||||||||
Net interest income | $ | 432 | $ | 1,209 | $ | 1,641 | $ | 1,082 | $ | (1,247 | ) | $ | (165 | ) | ||||||||||
Like 2009, the interest rate yield curve remained positively sloped in 2010, but at uniquely low levels. The FOMC has not adjusted the short-term federal funds rate which has remained near zero percent during 2009 and 2010. Similarly, at 3.25%, the national prime interest rate remained constant throughout 2010 as it did during all of 2009. National prime is a benchmark rate banks use to set rates on various lending and other interest-earning products. Operating in a very low interest rate environment has and will continue to challenge financial institutions in the coming year. The challenge facing banks in today's markets is to be able to effectively fund longer-termed interest producing assets with shorter-termed interest-bearing liabilities, not solely for higher current spreads but to prudently position the institution by managing interest rate risk when rates begin to rise and asset duration lengthens. Therefore, similar to 2009 and 2010, operating in this low interest rate environment will continue to suppress significant asset growth in the near-term.
The effect of this low interest rate level has been to continue to exert downward pressure on the yields of the Company's interest-earning assets. With rate-cutting beginning three years ago, this pressure existed with increasing momentum through today. The Company has been able to more than offset this pressure by periodically adjusting rates on its interest-bearing deposits. In response to the swift downward shift in rates, the Company's asset/liability committee assessed, among other things, the impact the interest rate movements have had on its earning assets. Where necessary, rate adjustments to interest-bearing deposits and repurchase agreements were implemented and high-costing long-term wholesale funding sources were paid off and not renewed, all of which helped minimize the effect rate changes have had on net interest income. The committee meets frequently and has successfully implemented rate setting strategies to help mitigate the interest rate risk inherent in the balance sheet and has been able to preserve its net interest margin to acceptable levels. The Company's overall cost of funds, which includes the effect of non-interest bearing DDA balances as a no-cost funding source has declined 83 basis points, from 2.10% to 1.27% for the years ended December 31, 2009 and 2010, respectively.
As market rates along with national prime remain at current levels, loan originations, renewing commercial and residential loans and lines of credit continued to price below the average 2009 and 2010 portfolio yields. In addition, the decrease in the Treasury yields and other capital market rates, which began in 2008, has had and could continue to have an unfavorable impact on the Company's total 2010 and 2011 investment portfolio yield. The prevalent low interest rate environment of late has had a negative impact on the Company's interest-earning assets. Total interest income declined 8%, or $2,329,000, from $29,909,000 in 2009 to $27,580,000 in 2010 and caused the tax-equivalent yield on earning assets to continue to slide – decreasing 60 basis points compared to 2009. Management expects yields to continue to experience a period of descent on its interest-earning assets during 2011.
32
Interest expense decreased $3,970,000, or 37%, from $10,797,000 in 2009 to $6,827,000 in 2010. The lower interest rate environment that has dominated the economy over the past three years required the Company to periodically reduce offering rates on both its deposit and repurchase agreement products. Though the Company recorded a $17,215,000 net increase in average interest-bearing deposits, interest expense on deposits declined $2,818,000 in 2010 compared to 2009 caused by a 78 basis point decline on rates paid. The effect of the increase in average interest-bearing deposits was an additional $62,000 in interest expense. Interest expense on borrowed funds declined $1,152,000 during 2010, mostly from the 205 basis point reduction in rates paid. The lower interest from borrowings was from the $11,000,000 reduction in long-term debt during the latter part of 2010 and the reduction of $20,000,000 in long-term debt in 2009. The 2010 advance with the FHLB carried an interest rate of 5.59%. The 2009 paid-off advances carried a weighted-average rate of 5.72% including a $10,000,000, 6.12% piece that was scheduled to mature in 2010. The early pay-down required a $505,000 prepayment of interest that is included as a component of interest expense in the consolidated statement of income for the year ended December 31, 2009.
In an effort to maintain reasonable interest rate spreads to its earning-assets, the Company's asset/liability committee reduced rates paid on CDs as well as rates paid on transactional deposits. In today's environment, rates on CDs should naturally price lower as they mature. Whether or not the Company can continue to reduce rates on deposits that are currently priced at unprecedented low levels will be predicated on the interest rate environment, liquidity position, the re-pricing characteristics of interest-earning assets and competition.
The resulting performance that the mix of the Company's interest-sensitive assets and liabilities and the impact the yield curve slope has had during 2010, combined with non-renewal and early pay-off of high-costing long-term debt, caused net interest income to increase $1,641,000, or 9%, from $19,112,000 in 2009 to $20,753,000 in 2010. On a tax-equivalent basis, the net interest rate spread increased 35 basis points from 3.28% to 3.63% and the tax-equivalent margin improved 18 basis points, from 3.71% in 2009 to 3.89% in 2010, respectively.
Provision for loan losses
The provision for loan losses represents the necessary amount to charge against current earnings, the purpose of which is to increase the allowance for loan losses to a level that represents management's best estimate of known and inherent losses in the Company's loan portfolio. Management continuously reviews the risks inherent in the loan portfolio. Loans determined to be uncollectible are charged-off against the allowance for loan losses. The required amount of the provision for loan losses, based upon the adequate level of the allowance for loan losses, is subject to ongoing analysis of the loan portfolio. The Company's Special Asset Committee meets periodically to review problem loans. The committee is comprised of management, including the chief risk officer, loan workout officers and collection personnel. The committee reports quarterly to the Credit Administration Committee of the Board of Directors.
Provisions for loan losses of $2,085,000 were made for the year December 31, 2010 as compared to $5,050,000 for the December 31, 2009 year. Improvement in overall asset quality primarily resulting from the successful resolution of several large commercial credits allowed for a lower provision for loan losses .
Other income (loss)
For the year ended December 31, 2010, the Company recorded a net other (non-interest) loss of $6,412,000 compared to non-interest income of $2,161,000 recorded during the year ended December 31, 2009. In 2010, a non-cash other-than-temporary impairment (OTTI) charge of $11,836,000 was recognized compared to $3,300,000 recognized for the year ended December 31, 2009. The OTTI charges were related to the Company's investment in pooled trust preferred securities. The carrying values of these securities were written down to their fair values as management has deemed the impairment to be other-than-temporary. For a further discussion on the Company's investment in pooled trust preferred securities see Note 3, "Investment Securities", within the notes to the consolidated financial statements, and incorporated by reference in Part II, Item 8, and the section entitled, "Investments", contained within this management's discussion and analysis. Excluding the OTTI charges in 2010 and 2009, other non-interest income was essentially unchanged, with the $262,000 decline in gains recognized from mortgage banking services offset by transactions related to foreclosed properties held-for-sale and increased fees and service charges from loans and deposits.
33
Other expenses
For the year ended December 31, 2010, other operating expenses decreased $1,224,000, or 6%, from $19,241,000 for the year ended December 31, 2009 to $18,017,000 for the 2010 year. Despite a one-time $400,000 severance and voluntary termination payout, from a planned organization restructuring and annual merit increases, salary and employee benefits declined $763,000, or 8%, in 2010 compared to 2009. The average full-time equivalent (FTE) number of employees was 165 in 2010 compared to 192 FTEs in 2009. Expenses related to premises and equipment declined $130,000, or 4%, in 2010 compared to 2009 including a decline in rental expense of $91,000. Savings from property insurance and facility maintenance also contributed to the reduction in premises and equipment. Advertising and marketing expense increased $150,000, or 15% in the current year. Costs associated with the development of the Company's new website, the implementation of a Company branding campaign, expenses for disseminating customer notifications of federal regulatory changes and promotional related expenses for sales campaigns designed to strengthen services for deposit customers contributed to the increase. Professional services declined $106,000, or 8%, due in part to the one-time, $162,000 consulting agreement expense paid to the Company's former chief executive officer in 2009 partially offset by higher fees for audit and tax services. FDIC deposit insurance premiums declined $318,000, or 27% in 2010 compared to 2009. The 2009 amount includes special assessments intended to shore up the FDIC's insurance reserve. Special assessments were not required in 2010.
The ratios of non-interest expense less non-interest income to average assets, known as the industry's expense ratio, at December 31, 2010 and 2009 were 2.07% and 2.37%, respectively. The expense ratio, which excludes OTTI and other securities transactions, declined due to the lower expense base most notable in employee salary and benefit costs and lower professional services expenses.
Provision for income taxes
The Company's larger pre-tax loss in 2010 compared to 2009 was the cause of a larger credit for income taxes in 2010 compared 2009.
Comparison of Financial Condition as of December 31, 2009
and 2008 and Results of Operations for each of the Years then Ended
Financial Condition
Overview
Consolidated assets decreased $19,702,000, or 3%, during the year ended December 31, 2009 to $556,017,000. The decline was the result of decreased total borrowings of $41,597,000, or 46%, and a decrease in total shareholders' equity of $3,286,000, or 7%, partially offset by a 6%, or $25,682,000 increase in deposits. The decline in borrowings resulted from a combination of deposit growth and balance sheet de-leveraging. Shareholders' equity declined due to the net loss recorded for the year ended December 31, 2009 and the declaration of cash dividends plus the reduction in intrinsic value from the expiration of the cash flow hedge.
Deposits
Total deposits increased $25,682,000, or 6%, during 2009 to $458,994,000. The increase stemmed from growth in savings and clubs of $45,009,000 and NOW accounts of $11,907,000, partially offset by declines in CDs including CDARS of $25,431,000, net and money market accounts of $5,250,000. In an effort to grow and retain core deposits, the Company introduced innovative options to its variety of deposit products. Most notably, in 2009 the Company created special savings account offerings tailored to the needs of both business and non-business customers. This creativity resulted in savings account balances that more than doubled by the end of 2009 compared to December 31, 2008.
Short-term borrowings
Due to the constant flow of funds in to and out of the sweep product, their balances tend to be somewhat volatile, mimicking the likes of a DDA deposit account. Customer liquidity is the typical cause for variances in repurchase agreements, which during 2009 declined $3,665,000 from $11,412,000 at December 31, 2008 to $7,747,000 as of December 31, 2009.
Long-term debt
The weighted-average rate that was in effect on funds borrowed at December 31, 2009 was 5.11% compared to 5.35% as of December 31, 2008. The 2009 weighted-average rate was 61 basis points below the tax-equivalent yield of 5.72% earned from the Company's portfolio of average interest-earning assets for the year ended December 31, 2009. Rates on the $32,000,000 balances of long-term advances were fixed, but structured to adjust quarterly in the event that market interest rates had risen beyond the issues' original or strike rates. During the third quarter of 2009, $10,000,000 of convertible select advances with a weighted-average interest rate of 6.12%, scheduled to mature in 2010, were paid off. At the time of pay-off, the Company incurred $505,000 of prepayment interest costs that were included as a component of interest expense in the consolidated statement of income for the year ended December 31, 2009. This deleveraging allowed the Company access to higher available liquidity and to strengthen regulatory capital ratios.
34
Investments
As of December 31, 2009 and December 31, 2008, the aggregate fair value of securities HTM exceeded their respective aggregate amortized cost by $56,000 and $31,000, respectively. Total investments decreased $7,657,000 during 2009. The carrying value of investment securities, at December 31, 2009, was $76,530,000, or 14% of total assets compared to $84,187,000, or 15%, as of December 31, 2008.
The tax-equivalent yield on debt securities by stated maturity date at December 31, 2009, was as follows:
One year | One through | Five through | More than | |||||||||||||||||
or less | five years | ten years | ten years | Total | ||||||||||||||||
Agency - GSE | - | % | - | % | 3.32 | % | 5.02 | % | 4.67 | % | ||||||||||
MBS - GSE residential | - | 6.00 | 6.04 | 4.76 | 4.81 | |||||||||||||||
State & municipal subdivisions | - | - | 5.60 | 6.22 | 6.21 | |||||||||||||||
Pooled trust preferred securities | - | - | - | 1.69 | 1.69 | |||||||||||||||
Total debt securities | - | % | - | % | 3.65 | % | 4.54 | % | 4.46 | % | ||||||||||
Loans
Gross loans decreased $10,255,000, or 2%, from $440,953,000 at December 31, 2008, to $430,698,000 at December 31, 2009. Gross loans represented 77% of total assets at both December 31, 2009 and December 31, 2008.
In 2009, the Company originated $32,686,000 of commercial and CRE loans, $13,809,000 of residential mortgage loans and $20,602,000 of consumer loans. This compares to $47,864,000, $23,111,000 and $21,354,000, respectively, in 2008. Included in mortgage loans is $8,307,000 of real estate construction lines in 2009 and $9,476,000 in 2008. In addition for 2009, the Company originated lines of credit in the amounts of $35,296,000 for commercial borrowers and $13,260,000 in home equity and other consumer lines of credit.
The Company's origination, for portfolio, activity declined 27% in 2009 compared to 2008. Because of the low interest rate environment, borrowers' sentiment was to procure and refinance to low, fixed-rate mortgage loans. The decline in the commercial and CRE originations was due to weak economic conditions and the related strict underwriting practices that the Company employed to help ensure against possible future losses.
Commercial and Commercial Real Estate Loans :
During 2009 the Company further implemented the concept of reinforcing and building relationships. Commercial lenders became relationship managers and had the knowledge to deal with loans, deposits and referrals to other areas of the bank such as the trust and asset management departments. The commercial and CRE portfolio increased to $263,514,000 from $245,480,000, or 7%, during 2009. Deposits associated with lending, whether they were retail or commercial, benefited from the emphasis on relationships and not just loans.
Residential Real Estate Loans :
Residential real estate loans declined $27,509,000, or 28%, to $71,001,000 in 2009. During the first quarter of 2009, the Company transferred $10,838,000 of residential mortgage loans to the HFS portfolio, which were simultaneously sold. The balance of the residential real estate mortgage decline was mostly from net pay-downs during 2009.
Consumer Loans :
Despite reduced origination, compared to December 31, 2008, the consumer loan portfolio remained relatively unchanged as of December 31, 2009. During the latter part of 2008 the Company began a new relationship with an automobile dealership which, along with increased prime-based home equity lines of credit, offset lower installment loan balances and helped to stabilize the size of the consumer loan portfolio.
Real Estate Construction Loans :
Real estate construction loans decreased $1,302,000, or 11%, at December 31, 2009 compared to December 31, 2008. These loans fund residential and commercial construction projects and then convert to a residential mortgage or to a commercial real estate loan usually within one year from the origination date. Generally, the converted loans will bear similar terms as the terms during the construction period.
35
Loans held-for-sale
Loans HFS at December 31, 2009 were $1,221,000 with a corresponding fair value of $1,233,000 compared to $84,000 and $85,000, respectively, at December 31, 2008. During 2009, the Company originated $87,896,000 of residential mortgages HFS, compared to $14,754,000 in 2008. The higher volume in 2009 was a function of the low interest rate environment which spawned refinance activity of existing home debt. During 2009, residential mortgage loans with principal balances of $98,213,000 were sold into the secondary market and net gains of approximately $1,060,000 were recognized, compared to $46,969,000 and $261,000, respectively, during 2008. Included in the 2009 sale were $10,838,000 of residential mortgage loans transferred from the loan portfolio during the first quarter of 2009 compared to $28,103,000 in the early part of 2008. The Company did not expect residential mortgage loan activity to continue at the 2009 pace.
At December 31, 2009 and 2008, the servicing portfolio balances of sold residential mortgage loans were $157,516,000 and $95,856,000, respectively.
Allowance for loan losses
The allowance for loan losses was $7,574,000 at December 31, 2009, an increase of $2,829,000 from December 31, 2008. The increased allowance was primarily driven by a migration of commercial loan credit risk ratings from pass to classified status, higher loan charge-offs, and a generally weaker economic outlook Total charge-offs, net of recoveries, for the year ended December 31, 2009, were $2,221,000, compared to $1,019,000 in 2008. The higher level of charge-offs recorded in 2009 primarily resulted from the write-down of impaired loans to current fair value. The majority of the increase occurred in the commercial portfolio and was attributed to non-performing loan dispositions and write-downs before transfers to ORE.
Non-performing assets
The majority of the increase in non-performing assets during 2009 was attributed to non-accruing commercial business loans, non-accruing real estate loans in the process of foreclosure and non-accruing investment securities. During 2009, $583,000 of corporate bonds consisting of pooled trust preferred securities were moved to non-accrual status. There were no non-accrual securities prior to 2009. Most of the non-accruing loans are collateralized, thereby mitigating the Company's potential for loss. In 2008, non-performing loans were $4,097,000 and $12,884,000 at year-end 2009. The increase occurred mainly in the commercial loan portfolio as several local borrowers were unable to meet their contractual repayment obligations as a result of the weakened economic conditions. Action plans for the resolution of each of the Company's non-performing loans were developed, monitored and periodically updated as needed. There were no repossessed assets at December 31, 2009 or 2008. ORE at December 31, 2009 consisted of three properties which were listed for sale with realtors. ORE at year-end 2008 consisted of four properties. The non-accrual loans aggregated $12,329,000 at December 31, 2009 and were $3,493,000 at December 31, 2008. During 2009, approximately $12,492,000 of loans were placed in non-accrual status. These were partially offset by reductions or payoffs of $1,131,000, charge-offs of $1,979,000, $469,000 of transfers to ORE and $77,000 of loans that returned to performing status. Loans past due 90 days or more and accruing totaled $555,000 at December 31, 2009 compared to $604,000, at December 31, 2008. The percentage of non-performing assets to total assets was 2.58% at December 31, 2009, an increase from 0.96% at December 31, 2008, primarily due to the transfer of loans and investments to non-performing status. Non-performing loans to net loans were 3.04% at December 31, 2009, and 0.94% at December 31, 2008.
During 2009, the Company collected approximately $31,000 of interest income recognized on the cash basis. If the non-accrual loans that were outstanding as of December 31, 2009 were performing in accordance with their original terms, the Company would have recognized interest income with respect to such loans of $365,000 for the year ended December 31, 2009.
Bank premises and equipment, net
Net of accumulated depreciation and disposals, premises and equipment decreased $695,000. During 2009, the Company purchased or transferred from construction in process approximately $908,000 compared to $4,489,000 in 2008. The 2008 amount included construction and the completion of the Company's West Scranton branch expansion project. There were no such projects during 2009.
Foreclosed assets held-for-sale
Other real estate owned
ORE was $887,000 at December 31, 2009 consisting of three properties, all of which were listed for sale with a realtor. At December 31, 2008 ORE consisted of four properties with an aggregate value of $1,451,000.
36
Other assets
Other assets increased 61% to $14,416,000 as of December 31, 2009 from $8,930,000 at December 31, 2008. The increase was caused predominately by the 2009 federal mandate that banks pre-fund their three-year estimated FDIC insurance premium. The prepaid insurance premium will be released as a charge to earnings through 2012. Also contributing to the increase were additional deferred tax assets that resulted from impairment losses in the securities AFS portfolio recognized during 2009. These increases were partially offset by the reduction in carrying value and subsequent expiration of the Company's derivative contract during 2009.
Results of Operations
Earnings Summary
For the year ended December 31, 2009, the Company incurred a net loss of $1,400,000, compared to net income of $3,636,000 for the year ended December 31, 2008. For the year ended December 31, 2009 diluted loss per common share was $0.67, compared to earnings per share of $1.76 for the same period of 2008. For the year ended December 31, 2009, the Company's return on average assets (ROA) and return on average shareholders' equity (ROE) were -0.25% and -2.91% compared to 0.62% and 6.81%, respectively, for the year ended December 31, 2008. 2009 included a non-operating, non-cash, after-tax charge of $2,178,000 related to an other-than-temporary impairment (OTTI) in the Company's security AFS portfolio, compared to $288,000 in 2008. In addition, during 2009, the Company recorded a provision for loan losses in the amount of $5,050,000 compared to $940,000 in 2008. The provision for loan losses in 2009 was recorded to reinforce and fund the allowance for loan losses for heightened credit risks from a weakened economy and declining real estate values, as well as an increase in the commercial real estate portfolio. Further contributing to the lower net income were lower interest income of $165,000 and higher non-interest expenses of $1,030,000, or 6%. During 2009, the company also paid off long-term debt and incurred $505,000 of prepayment interest costs which were included as a component of interest expense in the consolidated income statement for the year ended December 31, 2009. Higher FDIC insurance premiums contributed to the increase in non-interest expense in 2009 compared to 2008. The declines in ROA and ROE were caused by the decrease in net income.
Net interest income
The interest rate yield curve remained positively sloped during 2009, but at unprecedented low levels. The FOMC had not adjusted the short-term federal funds rate, which remained near zero percent during 2009. Similarly, at 3.25%, the national prime interest rate remained constant throughout 2009. National prime is a benchmark rate banks use to set rates on various lending and other interest-sensitive products. Operating in a low interest rate environment during 2009 continued to suppress significant asset growth.
While national prime remained at 3.25% throughout 2009, the weighted-average national prime rate decreased 184 basis points, from 5.09%, in 2008. The effect of this decrease had been to exert extreme downward pressure on the yields of the Company's interest-earning assets. With rate-cutting beginning in January 2008, this pressure existed with increasing momentum throughout 2009. The Company was able to more than offset this pressure by periodically adjusting rates on its interest-bearing deposits. In response to the swift downward shift in rates, the Company's asset/liability committee assessed, among other things, the impact the interest rate movements had on its earning assets. Where necessary, rate adjustments to interest-bearing deposits and repurchase agreements were implemented and high-costing long-term wholesale funding sources were paid off, all of which helped minimize the effect rate changes had on net interest income. The committee met frequently and successfully implemented rate setting strategies that helped mitigate the interest rate risk inherent in the balance sheet and was able to preserve its net interest margin at acceptable levels.
As market rates fell along with national prime, loan originations, renewing commercial and residential loans and lines of credit continued to price below the average 2009 portfolio yields. Total interest income declined 12%, or $4,052,000, from $33,961,000 in 2008 to $29,909,000 in 2009 and further caused the tax-equivalent yield on earning assets to decrease 55 basis points.
Interest expense decreased $3,887,000, or 26%, from $14,684,000 in 2008 to $10,797,000 in 2009. The lower interest rate environment that dominated the economy over the last two years required the Company to periodically reduce offering rates on both its deposit and repurchase agreement products. Though the Company recorded a net increase in average interest-bearing deposits, interest expense on deposits declined by $3,223,000 in 2009 compared to 2008 caused by a 96 basis point decline on rates paid. The effect of the $16,721,000 net increase in average interest-bearing deposits was an additional $90,000 in interest expense. In an effort to maintain reasonable interest rate spreads to its earning-assets, the Company's asset/liability committee reduced rates paid on CDs as well as rates paid on transactional deposits. Interest expense on borrowings, including repurchase agreements, declined $665,000 during 2009, mostly from the $31,882,000 decline in average balances. During 2009, the Company paid off $10,000,000 of high-costing long-term debt and incurred $505,000 of prepayment interest costs that were included as a component of interest expense in the consolidated statement of income for the year ended December 31, 2009.
37
The resulting performance that the mix of the Company's interest-sensitive assets and liabilities and the varying effects the severity of the yield curve slope has had during 2009, combined with the early pay off of high-costing long-term debt, caused net interest income to decrease $165,000, or 1%, from $19,277,000 in 2008 to $19,112,000 in 2009. On a tax-equivalent basis, the net interest rate spread increased 21 basis points from 3.07% to 3.28% and the tax-equivalent margin improved 11 basis points, from 3.60% in 2008 to 3.71% in 2009, respectively.
Provision for loan losses
Provisions for loan losses of $5,050,000 were made for the year ended December 31, 2009. In 2008, provisions of $940,000 were made. The $5,050,000 provision for loan losses was recorded due to credit quality deterioration ensuing from declines in economic conditions during 2009. This increase in the provision compared to 2008 was due to the increased levels of credit downgrades, net charge-offs, and an increase in the level of non-performing loans. A portion was also allocated to safeguard against possible future losses due to weaker economic conditions.
Other income
For the year ended December 31, 2009, total other income was $2,417,000, or 53%, less than the 4,578,000 recorded during the year ended December 31, 2008. In 2009, a non-cash other-than-temporary impairment (OTTI) charge of $3,300,000 was recorded compared to $436,000 recorded for the year ended December 31, 2008. For both years, the OTTI charges were related to the Company's investment in pooled trust preferred securities, for which the carrying values were written down to their fair values as management deemed the impairment to be other-than-temporary. Service charges on deposit related accounts declined $271,000, or 9%, in 2009 compared to 2008. This decline was attributed to lower volumes of overdraft transactions. Further contributing to the decline in other income in 2009, the Company wrote down, to fair value, the carrying amount of its investment in two foreclosed assets held-for-sale by a total of $178,000. There were no similar write-downs during 2008. These assets represent two commercial real estate properties that were acquired in foreclosure during 2008. The 2009 write-downs were based on sales indications received by the Company that were less than the carrying value of the properties. Partially offsetting these declines in other income were increased gains from mortgage banking services, which increased by $799,000 in the year-over-year comparison and higher levels of loan and financial services fee income.
Other expense
For the year ended December 31, 2009, other operating expenses grew $1,030,000, or 6%, from $18,211,000 for the year ended December 31, 2008. The higher operating expenses included a $1,046,000 increase in FDIC insurance premiums. In conjunction with the Company's branch expansion project during 2008, depreciation on premises and equipment increased $305,000, or 6%, from a full year of expense. Partially offsetting these increases were lower employee salary and benefit costs and less advertising expenses. The reduced salary and benefits expense was from fewer full-time equivalent employees in 2009 compared to 2008. The decline in advertising and marketing was related to the completion of the branch expansion project during 2008 and the related reduction in the associated promotion that did not recur during 2009. The increase in collection and ORE expenses were associated with more legal, maintenance and other costs associated with the property foreclosure and ownership. Other expenses declined $422,000, or 24%, due to higher deferral of costs associated with mortgage originations and improved efficiencies of branch operations resulting in lower deposit charge-offs.
The ratios of non-interest expense less non-interest income to average assets (expense ratio) at December 31, 2009 and 2008 were 2.37% and 2.25%, respectively. The overhead expense ratio, which excludes OTTI and gains from securities sales, drifted upward due mostly to lower average assets and to a lesser extent, higher net non-interest expense.
Provision for income taxes
The Company's pre tax loss in 2009 compared to pretax income in 2008 was the cause of a credit for income taxes in 2009 compared to a provision for income taxes in 2008.
38
Off-Balance Sheet Arrangements and Contractual Obligations
The Company is a party to financial instruments with off-balance sheet risk in the normal course of business in order to meet the financing needs of its customers and in connection with the overall interest rate management strategy. These instruments involve, to a varying degree, elements of credit, interest rate and liquidity risk. In accordance with GAAP, these instruments are either not recorded in the consolidated financial statements or are recorded in amounts that differ from the notional amounts. Such instruments primarily include lending commitments and lease obligations.
Lending commitments include commitments to originate loans and commitments to fund unused lines of credit. Commitments to extend credit are agreements to lend to a customer as long as there is no violation of any condition established in the contract. Commitments generally have fixed expiration dates or other termination clauses and may require payment of a fee. Since some of the commitments are expected to expire without being drawn upon, the total commitment amounts do not necessarily represent future cash requirements.
In addition to lending commitments, the Company has contractual obligations related to operating lease commitments. Operating lease commitments are obligations under various non-cancelable operating leases on buildings and land used for office space and banking purposes.
The following table presents, as of December 31, 2010, the Company's significant determinable contractual obligations and significant commitments by payment date. The payment amounts represent those amounts contractually due to the recipient, excluding interest (dollars in thousands):
Over one | Over three | |||||||||||||||||||
One year | year through | years through | Over | |||||||||||||||||
or less | three years | five years | five years | Total | ||||||||||||||||
Contractual obligations: | ||||||||||||||||||||
Certificates of deposit * | $ | 78,120 | $ | 50,776 | $ | 12,972 | $ | 1,783 | $ | 143,651 | ||||||||||
Long-term debt | - | 5,000 | - | 16,000 | 21,000 | |||||||||||||||
Repurchase agreements | 7,548 | - | - | - | 7,548 | |||||||||||||||
Operating leases | 357 | 699 | 672 | 2,889 | 4,617 | |||||||||||||||
Significant commitments: | ||||||||||||||||||||
Letters of credit | 2,783 | 5,240 | - | 720 | 8,743 | |||||||||||||||
Loan commitments ** | 22,907 | - | - | - | 22,907 | |||||||||||||||
Total | $ | 111,715 | $ | 61,715 | $ | 13,644 | $ | 21,392 | $ | 208,466 | ||||||||||
* | Includes certificates in the CDARS program. |
** | Available credit to borrowers in the amount of $55,858 is excluded from the above table since, by its nature, the borrowers may not have the need for additional funding, and, therefore, the credit may or may not be disbursed by the Company. |
Related Party Transactions
Information with respect to related parties is contained in Note 15, "Related Party Transactions", within the notes to the consolidated financial statements, and incorporated by reference in Part II, Item 8.
Impact of Accounting Standards and Interpretations
Information with respect to the impact of accounting standards is contained in Note 18, "Recent Accounting Pronouncements", within the notes to the consolidated financial statements, and incorporated by reference in Part II, Item 8.
Impact of Inflation and Changing Prices
The consolidated financial statements and notes thereto presented herein have been prepared in accordance with U.S. GAAP, which requires the measurement of the Company's financial condition and results of operations in terms of historical dollars without considering the changes in the relative purchasing power of money over time due to inflation. The impact of inflation is reflected in the increased cost of our operations. Unlike industrial businesses, most all of the Company's assets and liabilities are monetary in nature. As a result, interest rates have a greater impact on our performance than do the effects of general levels of inflation as interest rates do not necessarily move in the same direction or, to the same extent, as the price of goods and services.
39
Capital Resources
The Company is subject to various regulatory capital requirements administered by the federal banking agencies. Failure to meet minimum capital requirements can initiate certain mandatory and possible additional discretionary actions by regulators that, if undertaken, could have a direct material effect on the Company's financial statements. Under capital adequacy guidelines and the regulatory framework for prompt corrective action, the Company must meet specific capital guidelines that involve quantitative measures of the Company's assets, liabilities and certain off-balance-sheet items as calculated under regulatory accounting practices. The Company's capital amounts and classification are also subject to qualitative judgments by the regulators about components, risk-weightings and other factors.
Under these guidelines, assets and certain off-balance sheet items are assigned to broad risk categories, each with prescribed risk-weightings. The appropriate risk-weighting, pursuant to regulatory guidelines, required an increase in the weights applied to securities that are rated below investment grade, thereby inflating the total risk-weighted assets. The resulting capital ratios represent capital as a percentage of total risk-weighted assets and certain off-balance sheet items. The guidelines require all banks and bank holding companies to maintain a minimum ratio of total risk-based capital to total risk-weighted assets (Total Risk Adjusted Capital) of 8%, including Tier I capital to total risk-weighted assets (Tier I Capital) of 4% and Tier I capital to average total assets (Leverage Ratio) of at least 4%. Additional information with respect to capital requirements is contained in Note 14, "Regulatory Matters", within the notes to the consolidated financial statements, and incorporated by reference in Part II, Item 8.
In January 2010, the DRP was amended to authorize and issue not more than 300,000 shares of common stock of the Company. The DRP provides shareholders with a convenient and economical method of investing cash dividends payable upon the common stock and the opportunity to make voluntary optional cash payments to purchase additional shares of the Company's common stock. Participants pay no brokerage commissions or service charges when they acquire additional shares of common stock through the DRP. In addition, until further notice and action of the Company's Board of Directors, shareholders who participate in the DRP may use their cash dividends and optional cash payments to purchase additional shares of stock directly from the Company at 90% of the fair market value of the common stock on the investment date. To the extent that additional shares are purchased directly from the Company under the DRP, the Company will receive additional funds for its general corporate purposes.
During the year-ended December 31, 2010, total shareholders' equity increased $1.1 million, or 2%, due principally from the $5.4 million, after-tax decline in the net unrealized loss position in the Company's investment portfolio. Capital was further enhanced by $1,056,000 from investments in the Company's common stock via the Employee Stock Purchase and Dividend Reinvestment Plans. These items partially offset the $3.2 million net loss generated in 2010 as well as the $2.1 million of dividends declared. The Company's primary source (use) of capital during the previous five years has been from the (use) retention of equity in undistributed earnings (losses), as reflected below:
Net | Cash dividends | Earnings | ||||||||||
(loss) income | declared | (used) retained | ||||||||||
2010 | $ | (3,204,394 | ) | $ | 2,137,349 | $ | (5,341,743 | ) | ||||
2009 | (1,400,205 | ) | 2,078,171 | (3,478,376 | ) | |||||||
2008 | 3,635,948 | 2,068,680 | 1,567,268 | |||||||||
2007 | 4,611,572 | 1,921,533 | 2,690,039 | |||||||||
2006 | 4,125,283 | 1,801,361 | 2,323,922 | |||||||||
As of December 31, 2010, the Company reported a net unrealized loss position of $3,817,000, net of tax, from the securities AFS portfolio compared to a net unrealized loss of $9,194,000 as of December 31, 2009. Net of principal write-downs of the Company's investments in pooled trust preferred securities, the Company's unrealized loss position has improved from December 31, 2009. The prolonged economic slump has created uncertainty and illiquidity in the financial and capital markets and has had a sizable negative impact on the fair value estimates for securities in banks' investment portfolios in the past several years. Management believes these changes are due mainly to liquidity problems in the financial markets and to a lesser extent the deterioration in the creditworthiness of the issuers. Also, when U.S. Treasury rates begin to rise, investment securities' pricing will decline. Bond prices move inversely to the movement of interest rates. Nonetheless, there is no assurance that future realized and unrealized losses will not be recognized on the Company's portfolio of investment securities. Additional information with respect to the investment portfolio and a discussion on the related decline in fair value is contained in Note 3, "Investment Securities", within the notes to the consolidated financial statements, and incorporated by reference in Part II, Item 8, and the section entitled, "Investments", in management's discussion and analysis.
40
Liquidity
Liquidity management ensures that adequate funds will be available to meet customers' needs for borrowings, deposit withdrawals and maturities and normal operating expenses of the Company. Current sources of liquidity are cash and cash equivalents, asset maturities and pay-downs within one year, loans and investments AFS, growth of core deposits, growth of repurchase agreements, increases of other borrowed funds from correspondent banks and issuance of capital stock. Although regularly scheduled investment and loan payments are a dependable source of daily funds, the sales of both loans and investments AFS, deposit activity and investment and loan prepayments are significantly influenced by general economic conditions and the interest rate environment. During a declining interest rate environment, prepayments from interest-sensitive assets tend to accelerate and provide significant liquidity which can be used to invest in other interest-earning assets but at lower market rates. Conversely, periods of rising interest rates, prepayments from interest-sensitive assets tend to decelerate causing cash flow from mortgage loans and the MBS – GSE residential securities portfolio to decrease. Rising interest rates may also cause deposit inflow to accelerate and invested at higher market interest rates. The Company closely monitors activity in the capital markets and takes appropriate action to ensure that the liquidity levels are adequate for funding, investing and operating activities.
In 2010, the Company implemented a contingency funding plan (CFP) that sets a framework for handling liquidity issues in the event circumstances arise which the Company deems to be less than normal. To accomplish this, the Company established guidelines for identifying, measuring, monitoring and managing the resolution of potentially serious liquidity crises. The Company's CFP outlines required monitoring tools, acceptable alternative funding sources and required actions during various liquidity scenarios. Thus, the Company has implemented a proactive means for the measurement and resolution for dealing with potentially significant adverse liquidity issues. At least quarterly, the CFP monitoring tools, current liquidity position and monthly projected liquidity sources and uses are presented and reviewed by the Company's ALCO. As of December 31, 2010 the Company has not experienced any adverse liquidity issues that would give rise to its inability to raise liquidity in an emergency situation.
During the year ended December 31, 2010, the Company generated approximately $14.6 million of cash. During this period, the Company's operations provided approximately $14.4 million, primarily from the sales of mortgages HFS net of originations. The Company's investing activities used $3.1 million in cash during 2010 mostly from net growth in the investments portfolio and investment in premises and equipment, partially offset by net loan pay-downs. The $23.5 million growth in deposits were partially used to pay down short-and long-term debt thereby providing net funds generated from financing activities of $3.4 million.
As of December 31, 2010, the Company maintained $22,967,000 in cash and cash equivalents and $83,154,000 of investments AFS and loans HFS. In addition, as of December 31, 2010, the Company had approximately $163,585,000 available to borrow from the FHLB, $21,000,000 available from other correspondent banks and $24,322,000 (including the Borrower-in-Custody (BIC) program) from the Discount Window of the Federal Reserve Bank (FRB). The purpose of the BIC arrangement is to provide flexibility to banks so they may increase their pool of pledged collateral while avoiding the inconvenience and cost of transporting collateral and supporting documentation to the FRB. The combined total of $315,028,000 represented 56% of total assets at December 31, 2010. Management believes this level of liquidity to be strong and adequate to support current operations.
During April 2010, the FHLB informed the Company of a 50% collateral maintenance requirement on outstanding obligations and restrictions on utilization above 35% of the amount available to borrow. During October 2010, the FHLB informed the Company that it has reduced the restrictions on utilization to above 50% of the amount available to borrow. During first quarter of 2011, the Company was informed that the methodology by which restrictions are determined was amended. As a result, the 50% restrictions on utilization and collateral were lifted and the Company is now able to utilize 100% of the amount available to borrow with collateral delivery requirements if usage exceeds 75%. The Company neither considers the 75% collateral requirement to be overly-restrictive nor effect the liquidity position of the Company.
For a discussion on the Company's significant determinable contractual obligations and significant commitments, see "Off-Balance Sheet Arrangements and Contractual Obligations," above.
Management of interest rate risk and market risk analysis
In January 2010, the Federal Financial Institutions Examination Council (FFIEC) released an Advisory on Interest Rate Risk Management (IRR Advisory) to remind institutions of the supervisory expectations regarding sound practices for managing interest rate risk. While some degree of interest rate risk is inherent in the business of banking, the FFIEC expects financial institutions to have sound risk management practices in place to measure monitor and control interest rate risk exposures, and interest rate risk management should be an integral component of an institution's risk management infrastructure. The FFIEC expects all institutions to manage their interest rate risk exposures using processes and systems commensurate with the balance sheet complexity, business model, risk profile, scope of operations, earnings and capital levels. The IRR Advisory reiterates the importance of effective corporate governance, policies and procedures, risk measuring and monitoring systems, stress testing, and internal controls related to the interest rate risk exposures of institutions.
41
The IRR Advisory encourages institutions to use a variety of techniques to measure interest rate risk exposure including: gap analysis, income measurement and valuation measurement for assessing the impact of changes in market rates and simulation modeling to measure interest rate risk exposure. The IRR Advisory also reminds institutions that stress testing, which includes both scenario and sensitivity analysis, is an integral component of interest rate risk management. Institutions should regularly assess interest rate risk exposures beyond typical industry conventions and towards the given economic climate including changes in rates of a magnitude that is greater than the general practice of up and down 200 basis points and different scenarios to reflect changes in slopes of the yield curve.
The adequacy and effectiveness of an institution's interest rate risk management process and the level of its exposures are critical factors in the regulatory evaluation of an institution's sensitivity to changes in interest rates and capital adequacy. Management believes the Company's interest rate risk measurement framework is sound and provides an effective means to measure, monitor, analyze, indentify and control interest rate risk in the balance sheet.
The Company is subject to the interest rate risks inherent in its lending, investing and financing activities. Fluctuations of interest rates will impact interest income and interest expense along with affecting market values of all interest-earning assets and interest-bearing liabilities, except for those assets or liabilities with a short term remaining to maturity. Interest rate risk management is an integral part of the asset/liability management process. The Company has instituted certain procedures and policy guidelines to manage the interest rate risk position. Those internal policies enable the Company to react to changes in market rates to protect net interest income from significant fluctuations. The primary objective in managing interest rate risk is to minimize the adverse impact of changes in interest rates on net interest income along with creating an asset/liability structure that maximizes earnings.
Asset/Liability Management . One major objective of the Company when managing the rate sensitivity of its assets and liabilities is to stabilize net interest income. The management of and authority to assume interest rate risk is the responsibility of the Company's Asset/Liability Committee (ALCO), which is comprised of senior management and members of the board of directors. ALCO meets quarterly to monitor the relationship of interest sensitive assets to interest sensitive liabilities. The process to review interest rate risk is a regular part of managing the Company. Consistent policies and practices of measuring and reporting interest rate risk exposure, particularly regarding the treatment of non-contractual assets and liabilities, are in effect. In addition, there is an annual process to review the interest rate risk policy with the board of directors which includes limits on the impact to earnings from shifts in interest rates.
Interest Rate Risk Measurement. Interest rate risk is monitored through the use of three complementary measures: static gap analysis, earnings at risk simulation and economic value at risk simulation. While each of the interest rate risk measurements has limitations, collectively, they represent a reasonably comprehensive view of the magnitude of interest rate risk in the Company and the distribution of risk along the yield curve, the level of risk through time and the amount of exposure to changes in certain interest rate relationships.
Static Gap . The ratio between assets and liabilities re-pricing in specific time intervals is referred to as an interest rate sensitivity gap. Interest rate sensitivity gaps can be managed to take advantage of the slope of the yield curve as well as forecasted changes in the level of interest rate changes.
To manage this interest rate sensitivity gap position, an asset/liability model commonly known as cumulative gap analysis is used to monitor the difference in the volume of the Company's interest sensitive assets and liabilities that mature or re-price within given time intervals. A positive gap (asset sensitive) indicates that more assets will re-price during a given period compared to liabilities, while a negative gap (liability sensitive) has the opposite effect. The Company employs computerized net interest income simulation modeling to assist in quantifying interest rate risk exposure. This process measures and quantifies the impact on net interest income through varying interest rate changes and balance sheet compositions. The use of this model assists the ALCO to gauge the effects of the interest rate changes on interest-sensitive assets and liabilities in order to determine what impact these rate changes will have upon the net interest spread. At December 31, 2010 the Company maintained a one-year cumulative gap of positive $80.8 million, or 14.4%, of total assets. The effect of this positive gap position provided a mismatch of assets and liabilities which may expose the Company to interest rate risk during periods of falling interest rates. Conversely, in an increasing interest rate environment, net interest income could be positively impacted because more assets than liabilities will re-price upward during the one-year period.
Certain shortcomings are inherent in the method of analysis discussed above and presented in the next table. Although certain assets and liabilities may have similar maturities or periods of re-pricing, they may react in different degrees to changes in market interest rates. The interest rates on certain types of assets and liabilities may fluctuate in advance of changes in market interest rates, while interest rates on other types of assets and liabilities may lag behind changes in market interest rates. Certain assets, such as adjustable-rate mortgages, have features which restrict changes in interest rates on a short-term basis and over the life of the asset. In the event of a change in interest rates, prepayment and early withdrawal levels may deviate significantly from those assumed in calculating the table. The ability of many borrowers to service their adjustable-rate debt may decrease in the event of an interest rate increase.
42
The following table reflects the re-pricing of the balance sheet or "gap" position at December 31, 2010 (dollars in thousands):
More than | More than | |||||||||||||||||||
Three months | three months to | one year | More than | |||||||||||||||||
or less | twelve months | to three years | three years | Total | ||||||||||||||||
Cash and cash equivalents | $ | 14,909 | $ | - | $ | - | $ | 8,058 | $ | 22,967 | ||||||||||
Investment securities (1)(2) | 7,783 | 12,617 | 21,130 | 46,443 | 87,973 | |||||||||||||||
Loans (2) | 139,812 | 57,780 | 103,484 | 107,040 | 408,116 | |||||||||||||||
Fixed and other assets | - | 9,425 | - | 33,192 | 42,617 | |||||||||||||||
Total assets | $ | 162,504 | $ | 79,822 | $ | 124,614 | $ | 194,733 | $ | 561,673 | ||||||||||
Total cumulative assets | $ | 162,504 | $ | 242,326 | $ | 366,940 | $ | 561,673 | ||||||||||||
Non-interest-bearing transaction deposits (3) | $ | - | $ | 8,578 | $ | 23,590 | $ | 53,612 | $ | 85,780 | ||||||||||
Interest-bearing transaction deposits | 66,246 | - | 70,955 | 115,816 | 253,017 | |||||||||||||||
Certificates of deposit | 28,503 | 49,630 | 50,776 | 14,742 | 143,651 | |||||||||||||||
Repurchase agreements | 7,548 | - | - | - | 7,548 | |||||||||||||||
Short-term borrowings | 1,000 | - | - | - | 1,000 | |||||||||||||||
Long-term debt | - | - | 5,000 | 16,000 | 21,000 | |||||||||||||||
Other liabilities | - | - | - | 2,903 | 2,903 | |||||||||||||||
Total liabilities | $ | 103,297 | $ | 58,208 | $ | 150,321 | $ | 203,073 | $ | 514,899 | ||||||||||
Total cumulative liabilities | $ | 103,297 | $ | 161,505 | $ | 311,826 | $ | 514,899 | ||||||||||||
Interest sensitivity gap | $ | 59,207 | $ | 21,614 | $ | (25,707 | ) | $ | (8,340 | ) | ||||||||||
Cumulative gap | $ | 59,207 | $ | 80,821 | $ | 55,114 | $ | 46,774 | ||||||||||||
Cumulative gap to total assets | 10.5 | % | 14.4 | % | 9.8 | % | 8.3 | % | ||||||||||||
(1) | Includes FHLB stock and the net unrealized gains/losses on available-for-sale securities. |
(2) | Investments and loans are included in the earlier of the period in which interest rates were next scheduled to adjust or the period in which they are due. In addition, loans were included in the periods in which they are scheduled to be repaid based on scheduled amortization. For amortizing loans and MBS – GSE residential, annual prepayment rates are assumed reflecting historical experience as well as management's knowledge and experience of its loan products. |
(3) | The Company's demand and savings accounts were generally subject to immediate withdrawal. However, management considers a certain amount of such accounts to be core accounts having significantly longer effective maturities based on the retention experiences of such deposits in changing interest rate environments. The effective maturities presented are the recommended maturity distribution limits for non-maturing deposits based on historical deposit studies. |
Earnings at Risk and Economic Value at Risk Simulations . The Company recognizes that more sophisticated tools exist for measuring the interest rate risk in the balance sheet that extend beyond static re-pricing gap analysis. Although it will continue to measure its re-pricing gap position, the Company utilizes additional modeling for identifying and measuring the interest rate risk in the overall balance sheet. The ALCO is responsible for focusing on "earnings at risk" and "economic value at risk", and how both relate to the risk-based capital position when analyzing the interest rate risk.
Earnings at Risk . Earnings at risk simulation measures the change in net interest income and net income should interest rates rise and fall. The simulation recognizes that not all assets and liabilities re-price one-for-one with market rates (e.g., savings rate). The ALCO looks at "earnings at risk" to determine income changes from a base case scenario under an increase and decrease of 200 basis points in interest rate simulation models.
Economic Value at Risk. Earnings at risk simulation measures the short-term risk in the balance sheet. Economic value (or portfolio equity) at risk measures the long-term risk by finding the net present value of the future cash flows from the Company's existing assets and liabilities. The ALCO examines this ratio quarterly utilizing an increase and decrease of 200 basis points in interest rate simulation models. The ALCO recognizes that, in some instances, this ratio may contradict the "earnings at risk" ratio.
43
The following table illustrates the simulated impact of an immediate 200 basis points upward or downward movement in interest rates on net interest income, net income and the change in the economic value (portfolio equity). This analysis assumed that interest-earning asset and interest-bearing liability levels at December 31, 2010 remained constant. The impact of the rate movements was developed by simulating the effect of the rate change over a twelve-month period from the December 31, 2010 levels:
Rates +200 | Rates -200 | |||||||
Earnings at risk: | ||||||||
Percent change in: | ||||||||
Net interest income | 3.7 | % | (3.3 | ) % | ||||
Net income | 11.3 | (10.1 | ) | |||||
Economic value at risk: | ||||||||
Percent change in: | ||||||||
Economic value of equity | (29.7 | ) | (16.3 | ) | ||||
Economic value of equity as a percent of total assets | (2.2 | ) | (1.2 | ) | ||||
Economic value of equity, in the "rates +200" scenario, was marginally outside of the Company's policy guideline and will be monitored quarterly. Economic value has the most meaning when viewed within the context of risk-based capital. Therefore, the economic value may normally change beyond the Company's policy guideline for a short period of time as long as the risk-based capital ratio (after adjusting for the excess equity exposure) is greater than 10%. At December 31, 2010, the Company's risk-based capital ratio was 11.9%.
The table below summarizes estimated changes in net interest income over a twelve-month period beginning January 1, 2011, under alternate interest rate scenarios using the income simulation model described above (dollars in thousands):
Net interest | $ | % | ||||||||||
income | variance | variance | ||||||||||
Change in interest rates | ||||||||||||
+200 basis points | $ | 21,887 | $ | 772 | 3.7 | % | ||||||
+100 basis points | 21,329 | 214 | 1.0 | |||||||||
Flat rate | 21,115 | - | - | |||||||||
-100 basis points | 21,104 | (11 | ) | (0.1 | ) | |||||||
-200 basis points | 20,409 | (706 | ) | (3.3 | ) | |||||||
Simulation models require assumptions about certain categories of assets and liabilities. The models schedule existing assets and liabilities by their contractual maturity, estimated likely call date or earliest re-pricing opportunity. MBS – GSE residential securities and amortizing loans are scheduled based on their anticipated cash flow including estimated prepayments. For investment securities, the Company uses a third-party service to provide cash flow estimates in the various rate environments. Savings, money market and interest-bearing checking accounts do not have stated maturities or re-pricing terms and can be withdrawn or re-price at any time. This may impact the margin if more expensive alternative sources of deposits are required to fund loans or deposit runoff. Management projects the re-pricing characteristics of these accounts based on historical performance and assumptions that it believes reflect their rate sensitivity. The model reinvests all maturities, repayments and prepayments for each type of asset or liability into the same product for a new like term at current product interest rates. As a result, the mix of interest-earning assets and interest bearing-liabilities is held constant.
Supervision and Regulation
The following is a brief summary of the regulatory environment in which the Company and the Bank operate and is not designed to be a complete discussion of all statutes and regulations affecting such operations, including those statutes and regulations specifically mentioned herein. Changes in the laws and regulations applicable to the Company and the Bank can affect the operating environment in substantial and unpredictable ways. We cannot accurately predict whether legislation will ultimately be enacted, and if enacted, the ultimate effect that legislation or implementing regulations would have on our financial condition or results of operations. While banking regulations are material to the operations of the Company and the Bank, it should be noted that supervision, regulation and examination of the Company and the Bank are intended primarily for the protection of depositors, not shareholders.
44
Recent Legislation and Rulemaking
Dodd-Frank Wall Street Reform and Consumer Protection Act.
On July 21, 2010, the Dodd-Frank Wall Street Reform and Consumer Protection Act (Dodd-Frank) was signed into law. Dodd-Frank is intended to effect a fundamental restructuring of federal banking regulation. Among other things, Dodd-Frank creates a new Financial Stability Oversight Council to identify systemic risks in the financial system and gives federal regulators new authority to take control of and liquidate financial firms. Dodd-Frank additionally creates a new independent federal regulator to administer federal consumer protection laws. Dodd-Frank is expected to have a significant impact on our business operations as its provisions take effect. It is difficult to predict at this time what specific impact Dodd-Frank and the yet to be written implementing rules and regulations will have on community banks. However, it is expected that at a minimum they will increase our operating and compliance costs and could increase our interest expense. Among the provisions that are likely to affect us are the following:
Holding Company Capital Requirements. Dodd-Frank requires the Federal Reserve to apply consolidated capital requirements to bank holding companies that are no less stringent than those currently applied to depository institutions. Under these standards, pooled trust preferred securities will be excluded from Tier 1 capital unless such securities were issued prior to May 19, 2010 by a bank holding company with less than $15 billion in assets. Dodd-Frank additionally requires that bank regulators issue countercyclical capital requirements so that the required amount of capital increases in times of economic expansion and decreases in times of economic contraction, consistent with safety and soundness.
Deposit Insurance. Dodd-Frank permanently increases the maximum deposit insurance amount for banks, savings institutions and credit unions to $250,000 per depositor, and extends unlimited deposit insurance to non-interest bearing transaction accounts through December 31, 2012. Dodd-Frank also broadens the base for FDIC insurance assessments. Assessments will now be based on the average consolidated total assets less tangible equity capital of a financial institution. Dodd-Frank requires the FDIC to increase the reserve ratio of the Deposit Insurance Fund from 1.15% to 1.35% of insured deposits by 2020 and eliminates the requirement that the FDIC pay dividends to insured depository institutions when the reserve ratio exceeds certain thresholds. Effective one year from the date of enactment, Dodd-Frank eliminates the federal statutory prohibition against the payment of interest on business checking accounts.
Corporate Governance . Dodd-Frank requires publicly traded companies to give shareholders a non-binding vote on executive compensation at least every three years, a non-binding vote regarding the frequency of the vote on executive compensation at least every six years, and a non-binding vote on "golden parachute" payments in connection with approvals of mergers and acquisitions unless previously voted on by shareholders. The SEC has finalized the rules implementing these requirements. According to the final rule, smaller reporting companies are exempt for the advisory votes on executive compensation for two years. Additionally, Dodd-Frank directs the federal banking regulators to promulgate rules prohibiting excessive compensation paid to executives of depository institutions and their holding companies with assets in excess of $1.0 billion, regardless of whether the company is publicly traded. Dodd-Frank also gives the SEC authority to prohibit broker discretionary voting on elections of directors and executive compensation matters.
Prohibition Against Charter Conversions of Troubled Institutions . Effective one year after enactment, Dodd-Frank prohibits a depository institution from converting from a state to federal charter or vice versa while it is the subject of a cease and desist order or other formal enforcement action or a memorandum of understanding with respect to a significant supervisory matter unless the appropriate federal banking agency gives notice of the conversion to the federal or state authority that issued the enforcement action and that agency does not object within 30 days. The notice must include a plan to address the significant supervisory matter. The converting institution must also file a copy of the conversion application with its current federal regulator which must notify the resulting federal regulator of any ongoing supervisory or investigative proceedings that are likely to result in an enforcement action and provide access to all supervisory and investigative information relating thereto.
Interstate Branching . Dodd-Frank authorizes national and state banks to establish branches in other states to the same extent as a bank chartered by that state would be permitted. Previously, banks could only establish branches in other states if the host state expressly permitted out-of-state banks to establish branches in that state. Accordingly, banks will be able to enter new markets more freely.
45
Limits on Interstate Acquisitions and Mergers . Dodd-Frank precludes a bank holding company from engaging in an interstate acquisition – the acquisition of a bank outside its home state – unless the bank holding company is both well capitalized and well managed. Furthermore, a bank may not engage in an interstate merger with another bank headquartered in another state unless the surviving institution will be well capitalized and well managed. The previous standard in both cases was adequately capitalized and adequately managed.
Limits on Interchange Fees . Dodd-Frank amends the Electronic Fund Transfer Act to, among other things, give the Federal Reserve the authority to establish rules regarding interchange fees charged for electronic debit transactions by payment card issuers having assets over $10 billion and to enforce a new statutory requirement that such fees be reasonable and proportional to the actual cost of a transaction to the issuer.
Consumer Financial Protection Bureau. Dodd-Frank creates a new, independent federal agency called the Consumer Financial Protection Bureau (CFPB), which is granted broad rulemaking, supervisory and enforcement powers under various federal consumer financial protection laws, including the Equal Credit Opportunity Act, Truth in Lending Act, Real Estate Settlement Procedures Act, Fair Credit Reporting Act, Fair Debt Collection Act, the Consumer Financial Privacy provisions of the Gramm-Leach-Bliley Act and certain other statutes. The CFPB will have examination and primary enforcement authority with respect to depository institutions with $10 billion or more in assets. Smaller institutions will be subject to rules promulgated by the CFPB but will continue to be examined and supervised by federal banking regulators for consumer compliance purposes. The CFPB will have authority to prevent unfair, deceptive or abusive practices in connection with the offering of consumer financial products. Dodd-Frank authorizes the CFPB to establish certain minimum standards for the origination of residential mortgages including a determination of the borrower's ability to repay. In addition, Dodd-Frank will allow borrowers to raise certain defenses to foreclosure if they receive any loan other than a "qualified mortgage" as defined by the CFPB. Dodd-Frank permits states to adopt consumer protection laws and standards that are more stringent than those adopted at the federal level and, in certain circumstances, permits state attorneys general to enforce compliance with both the state and federal laws and regulations.
Small Business Jobs Act
The Small Business Jobs Act was signed into law on September 27, 2010, which creates a $30 billion Small Business Lending Fund (the Fund) to provide community banks with capital to increase small business lending. Generally, bank holding companies with assets equal to or less than $10 billion are eligible to apply for and receive a capital investment from the Fund in an amount equal to 3-5% of its risk-weighted assets.
The capital investment will take the form of preferred stock carrying a 5% dividend which has the potential to decrease to as low as 1% if the participant sufficiently increases its small business lending within the first two and one-half years. If the participant does not increase its small business lending at least 2.5% in the first two and one-half years, the dividend rate will increase to 7%. After four and one-half years, the dividend will increase to 9% regardless of the participant's small business lending. The deadline to apply to receive capital under the fund is March 31, 2011. Whether the Fund will help spur the economy by increasing small business lending or strengthening the capital position of community banks is uncertain.
Future Federal and State Legislation and Rulemaking
From time-to-time, various types of federal and state legislation have been proposed that could result in additional regulations and restrictions on the business of the Company and the Bank. We cannot predict whether legislation will be adopted, or if adopted, how the new laws would affect our business. As a consequence, we are susceptible to legislation that may increase the cost of doing business. Management believes that the effect of any current legislative proposals on the liquidity, capital resources and the results of operations of the Company and the Bank will be minimal.
It is possible that there will be regulatory proposals which, if implemented, could have a material effect upon our liquidity, capital resources and results of operations. In addition, the general cost of compliance with numerous federal and state laws does have, and in the future may have, a negative impact on our results of operations. As with other banks, the status of the financial services industry can affect the Bank. Consolidations of institutions are expected to continue as the financial services industry seeks greater efficiencies and market share. Bank management believes that such consolidations may enhance the Bank's competitive position as a community bank.
Future Outlook
Based upon the uncertain economic outlook that has affected the financial and capital markets, and for the Company the impact on its portfolio of pooled trust preferred securities, the uncertainty in the housing and real estate arena, high unemployment and the inability to predict when and by how much interest rates will change and whether rates will continue to fall or begin to rise, the Company recognizes that there are challenges ahead. The Company is prepared to meet these challenges and feels future earnings will be significantly impacted by its ability to respond to changes in interest rates and by its ability to react to market conditions that adversely impact the Company's performance and condition.
46
The Company will continue to monitor interest rate sensitivity of its interest-earning assets and interest-bearing liabilities to minimize any adverse effects on future financial performance. The Company's commitment to remain a community based organization is very strong. Our intention is to cautiously grow by increasing our base of core deposits and maintain risk-based regulatory capital ratios above "well capitalized" limits. Review and implementation of policies and procedures along with adding innovative products and services will continue. These steps are designed to provide our customers with confidence that the Company is doing everything possible to maximize their banking experience which in turn will increase shareholder value.
Item 7A: QUANTITATIVE AND QUALITATIVE DISCLOSURES ABOUT MARKET RISK
The information required by 7A is set forth at Item 7, under "Liquidity" and "Management of interest rate risk and market risk analysis," contained within management's discussion and analysis of financial condition and results of operations and incorporated herein by reference.
47
Item 8: FINANCIAL STATEMENTS AND SUPPLEMENTARY DATA
![]()
Board of Directors and Shareholders
Fidelity D & D Bancorp, Inc.:
We have audited the accompanying consolidated balance sheets of Fidelity D & D Bancorp, Inc. and Subsidiary as of December 31, 2010 and 2009 and the related consolidated statements of income, changes in shareholders' equity and cash flows for each of the years in the three-year period ended December 31, 2010. These financial statements are the responsibility of the Company's management. Our responsibility is to express an opinion on these financial statements based on our audits.
We conducted our audits in accordance with the standards of the Public Company Accounting Oversight Board (United States). Those standards require that we plan and perform the audit to obtain reasonable assurance about whether the financial statements are free of material misstatement. The Company is not required to have, nor were we engaged to perform, an audit of its internal control over financial reporting. Our audit included consideration of internal control over financial reporting as a basis for designing audit procedures that are appropriate in the circumstances, but not for the purpose of expressing an opinion on the effectiveness of the Company's internal control over financial reporting. Accordingly, we express no such opinion. An audit also includes examining, on a test basis, evidence supporting the amounts and disclosures in the financial statements, assessing the accounting principles used and significant estimates made by management, as well as evaluating the overall financial statement presentation. We believe that our audits provide a reasonable basis for our opinion.
In our opinion, the consolidated financial statements referred to above present fairly, in all material respects, the financial position of Fidelity D & D Bancorp, Inc. and Subsidiary as of December 31, 2010 and 2009, and the results of their operations and their cash flows for each of the years in the three-year period ended December 31, 2010 in conformity with accounting principles generally accepted in the United States of America.
/s/ ParenteBeard LLC |
ParenteBeard LLC |
Wilkes-Barre, Pennsylvania |
March 29, 2011 |
48
FIDELITY D & D BANCORP, INC. AND SUBSIDIARY
Consolidated Balance Sheets
As of December 31, 2010 and 2009
2010 | 2009 | |||||||
Assets: | ||||||||
Cash and due from banks | $ | 8,071,151 | $ | 8,173,199 | ||||
Interest-bearing deposits with financial institutions | 14,896,194 | 154,755 | ||||||
Total cash and cash equivalents | 22,967,345 | 8,327,954 | ||||||
Available-for-sale securities | 82,940,996 | 75,821,292 | ||||||
Held-to-maturity securities | 490,375 | 708,706 | ||||||
Federal Home Loan Bank stock | 4,542,000 | 4,781,100 | ||||||
Loans, net (allowance for loan losses of $7,897,822 in 2010; $7,573,603 in 2009) | 407,903,329 | 423,124,054 | ||||||
Loans held-for-sale (fair value $216,845 in 2009; $1,233,345 in 2009) | 213,000 | 1,221,365 | ||||||
Foreclosed assets held-for-sale | 1,260,895 | 887,397 | ||||||
Bank premises and equipment, net | 14,763,873 | 15,361,810 | ||||||
Cash surrender value of bank owned life insurance | 9,424,926 | 9,117,156 | ||||||
Accrued interest receivable | 2,228,409 | 2,250,855 | ||||||
Other assets | 14,938,004 | 14,415,582 | ||||||
Total assets | $ | 561,673,152 | $ | 556,017,271 | ||||
Liabilities: | ||||||||
Deposits: | ||||||||
Interest-bearing | $ | 396,667,300 | $ | 388,103,880 | ||||
Non-interest-bearing | 85,780,392 | 70,890,578 | ||||||
Total deposits | 482,447,692 | 458,994,458 | ||||||
Accrued interest payable and other liabilities | 2,903,045 | 2,815,159 | ||||||
Short-term borrowings | 8,548,400 | 16,533,107 | ||||||
Long-term debt | 21,000,000 | 32,000,000 | ||||||
Total liabilities | 514,899,137 | 510,342,724 | ||||||
Shareholders' equity: | ||||||||
Preferred stock authorized 5,000,000 shares with no par value; none issued | - | - | ||||||
Capital stock, no par value (10,000,000 shares authorized; shares issued and outstanding; 2,178,028 in 2010; and 2,105,860 in 2009) | 21,046,646 | 19,982,677 | ||||||
Retained earnings | 29,544,522 | 34,886,265 | ||||||
Accumulated other comprehensive loss | (3,817,153 | ) | (9,194,395 | ) | ||||
Total shareholders' equity | 46,774,015 | 45,674,547 | ||||||
Total liabilities and shareholders' equity | $ | 561,673,152 | $ | 556,017,271 | ||||
See notes to consolidated financial statements
49
FIDELITY D & D BANCORP, INC. AND SUBSIDIARY
Consolidated Statements of Income
For the years ended December 31, 2010, 2009 and 2008
2010 | 2009 | 2008 | ||||||||||
Interest income: | ||||||||||||
Loans: | ||||||||||||
Taxable | $ | 23,997,180 | $ | 25,521,742 | $ | 27,194,191 | ||||||
Nontaxable | 611,549 | 447,802 | 370,097 | |||||||||
Interest-bearing deposits with financial institutions | 65,007 | 589 | 3,173 | |||||||||
Investment securities: | ||||||||||||
U.S. government agency and corporations | 1,642,123 | 2,387,192 | 4,408,437 | |||||||||
States and political subdivisions (nontaxable) | 1,039,028 | 1,072,027 | 648,000 | |||||||||
Other securities | 211,413 | 468,604 | 1,246,403 | |||||||||
Federal funds sold | 13,674 | 11,317 | 91,133 | |||||||||
Total interest income | 27,579,974 | 29,909,273 | 33,961,434 | |||||||||
Interest expense: | ||||||||||||
Deposits | 5,078,053 | 7,895,576 | 11,118,194 | |||||||||
Securities sold under repurchase agreements | 89,358 | 27,959 | 102,577 | |||||||||
Other short-term borrowings and other | 1,395 | 34,602 | 276,407 | |||||||||
Long-term debt | 1,658,209 | 2,838,717 | 3,186,955 | |||||||||
Total interest expense | 6,827,015 | 10,796,854 | 14,684,133 | |||||||||
Net interest income | 20,752,959 | 19,112,419 | 19,277,301 | |||||||||
Provision for loan losses | 2,085,000 | 5,050,000 | 940,000 | |||||||||
Net interest income after provision for loan losses | 18,667,959 | 14,062,419 | 18,337,301 | |||||||||
Other (loss) income: | ||||||||||||
Service charges on deposit accounts | 2,653,317 | 2,630,190 | 2,901,156 | |||||||||
Service charges on loans | 709,615 | 624,309 | 445,897 | |||||||||
Fees and other service charges | 1,356,659 | 1,316,603 | 1,373,004 | |||||||||
Gain (loss) on sale or disposal of: | ||||||||||||
Loans | 798,093 | 1,059,876 | 260,940 | |||||||||
Investment securities | 1,713 | 10,695 | 25,428 | |||||||||
Premises and equipment | (23,530 | ) | (43,027 | ) | (35,658 | ) | ||||||
Foreclosed assets held-for-sale | 57,550 | 40,195 | 43,199 | |||||||||
Write-down of foreclosed assets held-for-sale | (129,497 | ) | (177,560 | ) | - | |||||||
Impairment losses on investment securities: | ||||||||||||
Other-than-temporary impairment on investment securities | (15,374,693 | ) | (8,074,293 | ) | (435,665 | ) | ||||||
Non-credit-related losses on investment securities not expected to be sold (recognized in other comprehensive income/(loss)) | 3,538,775 | 4,774,199 | - | |||||||||
Net impairment losses on investment securities recognized in earnings | (11,835,918 | ) | (3,300,094 | ) | (435,665 | ) | ||||||
Total other (loss) income | (6,411,998 | ) | 2,161,187 | 4,578,301 | ||||||||
Other expenses: | ||||||||||||
Salaries and employee benefits | 9,000,714 | 9,763,430 | 9,869,866 | |||||||||
Premises and equipment | 3,427,168 | 3,556,862 | 3,251,453 | |||||||||
Advertising and marketing | 1,123,818 | 974,194 | 1,142,327 | |||||||||
Professional services | 1,167,795 | 1,273,618 | 1,153,463 | |||||||||
FDIC assessment | 858,845 | 1,177,074 | 131,299 | |||||||||
Loan collection and other real estate owned | 645,009 | 635,022 | 402,148 | |||||||||
Office supplies and postage | 432,723 | 498,310 | 475,850 | |||||||||
Other | 1,360,652 | 1,362,615 | 1,784,277 | |||||||||
Total other expenses | 18,016,724 | 19,241,125 | 18,210,683 | |||||||||
(Loss) income before income taxes | (5,760,763 | ) | (3,017,519 | ) | 4,704,919 | |||||||
(Credit) provision for income taxes | (2,556,369 | ) | (1,617,314 | ) | 1,068,971 | |||||||
Net (loss) income | $ | (3,204,394 | ) | $ | (1,400,205 | ) | $ | 3,635,948 | ||||
Per share data: | ||||||||||||
Net (loss) income - basic | $ | (1.50 | ) | $ | (0.67 | ) | $ | 1.76 | ||||
Net (loss) income - diluted | $ | (1.50 | ) | $ | (0.67 | ) | $ | 1.76 | ||||
Dividends | $ | 1.00 | $ | 1.00 | $ | 1.00 | ||||||
See notes to consolidated financial statements
50
FIDELITY D & D BANCORP, INC. AND SUBSIDIARY
Consolidated Statements of Changes in Shareholders' Equity
For the years ended December 31, 2010, 2009 and 2008
Accumulated other | ||||||||||||||||||||||||||||
Capital stock | Treasury stock | Retained | comprehensive | |||||||||||||||||||||||||
Shares | Amount | Shares | Amount | earnings | loss | Total | ||||||||||||||||||||||
Balance, December 31, 2007 | 2,072,929 | $ | 19,223,363 | - | $ | - | $ | 36,564,157 | $ | (596,226 | ) | $ | 55,191,294 | |||||||||||||||
Total comprehensive loss: | ||||||||||||||||||||||||||||
Net income | 3,635,948 | 3,635,948 | ||||||||||||||||||||||||||
Change in net unrealized holding losses on available-for-sale securities, net of reclassification adjustment and net of tax adjustments of ($4,043,304) | (7,848,766 | ) | (7,848,766 | ) | ||||||||||||||||||||||||
Change in cash flow hedge intrinsic value | 220,752 | 220,752 | ||||||||||||||||||||||||||
Comprehensive loss | (3,992,066 | ) | ||||||||||||||||||||||||||
Issuance of common stock through Employee Stock Purchase Plan | 2,253 | 57,891 | 57,891 | |||||||||||||||||||||||||
Issuance of common stock through Dividend Reinvestment Plan | 2,745 | 78,770 | (5,175 | ) | 73,595 | |||||||||||||||||||||||
Stock-based compensation expense | 129,052 | 129,052 | ||||||||||||||||||||||||||
Purchase of treasury stock | (15,000 | ) | (430,435 | ) | (430,435 | ) | ||||||||||||||||||||||
Cash dividends declared | (2,068,680 | ) | (2,068,680 | ) | ||||||||||||||||||||||||
Balance, December 31, 2008 | 2,075,182 | 19,410,306 | (12,255 | ) | (351,665 | ) | 38,126,250 | (8,224,240 | ) | 48,960,651 | ||||||||||||||||||
Cumulative effect of change in accounting principle | 350,720 | (350,720 | ) | - | ||||||||||||||||||||||||
Total comprehensive loss: | ||||||||||||||||||||||||||||
Net loss | (1,400,205 | ) | (1,400,205 | ) | ||||||||||||||||||||||||
Change in net unrealized holding losses on available-for-sale securities, net of reclassification adjustment and net of tax adjustments of $1,595,988 | 3,098,095 | 3,098,095 | ||||||||||||||||||||||||||
Net non-credit-related impairment losses on investment securities not expected to be sold, net of tax adjustments of ($1,602,655) | (3,111,037 | ) | (3,111,037 | ) | ||||||||||||||||||||||||
Change in cash flow hedge intrinsic value | (606,493 | ) | (606,493 | ) | ||||||||||||||||||||||||
Comprehensive loss | (2,019,640 | ) | ||||||||||||||||||||||||||
Issuance of common stock through Employee Stock Purchase Plan | 1,701 | 40,569 | 40,569 | |||||||||||||||||||||||||
Purchase of treasury stock | (2,500 | ) | (56,505 | ) | (56,505 | ) | ||||||||||||||||||||||
Issuance of common stock through Dividend | ||||||||||||||||||||||||||||
Reinvestment Plan | 28,977 | 527,294 | 14,755 | 408,170 | (112,329 | ) | 823,135 | |||||||||||||||||||||
Stock-based compensation expense | 4,508 | 4,508 | ||||||||||||||||||||||||||
Cash dividends declared | (2,078,171 | ) | (2,078,171 | ) | ||||||||||||||||||||||||
Balance, December 31, 2009 | 2,105,860 | 19,982,677 | - | - | 34,886,265 | (9,194,395 | ) | 45,674,547 | ||||||||||||||||||||
Total comprehensive income: | ||||||||||||||||||||||||||||
Net loss | (3,204,394 | ) | (3,204,394 | ) | ||||||||||||||||||||||||
Change in net unrealized holding losses on available-for-sale securities, net of reclassification adjustment and net of tax adjustments of $2,299,257 | 4,463,263 | 4,463,263 | ||||||||||||||||||||||||||
Net non-credit-related impairment gains on investment securities not expected to be sold, net of tax adjustments of $470,838 | 913,979 | 913,979 | ||||||||||||||||||||||||||
Comprehensive income | 2,172,848 | |||||||||||||||||||||||||||
Issuance of common stock through Employee Stock Purchase Plan | 4,754 | 67,367 | 67,367 | |||||||||||||||||||||||||
Issuance of common stock through Dividend Reinvestment Plan | 67,414 | 989,117 | 989,117 | |||||||||||||||||||||||||
Stock-based compensation expense | 7,485 | 7,485 | ||||||||||||||||||||||||||
Cash dividends declared | (2,137,349 | ) | (2,137,349 | ) | ||||||||||||||||||||||||
Balance, December 31, 2010 | 2,178,028 | $ | 21,046,646 | - | $ | - | $ | 29,544,522 | $ | (3,817,153 | ) | $ | 46,774,015 | |||||||||||||||
See notes to consolidated financial statements
51
FIDELITY DEPOSIT & DISCOUNT BANCORP, INC. AND SUBSIDIARY
Consolidated Statements of Cash Flows
For the years ended December 31, 2010, 2009 and 2008
2010 | 2009 | 2008 | ||||||||||
Cash flows from operating activities: | ||||||||||||
Net (loss) income | $ | (3,204,394 | ) | $ | (1,400,205 | ) | $ | 3,635,948 | ||||
Adjustments to reconcile net (loss) income to net cash provided by operating activities: | ||||||||||||
Depreciation, amortization and accretion | 2,326,755 | 1,603,459 | 611,429 | |||||||||
Provision for loan losses | 2,085,000 | 5,050,000 | 940,000 | |||||||||
Deferred income tax benefit | (4,122,790 | ) | (1,776,033 | ) | (2,941 | ) | ||||||
Stock-based compensation expense | 7,485 | 4,508 | 129,052 | |||||||||
Loss from investment in limited partnership | - | 40,961 | 80,400 | |||||||||
Proceeds from sale of loans held-for-sale | 61,566,233 | 98,391,716 | 47,230,437 | |||||||||
Originations of loans held-for-sale | (55,928,170 | ) | (87,896,403 | ) | (14,754,219 | ) | ||||||
Write-down of foreclosed assets held-for-sale | 129,497 | 177,560 | - | |||||||||
Increase in cash surrender value of life insurance | (307,770 | ) | (309,372 | ) | (319,121 | ) | ||||||
Net gain on sale of loans | (798,093 | ) | (1,059,876 | ) | (260,940 | ) | ||||||
Net gain on sale of investment securities | (1,713 | ) | (10,695 | ) | (25,428 | ) | ||||||
Net gain on sale of foreclosed assets held for sale | (57,550 | ) | (40,195 | ) | (43,199 | ) | ||||||
Loss on disposal of equipment | 23,530 | 43,027 | 35,658 | |||||||||
Other-than-temporary impairment on securities | 11,835,918 | 3,300,094 | 435,665 | |||||||||
Change in: | ||||||||||||
Accrued interest receivable | (72,882 | ) | (26,435 | ) | 48,394 | |||||||
Other assets | 783,374 | (3,797,337 | ) | (1,122,487 | ) | |||||||
Accrued interest payable and other liabilities | 124,831 | (499,931 | ) | (829,539 | ) | |||||||
Net cash provided by operating activities | 14,389,261 | 11,794,843 | 35,789,109 | |||||||||
Cash flows from investing activities: | ||||||||||||
Held-to-maturity securities: | ||||||||||||
Proceeds from maturities, calls and principal pay-downs | 218,329 | 200,697 | 237,303 | |||||||||
Available-for-sale securities: | ||||||||||||
Proceeds from sale | 153,281 | 5,075,325 | 48,402,457 | |||||||||
Proceeds from maturities, calls and principal pay-downs | 40,563,144 | 39,348,330 | 31,969,469 | |||||||||
Purchases | (51,702,777 | ) | (39,614,223 | ) | (53,111,087 | ) | ||||||
Net decrease (increase) in FHLB stock | 239,100 | - | (1,478,200 | ) | ||||||||
Net decrease (increase) in loans | 7,700,703 | (3,890,584 | ) | (48,759,407 | ) | |||||||
Acquisition of bank premises and equipment | (880,167 | ) | (1,068,538 | ) | (3,950,934 | ) | ||||||
Proceeds from sale of bank premises and equipment | 250 | 2,323 | 600 | |||||||||
Proceeds from sale of foreclosed assets held-for-sale | 570,605 | 893,677 | 262,406 | |||||||||
Net cash (used in) provided by investing activities | (3,137,532 | ) | 947,007 | (26,427,393 | ) | |||||||
Cash flows from financing activities: | ||||||||||||
Net increase in deposits | 23,453,234 | 25,682,526 | 7,603,571 | |||||||||
Net decrease in short-term borrowings | (7,984,707 | ) | (21,596,597 | ) | (1,526,650 | ) | ||||||
Repayments of long-term debt | (11,000,000 | ) | (20,000,000 | ) | (10,708,677 | ) | ||||||
Purchase of treasury stock | - | (56,505 | ) | (430,435 | ) | |||||||
Proceeds from employee stock purchase plan | 67,367 | 40,569 | 57,891 | |||||||||
Dividends paid, net of dividends reinvested | (1,452,823 | ) | (1,255,036 | ) | (1,995,085 | ) | ||||||
Cash contributions from dividend reinvestment plan | 304,591 | - | - | |||||||||
Net provided by (used in) financing activities | 3,387,662 | (17,185,043 | ) | (6,999,385 | ) | |||||||
Net increase (decrease) in cash and cash equivalents | 14,639,391 | (4,443,193 | ) | 2,362,331 | ||||||||
Cash and cash equivalents, beginning | 8,327,954 | 12,771,147 | 10,408,816 | |||||||||
Cash and cash equivalents, ending | $ | 22,967,345 | $ | 8,327,954 | $ | 12,771,147 | ||||||
See notes to consolidated financial statements
52
FIDELITY D & D BANCORP, INC.
AND SUBSIDIARY
NOTES TO CONSOLIDATED FINANCIAL STATEMENTS
1. | NATURE OF OPERATIONS AND SUMMARY OF SIGNIFICANT ACCOUNTING POLICIES |
PRINCIPLES OF CONSOLIDATION
The accompanying consolidated financial statements include the accounts of Fidelity D & D Bancorp, Inc. and its wholly-owned subsidiary, The Fidelity Deposit and Discount Bank (the Bank) (collectively, the Company). All significant inter-company balances and transactions have been eliminated in consolidation.
NATURE OF OPERATIONS
The Company provides a full range of basic financial services to individuals, small businesses and corporate customers. Its primary market area is Lackawanna and Luzerne Counties, Pennsylvania. The Company's primary deposit products are demand deposits and interest-bearing time and savings accounts. It offers a full array of loan products to meet the needs of retail and commercial customers. The Company is subject to regulation by the Federal Deposit Insurance Corporation (FDIC) and the Pennsylvania Department of Banking.
USE OF ESTIMATES
The preparation of financial statements in conformity with accounting principles generally accepted in the United States of America requires management to make estimates and assumptions that affect the reported amounts of assets and liabilities and disclosure of contingent assets and liabilities at the date of the financial statements and the reported amounts of revenues and expenses during the reporting period. Actual results could differ from those estimates.
Material estimates that are particularly susceptible to significant change relate to the determination of the allowance for loan losses, the valuation of investment securities, the determination of and the amount of impairment in the securities portfolios and the related realization of the deferred tax assets related to the allowance for loan losses, other-than-temporary impairment on and valuations of investment securities.
In connection with the determination of the allowance for loan losses, management generally obtains independent appraisals for significant properties. While management uses available information to recognize losses on loans, further reductions in the carrying amounts of loans may be necessary based on changes in economic conditions. In addition, regulatory agencies, as an integral part of their examination process, periodically review the estimated losses on loans. Such agencies may require the Company to recognize additional losses based on their judgments about information available to them at the time of their examination. Because of these factors, it is reasonably possible that the estimated losses on loans may change materially in the near-term. However, the amount of the change that is reasonably possible cannot be estimated.
The Company's investment securities are comprised of a variety of financial instruments. The fair values of these securities are subject to various risks including changes in the interest rate environment and general economic conditions including illiquid conditions in the capital markets. Due to the increased level of these risks and their potential impact on the fair values of the securities, it is possible that the amounts reported in the accompanying financial statements could materially change in the near-term including changes caused by other-than-temporary impairment, the recovery of which may not occur until maturity. Credit-related impairment is included as a component of non-interest income in the consolidated income statements while non-credit-related impairment is charged to other comprehensive income, net of tax.
SIGNIFICANT GROUP CONCENTRATION OF CREDIT RISK
The Company originates commercial, consumer, and mortgage loans to customers primarily located in Lackawanna and Luzerne Counties of Pennsylvania. Although the Company has a diversified loan portfolio, a substantial portion of its debtors' ability to honor their contracts is dependent on the economic sector in which the Company operates. The loan portfolio does not have any significant concentrations from one industry or customer.
53
HELD-TO-MATURITY SECURITIES
Debt securities, for which the Company has the positive intent and ability to hold to maturity, are reported at cost. Premiums and discounts are amortized or accreted, as a component of interest income over the life of the related security as an adjustment to yield using the interest method.
TRADING SECURITIES
Debt and equity securities held principally for resale in the near-term, or trading securities, are recorded at their fair values. Unrealized gains and losses are included in other income. The Company did not have any investment securities held for trading purposes during 2010, 2009 or 2008.
AVAILABLE-FOR-SALE SECURITIES
Available-for-sale (AFS) securities consist of debt and equity securities not classified as either held-to-maturity securities or trading securities and are reported at fair value. Premiums and discounts are amortized or accreted as a component of interest income over the life of the related security as an adjustment to yield using the interest method. Unrealized holding gains and losses, including non-credit-related other-than-temporary impairment (OTTI), on AFS securities are reported as a separate component of shareholders' equity, net of deferred income taxes, until realized. The net unrealized holding gains and losses are a component of accumulated other comprehensive (loss) income. Gains and losses from sales of securities AFS are determined using the specific identification method. Credit-related OTTI is recorded as a reduction of the amortized cost of the impaired security. Net gains and losses from sales of securities and credit-related OTTI are recorded as a component of other income in the consolidated statements of income.
FEDERAL HOME LOAN BANK STOCK
The Company, is a member of the Federal Home Loan Bank system, and as such is required to maintain an investment in capital stock of the Federal Home Loan Bank of Pittsburgh (FHLB). The amount the Company is required to invest is dependent upon the relative size of outstanding borrowings the Company has with the FHLB. Based on redemption provisions of the FHLB, the stock has no quoted market value and is carried at cost. In December 2008, in order to preserve capital, the FHLB declared a suspension on the redemption of its stock and ceased payment of quarterly dividends. Though the FHLB announced a partial lifting and limited repurchase of the stock redemption provision of the suspension during the fourth quarter of 2010, management reviews for impairment based on the ultimate recoverability of the cost basis in the FHLB stock. Future redemptions and dividend payments will be predicated on the financial performance and health of the FHLB. Based on the financial results of the FHLB for the year-ended December 31, 2010 and 2009, management believes that the suspension of both the dividend payments and excess capital stock redemptions is temporary in nature.
LOANS
Loans that management has the intent and ability to hold for the foreseeable future or until maturity or payoff are stated at face value, net of unamortized loan fees and costs and the allowance for loan losses. Interest on residential real estate loans is recorded based on principal pay downs on an actual days basis. Commercial loan interest is accrued on the principal balance on an actual day basis. Interest on consumer loans is determined using the simple interest method.
Loans are generally placed on non-accrual status when principal or interest is past due 90 days or more. When a loan is placed on non-accrual status, all interest previously accrued but not collected is charged against current earnings. Any payments received on non-accrual loans are applied, first to the outstanding loan amounts, then to the recovery of any charged-off loan amounts. Any excess is treated as a recovery of lost interest.
LOANS HELD-FOR-SALE
Loans originated and intended for sale in the secondary market are carried at the lower of cost or estimated fair value in the aggregate. Net unrealized losses are recognized through a valuation allowance by charges to income. Unrealized gains are recognized but only to the extent of previous write-downs.
54
ALLOWANCE FOR LOAN LOSSES
The allowance for loan losses is established through a provision for loan losses. The allowance represents an amount which, in management's judgment, will be adequate to absorb losses on existing loans that may become uncollectible. Management's judgment in determining the adequacy of the allowance is based on evaluations of the collectability of the loans. These evaluations take into consideration such factors as changes in the nature and volume of the loan portfolio, current economic conditions that may affect the borrower's ability to pay, collateral value, overall portfolio quality and review of specific loans for impairment. Management applies two primary components during the loan review process to determine proper allowance levels; a specific loan loss allocation for loans that are deemed impaired; and a general loan loss allocation for those loans not specifically allocated based on historical charge-off history and qualitative factor adjustments for trends or changes in the loan portfolio. Delinquencies, changes in lending polices and local economic conditions are some of the items used for the qualitative factor adjustments. Loans considered uncollectible are charged against the allowance. Recoveries on loans previously charged off are added to the allowance.
A loan is considered impaired when, based on current information and events, it is probable that the Company will be unable to collect the scheduled payments in accordance with the contractual terms of the loan. Factors considered in determining impairment include payment status, collateral value and the probability of collecting payments when due. The significance of payment delays and/or shortfalls is determined on a case by case basis. All circumstances surrounding the loan are taken into account. Such factors include the length of the delinquency, the underlying reasons and the borrower's prior payment record. Impairment is measured on these loans on a loan-by- loan basis.
TRANSFER OF FINANCIAL ASSETS
Transfers of financial assets are accounted for as sales, when control over the assets has been surrendered. Control over transferred assets is deemed to be surrendered when: the assets have been isolated from the Company-put presumptively beyond the reach of the transferor and its creditors, even in bankruptcy or other receivership; the transferee obtains the right (free of conditions that constrain it from taking advantage of that right) to pledge or exchange the transferred assets; and the Company does not maintain effective control over the transferred assets through an agreement to repurchase them before their maturity or the ability to unilaterally cause the holder to return specific assets.
LOAN FEES
Nonrefundable loan origination fees and certain direct loan origination costs are recognized as a component of interest income over the life of the related loans as an adjustment to yield. The unamortized balance of these fees and costs are included as part of the loan balance to which it relates.
BANK PREMISES AND EQUIPMENT
Land is carried at cost. Bank premises and equipment are stated at cost less accumulated depreciation. Depreciation is computed on the straight-line method over the estimated useful lives of the assets. Leasehold improvements are amortized over the shorter of the term of the lease or the estimated useful lives of the improved property.
BANK OWNED LIFE INSURANCE
The Company is the owner and sole beneficiary of bank owned life insurance (BOLI) policies on certain employees. The earnings from the BOLI are recognized as a component of other income in the consolidated statements of income. The BOLI is an asset that can be liquidated, if necessary, with tax consequences. However, the Company intends to hold these policies and, accordingly, the Company has not provided for deferred income taxes on the earnings from the increase in the cash surrender value.
FORECLOSED ASSETS HELD-FOR-SALE
Foreclosed assets held-for-sale are carried at the lower of cost or fair value less cost to sell. Losses from the acquisition of property in full and partial satisfaction of debt are treated as credit losses. Routine holding costs are included in other operating expenses. Write-downs for subsequent declines in value are recognized as a component of other income in the consolidated statements of income. Gains or losses are recorded when the properties are sold.
STOCK OPTIONS
The Company has two stock-based compensation plans, which are described more fully in Note 9, "Stock Plans". The Company accounts for these plans under the recognition and measurement accounting principles, which requires the cost of share-based payment transactions be recognized in the financial statements. The stock compensation accounting guidance requires that compensation cost for all stock awards be calculated and recognized over the employees' service period, generally defined as the vesting period. Compensation cost is recognized on a straight-line basis over the requisite service period for the entire award. The Company uses the Black-Sholes model to estimate the fair value of stock options.
55
TRUST AND FINANCIAL SERVICE FEES
Trust and financial service fees are recorded on the cash basis, which is not materially different from the accrual basis.
ADVERTISING COSTS
Advertising costs are charged to expense as incurred.
FAIR VALUE OF FINANCIAL INSTRUMENTS
The carrying value of short-term financial instruments, as listed below, approximates their fair value. These instruments generally have limited credit exposure, no stated or short-term maturities and carry interest rates that approximate market:
| · | Cash and cash equivalents; |
| · | Non-interest bearing deposit accounts; |
| · | Savings, NOW and money market accounts; |
| · | Short-term borrowings and |
| · | Accrued interest |
Securities: With the exception of pooled trust preferred securities, fair values on the other investment securities are determined by prices provided by a third-party vendor, who is a provider of financial market data, analytics and related services to financial institutions. The fair values of pooled trust preferred securities is determined based on a present value technique (income valuation) as described in Note 3, "Investment Securities".
Loans: The fair value of loans is estimated by the net present value of the future expected cash flows discounted at the current offering rates.
Loans held-for-sale: The fair value of loans held-for-sale is estimated using rates currently offered for similar loans and is typically obtained from the Federal National Mortgage Association (FNMA) or the Federal Home Loan Bank of Pittsburgh (FHLB).
Certificates of deposit: The fair values of certificates of deposit are based on discounted cash flows using rates which approximate market rates for deposits of similar maturities.
Long-term debt: Fair value is estimated using the rates currently offered for similar borrowings.
INCOME TAXES
Deferred tax assets and liabilities are reflected at currently enacted income tax rates applicable to the period in which the deferred tax assets or liabilities are expected to be realized or settled. As changes in tax laws or rates are enacted, deferred tax assets and liabilities are adjusted through the provision for income taxes.
CASH FLOWS
For purposes of reporting cash flows, cash and cash equivalents includes cash on hand, amounts due from banks and interest-bearing deposits with financial institutions.
For the years ended December 31, 2010, 2009, and 2008, the Company paid interest of $7,055,000, $11,522,000 and $15,030,000, respectively. For the years ended December 31, 2010, 2009, and 2008, the Company paid income taxes of $1,025,000, $675,000 and $1,250,000, respectively.
Transfers from loans to foreclosed assets held-for-sale amounted to $1,053,000, $470,000 and $1,564,000 in 2010, 2009, and 2008, respectively. Transfers from loans to loans held-for-sale amounted to $4,382,000, $11,454,000 and $31,472,000 in 2010, 2009 and 2008, respectively. Expenditures for construction in process, a component of other assets in the consolidated balance sheets, are included in acquisition of premises and equipment.
RECLASSIFICATION ADJUSTMENTS
Certain reclassifications have been made to the 2009 and 2008 financial statements to conform to the 2010 presentation.
56
OTHER COMPREHENSIVE INCOME (LOSS)
The components of the changes in other comprehensive income (loss) and related tax effects are as follows:
2010 | 2009 | 2008 | ||||||||||
Unrealized holding gains (losses) on available-for-sale securities | $ | 6,764,233 | $ | 4,704,779 | $ | (11,866,642 | ) | |||||
Reclassification adjustment for gains realized in income | (1,713 | ) | (10,695 | ) | (25,428 | ) | ||||||
Non-credit-related impairment gains (losses) on investment securities | 1,384,817 | (4,713,693 | ) | - | ||||||||
Net unrealized gain (loss) | 8,147,337 | (19,609 | ) | (11,892,070 | ) | |||||||
Tax effect | (2,770,095 | ) | 6,667 | 4,043,304 | ||||||||
Net of tax amount | 5,377,242 | (12,942 | ) | (7,848,766 | ) | |||||||
Change in cash flow hedge intrinsic value | - | (606,493 | ) | 220,752 | ||||||||
Total | $ | 5,377,242 | $ | (619,435 | ) | $ | (7,628,014 | ) | ||||
The components of accumulated other comprehensive loss consisted of:
2010 | 2009 | 2008 | ||||||||||
Unrealized holding losses on available-for-sale securities | $ | (1,620,095 | ) | $ | (6,083,358 | ) | $ | (8,830,733 | ) | |||
Non-credit-related impairment losses on investment securities | (2,197,058 | ) | (3,111,037 | ) | - | |||||||
Cash flow hedge intrinsic value | - | - | 606,493 | |||||||||
Accumulated other comprehensive loss | $ | (3,817,153 | ) | $ | (9,194,395 | ) | $ | (8,224,240 | ) | |||
2. | CASH |
The Company is required by the Federal Reserve Bank to maintain average reserve balances based on a percentage of deposits. The amounts of those reserve requirements on December 31, 2010 and 2009 were $709,000 and $600,000, respectively.
Deposits with any one financial institution are insured up to $250,000. From time-to-time, the Company may maintain cash and cash equivalents with certain other financial institutions in excess of the insured amount.
57
3. | INVESTMENT SECURITIES |
Amortized cost and fair value of investment securities at December 31, 2010 and 2009 are as follows (dollars in thousands):
2010 | ||||||||||||||||
Gross | Gross | |||||||||||||||
Amortized | unrealized | unrealized | Fair | |||||||||||||
cost | gains | losses | value | |||||||||||||
| ||||||||||||||||
Held-to-maturity securities: | ||||||||||||||||
MBS - GSE residential | $ | 490 | $ | 48 | $ | - | $ | 538 | ||||||||
Available-for-sale securities: | ||||||||||||||||
Agency - GSE | $ | 16,316 | $ | 122 | $ | 150 | $ | 16,288 | ||||||||
Obligations of states and political subdivisions | 24,991 | 135 | 955 | 24,171 | ||||||||||||
Corporate bonds: | ||||||||||||||||
Pooled trust preferred securities | 6,873 | 90 | 5,510 | 1,453 | ||||||||||||
MBS - GSE residential | 40,222 | 524 | 193 | 40,553 | ||||||||||||
Total debt securities | 88,402 | 871 | 6,808 | 82,465 | ||||||||||||
Equity securities - financial services | 322 | 154 | - | 476 | ||||||||||||
Total available-for-sale securities | $ | 88,724 | $ | 1,025 | $ | 6,808 | $ | 82,941 | ||||||||
2009 | ||||||||||||||||
Gross | Gross | |||||||||||||||
Amortized | unrealized | unrealized | Fair | |||||||||||||
cost | gains | losses | value | |||||||||||||
| ||||||||||||||||
Held-to-maturity securities: | ||||||||||||||||
MBS - GSE residential | $ | 709 | $ | 56 | $ | - | $ | 765 | ||||||||
Available-for-sale securities: | ||||||||||||||||
Agency - GSE | $ | 34,205 | $ | 4 | $ | 1,077 | $ | 33,132 | ||||||||
Obligations of states and political subdivisions | 23,013 | 394 | 137 | 23,270 | ||||||||||||
Corporate bonds: | ||||||||||||||||
Pooled trust preferred securities | 18,794 | - | 13,552 | 5,242 | ||||||||||||
MBS - GSE residential | 13,418 | 401 | 71 | 13,748 | ||||||||||||
Total debt securities | 89,430 | 799 | 14,837 | 75,392 | ||||||||||||
Equity securities - financial services | 322 | 121 | 14 | 429 | ||||||||||||
Total available-for-sale securities | $ | 89,752 | $ | 920 | $ | 14,851 | $ | 75,821 | ||||||||
| Some of the Company's debt securities are pledged to secure trust funds, public deposits, repurchase agreements, other short-term borrowings, FHLB advances, Federal Reserve Bank of Philadelphia Discount Window borrowings and certain other deposits as required by law. Agency – GSE securities pledged on repurchase agreements are under the Company's control. |
58
The amortized cost and fair value of debt securities at December 31, 2010 by contractual maturity are shown below (dollars in thousands):
Amortized | Fair | |||||||
cost | value | |||||||
Held-to-maturity securities: | ||||||||
MBS - GSE residential | $ | 490 | $ | 538 | ||||
Available-for-sale securities: | ||||||||
Debt securities: | ||||||||
Due in one year or less | $ | - | $ | - | ||||
Due after one year through five years | 999 | 982 | ||||||
Due after five years through ten years | 9,632 | 9,546 | ||||||
Due after ten years | 37,549 | 31,384 | ||||||
Total debt securities | 48,180 | 41,912 | ||||||
MBS - GSE residential | 40,222 | 40,553 | ||||||
Total available-for-sale debt securities | $ | 88,402 | $ | 82,465 | ||||
Expected maturities will differ from contractual maturities because issuers and borrowers may have the right to call or repay obligations with or without call or prepayment penalty. Agency – GSE and municipal securities are included based on their original stated maturity. MBS – GSE residential, which are based on weighted-average lives and subject to monthly principal pay-downs, are listed in total.
59
The following table presents the fair value and gross unrealized losses of investments aggregated by investment type, the length of time and the number of securities that have been in a continuous unrealized loss position at December 31, 2010 and 2009 (dollars in thousands):
Less than 12 months | More than 12 months | Total | ||||||||||||||||||||||
Fair | Unrealized | Fair | Unrealized | Fair | Unrealized | |||||||||||||||||||
value | losses | value | losses | value | losses | |||||||||||||||||||
December 31, 2010: | ||||||||||||||||||||||||
Agency – GSE | $ | 6,995 | $ | 150 | $ | - | $ | - | $ | 6,995 | $ | 150 | ||||||||||||
Obligations of states and political subdivisions | 16,549 | 955 | - | - | 16,549 | 955 | ||||||||||||||||||
Corporate bonds: | ||||||||||||||||||||||||
Pooled trust preferred securities | - | - | 1,364 | 5,510 | 1,364 | 5,510 | ||||||||||||||||||
MBS - GSE residential | 14,672 | 193 | - | - | 14,672 | 193 | ||||||||||||||||||
Total temporarily impaired securities | $ | 38,216 | $ | 1,298 | $ | 1,364 | $ | 5,510 | $ | 39,580 | $ | 6,808 | ||||||||||||
Number of securities | 40 | 7 | 47 | |||||||||||||||||||||
December 31, 2009: | ||||||||||||||||||||||||
Agency – GSE | $ | 21,090 | $ | 291 | $ | 5,038 | $ | 786 | $ | 26,128 | $ | 1,077 | ||||||||||||
Obligations of states and political subdivisions | 3,534 | 115 | 2,600 | 22 | 6,134 | 137 | ||||||||||||||||||
Corporate bonds: | ||||||||||||||||||||||||
Pooled trust preferred securities | - | - | 5,242 | 13,552 | 5,242 | 13,552 | ||||||||||||||||||
MBS - GSE residential | 5,055 | 71 | - | - | 5,055 | 71 | ||||||||||||||||||
Subtotal, debt securities | 29,679 | 477 | 12,880 | 14,360 | 42,559 | 14,837 | ||||||||||||||||||
Equity securities - financial services | 114 | 10 | 46 | 4 | 160 | 14 | ||||||||||||||||||
Total securities Total temporarily impaired securities | $ | 29,793 | $ | 487 | $ | 12,926 | $ | 14,364 | $ | 42,719 | $ | 14,851 | ||||||||||||
Number of securities | 23 | 17 | 40 | |||||||||||||||||||||
As of December 31, 2010 the debt securities with unrealized losses have depreciated below their amortized cost by 14.7% compared to 25.9% at December 31, 2009. Management believes that the cause of the unrealized losses is related to changes in interest rates, instability in the capital markets or the limited trading activity due to illiquid debt market conditions and is not directly related to credit quality, which is consistent with its past experience. Nearly all of the securities in the portfolio have fixed rates or have predetermined scheduled rate changes, and many have call features that allow the issuer to call the security at par before its stated maturity without penalty.
Management conducts a formal review of investment securities on a quarterly basis for the presence of other-than-temporary impairment (OTTI). The accounting guidance related to OTTI requires the Company to assess whether OTTI is present when the fair value of a debt security is less than its amortized cost at the balance sheet date. Under these circumstances, OTTI is considered to have occurred if: (1) the entity has intent to sell the security; (2) more likely than not the entity will be required to sell the security before recovery of its amortized cost basis; or (3) the present value of expected cash flows is not sufficient to recover the entire amortized cost.
The accounting guidance requires that credit-related OTTI be recognized in earnings while non-credit-related OTTI on securities not expected to be sold be recognized in other comprehensive income (loss) (OCI). Non-credit-related OTTI is based on other factors affecting market conditions, including illiquidity. Presentation of OTTI is made in the consolidated statements of income on a gross basis with an offset for the amount of non-credit-related OTTI recognized in OCI.
The Company's OTTI evaluation process also follows the guidance set forth in topics related to debt and equity securities. The guidance set forth in these pronouncements require the Company to take into consideration current market conditions, fair value in relationship to cost, extent and nature of changes in fair value, issuer rating changes and trends, volatility of earnings, current analysts' evaluations, all available information relevant to the collectability of debt securities, the ability and intent to hold investments until a recovery of fair value which may be maturity and other factors when evaluating for the existence of OTTI. The guidance requires that OTTI be recognized as a realized loss through earnings when there has been an adverse change in the holder's expected cash flows such that the full amount (principal and interest) will probably not be received. This requirement is consistent with the impairment model in the guidance for accounting for debt and equity securities.
60
For all security types discussed below, as of December 31, 2010 the Company applied the criteria provided in the recognition and presentation guidance related to OTTI. That is, management has no intent to sell the securities and no conditions were identified by management that more likely than not would require the Company to sell the securities before recovery of their amortized cost basis. The results indicated there was no presence of OTTI for the Company's portfolios of Agency – Government Sponsored Enterprise (GSE), Mortgage-backed securities (MBS) – GSE residential and Obligations of states and political subdivisions.
Agency - GSE and MBS - GSE residential
Agency – GSE and MBS – GSE residential securities consist of medium- and long-term notes issued by Federal Home Loan Mortgage Corporation (FHLMC), Federal National Mortgage Association (FNMA), Federal Home Loan Bank (FHLB) and Government National Mortgage Association (GNMA). These securities have interest rates that are largely fixed-rate issues, have varying mid- to long-term maturity dates and have contractual cash flows guaranteed by the U.S. government or agencies of the U.S. government.
Obligations of states and political subdivisions
The municipal securities are bank qualified, general obligation bonds rated as investment grade by various credit rating agencies and have fixed rates of interest with mid- to long-term maturities. Fair values of these securities are highly driven by interest rates. Management performs ongoing credit quality reviews on these issues.
In the above security types, the changes in fair value is attributable to changes in interest rates and those instruments with unrealized losses were not caused by deterioration of credit quality. Accordingly, as of December 31, 2010, recognition of OTTI on these securities was unnecessary.
Pooled trust preferred securities
A Pooled Trust Preferred Collateralized Debt Obligation (CDO) is a type of investment security collateralized by trust preferred securities (TPS) issued by banks, insurance companies and real estate investment trusts. The primary collateral type is a TPS issued by a bank. A TPS is a hybrid security that consists of both debt and equity characteristics which includes the ability of the issuer to voluntarily defer interest payments for up to 20 consecutive quarters. A TPS is considered a junior security in the capital structure of the issuer.
There are various investment classes or tranches issued by the CDO. The most senior tranche has the lowest yield but the most protection from credit losses. The most junior tranche on the other hand, has the highest yield and the most risk of credit loss. Junior tranches are subordinate to senior tranches. Losses are generally allocated from the lowest tranche with the equity component holding the most risk and then subordinate tranches in reverse order up to the most senior tranche. The allocation of losses is defined in the indenture when the CDO was formed.
Unrealized losses in the pooled trust preferred securities (PreTSLs) are caused mainly by the following factors: (1) collateral deterioration due to bank failures and credit concerns across the banking sector; (2) widening of credit spreads and (3) illiquidity in the market. The Company's review of its portfolio of preferred trust preferred securities, in accordance with the previous discussion, determined that in 2010 credit-related OTTI be recorded on 12 holdings, all of which are in the AFS securities portfolio.
61
The following table summarizes the amount of credit-related OTTI recognized in earnings during the periods indicated (dollars in thousands):
Twelve months ended | ||||||||||||
December 31, | ||||||||||||
2010 | 2009 | 2008 | ||||||||||
Pooled trust preferred securities: | ||||||||||||
PreTSL IV, Mezzanine | $ | 163 | $ | - | $ | - | ||||||
PreTSL V, Mezzanine | 122 | - | - | |||||||||
PreTSL VII, Mezzanine | 409 | 674 | 430 | |||||||||
PreTSL IX, B1, B3 | 1,061 | 690 | - | |||||||||
PreTSL XI, B1, B3 | 1,273 | - | - | |||||||||
PreTSL XV, B1 | 1,359 | 154 | - | |||||||||
PreTSL XVI, C | 1,290 | 1,275 | - | |||||||||
PreTSL XVII, C | 1,014 | - | - | |||||||||
PreTSL XVIII, C | 736 | - | - | |||||||||
PreTSL XIX, C | 2,124 | - | - | |||||||||
PreTSL XXIV, B1 | 1,778 | - | - | |||||||||
PreTSL XXV, C1 | 507 | 507 | - | |||||||||
Equity securities | - | - | 6 | |||||||||
Total | $ | 11,836 | $ | 3,300 | $ | 436 | ||||||
The following table is a tabular roll-forward of the cumulative amount of credit-related OTTI recognized in earnings (dollars in thousands):
Twelve months ended | ||||||||||||
December 31, 2010 | ||||||||||||
HTM | AFS | Total | ||||||||||
Beginning balance of credit-related OTTI | $ | - | $ | (3,198 | ) | $ | (3,198 | ) | ||||
Additions for credit-related OTTI not previously recognized | - | (7,210 | ) | (7,210 | ) | |||||||
Additional credit-related OTTI previously recognized when there is no intent to sell before recovery of amortized cost basis | - | (4,626 | ) | (4,626 | ) | |||||||
Ending balance of credit-related OTTI | $ | - | $ | (15,034 | ) | $ | (15,034 | ) | ||||
To determine credit-related OTTI, the Company analyzes the collateral of each individual tranche within each of the 13 individual pools in the Company's portfolio of pooled trust preferred securities (PreTSLs). Defaults and cash flows on the underlying collateral were projected on each of the 13 tranches and utilizing the resulting estimated weighted-average lives, 10,000 credit scenarios were simulated to determine the frequency of losses to each tranche. A loss frequency of greater than 50% constituted OTTI. Utilizing the portfolio's default probability rate and weighted-average lives, to determine a benchmark discount rate, and applying a differential to the individual pool's collateral-rating, an appropriate discount rate is determined and is used to estimate the anticipated cash flow from each tranche within each pool. The projected estimated cash flow of each tranche was compared to the estimated cash flow of each tranche as of the previous measurement date of September 30, 2010 to determine if there was a significant adverse change. The results indicated that a significant adverse change in cash flow occurred in 10 tranches signifying additional collateral erosion and further evidence of the Company's inability to collect the principal balance of each tranche. Accordingly, an additional $9.3 million of credit-related OTTI was recorded in the fourth quarter of 2010, resulting in $11.8 million of credit-related OTTI for the year ended December 31, 2010.
62
Prior to December 31, 2010, the valuation process used by the Company was different than the process currently used. The inputs used in the past also consisted of a mix of both observable and unobservable, however they were more global applications and not as security-specific as those currently used. For example, prior to December 31, 2010, to project a default rate, universal adjustments were applied to the historical average default rates. The historical average default rates were obtained from the FDIC for U.S. Banks and Thrifts for the period spanning 1988 to 1991. This rate was tripled, and then adjusted downward for actual deferrals/defaults in all PreTSLs for the years 2008 and 2009. The results were then stratified beginning with a higher rate of default and then regressing to normal, with projected global recoveries and prepayment speeds. The resulting rate was then applied to all of the PreTSLs in the Company's portfolio to determine period-end valuations and the existence of OTTI. Management of the Company has determined that a security-specific analysis is more representative of the performance and credit-worthiness of the collateral within each of the securities. Accordingly, the Company's intent is to use the new analysis in future OTTI determinations.
One of the Company's initial mezzanine holdings, PreTSL IV, is now a senior tranche and the remaining holdings are mezzanine tranches. As of December 31, 2010, none of the PreTSLs were investment grade. At the time of initial issue, the subordination in the Company's tranches ranged in size from approximately 8.0% to 25.2% of the total principal amount of the respective securities and no more than 5% of any security consisted of a security issued by any one bank and 4% for insurance companies. As of December 31, 2010, management estimates the subordination in the Company's tranches ranging from 0% to 19.3% of the current performing collateral.
The following table is the composition of the Company's pooled trust preferred securities on non-accrual status as of the period indicated (dollars in thousands):
December 31, 2010 | December 31, 2009 | ||||||||||||||||||
Book | Fair | Book | Fair | ||||||||||||||||
Deal | Class | value | value | value | value | ||||||||||||||
Pre TSL VII | Mezzanine | $ | - | $ | 68 | $ | 432 | $ | 219 | ||||||||||
Pre TSL IX | B-1,B-3 | 1,679 | 527 | - | - | ||||||||||||||
Pre TSL XI | B-3 | 1,125 | 407 | - | - | ||||||||||||||
Pre TSL XV | B-1 | - | 21 | 1,359 | 297 | ||||||||||||||
Pre TSL XVI | C | - | - | 1,290 | 65 | ||||||||||||||
Pre TSL XVII | C | - | - | - | - | ||||||||||||||
Pre TSL XVIII | C | 285 | 11 | - | - | ||||||||||||||
Pre TSL XIX | C | 452 | 22 | - | - | ||||||||||||||
Pre TSL XXIV | B-1 | 482 | 35 | - | - | ||||||||||||||
Pre TSL XXV | C-1 | - | - | 507 | 2 | ||||||||||||||
| $ | 4,023 | $ | 1,091 | $ | 3,588 | $ | 583 | ||||||||||||
The securities included in the above table have experienced impairment of principal and interest was "paid-in-kind". When these two conditions exist, the security is placed on non-accrual status.
The following table provides additional information with respect to the Company's pooled trust preferred securities as of December 31, 2010:
| Current number of banks / insurance companies | Actual deferrals and defaults as a % of current collateral | Excess subordination (2) as a % of current performing collateral | Effective subordination (3) as a % of current performing collateral | ||||||||||||||||||||||||||||||||||||
| Actual deferrals and defaults $ (000) | |||||||||||||||||||||||||||||||||||||||
| Moody's / Fitch ratings (1) | Excess subordination $ (000) | ||||||||||||||||||||||||||||||||||||||
| Book value | Fair value | Unrealized gain (loss) | |||||||||||||||||||||||||||||||||||||
Deal | Class | ||||||||||||||||||||||||||||||||||||||
Pre TSL IV | Mezzanine | $ | 446,867 | $ | 138,768 | $ | (308,099 | ) | Ca / CCC | 6 / - | 18,000 | 27.1 | 9,934 | 19.3 | 34.0 | ||||||||||||||||||||||||
Pre TSL V | Mezzanine | $ | - | - | - | Ba3 / D | 3 / - | 28,950 | 100 | None | N/A | N/A | |||||||||||||||||||||||||||
Pre TSL VII | Mezzanine | $ | - | 67,820 | 67,820 | Ca / C | 19 / - | 160,000 | 70.5 | None | N/A | N/A | |||||||||||||||||||||||||||
Pre TSL IX | B-1,B-3 | $ | 1,679,393 | 526,621 | (1,152,772 | ) | Ca / C | 49 / - | 136,510 | 30.3 | None | N/A | N/A | ||||||||||||||||||||||||||
Pre TSL XI | B-3 | $ | 1,124,565 | 407,500 | (717,065 | ) | Ca / C | 65 / - | 174,780 | 29.7 | None | N/A | N/A | ||||||||||||||||||||||||||
Pre TSL XV | B-1 | $ | - | 21,401 | 21,401 | C / C | 63 / 9 | 209,450 | 35.0 | None | N/A | N/A | |||||||||||||||||||||||||||
Pre TSL XVI | C | $ | - | - | - | Ca / C | 49 / 7 | 241,010 | 41.9 | None | N/A | N/A | |||||||||||||||||||||||||||
Pre TSL XVII | C | $ | - | - | - | Ca / C | 51 / 6 | 167,670 | 35.3 | None | N/A | N/A | |||||||||||||||||||||||||||
Pre TSL XVIII | C | $ | 285,444 | 10,721 | (274,723 | ) | Ca / C | 66 / 14 | 166,250 | 24.6 | None | N/A | 2.4 | ||||||||||||||||||||||||||
Pre TSL XIX | C | $ | 451,874 | 22,567 | (429,307 | ) | C / C | 60 / 14 | 172,400 | 24.6 | None | N/A | 3.3 | ||||||||||||||||||||||||||
Pre TSL XXIV | B-1 | $ | 481,591 | 34,681 | (446,910 | ) | Caa3 / CC | 80 / 13 | 394,800 | 37.6 | None | N/A | 6.3 | ||||||||||||||||||||||||||
Pre TSL XXV | C-1 | $ | - | - | - | C / C | 64 / 9 | 314,600 | 35.9 | None | N/A | N/A | |||||||||||||||||||||||||||
Pre TSL XXVII | B | $ | 2,403,546 | $ | 222,716 | $ | (2,180,830 | ) | Ca / CC | 42 / 7 | 88,300 | 27.1 | None | N/A | 21.2 | ||||||||||||||||||||||||
| $ | 6,873,280 | $ | 1,452,795 | $ | (5,420,485 | ) | |||||||||||||||||||||||||||||||||
(1) All ratings have been updated through December 31, 2010.
(2) Excess subordination represents the excess (if any) of the amount of performing collateral over the given class of bonds.
(3) Effective subordination represents the estimated percentage of the performing collateral that would need to defer or default at the next payment in order to trigger a loss of principal or interest. This differs from excess subordination in that it considers the effect of excess interest earned on the performing collateral.
63
For a further discussion on the fair value of the Company's financial instruments, see Note 12, "Fair Value of Financial Instruments".
Gross realized gains and losses on sales of available-for-sale securities, determined using specific identification of the securities were as follows:
2010 | 2009 | 2008 | ||||||||||
Gross realized gain | $ | 1,713 | $ | 84,989 | $ | 113,070 | ||||||
Gross realized loss | - | 74,294 | 87,642 | |||||||||
Net gain | $ | 1,713 | $ | 10,695 | $ | 25,428 | ||||||
| 4. | LOANS |
The classifications of loans at December 31, 2010 and 2009 are summarized as follows:
2010 | 2009 | |||||||
Commercial and industrial | $ | 85,129,274 | $ | 77,070,743 | ||||
Commercial real estate: | ||||||||
Non-owner occupied | 87,355,325 | 99,396,996 | ||||||
Owner occupied | 69,337,940 | 79,012,903 | ||||||
Construction | 12,500,834 | 11,078,435 | ||||||
Consumer: | ||||||||
Home equity installment | 40,089,001 | 48,176,530 | ||||||
Home equity line of credit | 29,185,099 | 21,851,428 | ||||||
Auto | 10,734,367 | 9,857,017 | ||||||
Other | 7,165,328 | 5,759,825 | ||||||
Residential: | ||||||||
Real estate | 68,159,514 | 70,958,261 | ||||||
Construction | 6,144,469 | 7,535,519 | ||||||
Total | 415,801,151 | 430,697,657 | ||||||
Less: | ||||||||
Allowance for loan losses | 7,897,822 | 7,573,603 | ||||||
Loans, net | $ | 407,903,329 | $ | 423,124,054 | ||||
Net deferred loan costs of $574,000 and $495,000 have been added to the carrying values of loans at December 31, 2010 and 2009, respectively.
The Company services real estate loans for investors in the secondary mortgage market which are not included in the accompanying consolidated balance sheets. The approximate amount of mortgages serviced amounted to $188,627,000 as of December 31, 2010 and $157,516,000 as of December 31, 2009.
The Company utilizes an external independent loan review firm that reviews and validates the credit risk program on at least an annual basis. Results of these reviews are presented to management and the Board of Directors. The loan review process complements and reinforces the risk identification and assessment decisions made by lenders and credit personnel, as well as the Company's policies and procedures.
As noted in Footnote 18, "Recent Accounting Pronouncements", in 2010 the Company adopted the new accounting guidance on disclosures about the credit quality of financing receivables and the allowance for credit losses. The new disclosure guidance significantly expanded the requirements for greater transparency into a company's exposure to credit losses from lending type arrangements. The objectives of the expanded disclosures are to provide information that will enable readers of financial statements to understand the nature of credit risk in a company's financing receivables, how that risk is analyzed in determining the related allowance for credit losses and changes to the allowance during the reporting period.
64
Non-accrual loans
The decision to place loans on non-accrual status is made on an individual basis after considering factors pertaining to each specific loan. Commercial and industrial and commercial real estate loans are placed on non-accrual status when management has determined that payment of all contractual principal and interest is in doubt or the loan is past due 90 days or more as to principal and interest, unless well-secured and in the process of collection. Consumer loans secured by real estate and residential mortgage loans are placed on non-accrual status at 120 days past due as to principal and interest and unsecured consumer loans are charged off when the loan is 90 days or more past due as to principal and interest.
Non-accrual loans, segregated by class, at December 31, 2010 were as follows:
2010 | ||||
Commercial and industrial | $ | 164,583 | ||
Commercial real estate: | ||||
Owner occupied | 2,768,036 | |||
Non-owner occupied | 2,000,333 | |||
Construction | - | |||
Consumer: | ||||
Home equity installment | 600,745 | |||
Home equity line of credit | 507,660 | |||
Auto | 14,000 | |||
Other | 13,467 | |||
Residential: | ||||
Real estate | 3,805,462 | |||
Construction | 94,389 | |||
Total | $ | 9,968,675 | ||
65
Past due loans
Loans are considered past due when the contractual principal and/or interest is not received by the due date. An aging analysis of past due loans, segregated by class of loans, as of December 31, 2010 is as follows:
Recorded | ||||||||||||||||||||||||||||
Past due | Total | investment past | ||||||||||||||||||||||||||
30 - 59 Days | 60 - 89 Days | 90 days | Total | financing | due ≥ 90 days | |||||||||||||||||||||||
2010 | past due | past due | or more * | past due | Current | receivables | and accruing | |||||||||||||||||||||
Commercial and industrial | $ | 15,407 | $ | 270,624 | $ | 262,306 | $ | 548,337 | $ | 84,580,937 | $ | 85,129,274 | $ | 97,723 | ||||||||||||||
Commercial real estate: | ||||||||||||||||||||||||||||
Owner occupied | 402,868 | 20,539 | 2,783,586 | 3,206,993 | 66,130,947 | 69,337,940 | 15,549 | |||||||||||||||||||||
Non-owner occupied | 56,093 | 17,275 | 2,000,333 | 2,073,701 | 85,281,624 | 87,355,325 | - | |||||||||||||||||||||
Construction | - | - | - | - | 12,500,834 | 12,500,834 | - | |||||||||||||||||||||
Consumer: | ||||||||||||||||||||||||||||
Home equity installment | 205,889 | 103,775 | 711,915 | 1,021,579 | 39,067,422 | 40,089,001 | 111,171 | |||||||||||||||||||||
Home equity line of credit | 6,552 | 44,634 | 507,660 | 558,846 | 28,626,253 | 29,185,099 | - | |||||||||||||||||||||
Auto | 235,193 | 92,131 | 15,617 | 342,941 | 10,391,426 | 10,734,367 | 1,617 | |||||||||||||||||||||
Other | 21,034 | 11,578 | 13,467 | 46,079 | 7,119,249 | 7,165,328 | - | |||||||||||||||||||||
Residential: | ||||||||||||||||||||||||||||
Real estate | - | 1,107,570 | 3,868,020 | 4,975,590 | 63,183,924 | 68,159,514 | 62,558 | |||||||||||||||||||||
Construction | - | - | 94,389 | 94,389 | 6,050,080 | 6,144,469 | - | |||||||||||||||||||||
Total | $ | 943,036 | $ | 1,668,126 | $ | 10,257,293 | $ | 12,868,455 | $ | 402,932,696 | $ | 415,801,151 | $ | 288,618 | ||||||||||||||
* Includes $9,969,000 of non-accrual loans.
Impaired loans
A loan is considered impaired when, based on current information and events, it is probable that the Company will be unable to collect the scheduled payments in accordance with the contractual terms of the loan. Factors considered in determining impairment include payment status, collateral value and the probability of collecting payments when due. The significance of payment delays and/or shortfalls is determined on a case by case basis. All circumstances surrounding the loan are taken into account. Such factors include the length of the delinquency, the underlying reasons and the borrower's prior payment record. Impairment is measured on these loans on a loan-by-loan basis. Impaired loans include non-accrual loans and other loans deemed to be impaired based on the aforementioned factors. Other than the non-accrual loans, there we no other impaired loans as of December 31, 2010. Payments received on non-accrual loans are recognized on a cash basis. Payments are first applied against the outstanding principal balance, then to the recovery of any charged-off amounts. Any excess is treated as a recovery of interest income.
66
Impaired loans, segregated by class, are detailed below, as of December 31, 2010:
Recorded | Recorded | Cash basis | ||||||||||||||||||||||||||||||
Unpaid | investment | investment | Total | Average | Interest | interest | ||||||||||||||||||||||||||
principal | with | with no | recorded | Related | recorded | income | income | |||||||||||||||||||||||||
balance | allowance | allowance | investment | allowance | investment | recognized | recognized | |||||||||||||||||||||||||
| 2010 | ||||||||||||||||||||||||||||||||
Commercial & industrial | $ | 811,545 | $ | - | $ | 164,583 | $ | 164,583 | $ | - | $ | 421,866 | $ | 8,402 | $ | 2,247 | ||||||||||||||||
Commercial real estate: | ||||||||||||||||||||||||||||||||
Owner occupied | 2,768,036 | 2,444,999 | 323,037 | 2,768,036 | 522,835 | 3,018,352 | 11,351 | 8,219 | ||||||||||||||||||||||||
Non-owner occupied | 2,698,937 | 24,325 | 1,976,008 | 2,000,333 | 5,670 | 4,200,877 | 12,147 | 8,990 | ||||||||||||||||||||||||
Construction | - | - | - | - | - | - | - | |||||||||||||||||||||||||
Consumer: | ||||||||||||||||||||||||||||||||
Home equity installment | 718,656 | 286,188 | 314,557 | 600,745 | 29,495 | 737,973 | 12,733 | 8,988 | ||||||||||||||||||||||||
Home equity line of credit | 507,660 | 167,891 | 339,769 | 507,660 | 86,963 | 515,470 | - | - | ||||||||||||||||||||||||
Auto | 14,000 | - | 14,000 | 14,000 | - | 14,000 | - | - | ||||||||||||||||||||||||
Other | 13,467 | - | 13,467 | 13,467 | - | 13,467 | - | - | ||||||||||||||||||||||||
Residential: | ||||||||||||||||||||||||||||||||
Real Estate | 3,805,462 | 2,442,732 | 1,362,730 | 3,805,462 | 351,643 | 3,926,599 | 16,082 | 9,240 | ||||||||||||||||||||||||
Construction | 94,389 | 94,389 | - | 94,389 | 11,121 | 94,489 | - | - | ||||||||||||||||||||||||
Total | $ | 11,432,152 | $ | 5,460,524 | $ | 4,508,151 | $ | 9,968,675 | $ | 1,007,727 | $ | 12,943,093 | $ | 60,715 | $ | 37,684 | ||||||||||||||||
Information related to impaired and past due loans as of December 31, 2009 is as follows:
Non-accrual loans | $ | 12,329,337 | ||
Other impaired loans | 20,312 | |||
Total impaired loans | $ | 12,349,649 | ||
Amount of impaired loans that have a specific allowance | $ | 5,635,548 | ||
Amount of impaired loans with no specific allowance | 6,714,101 | |||
Allowance for impaired loans | 793,267 | |||
Accruing loans that are contractually past due as to principal or interest: | ||||
Past due 90 days or more | 554,806 | |||
Past due 30-89 days | 5,173,394 | |||
During the year ended December 31: | ||||
Average investment in impaired loans | 7,951,402 | |||
Interest income recognized on impaired loans | 41,645 | |||
Interest income recognized on impaired loans (cash basis) | 31,495 |
Had non-accrual loans been performing in accordance with their original contract terms, the Company would have recognized interest income of approximately $221,000 in 2010 and $365,000 in 2009.
Credit Quality Indicators
Commercial and industrial and commercial real estate
The Company utilizes a loan grading system and assigns a credit risk grade to its loans in the commercial and commercial real estate portfolios. The grading system provides a means to measure portfolio quality and aids in the monitoring of the credit quality of the overall loan portfolio. The credit risk grades are arrived at using a risk rating matrix to assign a grade to each of the loans in the commercial and industrial and commercial real estate portfolios.
67
The following is a description of each risk rating category the Company uses to classify each of its commercial and industrial and commercial real estate loans:
Pass
Loans in this category have an acceptable level of risk and are graded in range of one to five. Secured loans generally have good collateral coverage. Current financial statements reflect acceptable balance sheet ratios, sales and earnings trends. Management is considered to be good, and there is some depth existing. Payment experience on the loans has been good with minor or no delinquency experience. Loans with a grade of one are of the highest quality in the range. Those graded five are of marginally acceptable quality.
Special Mention
Loans in this category are graded a six and may be protected but are potentially weak. They constitute a credit risk to the Company, but have not yet reached the point of adverse classification. Some of the following conditions may exist: little or no collateral coverage; lack of current financial information; delinquency problems; highly leveraged; available financial information reflects poor balance sheet ratios and profit and loss statements reflect uncertain trends; document exceptions. Loans in this category should not remain on the list for an inordinate period of time (no more than one year) and then the loan should be passed or classified appropriately. Cash flow may not be sufficient to support total debt service requirements.
Substandard
Loans in this category are graded a seven and have a well defined weakness which may jeopardize the ultimate collectability of the debt. The collateral pledged may be lacking in quality or quantity. Financial statements may indicate insufficient cash flow to service the debt; and/or do not reflect a sound net worth. The payment history indicates chronic delinquency problems. Management is considered to be weak. There is a distinct possibility that the Company may sustain a loss. All loans on non-accrual are rated substandard. Loans 90+ days past due unless otherwise fully supported should be classified substandard. Also, borrowers that are bankrupt are substandard.
Doubtful
Loans in this category are graded an eight and have a better than 50% possibility of the Bank sustaining a loss, but the loss cannot be determined because of specific reasonable factors which may strengthen credit in the near-term. Many of the weaknesses present in a substandard loan exist. Liquidation of collateral, if any, is likely. Any loan graded lower than an eight is considered to be uncollectible and charged-off.
Consumer
For the consumer lending portfolio, the Company utilizes payment activity, history and recency of payment. Therefore, the consumer loan segment is regarded as a homogeneous loan pool and as such is not risk rated. Non-performing loans are considered to be loans past due 90 days or more and accruing and non-accrual loans. All loans not classified as non-performing are considered performing.
Residential
For the residential lending portfolio, the Company utilizes payment activity, history and recency of payment. Therefore, the residential loan segment is regarded as a homogeneous loan pool and as such is not risk rated. Non-performing loans are considered to be loans past due 90 days or more and accruing and non-accrual loans. All loans not classified as non-performing are considered performing.
68
The following table presents loans, segregated by class, categorized into the appropriate credit quality indicator category as of December 31, 2010:
Commercial Credit Exposure
Credit Risk Profile by Creditworthiness Category
Commercial | CRE - owner | CRE - non-owner | CRE - | |||||||||||||
and industrial | occupied | occupied | construction | |||||||||||||
2010 | 2010 | 2010 | 2010 | |||||||||||||
Pass | $ | 82,041,657 | $ | 61,219,553 | $ | 81,139,543 | $ | 9,438,537 | ||||||||
Special Mention | 2,212,483 | 514,313 | 1,973,618 | 1,849,077 | ||||||||||||
Substandard | 875,134 | 7,604,074 | 4,242,164 | 1,213,220 | ||||||||||||
Doubtful | - | - | - | - | ||||||||||||
Total | $ | 85,129,274 | $ | 69,337,940 | $ | 87,355,325 | $ | 12,500,834 | ||||||||
Consumer Credit Exposure
Credit Risk Profile Based on Payment Activity
Home equity | Home equity | |||||||||||||||
installment | line of credit | Auto | Other | |||||||||||||
2010 | 2010 | 2010 | 2010 | |||||||||||||
Performing | $ | 39,377,086 | $ | 28,677,439 | $ | 10,718,750 | $ | 7,151,861 | ||||||||
Non-performing | 711,915 | 507,660 | 15,617 | 13,467 | ||||||||||||
Total | $ | 40,089,001 | $ | 29,185,099 | $ | 10,734,367 | $ | 7,165,328 | ||||||||
Mortgage lending Credit Exposure
Credit Risk Profile Based on Payment Activity
Residential | Residential | |||||||||||||||
real estate | construction |
|
| |||||||||||||
2010 | 2010 |
|
| |||||||||||||
Performing | $ | 64,291,494 | $ | 6,050,080 | ||||||||||||
Non-performing | 3,868,020 | 94,389 | ||||||||||||||
Total | $ | 68,159,514 | $ | 6,144,469 | ||||||||||||
Allowance for loan losses
Management continually evaluates the credit quality of the Company's loan portfolio and performs a formal review of the adequacy of the allowance for loan losses (the allowance) on a quarterly basis. The allowance reflects management's best estimate of the amount of credit losses in the loan portfolio. Management's judgment is based on the evaluation of individual loans, past experience, the assessment of current economic conditions and other relevant factors including the amounts and timing of cash flows expected to be received on impaired loans. Those estimates may be susceptible to significant change. Loan losses are charged directly against the allowance when loans are deemed to be uncollectible. Recoveries from previously charged-off loans are added to the allowance when received.
69
Management applies two primary components during the loan review process to determine proper allowance levels. The two components are a specific loan loss allocation for loans that are deemed impaired and a general loan loss allocation for those loans not specifically allocated. The methodology to analyze the adequacy of the allowance for loan losses is as follows:
| § | identification of specific impaired loans by loan category; |
| § | specific loans that could have potential loss; |
| § | calculation of specific allowances where required for the impaired loans based on collateral and other objective and quantifiable evidence; |
| § | determination of homogenous pools by loan category and eliminating the impaired loans; |
| § | application of historical loss percentages (two-year average) to pools to determine the allowance allocation; |
| § | application of qualitative factor adjustment percentages to historical losses for trends or changes in the loan portfolio. Qualitative factor adjustments include: |
| o | levels of and trends in delinquencies and non-accrual loans; |
| o | levels of and trends in charge-offs and recoveries; |
| o | trends in volume and terms of loans; |
| o | changes in risk selection and underwriting standards; |
| o | changes in lending policies, procedures and practices; |
| o | experience, ability and depth of lending management; |
| o | national and local economic trends and conditions; and |
| o | changes in credit concentrations. |
Allocation of the allowance for different categories of loans is based on the methodology as explained above. A key element of the methodology to determine the allowance is the Company's credit risk evaluation process, which includes credit risk grading of individual commercial and industrial and commercial real estate loans. Commercial and industrial and commercial real estate loans are assigned credit risk grades based on the Company's assessment of conditions that affect the borrower's ability to meet its contractual obligations under the loan agreement. That process includes reviewing borrowers' current financial information, historical payment experience, credit documentation, public information and other information specific to each individual borrower. Upon review, the commercial loan credit risk grade is revised or reaffirmed as the case may be. The credit risk grades may be changed at any time management feels an upgrade or downgrade may be warranted. The credit risk grades for the commercial and industrial and commercial real estate loan portfolios are taken into account in the reserve methodology and loss factors are applied based upon the credit risk grades. The loss factors applied are based upon the Company's historical experience as well as what we believe to be best practices and common industry standards. Historical experience reveals there is a direct correlation between the credit risk grades and loan charge-offs. The changes in allocations in the commercial and industrial and commercial real estate loan portfolio from period to period are based upon the credit risk grading system and from periodic reviews of the loan portfolio.
Each quarter, management performs an assessment of the allowance for loan losses. The Company's Special Assets Committee meets quarterly and the applicable lenders discuss each relationship under review and reach a consensus on the appropriate estimated loss amount based on current accounting guidance. The Special Assets Committee's focus is on ensuring the pertinent facts are considered and the reserve amounts pursuant to the accounting principles are reasonable. The assessment process includes the review of all loans on a non-accruing basis as well as a review of certain loans to which the lenders or the Company's Credit Administration function have assigned a criticized or classified risk rating.
The Company's policy is to charge off unsecured consumer loans when they become 90 days or more past due as to principal and interest. In the other portfolio segments, amounts are charged off at the point in time when the Company deems the balance to be uncollectible.
70
Information related to the change in the allowance for loan losses and the Company's recorded investment in loans by portfolio segment as of December 31, 2010 is as follows:
Commercial & | Commercial | Residential | ||||||||||||||||||||||
industrial | real estate | Consumer | real estate | Unallocated | Total | |||||||||||||||||||
Allowance for Loan Losses: | ||||||||||||||||||||||||
Beginning balance | $ | 1,406,102 | $ | 4,313,897 | $ | 1,252,826 | $ | 505,259 | $ | 95,519 | $ | 7,573,603 | ||||||||||||
Charge-offs | 451,979 | 892,426 | 462,815 | 1,813 | - | 1,809,033 | ||||||||||||||||||
Recoveries | 3,839 | 2,799 | 39,904 | 1,710 | - | 48,252 | ||||||||||||||||||
Provision | 409,569 | 814,002 | 419,391 | 357,498 | 84,540 | 2,085,000 | ||||||||||||||||||
Ending balance | $ | 1,367,531 | $ | 4,238,272 | $ | 1,249,306 | $ | 862,654 | $ | 180,059 | $ | 7,897,822 | ||||||||||||
Ending balance: individually evaluated for impairment | $ | - | $ | 528,505 | $ | 116,458 | $ | 362,764 | $ | 1,007,727 | ||||||||||||||
Ending balance: collectively evaluated for impairment | $ | 1,367,531 | $ | 3,709,767 | $ | 1,132,848 | $ | 499,890 | $ | 6,710,036 | ||||||||||||||
Loans Receivables: | ||||||||||||||||||||||||
Ending balance | $ | 85,129,274 | $ | 169,194,099 | $ | 87,173,795 | $ | 74,303,983 | $ | 415,801,151 | ||||||||||||||
Ending balance: individually evaluated for impairment | $ | 164,583 | $ | 4,768,369 | $ | 1,135,872 | $ | 3,899,851 | $ | 9,968,675 | ||||||||||||||
Ending balance: collectively evaluated for impairment | $ | 84,964,691 | $ | 164,425,730 | $ | 86,037,923 | $ | 70,404,132 | $ | 405,832,476 | ||||||||||||||
Information related to the changes in the allowance for loan losses as of December 31, 2009 is as follows:
Balance, beginning | $ | 4,745,234 | ||
Recoveries | 47,495 | |||
Provision for loan losses | 5,050,000 | |||
Losses charged to allowance | (2,269,126 | ) | ||
Balance, ending | $ | 7,573,603 |
5. | BANK PREMISES AND EQUIPMENT |
Components of bank premises and equipment at December 31, 2010 and 2009 are summarized as follows:
2010 | 2009 | |||||||
Land | $ | 2,072,048 | $ | 2,072,048 | ||||
Bank premises | 9,693,113 | 9,686,913 | ||||||
Furniture, fixtures and equipment | 9,806,148 | 10,228,790 | ||||||
Leasehold improvements | 5,089,959 | 4,836,002 | ||||||
Total | 26,661,268 | 26,823,753 | ||||||
Less accumulated depreciation and amortization | 11,897,395 | 11,461,943 | ||||||
Bank premises and equipment, net | $ | 14,763,873 | $ | 15,361,810 | ||||
71
Depreciation expense, which includes amortization of leasehold improvements, was $1,532,000, $1,557,000 and $1,362,000 for the years ended December 31, 2010, 2009 and 2008, respectively.
The Company leases its Green Ridge, West Pittston, Moosic, Kingston, Peckville, Clarks Summit and Eynon branches under the terms of operating leases. Rental expense was $310,000 in 2010, $401,000 in 2009 and $392,000 in 2008. During 2010 the Company entered into a new lease agreement with a new owner-landlord of its Eynon branch. Under the terms of the new operating lease, as defined by the accounting guidance, the terms contain an initial ten year period supplemented with four renewal options of five years each. The terms and rental payments under the new agreement are not materially different than the terms and rental payments under the original, terminated lease. As a result of the new lease agreement, the Company was required to reverse previously accrued and unpaid future rental obligations expensed in accordance with the current accounting guidance. The Company is unable to definitively assert whether it will remain in the Eynon branch beyond the initial ten year lease term and therefore, the four renewal options are excluded from the following table of future minimum rental payments at December 31, 2010:
Year ending December 31 | Amount | |||
2011 | $ | 357,295 | ||
2012 | 360,996 | |||
2013 | 337,755 | |||
2014 | 335,385 | |||
2015 | 336,690 | |||
2016 and thereafter | 2,889,128 | |||
Total | $ | 4,617,249 | ||
During 2009, the Company closed its Wyoming Ave., Scranton branch but continues to pay monthly lease payments under an operating lease agreement that expires in 2024. The Company continues to search for a tenant to fill the vacant space to help offset the rental cost.
6. | DEPOSITS |
At December 31, 2010, the scheduled maturities of certificates of deposit including certificates reciprocated in the Certificate of Deposit Account Registry Service (CDARS) program are as follows:
2011 | $ | 78,120,096 | 54.4 | % | ||||
2012 | 39,911,827 | 27.8 | ||||||
2013 | 10,864,373 | 7.6 | ||||||
2014 | 6,084,927 | 4.2 | ||||||
2015 | 6,887,046 | 4.8 | ||||||
2016 and thereafter | 1,782,453 | 1.2 | ||||||
| $ | 143,650,722 | 100.0 | % |
Excluding $11,876,000 of CDARS deposits, certificate of deposit accounts of $100,000 or more aggregated $51,340,000 and $54,941,000 at December 31, 2010 and 2009, respectively. Certificate of deposit accounts of $250,000 or more aggregated $19,120,000 and $20,641,000 at December 31, 2010 and 2009, respectively.
As of December 31, 2010, investment securities with a combined fair value of $81,015,000 and letters of credit with a notional value of $255,000 were available to be pledged as qualifying collateral to secure public deposits and trust funds. The Company required $14,289,000 of the qualifying collateral to secure such deposits at year-end and the balance of $66,726,000 was available for other pledging needs.
72
7. | SHORT-TERM BORROWINGS |
Short-term borrowings at December 31, 2010 and 2009 are as follows:
2010 | 2009 | |||||||
Overnight borrowings | $ | - | $ | 8,573,000 | ||||
Securities sold under repurchase agreements | 7,548,400 | 7,746,597 | ||||||
Demand note, U.S. Treasury | 1,000,000 | 213,510 | ||||||
Total | $ | 8,548,400 | $ | 16,533,107 | ||||
The maximum and average amounts of short-term borrowings outstanding and related interest rates for the years ended December 31, 2010, 2009 and 2008 are as follows:
Maximum | Weighted- | |||||||||||||||
outstanding | average | |||||||||||||||
at any | Average | rate during | Rate at | |||||||||||||
month end | outstanding | the year | year-end | |||||||||||||
2010 | ||||||||||||||||
Overnight borrowings | $ | - | $ | 107,745 | 0.17 | % | 0.00 | % | ||||||||
Repurchase agreements | 20,964,931 | 12,692,352 | 0.70 | 0.28 | ||||||||||||
Demand note, U.S. Treasury | 1,089,021 | 610,386 | 0.00 | 0.00 | ||||||||||||
FHLB Advance | 9,500,000 | 9,369,863 | 0.59 | 0.00 | ||||||||||||
Total | $ | 31,553,952 | $ | 22,780,346 | ||||||||||||
2009 | ||||||||||||||||
Overnight borrowings | $ | 29,133,000 | $ | 4,896,685 | 0.66 | % | 0.65 | % | ||||||||
Repurchase agreements | 10,130,515 | 8,743,015 | 0.32 | 0.30 | ||||||||||||
Demand note, U.S. Treasury | 985,663 | 525,807 | 0.00 | 0.00 | ||||||||||||
Total | $ | 40,249,178 | $ | 14,165,507 | ||||||||||||
2008 | ||||||||||||||||
Overnight borrowings | $ | 29,960,000 | $ | 12,314,584 | 2.13 | % | 0.62 | % | ||||||||
Repurchase agreements | 17,210,316 | 12,074,345 | 0.85 | 0.33 | ||||||||||||
Demand note, U.S. Treasury | 1,049,765 | 509,715 | 1.85 | 0.00 | ||||||||||||
Total | $ | 48,220,081 | $ | 24,898,644 | ||||||||||||
Overnight borrowings may include Fed funds purchased from correspondent banks and open repurchase agreements with the FHLB. Securities sold under agreements to repurchase (repurchase agreements) are non-insured interest-bearing liabilities that have a perfected security interest in qualified investment securities of the Company. Repurchase agreements are reflected at the amount of cash received in connection with the transaction. The carrying value of the underlying qualified investment securities was approximately $22,663,000 and $10,151,000 at December 31, 2010 and 2009, respectively. The Company may be required to provide additional collateral based on the fair value of the underlying securities. The U. S. Treasury demand note is generally repaid within 1 to 90 days.
At December 31, 2010, the Company had approximately $163,585,000 available to borrow from the FHLB, $21,000,000 from correspondent banks and approximately $24,322,000 that it could borrow at the Discount Window from the Federal Reserve Bank of Philadelphia. There were no outstanding borrowings from the Federal Reserve Bank Discount Window at December 31, 2010 or 2009.
73
8. | LONG-TERM DEBT |
Long-term debt consists of outstanding advances from the FHLB of $21,000,000 and $32,000,000 as of December 31, 2010 and 2009, respectively. These advances are secured by blanket liens on all real estate, commercial and industrial loans and mortgage-backed securities representing an interest in, or mortgages guaranteed by GNMA, FHLMC or FNMA with a combined weighted valuation for collateral purposes, of $171,408,000 as of September 30, 2010 that was in effect as of December 31, 2010.
At December 31, 2010, the maturities and weighted-average interest rates of long-term debt are as follows:
Year ending December 31, | Amount | Rate | ||||||
2013 | $ | 5,000,000 | 3.61 | % | ||||
2016 | 16,000,000 | 5.26 | ||||||
Total | $ | 21,000,000 | 4.87 | % | ||||
All of the long-term debt outstanding as of December 31, 2010 consisted of convertible select FHLB advances that have fixed interest rates but may adjust quarterly should market rates increase beyond the issues' original or strike rates. Significant prepayment penalties attached to the borrowings are a deterrent from paying off the high cost advances. However, in the event underlying market rates rise above the rates currently paid on these borrowings, the FHLB rate will convert to a floating rate and the Company has the option at that time to repay or to renegotiate the converted advance. During 2010, the Company paid off $11,000,000 of FHLB advances, all of which matured during 2010.
9. | STOCK PLANS |
The Company has two stock-based compensation plans (the stock option plans). The stock option plans were shareholder-approved and permit the grant of share-based compensation awards to its directors, key officers and certain other employees. The Company believes that these stock option plans better align the interest of its directors, key officers and employees with the interest of its shareholders. The Company further believes that the granting of share-based awards under the provisions of the stock option plans is necessary to retain the knowledge base, continuity and expertise of its directors, key officers and employees. In the stock option plans, directors, key officers and certain other employees are eligible to be awarded stock options to purchase the Company's common stock at the fair market value on the date of grant.
The Company established the 2000 Independent Directors Stock Option Plan (the Directors Plan) and reserved 55,000 shares of its un-issued capital stock for issuance to its directors. In the Directors Plan, no stock options were awarded during 2010, 2009 or 2008. As of December 31, 2010, there were 21,050 unexercised stock options outstanding under this plan.
The Company has also established the 2000 Stock Incentive Plan (the Incentive Plan) and reserved 55,000 shares of its un-issued capital stock for issuance to key officers and certain other employees. In the Incentive Plan, no stock options were awarded during 2010 or 2009 and 2,000 options were awarded in 2008. As of December 31, 2010, there were 5,930 unexercised stock options outstanding under this plan.
74
A summary of the status of the Company's stock option plans as of December 31, 2010, December 31, 2009 and December 31, 2008 and changes during the periods are presented in the following table:
Weighted- | ||||||||||||
Weighted- | average | |||||||||||
average | remaining | |||||||||||
exercise | contractual | |||||||||||
Options | price | term (yrs) | ||||||||||
Outstanding and exercisable, December 31, 2007 | 43,180 | $ | 30.69 | 6.8 | ||||||||
Granted | 2,000 | 26.90 | ||||||||||
Exercised | - | - | ||||||||||
Forfeited | (2,200 | ) | 31.85 | |||||||||
Outstanding and exercisable, December 31, 2008 | 42,980 | 30.46 | 6.1 | |||||||||
Granted | - | - | ||||||||||
Exercised | - | - | ||||||||||
Forfeited | (5,390 | ) | 31.61 | |||||||||
Outstanding and exercisable, December 31, 2009 | 37,590 | 30.29 | 5.6 | |||||||||
Granted | - | - | ||||||||||
Exercised | - | - | ||||||||||
Forfeited | (10,610 | ) | 30.82 | |||||||||
Outstanding, December 31, 2010 | 26,980 | $ | 30.08 | 5.2 | ||||||||
Exercisable, December 31, 2010 | 26,980 | $ | 30.08 | |||||||||
In the above table, the weighted-average exercise price includes options with exercise prices ranging from $26.05 to $36.59.
As of December 31, 2010, 2009 and 2008, no intrinsic value existed because the strike price of all outstanding stock options exceeded the market price of the Company's stock.
Under the stock option plans, options are granted with an exercise price equal to the market price of the Company's stock at the date of grant. The awards vest based on six months of continuous service from the date of grant and have 10-year contractual terms. Generally, all shares that are granted become fully vested.
The Company does not have stock options that are traded on organized capital exchanges. As such, the estimated fair value of options awarded under its stock option plans is determined using the Black-Scholes Option Pricing Valuation Model (the model). There were no options granted in 2010 or 2009. For the options granted in 2008, the model incorporated the following assumptions:
Expected volatility | 26.31 | % | ||
Expected dividend | 3.72 | % | ||
Risk-free interest rate | 2.77 | % | ||
Expected term | 5.25 | years | ||
The expected volatility was determined based on the daily five-year historical volatility of the Company's stock. Management believes the five-year historical volatility measurement closely resembles the fluctuation of its stock value under most economic conditions and cycles. Because of the relatively short vesting period, the model assumes that all options granted will fully vest. The risk-free rate is for the period within the expected term of the options based on the U.S. Treasury yield curve. The Company used the simplified method to determine the term in which options are expected to be outstanding. The Company does not have sufficient historical share option exercise experience upon which to estimate expected term and therefore used the simplified method.
Since the Company did not grant stock options in 2010 or 2009, there was no stock-based compensation expense recognized under the stock option plans. In 2008, the Company recorded stock-based compensation expense of $91,000 under the Director's Plan and $36,000 under the Incentive Plan. Most of the stock-based compensation expense recorded in 2008 was from grants awarded at the end of 2007. Stock-based compensation expense is a component of salaries and employee benefits in the consolidated income statements. There was no unrecognized stock-based compensation expense as of December 31, 2010 or 2009. The per share weighted-average fair value of 2000 options granted in 2008 amounted to $4.85. As of December 31, 2010, there were no unvested options.
75
In addition to the two stock option plans, the Company established the 2002 Employee Stock Purchase Plan (the ESPP) and has reserved 110,000 shares of its un-issued capital stock for issuance under the plan. The ESPP was designed to promote broad-based employee ownership of the Company's stock. Under the ESPP, employees use automatic payroll withholdings to purchase the Company's capital stock at a discounted price based on the fair market value of the capital stock on either the commencement date or termination date. At December 31, 2010, 17,025 shares have been issued under the ESPP. The ESPP is considered a compensatory plan and as such, is required to comply with the provisions of authoritative accounting guidance. The Company recognizes compensation expense on its ESPP on the date the shares are purchased. For the years ended December 31, 2010, 2009 and 2008, compensation expense related to the ESPP approximated $7,000, $5,000 and $3,000, respectively, and is included as a component of salaries and employee benefits in the consolidated statements of income.
The Company also established the dividend reinvestment plan (the DRP) for its shareholders. The DRP is designed to avail the Company's stock at no transactional cost to its shareholders. Cash dividends paid to shareholders who are enrolled in the DRP plus voluntary cash deposits received are used to purchase shares either directly from the Company, from shares that become available in the open market or from the Company's previously acquired treasury stock. The Company has reserved 300,000 shares of its un-issued capital stock for issuance under the DRP. Until further notice and action of the Company's Board of Directors, additional shares of stock purchased directly from the Company through the DRP are issued at 90% of fair value as of the investment date. As of December 31, 2010, there were 132,939 shares available for future issuance.
10. | INCOME TAXES |
Pursuant to the accounting guidelines related to income taxes, the Company has evaluated its material tax positions as of December 31, 2010 and 2009. Under the "more-likely-than-not" threshold guidelines, the Company believes no significant uncertain tax positions exist, either individually or in the aggregate, that would give rise to the non-recognition of an existing tax benefit. In periods subsequent to December 31, 2010, determinations of potentially adverse material tax positions will be evaluated to determine whether an uncertain tax position may have previously existed or has been originated. In the event an adverse tax position is determined to exist, penalty and interest will be accrued, in accordance with the Internal Revenue Service guidelines, and will be recorded as a component of other expenses in the Company's consolidated statements of income.
As of December 31, 2010, there were no unrecognized tax benefits that, if recognized, would significantly affect the Company's effective tax rate. Also, as of December 31, 2010, there were no penalties and interest recognized in the consolidated statements of income as a result of management's evaluation of whether an uncertain tax position may exist nor does the Company foresee a change in its material tax positions that would give rise to the non-recognition of an existing tax benefit during the forthcoming twelve months. Tax returns filed with the Internal Revenue Service are subject to review by law under a three-year statute of limitations. The Company has not received notification from the IRS regarding adverse tax issues from tax returns filed for tax years 2010, 2009 or 2008.
76
The following temporary differences gave rise to the deferred tax asset (liability) at December 31, 2010 and 2009:
2010 | 2009 | |||||||
Deferred tax assets: | ||||||||
Other-than-temporary impairment on available-for-sale securities | $ | 5,113,696 | $ | 1,089,484 | ||||
Allowance for loan losses | 2,685,259 | 2,575,024 | ||||||
Unrealized losses on available-for-sale securities | 1,966,412 | 4,736,506 | ||||||
Deferred interest from non-accrual assets | 531,627 | 463,780 | ||||||
Stock-based compensation | 45,905 | 45,905 | ||||||
Retirement settlement reserve | 15,435 | 57,861 | ||||||
Other | 169,844 | 208,537 | ||||||
Total | 10,528,178 | 9,177,097 | ||||||
Deferred tax liabilities: | ||||||||
Depreciation | (679,478 | ) | (466,933 | ) | ||||
Loan fees and costs | (560,501 | ) | (603,736 | ) | ||||
Other | (314,759 | ) | (307,284 | ) | ||||
Total | (1,554,738 | ) | (1,377,953 | ) | ||||
Deferred tax asset, net | $ | 8,973,440 | $ | 7,799,144 | ||||
The (credit) provision for income taxes for the years ended December 31 are as follows:
2010 | 2009 | 2008 | ||||||||||
Current | $ | 1,566,421 | $ | 158,719 | $ | 1,071,912 | ||||||
Deferred | (4,122,790 | ) | (1,776,033 | ) | (2,941 | ) | ||||||
Total (credit) provision for income taxes | $ | (2,556,369 | ) | $ | (1,617,314 | ) | $ | 1,068,971 | ||||
The reconciliation between the expected statutory income tax and the actual (credit) provision for income taxes is as follows:
2010 | 2009 | 2008 | ||||||||||
Expected (credit) provision at the statutory rate | $ | (1,958,660 | ) | $ | (1,025,956 | ) | $ | 1,599,672 | ||||
Tax-exempt income | (544,507 | ) | (511,488 | ) | (371,360 | ) | ||||||
Nondeductible interest expense | 30,829 | 45,713 | 41,542 | |||||||||
Bank owned life insurance | (104,642 | ) | (105,186 | ) | (108,501 | ) | ||||||
Nondeductible other expenses and other, net | 20,611 | 25,409 | 25,319 | |||||||||
Low income housing credits | - | (45,806 | ) | (117,701 | ) | |||||||
Actual (credit) provision for income taxes | $ | (2,556,369 | ) | $ | (1,617,314 | ) | $ | 1,068,971 | ||||
11. | RETIREMENT PLAN |
The Company has a defined contribution profit sharing 401(k) plan covering substantially all of its employees. The plan is subject to the provisions of the Employee Retirement Income Security Act of 1974 (ERISA). Contributions to the plan approximated $304,000 in 2010, $357,000 in 2009 and $351,000 in 2008.
77
12. | FAIR VALUE OF FINANCIAL INSTRUMENTS |
The following table represents the carrying amount and estimated fair value of the Company's financial instruments as of December 31 (dollars in thousands):
2010 | 2009 | |||||||||||||||
Carrying | Estimated | Carrying | Estimated | |||||||||||||
amount | fair value | amount | fair value | |||||||||||||
Financial assets: | ||||||||||||||||
Cash and cash equivalents | $ | 22,967 | $ | 22,967 | $ | 8,328 | $ | 8,328 | ||||||||
Held-to-maturity securities | 490 | 538 | 709 | 765 | ||||||||||||
Available-for-sale securities | 82,941 | 82,941 | 75,821 | 75,821 | ||||||||||||
FHLB Stock | 4,542 | 4,542 | 4,781 | 4,781 | ||||||||||||
Loans and leases | 407,903 | 402,174 | 423,124 | 420,908 | ||||||||||||
Loans held-for-sale | 213 | 217 | 1,221 | 1,233 | ||||||||||||
Accrued interest | 2,228 | 2,228 | 2,251 | 2,251 | ||||||||||||
Financial liabilities: | ||||||||||||||||
Deposit liabilities | 482,448 | 478,721 | 458,994 | 453,264 | ||||||||||||
Short-term borrowings | 8,548 | 8,548 | 16,533 | 16,533 | ||||||||||||
Long-term debt | 21,000 | 23,956 | 32,000 | 35,017 | ||||||||||||
Accrued interest | 440 | 440 | 665 | 665 | ||||||||||||
The accounting guidelines establish a framework for measuring and disclosing information about fair value measurements. The guidelines of fair value reporting instituted a valuation hierarchy for disclosure of the inputs used to measure fair value. This hierarchy prioritizes the inputs into three broad levels as follows:
Level 1 inputs are quoted prices (unadjusted) in active markets for identical assets or liabilities;
Level 2 inputs are quoted prices for similar assets and liabilities in active markets; quoted prices for identical or similar assets or liabilities in markets that are not active; or inputs that are observable for the asset or liability, either directly or indirectly through market corroboration, for substantially the full term of the financial instrument;
Level 3 inputs are unobservable inputs based on our own assumptions to measure assets and liabilities at fair value. Level 3 pricing for securities may also include unobservable inputs based upon broker-traded transactions. A financial asset or liability's classification within the hierarchy is determined based on the lowest level input that is significant to the fair value measurement.
The Company uses fair value to measure certain assets and, if necessary, liabilities on a recurring basis when fair value is the primary measure for accounting. Thus, the Company uses fair value for AFS securities. Fair value is used on a non-recurring basis to measure certain assets when adjusting carrying values to market values, such as impaired loans.
78
The following tables illustrate the financial instruments measured at fair value on a recurring basis segregated by hierarchy fair value levels as of December 31, 2010 and December 31, 2009 (dollars in thousands):
Fair value measurements at December 31, 2010 | ||||||||||||||||
Quoted prices | ||||||||||||||||
in active | Significant other | Significant other | ||||||||||||||
Total carrying value | markets | observable inputs | unobservable inputs | |||||||||||||
at December 31, 2010 | (Level 1) | (Level 2) | (Level 3) | |||||||||||||
Available-for-sale securities: | ||||||||||||||||
Agency - GSE | $ | 16,288 | $ | - | $ | 16,288 | $ | - | ||||||||
Obligations of states and political subdivisions | 24,171 | - | 24,171 | - | ||||||||||||
Corporate bonds: | ||||||||||||||||
Pooled trust preferred securities | 1,453 | - | - | 1,453 | ||||||||||||
MBS - GSE residential | 40,553 | - | 40,553 | - | ||||||||||||
Equity securities - financial services | 476 | 476 | - | - | ||||||||||||
Total available-for-sale securities | $ | 82,941 | $ | 476 | $ | 81,012 | $ | 1,453 | ||||||||
Fair value measurements at December 31, 2009 | ||||||||||||||||
Quoted prices | ||||||||||||||||
in active | Significant other | Significant other | ||||||||||||||
Total carrying value | markets | observable inputs | unobservable inputs | |||||||||||||
at December 31, 2009 | (Level 1) | (Level 2) | (Level 3) | |||||||||||||
Available-for-sale securities: | ||||||||||||||||
Agency - GSE | $ | 33,132 | $ | - | $ | 33,132 | $ | - | ||||||||
Obligations of states and political subdivisions | 23,270 | - | 23,270 | - | ||||||||||||
Corporate bonds: | ||||||||||||||||
Pooled trust preferred securities | 5,242 | - | 5,242 | |||||||||||||
MBS - GSE residential | 13,748 | - | 13,748 | - | ||||||||||||
Equity securities - financial services | 429 | 429 | - | - | ||||||||||||
Total available-for-sale securities | $ | 75,821 | $ | 429 | $ | 70,150 | $ | 5,242 | ||||||||
Equity securities in the AFS portfolio are measured at fair value using quoted market prices for identical assets and are classified within Level 1 of the valuation hierarchy. Other than the Company's investment in corporate bonds, consisting of pooled trust preferred securities, all other debt securities in the AFS portfolio are measured at fair value using market quotations provided by a third-party vendor, who is a provider of financial market data, analytics and related services to financial institutions. Assets classified as Level 2 use valuation techniques that are common to bond valuations. That is, in active markets whereby bonds of similar characteristics frequently trade, quotes for similar assets are obtained. For the twelve months ended December 31, 2010, there were no transfers to and from Level 1 and Level 2 fair value measurements for financial assets measured on a recurring basis.
The Company's pooled trust preferred securities include both observable and unobservable inputs to determine fair value and, therefore, are considered Level 3 inputs. In 2009, the accounting guidance related to fair value measurement was further expanded and provides guidance on estimating fair value when the volume and level of activity for an asset or liability have significantly decreased in relation to normal market activity such as is the case with the Company's investment in pooled trust preferred securities. The requirements of fair value measurement also call for additional disclosures on fair value measurements and provide additional guidance on circumstances that may indicate that a transaction is not orderly.
For a further discussion on the fair value determination of the Company's investment in pooled trust preferred securities, see Note 3, "Investment Securities".
79
The following table illustrates the changes in Level 3 financial instruments measured at fair value on a recurring basis for the years ended December 31, 2010 and December 31, 2009 (dollars in thousands):
As of and for the | As of and for the | |||||||
twelve months ended | twelve months ended | |||||||
December 31, 2010 | December 31, 2009 | |||||||
Balance at beginning of period | $ | 5,242 | $ | 10,260 | ||||
Realized/unrealized gains (losses): | ||||||||
In earnings | (11,836 | ) | (3,300 | ) | ||||
In comprehensive income | 8,133 | (2,397 | ) | |||||
Purchases, sales, issuances and settlements, amortization, and accretion, net | (86 | ) | 679 | |||||
Balance at end of period | $ | 1,453 | $ | 5,242 | ||||
The following table illustrates the financial instruments measured at fair value on a non-recurring basis segregated by hierarchy fair value levels (dollars in thousands):
Fair value measurement at December 31, 2010 | ||||||||||||||||
Quoted prices in | Significant other | Significant other | ||||||||||||||
Total carrying value | active markets | observable inputs | unobservable inputs | |||||||||||||
at December 31, 2010 | (Level 1) | (Level 2) | (Level 3) | |||||||||||||
Impaired loans | $ | 4,453 | $ | - | $ | 4,387 | $ | 66 | ||||||||
Other real estate owned | 1,261 | - | 1,053 | 208 | ||||||||||||
Total | $ | 5,714 | $ | - | $ | 5,440 | $ | 274 | ||||||||
Fair value measurement at December 31, 2009 | ||||||||||||||||
Quoted prices in | Significant other | Significant other | ||||||||||||||
Total carrying value | active markets | observable inputs | unobservable inputs | |||||||||||||
at December 31, 2009 | (Level 1) | (Level 2) | (Level 3) | |||||||||||||
Impaired loans | $ | 4,842 | $ | 15 | $ | 4,447 | $ | 380 | ||||||||
Other real estate owned | 887 | - | 337 | 550 | ||||||||||||
Total | $ | 5,729 | $ | 15 | $ | 4,784 | $ | 930 | ||||||||
Impaired loans that are collateral dependent are written down to fair value through the establishment of specific reserves. Techniques used to value the collateral that secures the impaired loan include: quoted market prices for identical assets classified as Level 1 inputs; for Level 2, observable inputs, employed by certified appraisers for similar assets are utilized if the loan is collateral-dependent and then discounted based upon the type and/or age of the appraisal, the costs to sell and maintain the underlying collateral. If the loan is not considered to be collateral dependent, any impairment may be determined based upon the present value of the reported cash flows discounted at the loan's effective interest rate. In cases where valuation techniques included inputs that are unobservable, the valuations are based on commonly used and generally accepted industry liquidation advance rates or estimates and assumptions developed by management, with significant adjustments applied to the best information available under each circumstance. These asset valuations are classified as Level 3 inputs. A net reduction or transfer out of the impaired loans with Level 2 inputs occurred during the twelve month period ended December 31, 2010 based upon payments received. There were no significant transfers during the year in the Level 1 and Level 3 impaired loans.
Other real estate owned (ORE) is carried at its fair value. The technique used to value the ORE is similar to the valuation of impaired loans, however, Level 1 inputs do not apply to ORE as there is no readily available quoted market price for such assets. Level 2 observable inputs, employed by certified appraisers for similar assets are utilized; and are then discounted based upon type and/or age of the appraisal, the costs to sell and to maintain the property. In cases were the valuation techniques after considering the appraisal, included inputs that are unobservable, the valuations are based on estimates and assumptions developed by management, with the additional adjustments applied based upon the best information available in each case. These asset valuations are classified as Level 3 inputs.
80
Financial Instruments with Off-Balance Sheet Risk
The Company is a party to financial instruments with off-balance sheet risk in the normal course of business to meet the financing needs of its customers. These financial instruments include commitments to extend credit and standby letters of credit. Those instruments involve, to varying degrees, elements of credit risk in excess of the amount recognized in the balance sheet. The contract or notional amounts of those instruments reflect the extent of the Company's involvement in particular classes of financial instruments. Because of the nature of these instruments, the fair value of these off-balance sheet items are not material.
As of December 31, 2010 and 2009, the notional amount of the Company's financial instruments with off-balance sheet risk were as follows (dollars in thousands):
2010 | 2009 | |||||||
Off-balance sheet financial instruments: | ||||||||
Commitments to extend credit | $ | 78,765 | $ | 79,365 | ||||
Standby letters of credit | 8,743 | 9,046 | ||||||
Commitments to Extend Credit and Standby Letters of Credit
The Company's exposure to credit loss from nonperformance by the other party to the financial instruments for commitments to extend credit and standby letters of credit is represented by the contractual amount of those instruments. The Company uses the same credit policies in making commitments and conditional obligations as it does for on-balance sheet instruments.
Commitments to extend credit are legally binding agreements to lend to customers. Commitments generally have fixed expiration dates or other termination clauses and may require payment of fees. Since commitments may expire without being drawn upon, the total commitment amounts do not necessarily represent future liquidity requirements. The Company evaluates each customer's credit-worthiness on a case-by-case basis. The amount of collateral obtained, if considered necessary by the Company on extension of credit, is based on management's credit assessment of the customer.
Financial standby letters of credit are conditional commitments issued by the Company to guarantee performance of a customer to a third party. Those guarantees are issued primarily to support public and private borrowing arrangements, including commercial paper, bond financing, and similar transactions. The Company's performance under the guarantee is required upon presentation by the beneficiary of the financial standby letter of credit. The credit risk involved in issuing letters of credit is essentially the same as that involved in extending loan facilities to customers. The Company was not required to recognize any liability in connection with the issuance of these financial standby letters of credit.
The following table summarizes outstanding financial letters of credit as of December 31, 2010 (dollars in thousands):
More than | ||||||||||||||||
Less than | one year to | Over five | ||||||||||||||
one year | five years | years | Total | |||||||||||||
Secured by: | ||||||||||||||||
Collateral | $ | 1,981 | $ | 5,000 | $ | 720 | $ | 7,701 | ||||||||
Bank lines of credit | 684 | 240 | - | 924 | ||||||||||||
| 2,665 | 5,240 | 720 | 8,625 | |||||||||||||
Unsecured | 118 | - | - | 118 | ||||||||||||
Total | $ | 2,783 | $ | 5,240 | $ | 720 | $ | 8,743 | ||||||||
The Company has not incurred losses on its commitments in 2010, 2009 or 2008.
81
13. | EARNINGS PER SHARE |
Basic earnings (loss) per share (EPS) is computed by dividing income (loss) available to common shareholders by the weighted-average number of common shares outstanding for the period. Diluted EPS is computed in the same manner as basic EPS but reflects the potential dilution that could occur if stock options to issue additional common stock were exercised, which would then result in additional stock outstanding to share in or dilute the earnings of the Company. The Company maintains two share-based compensation plans that may generate additional potentially dilutive common shares. Generally, dilution would occur if Company-issued stock options were exercised and converted into common stock. There were no potentially dilutive shares outstanding as of December 31, 2010 and 2009 and there were 20 potentially dilutive shares outstanding as of December 31, 2008.
In the computation of diluted EPS, the Company uses the treasury stock method to determine the dilutive effect of its granted but unexercised stock options. Under this method, the assumed proceeds received from shares issued, in a hypothetical stock option exercise, are assumed to be used to purchase treasury stock. Pursuant to the accounting guidance for earnings per share, proceeds include: proceeds from the exercise of outstanding stock options; compensation cost for future service that the Company has not yet recognized; and any "windfall" tax benefits that would be credited directly to shareholders' equity when the grant generates a tax deduction (or a reduction in proceeds if there is a charge to equity). For a further discussion on the Company's stock plans, see Note 9, "Stock Plans", above.
The following data illustrates the data used in computing earnings per share and the effects on income and the weighted-average number of shares of potentially dilutive common stock for the years ended December 31, 2010, 2009 and 2008:
2010 | 2009 | 2008 | ||||||||||
Basic EPS: | ||||||||||||
Net (loss) income available to common shareholders | $ | (3,204,394 | ) | $ | (1,400,205 | ) | $ | 3,635,948 | ||||
Weighted-average common shares outstanding | 2,141,323 | 2,080,507 | 2,068,851 | |||||||||
Basic EPS | $ | (1.50 | ) | $ | (0.67 | ) | $ | 1.76 | ||||
Diluted EPS: | ||||||||||||
Net (loss) income available to common shareholders | $ | (3,204,394 | ) | $ | (1,400,205 | ) | $ | 3,635,948 | ||||
Weighted-average common shares outstanding | 2,141,323 | 2,080,507 | 2,068,851 | |||||||||
Diluted potential common shares | - | - | 20 | |||||||||
Weighted-average common shares and dilutive potential shares outstanding | 2,141,323 | 2,080,507 | 2,068,871 | |||||||||
Diluted EPS | $ | (1.50 | ) | $ | (0.67 | ) | $ | 1.76 | ||||
14. | REGULATORY MATTERS |
The Company (on a consolidated basis) and the Bank are subject to various regulatory capital requirements administered by the federal banking agencies. Failure to meet minimum capital requirements can initiate certain mandatory and possible additional discretionary actions by regulators that, if undertaken, could have a direct material effect on the Company's and the Bank's financial statements. Under capital adequacy guidelines and the regulatory framework for prompt corrective action, the Company and the Bank must meet specific capital guidelines that involve quantitative measures of their assets, liabilities and certain off-balance-sheet items as calculated under regulatory accounting practices. The capital amounts and classification are also subject to qualitative judgments by the regulators about components, risk-weightings and other factors. Prompt corrective action provisions are not applicable to bank holding companies.
82
Under these guidelines, assets and certain off-balance sheet items are assigned to broad risk categories, each with appropriate weights. The resulting capital ratios represent capital as a percentage of total risk-weighted assets. For the Company in 2010 and 2009, the appropriate risk-weighting pursuant to regulatory guidelines, required a gross-up in the risk-weighting of securities that were rated below investment grade, thus significantly inflating the total risk-weighted assets. This requirement had an adverse impact on the total capital and Tier I capital ratios in both 2010 and 2009. The guidelines require all banks and bank holding companies to maintain a minimum ratio of total risk-based capital to total risk-weighted assets (Total Risk Adjusted Capital) of 8%, including Tier I capital to total risk-weighted assets (Tier I Capital) of 4% and Tier I capital to average total assets (Leverage Ratio) of at least 4%. As of December 31, 2010 and 2009, the Company and the Bank exceeded all capital adequacy requirements to which it was subject.
To be categorized as well capitalized, the Company and the Bank must maintain minimum total risk-based, Tier I risk-based and Tier I leverage ratios as set forth in the following table. The Company's and the Bank's actual capital amounts and ratios are also presented in the table. No amounts were deducted from capital for interest-rate risk in either 2010 or 2009.
| To be well capitalized under prompt corrective action provisions | ||||||||||||||||||
| For capital adequacy purposes | ||||||||||||||||||
Actual | ||||||||||||||||||
Amount | Ratio | Amount | Ratio | Amount | Ratio | |||||||||||||
|
| |||||||||||||||||
As of December 31, 2010: |
|
| ||||||||||||||||
|
| |||||||||||||||||
Total capital (to risk-weighted assets) |
|
| ||||||||||||||||
Consolidated | $ | 54,155,010 | 11.9 % |
| ≥ $ 36,515,705 | ≥ 8.0 % | N/A | N/A | ||||||||||
Bank | $ | 53,809,582 | 11.8 % |
| ≥ $ 36,505,618 | ≥ 8.0 % | ≥ $ 45,632,022 | ≥ 10.0 % | ||||||||||
| ||||||||||||||||||
Tier I capital (to risk-weighted assets) |
| |||||||||||||||||
Consolidated | $ | 48,350,724 | 10.6 % |
| ≥ $ 18,257,852 | ≥ 4.0 % | N/A | N/A | ||||||||||
Bank | $ | 48,077,518 | 10.5 % |
| ≥ $ 18,252,809 | ≥ 4.0 % | ≥ $ 27,379,213 | ≥ 6.0 % | ||||||||||
| ||||||||||||||||||
Tier I capital (to average assets) |
| |||||||||||||||||
Consolidated | $ | 48,350,724 | 8.2 % |
| ≥ $ 23,601,194 | ≥ 4.0 % | N/A | N/A | ||||||||||
Bank | $ | 48,077,518 | 8.2 % |
| ≥ $ 23,584,273 | ≥ 4.0 % | ≥ $ 29,480,341 | ≥ 5.0 % | ||||||||||
| ||||||||||||||||||
As of December 31, 2009: |
| |||||||||||||||||
| ||||||||||||||||||
Total capital (to risk-weighted assets) |
| |||||||||||||||||
Consolidated | $ | 61,568,720 | 11.4 % |
| ≥ $ 43,085,677 | ≥ 8.0 % | N/A | N/A | ||||||||||
Bank | $ | 61,170,729 | 11.4 % |
| ≥ $ 43,075,958 | ≥ 8.0 % | ≥ $ 53,844,947 | ≥ 10.0 % | ||||||||||
| ||||||||||||||||||
Tier I capital (to risk-weighted assets) |
| |||||||||||||||||
Consolidated | $ | 54,778,019 | 10.2 % |
| ≥ $ 21,542,839 | ≥ 4.0 % | N/A | N/A | ||||||||||
Bank | $ | 54,429,494 | 10.1 % |
| ≥ $ 21,537,979 | ≥ 4.0 % | ≥ $ 32,306,968 | ≥ 6.0 % | ||||||||||
| ||||||||||||||||||
Tier I capital (to average assets) |
| |||||||||||||||||
Consolidated | $ | 54,778,019 | 9.8 % |
| ≥ $ 22,380,403 | ≥ 4.0 % | N/A | N/A | ||||||||||
Bank | $ | 54,429,494 | 9.7 % |
| ≥ $ 22,363,361 | ≥ 4.0 % | ≥ $ 27,954,202 | ≥ 5.0 % | ||||||||||
The Bank can pay dividends to the Company equal to the Bank's retained earnings which approximated $41,476,000 at December 31, 2010. However, such dividends are limited due to the capital requirements discussed above.
15. | RELATED PARTY TRANSACTIONS |
During the ordinary course of business, loans are made to executive officers, directors, greater than 5% shareholders and associates of such persons. These transactions are executed on substantially the same terms and at the rates prevailing at the time for comparable transactions with others. These loans do not involve more than the normal risk of collectability or present other unfavorable features. A summary of loan activity with officers, directors, associates of such persons and shareholders who own more than 5% of the Company's outstanding shares is as follows:
83
2010 | 2009 | 2008 | ||||||||||
Balance, beginning | $ | 6,828,855 | $ | 8,053,604 | $ | 7,665,710 | ||||||
Additions | 1,029,803 | 531,239 | 1,696,194 | |||||||||
Collections | (5,716,139 | ) | (1,755,988 | ) | (1,308,300 | ) | ||||||
Balance, ending | $ | 2,142,519 | $ | 6,828,855 | $ | 8,053,604 | ||||||
Aggregate loans to directors and associates exceeding 2.5% of shareholders' equity included in the table above are as follows:
2010 | 2009 | 2008 | ||||||||||
Number of persons | 1 | 2 | 2 | |||||||||
Balance, beginning | $ | 6,605,116 | $ | 7,578,162 | $ | 7,196,079 | ||||||
Additions | 705,528 | 106,044 | 1,090,044 | |||||||||
Collections | (5,445,077 | ) | (1,079,090 | ) | (707,961 | ) | ||||||
Balance, ending | $ | 1,865,567 | $ | 6,605,116 | $ | 7,578,162 | ||||||
As of December 31, 2010, 2009 and 2008, deposits from executive officers, directors and associates of such persons approximated $8,471,000, $6,919,000 and $9,000,000, respectively.
16. QUARTERLY FINANCIAL INFORMATION (UNAUDITED)
The following is a summary of quarterly results of operations for the years ended December 31, 2010, 2009 and 2008 (dollars in thousands, except per share data):
First | Second | Third | Fourth | |||||||||||||||||
quarter | quarter | quarter | quarter | Total | ||||||||||||||||
2010 | ||||||||||||||||||||
Interest income | $ | 7,041 | $ | 6,970 | $ | 6,954 | $ | 6,615 | $ | 27,580 | ||||||||||
Interest expense | (1,882 | ) | (1,753 | ) | (1,681 | ) | (1,511 | ) | (6,827 | ) | ||||||||||
Net interest income | 5,159 | 5,217 | 5,273 | 5,104 | 20,753 | |||||||||||||||
Provision for loan losses | (575 | ) | (300 | ) | (375 | ) | (835 | ) | (2,085 | ) | ||||||||||
Gain on sale of investment securities | - | - | - | 2 | 2 | |||||||||||||||
Other-than-temporary impairment | (79 | ) | (676 | ) | (1,749 | ) | (9,332 | ) | (11,836 | ) | ||||||||||
Other income | 1,225 | 1,316 | 1,479 | 1,404 | 5,424 | |||||||||||||||
Other expenses | (5,105 | ) | (4,694 | ) | (4,318 | ) | (3,901 | ) | (18,018 | ) | ||||||||||
Income (loss) before taxes | 625 | 863 | 310 | (7,558 | ) | (5,760 | ) | |||||||||||||
(Provision) credit for income taxes | (69 | ) | (144 | ) | 45 | 2,724 | 2,556 | |||||||||||||
Net income (loss) | $ | 556 | $ | 719 | $ | 355 | $ | (4,834 | ) | $ | (3,204 | ) | ||||||||
Net income (loss) per share | $ | 0.26 | $ | 0.34 | $ | 0.16 | $ | (2.26 | ) | $ | (1.50 | ) | ||||||||
84
First | Second | Third | Fourth | |||||||||||||||||
quarter | quarter | quarter | quarter | Total | ||||||||||||||||
2009 | ||||||||||||||||||||
Interest income | $ | 7,827 | $ | 7,456 | $ | 7,454 | $ | 7,173 | $ | 29,910 | ||||||||||
Interest expense | (3,002 | ) | (2,715 | ) | (3,033 | ) | (2,047 | ) | (10,797 | ) | ||||||||||
Net interest income | 4,825 | 4,741 | 4,421 | 5,126 | 19,113 | |||||||||||||||
Provision for loan losses | (425 | ) | (300 | ) | (3,125 | ) | (1,200 | ) | (5,050 | ) | ||||||||||
Gain on sale of investment securities | - | - | - | 11 | 11 | |||||||||||||||
Other-than-temporary impairment | (326 | ) | (1 | ) | (2,432 | ) | (542 | ) | (3,301 | ) | ||||||||||
Other income | 1,639 | 1,459 | 1,139 | 1,213 | 5,450 | |||||||||||||||
Other expenses | (4,662 | ) | (4,739 | ) | (5,109 | ) | (4,731 | ) | (19,241 | ) | ||||||||||
Income (loss) before taxes | 1,051 | 1,160 | (5,106 | ) | (123 | ) | (3,018 | ) | ||||||||||||
(Provision) credit for income taxes | (226 | ) | (248 | ) | 1,895 | 197 | 1,618 | |||||||||||||
Net income (loss) | $ | 825 | $ | 912 | $ | (3,211 | ) | $ | 74 | $ | (1,400 | ) | ||||||||
Net income (loss) per share | $ | 0.40 | $ | 0.44 | $ | (1.55 | ) | $ | 0.04 | $ | (0.67 | ) | ||||||||
First | Second | Third | Fourth | |||||||||||||||||
quarter | quarter | quarter | quarter | Total | ||||||||||||||||
2008 | ||||||||||||||||||||
Interest income | $ | 8,745 | $ | 8,613 | $ | 8,419 | $ | 8,184 | $ | 33,961 | ||||||||||
Interest expense | (4,198 | ) | (3,670 | ) | (3,540 | ) | (3,276 | ) | (14,684 | ) | ||||||||||
Net interest income | 4,547 | 4,943 | 4,879 | 4,908 | 19,277 | |||||||||||||||
Provision for loan losses | - | (125 | ) | (130 | ) | (685 | ) | (940 | ) | |||||||||||
Gain on sale of investment securities | 1 | 7 | 17 | - | 25 | |||||||||||||||
Other-than-temporary impairment | - | - | (403 | ) | (33 | ) | (436 | ) | ||||||||||||
Other income | 1,295 | 1,259 | 1,231 | 1,204 | 4,989 | |||||||||||||||
Other expenses | (4,393 | ) | (4,445 | ) | (4,673 | ) | (4,699 | ) | (18,210 | ) | ||||||||||
Income before taxes | 1,450 | 1,639 | 921 | 695 | 4,705 | |||||||||||||||
Provision for income taxes | (361 | ) | (435 | ) | (180 | ) | (93 | ) | (1,069 | ) | ||||||||||
Net income | $ | 1,089 | $ | 1,204 | $ | 741 | $ | 602 | $ | 3,636 | ||||||||||
Net income per share | $ | 0.52 | $ | 0.59 | $ | 0.35 | $ | 0.30 | $ | 1.76 | ||||||||||
17. | CONTINGENCIES |
The nature of the Company's business generates litigation involving matters arising in the ordinary course of business. However, in the opinion of management of the Company after consulting with the Company's legal counsel, no legal proceedings are pending, which, if determined adversely to the Company or the Bank, would have a material effect on the Company's shareholders' equity or results of operations. No legal proceedings are pending other than ordinary routine litigation incident to the business of the Company and the Bank. In addition, to management's knowledge, no government authorities have initiated or contemplated any material legal actions against the Company or the Bank.
85
18. | RECENT ACCOUNTING PRONOUNCEMENTS |
In 2010, the Financial Accounting Standards Board (FASB) issued and the Company adopted the new accounting guidance on disclosures about the credit quality of financing receivables and the allowance for credit losses. The new disclosure guidance significantly expanded the existing requirements for greater transparency into a company's exposure to credit losses from lending type arrangements. The objectives of the expanded disclosures are to provide information that will enable readers of financial statements to understand the nature of credit risk in a company's financing receivables, how that risk is analyzed in determining the related allowance for credit losses and changes to the allowance during the reporting period. The new guidance applies to all companies. The extensive new disclosures of information as of the end of a reporting period will become effective for interim and annual reporting periods ending after December 15, 2010 for public companies, such as the Company. Specific items regarding activity that occurred before the issuance of the new guidance, such as the allowance roll forward and modification disclosures will be required for periods beginning after December 15, 2010 for public companies. The adoption of the new accounting guidance did not have a material impact on the Company's consolidated financial statements.
In 2010, FASB issued and the Company adopted the new accounting guidance related to the transfers and servicing of financial assets. The standard eliminates the concept of qualifying special purpose entities, provides guidance as to when a portion of a transferred financial asset should be evaluated for sale accounting, provides additional guidance with regard to accounting for transfers of financial assets and requires additional disclosures. The adoption of the new accounting guidance did not have a material impact on the Company's consolidated financial statements.
In 2010, FASB issued and the Company adopted the amended accounting guidance related to fair value measurements which entails new disclosures and clarifies disclosure requirements about fair value measurement as set forth in previous guidance. The objective is to improve these disclosures and, thus, increase the transparency in financial reporting. Specifically, an entity is required to disclose separately the amounts of significant transfers in and out of Level 1 and Level 2 fair value measurements and describe the reasons for the transfers; and in the reconciliation for fair value measurements using significant unobservable inputs, a reporting entity should present separately information about purchases, sales, issuances, and settlements. The amended guidance also clarifies the requirements of the following disclosures: for purposes of reporting fair value measurement for each class of assets and liabilities, a reporting entity needs to use judgment in determining the appropriate classes of assets and liabilities; and a reporting entity should provide disclosures about the valuation techniques and inputs used to measure fair value for both recurring and non-recurring fair value measurements. The new guidance became effective for interim and annual reporting periods beginning after December 15, 2009, except for the disclosures about purchases, sales, issuances, and settlements in the roll forward of activity in Level 3 fair value measurements. Those disclosures will become effective for fiscal years beginning after December 15, 2010, and for interim periods within those fiscal years.
In 2011, the Company will adopt the new accounting guidance update related to the disclosures about troubled debt restructurings (TDRs). The amendments in this update temporarily delay the effective date of the disclosures for public entities. Under the existing effective date in this update, public-entity creditors, such as the Company, would have provided disclosures about TDRs for periods beginning on or after December 15, 2010. The delay is intended to allow the FASB time to complete its deliberations on what constitutes a TDR. The effective date of the new disclosures about TDRs for public entities and the guidance for determining what constitutes a TDR will then be coordinated. Currently, that guidance is anticipated to be effective for interim and annual periods ending after June 15, 2011. The adoption of this update is not expected to have a material impact on the Company's consolidated financial statements.
86
19. | PARENT COMPANY ONLY |
The following is the condensed financial information for Fidelity D & D Bancorp, Inc. on a parent company only basis (dollars in thousands):
Condensed Balance Sheets | December 31, | |||||||
2010 | 2009 | |||||||
Assets: | ||||||||
Cash | $ | 2 | $ | 47 | ||||
Investment in subsidiary | 46,356 | 45,256 | ||||||
Securities available-for-sale | 476 | 429 | ||||||
Other assets | 13 | 10 | ||||||
Total | $ | 46,847 | $ | 45,742 | ||||
Liabilities and shareholders' equity: | ||||||||
Liabilities | $ | 73 | $ | 67 | ||||
Shareholders' equity | 46,774 | 45,675 | ||||||
Total | $ | 46,847 | $ | 45,742 | ||||
Condensed Income Statements | Years ended December 31, | |||||||||||
2010 | 2009 | 2008 | ||||||||||
Income: | ||||||||||||
Equity in undistributed (loss) earnings of subsidiary | $ | (4,246 | ) | $ | (2,684 | ) | $ | 1,337 | ||||
Dividends from subsidiary | 1,206 | 1,439 | 2,580 | |||||||||
Other income | 17 | 19 | 16 | |||||||||
Total (loss) income | (3,023 | ) | (1,226 | ) | 3,933 | |||||||
Operating expenses | 268 | 258 | 446 | |||||||||
(Loss) income before taxes | (3,291 | ) | (1,484 | ) | 3,487 | |||||||
Credit for income taxes | 87 | 84 | 149 | |||||||||
Net (loss) income | $ | (3,204 | ) | $ | (1,400 | ) | $ | 3,636 | ||||
87
Condensed Statements of Cash Flows | Years ended December 31, | |||||||||||
2010 | 2009 | 2008 | ||||||||||
Cash flows from operating activities: | ||||||||||||
Net (loss) income | $ | (3,204 | ) | $ | (1,400 | ) | $ | 3,636 | ||||
Adjustments to reconcile net (loss) income to net cash used in operations: | ||||||||||||
Equity in earnings of subsidiary | 3,040 | 1,245 | (3,917 | ) | ||||||||
Stock-based compensation expense | 7 | 5 | 129 | |||||||||
Deferred income tax benefit | - | - | (43 | ) | ||||||||
Changes in other assets and liabilities, net | (14 | ) | 27 | (17 | ) | |||||||
Net cash used in operating activities | (171 | ) | (123 | ) | (212 | ) | ||||||
Cash flows provided by investing activities: | ||||||||||||
Dividends received from subsidiary | 1,207 | 1,439 | 2,580 | |||||||||
Net cash provided by investing activities | 1,207 | 1,439 | 2,580 | |||||||||
Cash flows from financing activities: | ||||||||||||
Dividends paid, net of dividend reinvestment | (1,453 | ) | (1,255 | ) | (1,995 | ) | ||||||
Cash contributions from dividend reinvestment plan | 305 | - | - | |||||||||
Purchase of treasury stock | - | (57 | ) | (430 | ) | |||||||
Withholdings to purchase capital stock | 67 | 41 | 57 | |||||||||
Net cash used in financing activities | (1,081 | ) | (1,271 | ) | (2,368 | ) | ||||||
Net (decrease) increase in cash | (45 | ) | 45 | - | ||||||||
Cash, beginning | 47 | 2 | 2 | |||||||||
Cash, ending | $ | 2 | $ | 47 | $ | 2 | ||||||
88
Item 9: | CHANGES IN AND DISAGREEMENTS WITH ACCOUNTANTS ON ACCOUNTING AND FINANCIAL DISCLOSURE |
None.
Item 9A(T): | CONTROLS AND PROCEDURES |
As of the end of the period covered by this Annual Report on Form 10-K, an evaluation was carried out by the Company's management, with the participation of its President and Chief Executive Officer and the Chief Financial Officer, of the effectiveness of the Company's disclosure controls and procedures, as defined in Rule 13a-15(e) under the Securities Exchange Act of 1934. Based on such evaluation, the President and Chief Executive Officer and the Chief Financial Officer concluded that the Company's disclosure controls and procedures are designed to ensure that information required to be disclosed in the reports the Company files or furnishes under the Securities Exchange Act of 1934 is recorded, processed, summarized and reported within the time periods specified in the SEC's rules and regulations, and are effective. The Company made no changes in its internal controls over financial reporting or in other factors that materially affected, or are reasonably likely to materially affect, these controls during the last fiscal quarter ended December 31, 2010.
In July 2010, President Obama signed into law the Dodd-Frank Wall Street Reform and Consumer Protection Act, which in part, provides smaller companies and debt-only issuers with a permanent exemption from the Sarbanes-Oxley internal control audit requirements. Without this exemption, these companies would have been required to comply with the internal control audit requirements for fiscal years ended on or after June 15, 2010. The permanent exemption applies to entities that are commonly referred to as non-accelerated filers and smaller reporting companies, such as the Company. Generally speaking, a non-accelerated filer and a smaller reporting company have public float, or market capitalization of less than $75.0 million. The permanent exemption applies only to the Sarbanes-Oxley internal control audit requirements. Non-accelerated filers and smaller reporting companies are still required to disclose management's assessment of the effectiveness of internal control over financial reporting.
Management's Report on Internal Control Over Financial Reporting
Management of the Company is responsible for establishing and maintaining adequate internal control over financial reporting. The Company's internal control over financial reporting is a process designed under the supervision of the Company's President and Chief Executive Officer and the Chief Financial Officer, and implemented in conjunction with management and other personnel, to provide reasonable assurance regarding the reliability of financial reporting and the preparation of the Company's consolidated financial statements for external purposes in accordance with generally accepted accounting principles.
There are inherent limitations in the effectiveness of any internal control, including the possibility of human error and the circumvention or overriding of controls. Accordingly, even effective internal control can provide only reasonable assurance with respect to financial statement preparation. Further, because of changes in conditions, the effectiveness of internal control may vary over time.
Management assessed the effectiveness of the Company's internal control over financial reporting as of December 31, 2010. This assessment was based on criteria for effective internal control over financial reporting described in "Internal Control – Integrated Framework," issued by the Committee of Sponsoring Organizations of the Treadway Commission (COSO). Based on this assessment, management determined that, as of December 31, 2010, the Company maintained effective internal control over financial reporting.
This annual report does not include an attestation report of the Company's registered public accounting firm regarding internal control over financial reporting. Management's report was not subject to attestation by the Company's registered public accounting firm pursuant to rules of the SEC that permit the Company to provide only management's report in this annual report.
Item 9B: | OTHER INFORMATION |
None.
89
PART III
Item 10: | DIRECTORS, EXECUTIVE OFFICERS AND CORPORATE GOVERNANCE |
The information required in this item is incorporated by reference herein, to the information presented in the Company's definitive Proxy Statement for its 2011 Annual Meeting of Shareholders to be filed with the SEC.
Section 16(a) Beneficial Ownership Reporting Compliance
The information required in this item is incorporated by reference herein, to the information presented in the Company's definitive Proxy Statement for its 2011 Annual Meeting of Shareholders to be filed with the SEC.
Code of Ethics
Pursuant to Item 406 of Regulation S-K, the Company adopted a written code of ethics that applies to our directors, officers and employees, including our chief executive officer and chief financial officer, which is available on our website at http://www.bankatfidelity.com through the Investor Relations link and then under the headings "Other Information", "Governance Documents." In addition, copies of our code of ethics will be provided to shareholders upon written request to Fidelity D & D Bancorp, Inc., Blakely and Drinker Streets, Dunmore, PA 18512 at no charge.
Item 11: | EXECUTIVE COMPENSATION |
The information required in this item is incorporated by reference herein, to the information presented in the Company's definitive Proxy Statement for its 2011 annual meeting of shareholders to be filed with the SEC.
Item 12: | SECURITY OWNERSHIP OF CERTAIN BENEFICIAL OWNERS AND MANAGEMENT AND RELATED STOCKHOLDER MATTERS |
The information required in this item is incorporated by reference herein, to the information presented in the Company's definitive Proxy Statement for its 2011 annual meeting of shareholders to be filed with the SEC.
Item 13: | CERTAIN RELATIONSHIPS AND RELATED TRANSACTIONS, AND DIRECTOR INDEPENDENCE |
The information required in this item is set forth in Footnote No. 15 "Related Party Transactions", of Part II, Item 8 "Financial Statements and Supplementary Data", and with Item 407(a) is incorporated by reference herein to the information presented in the Company's definitive Proxy Statement for its 2011 annual meeting of shareholders to be filed with the SEC.
Item 14: | PRINCIPAL ACCOUNTANT FEES AND SERVICES |
The information required by this item is incorporated by reference herein, to the information presented in the Company's definitive Proxy Statement for its 2011 annual meeting of shareholders to be filed with the SEC.
PART IV
Item 15: | EXHIBITS AND FINANCIAL STATEMENT SCHEDULES |
(a) (1) Financial Statements - The following financial statements are included by reference in Part II, Item 8 hereof:
Report of Independent Registered Public Accounting Firm
Consolidated Balance Sheets
Consolidated Statements of Income
Consolidated Statements of Changes in Shareholders' Equity
Consolidated Statements of Cash Flows
Notes to Consolidated Financial Statements
(2) Financial Statement Schedules
Financial Statement Schedules are omitted because the required information is either not applicable, the data is not significant or the required information is shown in the respective financial statements or in the notes thereto or elsewhere herein.
90
(3) Exhibits
The following exhibits are filed herewith or incorporated by reference as a part of this Form 10-K:
3(i) Amended and Restated Articles of Incorporation of Registrant. Incorporated by reference to Annex B of the Proxy Statement/Prospectus included in Registrant's Amendment 4 to its Registration Statement No. 333-90273 on Form S-4, filed with the SEC on April 6, 2000.
3(ii) Amended and Restated Bylaws of Registrant. Incorporated by reference to Exhibit 3(ii) to Registrant's Form 8-K filed with the SEC on November 21, 2007.
* 10.1 1998 Independent Directors Stock Option Plan of The Fidelity Deposit and Discount Bank, as assumed by Registrant. Incorporated by reference to Exhibit 10.1 to Registrant's Registration Statement No. 333-90273 on Form S-4, filed with the SEC on November 3, 1999.
*10.2 1998 Stock Incentive Plan of The Fidelity Deposit and Discount Bank, as assumed by Registrant. Incorporated by reference to Exhibit 10.2 of Registrant's Registration Statement No. 333-90273 on Form S-4, filed with the SEC on November 3, 1999.
* 10.3 Registrant's 2000 Dividend Reinvestment Plan. Incorporated by reference to Exhibit 4 to Registrant's Registration Statement No. 333-45668 on Form S-1, filed with the SEC on September 12, 2000 and as amended by Pre-Effective Amendment No. 1 on October 11, 2000, by Post-Effective Amendment No. 1 on May 30, 2001, by Post-Effective Amendment No. 2 on July 7, 2005, by Registration Statement No. 333-152806 on Form S-3 filed on August 6, 2008 and by Post-Effective Amendment No. 1 on January 25, 2010.
* 10.4 Registrant's 2000 Independent Directors Stock Option Plan. Incorporated by reference to Exhibit 4.3 to Registrant's Registration Statement No. 333-64356 on Form S-8 filed with the SEC on July 2, 2001.
* 10.5 Amendment, dated October 2, 2007, to the Registrant's 2000 Independent Directors Stock Option Plan. Incorporated by reference to Exhibit 10.2 to Registrant's Form 8-K filed with the SEC on October 4, 2007.
* 10.6 Registrant's 2000 Stock Incentive Plan. Incorporated by reference to Exhibit 4.4 to Registrant's Registration Statement No. 333-64356 on Form S-8 filed with the SEC on July 2, 2001.
* 10.7 Amendment, dated October 2, 2007, to the Registrant's 2000 Stock Incentive Plan. Incorporated by reference to Exhibit 10.1 to Registrant's Form 8-K filed with the SEC on October 4, 2007.
* 10.8 Registrant's 2002 Employee Stock Purchase Plan. Incorporated by reference to Exhibit 4.4 to Registrant's Registration Statement No. 333-113339 on Form S-8 filed with the SEC on March 5, 2004.
* 10.9 Change of Control Agreements with Salvatore R. DeFrancesco, Registrant and The Fidelity Deposit and Discount Bank, dated March 21, 2006. Incorporated by reference to Exhibit 99.2 to Registrant's Current Report on Form 8-K filed with the SEC on March 27, 2006.
* 10.10 Executive Employment Agreement between Fidelity D & D Bancorp, Inc., The Fidelity Deposit and Discount Bank and Timothy P. O'Brien, dated January 3, 2008. Incorporated by reference to Exhibit 10.1 to Registrant's Current Report on Form 8-K filed with the SEC on January 10, 2008.
* 10.11 Executive Employment Agreement between Fidelity D & D Bancorp, Inc., The Fidelity Deposit and Discount Bank and Daniel J. Santaniello, dated February 28, 2008. Incorporated by reference to Exhibit 10.1 to Registrant's Current Report on Form 8-K filed with the SEC on March 3, 2008.
11 Statement regarding computation of earnings per share. Included herein in Note 13 "Earnings per Share", contained within the notes to consolidated financial statements, and incorporated herein by reference.
12 Statement regarding computation of ratios. Included herein in Item 6, "Selected Financial Data."
13 Annual Report to Shareholders. Incorporated by reference to the 2011 Annual Report to Shareholders filed with the SEC on Form ARS.
14 Code of Ethics. Incorporated by reference to the 2003 Annual Report to Shareholders on Form 10-K filed with the SEC on March 29, 2004.
91
21 Subsidiaries of the Registrant.
23 Consent of Independent Registered Public Accounting Firm.
31.1 Rule 13a-14(a) Certification of Principal Executive Officer, filed herewith.
31.2 Rule 13a-14(a) Certification of Principal Financial Officer, filed herewith.
32.1 Certification of Principal Executive Officer pursuant to 18 U.S.C. Section 1350, as adopted pursuant to Section 906 of the Sarbanes-Oxley Act of 2002, filed herewith.
32.2 Certification of Principal Financial Officer pursuant to 18 U.S.C. Section 1350, as adopted pursuant to Section 906 of the Sarbanes-Oxley Act of 2002, filed herewith.
| (b) | The exhibits required to be filed by this Item are listed under Item 15(a) 3, above. |
| (c) | Not applicable. |
* Management contract or compensatory plan or arrangement.
92
SIGNATURES
Pursuant to the requirements of Section 13 or 15(d) of the Securities and Exchange Act of 1934, the registrant has duly caused this report to be signed on its behalf by the undersigned, thereunto duly authorized.
FIDELITY D & D BANCORP, INC. | ||
(Registrant) | ||
Date: March 29, 2011 | By: | /s / Daniel J. Santaniello |
Daniel J. Santaniello, | ||
President and Chief Executive Officer | ||
Date: March 29, 2011 | By: | /s/ Salvatore R. DeFrancesco, Jr. |
Salvatore R. DeFrancesco, Jr., | ||
Treasurer and Chief Financial Officer | ||
Pursuant to the requirements of the Securities and Exchange Act of 1934, this report has been signed below by the following person on behalf of the registrant and in the capacities and on the dates indicated.
DATE | |||
By: | /s/ D aniel J. Santaniello | March 29, 2011 | |
Daniel J. Santaniello, President and Chief | |||
Executive Officer | |||
By: | /s/ Salvatore R. DeFrancesco, Jr. | March 29, 2011 | |
Salvatore R. DeFrancesco, Jr., Treasurer | |||
and Chief Financial Officer | |||
By: | /s/ Patrick J. Dempsey | March 29, 2011 | |
Patrick J. Dempsey, Chairman of the | |||
Board of Directors and Director | |||
By: | /s/ John T. Cognetti | March 29, 2011 | |
John T. Cognetti, Secretary and Director | |||
By: | /s/ Michael J. McDonald | March 29, 2011 | |
Michael J. McDonald, Vice Chairman | |||
of the Board of Directors and Director | |||
By: | /s/ David L. Tressler | March 29, 2011 | |
David L. Tressler, Director | |||
By: | /s/ Mary E. Mcdonald | March 29, 2011 | |
Mary E. McDonald, Assistant Secretary and Director | |||
By: | /s/ Brian J. Cali | March 29, 2011 | |
Brian J. Cali, Director | |||
93
Exhibit Index | Page | |
3(i) Amended and Restated Articles of Incorporation of Registrant. Incorporated by reference to Annex B of the Proxy Statement/Prospectus included in Registrant's Amendment 4 to its Registration Statement No. 333-90273 on Form S-4, filed with the SEC on April 6, 2000. | * | |
3(ii) Amended and Restated Bylaws of Registrant. Incorporated by reference to Exhibit 3(ii) to Registrant's Form 8-K filed with the SEC on November 21, 2007. | * | |
10.1 1998 Independent Directors Stock Option Plan of The Fidelity Deposit and Discount Bank, as assumed by Registrant. Incorporated by reference to Exhibit 10.1 to Registrant's Registration Statement No. 333-90273 on Form S-4, filed with the SEC on November 3, 1999. | * | |
10.2 1998 Stock Incentive Plan of The Fidelity Deposit and Discount Bank, as assumed by Registrant. Incorporated by reference to Exhibit 10.2 of Registrant's Registration Statement No. 333-90273 on Form S-4, filed with the SEC on November 3, 1999. | * | |
10.3 Registrant's 2000 Dividend Reinvestment Plan. Incorporated by reference to Exhibit 4 to Registrant's Registration Statement No. 333-45668 on Form S-1, filed with the SEC on September 12, 2000 and as amended by Pre-Effective Amendment No. 1 on October 11, 2000, by Post-Effective Amendment No. 1 on May 30, 2001, by Post-Effective Amendment No. 2 on July 7, 2005 and by Registration Statement No. 333-152806 on Form S-3 filed on August 6, 2008 and by Post-Effective Amendment No. 1 on January 25, 2010. | * | |
10.4 Registrant's 2000 Independent Directors Stock Option Plan. Incorporated by reference to Exhibit 4.3 to Registrant's Registration Statement No. 333-64356 on Form S-8 filed with the SEC on July 2, 2001. | * | |
10.5 Amendment, dated October 2, 2007, to the Registrant's 2000 Independent Directors Stock Option Plan. Incorporated by reference to Exhibit 10.2 to Registrant's Form 8-K filed with the SEC on October 4, 2007. | * | |
10.6 Registrant's 2000 Stock Incentive Plan. Incorporated by reference to Exhibit 4.4 to Registrant's Registration Statement No. 333-64356 on Form S-8 filed with the SEC on July 2, 2001. | * | |
10.7 Amendment, dated October 2, 2007, to the Registrant's 2000 Stock Incentive Plan. Incorporated by reference to Exhibit 10.1 to Registrant's Form 8-K filed with the SEC on October 4, 2007. | * | |
10.8 Registrant's 2002 Employee Stock Purchase Plan. Incorporated by reference to Exhibit 4.5 to Registrant's Registration Statement No. 333-113339 on Form S-8 filed with the SEC on March 5, 2004. | * | |
10.9 Change of Control Agreements with Salvatore R. DeFrancesco, Registrant and The Fidelity Deposit and Discount Bank, dated March 21, 2006. Incorporated by reference to Exhibit 99.2 to Registrant's Current Report on Form 8-K filed with the SEC on March 27, 2006. | * | |
10.10 Executive Employment Agreement between Fidelity D & D Bancorp, Inc., The Fidelity Deposit and Discount Bank and Timothy P. O'Brien, dated January 3, 2008. Incorporated by reference to Exhibit 10.1 to Registrant's Current Report on Form 8-K filed with the SEC on January 10, 2008. | * | |
10.11 Executive Employment Agreement between Fidelity D & D Bancorp, Inc., The Fidelity Deposit and Discount Bank and Daniel J. Santaniello, dated February 28, 2008. Incorporated by reference to Exhibit 10.1 to Registrant's Current Report on Form 8-K filed with the SEC on March 3, 2008. | * |
94
11 Statement regarding computation of earnings per share. Included herein Note 13, "Earnings per Share", contained within the Notes to Consolidated Financial Statements, and incorporated herein by reference. | 82 | |
12 Statement regarding computation of ratios. Included herein in Item 6, "Selected Financial Data". | 14 | |
13 Annual Report to Shareholders. Incorporated by reference to the 2009 Annual Report to Shareholders filed with the SEC on Form ARS. | * | |
14 Code of Ethics. Incorporated by reference to the 2003 Annual Report to Shareholders on Form 10-K filed with the SEC on March 29, 2004. | * | |
21 Subsidiaries of the Registrant. | 96 | |
23 Consent of Independent Registered Public Accounting Firm. | 97 | |
31.1 Rule 13a-14(a) Certification of Principal Executive Officer. | 98 | |
31.2 Rule 13a-14(a) Certification of Principal Financial Officer. | 99 | |
32.1 Certification of Principal Executive Officer pursuant to 18 U.S.C. Section 1350, as adopted pursuant to Section 906 of the Sarbanes-Oxley Act of 2002. | 100 | |
32.2 Certification of Principal Financial Officer pursuant to 18 U.S.C. Section 1350, as adopted pursuant to Section 906 of the Sarbanes-Oxley Act of 2002. | 100 |
*Incorporated by Reference
95