UNITED STATES | ||
SECURITIES AND EXCHANGE COMMISSION | ||
Washington, D.C. 20549 | ||
| ||
FORM 10-Q | ||
| ||
(Mark One) | ||
[X] QUARTERLY REPORT PURSUANT TO SECTION 13 OR 15(d) OF THE SECURITIES EXCHANGE ACT OF 1934 | ||
For the quarterly period ended March 31, 2018 | ||
OR | ||
[ ] TRANSITION REPORT PURSUANT TO SECTION 13 OR 15(d) OF THE SECURITIES EXCHANGE ACT OF 1934 | ||
For the transition period from |
| to |
Commission File Number: 001-11307-01 | ||
Freeport-McMoRan Inc.
(Exact name of registrant as specified in its charter)
Delaware | 74-2480931 |
(State or other jurisdiction of | (I.R.S. Employer Identification No.) |
incorporation or organization) |
|
|
|
333 North Central Avenue |
|
Phoenix, AZ | 85004-2189 |
(Address of principal executive offices) | (Zip Code) |
(602) 366-8100 | |
(Registrant's telephone number, including area code) | |
|
|
Indicate by check mark whether the registrant (1) has filed all reports required to be filed by Section 13 or 15(d) of the Securities Exchange Act of 1934 during the preceding 12 months (or for such shorter period that the registrant was required to file such reports), and (2) has been subject to such filing requirements for the past 90 days.
☑ Yes o No
Indicate by check mark whether the registrant has submitted electronically and posted on its corporate website, if any, every Interactive Data File required to be submitted and posted pursuant to Rule 405 of Regulation S-T (§ 232.405 of this chapter) during the preceding 12 months (or for such shorter period that the registrant was required to submit and post such files).
☑ Yes o No
Indicate by check mark whether the registrant is a large accelerated filer, an accelerated filer, a non-accelerated filer, smaller reporting company, or an emerging growth company. See the definitions of "large accelerated filer," "accelerated filer," "smaller reporting company," and "emerging growth company" in Rule 12b-2 of the Exchange Act.
Large accelerated filer ☑ |
|
| Accelerated filer ¨ |
Non-accelerated filer ¨ (Do not check if a smaller reporting company) | Smaller reporting company ¨ | ||
Emerging growth company ¨ |
|
| |
If an emerging growth company, indicate by check mark if the registrant has elected not to use the extended transition period for complying with any new or revised financial accounting standards provided pursuant to Section 13(a) of the Exchange Act. ¨
Indicate by check mark whether the registrant is a shell company (as defined in Rule 12b-2 of the Exchange Act).
o Yes ☑ No
On April 30, 2018 , there were issued and outstanding 1,448,794,207 shares of the registrant's common stock, par value $0.10 per share.
FREEPORT-McMoRan INC.
TABLE OF CONTENTS
|
|
| Page |
|
|
Part I. Financial Information | 3 |
|
|
Item 1. Financial Statements: | 3 |
|
|
Consolidated Balance Sheets (Unaudited) | 3 |
|
|
Consolidated Statements of Income (Unaudited) | 4 |
|
|
Consolidated Statements of Comprehensive Income (Unaudited) | 5 |
|
|
Consolidated Statements of Cash Flows (Unaudited) | 6 |
|
|
Consolidated Statement of Equity (Unaudited) | 7 |
|
|
Notes to Consolidated Financial Statements (Unaudited) | 8 |
|
|
Report of Independent Registered Public Accounting Firm | 29 |
|
|
Item 2. Management's Discussion and Analysis of Financial Condition and Results of Operations | 30 |
|
|
Item 3. Quantitative and Qualitative Disclosures About Market Risk | 59 |
|
|
Item 4. Controls and Procedures | 59 |
|
|
Part II. Other Information | 59 |
|
|
Item 1. Legal Proceedings | 59 |
|
|
Item 1A. Risk Factors | 60 |
|
|
Item 2. Unregistered Sales of Equity Securities and Use of Proceeds | 60 |
|
|
Item 4. Mine Safety Disclosures | 60 |
|
|
Item 6. Exhibits | 61 |
|
|
Signature | S-1 |
|
|
2
Table of Contents
Part I. | FINANCIAL INFORMATION |
Item 1. | Financial Statements . |
FREEPORT-McMoRan INC.
CONSOLIDATED BALANCE SHEETS (Unaudited)
| March 31, |
| December 31, | ||||
| (In millions) | ||||||
ASSETS |
|
|
| ||||
Current assets: |
|
|
| ||||
Cash and cash equivalents | $ | 3,702 | |
| $ | 4,447 | |
Trade accounts receivable | 1,222 | |
| 1,246 | | ||
Income and other tax receivables | 222 | |
| 325 | | ||
Inventories: |
|
|
| ||||
Materials and supplies, net | 1,335 | |
| 1,305 | | ||
Mill and leach stockpiles | 1,448 | |
| 1,422 | | ||
Product | 1,102 | |
| 1,166 | | ||
Other current assets | 367 | |
| 270 | | ||
Assets held for sale | 708 | |
| 598 | | ||
Total current assets | 10,106 | |
| 10,779 | | ||
Property, plant, equipment and mine development costs, net | 22,792 | |
| 22,844 | | ||
Long-term mill and leach stockpiles | 1,387 | |
| 1,409 | | ||
Other assets | 2,352 | |
| 2,270 | | ||
Total assets | $ | 36,637 | |
| $ | 37,302 | |
|
|
|
| ||||
LIABILITIES AND EQUITY |
|
|
| ||||
Current liabilities: |
|
|
| ||||
Accounts payable and accrued liabilities | $ | 2,209 | |
| $ | 2,321 | |
Accrued income taxes | 749 | |
| 565 | | ||
Current portion of debt | 483 | |
| 1,414 | | ||
Current portion of environmental and asset retirement obligations | 396 | |
| 388 | | ||
Dividends payable | 72 | |
| - | | ||
Liabilities held for sale | 435 | |
| 350 | | ||
Total current liabilities | 4,344 | |
| 5,038 | | ||
Long-term debt, less current portion | 11,123 | |
| 11,703 | | ||
Deferred income taxes | 3,642 | |
| 3,622 | | ||
Environmental and asset retirement obligations, less current portion | 3,630 | |
| 3,631 | | ||
Other liabilities | 1,972 | |
| 2,012 | | ||
Total liabilities | 24,711 | |
| 26,006 | | ||
|
|
|
| ||||
Equity: |
|
|
| ||||
Stockholders' equity: |
|
|
| ||||
Common stock | 158 | |
| 158 | | ||
Capital in excess of par value | 26,729 | |
| 26,751 | | ||
Accumulated deficit | (14,030 | ) |
| (14,722 | ) | ||
Accumulated other comprehensive loss | (475 | ) |
| (487 | ) | ||
Common stock held in treasury | (3,726 | ) |
| (3,723 | ) | ||
Total stockholders' equity | 8,656 | |
| 7,977 | | ||
Noncontrolling interests | 3,270 | |
| 3,319 | | ||
Total equity | 11,926 | |
| 11,296 | | ||
Total liabilities and equity | $ | 36,637 | |
| $ | 37,302 | |
The accompanying notes are an integral part of these consolidated financial statements.
3
Table of Contents
FREEPORT-McMoRan INC.
CONSOLIDATED STATEMENTS OF INCOME (Unaudited)
| Three Months Ended | ||||||
| March 31, | ||||||
| 2018 |
| 2017 | ||||
| (In millions, except per share amounts) | ||||||
Revenues | $ | 4,868 | |
| $ | 3,341 | |
Cost of sales: |
|
|
| ||||
Production and delivery | 2,808 | |
| 2,188 | | ||
Depreciation, depletion and amortization | 451 | |
| 389 | | ||
Total cost of sales | 3,259 | |
| 2,577 | | ||
Selling, general and administrative expenses | 131 | |
| 151 | | ||
Mining exploration and research expenses | 21 | |
| 14 | | ||
Environmental obligations and shutdown costs | 9 | |
| 25 | | ||
Net gain on sales of assets | (11 | ) |
| (23 | ) | ||
Total costs and expenses | 3,409 | |
| 2,744 | | ||
Operating income | 1,459 | |
| 597 | | ||
Interest expense, net | (151 | ) |
| (167 | ) | ||
Other income, net | 28 | |
| 8 | | ||
Income from continuing operations before income taxes and equity in affiliated companies' net (losses) earnings | 1,336 | |
| 438 | | ||
Provision for income taxes | (506 | ) |
| (174 | ) | ||
Equity in affiliated companies' net (losses) earnings | (2 | ) |
| 4 | | ||
Net income from continuing operations | 828 | |
| 268 | | ||
Net (loss) income from discontinued operations | (11 | ) |
| 38 | | ||
Net income | 817 | |
| 306 | | ||
Net income attributable to noncontrolling interests: |
|
|
| ||||
Continuing operations | (125 | ) |
| (75 | ) | ||
Discontinued operations | - | |
| (3 | ) | ||
Net income attributable to common stockholders | $ | 692 | |
| $ | 228 | |
|
|
|
| ||||
Basic and diluted net income (loss) per share attributable to common stockholders: |
|
|
| ||||
Continuing operations | $ | 0.48 | |
| $ | 0.13 | |
Discontinued operations | (0.01 | ) |
| 0.03 | | ||
| $ | 0.47 | |
| $ | 0.16 | |
|
|
|
| ||||
Weighted-average common shares outstanding: |
|
|
| ||||
Basic | 1,449 | |
| 1,446 | | ||
|
|
|
| ||||
Diluted | 1,458 | |
| 1,454 | | ||
|
|
|
| ||||
Dividends declared per share of common stock | $ | 0.05 | |
| $ | - | |
The accompanying notes are an integral part of these consolidated financial statements.
4
Table of Contents
FREEPORT-McMoRan INC.
CONSOLIDATED STATEMENTS OF COMPREHENSIVE INCOME (Unaudited)
| Three Months Ended | ||||||
| March 31, | ||||||
| 2018 |
| 2017 | ||||
| (In millions) | ||||||
Net income | $ | 817 | |
| $ | 306 | |
|
|
|
| ||||
Other comprehensive income, net of taxes: |
|
|
| ||||
Unrealized gains on securities | - | |
| 1 | | ||
Defined benefit plans: |
|
|
| ||||
Amortization of unrecognized amounts included in net periodic benefit costs | 12 | |
| 11 | | ||
Foreign exchange losses | (1 | ) |
| (1 | ) | ||
Other comprehensive income | 11 | |
| 11 | | ||
|
|
|
| ||||
Total comprehensive income | 828 | |
| 317 | | ||
Total comprehensive income attributable to noncontrolling interests | (124 | ) |
| (78 | ) | ||
Total comprehensive income attributable to common stockholders | $ | 704 | |
| $ | 239 | |
The accompanying notes are an integral part of these consolidated financial statements.
5
Table of Contents
FREEPORT-McMoRan INC.
CONSOLIDATED STATEMENTS OF CASH FLOWS (Unaudited)
| Three Months Ended |
| ||||||
| March 31, |
| ||||||
| 2018 |
| 2017 |
| ||||
| (In millions) |
| ||||||
Cash flow from operating activities: |
|
|
|
| ||||
Net income | $ | 817 | |
| $ | 306 | |
|
Adjustments to reconcile net income to net cash provided by operating activities: |
|
|
|
| ||||
Depreciation, depletion and amortization | 451 | |
| 389 | |
| ||
Net gain on sales of assets | (11 | ) |
| (23 | ) |
| ||
Stock-based compensation | 49 | |
| 34 | |
| ||
Payments for Cerro Verde royalty dispute | (10 | ) |
| (11 | ) |
| ||
Net charges for environmental and asset retirement obligations, including accretion | 53 | |
| 71 | |
| ||
Payments for environmental and asset retirement obligations | (38 | ) |
| (33 | ) |
| ||
Net charges for defined pension and postretirement plans | 18 | |
| 33 | |
| ||
Pension plan contributions | (24 | ) |
| (30 | ) |
| ||
Deferred income taxes | 22 | |
| 20 | |
| ||
Loss (gain) on disposal of discontinued operations | 11 | |
| (32 | ) |
| ||
Decrease in long-term mill and leach stockpiles | 22 | |
| 8 | |
| ||
Oil and gas contract settlement payments | - | |
| (70 | ) |
| ||
Other, net | 30 | |
| (59 | ) |
| ||
Changes in working capital and other tax payments: |
|
|
|
| ||||
Accounts receivable | 136 | |
| 623 | |
| ||
Inventories | (142 | ) |
| (135 | ) |
| ||
Other current assets | (42 | ) |
| (13 | ) |
| ||
Accounts payable and accrued liabilities | (96 | ) |
| (433 | ) |
| ||
Accrued income taxes and timing of other tax payments | 123 | |
| 147 | |
| ||
Net cash provided by operating activities | 1,369 | |
| 792 | |
| ||
|
|
|
|
| ||||
Cash flow from investing activities: |
|
|
|
| ||||
Capital expenditures: |
|
|
|
| ||||
North America copper mines | (92 | ) |
| (28 | ) |
| ||
South America | (67 | ) |
| (15 | ) |
| ||
Indonesia | (203 | ) |
| (244 | ) |
| ||
Molybdenum mines | (1 | ) |
| (1 | ) |
| ||
Other | (39 | ) |
| (56 | ) |
| ||
Intangible water rights and other, net | (90 | ) |
| (17 | ) |
| ||
Net cash used in investing activities | (492 | ) |
| (361 | ) |
| ||
|
|
|
|
| ||||
Cash flow from financing activities: |
|
|
|
| ||||
Proceeds from debt | 122 | |
| 157 | |
| ||
Repayments of debt | (1,633 | ) |
| (815 | ) |
| ||
Cash dividends paid: |
|
|
|
| ||||
Common stock | - | |
| (1 | ) |
| ||
Noncontrolling interests | (80 | ) |
| (15 | ) |
| ||
Stock-based awards net proceeds (payments) | 3 | |
| (5 | ) |
| ||
Net cash used in financing activities | (1,588 | ) |
| (679 | ) |
| ||
|
|
|
|
| ||||
Net decrease in cash, cash equivalents, restricted cash and restricted cash equivalents | (711 | ) |
| (248 | ) |
| ||
Decrease in cash and cash equivalents in assets held for sale | 32 | |
| 8 | |
| ||
Cash, cash equivalents, restricted cash and restricted cash equivalents at beginning of year | 4,631 | |
| 4,403 | |
| ||
Cash, cash equivalents, restricted cash and restricted cash equivalents at end of period | $ | 3,952 | |
| $ | 4,163 | |
|
The accompanying notes are an integral part of these consolidated financial statements.
6
Table of Contents
FREEPORT-McMoRan INC.
CONSOLIDATED STATEMENT OF EQUITY (Unaudited)
| Stockholders' Equity |
|
|
|
| ||||||||||||||||||||||||||||||||
| Common Stock |
|
|
| Accum-ulated Deficit |
| Accumu- |
| Common Stock Held in Treasury |
| Total |
|
|
|
| ||||||||||||||||||||||
| Number of Shares |
| At Par Value |
| Capital in Excess of Par Value |
|
|
| Number of Shares |
| At Cost |
|
| Non- controlling Interests |
| Total Equity | |||||||||||||||||||||
|
|
|
|
|
|
|
|
|
| ||||||||||||||||||||||||||||
| (In millions) | ||||||||||||||||||||||||||||||||||||
Balance at December 31, 2017 | 1,578 | |
| $ | 158 | |
| $ | 26,751 | |
| $ | (14,722 | ) |
| $ | (487 | ) |
| 130 | |
| $ | (3,723 | ) |
| $ | 7,977 | |
| $ | 3,319 | |
| $ | 11,296 | |
Exercised and issued stock-based awards | 1 | |
| - | |
| 6 | |
| - | |
| - | |
| - | |
| - | |
| 6 | |
| - | |
| 6 | | ||||||||
Stock-based compensation, including the tender of shares | - | |
| - | |
| 44 | |
| - | |
| - | |
| - | |
| (3 | ) |
| 41 | |
| - | |
| 41 | | ||||||||
Dividends | - | |
| - | |
| (72 | ) |
| - | |
| - | |
| - | |
| - | |
| (72 | ) |
| (173 | ) |
| (245 | ) | ||||||||
Net income attributable to common stockholders | - | |
| - | |
| - | |
| 692 | |
| - | |
| - | |
| - | |
| 692 | |
| - | |
| 692 | | ||||||||
Net income attributable to noncontrolling interests | - | |
| - | |
| - | |
| - | |
| - | |
| - | |
| - | |
| - | |
| 125 | |
| 125 | | ||||||||
Other comprehensive income | - | |
| - | |
| - | |
| - | |
| 12 | |
| - | |
| - | |
| 12 | |
| (1 | ) |
| 11 | | ||||||||
Balance at March 31, 2018 | 1,579 | |
| $ | 158 | |
| $ | 26,729 | |
| $ | (14,030 | ) |
| $ | (475 | ) |
| 130 | |
| $ | (3,726 | ) |
| $ | 8,656 | |
| $ | 3,270 | |
| $ | 11,926 | |
The accompanying notes are an integral part of these consolidated financial statements.
7
Table of Contents
FREEPORT-McMoRan INC.
NOTES TO CONSOLIDATED FINANCIAL STATEMENTS (Unaudited)
NOTE 1. GENERAL INFORMATION
The accompanying unaudited consolidated financial statements have been prepared in accordance with the instructions to Form 10-Q and do not include all information and disclosures required by generally accepted accounting principles (GAAP) in the United States (U.S.). Therefore, this information should be read in conjunction with Freeport-McMoRan Inc.'s (FCX) consolidated financial statements and notes contained in its annual report on Form 10-K for the year ended December 31, 2017 . The information furnished herein reflects all adjustments that are, in the opinion of management, necessary for a fair statement of the results for the interim periods reported. With the exception of the accounting for discontinued operations and assets held for sale, all such adjustments are, in the opinion of management, of a normal recurring nature. Operating results for the three -month period ended March 31, 2018 , are not necessarily indicative of the results that may be expected for the year ending December 31, 2018.
NOTE 2. EARNINGS PER SHARE
FCX calculates its basic net income per share of common stock under the two-class method and calculates its diluted net income per share of common stock using the more dilutive of the two-class method or the treasury-stock method. Basic net income per share of common stock was computed by dividing net income attributable to common stockholders by the weighted-average shares of common stock outstanding during the period. Diluted net income per share of common stock was calculated by including the basic weighted-average shares of common stock outstanding adjusted for the effects of all potential dilutive shares of common stock, unless their effect would be anti-dilutive. Reconciliations of net income and weighted-average shares of common stock outstanding for purposes of calculating basic and diluted net income per share follow (in millions, except per share amounts):
| Three Months Ended | ||||||
| March 31, | ||||||
| 2018 |
| 2017 | ||||
Net income from continuing operations | $ | 828 | |
| $ | 268 | |
Net income from continuing operations attributable to noncontrolling interests | (125 | ) |
| (75 | ) | ||
Undistributed earnings allocated to participating securities | (4 | ) |
| (3 | ) | ||
Net income from continuing operations attributable to common stockholders | $ | 699 | |
| $ | 190 | |
|
|
|
| ||||
Net (loss) income from discontinued operations | $ | (11 | ) |
| $ | 38 | |
Net income from discontinued operations attributable to noncontrolling interests | - | |
| (3 | ) | ||
Net (loss) income from discontinued operations attributable to common stockholders | $ | (11 | ) |
| $ | 35 | |
|
|
|
| ||||
|
|
|
| ||||
Net income attributable to common stockholders | $ | 688 | |
| $ | 225 | |
|
|
|
| ||||
|
|
|
| ||||
Basic weighted-average shares of common stock outstanding | 1,449 | |
| 1,446 | | ||
Add shares issuable upon exercise or vesting of dilutive stock options and restricted stock units | 9 | | a | 8 | | ||
Diluted weighted-average shares of common stock outstanding | 1,458 | |
| 1,454 | | ||
|
|
|
| ||||
Basic and diluted net income (loss) per share attributable to common stockholders: |
|
|
| ||||
Continuing operations | $ | 0.48 | |
| $ | 0.13 | |
Discontinued operations | (0.01 | ) |
| 0.03 | | ||
| $ | 0.47 | |
| $ | 0.16 | |
a. | Excludes approximately 4 million shares of common stock associated with outstanding stock options with exercise prices less than the average market price of FCX's common stock that were anti-dilutive. |
Outstanding stock options with exercise prices greater than the average market price of FCX's common stock during the period are excluded from the computation of diluted net income per share of common stock. Stock options for 33 million shares of common stock were excluded for first-quarter 2018 and 44 million for first-quarter 2017 .
8
Table of Contents
NOTE 3. INVENTORIES, INCLUDING LONG-TERM MILL AND LEACH STOCKPILES
The components of inventories follow (in millions):
| March 31, |
| December 31, 2017 |
| ||||
Current inventories: |
|
|
|
| ||||
Total materials and supplies, net a | $ | 1,335 | |
| $ | 1,305 | |
|
|
|
|
|
| ||||
Mill stockpiles | $ | 330 | |
| $ | 360 | |
|
Leach stockpiles | 1,118 | |
| 1,062 | |
| ||
Total current mill and leach stockpiles | $ | 1,448 | |
| $ | 1,422 | |
|
|
|
|
|
| ||||
Raw materials (primarily concentrate) | $ | 284 | |
| $ | 265 | |
|
Work-in-process | 138 | |
| 154 | |
| ||
Finished goods | 680 | |
| 747 | |
| ||
Total product inventories | $ | 1,102 | |
| $ | 1,166 | |
|
|
|
|
|
| ||||
Long-term inventories: |
|
|
|
| ||||
Mill stockpiles | $ | 308 | |
| $ | 300 | |
|
Leach stockpiles | 1,079 | |
| 1,109 | |
| ||
Total long-term mill and leach stockpiles | $ | 1,387 | |
| $ | 1,409 | |
|
a. | Materials and supplies inventory was net of obsolescence reserves totaling $25 million at March 31, 2018 , and $29 million at December 31, 2017 . |
NOTE 4. INCOME TAXES
Variations in the relative proportions of jurisdictional income result in fluctuations to FCX's consolidated effective income tax rate. FCX's consolidated effective income tax rate was 38 percent for first-quarter 2018 and 40 percent for first-quarter 2017 . Geographic sources of FCX's (provision for) benefit from income taxes follow (in millions):
| Three Months Ended |
| ||||||
| March 31, |
| ||||||
| 2018 |
| 2017 |
| ||||
U.S. operations | $ | 3 | |
| $ | (7 | ) |
|
International operations | (509 | ) |
| (167 | ) |
| ||
Total | $ | (506 | ) |
| $ | (174 | ) |
|
The Tax Cuts and Jobs Act (the Act) was enacted on December 22, 2017, and includes significant modifications to existing U.S. tax laws and creates many new complex tax provisions. As of December 31, 2017, FCX recorded provisional impacts of the tax effects related to specific provisions and continues to evaluate other provisions of the Act. During the three months ended March 31, 2018, no adjustments were made to the provisional amounts recorded at December 31, 2017, as FCX has not fully completed its analysis of the Act. During the remainder of 2018, FCX will continue to refine its calculations as it gains a more thorough understanding of the Act.
9
Table of Contents
NOTE 5. DEBT AND EQUITY
The components of debt follow (in millions):
|
| March 31, |
| December 31, 2017 | ||||
Senior notes and debentures: |
|
|
|
| ||||
Issued by FCX |
| $ | 10,020 | |
| $ | 11,429 | |
Issued by Freeport Minerals Corporation |
| 358 | |
| 358 | | ||
Issued by Freeport-McMoRan Oil & Gas LLC (FM O&G LLC) |
| 54 | |
| 54 | | ||
Cerro Verde credit facility |
| 1,170 | |
| 1,269 | | ||
Other |
| 4 | |
| 7 | | ||
Total debt a |
| 11,606 | |
| 13,117 | | ||
Less current portion of debt |
| (483 | ) |
| (1,414 | ) | ||
Long-term debt |
| $ | 11,123 | |
| $ | 11,703 | |
a. | Includes additions for unamortized fair value adjustments totaling $93 million at March 31, 2018 ( $97 million at December 31, 2017 ), and is net of reductions for unamortized net discounts and unamortized debt issuance costs totaling $81 million at March 31, 2018 ( $85 million at December 31, 2017 ). |
Revolving Credit Facility. At March 31, 2018 , there were no borrowings outstanding and $13 million in letters of credit issued under FCX's revolving credit facility, resulting in availability of approximately $3.5 billion , of which approximately $1.5 billion could be used for additional letters of credit.
In April 2018, FCX, PT Freeport Indonesia (PT-FI) and FM O&G LLC entered into a new $3.5 billion , five -year, unsecured revolving credit facility, which replaced FCX's prior revolving credit facility (scheduled to mature on May 31, 2019). The new revolving credit facility is available until April 20, 2023, with $500 million available to PT-FI, and has substantially similar structure and terms as the prior revolving credit facility. Interest on loans made under the new revolving credit facility will, at the option of FCX, be determined based on the adjusted London Interbank Offered rate or the alternate base rate (each as defined in the new revolving credit facility) plus a spread to be determined by reference to FCX's credit ratings. The new revolving credit facility contains customary affirmative covenants and representations, and also contains a number of negative covenants that, among other things, restrict, subject to certain exceptions, the ability of FCX's subsidiaries that are not borrowers or guarantors to incur additional indebtedness (including guarantee obligations) and FCX's or its subsidiaries' ability to: create liens on assets; enter into sale and leaseback transactions; engage in mergers, liquidations and dissolutions; and sell assets. FCX's new revolving credit facility also contains financial ratios governing maximum total leverage and the minimum interest expense coverage ratio. FCX's total leverage ratio (ratio of total debt to consolidated earnings before interest, taxes, depreciation and amortization (EBITDA), as defined in the credit agreement) cannot exceed 3.75 x, and the minimum interest expense coverage ratio (ratio of consolidated EBITDA to consolidated cash interest expense, as defined in the credit agreement) is 2.25 x.
Senior Notes. In March 2018, FCX's 2.375% Senior Notes matured, and the $1.4 billion outstanding principal balance was repaid.
On April 4, 2018, FCX redeemed $454 million of aggregate principal amount of outstanding senior notes, consisting of $404 million of FCX 6.75% Senior Notes due 2022 and $50 million of FM O&G LLC 6 7 / 8 % Senior Notes due 2023. Holders of these senior notes received the principal amount together with the redemption premium and accrued and unpaid interest up to the redemption date. As a result of these redemptions, FCX will record a gain on early extinguishment of debt of $10 million in second-quarter 2018.
Cerro Verde Credit Facility. In March 2018, Cerro Verde prepaid $100 million under its credit facility.
Interest Expense, Net. Consolidated interest costs (before capitalized interest) totaled $176 million in first-quarter 2018 and $195 million in first-quarter 2017 . Capitalized interest added to property, plant, equipment and mine development costs, net, totaled $25 million in first-quarter 2018 and $28 million in first-quarter 2017 .
Common Stock. In February 2018, FCX's Board of Directors (the Board) reinstated a cash dividend on FCX's common stock. On March 28, 2018, the Board declared a quarterly cash dividend of $0.05 per share, which was paid on May 1, 2018, to common stockholders of record as of April 13, 2018.
|
|
|
|
|
|
|
|
|
|
10
Table of Contents
NOTE 6. FINANCIAL INSTRUMENTS
FCX does not purchase, hold or sell derivative financial instruments unless there is an existing asset or obligation, or it anticipates a future activity that is likely to occur and will result in exposure to market risks, which FCX intends to offset or mitigate. FCX does not enter into any derivative financial instruments for speculative purposes, but has entered into derivative financial instruments in limited instances to achieve specific objectives. These objectives principally relate to managing risks associated with commodity price changes, foreign currency exchange rates and interest rates.
Commodity Contracts. From time to time, FCX has entered into derivative contracts to hedge the market risk associated with fluctuations in the prices of commodities it purchases and sells. Derivative financial instruments used by FCX to manage its risks do not contain credit risk-related contingent provisions. As of March 31, 2018 , and December 31, 2017 , FCX had no price protection contracts relating to its mine production. A discussion of FCX's derivative contracts and programs follows.
Derivatives Designated as Hedging Instruments – Fair Value Hedges
Copper Futures and Swap Contracts. Some of FCX's U.S. copper rod customers request a fixed market price instead of the Commodity Exchange Inc. (COMEX) average copper price in the month of shipment. FCX hedges this price exposure in a manner that allows it to receive the COMEX average price in the month of shipment while the customers pay the fixed price they requested. FCX accomplishes this by entering into copper futures or swap contracts. Hedging gains or losses from these copper futures and swap contracts are recorded in revenues. FCX did not have any significant gains or losses resulting from hedge ineffectiveness during the three-month periods ended March 31, 2018 and 2017 . At March 31, 2018 , FCX held copper futures and swap contracts that qualified for hedge accounting for 57 million pounds at an average contract price of $3.10 per pound, with maturities through September 2019.
| Three Months Ended | ||||||
| March 31, | ||||||
| 2018 |
| 2017 | ||||
Copper futures and swap contracts: |
|
|
| ||||
Unrealized (losses) gains: |
|
|
| ||||
Derivative financial instruments | $ | (15 | ) |
| $ | (2 | ) |
Hedged item – firm sales commitments | 15 | |
| 2 | | ||
|
|
|
| ||||
Realized gains: |
|
|
| ||||
Matured derivative financial instruments | 2 | |
| 8 | | ||
Derivatives Not Designated as Hedging Instruments
Embedded Derivatives. Certain FCX concentrate and cathode contracts are provisionally priced at the time of shipment. The provisional prices are finalized in a specified future month (generally one to four months from the shipment date) based on quoted monthly average spot copper prices on the London Metal Exchange (LME) or COMEX and the London Bullion Market Association (London) gold price at the time of shipment as specified in the contract. FCX receives market prices based on prices in the specified future month, which results in price fluctuations until the date of settlement. Similarly, FCX purchases copper and cobalt under contracts that provide for provisional pricing. FCX applies the normal purchases and normal sales scope exception in accordance with derivatives and hedge accounting guidance to the host sales agreements since the contracts do not allow for net settlement and always result in physical delivery. Sales and purchases with a provisional sales price contain an embedded derivative ( i.e. , the price settlement mechanism is settled after the time of delivery) that is required to be bifurcated from the host contract. The host contract is the sale or purchase of the metals contained in the concentrate or cathode at the then-current metal price as defined in the contract. Mark-to-market price fluctuations from these embedded derivatives are recorded through the settlement date and are reflected in revenues for sales contracts and in inventory for purchase contracts.
11
Table of Contents
A summary of FCX's embedded derivatives at March 31, 2018 , follows:
| Open Positions |
| Average Price Per Unit |
| Maturities Through | |||||||
|
| Contract |
| Market |
| |||||||
Embedded derivatives in provisional sales contracts: |
|
|
|
|
|
|
| |||||
Copper (millions of pounds) | 518 | |
| $ | 3.13 | |
| $ | 3.04 | |
| August 2018 |
Gold (thousands of ounces) | 311 | |
| 1,325 | |
| 1,327 | |
| July 2018 | ||
Embedded derivatives in provisional purchase contracts: |
|
|
|
|
|
|
| |||||
Copper (millions of pounds) | 104 | |
| 3.13 | |
| 3.04 | |
| July 2018 | ||
Cobalt (millions of pounds) a | 8 | |
| 30.19 | |
| 33.88 | |
| June 2018 | ||
a. | Relates to assets held for sale. |
Copper Forward Contracts. Atlantic Copper, FCX's wholly owned smelting and refining unit in Spain, enters into copper forward contracts designed to hedge its copper price risk whenever its physical purchases and sales pricing periods do not match. These economic hedge transactions are intended to hedge against changes in copper prices, with the mark-to-market hedging gains or losses recorded in cost of sales. At March 31, 2018 , Atlantic Copper held net copper forward sales contracts for 3 million pounds at an average contract price of $3.09 per pound, with maturities through May 2018.
| Three Months Ended | ||||||
| March 31, | ||||||
| 2018 |
| 2017 | ||||
Embedded derivatives in provisional sales contracts: a |
|
|
| ||||
Copper | $ | (135 | ) |
| $ | 107 | |
Gold and other metals | 18 | |
| 19 | | ||
Copper forward contracts b | 2 | |
| (1 | ) | ||
a. | Amounts recorded in revenues. |
b. | Amounts recorded in cost of sales as production and delivery costs. |
Unsettled Derivative Financial Instruments
A summary of the fair values of unsettled commodity derivative financial instruments follows (in millions):
|
| March 31, |
| December 31, 2017 | ||||
Commodity Derivative Assets: |
|
|
|
| ||||
Derivatives designated as hedging instruments : |
|
|
|
| ||||
Copper futures and swap contracts |
| $ | 2 | |
| $ | 11 | |
Derivatives not designated as hedging instruments : |
|
|
|
| ||||
Embedded derivatives in provisional copper and gold |
|
|
|
| ||||
sales/purchase contracts |
| 11 | |
| 155 | | ||
Copper forward contracts |
| - | |
| 1 | | ||
Total derivative assets |
| $ | 13 | |
| $ | 167 | |
|
|
|
|
| ||||
Commodity Derivative Liabilities: |
|
|
|
| ||||
Derivatives designated as hedging instruments : |
|
|
|
| ||||
Copper futures and swap contracts |
| $ | 5 | |
| $ | - | |
Derivatives not designated as hedging instruments : |
|
|
|
| ||||
Embedded derivatives in provisional copper and gold |
|
|
|
| ||||
sales/purchase contracts |
| 48 | |
| 31 | | ||
Copper forward contracts |
| - | |
| 2 | | ||
Total derivative liabilities |
| $ | 53 | |
| $ | 33 | |
12
Table of Contents
FCX's commodity contracts have netting arrangements with counterparties with which the right of offset exists, and it is FCX's policy to generally offset balances by counterparty on its balance sheet. FCX's embedded derivatives on provisional sales/purchase contracts are netted with the corresponding outstanding receivable/payable balances. A summary of these unsettled commodity contracts that are offset in the balance sheets follows (in millions):
|
| Assets |
| Liabilities | ||||||||||||
|
| March 31, 2018 |
| December 31, 2017 |
| March 31, 2018 |
| December 31, 2017 | ||||||||
|
|
|
|
|
|
|
|
| ||||||||
Gross amounts recognized: |
|
|
|
|
|
|
|
| ||||||||
Commodity contracts: |
|
|
|
|
|
|
|
| ||||||||
Embedded derivatives in provisional |
|
|
|
|
|
|
|
| ||||||||
sales/purchase contracts |
| $ | 11 | |
| $ | 155 | |
| $ | 48 | |
| $ | 31 | |
Copper derivatives |
| 2 | |
| 12 | |
| 5 | |
| 2 | | ||||
|
| 13 | |
| 167 | |
| 53 | |
| 33 | | ||||
|
|
|
|
|
|
|
|
| ||||||||
Less gross amounts of offset: |
|
|
|
|
|
|
|
| ||||||||
Commodity contracts: |
|
|
|
|
|
|
|
| ||||||||
Embedded derivatives in provisional |
|
|
|
|
|
|
|
| ||||||||
sales/purchase contracts |
| 1 | |
| - | |
| 1 | |
| - | | ||||
Copper derivatives |
| - | |
| 1 | |
| - | |
| 1 | | ||||
|
| 1 | |
| 1 | |
| 1 | |
| 1 | | ||||
|
|
|
|
|
|
|
|
| ||||||||
Net amounts presented in balance sheet: |
|
|
|
|
|
|
|
| ||||||||
Commodity contracts: |
|
|
|
|
|
|
|
| ||||||||
Embedded derivatives in provisional |
|
|
|
|
|
|
|
| ||||||||
sales/purchase contracts |
| 10 | |
| 155 | |
| 47 | |
| 31 | | ||||
Copper derivatives |
| 2 | |
| 11 | |
| 5 | |
| 1 | | ||||
|
| $ | 12 | |
| $ | 166 | |
| $ | 52 | |
| $ | 32 | |
|
|
|
|
|
|
|
|
| ||||||||
Balance sheet classification: |
|
|
|
|
|
|
|
| ||||||||
Trade accounts receivable |
| $ | - | |
| $ | 151 | |
| $ | 41 | |
| $ | - | |
Other current assets |
| 2 | |
| 11 | |
| - | |
| - | | ||||
Accounts payable and accrued liabilities |
| 10 | |
| 4 | |
| 11 | |
| 32 | | ||||
|
| $ | 12 | |
| $ | 166 | |
| $ | 52 | |
| $ | 32 | |
The table above excludes $30 million of embedded derivatives in provisional cobalt purchase contracts at March 31, 2018, and $24 million at December 31, 2017, which are reflected in liabilities held for sale.
Credit Risk. FCX is exposed to credit loss when financial institutions with which it has entered into derivative transactions (commodity, foreign exchange and interest rate swaps) are unable to pay. To minimize the risk of such losses, FCX uses counterparties that meet certain credit requirements and periodically reviews the creditworthiness of these counterparties. FCX does not anticipate that any of the counterparties it deals with will default on their obligations. As of March 31, 2018 , the maximum amount of credit exposure associated with derivative transactions was $11 million .
13
Table of Contents
Other Financial Instruments. Other financial instruments include cash and cash equivalents, accounts receivable, restricted cash, restricted cash equivalents, investment securities, legally restricted funds, accounts payable and accrued liabilities, and long-term debt. The carrying value for cash and cash equivalents (which included time deposits of $2.8 billion at March 31, 2018 , and $2.9 billion at December 31, 2017 ), accounts receivable, restricted cash, restricted cash equivalents, and accounts payable and accrued liabilities approximates fair value because of their short-term nature and generally negligible credit losses (refer to Note 7 for the fair values of investment securities, legally restricted funds and long-term debt).
In addition, as of March 31, 2018 , FCX has contingent consideration assets related to certain 2016 asset sales (refer to Note 7 for the related fair values and to Note 2 of FCX's annual report on Form 10-K for the year ended December 31, 2017 , for further discussion of these instruments).
Cash, Cash Equivalents, Restricted Cash and Restricted Cash Equivalents. The following table provides a reconciliation of total cash, cash equivalents, restricted cash and restricted cash equivalents presented in the consolidated statements of cash flows to the components presented in the consolidated balance sheets (in millions):
|
| March 31, 2018 |
| December 31, 2017 | ||||
Balance sheet components: |
|
|
|
| ||||
Cash and cash equivalents |
| $ | 3,702 | |
| $ | 4,447 | |
Restricted cash and restricted cash equivalents included in: |
|
|
|
| ||||
Other current assets |
| 123 | |
| 52 | | ||
Other assets |
| 127 | |
| 132 | | ||
Total cash, cash equivalents, restricted cash and restricted cash equivalents presented in the consolidated statements of cash flows |
| $ | 3,952 | |
| $ | 4,631 | |
FCX's restricted cash and restricted cash equivalents are primarily related to PT-FI's commitment for smelter development in Indonesia; guarantees and commitments for certain mine closure and reclamation obligations, and customs duty taxes; and funds held as cash collateral for surety bonds related to plugging and abandonment obligations of certain oil and gas properties. Restricted cash and restricted cash equivalents are classified as a current or long-term asset based on the timing and nature of when or how the cash is expected to be used or when the restrictions are expected to lapse. Restricted cash and restricted cash equivalents are comprised of time deposits and money market funds.
14
Table of Contents
NOTE 7. FAIR VALUE MEASUREMENT
Fair value accounting guidance includes a hierarchy that prioritizes the inputs to valuation techniques used to measure fair value. The hierarchy gives the highest priority to unadjusted quoted prices in active markets for identical assets or liabilities (Level 1) and the lowest priority to unobservable inputs (Level 3). FCX recognizes transfers between levels at the end of the reporting period. FCX did not have any significant transfers in or out of Level 1, 2 or 3 for first-quarter 2018 .
FCX's financial instruments are recorded on the consolidated balance sheets at fair value except for contingent consideration associated with the sale of the Deepwater Gulf of Mexico (GOM) oil and gas properties (which was recorded under the loss recovery approach) and debt. A summary of the carrying amount and fair value of FCX's financial instruments (including those measured at net asset value (NAV) as a practical expedient), other than cash and cash equivalents, accounts receivable, restricted cash, restricted cash equivalents, and accounts payable and accrued liabilities (refer to Note 6) follows (in millions):
| At March 31, 2018 | ||||||||||||||||||||||
| Carrying |
| Fair Value | ||||||||||||||||||||
| Amount |
| Total |
| NAV |
| Level 1 |
| Level 2 |
| Level 3 | ||||||||||||
Assets |
|
|
|
|
|
|
|
|
|
|
| ||||||||||||
Investment securities: a,b |
|
|
|
|
|
|
|
|
|
|
| ||||||||||||
U.S. core fixed income fund | $ | 25 | |
| $ | 25 | |
| $ | 25 | |
| $ | - | |
| $ | - | |
| $ | - | |
Equity securities | 5 | |
| 5 | |
| - | |
| 5 | |
| - | |
| - | | ||||||
Total | 30 | |
| 30 | |
| 25 | |
| 5 | |
| - | |
| - | | ||||||
|
|
|
|
|
|
|
|
|
|
|
| ||||||||||||
Legally restricted funds: a |
|
|
|
|
|
|
|
|
|
|
| ||||||||||||
U.S. core fixed income fund | 54 | |
| 54 | |
| 54 | |
| - | |
| - | |
| - | | ||||||
Government bonds and notes | 42 | |
| 42 | |
| - | |
| - | |
| 42 | |
| - | | ||||||
Corporate bonds | 29 | |
| 29 | |
| - | |
| - | |
| 29 | |
| - | | ||||||
Government mortgage-backed securities | 25 | |
| 25 | |
| - | |
| - | |
| 25 | |
| - | | ||||||
Asset-backed securities | 13 | |
| 13 | |
| - | |
| - | |
| 13 | |
| - | | ||||||
Money market funds | 8 | |
| 8 | |
| - | |
| 8 | |
| - | |
| - | | ||||||
Collateralized mortgage-backed securities | 7 | |
| 7 | |
| - | |
| - | |
| 7 | |
| - | | ||||||
Municipal bonds | 1 | |
| 1 | |
| - | |
| - | |
| 1 | |
| - | | ||||||
Total | 179 | |
| 179 | |
| 54 | |
| 8 | |
| 117 | |
| - | | ||||||
|
|
|
|
|
|
|
|
|
|
|
| ||||||||||||
Derivatives: |
|
|
|
|
|
|
|
|
|
|
| ||||||||||||
Embedded derivatives in provisional sales/ |
|
|
|
|
|
|
|
|
|
|
| ||||||||||||
purchase contracts in a gross asset position c | 11 | |
| 11 | |
| - | |
| - | |
| 11 | |
| - | | ||||||
Copper futures and swap contracts c | 2 | |
| 2 | |
| - | |
| 1 | |
| 1 | |
| - | | ||||||
Contingent consideration for the sales of |
|
|
|
|
|
|
|
|
|
|
| ||||||||||||
TF Holdings Limited (TFHL) and onshore |
|
|
|
|
|
|
|
|
|
|
| ||||||||||||
California oil and gas properties a | 110 | |
| 110 | |
| - | |
| - | |
| 110 | |
| - | | ||||||
Total | 123 | |
| 123 | |
| - | |
| 1 | |
| 122 | |
| - | | ||||||
|
|
|
|
|
|
|
|
|
|
|
| ||||||||||||
Contingent consideration for the sale of the |
|
|
|
|
|
|
|
|
|
|
| ||||||||||||
Deepwater GOM oil and gas properties a | 150 | |
| 132 | |
| - | |
| - | |
| - | |
| 132 | | ||||||
|
|
|
|
|
|
|
|
|
|
|
| ||||||||||||
Liabilities |
|
|
|
|
|
|
|
|
|
|
| ||||||||||||
Derivatives: c |
|
|
|
|
|
|
|
|
|
|
| ||||||||||||
Embedded derivatives in provisional sales/ |
|
|
|
|
|
|
|
|
|
|
| ||||||||||||
purchase contracts in a gross liability position d | $ | 48 | |
| $ | 48 | |
| $ | - | |
| $ | - | |
| $ | 48 | |
| $ | - | |
Copper futures and swap contracts | 5 | |
| 5 | |
| - | |
| 4 | |
| 1 | |
| - | | ||||||
Total | 53 | |
| 53 | |
| - | |
| 4 | |
| 49 | |
| - | | ||||||
|
|
|
|
|
|
|
|
|
|
|
| ||||||||||||
Long-term debt, including current portion e | 11,606 | |
| 11,406 | |
| - | |
| - | |
| 11,406 | |
| - | | ||||||
|
|
|
|
|
|
|
|
|
|
|
| ||||||||||||
15
Table of Contents
| At December 31, 2017 | ||||||||||||||||||||||
| Carrying |
| Fair Value | ||||||||||||||||||||
| Amount |
| Total |
| NAV |
| Level 1 |
| Level 2 |
| Level 3 | ||||||||||||
Assets |
|
|
|
|
|
|
|
|
|
|
| ||||||||||||
Investment securities: a,b |
|
|
|
|
|
|
|
|
|
|
| ||||||||||||
U.S. core fixed income fund | $ | 25 | |
| $ | 25 | |
| $ | 25 | |
| $ | - | |
| $ | - | |
| $ | - | |
Equity securities | 5 | |
| 5 | |
| - | |
| 5 | |
| - | |
| - | | ||||||
Total | 30 | |
| 30 | |
| 25 | |
| 5 | |
| - | |
| - | | ||||||
|
|
|
|
|
|
|
|
|
|
|
| ||||||||||||
Legally restricted funds: a |
|
|
|
|
|
|
|
|
|
|
| ||||||||||||
U.S. core fixed income fund | 55 | |
| 55 | |
| 55 | |
| - | |
| - | |
| - | | ||||||
Government bonds and notes | 40 | |
| 40 | |
| - | |
| - | |
| 40 | |
| - | | ||||||
Corporate bonds | 32 | |
| 32 | |
| - | |
| - | |
| 32 | |
| - | | ||||||
Government mortgage-backed securities | 27 | |
| 27 | |
| - | |
| - | |
| 27 | |
| - | | ||||||
Asset-backed securities | 15 | |
| 15 | |
| - | |
| - | |
| 15 | |
| - | | ||||||
Money market funds | 11 | |
| 11 | |
| - | |
| 11 | |
| - | |
| - | | ||||||
Collateralized mortgage-backed securities | 8 | |
| 8 | |
| - | |
| - | |
| 8 | |
| - | | ||||||
Municipal bonds | 1 | |
| 1 | |
| - | |
| - | |
| 1 | |
| - | | ||||||
Total | 189 | |
| 189 | |
| 55 | |
| 11 | |
| 123 | |
| - | | ||||||
|
|
|
|
|
|
|
|
|
|
|
| ||||||||||||
Derivatives: |
|
|
|
|
|
|
|
|
|
|
| ||||||||||||
Embedded derivatives in provisional sales/ |
|
|
|
|
|
|
|
|
|
|
| ||||||||||||
purchase contracts in a gross asset position c | 155 | |
| 155 | |
| - | |
| - | |
| 155 | |
| - | | ||||||
Copper futures and swap contracts c | 11 | |
| 11 | |
| - | |
| 9 | |
| 2 | |
| - | | ||||||
Copper forward contracts c | 1 | |
| 1 | |
| - | |
| - | |
| 1 | |
| - | | ||||||
Contingent consideration for the sales of TFHL |
|
|
|
|
|
|
|
|
|
|
| ||||||||||||
and onshore California oil and gas properties a | 108 | |
| 108 | |
| - | |
| - | |
| 108 | |
| - | | ||||||
Total | 275 | |
| 275 | |
| - | |
| 9 | |
| 266 | |
| - | | ||||||
|
|
|
|
|
|
|
|
|
|
|
| ||||||||||||
Contingent consideration for the sale of the |
|
|
|
|
|
|
|
|
|
|
| ||||||||||||
Deepwater GOM oil and gas properties a | 150 | |
| 134 | |
| - | |
| - | |
| - | |
| 134 | | ||||||
|
|
|
|
|
|
|
|
|
|
|
| ||||||||||||
Liabilities |
|
|
|
|
|
|
|
|
|
|
| ||||||||||||
Derivatives: c |
|
|
|
|
|
|
|
|
|
|
| ||||||||||||
Embedded derivatives in provisional sales/ |
|
|
|
|
|
|
|
|
|
|
| ||||||||||||
purchase contracts in a gross liability position d | $ | 31 | |
| $ | 31 | |
| $ | - | |
| $ | - | |
| $ | 31 | |
| $ | - | |
Copper forward contracts | 2 | |
| 2 | |
| - | |
| 1 | |
| 1 | |
| - | | ||||||
Total | 33 | |
| 33 | |
| - | |
| 1 | |
| 32 | |
| - | | ||||||
|
|
|
|
|
|
|
|
|
|
|
| ||||||||||||
Long-term debt, including current portion e | 13,117 | |
| 13,269 | |
| - | |
| - | |
| 13,269 | |
| - | | ||||||
|
|
|
|
|
|
|
|
|
|
|
| ||||||||||||
a. | Current portion included in other current assets and long-term portion included in other assets. |
b. | Excludes time deposits (which approximated fair value) included in (i) other current assets of $123 million at March 31, 2018 , and $52 million at December 31, 2017 , primarily associated with PT-FI's mine closure and reclamation guarantees and its disputed incremental export duty and (ii) other assets of $125 million at March 31, 2018 , and $123 million at December 31, 2017 , primarily associated with an assurance bond to support PT-FI's commitment for smelter development in Indonesia. |
c. | Refer to Note 6 for further discussion and balance sheet classifications. |
d. | Excludes embedded derivatives in provisional cobalt purchase contracts of $30 million at March 31, 2018 , and $24 million at December 31, 2017 (refer to Note 6 for further discussion). |
e. | Recorded at cost except for debt assumed in acquisitions, which were recorded at fair value at the respective acquisition dates. In addition, debt excludes $112 million at March 31, 2018 , and December 31, 2017 , related to assets held for sale (which approximated fair value). |
Valuation Techniques. The U.S. core fixed income fund is valued at NAV. The fund strategy seeks total return consisting of income and capital appreciation primarily by investing in a broad range of investment-grade debt securities, including U.S. government obligations, corporate bonds, mortgage-backed securities, asset-backed securities and money market instruments. There are no restrictions on redemptions (which are usually within one business day of notice).
16
Table of Contents
Money market funds are classified within Level 1 of the fair value hierarchy because they are valued using quoted market prices in active markets.
Equity securities are valued at the closing price reported on the active market on which the individual securities are traded and, as such, are classified within Level 1 of the fair value hierarchy.
Fixed income securities (government securities, corporate bonds, asset-backed securities, collateralized mortgage-backed securities and municipal bonds) are valued using a bid-evaluation price or a mid-evaluation price. A bid-evaluation price is an estimated price at which a dealer would pay for a security. A mid-evaluation price is the average of the estimated price at which a dealer would sell a security and the estimated price at which a dealer would pay for a security. These evaluations are based on quoted prices, if available, or models that use observable inputs and, as such, are classified within Level 2 of the fair value hierarchy.
FCX's embedded derivatives on provisional copper concentrate, copper cathode and gold purchases and sales are valued using only quoted monthly LME or COMEX copper forward prices and the London gold forward price at each reporting date based on the month of maturity (refer to Note 6 for further discussion); however, FCX's contracts themselves are not traded on an exchange. As a result, these derivatives are classified within Level 2 of the fair value hierarchy.
FCX's embedded derivatives on provisional cobalt purchases, included in assets held for sale, are valued using quoted monthly LME cobalt forward prices or average published Metals Bulletin cobalt prices, subject to certain adjustments as specified by the terms of the contracts, at each reporting date based on the month of maturity (Level 2).
FCX's derivative financial instruments for copper futures and swap contracts and copper forward contracts that are traded on the respective exchanges are classified within Level 1 of the fair value hierarchy because they are valued using quoted monthly COMEX or LME prices at each reporting date based on the month of maturity (refer to Note 6 for further discussion). Certain of these contracts are traded on the over-the-counter market and are classified within Level 2 of the fair value hierarchy based on COMEX and LME forward prices.
As reported in Note 2 of FCX's annual report on Form 10-K for the year ended December 31, 2017 , in November 2016, FCX's sale of its interest in TFHL included contingent consideration of up to $120 million in cash, consisting of $60 million if the average copper price exceeds $3.50 per pound and $60 million if the average cobalt price exceeds $20 per pound, both during calendar years 2018 and 2019 . Also in 2016, FCX Oil & Gas LLC's (FM O&G) sale of its onshore California oil and gas properties included contingent consideration of up to $150 million , consisting of $50 million per year for 2018, 2019 and 2020 if the price of Brent crude oil averages over $70 per barrel in each of these calendar years. Future changes in the fair value of the contingent consideration derivative for the sale of TFHL will continue to be recorded in discontinued operations and for the onshore California oil and gas properties will continue to be recorded in operating income. The fair value of the contingent consideration derivative was (i) $65 million at March 31, 2018 , and $74 million at December 31, 2017 , associated with the sale of TFHL and (ii) $45 million at March 31, 2018 , and $34 million at December 31, 2017 , associated with the sale of the onshore California oil and gas properties. The contingent consideration derivative was included in other assets in the consolidated balance sheets except for $18 million included in other current assets at March 31, 2018 . These fair values were calculated based on average commodity price forecasts through applicable maturity dates using a Monte Carlo simulation model. The models use various observable inputs, including Brent crude oil forward prices, historical copper and cobalt prices, volatilities, discount rates and settlement terms. As a result, these contingent consideration assets are classified within Level 2 of the fair value hierarchy.
As reported in Note 2 of FCX's annual report on Form 10-K for the year ended December 31, 2017 , in December 2016, FM O&G's sale of its Deepwater GOM oil and gas properties included up to $150 million in contingent consideration that was recorded at the total amount under the loss recovery approach. The contingent consideration will be received over time as future cash flows are realized in connection with a third-party production handling agreement for an offshore platform. The contingent consideration included in (i) other current assets totaled $21 million at March 31, 2018 , and $24 million at December 31, 2017 , and (ii) other assets totaled $129 million at March 31, 2018 , and $126 million at December 31, 2017 . The fair value of this contingent consideration was calculated based on a discounted cash flow model using inputs that include third-party estimates for reserves, production rates and production timing, and discount rates. Because significant inputs are not observable in the market, the contingent consideration is classified within Level 3 of the fair value hierarchy.
17
Table of Contents
Long-term debt, including current portion, is valued using available market quotes and, as such, is classified within Level 2 of the fair value hierarchy.
The techniques described above may produce a fair value calculation that may not be indicative of net realizable value or reflective of future fair values. Furthermore, while FCX believes its valuation techniques are appropriate and consistent with other market participants, the use of different techniques or assumptions to determine fair value of certain financial instruments could result in a different fair value measurement at the reporting date. There have been no changes in the techniques used at March 31, 2018 , as compared to those techniques used at December 31, 2017 .
A summary of the changes in the fair value of FCX's Level 3 instrument, contingent consideration for the sale of the Deepwater GOM oil and gas properties, during the first three months of 2018 follows (in millions):
Fair value at January 1, 2018 | $ | 134 | |
|
Net unrealized loss related to assets still held at the end of the period | (2 | ) |
| |
Fair value at March 31, 2018 | $ | 132 | |
|
NOTE 8. CONTINGENCIES AND COMMITMENTS
Litigation
During first-quarter 2018 , there were no significant updates to previously reported legal proceedings included in Note 12 of FCX's annual report on Form 10-K for the year ended December 31, 2017 , other than the matter below.
On April 1, 2016, a purported class action titled David Garcia v. Freeport-McMoRan Oil & Gas LLC was filed in the Superior Court of the State of California for the County of Santa Barbara (Case No. 16CV01305) against FM O&G LLC, an indirect wholly owned subsidiary of FCX. A former FM O&G LLC employee filed the case, which alleges violations of various California employment laws and seeks relief for past wages, overtime, penalties, interest and attorney's fees. The primary issue underlying the claims is whether compensation must be paid to non-exempt shift workers on platforms located offshore California on the outer-continental shelf for sleep time and other non-working time. In June 2016, FM O&G LLC removed the case to the U.S. District Court for the Central District of California, Santa Barbara (the District Court). In September 2016, the court dismissed the complaint on the grounds that all four FM O&G LLC platforms potentially involved are located in federal waters, that federal law, not state law, applies, and that federal law does not require an employer to compensate for non-work time. In October 2016, the plaintiff appealed the dismissal to the U.S. Court of Appeals for the Ninth Circuit. In June 2017, the Ninth Circuit stayed the Garcia case pending its decision in another case involving essentially the same legal issues, titled Newton v. Parker Drilling Management Services, Ltd . In February 2018, a three-judge panel of the Ninth Circuit ruled in favor of the plaintiffs in the Newton case. Because that decision conflicts with longstanding precedent in the Fifth Circuit and could set a precedent that will result in a reversal of the dismissal in the Garcia case, FM O&G LLC and others filed amicus briefs in April 2018 in support of Parker Drilling's petition for an en banc rehearing in the Newton case. The Ninth Circuit denied that request on April 27, 2018, but modified its original opinion noting that the question of whether the Ninth Circuit's holding should be applied retrospectively is reserved for the District Court's consideration on remand.
The amount of the exposure in Garcia is uncertain because FM O&G LLC has potential defenses to the claims even if state law would be applied; however, absent success on those defenses, FCX estimates that the exposure could be in the range of approximately $50 million to $80 million if California wage and hour law is applied retroactively to FM O&G LLC's operations offshore California. FCX has not established a reserve for this contingency because it believes that its legal position is correct and does not believe a loss is probable. FCX intends to vigorously defend this matter.
Tax and Other Matters
Cerro Verde Royalty Dispute and Other Peru Tax Matters
During first-quarter 2018 , there were no significant changes to the Cerro Verde royalty dispute and other Peru tax matters included in Note 12 of FCX's annual report on Form 10-K for the year ended December 31, 2017 .
18
Table of Contents
Indonesia Tax Matters
The following information includes a discussion of updates to previously reported Indonesia tax matters included in Note 12 of FCX's annual report on Form 10-K for the year ended December 31, 2017 .
PT-FI received assessments from the local regional tax authority in Papua, Indonesia, for additional taxes and penalties related to surface water taxes for the period from January 2011 through March 2018. PT-FI has filed or will file appeals of these assessments with the Indonesia Tax Court. During first-quarter 2018, the Indonesia Tax Court ruled partially in favor of PT-FI with respect to assessments for the period January 2016 through April 2016 by reducing these assessments to $13 million , including penalties (based on the exchange rate at March 31, 2018), or an approximate 40 percent reduction. Hearings in the Indonesia Tax Court are currently underway related to assessments for the period from May 2016 through April 2017.
During 2017, PT-FI filed petitions to the Indonesia Supreme Court with respect to assessments for the period from January 2011 through December 2015. In April 2018, the Indonesia Supreme Court posted on its website summaries of favorable decisions relating to surface water tax assessments for the period January 2011 through July 2015. PT-FI began receiving the official written decisions on April 18, 2018. The Supreme Court ruling concluded that PT-FI and the Indonesian government are bound by PT-FI's Contract of Work (COW), which is lex specialis, and prevails as the law for the parties to the COW that should be carried out in good faith. The Supreme Court decisions for the period January 2011 through July 2015 reduce the total remaining exposure for the period from August 2015 through March 2018 to $161 million , including $81 million in penalties. As of March 31, 2018 , no charges have been recorded for any assessments because PT-FI believes its COW exempts it from these payments. As of May 4, 2018 , PT-FI has not paid and does not intend to pay these assessments.
Indonesia Mining Contract. The following is the latest information related to PT-FI's COW (refer to Note 13 of FCX's annual report on Form 10-K for the year ended December 31, 2017 , for further discussion).
In August 2017, FCX and the Indonesian government reached an understanding on a framework that would replace the COW while providing PT-FI with long-term mining rights. This framework includes (i) conversion from the COW to a special license (IUPK) providing PT-FI with long-term mining rights through 2041; (ii) Indonesian government certainty of fiscal and legal terms during the term of the IUPK; (iii) PT-FI commitment to construct a new smelter in Indonesia within five years of reaching a definitive agreement; and (iv) divestment of 51 percent of the project area interests to Indonesian participants at fair market value, structured so that FCX retains control over operations and governance of PT-FI. Execution of a definitive agreement will require approval by the Board and PT-FI's joint venture partner, Rio Tinto, as well as the modification or revocation of current regulations and the implementation of new regulations by the Indonesian government. FCX cannot currently predict whether there will be any material accounting and tax impacts associated with the divestment.
In late 2017, the Indonesian government (including the regional government of Papua Province and Mimika Regency) and PT Indonesia Asahan Aluminium (Inalum), a state-owned enterprise, which leads the Indonesian government's consortium of investors, formed a special purpose company to acquire Grasberg project area interests. Inalum is wholly owned by the Indonesian government and currently holds 9.36 percent of PT-FI's outstanding common stock. FCX continues to engage with Inalum and Rio Tinto on potential arrangements that would result in the Inalum consortium acquiring interests that would meet the Indonesian government's 51 percent ownership objective in a manner satisfactory to all parties, and in a structure that would provide for continuity of FCX's management of PT-FI's operations and governance of the business. The parties continue to negotiate documentation on a comprehensive agreement for PT-FI's extended operations and to reach agreement on timing, process and governance matters relating to the divestment. The parties have a mutual objective of completing negotiations and the required documentation as soon as possible.
19
Table of Contents
In October 2017, Indonesia's Ministry of Environment and Forestry (the Ministry) notified PT-FI of administrative sanctions related to certain activities the Ministry indicated are not reflected in PT-FI's environmental permit. The Ministry also notified PT-FI that certain operational activities were inconsistent with factors set forth in PT-FI's environmental permitting studies and that additional monitoring and improvements need to be undertaken related to air quality, water drainage, treatment and handling of certain wastes, and tailings management. PT-FI has been engaged in a process to update its permits through submissions and dialogue with the Ministry that began in late 2014, and PT-FI believes that it has submitted the required documentation to update such permits. In April 2018, the Ministry issued decrees imposing unattainable environmental standards related to PT-FI's controlled riverine tailings management system. The decrees include a six-month transition period and conflict with PT-FI's approved environmental management programs and existing environmental permits. PT-FI is engaged in discussions with the Ministry regarding these actions, which PT-FI believes are contrary to the Indonesian government's obligations under PT-FI's COW. Resolution of these matters is a requirement for concluding a comprehensive agreement for PT-FI's extended operations.
In December 2017, the Indonesian government extended PT-FI's temporary IUPK to June 30, 2018, to enable normal operations to continue during the negotiation period. In February 2018, PT-FI's export license was extended to February 15, 2019. On February 28, 2018, PT Smelting (PT-FI's 25-percent-owned smelter and refinery in Indonesia) received an extension of its anode slimes export license through February 26, 2019.
Until a definitive agreement is reached, PT-FI has reserved all rights under its COW, including dispute resolution procedures. FCX cannot predict whether PT-FI will be successful in reaching a satisfactory agreement on the terms of its long-term mining rights. If PT-FI is unable to reach a definitive agreement with the Indonesian government on its long-term mining rights, FCX intends to reduce or defer investments significantly in its underground development projects and will pursue dispute resolution procedures under the COW.
NOTE 9. BUSINESS SEGMENTS
FCX has organized its mining operations into four primary divisions – North America copper mines, South America mining, Indonesia mining and Molybdenum mines, and operating segments that meet certain thresholds are reportable segments. Separately disclosed in the following tables are FCX's reportable segments, which include the Morenci, Cerro Verde and Grasberg (Indonesia Mining) copper mines, the Rod & Refining operations and Atlantic Copper Smelting & Refining.
Intersegment sales between FCX's business segments are based on terms similar to arms-length transactions with third parties at the time of the sale. Intersegment sales may not be reflective of the actual prices ultimately realized because of a variety of factors, including additional processing, timing of sales to unaffiliated customers and transportation premiums.
FCX defers recognizing profits on sales from its mines to other divisions, including Atlantic Copper (FCX's wholly owned smelter and refinery in Spain) and on 25 percent of PT-FI's sales to PT Smelting, until final sales to third parties occur. Quarterly variations in ore grades, the timing of intercompany shipments and changes in product prices result in variability in FCX's net deferred profits and quarterly earnings.
FCX allocates certain operating costs, expenses and capital expenditures to its operating divisions and individual segments. However, not all costs and expenses applicable to an operation are allocated. U.S. federal and state income taxes are recorded and managed at the corporate level (included in Corporate, Other & Eliminations), whereas foreign income taxes are recorded and managed at the applicable country level. In addition, most mining exploration and research activities are managed on a consolidated basis, and those costs, along with some selling, general and administrative costs, are not allocated to the operating divisions or individual segments. Accordingly, the following segment information reflects management determinations that may not be indicative of what the actual financial performance of each operating division or segment would be if it was an independent entity.
20
Table of Contents
Product Revenues. FCX's revenues attributable to the products it produced for the first quarters of 2018 and 2017 follow (in millions):
| Three Months Ended | ||||||
| March 31, | ||||||
| 2018 |
| 2017 | ||||
Copper: |
|
|
| ||||
Concentrate | $ | 1,647 | |
| $ | 981 | |
Cathode | 1,423 | |
| 1,041 | | ||
Rod and other refined copper products | 670 | |
| 624 | | ||
Gold | 808 | |
| 268 | | ||
Molybdenum | 286 | |
| 209 | | ||
Other a | 398 | |
| 231 | | ||
Adjustments to revenue: |
|
|
| ||||
Treatment charges | (132 | ) |
| (103 | ) | ||
Royalty expense b | (69 | ) |
| (22 | ) | ||
Export duties c | (46 | ) |
| (14 | ) | ||
Revenue from contracts with customers | 4,985 | |
| 3,215 | | ||
Embedded derivatives d | (117 | ) |
| 126 | | ||
Total consolidated revenues | $ | 4,868 | |
| $ | 3,341 | |
a. | Primarily includes revenues associated with cobalt, silver, oil, gas and natural gas liquids. |
b. | Reflects royalties for sales from PT-FI and Cerro Verde that will vary with the volume of metal sold and the prices of copper and gold. |
c. | Reflects export duties paid by PT-FI. |
d. | Refer to Note 6 for discussion of embedded derivatives related to FCX's provisionally priced concentrate and cathode sales contracts. |
|
|
|
|
|
|
|
|
|
|
|
|
|
|
|
|
|
|
|
|
|
|
|
|
|
21
Table of Contents
Financial Information by Business Segment
|
|
|
|
|
|
|
|
|
|
|
|
|
|
|
|
|
|
|
|
|
|
|
|
| ||||||||||||||||||||||||
(In millions) |
|
|
|
|
|
| ||||||||||||||||||||||||||||||||||||||||||
|
|
|
|
|
|
|
|
|
|
|
|
|
|
|
|
| ||||||||||||||||||||||||||||||||
|
|
|
|
|
|
|
|
|
|
|
|
|
|
|
|
|
|
| Atlantic |
| Corporate, |
|
|
| ||||||||||||||||||||||||
| North America Copper Mines |
| South America Mining |
|
|
|
|
|
|
| Copper |
| Other |
|
|
| ||||||||||||||||||||||||||||||||
|
|
|
|
|
|
| Cerro |
|
|
|
|
| Indonesia |
| Molybdenum |
| Rod & |
| Smelting |
| & Elimi- |
| FCX |
| ||||||||||||||||||||||||
| Morenci |
| Other |
| Total |
| Verde |
| Other |
| Total |
| Mining |
| Mines |
| Refining |
| & Refining |
| nations a |
| Total |
| ||||||||||||||||||||||||
Three Months Ended March 31, 2018 |
|
|
|
|
|
|
|
|
|
|
|
|
|
|
|
|
|
|
|
|
|
|
|
| ||||||||||||||||||||||||
Revenues: |
|
|
|
|
|
|
|
|
|
|
|
|
|
|
|
|
|
|
|
|
|
|
|
| ||||||||||||||||||||||||
Unaffiliated customers | $ | 3 | |
| $ | 15 | |
| $ | 18 | |
| $ | 625 | |
| $ | 150 | |
| $ | 775 | |
| $ | 1,521 | | b | $ | - | |
| $ | 1,385 | |
| $ | 577 | |
| $ | 592 | | c | $ | 4,868 | |
|
Intersegment | 601 | |
| 689 | |
| 1,290 | |
| 102 | |
| - | |
| 102 | |
| 52 | |
| 95 | |
| 8 | |
| 2 | |
| (1,549 | ) |
| - | |
| ||||||||||||
Production and delivery | 290 | |
| 501 | |
| 791 | |
| 427 | |
| 116 | |
| 543 | |
| 457 | |
| 67 | |
| 1,388 | |
| 556 | |
| (994 | ) |
| 2,808 | |
| ||||||||||||
Depreciation, depletion and amortization | 46 | |
| 48 | |
| 94 | |
| 105 | |
| 22 | |
| 127 | |
| 181 | |
| 19 | |
| 2 | |
| 7 | |
| 21 | |
| 451 | |
| ||||||||||||
Selling, general and administrative expenses | 1 | |
| 2 | |
| 3 | |
| 2 | |
| - | |
| 2 | |
| 39 | |
| - | |
| - | |
| 6 | |
| 81 | |
| 131 | |
| ||||||||||||
Mining exploration and research expenses | - | |
| 1 | |
| 1 | |
| - | |
| - | |
| - | |
| - | |
| - | |
| - | |
| - | |
| 20 | |
| 21 | |
| ||||||||||||
Environmental obligations and shutdown costs | - | |
| - | |
| - | |
| - | |
| - | |
| - | |
| - | |
| - | |
| - | |
| - | |
| 9 | |
| 9 | |
| ||||||||||||
Net gain on sales of assets | - | |
| - | |
| - | |
| - | |
| - | |
| - | |
| - | |
| - | |
| - | |
| - | |
| (11 | ) |
| (11 | ) |
| ||||||||||||
Operating income (loss) | 267 | |
| 152 | |
| 419 | |
| 193 | |
| 12 | |
| 205 | |
| 896 | |
| 9 | |
| 3 | |
| 10 | |
| (83 | ) |
| 1,459 | |
| ||||||||||||
|
|
|
|
|
|
|
|
|
|
|
|
|
|
|
|
|
|
|
|
|
|
|
|
| ||||||||||||||||||||||||
Interest expense, net | 1 | |
| - | |
| 1 | |
| 17 | |
| - | |
| 17 | |
| - | |
| - | |
| - | |
| 5 | |
| 128 | |
| 151 | |
| ||||||||||||
Provision for income taxes | - | |
| - | |
| - | |
| 68 | |
| 4 | |
| 72 | |
| 401 | |
| - | |
| - | |
| 1 | |
| 32 | |
| 506 | |
| ||||||||||||
Total assets at March 31, 2018 | 2,817 | |
| 4,340 | |
| 7,157 | |
| 8,740 | |
| 1,715 | |
| 10,455 | |
| 10,992 | |
| 1,836 | |
| 290 | |
| 809 | |
| 5,098 | | d | 36,637 | |
| ||||||||||||
Capital expenditures | 47 | |
| 45 | |
| 92 | |
| 63 | |
| 4 | |
| 67 | |
| 203 | |
| 1 | |
| 1 | |
| 4 | |
| 34 | |
| 402 | |
| ||||||||||||
|
|
|
|
|
|
|
|
|
|
|
|
|
|
|
|
|
|
|
|
|
|
|
|
| ||||||||||||||||||||||||
Three Months Ended March 31, 2017 |
|
|
|
|
|
|
|
|
|
|
|
|
|
|
|
|
|
|
|
|
|
|
|
| ||||||||||||||||||||||||
Revenues: |
|
|
|
|
|
|
|
|
|
|
|
|
|
|
|
|
|
|
|
|
|
|
|
| ||||||||||||||||||||||||
Unaffiliated customers | $ | 66 | |
| $ | 50 | |
| $ | 116 | |
| $ | 640 | |
| $ | 112 | |
| $ | 752 | |
| $ | 534 | | b | $ | - | |
| $ | 1,107 | |
| $ | 458 | | | $ | 374 | | c | $ | 3,341 | |
|
Intersegment | 416 | |
| 563 | |
| 979 | |
| 116 | |
| - | |
| 116 | |
| - | |
| 63 | |
| 8 | |
| - | |
| (1,166 | ) |
| - | |
| ||||||||||||
Production and delivery | 257 | |
| 409 | |
| 666 | |
| 391 | |
| 82 | |
| 473 | |
| 270 | |
| 52 | |
| 1,109 | |
| 436 | |
| (818 | ) |
| 2,188 | | e | ||||||||||||
Depreciation, depletion and amortization | 47 | |
| 69 | |
| 116 | |
| 112 | |
| 21 | |
| 133 | |
| 83 | |
| 19 | |
| 2 | |
| 7 | |
| 29 | |
| 389 | |
| ||||||||||||
Selling, general and administrative expenses | - | |
| 1 | |
| 1 | |
| 2 | |
| - | |
| 2 | |
| 30 | |
| - | |
| - | |
| 5 | |
| 113 | |
| 151 | |
| ||||||||||||
Mining exploration and research expenses | - | |
| 1 | |
| 1 | |
| - | |
| - | |
| - | |
| - | |
| - | |
| - | |
| - | |
| 13 | |
| 14 | |
| ||||||||||||
Environmental obligations and shutdown costs | - | |
| - | |
| - | |
| - | |
| - | |
| - | |
| - | |
| - | |
| - | |
| - | |
| 25 | |
| 25 | |
| ||||||||||||
Net gain on sales of assets | - | |
| - | |
| - | |
| - | |
| - | |
| - | |
| - | |
| - | |
| - | |
| - | |
| (23 | ) |
| (23 | ) |
| ||||||||||||
Operating income (loss) | 178 | |
| 133 | |
| 311 | |
| 251 | |
| 9 | |
| 260 | |
| 151 | |
| (8 | ) |
| 4 | |
| 10 | |
| (131 | ) |
| 597 | |
| ||||||||||||
|
|
|
|
|
|
|
|
|
|
|
|
|
|
|
|
|
|
|
|
|
|
|
|
| ||||||||||||||||||||||||
Interest expense, net | 1 | |
| - | |
| 1 | |
| 16 | |
| - | |
| 16 | |
| - | |
| - | |
| - | |
| 4 | |
| 146 | |
| 167 | |
| ||||||||||||
Provision for income taxes | - | |
| - | |
| - | |
| 98 | |
| 3 | |
| 101 | |
| 67 | |
| - | |
| - | |
| 1 | |
| 5 | |
| 174 | |
| ||||||||||||
Total assets at March 31, 2017 | 2,814 | |
| 4,361 | |
| 7,175 | |
| 9,081 | |
| 1,525 | |
| 10,606 | |
| 10,418 | |
| 1,917 | |
| 261 | |
| 652 | |
| 5,547 | | d | 36,576 | |
| ||||||||||||
Capital expenditures | 23 | |
| 5 | |
| 28 | |
| 14 | |
| 1 | |
| 15 | |
| 244 | |
| 1 | |
| 1 | |
| 8 | |
| 47 | |
| 344 | |
| ||||||||||||
a. | Includes U.S. oil and gas operations. |
b. | Includes PT-FI's sales to PT Smelting totaling $628 million in first-quarter 2018 and $258 million in first-quarter 2017 . |
c. | Includes revenues from FCX's molybdenum sales company, which includes sales of molybdenum produced by the Molybdenum mines and by certain of the North America and South America copper mines. |
d. | Includes assets held for sale totaling $708 million at March 31, 2018 , and $408 million at March 31, 2017 , primarily associated with Freeport Cobalt and the Kisanfu exploration project. |
e. | Includes a decrease of $12 million for the new guidance for the presentation of net periodic benefit cost for pension and other postretirement benefit plans (refer to Note 11 for further discussion). |
22
Table of Contents
NOTE 10. GUARANTOR FINANCIAL STATEMENTS
All of the senior notes issued by FCX are fully and unconditionally guaranteed on a senior basis jointly and severally by FM O&G LLC, as guarantor, which is a 100 -percent-owned subsidiary of FM O&G and FCX. The guarantee is an unsecured obligation of the guarantor and ranks equal in right of payment with all existing and future indebtedness of FM O&G LLC, including indebtedness under FCX's revolving credit facility. The guarantee ranks senior in right of payment with all of FM O&G LLC's future subordinated obligations and is effectively subordinated in right of payment to any debt of FM O&G LLC's subsidiaries. The indentures provide that FM O&G LLC's guarantee may be released or terminated for certain obligations under the following circumstances: (i) all or substantially all of the equity interests or assets of FM O&G LLC are sold to a third party; or (ii) FM O&G LLC no longer has any obligations under any FM O&G senior notes or any refinancing thereof and no longer guarantees any obligations of FCX under the revolving credit facility or any other senior debt or, in each case, any refinancing thereof.
The following condensed consolidating financial information includes information regarding FCX, as issuer, FM O&G LLC, as guarantor, and all other non-guarantor subsidiaries of FCX. Included are the condensed consolidating balance sheets at March 31, 2018 , and December 31, 2017 , and the related condensed consolidating statements of comprehensive income (loss), and the condensed consolidating statements of cash flows for the three months ended March 31, 2018 and 2017 (in millions), which should be read in conjunction with FCX's notes to the consolidated financial statements.
CONDENSED CONSOLIDATING BALANCE SHEET
March 31, 2018
| FCX |
| FM O&G LLC |
| Non-guarantor |
|
|
| Consolidated | ||||||||||
| Issuer |
| Guarantor |
| Subsidiaries |
| Eliminations |
| FCX | ||||||||||
ASSETS |
|
|
|
|
|
|
|
|
| ||||||||||
Current assets | $ | 544 | |
| $ | 714 | |
| $ | 10,012 | |
| $ | (1,164 | ) |
| $ | 10,106 | |
Property, plant, equipment and mine development costs, net | 14 | |
| 7 | |
| 22,780 | |
| (9 | ) |
| 22,792 | | |||||
Investments in consolidated subsidiaries | 18,668 | |
| - | |
| - | |
| (18,668 | ) |
| - | | |||||
Other assets | 561 | |
| 34 | |
| 3,255 | |
| (111 | ) |
| 3,739 | | |||||
Total assets | $ | 19,787 | |
| $ | 755 | |
| $ | 36,047 | |
| $ | (19,952 | ) |
| $ | 36,637 | |
|
|
|
|
|
|
|
|
|
| ||||||||||
LIABILITIES AND EQUITY |
|
|
|
|
|
|
|
|
| ||||||||||
Current liabilities | $ | 621 | |
| $ | 117 | |
| $ | 4,831 | |
| $ | (1,225 | ) |
| $ | 4,344 | |
Long-term debt, less current portion | 9,594 | |
| 6,574 | |
| 5,013 | |
| (10,058 | ) |
| 11,123 | | |||||
Deferred income taxes | 745 | | a | - | |
| 2,897 | |
| - | |
| 3,642 | | |||||
Environmental and asset retirement obligations, less current portion | - | |
| 203 | |
| 3,427 | |
| - | |
| 3,630 | | |||||
Investments in consolidated subsidiaries | - | |
| 860 | |
| 10,338 | |
| (11,198 | ) |
| - | | |||||
Other liabilities | 171 | |
| 3,339 | |
| 1,948 | |
| (3,486 | ) |
| 1,972 | | |||||
Total liabilities | 11,131 | |
| 11,093 | |
| 28,454 | |
| (25,967 | ) |
| 24,711 | | |||||
|
|
|
|
|
|
|
|
|
| ||||||||||
Equity: |
|
|
|
|
|
|
|
|
| ||||||||||
Stockholders' equity | 8,656 | |
| (10,338 | ) |
| 4,901 | |
| 5,437 | |
| 8,656 | | |||||
Noncontrolling interests | - | |
| - | |
| 2,692 | |
| 578 | |
| 3,270 | | |||||
Total equity | 8,656 | |
| (10,338 | ) |
| 7,593 | |
| 6,015 | |
| 11,926 | | |||||
Total liabilities and equity | $ | 19,787 | |
| $ | 755 | |
| $ | 36,047 | |
| $ | (19,952 | ) |
| $ | 36,637 | |
a. | All U.S.-related deferred income taxes are recorded at the parent company. |
23
Table of Contents
CONDENSED CONSOLIDATING BALANCE SHEET
December 31, 2017
| FCX |
| FM O&G LLC |
| Non-guarantor |
|
|
| Consolidated | ||||||||||
| Issuer |
| Guarantor |
| Subsidiaries |
| Eliminations |
| FCX | ||||||||||
ASSETS |
|
|
|
|
|
|
|
|
| ||||||||||
Current assets | $ | 75 | |
| $ | 671 | |
| $ | 10,823 | |
| $ | (790 | ) |
| $ | 10,779 | |
Property, plant, equipment and mine development costs, net | 14 | |
| 11 | |
| 22,829 | |
| (10 | ) |
| 22,844 | | |||||
Investments in consolidated subsidiaries | 19,570 | |
| - | |
| - | |
| (19,570 | ) |
| - | | |||||
Other assets | 943 | |
| 48 | |
| 3,179 | |
| (491 | ) |
| 3,679 | | |||||
Total assets | $ | 20,602 | |
| $ | 730 | |
| $ | 36,831 | |
| $ | (20,861 | ) |
| $ | 37,302 | |
|
|
|
|
|
|
|
|
|
| ||||||||||
LIABILITIES AND EQUITY |
|
|
|
|
|
|
|
|
| ||||||||||
Current liabilities | $ | 1,683 | |
| $ | 220 | |
| $ | 4,073 | |
| $ | (938 | ) |
| $ | 5,038 | |
Long-term debt, less current portion | 10,021 | |
| 6,512 | |
| 5,440 | |
| (10,270 | ) |
| 11,703 | | |||||
Deferred income taxes | 748 | | a | - | |
| 2,874 | |
| - | |
| 3,622 | | |||||
Environmental and asset retirement obligations, less current portion | - | |
| 201 | |
| 3,430 | |
| - | |
| 3,631 | | |||||
Investments in consolidated subsidiary | - | |
| 853 | |
| 10,397 | |
| (11,250 | ) |
| - | | |||||
Other liabilities | 173 | |
| 3,340 | |
| 1,987 | |
| (3,488 | ) |
| 2,012 | | |||||
Total liabilities | 12,625 | |
| 11,126 | |
| 28,201 | |
| (25,946 | ) |
| 26,006 | | |||||
|
|
|
|
|
|
|
|
|
| ||||||||||
Equity: |
|
|
|
|
|
|
|
|
| ||||||||||
Stockholders' equity | 7,977 | |
| (10,396 | ) |
| 5,916 | |
| 4,480 | |
| 7,977 | | |||||
Noncontrolling interests | - | |
| - | |
| 2,714 | |
| 605 | |
| 3,319 | | |||||
Total equity | 7,977 | |
| (10,396 | ) |
| 8,630 | |
| 5,085 | |
| 11,296 | | |||||
Total liabilities and equity | $ | 20,602 | |
| $ | 730 | |
| $ | 36,831 | |
| $ | (20,861 | ) |
| $ | 37,302 | |
a. | All U.S.-related deferred income taxes are recorded at the parent company. |
24
Table of Contents
Three Months Ended March 31, 2018 |
|
|
|
|
|
|
|
|
| ||||||||||
| FCX |
| FM O&G LLC |
| Non-guarantor |
|
|
| Consolidated | ||||||||||
| Issuer |
| Guarantor |
| Subsidiaries |
| Eliminations |
| FCX | ||||||||||
Revenues | $ | - | |
| $ | 15 | |
| $ | 4,853 | |
| $ | - | |
| $ | 4,868 | |
Total costs and expenses | 9 | |
| 8 | |
| 3,393 | |
| (1 | ) |
| 3,409 | | |||||
Operating (loss) income | (9 | ) |
| 7 | |
| 1,460 | |
| 1 | |
| 1,459 | | |||||
Interest expense, net | (104 | ) |
| (64 | ) |
| (85 | ) |
| 102 | |
| (151 | ) | |||||
Other income (expense), net | 101 | |
| - | |
| 29 | |
| (102 | ) |
| 28 | | |||||
(Loss) income before income taxes and equity in affiliated companies' net earnings (losses) | (12 | ) |
| (57 | ) |
| 1,404 | |
| 1 | |
| 1,336 | | |||||
(Provision for) benefit from income taxes | (83 | ) |
| 12 | |
| (435 | ) |
| - | |
| (506 | ) | |||||
Equity in affiliated companies' net earnings (losses) | 787 | |
| (6 | ) |
| (34 | ) |
| (749 | ) |
| (2 | ) | |||||
Net income (loss) from continuing operations | 692 | |
| (51 | ) |
| 935 | |
| (748 | ) |
| 828 | | |||||
Net loss from discontinued operations | - | |
| - | |
| (11 | ) |
| - | |
| (11 | ) | |||||
Net income (loss) | 692 | |
| (51 | ) |
| 924 | |
| (748 | ) |
| 817 | | |||||
Net income attributable to noncontrolling interests: |
|
|
|
|
|
|
|
|
| ||||||||||
Continuing operations | - | |
| - | |
| (71 | ) |
| (54 | ) |
| (125 | ) | |||||
Net income (loss) attributable to common stockholders | $ | 692 | |
| $ | (51 | ) |
| $ | 853 | |
| $ | (802 | ) |
| $ | 692 | |
|
|
|
|
|
|
|
|
|
| ||||||||||
Other comprehensive income (loss) | 12 | |
| - | |
| 12 | |
| (12 | ) |
| 12 | | |||||
Total comprehensive income (loss) | $ | 704 | |
| $ | (51 | ) |
| $ | 865 | |
| $ | (814 | ) |
| $ | 704 | |
|
|
|
|
|
|
|
|
|
| ||||||||||
Three Months Ended March 31, 2017 |
|
|
|
|
|
|
|
|
| ||||||||||
| FCX |
| FM O&G LLC |
| Non-guarantor |
|
|
| Consolidated | ||||||||||
| Issuer |
| Guarantor |
| Subsidiaries |
| Eliminations |
| FCX | ||||||||||
Revenues | $ | - | |
| $ | 13 | |
| $ | 3,328 | |
| $ | - | |
| $ | 3,341 | |
Total costs and expenses | 8 | |
| 50 | |
| 2,684 | |
| 2 | |
| 2,744 | | |||||
Operating (loss) income | (8 | ) |
| (37 | ) |
| 644 | |
| (2 | ) |
| 597 | | |||||
Interest expense, net | (122 | ) |
| (53 | ) |
| (71 | ) |
| 79 | |
| (167 | ) | |||||
Other income (expense), net | 78 | |
| - | |
| 9 | |
| (79 | ) |
| 8 | | |||||
(Loss) income before income taxes and equity in affiliated companies' net earnings (losses) | (52 | ) |
| (90 | ) |
| 582 | |
| (2 | ) |
| 438 | | |||||
(Provision for) benefit from income taxes | (60 | ) |
| 31 | |
| (146 | ) |
| 1 | |
| (174 | ) | |||||
Equity in affiliated companies' net earnings (losses) | 340 | |
| 20 | |
| (36 | ) |
| (320 | ) |
| 4 | | |||||
Net income (loss) from continuing operations | 228 | |
| (39 | ) |
| 400 | |
| (321 | ) |
| 268 | | |||||
Net income from discontinued operations | - | |
| - | |
| 38 | |
| - | |
| 38 | | |||||
Net income (loss) | 228 | |
| (39 | ) |
| 438 | |
| (321 | ) |
| 306 | | |||||
Net income attributable to noncontrolling interests: |
|
|
|
|
|
|
|
|
| ||||||||||
Continuing operations | - | |
| - | |
| (65 | ) |
| (10 | ) |
| (75 | ) | |||||
Discontinued operations | - | |
| - | |
| (3 | ) |
| - | |
| (3 | ) | |||||
Net income (loss) attributable to common stockholders | $ | 228 | |
| $ | (39 | ) |
| $ | 370 | |
| $ | (331 | ) |
| $ | 228 | |
|
|
|
|
|
|
|
|
|
| ||||||||||
Other comprehensive income (loss) | 11 | |
| - | |
| 11 | |
| (11 | ) |
| 11 | | |||||
Total comprehensive income (loss) | $ | 239 | |
| $ | (39 | ) |
| $ | 381 | |
| $ | (342 | ) |
| $ | 239 | |
|
|
|
|
|
|
|
|
|
| ||||||||||
25
Table of Contents
CONDENSED CONSOLIDATING STATEMENTS OF CASH FLOWS
Three Months Ended March 31, 2018 |
|
|
|
|
|
|
|
|
| ||||||||||
| FCX |
| FM O&G LLC |
| Non-guarantor |
|
|
| Consolidated | ||||||||||
| Issuer |
| Guarantor |
| Subsidiaries |
| Eliminations |
| FCX | ||||||||||
Net cash (used in) provided by operating activities | $ | (156 | ) |
| $ | (70 | ) |
| $ | 1,595 | |
| $ | - | |
| $ | 1,369 | |
|
|
|
|
|
|
|
|
|
| ||||||||||
Cash flow from investing activities: |
|
|
|
|
|
|
|
|
| ||||||||||
Capital expenditures | - | |
| - | |
| (402 | ) |
| - | |
| (402 | ) | |||||
Intercompany loans | (184 | ) |
| - | |
| - | |
| 184 | |
| - | | |||||
Dividends from (investments in) consolidated subsidiaries | 1,746 | |
| - | |
| 23 | |
| (1,769 | ) |
| - | | |||||
Asset sales and other, net | - | |
| - | |
| (90 | ) |
| - | |
| (90 | ) | |||||
Net cash provided by (used in) investing activities | 1,562 | |
| - | |
| (469 | ) |
| (1,585 | ) |
| (492 | ) | |||||
|
|
|
|
|
|
|
|
|
| ||||||||||
Cash flow from financing activities: |
|
|
|
|
|
|
|
|
| ||||||||||
Proceeds from debt | - | |
| - | |
| 122 | |
| - | |
| 122 | | |||||
Repayments of debt | (1,409 | ) |
| - | |
| (224 | ) |
| - | |
| (1,633 | ) | |||||
Intercompany loans | - | |
| 62 | |
| 122 | |
| (184 | ) |
| - | | |||||
Cash dividends paid and contributions received, net | - | |
| - | |
| (1,835 | ) |
| 1,755 | |
| (80 | ) | |||||
Other, net | 3 | |
| - | |
| (14 | ) |
| 14 | |
| 3 | | |||||
Net cash (used in) provided by financing activities | (1,406 | ) |
| 62 | |
| (1,829 | ) |
| 1,585 | |
| (1,588 | ) | |||||
|
|
|
|
|
|
|
|
|
| ||||||||||
Net decrease in cash, cash equivalents, restricted cash and restricted cash equivalents | - | |
| (8 | ) |
| (703 | ) |
| - | |
| (711 | ) | |||||
Decrease in cash and cash equivalents in assets held for sale | - | |
| - | |
| 32 | |
| - | |
| 32 | | |||||
Cash, cash equivalents, restricted cash and restricted cash equivalents at beginning of year | - | |
| 8 | |
| 4,623 | |
| - | |
| 4,631 | | |||||
Cash, cash equivalents, restricted cash and restricted cash equivalents at end of period | $ | - | |
| $ | - | |
| $ | 3,952 | |
| $ | - | |
| $ | 3,952 | |
Three Months Ended March 31, 2017 |
|
|
|
|
|
|
|
|
| ||||||||||
| FCX |
| FM O&G LLC |
| Non-guarantor |
|
|
| Consolidated | ||||||||||
| Issuer |
| Guarantor |
| Subsidiaries |
| Eliminations |
| FCX | ||||||||||
Net cash (used in) provided by operating activities | $ | (112 | ) |
| $ | (200 | ) |
| $ | 1,104 | |
| $ | - | |
| $ | 792 | |
|
|
|
|
|
|
|
|
|
| ||||||||||
Cash flow from investing activities: |
|
|
|
|
|
|
|
|
| ||||||||||
Capital expenditures | - | |
| (10 | ) |
| (334 | ) |
| - | |
| (344 | ) | |||||
Intercompany loans | (277 | ) |
| - | |
| - | |
| 277 | |
| - | | |||||
Dividends from (investments in) consolidated subsidiaries | 894 | |
| - | |
| 26 | |
| (920 | ) |
| - | | |||||
Asset sales and other, net | - | |
| (23 | ) |
| 6 | |
| - | |
| (17 | ) | |||||
Net cash provided by (used in) investing activities | 617 | |
| (33 | ) |
| (302 | ) |
| (643 | ) |
| (361 | ) | |||||
|
|
|
|
|
|
|
|
|
| ||||||||||
Cash flow from financing activities: |
|
|
|
|
|
|
|
|
| ||||||||||
Proceeds from debt | - | |
| - | |
| 157 | |
| - | |
| 157 | | |||||
Repayments of debt | (499 | ) |
| - | |
| (316 | ) |
| - | |
| (815 | ) | |||||
Intercompany loans | - | |
| 236 | |
| 41 | |
| (277 | ) |
| - | | |||||
Cash dividends paid and contributions received, net | (1 | ) |
| - | |
| (895 | ) |
| 880 | |
| (16 | ) | |||||
Other, net | (5 | ) |
| (6 | ) |
| (34 | ) |
| 40 | |
| (5 | ) | |||||
Net cash (used in) provided by financing activities | (505 | ) |
| 230 | |
| (1,047 | ) |
| 643 | |
| (679 | ) | |||||
|
|
|
|
|
|
|
|
|
| ||||||||||
Net decrease in cash, cash equivalents, restricted cash and restricted cash equivalents | - | |
| (3 | ) |
| (245 | ) |
| - | |
| (248 | ) | |||||
Decrease in cash and cash equivalents in assets held for sale | - | |
| - | |
| 8 | |
| - | |
| 8 | | |||||
Cash, cash equivalents, restricted cash and restricted cash equivalents at beginning of year | - | |
| 11 | |
| 4,392 | |
| - | |
| 4,403 | | |||||
Cash, cash equivalents, restricted cash and restricted cash equivalents at end of period | $ | - | |
| $ | 8 | |
| $ | 4,155 | |
| $ | - | |
| $ | 4,163 | |
|
|
|
|
|
|
|
|
|
|
|
|
|
|
|
|
|
|
|
|
26
Table of Contents
NOTE 11. NEW ACCOUNTING STANDARDS
Revenue Recognition. In May 2014, the Financial Accounting Standards Board (FASB) issued a new Accounting Standards Update (ASU) related to revenue recognition. FCX adopted this standard effective January 1, 2018, under the modified retrospective approach applied to contracts that remain in force at the adoption date. The adoption of this standard did not result in any financial statement impacts or changes to FCX's revenue recognition policies or processes as revenue is primarily derived from arrangements in which the transfer of control coincides with the fulfillment of performance obligations (refer to Note 1 of FCX's annual report on Form 10-K for disclosure of FCX's revenue recognition policy). In connection with the adoption of the standard and consistent with FCX's policy prior to adoption of the standard, FCX has elected to account for shipping and handling activities performed after control of goods has been transferred to a customer as a fulfillment cost recorded in production and delivery costs on the consolidated statements of income.
FCX recognizes revenue for all of its products upon transfer of control in an amount that reflects the consideration it expects to receive in exchange for those products. Transfer of control is in accordance with the terms of customer contracts, which is generally upon shipment or delivery of the product. While payment terms vary by contract, terms generally include payment to be made within 30 days, but not longer than 60 days. Certain of FCX's concentrate and cathode sales contracts also provide for provisional pricing, which is accounted for as an embedded derivative (refer to Note 6 for further discussion). For provisionally priced sales, 90 percent to 100 percent of the provisional payment is made upon shipment or within 20 days, and final balances are settled in a contractually specified future month (generally one to four months from the shipment date) based on quoted monthly average spot copper prices on the LME or COMEX and the London gold price. FCX's product revenues are also recorded net of treatment charges, royalties and export duties. Refer to Note 9 for a summary of revenue by product type.
Financial Instruments. In January 2016, FASB issued an ASU that amends the guidance on the classification and measurement of financial instruments. This ASU makes limited changes to prior guidance and amends certain disclosure requirements. FCX adopted this ASU effective January 1, 2018, and adoption did not have a material impact on its financial statements.
|
| Previously Reported |
| Impact of Adoption |
| Current Presentation | ||||||
Other, net included in cash flow from investing activities |
| $ | (21 | ) |
| $ | 4 | |
| $ | (17 | ) |
Cash flow from investing activities |
| (365 | ) |
| 4 | |
| (361 | ) | |||
Net decrease in cash, cash equivalents, restricted cash and restricted cash equivalents |
| (252 | ) |
| 4 | |
| (248 | ) | |||
Cash, cash equivalents, restricted cash and restricted cash equivalents at beginning of year |
| 4,245 | |
| 158 | |
| 4,403 | | |||
Cash, cash equivalents, restricted cash and restricted cash equivalents at end of period |
| 4,001 | |
| 162 | |
| 4,163 | | |||
|
|
|
|
|
|
| ||||||
27
Table of Contents
|
| Previously Reported |
| Impact of Adoption |
| Current Presentation | ||||||
Production and delivery |
| $ | 2,200 | |
| $ | (12 | ) |
| $ | 2,188 | |
Total cost of sales |
| 2,589 | |
| (12 | ) |
| 2,577 | | |||
Selling, general and administrative expenses |
| 153 | |
| (2 | ) |
| 151 | | |||
Mining exploration and research expenses |
| 15 | |
| (1 | ) |
| 14 | | |||
Environmental obligations and shutdown costs |
| 27 | |
| (2 | ) |
| 25 | | |||
Total costs and expenses |
| 2,761 | |
| (17 | ) |
| 2,744 | | |||
Operating income |
| 580 | |
| 17 | |
| 597 | | |||
Other income, net |
| 25 | |
| (17 | ) |
| 8 | | |||
NOTE 12. SUBSEQUENT EVENTS
FCX evaluated events after March 31, 2018 , and through the date the consolidated financial statements were issued, and determined any events or transactions occurring during this period that would require recognition or disclosure are appropriately addressed in these consolidated financial statements.
28
Table of Contents
REPORT OF INDEPENDENT REGISTERED PUBLIC ACCOUNTING FIRM
TO THE BOARD OF DIRECTORS AND STOCKHOLDERS OF
FREEPORT-McMoRan INC.
Results of Review of Interim Financial Statements
We have reviewed the accompanying consolidated balance sheet of Freeport-McMoRan Inc. (the Company) as of March 31, 2018 , the related consolidated statements of income, comprehensive income and cash flows for the three-month periods ended March 31, 2018 and 2017 , the consolidated statement of equity for the three-month period ended March 31, 2018, and the related notes (collectively referred to as the "consolidated interim financial statements"). Based on our reviews, we are not aware of any material modifications that should be made to the consolidated interim financial statements for them to be in conformity with U.S. generally accepted accounting principles.
We have previously audited, in accordance with the standards of the Public Company Accounting Oversight Board (United States) (PCAOB), the consolidated balance sheet of the Company as of December 31, 2017 , the related consolidated statements of operations, comprehensive income (loss), cash flows and equity for the year then ended, and the related notes (not presented herein); and in our report dated February 20, 2018, we expressed an unqualified audit opinion on those consolidated financial statements. In our opinion, the information set forth in the accompanying consolidated balance sheet as of December 31, 2017 , is fairly stated, in all material respects, in relation to the consolidated balance sheet from which it has been derived.
Basis for Review Results
These financial statements are the responsibility of the Company's management. We are a public accounting firm registered with the PCAOB and are required to be independent with respect to the Company in accordance with the U.S. federal securities laws and the applicable rules and regulations of the SEC and the PCAOB. We conducted our review in accordance with the standards of the PCAOB. A review of interim financial statements consists principally of applying analytical procedures and making inquiries of persons responsible for financial and accounting matters. It is substantially less in scope than an audit conducted in accordance with the standards of the PCAOB, the objective of which is the expression of an opinion regarding the financial statements taken as a whole. Accordingly, we do not express such an opinion.
/s/ ERNST & YOUNG LLP
Phoenix, Arizona
May 4, 2018
29
Table of Contents
Item 2. | Management's Discussion and Analysis of Financial Condition and Results of Operations. |
In Management's Discussion and Analysis of Financial Condition and Results of Operations (MD&A), "we," "us" and "our" refer to Freeport-McMoRan Inc. (FCX) and its consolidated subsidiaries. You should read this discussion in conjunction with our consolidated financial statements, the related MD&A and the discussion of our Business and Properties in our annual report on Form 10-K for the year ended December 31, 2017 , filed with the United States (U.S.) Securities and Exchange Commission (SEC). The results of operations reported and summarized below are not necessarily indicative of future operating results (refer to "Cautionary Statement" for further discussion). References to "Notes" are Notes included in our Notes to Consolidated Financial Statements. Throughout MD&A, all references to income or losses per share are on a diluted basis.
OVERVIEW
We are a leading international mining company with headquarters in Phoenix, Arizona. We operate large, long-lived, geographically diverse assets with significant proven and probable reserves of copper, gold and molybdenum. We are the world's largest publicly traded copper producer. Our portfolio of assets includes the Grasberg minerals district in Indonesia, one of the world's largest copper and gold deposits; and significant mining operations in the Americas, including the large-scale Morenci minerals district in North America and the Cerro Verde operation in South America.
Net income attributable to common stock totaled $692 million in first-quarter 2018 and $228 million in first-quarter 2017 . First-quarter 2018 , compared with the 2017 period, benefited from higher copper and gold sales volumes and copper prices, partly offset by higher foreign income tax expense. Refer to "Consolidated Results" for further discussion.
During first-quarter 2018 , we repaid borrowings totaling $1.5 billion, and in April 2018, we redeemed $404 million of senior notes due 2022 and $50 million of senior notes due 2023. During first-quarter 2018 , our Board of Directors (Board) also reinstated a cash dividend on our common stock, and declared a quarterly cash dividend of $0.05 per share that was paid on May 1, 2018. Refer to Note 5 for further discussion.
At March 31, 2018 , we had $3.7 billion in consolidated cash and cash equivalents and $11.6 billion in total debt. We had no borrowings and $3.5 billion available under our revolving credit facility. In April 2018, we entered into a new $3.5 billion, five-year, unsecured revolving credit facility with substantially similar structure and terms as our prior credit facility. Refer to Note 5 for further discussion.
We believe that we have a high-quality portfolio of long-lived copper assets positioned to generate long-term value. We continue to advance a project to develop the Lone Star oxide ores near the Safford operation in eastern Arizona. We are also pursuing other opportunities to enhance our mines' net present values, and we continue to advance studies for future development of our copper resources, the timing of which will be dependent on market conditions.
As further discussed in Note 8, we continue to actively engage with Indonesian government officials to address regulatory changes that conflict with PT Freeport Indonesia's (PT-FI) contractual rights in a manner that provides long-term stability for its operations and investment plans, and protects value for our stockholders. The parties have a mutual objective of completing negotiations and the required documentation as soon as possible. In December 2017, PT-FI was granted an extension of its temporary special license (IUPK) through June 30, 2018, to enable normal operations to continue during the negotiation period. In February 2018, PT-FI's export license was extended to February 15, 2019. Until a definitive agreement is reached, PT-FI has reserved all rights under its Contract of Work (COW), including dispute resolution procedures.
As further discussed in Note 8, PT-FI is engaged in discussions with Indonesia's Ministry of Environment and Forestry regarding PT-FI's controlled riverine tailings management system. Resolution of these matters is a requirement for concluding a comprehensive agreement for PT-FI's extended operations.
30
Table of Contents
OUTLOOK
We continue to view the long-term outlook for our business positively, supported by limitations on supplies of copper and by the requirements for copper in the world's economy. Our financial results vary as a result of fluctuations in market prices primarily for copper, gold and molybdenum, as well as other factors. World market prices for these commodities have fluctuated historically and are affected by numerous factors beyond our control. Because we cannot control the price of our products, the key measures that management focuses on in operating our business are sales volumes, unit net cash costs, operating cash flow and capital expenditures.
Projections for 2018 and other forward looking statements in this quarterly report on Form 10-Q assume resolution of PT-FI's long-term mining rights or an extension of its temporary IUPK after June 30, 2018. Refer to Note 8 for further discussion of Indonesia regulatory matters, which could have a significant impact on future results. For other important factors that could cause results to differ materially from projections, refer to "Cautionary Statement."
Consolidated Sales Volumes
Following are our projected consolidated sales volumes for the year 2018 :
Copper (millions of recoverable pounds): |
|
| |
North America copper mines | 1,475 | |
|
South America mining | 1,205 | |
|
Indonesia mining | 1,150 | |
|
Total | 3,830 | |
|
|
|
| |
Gold (thousands of recoverable ounces) | 2,430 | |
|
|
|
| |
Molybdenum (millions of recoverable pounds) | 95 | | a |
a. | Projected molybdenum sales include 35 million pounds produced by our Molybdenum mines and 60 million pounds produced by our North America and South America copper mines. |
Consolidated sales volumes for second-quarter 2018 are expected to approximate 970 million pounds of copper, 700 thousand ounces of gold and 24 million pounds of molybdenum.
Consolidated Unit Net Cash Costs
Assuming average prices of $1,300 per ounce of gold and $12.00 per pound of molybdenum for the remainder of 2018 and achievement of current sales volume and cost estimates, consolidated unit net cash costs (net of by-product credits) for our copper mines are expected to average $1.01 per pound of copper for the year 2018 . The impact of price changes for the remainder of 2018 on consolidated unit net cash costs would approximate $0.025 per pound for each $50 per ounce change in the average price of gold and $0.02 per pound for each $2 per pound change in the average price of molybdenum. Quarterly unit net cash costs vary with fluctuations in sales volumes and realized prices, primarily for gold and molybdenum. Refer to "Consolidated Results – Production and Delivery Costs" for further discussion of consolidated production costs for our mining operations.
Consolidated Operating Cash Flow
Our consolidated operating cash flows vary with sales volumes, prices realized from copper, gold and molybdenum sales, production costs, income taxes, other working capital changes and other factors. Based on current sales volume and cost estimates, and assuming average prices of $3.15 per pound of copper, $1,300 per ounce of gold and $12.00 per pound of molybdenum for the remainder of 2018 , our consolidated operating cash flows are estimated to approximate $5.6 billion for the year 2018 (including $0.2 billion in working capital sources and timing of other tax payments). Projected consolidated operating cash flows for the year 2018 also reflect an estimated income tax provision of $2.1 billion (refer to "Consolidated Results – Income Taxes" for further discussion of our projected income tax rate for the year 2018 ). The impact of price changes during the remainder of 2018 on operating cash flows would approximate $250 million for each $0.10 per pound change in the average price of copper, $90 million for each $50 per ounce change in the average price of gold and $85 million for each $2 per pound change in the average price of molybdenum.
Consolidated Capital Expenditures
Consolidated capital expenditures are expected to approximate $2.0 billion for the year 2018 , including $1.1 billion for major mining projects primarily associated with underground development activities in the Grasberg minerals district and development of the Lone Star oxide project. If PT-FI is unable to reach a definitive agreement with the
31
Table of Contents
Indonesian government on its long-term mining rights, we intend to reduce or defer investments significantly in underground development projects and will pursue dispute resolution procedures under PT-FI's COW.
MARKETS
World prices for copper, gold and molybdenum can fluctuate significantly. During the period from January 2008 through March 2018 , the London Metal Exchange (LME) spot copper price varied from a low of $1.26 per pound in 2008 to a record high of $4.60 per pound in 2011; the London Bullion Market Association (London) PM gold price fluctuated from a low of $713 per ounce in 2008 to a record high of $1,895 per ounce in 2011; and the Metals Week Molybdenum Dealer Oxide weekly average price ranged from a low of $4.46 per pound in 2015 to a high of $33.88 per pound in 2008. Copper, gold and molybdenum prices are affected by numerous factors beyond our control as described further in "Risk Factors" contained in Part I, Item 1A. of our annual report on Form 10-K for the year ended December 31, 2017 .
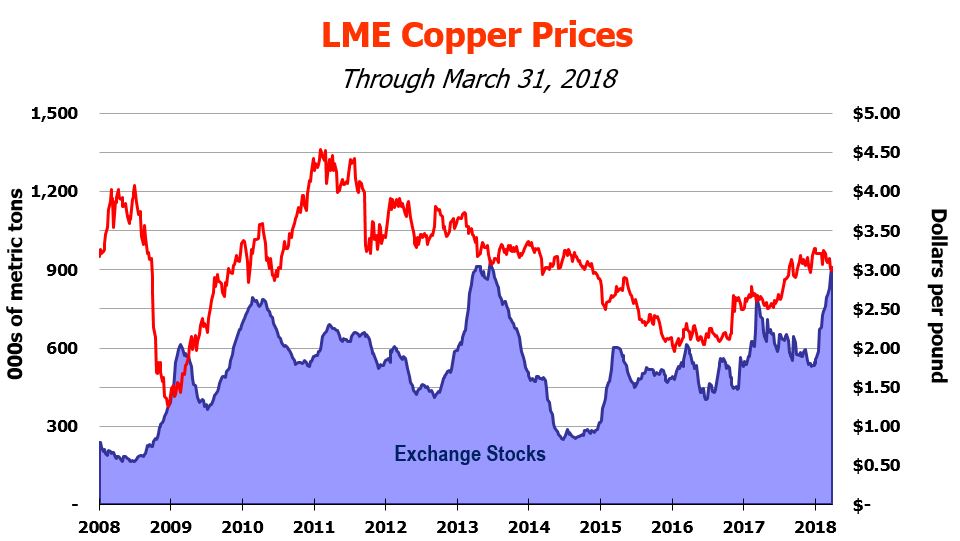
This graph presents LME spot copper prices and the combined reported stocks of copper at the LME, Commodity Exchange Inc. (COMEX), a division of the New York Mercantile Exchange (NYMEX), and the Shanghai Futures Exchange from January 2008 through March 2018 . Beginning in mid-2014, copper prices declined because of concerns about slowing growth rates in China, a stronger U.S. dollar and a broad-based decline in commodity prices, but began to improve in fourth-quarter 2016 and throughout 2017. During first-quarter 2018 , LME spot copper prices ranged from a low of $2.95 per pound to a high of $3.27 per pound, averaged $3.16 per pound and closed at $3.03 per pound on March 31, 2018 . The LME spot copper price was $3.08 per pound on April 30, 2018 .
We believe the underlying long-term fundamentals of the copper business remain positive, supported by the significant role of copper in the global economy and a challenging long-term supply environment attributable to difficulty in replacing existing large mines' output with new production sources. Future copper prices are expected to be volatile and are likely to be influenced by demand from China and emerging markets, as well as economic activity in the U.S. and other industrialized countries, the timing of the development of new supplies of copper and the production levels of mines and copper smelters.
32
Table of Contents
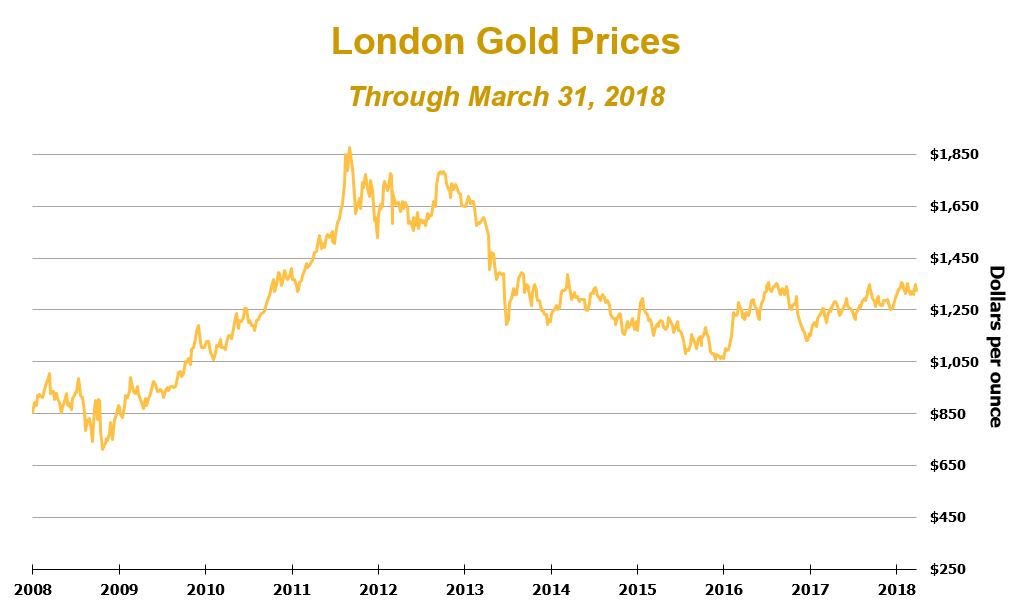
This graph presents London PM gold prices from January 2008 through March 2018 . An improving economic outlook, stronger U.S. dollar and positive equity performance contributed to lower demand for gold since 2014. During first-quarter 2018 , London PM gold prices ranged from a low of $1,308 per ounce to a high of $1,355 per ounce, averaged $1,329 per ounce, and closed at $1,324 per ounce on March 31, 2018 . The London PM gold price was $1,313 per ounce on April 30, 2018 .
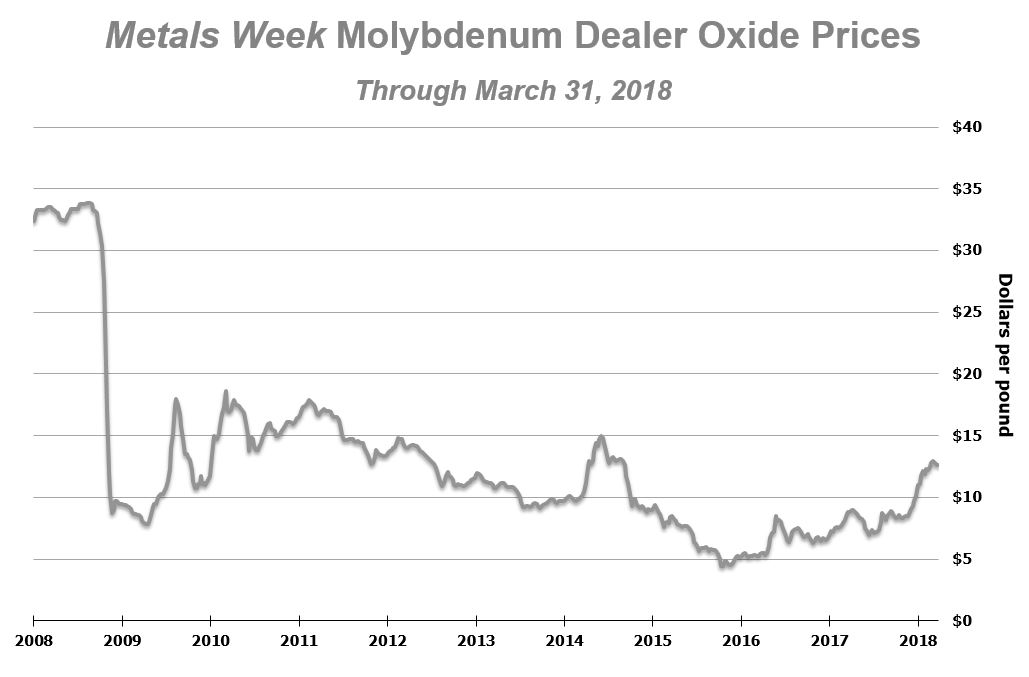
This graph presents the Metals Week Molybdenum Dealer Oxide weekly average prices from January 2008 through March 2018 . Molybdenum prices declined beginning in mid-2014 because of weaker demand from global steel and stainless steel producers but have rebounded starting in mid-2016 with further improvement in late-2017 and into 2018. During first-quarter 2018 , the weekly average price of molybdenum ranged from a low of $11.03 per pound to a high of $12.97 per pound, averaged $12.22 per pound, and was $12.66 per pound on March 31, 2018 . The Metals Week Molybdenum Dealer Oxide weekly average price was $12.35 per pound on April 30, 2018 .
33
Table of Contents
CONSOLIDATED RESULTS
| Three Months Ended March 31, |
| ||||||
| 2018 |
| 2017 |
| ||||
SUMMARY FINANCIAL DATA | (in millions, except per share amounts) |
| ||||||
Revenues a,b | $ | 4,868 | |
| $ | 3,341 | |
|
Operating income a,c | $ | 1,459 | |
| $ | 597 | | d,e,f |
Net income from continuing operations g | $ | 828 | | h | $ | 268 | |
|
Net (loss) income from discontinued operations i | $ | (11 | ) |
| $ | 38 | |
|
Net income attributable to common stock | $ | 692 | |
| $ | 228 | |
|
Diluted net income (loss) per share of common stock: |
|
|
|
| ||||
Continuing operations | $ | 0.48 | |
| $ | 0.13 | |
|
Discontinued operations | (0.01 | ) |
| 0.03 | |
| ||
| $ | 0.47 | |
| $ | 0.16 | |
|
|
|
|
|
| ||||
Diluted weighted-average common shares outstanding | 1,458 | |
| 1,454 | |
| ||
|
|
|
|
| ||||
Operating cash flows j | $ | 1,369 | |
| $ | 792 | |
|
Capital expenditures | $ | 402 | |
| $ | 344 | |
|
At March 31: |
|
|
|
| ||||
Cash and cash equivalents | $ | 3,702 | |
| $ | 4,001 | |
|
Total debt, including current portion | $ | 11,606 | |
| $ | 15,363 | |
|
|
|
|
|
| ||||
| Three Months Ended March 31, |
| ||||||
Revenues | 2018 |
| 2017 |
| ||||
North America copper mines | $ | 1,308 | |
| $ | 1,095 | |
|
South America mining | 877 | |
| 868 | |
| ||
Indonesia mining | 1,573 | |
| 534 | |
| ||
Molybdenum mines | 95 | |
| 63 | |
| ||
Rod & Refining | 1,393 | |
| 1,115 | |
| ||
Atlantic Copper Smelting & Refining | 579 | |
| 458 | |
| ||
Corporate, other & eliminations | (957 | ) |
| (792 | ) |
| ||
Total revenues | $ | 4,868 | |
| $ | 3,341 | |
|
|
|
|
|
| ||||
Operating income (loss) |
|
|
|
| ||||
North America copper mines | $ | 419 | |
| $ | 311 | |
|
South America mining | 205 | |
| 260 | |
| ||
Indonesia mining | 896 | |
| 151 | |
| ||
Molybdenum mines | 9 | |
| (8 | ) |
| ||
Rod & Refining | 3 | |
| 4 | |
| ||
Atlantic Copper Smelting & Refining | 10 | |
| 10 | |
| ||
Corporate, other & eliminations | (83 | ) |
| (131 | ) |
| ||
Total operating income | $ | 1,459 | |
| $ | 597 | |
|
b. | Includes adjustments to embedded derivatives for provisionally priced concentrate and cathode sales (refer to Note 6). |
c. | First-quarter 2018 includes a gain on sales of assets totaling $11 million ( $11 million to net income attributable to common stock or $0.01 per share), primarily reflecting adjustments to the fair value of contingent consideration related to the 2016 sale of onshore California oil and gas properties, which will continue to be adjusted through December 31, 2020. First-quarter 2017 includes a net gain on sales of assets totaling $23 million ( $23 million to net income attributable to common stock or $0.01 per share) associated with oil and gas property sales, partly offset by adjustments to the fair value of the potential contingent consideration related to the 2016 sale of onshore California oil and gas properties. |
d. | Includes charges at mining operations totaling $40 million ( $30 million to net income attributable to common stock or $0.02 per share) for costs charged directly to cost of sales as a result of the impact of regulatory restrictions on PT-FI's concentrate exports and for asset impairments at Morenci. |
e. | Includes net charges at oil and gas operations totaling $1 million ( $1 million to net income attributable to common stock or less than $0.01 per share) consisting of $21 million in selling, general and administrative expenses for contract termination costs, mostly offset by adjustments of $20 million in production and delivery costs for contingent payments related to 2016 drillship settlements. |
f. | Includes net charges to environmental obligations and related litigation reserves totaling $19 million ( $19 million to net income attributable to common stock or $0.01 per share). |
34
Table of Contents
g. | We defer recognizing profits on intercompany sales until final sales to third parties occur. Refer to "Operations – Smelting & Refining" for a summary of net impacts from changes in these deferrals. |
h. | Includes interest received by PT-FI with the refund of prior years' tax receivables totaling $24 million ( $13 million to net income attributable to common stock or $0.01 per share). |
i. | Primarily reflects adjustments to the estimated fair value of contingent consideration related to the November 2016 sale of our interest in TF Holdings Limited (TFHL), which will continue to be adjusted through December 31, 2019. |
j. | Includes net working capital (uses) sources and timing of other tax payments of $(21) million in first-quarter 2018 and $189 million in first-quarter 2017 . |
| Three Months Ended March 31, |
| ||||||
| 2018 |
| 2017 |
| ||||
SUMMARY OPERATING DATA |
|
|
|
| ||||
Copper (millions of recoverable pounds) |
|
|
|
| ||||
Production | 952 | |
| 851 | |
| ||
Sales, excluding purchases | 993 | |
| 809 | |
| ||
Average realized price per pound | $ | 3.11 | |
| $ | 2.67 | |
|
Site production and delivery costs per pound a | $ | 1.67 | |
| $ | 1.60 | |
|
Unit net cash costs per pound a | $ | 0.98 | |
| $ | 1.39 | |
|
Gold (thousands of recoverable ounces) |
|
|
|
| ||||
Production | 599 | |
| 239 | |
| ||
Sales, excluding purchases | 610 | |
| 182 | |
| ||
Average realized price per ounce | $ | 1,312 | |
| $ | 1,229 | |
|
Molybdenum (millions of recoverable pounds) |
|
|
|
| ||||
Production | 22 | |
| 23 | |
| ||
Sales, excluding purchases | 24 | |
| 24 | |
| ||
Average realized price per pound | $ | 11.95 | |
| $ | 8.71 | |
|
a. | Reflects per pound weighted-average production and delivery costs and unit net cash costs (net of by-product credits) for all copper mines, before net noncash and other costs. For reconciliations of per pound unit costs by operating division to production and delivery costs applicable to sales reported in our consolidated financial statements, refer to "Product Revenues and Production Costs." |
Revenues
Consolidated revenues totaled $4.9 billion in first-quarter 2018 and $3.3 billion in first-quarter 2017 . Revenues from our mining operations primarily include the sale of copper concentrate, copper cathode, copper rod, gold in concentrate and molybdenum. Following is a summary of changes in our consolidated revenues between periods (in millions):
| Three Months Ended March 31 | ||
|
| ||
Consolidated revenues - 2017 period | $ | 3,341 | |
Higher (lower) sales volumes: |
| ||
Copper | 491 | | |
Gold | 525 | | |
Molybdenum | (1 | ) | |
Higher average realized prices: |
| ||
Copper | 437 | | |
Gold | 51 | | |
Molybdenum | 77 | | |
Adjustments for prior period provisionally priced copper sales | (169 | ) | |
Higher treatment charges | (29 | ) | |
Higher revenues from purchased copper | 81 | | |
Higher Atlantic Copper revenues | 121 | | |
Other, including intercompany eliminations | (57 | ) | |
Consolidated revenues - 2018 period | $ | 4,868 | |
|
| ||
Sales Volumes. Consolidated copper sales increased to 993 million pounds in first-quarter 2018 , compared with 809 million pounds in first-quarter 2017 , primarily reflecting higher operating rates in Indonesia. Consolidated gold sales volumes increased to 610 thousand ounces in first-quarter 2018 , compared with 182 thousand ounces in first-
35
Table of Contents
quarter 2017 , primarily reflecting higher ore grades and operating rates in Indonesia. Lower operating rates in first-quarter 2017 reflected the regulatory restrictions on PT-FI's concentrate exports from mid-January 2017 to mid-April 2017.
Consolidated molybdenum sales volumes of 24 million pounds in first-quarter 2018 approximated first-quarter 2017 sales of 24 million pounds.
Refer to "Operations" for further discussion of sales volumes at our mining operations.
Realized Prices. Our consolidated revenues can vary significantly as a result of fluctuations in the market prices of copper, gold and molybdenum. First-quarter 2018 average realized prices, compared with first-quarter 2017 , were 16 percent higher for copper, 7 percent higher for gold and 37 percent higher for molybdenum. Refer to "Markets" for further discussion.
As discussed below, substantially all of our copper concentrate and cathode sales contracts provide final copper pricing in a specified future month. We record revenues and invoice customers at the time of shipment based on then-current LME prices, which results in an embedded derivative on provisionally priced concentrate and cathode sales that is adjusted to fair value through earnings each period until final pricing on the date of settlement. Average realized copper prices include net adjustments to current period provisionally priced copper sales totaling $ (57) million in first-quarter 2018 and $16 million in first-quarter 2017 . Refer to Notes 6 and 9 for a summary of total adjustments to prior period and current period provisionally priced sales.
Prior Period Provisionally Priced Copper Sales. Substantially all of our copper concentrate and cathode sales contracts provide final copper pricing in a specified future month (generally one to four months from the shipment date) based primarily on quoted LME monthly average spot copper prices. We receive market prices based on prices in the specified future period, which results in price fluctuations recorded through revenues until the date of settlement. We record revenues and invoice customers at the time of shipment based on then-current LME prices, which results in an embedded derivative on our provisionally priced concentrate and cathode sales that is adjusted to fair value through earnings each period, using the period-end forward prices, until final pricing on the date of settlement. To the extent final prices are higher or lower than what was recorded on a provisional basis, an increase or decrease to revenues is recorded each reporting period until the date of final pricing. Accordingly, in times of rising copper prices, our revenues benefit from adjustments to the final pricing of provisionally priced sales pursuant to contracts entered into in prior periods; in times of falling copper prices, the opposite occurs. Net adjustments to prior periods' provisionally priced copper sales recorded in consolidated revenues totaled $(78) million in first-quarter 2018 and $91 million in first-quarter 2017 . Refer to Notes 6 and 9 for a summary of total adjustments to prior period and current period provisionally priced sales.
At March 31, 2018 , we had provisionally priced copper sales totaling 324 million pounds of copper (net of intercompany sales and noncontrolling interests) recorded at an average of $3.04 per pound, subject to final pricing over the next several months. We estimate that each $0.05 change in the price realized from the March 31, 2018 , provisional price recorded would have an approximate $10 million effect on our 2018 net income attributable to common stock. The LME spot copper price was $3.08 per pound on April 30, 2018 .
Treatment Charges. Revenues from our concentrate sales are recorded net of treatment charges. Higher treatment charges in first-quarter 2018 , compared with first-quarter 2017 , primarily reflect higher sales volumes from Indonesia.
Purchased Copper. We purchase copper cathode primarily for processing by our Rod & Refining operations. Purchased copper volumes totaled 74 million pounds in first-quarter 2018 , compared with 58 million pounds in first-quarter 2017 .
Atlantic Copper Revenues. Atlantic Copper revenues totaled $579 million in first-quarter 2018 , compared with $458 million in first-quarter 2017 . Higher revenues in first-quarter 2018 , compared with first-quarter 2017 , primarily reflect higher copper sales volumes and higher copper prices.
Production and Delivery Costs
Consolidated production and delivery costs totaled $2.8 billion in first-quarter 2018 and $2.2 billion in first-quarter 2017 . Higher consolidated production and delivery costs in first-quarter 2018 , compared with first-quarter 2017 , primarily reflect higher mining rates and repair and maintenance costs.
36
Table of Contents
Mining Unit Site Production and Delivery Costs. Site production and delivery costs for our copper mining operations primarily include labor, energy and commodity-based inputs, such as sulphuric acid, reagents, liners, tires and explosives. Consolidated unit site production and delivery costs (before net noncash and other costs) for our copper mines averaged $1.67 per pound of copper in first-quarter 2018 , compared with $1.60 per pound of copper in first-quarter 2017 . Higher consolidated unit site production and delivery costs in first-quarter 2018 , compared with first-quarter 2017 , primarily reflect higher mining rates and higher repair and maintenance costs. Refer to "Operations – Unit Net Cash Costs" for further discussion of unit net cash costs associated with our operating divisions and to "Product Revenues and Production Costs" for reconciliations of per pound costs by operating division to production and delivery costs applicable to sales reported in our consolidated financial statements.
Depreciation, Depletion and Amortization
Depreciation will vary under the unit-of-production (UOP) method as a result of changes in sales volumes and the related UOP rates at our mining operations. Consolidated depreciation, depletion and amortization (DD&A) totaled $451 million in first-quarter 2018 , compared with $389 million in first-quarter 2017 . Higher DD&A in first-quarter 2018 , compared with first-quarter 2017 , primarily reflected higher sales volumes at PT-FI.
Selling, General and Administrative Expenses
Consolidated selling, general and administrative expenses totaled $131 million in first-quarter 2018 and $151 million in first-quarter 2017 (which included net charges of $21 million for contract termination costs at our oil and gas operations).
Mining Exploration and Research Expenses
Consolidated exploration and research expenses for our mining operations totaled $21 million in first-quarter 2018 and $14 million in first-quarter 2017 . Our mining exploration activities are generally associated with our existing mines, focusing on opportunities to expand reserves and resources to support development of additional future production capacity. Exploration results continue to indicate opportunities for significant future potential reserve additions in North America and South America. Exploration spending is expected to approximate $72 million for the year 2018 .
Environmental Obligations and Shutdown Costs
Environmental obligation costs reflect net revisions to our long-term environmental obligations, which vary from period to period because of changes to environmental laws and regulations, the settlement of environmental matters and/or circumstances affecting our operations that could result in significant changes in our estimates. Shutdown costs include care-and-maintenance costs and any litigation, remediation or related expenditures associated with closed facilities or operations. Net charges for environmental obligations and shutdown costs totaled $9 million in first-quarter 2018 and $25 million in first-quarter 2017 .
Net Gain on Sales of Assets
Net gain on sales of assets totaled $11 million in first-quarter 2018 , primarily reflecting adjustments to the fair value of the potential $150 million in contingent consideration related to the 2016 sale of onshore California oil and gas properties, which will continue to be adjusted through December 31, 2020. Net gain on sales of assets totaled $23 million in first-quarter 2017 , including gains of $17 million related to the sale of Madden property interests and $16 million of adjustments related to the December 2016 Deepwater Gulf of Mexico sale, partly offset by adjustments of $10 million to the fair value of contingent consideration related to the December 2016 onshore California sale.
Interest Expense, Net
Consolidated interest costs (before capitalization) totaled $176 million in first-quarter 2018 and $195 million in first-quarter 2017 . Lower interest costs in first-quarter 2018 , compared to first-quarter 2017 , reflect a decrease in total debt.
Capitalized interest varies with the level of expenditures for our development projects and average interest rates on our borrowings, and totaled $25 million in first-quarter 2018 and $28 million in first-quarter 2017 .
37
Table of Contents
Income Taxes
Following is a summary of the approximate amounts used in the calculation of our consolidated income tax provision (in millions, except percentages):
| Three Months Ended March 31, |
| ||||||||||||||||||
| 2018 |
| 2017 |
| ||||||||||||||||
| Income a |
| Effective Tax Rate |
| Income Tax (Provision) Benefit |
| Income a |
| Effective Tax Rate |
| Income Tax (Provision) Benefit |
| ||||||||
U.S. | $ | 170 | |
| (2)% |
| $ | 4 | |
| $ | 10 | |
| 70% |
| $ | (7 | ) |
|
South America | 183 | |
| 39% |
| (72 | ) |
| 260 | |
| 39% |
| (101 | ) |
| ||||
Indonesia | 933 | |
| 43% |
| (401 | ) |
| 152 | |
| 44% |
| (67 | ) |
| ||||
Eliminations and other | 50 | |
| N/A |
| (3 | ) |
| 16 | |
| N/A |
| (1 | ) |
| ||||
Rate adjustment b | - | |
| N/A |
| (34 | ) |
| - | |
| N/A |
| 2 | |
| ||||
Consolidated FCX | $ | 1,336 | |
| 38% | c | $ | (506 | ) |
| $ | 438 | |
| 40% |
| $ | (174 | ) |
|
a. | Represents income from continuing operations by geographic location before income taxes and equity in affiliated companies' net (losses) earnings. |
b. | In accordance with applicable accounting rules, we adjust our interim provision for income taxes to equal our consolidated tax rate. |
c. | The consolidated effective income tax rate is a function of the combined effective tax rates for the jurisdictions in which we operate. Accordingly, variations in the relative proportions of jurisdictional income result in fluctuations to our consolidated effective income tax rate. Assuming achievement of current sales volume and cost estimates and average prices of $3.15 per pound for copper, $1,300 per ounce for gold and $12.00 per pound for molybdenum for the remainder of 2018 , we estimate our consolidated effective tax rate for the year 2018 will approximate 36 percent and would decrease with higher prices. |
Net (Loss) Income from Discontinued Operations
Net (loss) income from discontinued operations of $(11) million in first-quarter 2018 and $38 million in first-quarter 2017 , primarily reflected adjustments to the fair value of the potential $120 million contingent consideration related to the November 2016 sale of our interest in TFHL, which will continue to be adjusted through December 31, 2019.
OPERATIONS
North America Copper Mines
We operate seven open-pit copper mines in North America – Morenci, Bagdad, Safford, Sierrita and Miami in Arizona, and Chino and Tyrone in New Mexico. All of the North America mining operations are wholly owned, except for Morenci. We record our 72 percent undivided joint venture interest in Morenci using the proportionate consolidation method.
The North America copper mines include open-pit mining, sulfide ore concentrating, leaching and solution extraction/electrowinning (SX/EW) operations. A majority of the copper produced at our North America copper mines is cast into copper rod by our Rod & Refining segment. The remainder of our North America copper sales is in the form of copper cathode or copper concentrate, a portion of which is shipped to Atlantic Copper (our wholly owned smelter). Molybdenum concentrate, gold and silver are also produced by certain of our North America copper mines.
Operating and Development Activities. We have significant undeveloped reserves and resources in North America and a portfolio of potential long-term development projects. Future investments will be undertaken based on the results of economic and technical feasibility studies, and are dependent on market conditions. We continue to study opportunities to reduce the capital intensity of our potential long-term development projects.
Through exploration drilling, we have identified a significant resource at our wholly owned Lone Star project located near the Safford operation in eastern Arizona. We have commenced an initial project to develop the Lone Star oxide ores with first production expected by the end of 2020. Total estimated capital costs, including mine equipment and pre-production stripping, approximate $850 million and will benefit from the utilization of existing infrastructure at the adjacent Safford operation. At March 31, 2018 , approximately $35 million has been incurred for this project. Production from the Lone Star oxide ores is expected to average approximately 200 million pounds of copper per year with an approximate 20-year mine life. The project also advances the potential for development of a larger-scale district opportunity. We are conducting additional drilling to follow up on positive exploration results as we
38
Table of Contents
continue to evaluate longer term opportunities available from the significant long-term sulfide potential in the Lone Star/Safford minerals district.
Operating Data. Following is a summary of consolidated operating data for the North America copper mines:
| Three Months Ended March 31, | ||||||
| 2018 |
| 2017 | ||||
Operating Data, Net of Joint Venture Interests |
|
|
| ||||
Copper (millions of recoverable pounds) |
|
|
| ||||
Production | 348 | |
| 392 | | ||
Sales, excluding purchases | 384 | |
| 375 | | ||
Average realized price per pound | $ | 3.16 | |
| $ | 2.68 | |
|
|
|
| ||||
Molybdenum (millions of recoverable pounds) |
|
|
| ||||
Production a | 7 | |
| 9 | | ||
|
|
|
| ||||
100% Operating Data |
|
|
| ||||
SX/EW operations |
|
|
| ||||
Leach ore placed in stockpiles (metric tons per day) | 674,600 | |
| 701,800 | | ||
Average copper ore grade (percent) | 0.27 | |
| 0.28 | | ||
Copper production (millions of recoverable pounds) | 262 | |
| 277 | | ||
|
|
|
| ||||
Mill operations |
|
|
| ||||
Ore milled (metric tons per day) | 288,600 | |
| 303,800 | | ||
Average ore grade (percent): |
|
|
| ||||
Copper | 0.35 | |
| 0.41 | | ||
Molybdenum | 0.02 | |
| 0.03 | | ||
Copper recovery rate (percent) | 88.0 | |
| 86.4 | | ||
Copper production (millions of recoverable pounds) | 151 | |
| 186 | | ||
a. | Refer to "Consolidated Results" for our consolidated molybdenum sales volumes, which include sales of molybdenum produced at the North America copper mines. |
North America's consolidated copper sales volumes of 384 million pounds in first-quarter 2018 were higher than first-quarter 2017 sales of 375 million pounds, primarily reflecting timing of shipments. North America copper sales are estimated to approximate 1.5 billion pounds for the year 2018 , compared with 1.5 billion pounds in 2017 .
Unit Net Cash Costs. Unit net cash costs per pound of copper is a measure intended to provide investors with information about the cash-generating capacity of our mining operations expressed on a basis relating to the primary metal product for our respective operations. We use this measure for the same purpose and for monitoring operating performance by our mining operations. This information differs from measures of performance determined in accordance with U.S. GAAP and should not be considered in isolation or as a substitute for measures of performance determined in accordance with U.S. GAAP. This measure is presented by other metals mining companies, although our measure may not be comparable to similarly titled measures reported by other companies.
Gross Profit per Pound of Copper and Molybdenum
The following table summarizes unit net cash costs and gross profit per pound at our North America copper mines. Refer to "Product Revenues and Production Costs" for an explanation of the "by-product" and "co-product" methods and a reconciliation of unit net cash costs per pound to production and delivery costs applicable to sales reported in our consolidated financial statements.
39
Table of Contents
|
|
|
|
|
|
|
|
|
|
|
|
| ||||||||||||
| Three Months Ended March 31, |
| ||||||||||||||||||||||
| 2018 |
| 2017 |
| ||||||||||||||||||||
| By- Product Method |
| Co-Product Method |
| By- Product Method |
| Co-Product Method |
| ||||||||||||||||
|
| Copper |
| Molyb- denum a |
|
| Copper |
| Molyb- denum a |
| ||||||||||||||
Revenues, excluding adjustments | $ | 3.16 | |
| $ | 3.16 | |
| $ | 10.87 | |
| $ | 2.68 | |
| $ | 2.68 | |
| $ | 7.00 | |
|
|
|
|
|
|
|
|
|
|
|
|
|
| ||||||||||||
Site production and delivery, before net noncash and other costs shown below | 1.84 | |
| 1.73 | |
| 7.81 | |
| 1.50 | |
| 1.42 | |
| 5.16 | |
| ||||||
By-product credits | (0.20 | ) |
| - | |
| - | |
| (0.15 | ) |
| - | |
| - | |
| ||||||
Treatment charges | 0.10 | |
| 0.09 | |
| - | |
| 0.11 | |
| 0.11 | |
| - | |
| ||||||
Unit net cash costs | 1.74 | |
| 1.82 | |
| 7.81 | |
| 1.46 | |
| 1.53 | |
| 5.16 | |
| ||||||
DD&A | 0.25 | |
| 0.23 | |
| 0.66 | |
| 0.31 | |
| 0.29 | |
| 0.52 | |
| ||||||
Noncash and other costs, net | 0.05 | |
| 0.05 | |
| 0.09 | |
| 0.09 | | b | 0.09 | |
| 0.07 | |
| ||||||
Total unit costs | 2.04 | |
| 2.10 | |
| 8.56 | |
| 1.86 | |
| 1.91 | |
| 5.75 | |
| ||||||
Other revenue adjustments, primarily for pricing on prior period open sales | (0.01 | ) |
| (0.01 | ) |
| - | |
| 0.02 | |
| 0.02 | |
| - | |
| ||||||
Gross profit per pound | $ | 1.11 | |
| $ | 1.05 | |
| $ | 2.31 | |
| $ | 0.84 | |
| $ | 0.79 | |
| $ | 1.25 | |
|
|
|
|
|
|
|
|
|
|
|
|
|
| ||||||||||||
Copper sales (millions of recoverable pounds) | 383 | |
| 383 | |
|
|
| 374 | |
| 374 | |
|
|
| ||||||||
Molybdenum sales (millions of recoverable pounds) a |
|
|
|
| 7 | |
|
|
|
|
| 9 | |
| ||||||||||
a. | Reflects sales of molybdenum produced by certain of the North America copper mines to our molybdenum sales company at market-based pricing. |
b. | Includes $19 million ( $0.05 per pound of copper) for asset impairment charges at Morenci. |
Our North America copper mines have varying cost structures because of differences in ore grades and characteristics, processing costs, by-product credits and other factors. Average unit net cash costs (net of by-product credits) for the North America copper mines of $1.74 per pound of copper in first-quarter 2018 were higher than unit net cash costs of $1.46 per pound in first-quarter 2017 , primarily reflecting higher repair and maintenance costs.
Because certain assets are depreciated on a straight-line basis, North America's average unit depreciation rate may vary with asset additions and the level of copper production and sales.
Average unit net cash costs (net of by-product credits) for our North America copper mines are expected to approximate $1.71 per pound of copper for the year 2018 , based on achievement of current sales volume and cost estimates and assuming an average molybdenum price of $12.00 per pound for the remainder of 2018 . North
America's average unit net cash costs for the year 2018 would change by approximately $0.03 per pound for each $2 per pound change in the average price of molybdenum for the remainder of 2018 .
|
|
|
|
|
|
|
|
|
|
|
|
|
South America Mining
We operate two copper mines in South America – Cerro Verde in Peru (in which we own a 53.56 percent interest) and El Abra in Chile (in which we own a 51 percent interest), which are consolidated in our financial statements.
South America mining includes open-pit mining, sulfide ore concentrating, leaching and SX/EW operations. Production from our South America mines is sold as copper concentrate or cathode under long-term contracts. Our South America mines also sell a portion of their copper concentrate production to Atlantic Copper. In addition to copper, the Cerro Verde mine produces molybdenum concentrate and silver.
Operating and Development Activities. The Cerro Verde expansion project, which commenced operations in September 2015, achieved capacity operating rates in early 2016. The project expanded the concentrator facilities' capacity from 120,000 metric tons of ore per day to 360,000 metric tons of ore per day. Cerro Verde's expanded operations benefit from its large-scale, long-lived reserves and cost efficiencies. The project has continued to perform well, with average mill throughput rates of 385,500 metric tons of ore per day in first-quarter 2018 , including a daily record of 462,900 metric tons of ore.
Exploration results at El Abra indicate a significant sulfide resource, which could potentially support a major mill project similar to facilities recently constructed at Cerro Verde. We continue to evaluate a major expansion at El
40
Table of Contents
Abra to process additional sulfide material and to achieve higher recoveries. Future investments will depend on technical studies, which are being advanced, economic factors and market conditions.
Operating Data. Following is a summary of consolidated operating data for our South America mining operations:
| Three Months Ended March 31, | ||||||
| 2018 |
| 2017 | ||||
Copper (millions of recoverable pounds) |
|
|
| ||||
Production | 293 | |
| 304 | | ||
Sales | 290 | |
| 309 | | ||
Average realized price per pound | $ | 3.08 | |
| $ | 2.66 | |
|
|
|
| ||||
Molybdenum (millions of recoverable pounds) |
|
|
| ||||
Production a | 6 | |
| 6 | | ||
|
|
|
| ||||
SX/EW operations |
|
|
| ||||
Leach ore placed in stockpiles (metric tons per day) | 168,000 | |
| 120,100 | | ||
Average copper ore grade (percent) | 0.33 | |
| 0.42 | | ||
Copper production (millions of recoverable pounds) | 67 | |
| 66 | | ||
|
|
|
| ||||
Mill operations |
|
|
| ||||
Ore milled (metric tons per day) | 385,500 | |
| 338,900 | | ||
Average ore grade (percent): |
|
|
| ||||
Copper | 0.39 | |
| 0.44 | | ||
Molybdenum | 0.01 | |
| 0.02 | | ||
Copper recovery rate (percent) | 79.0 | |
| 84.5 | | ||
Copper production (millions of recoverable pounds) | 226 | |
| 238 | | ||
a. | Refer to "Consolidated Results" for our consolidated molybdenum sales volumes, which include sales of molybdenum produced at Cerro Verde. |
|
|
|
|
|
|
|
|
|
South America's consolidated copper sales volumes of 290 million pounds in first-quarter 2018 were lower than first-quarter 2017 sales of 309 million pounds, primarily reflecting lower ore grades and recovery rates at Cerro Verde. Copper sales from South America mines are expected to approximate 1.2 billion pounds of copper for the year 2018 , compared with 1.2 billion pounds of copper in 2017 .
Unit Net Cash Costs. Unit net cash costs per pound of copper is a measure intended to provide investors with information about the cash-generating capacity of our mining operations expressed on a basis relating to the primary metal product for our respective operations. We use this measure for the same purpose and for monitoring operating performance by our mining operations. This information differs from measures of performance determined in accordance with U.S. GAAP and should not be considered in isolation or as a substitute for measures of performance determined in accordance with U.S. GAAP. This measure is presented by other metals mining companies, although our measure may not be comparable to similarly titled measures reported by other companies.
Gross Profit per Pound of Copper
The following table summarizes unit net cash costs and gross profit per pound of copper at the South America mining operations. Unit net cash costs per pound of copper are reflected under the by-product and co-product methods as the South America mining operations also had sales of molybdenum and silver. Refer to "Product Revenues and Production Costs" for an explanation of the "by-product" and "co-product" methods and a reconciliation of unit net cash costs per pound to production and delivery costs applicable to sales reported in our consolidated financial statements.
41
Table of Contents
| Three Months Ended March 31, | ||||||||||||||
| 2018 |
| 2017 | ||||||||||||
| By-Product Method |
| Co-Product Method |
| By-Product Method |
| Co-Product Method | ||||||||
Revenues, excluding adjustments | $ | 3.08 | |
| $ | 3.08 | |
| $ | 2.66 | |
| $ | 2.66 | |
|
|
|
|
|
|
|
| ||||||||
Site production and delivery, before net noncash and other costs shown below | 1.78 | |
| 1.64 | |
| 1.48 | |
| 1.38 | | ||||
By-product credits | (0.25 | ) |
| - | |
| (0.18 | ) |
| - | | ||||
Treatment charges | 0.20 | |
| 0.20 | |
| 0.22 | |
| 0.22 | | ||||
Royalty on metals | 0.01 | |
| 0.01 | |
| 0.01 | |
| 0.01 | | ||||
Unit net cash costs | 1.74 | |
| 1.85 | |
| 1.53 | |
| 1.61 | | ||||
DD&A | 0.43 | |
| 0.40 | |
| 0.43 | |
| 0.40 | | ||||
Noncash and other costs, net | 0.05 | |
| 0.05 | |
| 0.01 | |
| 0.01 | | ||||
Total unit costs | 2.22 | |
| 2.30 | |
| 1.97 | |
| 2.02 | | ||||
Other revenue adjustments, primarily for pricing on prior period open sales | (0.15 | ) |
| (0.15 | ) |
| 0.16 | |
| 0.16 | | ||||
Gross profit per pound | $ | 0.71 | |
| $ | 0.63 | |
| $ | 0.85 | |
| $ | 0.80 | |
|
|
|
|
| |
| | ||||||||
Copper sales (millions of recoverable pounds) | 290 | |
| 290 | |
| 309 | |
| 309 | | ||||
Our South America mines have varying cost structures because of differences in ore grades and characteristics, processing costs, by-product credits and other factors. Average unit net cash costs (net of by-product credits) of $1.74 per pound of copper in first-quarter 2018 were higher than unit net cash costs of $1.53 per pound in first-quarter 2017 , primarily reflecting higher mining rates and lower ore grades.
Revenues from Cerro Verde's concentrate sales are recorded net of treatment charges, which will vary with Cerro Verde's sales volumes and the price of copper.
Because certain assets are depreciated on a straight-line basis, South America's unit depreciation rate may vary with asset additions and the level of copper production and sales.
Revenue adjustments primarily result from changes in prices on provisionally priced copper sales recognized in prior periods. Refer to "Consolidated Results – Revenues" for further discussion of adjustments to prior period provisionally priced copper sales.
Average unit net cash costs (net of by-product credits) for our South America mining operations are expected to approximate $1.64 per pound of copper for the year 2018 , based on current sales volume and cost estimates and assuming an average price of $12.00 per pound of molybdenum for the remainder of 2018 .
Indonesia Mining
Indonesia mining includes PT-FI's Grasberg minerals district, one of the world's largest copper and gold deposits, in Papua, Indonesia. We own 90.64 percent of PT-FI, including 9.36 percent owned through our wholly owned subsidiary, PT Indocopper Investama.
PT-FI operates a proportionately consolidated unincorporated joint venture with Rio Tinto plc (Rio Tinto), under which Rio Tinto has a 40 percent interest in certain assets and a 40 percent interest through 2022 in production exceeding specified annual amounts of copper, gold and silver. After 2022, all production and related revenues and costs are shared 60 percent PT-FI and 40 percent Rio Tinto. Refer to Note 3 in our annual report on Form 10-K for the year ended December 31, 2017 , for discussion of our joint venture with Rio Tinto.
PT-FI produces copper concentrate that contains significant quantities of gold and silver. Substantially all of PT-FI's copper concentrate is sold under long-term contracts, and during first-quarter 2018 , approximately 40 percent of PT-FI's concentrate production was sold to PT Smelting (PT-FI's 25-percent-owned smelter and refinery in Gresik, Indonesia).
42
Table of Contents
Regulatory Matters. As further discussed in Note 8, PT-FI continues to actively engage with Indonesian government officials to address regulatory changes that conflict with its contractual rights in a manner that provides long-term stability for PT-FI's operations and investment plans, and protects value for our stockholders. The parties have a mutual objective of completing negotiations and the required documentation as soon as possible.
In December 2017, PT-FI was granted an extension of its temporary IUPK through June 30, 2018, to enable normal operations to continue during the negotiation period. In February 2018, PT-FI's export license was extended to February 15, 2019. Until a definitive agreement is reached, PT-FI has reserved all rights under its COW, including dispute resolution procedures.
PT-FI is also engaged in discussions with Indonesia's Ministry of Environment and Forestry regarding PT-FI's controlled riverine tailings management system. Resolution of these matters is a requirement for concluding a comprehensive agreement for PT-FI's extended operations.
We cannot predict whether PT-FI will be successful in reaching a satisfactory agreement on the terms of its long-term mining rights. If PT-FI is unable to reach a definitive agreement with the Indonesian government on its long-term mining rights, we intend to reduce or defer investments significantly in underground development projects and will pursue dispute resolution procedures under PT-FI's COW. For further discussion of the regulatory matters and risks associated with operations in Indonesia, refer to Part I, Item IA. "Risk Factors" of our annual report on Form 10-K for the year ended December 31, 2017 .
Operating and Development Activities. PT-FI is currently mining the final phase of the Grasberg open pit, which contains high copper and gold ore grades. PT-FI expects to mine high-grade ore until transitioning to the Grasberg Block Cave underground mine in the first half of 2019, resulting in lower copper and gold production from Indonesia mining during the transition period.
PT-FI has several projects in the Grasberg minerals district related to the development of its large-scale, long-lived, high-grade underground ore bodies. In aggregate, these underground ore bodies are expected to produce large-scale quantities of copper and gold following the transition from the Grasberg open pit. Substantial progress has been made to prepare for the transition to mining of the Grasberg Block Cave underground mine. Mine development activities are sufficiently advanced to commence caving in early 2019. The ore flow system and underground rail line are expected to be completed in the second half of 2018.
Subject to reaching a definitive agreement with the Indonesian government to support PT-FI's long-term investment plans, estimated annual capital spending on these projects would average $0.8 billion per year ( $0.7 billion per year net to PT-FI) over the next five years. Considering the long-term nature and size of these projects, actual costs could vary from these estimates. In response to market conditions and Indonesian regulatory uncertainty, the timing of these expenditures continues to be reviewed. If PT-FI is unable to reach a definitive agreement with the Indonesian government on its long-term mining rights, we intend to reduce or defer investments significantly in our underground development projects and will pursue dispute resolution procedures under PT-FI's COW.
The following provides additional information on the continued development of the Common Infrastructure project, the Grasberg Block Cave underground mine and the Deep Mill Level Zone (DMLZ) ore body that lies below the Deep Ore Zone (DOZ) underground mine. Our current plans and mineral reserves in Indonesia assume that PT-FI's long-term mining rights will be extended through 2041, as stated in the COW.
Common Infrastructure and Grasberg Block Cave Mine. In 2004, PT-FI commenced its Common Infrastructure project to provide access to its large undeveloped underground ore bodies located in the Grasberg minerals district through a tunnel system located approximately 400 meters deeper than its existing underground tunnel system. In addition to providing access to our underground ore bodies, the tunnel system will enable PT-FI to conduct future exploration in prospective areas associated with currently identified ore bodies. The tunnel system was completed to the Big Gossan terminal, and the Big Gossan mine was brought into production in 2010. The Big Gossan underground mine was on care-and-maintenance status during most of 2017 and production restarted in fourth-quarter 2017. Development of the DMLZ and Grasberg Block Cave underground mines is advancing using the Common Infrastructure project tunnels as access.
The Grasberg Block Cave underground mine accounts for approximately half of our recoverable proven and probable reserves in Indonesia. Production from the Grasberg Block Cave mine is expected to commence in the first half of 2019, following the end of mining of the Grasberg open pit. Targeted production rates once the Grasberg
43
Table of Contents
Block Cave mining operation reaches full capacity are expected to approximate 130,000 to 160,000 metric tons of ore per day. PT-FI continues to review its operating plans to determine the optimum mine plan for the Grasberg Block Cave underground mine.
Aggregate mine development capital for the Grasberg Block Cave underground mine and associated Common Infrastructure is expected to approximate $6.4 billion (incurred between 2008 and 2023), with PT-FI's share totaling approximately $5.9 billion. Aggregate project costs totaling $3.4 billion have been incurred through March 31, 2018 , including $136 million during first-quarter 2018 .
DMLZ. The DMLZ ore body lies below the DOZ mine at the 2,590-meter elevation and represents the downward continuation of mineralization in the Ertsberg East Skarn system and neighboring Ertsberg porphyry. In September 2015, PT-FI initiated pre-commercial production that represents ore extracted during the development phase for the purpose of obtaining access to the ore body. PT-FI continues to review its mine plan for the DMLZ underground mine, which is currently in pre-commercial production. In response to mining-induced seismic activity that began in 2017, the development plans have been revised to a slower ramp up to full production to assess alternatives to manage the rock stress encountered in the early phase of cave development. The DMLZ rock types and geologic setting are different than other ore bodies in the Grasberg minerals district. PT-FI currently expects DMLZ to ramp up to full capacity of 80,000 metric tons of ore per day in 2022. Near-term production plans will continue to be reviewed and potentially revised as additional data becomes available.
Drilling efforts continue to determine the extent of the ore body. Aggregate mine development capital costs for the DMLZ underground mine are expected to approximate $3.1 billion (incurred between 2009 and 2021), with PT-FI's share totaling approximately $1.9 billion. Aggregate project costs totaling $2.2 billion have been incurred through March 31, 2018 , including $75 million during first-quarter 2018 .
Other Matters. As further discussed in "Risk Factors" contained in Part I. Item 1A of our annual report on Form 10-K for the year ended December 31, 2017 , there have been a series of shooting incidents within the PT-FI project area and in nearby areas. During March and April 2018, there were six additional shooting incidents, which did not result in any injuries. The safety of our workforce is a critical concern, and PT-FI continues to work with the Indonesian government to address security issues. We also continue to limit the use of the road leading to our mining and milling operations to secured convoys.
44
Table of Contents
Operating Data. Following is a summary of consolidated operating data for our Indonesia mining operations:
| Three Months Ended March 31, | ||||||
| 2018 |
| 2017 | ||||
Operating Data, Net of Joint Venture Interest |
|
|
| ||||
Copper (millions of recoverable pounds) |
|
|
| ||||
Production | 311 | |
| 155 | | ||
Sales | 319 | |
| 125 | | ||
Average realized price per pound | $ | 3.06 | |
| $ | 2.63 | |
|
|
|
| ||||
Gold (thousands of recoverable ounces) |
|
|
| ||||
Production | 595 | |
| 232 | | ||
Sales | 603 | |
| 177 | | ||
Average realized price per ounce | $ | 1,312 | |
| $ | 1,229 | |
|
|
|
| ||||
100% Operating Data |
|
|
| ||||
Ore milled (metric tons per day): a |
|
|
| ||||
Grasberg open pit | 125,200 | |
| 53,600 | | ||
DOZ underground mine | 39,400 | |
| 26,100 | | ||
DMLZ underground mine | 2,600 | |
| 3,200 | | ||
Grasberg Block Cave underground mine | 4,000 | |
| 2,600 | | ||
Big Gossan underground mine | 2,400 | |
| 1,700 | | ||
Total | 173,600 | |
| 87,200 | | ||
Average ore grades: |
|
|
| ||||
Copper (percent) | 1.12 | |
| 1.15 | | ||
Gold (grams per metric ton) | 1.63 | |
| 1.17 | | ||
Recovery rates (percent): |
|
|
| ||||
Copper | 92.0 | |
| 92.2 | | ||
Gold | 84.7 | |
| 84.8 | | ||
Production: |
|
|
| ||||
Copper (millions of recoverable pounds) | 340 | |
| 172 | | ||
Gold (thousands of recoverable ounces) | 673 | |
| 241 | | ||
a. | Amounts represent the approximate average daily throughput processed at PT-FI's mill facilities from each producing mine and from development activities that result in metal production. |
Indonesia mining's consolidated sales of 319 million pounds of copper and 603 thousand ounces of gold in first-quarter 2018 were higher than first-quarter 2017 sales of 125 million pounds of copper and 177 thousand ounces of gold, primarily reflecting higher operating rates and gold ore grades. Lower operating rates in first-quarter 2017 reflected the regulatory restrictions on PT-FI's concentrate exports from mid-January 2017 to mid-April 2017.
Sales volumes from Indonesia mining are expected to approximate 1.15 billion pounds of copper and 2.4 million ounces of gold for the year 2018 , compared with 1.0 billion pounds of copper and 1.5 million ounces of gold for the year 2017 . Indonesia mining's projected sales volumes and unit net cash credits (refer to discussion below) for the year 2018 are dependent on a number of factors, including operational performance, workforce productivity, timing of shipments, and Indonesia regulatory matters, including the resolution of PT-FI's long-term mining rights or an extension of PT-FI's temporary IUPK after June 30, 2018. Refer to Note 8 for further discussion.
Unit Net Cash Costs. Unit net cash costs per pound of copper is a measure intended to provide investors with information about the cash-generating capacity of our mining operations expressed on a basis relating to the primary metal product for our respective operations. We use this measure for the same purpose and for monitoring operating performance by our mining operations. This information differs from measures of performance determined in accordance with U.S. GAAP and should not be considered in isolation or as a substitute for measures of performance determined in accordance with U.S. GAAP. This measure is presented by other metals mining companies, although our measure may not be comparable to similarly titled measures reported by other companies.
|
|
|
|
|
|
|
|
|
|
|
|
45
Table of Contents
Gross Profit per Pound of Copper and per Ounce of Gold
The following table summarizes the unit net cash costs and gross profit per pound of copper and per ounce of gold at our Indonesia mining operations. Refer to "Product Revenues and Production Costs" for an explanation of "by-product" and "co-product" methods and a reconciliation of unit net cash costs per pound to production and delivery costs applicable to sales reported in our consolidated financial statements.
| Three Months Ended March 31, | ||||||||||||||||||||||
| 2018 |
| 2017 | ||||||||||||||||||||
| By-Product Method |
| Co-Product Method |
| By-Product Method |
| Co-Product Method | ||||||||||||||||
|
| Copper |
| Gold |
|
| Copper |
| Gold | ||||||||||||||
Revenues, excluding adjustments | $ | 3.06 | |
| $ | 3.06 | |
| $ | 1,312 | |
| $ | 2.63 | |
| $ | 2.63 | |
| $ | 1,229 | |
|
|
|
|
|
|
|
|
|
|
|
| ||||||||||||
Site production and delivery, before net noncash and other costs shown below | 1.36 | |
| 0.75 | |
| 319 | |
| 2.13 | |
| 1.26 | |
| 589 | | ||||||
Gold and silver credits | (2.59 | ) |
| - | |
| - | |
| (1.88 | ) |
| - | |
| - | | ||||||
Treatment charges | 0.25 | |
| 0.13 | |
| 57 | |
| 0.28 | |
| 0.17 | |
| 77 | | ||||||
Export duties | 0.14 | |
| 0.08 | |
| 34 | |
| 0.11 | |
| 0.07 | |
| 31 | | ||||||
Royalty on metals | 0.21 | |
| 0.11 | |
| 49 | |
| 0.16 | |
| 0.09 | |
| 45 | | ||||||
Unit net cash (credits) costs | (0.63 | ) |
| 1.07 | |
| 459 | |
| 0.80 | |
| 1.59 | |
| 742 | | ||||||
DD&A | 0.57 | |
| 0.31 | |
| 133 | |
| 0.66 | |
| 0.39 | |
| 184 | | ||||||
Noncash and other costs, net | 0.04 | |
| 0.02 | |
| 11 | |
| 0.26 | | a | 0.15 | |
| 72 | | ||||||
Total unit (credit) costs | (0.02 | ) |
| 1.40 | |
| 603 | |
| 1.72 | |
| 2.13 | |
| 998 | | ||||||
Other revenue adjustments, primarily for pricing on prior period open sales | (0.12 | ) |
| (0.12 | ) |
| 27 | |
| 0.33 | |
| 0.33 | |
| 51 | | ||||||
PT Smelting intercompany (loss) profit | (0.03 | ) |
| (0.02 | ) |
| (7 | ) |
| 0.21 | |
| 0.13 | |
| 59 | | ||||||
Gross profit per pound/ounce | $ | 2.93 | |
| $ | 1.52 | |
| $ | 729 | |
| $ | 1.45 | |
| $ | 0.96 | |
| $ | 341 | |
|
|
|
|
|
|
|
|
|
|
|
| ||||||||||||
Copper sales (millions of recoverable pounds) | 319 | |
| 319 | |
|
|
| 125 | |
| 125 | |
|
| ||||||||
Gold sales (thousands of recoverable ounces) |
|
|
|
| 603 | |
|
|
|
|
| 177 | | ||||||||||
a. | Includes $21 million ( $0.17 per pound of copper) of costs charged directly to cost of sales as a result of the impact of regulatory restrictions on PT-FI's concentrate exports. |
A significant portion of PT-FI's costs are fixed, and unit costs vary depending on production volumes and other factors. As a result of higher sales volumes and gold and silver credits, Indonesia had unit net cash credits (including gold and silver credits) of $0.63 per pound of copper in first-quarter 2018 , compared with unit net cash costs of $0.80 per pound of copper in first-quarter 2017 .
Treatment charges vary with the volume of metals sold and the price of copper, and royalties vary with the volume of metals sold and the prices of copper and gold. PT-FI's royalties totaled $67 million in first-quarter 2018 and $19 million in first-quarter 2017 . Export duties totaled $46 million in first-quarter 2018 and $14 million in first-quarter 2017 .
Because certain assets are depreciated on a straight-line basis, PT-FI's unit depreciation rate varies with the level of copper production.
Revenue adjustments primarily result from changes in prices on provisionally priced copper sales recognized in prior periods. Refer to "Consolidated Results – Revenues" for further discussion of adjustments to prior period provisionally priced copper sales.
PT Smelting intercompany (loss) profit represents the change in the deferral of 25 percent of PT-FI's profit on sales to PT Smelting. Refer to "Smelting & Refining" below for further discussion.
Assuming an average gold price of $1,300 per ounce for the remainder of 2018 and achievement of current sales volume and cost estimates, unit net cash credits (including gold and silver credits) for Indonesia mining are expected to approximate $0.55 per pound of copper for the year 2018 . Indonesia mining's unit net cash credits for the year 2018 would change by approximately $0.09 per pound for each $50 per ounce change in the average price of gold for the remainder of 2018 . Because of the fixed nature of a large portion of Indonesia's costs, unit net cash credits/costs vary from quarter to quarter depending on copper and gold volumes.
46
Table of Contents
Molybdenum Mines
We have two wholly owned molybdenum mines in North America – the Henderson underground mine and the Climax open-pit mine, both in Colorado. The Henderson and Climax mines produce high-purity, chemical-grade molybdenum concentrate, which is typically further processed into value-added molybdenum chemical products. The majority of the molybdenum concentrate produced at the Henderson and Climax mines, as well as from our North America and South America copper mines, is processed at our own conversion facilities.
Operating and Development Activities. Production from the Molybdenum mines totaled 9 million pounds of molybdenum in first-quarter 2018 and 8 million pounds in first-quarter 2017 . Refer to "Consolidated Results" for our consolidated molybdenum operating data, which includes sales of molybdenum produced at our Molybdenum mines, and from our North America and South America copper mines, and refer to "Outlook" for projected consolidated molybdenum sales volumes.
Unit Net Cash Costs Per Pound of Molybdenum. Unit net cash costs per pound of molybdenum is a measure intended to provide investors with information about the cash-generating capacity of our mining operations expressed on a basis relating to the primary metal product for our respective operations. We use this measure for the same purpose and for monitoring operating performance by our mining operations. This information differs from measures of performance determined in accordance with U.S. GAAP and should not be considered in isolation or as a substitute for measures of performance determined in accordance with U.S. GAAP. This measure is presented by other metals mining companies, although our measure may not be comparable to similarly titled measures reported by other companies.
Unit net cash costs for our Molybdenum mines averaged $8.57 per pound of molybdenum in first-quarter 2018 and $7.02 per pound in first-quarter 2017 . Based on current sales volume and cost estimates, average unit net cash costs for the Molybdenum mines are expected to approximate $8.75 per pound of molybdenum for the year 2018 . Refer to "Product Revenues and Production Costs" for a reconciliation of unit net cash costs per pound to production and delivery costs applicable to sales reported in our consolidated financial statements.
Smelting and Refining
We wholly own and operate a smelter in Arizona (Miami smelter), a refinery in Texas (El Paso refinery) and a smelter and refinery in Spain (Atlantic Copper). Additionally, PT-FI owns 25 percent of a smelter and refinery in Gresik, Indonesia (PT Smelting). Treatment charges for smelting and refining copper concentrate consist of a base rate per pound of copper and per ounce of gold and are generally fixed. Treatment charges represent a cost to our mining operations and income to Atlantic Copper and PT Smelting. Thus, higher treatment charges benefit our smelter operations and adversely affect our mining operations. Our North America copper mines are less significantly affected by changes in treatment charges because these operations are largely integrated with our Miami smelter and El Paso refinery. Through this form of downstream integration, we are assured placement of a significant portion of our concentrate production.
Atlantic Copper smelts and refines copper concentrate and markets refined copper and precious metals in slimes. During first-quarter 2018 , approximately one-third of Atlantic Copper's concentrate purchases were from our North America and South America copper mining operations, with the remainder purchased from third parties.
PT-FI's contract with PT Smelting provides for PT-FI to supply 100 percent of the copper concentrate requirements (subject to a minimum or maximum rate) necessary for PT Smelting to produce 205,000 metric tons of copper annually on a priority basis. PT-FI may also sell copper concentrate to PT Smelting at market rates for quantities in excess of 205,000 metric tons of copper annually. During first-quarter 2018 , PT-FI supplied all of PT Smelting's concentrate requirements.
We defer recognizing profits on sales from our mining operations to Atlantic Copper and on 25 percent of PT-FI's sales to PT Smelting until final sales to third parties occur. Changes in these deferrals attributable to variability in intercompany volumes resulted in net (reductions) additions to net income attributable to common stock of $(7) million in first-quarter 2018 and $27 million in first-quarter 2017 . Our net deferred profits on our inventories at Atlantic Copper and PT Smelting to be recognized in future periods' net income attributable to common stock totaled $95 million at March 31, 2018 . Quarterly variations in ore grades, the timing of intercompany shipments and changes in product prices will result in variability in our net deferred profits and quarterly earnings.
47
Table of Contents
CAPITAL RESOURCES AND LIQUIDITY
Our consolidated operating cash flows vary with prices realized from copper, gold and molybdenum; our sales volumes; production costs; income taxes; other working capital changes; and other factors. We believe that we have a high-quality portfolio of long-lived copper assets positioned to generate long-term value. We have commenced a project to develop the Lone Star oxide ores near the Safford operation in eastern Arizona. We are also pursuing other opportunities to enhance net present values, and we continue to advance studies for future development of our copper resources, the timing of which will be dependent on market conditions.
Cash
Following is a summary of the U.S. and international components of consolidated cash and cash equivalents available to the parent company, net of noncontrolling interests' share, taxes and other costs at March 31, 2018 (in billions):
Cash at domestic companies | $ | 2.5 | |
Cash at international operations | 1.2 | | |
Total consolidated cash and cash equivalents | 3.7 | | |
Noncontrolling interests' share | (0.4 | ) | |
Cash, net of noncontrolling interests' share | 3.3 | | |
Withholding taxes and other | (0.1 | ) | |
Net cash available | $ | 3.2 | |
Cash held at our international operations is generally used to support our foreign operations' capital expenditures, operating expenses, debt repayment, working capital and other tax payments, or other cash needs. Management believes that sufficient liquidity is available in the U.S. from cash balances and availability from our revolving credit facility. We have not elected to permanently reinvest earnings from our foreign subsidiaries, and we have recorded deferred tax liabilities for foreign earnings that are available to be repatriated to the U.S. From time to time, our foreign subsidiaries distribute earnings to the U.S. through dividends that are subject to applicable withholding taxes and noncontrolling interests' share.
Debt
Following is a summary of our total debt and the related weighted-average interest rates at March 31, 2018 (in billions, except percentages):
|
|
| Weighted- | ||
|
|
| Average | ||
|
|
| Interest Rate | ||
Senior Notes | $ | 10.4 | |
| 4.7% |
Cerro Verde credit facility | 1.2 | |
| 3.8% | |
Total debt | $ | 11.6 | |
| 4.6% |
|
|
|
| ||
At March 31, 2018 , we had no borrowings, $13 million in letters of credit issued and availability of $3.5 billion under our revolving credit facility. In April 2018, we entered into a new $3.5 billion, five-year, unsecured revolving credit facility with substantially similar structure and terms as our prior facility, which was scheduled to mature in May 2019.
In April 2018, we redeemed $404 million of senior notes due 2022 and $50 million of senior notes due 2023. We expect to record a gain of $10 million in second-quarter 2018 related to these redemptions, and the aggregate annual cash interest savings approximates $30 million.
Refer to Note 5 for further discussion of debt.
Operating Activities
We generated consolidated operating cash flows of $1.4 billion (net of $21 million in working capital uses and timing of other tax payments) in first-quarter 2018 and $792 million (including $189 million in working capital sources and timing of other tax payments) in first-quarter 2017 . Higher operating cash flows in first-quarter 2018 , compared to first-quarter 2017 , primarily reflect higher copper and gold sales volumes and higher metals prices.
48
Table of Contents
Subject to future commodity prices for copper, gold and molybdenum, we expect estimated consolidated operating cash flows for the year 2018 , plus available cash and availability under our credit facility, to be sufficient to fund our budgeted capital expenditures, cash dividends, noncontrolling interest distributions and other cash requirements for the year. Refer to "Outlook" for further discussion of projected operating cash flows for the year 2018 . For a discussion of regulatory matters in Indonesia that could have a significant impact on future results, refer to "Risk Factors," contained in Part I, Item 1A. of our annual report on Form 10-K for the year ended December 31, 2017 .
Investing Activities
Capital Expenditures. Capital expenditures, including capitalized interest, totaled $402 million in first-quarter 2018 , including $250 million for major mining projects. Capital expenditures, including capitalized interest, totaled $344 million in first-quarter 2017 , including $210 million for major mining projects. Refer to "Outlook" for further discussion of projected capital expenditures for the year 2018 .
Financing Activities
Debt Transactions. Net repayments of debt in first-quarter 2018 totaled $1.5 billion , consisting of $1.4 billion for senior notes due March 2018 and $0.1 billion for the Cerro Verde credit facility.
Net repayments of debt in first-quarter 2017 totaled $0.7 billion primarily for the repayment of our senior notes due 2017 and payments on the Cerro Verde credit facility.
Dividends. In February 2018, the Board reinstated a cash dividend on our common stock. On March 28, 2018, the Board declared a quarterly cash dividend of $0.05 per share, which was paid May 1, 2018, to stockholders of record as of April 13, 2018. The declaration of dividends is at the discretion of our Board and will depend upon our financial results, cash requirements, future prospects and other factors deemed relevant by our Board.
Common stock dividends of $1 million in first-quarter 2017 related to accumulated dividends paid for vested stock-based compensation.
Cash dividends paid to noncontrolling interests totaled $80 million in first-quarter 2018 and $15 million in first-quarter 2017 . These payments will vary based on the operating results and cash requirements of our consolidated subsidiaries.
CONTRACTUAL OBLIGATIONS
There have been no material changes in our contractual obligations since December 31, 2017 . Refer to Part II, Items 7. and 7A. in our annual report on Form 10-K for the year ended December 31, 2017 , for information regarding our contractual obligations.
CONTINGENCIES
Environmental and Asset Retirement Obligations
Our current and historical operating activities are subject to stringent laws and regulations governing the protection of the environment. We perform a comprehensive annual review of our environmental and asset retirement obligations and also review changes in facts and circumstances associated with these obligations at least quarterly. There have been no material changes to our environmental and asset retirement obligations since December 31, 2017 . Updated cost assumptions, including increases and decreases to cost estimates, changes in the anticipated scope and timing of remediation activities, and settlement of environmental matters may result in additional revisions to certain of our environmental obligations. Refer to Note 12 in our annual report on Form 10-K for the year ended December 31, 2017 , for further information regarding our environmental and asset retirement obligations.
Litigation and Other Contingencies
Other than as discussed in Note 8, there have been no material changes to our contingencies associated with legal proceedings, environmental and other matters since December 31, 2017 . Refer to Note 12 and "Legal Proceedings" contained in Part I, Item 3. of our annual report on Form 10-K for the year ended December 31, 2017 , for further information regarding legal proceedings, environmental and other matters.
49
Table of Contents
NEW ACCOUNTING STANDARDS
Refer to Note 11 for a summary of recently adopted accounting standards.
PRODUCT REVENUES AND PRODUCTION COSTS
Unit net cash (credits) costs per pound of copper and molybdenum are measures intended to provide investors with information about the cash-generating capacity of our mining operations expressed on a basis relating to the primary metal product for the respective operations. We use this measure for the same purpose and for monitoring operating performance by our mining operations. This information differs from measures of performance determined in accordance with U.S. GAAP and should not be considered in isolation or as a substitute for measures of performance determined in accordance with U.S. GAAP. These measures are presented by other metals mining companies, although our measures may not be comparable to similarly titled measures reported by other companies.
We present gross profit per pound of copper in the following tables using both a "by-product" method and a "co-product" method. We use the by-product method in our presentation of gross profit per pound of copper because (i) the majority of our revenues are copper revenues, (ii) we mine ore, which contains copper, gold, molybdenum and other metals, (iii) it is not possible to specifically assign all of our costs to revenues from the copper, gold, molybdenum and other metals we produce and (iv) it is the method used by our management and our Board to monitor our mining operations and to compare mining operations in certain industry publications. In the co-product method presentations, shared costs are allocated to the different products based on their relative revenue values, which will vary to the extent our metals sales volumes and realized prices change.
We show revenue adjustments for prior period open sales as a separate line item. Because these adjustments do not result from current period sales, these amounts have been reflected separately from revenues on current period
sales. Noncash and other costs, which are removed from site production and delivery costs in the calculation of unit
net cash (credits) costs, consist of items such as stock-based compensation costs, start-up costs, inventory adjustments, long-lived asset impairments, restructuring and/or unusual charges. As discussed above, gold, molybdenum and other metal revenues at copper mines are reflected as credits against site production and delivery costs in the by-product method. The following schedules are presentations under both the by-product and co-product methods together with reconciliations to amounts reported in our consolidated financial statements.
|
|
|
|
|
|
|
|
|
|
|
|
|
|
|
|
|
|
|
|
|
|
| ||||||||
|
|
|
|
|
| ||||
50
Table of Contents
North America Copper Mines Product Revenues, Production Costs and Unit Net Cash Costs
|
|
|
|
|
| ||||||||||||||||
Three Months Ended March 31, 2018 |
|
|
|
|
| ||||||||||||||||
(In millions) |
| By-Product |
| Co-Product Method |
| ||||||||||||||||
|
| Method |
| Copper |
| Molybdenum a |
| Other b |
| Total |
| ||||||||||
Revenues, excluding adjustments |
| $ | 1,209 | |
| $ | 1,209 | |
| $ | 76 | |
| $ | 23 | |
| $ | 1,308 | |
|
Site production and delivery, before net noncash |
|
|
|
|
|
|
|
|
|
|
| ||||||||||
and other costs shown below |
| 705 | |
| 660 | |
| 55 | |
| 13 | |
| 728 | |
| |||||
By-product credits |
| (76 | ) |
| - | |
| - | |
| - | |
| - | |
| |||||
Treatment charges |
| 37 | |
| 35 | |
| - | |
| 2 | |
| 37 | |
| |||||
Net cash costs |
| 666 | |
| 695 | |
| 55 | |
| 15 | |
| 765 | |
| |||||
DD&A |
| 94 | |
| 88 | |
| 4 | |
| 2 | |
| 94 | |
| |||||
Noncash and other costs, net |
| 19 | |
| 18 | |
| 1 | |
| - | |
| 19 | |
| |||||
Total costs |
| 779 | |
| 801 | |
| 60 | |
| 17 | |
| 878 | |
| |||||
Other revenue adjustments, primarily for pricing |
|
|
|
|
|
|
|
|
|
|
| ||||||||||
on prior period open sales |
| (5 | ) |
| (5 | ) |
| - | |
| - | |
| (5 | ) |
| |||||
Gross profit |
| $ | 425 | |
| $ | 403 | |
| $ | 16 | |
| $ | 6 | |
| $ | 425 | |
|
|
|
|
|
|
|
|
|
|
|
|
| ||||||||||
Copper sales (millions of recoverable pounds) |
| 383 | |
| 383 | |
|
|
|
|
|
|
| ||||||||
Molybdenum sales (millions of recoverable pounds) a |
|
|
|
|
| 7 | |
|
|
|
|
| |||||||||
|
|
|
|
|
|
|
|
|
|
|
| ||||||||||
Gross profit per pound of copper/molybdenum: |
|
|
|
|
|
|
| ||||||||||||||
|
|
|
|
|
|
|
|
|
|
|
| ||||||||||
Revenues, excluding adjustments |
| $ | 3.16 | |
| $ | 3.16 | |
| $ | 10.87 | |
|
|
|
|
| ||||
Site production and delivery, before net noncash |
|
|
|
|
|
|
|
|
|
|
| ||||||||||
and other costs shown below |
| 1.84 | |
| 1.73 | |
| 7.81 | |
|
|
|
|
| |||||||
By-product credits |
| (0.20 | ) |
| - | |
| - | |
|
|
|
|
| |||||||
Treatment charges |
| 0.10 | |
| 0.09 | |
| - | |
|
|
|
|
| |||||||
Unit net cash costs |
| 1.74 | |
| 1.82 | |
| 7.81 | |
|
|
|
|
| |||||||
DD&A |
| 0.25 | |
| 0.23 | |
| 0.66 | |
|
|
|
|
| |||||||
Noncash and other costs, net |
| 0.05 | |
| 0.05 | |
| 0.09 | |
|
|
|
|
| |||||||
Total unit costs |
| 2.04 | |
| 2.10 | |
| 8.56 | |
|
|
|
|
| |||||||
Other revenue adjustments, primarily for pricing |
|
|
|
|
|
|
|
|
|
|
| ||||||||||
on prior period open sales |
| (0.01 | ) |
| (0.01 | ) |
| - | |
|
|
|
|
| |||||||
Gross profit per pound |
| $ | 1.11 | |
| $ | 1.05 | |
| $ | 2.31 | |
|
|
|
|
| ||||
|
|
|
|
|
|
|
|
|
|
|
| ||||||||||
Reconciliation to Amounts Reported |
|
|
|
|
|
|
|
|
|
|
| ||||||||||
(In millions) |
|
|
|
|
|
|
|
|
|
|
| ||||||||||
|
|
|
| Production |
|
|
|
|
|
|
| ||||||||||
|
| Revenues |
| and Delivery |
| DD&A |
|
|
|
|
| ||||||||||
Totals presented above |
| $ | 1,308 | |
| $ | 728 | |
| $ | 94 | |
|
|
|
|
| ||||
Treatment charges |
| (8 | ) |
| 29 | |
| - | |
|
|
|
|
| |||||||
Noncash and other costs, net |
| - | |
| 19 | |
| - | |
|
|
|
|
| |||||||
Other revenue adjustments, primarily for pricing |
|
|
|
|
|
|
|
|
|
|
| ||||||||||
on prior period open sales |
| (5 | ) |
| - | |
| - | |
|
|
|
|
| |||||||
Eliminations and other |
| 13 | |
| 15 | |
| - | |
|
|
|
|
| |||||||
North America copper mines |
| 1,308 | |
| 791 | |
| 94 | |
|
|
|
|
| |||||||
Other mining c |
| 4,517 | |
| 3,011 | |
| 336 | |
|
|
|
|
| |||||||
Corporate, other & eliminations |
| (957 | ) |
| (994 | ) |
| 21 | |
|
|
|
|
| |||||||
As reported in FCX's consolidated financial statements |
| $ | 4,868 | |
| $ | 2,808 | |
| $ | 451 | |
|
|
|
|
| ||||
| |||||||||||||||||||||
a. | Reflects sales of molybdenum produced by certain of the North America copper mines to our molybdenum sales company at market-based pricing. |
b. | Includes gold and silver product revenues and production costs. |
c. | Represents the combined total for our other mining operations, including South America mining, Indonesia mining, Molybdenum mines, Rod & Refining and Atlantic Copper Smelting & Refining, as presented in Note 9. |
51
Table of Contents
North America Copper Mines Product Revenues, Production Costs and Unit Net Cash Costs
|
|
|
|
|
| ||||||||||||||||
Three Months Ended March 31, 2017 |
|
|
|
|
| ||||||||||||||||
(In millions) |
| By-Product |
| Co-Product Method |
| ||||||||||||||||
|
| Method |
| Copper |
| Molybdenum a |
| Other b |
| Total |
| ||||||||||
Revenues, excluding adjustments |
| $ | 1,005 | |
| $ | 1,005 | |
| $ | 59 | |
| $ | 20 | |
| $ | 1,084 | |
|
Site production and delivery, before net noncash |
|
|
|
|
|
|
|
|
|
|
| ||||||||||
and other costs shown below |
| 562 | |
| 530 | |
| 44 | |
| 10 | |
| 584 | |
| |||||
By-product credits |
| (57 | ) |
| - | |
| - | |
| - | |
| - | |
| |||||
Treatment charges |
| 42 | |
| 41 | |
| - | |
| 1 | |
| 42 | |
| |||||
Net cash costs |
| 547 | |
| 571 | |
| 44 | |
| 11 | |
| 626 | |
| |||||
DD&A |
| 116 | |
| 110 | |
| 4 | |
| 2 | |
| 116 | |
| |||||
Noncash and other costs, net |
| 33 | | c | 32 | |
| 1 | |
| - | |
| 33 | |
| |||||
Total costs |
| 696 | |
| 713 | |
| 49 | |
| 13 | |
| 775 | |
| |||||
Other revenue adjustments, primarily for pricing |
|
|
|
|
|
|
|
|
|
|
| ||||||||||
on prior period open sales |
| 5 | |
| 5 | |
| - | |
| - | |
| 5 | |
| |||||
Gross profit |
| $ | 314 | |
| $ | 297 | |
| $ | 10 | |
| $ | 7 | |
| $ | 314 | |
|
|
|
|
|
|
|
|
|
|
|
|
| ||||||||||
Copper sales (millions of recoverable pounds) |
| 374 | |
| 374 | |
|
|
|
|
|
|
| ||||||||
Molybdenum sales (millions of recoverable pounds) a |
|
|
|
|
| 9 | |
|
|
|
|
| |||||||||
|
|
|
|
|
|
|
|
|
|
|
| ||||||||||
Gross profit per pound of copper/molybdenum: |
|
|
|
|
|
|
| ||||||||||||||
|
|
|
|
|
|
|
|
|
|
|
| ||||||||||
Revenues, excluding adjustments |
| $ | 2.68 | |
| $ | 2.68 | |
| $ | 7.00 | |
|
|
|
|
| ||||
Site production and delivery, before net noncash |
|
|
|
|
|
|
|
|
|
|
| ||||||||||
and other costs shown below |
| 1.50 | |
| 1.42 | |
| 5.16 | |
|
|
|
|
| |||||||
By-product credits |
| (0.15 | ) |
| - | |
| - | |
|
|
|
|
| |||||||
Treatment charges |
| 0.11 | |
| 0.11 | |
| - | |
|
|
|
|
| |||||||
Unit net cash costs |
| 1.46 | |
| 1.53 | |
| 5.16 | |
|
|
|
|
| |||||||
DD&A |
| 0.31 | |
| 0.29 | |
| 0.52 | |
|
|
|
|
| |||||||
Noncash and other costs, net |
| 0.09 | | c | 0.09 | |
| 0.07 | |
|
|
|
|
| |||||||
Total unit costs |
| 1.86 | |
| 1.91 | |
| 5.75 | |
|
|
|
|
| |||||||
Other revenue adjustments, primarily for pricing |
|
|
|
|
|
|
|
|
|
|
| ||||||||||
on prior period open sales |
| 0.02 | |
| 0.02 | |
| - | |
|
|
|
|
| |||||||
Gross profit per pound |
| $ | 0.84 | |
| $ | 0.79 | |
| $ | 1.25 | |
|
|
|
|
| ||||
|
|
|
|
|
|
|
|
|
|
|
| ||||||||||
Reconciliation to Amounts Reported |
|
|
|
|
|
|
|
|
|
|
| ||||||||||
(In millions) |
|
|
| Production |
|
|
|
|
|
|
| ||||||||||
|
| Revenues |
| and Delivery |
| DD&A |
|
|
|
|
| ||||||||||
Totals presented above |
| $ | 1,084 | |
| $ | 584 | |
| $ | 116 | |
|
|
|
|
| ||||
Treatment charges |
| (9 | ) |
| 33 | |
| - | |
|
|
|
|
| |||||||
Noncash and other costs, net |
| - | |
| 33 | |
| - | |
|
|
|
|
| |||||||
Other revenue adjustments, primarily for pricing |
|
|
|
|
|
|
|
|
|
|
| ||||||||||
on prior period open sales |
| 5 | |
| - | |
| - | |
|
|
|
|
| |||||||
Eliminations and other |
| 15 | |
| 16 | |
| - | |
|
|
|
|
| |||||||
North America copper mines |
| 1,095 | |
| 666 | |
| 116 | |
|
|
|
|
| |||||||
Other mining d |
| 3,038 | |
| 2,340 | |
| 244 | |
|
|
|
|
| |||||||
Corporate, other & eliminations |
| (792 | ) |
| (818 | ) |
| 29 | |
|
|
|
|
| |||||||
As reported in FCX's consolidated financial statements |
| $ | 3,341 | |
| $ | 2,188 | |
| $ | 389 | |
|
|
|
|
| ||||
| |||||||||||||||||||||
a. | Reflects sales of molybdenum produced by certain of the North America copper mines to our molybdenum sales company at market-based pricing. |
b. | Includes gold and silver product revenues and production costs. |
c. | Includes $19 million ( $0.05 per pound of copper) for other asset impairment charges at Morenci. |
d. | Represents the combined total for our other mining operations, including South America mining, Indonesia mining, Molybdenum mines, Rod & Refining and Atlantic Copper Smelting & Refining, as presented in Note 9. |
52
Table of Contents
South America Mining Product Revenues, Production Costs and Unit Net Cash Costs
|
|
|
|
| |||||||||||||
Three Months Ended March 31, 2018 |
|
|
|
| |||||||||||||
(In millions) |
| By-Product |
| Co-Product Method | |||||||||||||
|
| Method |
| Copper |
| Other a |
| Total | |||||||||
Revenues, excluding adjustments |
| $ | 894 | |
| $ | 894 | |
| $ | 85 | |
| $ | 979 | | |
Site production and delivery, before net noncash |
|
|
|
|
|
|
|
| |||||||||
and other costs shown below |
| 517 | |
| 476 | |
| 52 | |
| 528 | | |||||
By-product credits |
| (74 | ) |
| - | |
| - | |
| - | | |||||
Treatment charges |
| 59 | |
| 59 | |
| - | |
| 59 | | |||||
Royalty on metals |
| 2 | |
| 2 | |
| - | |
| 2 | | |||||
Net cash costs |
| 504 | |
| 537 | |
| 52 | |
| 589 | | |||||
DD&A |
| 126 | |
| 115 | |
| 11 | |
| 126 | | |||||
Noncash and other costs, net |
| 15 | |
| 15 | |
| - | |
| 15 | | |||||
Total costs |
| 645 | |
| 667 | |
| 63 | |
| 730 | | |||||
Other revenue adjustments, primarily for pricing |
|
|
|
|
|
|
|
| |||||||||
on prior period open sales |
| (43 | ) |
| (43 | ) |
| - | |
| (43 | ) | |||||
Gross profit |
| $ | 206 | |
| $ | 184 | |
| $ | 22 | |
| $ | 206 | | |
|
|
|
|
|
|
|
|
| |||||||||
Copper sales (millions of recoverable pounds) |
| 290 | |
| 290 | |
|
|
|
| |||||||
|
|
|
|
|
|
|
|
| |||||||||
Gross profit per pound of copper: |
|
|
|
| |||||||||||||
|
|
|
|
|
|
|
|
| |||||||||
Revenues, excluding adjustments |
| $ | 3.08 | |
| $ | 3.08 | |
|
|
|
| |||||
Site production and delivery, before net noncash |
|
|
|
|
|
|
|
| |||||||||
and other costs shown below |
| 1.78 | |
| 1.64 | |
|
|
|
| |||||||
By-product credits |
| (0.25 | ) |
| - | |
|
|
|
| |||||||
Treatment charges |
| 0.20 | |
| 0.20 | |
|
|
|
| |||||||
Royalty on metals |
| 0.01 | |
| 0.01 | |
|
|
|
| |||||||
Unit net cash costs |
| 1.74 | |
| 1.85 | |
|
|
|
| |||||||
DD&A |
| 0.43 | |
| 0.40 | |
|
|
|
| |||||||
Noncash and other costs, net |
| 0.05 | |
| 0.05 | |
|
|
|
| |||||||
Total unit costs |
| 2.22 | |
| 2.30 | |
|
|
|
| |||||||
Other revenue adjustments, primarily for pricing |
|
|
|
|
|
|
|
| |||||||||
on prior period open sales |
| (0.15 | ) |
| (0.15 | ) |
|
|
|
| |||||||
Gross profit per pound |
| $ | 0.71 | |
| $ | 0.63 | |
|
|
|
| |||||
|
|
|
|
|
|
|
|
| |||||||||
Reconciliation to Amounts Reported |
|
|
|
|
|
|
|
| |||||||||
(In millions) |
|
|
| Production |
|
|
|
| |||||||||
|
| Revenues |
| and Delivery |
| DD&A |
|
| |||||||||
Totals presented above |
| $ | 979 | |
| $ | 528 | |
| $ | 126 | |
|
| |||
Treatment charges |
| (59 | ) |
| - | |
| - | |
|
| ||||||
Royalty on metals |
| (2 | ) |
| - | |
| - | |
|
| ||||||
Noncash and other costs, net |
| - | |
| 15 | |
| - | |
|
| ||||||
Other revenue adjustments, primarily for pricing |
|
|
|
|
|
|
|
| |||||||||
on prior period open sales |
| (43 | ) |
| - | |
| - | |
|
| ||||||
Eliminations and other |
| 2 | |
| - | |
| 1 | |
|
| ||||||
South America mining |
| 877 | |
| 543 | |
| 127 | |
|
| ||||||
Other mining b | - | | 4,948 | |
| 3,259 | |
| 303 | |
|
| |||||
Corporate, other & eliminations | - | | (957 | ) |
| (994 | ) |
| 21 | |
|
| |||||
As reported in FCX's consolidated financial statements |
| $ | 4,868 | |
| $ | 2,808 | |
| $ | 451 | |
|
| |||
|
|
|
|
|
|
|
|
| |||||||||
a. | Includes silver sales of 975 thousand ounces ( $16.52 per ounce average realized price). Also reflects sales of molybdenum produced by Cerro Verde to our molybdenum sales company at market-based pricing. |
b. | Represents the combined total for our other mining operations, including North America copper mines, Indonesia mining, Molybdenum mines, Rod & Refining and Atlantic Copper Smelting & Refining, as presented in Note 9. |
53
Table of Contents
South America Mining Product Revenues, Production Costs and Unit Net Cash Costs
|
|
|
|
|
| ||||||||||||
Three Months Ended March 31, 2017 |
|
|
|
|
| ||||||||||||
(In millions) |
| By-Product |
| Co-Product Method |
| ||||||||||||
|
| Method |
| Copper |
| Other a |
| Total |
| ||||||||
Revenues, excluding adjustments |
| $ | 821 | |
| $ | 821 | |
| $ | 68 | |
| $ | 889 | |
|
Site production and delivery, before net noncash |
|
|
|
|
|
|
|
|
| ||||||||
and other costs shown below |
| 457 | |
| 426 | |
| 43 | |
| 469 | |
| ||||
By-product credits |
| (56 | ) |
| - | |
| - | |
| - | |
| ||||
Treatment charges |
| 68 | |
| 68 | |
| - | |
| 68 | |
| ||||
Royalty on metals |
| 2 | |
| 2 | |
| - | |
| 2 | |
| ||||
Net cash costs |
| 471 | |
| 496 | |
| 43 | |
| 539 | |
| ||||
DD&A |
| 133 | |
| 123 | |
| 10 | |
| 133 | |
| ||||
Noncash and other costs, net |
| 5 | |
| 5 | |
| - | |
| 5 | |
| ||||
Total costs |
| 609 | |
| 624 | |
| 53 | |
| 677 | |
| ||||
Other revenue adjustments, primarily for pricing |
|
|
|
|
|
|
|
|
| ||||||||
on prior period open sales |
| 49 | |
| 49 | |
| - | |
| 49 | |
| ||||
Gross profit |
| $ | 261 | |
| $ | 246 | |
| $ | 15 | |
| $ | 261 | |
|
|
|
|
|
|
|
|
|
|
| ||||||||
Copper sales (millions of recoverable pounds) |
| 309 | |
| 309 | |
|
|
|
|
| ||||||
|
|
|
|
|
|
|
|
|
| ||||||||
Gross profit per pound of copper: |
|
|
|
|
| ||||||||||||
|
|
|
|
|
|
|
|
|
| ||||||||
Revenues, excluding adjustments |
| $ | 2.66 | |
| $ | 2.66 | |
|
|
|
|
| ||||
Site production and delivery, before net noncash |
|
|
|
|
|
|
|
|
| ||||||||
and other costs shown below |
| 1.48 | |
| 1.38 | |
|
|
|
|
| ||||||
By-product credits |
| (0.18 | ) |
| - | |
|
|
|
|
| ||||||
Treatment charges |
| 0.22 | |
| 0.22 | |
|
|
|
|
| ||||||
Royalty on metals |
| 0.01 | |
| 0.01 | |
|
|
|
|
| ||||||
Unit net cash costs |
| 1.53 | |
| 1.61 | |
|
|
|
|
| ||||||
DD&A |
| 0.43 | |
| 0.40 | |
|
|
|
|
| ||||||
Noncash and other costs, net |
| 0.01 | |
| 0.01 | |
|
|
|
|
| ||||||
Total unit costs |
| 1.97 | |
| 2.02 | |
|
|
|
|
| ||||||
Other revenue adjustments, primarily for pricing |
|
|
|
|
|
|
|
|
| ||||||||
on prior period open sales |
| 0.16 | |
| 0.16 | |
|
|
|
|
| ||||||
Gross profit per pound |
| $ | 0.85 | |
| $ | 0.80 | |
|
|
|
|
| ||||
|
|
|
|
|
|
|
|
|
| ||||||||
Reconciliation to Amounts Reported |
|
|
|
|
|
|
|
|
| ||||||||
(In millions) |
|
|
| Production |
|
|
|
|
| ||||||||
|
| Revenues |
| and Delivery |
| DD&A |
|
|
| ||||||||
Totals presented above |
| $ | 889 | |
| $ | 469 | |
| $ | 133 | |
|
|
| ||
Treatment charges |
| (68 | ) |
| - | |
| - | |
|
|
| |||||
Royalty on metals |
| (2 | ) |
| - | |
| - | |
|
|
| |||||
Noncash and other costs, net |
| - | |
| 5 | |
| - | |
|
|
| |||||
Other revenue adjustments, primarily for pricing |
|
|
|
|
|
|
|
|
| ||||||||
on prior period open sales |
| 49 | |
| - | |
| - | |
|
|
| |||||
Eliminations and other |
| - | |
| (1 | ) |
| - | |
|
|
| |||||
South America mining |
| 868 | |
| 473 | |
| 133 | |
|
|
| |||||
Other mining b |
| 3,265 | |
| 2,533 | | | 227 | |
|
|
| |||||
Corporate, other & eliminations |
| (792 | ) |
| (818 | ) |
| 29 | |
|
|
| |||||
As reported in FCX's consolidated financial statements |
| $ | 3,341 | |
| $ | 2,188 | |
| $ | 389 | |
|
|
| ||
|
|
|
|
|
|
|
|
|
| ||||||||
a. | Includes silver sales of 964 thousand ounces ( $16.06 per ounce average realized price). Also reflects sales of molybdenum produced by Cerro Verde to our molybdenum sales company at market-based pricing. |
b. | Represents the combined total for our other mining operations, including North America copper mines, Indonesia mining, Molybdenum mines, Rod & Refining and Atlantic Copper Smelting & Refining, as presented in Note 9. |
|
|
|
|
|
|
|
54
Table of Contents
Indonesia Mining Product Revenues, Production Costs and Unit Net Cash Costs
|
|
|
|
| ||||||||||||||||
Three Months Ended March 31, 2018 |
|
|
|
| ||||||||||||||||
(In millions) |
| By-Product |
| Co-Product Method | ||||||||||||||||
|
| Method |
| Copper |
| Gold |
| Silver a |
| Total | ||||||||||
Revenues, excluding adjustments |
| $ | 976 | |
| $ | 976 | |
| $ | 791 | |
| $ | 19 | |
| $ | 1,786 | |
Site production and delivery, before net noncash |
|
|
|
|
|
|
|
|
|
| ||||||||||
and other costs shown below |
| 433 | |
| 237 | |
| 192 | |
| 4 | |
| 433 | | |||||
Gold and silver credits |
| (826 | ) |
| - | |
| - | |
| - | |
| - | | |||||
Treatment charges |
| 78 | |
| 43 | |
| 34 | |
| 1 | |
| 78 | | |||||
Export duties |
| 46 | |
| 25 | |
| 21 | |
| - | |
| 46 | | |||||
Royalty on metals |
| 67 | |
| 36 | |
| 30 | |
| 1 | |
| 67 | | |||||
Net cash (credits) costs |
| (202 | ) |
| 341 | |
| 277 | |
| 6 | |
| 624 | | |||||
DD&A |
| 181 | |
| 99 | |
| 80 | |
| 2 | |
| 181 | | |||||
Noncash and other costs, net |
| 15 | |
| 8 | |
| 6 | |
| 1 | |
| 15 | | |||||
Total (credits) costs |
| (6 | ) |
| 448 | |
| 363 | |
| 9 | |
| 820 | | |||||
Other revenue adjustments, primarily for pricing |
|
|
|
|
|
|
|
|
|
| ||||||||||
on prior period open sales |
| (38 | ) |
| (38 | ) |
| 16 | |
| - | |
| (22 | ) | |||||
PT Smelting intercompany loss |
| (9 | ) |
| (5 | ) |
| (4 | ) |
| - | |
| (9 | ) | |||||
Gross profit |
| $ | 935 | |
| $ | 485 | |
| $ | 440 | |
| $ | 10 | |
| $ | 935 | |
|
|
|
|
|
|
|
|
|
|
| ||||||||||
Copper sales (millions of recoverable pounds) |
| 319 | |
| 319 | |
|
|
|
|
|
| ||||||||
Gold sales (thousands of recoverable ounces) |
|
|
|
|
| 603 | |
|
|
|
| |||||||||
|
|
|
|
|
|
|
|
|
|
| ||||||||||
Gross profit per pound of copper/per ounce of gold: |
|
|
|
|
|
| ||||||||||||||
|
|
|
|
|
|
|
|
|
|
| ||||||||||
Revenues, excluding adjustments |
| $ | 3.06 | |
| $ | 3.06 | |
| $ | 1,312 | |
|
|
|
| ||||
Site production and delivery, before net noncash |
|
|
|
|
|
|
|
|
|
| ||||||||||
and other costs shown below |
| 1.36 | |
| 0.75 | |
| 319 | |
|
|
|
| |||||||
Gold and silver credits |
| (2.59 | ) |
| - | |
| - | |
|
|
|
| |||||||
Treatment charges |
| 0.25 | |
| 0.13 | |
| 57 | |
|
|
|
| |||||||
Export duties |
| 0.14 | |
| 0.08 | |
| 34 | |
|
|
|
| |||||||
Royalty on metals |
| 0.21 | |
| 0.11 | |
| 49 | |
|
|
|
| |||||||
Unit net cash (credits) costs |
| (0.63 | ) |
| 1.07 | |
| 459 | |
|
|
|
| |||||||
DD&A |
| 0.57 | |
| 0.31 | |
| 133 | |
|
|
|
| |||||||
Noncash and other costs, net |
| 0.04 | |
| 0.02 | |
| 11 | |
|
|
|
| |||||||
Total unit (credits) costs |
| (0.02 | ) |
| 1.40 | |
| 603 | |
|
|
|
| |||||||
Other revenue adjustments, primarily for pricing |
|
|
|
|
|
|
|
|
|
| ||||||||||
on prior period open sales |
| (0.12 | ) |
| (0.12 | ) |
| 27 | |
|
|
|
| |||||||
PT Smelting intercompany loss |
| (0.03 | ) |
| (0.02 | ) |
| (7 | ) |
|
|
|
| |||||||
Gross profit per pound/ounce |
| $ | 2.93 | |
| $ | 1.52 | |
| $ | 729 | |
|
|
|
| ||||
|
|
|
|
|
|
|
|
|
|
| ||||||||||
Reconciliation to Amounts Reported |
|
|
|
|
|
|
|
|
|
| ||||||||||
(In millions) |
|
|
| Production |
|
|
|
|
|
| ||||||||||
|
| Revenues |
| and Delivery |
| DD&A |
|
|
|
| ||||||||||
Totals presented above |
| $ | 1,786 | |
| $ | 433 | |
| $ | 181 | |
|
|
|
| ||||
Treatment charges |
| (78 | ) |
| - | |
| - | |
|
|
|
| |||||||
Export duties |
| (46 | ) |
| - | |
| - | |
|
|
|
| |||||||
Royalty on metals |
| (67 | ) |
| - | |
| - | |
|
|
|
| |||||||
Noncash and other costs, net |
| - | |
| 15 | |
| - | |
|
|
|
| |||||||
Other revenue adjustments, primarily for pricing |
|
|
|
|
|
|
|
|
|
| ||||||||||
on prior period open sales |
| (22 | ) |
| - | |
| - | |
|
|
|
| |||||||
PT Smelting intercompany loss |
| - | |
| 9 | |
| - | |
|
|
|
| |||||||
Indonesia mining |
| 1,573 | |
| 457 | |
| 181 | |
|
|
|
| |||||||
Other mining b |
| 4,252 | |
| 3,345 | |
| 249 | |
|
|
|
| |||||||
Corporate, other & eliminations |
| (957 | ) |
| (994 | ) |
| 21 | |
|
|
|
| |||||||
As reported in FCX's consolidated financial statements |
| $ | 4,868 | |
| $ | 2,808 | |
| $ | 451 | |
|
|
|
| ||||
|
|
|
|
|
|
|
|
|
|
| ||||||||||
a. | Includes silver sales of 1.2 million ounces ( $15.76 per ounce average realized price). |
b. | Represents the combined total for our other mining operations, including North America copper mines, South America mining, Molybdenum mines, Rod & Refining and Atlantic Copper Smelting & Refining, as presented in Note 9. |
| |||||||||||
55
Table of Contents
Indonesia Mining Product Revenues, Production Costs and Unit Net Cash Costs
Three Months Ended March 31, 2017 |
|
|
|
|
| ||||||||||||||||
(In millions) |
| By-Product |
| Co-Product Method |
| ||||||||||||||||
|
| Method |
| Copper |
| Gold |
| Silver a |
| Total |
| ||||||||||
Revenues, excluding adjustments |
| $ | 327 | |
| $ | 327 | |
| $ | 218 | |
| $ | 7 | |
| $ | 552 | |
|
Site production and delivery, before net noncash |
|
|
|
|
|
|
|
|
|
|
| ||||||||||
and other costs shown below |
| 265 | |
| 157 | |
| 104 | |
| 4 | |
| 265 | |
| |||||
Gold and silver credits |
| (234 | ) |
| - | |
| - | |
| - | |
| - | |
| |||||
Treatment charges |
| 35 | |
| 21 | |
| 14 | |
| - | |
| 35 | |
| |||||
Export duties |
| 14 | |
| 8 | |
| 6 | |
| - | |
| 14 | |
| |||||
Royalty on metals |
| 19 | |
| 11 | |
| 8 | |
| - | |
| 19 | |
| |||||
Net cash costs |
| 99 | |
| 197 | |
| 132 | |
| 4 | |
| 333 | |
| |||||
DD&A |
| 83 | |
| 49 | |
| 33 | |
| 1 | |
| 83 | |
| |||||
Noncash and other costs, net |
| 32 | | b | 19 | |
| 13 | |
| - | |
| 32 | |
| |||||
Total costs |
| 214 | |
| 265 | |
| 178 | |
| 5 | |
| 448 | |
| |||||
Other revenue adjustments, primarily for pricing |
|
|
|
|
|
|
|
|
|
|
| ||||||||||
on prior period open sales |
| 41 | |
| 41 | |
| 9 | |
| - | |
| 50 | |
| |||||
PT Smelting intercompany profit |
| 27 | |
| 16 | |
| 11 | |
| - | |
| 27 | |
| |||||
Gross profit |
| $ | 181 | |
| $ | 119 | |
| $ | 60 | |
| $ | 2 | |
| $ | 181 | |
|
|
|
|
|
|
|
|
|
|
|
|
| ||||||||||
Copper sales (millions of recoverable pounds) |
| 125 | |
| 125 | |
|
|
|
|
|
|
| ||||||||
Gold sales (thousands of recoverable ounces) |
|
|
|
|
| 177 | |
|
|
|
|
| |||||||||
|
|
|
|
|
|
|
|
|
|
|
| ||||||||||
Gross profit per pound of copper/per ounce of gold: |
|
|
|
|
|
|
| ||||||||||||||
|
|
|
|
|
|
|
|
|
|
|
| ||||||||||
Revenues, excluding adjustments |
| $ | 2.63 | |
| $ | 2.63 | |
| $ | 1,229 | |
|
|
|
|
| ||||
Site production and delivery, before net noncash |
|
|
|
|
|
|
|
|
|
|
| ||||||||||
and other costs shown below |
| 2.13 | |
| 1.26 | |
| 589 | |
|
|
|
|
| |||||||
Gold and silver credits |
| (1.88 | ) |
| - | |
| - | |
|
|
|
|
| |||||||
Treatment charges |
| 0.28 | |
| 0.17 | |
| 77 | |
|
|
|
|
| |||||||
Export duties |
| 0.11 | |
| 0.07 | |
| 31 | |
|
|
|
|
| |||||||
Royalty on metals |
| 0.16 | |
| 0.09 | |
| 45 | |
|
|
|
|
| |||||||
Unit net cash costs |
| 0.80 | |
| 1.59 | |
| 742 | |
|
|
|
|
| |||||||
DD&A |
| 0.66 | |
| 0.39 | |
| 184 | |
|
|
|
|
| |||||||
Noncash and other costs, net |
| 0.26 | | b | 0.15 | |
| 72 | |
|
|
|
|
| |||||||
Total unit costs |
| 1.72 | |
| 2.13 | |
| 998 | |
|
|
|
|
| |||||||
Other revenue adjustments, primarily for pricing |
|
|
|
|
|
|
|
|
|
|
| ||||||||||
on prior period open sales |
| 0.33 | |
| 0.33 | |
| 51 | |
|
|
|
|
| |||||||
PT Smelting intercompany profit |
| 0.21 | |
| 0.13 | |
| 59 | |
|
|
|
|
| |||||||
Gross profit per pound/ounce |
| $ | 1.45 | |
| $ | 0.96 | |
| $ | 341 | |
|
|
|
|
| ||||
|
|
|
|
|
|
|
|
|
|
|
| ||||||||||
Reconciliation to Amounts Reported |
|
|
|
|
|
|
|
|
|
|
| ||||||||||
(In millions) |
|
|
| Production |
|
|
|
|
|
|
| ||||||||||
|
| Revenues |
| and Delivery |
| DD&A |
|
|
|
|
| ||||||||||
Totals presented above |
| $ | 552 | |
| $ | 265 | |
| $ | 83 | |
|
|
|
|
| ||||
Treatment charges |
| (35 | ) |
| - | |
| - | |
|
|
|
|
| |||||||
Export duties |
| (14 | ) |
| - | |
| - | |
|
|
|
|
| |||||||
Royalty on metals |
| (19 | ) |
| - | |
| - | |
|
|
|
|
| |||||||
Noncash and other costs, net |
| - | |
| 32 | |
| - | |
|
|
|
|
| |||||||
Other revenue adjustments, primarily for pricing |
|
|
|
|
|
|
|
|
|
|
| ||||||||||
on prior period open sales |
| 50 | |
| - | |
| - | |
|
|
|
|
| |||||||
PT Smelting intercompany profit |
| - | |
| (27 | ) |
| - | |
|
|
|
|
| |||||||
Indonesia mining |
| 534 | |
| 270 | |
| 83 | |
|
|
|
|
| |||||||
Other mining c |
| 3,599 | |
| 2,736 | |
| 277 | |
|
|
|
|
| |||||||
Corporate, other & eliminations |
| (792 | ) |
| (818 | ) |
| 29 | |
|
|
|
|
| |||||||
As reported in FCX's consolidated financial statements |
| $ | 3,341 | |
| $ | 2,188 | |
| $ | 389 | |
|
|
|
|
| ||||
|
|
|
|
|
|
|
|
|
|
|
| ||||||||||
a. | Includes silver sales of 404 thousand ounces ( $17.37 per ounce average realized price). |
b. | Includes $21 million ( $0.17 per pound of copper) of costs charged directly to cost of sales as a result of the impact of regulatory restrictions on PT-FI's concentrate exports. |
|
|
|
|
| ||||||
| |||||||||||
56
Table of Contents
Molybdenum Mines Product Revenues, Production Costs and Unit Net Cash Costs
| Three Months Ended March 31, |
|
|
| ||||||||||
(In millions) | 2018 |
| 2017 |
|
|
|
|
| ||||||
|
|
|
|
|
|
|
|
| ||||||
Revenues, excluding adjustments a | $ | 102 | |
| $ | 70 | |
|
|
|
|
| ||
Site production and delivery, before net noncash and other costs shown below | 65 | |
| 51 | |
|
|
|
|
| ||||
Treatment charges and other | 7 | |
| 7 | |
|
|
|
|
| ||||
Net cash costs | 72 | |
| 58 | |
|
|
|
|
| ||||
DD&A | 19 | |
| 19 | |
|
|
|
|
| ||||
Noncash and other costs, net | 2 | |
| 1 | |
|
|
|
|
| ||||
Total costs | 93 | |
| 78 | |
|
|
|
|
| ||||
Gross profit (loss) | $ | 9 | |
| $ | (8 | ) |
|
|
|
|
| ||
|
|
|
|
|
|
|
|
| ||||||
Molybdenum sales (millions of recoverable pounds) a | 9 | |
| 8 | |
|
|
|
|
| ||||
|
|
|
|
|
|
|
|
| ||||||
Gross profit (loss) per pound of molybdenum: |
|
|
| |||||||||||
|
|
|
|
|
|
|
|
| ||||||
Revenues, excluding adjustments a | $ | 11.99 | |
| $ | 8.57 | |
|
|
|
|
| ||
Site production and delivery, before net noncash and other costs shown below | 7.71 | |
| 6.17 | |
|
|
|
|
| ||||
Treatment charges and other | 0.86 | |
| 0.85 | |
|
|
|
|
| ||||
Unit net cash costs | 8.57 | |
| 7.02 | |
|
|
|
|
| ||||
DD&A | 2.24 | |
| 2.37 | |
|
|
|
|
| ||||
Noncash and other costs, net | 0.15 | |
| 0.15 | |
|
|
|
|
| ||||
Total unit costs | 10.96 | |
| 9.54 | |
|
|
|
|
| ||||
Gross profit (loss) per pound | $ | 1.03 | |
| $ | (0.97 | ) |
|
|
|
|
| ||
|
|
|
|
|
|
|
|
| ||||||
Reconciliation to Amounts Reported |
|
|
|
|
|
|
|
| ||||||
(In millions) |
|
|
|
|
|
|
|
| ||||||
|
|
|
|
|
|
|
|
| ||||||
|
|
| Production |
|
|
|
|
| ||||||
Three Months Ended March 31, 2018 | Revenues |
| and Delivery |
| DD&A |
|
|
| ||||||
Totals presented above | $ | 102 | |
| $ | 65 | |
| $ | 19 | |
|
|
|
Treatment charges and other | (7 | ) |
| - | |
| - | |
|
|
| |||
Noncash and other costs, net | - | |
| 2 | |
| - | |
|
|
| |||
Molybdenum mines | 95 | |
| 67 | |
| 19 | |
|
|
| |||
Other mining b | 5,730 | |
| 3,735 | |
| 411 | |
|
|
| |||
Corporate, other & eliminations | (957 | ) |
| (994 | ) |
| 21 | |
|
|
| |||
As reported in FCX's consolidated financial statements | $ | 4,868 | |
| $ | 2,808 | |
| $ | 451 | |
|
|
|
|
|
|
|
|
|
|
|
| ||||||
Three Months Ended March 31, 2017 |
|
|
|
|
|
|
|
| ||||||
Totals presented above | $ | 70 | |
| $ | 51 | |
| $ | 19 | |
|
|
|
Treatment charges and other | (7 | ) |
| - | |
| - | |
|
|
| |||
Noncash and other costs, net | - | |
| 1 | |
| - | |
|
|
| |||
Molybdenum mines | 63 | |
| 52 | |
| 19 | |
|
|
| |||
Other mining b | 4,070 | |
| 2,954 | |
| 341 | |
|
|
| |||
Corporate, other & eliminations | (792 | ) |
| (818 | ) |
| 29 | |
|
|
| |||
As reported in FCX's consolidated financial statements | $ | 3,341 | |
| $ | 2,188 | |
| $ | 389 | |
|
|
|
|
|
|
|
|
|
|
|
| ||||||
a. | Reflects sales of the Molybdenum mines' production to our molybdenum sales company at market-based pricing. On a consolidated basis, realizations are based on the actual contract terms for sales to third parties; as a result, our consolidated average realized price per pound of molybdenum will differ from the amounts reported in this table. |
b. | Represents the combined total for our other mining operations, including North America copper mines, South America mining, Indonesia mining, Rod & Refining and Atlantic Copper Smelting & Refining, as presented in Note 9. Also includes amounts associated with our molybdenum sales company, which includes sales of molybdenum produced by the Molybdenum mines and by certain of the North America and South America copper mines. |
|
|
|
|
|
|
|
|
|
57
Table of Contents
CAUTIONARY STATEMENT
Our discussion and analysis contains forward-looking statements in which we discuss our potential future performance. Forward-looking statements are all statements other than statements of historical facts, such as projections or expectations relating to ore grades and milling rates, production and sales volumes, unit net cash costs, operating cash flows, capital expenditures, exploration efforts and results, development and production activities and costs, liquidity, tax rates, the impact of copper, gold and molybdenum price changes, the impact of deferred intercompany profits on earnings, reserve estimates, future dividend payments, and share purchases and sales. The words "anticipates," "may," "can," "plans," "believes," "estimates," "expects," "projects," "targets," "intends," "likely," "will," "should," "to be," "potential" and any similar expressions are intended to identify those assertions as forward-looking statements. The declaration of dividends is at the discretion of the Board and will depend on our financial results, cash requirements, future prospects, and other factors deemed relevant by the Board.
We caution readers that forward-looking statements are not guarantees of future performance and actual results may differ materially from those anticipated, projected or assumed in the forward-looking statements. Important factors that can cause our actual results to differ materially from those anticipated in the forward-looking statements include supply of and demand for, and prices of, copper, gold and molybdenum; mine sequencing; production rates; potential inventory adjustments; potential impairment of long-lived mining assets; the outcome of negotiations with the Indonesian government regarding PT-FI's long-term mining rights; the potential effects of violence in Indonesia generally and in the province of Papua; industry risks; regulatory changes; political risks; labor relations; weather- and climate-related risks; environmental risks (including resolution of the administrative sanctions and other environmental matters pending before Indonesia's Ministry of Environment and Forestry); litigation results (including the final disposition of Indonesian tax disputes and the outcome of Cerro Verde's royalty dispute with the Peruvian national tax authority); and other factors described in more detail in Part I, Item 1A. "Risk Factors" of our annual report on Form 10-K for the year ended December 31, 2017 , filed with the SEC. With respect to our operations in Indonesia, such factors include whether PT-FI will be able to resolve complex regulatory matters in Indonesia by June 30, 2018, or obtain an extension of its temporary IUPK after June 30, 2018.
Investors are cautioned that many of the assumptions upon which our forward-looking statements are based are likely to change after the forward-looking statements are made, including for example commodity prices, which we cannot control, and production volumes and costs, some aspects of which we may not be able to control. Further, we may make changes to our business plans that could affect our results. We caution investors that we do not intend to update forward-looking statements more frequently than quarterly notwithstanding any changes in our assumptions, changes in business plans, actual experience or other changes, and we undertake no obligation to update any forward-looking statements.
58
Table of Contents
Item 3. | Quantitative and Qualitative Disclosures About Market Risk. |
There have been no material changes in our market risks during the three -month period ended March 31, 2018 . For additional information on market risks, refer to "Disclosures About Market Risks" included in Part II, Items 7. and 7A. of our annual report on Form 10-K for the year ended December 31, 2017 . For projected sensitivities of our operating cash flow to changes in commodity prices, refer to "Outlook" in Part I, Item 2. of this quarterly report on Form 10-Q for the period ended March 31, 2018 ; for projected sensitivities of our provisionally priced copper sales to changes in commodity prices refer to "Consolidated Results – Revenues" in Part I, Item 2. of this quarterly report on Form 10-Q for the period ended March 31, 2018 .
Item 4. | Controls and Procedures. |
(a) | Evaluation of disclosure controls and procedures. Our chief executive officer and chief financial officer, with the participation of management, have evaluated the effectiveness of our "disclosure controls and procedures" (as defined in Rules 13a-15(e) and 15d-15(e) under the Securities Exchange Act of 1934) as of the end of the period covered by this quarterly report on Form 10-Q. Based on their evaluation, they have concluded that our disclosure controls and procedures are effective as of March 31, 2018 . |
(b) | Changes in internal control over financial reporting. There has been no change in our internal control over financial reporting that occurred during the quarter ended March 31, 2018 , that has materially affected, or is reasonably likely to materially affect, our internal control over financial reporting. |
Part II. | OTHER INFORMATION |
Item 1. | Legal Proceedings. |
We are involved in numerous legal proceedings that arise in the ordinary course of our business or that are associated with environmental issues arising from legacy operations conducted over the years by Freeport Minerals Corporation and its affiliates. We are also involved from time to time in other reviews, investigations and proceedings by government agencies, some of which may result in adverse judgments, settlements, fines, penalties, injunctions or other relief.
Management does not believe, based on currently available information, that the outcome of any proceeding reported in Note 8 of this quarterly report on Form 10-Q for the period ended March 31, 2018 , and in Part I, Item 3. "Legal Proceedings" and Note 12 of our annual report on Form 10-K for the year ended December 31, 2017 , will have a material adverse effect on our financial condition; although individual outcomes could be material to our operating results for a particular period, depending on the nature and magnitude of the outcome and the operating results for the period.
Environmental Proceedings
Louisiana Parishes Coastal Erosion Cases
Certain FCX affiliates have been named as defendants, along with numerous co-defendants, in 13 cases out of a total of 42 cases filed in Louisiana state courts by six south Louisiana parishes (Cameron, Jefferson, Plaquemines, St. Bernard, St. John the Baptist and Vermilion), alleging that certain oil and gas exploration and production operations and sulphur mining and production operations in coastal Louisiana have contaminated and damaged coastal wetlands, and caused significant land loss along the Louisiana coast, resulting in increased risk of damage from storm-generated surges and flooding and accelerated saltwater intrusion. The State of Louisiana, through the Attorney General and separately through the Louisiana Department of Natural Resources, has intervened in the litigation. Specifically, the cases allege the defendants failed to obtain and/or comply with required coastal use permits in violation of the Louisiana State and Local Coastal Resources Management Act of 1978, and seek unspecified damages for the alleged statutory violations, and restoration of the properties at issue to their original condition. Five of the 42 cases have recently been scheduled for trials beginning in early 2019. Certain FCX affiliates have been named as defendants in two of those cases, both originally filed on November 8, 2013: Parish of Plaquemines v. ConocoPhillips Company et al, 25th Judicial District Court, Plaquemines Parish, Louisiana; No. 60-982, Div. B, which is set for jury trial in August 2019; and Parish of Plaquemines v. Hilcorp Energy Company et al, 25th Judicial District Court, Plaquemines Parish, Louisiana; No. 60-999, Div. B, which is set for jury trial in January 2020. Plaintiffs have not yet alleged specific monetary demands. FCX does not currently believe that a loss is probable and intends to vigorously defend these matters.
59
Table of Contents
Item 1A. Risk Factors.
There have been no material changes to our risk factors previously disclosed in Part I, Item 1A. "Risk Factors" of our annual report on Form 10-K for the year ended December 31, 2017 .
Item 2. | Unregistered Sales of Equity Securities and Use of Proceeds. |
There were no unregistered sales of equity securities during the three months ended March 31, 2018 .
There were no shares of common stock purchased by us during the three months ended March 31, 2018 . On July 21, 2008, our Board of Directors approved an increase in our open-market share purchase program for up to 30 million shares. There have been no purchases under this program since 2008. This program does not have an expiration date. At March 31, 2018 , there were 23.7 million shares that could still be purchased under the program.
Item 4. | Mine Safety Disclosures. |
The safety and health of all employees is our highest priority. Management believes that safety and health considerations are integral to, and compatible with, all other functions in the organization and that proper safety and health management will enhance production and reduce costs. Our approach towards the safety and health of our workforce is to continuously improve performance through implementing robust management systems and providing adequate training, safety incentive and occupational health programs. The information concerning mine safety violations or other regulatory matters required by Section 1503(a) of the Dodd-Frank Wall Street Reform and Consumer Protection Act and Item 104 of Regulation S-K is included in Exhibit 95.1 to this quarterly report on Form 10-Q.
60
Table of Contents
Item 6. | Exhibits. |
|
| Filed |
| ||
Exhibit |
| with this | Incorporated by Reference | ||
Number | Exhibit Title | Form 10-Q | Form | File No. | Date Filed |
3.1 | Amended and Restated Certificate of Incorporation of FCX, effective as of June 8, 2016. |
| 8-K | 001-11307-01 | 6/9/2016 |
3.2 | Amended and Restated By-Laws of FCX, effective as of June 8, 2016. |
| 8-K | 001-11307-01 | 6/9/2016 |
4.1 | Indenture dated as of February 13, 2012, between FCX and U.S. Bank National Association, as Trustee (relating to the 3.55% Senior Notes due 2022, the 4.00% Senior Notes due 2021, the 4.55% Senior Notes due 2024, and the 5.40% Senior Notes due 2034). |
| 8-K | 001-11307-01 | 2/13/2012 |
4.2 | Third Supplemental Indenture dated as of February 13, 2012, between FCX and U.S. Bank National Association, as Trustee (relating to the 3.55% Senior Notes due 2022). |
| 8-K | 001-11307-01 | 2/13/2012 |
4.3 | Fourth Supplemental Indenture dated as of May 31, 2013, among FCX, Freeport-McMoRan Oil & Gas LLC and U.S. Bank National Association, as Trustee (relating to the 3.55% Senior Notes due 2022, the 4.00% Senior Notes due 2021, the 4.55% Senior Notes due 2024, and the 5.40% Senior Notes due 2034). |
| 8-K | 001-11307-01 | 6/3/2013 |
4.4 | Sixth Supplemental Indenture dated as of November 14, 2014 among FCX, Freeport-McMoRan Oil & Gas LLC and U.S. Bank National Association, as Trustee (relating to the 4.00% Senior Notes due 2021). |
| 8-K | 001-11307-01 | 11/14/2014 |
4.5 | Seventh Supplemental Indenture dated as of November 14, 2014 among FCX, Freeport-McMoRan Oil & Gas LLC and U.S. Bank National Association, as (relating to the 4.55% Senior Notes due 2024). |
| 8-K | 001-11307-01 | 11/14/2014 |
4.6 | Eighth Supplemental Indenture dated as of November 14, 2014 among FCX, Freeport-McMoRan Oil & Gas LLC and U.S. Bank National Association, as Trustee (relating to the 5.40% Senior Notes due 2034). |
| 8-K | 001-11307-01 | 11/14/2014 |
4.7 | Indenture dated as of March 7, 2013, between FCX and U.S. Bank National Association, as Trustee (relating to the 3.100% Senior Notes due 2020, the 3.875% Senior Notes due 2023, and the 5.450% Senior Notes due 2043). |
| 8-K | 001-11307-01 | 3/7/2013 |
4.8 | Form of Indenture dated as of September 22, 1997, between Phelps Dodge Corporation and The Chase Manhattan Bank, as Trustee (relating to the 7.125% Senior Notes due 2027, the 9.50% Senior Notes due 2031, and the 6.125% Senior Notes due 2034). |
| S-3 | 333-36415 | 9/25/1997 |
4.9 | Form of 7.125% Debenture due November 1, 2027 of Phelps Dodge Corporation issued on November 5, 1997, pursuant to the Indenture dated as of September 22, 1997, between Phelps Dodge Corporation and The Chase Manhattan Bank, as Trustee (relating to the 7.125% Senior Notes due 2027). |
| 8-K | 01-00082 | 11/3/1997 |
4.10 | Form of 9.5% Note due June 1, 2031 of Phelps Dodge Corporation issued on May 30, 2001, pursuant to the Indenture dated as of September 22, 1997, between Phelps Dodge Corporation and First Union National Bank, as successor Trustee (relating to the 9.50% Senior Notes due 2031). |
| 8-K | 01-00082 | 5/30/2001 |
61
Table of Contents
|
| Filed |
| ||
Exhibit |
| with this | Incorporated by Reference | ||
Number | Exhibit Title | Form 10-Q | Form | File No. | Date Filed |
4.11 | Form of 6.125% Note due March 15, 2034 of Phelps Dodge Corporation issued on March 4, 2004, pursuant to the Indenture dated as of September 22, 1997, between Phelps Dodge Corporation and First Union National Bank, as successor Trustee (relating to the 6.125% Senior Notes due 2034). |
| 10-K | 01-00082 | 3/7/2005 |
4.12 | Supplemental Indenture dated as of April 4, 2007 to the Indenture dated as of September 22, 1997, among Phelps Dodge Corporation, as Issuer, Freeport-McMoRan Copper & Gold Inc., as Parent Guarantor, and U.S. Bank National Association, as Trustee (relating to the 7.125% Senior Notes due 2027, the 9.50% Senior Notes due 2031, and the 6.125% Senior Notes due 2034). |
| 10-K | 001-11307-01 | 2/26/2016 |
4.13 | Indenture dated as of December 13, 2016, among FCX, Freeport-McMoRan Oil & Gas LLC, as guarantor, and U.S. Bank National Association, as Trustee (relating to the 6.875% Senior Notes due 2023). |
| 8-K | 001-11307-01 | 12/13/2016 |
10.1 | Revolving Credit Agreement dated as of April 20, 2018, among FCX, PT Freeport Indonesia, Freeport-McMoRan Oil & Gas LLC, JPMorgan Chase Bank, N.A., as administrative agent, Bank of America, N.A., as syndication agent, and each of the lenders and issuing banks party thereto. |
| 8-K | 001-11307-01 | 4/23/2018 |
15.1 | Letter from Ernst & Young LLP regarding unaudited interim financial statements. | X |
|
|
|
31.1 | Certification of Principal Executive Officer pursuant to Rule 13a-14(a)/15d – 14(a). | X |
|
|
|
31.2 | Certification of Principal Financial Officer pursuant to Rule 13a-14(a)/15d – 14(a). | X |
|
|
|
32.1 | Certification of Principal Executive Officer pursuant to 18 U.S.C. Section 1350. | X |
|
|
|
32.2 | Certification of Principal Financial Officer pursuant to 18 U.S.C Section 1350. | X |
|
|
|
95.1 | Mine Safety and Health Administration Safety Data. | X |
|
|
|
101.INS | XBRL Instance Document. | X |
|
|
|
101.SCH | XBRL Taxonomy Extension Schema. | X |
|
|
|
101.CAL | XBRL Taxonomy Extension Calculation Linkbase. | X |
|
|
|
101.DEF | XBRL Taxonomy Extension Definition Linkbase. | X |
|
|
|
101.LAB | XBRL Taxonomy Extension Label Linkbase. | X |
|
|
|
101.PRE | XBRL Taxonomy Extension Presentation Linkbase. | X |
|
|
|
Note: Certain instruments with respect to long-term debt of FCX have not been filed as exhibits to this Quarterly Report on Form 10-Q since the total amount of securities authorized under any such instrument does not exceed 10 percent of the total assets of FCX and its subsidiaries on a consolidated basis. FCX agrees to furnish a copy of each such instrument upon request of the Securities and Exchange Commission.
62
Table of Contents
SIGNATURE
Pursuant to the requirements of the Securities Exchange Act of 1934, the registrant has duly caused this report to be signed on its behalf by the undersigned thereunto duly authorized.
| Freeport-McMoRan Inc. | |
|
|
|
| By: | /s/ C. Donald Whitmire, Jr. |
|
| C. Donald Whitmire, Jr. |
|
| Vice President and |
|
| Controller - Financial Reporting |
|
| (authorized signatory |
|
| and Principal Accounting Officer) |
Date: May 4, 2018
S-1