UNITED STATES | ||
SECURITIES AND EXCHANGE COMMISSION | ||
Washington, D.C. 20549 | ||
| ||
FORM 10-Q | ||
| ||
(Mark One) | ||
[X] QUARTERLY REPORT PURSUANT TO SECTION 13 OR 15(d) OF THE SECURITIES EXCHANGE ACT OF 1934 | ||
For the quarterly period ended June 30, 2016 | ||
OR | ||
[ ] TRANSITION REPORT PURSUANT TO SECTION 13 OR 15(d) OF THE SECURITIES EXCHANGE ACT OF 1934 | ||
For the transition period from |
| to |
Commission File Number: 001-11307-01 | ||
Freeport-McMoRan Inc.
(Exact name of registrant as specified in its charter)
Delaware | 74-2480931 |
(State or other jurisdiction of | (I.R.S. Employer Identification No.) |
incorporation or organization) |
|
|
|
333 North Central Avenue |
|
Phoenix, AZ | 85004-2189 |
(Address of principal executive offices) | (Zip Code) |
(602) 366-8100 | |
(Registrant's telephone number, including area code) | |
|
|
Indicate by check mark whether the registrant (1) has filed all reports required to be filed by Section 13 or 15(d) of the Securities Exchange Act of 1934 during the preceding 12 months (or for such shorter period that the registrant was required to file such reports), and (2) has been subject to such filing requirements for the past 90 days.
☑ Yes o No
Indicate by check mark whether the registrant has submitted electronically and posted on its corporate website, if any, every Interactive Data File required to be submitted and posted pursuant to Rule 405 of Regulation S-T (§ 232.405 of this chapter) during the preceding 12 months (or for such shorter period that the registrant was required to submit and post such files). ☑ Yes o No
Indicate by check mark whether the registrant is a large accelerated filer, an accelerated filer, a non-accelerated filer, or a smaller reporting company. See the definitions of "large accelerated filer," "accelerated filer" and "smaller reporting company" in Rule 12b-2 of the Exchange Act.
Large accelerated filer ☑ Accelerated filer o Non-accelerated filer o Smaller reporting company o
Indicate by check mark whether the registrant is a shell company (as defined in Rule 12b-2 of the Exchange Act).
o Yes ☑ No
On July 29, 2016 , there were issued and outstanding 1,328,258,134 shares of the registrant's common stock, par value $0.10 per share.
FREEPORT-McMoRan INC.
TABLE OF CONTENTS
|
|
| Page |
|
|
Part I. Financial Information | 3 |
|
|
Item 1. Financial Statements: |
|
|
|
Consolidated Balance Sheets (Unaudited) | 3 |
|
|
Consolidated Statements of Operations (Unaudited) | 4 |
|
|
Consolidated Statements of Comprehensive Loss (Unaudited) | 5 |
|
|
Consolidated Statements of Cash Flows (Unaudited) | 6 |
|
|
Consolidated Statement of Equity (Unaudited) | 7 |
|
|
Notes to Consolidated Financial Statements (Unaudited) | 8 |
|
|
Review Report of Independent Registered Public Accounting Firm | 33 |
|
|
Item 2. Management's Discussion and Analysis of Financial Condition and Results of Operations | 34 |
|
|
Item 3. Quantitative and Qualitative Disclosures About Market Risk | 91 |
|
|
Item 4. Controls and Procedures | 91 |
|
|
Part II. Other Information | 91 |
|
|
Item 1. Legal Proceedings | 91 |
|
|
Item 1A. Risk Factors | 91 |
|
|
Item 2. Unregistered Sales of Equity Securities and Use of Proceeds | 92 |
|
|
Item 4. Mine Safety Disclosures | 92 |
|
|
Item 6. Exhibits | 92 |
|
|
Signature | S-1 |
|
|
Exhibit Index | E-1 |
|
|
2
Table of Contents
Part I. | FINANCIAL INFORMATION |
Item 1. | Financial Statements . |
FREEPORT-McMoRan INC.
CONSOLIDATED BALANCE SHEETS (Unaudited)
| June 30, |
| December 31, | ||||
| (In millions) | ||||||
ASSETS |
|
|
| ||||
Current assets: |
|
|
| ||||
Cash and cash equivalents | $ | 352 | |
| $ | 195 | |
Trade accounts receivable | 694 | |
| 660 | | ||
Income and other tax receivables | 916 | |
| 1,341 | | ||
Other accounts receivable | 102 | |
| 154 | | ||
Inventories: |
|
|
| ||||
Mill and leach stockpiles | 1,348 | |
| 1,539 | | ||
Materials and supplies, net | 1,338 | |
| 1,594 | | ||
Product | 1,058 | |
| 1,071 | | ||
Other current assets | 226 | |
| 164 | | ||
Assets held for sale | 4,666 | |
| 744 | | ||
Total current assets | 10,700 | |
| 7,462 | | ||
Property, plant, equipment and mining development costs, net | 23,609 | |
| 24,248 | | ||
Oil and gas properties, net - full cost method |
|
|
| ||||
Subject to amortization, less accumulated amortization and impairment | 1,381 | |
| 2,262 | | ||
Not subject to amortization | 1,656 | |
| 4,831 | | ||
Long-term mill and leach stockpiles | 1,742 | |
| 1,663 | | ||
Other assets | 2,208 | |
| 2,001 | | ||
Assets held for sale | - | |
| 4,110 | | ||
Total assets | $ | 41,296 | |
| $ | 46,577 | |
|
|
|
| ||||
LIABILITIES AND EQUITY |
|
|
| ||||
Current liabilities: |
|
|
| ||||
Accounts payable and accrued liabilities | $ | 2,569 | |
| $ | 3,255 | |
Current portion of debt | 770 | |
| 649 | | ||
Current portion of environmental and asset retirement obligations | 322 | |
| 272 | | ||
Accrued income taxes | 55 | |
| 23 | | ||
Liabilities held for sale | 824 | |
| 108 | | ||
Total current liabilities | 4,540 | |
| 4,307 | | ||
Long-term debt, less current portion | 18,549 | |
| 19,779 | | ||
Deferred income taxes | 3,758 | |
| 3,607 | | ||
Environmental and asset retirement obligations, less current portion | 3,697 | |
| 3,717 | | ||
Other liabilities | 1,662 | |
| 1,641 | | ||
Liabilities held for sale | - | |
| 718 | | ||
Total liabilities | 32,206 | |
| 33,769 | | ||
|
|
|
| ||||
Redeemable noncontrolling interest | 771 | |
| 764 | | ||
|
|
|
| ||||
Equity: |
|
|
| ||||
Stockholders' equity: |
|
|
| ||||
Common stock | 145 | |
| 137 | | ||
Capital in excess of par value | 25,105 | |
| 24,283 | | ||
Accumulated deficit | (17,049 | ) |
| (12,387 | ) | ||
Accumulated other comprehensive loss | (488 | ) |
| (503 | ) | ||
Common stock held in treasury | (3,710 | ) |
| (3,702 | ) | ||
Total stockholders' equity | 4,003 | |
| 7,828 | | ||
Noncontrolling interests | 4,316 | |
| 4,216 | | ||
Total equity | 8,319 | |
| 12,044 | | ||
Total liabilities and equity | $ | 41,296 | |
| $ | 46,577 | |
The accompanying notes are an integral part of these consolidated financial statements.
3
Table of Contents
FREEPORT-McMoRan INC.
CONSOLIDATED STATEMENTS OF OPERATIONS (Unaudited)
| Three Months Ended |
| Six Months Ended | ||||||||||||
| June 30, |
| June 30, | ||||||||||||
| 2016 |
| 2015 |
| 2016 |
| 2015 | ||||||||
| (In millions, except per share amounts) | ||||||||||||||
Revenues | $ | 3,334 | |
| $ | 3,938 | |
| $ | 6,576 | |
| $ | 7,709 | |
Cost of sales: |
|
|
|
|
|
|
| ||||||||
Production and delivery | 2,956 | |
| 2,651 | |
| 5,455 | |
| 5,330 | | ||||
Depreciation, depletion and amortization | 632 | |
| 833 | |
| 1,294 | |
| 1,699 | | ||||
Impairment of oil and gas properties | 291 | |
| 2,686 | |
| 4,078 | |
| 5,790 | | ||||
Total cost of sales | 3,879 | | | 6,170 | | | 10,827 | |
| 12,819 | | ||||
Selling, general and administrative expenses | 160 | |
| 148 | |
| 298 | |
| 299 | | ||||
Mining exploration and research expenses | 15 | |
| 30 | |
| 33 | |
| 57 | | ||||
Environmental obligations and shutdown costs | 11 | |
| 11 | |
| 21 | |
| 24 | | ||||
Net gain on sales of assets | (749 | ) |
| - | |
| (749 | ) |
| (39 | ) | ||||
Total costs and expenses | 3,316 | |
| 6,359 | |
| 10,430 | |
| 13,160 | | ||||
Operating income (loss) | 18 | |
| (2,421 | ) |
| (3,854 | ) |
| (5,451 | ) | ||||
Interest expense, net | (196 | ) |
| (142 | ) |
| (387 | ) |
| (281 | ) | ||||
Net gain on early extinguishment of debt | 39 | |
| - | |
| 36 | |
| - | | ||||
Other income, net | 25 | |
| 36 | |
| 64 | |
| 43 | | ||||
Loss before income taxes and equity in affiliated companies' net earnings | (114 | ) |
| (2,527 | ) |
| (4,141 | ) |
| (5,689 | ) | ||||
(Provision for) benefit from income taxes | (116 | ) |
| 699 | |
| (193 | ) |
| 1,413 | | ||||
Equity in affiliated companies' net earnings | 1 | |
| - | |
| 8 | |
| 1 | | ||||
Net loss from continuing operations | (229 | ) |
| (1,828 | ) |
| (4,326 | ) |
| (4,275 | ) | ||||
Net (loss) income from discontinued operations | (181 | ) |
| 29 | |
| (185 | ) |
| 70 | | ||||
Net loss | (410 | ) |
| (1,799 | ) |
| (4,511 | ) |
| (4,205 | ) | ||||
Net income attributable to noncontrolling interests: |
|
|
|
|
|
|
| ||||||||
Continuing operations | (47 | ) |
| (16 | ) |
| (109 | ) |
| (48 | ) | ||||
Discontinued operations | (12 | ) |
| (26 | ) |
| (22 | ) |
| (52 | ) | ||||
Preferred dividends attributable to redeemable noncontrolling interest | (10 | ) |
| (10 | ) |
| (21 | ) |
| (20 | ) | ||||
Net loss attributable to common stockholders | $ | (479 | ) |
| $ | (1,851 | ) |
| $ | (4,663 | ) |
| $ | (4,325 | ) |
|
|
|
|
|
|
|
| ||||||||
Basic and diluted net (loss) income per share attributable to common stockholders: |
|
|
|
|
|
|
| ||||||||
Continuing operations | $ | (0.23 | ) |
| $ | (1.78 | ) |
| $ | (3.54 | ) |
| $ | (4.18 | ) |
Discontinued operations | (0.15 | ) |
| - | |
| (0.16 | ) |
| 0.02 | | ||||
| $ | (0.38 | ) |
| $ | (1.78 | ) |
| $ | (3.70 | ) |
| $ | (4.16 | ) |
|
|
|
|
|
|
|
| ||||||||
Basic and diluted weighted-average common shares outstanding | 1,269 | |
| 1,040 | |
| 1,260 | |
| 1,040 | | ||||
|
|
|
|
|
|
|
| ||||||||
Dividends declared per share of common stock | $ | - | |
| $ | 0.1605 | |
| $ | - | |
| $ | 0.2105 | |
The accompanying notes are an integral part of these consolidated financial statements.
4
Table of Contents
FREEPORT-McMoRan INC.
CONSOLIDATED STATEMENTS OF COMPREHENSIVE LOSS (Unaudited)
|
| Three Months Ended |
| Six Months Ended | ||||||||||||
|
| June 30, |
| June 30, | ||||||||||||
|
| 2016 |
| 2015 |
| 2016 |
| 2015 | ||||||||
|
| (In millions) | ||||||||||||||
Net loss |
| $ | (410 | ) |
| $ | (1,799 | ) |
| $ | (4,511 | ) |
| $ | (4,205 | ) |
|
|
|
|
|
|
|
|
| ||||||||
Other comprehensive income, net of taxes: |
|
|
|
|
|
|
|
| ||||||||
Unrealized gains on securities |
| 1 | |
| - | |
| 1 | |
| - | | ||||
Defined benefit plans: |
|
|
|
|
|
|
|
| ||||||||
Amortization of unrecognized amounts included in net periodic benefit costs |
| 15 | |
| 8 | |
| 23 | |
| 16 | | ||||
Foreign exchange (losses) gains |
| (1 | ) |
| 1 | |
| (10 | ) |
| 5 | | ||||
Other comprehensive income |
| 15 | |
| 9 | |
| 14 | |
| 21 | | ||||
|
|
|
|
|
|
|
|
| ||||||||
Total comprehensive loss |
| (395 | ) |
| (1,790 | ) |
| (4,497 | ) |
| (4,184 | ) | ||||
Total comprehensive income attributable to noncontrolling interests |
| (59 | ) |
| (42 | ) |
| (130 | ) |
| (100 | ) | ||||
Preferred dividends attributable to redeemable noncontrolling interest |
| (10 | ) |
| (10 | ) |
| (21 | ) |
| (20 | ) | ||||
Total comprehensive loss attributable to common stockholders |
| $ | (464 | ) |
| $ | (1,842 | ) |
| $ | (4,648 | ) |
| $ | (4,304 | ) |
The accompanying notes are an integral part of these consolidated financial statements.
5
Table of Contents
FREEPORT-McMoRan INC.
CONSOLIDATED STATEMENTS OF CASH FLOWS (Unaudited)
| Six Months Ended |
| ||||||
| June 30, |
| ||||||
| 2016 |
| 2015 |
| ||||
| (In millions) |
| ||||||
Cash flow from operating activities: |
|
|
|
| ||||
Net loss | $ | (4,511 | ) |
| $ | (4,205 | ) |
|
Adjustments to reconcile net loss to net cash provided by operating activities: |
|
|
|
| ||||
Depreciation, depletion and amortization | 1,374 | |
| 1,829 | |
| ||
Impairment of oil and gas properties | 4,078 | |
| 5,790 | |
| ||
Non-cash oil and gas drillship settlements/idle rig costs | 612 | |
| - | |
| ||
Oil and gas inventory adjustments and write downs | 82 | |
| 23 | |
| ||
Mining inventory adjustments | 7 | |
| 63 | |
| ||
Net gain on sales of assets | (749 | ) |
| (39 | ) |
| ||
Net charges for environmental and asset retirement obligations, including accretion | 107 | |
| 109 | |
| ||
Payments for environmental and asset retirement obligations | (116 | ) |
| (81 | ) |
| ||
Net gain on early extinguishment of debt | (36 | ) |
| - | |
| ||
Deferred income taxes | 169 | |
| (1,432 | ) |
| ||
Estimated loss on disposal of discontinued operations | 177 | |
| - | |
| ||
Increase in long-term mill and leach stockpiles | (99 | ) |
| (104 | ) |
| ||
Net gains on crude oil derivative contracts | - | |
| (58 | ) |
| ||
Other, net | 53 | |
| 81 | |
| ||
Changes in working capital and other tax payments, excluding amounts from dispositions: |
|
|
|
| ||||
Accounts receivable | 259 | |
| 493 | |
| ||
Inventories | 190 | |
| 8 | |
| ||
Other current assets | (53 | ) |
| (1 | ) |
| ||
Accounts payable and accrued liabilities | 44 | |
| (205 | ) |
| ||
Accrued income taxes and changes in other tax payments | 26 | |
| (485 | ) |
| ||
Net cash provided by operating activities | 1,614 | |
| 1,786 | |
| ||
|
|
|
|
| ||||
Cash flow from investing activities: |
|
|
|
| ||||
Capital expenditures: |
|
|
|
| ||||
North America copper mines | (76 | ) |
| (214 | ) |
| ||
South America | (293 | ) |
| (902 | ) |
| ||
Indonesia | (459 | ) |
| (438 | ) |
| ||
Molybdenum mines | (1 | ) |
| (7 | ) |
| ||
United States oil and gas operations | (868 | ) |
| (1,795 | ) |
| ||
Other | (118 | ) |
| (172 | ) |
| ||
Net proceeds from sale of additional interest in Morenci | 996 | |
| - | |
| ||
Net proceeds from sale of other assets | 290 | |
| 150 | |
| ||
Other, net | (6 | ) |
| (14 | ) |
| ||
Net cash used in investing activities | (535 | ) |
| (3,392 | ) |
| ||
|
|
|
|
| ||||
Cash flow from financing activities: |
|
|
|
| ||||
Proceeds from debt | 2,811 | |
| 4,422 | |
| ||
Repayments of debt | (3,649 | ) |
| (2,360 | ) |
| ||
Net proceeds from sale of common stock | 32 | |
| - | |
| ||
Cash dividends and distributions paid: |
|
|
|
| ||||
Common stock | (5 | ) |
| (380 | ) |
| ||
Noncontrolling interests | (39 | ) |
| (60 | ) |
| ||
Stock-based awards net payments, including excess tax benefit | (5 | ) |
| (7 | ) |
| ||
Debt financing costs and other, net | (18 | ) |
| (7 | ) |
| ||
Net cash (used in) provided by financing activities | (873 | ) |
| 1,608 | |
| ||
|
|
|
|
| ||||
Net increase in cash and cash equivalents | 206 | |
| 2 | |
| ||
Increase in cash and cash equivalents in assets held for sale | (49 | ) |
| (1 | ) |
| ||
Cash and cash equivalents at beginning of year | 195 | |
| 317 | |
| ||
Cash and cash equivalents at end of period | $ | 352 | |
| $ | 318 | |
|
The accompanying notes are an integral part of these consolidated financial statements.
6
Table of Contents
FREEPORT-McMoRan INC.
CONSOLIDATED STATEMENT OF EQUITY (Unaudited)
| Stockholders' Equity |
|
|
|
| ||||||||||||||||||||||||||||||||
| Common Stock |
|
|
| Accum-ulated Deficit |
| Accumu- |
| Common Stock Held in Treasury |
| Total |
|
|
|
| ||||||||||||||||||||||
| Number of Shares |
| At Par Value |
| Capital in Excess of Par Value |
|
|
| Number of Shares |
| At Cost |
|
| Non- controlling Interests |
| Total Equity | |||||||||||||||||||||
|
|
|
|
|
|
|
|
|
| ||||||||||||||||||||||||||||
| (In millions) | ||||||||||||||||||||||||||||||||||||
Balance at December 31, 2015 | 1,374 | |
| $ | 137 | |
| $ | 24,283 | |
| $ | (12,387 | ) |
| $ | (503 | ) |
| 128 | |
| $ | (3,702 | ) |
| $ | 7,828 | |
| $ | 4,216 | |
| $ | 12,044 | |
Issuance of common stock | 70 | |
| 8 | |
| 793 | |
| - | |
| - | |
| - | |
| (3 | ) |
| 798 | |
| - | |
| 798 | | ||||||||
Exercised and issued stock-based awards | 3 | |
| - | |
| - | |
| - | |
| - | |
| - | |
| - | |
| - | |
| - | |
| - | | ||||||||
Stock-based compensation | - | |
| - | |
| 33 | |
| - | |
| - | |
| - | |
| - | |
| 33 | |
| - | |
| 33 | | ||||||||
Reserve on tax benefit for stock-based awards | - | |
| - | |
| (4 | ) |
| - | |
| - | |
| - | |
| - | |
| (4 | ) |
| - | |
| (4 | ) | ||||||||
Tender of shares for stock-based awards | - | |
| - | |
| - | |
| - | |
| - | |
| 1 | |
| (5 | ) |
| (5 | ) |
| - | |
| (5 | ) | ||||||||
Dividends on common stock | - | |
| - | |
| - | |
| 1 | |
| - | |
| - | |
| - | |
| 1 | |
| - | |
| 1 | | ||||||||
Dividends to noncontrolling interests | - | |
| - | |
| - | |
| - | |
| - | |
| - | |
| - | |
| - | |
| (25 | ) |
| (25 | ) | ||||||||
Changes in noncontrolling interests | - | |
| - | |
| - | |
| - | |
| - | |
| - | |
| - | |
| - | |
| (5 | ) |
| (5 | ) | ||||||||
Net loss attributable to common stockholders | - | |
| - | |
| - | |
| (4,663 | ) |
| - | |
| - | |
| - | |
| (4,663 | ) |
| - | |
| (4,663 | ) | ||||||||
Net income attributable to noncontrolling interests, including discontinued operations | - | |
| - | |
| - | |
| - | |
| - | |
| - | |
| - | |
| - | |
| 131 | |
| 131 | | ||||||||
Other comprehensive income (loss) | - | |
| - | |
| - | |
| - | |
| 15 | |
| - | |
| - | |
| 15 | |
| (1 | ) |
| 14 | | ||||||||
Balance at June 30, 2016 | 1,447 | |
| $ | 145 | |
| $ | 25,105 | |
| $ | (17,049 | ) |
| $ | (488 | ) |
| 129 | |
| $ | (3,710 | ) |
| $ | 4,003 | |
| $ | 4,316 | |
| $ | 8,319 | |
The accompanying notes are an integral part of these consolidated financial statements.
7
Table of Contents
FREEPORT-McMoRan INC.
NOTES TO CONSOLIDATED FINANCIAL STATEMENTS (Unaudited)
NOTE 1. GENERAL INFORMATION
The accompanying unaudited consolidated financial statements have been prepared in accordance with the instructions to Form 10-Q and do not include all information and disclosures required by generally accepted accounting principles (GAAP) in the United States (U.S.). Therefore, this information should be read in conjunction with Freeport-McMoRan Inc.'s (FCX) consolidated financial statements and notes contained in its annual report on Form 10-K for the year ended December 31, 2015. The information furnished herein reflects all adjustments that are, in the opinion of management, necessary for a fair statement of the results for the interim periods reported. With the exception of the accounting for discontinued operations, and the oil and gas properties impairment discussed below and the related tax charges to establish a deferred tax valuation allowance (refer to Note 5 ), all such adjustments are, in the opinion of management, of a normal recurring nature. As a result of FCX's second-quarter 2016 agreement to sell its interest in TF Holdings Limited (TFHL), FCX has reported TFHL as discontinued operations for all periods presented in the unaudited consolidated financial statements (refer to Note 2). Operating results for the six -month period ended June 30, 2016 , are not necessarily indicative of the results that may be expected for the year ending December 31, 2016 .
Oil and Gas Properties. Under the U.S. Securities and Exchange Commission's (SEC) full cost accounting rules, FCX reviews the carrying value of its oil and gas properties in the full cost pool for impairment each quarter on a country-by-country basis. Under these rules, capitalized costs of oil and gas properties (net of accumulated depreciation, depletion, amortization and impairment, and related deferred income taxes) for each cost center may not exceed a "ceiling" equal to:
• | the present value, discounted at 10 percent , of estimated future net cash flows from the related proved oil and gas reserves, net of estimated future income taxes; plus |
• | the cost of the related unproved properties not being amortized; plus |
• | the lower of cost or estimated fair value of the related unproved properties included in the costs being amortized (net of related tax effects). |
These rules require that FCX price its future oil and gas production at the twelve-month average of the first-day-of-the-month historical reference prices as adjusted for location and quality differentials. FCX's reference prices are West Texas Intermediate (WTI) for oil and the Henry Hub spot price for natural gas. Such prices are utilized except where different prices are fixed and determinable from applicable contracts for the remaining term of those contracts. The estimated future net cash flows also exclude future cash outflows associated with settling asset retirement obligations included in the net book value of the oil and gas properties. The rules require an impairment if the capitalized costs exceed this "ceiling."
In addition, following the evaluation of alternatives for the oil and gas business and the current limitations and cost of capital available for future drilling, FCX Oil & Gas Inc. (FM O&G, a wholly owned subsidiary of FCX) determined that the carrying values of certain of its unevaluated properties were impaired. For the first six months of 2016 , FM O&G transferred $3.2 billion of costs (including $3.1 billion in first-quarter 2016) associated with unevaluated properties to the full cost pool, mostly reflecting impairment of the carrying values of unevaluated properties. Combined with the impact of the reduction in twelve-month historical prices, net capitalized costs exceeded the related ceiling test limitation under full cost accounting rules, which resulted in the recognition of a $291 million impairment charge in second-quarter 2016 and $4.1 billion for the first six months of 2016 . The twelve-month average price (using WTI as the reference oil price) was $43.12 per barrel at June 30, 2016 , compared with $46.26 per barrel at March 31, 2016.
8
Table of Contents
NOTE 2. DISPOSITIONS
Timok. On May 2, 2016 , Freeport Minerals Corporation (FMC), a wholly owned subsidiary of FCX, completed the sale of an interest in the Timok exploration project in Serbia to Reservoir Minerals Inc. for consideration of $135 million in cash and contingent consideration of up to $107 million payable to FCX in stages upon achievement of defined development milestones (no amounts were recorded for the contingent consideration as of June 30, 2016). As a result of this transaction, FCX recorded a gain of $133 million in second-quarter 2016.
Morenci . On May 31, 2016 , FCX completed the sale of a 13 percent undivided interest in its Morenci unincorporated joint venture to Sumitomo Metal Mining Co., Ltd. (SMM) for $1.0 billion in cash. FCX recorded a $577 million gain on the transaction and used losses to offset cash taxes on the transaction. Proceeds from the transaction were used to repay borrowings under FCX's unsecured bank term loan (Term Loan) and revolving credit facility.
The Morenci unincorporated joint venture was owned 85 percent by FCX and 15 percent by Sumitomo Metal Mining Arizona Inc. (Sumitomo). As a result of the transaction, the unincorporated joint venture is owned 72 percent by FCX, 15 percent by Sumitomo and 13 percent by an affiliate that is wholly owned by SMM.
Oil and Gas Operations. On June 17, 2016 , FM O&G completed the sale of certain oil and gas royalty interests to Black Stone Minerals, L.P. for cash consideration of $102 million , before closing adjustments. In addition, on July 25, 2016 , FM O&G completed the sale of its Haynesville shale assets for cash consideration of $87 million , before closing adjustments. Under the full cost accounting rules, the proceeds were recorded as a reduction of capitalized oil and gas properties, with no gain or loss recognition.
TF Holdings Limited - Discontinued Operations. On May 9, 2016 , FCX entered into a definitive agreement to sell its 70 percent interest in TFHL to China Molybdenum Co., Ltd. (CMOC) for $2.65 billion in cash and contingent consideration of up to $120 million in cash, consisting of $60 million if the average copper price exceeds $3.50 per pound and $60 million if the average cobalt price exceeds $20 per pound, both during calendar years 2018 and 2019 (no amounts were recorded for the contingent consideration as of June 30, 2016). Through its interest in TFHL, FCX has an effective 56 percent interest in Tenke Fungurume Mining S.A. (TFM or Tenke) located in the Democratic Republic of Congo (DRC). The transaction is expected to close in fourth-quarter 2016, subject to regulatory approvals, CMOC shareholder approval and other customary closing conditions. The transaction is also subject to Lundin Mining Corporation's (Lundin) right of first offer (ROFO), which expires on September 15, 2016 . Lundin holds the remaining 30 percent interest in TFHL. In accordance with the mandatory prepayment provision of FCX's Term Loan, one-half of the proceeds from this transaction must be applied toward repaying FCX's Term Loan.
In accordance with accounting guidance, FCX has reported the results of operations of TFHL as discontinued operations in the consolidated statements of operations and presented the assets and liabilities of TFHL as held for sale in the consolidated balance sheets for all periods presented. The consolidated statements of comprehensive loss were not impacted by discontinued operations as TFHL did not have any other comprehensive income, and the consolidated statements of cash flows are reported on a combined basis without separately presenting discontinued operations.
9
Table of Contents
| June 30, |
| December 31, 2015 | ||||
Assets |
|
|
| ||||
Cash and cash equivalents | $ | 78 | |
| $ | 29 | |
Inventories | 1,152 | |
| 584 | | ||
Receivables and other current assets | 154 | |
| 131 | | ||
Property, plant, equipment and mining development costs, net | 3,056 | |
| - | | ||
Other assets | 226 | |
| - | | ||
Total current assets held for sale | $ | 4,666 | |
| $ | 744 | |
|
|
|
| ||||
Property, plant, equipment and mining development costs, net | $ | - | |
| $ | 3,261 | |
Inventories | - | |
| 608 | | ||
Other assets | - | |
| 241 | | ||
Total long-term assets held for sale | $ | - | |
| $ | 4,110 | |
|
|
|
| ||||
Liabilities |
|
|
| ||||
Accounts payable and accrued liabilities | $ | 99 | |
| $ | 108 | |
Deferred income taxes | 679 | |
| - | | ||
Asset retirement obligations and other liabilities | 46 | |
| - | | ||
Total current liabilities held for sale | $ | 824 | |
| $ | 108 | |
|
|
|
| ||||
Deferred income taxes | $ | - | |
| $ | 681 | |
Asset retirement obligations and other liabilities | - | |
| 37 | | ||
Total long-term liabilities held for sale | $ | - | |
| $ | 718 | |
|
|
|
| ||||
Noncontrolling interests | $ | 1,185 | |
| $ | 1,178 | |
Net (loss) income from discontinued operations in the consolidated statements of operations consists of the following (in millions):
| Three Months Ended |
| Six Months Ended | ||||||||||||
| June 30, |
| June 30, | ||||||||||||
| 2016 |
| 2015 |
| 2016 |
| 2015 | ||||||||
Revenues a | $ | 272 | |
| $ | 310 | |
| $ | 558 | |
| $ | 692 | |
Costs and expenses: |
|
|
|
|
|
|
| ||||||||
Production and delivery costs | 256 | |
| 197 | |
| 482 | |
| 430 | | ||||
Depreciation, depletion and amortization | 20 | | b | 57 | |
| 80 | | b | 130 | | ||||
Interest expense allocated from parent c | 11 | |
| 7 | |
| 21 | |
| 14 | | ||||
Other costs and expenses, net | 5 | |
| 8 | |
| 6 | |
| 17 | | ||||
(Loss) income before income taxes and estimated loss on disposal | (20 | ) |
| 41 | |
| (31 | ) |
| 101 | | ||||
Estimated loss on disposal d | (177 | ) |
| - | |
| (177 | ) |
| - | | ||||
Net (loss) income before income taxes | (197 | ) |
| 41 | |
| (208 | ) |
| 101 | | ||||
Benefit from (provision for) income taxes | 16 | |
| (12 | ) |
| 23 | |
| (31 | ) | ||||
Net (loss) income from discontinued operations | $ | (181 | ) |
| $ | 29 | |
| $ | (185 | ) |
| $ | 70 | |
a. | In accordance with accounting guidance, amounts are net of eliminations of intercompany sales totaling $41 million in both second-quarter 2016 and 2015, $73 million for the first six months of 2016 and $69 million for the first six months of 2015. |
b. | In accordance with accounting guidance, depreciation, depletion and amortization is not recognized subsequent to classification as assets held for sale. |
c. | In accordance with accounting guidance, interest associated with FCX's Term Loan that will be required to be repaid as a result of the sale of TFHL has been allocated to discontinued operations. |
d. | In accordance with accounting guidance, an estimated loss on disposal was recorded, which will be adjusted through closing of the transaction. |
10
Table of Contents
| Six Months Ended | ||||||
| June 30, | ||||||
| 2016 |
| 2015 | ||||
Net cash provided by operating activities | $ | 157 | |
| $ | 153 | |
Net cash used in investing activities | (57 | ) |
| (105 | ) | ||
Net cash used in financing activities | (51 | ) |
| (47 | ) | ||
Increase in cash and cash equivalents in assets held for sale | $ | 49 | |
| $ | 1 | |
FCX has also agreed to negotiate exclusively with CMOC (until December 31, 2016) to enter into a definitive agreement to sell its interest in Freeport Cobalt for $100 million and the Kisanfu exploration project in the DRC for $50 million in separate transactions. Freeport Cobalt includes the large-scale cobalt refinery in Kokkola, Finland, and the related sales and marketing business, in which FCX owns an effective 56 percent interest. Kisanfu is a copper and cobalt exploration project, located near Tenke, in which FCX holds a 100 percent interest.
NOTE 3. EARNINGS PER SHARE
FCX's basic net loss per share of common stock was computed by dividing net loss attributable to common stockholders by the weighted-average shares of common stock outstanding during the period. Diluted net income per share of common stock was computed using the most dilutive of (a) the two-class method or (b) the treasury stock method. Under the two-class method, net income is allocated to each class of common stock and participating securities as if all of the earnings for the period had been distributed. FCX's participating securities consist of vested restricted stock units (RSUs) for which the underlying common shares are not yet issued and entitle holders to non-forfeitable dividends.
11
Table of Contents
A reconciliation of net loss and weighted-average shares of common stock outstanding for purposes of calculating basic and diluted net (loss) income per share follows (in millions, except per share amounts):
| Three Months Ended |
| Six Months Ended |
| ||||||||||||
| June 30, |
| June 30, |
| ||||||||||||
| 2016 |
| 2015 |
| 2016 |
| 2015 |
| ||||||||
Net loss from continuing operations | $ | (229 | ) |
| $ | (1,828 | ) |
| $ | (4,326 | ) |
| $ | (4,275 | ) |
|
Net income from continuing operations attributable to noncontrolling interests | (47 | ) |
| (16 | ) |
| (109 | ) |
| (48 | ) |
| ||||
Preferred dividends on redeemable noncontrolling interest | (10 | ) |
| (10 | ) |
| (21 | ) |
| (20 | ) |
| ||||
Undistributed earnings allocated to participating securities | (3 | ) |
| (3 | ) |
| (3 | ) |
| (3 | ) |
| ||||
Net loss from continuing operations attributable to common stockholders | $ | (289 | ) |
| $ | (1,857 | ) |
| $ | (4,459 | ) |
| $ | (4,346 | ) |
|
|
|
|
|
|
|
|
|
| ||||||||
Net (loss) income from discontinued operations | $ | (181 | ) |
| $ | 29 | |
| $ | (185 | ) |
| $ | 70 | |
|
Net income from discontinued operations attributable to noncontrolling interests | (12 | ) |
| (26 | ) |
| (22 | ) |
| (52 | ) |
| ||||
Net (loss) income from discontinued operations attributable to common stockholders | $ | (193 | ) |
| $ | 3 | |
| $ | (207 | ) |
| $ | 18 | |
|
|
|
|
|
|
|
|
|
| ||||||||
Net loss attributable to common stockholders | $ | (482 | ) |
| $ | (1,854 | ) |
| $ | (4,666 | ) |
| $ | (4,328 | ) |
|
|
|
|
|
|
|
|
|
| ||||||||
Basic weighted-average shares of common stock outstanding | 1,269 | |
| 1,040 | |
| 1,260 | |
| 1,040 | |
| ||||
Add shares issuable upon exercise or vesting of dilutive stock options and RSUs | - | | a | - | | a | - | | a | - | | a | ||||
Diluted weighted-average shares of common stock outstanding | 1,269 | |
| 1,040 | |
| 1,260 | |
| 1,040 | |
| ||||
|
|
|
|
|
|
|
|
| ||||||||
|
|
|
|
|
|
|
|
| ||||||||
Basic and diluted net (loss) income per share attributable to common stockholders: |
|
|
|
|
|
|
|
| ||||||||
Continuing operations | $ | (0.23 | ) |
| $ | (1.78 | ) |
| $ | (3.54 | ) |
| $ | (4.18 | ) |
|
Discontinued operations | (0.15 | ) |
| - | |
| (0.16 | ) |
| 0.02 | |
| ||||
| $ | (0.38 | ) |
| $ | (1.78 | ) |
| $ | (3.70 | ) |
| $ | (4.16 | ) |
|
a. | Excludes 12 million shares of common stock for second-quarter 2016 , 15 million for second-quarter 2015 , 11 million for the first six months of 2016 , and 14 million for the first six months of 2015 associated with outstanding stock options with exercise prices less than the average market price of FCX's common stock and RSUs that were anti-dilutive. |
Outstanding stock options with exercise prices greater than the average market price of FCX's common stock during the period are excluded from the computation of diluted net income per share of common stock. Stock options for 46 million shares of common stock were excluded for second-quarter 2016 , 47 million for the first six months of 2016 and 40 million for both the quarter and six months ended June 30, 2015 .
12
Table of Contents
NOTE 4. INVENTORIES, INCLUDING LONG-TERM MILL AND LEACH STOCKPILES
The components of inventories follow (in millions):
| June 30, |
| December 31, 2015 |
| ||||
Current inventories: |
|
|
|
| ||||
Mill stockpiles | $ | 146 | |
| $ | 137 | |
|
Leach stockpiles | 1,202 | |
| 1,402 | |
| ||
Total current mill and leach stockpiles | $ | 1,348 | |
| $ | 1,539 | |
|
|
|
|
|
| ||||
Total materials and supplies, net a | $ | 1,338 | |
| $ | 1,594 | |
|
|
|
|
|
| ||||
Raw materials (primarily concentrate) | $ | 222 | |
| $ | 220 | |
|
Work-in-process | 93 | |
| 108 | |
| ||
Finished goods | 743 | |
| 743 | |
| ||
Total product inventories | $ | 1,058 | |
| $ | 1,071 | |
|
|
|
|
|
| ||||
Long-term inventories: |
|
|
|
| ||||
Mill stockpiles | $ | 584 | |
| $ | 480 | |
|
Leach stockpiles | 1,158 | |
| 1,183 | |
| ||
Total long-term mill and leach stockpiles b | $ | 1,742 | |
| $ | 1,663 | |
|
a. | Materials and supplies inventory was net of obsolescence reserves totaling $29 million at June 30, 2016 , and $26 million at December 31, 2015 . |
b. | Estimated metals in stockpiles not expected to be recovered within the next 12 months. |
FCX recorded charges for adjustments to inventory carrying values of $2 million in second-quarter 2016 and $7 million for the first six months of 2016, primarily at the Molybdenum mines because of lower molybdenum prices, and $59 million in second-quarter 2015 and $63 million for the first six months of 2015, primarily because of lower molybdenum and copper prices (refer to Note 10 for 2015 inventory adjustments by business segment).
NOTE 5. INCOME TAXES
Variations in the relative proportions of jurisdictional income result in fluctuations to FCX's consolidated effective income tax rate. FCX's consolidated effective income tax rate was (5) percent for the first six months of 2016 and 25 percent for the first six months of 2015 . Geographic sources of FCX's (provision for) benefit from income taxes follow (in millions):
| Three Months Ended |
| Six Months Ended |
| ||||||||||||
| June 30, |
| June 30, |
| ||||||||||||
| 2016 |
| 2015 |
| 2016 |
| 2015 |
| ||||||||
U.S. operations | $ | (49 | ) |
| $ | 829 | |
| $ | (38 | ) |
| $ | 1,664 | |
|
International operations | (67 | ) |
| (130 | ) |
| (155 | ) |
| (251 | ) |
| ||||
Total | $ | (116 | ) |
| $ | 699 | |
| $ | (193 | ) |
| $ | 1,413 | |
|
As a result of the impairment to U.S. oil and gas properties, FCX recorded tax charges of $1.5 billion for the first six months of 2016 and $763 million for the first six months of 2015 to establish a valuation allowance primarily against U.S. federal and state deferred tax assets that will not generate a future benefit. Excluding these charges, FCX's consolidated effective income tax rate was 33 percent for the first six months of 2016 and 38 percent for the first six months of 2015 .
13
Table of Contents
As of December 31, 2015 , FCX had determined that undistributed earnings of TFM were reinvested indefinitely and were allocated toward specifically identifiable needs of the local operations. In connection with the anticipated sale of its interest in TFHL, management concluded that its share of undistributed earnings of TFM were no longer reinvested indefinitely. This change did not have a material impact on FCX's results of operations.
Applicable accounting standards require that FCX estimate an annual effective tax rate and apply that rate to each year-to-date interim period. However, because FCX's estimated effective income tax rate for 2016 is highly variable ( i.e. , minor changes in FCX's estimated annual (loss) income would have a significant effect on the consolidated annual effective income tax rate), the actual effective income tax rate for the year-to-date reporting period represents a better estimate of the consolidated annual effective income tax rate. Accordingly, for the six months ended June 30, 2016 , the actual consolidated effective income tax rate was used to determine FCX's income tax provision.
NOTE 6. DEBT AND EQUITY
Debt. The components of debt follow (in millions):
| June 30, |
| December 31, 2015 | ||||
Term Loan | $ | 2,446 | |
| $ | 3,032 | |
Revolving credit facility | - | |
| - | | ||
Cerro Verde credit facility | 1,784 | |
| 1,781 | | ||
Cerro Verde shareholder loans | 261 | |
| 259 | | ||
Lines of credit | 192 | |
| 442 | | ||
Senior notes and debentures: |
|
|
| ||||
Issued by FCX | 11,648 | |
| 11,908 | | ||
Issued by Freeport-McMoRan Oil & Gas LLC (FM O&G LLC) | 2,524 | |
| 2,539 | | ||
Issued by FMC | 359 | |
| 359 | | ||
Other (including equipment capital leases and other short-term borrowings) | 105 | |
| 108 | | ||
Total debt a | 19,319 | |
| 20,428 | | ||
Less current portion of debt | (770 | ) |
| (649 | ) | ||
Long-term debt | $ | 18,549 | |
| $ | 19,779 | |
a. | Includes additions for unamortized fair value adjustments totaling $195 million at June 30, 2016, and $210 million at December 31, 2015, and net reductions for unamortized debt issuance costs and unamortized discounts of $120 million at June 30, 2016, and $129 million at December 31, 2015. |
On February 26, 2016 , FCX amended its revolving credit facility and Term Loan. The amendments included (i) modification of the maximum leverage ratio and the minimum interest expense coverage ratio, and (ii) the addition of a springing collateral and guarantee trigger. In addition, the commitment under the revolving credit facility was reduced from $4.0 billion to $3.5 billion , and the mandatory prepayment provision was modified under the Term Loan. Refer to Note 18 of FCX's annual report on Form 10-K for the year ended December 31, 2015, for further discussion of these amendments.
In second-quarter 2016, FCX prepaid $568 million on the Term Loan with a portion of the proceeds from the sale of the 13 percent undivided interest in Morenci.
With closed and pending asset sales exceeding the required $3 billion threshold under FCX's revolving credit facility and Term Loan, the springing collateral requirement under these agreements was not triggered on June 30, 2016. Since the TFHL transaction is not expected to close until fourth-quarter 2016, FCX was required to pledge its shares in FMC on June 30, 2016, which will be released upon closing of this transaction. If $3 billion in asset sale transactions have not been completed by December 31, 2016, the springing collateral requirement will be triggered.
At June 30, 2016 , there were no borrowings outstanding and $40 million in letters of credit issued under FCX's revolving credit facility, resulting in availability of approximately $3.5 billion , of which approximately $1.5 billion could be used for additional letters of credit.
14
Table of Contents
Early Extinguishment of Debt
During second-quarter 2016, FCX redeemed certain senior notes in exchange for its common stock (refer to the discussion under "Equity" in this note). A summary of these debt extinguishments follows (in millions):
| Principal Amount |
| Discounts/Deferred Debt Issuance Costs |
| Book Value |
| Gain | ||||||||
3.55% Senior Notes due 2022 | $ | 85 | |
| $ | - | |
| $ | 85 | |
| $ | 9 | |
3.875% Senior Notes due 2023 | 52 | |
| - | |
| 52 | |
| 6 | | ||||
5.40% Senior Notes due 2034 | 50 | |
| 1 | |
| 49 | |
| 8 | | ||||
5.450% Senior Notes due 2043 | 81 | |
| 1 | |
| 80 | |
| 16 | | ||||
Total | $ | 268 | |
| $ | 2 | |
| $ | 266 | |
| $ | 39 | |
In addition, FCX recorded a loss on early extinguishment of debt totaling $3 million associated with the modifications to its Term Loan and revolving credit facility in first-quarter 2016.
Interest Expense, Net
Consolidated interest expense from continuing operations (excluding capitalized interest) totaled $218 million in second-quarter 2016 , $208 million in second-quarter 2015 , $436 million for the first six months of 2016 and $411 million for the first six months of 2015 . Capitalized interest added to property, plant, equipment and mining development costs, net, totaled $22 million in second-quarter 2016 , $47 million in second-quarter 2015 , $42 million for the first six months of 2016 and $92 million for the first six months of 2015 . Capitalized interest added to oil and gas properties not subject to amortization totaled $19 million in second-quarter 2015 (none in second-quarter 2016), $7 million for the first six months of 2016 and $38 million for the first six months of 2015 .
Equity. In 2015 and through January 5, 2016, FCX generated approximately $2 billion in gross proceeds (proceeds of $1.97 billion net of $20 million of commissions and expenses) through the sale of 210 million shares of common stock ( 206 million shares through December 31, 2015, and 4 million shares (with a value of $32 million ) in January 2016) under its at-the-market equity programs. At July 29, 2016, FCX has approximately $12 million remaining under these at-the-market equity programs.
During second-quarter 2016, FCX issued 48 million shares of its common stock (with a value of $540 million , excluding $5 million of commissions paid by FCX) in connection with the settlement of two drilling rig contracts (refer to Note 9 for further discussion).
During second-quarter 2016, FCX negotiated private exchange transactions exempt from registration under the Securities Act of 1933, as amended, whereby 17 million shares of FCX's common stock were issued, with an additional 3 million shares that settled in early July 2016 (with an aggregate value of $226 million ), in exchange for $268 million principal amount of FCX's senior notes. From July 1, 2016, through August 4, 2016, an additional 8 million shares of FCX's common stock (with a value of $85 million ) were issued in exchange for $101 million principal amount of FCX's senior notes. The timing of future exchanges is dependent upon many factors including FCX's operating results, cash flow and financial position, the market price of FCX's common stock, and general economic and market conditions.
NOTE 7. FINANCIAL INSTRUMENTS
FCX does not purchase, hold or sell derivative financial instruments unless there is an existing asset or obligation, or it anticipates a future activity that is likely to occur and will result in exposure to market risks, which FCX intends to offset or mitigate. FCX does not enter into any derivative financial instruments for speculative purposes, but has entered into derivative financial instruments in limited instances to achieve specific objectives. These objectives principally relate to managing risks associated with commodity price changes, foreign currency exchange rates and interest rates.
15
Table of Contents
Commodity Contracts. From time to time, FCX has entered into derivative contracts to hedge the market risk associated with fluctuations in the prices of commodities it purchases and sells. Derivative financial instruments used by FCX to manage its risks do not contain credit risk-related contingent provisions. As of June 30, 2016 , and December 31, 2015 , FCX had no price protection contracts relating to its mine production or future sales of oil and gas. A discussion of FCX's derivative contracts and programs follows.
Derivatives Designated as Hedging Instruments – Fair Value Hedges
Copper Futures and Swap Contracts. Some of FCX's U.S. copper rod customers request a fixed market price instead of the Commodity Exchange Inc. (COMEX), a division of the New York Mercantile Exchange, average copper price in the month of shipment. FCX hedges this price exposure in a manner that allows it to receive the COMEX average price in the month of shipment while the customers pay the fixed price they requested. FCX accomplishes this by entering into copper futures or swap contracts. Hedging gains or losses from these copper futures and swap contracts are recorded in revenues. FCX did not have any significant gains or losses during the six -month periods ended June 30, 2016 and 2015 , resulting from hedge ineffectiveness. At June 30, 2016 , FCX held copper futures and swap contracts that qualified for hedge accounting for 62 million pounds at an average contract price of $2.18 per pound, with maturities through March 2018 .
| Three Months Ended |
| Six Months Ended | ||||||||||||
| June 30, |
| June 30, | ||||||||||||
| 2016 |
| 2015 |
| 2016 |
| 2015 | ||||||||
Copper futures and swap contracts: |
|
|
|
|
|
|
| ||||||||
Unrealized gains (losses): |
|
|
|
|
|
|
| ||||||||
Derivative financial instruments | $ | 3 | |
| $ | (4 | ) |
| $ | 10 | |
| $ | 2 | |
Hedged item – firm sales commitments | (3 | ) |
| 4 | |
| (10 | ) |
| (2 | ) | ||||
|
|
|
|
|
|
|
| ||||||||
Realized losses: |
|
|
|
|
|
|
| ||||||||
Matured derivative financial instruments | (4 | ) |
| (1 | ) |
| (8 | ) |
| (11 | ) | ||||
Derivatives Not Designated as Hedging Instruments
Embedded Derivatives. As described in Note 1 to FCX's annual report on Form 10-K for the year ended December 31, 2015, under "Revenue Recognition," certain FCX copper concentrate, copper cathode and gold sales contracts provide for provisional pricing primarily based on the London Metal Exchange (LME) copper price or the COMEX copper price and the London Bullion Market Association (London) gold price at the time of shipment as specified in the contract. Similarly, FCX purchases copper under contracts that provide for provisional pricing. FCX applies the normal purchases and normal sales scope exception in accordance with derivatives and hedge accounting guidance to the host sales agreements since the contracts do not allow for net settlement and always result in physical delivery. Sales and purchases with a provisional sales price contain an embedded derivative ( i.e. , the price settlement mechanism is settled after the time of delivery) that is required to be bifurcated from the host contract. The host contract is the sale or purchase of the metals contained in the concentrate or cathode at the then-current LME or COMEX copper price or the London gold price as defined in the contract. Mark-to-market price fluctuations from these embedded derivatives related to continuing operations are recorded through the settlement date and are reflected in revenues for sales contracts and in cost of sales as production and delivery costs for purchase contracts. Mark-to-market price fluctuations associated with embedded derivatives for discontinued operations, which were minimal, are included in discontinued operations for all periods presented in these financial statements.
A summary of FCX's embedded derivatives at June 30, 2016 , follows:
| Open Positions |
| Average Price Per Unit |
| Maturities Through | |||||||
|
| Contract |
| Market |
| |||||||
Embedded derivatives in provisional sales contracts: |
|
|
|
|
|
|
| |||||
Copper (millions of pounds) | 769 | |
| $ | 2.16 | |
| $ | 2.20 | |
| November 2016 |
Gold (thousands of ounces) | 90 | |
| 1,259 | |
| 1,322 | |
| October 2016 | ||
Embedded derivatives in provisional purchase contracts: |
|
|
|
|
|
|
| |||||
Copper (millions of pounds) | 123 | |
| 2.17 | |
| 2.20 | |
| October 2016 | ||
16
Table of Contents
Crude Oil Contracts. As a result of the acquisition of the oil and gas business, FCX had derivative contracts in 2015 that consisted of crude oil options. These derivatives were not designated as hedging instruments and were recorded at fair value with the mark-to-market gains and losses recorded in revenues. The crude oil options were entered into to protect the realized price of a portion of expected future sales in order to limit the effects of crude oil price decreases. The remaining contracts matured in 2015, and FCX does not have any crude oil derivative contracts in place for 2016 or future years.
Copper Forward Contracts. Atlantic Copper, FCX's wholly owned smelting and refining unit in Spain, enters into copper forward contracts designed to hedge its copper price risk whenever its physical purchases and sales pricing periods do not match. These economic hedge transactions are intended to hedge against changes in copper prices, with the mark-to-market hedging gains or losses recorded in cost of sales. At June 30, 2016 , Atlantic Copper held net copper forward purchase contracts for 14 million pounds at an average contract price of $2.10 per pound, with maturities through August 2016 .
| Three Months Ended |
| Six Months Ended | ||||||||||||
| June 30, |
| June 30, | ||||||||||||
| 2016 |
| 2015 |
| 2016 |
| 2015 | ||||||||
Embedded derivatives in provisional copper and gold |
|
|
|
|
|
|
| ||||||||
sales contracts a | $ | 4 | |
| $ | (73 | ) |
| $ | 76 | |
| $ | (144 | ) |
Copper forward contracts b | (2 | ) |
| (6 | ) |
| 5 | |
| (7 | ) | ||||
Crude oil options a | - | |
| 6 | |
| - | |
| 58 | | ||||
a. | Amounts recorded in revenues. |
b. | Amounts recorded in cost of sales as production and delivery costs. |
Unsettled Derivative Financial Instruments
A summary of the fair values of unsettled commodity derivative financial instruments follows (in millions):
|
| June 30, |
| December 31, 2015 | ||||
Commodity Derivative Assets: |
|
|
|
| ||||
Derivatives designated as hedging instruments : |
|
|
|
| ||||
Copper futures and swap contracts a |
| $ | 4 | |
| $ | 1 | |
Derivatives not designated as hedging instruments : |
|
|
|
| ||||
Embedded derivatives in provisional copper and gold |
|
|
|
| ||||
sales/purchase contracts |
| 49 | |
| 19 | | ||
Copper forward contracts |
| 2 | |
| - | | ||
Total derivative assets |
| $ | 55 | |
| $ | 20 | |
|
|
|
|
| ||||
Commodity Derivative Liabilities: |
|
|
|
| ||||
Derivatives designated as hedging instruments : |
|
|
|
| ||||
Copper futures and swap contracts a |
| $ | 3 | |
| $ | 11 | |
Derivatives not designated as hedging instruments : |
|
|
|
| ||||
Embedded derivatives in provisional copper and gold |
|
|
|
| ||||
sales/purchase contracts |
| 18 | |
| 81 | | ||
Copper forward contracts |
| 1 | |
| - | | ||
Total derivative liabilities |
| $ | 22 | |
| $ | 92 | |
a. | FCX paid $3 million to brokers at June 30, 2016 , and $10 million at December 31, 2015 , for margin requirements (recorded in other current assets). |
17
Table of Contents
FCX's commodity contracts have netting arrangements with counterparties with which the right of offset exists, and it is FCX's policy to offset balances by counterparty on its balance sheet. FCX's embedded derivatives on provisional sales/purchases are netted with the corresponding outstanding receivable/payable balances. A summary of these unsettled commodity contracts that are offset in the balance sheet follows (in millions):
|
| Assets |
| Liabilities | ||||||||||||
|
| June 30, 2016 |
| December 31, 2015 |
| June 30, 2016 |
| December 31, 2015 | ||||||||
|
|
|
|
|
|
|
|
| ||||||||
Gross amounts recognized: |
|
|
|
|
|
|
|
| ||||||||
Commodity contracts: |
|
|
|
|
|
|
|
| ||||||||
Embedded derivatives in provisional |
|
|
|
|
|
|
|
| ||||||||
sales/purchase contracts |
| $ | 49 | |
| $ | 19 | |
| $ | 18 | |
| $ | 81 | |
Copper derivatives |
| 6 | |
| 1 | |
| 4 | |
| 11 | | ||||
|
| 55 | |
| 20 | |
| 22 | |
| 92 | | ||||
|
|
|
|
|
|
|
|
| ||||||||
Less gross amounts of offset: |
|
|
|
|
|
|
|
| ||||||||
Commodity contracts: |
|
|
|
|
|
|
|
| ||||||||
Embedded derivatives in provisional |
|
|
|
|
|
|
|
| ||||||||
sales/purchase contracts |
| 3 | |
| 5 | |
| 3 | |
| 5 | | ||||
Copper derivatives |
| 4 | |
| 1 | |
| 4 | |
| 1 | | ||||
|
| 7 | |
| 6 | |
| 7 | |
| 6 | | ||||
|
|
|
|
|
|
|
|
| ||||||||
Net amounts presented in balance sheet: |
|
|
|
|
|
|
|
| ||||||||
Commodity contracts: |
|
|
|
|
|
|
|
| ||||||||
Embedded derivatives in provisional |
|
|
|
|
|
|
|
| ||||||||
sales/purchase contracts |
| 46 | |
| 14 | |
| 15 | |
| 76 | | ||||
Copper derivatives |
| 2 | |
| - | |
| - | |
| 10 | | ||||
|
| $ | 48 | |
| $ | 14 | |
| $ | 15 | |
| $ | 86 | |
|
|
|
|
|
|
|
|
| ||||||||
Balance sheet classification: |
|
|
|
|
|
|
|
| ||||||||
Trade accounts receivable |
| $ | 48 | |
| $ | 9 | |
| $ | 8 | |
| $ | 51 | |
Accounts payable and accrued liabilities |
| - | |
| 5 | |
| 7 | |
| 35 | | ||||
|
| $ | 48 | |
| $ | 14 | |
| $ | 15 | |
| $ | 86 | |
Credit Risk. FCX is exposed to credit loss when financial institutions with which FCX has entered into derivative transactions (commodity, foreign exchange and interest rate swaps) are unable to pay. To minimize the risk of such losses, FCX uses counterparties that meet certain credit requirements and periodically reviews the creditworthiness of these counterparties. FCX does not anticipate that any of the counterparties it deals with will default on their obligations. As of June 30, 2016 , the maximum amount of credit exposure associated with derivative transactions was $42 million .
Other Financial Instruments. Other financial instruments include cash and cash equivalents, accounts receivable, restricted cash, investment securities, legally restricted funds, accounts payable and accrued liabilities, and long-term debt. The carrying value for cash and cash equivalents (which included time deposits of $48 million at June 30, 2016 , and $34 million at December 31, 2015), accounts receivable, restricted cash, and accounts payable and accrued liabilities approximates fair value because of their short-term nature and generally negligible credit losses (refer to Note 8 for the fair values of investment securities, legally restricted funds and long-term debt).
In addition, FCX has contingent liabilities related to the settlement of FM O&G's drilling rig contracts (refer to Note 8 for the fair value and Note 9 for further discussion of these instruments).
18
Table of Contents
NOTE 8. FAIR VALUE MEASUREMENT
Fair value accounting guidance includes a hierarchy that prioritizes the inputs to valuation techniques used to measure fair value. The hierarchy gives the highest priority to unadjusted quoted prices in active markets for identical assets or liabilities (Level 1) and the lowest priority to unobservable inputs (Level 3).
FCX recognizes transfers between levels at the end of the reporting period. FCX did not have any significant transfers in or out of Level 1, 2 or 3 for second -quarter 2016 .
FCX retrospectively adopted the May 2015 Accounting Standards Update (ASU) associated with investments for which fair value is measured using the net asset value (NAV) per share as a practical expedient. As a result, investments valued using NAV per share are shown in the tables below in a column separate from the levels within the fair value hierarchy. A summary of the carrying amount and fair value of FCX's financial instruments, other than cash and cash equivalents, accounts receivable, restricted cash, and accounts payable and accrued liabilities (refer to Note 7 ) follows (in millions):
| At June 30, 2016 | ||||||||||||||||||||||
| Carrying |
| Fair Value | ||||||||||||||||||||
| Amount |
| Total |
| NAV |
| Level 1 |
| Level 2 |
| Level 3 | ||||||||||||
Assets |
|
|
|
|
|
|
|
|
|
|
| ||||||||||||
Investment securities: a,b |
|
|
|
|
|
|
|
|
|
|
| ||||||||||||
U.S. core fixed income fund at NAV | $ | 24 | |
| $ | 24 | |
| $ | 24 | |
| $ | - | |
| $ | - | |
| $ | - | |
Money market funds | 22 | |
| 22 | |
| - | |
| 22 | |
| - | |
| - | | ||||||
Equity securities | 4 | |
| 4 | |
| - | |
| 4 | |
| - | |
| - | | ||||||
Total | 50 | |
| 50 | |
| 24 | |
| 26 | |
| - | |
| - | | ||||||
|
|
|
|
|
|
|
|
|
|
|
| ||||||||||||
Legally restricted funds: a,b,c,d |
|
|
|
|
|
|
|
|
|
|
| ||||||||||||
U.S. core fixed income fund at NAV | 55 | |
| 55 | |
| 55 | |
| - | |
| - | |
| - | | ||||||
Government bonds and notes | 38 | |
| 38 | |
| - | |
| - | |
| 38 | |
| - | | ||||||
Government mortgage-backed securities | 30 | |
| 30 | |
| - | |
| - | |
| 30 | |
| - | | ||||||
Corporate bonds | 30 | |
| 30 | |
| - | |
| - | |
| 30 | |
| - | | ||||||
Asset-backed securities | 15 | |
| 15 | |
| - | |
| - | |
| 15 | |
| - | | ||||||
Money market funds | 12 | |
| 12 | |
| - | |
| 12 | |
| - | |
| - | | ||||||
Collateralized mortgage-backed securities | 6 | |
| 6 | |
| - | |
| - | |
| 6 | |
| - | | ||||||
Municipal bonds | 1 | |
| 1 | |
| - | |
| - | |
| 1 | |
| - | | ||||||
Total | 187 | |
| 187 | |
| 55 | |
| 12 | |
| 120 | |
| - | | ||||||
|
|
|
|
|
|
|
|
|
|
|
| ||||||||||||
Derivatives: a,e |
|
|
|
|
|
|
|
|
|
|
| ||||||||||||
Embedded derivatives in provisional sales/ |
|
|
|
|
|
|
|
|
|
|
| ||||||||||||
purchase contracts in a gross asset position | 49 | |
| 49 | |
| - | |
| - | |
| 49 | |
| - | | ||||||
Copper futures and swap contracts | 4 | |
| 4 | |
| - | |
| 4 | |
| - | |
| - | | ||||||
Copper forward contracts | 2 | |
| 2 | |
| - | |
| 1 | |
| 1 | |
| - | | ||||||
Total | 55 | |
| 55 | |
| - | |
| 5 | |
| 50 | |
| - | | ||||||
|
|
|
|
|
|
|
|
|
|
|
| ||||||||||||
Total assets |
|
| $ | 292 | |
| $ | 79 | |
| $ | 43 | |
| $ | 170 | |
| $ | - | | ||
|
|
|
|
|
|
|
|
|
|
|
| ||||||||||||
Liabilities |
|
|
|
|
|
|
|
|
|
|
| ||||||||||||
Derivatives: a,e |
|
|
|
|
|
|
|
|
|
|
| ||||||||||||
Embedded derivatives in provisional sales/ |
|
|
|
|
|
|
|
|
|
|
| ||||||||||||
purchase contracts in a gross liability position | $ | 18 | |
| $ | 18 | |
| $ | - | |
| $ | - | |
| $ | 18 | |
| $ | - | |
Copper futures and swap contracts | 3 | |
| 3 | |
| - | |
| 1 | |
| 2 | |
| - | | ||||||
Copper forward contracts | 1 | |
| 1 | |
| - | |
| 1 | |
| - | |
| - | | ||||||
Total | 22 | |
| 22 | |
| - | |
| 2 | |
| 20 | |
| - | | ||||||
|
|
|
|
|
|
|
|
|
|
|
| ||||||||||||
Contingent consideration for the settlements of |
|
|
|
|
|
|
|
|
|
|
| ||||||||||||
drilling rig contracts f | 25 | |
| 25 | |
| - | |
| - | |
| 25 | |
| - | | ||||||
|
|
|
|
|
|
|
|
|
|
|
| ||||||||||||
Long-term debt, including current portion g | 19,319 | |
| 17,772 | |
| - | |
| - | |
| 17,772 | |
| - | | ||||||
|
|
|
|
|
|
|
|
|
|
|
| ||||||||||||
Total liabilities |
|
| $ | 17,819 | |
| $ | - | |
| $ | 2 | |
| $ | 17,817 | |
| $ | - | | ||
19
Table of Contents
| At December 31, 2015 | ||||||||||||||||||||||
| Carrying |
| Fair Value | ||||||||||||||||||||
| Amount |
| Total |
| NAV |
| Level 1 |
| Level 2 |
| Level 3 | ||||||||||||
Assets |
|
|
|
|
|
|
|
|
|
|
| ||||||||||||
Investment securities: a,b |
|
|
|
|
|
|
|
|
|
|
| ||||||||||||
U.S. core fixed income fund at NAV | $ | 23 | |
| $ | 23 | |
| $ | 23 | |
| $ | - | |
| $ | - | |
| $ | - | |
Money market funds | 21 | |
| 21 | |
| - | |
| 21 | |
| - | |
| - | | ||||||
Equity securities | 3 | |
| 3 | |
| - | |
| 3 | |
| - | |
| - | | ||||||
Total | 47 | |
| 47 | |
| 23 | |
| 24 | |
| - | |
| - | | ||||||
|
|
|
|
|
|
|
|
|
|
|
| ||||||||||||
Legally restricted funds: a,b,c,d |
|
|
|
|
|
|
|
|
|
|
| ||||||||||||
U.S. core fixed income fund at NAV | 52 | |
| 52 | |
| 52 | |
| - | |
| - | |
| - | | ||||||
Government bonds and notes | 37 | |
| 37 | |
| - | |
| - | |
| 37 | |
| - | | ||||||
Government mortgage-backed securities | 28 | |
| 28 | |
| - | |
| - | |
| 28 | |
| - | | ||||||
Corporate bonds | 26 | |
| 26 | |
| - | |
| - | |
| 26 | |
| - | | ||||||
Asset-backed securities | 13 | |
| 13 | |
| - | |
| - | |
| 13 | |
| - | | ||||||
Collateralized mortgage-backed securities | 7 | |
| 7 | |
| - | |
| - | |
| 7 | |
| - | | ||||||
Money market funds | 7 | |
| 7 | |
| - | |
| 7 | |
| - | |
| - | | ||||||
Municipal bonds | 1 | |
| 1 | |
| - | |
| - | |
| 1 | |
| - | | ||||||
Total | 171 | |
| 171 | |
| 52 | |
| 7 | |
| 112 | |
| - | | ||||||
|
|
|
|
|
|
|
|
|
|
|
| ||||||||||||
Derivatives: a,e |
|
|
|
|
|
|
|
|
|
|
| ||||||||||||
Embedded derivatives in provisional sales/ |
|
|
|
|
|
|
|
|
|
|
| ||||||||||||
purchase contracts in a gross asset position | 19 | |
| 19 | |
| - | |
| - | |
| 19 | |
| - | | ||||||
Copper futures and swap contracts | 1 | |
| 1 | |
| - | |
| 1 | |
| - | |
| - | | ||||||
Total | 20 | |
| 20 | |
| - | |
| 1 | |
| 19 | |
| - | | ||||||
|
|
|
|
|
|
|
|
|
|
|
| ||||||||||||
Total assets |
|
| $ | 238 | |
| $ | 75 | |
| $ | 32 | |
| $ | 131 | |
| $ | - | | ||
|
|
|
|
|
|
|
|
|
|
|
| ||||||||||||
Liabilities |
|
|
|
|
|
|
|
|
|
|
| ||||||||||||
Derivatives: a,e |
|
|
|
|
|
|
|
|
|
|
| ||||||||||||
Embedded derivatives in provisional sales/ |
|
|
|
|
|
|
|
|
|
|
| ||||||||||||
purchase contracts in a gross liability position | $ | 81 | |
| $ | 81 | |
| $ | - | |
| $ | - | |
| $ | 81 | |
| $ | - | |
Copper futures and swap contracts | 11 | |
| 11 | |
| - | |
| 7 | |
| 4 | |
| - | | ||||||
Total | 92 | |
| 92 | |
| - | |
| 7 | |
| 85 | |
| - | | ||||||
|
|
|
|
|
|
|
|
|
|
|
| ||||||||||||
Long-term debt, including current portion g | 20,428 | |
| 13,987 | |
| - | |
| - | |
| 13,987 | |
| - | | ||||||
|
|
|
|
|
|
|
|
|
|
|
| ||||||||||||
Total liabilities |
|
| $ | 14,079 | |
| $ | - | |
| $ | 7 | |
| $ | 14,072 | |
| $ | - | | ||
a. | Recorded at fair value. |
b. | Current portion included in other current assets and long-term portion included in other assets. |
c. | Excludes time deposits (which approximated fair value) included in other assets of $120 million at June 30, 2016 , and $118 million at December 31, 2015 , primarily associated with an assurance bond to support PT Freeport Indonesia's (PT-FI) commitment for smelter development in Indonesia. |
d. | Excludes time deposits (which approximated fair value) included in other current assets of $30 million at June 30, 2016 , and $28 million at December 31, 2015 . |
e. | Refer to Note 7 for further discussion and balance sheet classifications. |
f. | Included in other liabilities. |
g. | Recorded at cost except for debt assumed in acquisitions, which were recorded at fair value at the respective acquisition dates. |
Valuation Techniques. Money market funds are classified within Level 1 of the fair value hierarchy because they are valued using quoted market prices in active markets.
Equity securities are valued at the closing price reported on the active market on which the individual securities are traded and, as such, are classified within Level 1 of the fair value hierarchy.
20
Table of Contents
Fixed income securities (government securities, corporate bonds, asset-backed securities, collateralized mortgage-backed securities and municipal bonds) are valued using a bid-evaluation price or a mid-evaluation price. A bid-evaluation price is an estimated price at which a dealer would pay for a security. A mid-evaluation price is the average of the estimated price at which a dealer would sell a security and the estimated price at which a dealer would pay for a security. These evaluations are based on quoted prices, if available, or models that use observable inputs and, as such, are classified within Level 2 of the fair value hierarchy.
FCX's embedded derivatives on provisional copper concentrate, copper cathode and gold purchases and sales are valued using only quoted monthly LME or COMEX copper forward prices and the London gold forward price at each reporting date based on the month of maturity (refer to Note 7 for further discussion); however, FCX's contracts themselves are not traded on an exchange. As a result, these derivatives are classified within Level 2 of the fair value hierarchy.
FCX's derivative financial instruments for copper futures and swap contracts and copper forward contracts that are traded on the respective exchanges are classified within Level 1 of the fair value hierarchy because they are valued using quoted monthly COMEX or LME prices at each reporting date based on the month of maturity (refer to Note 7 for further discussion). Certain of these contracts are traded on the over-the-counter market and are classified within Level 2 of the fair value hierarchy based on COMEX and LME forward prices.
Contingent liabilities for the settlement of drilling rig contracts (refer to Note 9 for further discussion) are based on the average price of WTI crude oil over the 12-month period ending June 30, 2017. The fair value is estimated using a Monte Carlo simulation model that uses various observable inputs, including WTI crude oil forward prices, volatilities, discount rate and settlement terms. As a result, these contingent liabilities are classified within Level 2 of the fair value hierarchy.
Long-term debt, including current portion, is valued using available market quotes and, as such, is classified within Level 2 of the fair value hierarchy.
The U.S. core fixed income fund is valued at NAV. The fund strategy seeks total return consisting of income and capital appreciation primarily by investing in a broad range of investment-grade debt securities, including U.S. government obligations, corporate bonds, mortgage-backed securities, asset-backed securities and money market instruments. There are no restrictions on redemptions (usually within one business day of notice).
The techniques described above may produce a fair value calculation that may not be indicative of net realizable value or reflective of future fair values. Furthermore, while FCX believes its valuation techniques are appropriate and consistent with other market participants, the use of different techniques or assumptions to determine fair value of certain financial instruments could result in a different fair value measurement at the reporting date. There have been no changes in the techniques used at June 30, 2016 .
|
|
|
NOTE 9. CONTINGENCIES AND COMMITMENTS
Litigation. During second-quarter 2016, there were no significant updates to previously reported legal proceedings included in Note 12 of FCX's annual report on Form 10-K for the year ended December 31, 2015.
Tax and Other Matters
Cerro Verde Royalty Dispute
As reported in Note 12 of FCX's annual report on Form 10-K for the year ended December 31, 2015, SUNAT, the Peru national tax authority, has assessed mining royalties on ore processed by the Cerro Verde concentrator, which commenced operations in late 2006, for the period December 2006 to December 2007 and the years 2008 and 2009. In April 2016, SUNAT issued assessments for the year 2010 and the period January 2011 to September 2011. Cerro Verde has contested the assessments, of which the aggregate amount covering the period December 2006 to September 2011 totals $387 million (based on the exchange rate as of June 30, 2016), including estimated accumulated interest and penalties. Additionally, in April 2016, Peru's Twentieth Contentious Administrative Court, which specializes in taxation matters, rendered its decision upholding the Peru Tax Tribunal's July 2013 decision affirming SUNAT's assessments for the period December 2006 through December 2007. On May 2, 2016, Cerro Verde appealed this decision to Peru's Twentieth Contentious Administrative Court.
21
Table of Contents
SUNAT may make additional assessments for mining royalties and associated penalties and interest for the period from October 2011 through December 2013, which Cerro Verde will contest. As of June 30, 2016, FCX estimates the total exposure associated with these mining royalties for the period from December 2006 through December 2013 approximates $474 million (based on the exchange rate as of June 30, 2016), including estimated accumulated interest and penalties. No amounts have been accrued for these assessments as of June 30, 2016, because Cerro Verde believes its 1998 stability agreement exempts it from these royalties and believes any payments will be recoverable.
Other Peru Tax Matters
There were no significant changes to other Peru tax matters during second-quarter 2016 (refer to Note 12 of FCX's annual report on Form 10-K for the year ended December 31, 2015 , for further discussion of these matters).
Indonesia Tax Matters
The following information includes a discussion of updates to previously reported Indonesia tax matters included in Note 12 of FCX's annual report on Form 10-K for the year ended December 31, 2015.
In December 2009, PT-FI was notified by Indonesian tax authorities that it was obligated to pay value-added taxes on certain goods imported after the year 2000. In December 2014, PT-FI paid $269 million for valued-added taxes for the period from November 2005 through the year 2009 and sought a refund. In March 2016, PT-FI collected a cash refund of $196 million and $38 million was offset against other tax liabilities. The remaining balance of the amount originally paid was reduced by currency exchange and other losses.
Required estimated income tax payments for 2014 significantly exceeded PT-FI's 2014 reported income tax liability, which resulted in a $284 million overpayment. During second-quarter 2016, the Indonesian tax authorities issued tax assessments for 2014 of $156 million and agreed to refund $128 million associated with income tax overpayments made by PT-FI in 2014. PT-FI will file objections for $155 million of the tax assessments.
PT-FI received assessments from the local regional tax authority in Papua, Indonesia, for additional taxes and penalties related to surface water taxes for the period from January 2011 through May 2016. PT-FI has filed or will file objections to these assessments. The local government of Papua rejected PT-FI's objections to the assessments related to the period from January 2011 through December 2015, and PT-FI has filed or will file appeals with the Indonesia Tax Court. The aggregate amount of all assessments received through June 30, 2016, including penalties, was 2.9 trillion Indonesian rupiah ( $220 million based on the exchange rate as of June 30, 2016). Additional penalties, which could be significant, may be assessed depending on the outcome of the appeals process. No amounts have been accrued for these assessments as of June 30, 2016, because PT-FI believes its Contract of Work (COW) exempts it from these payments and that it has the right to contest these assessments in the Indonesia Tax Court and ultimately the Indonesia Supreme Court.
Indonesia Mining Contract. There were no significant updates related to PT-FI's COW during second-quarter 2016 (refer to Note 13 of FCX's annual report on Form 10-K for the year ended December 31, 2015 , for further discussion).
PT-FI is required to apply for renewal of export permits at six-month intervals. In February 2016, PT-FI's export permit was renewed through August 8, 2016 . PT-FI has applied for an extension of this permit. The Indonesian government continues to impose a five percent export duty while it reviews PT-FI's smelter plans.
Other. During second-quarter 2016, FCX negotiated the termination and settlement of FM O&G's drilling rig contracts with Noble Drilling (U.S.) LLC (Noble) and Rowan Companies plc (Rowan). Under the settlement with Noble, FCX issued 48 million shares of its common stock (representing a value of $540 million ) during second-quarter 2016, and Noble immediately sold these shares. Under the settlement with Rowan, FCX paid $85 million in cash during second-quarter 2016 and will pay the remaining $130 million during third-quarter 2016. FCX also agreed to provide contingent payments of up to $75 million to Noble and $30 million to Rowan, depending on the average price of crude oil over the 12-month period ending June 30, 2017. The fair value of these contingent payments totaled $25 million as of June 30, 2016 (refer to Note 8). As a result of the settlements, FM O&G was released from a total of $1.1 billion in payment obligations under its three drilling rig contracts.
22
Table of Contents
NOTE 10. BUSINESS SEGMENTS
FCX has organized its continuing mining operations into four primary divisions – North America copper mines, South America mining, Indonesia mining and Molybdenum mines, and operating segments that meet certain thresholds are reportable segments. For oil and gas operations, FCX determines its operating segments on a country-by-country basis. Separately disclosed in the following table are FCX's reportable segments, which include the Morenci, Cerro Verde and Grasberg copper mines, the Rod & Refining operations, the Atlantic Copper Smelting & Refining operation and U.S. Oil & Gas operations.
FCX's reportable segments previously included Africa mining, which consisted of the Tenke mine located in the DRC. As discussed in Note 2, FCX has entered into a definitive agreement to sell its interest in TFHL, and as a result, Tenke has been removed from continuing operations and reported as discontinued operations for all periods presented.
On May 31, 2016, FCX completed the sale of an additional 13 percent undivided interest in the Morenci unincorporated joint venture. As a result, FCX's undivided interest in Morenci was prospectively reduced from 85 percent to 72 percent .
Intersegment sales between FCX's mining operations are based on similar arms-length transactions with third parties at the time of the sale. Intersegment sales may not be reflective of the actual prices ultimately realized because of a variety of factors, including additional processing, timing of sales to unaffiliated customers and transportation premiums. In addition, intersegment sales from Tenke to FCX's other consolidated subsidiaries have been eliminated in discontinued operations (refer to Note 2) and included in Other Mining & Eliminations.
FCX defers recognizing profits on sales from its mines to other divisions, including Atlantic Copper (FCX's wholly owned smelter and refinery in Spain) and on 25 percent of PT-FI's sales to PT Smelting (PT-FI's 25 percent -owned smelter and refinery in Indonesia), until final sales to third parties occur. Quarterly variations in ore grades, the timing of intercompany shipments and changes in product prices result in variability in FCX's net deferred profits and quarterly earnings.
FCX allocates certain operating costs, expenses and capital expenditures to its operating divisions and individual segments. However, not all costs and expenses applicable to an operation are allocated. U.S. federal and state income taxes are recorded and managed at the corporate level (included in Corporate, Other & Eliminations), whereas foreign income taxes are recorded and managed at the applicable country level. In addition, most mining exploration and research activities are managed on a consolidated basis, and those costs, along with some selling, general and administrative costs, are not allocated to the operating divisions or individual segments. Accordingly, the following segment information reflects management determinations that may not be indicative of what the actual financial performance of each operating division or segment would be if it was an independent entity.
23
Table of Contents
Financial Information by Business Segments
(In millions) | Mining Operations a |
|
|
|
|
|
| ||||||||||||||||||||||||||||||||||||||||||||||||||||
| North America Copper Mines |
| South America |
| Indonesia |
|
|
|
|
|
|
|
|
|
|
|
|
|
|
|
| ||||||||||||||||||||||||||||||||||||||
|
|
|
|
|
|
|
|
|
|
|
|
|
|
|
|
|
|
| Atlantic |
| Other |
|
|
|
|
| Corporate, |
|
| ||||||||||||||||||||||||||||||
|
|
|
|
|
|
|
|
|
|
|
|
|
|
| Molyb- |
|
|
| Copper |
| Mining |
|
|
| U.S. |
| Other |
|
| ||||||||||||||||||||||||||||||
|
|
|
|
|
|
| Cerro |
|
|
|
|
|
|
| denum |
| Rod & |
| Smelting |
| & Elimi- |
| Total |
| Oil & Gas |
| & Elimi- |
| FCX | ||||||||||||||||||||||||||||||
| Morenci |
| Other |
| Total |
| Verde |
| Other |
| Total |
| Grasberg |
| Mines |
| Refining |
| & Refining |
| nations |
| Mining |
| Operations |
| nations |
| Total | ||||||||||||||||||||||||||||||
Three Months Ended June 30, 2016 |
|
|
|
|
|
|
|
|
|
|
|
|
|
|
|
|
|
|
|
|
|
|
|
|
|
|
|
|
| ||||||||||||||||||||||||||||||
Revenues: |
|
|
|
|
|
|
|
|
|
|
|
|
|
|
|
|
|
|
|
|
|
|
|
|
|
|
|
|
| ||||||||||||||||||||||||||||||
Unaffiliated customers | $ | 79 | |
| $ | 43 | |
| $ | 122 | |
| $ | 494 | |
| $ | 123 | |
| $ | 617 | |
| $ | 532 | | b | $ | - | |
| $ | 919 | |
| $ | 493 | |
| $ | 241 | | c | $ | 2,924 | |
| $ | 410 | | | $ | - | |
| $ | 3,334 | |
Intersegment | 404 | |
| 534 | |
| 938 | |
| 60 | |
| - | |
| 60 | |
| (1 | ) | d | 45 | |
| 7 | |
| 2 | |
| (1,051 | ) |
| - | |
| - | |
| - | |
| - | | |||||||||||||||
Production and delivery | 298 | |
| 428 | |
| 726 | |
| 303 | |
| 103 | |
| 406 | |
| 356 | |
| 50 | |
| 919 | |
| 466 | |
| (866 | ) |
| 2,057 | |
| 889 | | e | 10 | |
| 2,956 | | |||||||||||||||
Depreciation, depletion and amortization | 57 | |
| 77 | |
| 134 | |
| 109 | |
| 27 | |
| 136 | |
| 93 | |
| 17 | |
| 3 | |
| 7 | |
| 20 | |
| 410 | |
| 218 | |
| 4 | |
| 632 | | |||||||||||||||
Impairment of oil and gas properties | - | |
| - | |
| - | |
| - | |
| - | |
| - | |
| - | |
| - | |
| - | |
| - | |
| - | |
| - | |
| 290 | |
| 1 | | f | 291 | | |||||||||||||||
Selling, general and administrative expenses | 1 | |
| 1 | |
| 2 | |
| 2 | |
| - | |
| 2 | |
| 22 | |
| - | |
| - | |
| 4 | |
| 2 | |
| 32 | |
| 81 | | g | 47 | |
| 160 | | |||||||||||||||
Mining exploration and research expenses | - | |
| - | |
| - | |
| - | |
| - | |
| - | |
| - | |
| - | |
| - | |
| - | |
| 15 | |
| 15 | |
| - | |
| - | |
| 15 | | |||||||||||||||
Environmental obligations and shutdown costs | - | |
| - | |
| - | |
| - | |
| - | |
| - | |
| - | |
| - | |
| - | |
| - | |
| 10 | |
| 10 | |
| - | |
| 1 | |
| 11 | | |||||||||||||||
Net gain on sales of assets | (577 | ) |
| - | |
| (577 | ) |
| - | |
| - | |
| - | |
| - | |
| - | |
| - | |
| - | |
| (172 | ) |
| (749 | ) |
| - | |
| - | |
| (749 | ) | |||||||||||||||
Operating income (loss) | 704 | |
| 71 | |
| 775 | |
| 140 | |
| (7 | ) |
| 133 | |
| 60 | |
| (22 | ) |
| 4 | |
| 18 | |
| 181 | |
| 1,149 | |
| (1,068 | ) |
| (63 | ) |
| 18 | | |||||||||||||||
|
|
|
|
|
|
|
|
|
|
|
|
|
|
|
|
|
|
|
|
|
|
|
|
|
|
|
|
|
| ||||||||||||||||||||||||||||||
Interest expense, net | - | |
| 1 | |
| 1 | |
| 20 | |
| - | |
| 20 | |
| - | |
| - | |
| - | |
| 4 | |
| 19 | |
| 44 | |
| 93 | |
| 59 | |
| 196 | | |||||||||||||||
Provision for (benefit from) income taxes | - | |
| - | |
| - | |
| 45 | |
| (2 | ) |
| 43 | |
| 18 | |
| - | |
| - | |
| - | |
| - | |
| 61 | |
| - | |
| 55 | |
| 116 | | |||||||||||||||
Total assets at June 30, 2016 | 2,960 | |
| 4,676 | |
| 7,636 | |
| 9,330 | |
| 1,609 | |
| 10,939 | |
| 9,550 | |
| 1,969 | |
| 217 | |
| 607 | |
| 6,151 | | h | 37,069 | |
| 3,902 | |
| 325 | |
| 41,296 | | |||||||||||||||
Capital expenditures | 37 | |
| 5 | |
| 42 | |
| 135 | |
| 1 | |
| 136 | |
| 234 | |
| - | |
| - | |
| 5 | |
| 24 | | i | 441 | |
| 388 | | j | 4 | |
| 833 | | |||||||||||||||
|
|
|
|
|
|
|
|
|
|
|
|
|
|
|
|
|
|
|
|
|
|
|
|
|
|
|
|
|
| ||||||||||||||||||||||||||||||
Three Months Ended June 30, 2015 |
|
|
|
|
|
|
|
|
|
|
|
|
|
|
|
|
|
|
|
|
|
|
|
|
|
|
|
|
| ||||||||||||||||||||||||||||||
Revenues: |
|
|
|
|
|
|
|
|
|
|
|
|
|
|
|
|
|
|
|
|
|
|
|
|
|
|
|
|
| ||||||||||||||||||||||||||||||
Unaffiliated customers | $ | 180 | |
| $ | 92 | |
| $ | 272 | |
| $ | 195 | |
| $ | 221 | |
| $ | 416 | |
| $ | 792 | | b | $ | - | |
| $ | 1,089 | |
| $ | 495 | |
| $ | 305 | | c | $ | 3,369 | |
| $ | 569 | | k | $ | - | |
| $ | 3,938 | |
Intersegment | 427 | |
| 706 | |
| 1,133 | |
| 37 | |
| - | |
| 37 | |
| (2 | ) | d | 102 | |
| 8 | |
| 5 | |
| (1,283 | ) |
| - | |
| - | |
| - | |
| - | | |||||||||||||||
Production and delivery | 386 | |
| 576 | | l | 962 | |
| 165 | |
| 150 | |
| 315 | |
| 455 | |
| 84 | | l | 1,088 | |
| 468 | |
| (1,004 | ) | l | 2,368 | |
| 281 | | e | 2 | |
| 2,651 | | |||||||||||||||
Depreciation, depletion and amortization | 55 | |
| 84 | |
| 139 | |
| 40 | |
| 32 | |
| 72 | |
| 78 | |
| 25 | |
| 3 | |
| 9 | |
| 19 | |
| 345 | |
| 485 | |
| 3 | |
| 833 | | |||||||||||||||
Impairment of oil and gas properties | - | |
| - | |
| - | |
| - | |
| - | |
| - | |
| - | |
| - | |
| - | |
| - | |
| - | |
| - | |
| 2,686 | |
| - | |
| 2,686 | | |||||||||||||||
Selling, general and administrative expenses | - | |
| 2 | |
| 2 | |
| - | |
| 1 | |
| 1 | |
| 25 | |
| - | |
| - | |
| 4 | |
| 5 | |
| 37 | |
| 49 | |
| 62 | |
| 148 | | |||||||||||||||
Mining exploration and research expenses | - | |
| 2 | |
| 2 | |
| - | |
| - | |
| - | |
| - | |
| - | |
| - | |
| - | |
| 28 | |
| 30 | |
| - | |
| - | |
| 30 | | |||||||||||||||
Environmental obligations and shutdown costs | - | |
| - | |
| - | |
| - | |
| - | |
| - | |
| - | |
| - | |
| - | |
| - | |
| 11 | |
| 11 | |
| - | |
| - | |
| 11 | | |||||||||||||||
Operating income (loss) | 166 | |
| 134 | |
| 300 | |
| 27 | |
| 38 | |
| 65 | |
| 232 | |
| (7 | ) |
| 6 | |
| 19 | |
| (37 | ) |
| 578 | |
| (2,932 | ) |
| (67 | ) |
| (2,421 | ) | |||||||||||||||
|
|
|
|
|
|
|
|
|
|
|
|
|
|
|
|
|
|
|
|
|
|
|
|
|
|
|
|
|
| ||||||||||||||||||||||||||||||
Interest expense, net | - | |
| 1 | |
| 1 | |
| - | |
| - | |
| - | |
| - | |
| - | |
| - | |
| 2 | |
| 39 | |
| 42 | |
| 41 | |
| 59 | |
| 142 | | |||||||||||||||
Provision for (benefit from) income taxes | - | |
| - | |
| - | |
| (5 | ) |
| 11 | |
| 6 | |
| 95 | |
| - | |
| - | |
| - | |
| - | |
| 101 | |
| - | |
| (800 | ) |
| (699 | ) | |||||||||||||||
Total assets at June 30, 2015 | 3,806 | |
| 5,582 | |
| 9,388 | |
| 8,567 | |
| 1,935 | |
| 10,502 | |
| 8,959 | |
| 2,052 | |
| 286 | |
| 786 | |
| 6,461 | | h | 38,434 | |
| 15,393 | |
| 181 | |
| 54,008 | | |||||||||||||||
Capital expenditures | 79 | |
| 28 | |
| 107 | |
| 444 | |
| 13 | |
| 457 | |
| 213 | |
| 4 | |
| - | |
| 4 | |
| 70 | | i | 855 | |
| 777 | | j | 29 | |
| 1,661 | | |||||||||||||||
a. | Excludes the results of Tenke, which is reported as discontinued operations (refer to Note 2). |
b. | Includes PT-FI's sales to PT Smelting totaling $287 million in second-quarter 2016 and $293 million in second-quarter 2015 . |
c. | Includes revenues from FCX's molybdenum sales company, which includes sales of molybdenum produced by the Molybdenum mines and by certain of the North and South America copper mines. |
d. | Reflects net reductions for provisional pricing adjustments to prior period open sales. There were no intersegment sales from Grasberg in second-quarter 2016 or 2015. |
e. | Includes charges at oil and gas operations totaling $692 million in second-quarter 2016 and $22 million in second-quarter 2015 , primarily associated with drillship settlement/idle rig costs and inventory write-downs. |
f. | Reflects impairment charges for international oil and gas properties primarily in Morocco. |
g. | Includes $37 million for net restructuring charges. |
h. | Includes assets held for sale totaling $4.7 billion at June 30, 2016 and $4.9 billion at June 30, 2015 , associated with discontinued operations (refer to Note 2). |
i. | Includes capital expenditures of $20 million in second-quarter 2016 and $58 million in second-quarter 2015 associated with discontinued operations. |
j. | Excludes international oil and gas capital expenditures totaling $4 million in second-quarter 2016 and $29 million in second-quarter 2015 , primarily related to the Morocco oil and gas properties, which are included in Corporate, Other & Eliminations. |
k. | Includes net mark-to-market gains of $6 million associated with crude oil derivative contracts. |
l. | Includes inventory adjustments totaling $11 million at other North America copper mines, $3 million at Molybdenum mines and $ 45 million at Other Mining & Eliminations. |
24
Table of Contents
|
|
|
|
|
|
|
|
|
|
|
|
|
|
|
|
|
|
|
|
|
|
|
|
|
|
|
|
|
| ||||||||||||||||||||||||||||||
(In millions) | Mining Operations a |
|
|
|
|
|
| ||||||||||||||||||||||||||||||||||||||||||||||||||||
| North America Copper Mines |
| South America |
| Indonesia |
|
|
|
|
|
|
|
|
|
|
|
|
|
|
|
| ||||||||||||||||||||||||||||||||||||||
|
|
|
|
|
|
|
|
|
|
|
|
|
|
|
|
|
|
| Atlantic |
| Other |
|
|
|
|
| Corporate, |
|
| ||||||||||||||||||||||||||||||
|
|
|
|
|
|
|
|
|
|
|
|
|
|
| Molyb- |
|
|
| Copper |
| Mining |
|
|
| U.S. |
| Other |
|
| ||||||||||||||||||||||||||||||
|
|
|
|
|
|
| Cerro |
|
|
|
|
|
|
| denum |
| Rod & |
| Smelting |
| & Elimi- |
| Total |
| Oil & Gas |
| & Elimi- |
| FCX | ||||||||||||||||||||||||||||||
| Morenci |
| Other |
| Total |
| Verde |
| Other |
| Total |
| Grasberg |
| Mines |
| Refining |
| & Refining |
| nations |
| Mining |
| Operations |
| nations |
| Total | ||||||||||||||||||||||||||||||
Six Months Ended June 30, 2016 |
|
|
|
|
|
|
|
|
|
|
|
|
|
|
|
|
|
|
|
|
|
|
|
|
|
|
|
|
| ||||||||||||||||||||||||||||||
Revenues: |
|
|
|
|
|
|
|
|
|
|
|
|
|
|
|
|
|
|
|
|
|
|
|
|
|
|
|
|
| ||||||||||||||||||||||||||||||
Unaffiliated customers | $ | 241 | |
| $ | 99 | |
| $ | 340 | |
| $ | 980 | |
| $ | 267 | |
| $ | 1,247 | |
| $ | 1,030 | | b | $ | - | |
| $ | 1,890 | |
| $ | 915 | |
| $ | 449 | | c | $ | 5,871 | |
| $ | 705 | | | $ | - | |
| $ | 6,576 | |
Intersegment | 761 | |
| 1,095 | |
| 1,856 | |
| 101 | |
| - | |
| 101 | |
| 57 | |
| 90 | |
| 15 | |
| 3 | |
| (2,122 | ) |
| - | |
| - | |
| - | |
| - | | |||||||||||||||
Production and delivery | 638 | |
| 876 | |
| 1,514 | |
| 594 | |
| 222 | |
| 816 | |
| 750 | |
| 102 | |
| 1,889 | |
| 859 | |
| (1,784 | ) |
| 4,146 | |
| 1,296 | | d | 13 | |
| 5,455 | | |||||||||||||||
Depreciation, depletion and amortization | 119 | |
| 159 | |
| 278 | |
| 210 | |
| 58 | |
| 268 | |
| 174 | |
| 36 | |
| 5 | |
| 15 | |
| 38 | |
| 814 | |
| 473 | |
| 7 | |
| 1,294 | | |||||||||||||||
Impairment of oil and gas properties | - | |
| - | |
| - | |
| - | |
| - | |
| - | |
| - | |
| - | |
| - | |
| - | |
| - | |
| - | |
| 4,061 | |
| 17 | | e | 4,078 | | |||||||||||||||
Selling, general and administrative expenses | 1 | |
| 2 | |
| 3 | |
| 4 | |
| - | |
| 4 | |
| 36 | |
| - | |
| - | |
| 8 | |
| 6 | |
| 57 | |
| 130 | | f | 111 | |
| 298 | | |||||||||||||||
Mining exploration and research expenses | - | |
| 1 | |
| 1 | |
| - | |
| - | |
| - | |
| - | |
| - | |
| - | |
| - | |
| 32 | |
| 33 | |
| - | |
| - | |
| 33 | | |||||||||||||||
Environmental obligations and shutdown costs | - | |
| - | |
| - | |
| - | |
| - | |
| - | |
| - | |
| - | |
| - | |
| - | |
| 20 | |
| 20 | |
| - | |
| 1 | |
| 21 | | |||||||||||||||
Net gain on sales of assets | (577 | ) |
| - | |
| (577 | ) |
| - | |
| - | |
| - | |
| - | |
| - | |
| - | |
| - | |
| (172 | ) |
| (749 | ) |
| - | |
| - | |
| (749 | ) | |||||||||||||||
Operating income (loss) | 821 | |
| 156 | |
| 977 | |
| 273 | |
| (13 | ) |
| 260 | |
| 127 | |
| (48 | ) |
| 11 | |
| 36 | |
| 187 | |
| 1,550 | |
| (5,255 | ) |
| (149 | ) |
| (3,854 | ) | |||||||||||||||
|
|
|
|
|
|
|
|
|
|
|
|
|
|
|
|
|
|
|
|
|
|
|
|
|
|
|
|
|
| ||||||||||||||||||||||||||||||
Interest expense, net | 1 | |
| 1 | |
| 2 | |
| 42 | |
| - | |
| 42 | |
| - | |
| - | |
| - | |
| 8 | |
| 39 | |
| 91 | |
| 164 | |
| 132 | |
| 387 | | |||||||||||||||
Provision for (benefit from) income taxes | - | |
| - | |
| - | |
| 90 | |
| (8 | ) |
| 82 | |
| 54 | |
| - | |
| - | |
| - | |
| - | |
| 136 | |
| - | |
| 57 | |
| 193 | | |||||||||||||||
Capital expenditures | 65 | |
| 11 | |
| 76 | |
| 291 | |
| 2 | |
| 293 | |
| 459 | |
| 1 | |
| 1 | |
| 7 | |
| 63 | | g | 900 | |
| 868 | | h | 47 | |
| 1,815 | | |||||||||||||||
|
|
|
|
|
|
|
|
|
|
|
|
|
|
|
|
|
|
|
|
|
|
|
|
|
|
|
|
|
| ||||||||||||||||||||||||||||||
Six Months Ended June 30, 2015 |
|
|
|
|
|
|
|
|
|
|
|
|
|
|
|
|
|
|
|
|
|
|
|
|
|
|
|
|
| ||||||||||||||||||||||||||||||
Revenues: |
|
|
|
|
|
|
|
|
|
|
|
|
|
|
|
|
|
|
|
|
|
|
|
|
|
|
|
|
| ||||||||||||||||||||||||||||||
Unaffiliated customers | $ | 286 | |
| $ | 207 | |
| $ | 493 | |
| $ | 443 | |
| $ | 452 | |
| $ | 895 | |
| $ | 1,413 | | b | $ | - | |
| $ | 2,151 | |
| $ | 1,035 | |
| $ | 653 | | c | $ | 6,640 | |
| $ | 1,069 | | i | $ | - | |
| $ | 7,709 | |
Intersegment | 877 | |
| 1,370 | |
| 2,247 | |
| 51 | |
| (7 | ) | j | 44 | |
| (16 | ) | j | 215 | |
| 15 | |
| 11 | |
| (2,516 | ) |
| - | |
| - | |
| - | |
| - | | |||||||||||||||
Production and delivery | 760 | |
| 1,145 | | k | 1,905 | |
| 363 | |
| 297 | |
| 660 | |
| 894 | |
| 167 | | k | 2,151 | |
| 987 | |
| (2,003 | ) | k | 4,761 | |
| 564 | | d | 5 | |
| 5,330 | | |||||||||||||||
Depreciation, depletion and amortization | 106 | |
| 166 | |
| 272 | |
| 77 | |
| 70 | |
| 147 | |
| 148 | |
| 51 | |
| 5 | |
| 19 | |
| 35 | |
| 677 | |
| 1,015 | |
| 7 | |
| 1,699 | | |||||||||||||||
Impairment of oil and gas properties | - | |
| - | |
| - | |
| - | |
| - | |
| - | |
| - | |
| - | |
| - | |
| - | |
| - | |
| - | |
| 5,790 | |
| - | |
| 5,790 | | |||||||||||||||
Selling, general and administrative expenses | 1 | |
| 2 | |
| 3 | |
| 1 | |
| 1 | |
| 2 | |
| 50 | |
| - | |
| - | |
| 9 | |
| 11 | |
| 75 | |
| 103 | |
| 121 | |
| 299 | | |||||||||||||||
Mining exploration and research expenses | - | |
| 5 | |
| 5 | |
| - | |
| - | |
| - | |
| - | |
| - | |
| - | |
| - | |
| 52 | |
| 57 | |
| - | |
| - | |
| 57 | | |||||||||||||||
Environmental obligations and shutdown costs | - | |
| - | |
| - | |
| - | |
| - | |
| - | |
| - | |
| - | |
| - | |
| - | |
| 24 | |
| 24 | |
| - | |
| - | |
| 24 | | |||||||||||||||
Net gain on sales of assets | - | |
| (39 | ) |
| (39 | ) |
| - | |
| - | |
| - | |
| - | |
| - | |
| - | |
| - | |
| - | |
| (39 | ) |
| - | |
| - | |
| (39 | ) | |||||||||||||||
Operating income (loss) | 296 | |
| 298 | |
| 594 | |
| 53 | |
| 77 | |
| 130 | |
| 305 | |
| (3 | ) |
| 10 | |
| 31 | |
| 18 | |
| 1,085 | |
| (6,403 | ) |
| (133 | ) |
| (5,451 | ) | |||||||||||||||
|
|
|
|
|
|
|
|
|
|
|
|
|
|
|
|
|
|
|
|
|
|
|
|
|
|
|
|
|
| ||||||||||||||||||||||||||||||
Interest expense, net | 1 | |
| 1 | |
| 2 | |
| 1 | |
| - | |
| 1 | |
| - | |
| - | |
| - | |
| 5 | |
| 79 | |
| 87 | |
| 78 | |
| 116 | |
| 281 | | |||||||||||||||
Provision for (benefit from) income taxes | - | |
| - | |
| - | |
| - | |
| 30 | |
| 30 | |
| 124 | |
| - | |
| - | |
| - | |
| - | |
| 154 | |
| - | |
| (1,567 | ) |
| (1,413 | ) | |||||||||||||||
Capital expenditures | 163 | |
| 51 | |
| 214 | |
| 875 | |
| 27 | |
| 902 | |
| 438 | |
| 7 | |
| 1 | |
| 8 | |
| 119 | | g | 1,689 | |
| 1,795 | | h | 44 | |
| 3,528 | | |||||||||||||||
a. | Excludes the results of Tenke, which is reported as discontinued operations (refer to Note 2). |
b. | Includes PT-FI's sales to PT Smelting totaling $564 million for the first six months of 2016 and $643 million for the first six months of 2015 . |
c. | Includes revenues from FCX's molybdenum sales company, which includes sales of molybdenum produced by the Molybdenum mines and by certain of the North and South America copper mines. |
d. | Includes charges at oil and gas operations totaling $892 million for the first six months of 2016 and $39 million for the first six months of 2015 , primarily associated with drillship settlement/idle rig costs and inventory write downs. |
e. | Reflects impairment charges for international oil and gas properties primarily in Morocco. |
f. | Includes $39 million for net restructuring charges. |
g. | Includes capital expenditures of $55 million for the first six months of 2016 and $97 million for the first six months of 2015 associated with discontinued operations. |
h. | Excludes international oil and gas capital expenditures totaling $47 million for the first six months of 2016 and $44 million for the first six months of 2015 , primarily related to the Morocco oil and gas properties, which are included in Corporate, Other & Eliminations. |
i. | Includes net mark-to-market gains of $58 million associated with crude oil derivative contracts. |
j. | Reflects net reductions for provisional pricing adjustments to prior period open sales. There were no intersegment sales from El Abra or Grasberg for the first six months of 2015. |
k. | Includes inventory adjustments totaling $11 million at other North America copper mines, $3 million at Molybdenum mines and $ 49 million at Other Mining & Eliminations for the first six months of 2015 . |
25
Table of Contents
NOTE 11. GUARANTOR FINANCIAL STATEMENTS
All of the senior notes issued by FCX are fully and unconditionally guaranteed on a senior basis jointly and severally by FM O&G LLC, as guarantor, which is a 100 -percent-owned subsidiary of FM O&G and FCX. The guarantee is an unsecured obligation of the guarantor and ranks equal in right of payment with all existing and future indebtedness of FM O&G LLC, including indebtedness under the revolving credit facility. The guarantee ranks senior in right of payment with all of FM O&G LLC's future subordinated obligations and is effectively subordinated in right of payment to any debt of FM O&G LLC's subsidiaries. The indentures provide that FM O&G LLC's guarantee may be released or terminated for certain obligations under the following circumstances: (i) all or substantially all of the equity interests or assets of FM O&G LLC are sold to a third party; or (ii) FM O&G LLC no longer has any obligations under any FM O&G senior notes or any refinancing thereof and no longer guarantees any obligations of FCX under the revolver, the Term Loan or any other senior debt.
The following condensed consolidating financial information includes information regarding FCX, as issuer, FM O&G LLC, as guarantor, and all other non-guarantor subsidiaries of FCX. Included are the condensed consolidating balance sheets at June 30, 2016 , and December 31, 2015 , and the related condensed consolidating statements of comprehensive (loss) income for the three and six months ended June 30, 2016 and 2015 , and cash flows for the six months ended June 30, 2016 and 2015 (in millions), which should be read in conjunction with FCX's notes to the consolidated financial statements.
CONDENSED CONSOLIDATING BALANCE SHEET
June 30, 2016
| FCX |
| FM O&G LLC |
| Non-guarantor |
|
|
| Consolidated | ||||||||||
| Issuer |
| Guarantor |
| Subsidiaries |
| Eliminations |
| FCX | ||||||||||
ASSETS |
|
|
|
|
|
|
|
|
| ||||||||||
Current assets, other than assets held for sale | $ | 267 | |
| $ | 2,792 | |
| $ | 6,902 | |
| $ | (3,927 | ) |
| $ | 6,034 | |
Current assets held for sale | - | |
| - | |
| 4,666 | |
| - | |
| 4,666 | | |||||
Property, plant, equipment and mining development costs, net | 23 | |
| 57 | |
| 23,529 | |
| - | |
| 23,609 | | |||||
Oil and gas properties, net - full cost method: |
|
|
|
|
|
|
|
|
| ||||||||||
Subject to amortization, less accumulated amortization and impairments | - | |
| 356 | |
| 1,025 | |
| - | |
| 1,381 | | |||||
Not subject to amortization | - | |
| 408 | |
| 1,246 | |
| 2 | |
| 1,656 | | |||||
Investments in consolidated subsidiaries | 19,759 | |
| - | |
| - | |
| (19,759 | ) |
| - | | |||||
Other assets | 1,389 | |
| 42 | |
| 3,866 | |
| (1,347 | ) |
| 3,950 | | |||||
Total assets | $ | 21,438 | |
| $ | 3,655 | |
| $ | 41,234 | |
| $ | (25,031 | ) |
| $ | 41,296 | |
|
|
|
|
|
|
|
|
|
| ||||||||||
LIABILITIES AND EQUITY |
|
|
|
|
|
|
|
|
| ||||||||||
Current liabilities, other than liabilities held for sale | $ | 2,811 | |
| $ | 534 | |
| $ | 4,288 | |
| $ | (3,917 | ) |
| $ | 3,716 | |
Current liabilities held for sale | - | |
| - | |
| 824 | |
| - | |
| 824 | | |||||
Long-term debt, less current portion | 13,520 | |
| 7,425 | |
| 12,064 | |
| (14,460 | ) |
| 18,549 | | |||||
Deferred income taxes | 1,064 | | a | - | |
| 2,694 | |
| - | |
| 3,758 | | |||||
Environmental and asset retirement obligations, less current portion | - | |
| 313 | |
| 3,384 | |
| - | |
| 3,697 | | |||||
Investments in consolidated subsidiaries | - | |
| 649 | |
| 8,647 | |
| (9,296 | ) |
| - | | |||||
Other liabilities | 40 | |
| 3,381 | |
| 1,730 | |
| (3,489 | ) |
| 1,662 | | |||||
Total liabilities | 17,435 | |
| 12,302 | |
| 33,631 | |
| (31,162 | ) |
| 32,206 | | |||||
|
|
|
|
|
|
|
|
|
| ||||||||||
Redeemable noncontrolling interest | - | |
| - | |
| 771 | |
| - | |
| 771 | | |||||
|
|
|
|
|
|
|
|
|
| ||||||||||
Equity: |
|
|
|
|
|
|
|
|
| ||||||||||
Stockholders' equity | 4,003 | |
| (8,647 | ) |
| 3,067 | |
| 5,580 | |
| 4,003 | | |||||
Noncontrolling interests | - | |
| - | |
| 3,765 | |
| 551 | |
| 4,316 | | |||||
Total equity | 4,003 | |
| (8,647 | ) |
| 6,832 | |
| 6,131 | |
| 8,319 | | |||||
Total liabilities and equity | $ | 21,438 | |
| $ | 3,655 | |
| $ | 41,234 | |
| $ | (25,031 | ) |
| $ | 41,296 | |
a. | All U.S. related deferred income taxes are recorded at the parent company. |
26
Table of Contents
CONDENSED CONSOLIDATING BALANCE SHEET
December 31, 2015
| FCX |
| FM O&G LLC |
| Non-guarantor |
|
|
| Consolidated | ||||||||||
| Issuer |
| Guarantor |
| Subsidiaries |
| Eliminations |
| FCX | ||||||||||
ASSETS |
|
|
|
|
|
|
|
|
| ||||||||||
Current assets, other than assets held for sale | $ | 181 | |
| $ | 3,831 | |
| $ | 10,238 | |
| $ | (7,532 | ) |
| $ | 6,718 | |
Current assets held for sale | - | |
| - | |
| 744 | |
| - | |
| 744 | | |||||
Property, plant, equipment and mining development costs, net | 26 | |
| 57 | |
| 24,165 | |
| - | |
| 24,248 | | |||||
Oil and gas properties, net - full cost method: |
|
|
|
|
|
|
|
|
| ||||||||||
Subject to amortization, less accumulated amortization and impairments | - | |
| 710 | |
| 1,552 | |
| - | |
| 2,262 | | |||||
Not subject to amortization | - | |
| 1,393 | |
| 3,432 | |
| 6 | |
| 4,831 | | |||||
Investments in consolidated subsidiaries | 24,311 | |
| - | |
| - | |
| (24,311 | ) |
| - | | |||||
Other assets | 5,038 | |
| 1,826 | |
| 3,598 | |
| (6,798 | ) |
| 3,664 | | |||||
Assets held for sale | - | |
| - | |
| 4,110 | |
| - | |
| 4,110 | | |||||
Total assets | $ | 29,556 | |
| $ | 7,817 | |
| $ | 47,839 | |
| $ | (38,635 | ) |
| $ | 46,577 | |
|
|
|
|
|
|
|
|
|
| ||||||||||
LIABILITIES AND EQUITY |
|
|
|
|
|
|
|
|
| ||||||||||
Current liabilities, other than assets held for sale | $ | 6,012 | |
| $ | 666 | |
| $ | 5,047 | |
| $ | (7,526 | ) |
| $ | 4,199 | |
Current liabilities held for sale | - | |
| - | |
| 108 | |
| - | |
| 108 | | |||||
Long-term debt, less current portion | 14,735 | |
| 5,883 | |
| 11,594 | |
| (12,433 | ) |
| 19,779 | | |||||
Deferred income taxes | 941 | | a | - | |
| 2,666 | |
| - | |
| 3,607 | | |||||
Environmental and asset retirement obligations, less current portion | - | |
| 305 | |
| 3,412 | |
| - | |
| 3,717 | | |||||
Investment in consolidated subsidiary | - | |
| - | |
| 2,397 | |
| (2,397 | ) |
| - | | |||||
Other liabilities | 40 | |
| 3,360 | |
| 1,732 | |
| (3,491 | ) |
| 1,641 | | |||||
Liabilities held for sale | - | |
| - | |
| 718 | |
| - | |
| 718 | | |||||
Total liabilities | 21,728 | |
| 10,214 | |
| 27,674 | |
| (25,847 | ) |
| 33,769 | | |||||
|
|
|
|
|
|
|
|
|
| ||||||||||
Redeemable noncontrolling interest | - | |
| - | |
| 764 | |
| - | |
| 764 | | |||||
|
|
|
|
|
|
|
|
|
| ||||||||||
Equity: |
|
|
|
|
|
|
|
|
| ||||||||||
Stockholders' equity | 7,828 | |
| (2,397 | ) |
| 15,725 | |
| (13,328 | ) |
| 7,828 | | |||||
Noncontrolling interests | - | |
| - | |
| 3,676 | |
| 540 | |
| 4,216 | | |||||
Total equity | 7,828 | |
| (2,397 | ) |
| 19,401 | |
| (12,788 | ) |
| 12,044 | | |||||
Total liabilities and equity | $ | 29,556 | |
| $ | 7,817 | |
| $ | 47,839 | |
| $ | (38,635 | ) |
| $ | 46,577 | |
a. | All U.S. related deferred income taxes are recorded at the parent company. |
27
Table of Contents
CONDENSED CONSOLIDATING STATEMENTS OF COMPREHENSIVE (LOSS) INCOME
Three Months Ended June 30, 2016 |
|
|
|
|
|
|
|
|
| ||||||||||
| FCX |
| FM O&G LLC |
| Non-guarantor |
|
|
| Consolidated | ||||||||||
| Issuer |
| Guarantor |
| Subsidiaries |
| Eliminations |
| FCX | ||||||||||
Revenues | $ | - | |
| $ | 106 | |
| $ | 3,228 | |
| $ | - | |
| $ | 3,334 | |
Total costs and expenses | 17 | |
| 964 | | a | 2,335 | | a | - | |
| 3,316 | | |||||
Operating (loss) income | (17 | ) |
| (858 | ) |
| 893 | |
| - | |
| 18 | | |||||
Interest expense, net | (141 | ) |
| (15 | ) |
| (124 | ) |
| 84 | |
| (196 | ) | |||||
Other income (expense), net | 107 | |
| - | |
| 28 | |
| (71 | ) |
| 64 | | |||||
(Loss) income before income taxes and equity in affiliated companies' net (losses) earnings | (51 | ) |
| (873 | ) |
| 797 | |
| 13 | |
| (114 | ) | |||||
(Provision for) benefit from income taxes | (345 | ) |
| 306 | |
| (69 | ) |
| (8 | ) |
| (116 | ) | |||||
Equity in affiliated companies' net (losses) earnings | (90 | ) |
| (280 | ) |
| (853 | ) |
| 1,224 | |
| 1 | | |||||
Net (loss) income from continuing operations | (486 | ) |
| (847 | ) |
| (125 | ) |
| 1,229 | |
| (229 | ) | |||||
Net income (loss) from discontinued operations | 5 | |
| - | |
| (175 | ) |
| (11 | ) |
| (181 | ) | |||||
Net (loss) income | (481 | ) |
| (847 | ) |
| (300 | ) |
| 1,218 | |
| (410 | ) | |||||
Net income and preferred dividends attributable to noncontrolling interests: |
|
|
|
|
|
|
|
|
| ||||||||||
Continuing operations | - | |
| - | |
| (50 | ) |
| (7 | ) |
| (57 | ) | |||||
Discontinued operations | - | |
| - | |
| (12 | ) |
| - | |
| (12 | ) | |||||
Net (loss) income attributable to common stockholders | $ | (481 | ) |
| $ | (847 | ) |
| $ | (362 | ) |
| $ | 1,211 | |
| $ | (479 | ) |
|
|
|
|
|
|
|
|
|
| ||||||||||
Other comprehensive income (loss) | 15 | |
| - | |
| 15 | |
| (15 | ) |
| 15 | | |||||
Total comprehensive (loss) income | $ | (466 | ) |
| $ | (847 | ) |
| $ | (347 | ) |
| $ | 1,196 | |
| $ | (464 | ) |
a. | Includes charges totaling $0.2 billion at the FM O&G LLC guarantor and $0.1 billion at the non-guarantor subsidiaries related to impairment of FCX's oil and gas properties pursuant to full cost accounting rules. |
|
|
|
|
|
|
|
|
|
| ||||||||||
Six Months Ended June 30, 2016 |
|
|
|
|
|
|
|
|
| ||||||||||
| FCX |
| FM O&G LLC |
| Non-guarantor |
|
|
| Consolidated | ||||||||||
| Issuer |
| Guarantor |
| Subsidiaries |
| Eliminations |
| FCX | ||||||||||
Revenues | $ | - | |
| $ | 184 | |
| $ | 6,392 | |
| $ | - | |
| $ | 6,576 | |
Total costs and expenses | 44 | |
| 2,593 | | a | 7,787 | | a | 6 | |
| 10,430 | | |||||
Operating loss | (44 | ) |
| (2,409 | ) |
| (1,395 | ) |
| (6 | ) |
| (3,854 | ) | |||||
Interest expense, net | (278 | ) |
| (19 | ) |
| (238 | ) |
| 148 | |
| (387 | ) | |||||
Other income (expense), net | 157 | |
| - | |
| 68 | |
| (125 | ) |
| 100 | | |||||
(Loss) income before income taxes and equity in affiliated companies' net (losses) earnings | (165 | ) |
| (2,428 | ) |
| (1,565 | ) |
| 17 | |
| (4,141 | ) | |||||
(Provision for) benefit from income taxes | (2,128 | ) |
| 922 | |
| 1,019 | |
| (6 | ) |
| (193 | ) | |||||
Equity in affiliated companies' net (losses) earnings | (2,376 | ) |
| (2,984 | ) |
| (4,483 | ) |
| 9,851 | |
| 8 | | |||||
Net (loss) income from continuing operations | (4,669 | ) |
| (4,490 | ) |
| (5,029 | ) |
| 9,862 | |
| (4,326 | ) | |||||
Net income (loss) from discontinued operations | 5 | |
| - | |
| (169 | ) |
| (21 | ) |
| (185 | ) | |||||
Net (loss) income | (4,664 | ) |
| (4,490 | ) |
| (5,198 | ) |
| 9,841 | |
| (4,511 | ) | |||||
Net income and preferred dividends attributable to noncontrolling interests: |
|
|
|
|
|
|
|
|
| ||||||||||
Continuing operations | - | |
| - | |
| (117 | ) |
| (13 | ) |
| (130 | ) | |||||
Discontinued operations | - | |
| - | |
| (22 | ) |
| - | |
| (22 | ) | |||||
Net (loss) income attributable to common stockholders | $ | (4,664 | ) |
| $ | (4,490 | ) |
| $ | (5,337 | ) |
| $ | 9,828 | |
| $ | (4,663 | ) |
|
|
|
|
|
|
|
|
|
| ||||||||||
Other comprehensive income (loss) | 15 | |
| - | |
| 15 | |
| (15 | ) |
| 15 | | |||||
Total comprehensive (loss) income | $ | (4,649 | ) |
| $ | (4,490 | ) |
| $ | (5,322 | ) |
| $ | 9,813 | |
| $ | (4,648 | ) |
|
|
|
|
|
|
|
|
|
| ||||||||||
a. | Includes charges totaling $1.5 billion at the FM O&G LLC guarantor and $2.6 billion at the non-guarantor subsidiaries related to impairment of FCX's oil and gas properties pursuant to full cost accounting rules. |
28
Table of Contents
CONDENSED CONSOLIDATING STATEMENTS OF COMPREHENSIVE (LOSS) INCOME
Three Months Ended June 30, 2015 |
|
|
|
|
|
|
|
|
| ||||||||||
| FCX |
| FM O&G LLC |
| Non-guarantor |
|
|
| Consolidated | ||||||||||
| Issuer |
| Guarantor |
| Subsidiaries |
| Eliminations |
| FCX | ||||||||||
Revenues | $ | - | |
| $ | 169 | |
| $ | 3,769 | |
| $ | - | |
| $ | 3,938 | |
Total costs and expenses | 19 | |
| 1,217 | | a | 5,120 | | a | 3 | | | 6,359 | | |||||
Operating loss | (19 | ) |
| (1,048 | ) |
| (1,351 | ) |
| (3 | ) |
| (2,421 | ) | |||||
Interest expense, net | (121 | ) |
| (2 | ) |
| (53 | ) |
| 34 | |
| (142 | ) | |||||
Other income (expense), net | 127 | |
| - | |
| (57 | ) |
| (34 | ) |
| 36 | | |||||
Loss before income taxes and equity in affiliated companies' net (losses) earnings | (13 | ) |
| (1,050 | ) |
| (1,461 | ) |
| (3 | ) |
| (2,527 | ) | |||||
(Provision for) benefit from income taxes | (265 | ) |
| 374 | |
| 592 | |
| (2 | ) |
| 699 | | |||||
Equity in affiliated companies' net (losses) earnings | (1,573 | ) |
| (1,920 | ) |
| (2,972 | ) |
| 6,465 | |
| - | | |||||
Net (loss) income from continuing operations | (1,851 | ) |
| (2,596 | ) |
| (3,841 | ) |
| 6,460 | |
| (1,828 | ) | |||||
Net income from discontinued operations | - | |
| - | |
| 22 | |
| 7 | |
| 29 | | |||||
Net (loss) income | (1,851 | ) |
| (2,596 | ) |
| (3,819 | ) |
| 6,467 | |
| (1,799 | ) | |||||
Net income and preferred dividends attributable to noncontrolling interests: |
|
|
|
|
|
|
|
|
| ||||||||||
Continuing operations | - | |
| - | |
| (12 | ) |
| (14 | ) |
| (26 | ) | |||||
Discontinued operations | - | |
| - | |
| (26 | ) |
| - | |
| (26 | ) | |||||
Net (loss) income attributable to common stockholders | $ | (1,851 | ) |
| $ | (2,596 | ) |
| $ | (3,857 | ) |
| $ | 6,453 | |
| $ | (1,851 | ) |
|
|
|
|
|
|
|
|
|
| ||||||||||
Other comprehensive income (loss) | 9 | |
| - | |
| 9 | |
| (9 | ) |
| 9 | | |||||
Total comprehensive (loss) income | $ | (1,842 | ) |
| $ | (2,596 | ) |
| $ | (3,848 | ) |
| $ | 6,444 | |
| $ | (1,842 | ) |
a. | Includes charges totaling $1.0 billion at the FM O&G LLC guarantor and $1.7 billion at the non-guarantor subsidiaries related to impairment of FCX's oil and gas properties pursuant to full cost accounting rules. |
|
|
|
|
|
|
|
|
|
| ||||||||||
Six Months Ended June 30, 2015 |
|
|
|
|
|
|
|
|
| ||||||||||
| FCX |
| FM O&G LLC |
| Non-guarantor |
|
|
| Consolidated | ||||||||||
| Issuer |
| Guarantor |
| Subsidiaries |
| Eliminations |
| FCX | ||||||||||
Revenues | $ | - | |
| $ | 350 | |
| $ | 7,359 | |
| $ | - | |
| $ | 7,709 | |
Total costs and expenses | 35 | |
| 2,535 | | a | 10,603 | | a | (13 | ) | | 13,160 | | |||||
Operating (loss) income | (35 | ) |
| (2,185 | ) |
| (3,244 | ) |
| 13 | |
| (5,451 | ) | |||||
Interest expense, net | (236 | ) |
| (6 | ) |
| (96 | ) |
| 57 | |
| (281 | ) | |||||
Other income (expense), net | 156 | |
| - | |
| (49 | ) |
| (64 | ) |
| 43 | | |||||
(Loss) income before income taxes and equity in affiliated companies' net (losses) earnings | (115 | ) |
| (2,191 | ) |
| (3,389 | ) |
| 6 | |
| (5,689 | ) | |||||
(Provision for) benefit from income taxes | (686 | ) |
| 790 | |
| 1,317 | |
| (8 | ) |
| 1,413 | | |||||
Equity in affiliated companies' net (losses) earnings | (3,524 | ) |
| (4,279 | ) |
| (6,502 | ) |
| 14,306 | |
| 1 | | |||||
Net (loss) income from continuing operations | (4,325 | ) |
| (5,680 | ) |
| (8,574 | ) |
| 14,304 | |
| (4,275 | ) | |||||
Net income from discontinued operations | - | |
| - | |
| 56 | |
| 14 | |
| 70 | | |||||
Net (loss) income | (4,325 | ) |
| (5,680 | ) |
| (8,518 | ) |
| 14,318 | |
| (4,205 | ) | |||||
Net income and preferred dividends attributable to noncontrolling interests: |
|
|
|
|
|
|
|
|
| ||||||||||
Continuing operations | - | |
| - | |
| (42 | ) |
| (26 | ) |
| (68 | ) | |||||
Discontinued operations | - | |
| - | |
| (52 | ) |
| - | |
| (52 | ) | |||||
Net (loss) income attributable to common stockholders | $ | (4,325 | ) |
| $ | (5,680 | ) |
| $ | (8,612 | ) |
| $ | 14,292 | |
| $ | (4,325 | ) |
|
|
|
|
|
|
|
|
|
| ||||||||||
Other comprehensive income (loss) | 21 | |
| - | |
| 21 | |
| (21 | ) |
| 21 | | |||||
Total comprehensive (loss) income | $ | (4,304 | ) |
| $ | (5,680 | ) |
| $ | (8,591 | ) |
| $ | 14,271 | |
| $ | (4,304 | ) |
|
|
|
|
|
|
|
|
|
| ||||||||||
a. | Includes charges totaling $2.1 billion at the FM O&G LLC guarantor and $3.7 billion at the non-guarantor subsidiaries related to impairment of FCX's oil and gas properties pursuant to full cost accounting rules. |
29
Table of Contents
CONDENSED CONSOLIDATING STATEMENT OF CASH FLOWS
Six Months Ended June 30, 2016
| FCX |
| FM O&G LLC |
| Non-guarantor |
|
|
| Consolidated | ||||||||||
| Issuer |
| Guarantor |
| Subsidiaries |
| Eliminations |
| FCX | ||||||||||
Cash flow from operating activities: |
|
|
|
|
|
|
|
|
| ||||||||||
Net (loss) income | $ | (4,664 | ) |
| $ | (4,490 | ) |
| $ | (5,198 | ) |
| $ | 9,841 | |
| $ | (4,511 | ) |
Adjustments to reconcile net (loss) income to net cash (used in) provided by operating activities: |
|
|
|
|
|
|
|
|
| ||||||||||
Depreciation, depletion and amortization | 3 | |
| 92 | |
| 1,293 | |
| (14 | ) |
| 1,374 | | |||||
Impairment of oil and gas properties | - | |
| 1,436 | |
| 2,622 | |
| 20 | |
| 4,078 | | |||||
Equity in losses (earnings) of affiliated companies | 2,375 | |
| 2,985 | |
| 4,483 | |
| (9,851 | ) |
| (8 | ) | |||||
Other, net | 104 | |
| 600 | |
| (489 | ) |
| - | |
| 215 | | |||||
Changes in working capital and other tax payments, excluding amounts from dispositions | 2,009 | |
| (713 | ) |
| (836 | ) |
| 6 | |
| 466 | | |||||
Net cash (used in) provided by operating activities | (173 | ) |
| (90 | ) |
| 1,875 | |
| 2 | |
| 1,614 | | |||||
|
|
|
|
|
|
|
|
|
| ||||||||||
Cash flow from investing activities: |
|
|
|
|
|
|
|
|
| ||||||||||
Capital expenditures | - | |
| (433 | ) |
| (1,380 | ) |
| (2 | ) |
| (1,815 | ) | |||||
Intercompany loans | (994 | ) |
| (493 | ) |
| - | |
| 1,487 | |
| - | | |||||
Dividends from (investments in) consolidated subsidiaries | 1,935 | |
| (41 | ) |
| 78 | |
| (1,972 | ) |
| - | | |||||
Asset sales and other, net | - | |
| 91 | |
| 1,189 | |
| - | |
| 1,280 | | |||||
Net cash provided by (used in) investing activities | 941 | |
| (876 | ) |
| (113 | ) |
| (487 | ) |
| (535 | ) | |||||
|
|
|
|
|
|
|
|
|
| ||||||||||
Cash flow from financing activities: |
|
|
|
|
|
|
|
|
| ||||||||||
Proceeds from debt | 1,505 | |
| - | |
| 1,306 | |
| - | |
| 2,811 | | |||||
Repayments of debt | (2,282 | ) |
| - | |
| (1,367 | ) |
| - | |
| (3,649 | ) | |||||
Intercompany loans | - | |
| 1,018 | |
| 469 | |
| (1,487 | ) |
| - | | |||||
Net proceeds from sale of common stock | 32 | |
| - | |
| 42 | |
| (42 | ) |
| 32 | | |||||
Cash dividends and distributions paid, and contributions received, net | (5 | ) |
| - | |
| (1,989 | ) |
| 1,950 | |
| (44 | ) | |||||
Other, net | (18 | ) |
| (52 | ) |
| (17 | ) |
| 64 | |
| (23 | ) | |||||
Net cash (used in) provided by financing activities | (768 | ) |
| 966 | |
| (1,556 | ) |
| 485 | |
| (873 | ) | |||||
|
|
|
|
|
|
|
|
|
| ||||||||||
Net increase in cash and cash equivalents | - | |
| - | |
| 206 | |
| - | |
| 206 | | |||||
Increase in cash and cash equivalents in assets held for sale | - | |
| - | |
| (49 | ) |
| - | |
| (49 | ) | |||||
Cash and cash equivalents at beginning of period | - | |
| - | |
| 195 | |
| - | |
| 195 | | |||||
Cash and cash equivalents at end of period | $ | - | |
| $ | - | |
| $ | 352 | |
| $ | - | |
| $ | 352 | |
30
Table of Contents
CONDENSED CONSOLIDATING STATEMENT OF CASH FLOWS
Six Months Ended June 30, 2015
| FCX |
| FM O&G LLC |
| Non-guarantor |
|
|
| Consolidated | ||||||||||
| Issuer |
| Guarantor |
| Subsidiaries |
| Eliminations |
| FCX | ||||||||||
Cash flow from operating activities: |
|
|
|
|
|
|
|
|
| ||||||||||
Net (loss) income | $ | (4,325 | ) |
| $ | (5,680 | ) |
| $ | (8,518 | ) |
| $ | 14,318 | |
| $ | (4,205 | ) |
Adjustments to reconcile net (loss) income to net cash (used in) provided by operating activities: |
|
|
|
|
|
|
|
|
| ||||||||||
Depreciation, depletion and amortization | 2 | |
| 223 | |
| 1,638 | |
| (34 | ) |
| 1,829 | | |||||
Impairment of oil and gas properties | - | |
| 2,052 | |
| 3,717 | |
| 21 | |
| 5,790 | | |||||
Net gains on crude oil derivative contracts | - | |
| (58 | ) |
| - | |
| - | |
| (58 | ) | |||||
Equity in losses (earnings) of affiliated companies | 3,524 | |
| 4,279 | |
| 6,502 | |
| (14,306 | ) |
| (1 | ) | |||||
Other, net | (1,431 | ) |
| 9 | |
| 43 | |
| - | |
| (1,379 | ) | |||||
Changes in working capital and other tax payments | 2,222 | |
| (550 | ) |
| (1,870 | ) |
| 8 | |
| (190 | ) | |||||
Net cash (used in) provided by operating activities | (8 | ) |
| 275 | |
| 1,512 | |
| 7 | |
| 1,786 | | |||||
|
|
|
|
|
|
|
|
|
| ||||||||||
Cash flow from investing activities: |
|
|
|
|
|
|
|
|
| ||||||||||
Capital expenditures | - | |
| (734 | ) |
| (2,787 | ) |
| (7 | ) |
| (3,528 | ) | |||||
Intercompany loans | (1,073 | ) |
| (794 | ) |
| - | | | 1,867 | |
| - | | |||||
Dividends from (investments in) consolidated subsidiaries | 438 | |
| (31 | ) |
| 74 | |
| (481 | ) |
| - | | |||||
Other, net | (10 | ) |
| (1 | ) |
| 137 | |
| 10 | |
| 136 | | |||||
Net cash (used in) provided by investing activities | (645 | ) |
| (1,560 | ) |
| (2,576 | ) |
| 1,389 | |
| (3,392 | ) | |||||
|
|
|
|
|
|
|
|
|
| ||||||||||
Cash flow from financing activities: |
|
|
|
|
|
|
|
|
| ||||||||||
Proceeds from debt | 2,735 | |
| - | |
| 1,687 | |
| - | |
| 4,422 | | |||||
Repayments of debt | (1,690 | ) |
| - | |
| (670 | ) |
| - | |
| (2,360 | ) | |||||
Intercompany loans | - | |
| 1,321 | |
| 546 | |
| (1,867 | ) |
| - | | |||||
Cash dividends and distributions paid, and contributions received, net | (380 | ) |
| - | |
| (481 | ) |
| 421 | |
| (440 | ) | |||||
Other, net | (12 | ) |
| (37 | ) |
| (15 | ) |
| 50 | |
| (14 | ) | |||||
Net cash provided by (used in) financing activities | 653 | |
| 1,284 | |
| 1,067 | |
| (1,396 | ) |
| 1,608 | | |||||
|
|
|
|
|
|
|
|
|
| ||||||||||
Net (decrease) increase in cash and cash equivalents | - | |
| (1 | ) |
| 3 | |
| - | |
| 2 | | |||||
Increase in cash and cash equivalents in assets held for sale | - | |
| - | |
| (1 | ) |
| - | |
| (1 | ) | |||||
Cash and cash equivalents at beginning of period | - | |
| 1 | |
| 316 | |
| - | |
| 317 | | |||||
Cash and cash equivalents at end of period | $ | - | |
| $ | - | |
| $ | 318 | |
| $ | - | |
| $ | 318 | |
31
Table of Contents
NOTE 12. NEW ACCOUNTING STANDARDS
In May 2015, the Financial Accounting Standards Board (FASB) issued an ASU that removes the requirement to categorize within the fair value hierarchy all investments for which fair value is measured using the NAV per share (or its equivalent) as a practical expedient. FCX adopted this ASU effective January 1, 2016, and the prior period disclosures have been restated to remove these investments from the levels within the fair value hierarchy (refer to Note 8 ).
In January 2016, FASB issued an ASU that amends the current guidance on the classification and measurement of financial instruments. This ASU makes limited changes to existing guidance and amends certain disclosure requirements. For public entities, this ASU is effective for interim and annual periods beginning after December 15, 2017. Early adoption is not permitted, except for the provision on recording fair value changes for financial liabilities under the fair value option. FCX is currently evaluating the impact this ASU will have on its financial reporting and disclosures, but at this time does not expect the adoption of this ASU will have a material impact on its financial statements.
In February 2016, FASB issued an ASU that will require lessees to recognize most leases on the balance sheet. This ASU allows lessees to make an accounting policy election to not recognize a lease asset and liability for leases with a term of 12 months or less and do not have a purchase option that is expected to be exercised. For public entities, this ASU is effective for interim and annual reporting periods beginning after December 15, 2018, with early adoption permitted. This ASU must be applied using the modified retrospective approach for leases that exist or are entered into after the beginning of the earliest comparative period in the financial statements. FCX is currently evaluating the impact this guidance will have on its financial statements.
In March 2016, FASB issued an ASU that simplifies various aspects of the accounting for share-based payment transactions, including the income tax consequences, statutory tax withholding requirements, an accounting policy election for forfeitures and the classification on the statement of cash flows. For public entities, this ASU is effective for interim and annual periods beginning after December 15, 2016, with early adoption permitted. Each of the amendments in this ASU provides specific transition requirements. FCX is currently evaluating the impact this guidance will have on its financial statements.
NOTE 13. SUBSEQUENT EVENTS
On July 27, 2016 , FCX commenced a new registered at-the-market equity offering of up to $1.5 billion of common stock. From July 27, 2016, through August 4, 2016 , FCX sold 13 million shares of its common stock at an average price of $12.69 per share, which generated gross proceeds of $167 million (proceeds of $166 million net of approximately $1 million of commissions and expenses). FCX will use the proceeds to retire outstanding indebtedness.
FCX evaluated events after June 30, 2016 , and through the date the consolidated financial statements were issued, and determined any events or transactions occurring during this period that would require recognition or disclosure are appropriately addressed in these consolidated financial statements.
32
Table of Contents
REVIEW REPORT OF INDEPENDENT REGISTERED PUBLIC ACCOUNTING FIRM
TO THE BOARD OF DIRECTORS AND STOCKHOLDERS OF
FREEPORT-McMoRan INC.
We have reviewed the consolidated balance sheet of Freeport-McMoRan Inc. as of June 30, 2016 , and the related consolidated statements of operations and comprehensive loss for the three - and six -month periods ended June 30, 2016 and 2015 , the consolidated statements of cash flows for the six -month periods ended June 30, 2016 and 2015 , and the consolidated statement of equity for the six -month period ended June 30, 2016 . These financial statements are the responsibility of the Company's management.
We conducted our review in accordance with the standards of the Public Company Accounting Oversight Board (United States). A review of interim financial information consists principally of applying analytical procedures and making inquiries of persons responsible for financial and accounting matters. It is substantially less in scope than an audit conducted in accordance with the standards of the Public Company Accounting Oversight Board (United States), the objective of which is the expression of an opinion regarding the financial statements taken as a whole. Accordingly, we do not express such an opinion.
Based on our review, we are not aware of any material modifications that should be made to the consolidated financial statements referred to above for them to be in conformity with U.S. generally accepted accounting principles.
We have previously audited, in accordance with the standards of the Public Company Accounting Oversight Board (United States), the consolidated balance sheet of Freeport-McMoRan Inc. as of December 31, 2015 , and the related consolidated statements of operations, comprehensive (loss) income, cash flows and equity for the year then ended (not presented herein) and we expressed an unqualified audit opinion on those consolidated financial statements in our report dated February 26, 2016. As described in Note 2 to the Company's unaudited interim financial statements, the Company has reported the results of operations and financial position of TF Holdings Limited as discontinued operations in the consolidated statements of operations and balance sheets for all periods presented in accordance with the Financial Accounting Standards Board Accounting Standards Codification (ASC) 205-20, Presentation of Financial Statements - Discontinued Operations, and applied the change on a retrospective basis resulting in revision of the December 31, 2015 consolidated balance sheet and the related consolidated statement of operations. We have not audited and reported on the revised balance sheet and statement of operations reflecting the adoption of ASC 205-20.
/s/ ERNST & YOUNG LLP
Phoenix, Arizona
August 5, 2016
33
Table of Contents
Item 2. | Management's Discussion and Analysis of Financial Condition and Results of Operations. |
In Management's Discussion and Analysis of Financial Condition and Results of Operations, "we," "us" and "our" refer to Freeport-McMoRan Inc. (FCX) and its consolidated subsidiaries. You should read this discussion in conjunction with our financial statements, the related Management's Discussion and Analysis of Financial Condition and Results of Operations and the discussion of our Business and Properties in our annual report on Form 10-K for the year ended December 31, 2015 , filed with the United States (U.S.) Securities and Exchange Commission (SEC). The results of operations reported and summarized below are not necessarily indicative of future operating results (refer to "Cautionary Statement" for further discussion). References to "Notes" are Notes included in our Notes to Consolidated Financial Statements. Throughout Management's Discussion and Analysis of Financial Condition and Results of Operations, all references to earnings or losses per share are on a diluted basis. Additionally, in accordance with accounting guidelines, TF Holdings Limited (TFHL) is reported as a discontinued operation for all periods presented.
OVERVIEW
We are a premier U.S.-based natural resources company with an industry-leading global portfolio of mineral assets and significant oil and gas resources. We are the world's largest publicly traded copper producer. Our portfolio of assets includes the Grasberg minerals district in Indonesia, one of the world's largest copper and gold deposits; significant mining operations in the Americas; including the large-scale Morenci minerals district in North America and the Cerro Verde operation in South America; the Tenke Fungurume (Tenke) minerals district in the Democratic Republic of Congo (DRC); and significant U.S. oil and gas assets, principally in the Deepwater Gulf of Mexico (GOM) and in California.
Our results for the second quarter and first six months of 2016 , compared to the 2015 periods, reflected lower price realizations, primarily from copper and oil, and net charges associated with the termination and settlements of drilling rig contracts, partly offset by gains on sales of assets and lower charges associated with the impairment of oil and gas properties. Refer to "Consolidated Results" for further discussion.
At June 30, 2016 , we had $352 million in consolidated cash and cash equivalents and $19.3 billion in total debt. We had no borrowings and $3.5 billion available under our $3.5 billion revolving credit facility. Refer to Note 6 for further discussion of debt.
We previously announced plans to reduce debt and restore our balance sheet strength through a combination of asset sale transactions, cash flow from operations and potential capital market transactions. During second-quarter 2016, we completed asset sales for aggregate cash consideration of $1.3 billion, primarily including the $1.0 billion sale of an additional 13 percent undivided interest in Morenci (the Morenci transaction), the sale of an interest in the Timok exploration project in Serbia (the Timok transaction) and the sale of certain oil and gas royalty interests. Additionally, in July 2016 we completed the sale of the Haynesville shale assets for $87 million (before closing adjustments), and in May 2016 we entered into a definitive agreement to sell our interest in TFHL for $2.65 billion in cash and contingent consideration of up to $120 million, which is expected to close in fourth-quarter 2016, subject to regulatory and other approvals. Refer to Note 2 for further discussion of these transactions. FCX continues to aggressively manage production, exploration and administrative costs, and capital spending.
During second-quarter 2016, we restructured our oil and gas business to reduce costs and align capital allocation for the business with corporate debt reduction initiatives. During second-quarter 2016, we terminated contracts for Freeport-McMoRan Oil & Gas LLC's (FM O&G) deepwater drillships, and settled aggregate commitments totaling $1.1 billion for $755 million, of which $540 million was funded with shares of our common stock. We also agreed to provide contingent payments of up to $105 million, depending on the average price of crude oil over the 12-month period ending June 30, 2017. A net charge of $0.6 billion was recorded in second-quarter 2016 associated with the termination of these contracts. Refer to "Operations - Oil and Gas" for further discussion.
Through August 4, 2016, we have retired $369 million of our senior notes through a series of privately negotiated exchanges for 28 million shares of our common stock (including $268 million during second-quarter 2016, which resulted in a $39 million gain on early extinguishment of debt). These transactions will reduce annual interest expense by $17 million. Refer to Note 6 for further discussion of these exchanges. We will continue to evaluate opportunities for transactions, which may include open-market purchases of our debt, debt for debt exchanges, and privately negotiated exchanges of our debt for equity or equity-linked securities. We may also issue additional debt or convertible securities to repay or refinance existing debt. The completion and amount of these transactions, if
34
Table of Contents
any, are subject to a number of factors, including market conditions, our financial position and our ability to complete such transactions on economically attractive terms.
On July 27, 2016, we commenced a new registered at-the-market offering of up to $1.5 billion of our common stock. Through August 4, 2016 , we have sold 13 million shares of our common stock for gross proceeds of $167 million ( $12.69 per share average price). Refer to Note 13 for further discussion. We believe the proceeds of this offering, together with previously announced asset sale transactions and anticipated cash flow from operations, will enable us to reduce debt.
While additional asset sales may be considered, including potential sales of oil and gas properties, we remain focused on retaining a high-quality portfolio of long-lived copper assets positioned to generate value as market conditions improve. In addition to debt reduction plans, we are pursuing opportunities to create additional value through mine designs that would increase copper reserves, reduce costs and provide opportunities to enhance net present values, and we continue to advance studies for future development of our copper resources, the timing of which will be dependent on market conditions.
OUTLOOK
We view the long-term outlook for our business positively, supported by limitations on supplies of copper and by the requirements for copper and oil in the world's economy. Our financial results vary as a result of fluctuations in market prices, primarily for copper, gold, molybdenum and oil, as well as other factors. World market prices for these commodities have fluctuated historically and are affected by numerous factors beyond our control. Because we cannot control the price of our products, the key measures that management focuses on in operating our business are sales volumes, unit net cash costs for our mining operations, cash production costs per barrel of oil equivalents (BOE) for our oil and gas operations, operating cash flow and capital expenditures.
Projections and other forward-looking statements included in this quarterly report on Form 10-Q assume renewal of PT Freeport Indonesia's (PT-FI) export permit after August 8, 2016, and a resolution with respect to Indonesian regulations prohibiting concentrate exports after January 12, 2017. Additionally, projections for or including Tenke are through the anticipated closing date in fourth-quarter 2016.
Sales Volumes
Following are our projected consolidated sales volumes for the year 2016 :
Copper (millions of recoverable pounds): |
|
| |
North America copper mines | 1,830 | |
|
South America mining | 1,360 | |
|
Indonesia mining | 1,320 | |
|
Consolidated - continuing operations | 4,510 | |
|
Discontinued operations - Africa mining | 440 | |
|
Total | 4,950 | |
|
Gold (thousands of recoverable ounces) | 1,700 | |
|
Molybdenum (millions of recoverable pounds) | 76 | | a |
Oil Equivalents (million BOE or MMBOE) | 47.4 | |
|
a. | Projected molybdenum sales include 25 million pounds produced by our Molybdenum mines and 51 million pounds produced by our North and South America copper mines. |
Consolidated sales volumes for third-quarter 2016 (excluding 115 million pounds of copper for Tenke) are expected to approximate 1.2 billion pounds of copper, 410 thousand ounces of gold, 20 million pounds of molybdenum and 11.4 MMBOE. Anticipated higher ore grades from the Grasberg mine are expected to result in approximately 30 percent of 2016 copper sales and 55 percent of 2016 gold sales occurring in fourth-quarter 2016. Projected sales volumes are dependent on operational performance and other factors. For other important factors that could cause results to differ materially from projections, refer to "Cautionary Statement."
35
Table of Contents
Mining Unit Net Cash Costs
Assuming average prices of $1,300 per ounce of gold and $6 per pound of molybdenum for the second half of 2016 , and achievement of current sales volume and cost estimates, consolidated unit net cash costs (net of by-product credits) for our copper mines (excluding Tenke) are expected to average $1.03 per pound of copper for the year 2016 . Including the Tenke mine, mining unit net cash costs for the year 2016 are expected to average $1.06 per pound of copper. The impact of price changes for the second half of 2016 on consolidated unit net cash costs would approximate $0.015 per pound for each $50 per ounce change in the average price of gold and $0.01 per pound for each $2 per pound change in the average price of molybdenum. Quarterly unit net cash costs vary with fluctuations in sales volumes and realized prices primarily for gold and molybdenum. Refer to "Consolidated Results – Production and Delivery Costs" for further discussion of consolidated production and delivery costs for our mining operations.
Oil and Gas Cash Production Costs per BOE
Based on current sales volume and cost estimates, cash production costs for our oil and gas operations are expected to approximate $15.50 per BOE for the year 2016 . Refer to "Operations – Oil and Gas" for further discussion of oil and gas production costs.
Consolidated Operating Cash Flow
Our consolidated operating cash flows vary with volumes, prices realized from copper, gold, molybdenum and oil sales, production costs, income taxes, other working capital changes and other factors. Based on current sales volume and cost estimates, and assuming average prices of $2.25 per pound of copper, $1,300 per ounce of gold, $6 per pound of molybdenum and $48 per barrel of Brent crude oil for the second half of 2016 , consolidated operating cash flows are estimated to approximate $4.5 billion for the year 2016 (including $0.7 billion in working capital sources and other tax payments). Projected consolidated operating cash flows for the year 2016 also reflect an estimated income tax provision of $1.2 billion, primarily associated with income from our international mining operations (refer to "Consolidated Results - Income Taxes" for further discussion of our projected income tax rate for the year 2016). The impact of price changes for the second half of 2016 on operating cash flows would approximate $260 million for each $0.10 per pound change in the average price of copper, $40 million for each $50 per ounce change in the average price of gold, $35 million for each $2 per pound change in the average price of molybdenum and $55 million for each $5 per barrel change in the average Brent crude oil price.
Consolidated Capital Expenditures
Consolidated capital expenditures are expected to approximate $3.1 billion for the year 2016, consisting of $1.7 billion for mining operations (including $1.3 billion for major projects, primarily for underground development activities at Grasberg and remaining costs for the Cerro Verde expansion) and $1.4 billion for oil and gas operations.
36
Table of Contents
MARKETS
Metals
World prices for copper, gold and molybdenum can fluctuate significantly. During the period from January 2006 through July 2016 , the London Metal Exchange (LME) spot copper price varied from a low of $1.26 per pound in 2008 to a record high of $4.60 per pound in 2011; the London Bullion Market Association (London) PM gold price fluctuated from a low of $525 per ounce in 2006 to a record high of $1,895 per ounce in 2011; and the Metals Week Molybdenum Dealer Oxide weekly average price ranged from a low of $4.46 per pound in 2015 to a high of $33.88 per pound in 2008. Copper, gold and molybdenum prices are affected by numerous factors beyond our control as described further in "Risk Factors" contained in Part I, Item 1A. of our annual report on Form 10-K for the year ended December 31, 2015 .
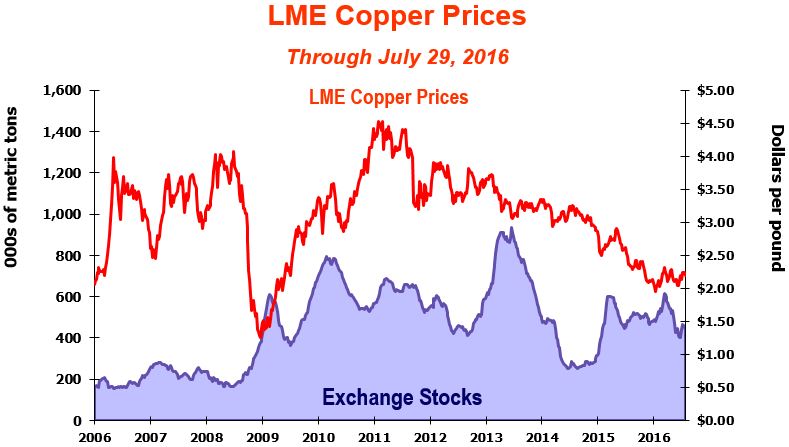
This graph presents LME spot copper prices and the combined reported stocks of copper at the LME, Commodity Exchange Inc. (COMEX), a division of the New York Mercantile Exchange (NYMEX), and the Shanghai Futures Exchange from January 2006 through July 2016 . Since mid-2014, copper prices have declined because of concerns about slowing growth rates in China, a stronger U.S. dollar and a broad-based decline in commodity prices. During second-quarter 2016 , LME spot copper prices ranged from a low of $2.04 per pound to a high of $2.29 per pound, averaged $2.14 per pound and closed at $2.19 per pound on June 30, 2016 . The LME spot copper price was $2.20 per pound on July 29, 2016 .
We believe the underlying long-term fundamentals of the copper business remain positive, supported by the significant role of copper in the global economy and a challenging long-term supply environment attributable to difficulty in replacing output of existing large mines with new production sources. Future copper prices are expected to be volatile and are likely to be influenced by demand from China and emerging markets, as well as economic activity in the U.S. and other industrialized countries, the timing of the development of new supplies of copper, and production levels of mines and copper smelters.
37
Table of Contents
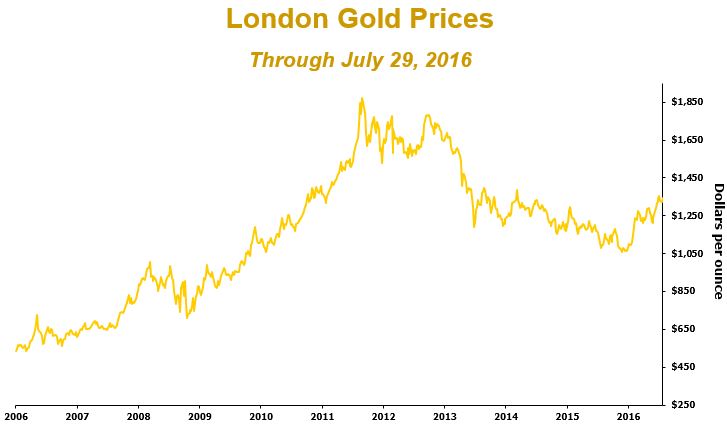
This graph presents London PM gold prices from January 2006 through July 2016 . An improving economic outlook, stronger U.S. dollar and positive equity performance contributed to lower demand for gold in 2014 and 2015, resulting in lower prices. During second-quarter 2016 , London PM gold prices ranged from a low of $1,212 per ounce to a high of $1,325 per ounce, averaged $1,260 per ounce and closed at $1,321 per ounce on June 30, 2016 . The London PM gold price was $1,342 per ounce on July 29, 2016 .
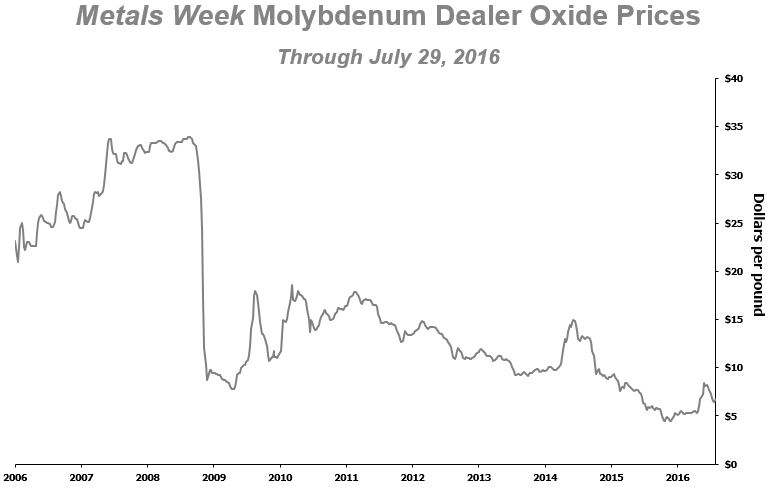
This graph presents the Metals Week Molybdenum Dealer Oxide weekly average prices from January 2006 through July 2016 . Molybdenum prices have declined since mid-2014 because of weaker demand from global steel and stainless steel producers. During second-quarter 2016 , the weekly average price of molybdenum ranged from a low of $5.35 per pound to a high of $8.47 per pound, averaged $6.88 per pound and was $7.70 on June 30, 2016 . The Metals Week Molybdenum Dealer Oxide weekly average price was $6.77 per pound on July 29, 2016 .
38
Table of Contents
Oil and Gas
Market prices for crude oil and natural gas can fluctuate significantly. During the period from January 2006 through July 2016 , the Brent crude oil price ranged from a low of $27.88 per barrel in 2016 to a high of $146.08 per barrel in 2008 and the NYMEX natural gas price fluctuated from a low of $1.71 per million British thermal units (MMBtu) in 2016 to a high of $13.11 per MMBtu in 2008. Crude oil and natural gas prices are affected by numerous factors beyond our control as described further in "Risk Factors" contained in Part I, Item 1A. of our annual report on Form 10-K for the year ended December 31, 2015 .
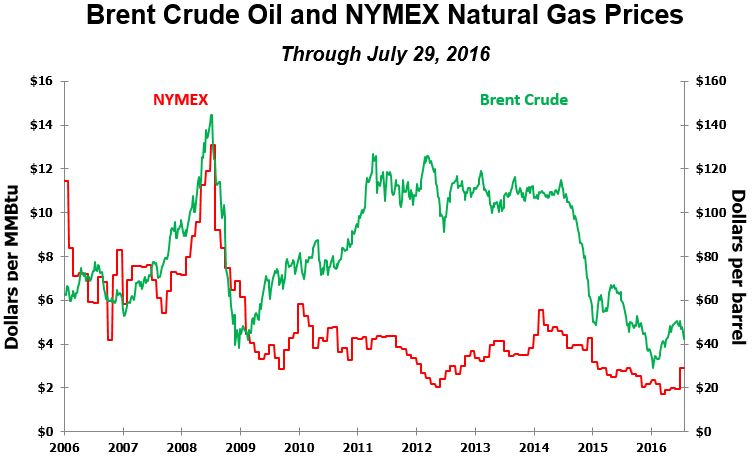
This graph presents Brent crude oil prices and NYMEX natural gas contract prices from January 2006 through July 2016 . Since mid-2014, oil prices have significantly declined in connection with concerns of global oversupply. During second-quarter 2016 , the Brent crude oil price ranged from a low of $37.69 per barrel to a high of $52.51 per barrel, averaged $47.03 per barrel and was $49.68 per barrel on June 30, 2016 . The Brent crude oil price was $42.46 per barrel on July 29, 2016 .
39
Table of Contents
CONSOLIDATED RESULTS
| Three Months Ended June 30, |
| Six Months Ended June 30, |
| ||||||||||||
| 2016 |
| 2015 |
| 2016 |
| 2015 |
| ||||||||
SUMMARY FINANCIAL DATA | (in millions, except per share amounts) |
| ||||||||||||||
Revenues a,b | $ | 3,334 | |
| $ | 3,938 | | c | $ | 6,576 | |
| $ | 7,709 | | c |
Operating income (loss) a,d,e,f | $ | 18 | | g | $ | (2,421 | ) |
| $ | (3,854 | ) | g | $ | (5,451 | ) | g |
Net loss from continuing operations h | $ | (229 | ) | i,j | $ | (1,828 | ) | k | $ | (4,326 | ) | i,j | $ | (4,275 | ) | k |
Net (loss) income from discontinued operations l | $ | (181 | ) |
| $ | 29 | |
| $ | (185 | ) |
| $ | 70 | |
|
Net loss attributable to common stock | $ | (479 | ) | | $ | (1,851 | ) | | $ | (4,663 | ) |
| $ | (4,325 | ) |
|
Diluted net loss per share of common stock: |
|
|
|
|
|
|
|
| ||||||||
Continuing operations | $ | (0.23 | ) |
| $ | (1.78 | ) |
| $ | (3.54 | ) |
| $ | (4.18 | ) |
|
Discontinued operations | (0.15 | ) |
| - | |
| (0.16 | ) |
| 0.02 | |
| ||||
| $ | (0.38 | ) | | $ | (1.78 | ) | | $ | (3.70 | ) |
| $ | (4.16 | ) |
|
Diluted weighted-average common shares outstanding | 1,269 | |
| 1,040 | |
| 1,260 | |
| 1,040 | |
| ||||
Operating cash flows m | $ | 874 | | | $ | 1,069 | | | $ | 1,614 | | | $ | 1,786 | | |
Capital expenditures | $ | 833 | |
| $ | 1,661 | |
| $ | 1,815 | |
| $ | 3,528 | |
|
At June 30: |
|
|
|
|
|
|
|
| ||||||||
Cash and cash equivalents | $ | 352 | |
| $ | 318 | |
| $ | 352 | |
| $ | 318 | |
|
Total debt, including current portion | $ | 19,319 | |
| $ | 20,902 | |
| $ | 19,319 | |
| $ | 20,902 | |
|
|
|
|
|
|
|
|
|
| ||||||||
| Three Months Ended June 30, |
| Six Months Ended June 30, |
| ||||||||||||
Revenues | 2016 |
| 2015 |
| 2016 |
| 2015 |
| ||||||||
North America copper mines | $ | 1,060 | |
| $ | 1,405 | |
| $ | 2,196 | |
| $ | 2,740 | |
|
South America mining | 677 | |
| 453 | |
| 1,348 | |
| 939 | |
| ||||
Indonesia mining | 531 | |
| 790 | |
| 1,087 | |
| 1,397 | |
| ||||
Molybdenum mines | 45 | |
| 102 | |
| 90 | |
| 215 | |
| ||||
Rod & Refining | 926 | |
| 1,097 | |
| 1,905 | |
| 2,166 | |
| ||||
Atlantic Copper Smelting & Refining | 495 | |
| 500 | |
| 918 | |
| 1,046 | |
| ||||
U.S. oil & gas operations | 410 | |
| 569 | |
| 705 | |
| 1,069 | |
| ||||
Other mining & eliminations | (810 | ) |
| (978 | ) |
| (1,673 | ) |
| (1,863 | ) |
| ||||
Total revenues | $ | 3,334 | |
| $ | 3,938 | |
| $ | 6,576 | |
| $ | 7,709 | |
|
|
|
|
|
|
|
|
|
| ||||||||
Operating income (loss) |
|
|
|
|
|
|
|
| ||||||||
North America copper mines | $ | 775 | |
| $ | 300 | |
| $ | 977 | |
| $ | 594 | |
|
South America mining | 133 | |
| 65 | |
| 260 | |
| 130 | |
| ||||
Indonesia mining | 60 | |
| 232 | |
| 127 | |
| 305 | |
| ||||
Molybdenum mines | (22 | ) |
| (7 | ) |
| (48 | ) |
| (3 | ) |
| ||||
Rod & Refining | 4 | |
| 6 | |
| 11 | |
| 10 | |
| ||||
Atlantic Copper Smelting & Refining | 18 | |
| 19 | |
| 36 | |
| 31 | |
| ||||
U.S. oil & gas operations | (1,068 | ) |
| (2,932 | ) |
| (5,255 | ) |
| (6,403 | ) |
| ||||
Other mining, corporate, other & eliminations | 118 | |
| (104 | ) |
| 38 | |
| (115 | ) |
| ||||
Total operating income (loss) | $ | 18 | |
| $ | (2,421 | ) |
| $ | (3,854 | ) |
| $ | (5,451 | ) |
|
b. | Includes (unfavorable) favorable adjustments to provisionally priced concentrate and cathode copper sales recognized in prior periods totaling $(28) million ( $(15) million to net loss attributable to common stock from continuing operations or $(0.01) per share) in second-quarter 2016 , $(22) million ( $(11) million to net loss attributable to common stock from continuing operations or $(0.01) per share) in second-quarter 2015 , $5 million ( $2 million to net loss attributable to common stock from continuing operations or less than $0.01 per share) for the first six months of 2016 and $(99) million ( $(47) million to net loss attributable to common stock from continuing operations or $(0.04) per share) for the first six months of 2015 . Refer to "Revenues" for further discussion. |
c. | Includes net noncash mark-to-market losses associated with crude oil derivative contracts totaling $95 million ( $59 million to net loss attributable to common stock or $0.06 per share) in second-quarter 2015 and $143 million ( $89 million to net loss attributable to common stock or $0.09 per share) for the first six months of 2015 . We currently do not have oil and gas derivative contracts in place for 2016 or future years. |
40
Table of Contents
d. | Includes the following charges to reduce the carrying value of oil and gas properties pursuant to full cost accounting rules (in millions, except per share amounts): |
| Three Months Ended June 30, |
| Six Months Ended June 30, |
| ||||||||||||
| 2016 |
| 2015 |
| 2016 |
| 2015 |
| ||||||||
Operating income (loss) | $ | 291 | |
| $ | 2,686 | |
| $ | 4,078 | |
| $ | 5,790 | |
|
Net loss attributable to common stock | $ | 291 | |
| $ | 1,975 | |
| $ | 4,078 | |
| $ | 4,374 | |
|
Net loss per share of common stock | $ | 0.23 | |
| $ | 1.90 | |
| $ | 3.24 | |
| $ | 4.20 | |
|
As a result of impairments to oil and gas properties, we recorded tax charges to establish valuation allowances against U.S. federal and state deferred tax assets that will not generate a future benefit, which have been reflected in the after-tax impacts for the impairment of oil and gas properties (refer to "Income Taxes" for these amounts).
e. | Includes the following charges at oil and gas operations associated with drillship settlements and idle rig costs (in millions, except per share amounts): |
| Three Months Ended June 30, |
| Six Months Ended June 30, |
| ||||||||||||
| 2016 |
| 2015 |
| 2016 |
| 2015 |
| ||||||||
Operating income (loss) | $ | 639 | |
| $ | 3 | |
| $ | 804 | |
| $ | 16 | |
|
Net loss attributable to common stock | $ | 639 | |
| $ | 2 | |
| $ | 804 | |
| $ | 10 | |
|
Net loss per share of common stock | $ | 0.50 | |
| $ | - | |
| $ | 0.64 | |
| $ | 0.01 | |
|
Also includes charges for (i) inventory write downs totaling $53 million ( $53 million to net loss attributable to common stock or $0.04 per share) in second-quarter 2016 , $19 million ( $12 million to net loss attributable to common stock or $0.01 per share) in second-quarter 2015 , $88 million ( $88 million to net loss attributable to common stock or $0.07 per share) for the first six months of 2016 and $23 million ( $14 million to net loss attributable to common stock or $0.01 per share) for the first six months of 2015 , and (ii) restructuring and other charges totaling $37 million ( $37 million to net loss attributable to common stock or $0.03 per share) in second-quarter 2016 and $39 million ( $39 million to net loss attributable to common stock or $0.03 per share) for the first six months of 2016 .
f. | Includes net charges at mining operations for adjustments to inventories totaling $2 million ( $2 million to net loss attributable to common stock or less than $0.01 per share) for second-quarter 2016 , $59 million ( $38 million to net loss attributable to common stock or $0.04 per share) for second-quarter 2015 , $7 million ( $7 million to net loss attributable to common stock or $0.01 per share) for the first six months of 2016 , and $63 million ( $41 million to net loss attributable to common stock or $0.04 per share) for the first six months of 2015 . |
g. | Includes net gains on sales of assets totaling $749 million ( $744 million to net loss attributable to common stock or $0.59 per share) for the second quarter and first six months of 2016 , primarily associated with the Morenci and Timok transactions and $39 million ( $25 million to net loss attributable to common stock or $0.02 per share) for the first six months of 2015 associated with the sale of our interest in the Luna Energy power facility. Refer to Note 2 for further discussion of the 2016 dispositions. |
h. | We defer recognizing profits on intercompany sales until final sales to third parties occur. Refer to "Operations - Smelting & Refining" for a summary of net impacts from changes in these deferrals. |
i. | Includes a net gain on early extinguishment of debt of $39 million ( $39 million to net loss attributable to common stock or $0.03 per share) in second-quarter 2016 and $36 million ( $36 million to net loss attributable to common stock or $0.03 per share) for the first six months of 2016. Refer to Note 6 for further discussion. |
j. | Includes net tax charges of $36 million ( $0.03 per share) for the second quarter and first six months of 2016, comprised of$96 million related to the reversal of income tax benefits recognized in 2015 for carryback claims, partly offset by a tax benefit of $60 million associated with our election to monetize alternative minimum tax credits. |
k. | Includes a gain of $92 million ( $92 million to net loss attributable to common stock or $0.09 per share) for the second quarter and first six months of 2015 related to the proceeds received from insurance carriers and other third parties related to a shareholder derivative litigation settlement. |
l. | Net (loss) income from discontinued operations includes charges for (i) allocated interest expense totaling $11 million in second-quarter 2016 , $7 million in second-quarter 2015 , $21 million for the first six months of 2016 and $14 million for the first six months of 2015 associated with the portion of our Term Loan that is required to be repaid as a result of the sale of our interest in Tenke and (ii) an income tax (benefit) provision totaling $(16) million in second-quarter 2016 , $12 million in second-quarter 2015 , $(23) million for the first six months of 2016 and $31 million for the first six months of 2015 . In accordance with accounting guidelines, the second quarter and first six months of 2016 are also net of $177 million for the estimated loss on disposal, which will be adjusted through closing of the transaction. |
m. | Includes net working capital sources (uses) and changes in other tax payments of $278 million in second-quarter 2016 , $(104) million in second-quarter 2015 , $466 million for the first six months of 2016 and $(190) million for the first six months of 2015 . |
41
Table of Contents
| Three Months Ended June 30, |
| Six Months Ended June 30, |
| ||||||||||||
| 2016 |
| 2015 |
| 2016 |
| 2015 |
| ||||||||
SUMMARY OPERATING DATA |
|
|
|
|
|
| ||||||||||
Copper (millions of recoverable pounds) a |
|
|
|
|
|
|
|
| ||||||||
Production | 1,011 | |
| 862 | |
| 1,998 | |
| 1,661 | |
| ||||
Sales, excluding purchases | 987 | |
| 860 | |
| 1,987 | |
| 1,687 | |
| ||||
Average realized price per pound | $ | 2.19 | |
| $ | 2.72 | |
| $ | 2.17 | |
| $ | 2.71 | |
|
Site production and delivery costs per pound b | $ | 1.41 | |
| $ | 1.89 | |
| $ | 1.45 | |
| $ | 1.93 | |
|
Unit net cash costs per pound b | $ | 1.33 | |
| $ | 1.56 | |
| $ | 1.36 | |
| $ | 1.63 | |
|
Gold (thousands of recoverable ounces) |
|
|
|
|
|
|
|
| ||||||||
Production | 166 | |
| 367 | |
| 350 | |
| 626 | |
| ||||
Sales, excluding purchases | 156 | |
| 352 | |
| 357 | |
| 615 | |
| ||||
Average realized price per ounce | $ | 1,292 | |
| $ | 1,174 | |
| $ | 1,259 | |
| $ | 1,183 | |
|
Molybdenum (millions of recoverable pounds) |
|
|
|
|
|
|
|
| ||||||||
Production | 19 | |
| 25 | |
| 39 | |
| 49 | |
| ||||
Sales, excluding purchases | 19 | |
| 23 | |
| 36 | |
| 46 | |
| ||||
Average realized price per pound | $ | 8.34 | |
| $ | 9.51 | |
| $ | 7.99 | |
| $ | 9.84 | |
|
Oil Equivalents |
|
|
|
|
|
|
|
| ||||||||
Sales volumes |
|
|
|
|
|
|
|
| ||||||||
MMBOE | 12.4 | |
| 13.1 | |
| 24.5 | |
| 25.6 | |
| ||||
Thousand BOE (MBOE) per day | 136 | |
| 144 | |
| 135 | |
| 142 | |
| ||||
Cash operating margin per BOE c |
|
|
|
|
|
|
|
| ||||||||
Realized revenues | $ | 32.70 | |
| $ | 50.04 | | d | $ | 28.29 | |
| $ | 46.95 | | d |
Cash production costs | (15.00 | ) |
| (19.04 | ) |
| (15.42 | ) |
| (19.62 | ) |
| ||||
Cash operating margin | $ | 17.70 | |
| $ | 31.00 | |
| $ | 12.87 | |
| $ | 27.33 | |
|
a. | Excludes production and sales volumes from the Tenke mine, which is reported as a discontinued operation. Copper sales volumes from the Tenke mine totaled 124 million pounds in second-quarter 2016 , 104 million pounds in second-quarter 2015 , 247 million pounds for the first six months of 2016 and 237 million pounds for the first six months of 2015 . Refer to "Discontinued Operations" for discussion of Tenke's operating results. |
b. | Reflects per pound weighted-average production and delivery costs and unit net cash costs (net of by-product credits) for all copper mines (excluding Tenke), before net noncash and other costs. Including the Tenke mine, mining unit net cash costs averaged $1.33 per pound in second-quarter 2016 , $1.50 per pound in second-quarter 2015 , $1.35 per pound for the first six months of 2016 and $1.57 per pound for the first six months of 2015 . For reconciliations of per pound unit costs by operating division to production and delivery costs applicable to sales reported in our consolidated financial statements, refer to "Product Revenues and Production Costs." |
c. | Cash operating margin for oil and gas operations reflects realized revenues less cash production costs. Cash production costs exclude accretion and other costs. For reconciliations of realized revenues and cash production costs per BOE to revenues and production and delivery costs reported in our consolidated financial statements, refer to "Product Revenues and Production Costs." |
d. | Includes realized cash gains on crude oil derivative contracts of $7.73 per BOE in second-quarter 2015 and $7.87 per BOE for the first six months of 2015 . We currently do not have oil or gas derivative contracts in place for 2016 or future years. |
Revenues
Consolidated revenues totaled $3.3 billion in second-quarter 2016 and $6.6 billion for the first six months of 2016 , compared with $3.9 billion in second-quarter 2015 and $7.7 billion for the first six months of 2015 . Revenues from our mining operations primarily include the sale of copper concentrate, copper cathode, copper rod, gold and molybdenum. During the first six months of 2016 , our mined copper (excluding volumes from Tenke) was sold 53 percent in concentrate, 23 percent as cathode and 24 percent as rod from North America operations. Revenues from our oil and gas operations include the sale of oil, natural gas and natural gas liquids (NGLs). During the first six months of 2016 , approximately 90 percent of our oil and gas revenues were from oil and NGLs.
42
Table of Contents
Following is a summary of changes in our consolidated revenues between periods (in millions):
| Three Months Ended June 30 |
| Six Months Ended June 30 | ||||
|
|
|
| ||||
Revenues - 2015 period | $ | 3,938 | |
| $ | 7,709 | |
Mining operations: |
|
|
| ||||
Higher (lower) sales volumes: |
|
|
| ||||
Copper | 345 | |
| 815 | | ||
Gold | (229 | ) |
| (305 | ) | ||
Molybdenum | (39 | ) |
| (105 | ) | ||
(Lower) higher average realized prices: |
|
|
| ||||
Copper | (523 | ) |
| (1,073 | ) | ||
Gold | 19 | |
| 27 | | ||
Molybdenum | (22 | ) |
| (66 | ) | ||
Net adjustments for prior period provisionally priced copper sales | (6 | ) |
| 104 | | ||
Higher (lower) revenues from purchased copper | 20 | |
| (23 | ) | ||
Lower Atlantic Copper revenues | (5 | ) |
| (128 | ) | ||
Oil and gas operations: |
|
|
| ||||
Higher (lower) oil sales volumes | 3 | |
| (1 | ) | ||
Lower oil average realized price, excluding derivative contracts | (127 | ) |
| (255 | ) | ||
Net mark-to-market gains on crude oil derivative contracts for 2015 periods | (6 | ) |
| (58 | ) | ||
Other, including intercompany eliminations | (34 | ) |
| (65 | ) | ||
Revenues - 2016 period | $ | 3,334 | |
| $ | 6,576 | |
|
|
|
| ||||
Mining Operations
Sales Volumes. Consolidated copper sales increased to 987 million pounds in second-quarter 2016 and 2.0 billion for the first six months of 2016 , compared with 860 million pounds in second-quarter 2015 and 1.7 billion for the first six months of 2015 , primarily reflecting higher volumes from Cerro Verde.
Consolidated gold sales volumes decreased to 156 thousand ounces in second-quarter 2016 and 357 thousand for the first six months of 2016 , compared with 352 thousand ounces in second-quarter 2015 and 615 thousand for the first six months of 2015 , primarily reflecting lower ore grades and lower mining and milling rates in Indonesia.
Consolidated molybdenum sales volumes decreased to 19 million pounds in second-quarter 2016 and 36 million for the first six months of 2016 , compared with 23 million pounds in second-quarter 2015 and 46 million for the first six months of 2015 , primarily reflecting market-driven curtailed production volumes from the primary molybdenum mines.
Refer to "Operations" for further discussion of sales volumes at our mining operations.
Metals Realized Prices. Our consolidated revenues can vary significantly as a result of fluctuations in the market prices of copper, gold and molybdenum, and to a lesser extent silver. Second-quarter 2016 average realized prices, compared with second-quarter 2015 , were 19 percent lower for copper, 10 percent higher for gold and 12 percent lower for molybdenum, and average realized prices for the first six months of 2016 , compared with the first six months of 2015 , were 20 percent lower for copper, 6 percent higher for gold and 19 percent lower for molybdenum. Refer to "Markets" for further discussion.
Provisionally Priced Copper Sales. Impacts of net adjustments for prior period provisionally priced sales primarily relate to copper sales. Substantially all of our copper concentrate and cathode sales contracts provide final copper pricing in a specified future month (generally one to four months from the shipment date) based primarily on quoted LME monthly average spot copper prices. We receive market prices based on prices in the specified future period, which results in price fluctuations recorded through revenues until the date of settlement. We record revenues and invoice customers at the time of shipment based on then-current LME prices, which results in an embedded derivative on our provisionally priced concentrate and cathode sales that is adjusted to fair value through earnings each period, using the period-end forward prices, until final pricing on the date of settlement. To the extent final prices are higher or lower than what was recorded on a provisional basis, an increase or decrease to revenues is recorded each reporting period until the date of final pricing. Accordingly, in times of rising copper prices, our
43
Table of Contents
revenues benefit from adjustments to the final pricing of provisionally priced sales pursuant to contracts entered into in prior periods; in times of falling copper prices, the opposite occurs. (Unfavorable) favorable impacts of net adjustments to prior periods' provisionally priced copper sales from continuing operations totaled $(28) million for second-quarter 2016 and $5 million for the first six months of 2016 , compared with $(22) million for second-quarter 2015 and $(99) million for the first six months of 2015 .
At June 30, 2016 , we had provisionally priced copper sales at our copper mining operations totaling 538 million pounds of copper (net of intercompany sales and noncontrolling interests) recorded at an average of $2.19 per pound, subject to final pricing over the next several months. We estimate that each $0.05 change in the price realized from the June 30, 2016 , provisional price recorded would have an approximate $19 million effect on 2016 net loss attributable to common stock. The LME spot copper price was $2.20 per pound on July 29, 2016.
Purchased Copper. We purchase copper cathode primarily for processing by our Rod & Refining operations. Purchased copper volumes of 43 million pounds in second-quarter 2016 were higher than 24 million pounds in second-quarter 2015 , which were partly offset by lower copper prices. Purchased copper volumes of 70 million pounds for the first six months of 2016 were higher than 64 million pounds for the first six months of 2015 , which were more than offset by lower copper prices.
Atlantic Copper Revenues. Atlantic Copper revenues for second-quarter 2016 , compared with second-quarter 2015 , primarily reflect lower copper prices, offset by higher copper and gold sales volumes. Lower Atlantic Copper revenues for the first six months of 2016 , compared with the first six months of 2015 , primarily reflect lower copper prices.
Oil and Gas Operations
Oil Sales Volumes. Oil sales volumes of 8.7 million barrels (MMBbls) in second-quarter 2016 and 17.0 MMBbls for the first six months of 2016 approximated oil sales volumes of 8.6 MMBbls in second-quarter 2015 and 17.0 MMBbls for the first six months of 2015 , as higher volumes from the GOM were offset by lower volumes from California.
Realized Oil Prices and Derivative Contracts. Our average realized price for oil of $41.10 per barrel in second-quarter 2016 was 26 percent lower than our average realized price of $55.82 per barrel in second-quarter 2015 (excluding cash gains on derivative contracts). Our average realized price for oil of $35.21 per barrel for the first six months of 2016 was 30 percent lower than our average realized price of $50.25 per barrel for the first six months of 2015 (excluding cash gains on derivative contracts).
Crude Oil Derivative Contracts. During 2015, we had crude oil derivative contracts that were not designated as hedging instruments; accordingly, they were recorded at fair value with the mark-to-market gains and losses recorded in revenues each period. Net mark-to-market gains on crude oil derivative contracts totaled $6 million (consisting of cash gains of $101 million , partly offset by net noncash mark-to-market losses of $95 million ) in second-quarter 2015 and $58 million (consisting of cash gains of $201 million , partly offset by net noncash mark-to-market losses of $143 million ) for the first six months of 2015 . We currently do not have oil and gas derivative contracts in place for 2016 and future years.
Production and Delivery Costs
Consolidated production and delivery costs totaled $3.0 billion in second-quarter 2016 and $5.5 billion for the first six months of 2016 , compared with $2.7 billion in second-quarter 2015 and $5.3 billion for the first six months of 2015 . Compared with the 2015 periods, production and delivery costs for mining operations were $311 million lower in second-quarter 2016 and $615 million lower for the first six months of 2016 , primarily reflecting ongoing cost reduction initiatives, partly offset by higher costs from Cerro Verde's expanded operations. Compared with the 2015 periods, production and delivery costs for our U.S. oil and gas operations were $608 million higher in second-quarter 2016 and $732 million higher for the first six months of 2016 , primarily reflecting higher charges for drillship settlements/idle rig costs, which totaled $639 million in second-quarter 2016 , $3 million in second-quarter 2015 , $804 million for the first six months of 2016 and $16 million for the first six months of 2015 .
Mining Unit Site Production and Delivery Costs. Site production and delivery costs for our copper mining operations primarily include labor, energy and commodity-based inputs, such as sulphuric acid, reagents, liners, tires and explosives. Consolidated unit site production and delivery costs (before net noncash and other costs) for our copper mines totaled $1.41 per pound of copper in second-quarter 2016 and $1.45 per pound for the first six months of 2016 , compared with $1.89 per pound in second-quarter 2015 and $1.93 for the first six months of 2015 . Lower
44
Table of Contents
consolidated unit site production and delivery costs for the 2016 periods, compared with the 2015 periods, primarily reflect the impact of ongoing cost reduction initiatives and higher copper sales volumes. Refer to "Operations – Unit Net Cash Costs" for further discussion of unit net cash costs associated with our operating divisions and to "Product Revenues and Production Costs" for reconciliations of per pound costs by operating division to production and delivery costs applicable to sales reported in our consolidated financial statements.
Oil and Gas Cash Production Costs per BOE. Production costs for our oil and gas operations primarily include costs incurred to operate and maintain wells and related equipment and facilities, such as lease operating expenses, steam gas costs, electricity, production and ad valorem taxes, and gathering and transportation expenses. Lower cash production costs for our oil and gas operations of $15.00 per BOE in second-quarter 2016 and $15.42 for the first six months of 2016 , compared with $19.04 per BOE in second-quarter 2015 and $19.62 for the first six months of 2015 , primarily reflect higher production from GOM wells and ongoing cost reduction efforts. Refer to "Operations" for further discussion of cash production costs at our oil and gas operations.
Depreciation, Depletion and Amortization
Depreciation will vary under the unit-of-production (UOP) method as a result of changes in sales volumes and the related UOP rates at our mining and oil and gas operations. Consolidated depreciation, depletion and amortization (DD&A) totaled $632 million in second-quarter 2016 and $1.3 billion for the first six months of 2016 , compared with $833 million in second-quarter 2015 and $1.7 billion for the first six months of 2015 . DD&A from mining operations was $65 million higher in second-quarter 2016 and $137 million higher for the first six months of 2016 , compared with the 2015 periods, primarily reflecting higher copper sales volumes from Cerro Verde. DD&A from U.S. oil and gas operations was $267 million lower in second-quarter 2016 and $542 million lower for the first six months of 2016 , compared with the 2015 periods, primarily reflecting lower DD&A rates as a result of reduced oil and gas property costs subject to amortization following impairment charges.
Impairment of Oil and Gas Properties
Under full cost accounting rules, a "ceiling test" is conducted each quarter to review the carrying value of oil and gas properties for impairment, which resulted in the recognition of impairment charges totaling $291 million in second-quarter 2016 , $2.7 billion in second-quarter 2015 , $4.1 billion for the first six months of 2016 and $5.8 billion for the first six months of 2015 . Refer to Note 1 and "Operations" for further discussion.
Selling, General and Administrative Expenses
Consolidated selling, general and administrative expenses totaled $160 million in second-quarter 2016 , $148 million in second-quarter 2015 , $298 million for the first six months of 2016 and $299 million for the first six months of 2015 . Selling, general and administrative expenses includes charges of $ 37 million in second-quarter 2016 and $39 million for the first six months of 2016 associated with workforce reductions and other restructuring costs at oil and gas operations.
Consolidated selling, general and administrative expenses were net of capitalized general and administrative expense at our oil and gas operations totaling $23 million in second-quarter 2016 , $38 million in second-quarter 2015 , $50 million for the first six months of 2016 and $71 million for the first six months of 2015 .
Mining Exploration and Research Expenses
Consolidated exploration and research expenses for our mining operations totaled $15 million in second-quarter 2016 , $30 million in second-quarter 2015 , $33 million for the first six months of 2016 and $57 million for the first six months of 2015 . Our mining exploration activities are generally associated with our existing mines focusing on opportunities to expand reserves and resources to support development of additional future production capacity. Exploration results continue to indicate opportunities for significant future potential reserve additions in North and South America. Exploration spending continues to be constrained by market conditions and is expected to approximate $45 million for the year 2016 .
Exploration costs for our oil and gas operations are capitalized to oil and gas properties.
Environmental Obligations and Shutdown Costs
Environmental obligation costs reflect net revisions to our long-term environmental obligations, which vary from period to period because of changes to environmental laws and regulations, the settlement of environmental matters and/or circumstances affecting our operations that could result in significant changes in our estimates. Shutdown costs include care-and-maintenance costs and any litigation, remediation or related expenditures associated with closed facilities or operations. Net charges for environmental obligations and shutdown costs from
45
Table of Contents
continuing operations totaled $11 million in second-quarter 2016 , $11 million in second-quarter 2015 , $21 million for the first six months of 2016 and $24 million for the first six months of 2015 .
Net Gain on Sales of Assets
Net gain on sales of assets totaled $749 million in the second quarter and first six months of 2016 , primarily associated with the Morenci and Timok transactions. Net gain on sales of assets totaled $39 million for the first six months of 2015 related to the sale of our interest in the Luna Energy power facility. Refer to Note 2 for further discussion of the 2016 transactions.
Interest Expense, Net
Consolidated interest expense (excluding capitalized interest and interest expense allocated to discontinued operations) totaled $218 million in second-quarter 2016 , $208 million in second-quarter 2015 , $436 million for the first six months of 2016 and $411 million for the first six months of 2015 . Refer to Note 2 for interest allocated to discontinued operations.
Capitalized interest varies with the level of expenditures for our development projects and average interest rates on our borrowings and totaled $22 million in second-quarter 2016 , $66 million in second-quarter 2015 , $49 million for the first six months of 2016 and $130 million for the first six months of 2015 .
Net Gain on Early Extinguishment of Debt
Net gain on early extinguishment of debt totaled $39 million in second-quarter 2016 and $36 million for the first six months of 2016 , primarily related to our second-quarter 2016 redemptions of certain senior notes in exchange for common stock. Refer to Note 6 for further discussion.
Income Taxes
Following is a summary of the approximate amounts used in the calculation of our consolidated income tax benefit
(provision) from continuing operations for the 2016 and 2015 periods (in millions, except percentages):
| Six Months Ended June 30, |
| ||||||||||||||||||
| 2016 |
| 2015 |
| ||||||||||||||||
| Income(Loss) a |
| Effective Tax Rate |
| Income Tax Benefit (Provision) |
| Income (Loss) a |
| Effective Tax Rate |
| Income Tax Benefit (Provision) |
| ||||||||
U.S. | $ | (535 | ) |
| (7)% |
| $ | (39 | ) | b | $ | (455 | ) | c | 63% |
| $ | 288 | |
|
South America | 219 | |
| 38% |
| (82 | ) |
| 81 | |
| 37% |
| (30 | ) |
| ||||
Indonesia | 164 | |
| 33% |
| (54 | ) |
| 289 | |
| 43% |
| (124 | ) |
| ||||
Impairment of oil and gas properties | (4,078 | ) |
| 38% |
| 1,543 | |
| (5,790 | ) |
| 38% |
| 2,179 | |
| ||||
Valuation allowance, net | - | |
| N/A |
| (1,543 | ) | d | - | |
| N/A |
| (763 | ) | d | ||||
Eliminations and other | 89 | |
| N/A |
| (25 | ) |
| 186 | |
| N/A |
| (50 | ) |
| ||||
Rate adjustment e | - | |
| N/A |
| 7 | |
| - | |
| N/A |
| (87 | ) |
| ||||
Consolidated FCX | $ | (4,141 | ) |
| (5)% | f | $ | (193 | ) |
| $ | (5,689 | ) |
| 25% |
| $ | 1,413 | |
|
a. | Represents income (loss) from continuing operations by geographic location before income taxes and equity in affiliated companies' net earnings. |
b. | Includes net tax charges of $36 million , comprised of $96 million related to the reversal of income tax benefits recognized in 2015 for carryback claims, partly offset by a tax benefit of $60 million associated with our election to monetize alternative minimum tax credits. |
c. | Includes a gain of $92 million related to net proceeds received from insurance carriers and other third parties related to the shareholder derivative litigation settlement for which there was no related tax provision. |
d. | As a result of the impairment to U.S. oil and gas properties, we recorded tax charges to establish valuation allowances against U.S. federal and state deferred tax assets that will not generate a future benefit. |
e. | In accordance with applicable accounting rules, we adjust our interim provision for income taxes to equal our consolidated tax rate. |
f. | The consolidated effective income tax rate is a function of the combined effective tax rates for the jurisdictions in which we operate. Accordingly, variations in the relative proportions of jurisdictional income result in fluctuations to our consolidated effective income tax rate. Assuming achievement of current sales volume and cost estimates and average prices of $2.25 per pound for copper, $1,300 per ounce for gold, $6 per pound for molybdenum and $48 per barrel of Brent crude oil for the remainder of 2016 , we estimate our consolidated effective tax rate related to continuing operations for the year 2016 will approximate 40 percent , excluding U.S. domestic losses. |
46
Table of Contents
Net (Loss) Income from Discontinued Operations
In May 2016, we entered into a definitive agreement to sell our interest in TFHL. Through our interest in TFHL, we have an effective 56 percent interest in the Tenke minerals district in the DRC. In accordance with accounting guidelines, the results of Tenke have been reported as discontinued operations for all periods presented. Net (loss) income from discontinued operations totaled $(181) million in second-quarter 2016 , $29 million in second-quarter 2015 , $(185) million for the first six months of 2016 and $70 million for the first six months of 2015 . The second quarter and first six months of 2016 include a charge of $177 million for the estimated loss on disposal, which will be adjusted through closing of the transaction. Refer to Note 2 for a summary of the components of discontinued operations and to "Discontinued Operations" for a discussion of operating results.
OPERATIONS
North America Copper Mines
We operate seven open-pit copper mines in North America – Morenci, Bagdad, Safford, Sierrita and Miami in Arizona, and Chino and Tyrone in New Mexico. All of the North America mining operations are wholly owned, except for Morenci.
We record our undivided joint venture interest in Morenci using the proportionate consolidation method. On May 31, 2016, we completed the sale of an additional 13 percent undivided interest in Morenci for $1.0 billion in cash. As a result of the transaction, our undivided interest in Morenci was prospectively reduced from 85 percent to 72 percent. Refer to Note 2 for further discussion.
The North America copper mines include open-pit mining, sulfide ore concentrating, leaching and solution extraction/electrowinning (SX/EW) operations. A majority of the copper produced at our North America copper mines is cast into copper rod by our Rod & Refining segment. The remainder of our North America copper sales is in the form of copper cathode or copper concentrate, a portion of which is shipped to Atlantic Copper. Molybdenum concentrate and silver are also produced by certain of our North America copper mines.
Operating and Development Activities. We have significant undeveloped reserves and resources in North America and a portfolio of long-term development projects. In the near term, we are deferring development of new projects as a result of current market conditions. Future investments will be undertaken based on the results of economic and technical feasibility studies, and market conditions.
During 2015, we revised plans for our North America copper mines to incorporate reductions in mining rates to reduce operating and capital costs. In addition, we curtailed operations at the Miami and Tyrone mines, and we are operating our Sierrita mine at reduced rates.The revised plans at each of the operations incorporate the impacts of lower energy, acid and other consumables, reduced labor costs and a significant reduction in capital spending plans. These operating plans will continue to be reviewed and additional adjustments will be made as market conditions warrant.
47
Table of Contents
Operating Data. Following is a summary of consolidated operating data for the North America copper mines for the second quarters and first six months of 2016 and 2015 :
| Three Months Ended June 30, |
| Six Months Ended June 30, | ||||||||||||
| 2016 |
| 2015 |
| 2016 |
| 2015 | ||||||||
Operating Data, Net of Joint Venture Interest |
|
|
|
|
|
|
| ||||||||
Copper |
|
|
|
|
|
|
| ||||||||
Production (millions of recoverable pounds) | 469 | |
| 469 | |
| 956 | |
| 921 | | ||||
Sales (millions of recoverable pounds) | 464 | |
| 486 | |
| 967 | |
| 958 | | ||||
Average realized price per pound | $ | 2.18 | |
| $ | 2.77 | |
| $ | 2.17 | |
| $ | 2.73 | |
|
|
|
|
|
|
|
| ||||||||
Molybdenum |
|
|
|
|
|
|
| ||||||||
Production (millions of recoverable pounds) a | 8 | |
| 10 | |
| 16 | |
| 19 | | ||||
|
|
|
|
|
|
|
| ||||||||
100% Operating Data |
|
|
|
|
|
|
| ||||||||
SX/EW operations |
|
|
|
|
|
|
| ||||||||
Leach ore placed in stockpiles (metric tons per day) | 780,700 | |
| 890,000 | |
| 807,100 | |
| 902,500 | | ||||
Average copper ore grade (percent) | 0.33 | |
| 0.26 | |
| 0.32 | |
| 0.25 | | ||||
Copper production (millions of recoverable pounds) | 303 | |
| 261 | |
| 605 | |
| 508 | | ||||
|
|
|
|
|
|
|
| ||||||||
Mill operations |
|
|
|
|
|
|
| ||||||||
Ore milled (metric tons per day) | 300,400 | |
| 316,000 | |
| 299,500 | |
| 308,800 | | ||||
Average ore grade (percent): |
|
|
|
|
|
|
| ||||||||
Copper | 0.48 | |
| 0.47 | |
| 0.49 | |
| 0.48 | | ||||
Molybdenum | 0.03 | |
| 0.03 | |
| 0.03 | |
| 0.03 | | ||||
Copper recovery rate (percent) | 86.6 | |
| 85.8 | |
| 85.6 | |
| 85.6 | | ||||
Copper production (millions of recoverable pounds) | 219 | |
| 247 | |
| 445 | |
| 488 | | ||||
a. | Refer to "Consolidated Results" for our consolidated molybdenum sales volumes, which includes sales of molybdenum produced at the North America copper mines. |
Copper sales volumes from our North America copper mines of 464 million pounds in second-quarter 2016 were lower than 486 million pounds in second-quarter 2015 , primarily because of timing of sales in the 2015 period. Copper sales volumes from our North America mines of 967 million pounds for the first six months of 2016 were higher than 958 million pounds for the first six months of 2015 , primarily reflecting higher ore grades at Morenci and Safford, partly offset by the impact of timing of sales in the 2015 period.
Copper sales from North America are expected to approximate 1.8 billion pounds for the year 2016 , compared with 2.0 billion pounds in 2015 .
Unit Net Cash Costs. Unit net cash costs per pound of copper is a measure intended to provide investors with information about the cash-generating capacity of our mining operations expressed on a basis relating to the primary metal product for our respective operations. We use this measure for the same purpose and for monitoring operating performance by our mining operations. This information differs from measures of performance determined in accordance with U.S. GAAP and should not be considered in isolation or as a substitute for measures of performance determined in accordance with U.S. GAAP. This measure is presented by other metals mining companies, although our measure may not be comparable to similarly titled measures reported by other companies.
48
Table of Contents
Gross Profit per Pound of Copper and Molybdenum
The following tables summarize unit net cash costs and gross profit per pound at our North America copper mines for the second quarters and first six months of 2016 and 2015 . Refer to "Product Revenues and Production Costs" for an explanation of the "by-product" and "co-product" methods and a reconciliation of unit net cash costs per pound to production and delivery costs applicable to sales reported in our consolidated financial statements.
| Three Months Ended June 30, |
| ||||||||||||||||||||||
| 2016 |
| 2015 |
| ||||||||||||||||||||
| By- Product Method |
| Co-Product Method |
| By- Product Method |
| Co-Product Method |
| ||||||||||||||||
|
| Copper |
| Molyb- denum a |
|
| Copper |
| Molyb- |
| ||||||||||||||
Revenues, excluding adjustments | $ | 2.18 | |
| $ | 2.18 | |
| $ | 5.92 | |
| $ | 2.77 | |
| $ | 2.77 | |
| $ | 7.80 | |
|
|
|
|
|
|
|
|
|
|
|
|
|
| ||||||||||||
Site production and delivery, before net noncash and other costs shown below | 1.40 | |
| 1.34 | |
| 4.71 | |
| 1.78 | |
| 1.66 | |
| 6.24 | |
| ||||||
By-product credits | (0.11 | ) |
| - | |
| - | |
| (0.16 | ) |
| - | |
| - | |
| ||||||
Treatment charges | 0.11 | |
| 0.10 | |
| - | |
| 0.12 | |
| 0.12 | |
| - | |
| ||||||
Unit net cash costs | 1.40 | |
| 1.44 | |
| 4.71 | |
| 1.74 | |
| 1.78 | |
| 6.24 | |
| ||||||
Depreciation, depletion and amortization | 0.29 | |
| 0.27 | |
| 0.57 | |
| 0.28 | |
| 0.27 | |
| 0.53 | |
| ||||||
Noncash and other costs, net | 0.05 | |
| 0.05 | |
| 0.08 | |
| 0.10 | |
| 0.09 | |
| 0.06 | |
| ||||||
Total unit costs | 1.74 | |
| 1.76 | |
| 5.36 | |
| 2.12 | |
| 2.14 | |
| 6.83 | |
| ||||||
Revenue adjustments, primarily for pricing on prior period open sales | (0.01 | ) |
| (0.01 | ) |
| - | |
| (0.03 | ) |
| (0.03 | ) |
| - | |
| ||||||
Gross profit per pound | $ | 0.43 | |
| $ | 0.41 | |
| $ | 0.56 | |
| $ | 0.62 | |
| $ | 0.60 | |
| $ | 0.97 | |
|
|
|
|
|
|
|
|
|
|
|
|
|
| ||||||||||||
Copper sales (millions of recoverable pounds) | 462 | |
| 462 | |
|
|
| 485 | |
| 485 | |
|
|
| ||||||||
Molybdenum sales (millions of recoverable pounds) a |
|
|
|
| 8 | |
|
|
|
|
| 10 | |
| ||||||||||
|
|
|
|
|
|
|
|
|
|
|
|
| ||||||||||||
| Six Months Ended June 30, |
| ||||||||||||||||||||||
| 2016 |
| 2015 |
| ||||||||||||||||||||
| By- Product Method |
| Co-Product Method |
| By- Product Method |
| Co-Product Method |
| ||||||||||||||||
|
| Copper |
| Molyb- denum a |
|
| Copper |
| Molyb- denum a |
| ||||||||||||||
Revenues, excluding adjustments | $ | 2.17 | |
| $ | 2.17 | |
| $ | 5.61 | |
| $ | 2.73 | |
| $ | 2.73 | |
| $ | 8.28 | |
|
|
|
|
|
|
|
|
|
|
|
|
|
| ||||||||||||
Site production and delivery, before net noncash and other costs shown below | 1.40 | |
| 1.34 | |
| 4.51 | |
| 1.79 | |
| 1.68 | |
| 6.24 | |
| ||||||
By-product credits | (0.10 | ) |
| - | |
| - | |
| (0.17 | ) |
| - | |
| - | |
| ||||||
Treatment charges | 0.11 | |
| 0.11 | |
| - | |
| 0.13 | |
| 0.12 | |
| - | |
| ||||||
Unit net cash costs | 1.41 | |
| 1.45 | |
| 4.51 | |
| 1.75 | |
| 1.80 | |
| 6.24 | |
| ||||||
Depreciation, depletion and amortization | 0.29 | |
| 0.27 | |
| 0.55 | |
| 0.28 | |
| 0.27 | |
| 0.58 | |
| ||||||
Noncash and other costs, net | 0.05 | |
| 0.05 | |
| 0.02 | |
| 0.08 | |
| 0.08 | |
| 0.06 | |
| ||||||
Total unit costs | 1.75 | |
| 1.77 | |
| 5.08 | |
| 2.11 | |
| 2.15 | |
| 6.88 | |
| ||||||
Revenue adjustments, primarily for pricing on prior period open sales | - | |
| - | |
| - | |
| (0.03 | ) |
| (0.03 | ) |
| - | |
| ||||||
Gross profit per pound | $ | 0.42 | |
| $ | 0.40 | |
| $ | 0.53 | |
| $ | 0.59 | |
| $ | 0.55 | |
| $ | 1.40 | |
|
|
|
|
|
|
|
|
|
|
|
|
|
| ||||||||||||
Copper sales (millions of recoverable pounds) | 964 | |
| 964 | |
|
|
| 956 | |
| 956 | |
|
|
| ||||||||
Molybdenum sales (millions of recoverable pounds) a |
|
|
|
| 16 | |
|
|
|
|
| 19 | |
| ||||||||||
a. | Reflects sales of molybdenum produced by certain of the North America copper mines to our molybdenum sales company at market-based pricing. |
Our North America copper mines have varying cost structures because of differences in ore grades and characteristics, processing costs, by-product credits and other factors. Average unit net cash costs (net of by-product credits) of $1.40 per pound of copper in second-quarter 2016 and $1.41 per pound of copper for the first six months of 2016 were lower than unit net cash costs of $1.74 per pound in second-quarter 2015 and $1.75 per pound for the first six months of 2015 , primarily reflecting cost reduction initiatives and lower energy and other input costs.
Because certain assets are depreciated on a straight-line basis, North America's average unit depreciation rate may vary with asset additions and the level of copper production and sales.
49
Table of Contents
Average unit net cash costs (net of by-product credits) for our North America copper mines are expected to approximate $1.42 per pound of copper for the year 2016 , based on achievement of current sales volume and cost estimates, and assuming an average molybdenum price of $6 per pound for the second half of 2016 . North America's average unit net cash costs would change by approximately $0.012 per pound for each $2 per pound change in the average price of molybdenum.
South America Mining
We operate two copper mines in South America – Cerro Verde in Peru (in which we own a 53.56 percent interest) and El Abra in Chile (in which we own a 51 percent interest). These operations are consolidated in our financial statements.
South America mining includes open-pit mining, sulfide ore concentrating, leaching and SX/EW operations. Production from our South America mines is sold as copper concentrate or cathode under long-term contracts. Our South America mines also ship a portion of their copper concentrate inventories to Atlantic Copper. In addition to copper, the Cerro Verde mine produces molybdenum concentrate and silver.
Operating and Development Activities. The Cerro Verde expansion project commenced operations in September 2015 and achieved capacity operating rates during first-quarter 2016. Cerro Verde's expanded operations benefit from its large-scale, long-lived reserves and cost efficiencies. The project expanded the concentrator facilities from 120,000 metric tons of ore per day to 360,000 metric tons of ore per day and is on track to provide incremental annual production of approximately 600 million pounds of copper and 15 million pounds of molybdenum.
During 2015, we revised operating plans for our South America mines, principally to reflect adjustments to our mine plan at El Abra to reduce mining and stacking rates by approximately 50 percent to achieve lower operating and labor costs, defer capital expenditures and extend the life of the existing operations.
We continue to evaluate a potential large-scale milling operation at El Abra to process additional sulfide material and to achieve higher recoveries. Exploration results in recent years at El Abra indicate a significant sulfide resource, which could potentially support a major mill project. Future investments will depend on technical studies, economic factors and global copper market conditions.
Operating Data. Following is a summary of consolidated operating data for our South America mining operations for the second quarters and first six months of 2016 and 2015 :
| Three Months Ended June 30, |
| Six Months Ended June 30, | ||||||||||||
| 2016 |
| 2015 |
| 2016 |
| 2015 | ||||||||
Copper |
|
|
|
|
|
|
| ||||||||
Production (millions of recoverable pounds) | 334 | |
| 188 | |
| 669 | |
| 381 | | ||||
Sales (millions of recoverable pounds) | 327 | |
| 178 | |
| 650 | |
| 378 | | ||||
Average realized price per pound | $ | 2.19 | |
| $ | 2.69 | |
| $ | 2.18 | |
| $ | 2.68 | |
|
|
|
|
|
|
|
| ||||||||
Molybdenum |
|
|
|
|
|
|
| ||||||||
Production (millions of recoverable pounds) a | 4 | |
| 2 | |
| 9 | |
| 4 | | ||||
|
|
|
|
|
|
|
| ||||||||
SX/EW operations |
|
|
|
|
|
|
| ||||||||
Leach ore placed in stockpiles (metric tons per day) | 170,400 | |
| 237,000 | |
| 155,500 | |
| 235,300 | | ||||
Average copper ore grade (percent) | 0.39 | |
| 0.41 | |
| 0.40 | |
| 0.41 | | ||||
Copper production (millions of recoverable pounds) | 82 | |
| 109 | |
| 172 | |
| 223 | | ||||
|
|
|
|
|
|
|
| ||||||||
Mill operations |
|
|
|
|
|
|
| ||||||||
Ore milled (metric tons per day) | 352,000 | |
| 116,500 | |
| 345,700 | |
| 117,900 | | ||||
Average ore grade: |
|
|
|
|
|
|
| ||||||||
Copper (percent) | 0.42 | |
| 0.46 | |
| 0.43 | |
| 0.45 | | ||||
Molybdenum (percent) | 0.02 | |
| 0.01 | |
| 0.02 | |
| 0.02 | | ||||
Copper recovery rate (percent) | 88.0 | |
| 78.2 | |
| 87.1 | |
| 78.9 | | ||||
Copper production (millions of recoverable pounds) | 252 | |
| 79 | |
| 497 | |
| 158 | | ||||
a. | Refer to "Consolidated Results" for our consolidated molybdenum sales volumes, which include sales of molybdenum produced at Cerro Verde. |
50
Table of Contents
Consolidated copper sales volumes from South America of 327 million pounds in second-quarter 2016 and 650 million pounds for the first six months of 2016 , were significantly higher than sales of 178 million pounds in second-quarter 2015 and 378 million pounds for the first six months of 2015 , primarily reflecting Cerro Verde's expanded operations.
Copper sales from South America mines are expected to approximate 1.36 billion pounds of copper for the year 2016 , compared with 871 million pounds in 2015.
Unit Net Cash Costs. Unit net cash costs per pound of copper is a measure intended to provide investors with information about the cash-generating capacity of our mining operations expressed on a basis relating to the primary metal product for our respective operations. We use this measure for the same purpose and for monitoring operating performance by our mining operations. This information differs from measures of performance determined in accordance with U.S. GAAP and should not be considered in isolation or as a substitute for measures of performance determined in accordance with U.S. GAAP. This measure is presented by other metals mining companies, although our measure may not be comparable to similarly titled measures reported by other companies.
Gross Profit per Pound of Copper
The following tables summarize unit net cash costs and gross profit per pound of copper at the South America mining operations for the second quarters and first six months of 2016 and 2015 . Unit net cash costs per pound of copper are reflected under the by-product and co-product methods as the South America mining operations also had small amounts of molybdenum and silver sales. Refer to "Product Revenues and Production Costs" for an explanation of the "by-product" and "co-product" methods and a reconciliation of unit net cash costs per pound to production and delivery costs applicable to sales reported in our consolidated financial statements.
| Three Months Ended June 30, |
| ||||||||||||||
| 2016 |
| 2015 |
| ||||||||||||
| By-Product Method |
| Co-Product Method |
| By-Product Method |
| Co-Product Method |
| ||||||||
Revenues, excluding adjustments | $ | 2.19 | |
| $ | 2.19 | |
| $ | 2.69 | |
| $ | 2.69 | |
|
|
|
|
|
|
|
|
|
| ||||||||
Site production and delivery, before net noncash and other costs shown below | 1.20 | |
| 1.13 | |
| 1.77 | |
| 1.72 | |
| ||||
By-product credits | (0.12 | ) |
| - | |
| (0.04 | ) |
| - | |
| ||||
Treatment charges | 0.23 | |
| 0.23 | |
| 0.17 | |
| 0.17 | |
| ||||
Royalty on metals | - | |
| - | |
| - | |
| - | |
| ||||
Unit net cash costs | 1.31 | |
| 1.36 | |
| 1.90 | |
| 1.89 | |
| ||||
Depreciation, depletion and amortization | 0.41 | |
| 0.39 | |
| 0.40 | |
| 0.39 | |
| ||||
Noncash and other costs (credits), net | 0.02 | |
| 0.02 | |
| (0.02 | ) |
| (0.03 | ) |
| ||||
Total unit costs | 1.74 | |
| 1.77 | |
| 2.28 | |
| 2.25 | |
| ||||
Revenue adjustments, primarily for pricing on prior period open sales | (0.04 | ) |
| (0.04 | ) |
| (0.05 | ) |
| (0.05 | ) |
| ||||
Gross profit per pound | $ | 0.41 | |
| $ | 0.38 | |
| $ | 0.36 | |
| $ | 0.39 | |
|
|
|
|
|
|
|
|
|
| ||||||||
Copper sales (millions of recoverable pounds) | 327 | |
| 327 | |
| 178 | |
| 178 | |
| ||||
51
Table of Contents
|
|
|
|
|
|
|
| ||||||||
| Six Months Ended June 30, | ||||||||||||||
| 2016 |
| 2015 | ||||||||||||
| By-Product Method |
| Co-Product Method |
| By-Product Method |
| Co-Product Method | ||||||||
Revenues, excluding adjustments | $ | 2.18 | |
| $ | 2.18 | |
| $ | 2.68 | |
| $ | 2.68 | |
|
|
|
|
|
|
|
| ||||||||
Site production and delivery, before net noncash and other costs shown below | 1.22 | |
| 1.16 | |
| 1.76 | |
| 1.70 | | ||||
By-product credits | (0.10 | ) |
| - | |
| (0.06 | ) |
| - | | ||||
Treatment charges | 0.23 | |
| 0.23 | |
| 0.17 | |
| 0.17 | | ||||
Royalty on metals | 0.01 | |
| 0.01 | |
| - | |
| - | | ||||
Unit net cash costs | 1.36 | |
| 1.40 | |
| 1.87 | |
| 1.87 | | ||||
Depreciation, depletion and amortization | 0.41 | |
| 0.39 | |
| 0.39 | |
| 0.38 | | ||||
Noncash and other costs, net | 0.02 | |
| 0.02 | |
| - | |
| - | | ||||
Total unit costs | 1.79 | |
| 1.81 | |
| 2.26 | |
| 2.25 | | ||||
Revenue adjustments, primarily for pricing on prior period open sales | 0.01 | |
| 0.01 | |
| (0.08 | ) |
| (0.08 | ) | ||||
Gross profit per pound | $ | 0.40 | |
| $ | 0.38 | |
| $ | 0.34 | |
| $ | 0.35 | |
|
|
|
|
|
|
|
| ||||||||
Copper sales (millions of recoverable pounds) | 650 | |
| 650 | |
| 378 | |
| 378 | | ||||
Our South America mines have varying cost structures because of differences in ore grades and characteristics, processing costs, by-product credits and other factors. Average unit net cash costs (net of by-product credits) of $1.31 per pound of copper in second-quarter 2016 and $1.36 per pound of copper for the first six months of 2016 were lower than unit net cash costs of $1.90 per pound in second-quarter 2015 and $1.87 per pound for the first six months of 2015 , primarily reflecting higher copper sales volumes and economies of scale associated with the Cerro Verde expansion.
Revenues from Cerro Verde's concentrate sales are recorded net of treatment and refining charges. Accordingly, treatment charges will vary with Cerro Verde's sales volumes and the price of copper.
Because certain assets are depreciated on a straight-line basis, South America's unit depreciation rate may vary with asset additions and the level of copper production and sales.
Revenue adjustments primarily result from changes in prices on provisionally priced copper sales recognized in prior periods. Refer to "Consolidated Results - Revenues" for further discussion of adjustments to prior period provisionally priced copper sales.
Average unit net cash costs (net of by-product credits) for our South America mining operations are expected to approximate $1.40 per pound of copper for the year 2016 , based on current sales volume and cost estimates, and assuming average prices of $6 per pound of molybdenum for the second half of 2016 .
Indonesia Mining
Indonesia mining includes PT-FI's Grasberg minerals district, one of the world's largest copper and gold deposits, in Papua, Indonesia. We own 90.64 percent of PT-FI, including 9.36 percent owned through our wholly owned subsidiary, PT Indocopper Investama.
PT-FI proportionately consolidates an unincorporated joint venture with Rio Tinto plc (Rio Tinto), under which Rio Tinto has a 40 percent interest in certain assets and a 40 percent interest through 2021 in production exceeding specified annual amounts of copper, gold and silver. Refer to Note 3 in our annual report on Form 10-K for the year ended December 31, 2015 , for discussion of our joint venture with Rio Tinto.
PT-FI produces copper concentrate that contains significant quantities of gold and silver. Substantially all of PT-FI's copper concentrate is sold under long-term contracts, and during the first six months of 2016, approximately half of PT-FI's concentrate production was sold to PT Smelting, its 25-percent-owned smelter and refinery in Gresik, Indonesia.
Regulatory Matters. In October 2015, the Indonesian government provided a letter of assurance to PT-FI indicating that it will approve the extension of PT-FI's operations beyond 2021, and provide the same rights and the same
52
Table of Contents
level of legal and fiscal certainty provided under its current Contract of Work (COW). PT-FI continues to engage in discussions with the Indonesian government to obtain an extension of its long-term rights available under the COW.
In connection with its COW negotiations and subject to concluding an agreement to extend PT-FI's operations beyond 2021 on acceptable terms, PT-FI has agreed to construct new smelter capacity in Indonesia and to divest an additional 20.64 percent interest in PT-FI at fair market value.
PT-FI is required to apply for renewal of export permits at six-month intervals. In February 2016, PT-FI's export permit was renewed through August 8, 2016. PT-FI has applied for an extension of this permit. The Indonesian government continues to impose a 5.0 percent export duty while it reviews PT-FI's smelter plans. In addition, regulations published by the Indonesian government in January 2014 prohibit concentrate exports after January 12, 2017. PT-FI's current COW permits it to export concentrate.
We cannot predict whether PT-FI will be successful in reaching a satisfactory agreement on the terms of its long-term mining rights. If PT-FI is unable to reach agreement with the Indonesian government on its long-term rights, we may be required to reduce or defer investments in underground development projects, which could have a material adverse effect on PT-FI's future production and reserves. In addition, PT-FI would intend to pursue any and all claims against the Indonesian government for breach of contract through international arbitration. Refer to "Risk Factors" contained in Part I, Item 1A. of our annual report on Form 10-K for the year ended December 31, 2015, for further discussion of risks associated with our operations in Indonesia.
Operating and Development Activities. PT-FI's revised operating plans incorporate improved operational efficiencies, reductions in input costs, supplies and contractor costs, foreign exchange impacts and an approximate 20 percent deferral of capital expenditures that had been planned for 2016.
PT-FI has several projects in progress in the Grasberg minerals district related to the development of its large-scale, long-lived, high-grade underground ore bodies. In aggregate, these underground ore bodies are expected to produce large-scale quantities of copper and gold following the transition from the Grasberg open pit, currently anticipated to occur in early 2018. From 2016 to 2020, estimated aggregate capital spending on these projects is currently expected to average $1.0 billion per year ($0.8 billion per year net to PT-FI). Considering the long-term nature and size of these projects, actual costs could vary from these estimates. In response to market conditions and Indonesian regulatory uncertainty, the timing of these expenditures continues to be reviewed.
The following provides additional information on the continued development of the Common Infrastructure project, the Grasberg Block Cave underground mine and the Deep Mill Level Zone (DMLZ) ore body that lies below the Deep Ore Zone (DOZ) underground mine.
Common Infrastructure and Grasberg Block Cave Mine. In 2004, PT-FI commenced its Common Infrastructure project to provide access to its large undeveloped underground ore bodies located in the Grasberg minerals district through a tunnel system located approximately 400 meters deeper than its existing underground tunnel system. In addition to providing access to our underground ore bodies, the tunnel system will enable PT-FI to conduct future exploration in prospective areas associated with currently identified ore bodies. The tunnel system was completed to the Big Gossan terminal, and the Big Gossan mine was brought into production in 2010. Production from the Big Gossan mine, which is currently suspended, is expected to restart in the first half of 2017 and ramp up to 7,000 metric tons of ore per day in 2019. Development of the DMLZ and Grasberg Block Cave underground mines is advancing using the Common Infrastructure project tunnels as access.
The Grasberg Block Cave underground mine accounts for more than 45 percent of our recoverable proven and probable reserves in Indonesia. Production at the Grasberg Block Cave mine is expected to commence in 2018, following the end of mining of the Grasberg open pit. Targeted production rates once the Grasberg Block Cave mining operation reaches full capacity are expected to approximate 160,000 metric tons of ore per day. As a result of current market conditions, PT-FI is reviewing its operating plans to determine the optimum mine plan for the Grasberg Block Cave.
Aggregate mine development capital for the Grasberg Block Cave mine and associated Common Infrastructure is expected to approximate $6.0 billion (incurred between 2008 and 2022), with PT-FI's share totaling approximately $5.5 billion . Aggregate project costs totaling $2.5 billion have been incurred through June 30, 2016 ( $264 million during the first six months of 2016 ).
53
Table of Contents
DMLZ. The DMLZ ore body lies below the DOZ mine at the 2,590-meter elevation and represents the downward continuation of mineralization in the Ertsberg East Skarn system and neighboring Ertsberg porphyry. In September 2015, PT-FI initiated a significant step towards full production of the DMLZ block-cave mine by commencing the undercutting of the ore body.
Drilling efforts continue to determine the extent of the ore body. Aggregate mine development capital costs for the DMLZ underground mine are expected to approximate $2.6 billion (incurred between 2009 and 2020), with PT-FI's share totaling approximately $1.6 billion . Aggregate project costs totaling $1.7 billion have been incurred through June 30, 2016 ( $163 million during the first six months of 2016 ).
Operating Data. Following is a summary of consolidated operating data for our Indonesia mining operations for the second quarters and first six months of 2016 and 2015 :
| Three Months Ended June 30, |
| Six Months Ended June 30, | ||||||||||||
| 2016 |
| 2015 |
| 2016 |
| 2015 | ||||||||
Operating Data, Net of Joint Venture Interest |
|
|
|
|
|
|
| ||||||||
Copper |
|
|
|
|
|
|
| ||||||||
Production (millions of recoverable pounds) | 208 | |
| 205 | |
| 373 | |
| 359 | | ||||
Sales (millions of recoverable pounds) | 196 | |
| 196 | |
| 370 | |
| 351 | | ||||
Average realized price per pound | $ | 2.20 | |
| $ | 2.61 | |
| $ | 2.17 | |
| $ | 2.66 | |
|
|
|
|
|
|
|
| ||||||||
Gold |
|
|
|
|
|
|
| ||||||||
Production (thousands of recoverable ounces) | 158 | |
| 360 | |
| 336 | |
| 615 | | ||||
Sales (thousands of recoverable ounces) | 151 | |
| 346 | |
| 346 | |
| 606 | | ||||
Average realized price per ounce | $ | 1,292 | |
| $ | 1,173 | |
| $ | 1,260 | |
| $ | 1,183 | |
|
|
|
|
|
|
|
| ||||||||
100% Operating Data |
|
|
|
|
|
|
| ||||||||
Ore milled (metric tons per day): a |
|
|
|
|
|
|
| ||||||||
Grasberg open pit | 110,200 | |
| 134,200 | |
| 108,000 | |
| 121,200 | | ||||
DOZ underground mine b | 36,700 | |
| 42,700 | |
| 40,500 | |
| 45,800 | | ||||
DMLZ underground mine c | 4,900 | |
| - | |
| 4,500 | |
| - | | ||||
Grasberg Block Cave d | 2,600 | |
| - | |
| 2,400 | |
| - | | ||||
Big Gossan underground mine d | 1,000 | |
| - | |
| 600 | |
| - | | ||||
Total | 155,400 | |
| 176,900 | |
| 156,000 | |
| 167,000 | | ||||
Average ore grades: |
|
|
|
|
|
|
| ||||||||
Copper (percent) | 0.84 | |
| 0.67 | |
| 0.77 | |
| 0.63 | | ||||
Gold (grams per metric ton) | 0.48 | |
| 0.86 | |
| 0.50 | |
| 0.78 | | ||||
Recovery rates (percent): |
|
|
|
|
|
|
| ||||||||
Copper | 90.4 | |
| 90.6 | |
| 89.9 | |
| 90.6 | | ||||
Gold | 80.0 | |
| 83.5 | |
| 80.3 | |
| 83.9 | | ||||
Production: |
|
|
|
|
|
|
| ||||||||
Copper (millions of recoverable pounds) | 226 | |
| 205 | |
| 409 | |
| 359 | | ||||
Gold (thousands of recoverable ounces) | 174 | |
| 360 | |
| 364 | |
| 615 | | ||||
a. | Amounts represent the approximate average daily throughput processed at PT-FI's mill facilities from each producing mine and from development activities that result in metal production. |
b. | Ore milled from the DOZ underground mine is expected to ramp up to over 60,000 metric tons of ore per day in 2017. |
c. | Targeted production rates once the DMLZ underground mine reaches full capacity are expected to approximate 80,000 metric tons of ore per day in 2021. |
d. | Production from the Big Gossan underground mine is expected to restart in the first half of 2017, and production from the Grasberg Block Cave underground mine is expected to commence in 2018. |
Indonesia's consolidated copper sales totaled 196 million pounds in second-quarter 2016 , 196 million pounds in second-quarter 2015 , 370 million pounds for the first six months of 2016 and 351 million pounds for the first six months of 2015 . Higher copper ore grades in the 2016 periods were mostly offset by lower mining and milling rates.
54
Table of Contents
Indonesia's gold sales of 151 thousand ounces in second-quarter 2016 and 346 thousand ounces for the first six months of 2016 were lower than sales of 346 thousand ounces in second-quarter 2015 and 606 thousand ounces for the first six months of 2015 , primarily reflecting lower gold ore grades and lower mining and milling rates.
During second-quarter 2016 , PT-FI completed repairs to its large-scale concentrating facility, which required 23 days of downtime to repair one of the milling circuits. During second-quarter 2016, PT-FI was also impacted by lower than expected mining rates and productivity in the Grasberg open pit, which affects the timing of metal production. Productivity in the Grasberg open pit improved in July 2016.
At the Grasberg mine, the sequencing of mining areas with varying ore grades causes fluctuations in quarterly and annual production of copper and gold. Consolidated sales volumes from our Indonesia mining operations are expected to approximate 1.3 billion pounds of copper and 1.7 million ounces of gold for the year 2016 , compared with 744 million pounds of copper and 1.2 million ounces of gold for the year 2015 . PT-FI expects ore grades to improve significantly in the second half of 2016, with approximately 40 percent of its 2016 copper sales and 55 percent of its gold sales for the year 2016 anticipated in fourth-quarter 2016.
Unit Net Cash Costs. Unit net cash costs per pound of copper is a measure intended to provide investors with information about the cash-generating capacity of our mining operations expressed on a basis relating to the primary metal product for our respective operations. We use this measure for the same purpose and for monitoring operating performance by our mining operations. This information differs from measures of performance determined in accordance with U.S. GAAP and should not be considered in isolation or as a substitute for measures of performance determined in accordance with U.S. GAAP. This measure is presented by other metals mining companies, although our measure may not be comparable to similarly titled measures reported by other companies.
Gross Profit per Pound of Copper and per Ounce of Gold
The following tables summarize the unit net cash costs and gross profit per pound of copper and per ounce of gold at our Indonesia mining operations for the second quarters and first six months of 2016 and 2015 . Refer to "Production Revenues and Production Costs" for an explanation of "by-product" and "co-product" methods and a reconciliation of unit net cash costs per pound to production and delivery costs applicable to sales reported in our consolidated financial statements.
| Three Months Ended June 30, | ||||||||||||||||||||||
| 2016 |
| 2015 | ||||||||||||||||||||
| By-Product Method |
| Co-Product Method |
| By-Product Method |
| Co-Product Method | ||||||||||||||||
|
| Copper |
| Gold |
|
| Copper |
| Gold | ||||||||||||||
Revenues, excluding adjustments | $ | 2.20 | |
| $ | 2.20 | |
| $ | 1,292 | |
| $ | 2.61 | |
| $ | 2.61 | |
| $ | 1,173 | |
|
|
|
|
|
|
|
|
|
|
|
| ||||||||||||
Site production and delivery, before net noncash and other costs shown below | 1.77 | |
| 1.20 | |
| 706 | |
| 2.26 | |
| 1.25 | |
| 560 | | ||||||
Gold and silver credits | (1.05 | ) |
| - | |
| - | |
| (2.13 | ) |
| - | |
| - | | ||||||
Treatment charges | 0.29 | |
| 0.20 | |
| 116 | |
| 0.32 | |
| 0.18 | |
| 79 | | ||||||
Export duties | 0.08 | |
| 0.05 | |
| 32 | |
| 0.18 | |
| 0.10 | |
| 45 | | ||||||
Royalty on metals | 0.11 | |
| 0.07 | |
| 45 | |
| 0.18 | |
| 0.10 | |
| 45 | | ||||||
Unit net cash costs | 1.20 | |
| 1.52 | |
| 899 | |
| 0.81 | |
| 1.63 | |
| 729 | | ||||||
Depreciation and amortization | 0.48 | |
| 0.33 | |
| 190 | |
| 0.40 | |
| 0.22 | |
| 100 | | ||||||
Noncash and other costs, net | 0.01 | |
| 0.01 | |
| 4 | |
| 0.04 | |
| 0.02 | |
| 10 | | ||||||
Total unit costs | 1.69 | |
| 1.86 | |
| 1,093 | |
| 1.25 | |
| 1.87 | |
| 839 | | ||||||
Revenue adjustments, primarily for pricing on prior period open sales | (0.06 | ) |
| (0.06 | ) |
| 7 | |
| (0.02 | ) |
| (0.02 | ) |
| 7 | | ||||||
PT Smelting intercompany loss | (0.03 | ) |
| (0.02 | ) |
| (14 | ) |
| (0.02 | ) |
| (0.01 | ) |
| (5 | ) | ||||||
Gross profit per pound/ounce | $ | 0.42 | |
| $ | 0.26 | |
| $ | 192 | |
| $ | 1.32 | |
| $ | 0.71 | |
| $ | 336 | |
|
|
|
|
|
|
|
|
|
|
|
| ||||||||||||
Copper sales (millions of recoverable pounds) | 196 | |
| 196 | |
|
|
| 196 | |
| 196 | |
|
| ||||||||
Gold sales (thousands of recoverable ounces) |
|
|
|
| 151 | |
|
|
|
|
| 346 | | ||||||||||
55
Table of Contents
|
|
|
|
|
|
|
|
|
|
|
| ||||||||||||
| Six Months Ended June 30, | ||||||||||||||||||||||
| 2016 |
| 2015 | ||||||||||||||||||||
| By-Product Method |
| Co-Product Method |
| By-Product Method |
| Co-Product Method | ||||||||||||||||
|
| Copper |
| Gold |
|
| Copper |
| Gold | ||||||||||||||
Revenues, excluding adjustments | $ | 2.17 | |
| $ | 2.17 | |
| $ | 1,260 | |
| $ | 2.66 | |
| $ | 2.66 | |
| $ | 1,183 | |
|
|
|
|
|
|
|
|
|
|
|
| ||||||||||||
Site production and delivery, before net noncash and other costs shown below | 1.99 | |
| 1.27 | |
| 740 | |
| 2.51 | |
| 1.41 | |
| 626 | | ||||||
Gold and silver credits | (1.27 | ) |
| - | |
| - | |
| (2.11 | ) |
| - | |
| - | | ||||||
Treatment charges | 0.30 | |
| 0.20 | |
| 113 | |
| 0.31 | |
| 0.17 | |
| 77 | | ||||||
Export duties | 0.08 | |
| 0.05 | |
| 29 | |
| 0.16 | |
| 0.09 | |
| 41 | | ||||||
Royalty on metals | 0.12 | |
| 0.07 | |
| 47 | |
| 0.17 | |
| 0.10 | |
| 42 | | ||||||
Unit net cash costs | 1.22 | |
| 1.59 | |
| 929 | |
| 1.04 | |
| 1.77 | |
| 786 | | ||||||
Depreciation and amortization | 0.47 | |
| 0.30 | |
| 175 | |
| 0.42 | |
| 0.24 | |
| 106 | | ||||||
Noncash and other costs, net | 0.04 | |
| 0.02 | |
| 14 | |
| 0.04 | |
| 0.02 | |
| 10 | | ||||||
Total unit costs | 1.73 | |
| 1.91 | |
| 1,118 | |
| 1.50 | |
| 2.03 | |
| 902 | | ||||||
Revenue adjustments, primarily for pricing on prior period open sales | - | |
| - | |
| 48 | |
| (0.15 | ) |
| (0.15 | ) |
| 14 | | ||||||
PT Smelting intercompany profit | - | |
| - | |
| 2 | |
| 0.01 | |
| 0.01 | |
| 2 | | ||||||
Gross profit per pound/ounce | $ | 0.44 | |
| $ | 0.26 | |
| $ | 192 | |
| $ | 1.02 | |
| $ | 0.49 | |
| $ | 297 | |
|
|
|
|
|
|
|
|
|
|
|
| ||||||||||||
Copper sales (millions of recoverable pounds) | 370 | |
| 370 | |
|
|
| 351 | |
| 351 | |
|
| ||||||||
Gold sales (thousands of recoverable ounces) |
|
|
|
| 346 | |
|
|
|
|
| 606 | | ||||||||||
A significant portion of PT-FI's costs are fixed and unit costs vary depending on volumes and other factors. Indonesia's unit net cash costs (including gold and silver credits) of $1.20 per pound of copper in second-quarter 2016 and $1.22 per pound of copper for the first six months of 2016 , were higher than $0.81 per pound of copper in second-quarter 2015 and $1.04 per pound of copper for the first six months of 2015 , primarily reflecting lower gold credits, partly offset by lower royalties, export duties and energy costs.
Treatment charges vary with the volume of metals sold and the price of copper, and royalties vary with the volume of metals sold and the prices of copper and gold.
Export duties were initially set at 7.5 percent and were reduced to 5.0 percent in July 2015 as a result of smelter development progress. Export duties totaled $16 million in second-quarter 2016, $36 million in second-quarter 2015, $29 million for the first six months of 2016 and $57 million for the first six months of 2015.
Because certain assets are depreciated on a straight-line basis, PT-FI's unit depreciation rate varies with the level of copper production and sales.
Revenue adjustments primarily result from changes in prices on provisionally priced copper sales recognized in prior periods. Refer to "Consolidated Results - Revenues" for further discussion of adjustments to prior period provisionally priced copper sales.
PT Smelting intercompany profit represents the change in the deferral of 25 percent of PT-FI's profit on sales to PT Smelting. Refer to "Operations - Smelting & Refining" for further discussion.
Based on current sales volume and cost estimates, and assuming an average gold price of $1,300 per ounce for the second half of 2016 , unit net cash costs (net of gold and silver credits) for Indonesia mining are expected to approximate $0.12 per pound of copper for the year 2016 and $0.43 per pound for third-quarter 2016. Indonesia mining's unit net cash costs for the year 2016 would change by approximately $0.05 per pound for each $50 per ounce change in the average price of gold. Because of the fixed nature of a large portion of Indonesia's costs, unit costs vary from quarter to quarter depending on copper and gold volumes. Anticipated higher ore grades from Grasberg are expected to result in lower unit net cash costs in the second half of 2016.
Molybdenum Mines
We have two wholly owned molybdenum mines in North America – the Henderson underground mine and the Climax open-pit mine, both in Colorado. The Henderson and Climax mines produce high-purity, chemical-grade molybdenum concentrate, which is typically further processed into value-added molybdenum chemical products.
56
Table of Contents
The majority of the molybdenum concentrate produced at the Henderson and Climax mines, as well as from our North and South America copper mines, is processed at our own conversion facilities.
Operating and Development Activities. In response to market conditions, the revised plans for our Henderson molybdenum mine incorporate lower operating rates, resulting in an approximate 65 percent reduction in Henderson's annual production volumes. We have also adjusted production plans at our by-product mines, including reduced production at the Sierrita mine. Additionally, we have incorporated changes in the commercial pricing structure for our chemical products to promote continuation of chemical-grade production.
Production from the Molybdenum mines totaled 7 million pounds of molybdenum in second-quarter 2016 and 14 million pounds of molybdenum for the first six months of 2016 , compared with 13 million pounds of molybdenum in second-quarter 2015 and 26 million pounds of molybdenum for the first six months of 2015 . Refer to "Consolidated Results" for our consolidated molybdenum operating data, which includes sales of molybdenum produced at our Molybdenum mines, and from our North and South America copper mines, and refer to "Outlook" for projected consolidated molybdenum sales volumes.
Unit Net Cash Costs Per Pound of Molybdenum. Unit net cash costs per pound of molybdenum is a measure intended to provide investors with information about the cash-generating capacity of our mining operations expressed on a basis relating to the primary metal product for our respective operations. We use this measure for the same purpose and for monitoring operating performance by our mining operations. This information differs from measures of performance determined in accordance with U.S. GAAP and should not be considered in isolation or as a substitute for measures of performance determined in accordance with U.S. GAAP. This measure is presented by other metals mining companies, although our measure may not be comparable to similarly titled measures reported by other companies.
Average unit net cash costs for our Molybdenum mines of $7.80 per pound of molybdenum in second-quarter 2016 and $7.61 per pound of molybdenum for the first six months of 2016 , were higher than average unit net cash costs of $7.19 per pound in second-quarter 2015 and $7.18 for the first six months of 2015 , primarily reflecting lower volumes. Assuming achievement of current sales volume and cost estimates, we estimate unit net cash costs for the Molybdenum mines to average $8.60 per pound of molybdenum for the year 2016 . Refer to "Product Revenues and Production Costs" for a reconciliation of unit net cash costs per pound to production and delivery costs applicable to sales reported in our consolidated financial statements.
Smelting and Refining
We wholly own and operate a smelter in Arizona (Miami smelter) and a smelter and refinery in Spain (Atlantic Copper). Additionally, PT-FI owns 25 percent of a smelter and refinery in Gresik, Indonesia (PT Smelting). Treatment charges for smelting and refining copper concentrate consist of a base rate per pound of copper and per ounce of gold and are generally fixed. Treatment charges represent a cost to our mining operations and income to Atlantic Copper and PT Smelting. Thus, higher treatment charges benefit our smelter operations and adversely affect our mining operations. Our North America copper mines are less significantly affected by changes in treatment charges because these operations are largely integrated with our Miami smelter. Through this form of downstream integration, we are assured placement of a significant portion of our concentrate production.
Atlantic Copper smelts and refines copper concentrate and markets refined copper and precious metals in slimes. During the first six months of 2016 , Atlantic Copper's concentrate purchases from our copper mining operations included 12 percent from our North America copper mines, 9 percent from South America mining and 7 percent from Indonesia mining, with the remainder purchased from third parties.
PT-FI's contract with PT Smelting provides for PT-FI to supply 100 percent of the copper concentrate requirements (subject to a minimum or maximum rate) necessary for PT Smelting to produce 205,000 metric tons of copper annually on a priority basis. PT-FI may also sell copper concentrate to PT Smelting at market rates for quantities in excess of 205,000 metric tons of copper annually. During the first six months of 2016 , PT-FI supplied approximately 85 percent of PT Smelting's concentrate requirements, and PT Smelting processed approximately half of PT-FI's concentrate production.
We defer recognizing profits on sales from our mining operations to Atlantic Copper and on 25 percent of PT-FI's sales to PT Smelting until final sales to third parties occur. Changes in these deferrals attributable to variability in intercompany volumes resulted in net (reductions) additions to net loss attributable to common stock of $(13) million in second-quarter 2016 , $13 million in second-quarter 2015 , $(11) million for the first six months of 2016 and $37
57
Table of Contents
million for the first six months of 2015 . Our net deferred profits on our inventories at Atlantic Copper and PT Smelting to be recognized in future periods' net income attributable to common stock from continuing operations totaled $31 million at June 30, 2016 . Quarterly variations in ore grades, the timing of intercompany shipments and changes in product prices will result in variability in our net deferred profits and quarterly earnings.
Oil and Gas
Through our wholly owned oil and gas subsidiary, FM O&G, our principal oil and gas assets include significant oil production facilities and growth potential in the Deepwater GOM and established oil production facilities in California.
During second-quarter 2016, FM O&G completed the sale of certain oil and gas royalty interests for $102 million (before closing adjustments), and in July 2016, completed the sale of the Haynesville shale assets for $87 million (before closing adjustments). Under full cost accounting rules, the proceeds from these transactions are recorded as a reduction of capitalized oil and gas properties, with no gain or loss recognition. Refer to Note 2 for further discussion of these transactions.
Impairment of Oil and Gas Properties. As discussed in Note 1, under full cost accounting rules, a "ceiling test" is conducted each quarter to review the carrying value of our oil and gas properties for impairment. The SEC requires the twelve-month average of the first-day-of-the-month historical reference oil price be used in determining the ceiling test limitation. The reference pricing in ceiling test impairment calculations may cause results that do not reflect current market conditions that exist at the end of an accounting period. For example, in periods of increasing oil and gas prices, the use of a twelve-month historical average price in the ceiling test calculation may result in an impairment. Conversely, in times of declining prices, ceiling test calculations may not result in an impairment.
Using West Texas Intermediate (WTI) as the reference oil price, the average price was $43.12 per barrel at June 30, 2016 , compared with $46.26 per barrel at March 31, 2016. At June 30, 2016, and March 31, 2016, net capitalized costs exceeded the ceiling test limitation under full cost accounting rules, which resulted in the recognition of impairment charges totaling $291 million in second-quarter 2016 and $4.1 billion for the first six months of 2016 .
If the twelve-month historical average price remains below the June 30, 2016 , twelve-month average of $43.12 per barrel, the ceiling test limitation will decrease, potentially resulting in additional ceiling test impairments of our oil and gas properties. The WTI spot oil price was $41.60 per barrel at July 29, 2016 . In addition to a decline in the trailing twelve-month average oil and gas prices, other factors that could result in future impairment of our oil and gas properties include costs transferred from unevaluated properties to the full cost pool without corresponding proved oil and gas reserve additions, negative reserve revisions and the capitalization of future exploration and development costs. At June 30, 2016 , carrying costs for unevaluated properties excluded from amortization totaled $1.7 billion . These costs will be transferred into the full cost pool as the properties are evaluated and proved reserves are established or if impairment is determined. If these activities do not result in additions to discounted future net cash flows from proved oil and gas reserves at least equal to the related costs transferred (net of related tax effects), additional ceiling test impairments may occur.
58
Table of Contents
U.S. Oil & Gas Operating Data. Following is summary operating results for the U.S. oil and gas operations for the second quarters and first six months of 2016 and 2015 :
|
| Three Months Ended June 30, |
| Six Months Ended June 30, |
| ||||||||||||
|
| 2016 |
| 2015 |
| 2016 |
| 2015 |
| ||||||||
Sales Volumes |
|
|
|
|
|
|
|
|
| ||||||||
Oil (MMBbls) |
| 8.7 | |
| 8.6 | |
| 17.0 | |
| 17.0 | |
| ||||
Natural gas (Bcf) |
| 18.8 | |
| 23.5 | |
| 38.4 | |
| 45.3 | |
| ||||
NGLs (MMBbls) |
| 0.6 | |
| 0.6 | |
| 1.2 | |
| 1.1 | |
| ||||
MMBOE |
| 12.4 | |
| 13.1 | |
| 24.5 | |
| 25.6 | |
| ||||
|
|
|
|
|
|
|
|
|
| ||||||||
Average Realized Prices a |
|
|
|
|
|
|
|
|
| ||||||||
Oil (per barrel) |
| $ | 41.10 | |
| $ | 67.61 | | b | $ | 35.21 | |
| $ | 62.13 | | b |
Natural gas (per MMBtu) |
| $ | 2.04 | |
| $ | 2.66 | |
| $ | 2.02 | |
| $ | 2.75 | |
|
NGLs (per barrel) |
| $ | 18.00 | |
| $ | 20.50 | |
| $ | 16.44 | |
| $ | 21.71 | |
|
|
|
|
|
|
|
|
|
|
| ||||||||
Gross Loss per BOE |
|
|
|
|
|
|
|
|
| ||||||||
Realized revenues a |
| $ | 32.70 | |
| $ | 50.04 | | b | $ | 28.29 | |
| $ | 46.95 | | b |
Cash production costs a |
| (15.00 | ) |
| (19.04 | ) |
| (15.42 | ) |
| (19.62 | ) |
| ||||
Cash operating margin a |
| 17.70 | |
| 31.00 | |
| 12.87 | |
| 27.33 | |
| ||||
Depreciation, depletion and amortization |
| (17.61 | ) |
| (36.99 | ) |
| (19.27 | ) |
| (39.59 | ) |
| ||||
Impairment of oil and gas properties |
| (23.46 | ) |
| (204.91 | ) |
| (165.56 | ) |
| (225.89 | ) |
| ||||
Accretion and other costs c |
| (56.76 | ) |
| (2.46 | ) |
| (37.41 | ) |
| (2.39 | ) |
| ||||
Net noncash mark-to-market losses on derivative contracts |
| - | |
| (7.26 | ) |
| - | |
| (5.60 | ) |
| ||||
Other revenues |
| 0.42 | |
| 0.61 | |
| 0.45 | |
| 0.34 | |
| ||||
Gross loss |
| $ | (79.71 | ) |
| $ | (220.01 | ) |
| $ | (208.92 | ) |
| $ | (245.80 | ) |
|
a. | Cash operating margin for oil and gas operations reflects realized revenues less cash production costs. Cash production costs exclude accretion and other costs. For reconciliations of realized revenues (including average realized prices for oil, natural gas and NGLs) and cash production costs to revenues and production and delivery costs reported in our consolidated financial statements, refer to "Product Revenues and Production Costs." |
b. | Includes realized cash gains on crude oil derivative contracts of $7.73 per BOE ( $11.79 per barrel of oil) in second-quarter 2015 and $7.87 per BOE ( $11.88 per barrel of oil) for the first six months of 2015 . FCX currently does not have oil and gas derivative contracts in place for 2016 or future years. |
c. | Includes charges of $55.91 per BOE in second-quarter 2016 and $36.36 per BOE for the first six months of 2016 , primarily for the termination and settlement of drillship contracts and inventory write downs. Includes charges of $1.72 per BOE in second-quarter 2015 and $1.54 per BOE for the first six months of 2015 , primarily for idle rig costs and inventory write downs. |
FM O&G's average realized price for crude oil was $41.10 per barrel ( 87 percent of the average Brent crude oil price of $47.03 per barrel) in second-quarter 2016 and $35.21 per barrel ( 85 percent of the average Brent crude oil price of $41.21 per barrel) for the first six months of 2016 .
FM O&G's average realized price for natural gas was $2.04 per MMBtu in second-quarter 2016 , compared to the NYMEX natural gas price average of $1.95 per MMBtu for the April through June 2016 contracts; and $2.02 per MMBtu for the first six months of 2016 , compared to the NYMEX natural gas price average of $2.01 per MMBtu for the January through June 2016 contracts.
Realized revenues for oil and gas operations of $32.70 per BOE in second-quarter 2016 and $28.29 per BOE for the first six months of 2016 were lower than realized revenues of $50.04 per BOE in second-quarter 2015 and $46.95 per BOE for the first six months of 2015, primarily reflecting lower oil prices and the impact of realized cash gains on derivative contracts of $7.73 per BOE in second-quarter 2015 and $7.87 per BOE for the first six months of 2015.
Cash production costs for oil and gas operations of $15.00 per BOE in second-quarter 2016 and $15.42 per BOE for the first six months of 2016 were lower than cash production costs of $19.04 per BOE in second-quarter 2015 and $19.62 per BOE for the first six months of 2015, primarily reflecting higher production from GOM wells and ongoing cost reduction efforts.
59
Table of Contents
Following is a summary of average sales volumes per day by region for oil and gas operations for the second quarters and first six months of 2016 and 2015 :
| Three Months Ended June 30, |
| Six Months Ended June 30, |
| ||||||||
| 2016 |
| 2015 |
| 2016 |
| 2015 |
| ||||
Sales Volumes (MBOE per day): |
|
|
|
|
|
|
|
| ||||
GOM a | 88 | |
| 80 | |
| 85 | |
| 77 | |
|
California | 32 | |
| 38 | |
| 32 | |
| 39 | |
|
Haynesville/Madden/Other b | 16 | |
| 26 | |
| 18 | |
| 26 | |
|
Total oil and gas operations | 136 | |
| 144 | |
| 135 | |
| 142 | |
|
a. | Includes sales from properties on the GOM Shelf and in the Deepwater GOM, and the Inboard Lower Tertiary/Cretaceous natural gas trend. |
b. | In July 2016, FM O&G completed the sale of the Haynesville shale assets. |
Daily sales volumes averaged 136 MBOE in second-quarter 2016 , including 95 thousand barrels (MBbls) of crude oil, 207 million cubic feet (MMcf) of natural gas and 6 MBbls of NGLs, and 135 MBOE for the first six months of 2016 , including 93 MBbls of crude oil, 211 million cubic feet (MMcf) of natural gas and 6 MBbls of NGLs. During the first six months of 2016, FM O&G commenced production from six 100-percent-owned Deepwater GOM wells. Oil and gas sales volumes are expected to average 130 MBOE per day for the year 2016 , comprised of 73 percent oil, 22 percent natural gas and 5 percent NGLs.
In late June 2016, a fire at a third-party natural gas processing plant in Pascagoula, Mississippi resulted in the shutdown of the plant and the pipeline that transports gas supply from several offshore platforms, including FM O&G's Horn Mountain and Marlin facilities (representing approximately 45 percent of FM O&G's GOM BOE production). As a result, production has been temporarily constrained and FM O&G is currently accessing an alternative pipeline as an interim solution. FM O&G is working with third parties on alternative routes to resume normal production and does not expect long-term impacts from this event.
Based on current sales volume and cost estimates, cash production costs are expected to approximate $15.50 per BOE for the year 2016 .
Oil and Gas Exploration, Operating and Development Activities. In second-quarter 2016, FM O&G remained focused on managing costs and enhancing asset values in response to the current market environment. FM O&G achieved a number of important operational milestones during the quarter, including the commencement of production from five 100-percent-owned Deepwater GOM tieback wells, including three at Holstein Deep and two in the Horn Mountain area. At Lucius and Heidelberg, the operator drilled development wells with favorable results that we believe will further benefit future oil production.
During second-quarter 2016, we negotiated the termination and settlement of FM O&G's drilling rig contracts with Noble Drilling (U.S.) LLC (Noble) and Rowan Companies plc (Rowan). As a result of the settlements, FM O&G was released from a total of $1.1 billion in payment obligations under its three drilling rig contracts. In aggregate, reductions in previously contracted commitments for deepwater drillships approximate $350 million. During second-quarter 2016, we issued 48 million shares of our common stock (representing a value of $540 million) and paid $85 million in cash in connection with the settlements (the remaining $130 million will be paid during third-quarter 2016). We also agreed to provide contingent payments of up to $105 million, depending on the average price of crude oil over the 12-month period ending June 30, 2017. A net charge of $0.6 billion was recorded in second-quarter 2016 associated with the termination of these contracts.
Since commencing development activities in 2014 at its three 100-percent-owned production platforms in the Deepwater GOM, FM O&G has drilled 14 wells in producing fields with positive results, ten of these wells have been brought on production, including five wells during second-quarter 2016.
Oil and Gas Capital Expenditures . Capital expenditures for our oil and gas operations in second-quarter 2016 totaled $388 million in the U.S. (including $205 million incurred for GOM and approximately $150 million associated with the change in capital expenditure accruals) and $4 million for international oil and gas properties. Capital expenditures for our oil and gas operations for the first six months of 2016 totaled $868 million in the U.S. (including $482 million incurred for GOM and $374 million associated with the change in capital expenditure accruals) and $47 million for international oil and gas properties, primarily associated with Morocco.
60
Table of Contents
Capital expenditures for oil and gas operations are estimated to total $1.4 billion for the year 2016 , with approximately 90 percent of the capital budget expected to be directed to the GOM.
Deepwater GOM . FM O&G operates and owns 100-percent working interests in the Holstein, Marlin and Horn Mountain deepwater production platforms, which in total have processing capacity of 250 MBbls of oil per day. In addition, FM O&G has interests in the Lucius, Heidelberg, Ram Powell and Hoover producing oil fields and in the Atwater Valley undeveloped area.
During second-quarter 2016, production from six wells in the Lucius field in the Keathly Canyon area averaged 20 MBOE per day, net to FM O&G's 25-percent working interest. The field has performed well since initial production commenced in first-quarter 2015. In second-quarter 2016, the operator completed the seventh well in the field. Approximately 80 percent of FM O&G's working interest is held through its consolidated subsidiary Plains Offshore Operations Inc. (POI). As further discussed in Note 2 of our annual report on Form 10-K for the year ended December 31, 2015, third parties hold a preferred interest in POI and are entitled to a liquidation preference and to receive preferred distributions.
In January 2016, first oil production commenced from three initial subsea wells in the Heidelberg oil field in the Green Canyon area. Heidelberg is a subsea oil development consisting of five subsea wells tied back to a truss spar hull located in 5,300 feet of water. In second-quarter 2016, the operator commenced drilling a fourth well in the field and in July 2016, logging results confirmed oil pay with similar characteristics to a good offset producing well. The fifth and final well of the initial development phase commenced drilling in third-quarter 2016. Heidelberg field was discovered in February 2009, and the subsequent development project was sanctioned in early 2013. FM O&G has a 12.5-percent working interest in Heidelberg.
At the 100-percent-owned Holstein Deep, three wells commenced production in second-quarter 2016 and are currently producing at a gross rate of approximately 9 MBOE per day, which are below previous estimates reflecting lower than expected crude oil quality and lower permeability. The Holstein Deep development is located in Green Canyon Block 643, west of the 100-percent-owned Holstein platform in 3,890 feet of water, with production facilities capable of processing 113 MBbls of oil per day.
FM O&G's 100-percent-owned Horn Mountain is located in the Mississippi Canyon area and has production facilities capable of processing 75 MBbls of oil per day. The Quebec/Victory and Kilo/Oscar wells commenced production in second-quarter 2016. To enhance recovery of remaining oil in place, future development plans will target subsea tieback from multiple stacked sands in the area.
FM O&G's well inventory also includes the Horn Mountain Deep discovery well, where successful drilling results in 2015 indicated the presence of sand sections deeper than known pay sections in the field. These positive results and geophysical data support the existence of Middle Miocene reservoir potential for additional development opportunities in the Horn Mountain Deep area, including five 100-percent-owned exploration prospects with significant future potential. FM O&G controls rights to over 55,000 acres associated with these prospects.
FM O&G's 100-percent-owned Marlin Hub is located in the Mississippi Canyon area and has production facilities capable of processing 60 MBbls of oil per day. FM O&G has drilled five successful tieback opportunities in the area since 2014. The King D-12 and Dorado wells commenced production in 2015, and the King D-13 well commenced production in first-quarter 2016.
DISCONTINUED OPERATIONS
Africa Mining
Africa mining includes the Tenke minerals district. As further discussed in Note 2 , in May 2016, we entered into a definitive agreement to sell our interest in TFHL, through which we hold an effective 56 percent interest in the Tenke copper and cobalt mining concessions in the Southeast region of the DRC.
The Tenke operation includes open-pit mining, leaching and SX/EW operations. Copper production from the Tenke minerals district is sold as copper cathode. In addition to copper, the Tenke minerals district produces cobalt hydroxide.
61
Table of Contents
Operating and Development Activities. Revised plans at Tenke incorporate a 50 percent reduction in capital
spending for 2016 and various initiatives to reduce operating, administrative and exploration costs. A sulphuric acid plant was successfully commissioned in first-quarter 2016, which will reduce requirements for third-party
acid purchases.
Operating Data. Following is a summary of consolidated operating data for our Africa mining operations for the second quarters and first six months of 2016 and 2015 :
| Three Months Ended June 30, |
| Six Months Ended June 30, | ||||||||||||
| 2016 |
| 2015 |
| 2016 |
| 2015 | ||||||||
Copper (recoverable) |
|
|
|
|
|
|
| ||||||||
Production (millions of pounds) | 122 | |
| 115 | |
| 232 | |
| 231 | | ||||
Sales (millions of pounds) | 124 | |
| 104 | |
| 247 | |
| 237 | | ||||
Average realized price per pound a | $ | 2.07 | |
| $ | 2.63 | |
| $ | 2.08 | |
| $ | 2.66 | |
|
|
|
|
|
|
|
| ||||||||
Cobalt (contained) |
|
|
|
|
|
|
| ||||||||
Production (millions of pounds) | 10 | |
| 9 | |
| 19 | |
| 16 | | ||||
Sales (millions of pounds) | 10 | |
| 8 | |
| 20 | |
| 16 | | ||||
Average realized price per pound | $ | 6.58 | |
| $ | 9.27 | |
| $ | 6.52 | |
| $ | 9.23 | |
|
|
|
|
|
|
|
| ||||||||
Ore milled (metric tons per day) | 15,900 | |
| 15,300 | |
| 15,500 | |
| 14,900 | | ||||
Average ore grades (percent): |
|
|
|
|
|
|
| ||||||||
Copper | 4.05 | |
| 4.02 | |
| 4.01 | |
| 4.18 | | ||||
Cobalt | 0.43 | |
| 0.44 | |
| 0.46 | |
| 0.40 | | ||||
Copper recovery rate (percent) | 94.5 | |
| 93.9 | |
| 93.7 | |
| 93.9 | | ||||
a. | Includes point-of-sale transportation costs as negotiated in customer contracts. |
Africa mining's copper sales of 124 million pounds in second-quarter 2016 and 247 million pounds for the first six months of 2016 , were higher than 104 million pounds in second-quarter 2015 and 237 million pounds for the first six months of 2015 , primarily reflecting higher mining rates and timing of shipments. The first six months of 2016 were also impacted by lower ore grades.
Africa mining's sales for 2016 (through the anticipated closing date) are expected to approximate 440 million pounds of copper and 35 million pounds of cobalt, compared with 467 million pounds of copper and 35 million pounds of cobalt for the year 2015 .
Unit Net Cash Costs. Unit net cash costs per pound of copper is a measure intended to provide investors with information about the cash-generating capacity of our mining operations expressed on a basis relating to the primary metal product for our respective operations. We use this measure for the same purpose and for monitoring operating performance by our mining operations. This information differs from measures of performance determined in accordance with U.S. GAAP and should not be considered in isolation or as a substitute for measures of performance determined in accordance with U.S. GAAP. This measure is presented by other metals mining companies, although our measure may not be comparable to similarly titled measures reported by other companies.
62
Table of Contents
Gross Profit per Pound of Copper and Cobalt. The following tables summarize the unit net cash costs and gross profit per pound of copper and cobalt at our Africa mining operations for the second quarters and first six months of 2016 and 2015 . Refer to "Production Revenues and Production Costs" for an explanation of "by-product" and "co-product" methods and a reconciliation of unit net cash costs per pound to net (loss) income from discontinued operations reported in our consolidated financial statements.
| Three Months Ended June 30, | ||||||||||||||||||||||
| 2016 |
| 2015 | ||||||||||||||||||||
| By-Product Method |
| Co-Product Method |
| By-Product Method |
| Co-Product Method | ||||||||||||||||
|
| Copper |
| Cobalt |
|
| Copper |
| Cobalt | ||||||||||||||
Revenues, excluding adjustments a | $ | 2.07 | |
| $ | 2.07 | |
| $ | 6.58 | |
| $ | 2.63 | |
| $ | 2.63 | |
| $ | 9.27 | |
|
|
|
|
|
|
|
|
|
|
|
| ||||||||||||
Site production and delivery, before net noncash and other costs shown below | 1.62 | |
| 1.42 | |
| 5.03 | |
| 1.54 | |
| 1.35 | |
| 5.48 | | ||||||
Cobalt credits b | (0.33 | ) |
| - | |
| - | |
| (0.53 | ) |
| - | |
| - | | ||||||
Royalty on metals | 0.05 | |
| 0.04 | |
| 0.11 | |
| 0.06 | |
| 0.05 | |
| 0.16 | | ||||||
Unit net cash costs | 1.34 | |
| 1.46 | |
| 5.14 | |
| 1.07 | |
| 1.40 | |
| 5.64 | | ||||||
Depreciation, depletion and amortization | 0.49 | |
| 0.41 | |
| 1.07 | |
| 0.55 | |
| 0.43 | |
| 1.42 | | ||||||
Noncash and other costs, net | 0.09 | |
| 0.08 | |
| 0.20 | |
| 0.03 | |
| 0.03 | |
| 0.10 | | ||||||
Total unit costs | 1.92 | |
| 1.95 | |
| 6.41 | |
| 1.65 | |
| 1.86 | |
| 7.16 | | ||||||
Revenue adjustments, primarily for pricing on prior period open sales | (0.01 | ) |
| (0.01 | ) |
| 0.17 | |
| 0.02 | |
| 0.02 | |
| 0.50 | | ||||||
Gross profit per pound | $ | 0.14 | |
| $ | 0.11 | |
| $ | 0.34 | |
| $ | 1.00 | |
| $ | 0.79 | |
| $ | 2.61 | |
|
|
|
|
|
|
|
|
|
|
|
| ||||||||||||
Copper sales (millions of recoverable pounds) | 124 | |
| 124 | |
|
|
| 104 | |
| 104 | |
|
| ||||||||
Cobalt sales (millions of contained pounds) |
|
|
|
| 10 | |
|
|
|
|
| 8 | | ||||||||||
|
|
|
|
|
|
|
|
|
|
|
| ||||||||||||
| Six Months Ended June 30, | ||||||||||||||||||||||
| 2016 |
| 2015 | ||||||||||||||||||||
| By-Product Method |
| Co-Product Method |
| By-Product Method |
| Co-Product Method | ||||||||||||||||
|
| Copper |
| Cobalt |
|
| Copper |
| Cobalt | ||||||||||||||
Revenues, excluding adjustments a | $ | 2.08 | |
| $ | 2.08 | |
| $ | 6.52 | |
| $ | 2.66 | |
| $ | 2.66 | |
| $ | 9.23 | |
|
|
|
|
|
|
|
|
|
|
|
| ||||||||||||
Site production and delivery, before net noncash and other costs shown below | 1.63 | |
| 1.42 | |
| 4.99 | |
| 1.56 | |
| 1.37 | |
| 5.54 | | ||||||
Cobalt credits b | (0.35 | ) |
| - | |
| - | |
| (0.44 | ) |
| - | |
| - | | ||||||
Royalty on metals | 0.05 | |
| 0.03 | |
| 0.11 | |
| 0.06 | |
| 0.05 | |
| 0.15 | | ||||||
Unit net cash costs | 1.33 | |
| 1.45 | |
| 5.10 | |
| 1.18 | |
| 1.42 | |
| 5.69 | | ||||||
Depreciation, depletion and amortization | 0.49 | |
| 0.41 | |
| 1.05 | |
| 0.55 | |
| 0.46 | |
| 1.31 | | ||||||
Noncash and other costs, net | 0.05 | |
| 0.04 | |
| 0.11 | |
| 0.03 | |
| 0.03 | |
| 0.08 | | ||||||
Total unit costs | 1.87 | |
| 1.90 | |
| 6.26 | |
| 1.76 | |
| 1.91 | |
| 7.08 | | ||||||
Revenue adjustments, primarily for pricing on prior period open sales | (0.02 | ) |
| (0.02 | ) |
| 0.19 | |
| (0.03 | ) |
| (0.03 | ) |
| (0.04 | ) | ||||||
Gross profit per pound | $ | 0.19 | |
| $ | 0.16 | |
| $ | 0.45 | |
| $ | 0.87 | |
| $ | 0.72 | |
| $ | 2.11 | |
|
|
|
|
|
|
|
|
|
|
|
| ||||||||||||
Copper sales (millions of recoverable pounds) | 247 | |
| 247 | |
|
|
| 237 | |
| 237 | |
|
| ||||||||
Cobalt sales (millions of contained pounds) |
|
|
|
| 20 | |
|
|
|
|
| 16 | | ||||||||||
a. | Includes point-of-sale transportation costs as negotiated in customer contracts. |
b. | Net of cobalt downstream processing and freight costs. |
Unit net cash costs (net of cobalt credits) for Africa mining of $1.34 per pound of copper in second-quarter 2016 and $1.33 per pound of copper for the first six months of 2016 , were higher than unit net cash costs of $1.07 per pound of copper in second-quarter 2015 and $1.18 per pound of copper for the first six months of 2015 , primarily reflecting lower cobalt credits.
Because certain assets are depreciated on a straight-line basis, Africa mining's unit depreciation rate may vary with the level of copper production and sales.
Based on current sales volume and cost estimates and assuming an average cobalt price of $11 per pound for the second half of 2016 , unit net cash costs (net of cobalt credits) for Africa mining are expected to approximate $1.28
63
Table of Contents
per pound of copper for the year 2016 . Africa mining's unit net cash costs for the year 2016 would change by $0.045 per pound for each $2 per pound change in the average price of cobalt.
CAPITAL RESOURCES AND LIQUIDITY
Our operating cash flows vary with prices realized from copper, gold, molybdenum and oil sales, our sales volumes, production costs, income taxes, other working capital changes and other factors. In response to weak market conditions, we have taken actions to enhance our financial position, including significant reductions in capital spending, production curtailments at certain North and South America mines and actions to reduce operating, exploration and administrative costs.
In addition to reducing costs and capital expenditures to maximize cash flows from our global business, we have announced plans to sell assets to repay debt. During second-quarter 2016, we completed asset sales for aggregate consideration of $1.3 billion, primarily associated with the Morenci and Timok transactions and the sale of certain oil and gas royalty interests. In July 2016, we completed the sale of our Haynesville shale assets for $87 million (before closing adjustments), and we expect to complete the sale of our interest in TFHL for $2.65 billion in fourth-quarter 2016 (subject to regulatory and other approvals). Refer to Note 2 for further discussion of these disposal transactions. While additional asset sales may be considered, including potential sales of oil and gas properties, we remain focused on retaining a high-quality portfolio of long-lived copper assets positioned to generate value as market conditions improve. In addition to debt reduction plans, we are pursuing opportunities to create additional value through mine designs that would increase copper reserves, reduce costs and provide opportunities to enhance net present values, and we continue to advance studies for future development of our copper resources, the timing of which will be dependent on market conditions.
On July 27, 2016, we commenced a new registered at-the-market offering of up to $1.5 billion of our common stock. Through August 4, 2016 , we have sold 13 million shares of our common stock for gross proceeds of $167 million ( $12.69 per share average price). Refer to Note 13 for further discussion. We believe the proceeds of this offering, together with previously announced asset sale transactions and anticipated cash flow from operations, will enable us to reduce debt.
We will continue to evaluate opportunities for transactions, which may include open-market purchases of our debt, debt for debt exchanges, and privately negotiated exchanges of our debt for equity or equity-linked securities. We may also issue additional debt or convertible securities to repay or refinance existing debt. The completion and amount of these transactions, if any, are subject to a number of factors, including market conditions, our financial position and our ability to complete such transactions on economically attractive terms.
Cash
Following is a summary of the U.S. and international components of consolidated cash and cash equivalents available to the parent company (excluding cash and cash equivalents in assets held for sale of $78 million at June 30, 2016, and $29 million at December 31, 2015), net of noncontrolling interests' share, taxes and other costs (in millions):
| June 30, 2016 |
| December 31, 2015 | ||||
Cash at domestic companies | $ | 20 | |
| $ | 6 | |
Cash at international operations | 332 | |
| 189 | | ||
Total consolidated cash and cash equivalents | 352 | |
| 195 | | ||
Noncontrolling interests' share | (102 | ) |
| (36 | ) | ||
Cash, net of noncontrolling interests' share | 250 | |
| 159 | | ||
Withholding taxes and other | (23 | ) |
| (11 | ) | ||
Net cash available | $ | 227 | |
| $ | 148 | |
Cash held at our international operations is generally used to support our foreign operations' capital expenditures, operating expenses, working capital and other tax payments, or other cash needs. Management believes that
sufficient liquidity is available in the U.S. from cash balances and availability from our revolving credit facility and uncommitted lines of credit. We have not elected to permanently reinvest earnings from our foreign subsidiaries, and we have recorded deferred tax liabilities for foreign earnings that are available to be repatriated to the U.S. From time to time, our foreign subsidiaries distribute earnings to the U.S. through dividends that are subject to applicable withholding taxes and noncontrolling interests' share.
64
Table of Contents
Debt
Following is a summary of our total debt and the related weighted-average interest rates (in billions, except percentages):
| June 30, 2016 |
| December 31, 2015 |
| |||||||||
|
|
| Weighted- |
|
|
| Weighted- |
| |||||
|
|
| Average |
|
|
| Average |
| |||||
|
|
| Interest Rate |
|
|
| Interest Rate |
| |||||
FCX Senior Notes | $ | 11.6 | |
| 3.8% |
| $ | 11.9 | |
| 3.8 | % |
|
FCX Term Loan | 2.5 | | a | 3.2% |
| 3.0 | |
| 2.2 | % |
| ||
FM O&G LLC Senior Notes | 2.5 | |
| 6.6% |
| 2.5 | |
| 6.6 | % |
| ||
Cerro Verde Credit Facility | 1.8 | |
| 2.8% |
| 1.8 | |
| 2.8 | % |
| ||
Other | 0.9 | |
| 4.7% |
| 1.2 | |
| 3.9 | % |
| ||
Total debt | $ | 19.3 | |
| 4.0% |
| $ | 20.4 | |
| 3.8 | % |
|
|
|
|
|
|
|
|
|
| |||||
a. In accordance with the mandatory prepayment provision of the amended Term Loan, 50 percent of the proceeds associated with the Tenke sale must be applied toward repaying the Term Loan.
At June 30, 2016 , we had $40 million in letters of credit issued and availability of $3.5 billion under the revolving credit facility.
Through August 4, 2016, we have retired $369 million of our senior notes (including $268 million during second-quarter 2016) maturing in 2022, 2023, 2034 and 2043 for 28 million shares of our common stock in a series of privately negotiated transactions at a cost of $311 million. These transactions will reduce annual interest expense by $17 million.
Refer to Note 6 for further discussion of debt.
Operating Activities
During the first six months of 2016 , we generated consolidated operating cash flows of $1.6 billion (including $466 million in working capital sources and changes in other tax payments), compared with consolidated operating cash flows for the first six months of 2015 of $1.8 billion (net of $190 million for working capital uses and changes in other tax payments). Lower consolidated operating cash flows for the first six months of 2016 , compared with the first six months of 2015 , primarily reflect lower copper price realizations and lower gold sales volumes, partly offset by an increase in working capital sources mostly resulting from cost reduction initiatives and lower tax payments primarily in South America and the DRC. Additionally, working capital uses and changes in other tax payments for the first six months of 2015 included tax payments of approximately $0.3 billion associated with our November 2014 sale of Candelaria.
Based on current operating plans and subject to future commodity prices for copper, gold, molybdenum and crude oil, we expect estimated consolidated operating cash flows for the year 2016, plus available cash and availability under our credit facility and uncommitted lines of credit, to be sufficient to fund our budgeted capital expenditures, scheduled debt maturities, noncontrolling interest distributions and other cash requirements for the year. Refer to "Outlook" for further discussion of projected operating cash flows for the year 2016 .
Investing Activities
Capital Expenditures. Capital expenditures, including capitalized interest, totaled $1.8 billion for the first six months of 2016 , consisting of $900 million for mining operations (including $0.7 billion for major projects) and $915 million for oil and gas operations. Capital expenditures, including capitalized interest, totaled $3.5 billion for the first six months of 2015 , consisting of $1.7 billion for mining operations (including $1.2 billion for major projects) and $1.8 billion for oil and gas operations. Lower capital expenditures for the first six months of 2016 , compared with the first six months of 2015 , primarily reflect a decrease in major mining projects associated with the completion of the Cerro Verde expansion and a decrease in oil and gas activities in Deepwater GOM. Refer to "Operations" for further discussion.
Dispositions. During second-quarter 2016, we completed previously announced asset sales including the $1.0 billion sale of an additional 13 percent undivided interest in Morenci, the sale of an interest in the Timok exploration
65
Table of Contents
project in Serbia and the sale of certain oil and gas royalty interests. Refer to Note 2 for further discussion of these transactions.
Financing Activities
Debt Transactions. Net repayments of debt for the first six months of 2016 primarily reflected $568 million of payments on the Term Loan and the retirement of $268 million of our senior notes through a series of privately negotiated transactions. Refer to Note 6 for further discussion of debt.
Net proceeds from debt for the first six months of 2015 primarily included net borrowings of $1.0 billion under our revolving credit facility and borrowings of $0.8 billion under Cerro Verde's senior unsecured credit facility to fund the expansion project.
Dividends. The Board reduced our annual common stock dividend from $1.25 per share to $0.20 per share in March 2015, and subsequently suspended the annual common stock dividend in December 2015. Common stock dividends of $5 million for the first six months of 2016 relate to accumulated dividends paid for vested stock-based compensation. The declaration of dividends is at the discretion of our Board and will depend upon our financial results, cash requirements, future prospects and other factors deemed relevant by our Board. Additionally, in connection with the February 2016 amendment to the revolving credit facility and Term Loan, we are not permitted to pay dividends on our common stock on or prior to March 31, 2017.
Cash dividends and other distributions paid to noncontrolling interests totaled $39 million for the first six months of 2016 and $60 million for the first six months of 2015 . These payments will vary based on the cash requirements of the related consolidated subsidiaries.
CONTRACTUAL OBLIGATIONS
As further discussed in Note 9 and "Operations - Oil and Gas," during second-quarter 2016, we terminated FM O&G's three drilling rig contracts for $755 million (excluding contingent consideration) and settled aggregate commitments totaling $1.1 billion. Additionally, as further discussed in Note 6 and "Capital Resources and Liquidity," during the first six months of 2016, we have reduced our December 31, 2015, debt balance by $1.1 billion. There have been no other material changes in our contractual obligations since December 31, 2015 . Refer to Part II, Items 7. and 7A. in our annual report on Form 10-K for the year ended December 31, 2015 , for further information regarding our contractual obligations.
CONTINGENCIES
Environmental and Asset Retirement Obligations
Our current and historical operating activities are subject to stringent laws and regulations governing the protection of the environment. We perform a comprehensive annual review of our environmental and asset retirement obligations and also review changes in facts and circumstances associated with these obligations at least quarterly. There have been no material changes to our environmental and asset retirement obligations since December 31, 2015. Updated cost assumptions, including increases and decreases to cost estimates, changes in the anticipated scope and timing of remediation activities, and settlement of environmental matters may result in additional revisions to certain of our environmental obligations. Refer to Note 12 in our annual report on Form 10-K for the year ended December 31, 2015 , for further information regarding our environmental and asset retirement obligations.
Litigation and Other Contingencies
Other than as discussed in Note 9 , there have been no material changes to our contingencies associated with legal proceedings and other matters since December 31, 2015 . Refer to Note 12 and "Legal Proceedings" contained in Part I, Item 3. of our annual report on Form 10-K for the year ended December 31, 2015 , for further information regarding legal proceedings and other matters.
NEW ACCOUNTING STANDARDS
Refer to Note 12 for discussion of recently issued accounting standards and their impact on our future financial statements and disclosures.
66
Table of Contents
PRODUCT REVENUES AND PRODUCTION COSTS
Mining Product Revenues and Unit Net Cash Cost
Unit net cash costs per pound of copper and molybdenum are measures intended to provide investors with information about the cash-generating capacity of our mining operations expressed on a basis relating to the primary metal product for the respective operations. We use this measure for the same purpose and for monitoring operating performance by our mining operations. This information differs from measures of performance determined in accordance with U.S. GAAP and should not be considered in isolation or as a substitute for measures of performance determined in accordance with U.S. GAAP. This measure is presented by other metals mining companies, although our measures may not be comparable to similarly titled measures reported by other companies.
We present gross profit per pound of copper in the following tables using both a "by-product" method and a "co-product" method. We use the by-product method in our presentation of gross profit per pound of copper because (i) the majority of our revenues are copper revenues, (ii) we mine ore, which contains copper, gold, molybdenum and other metals, (iii) it is not possible to specifically assign all of our costs to revenues from the copper, gold, molybdenum and other metals we produce, (iv) it is the method used to compare mining operations in certain industry publications and (v) it is the method used by our management and our Board to monitor operations. In the co-product method presentations below, shared costs are allocated to the different products based on their relative revenue values, which will vary to the extent our metals sales volumes and realized prices change.
We show revenue adjustments for prior period open sales as a separate line item. Because these adjustments do not result from current period sales, we have reflected these separately from revenues on current period sales. Noncash and other costs consist of items such as stock-based compensation costs, start-up costs, inventory adjustments, long-lived asset impairments, restructuring and/or unusual charges. They are removed from site production and delivery costs in the calculation of unit net cash costs. As discussed above, gold, molybdenum and other metal revenues at copper mines are reflected as credits against site production and delivery costs in the by-product method. The following schedules for our mining operations are presentations under both the by-product and co-product methods together with reconciliations to amounts reported in our consolidated financial statements.
U.S. Oil and Gas Product Revenues and Cash Production Costs per Unit
Realized revenues and cash production costs per unit are measures intended to provide investors with information about the cash operating margin of our oil and gas operations. We use this measure for the same purpose and for monitoring operating performance by our oil and gas operations. This information differs from measures of performance determined in accordance with U.S. GAAP and should not be considered in isolation or as a substitute for measures of performance determined in accordance with U.S. GAAP. Our measures may not be comparable to similarly titled measures reported by other companies.
Accretion charges for asset retirement obligations and other costs, such as drillship settlements/idle rig costs, inventory write downs and/or unusual charges, are removed from production and delivery costs in the calculation of cash production costs per BOE. Additionally, in the 2015 periods, we had crude oil derivative contracts. We show revenue adjustments from these derivative contracts as separate line items. Because these adjustments did not result from oil and gas sales, gains and losses have been reflected separately from revenues on current period sales. The following schedules include calculations of oil and gas product revenues and cash production costs together with a reconciliation to amounts reported in our consolidated financial statements.
67
Table of Contents
North America Copper Mines Product Revenues, Production Costs and Unit Net Cash Costs
Three Months Ended June 30, 2016 |
|
|
| ||||||||||||||||
(In millions) | By-Product |
| Co-Product Method | ||||||||||||||||
| Method |
| Copper |
| Molybdenum a |
| Other b |
| Total | ||||||||||
Revenues, excluding adjustments | $ | 1,010 | |
| $ | 1,010 | |
| $ | 50 | |
| $ | 20 | |
| $ | 1,080 | |
Site production and delivery, before net noncash and other costs shown below | 647 | |
| 617 | |
| 39 | |
| 11 | |
| 667 | | |||||
By-product credits | (50 | ) |
| - | |
| - | |
| - | |
| - | | |||||
Treatment charges | 49 | |
| 47 | |
| - | |
| 2 | |
| 49 | | |||||
Net cash costs | 646 | |
| 664 | |
| 39 | |
| 13 | |
| 716 | | |||||
Depreciation, depletion and amortization (DD&A) | 134 | |
| 127 | |
| 5 | |
| 2 | |
| 134 | | |||||
Noncash and other costs, net | 22 | |
| 21 | |
| 1 | |
| - | |
| 22 | | |||||
Total costs | 802 | |
| 812 | |
| 45 | |
| 15 | |
| 872 | | |||||
Revenue adjustments, primarily for pricing on prior period open sales | (7 | ) |
| (7 | ) |
| - | |
| - | |
| (7 | ) | |||||
Gross profit | $ | 201 | |
| $ | 191 | |
| $ | 5 | |
| $ | 5 | |
| $ | 201 | |
|
|
|
|
|
|
|
|
|
| ||||||||||
Copper sales (millions of recoverable pounds) | 462 | |
| 462 | |
|
|
|
|
|
| ||||||||
Molybdenum sales (millions of recoverable pounds) a |
|
|
|
| 8 | |
|
|
|
| |||||||||
|
|
|
|
|
|
|
|
|
| ||||||||||
Gross profit per pound of copper/molybdenum: |
|
|
|
|
| ||||||||||||||
|
|
|
|
|
|
|
|
|
| ||||||||||
Revenues, excluding adjustments | $ | 2.18 | |
| $ | 2.18 | |
| $ | 5.92 | |
|
|
|
| ||||
Site production and delivery, before net noncash and other costs shown below | 1.40 | |
| 1.34 | |
| 4.71 | |
|
|
|
| |||||||
By-product credits | (0.11 | ) |
| - | |
| - | |
|
|
|
| |||||||
Treatment charges | 0.11 | |
| 0.10 | |
| - | |
|
|
|
| |||||||
Unit net cash costs | 1.40 | |
| 1.44 | |
| 4.71 | |
|
|
|
| |||||||
DD&A | 0.29 | |
| 0.27 | |
| 0.57 | |
|
|
|
| |||||||
Noncash and other costs, net | 0.05 | |
| 0.05 | |
| 0.08 | |
|
|
|
| |||||||
Total unit costs | 1.74 | |
| 1.76 | |
| 5.36 | |
|
|
|
| |||||||
Revenue adjustments, primarily for pricing on prior period open sales | (0.01 | ) |
| (0.01 | ) |
| - | |
|
|
|
| |||||||
Gross profit per pound | $ | 0.43 | |
| $ | 0.41 | |
| $ | 0.56 | |
|
|
|
| ||||
|
|
|
|
|
|
|
|
|
| ||||||||||
Reconciliation to Amounts Reported |
|
|
|
|
|
|
|
|
| ||||||||||
(In millions) | Revenues |
| Production and Delivery |
| DD&A |
|
|
|
| ||||||||||
Totals presented above | $ | 1,080 | |
| $ | 667 | |
| $ | 134 | |
|
|
|
| ||||
Treatment charges | - | |
| 49 | |
| - | |
|
|
|
| |||||||
Noncash and other costs, net | - | |
| 22 | |
| - | |
|
|
|
| |||||||
Revenue adjustments, primarily for pricing on prior period open sales | (7 | ) |
| - | |
| - | |
|
|
|
| |||||||
Eliminations and other | (13 | ) |
| (12 | ) |
| - | |
|
|
|
| |||||||
North America copper mines | 1,060 | |
| 726 | |
| 134 | |
|
|
|
| |||||||
Other mining & eliminations c | 1,864 | |
| 1,331 | |
| 276 | |
|
|
|
| |||||||
Total mining | 2,924 | |
| 2,057 | |
| 410 | |
|
|
|
| |||||||
U.S. oil & gas operations | 410 | |
| 889 | |
| 218 | |
|
|
|
| |||||||
Corporate, other & eliminations | - | |
| 10 | |
| 4 | |
|
|
|
| |||||||
As reported in FCX's consolidated financial statements | $ | 3,334 | |
| $ | 2,956 | |
| $ | 632 | |
|
|
|
| ||||
a. | Reflects sales of molybdenum produced by certain of the North America copper mines to our molybdenum sales company at market-based pricing. |
b. | Includes gold and silver product revenues and production costs. |
c. | Represents the combined total for all other mining operations and the related eliminations, as presented in Note 10 . |
68
Table of Contents
Three Months Ended June 30, 2015 |
|
|
| ||||||||||||||||
(In millions) | By-Product |
| Co-Product Method | ||||||||||||||||
| Method |
| Copper |
| Molybdenum a |
| Other b |
| Total | ||||||||||
Revenues, excluding adjustments | $ | 1,341 | |
| $ | 1,341 | |
| $ | 80 | |
| $ | 28 | |
| $ | 1,449 | |
Site production and delivery, before net noncash and other costs shown below | 862 | |
| 804 | |
| 64 | |
| 22 | |
| 890 | | |||||
By-product credits | (80 | ) |
| - | |
| - | |
| - | |
| - | | |||||
Treatment charges | 60 | |
| 58 | |
| - | |
| 2 | |
| 60 | | |||||
Net cash costs | 842 | |
| 862 | |
| 64 | |
| 24 | |
| 950 | | |||||
DD&A | 137 | |
| 129 | |
| 5 | |
| 3 | |
| 137 | | |||||
Noncash and other costs, net | 46 | |
| 45 | |
| 1 | |
| - | |
| 46 | | |||||
Total costs | 1,025 | |
| 1,036 | |
| 70 | |
| 27 | |
| 1,133 | | |||||
Revenue adjustments, primarily for pricing on prior period open sales | (13 | ) |
| (13 | ) |
| - | |
| - | |
| (13 | ) | |||||
Gross profit | $ | 303 | |
| $ | 292 | |
| $ | 10 | |
| $ | 1 | |
| $ | 303 | |
|
|
|
|
|
|
|
|
|
| ||||||||||
Copper sales (millions of recoverable pounds) | 485 | |
| 485 | |
|
|
|
|
|
| ||||||||
Molybdenum sales (millions of recoverable pounds) a |
|
|
| 10 | |
|
|
|
| ||||||||||
|
|
|
|
|
|
|
|
|
| ||||||||||
Gross profit per pound of copper/molybdenum: |
|
|
|
|
| ||||||||||||||
|
|
|
|
|
|
|
|
|
| ||||||||||
Revenues, excluding adjustments | $ | 2.77 | |
| $ | 2.77 | |
| $ | 7.80 | |
|
|
|
| ||||
Site production and delivery, before net noncash and other costs shown below | 1.78 | |
| 1.66 | |
| 6.24 | |
|
|
|
| |||||||
By-product credits | (0.16 | ) |
| - | |
| - | |
|
|
|
| |||||||
Treatment charges | 0.12 | |
| 0.12 | |
| - | |
|
|
|
| |||||||
Unit net cash costs | 1.74 | |
| 1.78 | |
| 6.24 | |
|
|
|
| |||||||
DD&A | 0.28 | |
| 0.27 | |
| 0.53 | |
|
|
|
| |||||||
Noncash and other costs, net | 0.10 | |
| 0.09 | |
| 0.06 | |
|
|
|
| |||||||
Total unit costs | 2.12 | |
| 2.14 | |
| 6.83 | |
|
|
|
| |||||||
Revenue adjustments, primarily for pricing on prior period open sales | (0.03 | ) |
| (0.03 | ) |
| - | |
|
|
|
| |||||||
Gross profit per pound | $ | 0.62 | |
| $ | 0.60 | |
| $ | 0.97 | |
|
|
|
| ||||
|
|
|
|
|
|
|
|
|
| ||||||||||
Reconciliation to Amounts Reported |
|
|
|
|
|
|
|
|
| ||||||||||
(In millions) | Revenues |
| Production and Delivery |
| DD&A |
|
|
|
| ||||||||||
Totals presented above | $ | 1,449 | |
| $ | 890 | |
| $ | 137 | |
|
|
|
| ||||
Treatment charges | - | |
| 60 | |
| - | |
|
|
|
| |||||||
Noncash and other costs, net | - | |
| 46 | |
| - | |
|
|
|
| |||||||
Revenue adjustments, primarily for pricing on prior period open sales | (13 | ) |
| - | |
| - | |
|
|
|
| |||||||
Eliminations and other | (31 | ) |
| (34 | ) |
| 2 | |
|
|
|
| |||||||
North America copper mines | 1,405 | |
| 962 | |
| 139 | |
|
|
|
| |||||||
Other mining & eliminations c | 1,964 | |
| 1,406 | |
| 206 | |
|
|
|
| |||||||
Total mining | 3,369 | |
| 2,368 | |
| 345 | |
|
|
|
| |||||||
U.S. oil & gas operations | 569 | |
| 281 | |
| 485 | |
|
|
|
| |||||||
Corporate, other & eliminations | - | |
| 2 | |
| 3 | |
|
|
|
| |||||||
As reported in FCX's consolidated financial statements | $ | 3,938 | |
| $ | 2,651 | |
| $ | 833 | |
|
|
|
| ||||
a. | Reflects sales of molybdenum produced by certain of the North America copper mines to our molybdenum sales company at market-based pricing. |
b. | Includes gold and silver product revenues and production costs. |
c. | Represents the combined total for all other mining operations and the related eliminations, as presented in Note 10 . |
69
Table of Contents
|
|
|
|
|
|
|
|
|
| ||||||||||
Six Months Ended June 30, 2016 |
|
|
| ||||||||||||||||
(In millions) | By-Product |
| Co-Product Method | ||||||||||||||||
| Method |
| Copper |
| Molybdenum a |
| Other b |
| Total | ||||||||||
Revenues, excluding adjustments | $ | 2,092 | |
| $ | 2,092 | |
| $ | 90 | |
| $ | 41 | |
| $ | 2,223 | |
Site production and delivery, before net noncash and other costs shown below | 1,349 | |
| 1,295 | |
| 72 | |
| 21 | |
| 1,388 | | |||||
By-product credits | (92 | ) |
| - | |
| - | |
| - | |
| - | | |||||
Treatment charges | 103 | |
| 99 | |
| - | |
| 4 | |
| 103 | | |||||
Net cash costs | 1,360 | |
| 1,394 | |
| 72 | |
| 25 | |
| 1,491 | | |||||
DD&A | 277 | |
| 263 | |
| 9 | |
| 5 | |
| 277 | | |||||
Noncash and other costs, net | 48 | |
| 48 | |
| - | |
| - | |
| 48 | | |||||
Total costs | 1,685 | |
| 1,705 | |
| 81 | |
| 30 | |
| 1,816 | | |||||
Revenue adjustments, primarily for pricing on prior period open sales | (1 | ) |
| (1 | ) |
| - | |
| - | |
| (1 | ) | |||||
Gross profit | $ | 406 | |
| $ | 386 | |
| $ | 9 | |
| $ | 11 | |
| $ | 406 | |
|
|
|
|
|
|
|
|
|
| ||||||||||
Copper sales (millions of recoverable pounds) | 964 | |
| 964 | |
|
|
|
|
|
| ||||||||
Molybdenum sales (millions of recoverable pounds) a |
|
|
|
| 16 | |
|
|
|
| |||||||||
|
|
|
|
|
|
|
|
|
| ||||||||||
Gross profit per pound of copper/molybdenum: |
|
|
|
|
|
|
|
|
| ||||||||||
|
|
|
|
|
|
|
|
|
| ||||||||||
Revenues, excluding adjustments | $ | 2.17 | |
| $ | 2.17 | |
| $ | 5.61 | |
|
|
|
| ||||
Site production and delivery, before net noncash |
|
|
|
|
|
|
|
|
| ||||||||||
and other costs shown below | 1.40 | |
| 1.34 | |
| 4.51 | |
|
|
|
| |||||||
By-product credits | (0.10 | ) |
| - | |
| - | |
|
|
|
| |||||||
Treatment charges | 0.11 | |
| 0.11 | |
| - | |
|
|
|
| |||||||
Unit net cash costs | 1.41 | |
| 1.45 | |
| 4.51 | |
|
|
|
| |||||||
DD&A | 0.29 | |
| 0.27 | |
| 0.55 | |
|
|
|
| |||||||
Noncash and other costs, net | 0.05 | |
| 0.05 | |
| 0.02 | |
|
|
|
| |||||||
Total unit costs | 1.75 | |
| 1.77 | |
| 5.08 | |
|
|
|
| |||||||
Revenue adjustments, primarily for pricing |
|
|
|
|
|
|
|
|
| ||||||||||
on prior period open sales | - | |
| - | |
| - | |
|
|
|
| |||||||
Gross profit per pound | $ | 0.42 | |
| $ | 0.40 | |
| $ | 0.53 | |
|
|
|
| ||||
|
|
|
|
|
|
|
|
|
| ||||||||||
Reconciliation to Amounts Reported |
|
|
|
|
|
|
|
|
| ||||||||||
(In millions) | Revenues |
| Production and Delivery |
| DD&A |
|
|
|
| ||||||||||
Totals presented above | $ | 2,223 | |
| $ | 1,388 | |
| $ | 277 | |
|
|
|
| ||||
Treatment charges | - | |
| 103 | |
| - | |
|
|
|
| |||||||
Noncash and other costs, net | - | |
| 48 | |
| - | |
|
|
|
| |||||||
Revenue adjustments, primarily for pricing on prior period open sales | (1 | ) |
| - | |
| - | |
|
|
|
| |||||||
Eliminations and other | (26 | ) |
| (25 | ) |
| 1 | |
|
|
|
| |||||||
North America copper mines | 2,196 | |
| 1,514 | |
| 278 | |
|
|
|
| |||||||
Other mining & eliminations c | 3,675 | |
| 2,632 | |
| 536 | |
|
|
|
| |||||||
Total mining | 5,871 | |
| 4,146 | |
| 814 | |
|
|
|
| |||||||
U.S. oil & gas operations | 705 | |
| 1,296 | |
| 473 | |
|
|
|
| |||||||
Corporate, other & eliminations | - | |
| 13 | |
| 7 | |
|
|
|
| |||||||
As reported in FCX's consolidated financial statements | $ | 6,576 | |
| $ | 5,455 | |
| $ | 1,294 | |
|
|
|
| ||||
a. | Reflects sales of molybdenum produced by certain of the North America copper mines to our molybdenum sales company at market-based pricing. |
b. | Includes gold and silver product revenues and production costs. |
c. | Represents the combined total for all other mining operations and the related eliminations, as presented in Note 10 . |
70
Table of Contents
|
|
|
|
|
|
|
|
|
| ||||||||||
Six Months Ended June 30, 2015 |
|
|
| ||||||||||||||||
(In millions) | By-Product |
| Co-Product Method | ||||||||||||||||
| Method |
| Copper |
| Molybdenum a |
| Other b |
| Total | ||||||||||
Revenues, excluding adjustments | $ | 2,612 | |
| $ | 2,612 | |
| $ | 162 | |
| $ | 54 | |
| $ | 2,828 | |
Site production and delivery, before net noncash and other costs shown below | 1,715 | |
| 1,605 | |
| 122 | |
| 41 | |
| 1,768 | | |||||
By-product credits | (163 | ) |
| - | |
| - | |
| - | |
| - | | |||||
Treatment charges | 121 | |
| 118 | |
| - | |
| 3 | |
| 121 | | |||||
Net cash costs | 1,673 | |
| 1,723 | |
| 122 | |
| 44 | |
| 1,889 | | |||||
DD&A | 270 | |
| 254 | |
| 11 | |
| 5 | |
| 270 | | |||||
Noncash and other costs, net | 77 | |
| 76 | |
| 1 | |
| - | |
| 77 | | |||||
Total costs | 2,020 | |
| 2,053 | |
| 134 | |
| 49 | |
| 2,236 | | |||||
Revenue adjustments, primarily for pricing on prior period open sales | (28 | ) |
| (28 | ) |
| - | |
| - | |
| (28 | ) | |||||
Gross profit | $ | 564 | |
| $ | 531 | |
| $ | 28 | |
| $ | 5 | |
| $ | 564 | |
|
|
|
|
|
|
|
|
|
| ||||||||||
Copper sales (millions of recoverable pounds) | 956 | |
| 956 | |
|
|
|
|
|
| ||||||||
Molybdenum sales (millions of recoverable pounds) a |
|
|
|
| 19 | |
|
|
|
| |||||||||
|
|
|
|
|
|
|
|
|
| ||||||||||
Gross profit per pound of copper/molybdenum: |
|
|
|
|
| ||||||||||||||
|
|
|
|
|
|
|
|
|
| ||||||||||
Revenues, excluding adjustments | $ | 2.73 | |
| $ | 2.73 | |
| $ | 8.28 | |
|
|
|
| ||||
Site production and delivery, before net noncash |
|
|
|
|
|
|
|
|
| ||||||||||
and other costs shown below | 1.79 | |
| 1.68 | |
| 6.24 | |
|
|
|
| |||||||
By-product credits | (0.17 | ) |
| - | |
| - | |
|
|
|
| |||||||
Treatment charges | 0.13 | |
| 0.12 | |
| - | |
|
|
|
| |||||||
Unit net cash costs | 1.75 | |
| 1.80 | |
| 6.24 | |
|
|
|
| |||||||
DD&A | 0.28 | |
| 0.27 | |
| 0.58 | |
|
|
|
| |||||||
Noncash and other costs, net | 0.08 | |
| 0.08 | |
| 0.06 | |
|
|
|
| |||||||
Total unit costs | 2.11 | |
| 2.15 | |
| 6.88 | |
|
|
|
| |||||||
Revenue adjustments, primarily for pricing |
|
|
|
|
|
|
|
|
| ||||||||||
on prior period open sales | (0.03 | ) |
| (0.03 | ) |
| - | |
|
|
|
| |||||||
Gross profit per pound | $ | 0.59 | |
| $ | 0.55 | |
| $ | 1.40 | |
|
|
|
| ||||
|
|
|
|
|
|
|
|
|
| ||||||||||
Reconciliation to Amounts Reported |
|
|
|
|
|
|
|
|
| ||||||||||
(In millions) | Revenues |
| Production and Delivery |
| DD&A |
|
|
|
| ||||||||||
Totals presented above | $ | 2,828 | |
| $ | 1,768 | |
| $ | 270 | |
|
|
|
| ||||
Treatment charges | - | |
| 121 | |
| - | |
|
|
|
| |||||||
Noncash and other costs, net | - | |
| 77 | |
| - | |
|
|
|
| |||||||
Revenue adjustments, primarily for pricing on prior period open sales | (28 | ) |
| - | |
| - | |
|
|
|
| |||||||
Eliminations and other | (60 | ) |
| (61 | ) |
| 2 | |
|
|
|
| |||||||
North America copper mines | 2,740 | |
| 1,905 | |
| 272 | |
|
|
|
| |||||||
Other mining & eliminations c | 3,900 | |
| 2,856 | |
| 405 | |
|
|
|
| |||||||
Total mining | 6,640 | |
| 4,761 | |
| 677 | |
|
|
|
| |||||||
U.S. oil & gas operations | 1,069 | |
| 564 | |
| 1,015 | |
|
|
|
| |||||||
Corporate, other & eliminations | - | |
| 5 | |
| 7 | |
|
|
|
| |||||||
As reported in FCX's consolidated financial statements | $ | 7,709 | |
| $ | 5,330 | |
| $ | 1,699 | |
|
|
|
| ||||
a. | Reflects sales of molybdenum produced by certain of the North America copper mines to our molybdenum sales company at market-based pricing. |
b. | Includes gold and silver product revenues and production costs. |
c. | Represents the combined total for all other mining operations and the related eliminations, as presented in Note 10 . |
71
Table of Contents
South America Mining Product Revenues, Production Costs and Unit Net Cash Costs
Three Months Ended June 30, 2016 |
|
|
|
|
|
|
| ||||||||
(In millions) | By-Product |
| Co-Product Method | ||||||||||||
| Method |
| Copper |
| Other a |
| Total | ||||||||
Revenues, excluding adjustments | $ | 715 | |
| $ | 715 | |
| $ | 51 | |
| $ | 766 | |
Site production and delivery, before net noncash and other costs shown below | 391 | |
| 369 | |
| 33 | |
| 402 | | ||||
By-product credits | (40 | ) |
| - | |
| - | |
| - | | ||||
Treatment charges | 76 | |
| 76 | |
| - | |
| 76 | | ||||
Royalty on metals | 2 | |
| 2 | |
| - | |
| 2 | | ||||
Net cash costs | 429 | |
| 447 | |
| 33 | |
| 480 | | ||||
DD&A | 136 | |
| 127 | |
| 9 | |
| 136 | | ||||
Noncash and other costs, net | 5 | |
| 5 | |
| - | |
| 5 | | ||||
Total costs | 570 | |
| 579 | |
| 42 | |
| 621 | | ||||
Revenue adjustments, primarily for pricing on prior period open sales | (11 | ) |
| (11 | ) |
| - | |
| (11 | ) | ||||
Gross profit | $ | 134 | |
| $ | 125 | |
| $ | 9 | |
| $ | 134 | |
|
|
|
|
|
|
|
| ||||||||
Copper sales (millions of recoverable pounds) | 327 | |
| 327 | |
|
|
|
| ||||||
|
|
|
|
|
|
|
| ||||||||
Gross profit per pound of copper: |
|
|
| ||||||||||||
|
|
|
|
|
|
|
| ||||||||
Revenues, excluding adjustments | $ | 2.19 | |
| $ | 2.19 | |
|
|
|
| ||||
Site production and delivery, before net noncash and other costs shown below | 1.20 | |
| 1.13 | |
|
|
|
| ||||||
By-product credits | (0.12 | ) |
| - | |
|
|
|
| ||||||
Treatment charges | 0.23 | |
| 0.23 | |
|
|
|
| ||||||
Royalty on metals | - | |
| - | |
|
|
|
| ||||||
Unit net cash costs | 1.31 | |
| 1.36 | |
|
|
|
| ||||||
DD&A | 0.41 | |
| 0.39 | |
|
|
|
| ||||||
Noncash and other costs, net | 0.02 | |
| 0.02 | |
|
|
|
| ||||||
Total unit costs | 1.74 | |
| 1.77 | |
|
|
|
| ||||||
Revenue adjustments, primarily for pricing on prior period open sales | (0.04 | ) |
| (0.04 | ) |
|
|
|
| ||||||
Gross profit per pound | $ | 0.41 | |
| $ | 0.38 | |
|
|
|
| ||||
|
|
|
|
|
|
|
| ||||||||
Reconciliation to Amounts Reported |
|
|
|
|
|
|
| ||||||||
(In millions) | Revenues |
| Production and Delivery |
| DD&A |
|
| ||||||||
Totals presented above | $ | 766 | |
| $ | 402 | |
| $ | 136 | |
|
| ||
Treatment charges | (76 | ) |
| - | |
| - | |
|
| |||||
Royalty on metals | (2 | ) |
| - | |
| - | |
|
| |||||
Noncash and other costs, net | - | |
| 5 | |
| - | |
|
| |||||
Revenue adjustments, primarily for pricing on prior period open sales | (11 | ) |
| - | |
| - | |
|
| |||||
Eliminations and other | - | |
| (1 | ) |
| - | |
|
| |||||
South America mining | 677 | |
| 406 | |
| 136 | |
|
| |||||
Other mining & eliminations b | 2,247 | |
| 1,651 | |
| 274 | |
|
| |||||
Total mining | 2,924 | |
| 2,057 | |
| 410 | |
|
| |||||
U.S. oil & gas operations | 410 | |
| 889 | |
| 218 | |
|
| |||||
Corporate, other & eliminations | - | |
| 10 | |
| 4 | |
|
| |||||
As reported in FCX's consolidated financial statements | $ | 3,334 | |
| $ | 2,956 | |
| $ | 632 | |
|
| ||
a. | Includes silver sales of 911 thousand ounces ( $17.50 per ounce average realized price). Also reflects sales of molybdenum produced by Cerro Verde to our molybdenum sales company at market-based pricing. |
b. | Represents the combined total for all other mining operations and the related eliminations, as presented in Note 10 . |
72
Table of Contents
Three Months Ended June 30, 2015 |
|
|
|
|
|
|
| ||||||||
(In millions) | By-Product |
| Co-Product Method | ||||||||||||
| Method |
| Copper |
| Other a |
| Total | ||||||||
Revenues, excluding adjustments | $ | 479 | |
| $ | 479 | |
| $ | 14 | |
| $ | 493 | |
Site production and delivery, before net noncash and other costs shown below | 314 | |
| 305 | |
| 15 | |
| 320 | | ||||
By-product credits | (8 | ) |
| - | |
| - | |
| - | | ||||
Treatment charges | 30 | |
| 30 | |
| - | |
| 30 | | ||||
Royalty on metals | 1 | |
| 1 | |
| - | |
| 1 | | ||||
Net cash costs | 337 | |
| 336 | |
| 15 | |
| 351 | | ||||
DD&A | 72 | |
| 70 | |
| 2 | |
| 72 | | ||||
Noncash and other (credits) costs, net | (4 | ) |
| (5 | ) |
| 1 | |
| (4 | ) | ||||
Total costs | 405 | |
| 401 | |
| 18 | |
| 419 | | ||||
Revenue adjustments, primarily for pricing on prior period open sales | (8 | ) |
| (8 | ) |
| - | |
| (8 | ) | ||||
Gross profit | $ | 66 | |
| $ | 70 | |
| $ | (4 | ) |
| $ | 66 | |
|
|
|
|
|
|
|
| ||||||||
Copper sales (millions of recoverable pounds) | 178 | |
| 178 | |
|
|
|
| ||||||
|
|
|
|
|
|
|
| ||||||||
Gross profit per pound of copper: |
|
|
| ||||||||||||
|
|
|
|
|
|
|
| ||||||||
Revenues, excluding adjustments | $ | 2.69 | |
| $ | 2.69 | |
|
|
|
| ||||
Site production and delivery, before net noncash and other costs shown below | 1.77 | |
| 1.72 | |
|
|
|
| ||||||
By-product credits | (0.04 | ) |
| - | |
|
|
|
| ||||||
Treatment charges | 0.17 | |
| 0.17 | |
|
|
|
| ||||||
Royalty on metals | - | |
| - | |
|
|
|
| ||||||
Unit net cash costs | 1.90 | |
| 1.89 | |
|
|
|
| ||||||
DD&A | 0.40 | |
| 0.39 | |
|
|
|
| ||||||
Noncash and other credits, net | (0.02 | ) |
| (0.03 | ) |
|
|
|
| ||||||
Total unit costs | 2.28 | |
| 2.25 | |
|
|
|
| ||||||
Revenue adjustments, primarily for pricing on prior period open sales | (0.05 | ) |
| (0.05 | ) |
|
|
|
| ||||||
Gross profit per pound | $ | 0.36 | |
| $ | 0.39 | |
|
|
|
| ||||
|
|
|
|
|
|
|
| ||||||||
Reconciliation to Amounts Reported |
|
|
|
|
|
|
| ||||||||
(In millions) | Revenues |
| Production and Delivery |
| DD&A |
|
| ||||||||
Totals presented above | $ | 493 | |
| $ | 320 | |
| $ | 72 | |
|
| ||
Treatment charges | (30 | ) |
| - | |
| - | |
|
| |||||
Royalty on metals | (1 | ) |
| - | |
| - | |
|
| |||||
Noncash and other credits, net | - | |
| (4 | ) |
| - | |
|
| |||||
Revenue adjustments, primarily for pricing on prior period open sales | (8 | ) |
| - | |
| - | |
|
| |||||
Eliminations and other | (1 | ) |
| (1 | ) |
| - | |
|
| |||||
South America mining | 453 | |
| 315 | |
| 72 | |
|
| |||||
Other mining & eliminations b | 2,916 | |
| 2,053 | |
| 273 | |
|
| |||||
Total mining | 3,369 | |
| 2,368 | |
| 345 | |
|
| |||||
U.S. oil & gas operations | 569 | |
| 281 | |
| 485 | |
|
| |||||
Corporate, other & eliminations | - | |
| 2 | |
| 3 | |
|
| |||||
As reported in FCX's consolidated financial statements | $ | 3,938 | |
| $ | 2,651 | |
| $ | 833 | |
|
| ||
a. | Includes silver sales of 373 thousand ounces ( $15.15 per ounce average realized price). Also reflects sales of molybdenum produced by Cerro Verde to our molybdenum sales company at market-based pricing. |
b. | Represents the combined total for all other mining operations and the related eliminations, as presented in Note 10 . |
73
Table of Contents
|
|
|
|
|
|
|
| ||||||||
Six Months Ended June 30, 2016 |
|
|
|
|
|
|
| ||||||||
(In millions) | By-Product |
| Co-Product Method | ||||||||||||
| Method |
| Copper |
| Other a |
| Total | ||||||||
Revenues, excluding adjustments | $ | 1,414 | |
| $ | 1,414 | |
| $ | 80 | |
| $ | 1,494 | |
Site production and delivery, before net noncash and other costs shown below | 789 | |
| 754 | |
| 53 | |
| 807 | | ||||
By-product credits | (62 | ) |
| - | |
| - | |
| - | | ||||
Treatment charges | 151 | |
| 151 | |
| - | |
| 151 | | ||||
Royalty on metals | 3 | |
| 3 | |
| - | |
| 3 | | ||||
Net cash costs | 881 | |
| 908 | |
| 53 | |
| 961 | | ||||
DD&A | 267 | |
| 253 | |
| 14 | |
| 267 | | ||||
Noncash and other costs, net | 12 | |
| 12 | |
| - | |
| 12 | | ||||
Total costs | 1,160 | |
| 1,173 | |
| 67 | |
| 1,240 | | ||||
Revenue adjustments, primarily for pricing on prior period open sales | 8 | |
| 8 | |
| - | |
| 8 | | ||||
Gross profit | $ | 262 | |
| $ | 249 | |
| $ | 13 | |
| $ | 262 | |
|
|
|
|
|
|
|
| ||||||||
Copper sales (millions of recoverable pounds) | 650 | |
| 650 | |
|
|
|
| ||||||
|
|
|
|
|
|
|
| ||||||||
Gross profit per pound of copper: |
|
|
| ||||||||||||
|
|
|
|
|
|
|
| ||||||||
Revenues, excluding adjustments | $ | 2.18 | |
| $ | 2.18 | |
|
|
|
| ||||
Site production and delivery, before net noncash |
|
|
|
|
|
|
| ||||||||
and other costs shown below | 1.22 | |
| 1.16 | |
|
|
|
| ||||||
By-product credits | (0.10 | ) |
| - | |
|
|
|
| ||||||
Treatment charges | 0.23 | |
| 0.23 | |
|
|
|
| ||||||
Royalty on metals | 0.01 | |
| 0.01 | |
|
|
|
| ||||||
Unit net cash costs | 1.36 | |
| 1.40 | |
|
|
|
| ||||||
DD&A | 0.41 | |
| 0.39 | |
|
|
|
| ||||||
Noncash and other costs, net | 0.02 | |
| 0.02 | |
|
|
|
| ||||||
Total unit costs | 1.79 | |
| 1.81 | |
|
|
|
| ||||||
Revenue adjustments, primarily for pricing |
|
|
|
|
|
|
| ||||||||
on prior period open sales | 0.01 | |
| 0.01 | |
|
|
|
| ||||||
Gross profit per pound | $ | 0.40 | |
| $ | 0.38 | |
|
|
|
| ||||
|
|
|
|
|
|
|
| ||||||||
Reconciliation to Amounts Reported |
|
|
|
|
|
|
| ||||||||
(In millions) | Revenues |
| Production and Delivery |
| DD&A |
|
| ||||||||
Totals presented above | $ | 1,494 | |
| $ | 807 | |
| $ | 267 | |
|
| ||
Treatment charges | (151 | ) |
| - | |
| - | |
|
| |||||
Royalty on metals | (3 | ) |
| - | |
| - | |
|
| |||||
Noncash and other costs, net | - | |
| 12 | |
| - | |
|
| |||||
Revenue adjustments, primarily for pricing on prior period open sales | 8 | |
| - | |
| - | |
|
| |||||
Eliminations and other | - | |
| (3 | ) |
| 1 | |
|
| |||||
South America mining | 1,348 | |
| 816 | |
| 268 | |
|
| |||||
Other mining & eliminations b | 4,523 | |
| 3,330 | |
| 546 | |
|
| |||||
Total mining | 5,871 | |
| 4,146 | |
| 814 | |
|
| |||||
U.S. oil & gas operations | 705 | |
| 1,296 | |
| 473 | |
|
| |||||
Corporate, other & eliminations | - | |
| 13 | |
| 7 | |
|
| |||||
As reported in FCX's consolidated financial statements | $ | 6,576 | |
| $ | 5,455 | |
| $ | 1,294 | |
|
| ||
a. | Includes silver sales of 1.8 million ounces ( $16.03 per ounce average realized price). Also reflects sales of molybdenum produced by Cerro Verde to our molybdenum sales company at market-based pricing. |
b. | Represents the combined total for all other mining operations and the related eliminations, as presented in Note 10 . |
74
Table of Contents
|
|
|
|
|
|
|
| ||||||||
Six Months Ended June 30, 2015 |
|
|
|
|
|
|
| ||||||||
(In millions) | By-Product |
| Co-Product Method | ||||||||||||
| Method |
| Copper |
| Other a |
| Total | ||||||||
Revenues, excluding adjustments | $ | 1,013 | |
| $ | 1,013 | |
| $ | 35 | |
| $ | 1,048 | |
Site production and delivery, before net noncash and other costs shown below | 664 | |
| 642 | |
| 33 | |
| 675 | | ||||
By-product credits | (24 | ) |
| - | |
| - | |
| - | | ||||
Treatment charges | 64 | |
| 64 | |
| - | |
| 64 | | ||||
Royalty on metals | 1 | |
| 1 | |
| - | |
| 1 | | ||||
Net cash costs | 705 | |
| 707 | |
| 33 | |
| 740 | | ||||
DD&A | 147 | |
| 143 | |
| 4 | |
| 147 | | ||||
Noncash and other costs, net | - | |
| - | |
| - | |
| - | | ||||
Total costs | 852 | |
| 850 | |
| 37 | |
| 887 | | ||||
Revenue adjustments, primarily for pricing on prior period open sales | (31 | ) |
| (31 | ) |
| - | |
| (31 | ) | ||||
Gross profit (loss) | $ | 130 | |
| $ | 132 | |
| $ | (2 | ) |
| $ | 130 | |
|
|
|
|
|
|
|
| ||||||||
Copper sales (millions of recoverable pounds) | 378 | |
| 378 | |
|
|
|
| ||||||
|
|
|
|
|
|
|
| ||||||||
Gross profit per pound of copper: |
|
|
| ||||||||||||
|
|
|
|
|
|
|
| ||||||||
Revenues, excluding adjustments | $ | 2.68 | |
| $ | 2.68 | |
|
|
|
| ||||
Site production and delivery, before net noncash |
|
|
|
|
|
|
| ||||||||
and other costs shown below | 1.76 | |
| 1.70 | |
|
|
|
| ||||||
By-product credits | (0.06 | ) |
| - | |
|
|
|
| ||||||
Treatment charges | 0.17 | |
| 0.17 | |
|
|
|
| ||||||
Royalty on metals | - | |
| - | |
|
|
|
| ||||||
Unit net cash costs | 1.87 | |
| 1.87 | |
|
|
|
| ||||||
DD&A | 0.39 | |
| 0.38 | |
|
|
|
| ||||||
Noncash and other costs, net | - | |
| - | |
|
|
|
| ||||||
Total unit costs | 2.26 | |
| 2.25 | |
|
|
|
| ||||||
Revenue adjustments, primarily for pricing |
|
|
|
|
|
|
| ||||||||
on prior period open sales | (0.08 | ) |
| (0.08 | ) |
|
|
|
| ||||||
Gross profit per pound | $ | 0.34 | |
| $ | 0.35 | |
|
|
|
| ||||
|
|
|
|
|
|
|
| ||||||||
Reconciliation to Amounts Reported |
|
|
|
|
|
|
| ||||||||
(In millions) | Revenues |
| Production and Delivery |
| DD&A |
|
| ||||||||
Totals presented above | $ | 1,048 | |
| $ | 675 | |
| $ | 147 | |
|
| ||
Treatment charges | (64 | ) |
| - | |
| - | |
|
| |||||
Royalty on metals | (1 | ) |
| - | |
| - | |
|
| |||||
Noncash and other costs, net | - | |
| - | |
| - | |
|
| |||||
Revenue adjustments, primarily for pricing on prior period open sales | (31 | ) |
| - | |
| - | |
|
| |||||
Eliminations and other | (13 | ) |
| (15 | ) |
| - | |
|
| |||||
South America mining | 939 | |
| 660 | |
| 147 | |
|
| |||||
Other mining & eliminations b | 5,701 | |
| 4,101 | |
| 530 | |
|
| |||||
Total mining | 6,640 | |
| 4,761 | |
| 677 | |
|
| |||||
U.S. oil & gas operations | 1,069 | |
| 564 | |
| 1,015 | |
|
| |||||
Corporate, other & eliminations | - | |
| 5 | |
| 7 | |
|
| |||||
As reported in FCX's consolidated financial statements | $ | 7,709 | |
| $ | 5,330 | |
| $ | 1,699 | |
|
| ||
a. | Includes silver sales of 759 thousand ounces ( $14.97 per ounce average realized price). Also reflects sales of molybdenum produced by Cerro Verde to our molybdenum sales company at market-based pricing. |
b. | Represents the combined total for all other mining operations and the related eliminations, as presented in Note 10 . |
|
|
|
|
|
|
|
75
Table of Contents
Indonesia Mining Product Revenues, Production Costs and Unit Net Cash Costs
Three Months Ended June 30, 2016 |
|
|
| ||||||||||||||||
(In millions) | By-Product |
| Co-Product Method | ||||||||||||||||
| Method |
| Copper |
| Gold |
| Silver a |
| Total | ||||||||||
Revenues, excluding adjustments | $ | 431 | |
| $ | 431 | |
| $ | 195 | |
| $ | 10 | |
| $ | 636 | |
Site production and delivery, before net noncash and other costs shown below | 347 | |
| 235 | |
| 107 | |
| 5 | |
| 347 | | |||||
Gold and silver credits | (206 | ) |
| - | |
| - | |
| - | |
| - | | |||||
Treatment charges | 57 | |
| 39 | |
| 17 | |
| 1 | |
| 57 | | |||||
Export duties | 16 | |
| 11 | |
| 5 | |
| - | |
| 16 | | |||||
Royalty on metals | 21 | |
| 14 | |
| 7 | |
| - | |
| 21 | | |||||
Net cash costs | 235 | |
| 299 | |
| 136 | |
| 6 | |
| 441 | | |||||
DD&A | 93 | |
| 63 | |
| 28 | |
| 2 | |
| 93 | | |||||
Noncash and other costs, net | 2 | |
| 1 | |
| 1 | |
| - | |
| 2 | | |||||
Total costs | 330 | |
| 363 | |
| 165 | |
| 8 | |
| 536 | | |||||
Revenue adjustments, primarily for pricing on prior period open sales | (12 | ) |
| (12 | ) |
| 1 | |
| - | |
| (11 | ) | |||||
PT Smelting intercompany loss | (7 | ) |
| (5 | ) |
| (2 | ) |
| - | |
| (7 | ) | |||||
Gross profit | $ | 82 | |
| $ | 51 | |
| $ | 29 | |
| $ | 2 | |
| $ | 82 | |
|
|
|
|
|
|
|
|
|
| ||||||||||
Copper sales (millions of recoverable pounds) | 196 | |
| 196 | |
|
|
|
|
|
| ||||||||
Gold sales (thousands of recoverable ounces) |
|
|
|
| 151 | |
|
|
|
| |||||||||
|
|
|
|
|
|
|
|
|
| ||||||||||
Gross profit per pound of copper/per ounce of gold: |
|
|
|
|
| ||||||||||||||
|
|
|
|
|
|
|
|
|
| ||||||||||
Revenues, excluding adjustments | $ | 2.20 | |
| $ | 2.20 | |
| $ | 1,292 | |
|
|
|
| ||||
Site production and delivery, before net noncash and other costs shown below | 1.77 | |
| 1.20 | |
| 706 | |
|
|
|
| |||||||
Gold and silver credits | (1.05 | ) |
| - | |
| - | |
|
|
|
| |||||||
Treatment charges | 0.29 | |
| 0.20 | |
| 116 | |
|
|
|
| |||||||
Export duties | 0.08 | |
| 0.05 | |
| 32 | |
|
|
|
| |||||||
Royalty on metals | 0.11 | |
| 0.07 | |
| 45 | |
|
|
|
| |||||||
Unit net cash costs | 1.20 | |
| 1.52 | |
| 899 | |
|
|
|
| |||||||
DD&A | 0.48 | |
| 0.33 | |
| 190 | |
|
|
|
| |||||||
Noncash and other costs, net | 0.01 | |
| 0.01 | |
| 4 | |
|
|
|
| |||||||
Total unit costs | 1.69 | |
| 1.86 | |
| 1,093 | |
|
|
|
| |||||||
Revenue adjustments, primarily for pricing on prior period open sales | (0.06 | ) |
| (0.06 | ) |
| 7 | |
|
|
|
| |||||||
PT Smelting intercompany loss | (0.03 | ) |
| (0.02 | ) |
| (14 | ) |
|
|
|
| |||||||
Gross profit per pound/ounce | $ | 0.42 | |
| $ | 0.26 | |
| $ | 192 | |
|
|
|
| ||||
|
|
|
|
|
|
|
|
|
| ||||||||||
Reconciliation to Amounts Reported |
|
|
|
|
|
|
|
|
| ||||||||||
(In millions) | Revenues |
| Production and Delivery |
| DD&A |
|
|
|
| ||||||||||
Totals presented above | $ | 636 | |
| $ | 347 | |
| $ | 93 | |
|
|
|
| ||||
Treatment charges | (57 | ) |
| - | |
| - | |
|
|
|
| |||||||
Export duties | (16 | ) |
| - | |
| - | |
|
|
|
| |||||||
Royalty on metals | (21 | ) |
| - | |
| - | |
|
|
|
| |||||||
Noncash and other costs, net | - | |
| 2 | |
| - | |
|
|
|
| |||||||
Revenue adjustments, primarily for pricing on prior period open sales | (11 | ) |
| - | |
| - | |
|
|
|
| |||||||
PT Smelting intercompany loss | - | |
| 7 | |
| - | |
|
|
|
| |||||||
Indonesia mining | 531 | |
| 356 | |
| 93 | |
|
|
|
| |||||||
Other mining & eliminations b | 2,393 | |
| 1,701 | |
| 317 | |
|
|
|
| |||||||
Total mining | 2,924 | |
| 2,057 | |
| 410 | |
|
|
|
| |||||||
U.S. oil & gas operations | 410 | |
| 889 | |
| 218 | |
|
|
|
| |||||||
Corporate, other & eliminations | - | |
| 10 | |
| 4 | |
|
|
|
| |||||||
As reported in FCX's consolidated financial statements | $ | 3,334 | |
| $ | 2,956 | |
| $ | 632 | |
|
|
|
| ||||
a. | Includes silver sales of 562 thousand ounces ( $17.42 per ounce average realized price). |
b. | Represents the combined total for all other mining operations and the related eliminations, as presented in Note 10 . |
.
76
Table of Contents
Three Months Ended June 30, 2015 |
|
|
| ||||||||||||||||
(In millions) | By-Product |
| Co-Product Method | ||||||||||||||||
| Method |
| Copper |
| Gold |
| Silver a |
| Total | ||||||||||
Revenues, excluding adjustments | $ | 511 | |
| $ | 511 | |
| $ | 406 | |
| $ | 8 | |
| $ | 925 | |
Site production and delivery, before net noncash and other costs shown below | 442 | |
| 244 | |
| 194 | |
| 4 | |
| 442 | | |||||
Gold and silver credits | (416 | ) |
| - | |
| - | |
| - | |
| - | | |||||
Treatment charges | 62 | |
| 34 | |
| 27 | |
| 1 | |
| 62 | | |||||
Export duties | 36 | |
| 20 | |
| 16 | |
| - | |
| 36 | | |||||
Royalty on metals | 35 | |
| 19 | |
| 16 | |
| - | |
| 35 | | |||||
Net cash costs | 159 | |
| 317 | |
| 253 | |
| 5 | |
| 575 | | |||||
DD&A | 78 | |
| 43 | |
| 34 | |
| 1 | |
| 78 | | |||||
Noncash and other costs, net | 8 | |
| 5 | |
| 3 | |
| - | |
| 8 | | |||||
Total costs | 245 | |
| 365 | |
| 290 | |
| 6 | |
| 661 | | |||||
Revenue adjustments, primarily for pricing on prior period open sales | (4 | ) |
| (4 | ) |
| 2 | |
| - | |
| (2 | ) | |||||
PT Smelting intercompany loss | (5 | ) |
| (3 | ) |
| (2 | ) |
| - | |
| (5 | ) | |||||
Gross profit | $ | 257 | |
| $ | 139 | |
| $ | 116 | |
| $ | 2 | |
| $ | 257 | |
|
|
|
|
|
|
|
|
|
| ||||||||||
Copper sales (millions of recoverable pounds) | 196 | |
| 196 | |
|
|
|
|
|
| ||||||||
Gold sales (thousands of recoverable ounces) |
|
|
|
| 346 | |
|
|
|
| |||||||||
|
|
|
|
|
|
|
|
|
| ||||||||||
Gross profit per pound of copper/per ounce of gold: |
|
|
|
|
| ||||||||||||||
|
|
|
|
|
|
|
|
|
| ||||||||||
Revenues, excluding adjustments | $ | 2.61 | |
| $ | 2.61 | |
| $ | 1,173 | |
|
|
|
| ||||
Site production and delivery, before net noncash and other costs shown below | 2.26 | |
| 1.25 | |
| 560 | |
|
|
|
| |||||||
Gold and silver credits | (2.13 | ) |
| - | |
| - | |
|
|
|
| |||||||
Treatment charges | 0.32 | |
| 0.18 | |
| 79 | |
|
|
|
| |||||||
Export duties | 0.18 | |
| 0.10 | |
| 45 | |
|
|
|
| |||||||
Royalty on metals | 0.18 | |
| 0.10 | |
| 45 | |
|
|
|
| |||||||
Unit net cash costs | 0.81 | |
| 1.63 | |
| 729 | |
|
|
|
| |||||||
DD&A | 0.40 | |
| 0.22 | |
| 100 | |
|
|
|
| |||||||
Noncash and other costs, net | 0.04 | |
| 0.02 | |
| 10 | |
|
|
|
| |||||||
Total unit costs | 1.25 | |
| 1.87 | |
| 839 | |
|
|
|
| |||||||
Revenue adjustments, primarily for pricing on prior period open sales | (0.02 | ) |
| (0.02 | ) |
| 7 | |
|
|
|
| |||||||
PT Smelting intercompany loss | (0.02 | ) |
| (0.01 | ) |
| (5 | ) |
|
|
|
| |||||||
Gross profit per pound/ounce | $ | 1.32 | |
| $ | 0.71 | |
| $ | 336 | |
|
|
|
| ||||
|
|
|
|
|
|
|
|
|
| ||||||||||
Reconciliation to Amounts Reported |
|
|
|
|
|
|
|
|
| ||||||||||
(In millions) | Revenues |
| Production and Delivery |
| DD&A |
|
|
|
| ||||||||||
Totals presented above | $ | 925 | |
| $ | 442 | |
| $ | 78 | |
|
|
|
| ||||
Treatment charges | (62 | ) |
| - | |
| - | |
|
|
|
| |||||||
Export duties | (36 | ) |
| - | |
| - | |
|
|
|
| |||||||
Royalty on metals | (35 | ) |
| - | |
| - | |
|
|
|
| |||||||
Noncash and other costs, net | - | |
| 8 | |
| - | |
|
|
|
| |||||||
Revenue adjustments, primarily for pricing on prior period open sales | (2 | ) |
| - | |
| - | |
|
|
|
| |||||||
PT Smelting intercompany loss | - | |
| 5 | |
| - | |
|
|
|
| |||||||
Indonesia mining | 790 | |
| 455 | |
| 78 | |
|
|
|
| |||||||
Other mining & eliminations b | 2,579 | |
| 1,913 | |
| 267 | |
|
|
|
| |||||||
Total mining | 3,369 | |
| 2,368 | |
| 345 | |
|
|
|
| |||||||
U.S. oil & gas operations | 569 | |
| 281 | |
| 485 | |
|
|
|
| |||||||
Corporate, other & eliminations | - | |
| 2 | |
| 3 | |
|
|
|
| |||||||
As reported in FCX's consolidated financial statements | $ | 3,938 | |
| $ | 2,651 | |
| $ | 833 | |
|
|
|
| ||||
a. | Includes silver sales of 558 thousand ounces ( $15.48 per ounce average realized price). |
b. | Represents the combined total for all other mining operations and the related eliminations, as presented in Note 10 . |
77
Table of Contents
|
|
|
|
|
|
|
|
|
| ||||||||||
Six Months Ended June 30, 2016 |
|
|
| ||||||||||||||||
(In millions) | By-Product |
| Co-Product Method | ||||||||||||||||
| Method |
| Copper |
| Gold |
| Silver a |
| Total | ||||||||||
Revenues, excluding adjustments | $ | 802 | |
| $ | 802 | |
| $ | 436 | |
| $ | 17 | |
| $ | 1,255 | |
Site production and delivery, before net noncash and other costs shown below | 737 | |
| 471 | |
| 256 | |
| 10 | |
| 737 | | |||||
Gold and silver credits | (470 | ) |
| - | |
| - | |
| - | |
| - | | |||||
Treatment charges | 112 | |
| 72 | |
| 39 | |
| 1 | |
| 112 | | |||||
Export duties | 29 | |
| 18 | |
| 10 | |
| 1 | |
| 29 | | |||||
Royalty on metals | 43 | |
| 27 | |
| 16 | |
| - | |
| 43 | | |||||
Net cash costs | 451 | |
| 588 | |
| 321 | |
| 12 | |
| 921 | | |||||
DD&A | 174 | |
| 111 | |
| 60 | |
| 3 | |
| 174 | | |||||
Noncash and other costs, net | 14 | |
| 9 | |
| 5 | |
| - | |
| 14 | | |||||
Total costs | 639 | |
| 708 | |
| 386 | |
| 15 | |
| 1,109 | | |||||
Revenue adjustments, primarily for pricing on prior period open sales | (1 | ) |
| (1 | ) |
| 17 | |
| - | |
| 16 | | |||||
PT Smelting intercompany profit | 1 | |
| 1 | |
| - | |
| - | |
| 1 | | |||||
Gross profit | $ | 163 | |
| $ | 94 | |
| $ | 67 | |
| $ | 2 | |
| $ | 163 | |
|
|
|
|
|
|
|
|
|
| ||||||||||
Copper sales (millions of recoverable pounds) | 370 | |
| 370 | |
|
|
|
|
|
| ||||||||
Gold sales (thousands of recoverable ounces) |
|
|
|
| 346 | |
|
|
|
| |||||||||
|
|
|
|
|
|
|
|
|
| ||||||||||
Gross profit per pound of copper/per ounce of gold: |
|
|
|
|
| ||||||||||||||
|
|
|
|
|
|
|
|
|
| ||||||||||
Revenues, excluding adjustments | $ | 2.17 | |
| $ | 2.17 | |
| $ | 1,260 | |
|
|
|
| ||||
Site production and delivery, before net noncash |
|
|
|
|
|
|
|
|
| ||||||||||
and other costs shown below | 1.99 | |
| 1.27 | |
| 740 | |
|
|
|
| |||||||
Gold and silver credits | (1.27 | ) |
| - | |
| - | |
|
|
|
| |||||||
Treatment charges | 0.30 | |
| 0.20 | |
| 113 | |
|
|
|
| |||||||
Export duties | 0.08 | |
| 0.05 | |
| 29 | |
|
|
|
| |||||||
Royalty on metals | 0.12 | |
| 0.07 | |
| 47 | |
|
|
|
| |||||||
Unit net cash costs | 1.22 | |
| 1.59 | |
| 929 | |
|
|
|
| |||||||
DD&A | 0.47 | |
| 0.30 | |
| 175 | |
|
|
|
| |||||||
Noncash and other costs, net | 0.04 | |
| 0.02 | |
| 14 | |
|
|
|
| |||||||
Total unit costs | 1.73 | |
| 1.91 | |
| 1,118 | |
|
|
|
| |||||||
Revenue adjustments, primarily for pricing |
|
|
|
|
|
|
|
|
| ||||||||||
on prior period open sales | - | |
| - | |
| 48 | |
|
|
|
| |||||||
PT Smelting intercompany profit | - | |
| - | |
| 2 | |
|
|
|
| |||||||
Gross profit per pound/ounce | $ | 0.44 | |
| $ | 0.26 | |
| $ | 192 | |
|
|
|
| ||||
|
|
|
|
|
|
|
|
|
| ||||||||||
Reconciliation to Amounts Reported |
|
|
|
|
|
|
|
|
| ||||||||||
(In millions) | Revenues |
| Production and Delivery |
| DD&A |
|
|
|
| ||||||||||
Totals presented above | $ | 1,255 | |
| $ | 737 | |
| $ | 174 | |
|
|
|
| ||||
Treatment charges | (112 | ) |
| - | |
| - | |
|
|
|
| |||||||
Export duties | (29 | ) |
| - | |
| - | |
|
|
|
| |||||||
Royalty on metals | (43 | ) |
| - | |
| - | |
|
|
|
| |||||||
Noncash and other costs, net | - | |
| 14 | |
| - | |
|
|
|
| |||||||
Revenue adjustments, primarily for pricing on prior period open sales | 16 | |
| - | |
| - | |
|
|
|
| |||||||
PT Smelting intercompany profit | - | |
| (1 | ) |
| - | |
|
|
|
| |||||||
Indonesia mining | 1,087 | |
| 750 | |
| 174 | |
|
|
|
| |||||||
Other mining & eliminations b | 4,784 | |
| 3,396 | |
| 640 | |
|
|
|
| |||||||
Total mining | 5,871 | |
| 4,146 | |
| 814 | |
|
|
|
| |||||||
U.S. oil & gas operations | 705 | |
| 1,296 | |
| 473 | |
|
|
|
| |||||||
Corporate, other & eliminations | - | |
| 13 | |
| 7 | |
|
|
|
| |||||||
As reported in FCX's consolidated financial statements | $ | 6,576 | |
| $ | 5,455 | |
| $ | 1,294 | |
|
|
|
| ||||
a. | Includes silver sales of 1.1 million ounces ( $16.56 per ounce average realized price). |
b. | Represents the combined total for all other mining operations and the related eliminations, as presented in Note 10 . |
78
Table of Contents
|
|
|
|
|
|
|
|
|
| ||||||||||
Six Months Ended June 30, 2015 |
|
|
| ||||||||||||||||
(In millions) | By-Product |
| Co-Product Method | ||||||||||||||||
| Method |
| Copper |
| Gold |
| Silver a |
| Total | ||||||||||
Revenues, excluding adjustments | $ | 933 | |
| $ | 933 | |
| $ | 716 | |
| $ | 16 | |
| $ | 1,665 | |
Site production and delivery, before net noncash and other costs shown below | 882 | |
| 494 | |
| 380 | |
| 8 | |
| 882 | | |||||
Gold and silver credits | (741 | ) |
| - | |
| - | |
| - | |
| - | | |||||
Treatment charges | 108 | |
| 61 | |
| 46 | |
| 1 | |
| 108 | | |||||
Export duties | 57 | |
| 32 | |
| 24 | |
| 1 | |
| 57 | | |||||
Royalty on metals | 60 | |
| 33 | |
| 26 | |
| 1 | |
| 60 | | |||||
Net cash costs | 366 | |
| 620 | |
| 476 | |
| 11 | |
| 1,107 | | |||||
DD&A | 148 | |
| 83 | |
| 64 | |
| 1 | |
| 148 | | |||||
Noncash and other costs, net | 14 | |
| 8 | |
| 6 | |
| - | |
| 14 | | |||||
Total costs | 528 | |
| 711 | |
| 546 | |
| 12 | |
| 1,269 | | |||||
Revenue adjustments, primarily for pricing on prior period open sales | (52 | ) |
| (52 | ) |
| 9 | |
| - | |
| (43 | ) | |||||
PT Smelting intercompany profit | 2 | |
| 2 | |
| - | |
| - | |
| 2 | | |||||
Gross profit | $ | 355 | |
| $ | 172 | |
| $ | 179 | |
| $ | 4 | |
| $ | 355 | |
|
|
|
|
|
|
|
|
|
| ||||||||||
Copper sales (millions of recoverable pounds) | 351 | |
| 351 | |
|
|
|
|
|
| ||||||||
Gold sales (thousands of recoverable ounces) |
|
|
|
| 606 | |
|
|
|
| |||||||||
|
|
|
|
|
|
|
|
|
| ||||||||||
Gross profit per pound of copper/per ounce of gold: |
|
|
|
|
| ||||||||||||||
|
|
|
|
|
|
|
|
|
| ||||||||||
Revenues, excluding adjustments | $ | 2.66 | |
| $ | 2.66 | |
| $ | 1,183 | |
|
|
|
| ||||
Site production and delivery, before net noncash |
|
|
|
|
|
|
|
|
| ||||||||||
and other costs shown below | 2.51 | |
| 1.41 | |
| 626 | |
|
|
|
| |||||||
Gold and silver credits | (2.11 | ) |
| - | |
| - | |
|
|
|
| |||||||
Treatment charges | 0.31 | |
| 0.17 | |
| 77 | |
|
|
|
| |||||||
Export duties | 0.16 | |
| 0.09 | |
| 41 | |
|
|
|
| |||||||
Royalty on metals | 0.17 | |
| 0.10 | |
| 42 | |
|
|
|
| |||||||
Unit net cash costs | 1.04 | |
| 1.77 | |
| 786 | |
|
|
|
| |||||||
DD&A | 0.42 | |
| 0.24 | |
| 106 | |
|
|
|
| |||||||
Noncash and other costs, net | 0.04 | |
| 0.02 | |
| 10 | |
|
|
|
| |||||||
Total unit costs | 1.50 | |
| 2.03 | |
| 902 | |
|
|
|
| |||||||
Revenue adjustments, primarily for pricing |
|
|
|
|
|
|
|
|
| ||||||||||
on prior period open sales | (0.15 | ) |
| (0.15 | ) |
| 14 | |
|
|
|
| |||||||
PT Smelting intercompany profit | 0.01 | |
| 0.01 | |
| 2 | |
|
|
|
| |||||||
Gross profit per pound/ounce | $ | 1.02 | |
| $ | 0.49 | |
| $ | 297 | |
|
|
|
| ||||
|
|
|
|
|
|
|
|
|
| ||||||||||
Reconciliation to Amounts Reported |
|
|
|
|
|
|
|
|
| ||||||||||
(In millions) | Revenues |
| Production and Delivery |
| DD&A |
|
|
|
| ||||||||||
Totals presented above | $ | 1,665 | |
| $ | 882 | |
| $ | 148 | |
|
|
|
| ||||
Treatment charges | (108 | ) |
| - | |
| - | |
|
|
|
| |||||||
Export duties | (57 | ) |
| - | |
| - | |
|
|
|
| |||||||
Royalty on metals | (60 | ) |
| - | |
| - | |
|
|
|
| |||||||
Noncash and other costs, net | - | |
| 14 | |
| - | |
|
|
|
| |||||||
Revenue adjustments, primarily for pricing on prior period open sales | (43 | ) |
| - | |
| - | |
|
|
|
| |||||||
PT Smelting intercompany profit | - | |
| (2 | ) |
| - | |
|
|
|
| |||||||
Indonesia mining | 1,397 | |
| 894 | |
| 148 | |
|
|
|
| |||||||
Other mining & eliminations b | 5,243 | |
| 3,867 | |
| 529 | |
|
|
|
| |||||||
Total mining | 6,640 | |
| 4,761 | |
| 677 | |
|
|
|
| |||||||
U.S. oil & gas operations | 1,069 | |
| 564 | |
| 1,015 | |
|
|
|
| |||||||
Corporate, other & eliminations | - | |
| 5 | |
| 7 | |
|
|
|
| |||||||
As reported in FCX's consolidated financial statements | $ | 7,709 | |
| $ | 5,330 | |
| $ | 1,699 | |
|
|
|
| ||||
a. | Includes silver sales of 993 thousand ounces ( $15.75 per ounce average realized price). |
b. | Represents the combined total for all other mining operations and the related eliminations, as presented in Note 10 . |
79
Table of Contents
Molybdenum Mines Product Revenues, Production Costs and Unit Net Cash Costs
(In millions) | Three Months Ended June 30, |
|
|
| ||||||||
| 2016 |
| 2015 |
|
|
| ||||||
Revenues, excluding adjustments a | $ | 50 | |
| $ | 112 | |
|
|
| ||
Site production and delivery, before net noncash and other costs shown below | 45 | |
| 80 | |
|
|
| ||||
Treatment charges and other | 5 | |
| 10 | |
|
|
| ||||
Net cash costs | 50 | |
| 90 | |
|
|
| ||||
DD&A | 17 | |
| 25 | |
|
|
| ||||
Noncash and other costs, net | 5 | |
| 4 | |
|
|
| ||||
Total costs | 72 | |
| 119 | |
|
|
| ||||
Gross loss | $ | (22 | ) |
| $ | (7 | ) |
|
|
| ||
|
|
|
|
|
|
| ||||||
Molybdenum sales (millions of recoverable pounds) a | 7 | |
| 13 | |
|
|
| ||||
|
|
|
|
|
|
| ||||||
Gross loss per pound of molybdenum: |
|
|
| |||||||||
|
|
|
|
|
|
| ||||||
Revenues, excluding adjustments a | $ | 7.87 | |
| $ | 9.00 | |
|
|
| ||
Site production and delivery, before net noncash and other costs shown below | 6.95 | |
| 6.35 | |
|
|
| ||||
Treatment charges and other | 0.85 | |
| 0.84 | |
|
|
| ||||
Unit net cash costs | 7.80 | |
| 7.19 | |
|
|
| ||||
DD&A | 2.71 | |
| 1.97 | |
|
|
| ||||
Noncash and other costs, net | 0.82 | |
| 0.37 | |
|
|
| ||||
Total unit costs | 11.33 | |
| 9.53 | |
|
|
| ||||
Gross loss per pound | $ | (3.46 | ) |
| $ | (0.53 | ) |
|
|
| ||
|
|
|
|
|
|
| ||||||
Reconciliation to Amounts Reported |
|
|
|
|
|
| ||||||
(In millions) |
|
|
|
|
|
| ||||||
Three Months Ended June 30, 2016 | Revenues |
| Production and Delivery |
| DD&A |
| ||||||
Totals presented above | $ | 50 | |
| $ | 45 | |
| $ | 17 | |
|
Treatment charges and other | (5 | ) |
| - | |
| - | |
| |||
Noncash and other costs, net | - | |
| 5 | |
| - | |
| |||
Molybdenum mines | 45 | |
| 50 | |
| 17 | |
| |||
Other mining & eliminations b | 2,879 | |
| 2,007 | |
| 393 | |
| |||
Total mining | 2,924 | |
| 2,057 | |
| 410 | |
| |||
U.S. oil & gas operations | 410 | |
| 889 | |
| 218 | |
| |||
Corporate, other & eliminations | - | |
| 10 | |
| 4 | |
| |||
As reported in FCX's consolidated financial statements | $ | 3,334 | |
| $ | 2,956 | |
| $ | 632 | |
|
|
|
|
|
|
|
| ||||||
Three Months Ended June 30, 2015 |
|
|
|
|
|
| ||||||
Totals presented above | $ | 112 | |
| $ | 80 | |
| $ | 25 | |
|
Treatment charges and other | (10 | ) |
| - | |
| - | |
| |||
Noncash and other costs, net | - | |
| 4 | |
| - | |
| |||
Molybdenum mines | 102 | |
| 84 | |
| 25 | |
| |||
Other mining & eliminations b | 3,267 | |
| 2,284 | |
| 320 | |
| |||
Total mining | 3,369 | |
| 2,368 | |
| 345 | |
| |||
U.S. oil & gas operations | 569 | |
| 281 | |
| 485 | |
| |||
Corporate, other & eliminations | - | |
| 2 | |
| 3 | |
| |||
As reported in FCX's consolidated financial statements | $ | 3,938 | |
| $ | 2,651 | |
| $ | 833 | |
|
a. | Reflects sales of the Molybdenum mines' production to our molybdenum sales company at market-based pricing. On a consolidated basis, realizations are based on the actual contract terms for sales to third parties; as a result, our consolidated average realized price per pound of molybdenum will differ from the amounts reported in this table. |
b. | Represents the combined total for all other mining operations and the related eliminations, as presented in Note 10 . Also includes amounts associated with our molybdenum sales company, which includes sales of molybdenum produced by the Molybdenum mines and by certain of the North and South America copper mines. |
80
Table of Contents
|
|
|
|
|
|
| ||||||
(In millions) | Six Months Ended June 30, |
|
|
| ||||||||
| 2016 |
| 2015 |
|
|
| ||||||
Revenues, excluding adjustments a | $ | 102 | |
| $ | 236 | |
|
|
| ||
|
|
|
|
|
|
| ||||||
Site production and delivery, before net noncash and other costs shown below | 92 | |
| 161 | |
|
|
| ||||
Treatment charges and other | 12 | |
| 21 | |
|
|
| ||||
Net cash costs | 104 | |
| 182 | |
|
|
| ||||
DD&A | 36 | |
| 51 | |
|
|
| ||||
Noncash and other costs, net | 10 | |
| 6 | |
|
|
| ||||
Total costs | 150 | |
| 239 | |
|
|
| ||||
Gross loss | $ | (48 | ) |
| $ | (3 | ) |
|
|
| ||
|
|
|
|
|
|
| ||||||
Molybdenum sales (millions of recoverable pounds) a | 14 | |
| 26 | |
|
|
| ||||
|
|
|
|
|
|
| ||||||
Gross loss per pound of molybdenum: |
|
|
| |||||||||
|
|
|
|
|
|
| ||||||
Revenues, excluding adjustments a | $ | 7.47 | |
| $ | 9.34 | |
|
|
| ||
|
|
|
|
|
|
| ||||||
Site production and delivery, before net noncash and other costs shown below | 6.76 | |
| 6.34 | |
|
|
| ||||
Treatment charges and other | 0.85 | |
| 0.84 | |
|
|
| ||||
Unit net cash costs | 7.61 | |
| 7.18 | |
|
|
| ||||
DD&A | 2.66 | |
| 2.00 | |
|
|
| ||||
Noncash and other costs, net | 0.69 | |
| 0.25 | |
|
|
| ||||
Total unit costs | 10.96 | |
| 9.43 | |
|
|
| ||||
Gross loss per pound | $ | (3.49 | ) |
| $ | (0.09 | ) |
|
|
| ||
|
|
|
|
|
|
| ||||||
Reconciliation to Amounts Reported |
|
|
|
|
|
| ||||||
(In millions) |
|
|
|
|
|
| ||||||
Six Months Ended June 30, 2016 | Revenues |
| Production and Delivery |
| DD&A |
| ||||||
Totals presented above | $ | 102 | |
| $ | 92 | |
| $ | 36 | |
|
Treatment charges and other | (12 | ) |
| - | |
| - | |
| |||
Noncash and other costs, net | - | |
| 10 | |
| - | |
| |||
Molybdenum mines | 90 | |
| 102 | |
| 36 | |
| |||
Other mining & eliminations b | 5,781 | |
| 4,044 | |
| 778 | |
| |||
Total mining | 5,871 | |
| 4,146 | |
| 814 | |
| |||
U.S. oil & gas operations | 705 | |
| 1,296 | |
| 473 | |
| |||
Corporate, other & eliminations | - | |
| 13 | |
| 7 | |
| |||
As reported in FCX's consolidated financial statements | $ | 6,576 | |
| $ | 5,455 | |
| $ | 1,294 | |
|
|
|
|
|
|
|
| ||||||
Six Months Ended June 30, 2015 |
|
|
|
|
|
| ||||||
Totals presented above | $ | 236 | |
| $ | 161 | |
| $ | 51 | |
|
Treatment charges and other | (21 | ) |
| - | |
| - | |
| |||
Noncash and other costs,net | - | |
| 6 | |
| - | |
| |||
Molybdenum mines | 215 | |
| 167 | |
| 51 | |
| |||
Other mining & eliminations b | 6,425 | |
| 4,594 | |
| 626 | |
| |||
Total mining | 6,640 | |
| 4,761 | |
| 677 | |
| |||
U.S. oil & gas operations | 1,069 | |
| 564 | |
| 1,015 | |
| |||
Corporate, other & eliminations | - | |
| 5 | |
| 7 | |
| |||
As reported in FCX's consolidated financial statements | $ | 7,709 | |
| $ | 5,330 | |
| $ | 1,699 | |
|
a. | Reflects sales of the Molybdenum mines' production to our molybdenum sales company at market-based pricing. On a consolidated basis, realizations are based on the actual contract terms for sales to third parties; as a result, our consolidated average realized price per pound of molybdenum will differ from the amounts reported in this table. |
b. | Represents the combined total for all other mining operations and the related eliminations, as presented in Note 10 . Also includes amounts associated with our molybdenum sales company, which includes sales of molybdenum produced by the Molybdenum mines and by certain of the North and South America copper mines. |
81
Table of Contents
U.S. Oil & Gas Product Revenues, Cash Production Costs and Realizations
Three Months Ended June 30, 2016 |
|
|
|
|
|
|
|
| ||||||||
(In millions) | Oil |
| Natural Gas |
| NGLs |
| Total |
| ||||||||
Oil and gas revenues | $ | 356 | |
| $ | 39 | |
| $ | 10 | |
| $ | 405 | |
|
Cash production costs |
|
|
|
|
|
| (186 | ) |
| |||||||
Cash operating margin |
|
|
|
|
|
| 219 | |
| |||||||
DD&A |
|
|
|
|
|
| (218 | ) |
| |||||||
Impairment of oil and gas properties |
|
|
|
|
|
| (290 | ) |
| |||||||
Accretion and other costs |
|
|
|
|
|
| (703 | ) | a | |||||||
Other revenue |
|
|
|
|
|
| 5 | |
| |||||||
Gross loss |
|
|
|
|
|
| $ | (987 | ) |
| ||||||
|
|
|
|
|
|
|
|
| ||||||||
Oil (MMBbls) | 8.7 | |
|
|
|
|
|
|
| |||||||
Gas (Bcf) |
|
| 18.8 | |
|
|
|
|
| |||||||
NGLs (MMBbls) |
|
|
|
| 0.6 | |
|
|
| |||||||
Oil Equivalents (MMBOE) |
|
|
|
|
|
| 12.4 | |
| |||||||
|
|
|
|
|
|
|
|
| ||||||||
| Oil |
| Natural Gas |
| NGLs |
| Per BOE |
| ||||||||
Oil and gas revenues | $ | 41.10 | |
| $ | 2.04 | |
| $ | 18.00 | |
| $ | 32.70 | |
|
Cash production costs |
|
|
|
|
|
| (15.00 | ) |
| |||||||
Cash operating margin |
|
|
|
|
|
| 17.70 | |
| |||||||
DD&A |
|
|
|
|
|
| (17.61 | ) |
| |||||||
Impairment of oil and gas properties |
|
|
|
|
|
| (23.46 | ) |
| |||||||
Accretion and other costs |
|
|
|
|
|
| (56.76 | ) | a | |||||||
Other revenue |
|
|
|
|
|
| 0.42 | |
| |||||||
Gross loss |
|
|
|
|
|
| $ | (79.71 | ) |
| ||||||
|
|
|
|
|
|
|
|
| ||||||||
Reconciliation to Amounts Reported | ||||||||||||||||
(In millions) | Revenues |
| Production and Delivery |
| DD&A |
| Impairment of Oil and Gas Properties |
| ||||||||
Totals presented above | $ | 405 | |
| $ | 186 | |
| $ | 218 | |
| $ | 290 | |
|
Accretion and other costs | - | |
| 703 | |
| - | |
| - | |
| ||||
Other revenue | 5 | |
| - | |
| - | |
| - | |
| ||||
U.S. oil & gas operations | 410 | |
| 889 | |
| 218 | |
| 290 | |
| ||||
Total mining b | 2,924 | |
| 2,057 | |
| 410 | |
| - | |
| ||||
Corporate, other & eliminations | - | |
| 10 | |
| 4 | |
| 1 | |
| ||||
As reported in FCX's consolidated financial statements | $ | 3,334 | |
| $ | 2,956 | |
| $ | 632 | |
| $ | 291 | |
|
a. | Includes charges of $692 million ( $55.91 per BOE) primarily for the termination and settlement of drillship contracts and inventory write downs. |
b. | Represents the combined total for mining operations and the related eliminations, as presented in Note 10 . |
82
Table of Contents
|
|
|
|
| ||||||||||||
Three Months Ended June 30, 2015 |
|
|
|
|
|
|
|
| ||||||||
(In millions) | Oil |
| Natural Gas |
| NGLs |
| Total |
| ||||||||
Oil and gas revenues before derivatives | $ | 480 | |
| $ | 63 | |
| $ | 12 | |
| $ | 555 | |
|
Cash gains on derivative contracts | 101 | |
| - | |
| - | |
| 101 | |
| ||||
Realized revenues | $ | 581 | |
| $ | 63 | |
| $ | 12 | |
| 656 | |
| |
Cash production costs |
|
|
|
|
|
| (249 | ) |
| |||||||
Cash operating margin |
|
|
|
|
|
| 407 | |
| |||||||
DD&A |
|
|
|
|
|
| (485 | ) |
| |||||||
Impairment of oil and gas properties |
|
|
|
|
|
| (2,686 | ) |
| |||||||
Accretion and other costs |
|
|
|
|
|
| (32 | ) | a | |||||||
Net noncash mark-to-market losses on derivative contracts |
|
|
|
|
|
| (95 | ) |
| |||||||
Other revenue |
|
|
|
|
|
| 8 | |
| |||||||
Gross loss |
|
|
|
|
|
| $ | (2,883 | ) |
| ||||||
|
|
|
|
|
|
|
|
| ||||||||
Oil (MMBbls) | 8.6 | |
|
|
|
|
|
|
| |||||||
Gas (Bcf) |
|
| 23.5 | |
|
|
|
|
| |||||||
NGLs (MMBbls) |
|
|
|
| 0.6 | |
|
|
| |||||||
Oil Equivalents (MMBOE) |
|
|
|
|
|
| 13.1 | |
| |||||||
|
|
|
|
|
|
|
|
| ||||||||
| Oil |
| Natural Gas |
| NGLs |
|
|
| ||||||||
| (per barrel) |
| (per MMBtu) |
| (per barrel) |
| Per BOE |
| ||||||||
Oil and gas revenues before derivatives | $ | 55.82 | |
| $ | 2.66 | |
| $ | 20.50 | |
| $ | 42.31 | |
|
Cash gains on derivative contracts | 11.79 | |
| - | |
| - | |
| 7.73 | |
| ||||
Realized revenues | $ | 67.61 | |
| $ | 2.66 | |
| $ | 20.50 | |
| 50.04 | |
| |
Cash production costs |
|
|
|
|
|
| (19.04 | ) |
| |||||||
Cash operating margin |
|
|
|
|
|
| 31.00 | |
| |||||||
DD&A |
|
|
|
|
|
| (36.99 | ) |
| |||||||
Impairment of oil and gas properties |
|
|
|
|
|
| (204.91 | ) |
| |||||||
Accretion and other costs |
|
|
|
|
|
| (2.46 | ) | a | |||||||
Net noncash mark-to-market losses on derivative contracts |
|
|
|
|
|
| (7.26 | ) |
| |||||||
Other revenue |
|
|
|
|
|
| 0.61 | |
| |||||||
Gross loss |
|
|
|
|
|
| $ | (220.01 | ) |
| ||||||
|
|
|
|
|
|
|
|
| ||||||||
Reconciliation to Amounts Reported |
| |||||||||||||||
(In millions) | Revenues |
| Production and Delivery |
| DD&A |
| Impairment of Oil and Gas Properties |
| ||||||||
Totals presented above | $ | 555 | |
| $ | 249 | |
| $ | 485 | |
| $ | 2,686 | |
|
Cash gains on derivative contracts | 101 | |
| - | |
| - | |
| - | |
| ||||
Net noncash mark-to-market losses on derivative contracts | (95 | ) |
| - | |
| - | |
| - | |
| ||||
Accretion and other costs | - | |
| 32 | |
| - | |
| - | |
| ||||
Other revenue | 8 | |
| - | |
| - | |
| - | |
| ||||
U.S. oil & gas operations | 569 | |
| 281 | |
| 485 | |
| 2,686 | |
| ||||
Total mining b | 3,369 | |
| 2,368 | |
| 345 | |
| - | |
| ||||
Corporate, other & eliminations | - | |
| 2 | |
| 3 | |
| - | |
| ||||
As reported in FCX's consolidated financial statements | $ | 3,938 | |
| $ | 2,651 | |
| $ | 833 | |
| $ | 2,686 | |
|
|
|
|
|
|
|
|
|
| ||||||||
a. | Includes charges of $22 million ( $1.72 per BOE) primarily for idle rig costs and inventory write downs. |
b. | Represents the combined total for mining operations and the related eliminations, as presented in Note 10 . |
83
Table of Contents
|
|
|
|
|
|
|
|
| ||||||||
|
|
|
|
|
|
| ||||||||||
Six Months Ended June 30, 2016 |
|
|
|
|
|
| ||||||||||
(In millions) | Oil |
| Natural Gas |
| NGLs |
| Total |
| ||||||||
Oil and gas revenues | $ | 597 | |
| $ | 78 | |
| $ | 19 | |
| $ | 694 | |
|
Cash production costs |
|
|
|
|
|
| (378 | ) |
| |||||||
Cash operating margin |
|
|
|
|
|
| 316 | |
| |||||||
DD&A |
|
|
|
|
|
| (473 | ) |
| |||||||
Impairment of oil and gas properties |
|
|
|
|
|
| (4,061 | ) |
| |||||||
Accretion and other costs |
|
|
|
|
|
| (918 | ) | a | |||||||
Other revenue |
|
|
|
|
|
| 11 | |
| |||||||
Gross loss |
|
|
|
|
|
| $ | (5,125 | ) |
| ||||||
|
|
|
|
|
|
|
|
| ||||||||
Oil (MMBbls) | 17.0 | |
|
|
|
|
|
|
| |||||||
Gas (Bcf) |
|
| 38.4 | |
|
|
|
|
| |||||||
NGLs (MMBbls) |
|
|
|
| 1.2 | |
|
|
| |||||||
Oil Equivalents (MMBOE) |
|
|
|
|
|
| 24.5 | |
| |||||||
|
|
|
|
|
|
|
|
| ||||||||
| Oil |
| Natural Gas |
| NGLs |
| Per BOE |
| ||||||||
Oil and gas revenues | $ | 35.21 | |
| $ | 2.02 | |
| $ | 16.44 | |
| $ | 28.29 | |
|
Cash production costs |
|
|
|
|
|
| (15.42 | ) |
| |||||||
Cash operating margin |
|
|
|
|
|
| 12.87 | |
| |||||||
DD&A |
|
|
|
|
|
| (19.27 | ) |
| |||||||
Impairment of oil and gas properties |
|
|
|
|
|
| (165.56 | ) |
| |||||||
Accretion and other costs |
|
|
|
|
|
| (37.41 | ) | a | |||||||
Other revenue |
|
|
|
|
|
| 0.45 | |
| |||||||
Gross loss |
|
|
|
|
|
| $ | (208.92 | ) |
| ||||||
|
|
|
|
|
|
|
|
| ||||||||
Reconciliation to Amounts Reported | ||||||||||||||||
(In millions) | Revenues |
| Production and Delivery |
| DD&A |
| Impairment of Oil and Gas Properties |
| ||||||||
Totals presented above | $ | 694 | |
| $ | 378 | |
| $ | 473 | |
| $ | 4,061 | |
|
Accretion and other costs | - | |
| 918 | |
| - | |
| - | |
| ||||
Other revenue | 11 | |
| - | |
| - | |
| - | |
| ||||
U.S. oil & gas operations | 705 | |
| 1,296 | |
| 473 | |
| 4,061 | |
| ||||
Total mining b | 5,871 | |
| 4,146 | |
| 814 | |
| - | |
| ||||
Corporate, other & eliminations | - | |
| 13 | |
| 7 | |
| 17 | |
| ||||
As reported in FCX's consolidated financial statements | $ | 6,576 | |
| $ | 5,455 | |
| $ | 1,294 | |
| $ | 4,078 | |
|
a. | Includes charges of $892 million ( $36.36 per BOE) primarily for the termination and settlement of drillship contracts and inventory write downs. |
b. | Represents the combined total for mining operations and the related eliminations, as presented in Note 10 . |
84
Table of Contents
|
|
|
|
|
|
|
|
| ||||||||
|
|
|
|
|
|
|
|
| ||||||||
Six Months Ended June 30, 2015 |
|
|
|
|
|
|
|
| ||||||||
(In millions) | Oil |
| Natural Gas |
| NGLs |
| Total |
| ||||||||
Oil and gas revenues before derivatives | $ | 853 | |
| $ | 125 | |
| $ | 24 | |
| $ | 1,002 | |
|
Cash gains on derivative contracts | 201 | |
| - | |
| - | |
| 201 | |
| ||||
Realized revenues | $ | 1,054 | |
| $ | 125 | |
| $ | 24 | |
| 1,203 | |
| |
Cash production costs |
|
|
|
|
|
| (503 | ) |
| |||||||
Cash operating margin |
|
|
|
|
|
| 700 | |
| |||||||
DD&A |
|
|
|
|
|
| (1,015 | ) |
| |||||||
Impairment of oil and gas properties |
|
|
|
|
|
| (5,790 | ) |
| |||||||
Accretion and other costs |
|
|
|
|
|
| (61 | ) | a | |||||||
Net noncash mark-to-market losses on derivative contracts |
|
|
|
|
|
| (143 | ) |
| |||||||
Other revenue |
|
|
|
|
|
| 9 | |
| |||||||
Gross loss |
|
|
|
|
|
| $ | (6,300 | ) |
| ||||||
|
|
|
|
|
|
|
|
| ||||||||
Oil (MMBbls) | 17.0 | |
|
|
|
|
|
|
| |||||||
Gas (Bcf) |
|
| 45.3 | |
|
|
|
|
| |||||||
NGLs (MMBbls) |
|
|
|
| 1.1 | |
|
|
| |||||||
Oil Equivalents (MMBOE) |
|
|
|
|
|
| 25.6 | |
| |||||||
|
|
|
|
|
|
|
|
| ||||||||
| Oil |
| Natural Gas |
| NGLs |
| Per BOE |
| ||||||||
Oil and gas revenues before derivatives | $ | 50.25 | |
| $ | 2.75 | |
| $ | 21.71 | |
| $ | 39.08 | |
|
Cash gains on derivative contracts | 11.88 | |
| - | |
| - | |
| 7.87 | |
| ||||
Realized revenues | $ | 62.13 | |
| $ | 2.75 | |
| $ | 21.71 | |
| 46.95 | |
| |
Cash production costs |
|
|
|
|
|
| (19.62 | ) |
| |||||||
Cash operating margin |
|
|
|
|
|
| 27.33 | |
| |||||||
DD&A |
|
|
|
|
|
| (39.59 | ) |
| |||||||
Impairment of oil and gas properties |
|
|
|
|
|
| (225.89 | ) |
| |||||||
Accretion and other costs |
|
|
|
|
|
| (2.39 | ) | a | |||||||
Net noncash mark-to-market losses on derivative contracts |
|
|
|
|
|
| (5.60 | ) |
| |||||||
Other revenue |
|
|
|
|
|
| 0.34 | |
| |||||||
Gross loss |
|
|
|
|
|
| $ | (245.80 | ) |
| ||||||
|
|
|
|
|
|
|
|
| ||||||||
Reconciliation to Amounts Reported | ||||||||||||||||
(In millions) | Revenues |
| Production and Delivery |
| DD&A |
| Impairment of Oil and Gas Properties |
| ||||||||
Totals presented above | $ | 1,002 | |
| $ | 503 | |
| $ | 1,015 | |
| $ | 5,790 | |
|
Cash gains on derivative contracts | 201 | |
| - | |
| - | |
| - | |
| ||||
Net noncash mark-to-market losses on derivative contracts | (143 | ) |
| - | |
| - | |
| - | |
| ||||
Accretion and other costs | - | |
| 61 | |
| - | |
| - | |
| ||||
Other revenue | 9 | |
| - | |
| - | |
| - | |
| ||||
U.S. oil & gas operations | 1,069 | |
| 564 | |
| 1,015 | |
| 5,790 | |
| ||||
Total mining b | 6,640 | |
| 4,761 | |
| 677 | |
| - | |
| ||||
Corporate, other & eliminations | - | |
| 5 | |
| 7 | |
| - | |
| ||||
As reported in FCX's consolidated financial statements | $ | 7,709 | |
| $ | 5,330 | |
| $ | 1,699 | |
| $ | 5,790 | |
|
a. | Includes charges of $39 million ( $1.54 per BOE) primarily for idle rig costs and inventory write downs. |
b. | Represents the combined total for mining operations and the related eliminations, as presented in Note 10 . |
|
|
|
|
|
|
85
Table of Contents
Discontinued Operations (Africa Mining): Product Revenues, Production Costs and Unit Net Cash Costs
Three Months Ended June 30, 2016 |
|
|
|
|
|
|
| ||||||||
(In millions) | By-Product |
| Co-Product Method | ||||||||||||
| Method |
| Copper |
| Cobalt |
| Total | ||||||||
Revenues, excluding adjustments a | $ | 258 | |
| $ | 258 | |
| $ | 61 | |
| $ | 319 | |
Site production and delivery, before net noncash and other costs shown below | 201 | |
| 177 | |
| 46 | |
| 223 | | ||||
Cobalt credits b | (40 | ) |
| - | |
| - | |
| - | | ||||
Royalty on metals | 6 | |
| 5 | |
| 1 | |
| 6 | | ||||
Net cash costs | 167 | |
| 182 | |
| 47 | |
| 229 | | ||||
DD&A | 62 | |
| 52 | |
| 10 | |
| 62 | | ||||
Noncash and other costs, net | 11 | |
| 9 | |
| 2 | |
| 11 | | ||||
Total costs | 240 | |
| 243 | |
| 59 | |
| 302 | | ||||
Revenue adjustments, primarily for pricing on prior period open sales | (1 | ) |
| (1 | ) |
| 1 | |
| - | | ||||
Gross profit | $ | 17 | |
| $ | 14 | |
| $ | 3 | |
| $ | 17 | |
|
|
|
|
|
|
|
| ||||||||
Copper sales (millions of recoverable pounds) | 124 | |
| 124 | |
|
|
|
| ||||||
Cobalt sales (millions of contained pounds) |
|
|
|
| 10 | |
|
| |||||||
|
|
|
|
|
|
|
| ||||||||
Gross profit per pound of copper/cobalt: |
|
|
| ||||||||||||
|
|
|
|
|
|
|
| ||||||||
Revenues, excluding adjustments a | $ | 2.07 | |
| $ | 2.07 | |
| $ | 6.58 | |
|
| ||
Site production and delivery, before net noncash and other costs shown below | 1.62 | |
| 1.42 | |
| 5.03 | |
|
| |||||
Cobalt credits b | (0.33 | ) |
| - | |
| - | |
|
| |||||
Royalty on metals | 0.05 | |
| 0.04 | |
| 0.11 | |
|
| |||||
Unit net cash costs | 1.34 | |
| 1.46 | |
| 5.14 | |
|
| |||||
DD&A | 0.49 | |
| 0.41 | |
| 1.07 | |
|
| |||||
Noncash and other costs, net | 0.09 | |
| 0.08 | |
| 0.20 | |
|
| |||||
Total unit costs | 1.92 | |
| 1.95 | |
| 6.41 | |
|
| |||||
Revenue adjustments, primarily for pricing on prior period open sales | (0.01 | ) |
| (0.01 | ) |
| 0.17 | |
|
| |||||
Gross profit per pound | $ | 0.14 | |
| $ | 0.11 | |
| $ | 0.34 | |
|
| ||
|
|
|
|
|
|
|
| ||||||||
Reconciliation to Amounts Reported |
|
|
|
|
|
|
| ||||||||
(In millions) | Revenues |
| Production and Delivery |
| DD&A |
|
| ||||||||
Totals presented above | $ | 319 | |
| $ | 223 | |
| $ | 62 | |
|
| ||
Royalty on metals | (6 | ) |
| - | |
| - | |
|
| |||||
Noncash and other costs, net | - | |
| 11 | |
| - | |
|
| |||||
Revenue adjustments, primarily for pricing on prior period open sales | - | |
| - | |
| - | |
|
| |||||
Eliminations and other adjustments c | (41 | ) |
| 22 | |
| (42 | ) |
|
| |||||
Total | $ | 272 | | d | $ | 256 | | d | $ | 20 | | d |
| ||
a. | Includes point-of-sale transportation costs as negotiated in customer contracts. |
b. | Net of cobalt downstream processing and freight costs. |
c. | Reflects adjustments associated with reporting Tenke as discontinued operations/assets held for sale, including the elimination of intercompany sales to our consolidated subsidiaries and the impact of discontinuing DD&A. |
d. | Refer to Note 2 for a reconciliation of these amounts to net income from discontinued operations as reported in FCX's consolidated financial statements. |
|
|
|
86
Table of Contents
Three Months Ended June 30, 2015 |
|
|
|
|
|
|
| ||||||||
(In millions) | By-Product |
| Co-Product Method | ||||||||||||
| Method |
| Copper |
| Cobalt |
| Total | ||||||||
Revenues, excluding adjustments a | $ | 275 | |
| $ | 275 | |
| $ | 76 | |
| $ | 351 | |
Site production and delivery, before net noncash and other costs shown below | 161 | |
| 141 | |
| 45 | |
| 186 | | ||||
Cobalt credits b | (55 | ) |
| - | |
| - | |
| - | | ||||
Royalty on metals | 6 | |
| 5 | |
| 1 | |
| 6 | | ||||
Net cash costs | 112 | |
| 146 | |
| 46 | |
| 192 | | ||||
DD&A | 57 | |
| 45 | |
| 12 | |
| 57 | | ||||
Noncash and other costs, net | 4 | |
| 3 | |
| 1 | |
| 4 | | ||||
Total costs | 173 | |
| 194 | |
| 59 | |
| 253 | | ||||
Revenue adjustments, primarily for pricing on prior period open sales | 2 | |
| 2 | |
| 4 | |
| 6 | | ||||
Gross profit | $ | 104 | |
| $ | 83 | |
| $ | 21 | |
| $ | 104 | |
|
|
|
|
|
|
|
| ||||||||
Copper sales (millions of recoverable pounds) | 104 | |
| 104 | |
|
|
|
| ||||||
Cobalt sales (millions of contained pounds) |
|
|
|
| 8 | |
|
| |||||||
|
|
|
|
|
|
|
| ||||||||
Gross profit per pound of copper/cobalt: |
|
|
| ||||||||||||
|
|
|
|
|
|
|
| ||||||||
Revenues, excluding adjustments a | $ | 2.63 | |
| $ | 2.63 | |
| $ | 9.27 | |
|
| ||
Site production and delivery, before net noncash and other costs shown below | 1.54 | |
| 1.35 | |
| 5.48 | |
|
| |||||
Cobalt credits b | (0.53 | ) |
| - | |
| - | |
|
| |||||
Royalty on metals | 0.06 | |
| 0.05 | |
| 0.16 | |
|
| |||||
Unit net cash costs | 1.07 | |
| 1.40 | |
| 5.64 | |
|
| |||||
DD&A | 0.55 | |
| 0.43 | |
| 1.42 | |
|
| |||||
Noncash and other costs, net | 0.03 | |
| 0.03 | |
| 0.10 | |
|
| |||||
Total unit costs | 1.65 | |
| 1.86 | |
| 7.16 | |
|
| |||||
Revenue adjustments, primarily for pricing on prior period open sales | 0.02 | |
| 0.02 | |
| 0.50 | |
|
| |||||
Gross profit per pound | $ | 1.00 | |
| $ | 0.79 | |
| $ | 2.61 | |
|
| ||
|
|
|
|
|
|
|
| ||||||||
Reconciliation to Amounts Reported |
|
|
|
|
|
|
| ||||||||
(In millions) | Revenues |
| Production and Delivery |
| DD&A |
|
| ||||||||
Totals presented above | $ | 351 | |
| $ | 186 | |
| $ | 57 | |
|
| ||
Royalty on metals | (6 | ) |
| - | |
| - | |
|
| |||||
Noncash and other costs, net | - | |
| 4 | |
| - | |
|
| |||||
Revenue adjustments, primarily for pricing on prior period open sales | 6 | |
| - | |
| - | |
|
| |||||
Eliminations and other adjustments c | (41 | ) |
| 7 | |
| - | |
|
| |||||
Total | $ | 310 | | d | $ | 197 | | d | $ | 57 | | d |
| ||
a. | Includes point-of-sale transportation costs as negotiated in customer contracts. |
b. | Net of cobalt downstream processing and freight costs. |
c. | Reflects adjustments associated with reporting Tenke as discontinued operations/assets held for sale, including the elimination of intercompany sales to our consolidated subsidiaries. |
d. | Refer to Note 2 for a reconciliation of these amounts to net income from discontinued operations as reported in FCX's consolidated financial statements. |
|
|
|
87
Table of Contents
|
|
|
|
|
|
|
| ||||||||
Six Months Ended June 30, 2016 |
|
|
|
|
|
|
| ||||||||
(In millions) | By-Product |
| Co-Product Method | ||||||||||||
| Method |
| Copper |
| Cobalt |
| Total | ||||||||
Revenues, excluding adjustments a | $ | 514 | |
| $ | 514 | |
| $ | 128 | |
| $ | 642 | |
Site production and delivery, before net noncash and other costs shown below | 403 | |
| 350 | |
| 98 | |
| 448 | | ||||
Cobalt credits b | (87 | ) |
| - | |
| - | |
| - | | ||||
Royalty on metals | 11 | |
| 9 | |
| 2 | |
| 11 | | ||||
Net cash costs | 327 | |
| 359 | |
| 100 | |
| 459 | | ||||
DD&A | 122 | |
| 101 | |
| 21 | |
| 122 | | ||||
Noncash and other costs, net | 13 | |
| 11 | |
| 2 | |
| 13 | | ||||
Total costs | 462 | |
| 471 | |
| 123 | |
| 594 | | ||||
Revenue adjustments, primarily for pricing on prior period open sales | (4 | ) |
| (4 | ) |
| 4 | |
| - | | ||||
Gross profit | $ | 48 | |
| $ | 39 | |
| $ | 9 | |
| $ | 48 | |
|
|
|
|
|
|
|
| ||||||||
Copper sales (millions of recoverable pounds) | 247 | |
| 247 | |
|
|
|
| ||||||
Cobalt sales (millions of contained pounds) |
|
|
|
| 20 | |
|
| |||||||
|
|
|
|
|
|
|
| ||||||||
Gross profit per pound of copper/cobalt: |
|
|
| ||||||||||||
|
|
|
|
|
|
|
| ||||||||
Revenues, excluding adjustments a | $ | 2.08 | |
| $ | 2.08 | |
| $ | 6.52 | |
|
| ||
Site production and delivery, before net noncash |
|
|
|
|
|
|
| ||||||||
and other costs shown below | 1.63 | |
| 1.42 | |
| 4.99 | |
|
| |||||
Cobalt credits b | (0.35 | ) |
| - | |
| - | |
|
| |||||
Royalty on metals | 0.05 | |
| 0.03 | |
| 0.11 | |
|
| |||||
Unit net cash costs | 1.33 | |
| 1.45 | |
| 5.10 | |
|
| |||||
DD&A | 0.49 | |
| 0.41 | |
| 1.05 | |
|
| |||||
Noncash and other costs, net | 0.05 | |
| 0.04 | |
| 0.11 | |
|
| |||||
Total unit costs | 1.87 | |
| 1.90 | |
| 6.26 | |
|
| |||||
Revenue adjustments, primarily for pricing |
|
|
|
|
|
|
| ||||||||
on prior period open sales | (0.02 | ) |
| (0.02 | ) |
| 0.19 | |
|
| |||||
Gross profit per pound | $ | 0.19 | |
| $ | 0.16 | |
| $ | 0.45 | |
|
| ||
|
|
|
|
|
|
|
| ||||||||
Reconciliation to Amounts Reported |
|
|
|
|
|
|
| ||||||||
(In millions) | Revenues |
| Production and Delivery |
| DD&A |
|
| ||||||||
Totals presented above | $ | 642 | |
| $ | 448 | |
| $ | 122 | |
|
| ||
Royalty on metals | (11 | ) |
| - | |
| - | |
|
| |||||
Noncash and other costs, net | - | |
| 13 | |
| - | |
|
| |||||
Revenue adjustments, primarily for pricing on prior period open sales | - | |
| - | |
| - | |
|
| |||||
Eliminations and other adjustments c | (73 | ) |
| 21 | |
| (42 | ) |
|
| |||||
Total | $ | 558 | | d | $ | 482 | | d | $ | 80 | | d |
| ||
a. | Includes point-of-sale transportation costs as negotiated in customer contracts. |
b. | Net of cobalt downstream processing and freight costs. |
c. | Reflects adjustments associated with reporting Tenke as discontinued operations/assets held for sale, including the elimination of intercompany sales to our consolidated subsidiaries and the impact of discontinuing DD&A. |
d. | Refer to Note 2 for a reconciliation of these amounts to net income from discontinued operations as reported in FCX's consolidated financial statements. |
|
|
|
88
Table of Contents
|
|
|
|
|
|
|
| ||||||||
Six Months Ended June 30, 2015 |
|
|
|
|
|
|
| ||||||||
(In millions) | By-Product |
| Co-Product Method | ||||||||||||
| Method |
| Copper |
| Cobalt |
| Total | ||||||||
Revenues, excluding adjustments a | $ | 631 | |
| $ | 631 | |
| $ | 152 | |
| $ | 783 | |
Site production and delivery, before net noncash and other costs shown below | 370 | |
| 325 | |
| 92 | |
| 417 | | ||||
Cobalt credits b | (104 | ) |
| - | |
| - | |
| - | | ||||
Royalty on metals | 14 | |
| 12 | |
| 2 | |
| 14 | | ||||
Net cash costs | 280 | |
| 337 | |
| 94 | |
| 431 | | ||||
DD&A | 130 | |
| 109 | |
| 21 | |
| 130 | | ||||
Noncash and other costs, net | 8 | |
| 6 | |
| 2 | |
| 8 | | ||||
Total costs | 418 | |
| 452 | |
| 117 | |
| 569 | | ||||
Revenue adjustments, primarily for pricing on prior period open sales | (7 | ) |
| (7 | ) |
| (1 | ) |
| (8 | ) | ||||
Gross profit | $ | 206 | |
| $ | 172 | |
| $ | 34 | |
| $ | 206 | |
|
|
|
|
|
|
|
| ||||||||
Copper sales (millions of recoverable pounds) | 237 | |
| 237 | |
|
|
|
| ||||||
Cobalt sales (millions of contained pounds) |
|
|
|
| 16 | |
|
| |||||||
|
|
|
|
|
|
|
| ||||||||
Gross profit per pound of copper/cobalt: |
|
|
| ||||||||||||
|
|
|
|
|
|
|
| ||||||||
Revenues, excluding adjustments a | $ | 2.66 | |
| $ | 2.66 | |
| $ | 9.23 | |
|
| ||
Site production and delivery, before net noncash |
|
|
|
|
|
|
| ||||||||
and other costs shown below | 1.56 | |
| 1.37 | |
| 5.54 | |
|
| |||||
Cobalt credits b | (0.44 | ) |
| - | |
| - | |
|
| |||||
Royalty on metals | 0.06 | |
| 0.05 | |
| 0.15 | |
|
| |||||
Unit net cash costs | 1.18 | |
| 1.42 | |
| 5.69 | |
|
| |||||
DD&A | 0.55 | |
| 0.46 | |
| 1.31 | |
|
| |||||
Noncash and other costs, net | 0.03 | |
| 0.03 | |
| 0.08 | |
|
| |||||
Total unit costs | 1.76 | |
| 1.91 | |
| 7.08 | |
|
| |||||
Revenue adjustments, primarily for pricing |
|
|
|
|
|
|
| ||||||||
on prior period open sales | (0.03 | ) |
| (0.03 | ) |
| (0.04 | ) |
|
| |||||
Gross profit per pound | $ | 0.87 | |
| $ | 0.72 | |
| $ | 2.11 | |
|
| ||
|
|
|
|
|
|
|
| ||||||||
Reconciliation to Amounts Reported |
|
|
|
|
|
|
| ||||||||
(In millions) | Revenues |
| Production and Delivery |
| DD&A |
|
| ||||||||
Totals presented above | $ | 783 | |
| $ | 417 | |
| $ | 130 | |
|
| ||
Royalty on metals | (14 | ) |
| - | |
| - | |
|
| |||||
Noncash and other costs, net | - | |
| 8 | |
| - | |
|
| |||||
Revenue adjustments, primarily for pricing on prior period open sales | (8 | ) |
| - | |
| - | |
|
| |||||
Eliminations and other adjustments c | (69 | ) |
| 5 | |
| - | |
|
| |||||
Total | $ | 692 | | d | $ | 430 | | d | $ | 130 | | d |
| ||
a. | Includes point-of-sale transportation costs as negotiated in customer contracts. |
b. | Net of cobalt downstream processing and freight costs. |
c. | Reflects adjustments associated with reporting Tenke as discontinued operations/assets held for sale, including the elimination of intercompany sales to our consolidated subsidiaries. |
d. | Refer to Note 2 for a reconciliation of these amounts to net income from discontinued operations as reported in FCX's consolidated financial statements. |
|
|
|
89
Table of Contents
CAUTIONARY STATEMENT
Our discussion and analysis contains forward-looking statements in which we discuss factors we believe may affect our future performance. Forward-looking statements are all statements other than statements of historical facts, such as projections or expectations relating to ore grades and milling rates; production and sales volumes; unit net cash costs; cash production costs per BOE; operating cash flows; capital expenditures; debt reduction initiatives, including our ability to complete pending asset sales; exploration efforts and results; development and production activities and costs; liquidity; tax rates; the impact of copper, gold, molybdenum, cobalt, crude oil and natural gas price changes; the impact of deferred intercompany profits on earnings; reserve estimates; future dividend payments, and share purchases and sales. The words "anticipates," "may," "can," "plans," "believes," "estimates," "expects," "projects," "targets," "intends," "likely," "will," "should," "to be," "potential," and any similar expressions are intended to identify those assertions as forward-looking statements. Under our term loan and revolving credit facility, as amended, we are not permitted to pay dividends on common stock on or prior to March 31, 2017. The declaration of dividends is at the discretion of our Board of Directors, subject to restrictions under our credit agreements, and will depend on our financial results, cash requirements, future prospects, and other factors deemed relevant by our Board.
We caution readers that forward-looking statements are not guarantees of future performance and actual results may differ materially from those anticipated, projected or assumed in the forward-looking statements. Important factors that can cause our actual results to differ materially from those anticipated in the forward-looking statements include supply of and demand for, and prices of, copper, gold, molybdenum, cobalt, crude oil and natural gas, mine sequencing, production rates, drilling results, potential effects of cost and capital expenditure reductions and production curtailments on financial results and cash flow, the outcome of our debt reduction initiatives, our ability to secure regulatory approvals, satisfy closing conditions and consummate pending asset sales, potential additional oil and gas property impairment charges, potential inventory adjustments, potential impairment of long-lived mining assets, the outcome of ongoing discussions with the Indonesian government regarding PT-FI's COW, including a resolution with respect to Indonesian regulations prohibiting concentrate exports after January 12, 2017, PT-FI's ability to obtain renewal of its export license after August 8, 2016, the potential effects of violence in Indonesia generally and in the province of Papua, the resolution of administrative disputes in the DRC, industry risks, regulatory changes, political risks, weather- and climate-related risks, labor relations, environmental risks, litigation results and other factors described in more detail in Part I, Item 1A. "Risk Factors" of our annual report on Form 10-K for the year ended December 31, 2015 , as updated by our subsequent filings with the SEC.
Investors are cautioned that many of the assumptions upon which our forward-looking statements are based are likely to change after the forward-looking statements are made, including for example commodity prices, which we cannot control, and production volumes and costs, some aspects of which we may not be able to control. Further, we may make changes to our business plans that could affect our results. We caution investors that we do not intend to update forward-looking statements more frequently than quarterly notwithstanding any changes in our assumptions, changes in business plans, actual experience or other changes, and we undertake no obligation to update any forward-looking statements.
90
Table of Contents
Item 3. | Quantitative and Qualitative Disclosures About Market Risk. |
There have been no material changes in our market risks during the six-month period ended June 30, 2016 . For additional information on market risks, refer to "Disclosures About Market Risks" included in Part I, Item 2. of our annual report on Form 10-K for the year ended December 31, 2015 . For projected sensitivities of our operating cash flow to changes in commodity prices, refer to "Outlook" in Part I, Item 2. of this quarterly report on Form 10-Q for the period ended June 30, 2016 ; for projected sensitivities of our provisionally priced copper sales and derivative instruments to changes in commodity prices refer to "Consolidated Results – Revenues" in Part I, Item 2. of this quarterly report on Form 10-Q for the period ended June 30, 2016 .
Item 4. | Controls and Procedures. |
(a) | Evaluation of disclosure controls and procedures. Our chief executive officer and chief financial officer, with the participation of management, have evaluated the effectiveness of our "disclosure controls and procedures" (as defined in Rules 13a-15(e) and 15d-15(e) under the Securities Exchange Act of 1934) as of the end of the period covered by this quarterly report on Form 10-Q. Based on their evaluation, they have concluded that our disclosure controls and procedures are effective as of June 30, 2016 . |
(b) | Changes in internal control over financial reporting. There has been no change in our internal control over financial reporting that occurred during the quarter ended June 30, 2016 , that has materially affected, or is reasonably likely to materially affect, our internal control over financial reporting. |
Part II. | OTHER INFORMATION |
Item 1. | Legal Proceedings. |
We are involved in numerous legal proceedings that arise in the ordinary course of our business or that are associated with environmental issues arising from legacy operations conducted over the years by Freeport Minerals Corporation and its affiliates. We are also involved from time to time in other reviews, investigations and proceedings by government agencies, some of which may result in adverse judgments, settlements, fines, penalties, injunctions or other relief.
Management does not believe, based on currently available information, that the outcome of any proceeding reported in Note 9 of this quarterly report on Form 10-Q for the period ended June 30, 2016, and in Part I, Item 3. "Legal Proceedings" of our annual report on Form 10-K for the year ended December 31, 2015 , will have a material adverse effect on our financial condition; although individual outcomes could be material to our operating results for a particular period, depending on the nature and magnitude of the outcome and the operating results for the period.
Item 1A. Risk Factors.
There have been no material changes to our risk factors during the six-month period ended June 30, 2016 . For additional information on risk factors, refer to Part I, Item 1A. "Risk Factors" of our annual report on Form 10-K for the year ended December 31, 2015 .
91
Table of Contents
Item 2. | Unregistered Sales of Equity Securities and Use of Proceeds. |
(a) We entered into privately negotiated share exchange agreements to exchange certain of our outstanding senior notes for shares of our common stock, plus cash representing accrued and unpaid interest on the senior notes. Between June 16, 2016 and August 4, 2016, we issued an aggregate of 28 million shares of common stock and approximately $5 million in cash representing accrued and unpaid interest, in exchange for an aggregate of $369 million in senior notes, consisting of: (i) $108 million aggregate principal amount of our 3.550% Senior Notes due 2022; (ii) $77 million aggregate principal amount of our 3.875% Senior Notes due 2023; (iii) $50 million aggregate principal amount of our 5.400% Senior Notes due 2034; and (iv) $134 million aggregate principal amount of our 5.450% Senior Notes due 2043.
The issuance of shares of common stock in the exchange transactions was made in reliance on the exemption from the registration requirements of the Securities Act of 1933, as amended, pursuant to Section 3(a)(9) thereof, as the exchanges were made with existing security holders exclusively in a series of privately negotiated transactions where no commission or other remuneration was paid or given directly or indirectly for soliciting the exchanges.
(c) | The following table sets forth information with respect to shares of our common stock purchased by us during the three months ended June 30, 2016 : |
Period |
| (a) Total Number of Shares Purchased |
| (b) Average Price Paid Per Share |
| (c) Total Number of Shares Purchased as Part of Publicly Announced Plans or Programs a |
| (d) Maximum Number of Shares That May Yet Be Purchased Under the Plans or Programs a | ||||||
April 1-30, 2016 |
| - | |
| $ | - | |
| - | |
| 23,685,500 | | |
May 1-31, 2016 |
| - | |
| $ | - | |
| - | |
| 23,685,500 | | |
June 1-30, 2016 |
| - | |
| $ | - | |
| - | |
| 23,685,500 | | |
Total |
| - | |
| $ | - | |
| - | |
| 23,685,500 | | |
a. | On July 21, 2008, our Board of Directors approved an increase in our open-market share purchase program for up to 30 million shares. There have been no purchases under this program since 2008. This program does not have an expiration date. |
Item 4. | Mine Safety Disclosures. |
The safety and health of all employees is our highest priority. Management believes that safety and health considerations are integral to, and compatible with, all other functions in the organization and that proper safety and health management will enhance production and reduce costs. Our approach towards the safety and health of our workforce is to continuously improve performance through implementing robust management systems and providing adequate training, safety incentive and occupational health programs. The information concerning mine safety violations or other regulatory matters required by Section 1503(a) of the Dodd-Frank Wall Street Reform and Consumer Protection Act and Item 104 of Regulation S-K is included in Exhibit 95.1 to this quarterly report on Form 10-Q.
Item 6. | Exhibits. |
The exhibits to this report are listed in the Exhibit Index beginning on Page E-1 hereof.
92
Table of Contents
SIGNATURE
Pursuant to the requirements of the Securities Exchange Act of 1934, the registrant has duly caused this report to be signed on its behalf by the undersigned thereunto duly authorized.
| FREEPORT-McMoRan INC. | |
|
|
|
| By: | /s/ C. Donald Whitmire, Jr. |
|
| C. Donald Whitmire, Jr. |
|
| Vice President and |
|
| Controller - Financial Reporting |
|
| (authorized signatory |
|
| and Principal Accounting Officer) |
Date: August 5, 2016
S-1
Table of Contents
FREEPORT-McMoRan INC. | |||||
EXHIBIT INDEX | |||||
|
| Filed |
| ||
Exhibit |
| with this | Incorporated by Reference | ||
Number | Exhibit Title | Form 10-Q | Form | File No. | Date Filed |
2.1 | Purchase Agreement dated February 15, 2016, between Sumitomo Metal Mining America Inc., Sumitomo Metal Mining Co., Ltd., Freeport-McMoRan Morenci Inc., Freeport Minerals Corporation and FCX. |
| 8-K | 001-11307-01 | 2/16/2016 |
2.2 | Stock Purchase Agreement dated May 9, 2016, among CMOC Limited, China Molybdenum Co., Ltd., Phelps Dodge Katanga Corporation and FCX. |
| 8-K | 001-11307-01 | 5/9/2016 |
3.1 | Amended and Restated Certificate of Incorporation of FCX, effective as of June 8, 2016. |
| 8-K | 001-11307-01 | 6/9/2016 |
3.2 | Amended and Restated By-Laws of FCX, effective as of June 8, 2016. |
| 8-K | 001-11307-01 | 6/9/2016 |
4.1 | Indenture dated as of February 13, 2012, between FCX and U.S. Bank National Association, as Trustee (relating to the 2.15% Senior Notes due 2017, the 3.55% Senior Notes due 2022, the 2.30% Senior Notes due 2017, the 4.00% Senior Notes due 2021, the 4.55% Senior Notes due 2024, and the 5.40% Senior Notes due 2034). |
| 8-K | 001-11307-01 | 2/13/2012 |
4.2 | Second Supplemental Indenture dated as of February 13, 2012, between FCX and U.S. Bank National Association, as Trustee (relating to the 2.15% Senior Notes due 2017). |
| 8-K | 001-11307-01 | 2/13/2012 |
4.3 | Third Supplemental Indenture dated as of February 13, 2012, between FCX and U.S. Bank National Association, as Trustee (relating to the 3.55% Senior Notes due 2022). |
| 8-K | 001-11307-01 | 2/13/2012 |
4.4 | Fourth Supplemental Indenture dated as of May 31, 2013, among FCX, Freeport-McMoRan Oil & Gas LLC and U.S. Bank National Association, as Trustee (relating to the 2.15% Senior Notes due 2017, the 3.55% Senior Notes due 2022, the 2.30% Senior Notes due 2017, the 4.00% Senior Notes due 2021, the 4.55% Senior Notes due 2024, and the 5.40% Senior Notes due 2034). |
| 8-K | 001-11307-01 | 6/3/2013 |
4.5 | Fifth Supplemental Indenture dated as of November 14, 2014 among FCX, Freeport-McMoRan Oil & Gas LLC and U.S. Bank National Association, as Trustee (relating to the 2.30% Senior Notes due 2017). |
| 8-K | 001-11307-01 | 11/14/2014 |
4.6 | Sixth Supplemental Indenture dated as of November 14, 2014 among FCX, Freeport-McMoRan Oil & Gas LLC and U.S. Bank National Association, as Trustee (relating to the 4.00% Senior Notes due 2021). |
| 8-K | 001-11307-01 | 11/14/2014 |
4.7 | Seventh Supplemental Indenture dated as of November 14, 2014 among FCX, Freeport-McMoRan Oil & Gas LLC and U.S. Bank National Association, as (relating to the 4.55% Senior Notes due 2024). |
| 8-K | 001-11307-01 | 11/14/2014 |
4.8 | Eighth Supplemental Indenture dated as of November 14, 2014 among FCX, Freeport-McMoRan Oil & Gas LLC and U.S. Bank National Association, as Trustee (relating to the 5.40% Senior Notes due 2034). |
| 8-K | 001-11307-01 | 11/14/2014 |
4.9 | Indenture dated as of March 7, 2013, between FCX and U.S. Bank National Association, as Trustee (relating to the 2.375% Senior Notes due 2018, the 3.100% Senior Notes due 2020, the 3.875% Senior Notes due 2023, and the 5.450% Senior Notes due 2043). |
| 8-K | 001-11307-01 | 3/7/2013 |
|
|
|
|
|
|
E-1
Table of Contents
FREEPORT-McMoRan INC. | |||||
EXHIBIT INDEX | |||||
|
| Filed |
| ||
Exhibit |
| with this | Incorporated by Reference | ||
Number | Exhibit Title | Form 10-Q | Form | File No. | Date Filed |
4.10 | Supplemental Indenture dated as of May 31, 2013, among FCX, Freeport-McMoRan Oil & Gas LLC and U.S. Bank National Association, as Trustee (relating to the 2.375% Senior Notes due 2018, the 3.100% Senior Notes due 2020, the 3.875% Senior Notes due 2023, and the 5.450% Senior Notes due 2043). |
| 8-K | 001-11307-01 | 6/3/2013 |
4.11 | Indenture dated as of March 13, 2007, among Plains Exploration & Production Company, the Subsidiary Guarantors parties thereto, and Wells Fargo Bank, N.A., as Trustee (relating to the 6.625% Senior Notes due 2021, the 6.75% Senior Notes due 2022, the 6.125% Senior Notes due 2019, the 6.5% Senior Notes due 2020, and the 6.875% Senior Notes due 2023). |
| 8-K | 001-31470 | 3/13/2007 |
4.12 | Twelfth Supplemental Indenture dated as of March 29, 2011 to the Indenture dated as of March 13, 2007, among Plains Exploration & Production Company, the Subsidiary Guarantors parties thereto and Wells Fargo Bank, N.A., as Trustee (relating to the 6.625% Senior Notes due 2021). |
| 8-K | 001-31470 | 3/29/2011 |
4.13 | Thirteenth Supplemental Indenture dated as of November 21, 2011 to the Indenture dated as of March 13, 2007, among Plains Exploration & Production Company, the Subsidiary Guarantors parties thereto and Wells Fargo Bank, N.A., as Trustee (relating to the 6.75% Senior Notes due 2022). |
| 8-K | 001-31470 | 11/22/2011 |
4.14 | Fourteenth Supplemental Indenture dated as of April 27, 2012 to the Indenture dated as of March 13, 2007, among Plains Exploration & Production Company, the Subsidiary Guarantors parties thereto and Wells Fargo Bank, N.A., as Trustee (relating to the 6.125% Senior Notes due 2019). |
| 8-K | 001-31470 | 4/27/2012 |
4.15 | Sixteenth Supplemental Indenture dated as of October 26, 2012 to the Indenture dated as of March 13, 2007, among Plains Exploration & Production Company, the Subsidiary Guarantors parties thereto and Wells Fargo Bank, N.A., as Trustee (relating to the 6.5% Senior Notes due 2020). |
| 8-K | 001-31470 | 10/26/2012 |
4.16 | Seventeenth Supplemental Indenture dated as of October 26, 2012 to the Indenture dated as of March 13, 2007, among Plains Exploration & Production Company, the Subsidiary Guarantors parties thereto and Wells Fargo Bank, N.A., as Trustee (relating to the 6.875% Senior Notes due 2023). |
| 8-K | 001-31470 | 10/26/2012 |
4.17 | Eighteenth Supplemental Indenture dated as of May 31, 2013 to the Indenture dated as of March 13, 2007, among Freeport-McMoRan Oil & Gas LLC, as Successor Issuer, FCX Oil & Gas Inc., as Co-Issuer, FCX, as Parent Guarantor, Plains Exploration & Production Company, as Original Issuer, and Wells Fargo Bank, N.A., as Trustee (relating to the 6.625% Senior Notes due 2021, the 6.75% Senior Notes due 2022, the 6.125% Senior Notes due 2019, the 6.5% Senior Notes due 2020, and the 6.875% Senior Notes due 2023). |
| 8-K | 001-11307-01 | 6/3/2013 |
4.18 | Form of Indenture dated as of September 22, 1997, between Phelps Dodge Corporation and The Chase Manhattan Bank, as Trustee (relating to the 7.125% Senior Notes due 2027, the 9.50% Senior Notes due 2031, and the 6.125% Senior Notes due 2034). |
| S-3 | 333-36415 | 9/25/1997 |
|
|
|
|
|
|
E-2
Table of Contents
FREEPORT-McMoRan INC. | |||||
EXHIBIT INDEX | |||||
|
| Filed |
| ||
Exhibit |
| with this | Incorporated by Reference | ||
Number | Exhibit Title | Form 10-Q | Form | File No. | Date Filed |
4.19 | Form of 7.125% Debenture due November 1, 2027 of Phelps Dodge Corporation issued on November 5, 1997, pursuant to the Indenture dated as of September 22, 1997, between Phelps Dodge Corporation and The Chase Manhattan Bank, as Trustee (relating to the 7.125% Senior Notes due 2027). |
| 8-K | 01-00082 | 11/3/1997 |
4.20 | Form of 9.5% Note due June 1, 2031 of Phelps Dodge Corporation issued on May 30, 2001, pursuant to the Indenture dated as of September 22, 1997, between Phelps Dodge Corporation and First Union National Bank, as successor Trustee (relating to the 9.50% Senior Notes due 2031). |
| 8-K | 01-00082 | 5/30/2001 |
4.21 | Form of 6.125% Note due March 15, 2034 of Phelps Dodge Corporation issued on March 4, 2004, pursuant to the Indenture dated as of September 22, 1997, between Phelps Dodge Corporation and First Union National Bank, as successor Trustee (relating to the 6.125% Senior Notes due 2034). |
| 10-K | 01-00082 | 3/7/2005 |
4.22 | Supplemental Indenture dated as of April 4, 2007 to the Indenture dated as of September 22, 1997, among Phelps Dodge Corporation, as Issuer, Freeport-McMoRan Copper & Gold Inc., as Parent Guarantor, and U.S. Bank National Association, as Trustee (relating to the 7.125% Senior Notes due 2027, the 9.50% Senior Notes due 2031, and the 6.125% Senior Notes due 2034). |
| 10-K | 001-11307-01 | 2/26/2016 |
10.1 | Distribution Agreement, dated as of May 16, 2016, by and among FCX, Noble Drilling (U.S.) LLC, J.P. Morgan Securities LLC and HSBC Securities (USA) Inc. |
| 8-K | 001-11307-01 | 5/16/2016 |
10.2 | Distribution Agreement, dated as of July 27, 2016, by and among FCX, J.P. Morgan Securities LLC, Merrill Lynch, Pierce, Fenner & Smith Incorporated, BBVA Securities Inc., BMO Capital Markets Corp., BNP Paribas Securities Corp., BTIG, LLC, CIBC World Markets Corp., Citigroup Global Markets Inc., HSBC Securities (USA) Inc., Mizuho Securities USA Inc., MUFG Securities Americas Inc., RBC Capital Markets, LLC, Santander Investment Securities Inc., Scotia Capital (USA) Inc., SMBC Nikko Securities America, Inc., TD Securities (USA) LLC and Wells Fargo Securities, LLC. |
| 8-K | 001-11307-01 | 7/27/2016 |
10.3* | FCX 2016 Stock Incentive Plan. |
| 8-K | 001-11307-01 | 6/9/2016 |
15.1 | Letter from Ernst & Young LLP regarding unaudited interim financial statements. | X |
|
|
|
31.1 | Certification of Principal Executive Officer pursuant to Rule 13a-14(a)/15d – 14(a). | X |
|
|
|
31.2 | Certification of Principal Financial Officer pursuant to Rule 13a-14(a)/15d – 14(a). | X |
|
|
|
32.1 | Certification of Principal Executive Officer pursuant to 18 U.S.C. Section 1350. | X |
|
|
|
32.2 | Certification of Principal Financial Officer pursuant to 18 U.S.C Section 1350. | X |
|
|
|
95.1 | Mine Safety and Health Administration Safety Data. | X |
|
|
|
101.INS | XBRL Instance Document. | X |
|
|
|
101.SCH | XBRL Taxonomy Extension Schema. | X |
|
|
|
101.CAL | XBRL Taxonomy Extension Calculation Linkbase. | X |
|
|
|
101.DEF | XBRL Taxonomy Extension Definition Linkbase. | X |
|
|
|
101.LAB | XBRL Taxonomy Extension Label Linkbase. | X |
|
|
|
101.PRE | XBRL Taxonomy Extension Presentation Linkbase. | X |
|
|
|
E-3
Table of Contents
* Indicates management contract or compensatory plan or arrangement.
Note: Certain instruments with respect to long-term debt of FCX have not been filed as exhibits to this Quarterly Report on Form 10-Q since the total amount of securities authorized under any such instrument does not exceed 10 percent of the total assets of FCX and its subsidiaries on a consolidated basis. FCX agrees to furnish a copy of each such instrument upon request of the Securities and Exchange Commission.
E-4