|
UNITED STATES
SECURITIES AND EXCHANGE COMMISSION
Washington, DC 20549
FORM 10-Q
(Mark One) |
|
R | Quarterly report pursuant to Section 13 or 15(d) of the Securities Exchange Act of 1934 |
|
|
| For the quarterly period ended June 30, 2017 |
|
|
or | |
|
|
o | Transition report pursuant to Section 13 or 15(d) of the Securities Exchange Act of 1934 |
|
|
| For the transition period from __________ to __________ |
|
|
| Commission file number 1-3950 |
Ford Motor Company
(Exact name of Registrant as specified in its charter)
Delaware | 38-0549190 |
(State of incorporation) | (I.R.S. Employer Identification No.) |
|
|
One American Road, Dearborn, Michigan | 48126 |
(Address of principal executive offices) | (Zip Code) |
313-322-3000
(Registrant's telephone number, including area code)
Indicate by check mark if the registrant (1) has filed all reports required to be filed by Section 13 or 15(d) of the Securities Exchange Act of 1934 during the preceding 12 months (or for such shorter period that the registrant was required to file such reports), and (2) has been subject to such filing requirements for the past 90 days. Yes R No o
Indicate by check mark whether the registrant has submitted electronically and posted on its corporate Web site, if any, every Interactive Data File required to be submitted and posted pursuant to Rule 405 of Regulation S-T (§232.405 of this chapter) during the preceding 12 months (or for such shorter period that the registrant was required to submit and post such files). Yes R No o
Indicate by check mark whether the registrant is a large accelerated filer, an accelerated filer, a non-accelerated filer, a smaller reporting company, or an emerging growth company. See definitions of "large accelerated filer," "accelerated filer," "smaller reporting company," and "emerging growth company" in Rule 12b-2 of the Exchange Act. Large accelerated filer R Accelerated filer o Non-accelerated filer o Smaller reporting company o Emerging growth company o
If an emerging growth company, indicate by check mark if the registrant has elected not to use the extended transition period for complying with any new or revised financial accounting standards provided pursuant to Section 13(a) of the Exchange Act. o
Indicate by check mark whether the registrant is a shell company (as defined in Rule 12b-2 of the Exchange Act). Yes o No R
As of July 19, 2017, Ford had outstanding 3,900,903,065 shares of Common Stock and 70,852,076 shares of Class B Stock.
77 |
|
FORD MOTOR COMPANY
QUARTERLY REPORT ON FORM 10-Q
For the Quarter Ended June 30, 2017
| Table of Contents |
| Page |
| Part I - Financial Information |
|
|
Item 1 | Financial Statements |
| 1 |
| Consolidated Income Statement |
| 1 |
| Consolidated Statement of Comprehensive Income |
| 1 |
| Consolidated Balance Sheet |
| 2 |
| Condensed Consolidated Statement of Cash Flows |
| 3 |
| Consolidated Statement of Equity |
| 4 |
| Notes to the Financial Statements |
| 5 |
| Report of Independent Registered Public Accounting Firm |
| 31 |
Item 2 | Management's Discussion and Analysis of Financial Condition and Results of Operations |
| 32 |
| Overview |
| 32 |
| Results of Operations |
| 33 |
| Automotive Segment |
| 35 |
| Financial Services Segment |
| 50 |
| All Other |
| 54 |
| Special Items |
| 54 |
| Taxes |
| 55 |
| Liquidity and Capital Resources |
| 55 |
| Credit Ratings |
| 62 |
| Production Volumes |
| 64 |
| Outlook |
| 65 |
| Non-GAAP Financial Measure Reconciliations |
| 67 |
| Supplemental Financial Information |
| 69 |
| Risk Factors |
| 72 |
| Accounting Standards Issued But Not Yet Adopted |
| 73 |
| Other Financial Information |
| 73 |
Item 3 | Quantitative and Qualitative Disclosures About Market Risk |
| 74 |
Item 4 | Controls and Procedures |
| 75 |
|
|
|
|
| Part II - Other Information |
|
|
Item 1 | Legal Proceedings |
| 75 |
Item 2 | Unregistered Sales of Equity Securities and Use of Proceeds |
| 75 |
Item 6 | Exhibits |
| 75 |
| Signature |
| 76 |
| Exhibit Index |
| 77 |
i
PART I. FINANCIAL INFORMATION
ITEM 1. Financial Statements.
FORD MOTOR COMPANY AND SUBSIDIARIES
CONSOLIDATED INCOME STATEMENT
(in millions, except per share amounts)
| For the periods ended June 30, | ||||||||||||||
| 2016 |
| 2017 |
| 2016 |
| 2017 | ||||||||
| Second Quarter |
| First Half | ||||||||||||
| (unaudited) | ||||||||||||||
Revenues |
|
|
|
|
|
|
| ||||||||
Automotive | $ | 36,932 | |
| $ | 37,113 | |
| $ | 72,189 | |
| $ | 73,588 | |
Financial Services | 2,553 | |
| 2,738 | |
| 5,014 | |
| 5,407 | | ||||
Other | - | |
| 2 | |
| - | |
| 4 | | ||||
Total revenues (Note 3) | 39,485 | |
| 39,853 | |
| 77,203 | |
| 78,999 | | ||||
|
|
|
|
|
|
|
| ||||||||
Costs and expenses |
| |
|
| |
|
|
|
| ||||||
Cost of sales | 32,522 | |
| 33,349 | |
| 63,039 | |
| 66,057 | | ||||
Selling, administrative, and other expenses | 2,784 | |
| 2,756 | |
| 5,474 | |
| 5,520 | | ||||
Financial Services interest, operating, and other expenses | 2,258 | |
| 2,217 | |
| 4,318 | |
| 4,449 | | ||||
Total costs and expenses | 37,564 | |
| 38,322 | |
| 72,831 | |
| 76,026 | | ||||
|
|
|
|
|
|
|
| ||||||||
Interest expense on Automotive debt | 212 | |
| 277 | |
| 412 | |
| 556 | | ||||
|
|
|
|
|
|
|
| ||||||||
Non-Financial Services other income/(loss), net (Note 4) | 686 | |
| 658 | |
| 1,454 | |
| 1,370 | | ||||
Financial Services other income/(loss), net (Note 4) | 82 | |
| 74 | |
| 173 | |
| 96 | | ||||
Equity in net income of affiliated companies | 398 | |
| 273 | |
| 939 | |
| 619 | | ||||
Income before income taxes | 2,875 | |
| 2,259 | | | 6,526 | | | 4,502 | | ||||
Provision for/(Benefit from) income taxes | 903 | |
| 209 | |
| 2,099 | |
| 858 | | ||||
Net income | 1,972 | |
| 2,050 | |
| 4,427 | |
| 3,644 | | ||||
Less: Income/(Loss) attributable to noncontrolling interests | 2 | |
| 8 | |
| 5 | |
| 15 | | ||||
Net income attributable to Ford Motor Company | $ | 1,970 | |
| $ | 2,042 | |
| $ | 4,422 | |
| $ | 3,629 | |
|
|
|
|
|
|
|
| ||||||||
EARNINGS PER SHARE ATTRIBUTABLE TO FORD MOTOR COMPANY COMMON AND CLASS B STOCK (Note 6) | |||||||||||||||
Basic income | $ | 0.50 | |
| $ | 0.51 | |
| $ | 1.11 | |
| $ | 0.91 | |
Diluted income | 0.49 | |
| 0.51 | |
| 1.11 | |
| 0.91 | | ||||
|
|
|
|
|
|
|
| ||||||||
Cash dividends declared | 0.15 | |
| 0.15 | |
| 0.55 | |
| 0.35 | | ||||
CONSOLIDATED STATEMENT OF COMPREHENSIVE INCOME
(in millions)
| For the periods ended June 30, | ||||||||||||||
| 2016 |
| 2017 |
| 2016 |
| 2017 | ||||||||
| Second Quarter |
| First Half | ||||||||||||
| (unaudited) | ||||||||||||||
Net income | $ | 1,972 | |
| $ | 2,050 | |
| $ | 4,427 | |
| $ | 3,644 | |
Other comprehensive income/(loss), net of tax (Note 15) |
|
|
|
|
|
|
| ||||||||
Foreign currency translation | (58 | ) |
| 84 | |
| (122 | ) |
| 326 | | ||||
Marketable securities | - | |
| 4 | |
| 6 | |
| 3 | | ||||
Derivative instruments | 111 | |
| 137 | |
| 357 | |
| (31 | ) | ||||
Pension and other postretirement benefits | 17 | |
| (12 | ) |
| 39 | |
| (3 | ) | ||||
Total other comprehensive income/(loss), net of tax | 70 | |
| 213 | |
| 280 | |
| 295 | | ||||
Comprehensive income | 2,042 | |
| 2,263 | |
| 4,707 | |
| 3,939 | | ||||
Less: Comprehensive income/(loss) attributable to noncontrolling interests | 2 | |
| 8 | |
| 4 | |
| 13 | | ||||
Comprehensive income attributable to Ford Motor Company | $ | 2,040 | |
| $ | 2,255 | |
| $ | 4,703 | |
| $ | 3,926 | |
The accompanying notes are part of the financial statements.
1
Item 1. Financial Statements (Continued)
FORD MOTOR COMPANY AND SUBSIDIARIES
CONSOLIDATED BALANCE SHEET
(in millions)
| December 31, |
| June 30, | ||||
| (unaudited) | ||||||
ASSETS |
|
|
| ||||
Cash and cash equivalents (Note 7) | $ | 15,905 | |
| $ | 16,223 | |
Marketable securities (Note 7) | 22,922 | |
| 22,886 | | ||
Financial Services finance receivables, net (Note 8) | 46,266 | |
| 49,888 | | ||
Trade and other receivables, less allowances of $392 and $416 | 11,102 | |
| 10,159 | | ||
Inventories (Note 10) | 8,898 | |
| 11,092 | | ||
Other assets | 3,368 | |
| 3,291 | | ||
Total current assets | 108,461 | |
| 113,539 | | ||
|
|
|
| ||||
Financial Services finance receivables, net (Note 8) | 49,924 | |
| 51,551 | | ||
Net investment in operating leases | 28,829 | |
| 28,597 | | ||
Net property | 32,072 | |
| 33,794 | | ||
Equity in net assets of affiliated companies | 3,304 | |
| 3,241 | | ||
Deferred income taxes | 9,705 | |
| 10,145 | | ||
Other assets | 5,656 | |
| 6,602 | | ||
Total assets | $ | 237,951 | |
| $ | 247,469 | |
|
|
|
| ||||
LIABILITIES |
| |
|
| | ||
Payables | $ | 21,296 | |
| $ | 23,568 | |
Other liabilities and deferred revenue (Note 11) | 19,316 | |
| 19,958 | | ||
Automotive debt payable within one year (Note 13) | 2,685 | |
| 2,911 | | ||
Financial Services debt payable within one year (Note 13) | 46,984 | |
| 47,862 | | ||
Total current liabilities | 90,281 | |
| 94,299 | | ||
|
|
|
| ||||
Other liabilities and deferred revenue (Note 11) | 24,395 | |
| 24,840 | | ||
Automotive long-term debt (Note 13) | 13,222 | |
| 13,277 | | ||
Financial Services long-term debt (Note 13) | 80,079 | |
| 81,959 | | ||
Deferred income taxes | 691 | |
| 735 | | ||
Total liabilities | 208,668 | |
| 215,110 | | ||
|
|
|
| ||||
Redeemable noncontrolling interest | 96 | |
| 97 | | ||
|
|
|
| ||||
EQUITY |
| |
|
| | ||
Common Stock, par value $.01 per share (3,986 million shares issued of 6 billion authorized) | 40 | |
| 40 | | ||
Class B Stock, par value $.01 per share (71 million shares issued of 530 million authorized) | 1 | |
| 1 | | ||
Capital in excess of par value of stock | 21,630 | |
| 21,735 | | ||
Retained earnings | 15,634 | |
| 18,437 | | ||
Accumulated other comprehensive income/(loss) (Note 15) | (7,013 | ) |
| (6,716 | ) | ||
Treasury stock | (1,122 | ) |
| (1,253 | ) | ||
Total equity attributable to Ford Motor Company | 29,170 | |
| 32,244 | | ||
Equity attributable to noncontrolling interests | 17 | |
| 18 | | ||
Total equity | 29,187 | |
| 32,262 | | ||
Total liabilities and equity | $ | 237,951 | |
| $ | 247,469 | |
The following table includes assets to be used to settle liabilities of the consolidated variable interest entities ("VIEs"). These assets and liabilities are included in the consolidated balance sheet above. | |||||||
| December 31, |
| June 30, | ||||
| (unaudited) | ||||||
ASSETS |
|
|
| ||||
Cash and cash equivalents | $ | 3,047 | |
| $ | 2,608 | |
Financial Services finance receivables, net | 50,857 | |
| 53,359 | | ||
Net investment in operating leases | 11,761 | |
| 11,003 | | ||
Other assets | 25 | |
| 39 | | ||
LIABILITIES |
|
|
| ||||
Other liabilities and deferred revenue | $ | 5 | |
| $ | 2 | |
Debt | 43,730 | |
| 43,051 | | ||
The accompanying notes are part of the financial statements.
2
Item 1. Financial Statements (Continued)
FORD MOTOR COMPANY AND SUBSIDIARIES
CONDENSED CONSOLIDATED STATEMENT OF CASH FLOWS
(in millions)
| For the periods ended June 30, | ||||||
| 2016 |
| 2017 | ||||
| First Half | ||||||
| (unaudited) | ||||||
Cash flows from operating activities |
|
|
| ||||
Net cash provided by/(used in) operating activities | $ | 11,891 | |
| $ | 9,951 | |
|
|
|
| ||||
Cash flows from investing activities |
|
|
| ||||
Capital spending | (3,206 | ) |
| (3,264 | ) | ||
Acquisitions of finance receivables and operating leases | (27,501 | ) |
| (27,379 | ) | ||
Collections of finance receivables and operating leases | 19,732 | |
| 21,636 | | ||
Purchases of equity and debt securities | (16,757 | ) |
| (16,931 | ) | ||
Sales and maturities of equity and debt securities | 15,491 | |
| 16,906 | | ||
Settlements of derivatives | 111 | |
| 154 | | ||
Other | 21 | |
| 16 | | ||
Net cash provided by/(used in) investing activities | (12,109 | ) |
| (8,862 | ) | ||
|
|
|
| ||||
Cash flows from financing activities |
| |
|
| | ||
Cash dividends | (2,184 | ) |
| (1,392 | ) | ||
Purchases of common stock | (145 | ) |
| (131 | ) | ||
Net changes in short-term debt | 934 | |
| 72 | | ||
Proceeds from issuance of other debt | 25,574 | |
| 20,467 | | ||
Principal payments on other debt | (21,104 | ) |
| (19,952 | ) | ||
Other | (87 | ) |
| (102 | ) | ||
Net cash provided by/(used in) financing activities | 2,988 | |
| (1,038 | ) | ||
|
|
|
| ||||
Effect of exchange rate changes on cash and cash equivalents | 21 | |
| 267 | | ||
|
|
|
| ||||
Net increase/(decrease) in cash and cash equivalents | $ | 2,791 | |
| $ | 318 | |
|
|
|
| ||||
Cash and cash equivalents at January 1 | $ | 14,272 | |
| $ | 15,905 | |
Net increase/(decrease) in cash and cash equivalents | 2,791 | |
| 318 | | ||
Cash and cash equivalents at June 30 | $ | 17,063 | |
| $ | 16,223 | |
The accompanying notes are part of the financial statements.
3
Item 1. Financial Statements (Continued)
FORD MOTOR COMPANY AND SUBSIDIARIES
CONSOLIDATED STATEMENT OF EQUITY
(in millions, unaudited)
| Equity Attributable to Ford Motor Company |
|
|
|
| ||||||||||||||||||||||||||
| Capital Stock |
| Cap. in Excess of Par Value of Stock |
| Retained Earnings |
| Accumulated Other Comprehensive Income/(Loss) (Note 15) |
| Treasury Stock |
| Total |
| Equity Attributable to Non-controlling Interests |
| Total Equity | ||||||||||||||||
Balance at December 31, 2015 | $ | 41 | |
| $ | 21,421 | |
| $ | 14,414 | |
| $ | (6,257 | ) |
| $ | (977 | ) |
| $ | 28,642 | |
| $ | 15 | |
| $ | 28,657 | |
Net income | - | |
| - | |
| 4,422 | |
| - | |
| - | |
| 4,422 | |
| 5 | |
| 4,427 | | ||||||||
Other comprehensive income/(loss), net of tax | - | |
| - | |
| - | |
| 281 | |
| - | |
| 281 | |
| (1 | ) |
| 280 | | ||||||||
Common stock issued (including share-based compensation impacts) | - | |
| 125 | |
| - | |
| - | |
| - | |
| 125 | |
| - | |
| 125 | | ||||||||
Treasury stock/other | - | |
| - | |
| - | |
| - | |
| (145 | ) |
| (145 | ) |
| (1 | ) |
| (146 | ) | ||||||||
Cash dividends declared | - | |
| - | |
| (2,184 | ) |
| - | |
| - | |
| (2,184 | ) |
| (5 | ) |
| (2,189 | ) | ||||||||
Balance at June 30, 2016 | $ | 41 | |
| $ | 21,546 | |
| $ | 16,652 | |
| $ | (5,976 | ) |
| $ | (1,122 | ) |
| $ | 31,141 | |
| $ | 13 | |
| $ | 31,154 | |
|
|
|
|
|
|
|
|
|
|
|
|
|
|
|
| ||||||||||||||||
Balance at December 31, 2016 | $ | 41 | |
| $ | 21,630 | |
| $ | 15,634 | |
| $ | (7,013 | ) |
| $ | (1,122 | ) |
| $ | 29,170 | |
| $ | 17 | |
| $ | 29,187 | |
Adoption of accounting standards | - | |
| 6 | |
| 566 | |
| - | |
| - | |
| 572 | |
| - | |
| 572 | | ||||||||
Net income | - | |
| - | |
| 3,629 | |
| - | |
| - | |
| 3,629 | |
| 15 | |
| 3,644 | | ||||||||
Other comprehensive income/(loss), net of tax | - | |
| - | |
| - | |
| 297 | |
| - | |
| 297 | |
| (2 | ) |
| 295 | | ||||||||
Common stock issued (including share-based compensation impacts) | - | |
| 99 | |
| - | |
| - | |
| - | |
| 99 | |
| - | |
| 99 | | ||||||||
Treasury stock/other | - | |
| - | |
| - | |
| - | |
| (131 | ) |
| (131 | ) |
| (1 | ) |
| (132 | ) | ||||||||
Cash dividends declared | - | |
| - | |
| (1,392 | ) |
| - | |
| - | |
| (1,392 | ) |
| (11 | ) |
| (1,403 | ) | ||||||||
Balance at June 30, 2017 | $ | 41 | |
| $ | 21,735 | |
| $ | 18,437 | |
| $ | (6,716 | ) |
| $ | (1,253 | ) |
| $ | 32,244 | |
| $ | 18 | |
| $ | 32,262 | |
The accompanying notes are part of the financial statements.
4
Item 1. Financial Statements (Continued)
FORD MOTOR COMPANY AND SUBSIDIARIES
NOTES TO THE FINANCIAL STATEMENTS
Table of Contents
Footnote |
| Page |
Note 1 | Presentation | 6 |
Note 2 | New Accounting Standards | 6 |
Note 3 | Revenue | 10 |
Note 4 | Other Income/(Loss) | 12 |
Note 5 | Income Taxes | 13 |
Note 6 | Capital Stock and Earnings Per Share | 13 |
Note 7 | Cash, Cash Equivalents, and Marketable Securities | 14 |
Note 8 | Financial Services Finance Receivables | 17 |
Note 9 | Financial Services Allowance for Credit Losses | 20 |
Note 10 | Inventories | 21 |
Note 11 | Other Liabilities and Deferred Revenue | 21 |
Note 12 | Retirement Benefits | 22 |
Note 13 | Debt | 23 |
Note 14 | Derivative Financial Instruments and Hedging Activities | 24 |
Note 15 | Accumulated Other Comprehensive Income/(Loss) | 26 |
Note 16 | Commitments and Contingencies | 27 |
Note 17 | Segment Information | 29 |
5
Item 1. Financial Statements (Continued)
FORD MOTOR COMPANY AND SUBSIDIARIES
NOTES TO THE FINANCIAL STATEMENTS
NOTE 1. PRESENTATION
For purposes of this report, "Ford," the "Company," "we," "our," "us," or similar references mean Ford Motor Company, our consolidated subsidiaries, and our consolidated VIEs of which we are the primary beneficiary, unless the context requires otherwise. Our financial statements are presented in accordance with U.S. generally accepted accounting principles ("GAAP") for interim financial information, instructions to Quarterly Report on Form 10-Q, and Rule 10-01 of Regulation S-X.
In the opinion of management, these unaudited financial statements reflect a fair statement of our results of operations and financial condition for the periods, and at the dates, presented. The results for interim periods are not necessarily indicative of results that may be expected for any other interim period or for the full year. Reference should be made to the financial statements contained in our Annual Report on Form 10-K for the year ended December 31, 2016 (" 2016 Form 10-K Report"). We reclassified certain prior year amounts in our consolidated financial statements to conform to the current year presentation.
NOTE 2. NEW ACCOUNTING STANDARDS
Adoption of New Accounting Standards
Accounting Standards Update ("ASU") 2016-09, Stock Compensation - Improvements to Employee Share-Based Payment Accounting . On January 1, 2017, we adopted the amendments to accounting standards codification ("ASC") 718 which simplify accounting for share-based payment transactions. Prior to this amendment, excess tax benefits resulting from the difference between the deduction for tax purposes and the compensation costs recognized for financial reporting were not recognized until the deduction reduced taxes payable. Under the new method, we will recognize excess tax benefits in the current accounting period. In addition, prior to January 1, 2017, the employee share-based compensation expense was recorded net of estimated forfeiture rates and subsequently adjusted at the vesting date, as appropriate. As part of the amendment, we have elected to recognize the actual forfeitures by reducing the employee share-based compensation expense in the same period as the forfeitures occur. We have adopted these changes in accounting method using the modified retrospective method by recognizing one-time adjustments to retained earnings for excess tax benefits previously unrecognized and the change in accounting for forfeited awards.
ASU 2014-09, Revenue - Revenue from Contracts with Customers. On January 1, 2017, we adopted the new accounting standard ASC 606, Revenue from Contracts with Customers and all the related amendments ("new revenue standard") to all contracts using the modified retrospective method. We recognized the cumulative effect of initially applying the new revenue standard as an adjustment to the opening balance of retained earnings. The comparative information has not been restated and continues to be reported under the accounting standards in effect for those periods. We expect the impact of the adoption of the new revenue standard to be immaterial to our net income on an ongoing basis.
A majority of our sales revenue continues to be recognized when products are shipped from our manufacturing facilities. For certain vehicle sales where revenue was previously deferred, such as vehicles subject to a guaranteed resale value recognized as a lease and transactions in which a Ford-owned entity delivered vehicles, we now recognize revenue when vehicles are shipped in accordance with the new revenue standard.
The new revenue standard also provided additional clarity that resulted in reclassifications to or from Revenue , Cost of sales , and Financial Services other income/(loss), net .
6
Item 1. Financial Statements (Continued)
FORD MOTOR COMPANY AND SUBSIDIARIES
NOTES TO THE FINANCIAL STATEMENTS
NOTE 2. NEW ACCOUNTING STANDARDS (Continued)
The cumulative effect of the changes made to our consolidated January 1, 2017 balance sheet for the adoption of ASU 2016-09, Stock Compensation - Improvements to Employee Share-Based Payment Accounting and ASU 2014-09, Revenue - Revenue from Contracts with Customers were as follows (in millions):
| Balance at December 31, 2016 |
| Adjustments Due to |
| Adjustments Due to ASU 2014-09 |
| Balance at January 1, 2017 | ||||||||
Balance Sheet |
|
|
|
|
|
|
| ||||||||
Assets |
|
|
|
|
|
|
| ||||||||
Trade and other receivables | $ | 11,102 | |
| $ | - | |
| $ | (17 | ) |
| $ | 11,085 | |
Inventories | 8,898 | |
| - | |
| (9 | ) |
| 8,889 | | ||||
Other assets, current | 3,368 | |
| - | |
| 307 | |
| 3,675 | | ||||
Net investment in operating leases | 28,829 | |
| - | |
| (1,078 | ) |
| 27,751 | | ||||
Deferred income taxes | 9,705 | |
| 536 | |
| (13 | ) |
| 10,228 | | ||||
|
|
|
|
|
|
| | | |||||||
Liabilities |
|
|
|
|
|
| | | |||||||
Payables | 21,296 | |
| - | |
| 262 | |
| 21,558 | | ||||
Other liabilities and deferred revenue, current | 19,316 | |
| - | |
| (1,429 | ) |
| 17,887 | | ||||
Automotive debt payable within one year | 2,685 | |
| - | |
| 326 | |
| 3,011 | | ||||
Other liabilities and deferred revenue, non-current | 24,395 | |
| - | |
| (5 | ) |
| 24,390 | | ||||
|
|
|
|
|
|
| | | |||||||
Equity |
|
|
|
|
|
| | | |||||||
Capital in excess of par value of stock | 21,630 | |
| 6 | |
| - | |
| 21,636 | | ||||
Retained earnings | 15,634 | |
| 530 | |
| 36 | |
| 16,200 | | ||||
As part of ASU 2016-09, we retrospectively reclassified cash paid to taxing authorities related to shares withheld for tax purposes from operating activities to financing activities on our consolidated statement of cash flows. Cash paid to taxing authorities related to shares withheld for tax purposes was about $57 million and $56 million for the first half of 2016 and 2017 , respectively. This standard did not have a material impact on our second quarter and first half 2017 consolidated income statement or June 30, 2017 consolidated balance sheet .
7
Item 1. Financial Statements (Continued)
FORD MOTOR COMPANY AND SUBSIDIARIES
NOTES TO THE FINANCIAL STATEMENTS
NOTE 2. NEW ACCOUNTING STANDARDS (Continued)
In accordance with the new revenue standard requirements, the disclosure of the impact of adoption on our consolidated income statement and balance sheet for the periods ended June 30, 2017 was as follows (in millions):
| Second Quarter |
| First Half | ||||||||||||||||||||
| As Reported |
| Balances Without Adoption of ASC 606 |
| Effect of Change |
| As Reported |
| Balances Without Adoption of ASC 606 |
| Effect of Change | ||||||||||||
Income statement |
|
|
|
|
|
|
|
|
|
|
| ||||||||||||
Revenues |
|
|
|
|
|
|
|
|
|
|
| ||||||||||||
Automotive | $ | 37,113 | |
| $ | 36,898 | |
| $ | 215 | |
| $ | 73,588 | |
| $ | 73,040 | |
| $ | 548 | |
Financial Services | 2,738 | |
| 2,641 | |
| 97 | |
| 5,407 | |
| 5,221 | |
| 186 | | ||||||
|
|
|
|
|
|
|
|
|
|
|
| ||||||||||||
Costs and expenses |
|
|
|
|
|
|
|
|
|
|
| ||||||||||||
Cost of sales | 33,349 | |
| 33,184 | |
| 165 | |
| 66,057 | |
| 65,630 | |
| 427 | | ||||||
Interest expense on Automotive debt | 277 | |
| 266 | |
| 11 | |
| 556 | |
| 528 | |
| 28 | | ||||||
Non-Financial Services other income/(loss), net | 658 | |
| 679 | |
| (21 | ) |
| 1,370 | |
| 1,411 | |
| (41 | ) | ||||||
Financial Services other income/(loss), net | 74 | |
| 171 | |
| (97 | ) |
| 96 | |
| 282 | |
| (186 | ) | ||||||
Provision for/(Benefit from) income taxes | 209 | |
| 204 | |
| 5 | |
| 858 | |
| 846 | |
| 12 | | ||||||
Net income | 2,050 | |
| 2,037 | |
| 13 | |
| 3,644 | |
| 3,604 | |
| 40 | | ||||||
| June 30, 2017 | ||||||||||
| As Reported |
| Balances Without Adoption of ASC 606 |
| Effect of Change | ||||||
Balance Sheet |
|
|
|
|
| ||||||
Assets |
|
|
|
|
| ||||||
Trade and other receivables | $ | 10,159 | |
| $ | 10,199 | |
| $ | (40 | ) |
Other assets, current | 3,291 | |
| 2,951 | |
| 340 | | |||
Net investment in operating leases | 28,597 | |
| 29,553 | |
| (956 | ) | |||
Deferred income taxes | 10,145 | |
| 10,170 | |
| (25 | ) | |||
|
|
|
|
|
| ||||||
Liabilities |
|
|
|
|
| ||||||
Payables | 23,568 | |
| 23,285 | |
| 283 | | |||
Other liabilities and deferred revenue, current | 19,958 | |
| 21,393 | |
| (1,435 | ) | |||
Automotive debt payable within one year | 2,911 | |
| 2,511 | |
| 400 | | |||
Other liabilities and deferred revenue, non-current | 24,840 | |
| 24,845 | |
| (5 | ) | |||
Deferred income taxes | 735 | |
| 735 | |
| - | | |||
|
|
|
|
|
| ||||||
Equity |
|
|
|
|
| ||||||
Retained earnings | 18,437 | |
| 18,361 | |
| 76 | | |||
8
Item 1. Financial Statements (Continued)
FORD MOTOR COMPANY AND SUBSIDIARIES
NOTES TO THE FINANCIAL STATEMENTS
NOTE 2. NEW ACCOUNTING STANDARDS (Continued)
ASU 2017-07, Retirement Benefits - Improving the Presentation of Net Periodic Pension Cost and Net Periodic Postretirement Benefit Cost . On January 1, 2017, we adopted the amendments to ASC 715 that improve the presentation of net periodic pension and postretirement benefit costs. We retrospectively adopted the presentation of service cost separate from the other components of net periodic costs. The interest cost, expected return on assets, amortization of prior service costs, net remeasurement, and other costs have been reclassified from Cost of Sales and Selling, administrative, and other expenses to Non-Financial Services other income/(loss), net. We elected to apply the practical expedient which allows us to reclassify amounts disclosed previously in the retirement benefits note as the basis for applying retrospective presentation for comparative periods as it is impracticable to determine the disaggregation of the cost components for amounts capitalized and amortized in those periods. On a prospective basis, the other components of net periodic benefit costs will not be included in amounts capitalized in inventory or property, plant, and equipment.
The effect of the retrospective presentation change related to the net periodic cost of our defined benefit pension and other postretirement employee benefits ("OPEB") plans on our consolidated income statement for the periods ended June 30, 2016 was as follows (in millions):
| Second Quarter |
| First Half | ||||||||||||||||||||
| As Revised |
| Previously Reported |
| Effect of Change |
| As Revised |
| Previously Reported |
| Effect of Change | ||||||||||||
Income statement |
|
|
|
|
|
|
|
|
|
|
| ||||||||||||
Cost of sales | $ | 32,522 | |
| $ | 32,348 | |
| $ | 174 | |
| $ | 63,039 | |
| $ | 62,629 | |
| $ | 410 | |
Selling, administrative, and other expenses | 2,784 | |
| 2,661 | |
| 123 | |
| 5,474 | |
| 5,223 | |
| 251 | | ||||||
Non-Financial Services other income/(loss), net | 686 | |
| 389 | |
| 297 | |
| 1,454 | |
| 793 | |
| 661 | | ||||||
We also adopted the following standards during 2017 , none of which had a material impact to our financial statements or financial statement disclosures:
Standard |
| Effective Date | |
2017-05 | Gains and Losses from the Derecognition of Nonfinancial Assets - Clarifying the Scope of Asset Derecognition Guidance |
| January 1, 2017 |
2017-04 | Goodwill and Other - Simplifying the Test for Goodwill Impairment |
| January 1, 2017 |
2017-03 | Accounting Changes and Error Corrections and Investments - Equity Method and Joint Ventures |
| January 1, 2017 |
2017-01 | Business Combinations - Clarifying the Definition of a Business |
| January 1, 2017 |
2016-17 | Consolidation - Interests Held through Related Parties That Are under Common Control |
| January 1, 2017 |
2016-07 | Equity Method and Joint Ventures - Simplifying the Transition to the Equity Method of Accounting |
| January 1, 2017 |
2016-06 | Derivatives and Hedging - Contingent Put and Call Options in Debt Instruments |
| January 1, 2017 |
2016-05 | Derivatives and Hedging - Effect of Derivative Contract Novations on Existing Hedge Accounting Relationships |
| January 1, 2017 |
2016-04 | Extinguishments of Liabilities - Recognition of Breakage for Certain Prepaid Stored-Value Products |
| January 1, 2017 |
2017-09 | Stock Compensation - Scope of Modification Accounting |
| April 1, 2017 |
Accounting Standards Issued But Not Yet Adopted
The following represent the standards that will, or are expected to, result in a significant change in practice and/or have a significant financial impact to Ford.
ASU 2016-13, Credit Losses - Measurement of Credit Losses on Financial Instruments . In June 2016, the Financial Accounting Standards Board ("FASB") issued a new accounting standard which replaces the current incurred loss impairment method with a method that reflects expected credit losses. The new standard is effective as of January 1, 2020, and early adoption is permitted as of January 1, 2019. We will adopt the new credit loss guidance by recognizing the cumulative effect of initially applying the new standard as an adjustment to the opening balance of retained earnings. We are assessing the potential impact to our financial statements and disclosures.
9
Item 1. Financial Statements (Continued)
FORD MOTOR COMPANY AND SUBSIDIARIES
NOTES TO THE FINANCIAL STATEMENTS
NOTE 2. NEW ACCOUNTING STANDARDS (Continued)
ASU 2016-02, Leases . In February 2016, the FASB issued a new accounting standard which provides guidance on the recognition, measurement, presentation, and disclosure of leases. The new standard supersedes the present U.S. GAAP standard on leases and requires substantially all leases to be reported on the balance sheet as right-of-use assets and lease obligations. We plan to adopt the new standard at its effective date of January 1, 2019. We anticipate adoption of the standard will add between $1.5 billion and $2 billion in right-of-use assets and lease obligations to our balance sheet and will not significantly impact pre-tax profit. We are in the early stages of implementation.
NOTE 3. REVENUE
The following table disaggregates our revenue by major source for the periods ended June 30, 2017 (in millions):
| Second Quarter | ||||||||||||||
| Automotive |
| Financial Services |
| All Other |
| Consolidated | ||||||||
Vehicles, parts, and accessories | $ | 35,746 | |
| $ | - | |
| $ | - | |
| $ | 35,746 | |
Sale of used vehicles | 708 | |
| - | |
| - | |
| 708 | | ||||
Extended service contracts | 332 | |
| - | |
| - | |
| 332 | | ||||
Other (a) | 202 | |
| 55 | |
| 2 | |
| 259 | | ||||
Revenues from sales and services | 36,988 | |
| 55 | |
| 2 | |
| 37,045 | | ||||
|
|
|
|
|
|
|
| ||||||||
Leasing income | 125 | |
| 1,381 | |
| - | |
| 1,506 | | ||||
Financing income | - | |
| 1,260 | |
| - | |
| 1,260 | | ||||
Insurance income | - | |
| 42 | |
| - | |
| 42 | | ||||
Total revenues | $ | 37,113 | |
| $ | 2,738 | |
| $ | 2 | |
| $ | 39,853 | |
|
|
|
|
|
|
|
| ||||||||
| First Half | ||||||||||||||
| Automotive |
| Financial Services |
| All Other |
| Consolidated | ||||||||
Vehicles, parts, and accessories | $ | 70,742 | |
| $ | - | |
| $ | - | |
| $ | 70,742 | |
Sale of used vehicles | 1,581 | |
| - | |
| - | |
| 1,581 | | ||||
Extended service contracts | 607 | |
| - | |
| - | |
| 607 | | ||||
Other (a) | 426 | |
| 104 | |
| 4 | |
| 534 | | ||||
Revenues from sales and services | 73,356 | |
| 104 | |
| 4 | |
| 73,464 | | ||||
|
|
|
|
|
|
|
| ||||||||
Leasing income | 232 | |
| 2,747 | |
| - | |
| 2,979 | | ||||
Financing income | - | |
| 2,474 | |
| - | |
| 2,474 | | ||||
Insurance income | - | |
| 82 | |
| - | |
| 82 | | ||||
Total revenues | $ | 73,588 | |
| $ | 5,407 | |
| $ | 4 | |
| $ | 78,999 | |
__________
(a) | Primarily includes commissions and vehicle-related design and testing services. |
Revenue is recognized when obligations under the terms of a contract with our customer are satisfied; generally this occurs with the transfer of control of our vehicles, parts, accessories, or services. Revenue is measured as the amount of consideration we expect to receive in exchange for transferring goods or providing services. Sales, value add, and other taxes we collect concurrent with revenue-producing activities are excluded from revenue. Incidental items that are immaterial in the context of the contract are recognized as expense. The expected costs associated with our base warranties and field service actions continue to be recognized as expense when the products are sold (see Note 16 ). We recognize revenue for vehicle service contracts that extend mechanical and maintenance beyond our base warranties over the life of the contract.
10
Item 1. Financial Statements (Continued)
FORD MOTOR COMPANY AND SUBSIDIARIES
NOTES TO THE FINANCIAL STATEMENTS
NOTE 3. REVENUE (Continued)
Automotive Segment
Vehicles, Parts, and Accessories. For the majority of vehicles, parts, and accessories, we transfer control and recognize a sale when we ship the product from our manufacturing facility to our customer (dealers and distributors). The amount of consideration we receive and revenue we recognize varies with changes in marketing incentives and returns we offer to our customers and their customers. When we give our dealers the right to return eligible parts and accessories, we estimate the expected returns based on an analysis of historical experience. We adjust our estimate of revenue at the earlier of when the most likely amount of consideration we expect to receive changes or when the consideration becomes fixed. As a result we recognized a decrease to revenue from prior periods in the second quarter of 2017 of $259 million .
Depending on the terms of the arrangement, we may also defer the recognition of a portion of the consideration received because we have to satisfy a future obligation (e.g., free extended service contracts). We use an observable price to determine the stand-alone selling price for separate performance obligations or a cost plus margin approach when one is not available. We have elected to recognize the cost for freight and shipping when control over vehicles, parts, or accessories have transferred to the customer as an expense in Cost of sales .
We sell vehicles to daily rental companies and guarantee that we will pay them the difference between an agreed amount and the value they are able to realize upon resale. At the time of transfer of vehicles to the daily rental companies, we record the probable amount we will pay under the guarantee to Other liabilities and deferred revenue.
Sale of Used Vehicles. We sell used vehicles both at auction and through our consolidated dealerships. Proceeds from the sale of these vehicles are recognized in Automotive revenues upon transfer of control of the vehicle to the customer and the related vehicle carrying value is recognized in Cost of sales .
Extended Service Contracts. We sell separately-priced service contracts that extend mechanical and maintenance coverages beyond our base warranty agreements to vehicle owners. The separately priced service contracts range from 12 months to 120 months . We receive payment at the inception of the contract and recognize revenue over the term of the agreement in proportion to the costs expected to be incurred in satisfying the obligations under the contract. At January 1, 2017, $3.5 billion of unearned revenue associated with outstanding contracts was reported in Other Liabilities and deferred revenue, $271 million and $541 million of this was recognized as revenue during the second quarter and first half of 2017 , respectively. At June 30, 2017 , the unearned amount was $3.7 billion . We expect to recognize approximately $550 million of the unearned amount in 2017, $950 million in 2018, and $2.2 billion thereafter. We record a premium deficiency reserve to the extent we estimate the future costs associated with these contracts exceed the unrecognized revenue. Amounts paid to dealers to obtain these contracts are deferred and recorded as Other assets . These costs are amortized to expense consistent with how the related revenue is recognized. We had a balance of $239 million in deferred costs as of June 30, 2017 and recognized $14 million and $29 million of amortization during the second quarter and first half of 2017 , respectively.
Other Revenue. Other revenue consists primarily of net commissions received for serving as the agent in facilitating the sale of a third party's products or services to our customers and payments for vehicle - related design and testing services we perform for others. We have applied the practical expedient to recognize Automotive revenues for vehicle-related design and testing services over the two to three year term of these agreements in proportion to the amount we have the right to invoice.
Leasing Income. We sell vehicles to daily rental companies with an obligation to repurchase the vehicles for a guaranteed amount, exercisable at the option of the customer. The transactions are accounted for as operating leases. Upon the transfer of vehicles to the daily rental companies, we record proceeds received in Other liabilities and deferred revenue. The difference between the proceeds received and the guaranteed repurchase amount is recorded in Automotive revenues over the term of the lease using a straight-line method. The cost of the vehicle is recorded in Net investment in operating leases on our consolidated balance sheet and the difference between the cost of the vehicle and the estimated auction value is depreciated in Cost of sales over the term of the lease.
11
Item 1. Financial Statements (Continued)
FORD MOTOR COMPANY AND SUBSIDIARIES
NOTES TO THE FINANCIAL STATEMENTS
NOTE 3. REVENUE (Continued)
Financial Services Segment
Leasing Income. Ford Credit offers leasing plans to retail consumers through Ford and Lincoln brand dealers who originate the leases. Upon the purchase of a lease from the dealer, Ford Credit takes ownership of the vehicle and records an operating lease. The retail consumer makes lease payments representing the difference between Ford Credit's purchase price of the vehicle and the contractual residual value of the vehicle, plus lease fees that we recognize on a straight-line basis over the term of the lease agreement. Depreciation and the gain or loss upon disposition of the vehicle is recorded in Financial Services interest, operating, and other expenses .
Financing Income. Ford Credit originates and purchases finance installment contracts. Financing income represents interest earned on the finance receivables (including direct financing leases). Interest is recognized using the interest method, and includes the amortization of certain direct origination costs.
Insurance Income. Income from insurance contracts is recognized evenly over the term of the agreement. Insurance commission revenue is recognized on a net basis at the time of sale of the third party's product or service to our customer.
NOTE 4. OTHER INCOME/(LOSS)
Non-Financial Services
The amounts included in Non-Financial Services other income/(loss), net for the periods ended June 30 were as follows (in millions):
| Second Quarter |
| First Half | ||||||||||||
| 2016 |
| 2017 |
| 2016 |
| 2017 | ||||||||
Net periodic pension and OPEB income/(cost), excluding service cost | $ | 297 | |
| $ | 389 | |
| $ | 661 | |
| $ | 779 | |
Investment-related interest income | 52 | |
| 85 | |
| 113 | |
| 156 | | ||||
Interest income/(expense) on income taxes | 1 | |
| (1 | ) |
| (1 | ) |
| 2 | | ||||
Realized and unrealized gains/(losses) on cash equivalents and marketable securities | (7 | ) |
| (24 | ) |
| 65 | |
| 25 | | ||||
Gains/(Losses) on changes in investments in affiliates | 147 | |
| (1 | ) |
| 181 | |
| (2 | ) | ||||
Royalty income | 137 | |
| 150 | |
| 320 | |
| 304 | | ||||
Other | 59 | |
| 60 | |
| 115 | |
| 106 | | ||||
Total | $ | 686 | |
| $ | 658 | |
| $ | 1,454 | |
| $ | 1,370 | |
Financial Services
The amounts included in Financial Services other income/(loss), net for the periods ended June 30 were as follows (in millions):
| Second Quarter |
| First Half | ||||||||||||
| 2016 |
| 2017 |
| 2016 |
| 2017 | ||||||||
Investment-related interest income | $ | 20 | |
| $ | 24 | |
| $ | 39 | |
| $ | 45 | |
Interest income/(expense) on income taxes | 15 | |
| 1 | |
| 13 | |
| (1 | ) | ||||
Insurance premiums earned | 41 | |
| - | |
| 80 | |
| - | | ||||
Other | 6 | |
| 49 | |
| 41 | |
| 52 | | ||||
Total | $ | 82 | |
| $ | 74 | |
| $ | 173 | |
| $ | 96 | |
12
Item 1. Financial Statements (Continued)
FORD MOTOR COMPANY AND SUBSIDIARIES
NOTES TO THE FINANCIAL STATEMENTS
NOTE 5. INCOME TAXES
For interim tax reporting, we estimate one single effective tax rate for tax jurisdictions not subject to a valuation allowance, which is applied to the year-to-date ordinary income/(loss). Tax effects of significant unusual or infrequently occurring items are excluded from the estimated annual effective tax rate calculation and recognized in the interim period in which they occur.
For the second quarter of 2016 and 2017 , our effective tax rates were 31.4% and 9.3% , respectively. During the second quarter of 2017 , we recognized a $421 million benefit for foreign tax credits expected to be realized in the foreseeable future. The tax benefit relates to investments in certain non-U.S. subsidiaries previously determined to be indefinitely reinvested in operations outside the United States. Our change in assertion for these investments is related to planned distributions in anticipation of potential U.S. corporate tax reform.
NOTE 6. CAPITAL STOCK AND EARNINGS PER SHARE
Earnings Per Share Attributable to Ford Motor Company Common and Class B Stock
Basic and diluted income per share were calculated using the following (in millions):
| Second Quarter |
| First Half | ||||||||||||
| 2016 |
| 2017 |
| 2016 |
| 2017 | ||||||||
Basic and Diluted Income Attributable to Ford Motor Company |
|
|
|
|
|
|
| ||||||||
Basic income | $ | 1,970 | |
| $ | 2,042 | |
| $ | 4,422 | |
| $ | 3,629 | |
Diluted income | 1,970 | |
| 2,042 | |
| 4,422 | |
| 3,629 | | ||||
|
|
|
|
|
|
|
| ||||||||
Basic and Diluted Shares |
| |
|
| |
|
|
|
| ||||||
Basic shares (average shares outstanding) | 3,973 | |
| 3,977 | |
| 3,972 | |
| 3,977 | | ||||
Net dilutive options and unvested restricted stock units | 24 | |
| 19 | |
| 24 | |
| 21 | | ||||
Diluted shares | 3,997 | |
| 3,996 | |
| 3,996 | |
| 3,998 | | ||||
13
Item 1. Financial Statements (Continued)
FORD MOTOR COMPANY AND SUBSIDIARIES
NOTES TO THE FINANCIAL STATEMENTS
NOTE 7. CASH, CASH EQUIVALENTS, AND MARKETABLE SECURITIES
The fair values of cash, cash equivalents, and marketable securities measured at fair value on a recurring basis on our balance sheet were as follows (in millions):
|
|
| December 31, 2016 | ||||||||||||||
| Fair Value Level |
| Automotive |
| Financial Services |
| All Other |
| Consolidated | ||||||||
Cash and cash equivalents |
|
|
|
|
|
|
|
|
| ||||||||
U.S. government | 1 |
| $ | 888 | |
| $ | 924 | |
| $ | - | |
| $ | 1,812 | |
U.S. government agencies | 2 |
| - | |
| - | |
| - | |
| - | | ||||
Non-U.S. government and agencies | 2 |
| 200 | |
| 142 | |
| - | |
| 342 | | ||||
Corporate debt | 2 |
| 100 | |
| - | |
| - | |
| 100 | | ||||
Total marketable securities classified as cash equivalents |
|
| 1,188 | |
| 1,066 | |
| - | |
| 2,254 | | ||||
Cash, time deposits, and money market funds |
|
| 6,632 | |
| 7,011 | |
| 8 | |
| 13,651 | | ||||
Total cash and cash equivalents |
|
| $ | 7,820 | |
| $ | 8,077 | |
| $ | 8 | |
| $ | 15,905 | |
|
|
|
|
|
|
|
|
|
| ||||||||
Marketable securities |
|
|
|
|
|
|
|
|
| ||||||||
U.S. government | 1 |
| $ | 8,099 | |
| $ | 1,634 | |
| $ | - | |
| $ | 9,733 | |
U.S. government agencies | 2 |
| 2,244 | |
| 505 | |
| - | |
| 2,749 | | ||||
Non-U.S. government and agencies | 2 |
| 4,751 | |
| 632 | |
| - | |
| 5,383 | | ||||
Corporate debt | 2 |
| 4,329 | |
| 475 | |
| - | |
| 4,804 | | ||||
Equities | 1 |
| 165 | |
| - | |
| - | |
| 165 | | ||||
Other marketable securities | 2 |
| 54 | |
| 34 | |
| - | |
| 88 | | ||||
Total marketable securities |
|
| $ | 19,642 | |
| $ | 3,280 | |
| $ | - | |
| $ | 22,922 | |
|
|
|
|
|
|
|
|
|
| ||||||||
|
|
| June 30, 2017 | ||||||||||||||
| Fair Value Level |
| Automotive |
| Financial Services |
| All Other |
| Consolidated | ||||||||
Cash and cash equivalents |
|
|
|
|
|
|
|
|
| ||||||||
U.S. government | 1 |
| $ | 300 | |
| $ | 182 | |
| $ | - | |
| $ | 482 | |
U.S. government agencies | 2 |
| 624 | |
| 100 | |
| - | |
| 724 | | ||||
Non-U.S. government and agencies | 2 |
| 270 | |
| 342 | |
| - | |
| 612 | | ||||
Corporate debt | 2 |
| - | |
| 75 | |
| - | |
| 75 | | ||||
Total marketable securities classified as cash equivalents |
|
| 1,194 | |
| 699 | |
| - | |
| 1,893 | | ||||
Cash, time deposits, and money market funds |
|
| 7,659 | |
| 6,667 | |
| 4 | |
| 14,330 | | ||||
Total cash and cash equivalents |
|
| $ | 8,853 | |
| $ | 7,366 | |
| $ | 4 | |
| $ | 16,223 | |
|
|
|
|
|
|
|
|
|
| ||||||||
Marketable securities |
|
|
|
|
|
|
|
|
| ||||||||
U.S. government | 1 |
| $ | 5,365 | |
| $ | 977 | |
| $ | - | |
| $ | 6,342 | |
U.S. government agencies | 2 |
| 3,677 | |
| 663 | |
| - | |
| 4,340 | | ||||
Non-U.S. government and agencies | 2 |
| 6,036 | |
| 790 | |
| - | |
| 6,826 | | ||||
Corporate debt | 2 |
| 4,284 | |
| 854 | |
| - | |
| 5,138 | | ||||
Equities | 1 |
| 177 | |
| | |
| - | |
| 177 | | ||||
Other marketable securities | 2 |
| 36 | |
| 27 | |
| - | |
| 63 | | ||||
Total marketable securities |
|
| $ | 19,575 | |
| $ | 3,311 | |
| $ | - | |
| $ | 22,886 | |
14
Item 1. Financial Statements (Continued)
FORD MOTOR COMPANY AND SUBSIDIARIES
NOTES TO THE FINANCIAL STATEMENTS
NOTE 7. CASH, CASH EQUIVALENTS, AND MARKETABLE SECURITIES (Continued)
The cash equivalents and marketable securities accounted for as available-for-sale ("AFS") securities on our balance sheet were as follows (in millions):
| December 31, 2016 | ||||||||||||||||||||||||||
|
|
|
|
|
|
|
|
| Fair Value of Securities with Contractual Maturities | ||||||||||||||||||
| Amortized Cost |
| Gross Unrealized Gains |
| Gross Unrealized Losses |
| Fair Value |
| Within 1 Year |
| After 1 Year through 5 Years |
| After 5 Years through 10 Years | ||||||||||||||
Automotive |
|
|
|
|
|
|
|
|
|
|
|
|
| ||||||||||||||
U.S. government | $ | 3,703 | |
| $ | 2 | |
| $ | (14 | ) |
| $ | 3,691 | |
| $ | 727 | |
| $ | 2,776 | |
| $ | 188 | |
U.S. government agencies | 308 | |
| - | |
| (2 | ) |
| 306 | |
| - | |
| 306 | |
| - | | |||||||
Non-U.S. government and agencies | 1,443 | |
| 1 | |
| (11 | ) |
| 1,433 | |
| 148 | |
| 1,285 | |
| - | | |||||||
Corporate debt | 1,079 | |
| - | |
| - | |
| 1,079 | |
| 1,031 | |
| 48 | |
| - | | |||||||
Total | $ | 6,533 | |
| $ | 3 | |
| $ | (27 | ) |
| $ | 6,509 | |
| $ | 1,906 | |
| $ | 4,415 | |
| $ | 188 | |
|
|
|
|
|
|
|
| |
|
|
|
|
|
| |||||||||||||
| June 30, 2017 | ||||||||||||||||||||||||||
|
|
|
|
|
|
|
|
| Fair Value of Securities with Contractual Maturities | ||||||||||||||||||
| Amortized Cost |
| Gross Unrealized Gains |
| Gross Unrealized Losses |
| Fair Value |
| Within 1 Year |
| After 1 Year through 5 Years |
| After 5 Years through 10 Years | ||||||||||||||
Automotive |
|
|
|
|
|
|
|
|
|
|
|
|
| ||||||||||||||
U.S. government | $ | 2,587 | |
| $ | - | |
| $ | (7 | ) |
| $ | 2,580 | |
| $ | 524 | |
| $ | 2,056 | |
| $ | - | |
U.S. government agencies | 1,982 | |
| 1 | |
| (4 | ) |
| 1,979 | |
| 677 | |
| 1,237 | |
| 65 | | |||||||
Non-U.S. government and agencies | 2,961 | |
| 5 | |
| (5 | ) |
| 2,961 | |
| 248 | |
| 2,688 | |
| 25 | | |||||||
Corporate debt | 1,398 | |
| - | |
| (2 | ) |
| 1,396 | |
| 756 | |
| 633 | |
| 7 | | |||||||
Total | $ | 8,928 | |
| $ | 6 | |
| $ | (18 | ) |
| $ | 8,916 | |
| $ | 2,205 | |
| $ | 6,614 | |
| $ | 97 | |
Sales proceeds from investments classified as AFS and sold prior to maturity were $0 and $1.3 billion in the second quarter of 2016 and 2017 , respectively, and $69 million and $2.6 billion in the first half of 2016 and 2017 , respectively. The gross realized gains from the sale of AFS securities were $0 and $2 million in the second quarter of 2016 and 2017 , respectively, and $1 million and $3 million in the first half of 2016 and 2017 , respectively. Gross realized losses from the sale of AFS securities were $0 and $6 million in the second quarter of 2016 and 2017 , respectively, and $0 and $8 million in the first half of 2016 and 2017 , respectively.
15
Item 1. Financial Statements (Continued)
FORD MOTOR COMPANY AND SUBSIDIARIES
NOTES TO THE FINANCIAL STATEMENTS
NOTE 7. CASH, CASH EQUIVALENTS, AND MARKETABLE SECURITIES (Continued)
The present fair values and gross unrealized losses for cash equivalents and marketable securities accounted for as AFS securities that were in an unrealized loss position, aggregated by investment category and the length of time that individual securities have been in a continuous loss position, were as follows (in millions):
| December 31, 2016 | ||||||||||||||||||||||
| Less than 1 year |
| 1 Year or Greater |
| Total | ||||||||||||||||||
| Fair Value |
| Unrealized Losses |
| Fair Value |
| Unrealized Losses |
| Fair Value |
| Unrealized Losses | ||||||||||||
|
|
|
|
|
|
|
|
|
|
|
| ||||||||||||
Automotive |
|
|
|
|
|
|
|
|
|
|
| ||||||||||||
U.S. government | $ | 1,474 | |
| $ | (14 | ) |
| $ | - | |
| $ | - | |
| $ | 1,474 | |
| $ | (14 | ) |
U.S. government agencies | 261 | |
| (2 | ) |
| - | |
| - | |
| 261 | |
| (2 | ) | ||||||
Non-U.S. government and agencies | 1,137 | |
| (11 | ) |
| - | |
| - | |
| 1,137 | |
| (11 | ) | ||||||
Corporate debt | - | |
| - | |
| - | |
| - | |
| - | |
| - | | ||||||
Total | $ | 2,872 | |
| $ | (27 | ) |
| $ | - | |
| $ | - | |
| $ | 2,872 | |
| $ | (27 | ) |
|
| |
|
|
|
|
|
|
|
|
|
| |||||||||||
| June 30, 2017 | ||||||||||||||||||||||
| Less than 1 year |
| 1 Year or Greater |
| Total | ||||||||||||||||||
| Fair Value |
| Unrealized Losses |
| Fair Value |
| Unrealized Losses |
| Fair Value |
| Unrealized Losses | ||||||||||||
Automotive |
|
|
|
|
|
|
|
|
|
|
| ||||||||||||
U.S. government | $ | 2,580 | |
| $ | (7 | ) |
| $ | - | |
| $ | - | |
| $ | 2,580 | |
| $ | (7 | ) |
U.S. government agencies | 1,172 | |
| (4 | ) |
| - | |
| - | |
| 1,172 | |
| (4 | ) | ||||||
Non-U.S. government and agencies | 1,555 | |
| (5 | ) |
| - | |
| - | |
| 1,555 | |
| (5 | ) | ||||||
Corporate debt | 517 | |
| (2 | ) |
| - | |
| - | |
| 517 | |
| (2 | ) | ||||||
Total | $ | 5,824 | |
| $ | (18 | ) |
| $ | - | |
| $ | - | |
| $ | 5,824 | |
| $ | (18 | ) |
We determine other-than-temporary impairments on cash equivalents and marketable securities using a specific identification method. During the six months ended June 30, 2016 and 2017 , we did not recognize any other-than-temporary impairment loss.
Other Securities
Investments in entities that we do not control and over which we do not have the ability to exercise significant influence are recorded at cost and reported in Other assets in the non-current assets section of our consolidated balance sheet. These cost method investments were $219 million and $221 million at December 31, 2016 and June 30, 2017 , respectively.
16
Item 1. Financial Statements (Continued)
FORD MOTOR COMPANY AND SUBSIDIARIES
NOTES TO THE FINANCIAL STATEMENTS
NOTE 8. FINANCIAL SERVICES FINANCE RECEIVABLES
Our Financial Services segment, primarily Ford Credit, manages finance receivables as "consumer" and "non-consumer" portfolios. The receivables are generally secured by the vehicles, inventory, or other property being financed.
Finance receivables, net were as follows (in millions):
| December 31, |
| June 30, | ||||
Consumer |
|
|
| ||||
Retail financing, gross | $ | 68,121 | |
| $ | 71,079 | |
Unearned interest supplements | (2,783 | ) |
| (2,926 | ) | ||
Consumer finance receivables | 65,338 | |
| 68,153 | | ||
Non-Consumer |
| |
|
| | ||
Dealer financing | 31,336 | |
| 33,808 | | ||
Non-Consumer finance receivables | 31,336 | |
| 33,808 | | ||
Total recorded investment | $ | 96,674 | |
| $ | 101,961 | |
|
|
|
| ||||
Recorded investment in finance receivables | $ | 96,674 | |
| $ | 101,961 | |
Allowance for credit losses | (484 | ) |
| (522 | ) | ||
Finance receivables, net | $ | 96,190 | |
| $ | 101,439 | |
|
|
|
| ||||
Current portion | $ | 46,266 | |
| $ | 49,888 | |
Non-current portion | 49,924 | |
| 51,551 | | ||
Finance receivables, net | $ | 96,190 | |
| $ | 101,439 | |
|
|
|
| ||||
Net finance receivables subject to fair value (a) | $ | 94,066 | |
| $ | 98,916 | |
Fair value | 94,785 | |
| 98,872 | | ||
__________
(a) | At December 31, 2016 and June 30, 2017 , Finance receivables, net includes $2.1 billion and $2.5 billion , respectively, of direct financing leases that are not subject to fair value disclosure requirements. The fair value of finance receivables is categorized within Level 3 of the fair value hierarchy. |
Excluded from finance receivables at both December 31, 2016 and June 30, 2017 , was $223 million of accrued uncollected interest, which is reported as Other assets in the current assets section of our consolidated balance sheet.
Included in the recorded investment in finance receivables at December 31, 2016 and June 30, 2017 were consumer receivables of $32.5 billion and $33.1 billion , respectively, and non-consumer receivables of $26 billion and $26.1 billion , respectively, that have been sold for legal purposes in securitization transactions but continue to be reported in our consolidated financial statements. The receivables are available only for payment of the debt issued by, and other obligations of, the securitization entities that are parties to those securitization transactions; they are not available to pay the other obligations or the claims of Ford Credit's other creditors. Ford Credit holds the right to receive the excess cash flows not needed to pay the debt issued by, and other obligations of, the securitization entities that are parties to those securitization transactions.
17
Item 1. Financial Statements (Continued)
FORD MOTOR COMPANY AND SUBSIDIARIES
NOTES TO THE FINANCIAL STATEMENTS
NOTE 8. FINANCIAL SERVICES FINANCE RECEIVABLES (Continued)
Aging
For all finance receivables, we define "past due" as any payment, including principal and interest, that is at least 31 days past the contractual due date. The recorded investment of consumer receivables greater than 90 days past due and still accruing interest was $21 million and $23 million at December 31, 2016 and June 30, 2017 , respectively. The recorded investment of non-consumer receivables greater than 90 days past due and still accruing interest was de minimis at December 31, 2016 and $1 million at June 30, 2017 .
The aging analysis of our finance receivables balances were as follows (in millions):
| December 31, |
| June 30, | ||||
Consumer |
|
|
| ||||
31-60 days past due | $ | 760 | |
| $ | 643 | |
61-90 days past due | 114 | |
| 106 | | ||
91-120 days past due | 34 | |
| 36 | | ||
Greater than 120 days past due | 39 | |
| 36 | | ||
Total past due | 947 | |
| 821 | | ||
Current | 64,391 | |
| 67,332 | | ||
Consumer finance receivables | 65,338 | |
| 68,153 | | ||
|
|
|
| ||||
Non-Consumer |
|
|
| ||||
Total past due | 107 | |
| 133 | | ||
Current | 31,229 | |
| 33,675 | | ||
Non-Consumer finance receivables | 31,336 | |
| 33,808 | | ||
Total recorded investment | $ | 96,674 | |
| $ | 101,961 | |
Credit Quality
Consumer Portfolio. Credit quality ratings for consumer receivables are based on aging. Refer to the aging table above.
Consumer receivables credit quality ratings are as follows:
• | Pass – current to 60 days past due |
• | Special Mention – 61 to 120 days past due and in intensified collection status |
• | Substandard – greater than 120 days past due and for which the uncollectible portion of the receivables has already been charged off, as measured using the fair value of collateral less costs to sell |
Non-Consumer Portfolio. Dealers are assigned to one of four groups according to risk ratings as follows:
• | Group I – strong to superior financial metrics |
• | Group II – fair to favorable financial metrics |
• | Group III – marginal to weak financial metrics |
• | Group IV – poor financial metrics, including dealers classified as uncollectible |
18
Item 1. Financial Statements (Continued)
FORD MOTOR COMPANY AND SUBSIDIARIES
NOTES TO THE FINANCIAL STATEMENTS
NOTE 8. FINANCIAL SERVICES FINANCE RECEIVABLES (Continued)
The credit quality analysis of our dealer financing receivables was as follows (in millions):
| December 31, |
| June 30, | ||||
Dealer Financing |
|
|
| ||||
Group I | $ | 24,315 | |
| $ | 26,688 | |
Group II | 5,552 | |
| 5,589 | | ||
Group III | 1,376 | |
| 1,364 | | ||
Group IV | 93 | |
| 167 | | ||
Total recorded investment | $ | 31,336 | |
| $ | 33,808 | |
Impaired Receivables. Impaired consumer receivables include accounts that have been rewritten or modified in reorganization proceedings pursuant to the U.S. Bankruptcy Code that are considered to be Troubled Debt Restructurings ("TDRs"), as well as all accounts greater than 120 days past due. Impaired non-consumer receivables represent accounts with dealers that have weak or poor financial metrics or dealer financing that has been modified in TDRs. The recorded investment of consumer receivables that were impaired at December 31, 2016 and June 30, 2017 was $367 million , or 0.6% of consumer receivables, and $381 million , or 0.6% of consumer receivables, respectively. The recorded investment of non-consumer receivables that were impaired at December 31, 2016 and June 30, 2017 was $107 million , or 0.3% of non-consumer receivables, and $181 million , or 0.5% of non-consumer receivables, respectively. Impaired finance receivables are evaluated both collectively and specifically.
19
Item 1. Financial Statements (Continued)
FORD MOTOR COMPANY AND SUBSIDIARIES
NOTES TO THE FINANCIAL STATEMENTS
NOTE 9. FINANCIAL SERVICES ALLOWANCE FOR CREDIT LOSSES
An analysis of the allowance for credit losses related to finance receivables for the periods ended June 30 was as follows (in millions):
| Second Quarter 2016 |
| First Half 2016 | ||||||||||||||||||||
| Consumer |
| Non-Consumer |
| Total |
| Consumer |
| Non-Consumer |
| Total | ||||||||||||
Allowance for credit losses |
|
|
|
|
|
|
|
|
|
|
| ||||||||||||
Beginning balance | $ | 390 | |
| $ | 20 | |
| $ | 410 | |
| $ | 357 | |
| $ | 16 | |
| $ | 373 | |
Charge-offs | (94 | ) |
| (3 | ) |
| (97 | ) |
| (196 | ) |
| (2 | ) |
| (198 | ) | ||||||
Recoveries | 31 | |
| 2 | |
| 33 | |
| 60 | |
| 3 | |
| 63 | | ||||||
Provision for credit losses | 109 | |
| (1 | ) |
| 108 | |
| 211 | |
| - | |
| 211 | | ||||||
Other (a) | (4 | ) |
| (1 | ) |
| (5 | ) |
| - | |
| - | |
| - | | ||||||
Ending balance (b) | $ | 432 | |
| $ | 17 | |
| $ | 449 | |
| $ | 432 | |
| $ | 17 | |
| $ | 449 | |
|
|
|
|
|
|
|
|
|
|
|
| ||||||||||||
Analysis of ending balance of allowance for credit losses | |||||||||||||||||||||||
Collective impairment allowance |
|
|
|
|
|
| $ | 414 | |
| $ | 13 | |
| $ | 427 | | ||||||
Specific impairment allowance |
|
|
|
|
|
| 18 | |
| 4 | |
| 22 | | |||||||||
Ending balance (b) |
|
|
|
|
|
| 432 | |
| 17 | |
| 449 | | |||||||||
|
|
|
|
|
|
|
|
|
|
|
| ||||||||||||
Analysis of ending balance of finance receivables |
|
|
|
|
|
| |||||||||||||||||
Collectively evaluated for impairment |
|
|
|
|
|
| 61,819 | |
| 33,425 | |
| 95,244 | | |||||||||
Specifically evaluated for impairment |
|
|
|
|
|
| 366 | |
| 126 | |
| 492 | | |||||||||
Recorded investment |
|
|
|
|
|
| 62,185 | |
| 33,551 | |
| 95,736 | | |||||||||
|
|
|
|
|
|
|
|
|
|
|
| ||||||||||||
Ending balance, net of allowance for credit losses |
|
|
| $ | 61,753 | |
| $ | 33,534 | |
| $ | 95,287 | | |||||||||
__________
(a) | Primarily represents amounts related to translation adjustments. |
(b) | Total allowance, including reserves for operating leases, was $512 million . |
| Second Quarter 2017 |
| First Half 2017 | ||||||||||||||||||||
| Consumer |
| Non-Consumer |
| Total |
| Consumer |
| Non-Consumer |
| Total | ||||||||||||
Allowance for credit losses |
|
|
|
|
|
|
|
|
|
|
| ||||||||||||
Beginning balance | $ | 504 | |
| $ | 13 | |
| $ | 517 | |
| $ | 469 | |
| $ | 15 | |
| $ | 484 | |
Charge-offs | (110 | ) |
| (2 | ) |
| (112 | ) |
| (233 | ) |
| (4 | ) |
| (237 | ) | ||||||
Recoveries | 35 | |
| 3 | |
| 38 | |
| 69 | |
| 3 | |
| 72 | | ||||||
Provision for credit losses | 73 | |
| - | |
| 73 | |
| 194 | |
| - | |
| 194 | | ||||||
Other (a) | 5 | |
| 1 | |
| 6 | |
| 8 | |
| 1 | |
| 9 | | ||||||
Ending balance (b) | $ | 507 | |
| $ | 15 | |
| $ | 522 | |
| $ | 507 | |
| $ | 15 | |
| $ | 522 | |
|
|
|
|
|
|
|
|
|
|
|
| ||||||||||||
Analysis of ending balance of allowance for credit losses | |||||||||||||||||||||||
Collective impairment allowance |
|
|
|
|
|
| $ | 487 | |
| $ | 13 | |
| $ | 500 | | ||||||
Specific impairment allowance |
|
|
|
|
|
| 20 | |
| 2 | |
| 22 | | |||||||||
Ending balance (b) |
|
|
|
|
|
| 507 | |
| 15 | |
| 522 | | |||||||||
|
|
|
|
|
|
|
|
|
|
|
| ||||||||||||
Analysis of ending balance of finance receivables |
|
|
|
|
|
| |||||||||||||||||
Collectively evaluated for impairment |
|
|
|
|
|
| 67,772 | |
| 33,627 | |
| 101,399 | | |||||||||
Specifically evaluated for impairment |
|
|
|
|
|
| 381 | |
| 181 | |
| 562 | | |||||||||
Recorded investment |
|
|
|
|
|
| 68,153 | |
| 33,808 | |
| 101,961 | | |||||||||
|
|
|
|
|
|
|
|
|
|
|
| ||||||||||||
Ending balance, net of allowance for credit losses |
| $ | 67,646 | |
| $ | 33,793 | |
| $ | 101,439 | | |||||||||||
__________
(a) | Primarily represents amounts related to translation adjustments. |
(b) | Total allowance, including reserves for operating leases, was $588 million . |
20
Item 1. Financial Statements (Continued)
FORD MOTOR COMPANY AND SUBSIDIARIES
NOTES TO THE FINANCIAL STATEMENTS
NOTE 10. INVENTORIES
All inventories are stated at the lower of cost and net realizable value. Cost for a substantial portion of U.S. inventories is determined on a last-in, first-out ("LIFO") basis. LIFO was used for 30% and 34% of total inventories at December 31, 2016 and June 30, 2017 , respectively. Cost of other inventories is determined by costing methods that approximate a first-in, first-out ("FIFO") basis.
Inventories were as follows (in millions):
| December 31, |
| June 30, | ||||
Raw materials, work-in-process, and supplies | $ | 3,843 | |
| $ | 4,090 | |
Finished products | 5,943 | |
| 7,904 | | ||
Total inventories under FIFO | 9,786 | |
| 11,994 | | ||
LIFO adjustment | (888 | ) |
| (902 | ) | ||
Total inventories | $ | 8,898 | |
| $ | 11,092 | |
NOTE 11. OTHER LIABILITIES AND DEFERRED REVENUE
| December 31, |
| June 30, | ||||
Current |
|
|
| ||||
Dealer and dealers' customer allowances and claims | $ | 9,542 | |
| $ | 11,034 | |
Deferred revenue | 3,866 | |
| 2,443 | | ||
Employee benefit plans | 1,469 | |
| 1,436 | | ||
Accrued interest | 974 | |
| 1,034 | | ||
OPEB (a) | 349 | |
| 351 | | ||
Pension (a) | 247 | |
| 252 | | ||
Other | 2,869 | |
| 3,408 | | ||
Total current other liabilities and deferred revenue | $ | 19,316 | |
| $ | 19,958 | |
Non-current |
| |
|
| | ||
Pension (a) | $ | 10,150 | |
| $ | 10,218 | |
OPEB (a) | 5,516 | |
| 5,526 | | ||
Dealer and dealers' customer allowances and claims | 2,564 | |
| 2,806 | | ||
Deferred revenue | 3,687 | |
| 3,832 | | ||
Employee benefit plans | 1,063 | |
| 1,105 | | ||
Other | 1,415 | |
| 1,353 | | ||
Total non-current other liabilities and deferred revenue | $ | 24,395 | |
| $ | 24,840 | |
__________
(a) | Balances at June 30, 2017 reflect pension and OPEB liabilities at December 31, 2016 , updated (where applicable) for service and interest cost, expected return on assets, separation expense, actual benefit payments, and cash contributions. The discount rate and rate of expected return assumptions are unchanged from year-end 2016 . Included in Other assets are pension assets of $1.5 billion and $2.1 billion at December 31, 2016 and June 30, 2017 , respectively. |
21
Item 1. Financial Statements (Continued)
FORD MOTOR COMPANY AND SUBSIDIARIES
NOTES TO THE FINANCIAL STATEMENTS
NOTE 12. RETIREMENT BENEFITS
Defined Benefit Plans - Expense
| Second Quarter | ||||||||||||||||||||||
| Pension Benefits |
|
|
|
| ||||||||||||||||||
| U.S. Plans |
| Non-U.S. Plans |
| Worldwide OPEB | ||||||||||||||||||
| 2016 |
| 2017 |
| 2016 |
| 2017 |
| 2016 |
| 2017 | ||||||||||||
Service cost | $ | 127 | |
| $ | 134 | |
| $ | 124 | |
| $ | 125 | |
| $ | 12 | |
| $ | 12 | |
Interest cost | 381 | |
| 381 | |
| 202 | |
| 173 | |
| 49 | |
| 49 | | ||||||
Expected return on assets | (674 | ) |
| (684 | ) |
| (350 | ) |
| (335 | ) |
| - | |
| - | | ||||||
Amortization of prior service costs/(credits) | 43 | |
| 35 | |
| 9 | |
| 9 | |
| (36 | ) |
| (29 | ) | ||||||
Net remeasurement (gain)/loss | - | |
| - | |
| 11 | |
| - | |
| - | |
| - | | ||||||
Separation programs/other | 3 | |
| 9 | |
| 65 | |
| 3 | |
| - | |
| - | | ||||||
Net periodic benefit cost/(income) | $ | (120 | ) |
| $ | (125 | ) |
| $ | 61 | |
| $ | (25 | ) |
| $ | 25 | |
| $ | 32 | |
|
|
|
|
|
|
|
|
|
|
|
| ||||||||||||
| First Half | ||||||||||||||||||||||
| Pension Benefits |
|
|
|
| ||||||||||||||||||
| U.S. Plans |
| Non-U.S. Plans |
| Worldwide OPEB | ||||||||||||||||||
| 2016 |
| 2017 |
| 2016 |
| 2017 |
| 2016 |
| 2017 | ||||||||||||
Service cost | $ | 255 | |
| $ | 267 | |
| $ | 242 | |
| $ | 259 | |
| $ | 24 | |
| $ | 24 | |
Interest cost | 762 | |
| 762 | |
| 397 | |
| 332 | |
| 97 | |
| 98 | | ||||||
Expected return on assets | (1,347 | ) |
| (1,367 | ) |
| (689 | ) |
| (665 | ) |
| - | |
| - | | ||||||
Amortization of prior service costs/(credits) | 85 | |
| 71 | |
| 19 | |
| 18 | |
| (71 | ) |
| (59 | ) | ||||||
Net remeasurement (gain)/loss | - | |
| - | |
| 11 | |
| - | |
| - | |
| - | | ||||||
Separation programs/other | 3 | |
| 12 | |
| 72 | |
| 19 | |
| - | |
| - | | ||||||
Net periodic benefit cost/(income) | $ | (242 | ) |
| $ | (255 | ) |
| $ | 52 | |
| $ | (37 | ) |
| $ | 50 | |
| $ | 63 | |
The service cost component is included in Cost of sales and Selling, administrative and other expenses . Other components of net periodic benefit cost/(income) are included in Non-Financial Services other income/(loss), net of our consolidated income statement.
Pension Plan Contributions
During 2017 , we expect contributions to be about $1 billion (most of which are mandatory) from cash and cash equivalents to our worldwide funded pension plans, and to make about $300 million of benefit payments to participants in unfunded plans, for a total of about $1.3 billion . In the first half of 2017 , we contributed about $500 million to our worldwide funded pension plans and made about $150 million of benefit payments to participants in unfunded plans.
22
Item 1. Financial Statements (Continued)
FORD MOTOR COMPANY AND SUBSIDIARIES
NOTES TO THE FINANCIAL STATEMENTS
NOTE 13. DEBT
The carrying value of Automotive and Financial Services debt was as follows (in millions):
Automotive Segment | December 31, |
| June 30, | ||||
Debt payable within one year |
|
|
| ||||
Short-term | $ | 1,324 | |
| $ | 1,516 | |
Long-term payable within one year |
| |
|
| | ||
U.S. Department of Energy Advanced Technology Vehicles Manufacturing Incentive Program | 591 | |
| 591 | | ||
Other debt | 827 | |
| 853 | | ||
Unamortized (discount)/premium | (57 | ) |
| (49 | ) | ||
Total debt payable within one year | 2,685 | |
| 2,911 | | ||
Long-term debt payable after one year |
| |
|
| | ||
Public unsecured debt securities | 9,394 | |
| 9,394 | | ||
DOE ATVM Incentive Program | 2,651 | |
| 2,356 | | ||
Other debt | 1,573 | |
| 1,904 | | ||
Adjustments |
|
|
| ||||
Unamortized (discount)/premium | (320 | ) |
| (299 | ) | ||
Unamortized issuance costs | (76 | ) |
| (78 | ) | ||
Total long-term debt payable after one year | 13,222 | |
| 13,277 | | ||
Total Automotive Segment | $ | 15,907 | |
| $ | 16,188 | |
|
|
|
| ||||
Fair value of Automotive Segment debt (a) | $ | 17,433 | |
| $ | 17,873 | |
|
|
|
| ||||
Financial Services Segment |
| |
|
| | ||
Debt payable within one year |
| |
|
| | ||
Short-term | $ | 15,330 | |
| $ | 15,429 | |
Long-term payable within one year |
| |
|
| | ||
Unsecured debt | 12,369 | |
| 14,409 | | ||
Asset-backed debt | 19,286 | |
| 18,018 | | ||
Adjustments |
|
|
| ||||
Unamortized (discount)/premium | (2 | ) |
| (1 | ) | ||
Unamortized issuance costs | (16 | ) |
| (18 | ) | ||
Fair value adjustments (b) | 17 | |
| 25 | | ||
Total debt payable within one year | 46,984 | |
| 47,862 | | ||
Long-term debt payable after one year |
|
|
| ||||
Unsecured debt | 49,912 | |
| 52,579 | | ||
Asset-backed debt | 30,112 | |
| 29,409 | | ||
Adjustments |
|
|
| ||||
Unamortized (discount)/premium | (9 | ) |
| (8 | ) | ||
Unamortized issuance costs | (197 | ) |
| (205 | ) | ||
Fair value adjustments (b) | 261 | |
| 184 | | ||
Total long-term debt payable after one year | 80,079 | |
| 81,959 | | ||
Total Financial Services Segment | $ | 127,063 | |
| $ | 129,821 | |
|
|
|
| ||||
Fair value of Financial Services Segment debt (a) | $ | 128,777 | |
| $ | 131,913 | |
__________
(a) | The fair value of debt includes $1.1 billion and $1.2 billion of Automotive segment short-term debt and $14.3 billion and $14.7 billion of Financial Services segment short-term debt at December 31, 2016 and June 30, 2017 , respectively, carried at cost, which approximates fair value. All other debt is categorized within Level 2 of the fair value hierarchy. |
(b) | Adjustments related to designated fair value hedges of unsecured debt. |
23
Item 1. Financial Statements (Continued)
FORD MOTOR COMPANY AND SUBSIDIARIES
NOTES TO THE FINANCIAL STATEMENTS
NOTE 14. DERIVATIVE FINANCIAL INSTRUMENTS AND HEDGING ACTIVITIES
In the normal course of business, our operations are exposed to global market risks, including the effect of changes in foreign currency exchange rates, certain commodity prices, and interest rates. To manage these risks, we enter into highly effective derivative contracts. We have elected to apply hedge accounting to certain derivatives. Derivatives that are designated in hedging relationships are evaluated for effectiveness using regression analysis at the time they are designated and throughout the hedge period. Some derivatives do not qualify for hedge accounting; for others, we elect not to apply hedge accounting.
Income Effect of Derivative Financial Instruments
The gains/(losses), by hedge designation, recorded in income for the periods ended June 30 were as follows (in millions):
| Second Quarter |
| First Half | ||||||||||||
| 2016 |
| 2017 |
| 2016 |
| 2017 | ||||||||
Cash flow hedges (a) |
|
|
|
|
|
|
| ||||||||
Reclassified from AOCI to net income | $ | 46 | |
| $ | 124 | |
| $ | 133 | |
| $ | 242 | |
Fair value hedges |
|
|
|
|
|
|
| ||||||||
Interest rate contracts |
|
|
|
|
|
|
| ||||||||
Net interest settlements and accruals excluded from the assessment of hedge effectiveness | 98 | |
| 62 | |
| 197 | |
| 132 | | ||||
Ineffectiveness (b) | 5 | |
| 4 | |
| 22 | |
| - | | ||||
Derivatives not designated as hedging instruments |
|
|
|
|
|
|
| ||||||||
Foreign currency exchange contracts | 171 | |
| (218 | ) |
| 32 | |
| (426 | ) | ||||
Cross-currency interest rate swap contracts | 140 | |
| 16 | |
| 335 | |
| 74 | | ||||
Interest rate contracts | (43 | ) |
| 30 | |
| (91 | ) |
| 37 | | ||||
Commodity contracts | 9 | |
| (10 | ) |
| 4 | |
| 32 | | ||||
Total | $ | 426 | |
| $ | 8 | |
| $ | 632 | |
| $ | 91 | |
__________
(a) | For the second quarter and first half of 2016 , a $184 million gain and a $547 million gain , respectively, were recorded in Other comprehensive income. For the second quarter and first half of 2017 , a $318 million gain and a $206 million gain , respectively, were recorded in Other comprehensive income. |
(b) | For the second quarter and first half of 2016 , hedge ineffectiveness reflects the net change in fair value on derivatives of $273 million gain and $883 million gain , respectively, and a change in value on hedged debt attributable to the change in benchmark interest rates of $268 million loss and $861 million loss , respectively. For the second quarter and first half of 2017 , hedge ineffectiveness reflects the net change in fair value on derivatives of $34 million gain and $55 million loss , respectively, and a change in value on hedged debt attributable to the change in benchmark interest rates of $30 million loss and $55 million gain , respectively. |
24
Item 1. Financial Statements (Continued)
FORD MOTOR COMPANY AND SUBSIDIARIES
NOTES TO THE FINANCIAL STATEMENTS
NOTE 14. DERIVATIVE FINANCIAL INSTRUMENTS AND HEDGING ACTIVITIES (Continued)
Balance Sheet Effect of Derivative Financial Instruments
Derivative assets and liabilities are recorded on the balance sheet at fair value and are presented on a gross basis. The notional amounts of the derivative instruments do not necessarily represent amounts exchanged by the parties and are not a direct measure of our financial exposure. We also enter into master agreements with counterparties that may allow for netting of exposures in the event of default or breach of the counterparty agreement. Collateral represents cash received or paid under reciprocal arrangements that we have entered into with our derivative counterparties which we do not use to offset our derivative assets and liabilities.
The fair value of our derivative instruments and the associated notional amounts, presented gross, were as follows (in millions):
| December 31, 2016 |
| June 30, 2017 | ||||||||||||||||||||
| Notional |
| Fair Value of Assets |
| Fair Value of Liabilities |
| Notional |
| Fair Value of Assets |
| Fair Value of Liabilities | ||||||||||||
Cash flow hedges |
|
|
|
|
|
|
|
|
|
|
| ||||||||||||
Foreign currency exchange contracts | $ | 19,091 | |
| $ | 620 | |
| $ | 257 | |
| $ | 17,926 | |
| $ | 504 | |
| $ | 179 | |
Fair value hedges |
| |
|
| |
|
| |
|
|
|
|
|
| |||||||||
Interest rate contracts | 33,175 | |
| 487 | |
| 80 | |
| 34,958 | |
| 429 | |
| 83 | | ||||||
Derivatives not designated as hedging instruments |
|
|
|
|
|
|
|
|
|
| |||||||||||||
Foreign currency exchange contracts | 17,227 | |
| 379 | |
| 194 | |
| 21,221 | |
| 208 | |
| 346 | | ||||||
Cross-currency interest rate swap contracts | 3,201 | |
| 242 | |
| 8 | |
| 3,918 | |
| 338 | |
| 6 | | ||||||
Interest rate contracts | 61,689 | |
| 156 | |
| 74 | |
| 53,968 | |
| 180 | |
| 55 | | ||||||
Commodity contracts | 531 | |
| 11 | |
| 6 | |
| 550 | |
| 14 | |
| 5 | | ||||||
Total derivative financial instruments, gross (a) (b) | $ | 134,914 | |
| $ | 1,895 | |
| $ | 619 | |
| $ | 132,541 | |
| $ | 1,673 | |
| $ | 674 | |
|
|
|
|
|
|
|
|
|
|
|
| ||||||||||||
Current portion |
|
| $ | 1,108 | |
| $ | 371 | |
|
|
| $ | 870 | |
| $ | 473 | | ||||
Non-current portion |
|
| 787 | |
| 248 | |
|
|
| 803 | |
| 201 | | ||||||||
Total derivative financial instruments, gross |
|
| $ | 1,895 | |
| $ | 619 | |
|
|
| $ | 1,673 | |
| $ | 674 | | ||||
__________
(a) | At December 31, 2016 and June 30, 2017 , we held collateral of $15 million and $10 million , and we posted collateral of $12 million and $16 million , respectively. |
(b) | At December 31, 2016 and June 30, 2017 , the fair value of assets and liabilities available for counterparty netting was $554 million and $477 million , respectively . All derivatives are categorized within Level 2 of the fair value hierarchy. |
25
Item 1. Financial Statements (Continued)
FORD MOTOR COMPANY AND SUBSIDIARIES
NOTES TO THE FINANCIAL STATEMENTS
NOTE 15. ACCUMULATED OTHER COMPREHENSIVE INCOME/(LOSS)
The changes in the balances for each component of accumulated other comprehensive income/(loss) attributable to Ford Motor Company for the periods ended June 30 were as follows (in millions):
| Second Quarter |
| First Half | ||||||||||||
| 2016 |
| 2017 |
| 2016 |
| 2017 | ||||||||
Foreign currency translation |
|
|
|
|
|
|
| ||||||||
Beginning balance | $ | (3,633 | ) |
| $ | (4,350 | ) |
| $ | (3,570 | ) |
| $ | (4,593 | ) |
Gains/(Losses) on foreign currency translation | (58 | ) |
| (39 | ) |
| (88 | ) |
| 150 | | ||||
Less: Tax/(Tax benefit) | - | |
| (123 | ) |
| - | |
| (177 | ) | ||||
Net gains/(losses) on foreign currency translation | (58 | ) |
| 84 | |
| (88 | ) |
| 327 | | ||||
(Gains)/Losses reclassified from AOCI to net income (a) | - | |
| - | |
| (33 | ) |
| - | | ||||
Other comprehensive income/(loss), net of tax | (58 | ) |
| 84 | |
| (121 | ) |
| 327 | | ||||
Ending balance | $ | (3,691 | ) |
| $ | (4,266 | ) |
| $ | (3,691 | ) |
| $ | (4,266 | ) |
|
|
|
|
|
|
|
| ||||||||
Marketable securities |
|
|
|
|
|
|
| ||||||||
Beginning balance | $ | - | |
| $ | (15 | ) |
| $ | (6 | ) |
| $ | (14 | ) |
Gains/(Losses) on available for sale securities | - | |
| 2 | |
| 11 | |
| 3 | | ||||
Less: Tax/(Tax benefit) | - | |
| 2 | |
| - | |
| 5 | | ||||
Net gains/(losses) on available for sale securities | - | |
| - | |
| 11 | |
| (2 | ) | ||||
(Gains)/Losses reclassified from AOCI to net income | - | |
| 4 | |
| (1 | ) |
| 5 | | ||||
Less: Tax/(Tax benefit) | - | |
| - | |
| 4 | |
| - | | ||||
Net (gains)/losses reclassified from AOCI to net income | - | |
| 4 | |
| (5 | ) |
| 5 | | ||||
Other comprehensive income/(loss), net of tax | - | |
| 4 | |
| 6 | |
| 3 | | ||||
Ending balance | $ | - | |
| $ | (11 | ) |
| $ | - | |
| $ | (11 | ) |
|
|
|
|
|
|
|
| ||||||||
Derivative instruments |
|
|
|
|
|
|
| ||||||||
Beginning balance | $ | 310 | |
| $ | 116 | |
| $ | 64 | |
| $ | 283 | |
Gains/(Losses) on derivative instruments | 184 | |
| 318 | |
| 547 | |
| 206 | | ||||
Less: Tax/(Tax benefit) | 35 | |
| 85 | |
| 94 | |
| 51 | | ||||
Net gains/(losses) on derivative instruments | 149 | |
| 233 | |
| 453 | |
| 155 | | ||||
(Gains)/Losses reclassified from AOCI to net income | (46 | ) |
| (124 | ) |
| (133 | ) |
| (242 | ) | ||||
Less: Tax/(Tax benefit) | (8 | ) |
| (28 | ) |
| (37 | ) |
| (57 | ) | ||||
Net (gains)/losses reclassified from AOCI to net income (b) | (38 | ) |
| (96 | ) |
| (96 | ) |
| (185 | ) | ||||
Other comprehensive income/(loss), net of tax | 111 | |
| 137 | |
| 357 | |
| (30 | ) | ||||
Ending balance | $ | 421 | |
| $ | 253 | |
| $ | 421 | |
| $ | 253 | |
|
|
|
|
|
|
|
| ||||||||
Pension and other postretirement benefits |
|
|
|
|
|
|
| ||||||||
Beginning balance | $ | (2,723 | ) |
| $ | (2,680 | ) |
| $ | (2,745 | ) |
| $ | (2,689 | ) |
Amortization and recognition of prior service costs/(credits) | 16 | |
| 15 | |
| 33 | |
| 30 | | ||||
Less: Tax/(Tax benefit) | 7 | |
| 23 | |
| 10 | |
| 28 | | ||||
Net prior service costs/(credits) reclassified from AOCI to net income | 9 | |
| (8 | ) |
| 23 | |
| 2 | | ||||
Translation impact on non-U.S. plans | 8 | |
| (4 | ) |
| 16 | |
| (5 | ) | ||||
Other comprehensive income/(loss), net of tax | 17 | |
| (12 | ) |
| 39 | |
| (3 | ) | ||||
Ending balance | $ | (2,706 | ) |
| $ | (2,692 | ) |
| $ | (2,706 | ) |
| $ | (2,692 | ) |
|
|
|
|
|
|
|
| ||||||||
Total AOCI ending balance at June 30 | $ | (5,976 | ) |
| $ | (6,716 | ) |
| $ | (5,976 | ) |
| $ | (6,716 | ) |
__________
(a) | Reclassified to Non-Financial Services other income/(loss), net. |
(b) | Reclassified to Cost of sales . During the next twelve months we expect to reclassify existing net losses on cash flow hedges of $270 million . See Note 14 for additional information. |
26
Item 1. Financial Statements (Continued)
FORD MOTOR COMPANY AND SUBSIDIARIES
NOTES TO THE FINANCIAL STATEMENTS
NOTE 16. COMMITMENTS AND CONTINGENCIES
Commitments and contingencies primarily consist of guarantees and indemnifications, litigation and claims, and warranty.
Guarantees and Indemnifications
The maximum potential payments and the carrying value of recorded liabilities related to guarantees and limited indemnities were as follows (in millions):
| December 31, |
| June 30, | ||||
Maximum potential payments | $ | 177 | |
| $ | 1,613 | |
Carrying value of recorded liabilities related to guarantees and limited indemnities | 23 | |
| 481 | | ||
Guarantees and indemnifications are recorded at fair value at their inception. We regularly review our performance risk under these arrangements, and in the event it becomes probable we will be required to perform under guarantee or indemnity, the amount of probable payment is recorded.
We guarantee the resale value of vehicles sold in certain arrangements to daily rental companies. The maximum potential payment of $1.5 billion as of June 30, 2017 included in the table above represents the total proceeds we guarantee the rental company will receive on re-sale. Reflecting our present estimate of proceeds the rental companies will receive on resale from third parties, we have recorded $459 million as our best estimate of the amount we will have to pay under the guarantee. See Note 2 for additional information on the adoption of the new revenue standard.
We also guarantee debt and lease obligations of certain joint ventures, as well as certain financial obligations of outside third parties, including suppliers, to support our business and economic growth. Expiration dates vary through 2033, and guarantees will terminate on payment and/or cancellation of the underlying obligation. A payment by us would be triggered by failure of the joint venture or other third party to fulfill its obligation covered by the guarantee. In some circumstances, we are entitled to recover from a third party amounts paid by us under the guarantee. However, our ability to enforce these rights is sometimes stayed until the guaranteed party is paid in full, and may be limited in the event of insolvency of the third party or other circumstances.
In the ordinary course of business, we execute contracts involving indemnifications standard in the industry and indemnifications specific to a transaction, such as the sale of a business. These indemnifications might include and are not limited to claims relating to any of the following: environmental, tax, and shareholder matters; intellectual property rights; power generation contracts; governmental regulations and employment-related matters; dealer, supplier, and other commercial contractual relationships; and financial matters, such as securitizations. Performance under these indemnities generally would be triggered by a breach of terms of the contract or by a third-party claim. While some of these indemnifications are limited in nature, many of them do not limit potential payment. Therefore, we are unable to estimate a maximum amount of future payments that could result from claims made under these unlimited indemnities.
Litigation and Claims
Various legal actions, proceedings, and claims (generally, "matters") are pending or may be instituted or asserted against us. These include but are not limited to matters arising out of alleged defects in our products; product warranties; governmental regulations relating to safety, emissions, and fuel economy or other matters; government incentives; tax matters; alleged illegal acts resulting in fines or penalties; financial services; employment-related matters; dealer, supplier, and other contractual relationships; intellectual property rights; environmental matters; shareholder or investor matters; and financial reporting matters. Certain of the pending legal actions are, or purport to be, class actions. Some of the matters involve or may involve claims for compensatory, punitive, or antitrust or other treble damages in very large amounts, or demands for field service actions, environmental remediation programs, sanctions, loss of government incentives, assessments, or other relief, which, if granted, would require very large expenditures.
The extent of our financial exposure to these matters is difficult to estimate. Many matters do not specify a dollar amount for damages, and many others specify only a jurisdictional minimum. To the extent an amount is asserted, our historical experience suggests that in most instances the amount asserted is not a reliable indicator of the ultimate outcome.
27
Item 1. Financial Statements (Continued)
FORD MOTOR COMPANY AND SUBSIDIARIES
NOTES TO THE FINANCIAL STATEMENTS
NOTE 16. COMMITMENTS AND CONTINGENCIES (Continued)
We accrue for matters when losses are deemed probable and reasonably estimable. In evaluating matters for accrual and disclosure purposes, we take into consideration factors such as our historical experience with matters of a similar nature, the specific facts and circumstances asserted, the likelihood that we will prevail, and the severity of any potential loss. We reevaluate and update our accruals as matters progress over time.
For the majority of matters, which generally arise out of alleged defects in our products, we establish an accrual based on our extensive historical experience with similar matters. We do not believe there is a reasonably possible outcome materially in excess of our accrual for these matters.
For the remaining matters, where our historical experience with similar matters is of more limited value (i.e., "non-pattern matters"), we evaluate the matters primarily based on the individual facts and circumstances. For non-pattern matters, we evaluate whether there is a reasonable possibility of a material loss in excess of any accrual that can be estimated. Our estimate of reasonably possible loss in excess of our accruals for all material matters currently reflects indirect tax and customs matters, for which we estimate the aggregate risk to be a range of up to a bout $2.8 billion .
As noted, the litigation process is subject to many uncertainties, and the outcome of individual matters is not predictable with assurance. Our assessments are based on our knowledge and experience, but the ultimate outcome of any matter could require payment substantially in excess of the amount that we have accrued and/or disclosed.
Warranty and Field Service Actions
We accrue obligations for warranty costs and field service actions (i.e., safety recalls, emission recalls, and other product campaigns) at the time of sale using a patterned estimation model that includes historical information regarding the nature, frequency, and average cost of claims for each vehicle line by model year. Warranty and field service action obligations are reported in Other liabilities and deferred revenue . We reevaluate the adequacy of our accruals on a regular basis.
We recognize the benefit from a recovery of the costs associated with our warranty and field service actions when specifics of the recovery have been agreed with our supplier and the amount of the recovery is virtually certain. Recoveries are reported in Trade and other receivables and Other assets.
The estimate of our future warranty and field service action costs, net of supplier recoveries, for the periods ended June 30 were as follows (in millions):
| First Half | ||||||
| 2016 |
| 2017 | ||||
Beginning balance | $ | 4,558 | |
| $ | 4,960 | |
Payments made during the period | (1,593 | ) |
| (1,710 | ) | ||
Changes in accrual related to warranties issued during the period | 1,179 | |
| 1,272 | | ||
Changes in accrual related to pre-existing warranties | 279 | |
| 582 | | ||
Foreign currency translation and other | 45 | |
| 71 | | ||
Ending balance | $ | 4,468 | |
| $ | 5,175 | |
Revisions to our estimated costs are reported as changes in accrual related to pre-existing warranties in the table above.
28
Item 1. Financial Statements (Continued)
FORD MOTOR COMPANY AND SUBSIDIARIES
NOTES TO THE FINANCIAL STATEMENTS
NOTE 17. SEGMENT INFORMATION
Below is a description of our reportable segments and the business activities included in All Other.
Automotive Segment
Our Automotive segment primarily includes the sale of Ford and Lincoln brand vehicles, service parts, and accessories worldwide, together with the associated costs to develop, manufacture, distribute, and service the vehicles, parts, and accessories. The segment includes five regional business units: North America, South America, Europe, Middle East & Africa, and Asia Pacific.
Financial Services Segment
The Financial Services segment primarily includes our vehicle-related financing and leasing activities at Ford Credit.
All Other
All Other is a combination of two operating segments that did not meet the quantitative thresholds in this reporting period to qualify as reportable segments. All Other consists of our Central Treasury Operations and Ford Smart Mobility LLC. The Central Treasury Operations segment is primarily engaged in decision making for investments, risk management activities, and providing financing for the Automotive segment. Interest income (excluding interest earned on our extended service contract portfolio that is included in our Automotive segment), interest expense, gains and losses on cash equivalents and marketable securities, and foreign exchange derivatives associated with intercompany lending, are included in the results of Central Treasury Operations. The underlying assets and liabilities, primarily cash and cash equivalents, marketable securities, debt, and derivatives, remain with the Automotive segment.
Ford Smart Mobility LLC is a subsidiary formed to design, build, grow, and invest in emerging mobility services. Designed to compete like a start-up company, Ford Smart Mobility LLC designs and builds mobility services on its own, and collaborates with start-ups and tech companies.
Special Items
Our results include Special items that consist of (i) pension and OPEB remeasurement gains and losses, (ii) significant personnel and dealer-related costs stemming from our efforts to match production capacity and cost structure to market demand and changing model mix, and (iii) certain infrequent significant items that we generally do not consider to be indicative of our ongoing operating activities. Our management excludes these items from its review of the results of the operating segments for purposes of measuring segment profitability and allocating resources. Special items are presented as a separate reconciling item.
29
Item 1. Financial Statements (Continued)
FORD MOTOR COMPANY AND SUBSIDIARIES
NOTES TO THE FINANCIAL STATEMENTS
NOTE 17. SEGMENT INFORMATION (Continued)
Key operating data for the periods ended or at June 30 were as follows (in millions):
| Automotive |
| Financial Services |
| All Other |
| Special Items |
| Adjustments |
| Total | ||||||||||||
Second Quarter 2016 |
| |
|
| |
|
| |
|
|
|
| |
|
| | |||||||
Revenues | $ | 36,932 | |
| $ | 2,553 | |
| $ | - | |
| $ | - | |
| $ | - | |
| $ | 39,485 | |
Pre-tax results - income/(loss) | 2,832 | |
| 385 | |
| (224 | ) |
| (118 | ) |
| - | |
| 2,875 | | ||||||
Equity in net income/(loss) of affiliated companies | 390 | |
| 8 | |
| - | |
| - | |
| - | |
| 398 | | ||||||
Cash, cash equivalents, and marketable securities | 27,210 | |
| 12,087 | |
| - | |
| - | |
| - | |
| 39,297 | | ||||||
Total assets | 99,272 | |
| 145,303 | |
| 6 | |
| - | |
| (4,903 | ) | (a) | 239,678 | | ||||||
Debt | 13,071 | |
| 126,843 | |
| - | |
| - | |
| - | |
| 139,914 | | ||||||
Operating cash flows | 4,144 | |
| 2,283 | |
| - | |
| - | |
| 1,315 | | (b) | 7,742 | | ||||||
|
|
|
|
|
|
|
|
|
|
|
| ||||||||||||
Second Quarter 2017 |
| |
|
| |
|
| |
|
|
|
| |
|
| | |||||||
Revenues | $ | 37,113 | |
| $ | 2,738 | |
| $ | 2 | |
| $ | - | |
| $ | - | |
| $ | 39,853 | |
Pre-tax results - income/(loss) | 2,191 | |
| 603 | |
| (287 | ) |
| (248 | ) |
| - | |
| 2,259 | | ||||||
Equity in net income/(loss) of affiliated companies | 266 | |
| 8 | |
| (1 | ) |
| - | |
| - | |
| 273 | | ||||||
Cash, cash equivalents, and marketable securities | 28,428 | |
| 10,677 | |
| 4 | |
| - | |
| - | |
| 39,109 | | ||||||
Total assets | 103,583 | |
| 150,793 | |
| 83 | |
| - | |
| (6,990 | ) | (a) | 247,469 | | ||||||
Debt | 16,188 | |
| 129,821 | |
| - | |
| - | |
| - | |
| 146,009 | | ||||||
Operating cash flows | 1,270 | |
| 3,152 | |
| (23 | ) |
| - | |
| 1,216 | | (b) | 5,615 | | ||||||
|
|
|
|
|
|
|
|
|
|
|
| ||||||||||||
| Automotive |
| Financial Services |
| All Other |
| Special Items |
| Adjustments |
| Total | ||||||||||||
First Half 2016 |
| |
|
| |
|
| |
|
|
|
| |
|
| | |||||||
Revenues | $ | 72,189 | |
| $ | 5,014 | |
| $ | - | |
| $ | - | |
| $ | - | |
| $ | 77,203 | |
Pre-tax results - income/(loss) | 6,296 | |
| 884 | |
| (350 | ) |
| (304 | ) |
| - | |
| 6,526 | | ||||||
Equity in net income/(loss) of affiliated companies | 924 | |
| 15 | |
| - | |
| - | |
| - | |
| 939 | | ||||||
Operating cash flows | 6,871 | |
| 2,808 | |
| - | |
| - | |
| 2,212 | | (b) | 11,891 | | ||||||
|
|
|
|
|
|
|
|
|
|
|
| ||||||||||||
First Half 2017 |
| |
|
| |
|
| |
|
|
|
| |
|
| | |||||||
Revenues | $ | 73,588 | |
| $ | 5,407 | |
| $ | 4 | |
| $ | - | |
| $ | - | |
| $ | 78,999 | |
Pre-tax results - income/(loss) | 4,156 | |
| 1,069 | |
| (499 | ) |
| (224 | ) |
| - | |
| 4,502 | | ||||||
Equity in net income/(loss) of affiliated companies | 605 | |
| 15 | |
| (1 | ) |
| - | |
| - | |
| 619 | | ||||||
Operating cash flows | 3,286 | |
| 4,236 | |
| (33 | ) |
| - | |
| 2,462 | | (b) | 9,951 | | ||||||
__________
(a) | Includes eliminations of intersegment transactions occurring in the ordinary course of business and deferred tax netting. |
(b) | We measure and evaluate our Automotive segment operating cash flow on a different basis than Net cash provided by/(used in) operating activities in our consolidated statement of cash flows. Automotive segment operating cash flow includes additional elements management considers to be related to our Automotive operating activities, primarily capital spending and non-designated derivatives, and excludes outflows for funded pension contributions, separation payments, and other items that are considered operating cash flows under U.S. GAAP. The table below quantifies these reconciling adjustments to Net cash provided by/(used in) operating activities for the periods ended June 30 (in millions): |
|
| Second Quarter |
| First Half | ||||||||||||
|
| 2016 |
| 2017 |
| 2016 |
| 2017 | ||||||||
| Automotive capital spending | $ | 1,686 | |
| $ | 1,547 | |
| $ | 3,183 | |
| $ | 3,242 | |
| Net cash flows from non-designated derivatives | 41 | |
| (66 | ) |
| (76 | ) |
| (200 | ) | ||||
| Funded pension contributions | (221 | ) |
| (221 | ) |
| (589 | ) |
| (456 | ) | ||||
| Separation payments | (148 | ) |
| (31 | ) |
| (158 | ) |
| (59 | ) | ||||
| Other | (43 | ) |
| (13 | ) |
| (148 | ) |
| (65 | ) | ||||
| Total operating cash flow adjustments | $ | 1,315 | |
| $ | 1,216 | |
| $ | 2,212 | |
| $ | 2,462 | |
30
Report of Independent Registered Public Accounting Firm
To the Board of Directors and Stockholders of
Ford Motor Company
We have reviewed the accompanying consolidated balance sheet of Ford Motor Company and its subsidiaries as of June 30, 2017 , and the related consolidated statements of income and comprehensive income for the three-month and six -month periods ended June 30, 2017 and 2016 and the consolidated statement of equity and the condensed consolidated statement of cash flows for the six -month periods ended June 30, 2017 and 2016 . These interim financial statements are the responsibility of the Company's management.
We conducted our review in accordance with the standards of the Public Company Accounting Oversight Board (United States). A review of interim financial information consists principally of applying analytical procedures and making inquiries of persons responsible for financial and accounting matters. It is substantially less in scope than an audit conducted in accordance with the standards of the Public Company Accounting Oversight Board (United States), the objective of which is the expression of an opinion regarding the financial statements taken as a whole. Accordingly, we do not express such an opinion.
Based on our review, we are not aware of any material modifications that should be made to the accompanying consolidated interim financial statements for them to be in conformity with accounting principles generally accepted in the United States of America.
We previously audited, in accordance with the standards of the Public Company Accounting Oversight Board (United States), the consolidated balance sheet as of December 31, 2016 , and the related consolidated statements of income, comprehensive income, equity, and cash flows for the year then ended (not presented herein), and in our report dated February 9, 2017 , we expressed an unqualified opinion on those consolidated financial statements. In our opinion, the information set forth in the accompanying consolidated balance sheet information as of December 31, 2016 , is fairly stated in all material respects in relation to the consolidated balance sheet from which it has been derived.
/s/ PricewaterhouseCoopers LLP
PricewaterhouseCoopers LLP
Detroit, Michigan
July 26, 2017
31
ITEM 2. Management's Discussion and Analysis of Financial Condition and Results of Operations.
OVERVIEW
Non-GAAP Financial Measures That Supplement GAAP Measures
We use both generally accepted accounting principles ("GAAP") and non-GAAP financial measures for operational and financial decision making, and to assess Company and segment business performance. The non-GAAP measures listed below are intended to be considered by users as supplemental information to their equivalent GAAP measures, to aid investors in better understanding our financial results. We believe that these non-GAAP measures provide useful perspective on underlying business results and trends, and a means to assess our period-over-period results. These non-GAAP measures should not be considered as a substitute for, or superior to, measures of financial performance prepared in accordance with GAAP. These non-GAAP measures may not be the same as similarly titled measures used by other companies due to possible differences in method and in items or events being adjusted.
• | Total Company Adjusted Pre-tax Profit (Most Comparable GAAP Measure: Net Income Attributable to Ford) – The non-GAAP measure is useful to management and investors because it allows users to evaluate our pre-tax results excluding pre-tax special items. Pre-tax special items consist of (i) pension and other postretirement employee benefits ("OPEB") remeasurement gains and losses that are not reflective of our underlying business results, (ii) significant restructuring actions related to our efforts to match production capacity and cost structure to market demand and changing model mix, and (iii) other items that we do not necessarily consider to be indicative of earnings from ongoing operating activities. When we provide guidance for adjusted pre-tax profit, we do not provide guidance on a net income basis because the GAAP measure will include potentially significant special items that have not yet occurred and are difficult to predict with reasonable certainty prior to year-end, including pension and OPEB remeasurement gains and losses. |
• | Adjusted Earnings Per Share (Most Comparable GAAP Measure: Earnings Per Share) – Measure of Company's diluted net earnings per share adjusted for impact of pre-tax special items (described above) and tax special items. The measure provides investors with useful information to evaluate performance of our business excluding items not indicative of the underlying run rate of our business. When we provide guidance for adjusted earnings per share, we do not provide guidance on an earnings per share basis because the GAAP measure will include potentially significant special items that have not yet occurred and are difficult to predict with reasonable certainty prior to year-end, including pension and OPEB remeasurement gains and losses. |
• | Adjusted Effective Tax Rate (Most Comparable GAAP Measure: Effective Tax Rate) – Measure of Company's tax rate excluding pre-tax special items (described above) and tax special items. The measure provides an ongoing effective rate which investors find useful for historical comparisons and for forecasting. When we provide guidance for adjusted effective tax rate, we do not provide guidance on an effective tax rate basis because the GAAP measure will include potentially significant special items that have not yet occurred and are difficult to predict with reasonable certainty prior to year-end, including pension and OPEB remeasurement gains and losses. |
• | Ford Credit Managed Receivables (Most Comparable GAAP Measure: Net Finance Receivables plus Net Investment in Operating Leases) – Measure of Ford Credit's total net receivables, excluding unearned interest supplements and residual support, allowance for credit losses, and other (primarily accumulated supplemental depreciation). The measure is useful to management and investors as it closely approximates the customer's outstanding balance on the receivables, which is the basis for earning revenue. |
• | Ford Credit Managed Leverage (Most Comparable GAAP Measure: Financial Statement Leverage) – Ford Credit's debt-to-equity ratio adjusted (i) to exclude cash, cash equivalents, and marketable securities (other than amounts related to insurance activities), and (ii) for derivative accounting. The measure is useful to investors because it reflects the way Ford Credit manages its business. Cash, cash equivalents, and marketable securities are deducted because they generally correspond to excess debt beyond the amount required to support operations and on-balance sheet securitization transactions. Derivative accounting adjustments are made to asset, debt, and equity positions to reflect the impact of interest rate instruments used with Ford Credit's term-debt issuances and securitization transactions. Ford Credit generally repays its debt obligations as they mature, so the interim effects of changes in market interest rates are excluded in the calculation of managed leverage. |
32
Item 2. Management's Discussion and Analysis of Financial Condition and Results of Operations (Continued)
RESULTS OF OPERATIONS
Total Company
Net income attributable to Ford. The chart below shows our second quarter 2017 net income attributable to Ford.
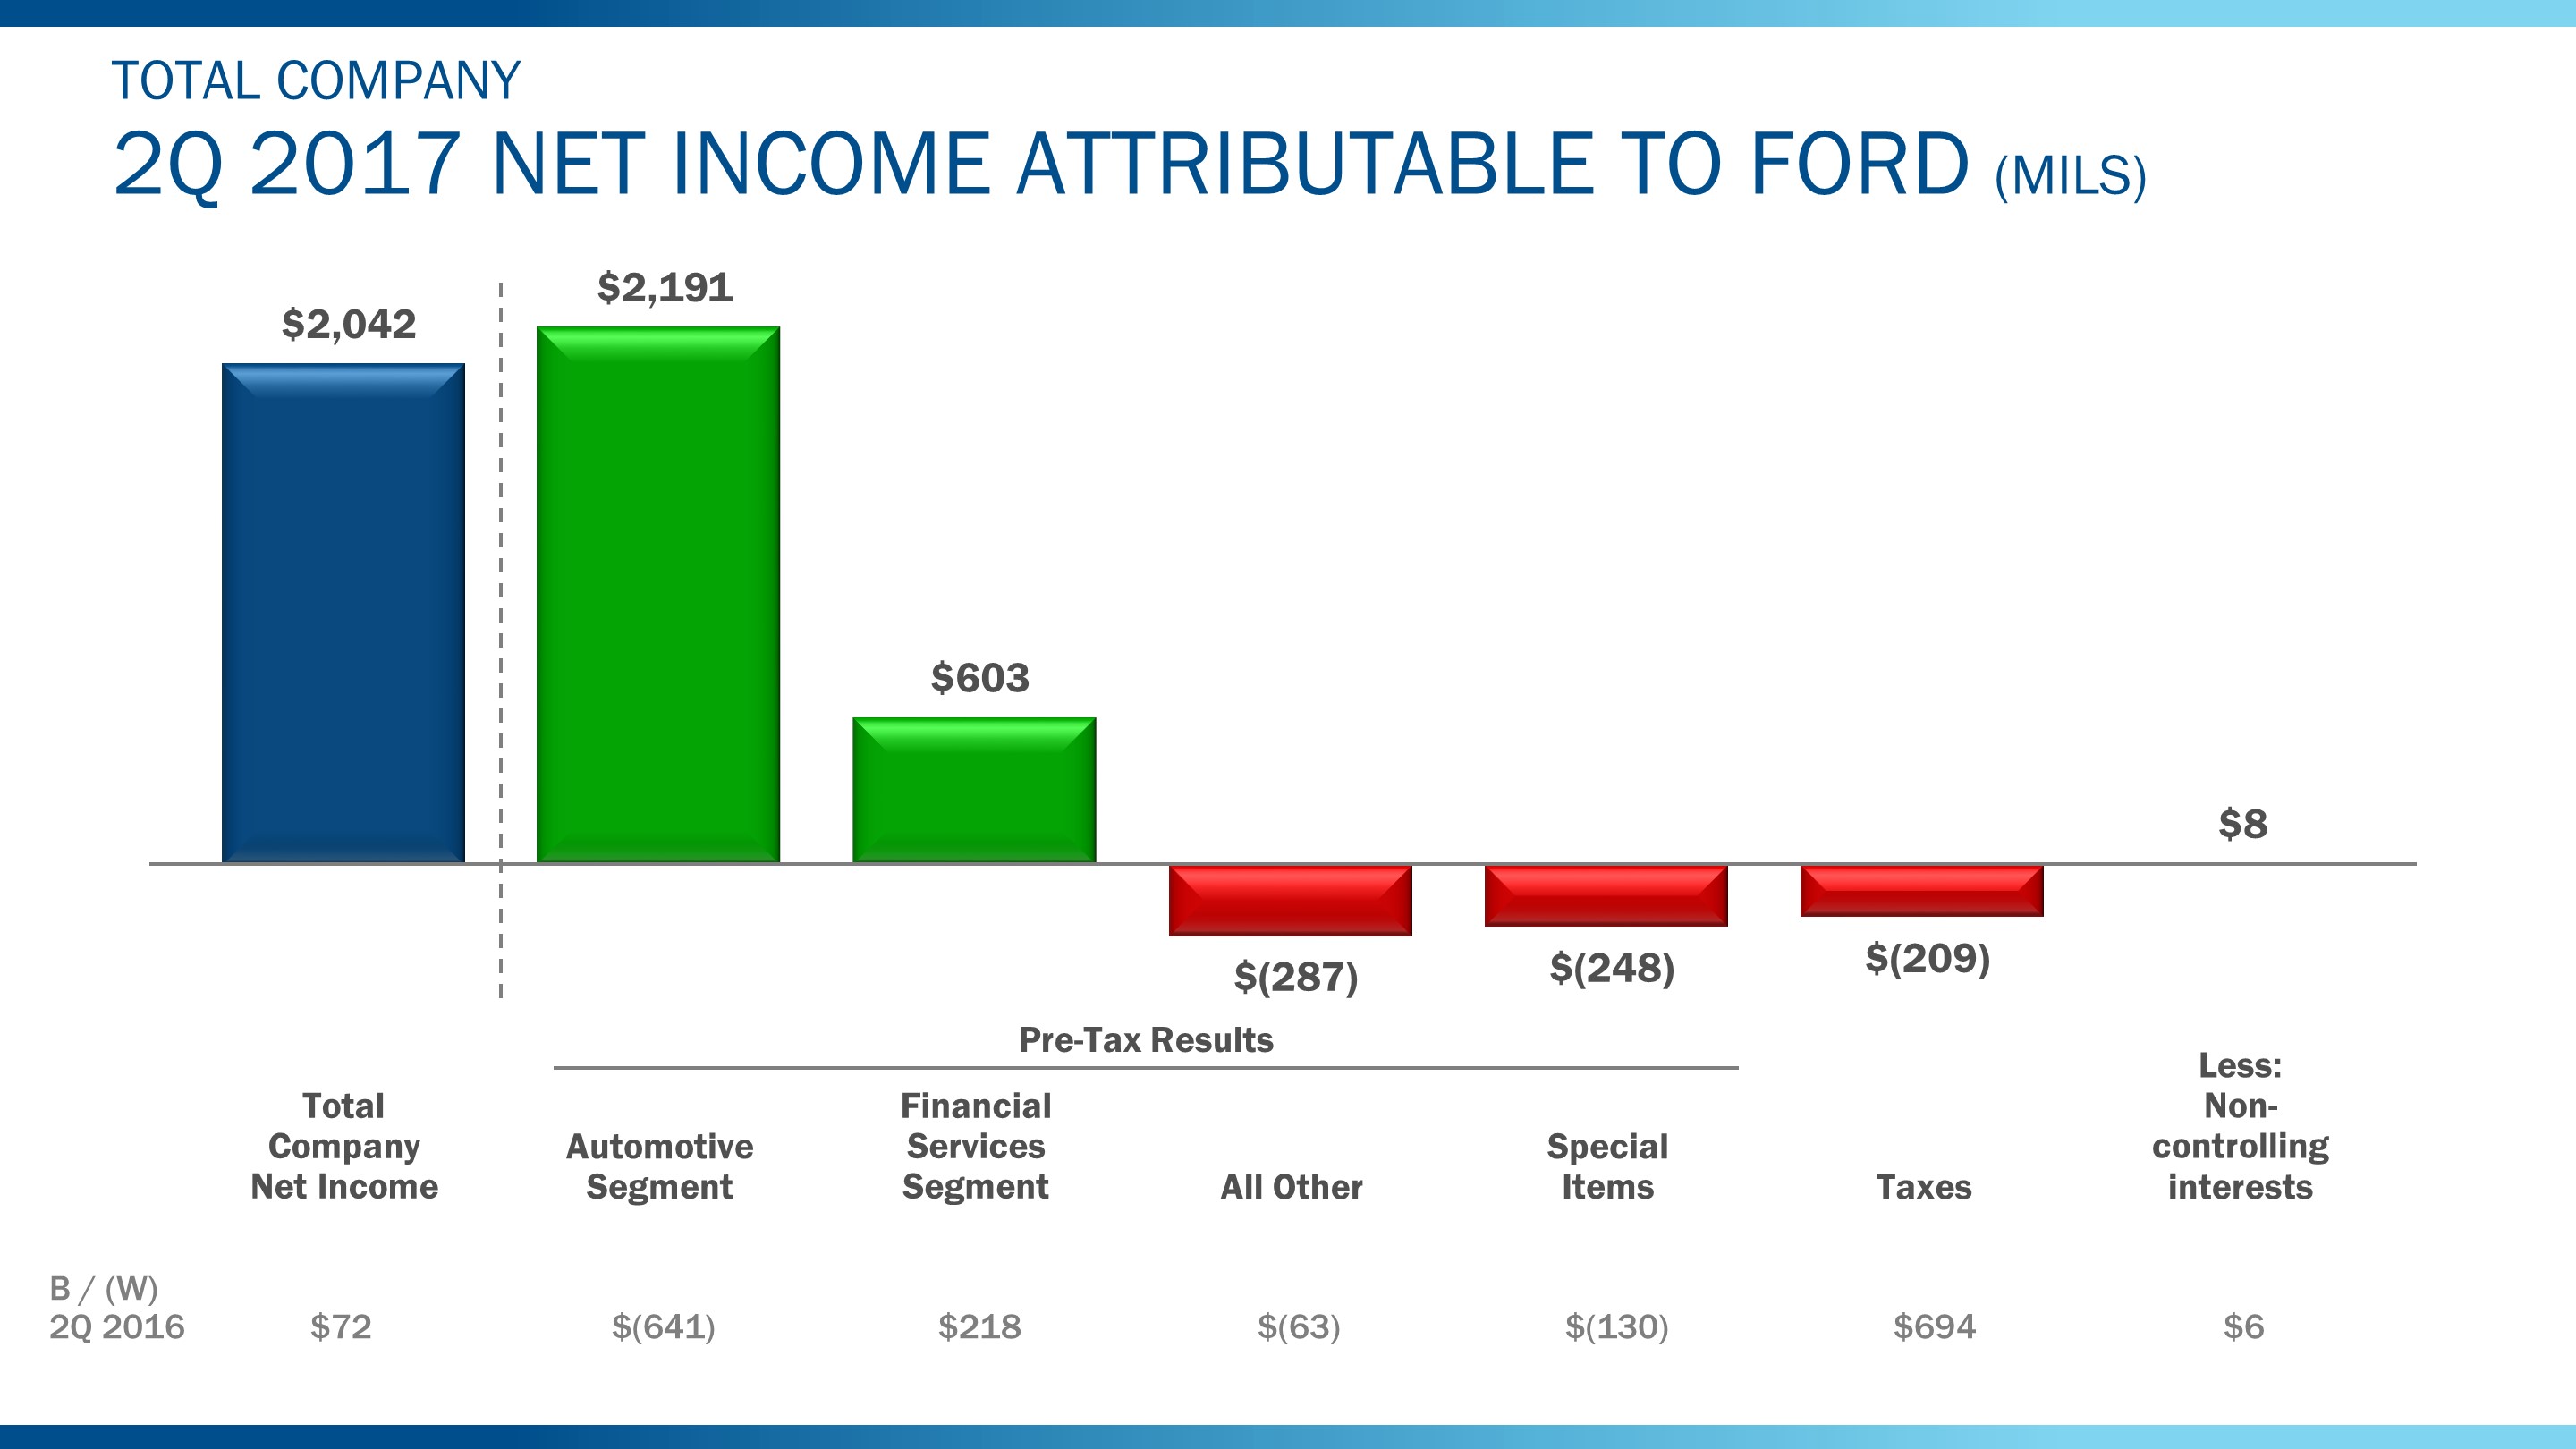
Net income attributable to Ford in the second quarter of 2017 was $2 billion or $0.51 diluted earnings per share of Common and Class B Stock, an increase of $72 million or $0.02 per share compared with the second quarter of 2016. Second quarter 2017 pre-tax results of our Automotive segment, Financial Services segment, All Other, and Special Items, as well as Taxes are discussed in the following sections in "Results of Operations."
Revenue. Company revenue in the second quarter of 2017 was $39.9 billion, $368 million higher than a year ago.
Cost of sales and Selling, administrative, and other expenses for the second quarter of 2017 were $36.1 billion, an increase of $0.8 billion. Cost of sales and Selling, administrative, and other expenses for the first half of 2017 was $71.6 billion, an increase of $3.1 billion. The detail for the second quarter and first half of 2017 change compared with 2016 is shown below (in billions):
| 2017 Lower/(Higher) 2016 | ||||||
| Second Quarter |
| First Half | ||||
Volume and mix, exchange, and other | $ | (0.3 | ) |
| $ | (1.5 | ) |
Contribution costs |
|
|
| | |||
Material excluding commodities | - | |
| (0.3 | ) | ||
Commodities | (0.4 | ) |
| (0.6 | ) | ||
Freight and other | 0.1 | |
| (0.3 | ) | ||
Structural costs | (0.1 | ) |
| (0.5 | ) | ||
Special items | (0.1 | ) |
| 0.1 | | ||
Total | $ | (0.8 | ) |
| $ | (3.1 | ) |
33
Item 2. Management's Discussion and Analysis of Financial Condition and Results of Operations (Continued)
Equity. At June 30, 2017 , total equity attributable to Ford was $32.2 billion, an increase of $3.1 billion compared with December 31, 2016 . The detail for this change is shown below (in billions):
| Increase/ (Decrease) | ||
Net income | $ | 3.6 | |
Shareholder distributions | (1.5 | ) | |
Other comprehensive income | 0.3 | | |
Adoption of accounting standards | 0.6 | | |
Common Stock issued (including share-based compensation impacts) | 0.1 | | |
Total | $ | 3.1 | |
The chart below shows our second quarter 2017 total Company adjusted pre-tax results and the pre-tax results of our Automotive segment, our Financial Services segment, and All Other, which is mainly net interest expense and the results of Ford Smart Mobility LLC.
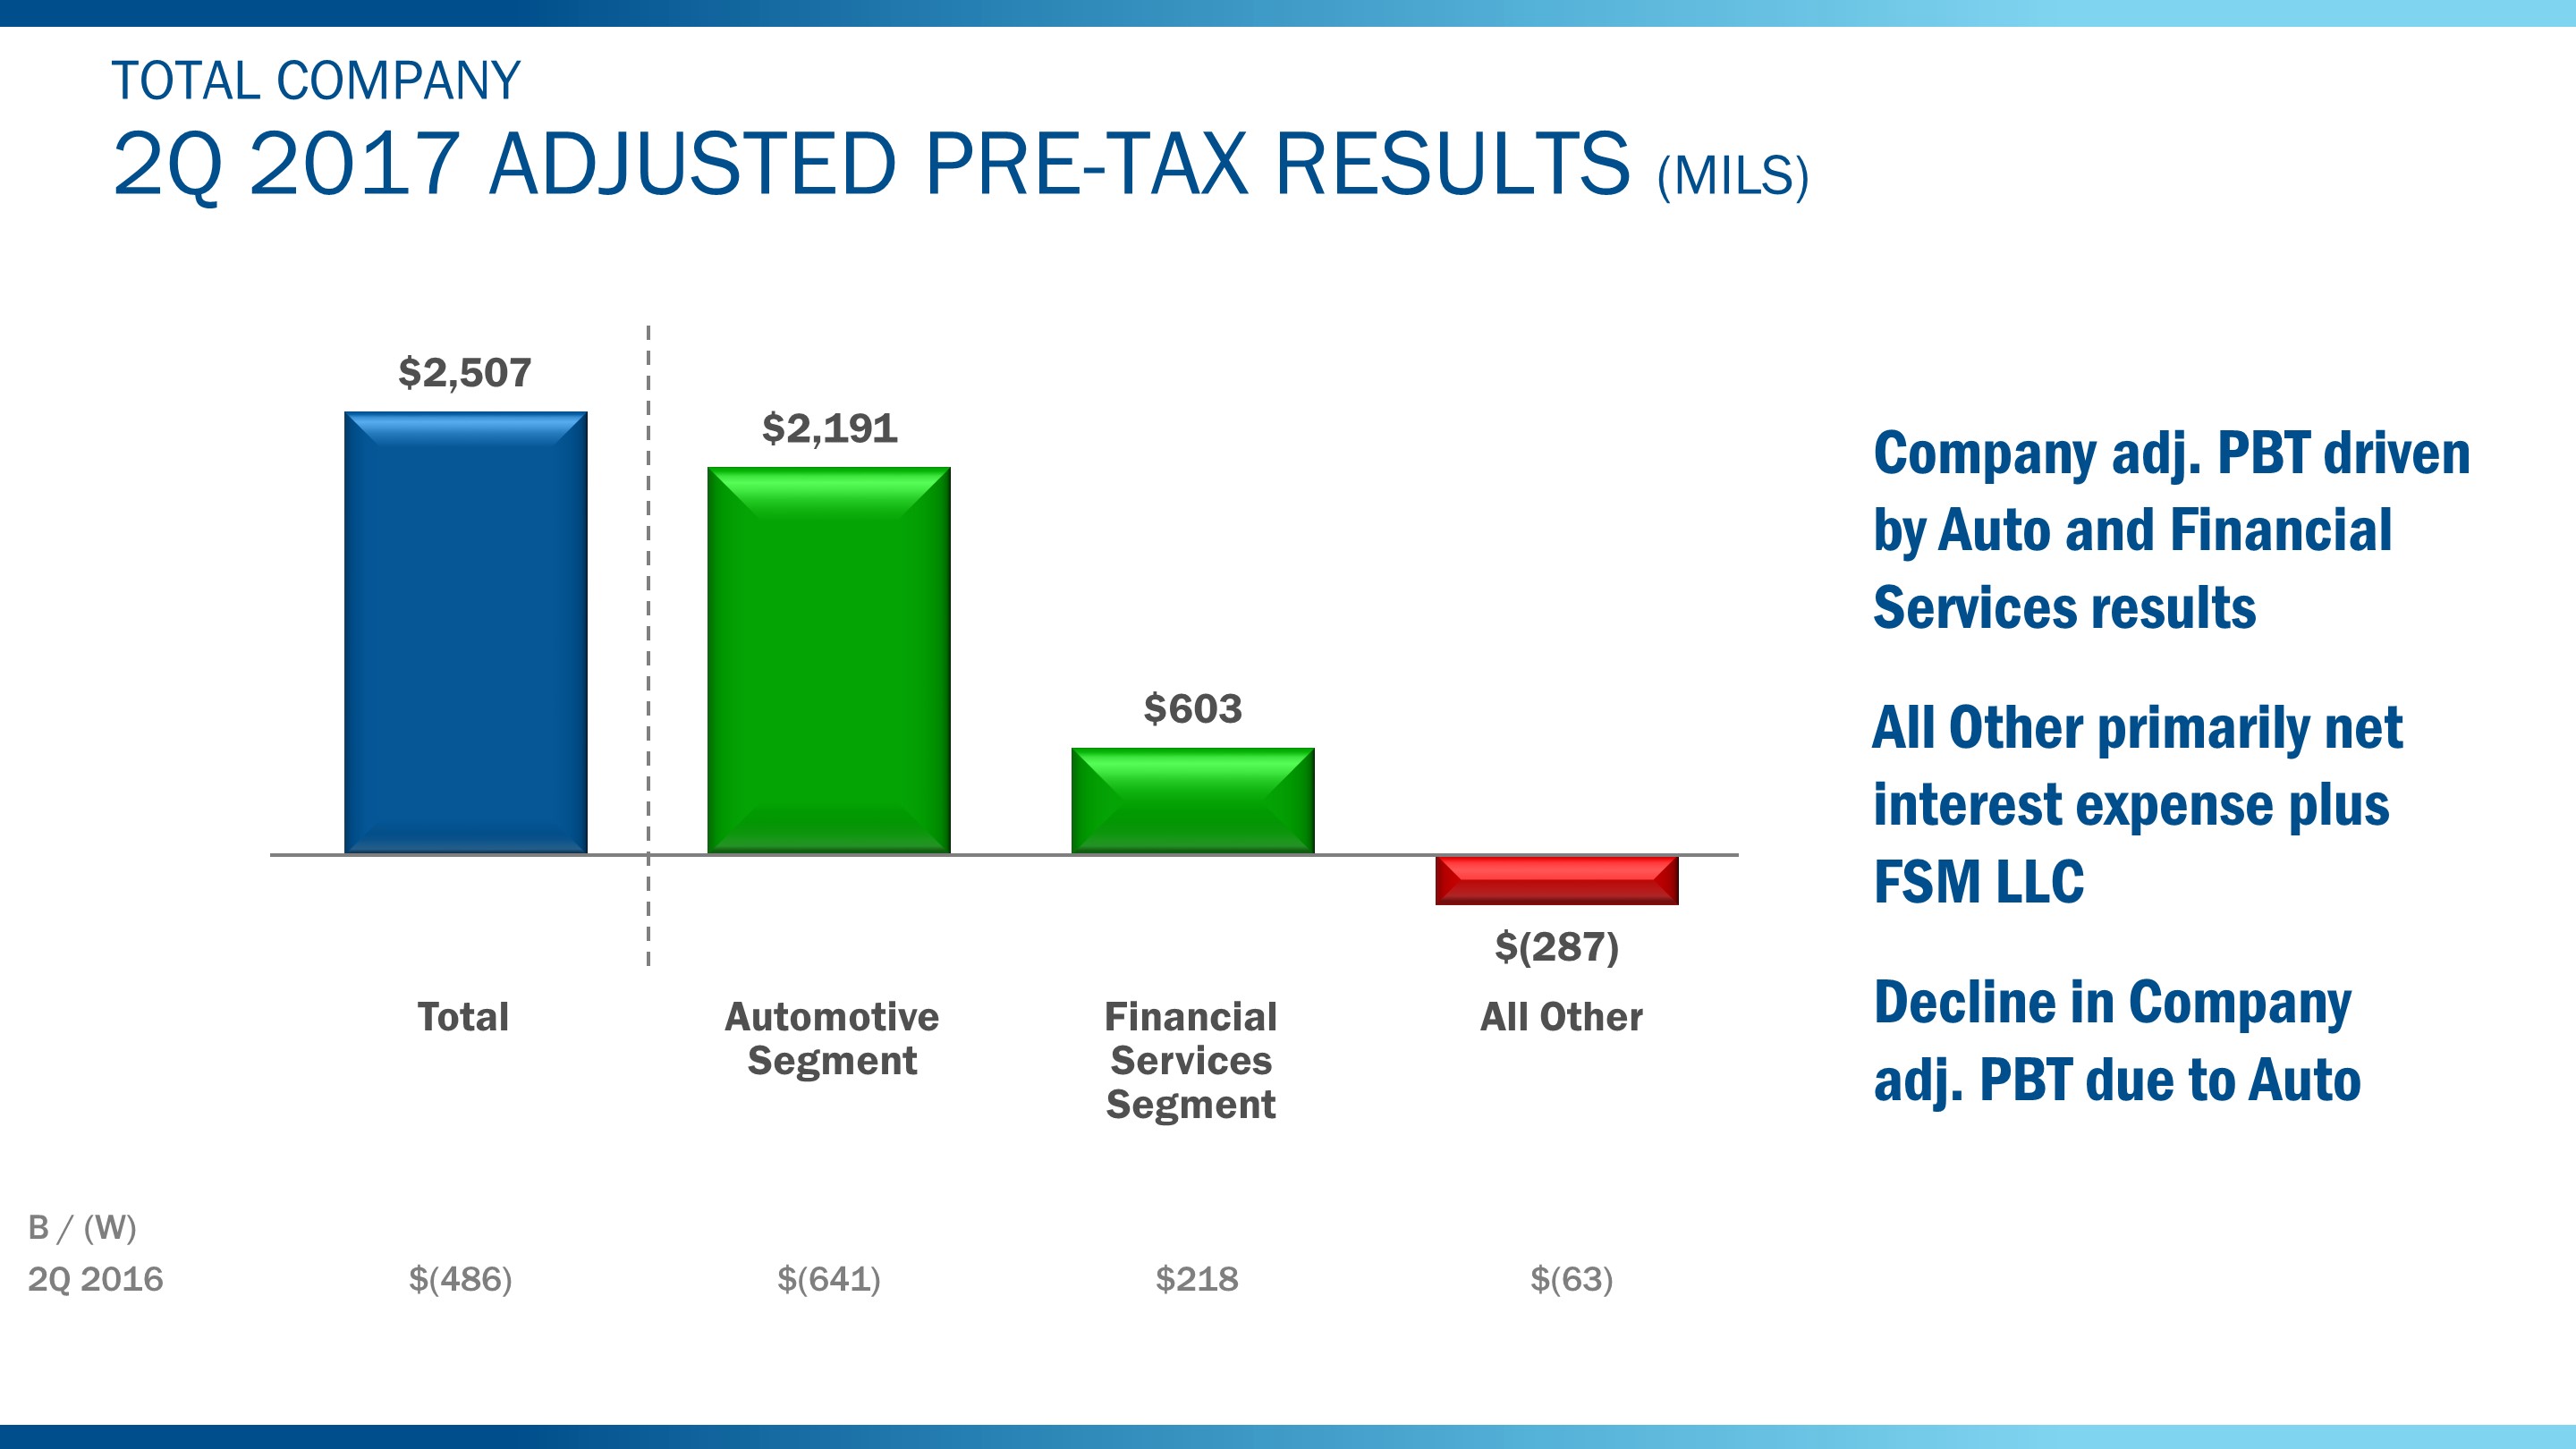
Our total Company adjusted pre-tax profit for the second quarter of 2017 was $2.5 billion, $486 million lower than a year ago. Adjusted earnings per share of Common and Class B stock was $0.56, up $0.04 per share compared with the second quarter of 2016.
Our total Company adjusted pre-tax profit of $2.5 billion consisted of: Automotive segment profit of about $2.2 billion, a profit of $603 million in the Financial Services segment, and a loss of $287 million in All Other, largely net interest expense.
As shown below the chart, the Automotive segment profit decline from a year ago drove the lower total Company adjusted pre-tax profit.
34
Item 2. Management's Discussion and Analysis of Financial Condition and Results of Operations (Continued)
AUTOMOTIVE SEGMENT
In general, we measure year-over-year change in Automotive segment pre-tax results using the causal factors listed below, with net pricing and cost variances calculated at present-year volume and mix and exchange:
• | Market Factors : |
◦ | Volume and Mix – primarily measures profit variance from changes in wholesale volumes (at prior-year average contribution margin per unit) driven by changes in industry volume, market share, and dealer stocks, as well as the profit variance resulting from changes in product mix, including mix among vehicle lines and mix of trim levels and options within a vehicle line |
◦ | Net Pricing – primarily measures profit variance driven by changes in wholesale prices to dealers and marketing incentive programs such as rebate programs, low-rate financing offers, special lease offers, and stock adjustments on dealer inventory |
• | Contribution Costs – primarily measures profit variance driven by per-unit changes in cost categories that typically vary with volume, such as material costs (including commodity and component costs), warranty expense, and freight and duty costs |
• | Structural Costs – primarily measures profit variance driven by absolute change in cost categories that typically do not have a directly proportionate relationship to production volume. Structural costs include the following cost categories: |
◦ | Manufacturing, Including Volume Related – consists primarily of costs for hourly and salaried manufacturing personnel, plant overhead (such as utilities and taxes), and new product launch expense. These costs could be affected by volume for operating pattern actions such as overtime, line-speed, and shift schedules |
◦ | Engineering – consists primarily of costs for engineering personnel, prototype materials, testing, and outside engineering services |
◦ | Spending-Related – consists primarily of depreciation and amortization of our manufacturing and engineering assets, but also includes asset retirements and operating leases |
◦ | Advertising and Sales Promotions – includes costs for advertising, marketing programs, brand promotions, customer mailings and promotional events, and auto shows |
◦ | Administrative and Selling – includes primarily costs for salaried personnel and purchased services related to our staff activities and selling functions, as well as associated information technology costs |
◦ | Pension and OPEB – consists primarily of past service pension costs and other postretirement employee benefit costs |
• | Exchange – primarily measures profit variance driven by one or more of the following: (i) transactions denominated in currencies other than the functional currencies of the relevant entities, (ii) effects of converting functional currency income to U.S. dollars, (iii) effects of remeasuring monetary assets and liabilities of the relevant entities in currencies other than their functional currency, or (iv) results of our foreign currency hedging |
• | Other – includes a variety of items, such as parts and services profits, royalties, government incentives and compensation-related changes |
In addition, definitions and calculations used in this report include:
• | Wholesales and Revenue – wholesale unit volumes include all Ford and Lincoln badged units (whether produced by Ford or by an unconsolidated affiliate) that are sold to dealerships, units manufactured by Ford that are sold to other manufacturers, units distributed by Ford for other manufacturers, and local brand units produced by our China joint venture, Jiangling Motors Corporation, Ltd. ("JMC"), that are sold to dealerships. Vehicles sold to daily rental car companies that are subject to a guaranteed repurchase option (i.e., rental repurchase), as well as other sales of finished vehicles for which the recognition of revenue is deferred (e.g., consignments), also are included in wholesale unit volumes. Revenue from certain vehicles in wholesale unit volumes (specifically, Ford badged vehicles produced and distributed by our unconsolidated affiliates, as well as JMC brand vehicles) are not included in our revenue |
• | Automotive Segment Operating Margin – defined as Automotive segment pre-tax profit divided by Automotive segment revenue |
35
Item 2. Management's Discussion and Analysis of Financial Condition and Results of Operations (Continued)
• | Industry Volume and Market Share – based, in part, on estimated vehicle registrations; includes medium and heavy duty trucks |
• | Automotive Cash – includes cash, cash equivalents, and marketable securities |
• | SAAR – seasonally adjusted annual rate |
References to Automotive records for operating cash flow, operating margin, and business units are since at least 2000.
The charts on the following pages detail second quarter 2017 key metrics and the change in second quarter 2017 pre-tax results compared with second quarter 2016 by causal factor for our Automotive segment and its business units - North America, South America, Europe, Middle East & Africa, and Asia Pacific.
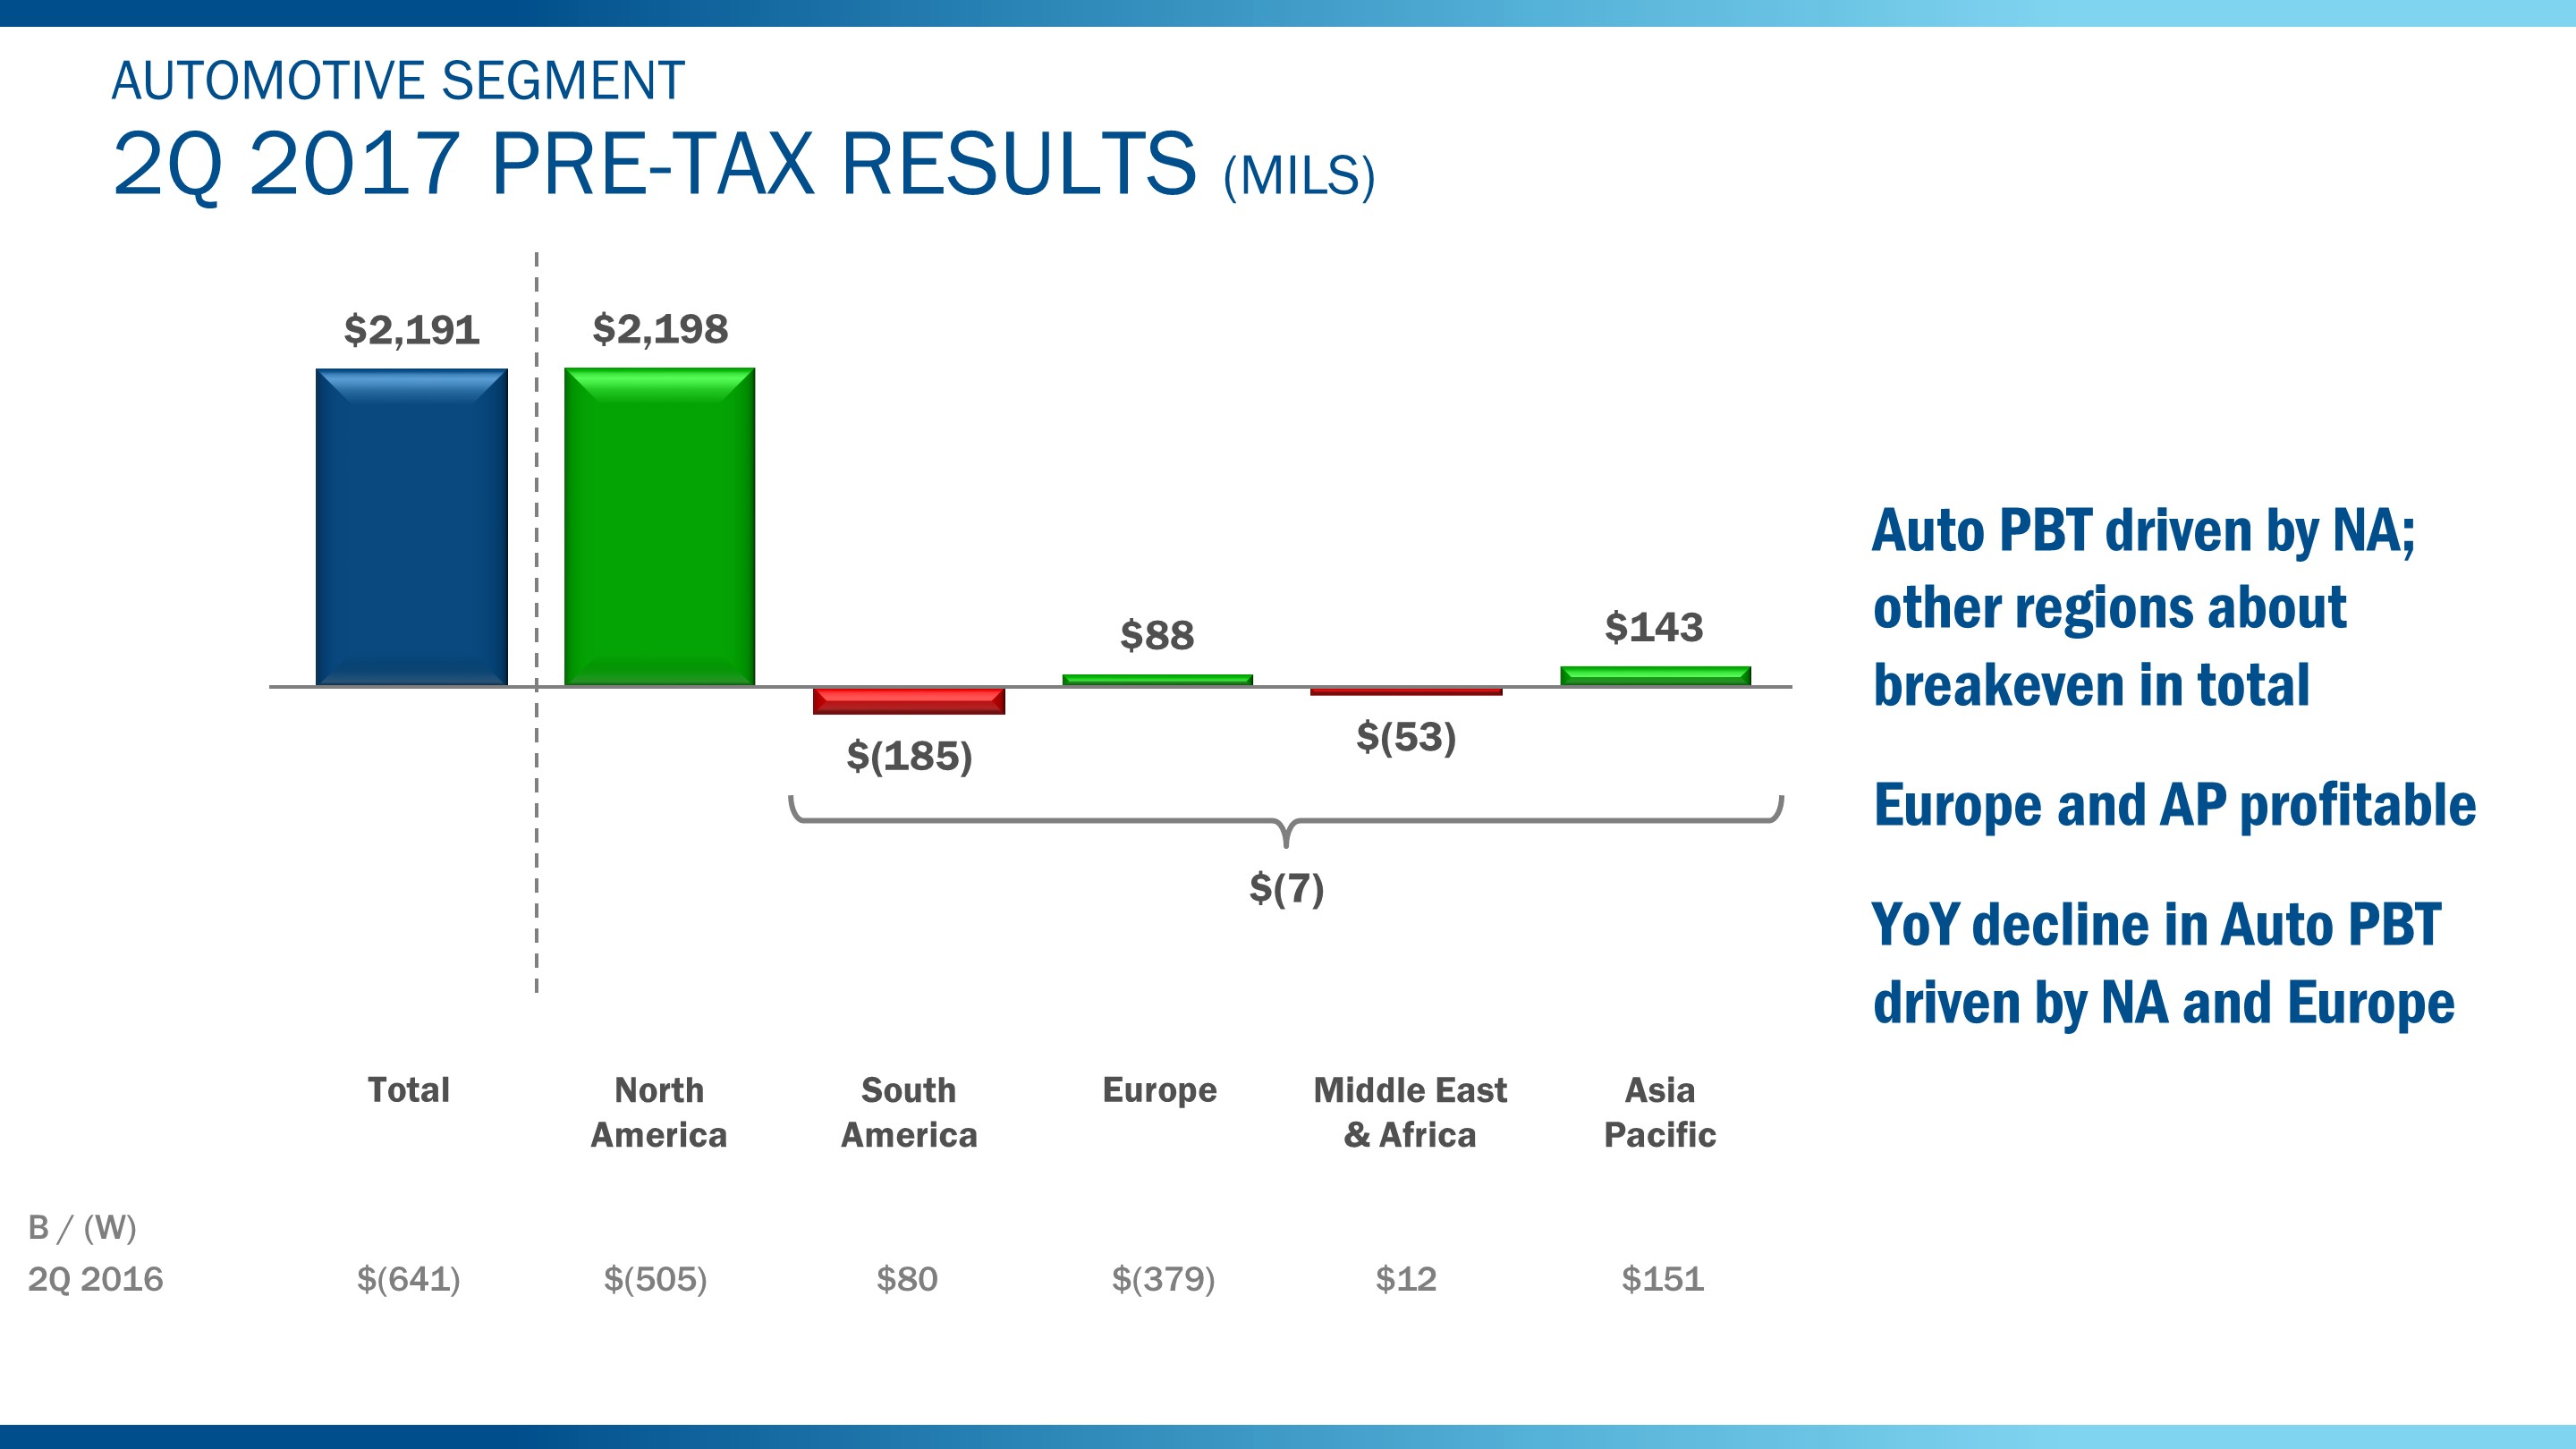
Our second quarter 2017 Automotive pre-tax results by business unit are shown above. Automotive profit was driven by North America with Europe and Asia Pacific also profitable. Outside North America, other regions were about breakeven in total.
As shown below the chart, the decline in Automotive profit versus last year was due to North America and Europe; results improved in Asia Pacific, South America, and Middle East & Africa.
36
Item 2. Management's Discussion and Analysis of Financial Condition and Results of Operations (Continued)
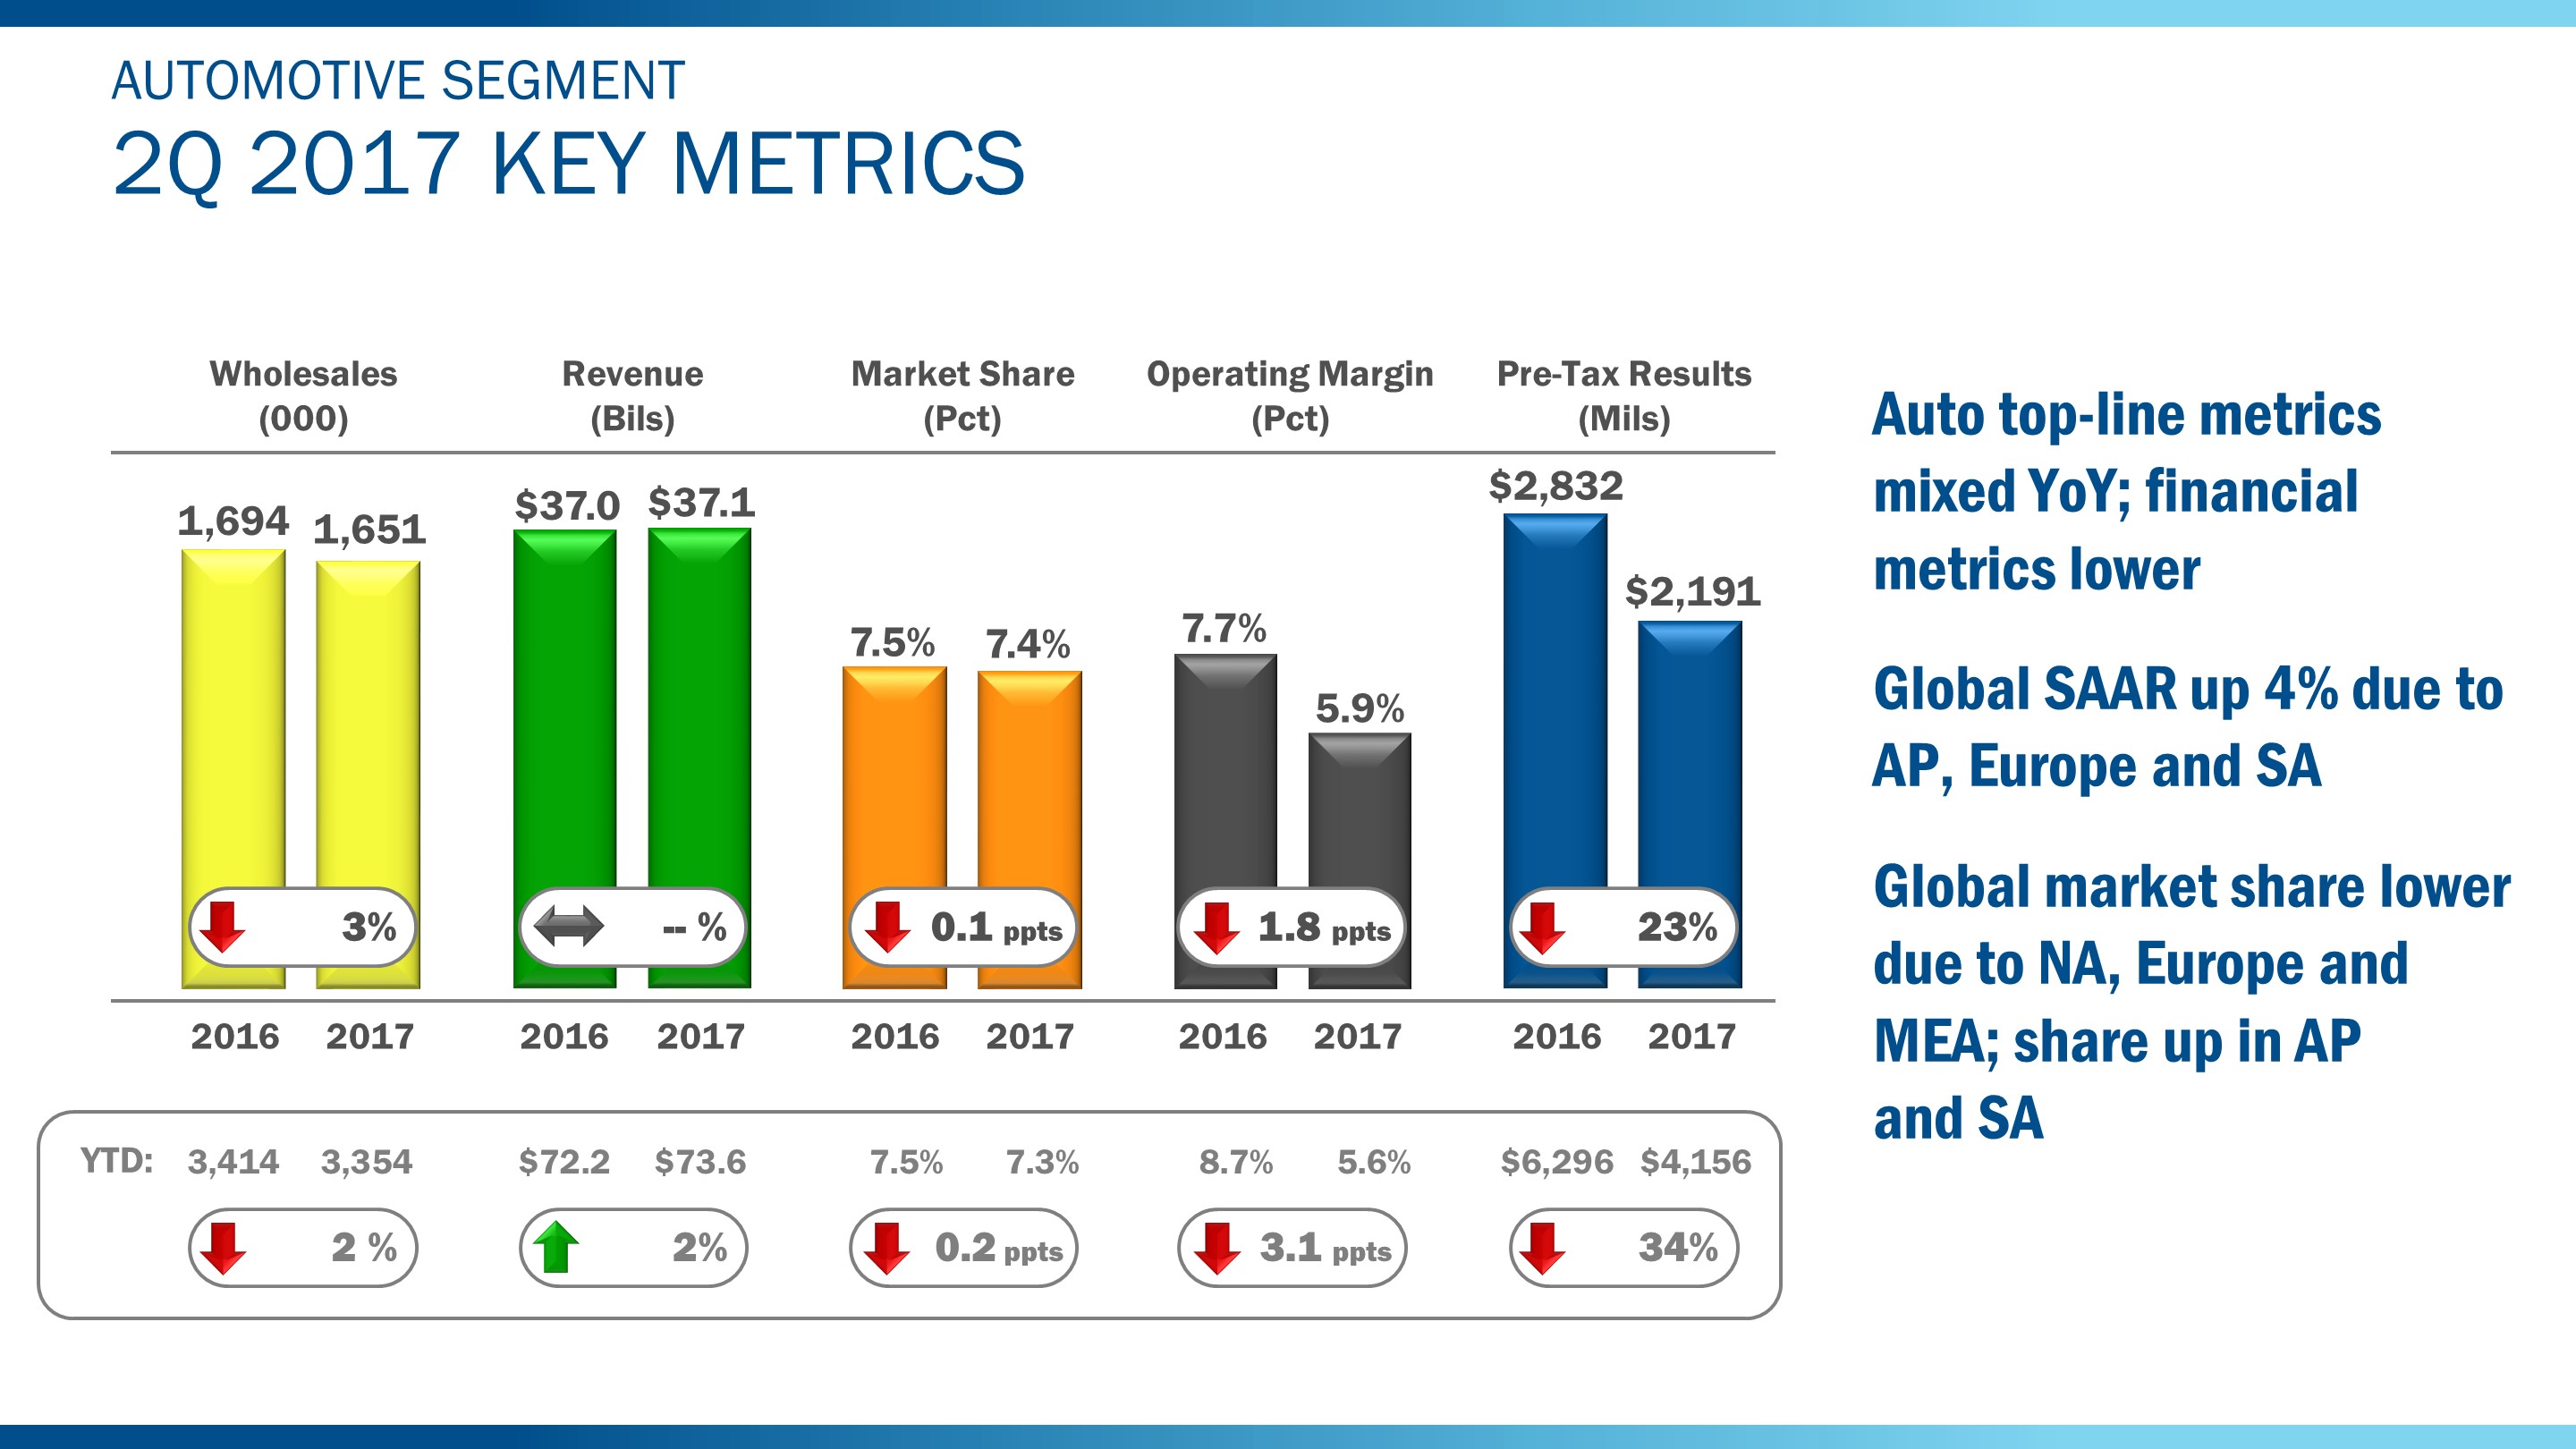
Shown above are the second quarter 2017 key metrics for our Automotive segment. Wholesale volume was down 3% from a year ago, while Automotive revenue was about flat.
Global industry SAAR is estimated at 93.2 million units, up 4%; this was driven by Asia Pacific, Europe, and South America.
Global market share, at 7.4%, was down one-tenth of a percentage point, reflecting lower share in North America, Europe, and Middle East & Africa. Market share improved in Asia Pacific and South America.
Automotive operating margin and pre-tax profit, at 5.9% and $2.2 billion, respectively, were both lower than a year ago.
As shown below the chart, first half 2017 Automotive revenue was up 2% year over year, while all other key metrics were lower.
37
Item 2. Management's Discussion and Analysis of Financial Condition and Results of Operations (Continued)
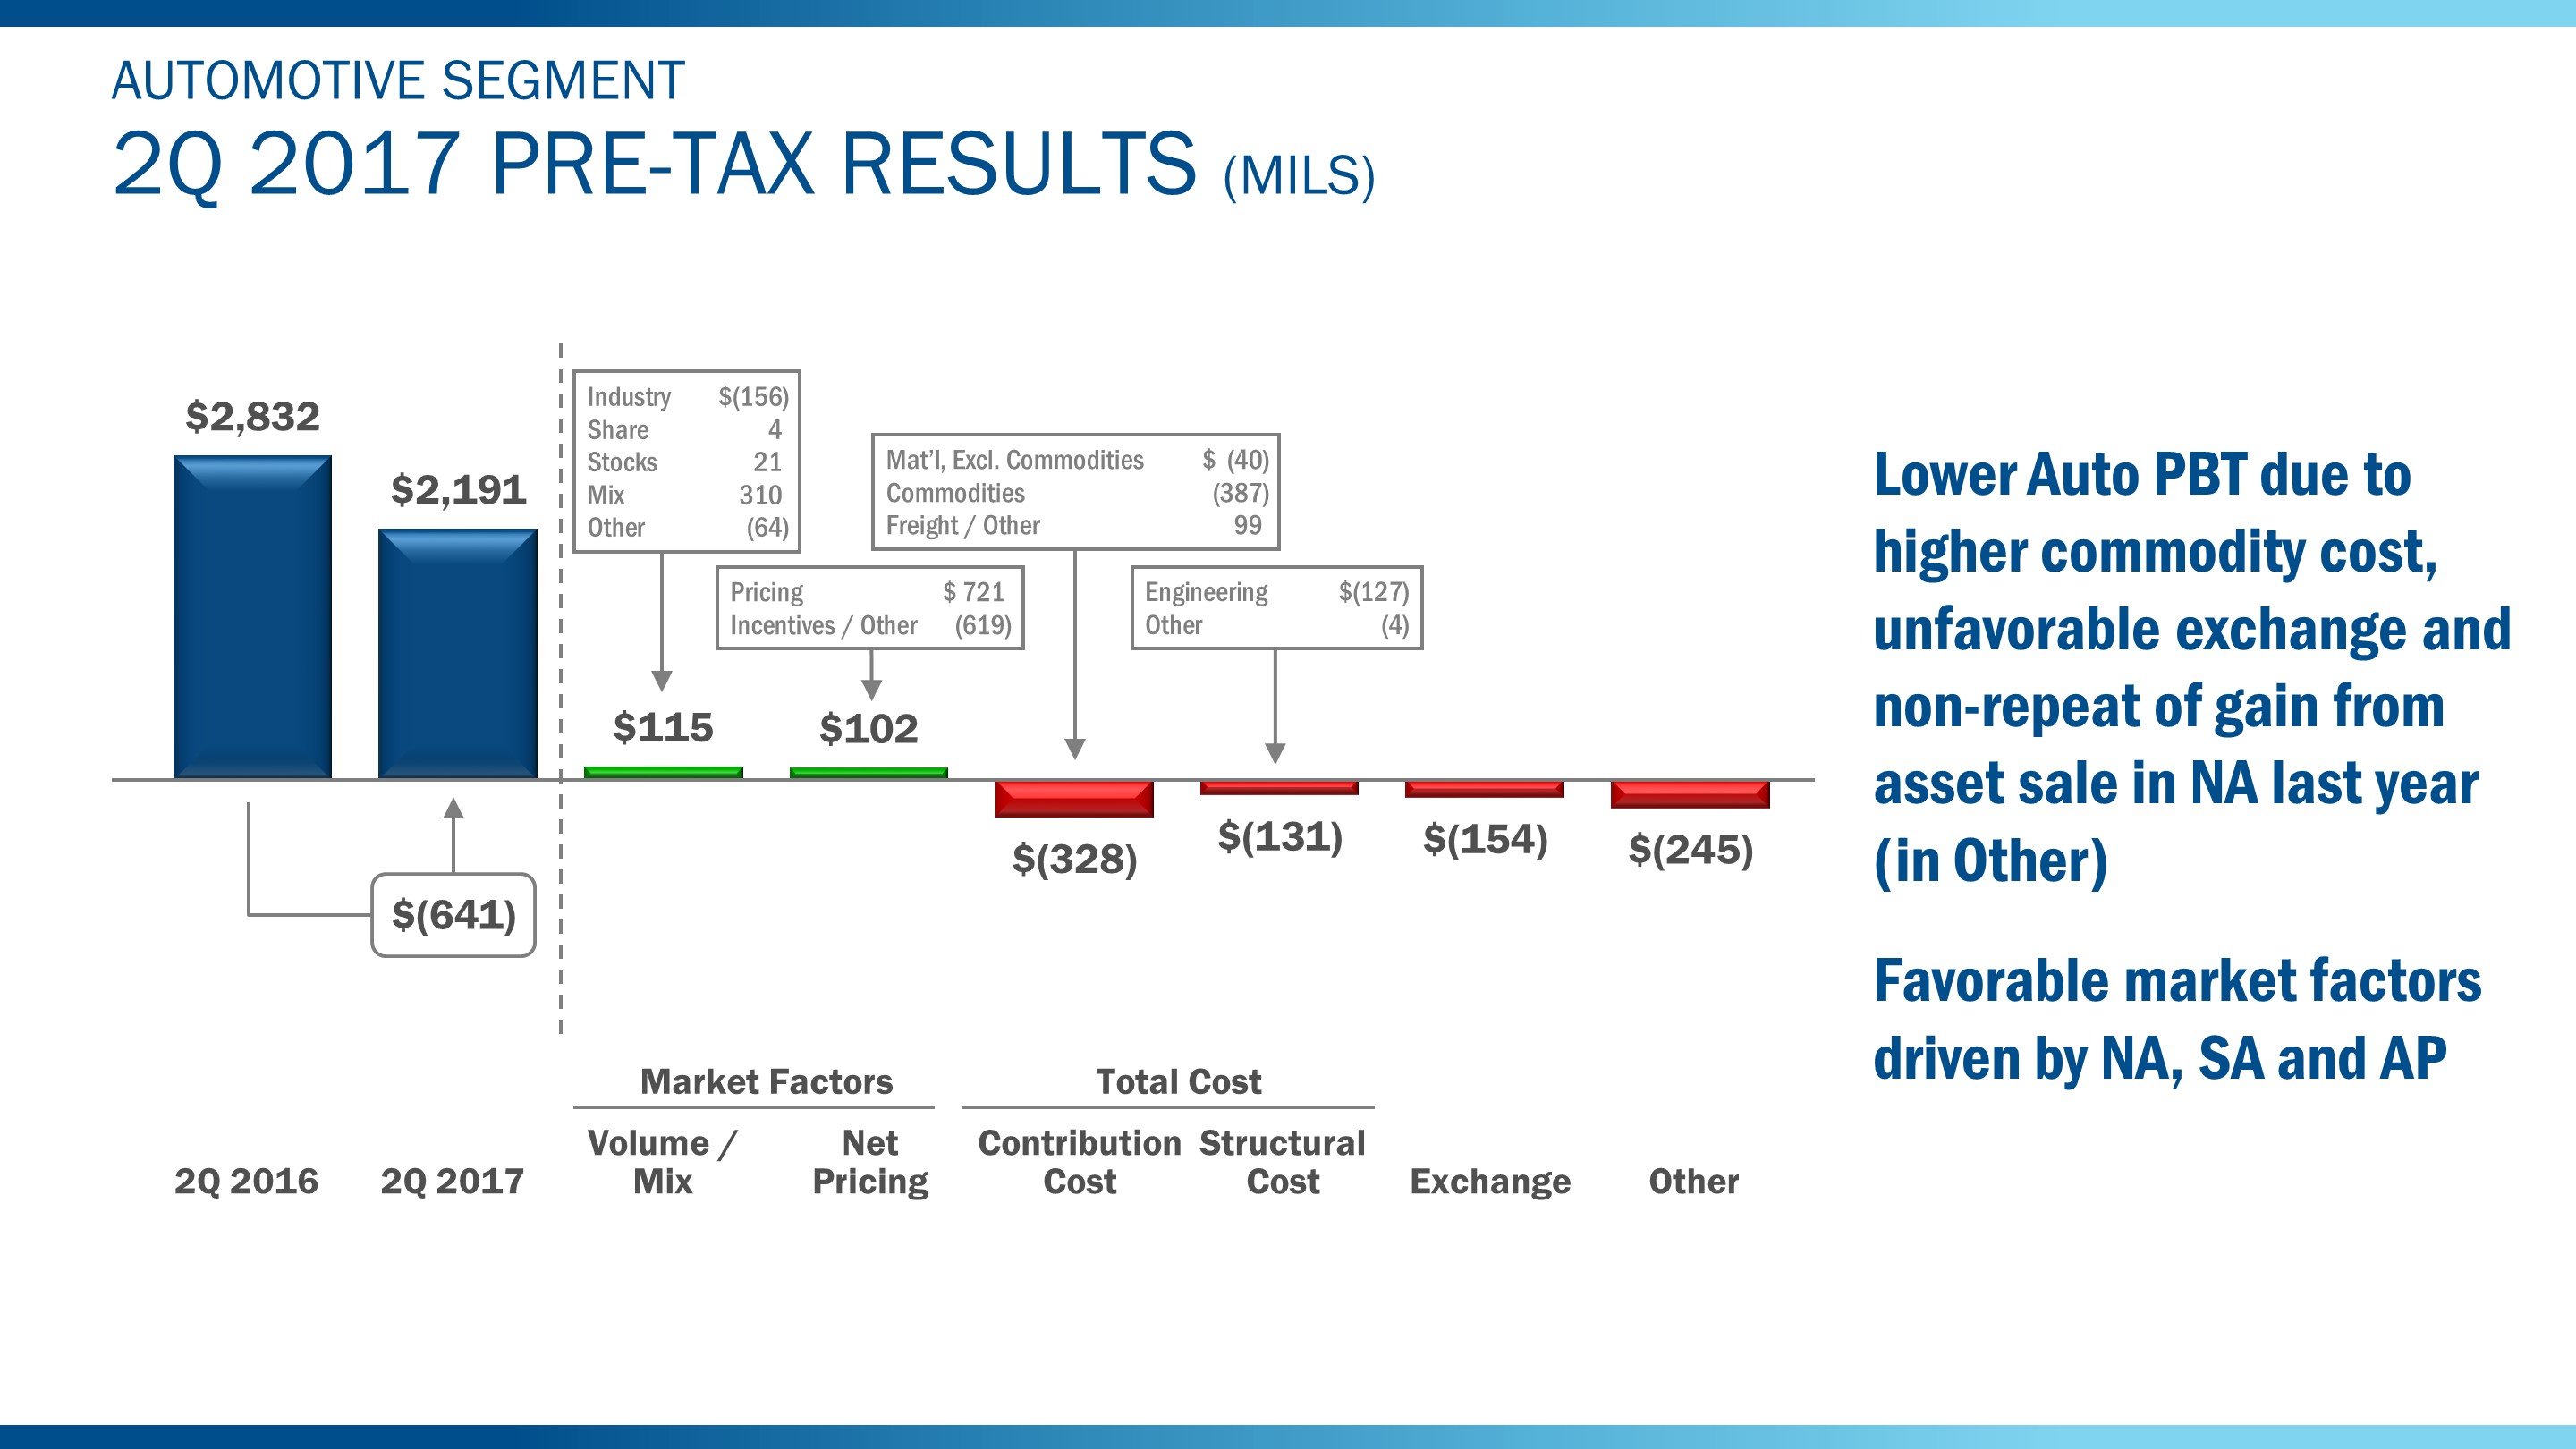
Shown above are the factors that contributed to the $641 million decline in second quarter 2017 Automotive segment pre-tax profit. The lower profit is explained by higher commodity cost, with steel the largest factor, unfavorable exchange, and the non-repeat of a gain from an asset sale in North America last year.
Market factors were positive, driven by favorable mix and higher net pricing.
38
Item 2. Management's Discussion and Analysis of Financial Condition and Results of Operations (Continued)
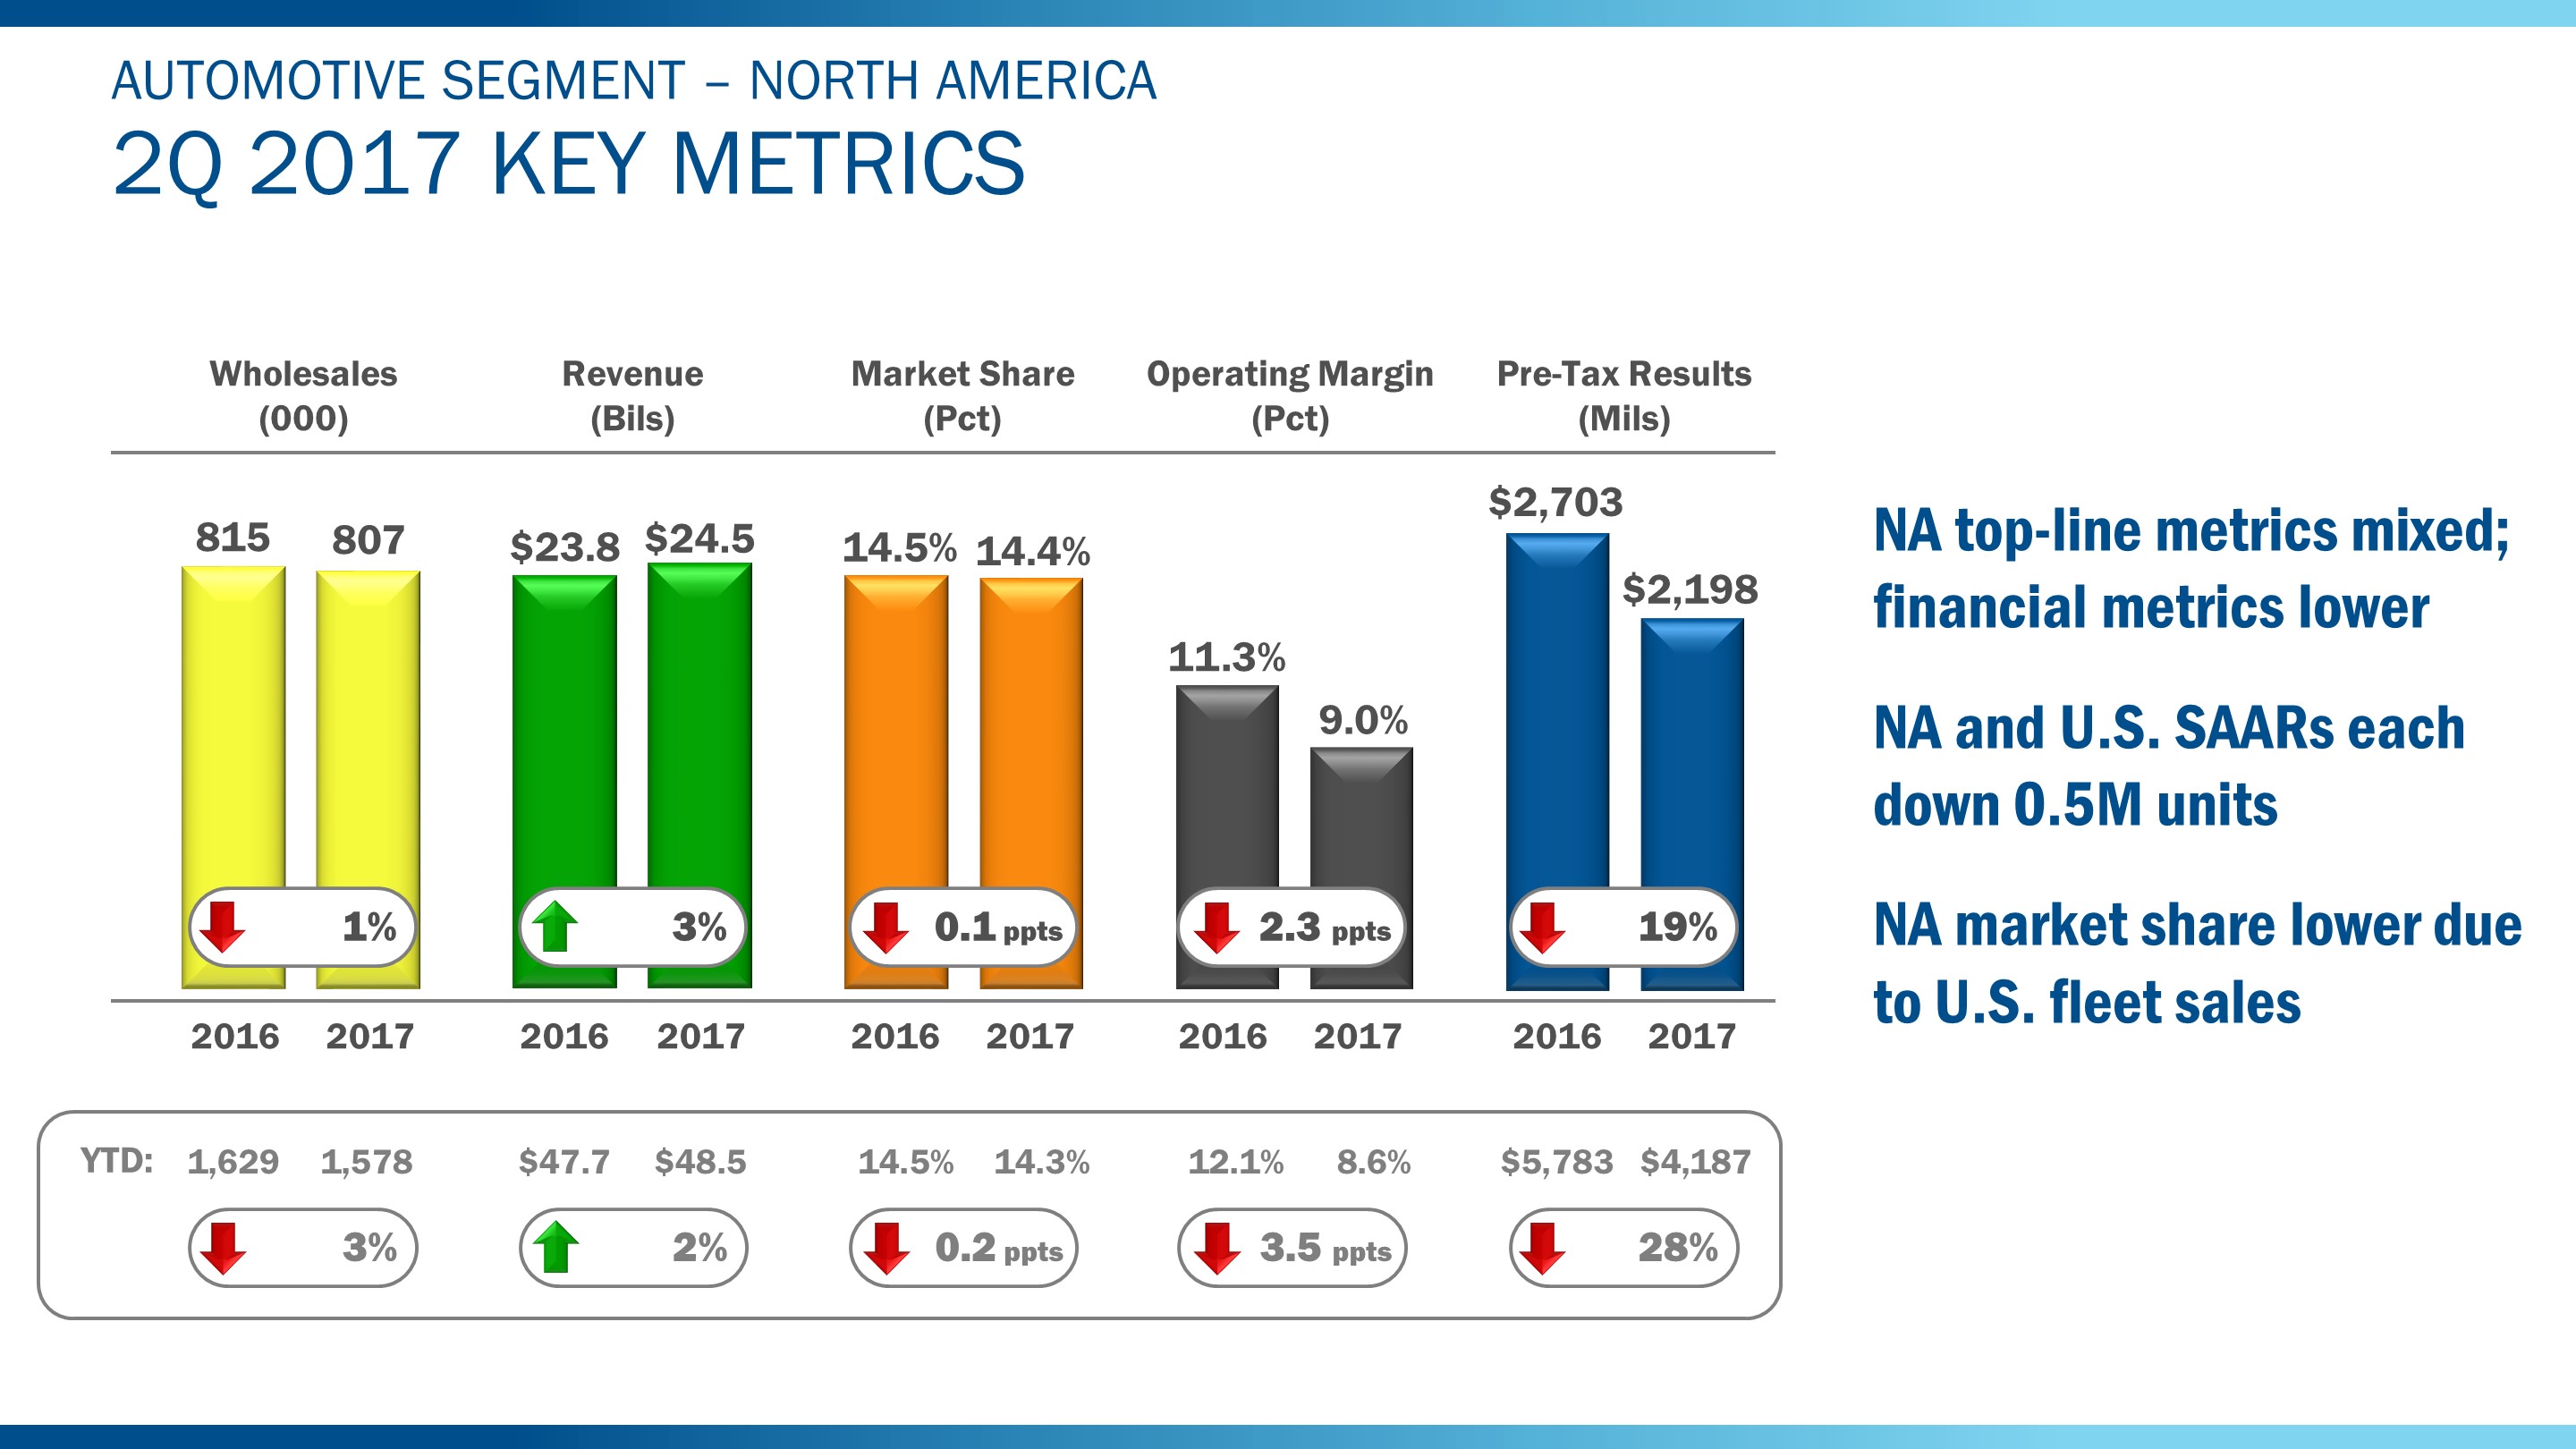
Shown above are the second quarter 2017 key metrics for North America. Revenue was up 3%, driven by the continued strong mix and higher net pricing. All other key metrics were flat to lower than a year ago.
North America SAAR, at 21 million units, and U.S. SAAR, at 17 million units, were both down 500,000 units from a year ago.
North America market share was down one-tenth of a percentage point, with U.S. share also down one-tenth of a point to 15.2%. This was driven by lower U.S. fleet sales. We gained share in the growing utilities and truck segments.
In the quarter, F-Series sales improved 7.4% compared to a year ago and gained share, reflecting our best second quarter sales performance since 2001. Ford-brand SUVs also had outstanding results, achieving record sales for the quarter. Lincoln continued to grow, up 3% with retail sales up 8%, delivering the brand's best sales performance in a decade.
Operating margin was 9% and pre-tax profit was $2.2 billion, both lower than a year ago.
As shown below the chart, each of North America's first half key metrics, except for revenue, was lower than a year ago.
39
Item 2. Management's Discussion and Analysis of Financial Condition and Results of Operations (Continued)
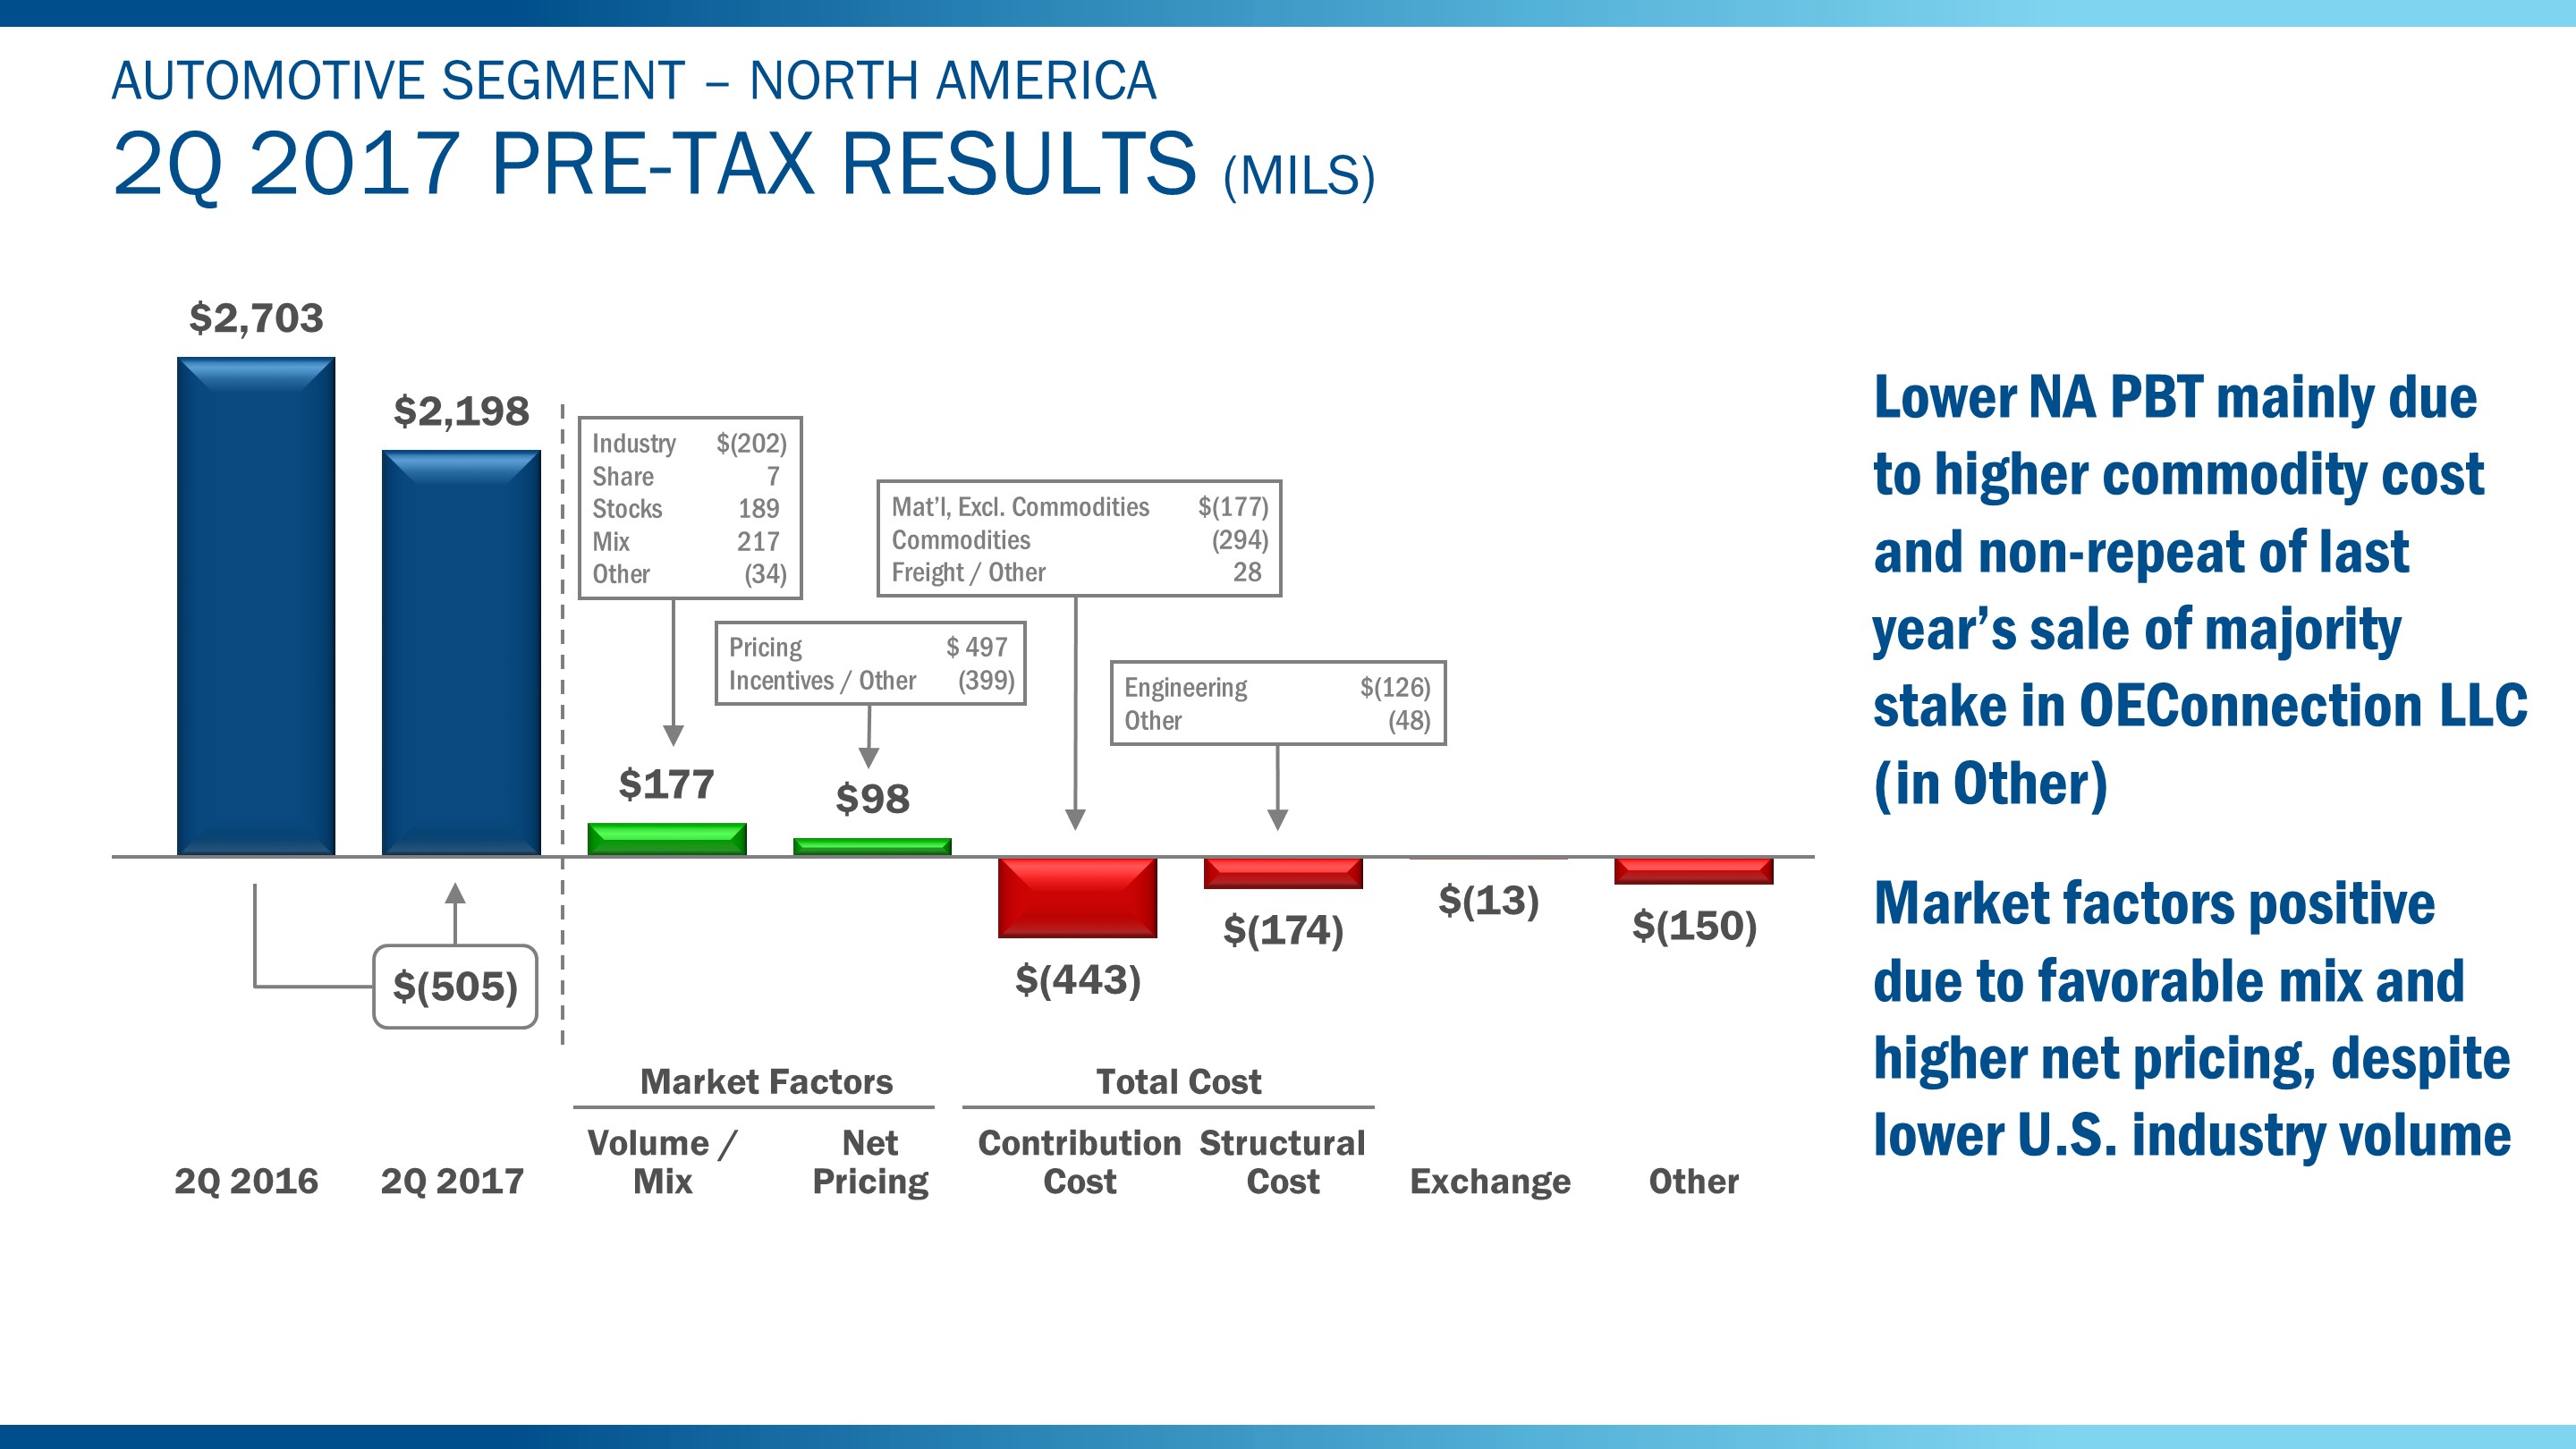
As shown above, North America's pre-tax profit was $505 million lower than a year ago, reflecting mainly higher commodity cost and the non-repeat of last year's gain on the sale of a majority of our stake in OEConnection LLC.
Market factors were positive due to favorable mix and higher net pricing. The mix reflects primarily the continued strength of F-Series.
For 2017, we continue to expect North America operating margin and profit to be lower than 2016, mainly due to higher commodity cost and increased engineering expense, mainly for utility and autonomous vehicles. Exchange is also expected to be unfavorable.
40
Item 2. Management's Discussion and Analysis of Financial Condition and Results of Operations (Continued)
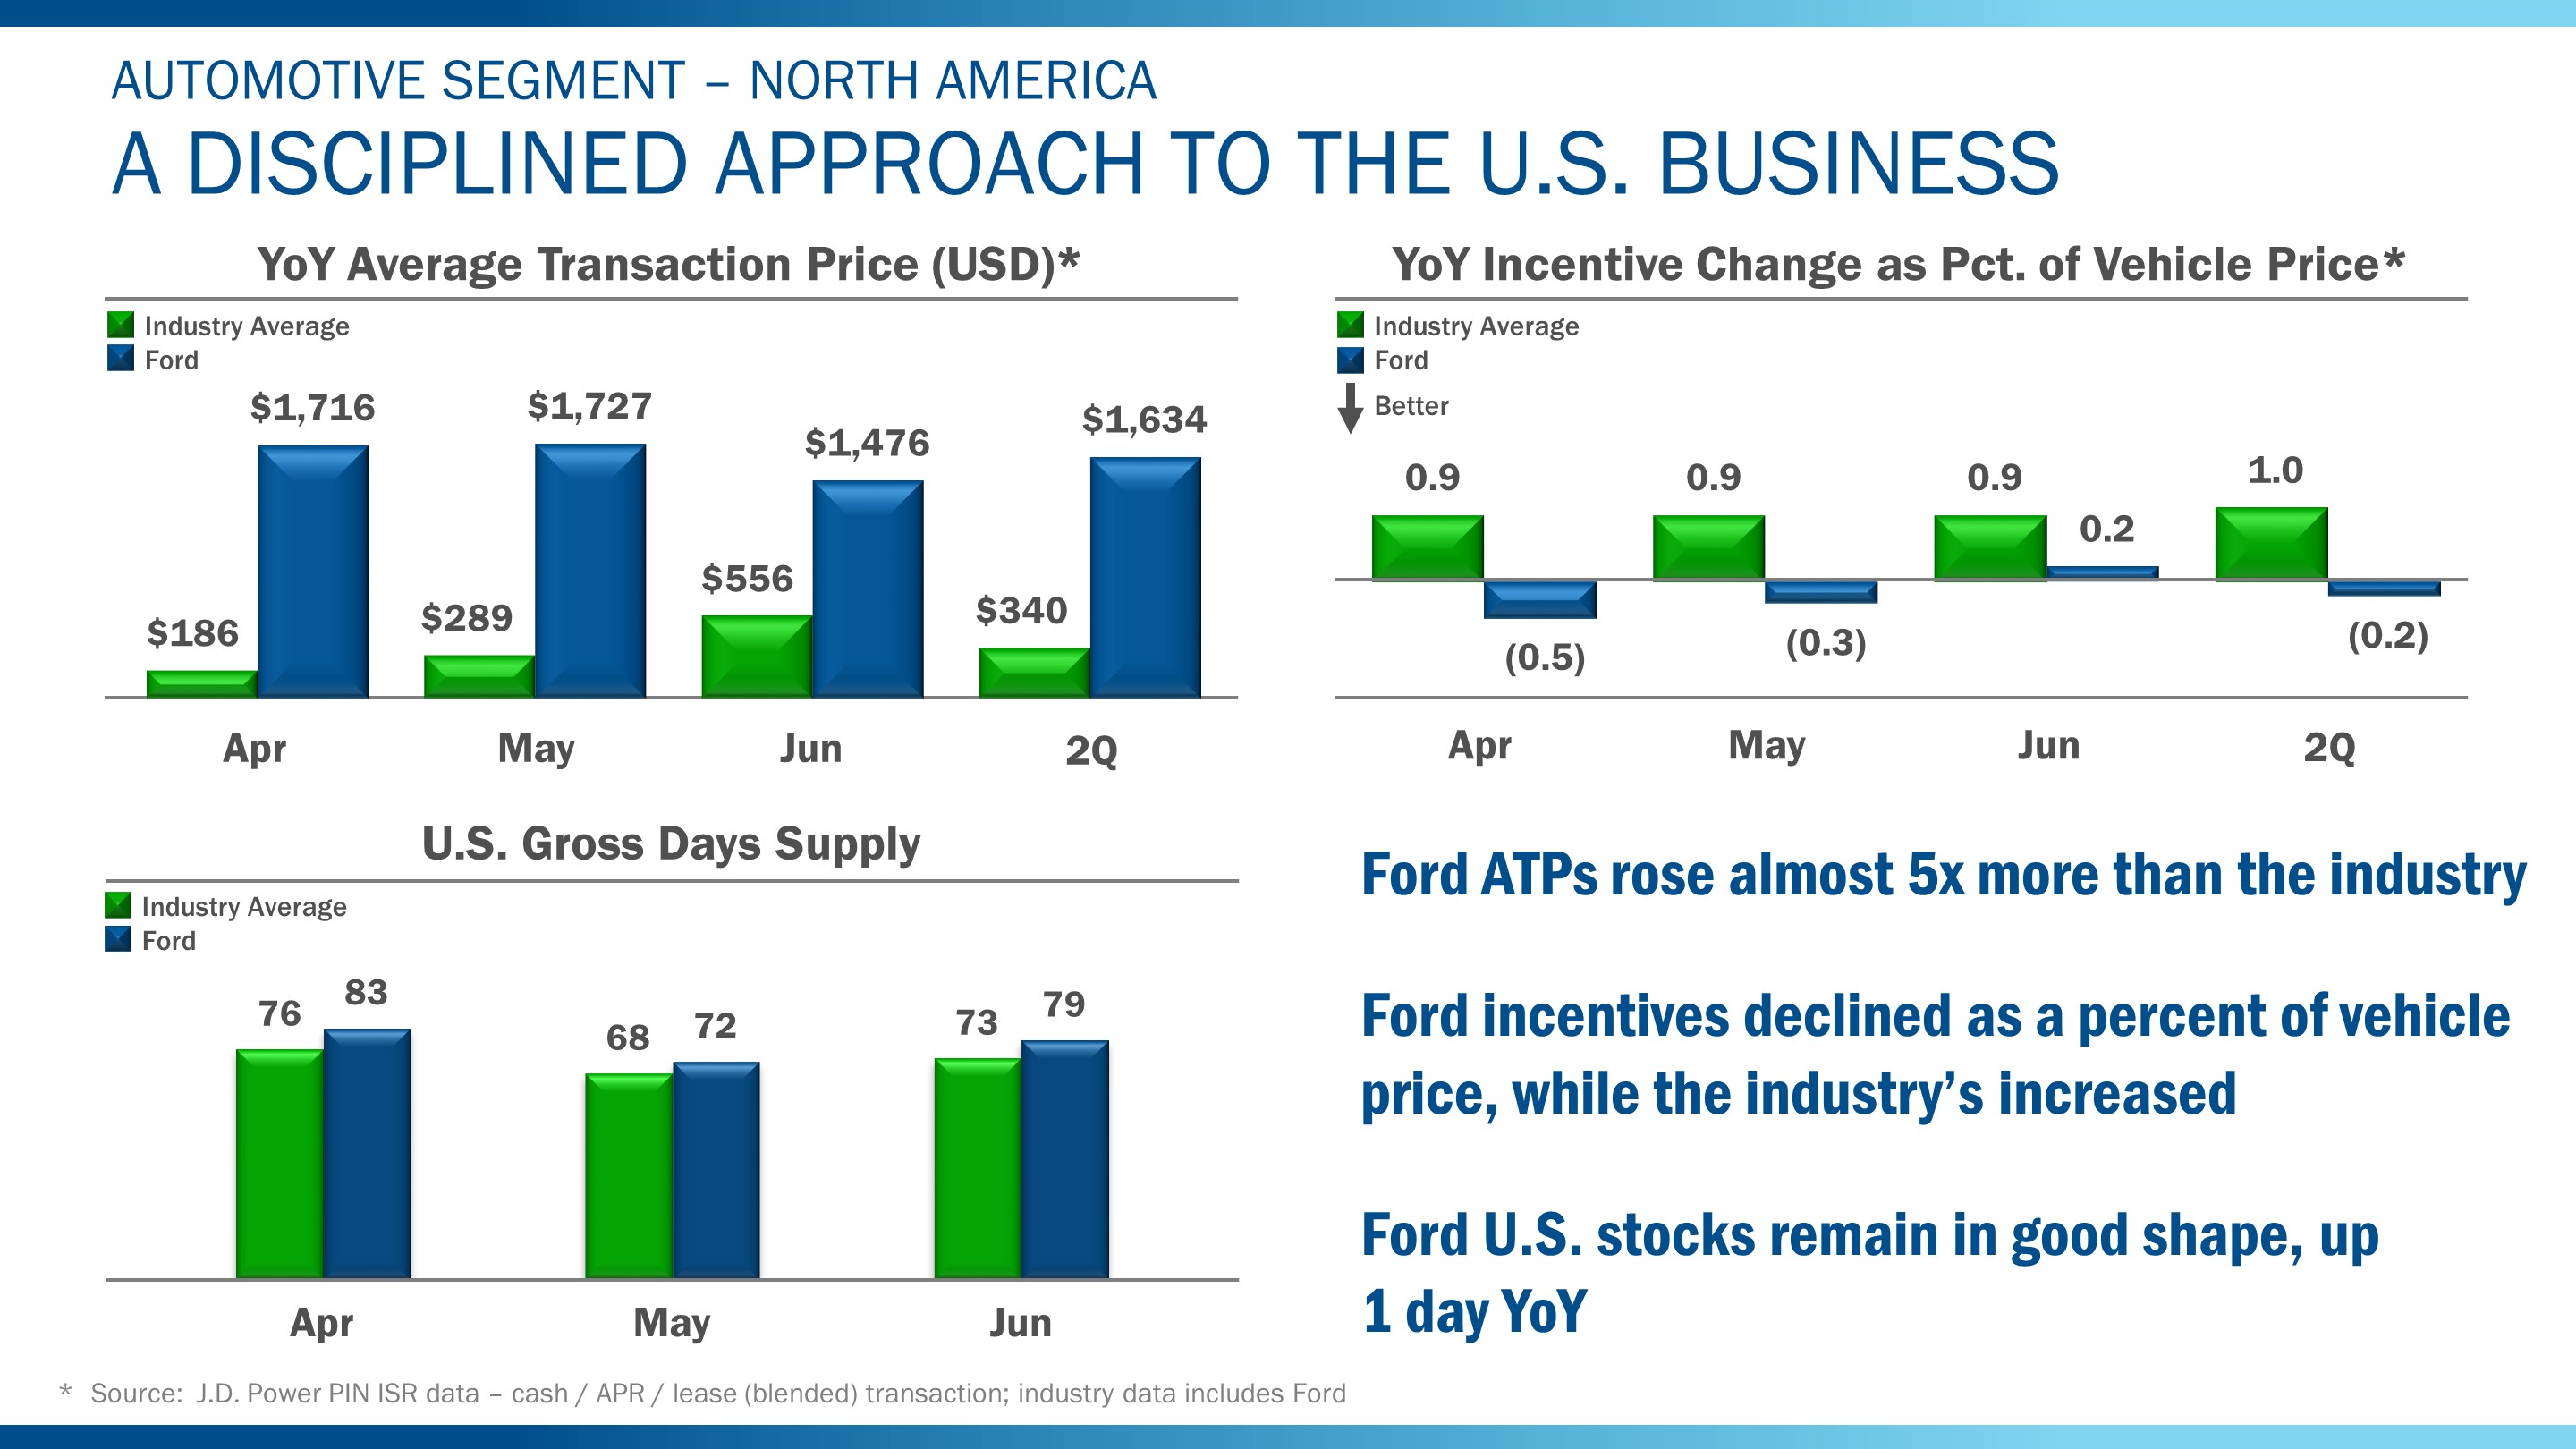
As shown above, the metrics continue to demonstrate the disciplined approach we take to our business. This is true everywhere we operate, but highlighted here for North America.
Our year-over-year average transaction price in the U.S. in the second quarter of 2017 grew nearly five times faster than the industry due to the strength of F-Series. In the quarter, F-Series transaction prices were up over $3,100 per unit compared to a year ago, outpacing the overall segment increase of $1,400 per unit, reflecting strong customer demand for high-level trim series on both Super Duty and F-150, including the Raptor.
We also continued our disciplined approach to incentives. While industry incentives as a percent of vehicle price were up in the second quarter, our levels were slightly lower as we managed supply and demand well and benefited from the strength of our products.
Our U.S. stocks remain in good shape and we continue to take a disciplined approach to match supply to demand.
Ford's days supply tend to be slightly higher than industry average because of our stronger position in trucks and the associated larger number of product configurations we offer, a Ford strength.
41
Item 2. Management's Discussion and Analysis of Financial Condition and Results of Operations (Continued)
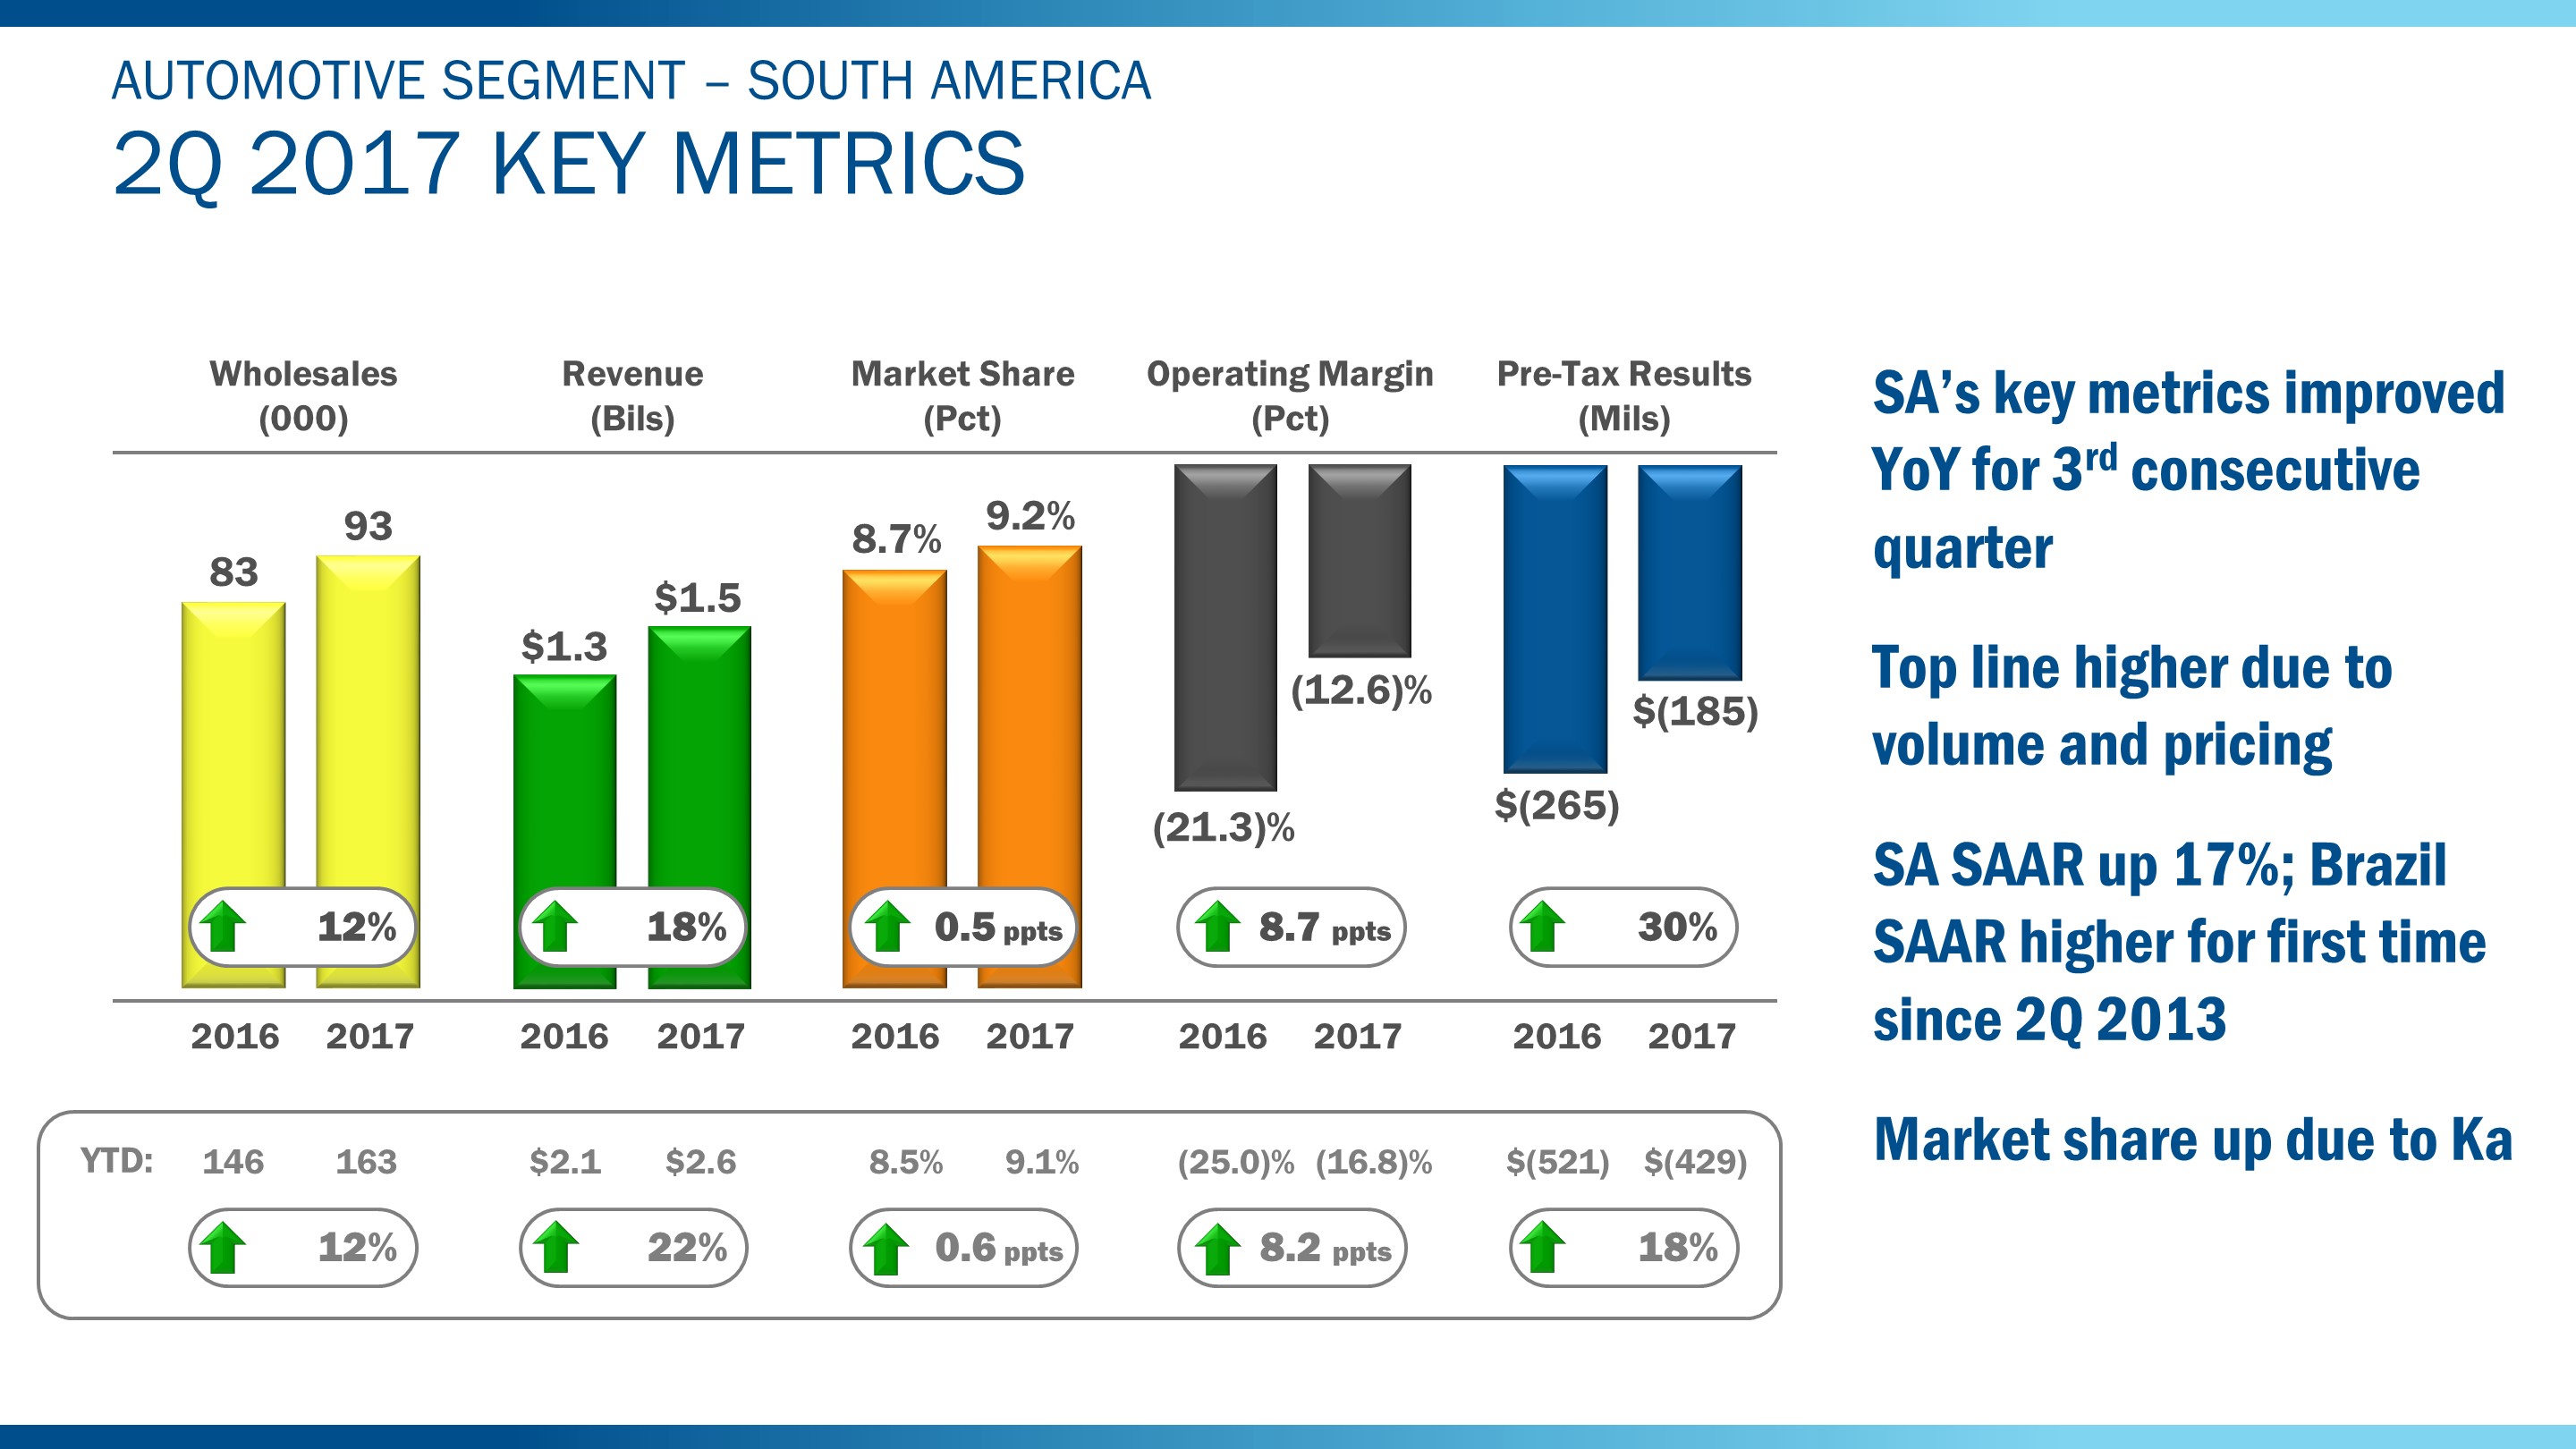
All key metrics for South America in the second quarter of 2017 improved from a year ago -- our third consecutive quarter of improvement across the board.
The top-line improved with wholesale volume up 12% and revenue up 18%. The higher volume was driven by higher industry and improved market share, while the higher revenue was due to the volume increase and higher pricing.
Industry SAAR for the region, at 4.2 million units, was up 17%, or 600,000 units. Brazil SAAR, at 2.3 million units, was up 15%, or 300,000 units. The increase was the first quarterly year-over-year improvement in Brazil in four years.
Our market share for the region, at 9.2%, was up five-tenths of a percentage point due to strong sales of Ka.
Operating margin and pre-tax results for the region both improved sharply from a year ago.
As shown below the chart, each of South America's key metrics improved significantly in the first half from a year ago.
42
Item 2. Management's Discussion and Analysis of Financial Condition and Results of Operations (Continued)
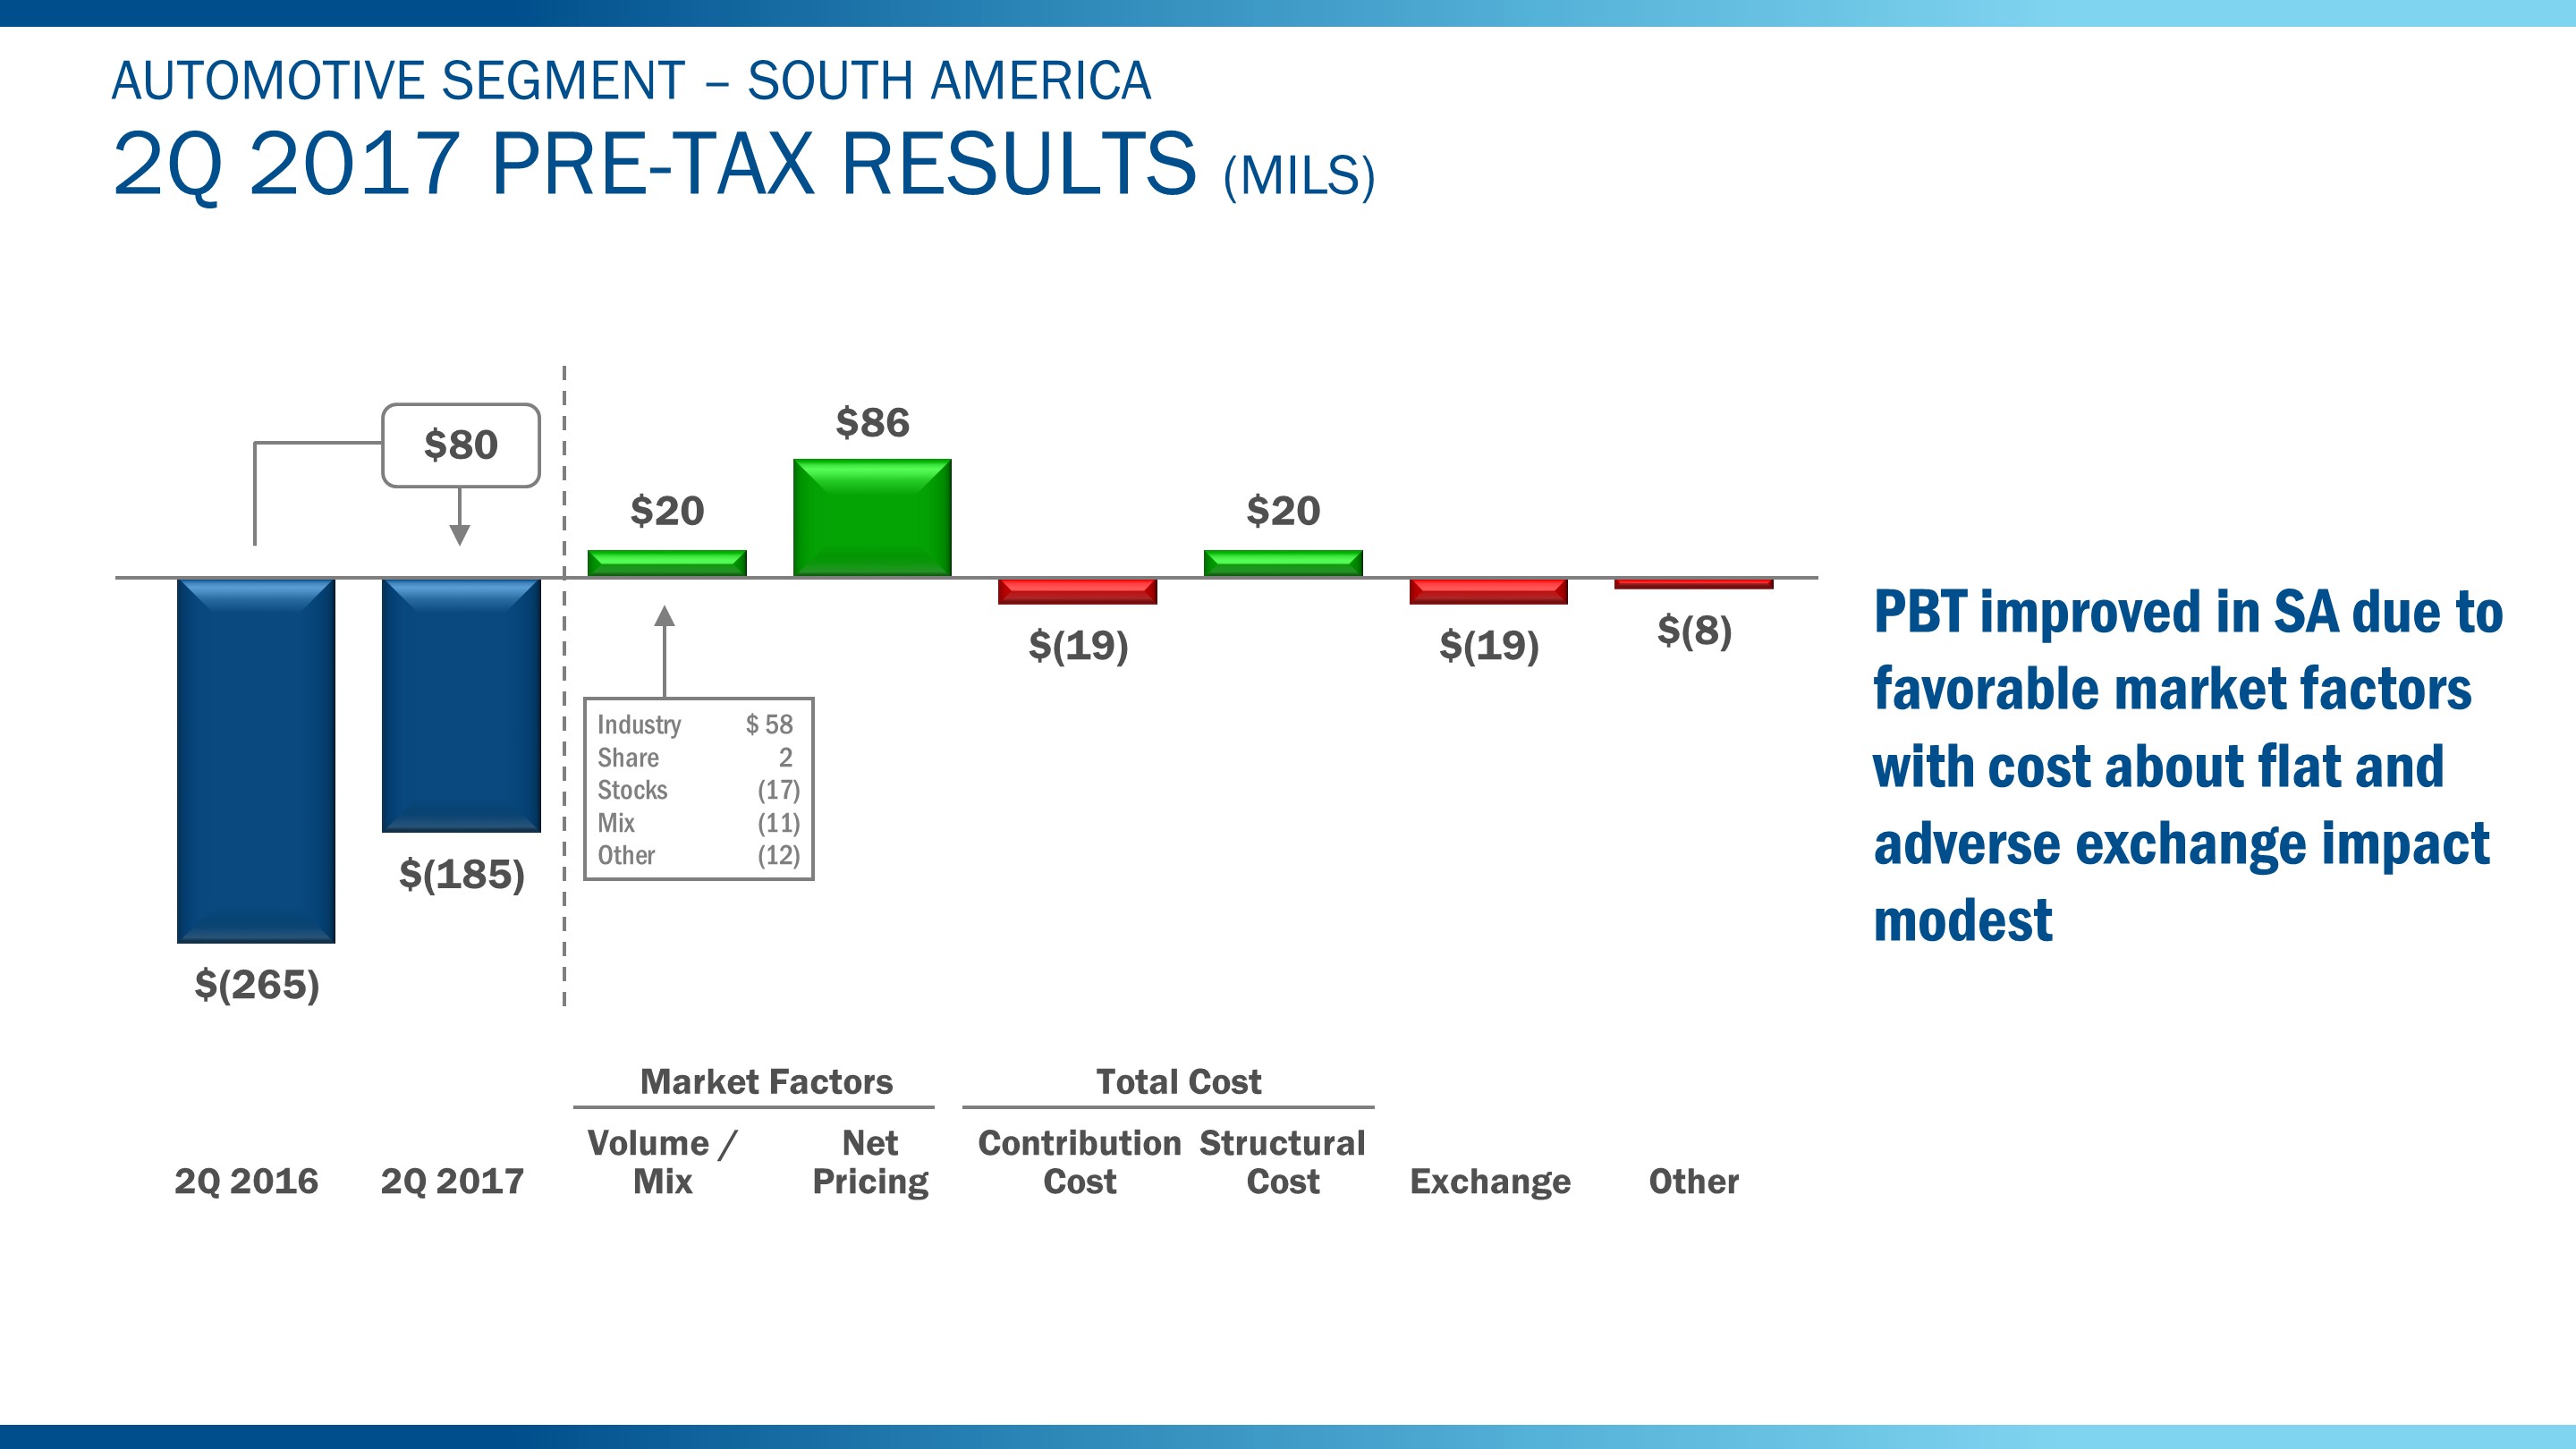
As shown above, South America's second quarter 2017 pre-tax result improved $80 million compared to a year ago due to higher net pricing and volume.
Total cost was about flat as we continued to improve the fitness of our business while inflation and exchange effects moderated.
For 2017, we continue to expect South America's loss to improve from last year as a result of favorable market factors as the economy continues to recover. We expect most of the full year improvement to occur in the second half as the economy gains momentum.
43
Item 2. Management's Discussion and Analysis of Financial Condition and Results of Operations (Continued)
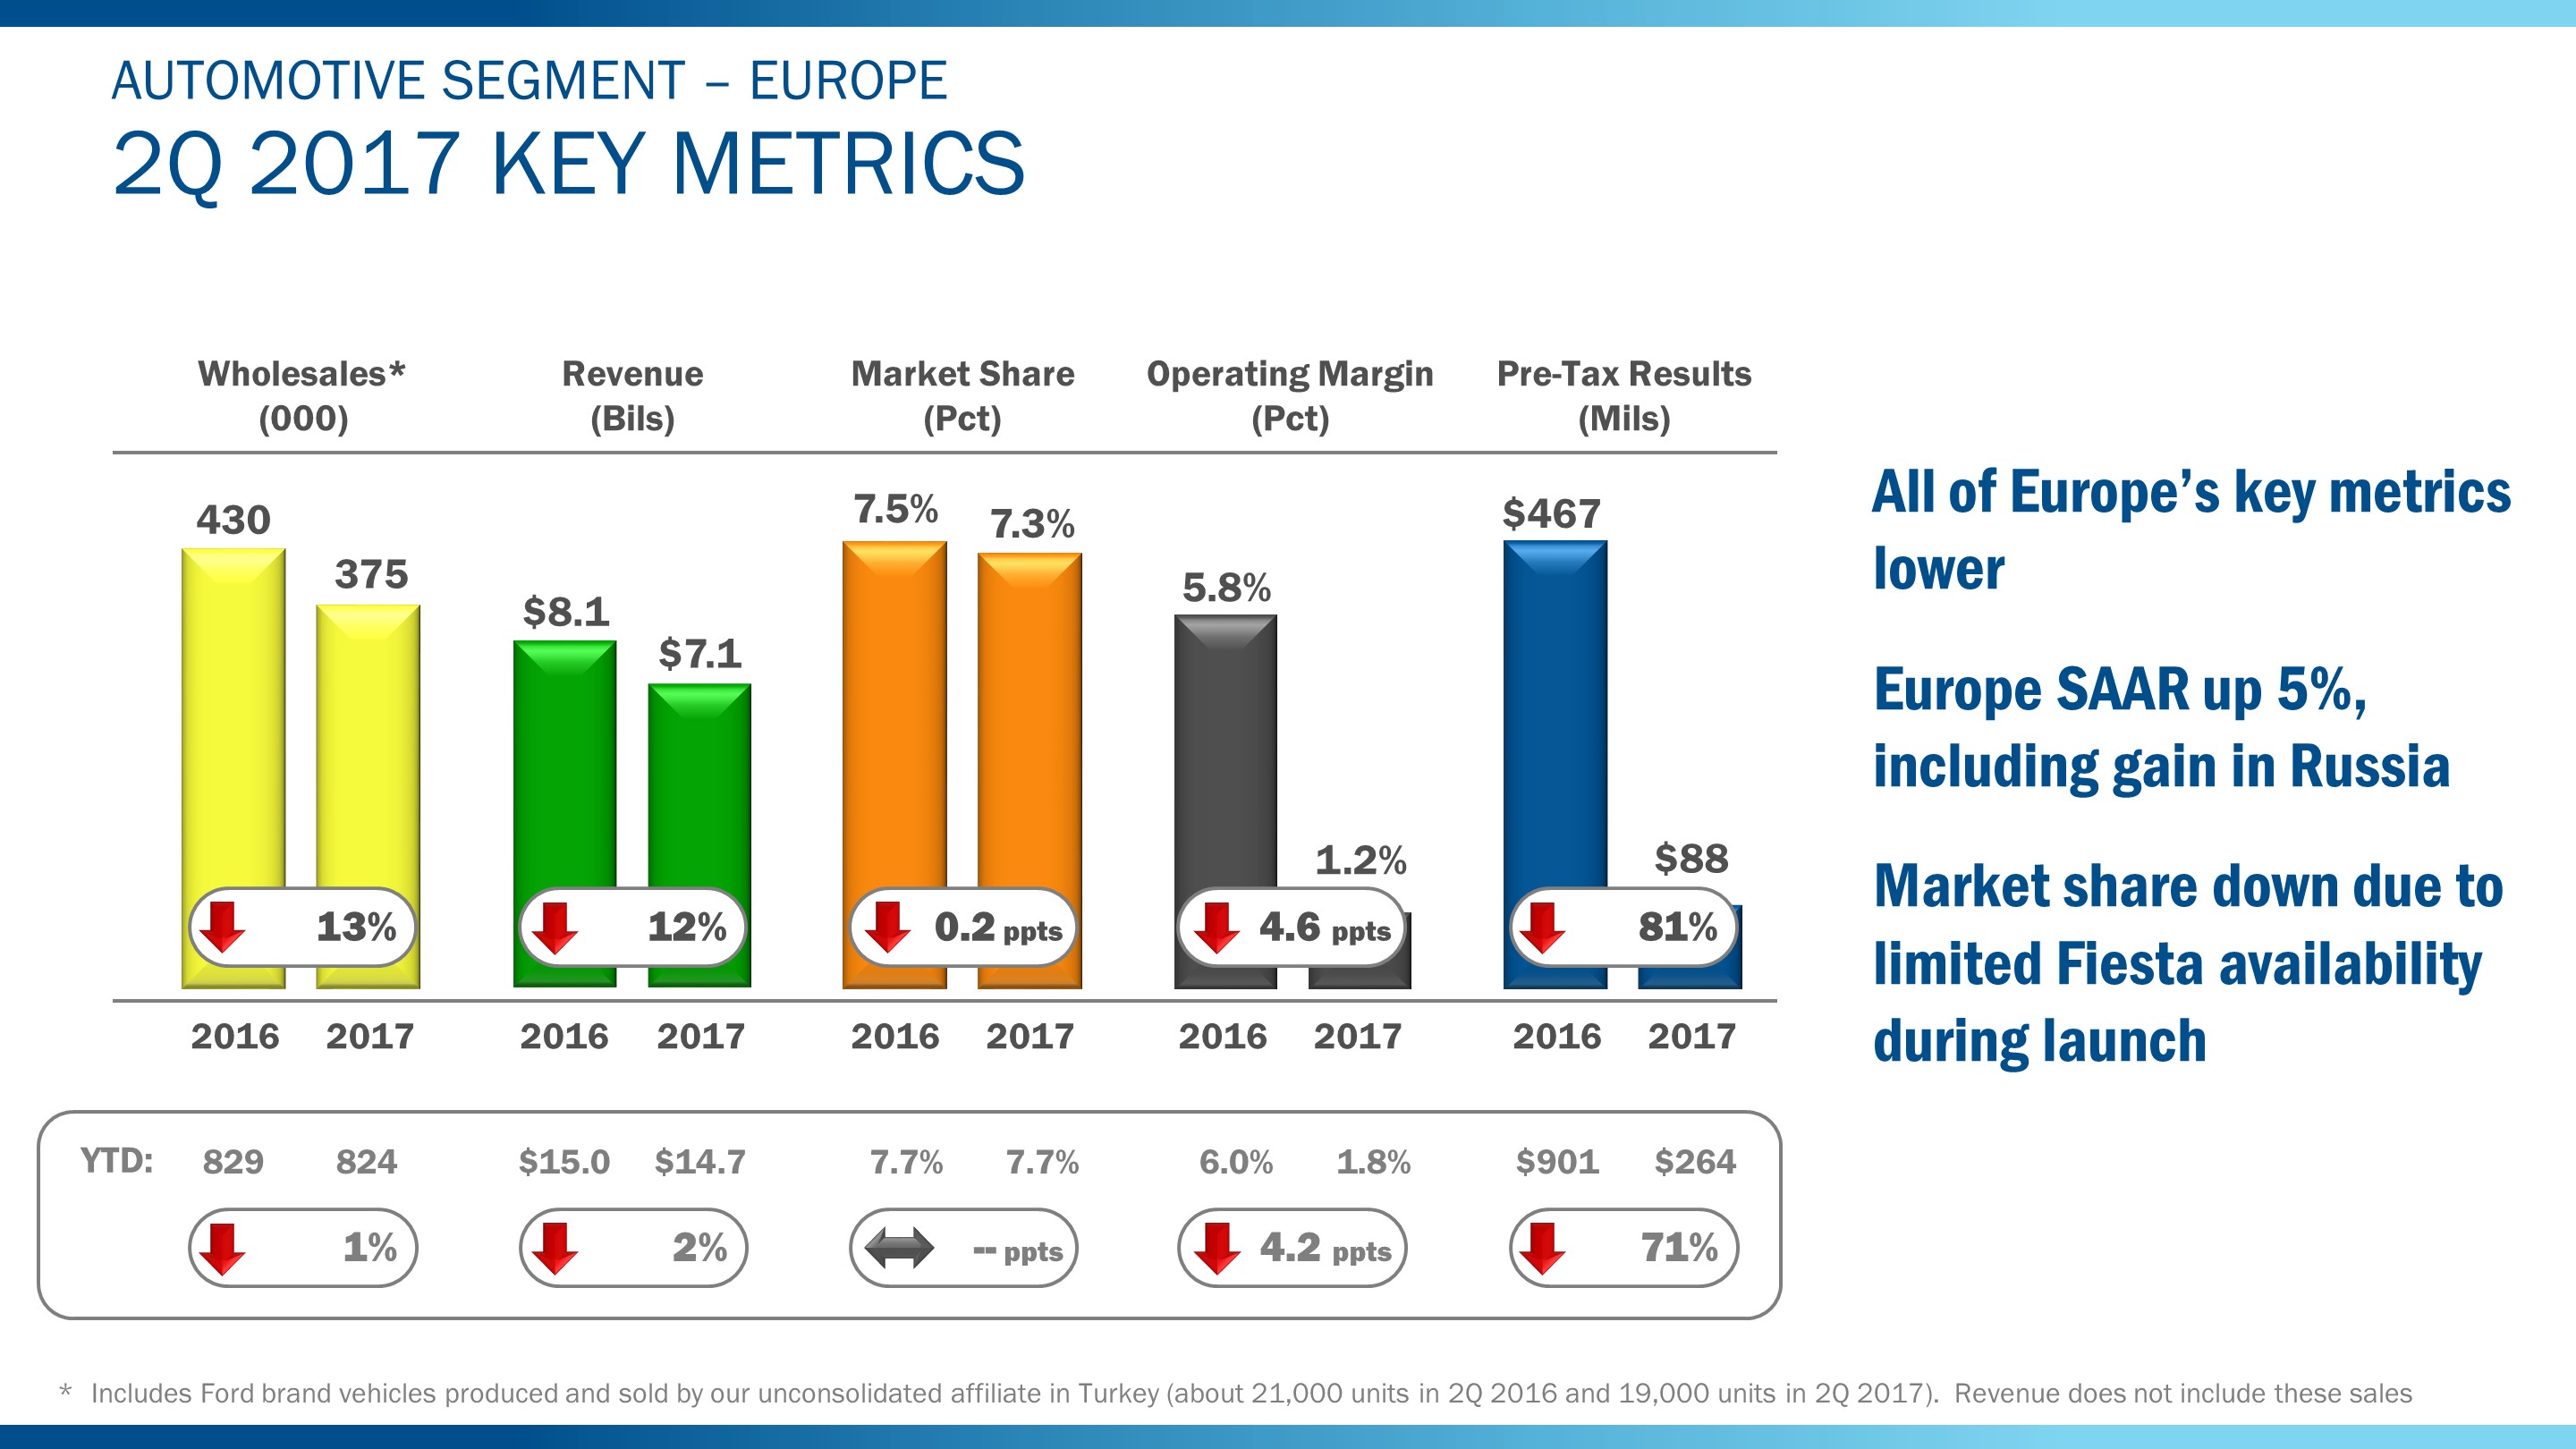
Shown above are the second quarter 2017 key metrics for Europe. We delivered our ninth consecutive quarterly profit, but all key metrics were lower.
The top line declined with wholesale volume down 13% and revenue down 12% from a year ago. The lower wholesales were driven by a decrease in dealer stocks this quarter compared to an increase a year ago. This reflects the launch effect of the all-new Fiesta. The lower revenue was driven by the lower volume and adverse exchange.
Europe SAAR, at 20.7 million units, was 5% higher than a year ago, including the first quarterly year-over-year improvement in Russia since fourth quarter of 2012.
Market share, at 7.3%, was down two-tenths of a percentage point, driven by Fiesta. Commercial vehicle share improved, and Ford remained Europe's best-selling commercial vehicle brand in the second quarter.
Europe's operating margin was 1.2% and pre-tax profit was $88 million, both lower than a year ago.
As shown below the chart, our year-to-date market share was flat compared to a year ago. Top line metrics were down modestly, while operating margin and profit were down more sharply.
44
Item 2. Management's Discussion and Analysis of Financial Condition and Results of Operations (Continued)
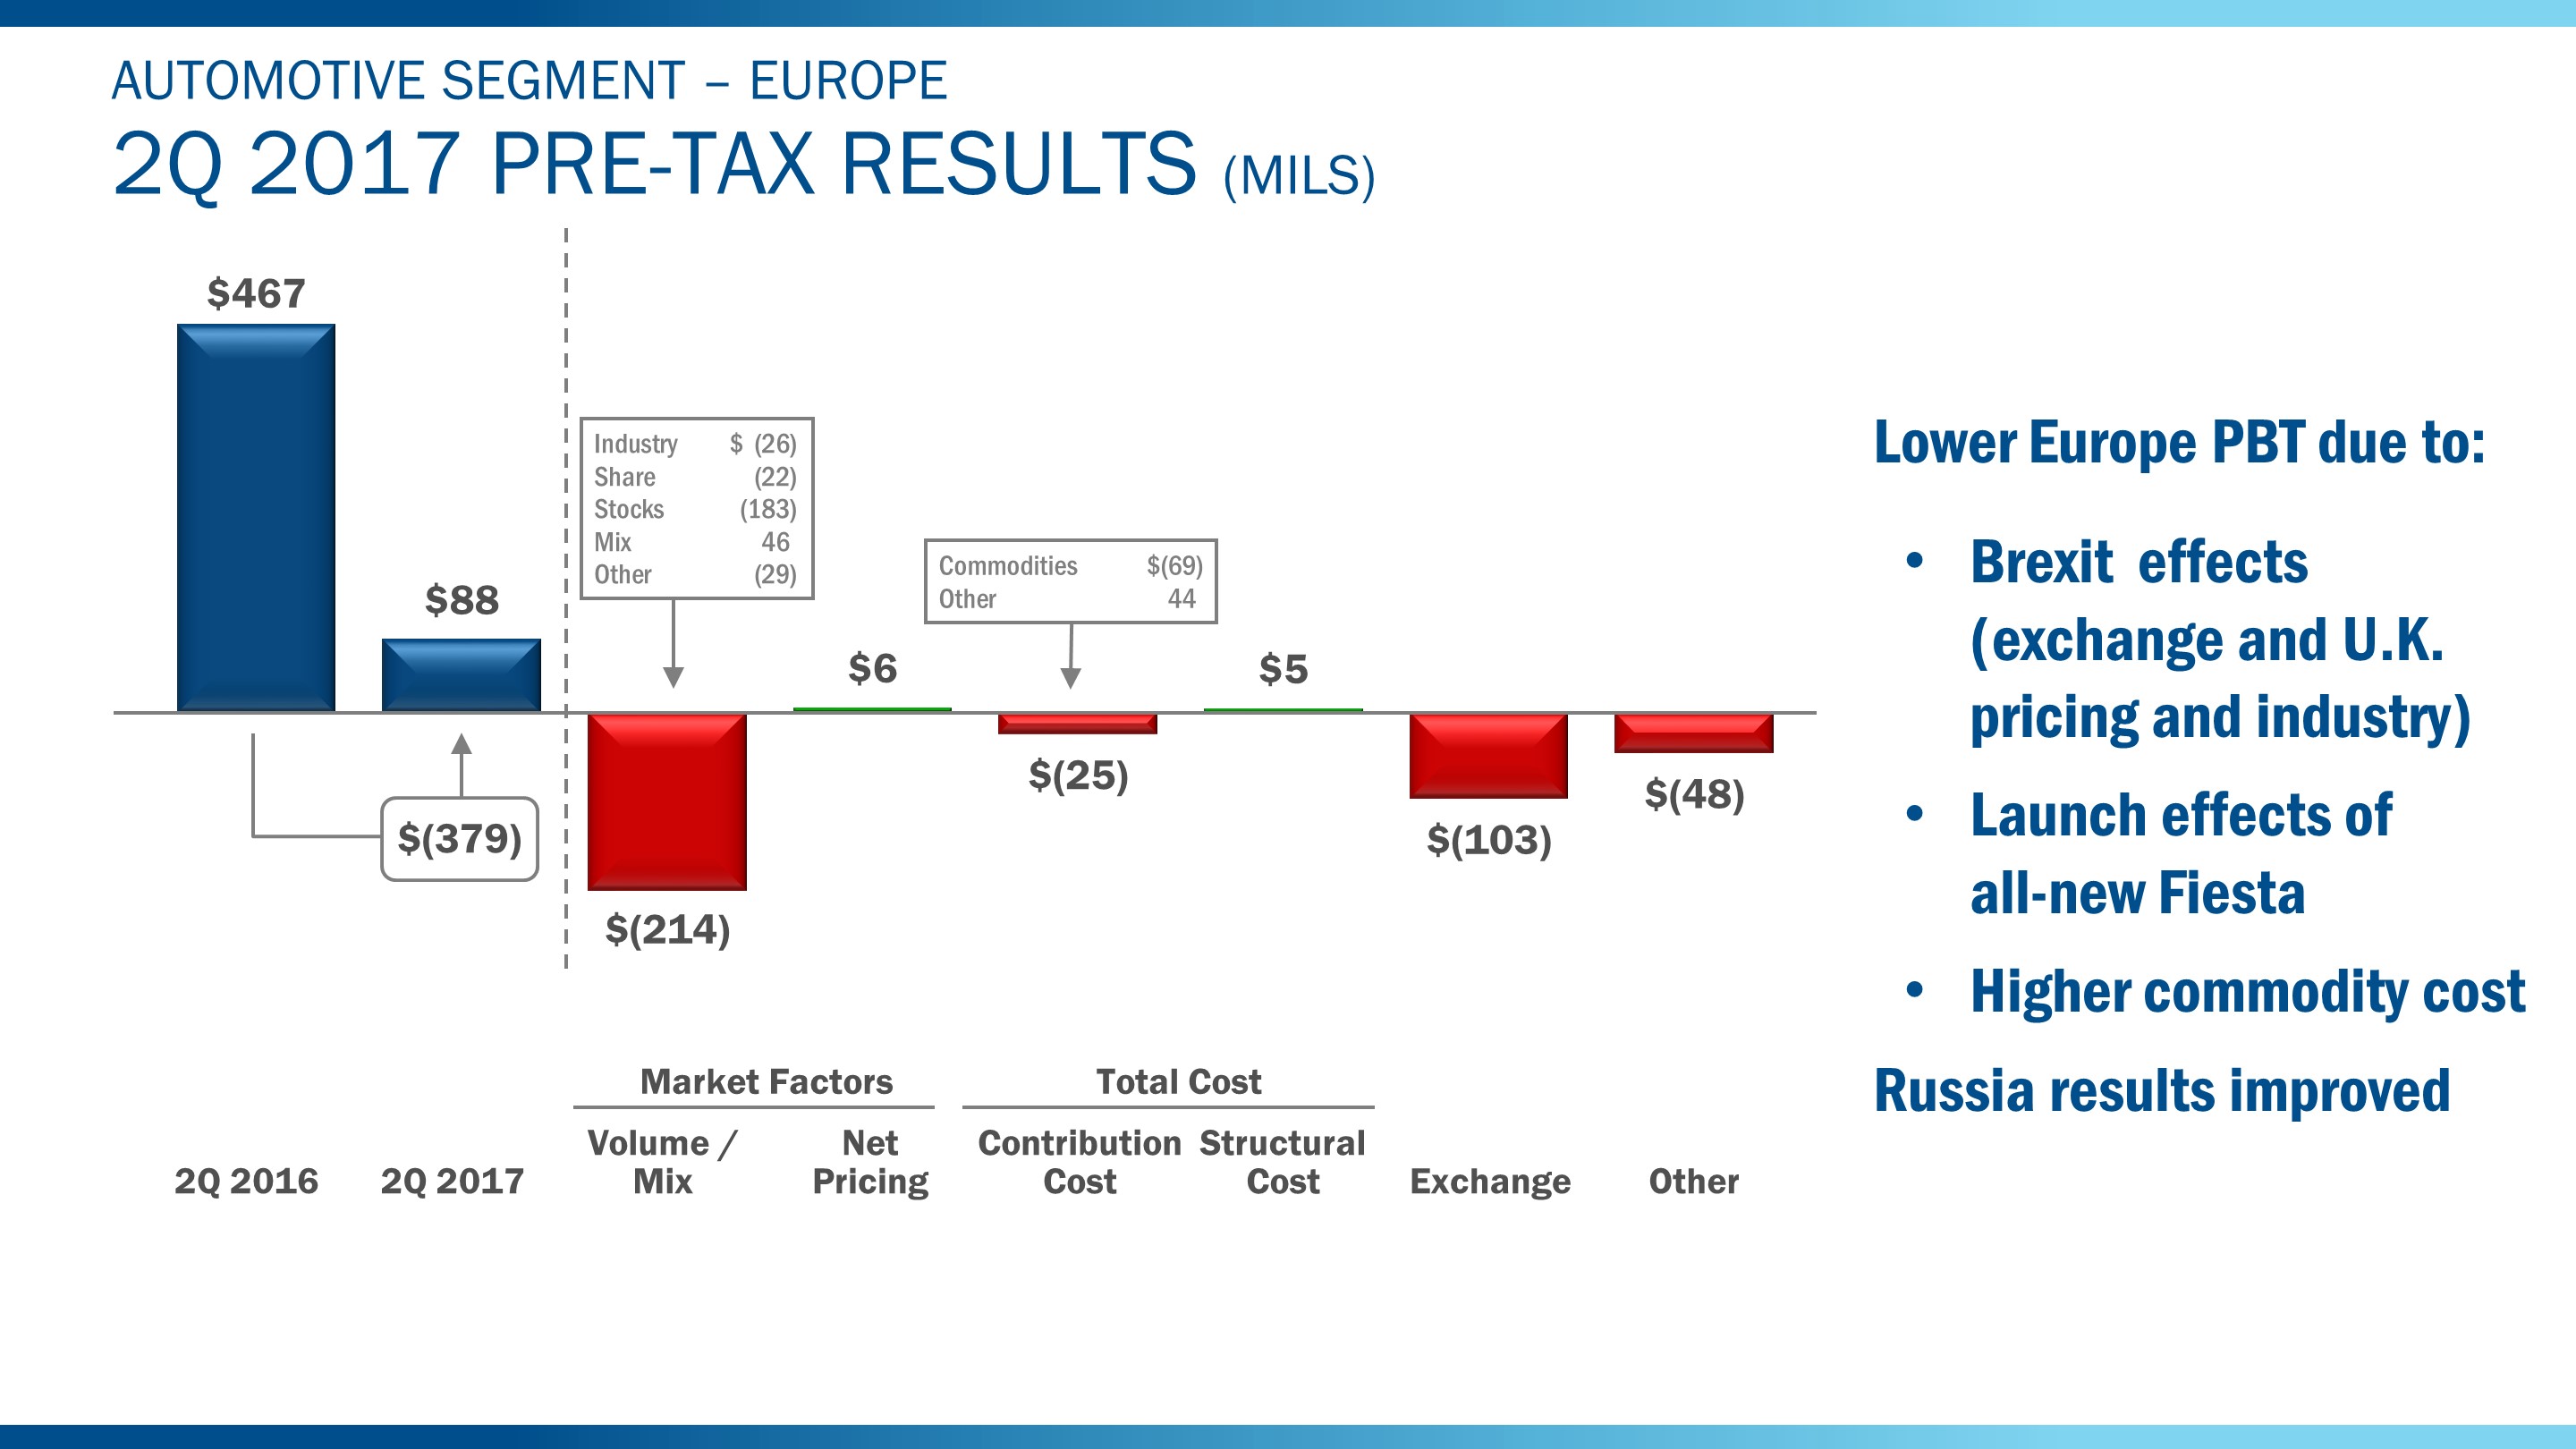
Europe's second quarter 2017 pre-tax profit was $379 million lower than a year ago, reflecting the weaker sterling and lower U.K. industry resulting from Brexit, the launch effects of the all-new Fiesta, and higher commodity cost.
Although not shown, results in Russia continued to improve.
For 2017, we continue to expect Europe to remain profitable, although at levels below 2016. This is due mainly to Brexit effects and higher commodity cost. Favorable market factors and continued improvement in Russia will be a partial offset.
45
Item 2. Management's Discussion and Analysis of Financial Condition and Results of Operations (Continued)
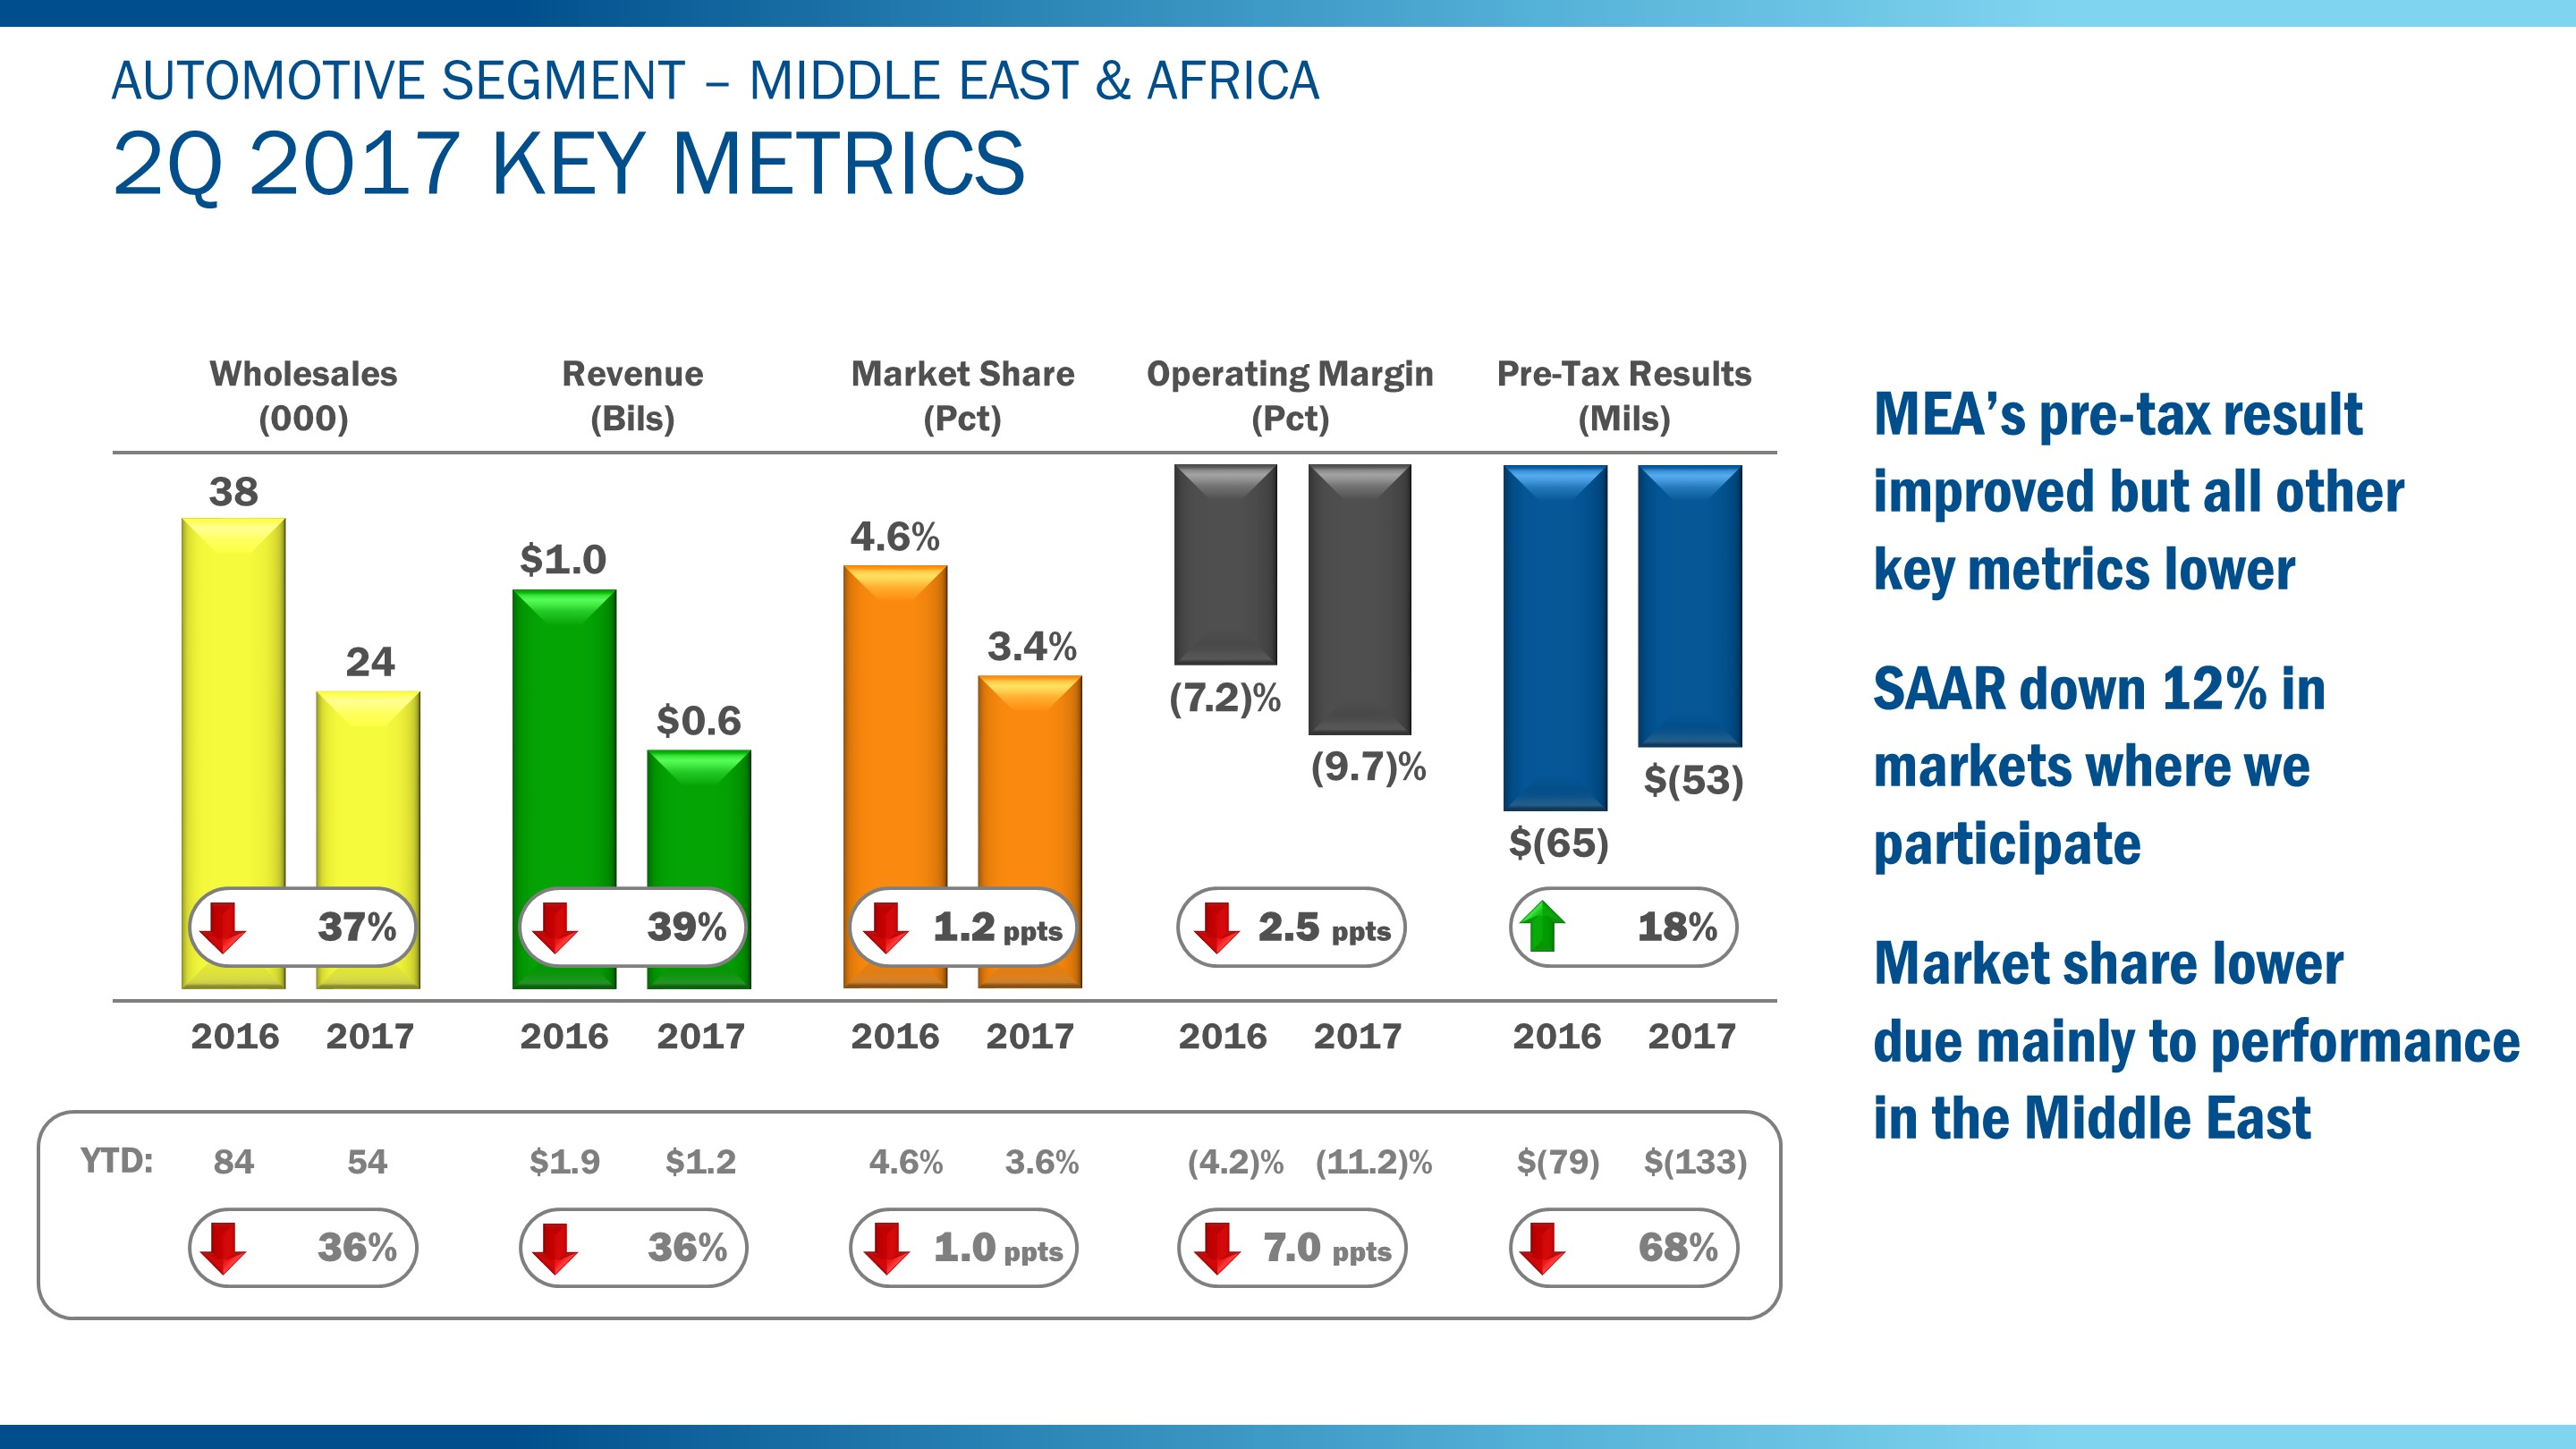
Shown above are the key metrics for Middle East & Africa for the second quarter of 2017, where our pre-tax result improved from a year ago despite declines in all other key metrics.
The top line was down due to lower wholesale volume, largely reflecting lower share and lower industry in the Middle East.
Industry SAAR for the region, at 3.7 million units, was down 100,000 units from 2016. Within this, the markets where we participate declined 300,000 units.
Our market share was 3.4%, down 1.2 percentage points, mostly reflecting performance in the Middle East.
As shown below chart, each of the key metrics in the first half was lower compared with a year ago because of volume declines as a result of lower industry volume and market performance in the Middle East.
46
Item 2. Management's Discussion and Analysis of Financial Condition and Results of Operations (Continued)
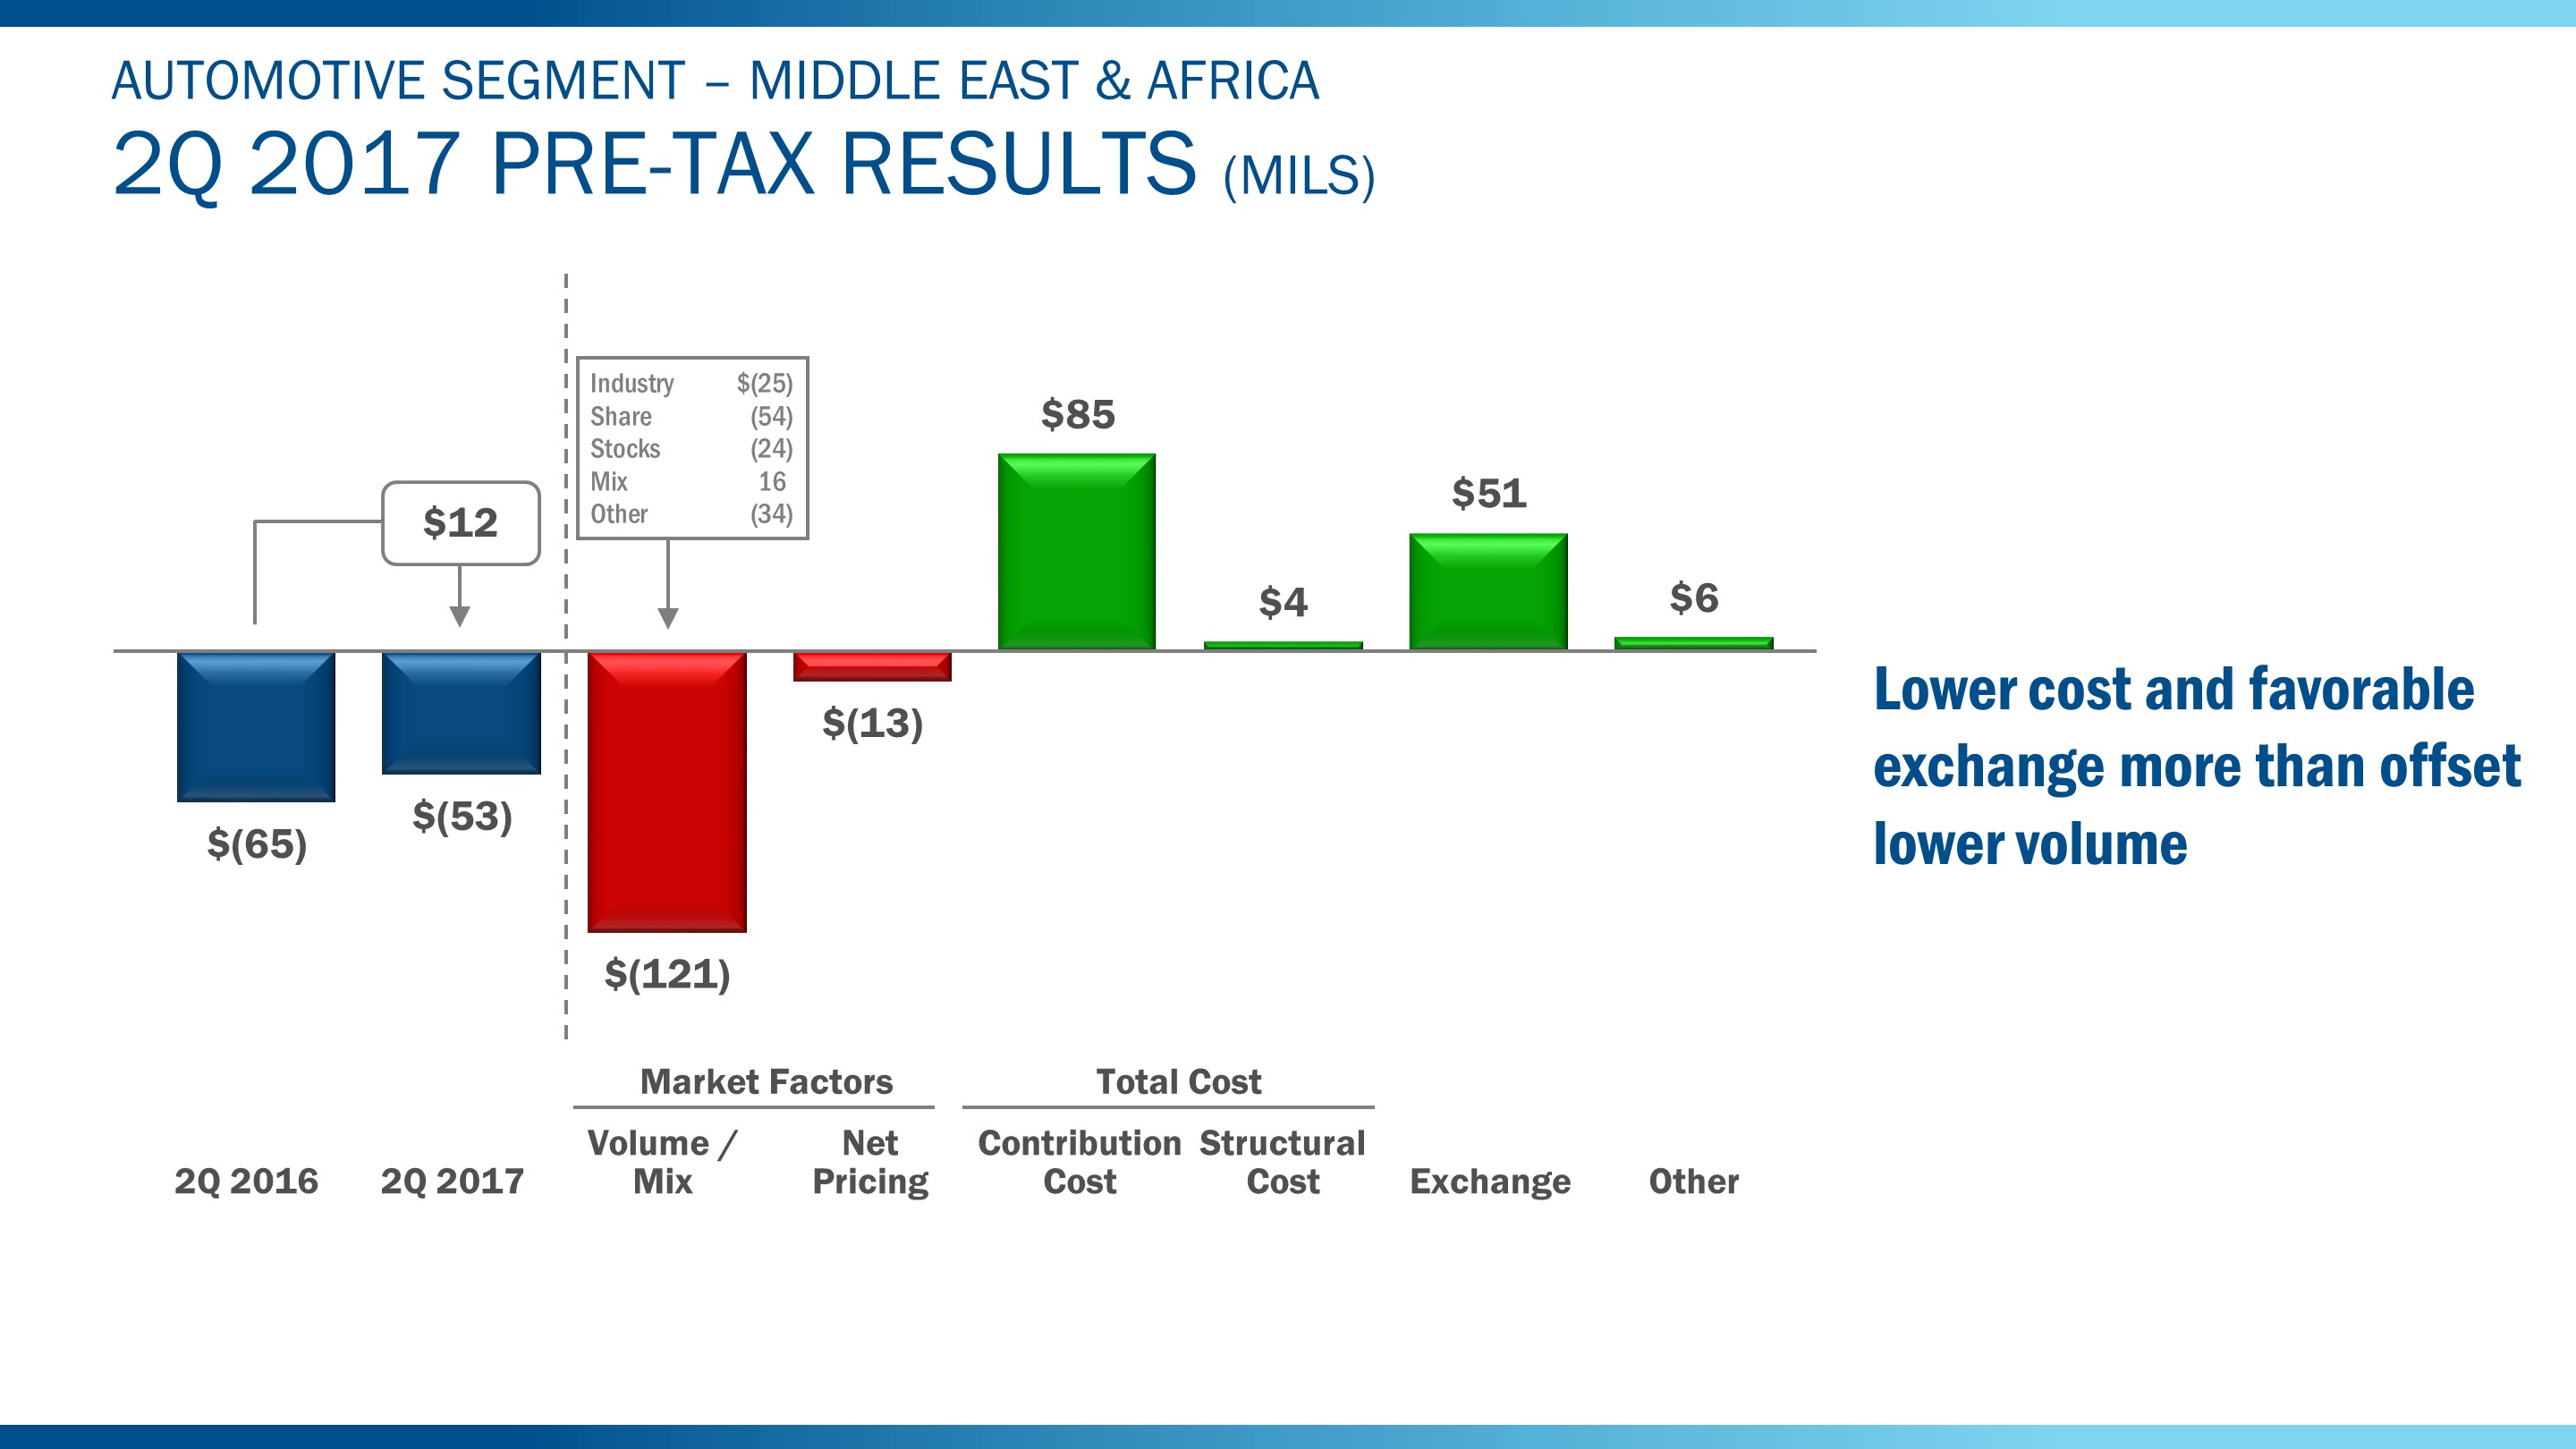
As shown above, Middle East & Africa's second quarter 2017 pre-tax result improved $12 million from a year ago.
The better result was due to favorable cost performance, reflecting mainly lower material and freight and distribution costs, and favorable exchange. This was partially offset by lower volume driven by market performance and lower industry volume in the Middle East, along with related dealer stock adjustments.
For 2017, we continue to expect results in Middle East & Africa to improve compared to 2016 due to lower cost and favorable exchange with lower volume a partial offset.
47
Item 2. Management's Discussion and Analysis of Financial Condition and Results of Operations (Continued)
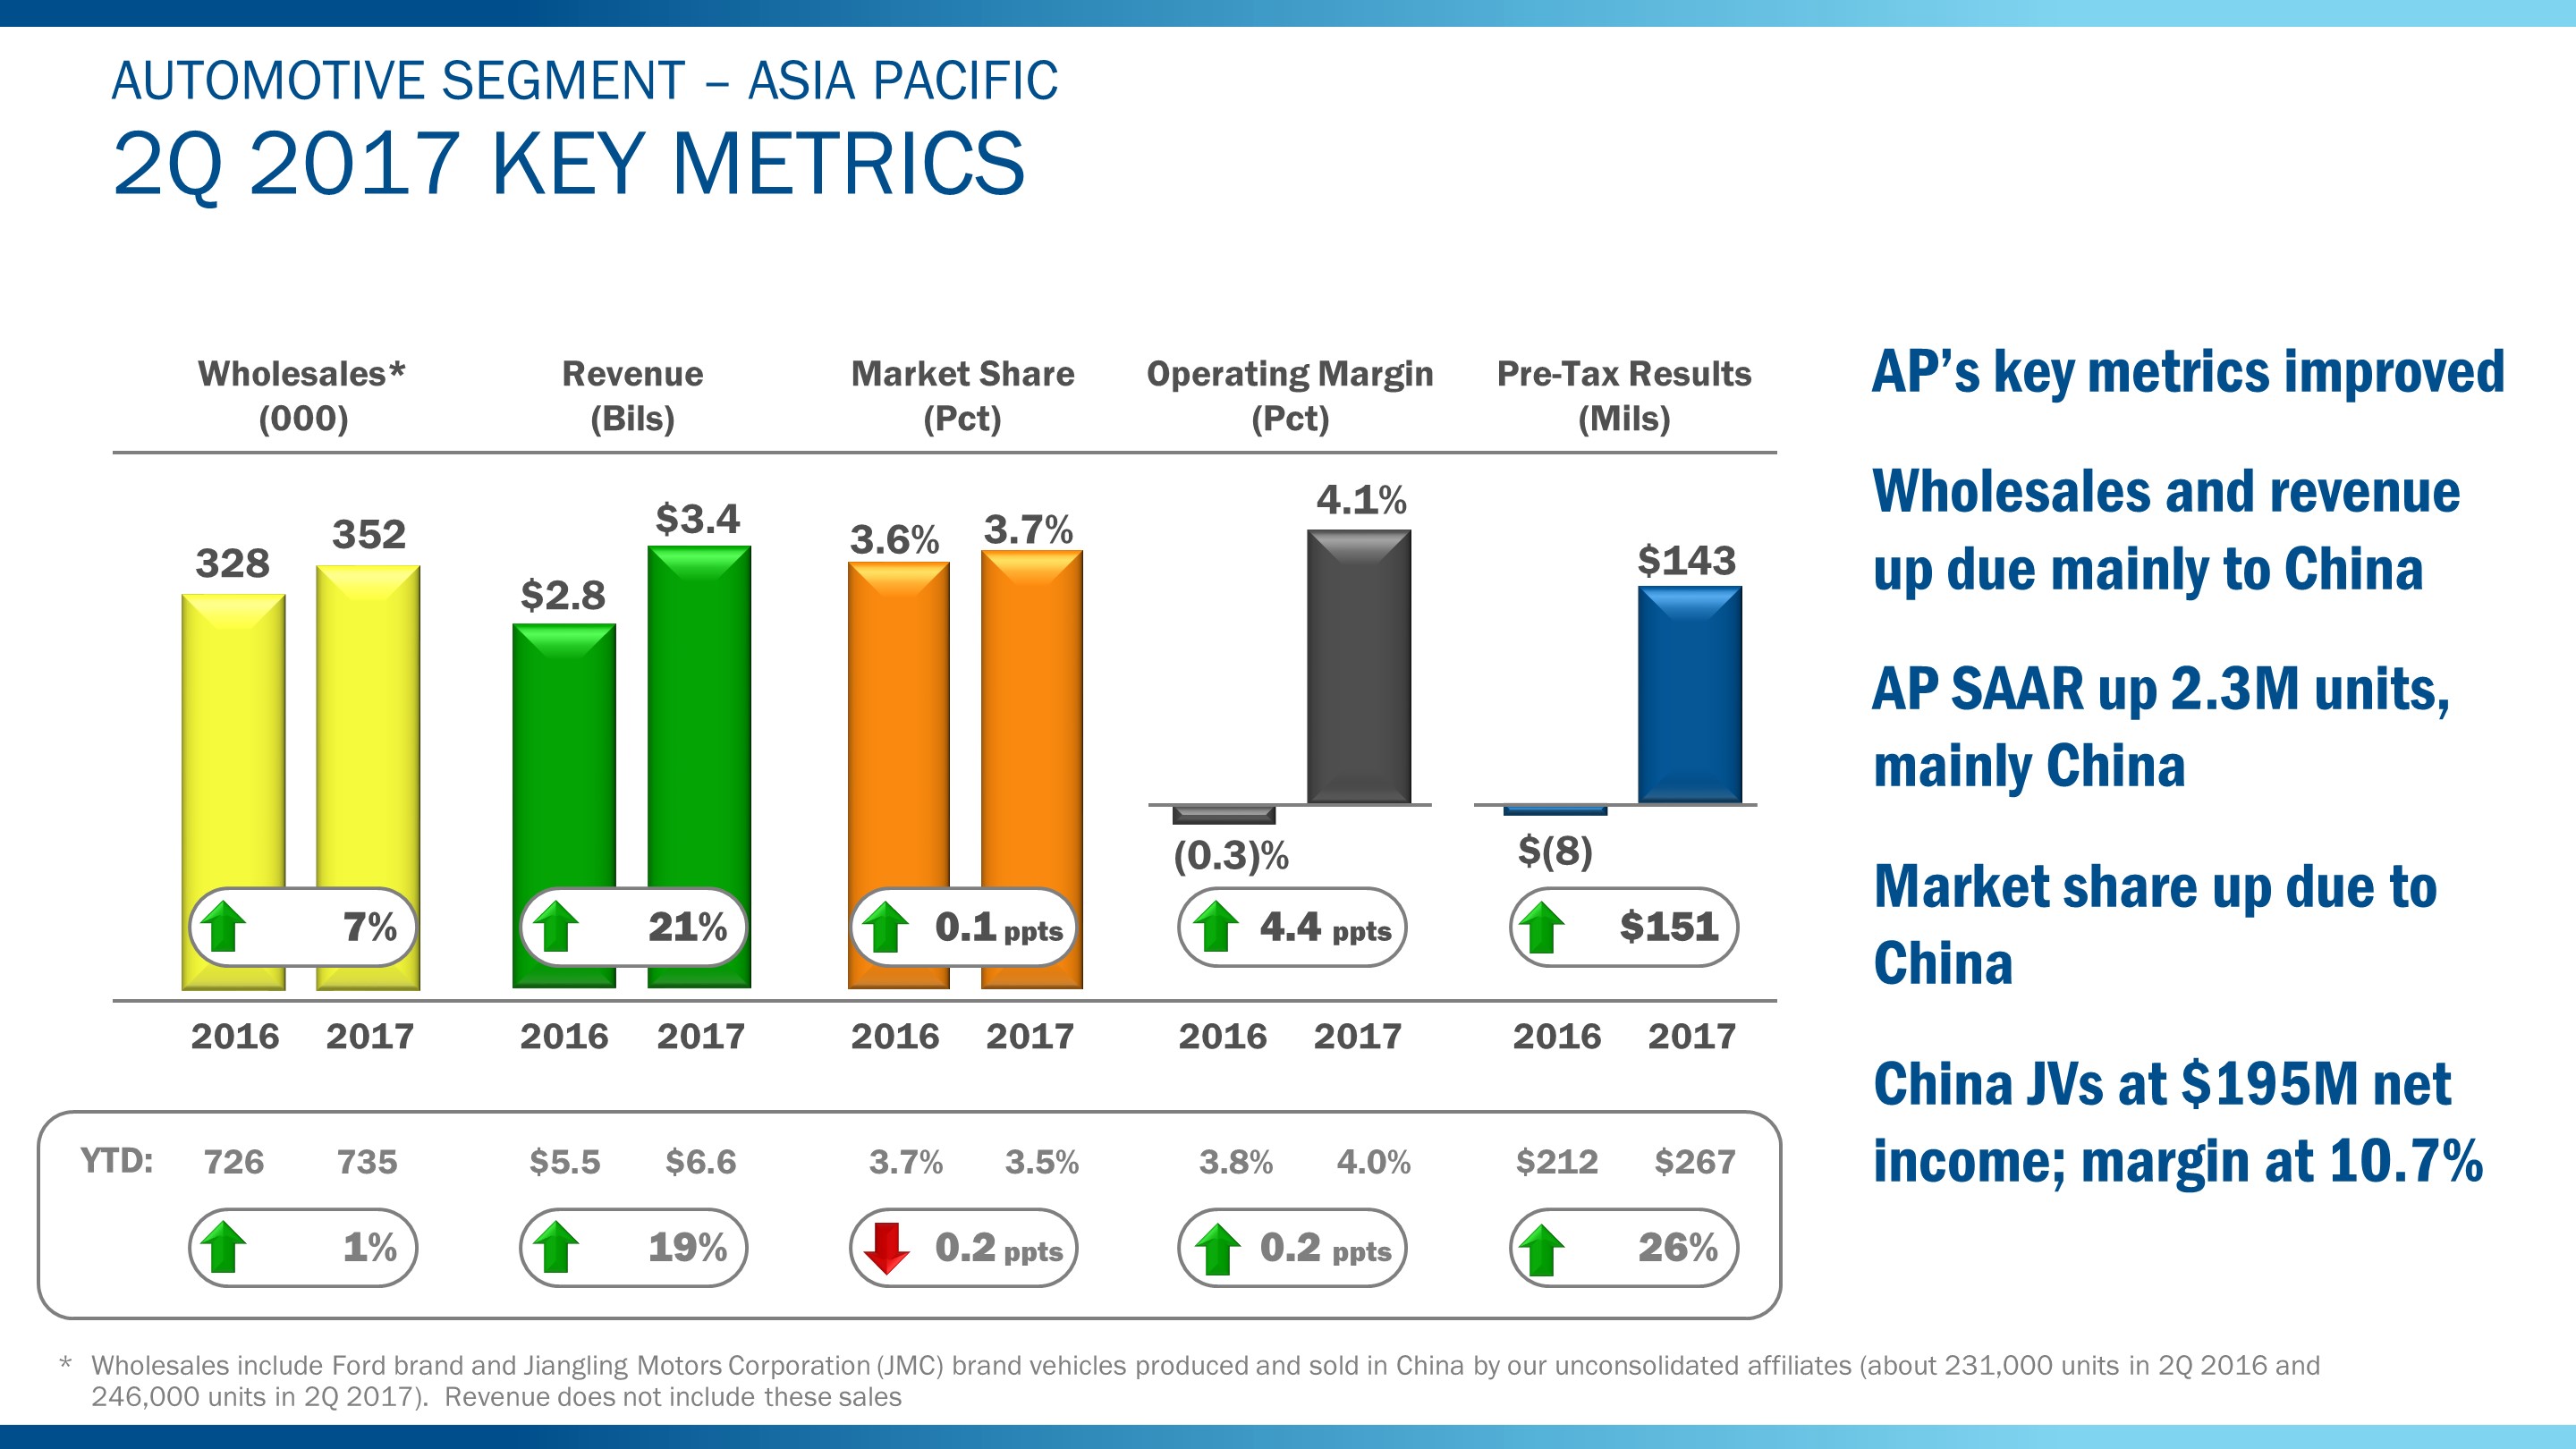
Asia Pacific's second quarter 2017 key metrics are shown above, where we delivered a pre-tax profit of$143 million with all key metrics improving from a year ago.
Wholesale volume increased by 7% and revenue from consolidated operations increased by 21%, reflecting the strength of our full line up of SUVs and continued growth of Lincoln in China.
Asia Pacific SAAR was 43.7 million units, up 2.3 million units, driven by a 1.9 million unit increase in China SAAR, estimated at 27.2 million units.
Asia Pacific market share was 3.7%, up one-tenth of a percentage point due to higher share in China because of strong JMC commercial vehicle gains and Lincoln performance.
Asia Pacific's operating margin and pre-tax profit both increased significantly from a year ago.
In the quarter, our China joint ventures contributed $195 million to pre-tax profit, reflecting our equity share of the JVs' after-tax earnings. This was $101 million lower than last year due mainly to lower investment incentives and unfavorable exchange. Net income margin was 10.7%, down 5.4 percentage points.
As shown below the chart, all key metrics except market share improved in the first half versus a year ago.
48
Item 2. Management's Discussion and Analysis of Financial Condition and Results of Operations (Continued)
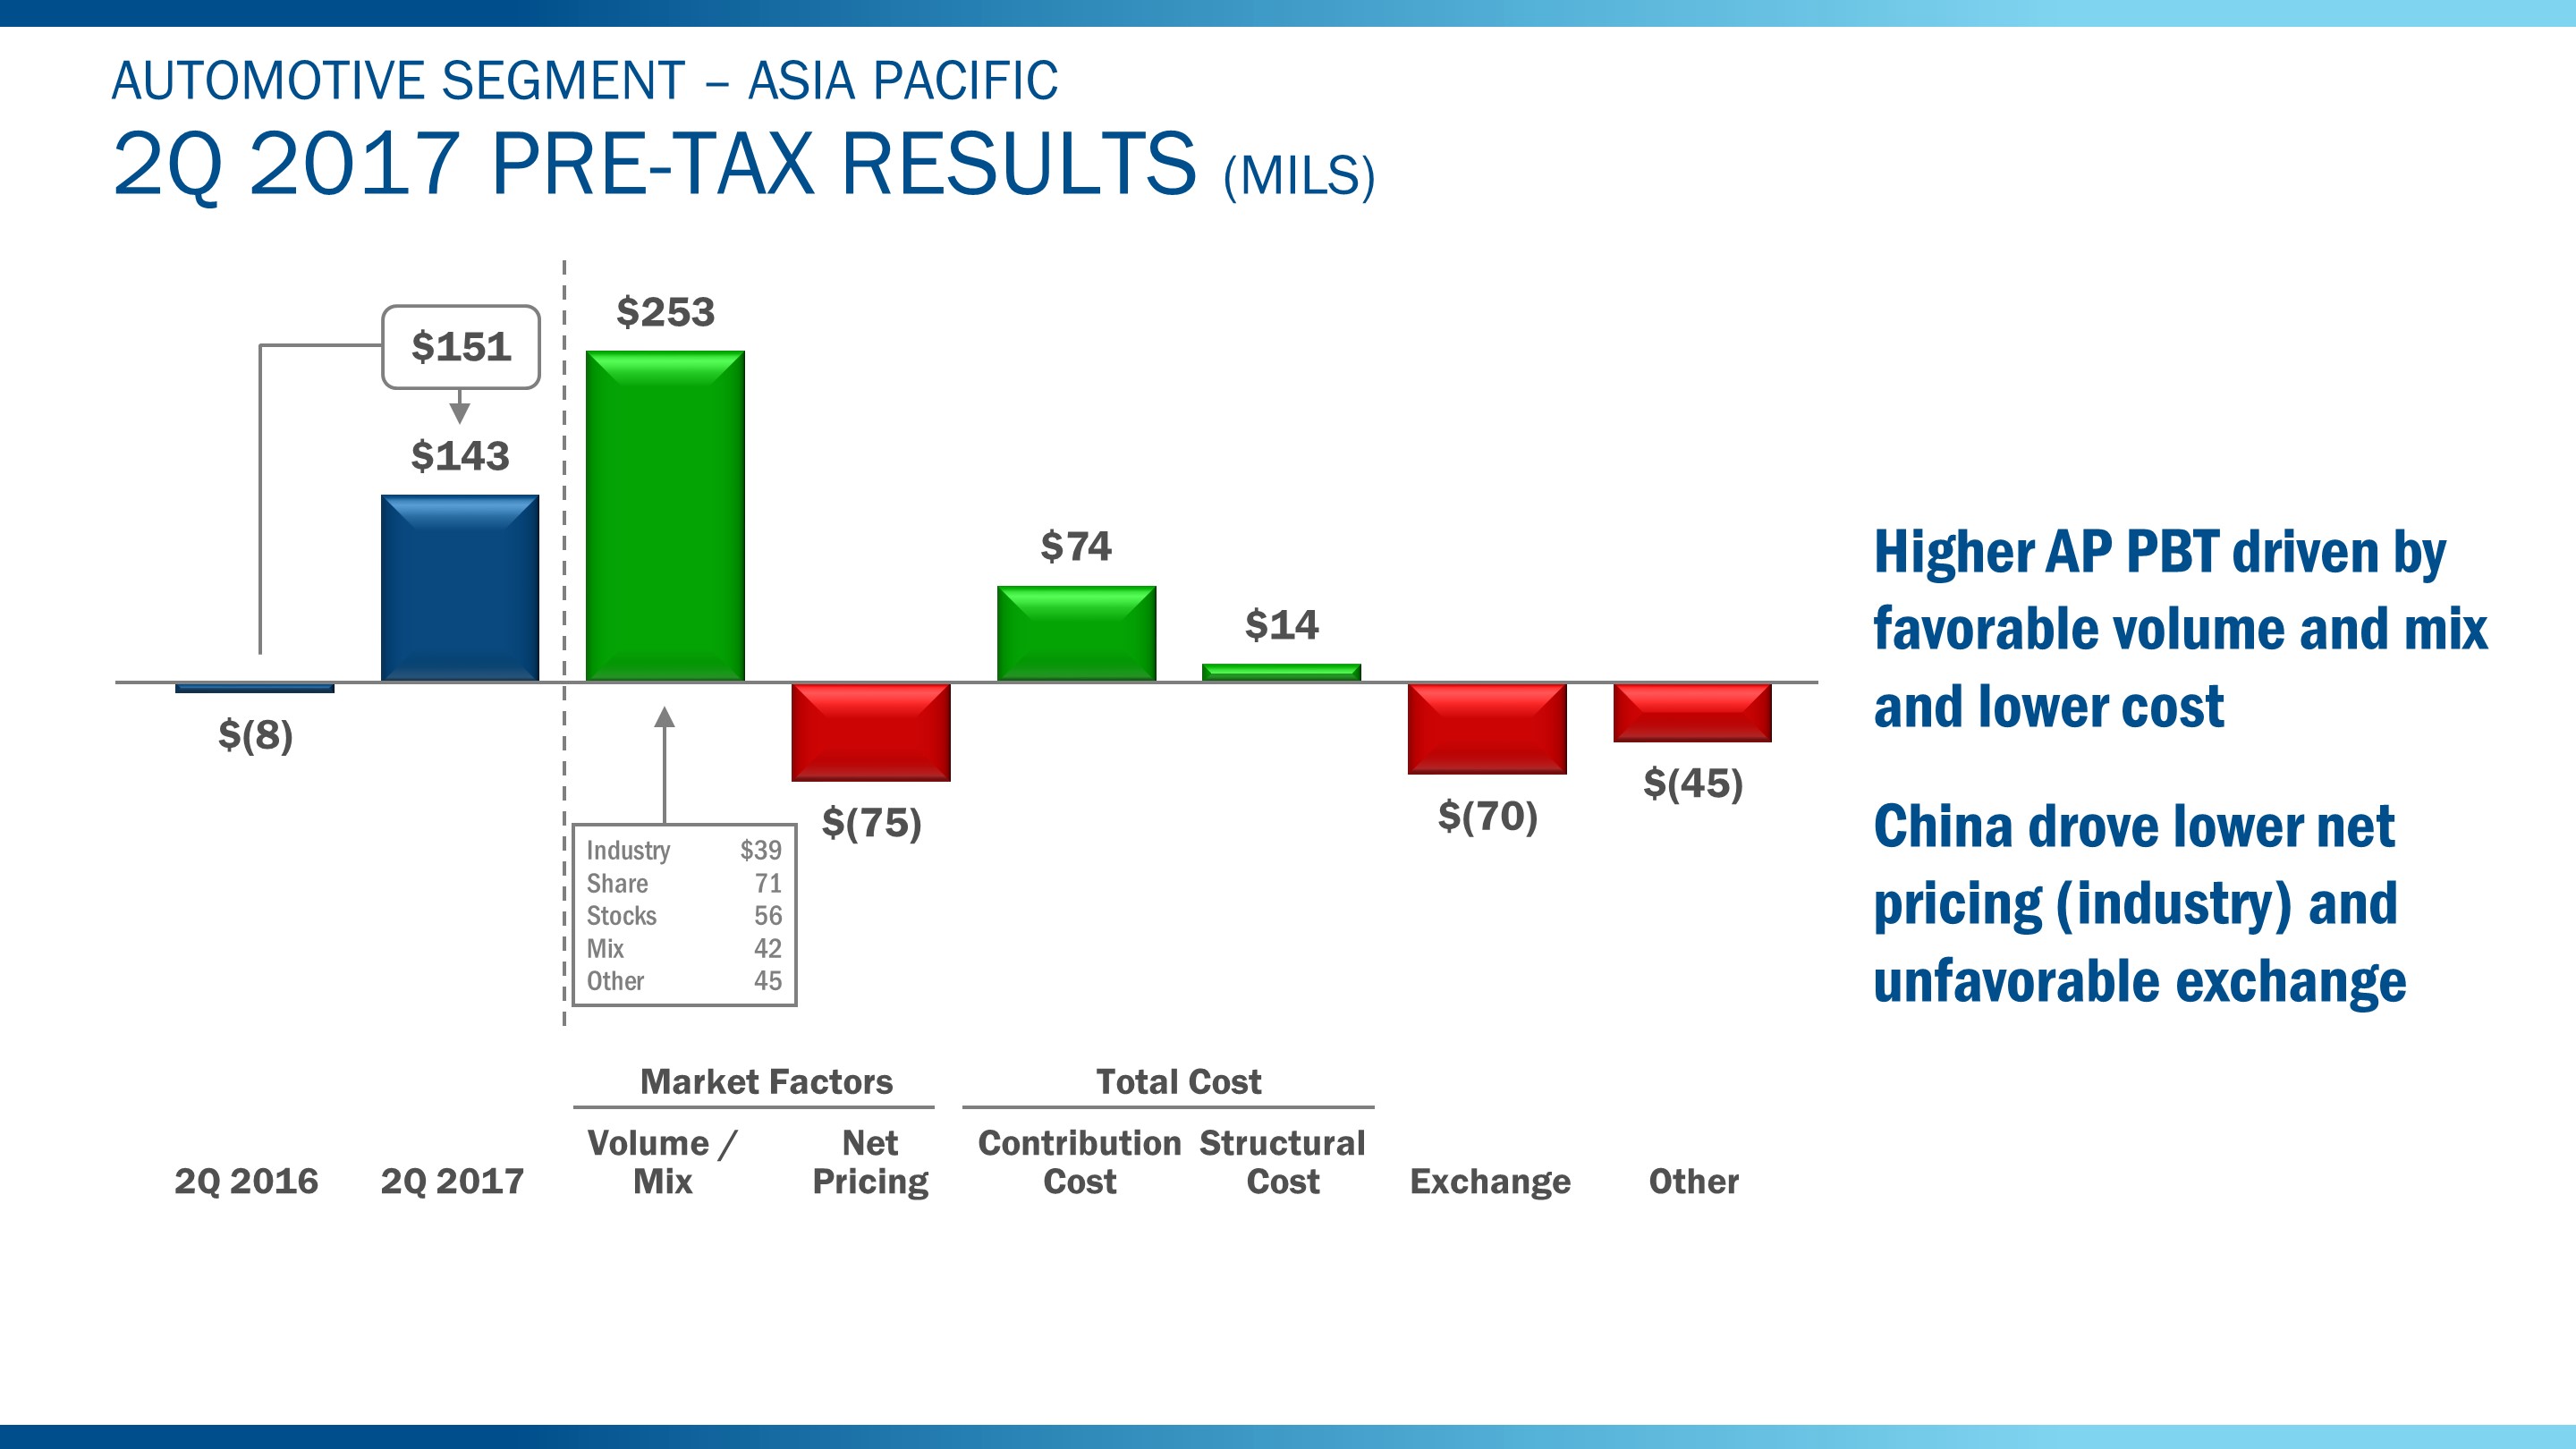
As shown above, Asia Pacific's second quarter 2017 pre-tax profit was $151 million higher than a year ago, driven by higher volume and mix. This reflects higher share and industry volume in China, favorable stock adjustments for Ford brand imports to China, and favorable mix in Australia.
China drove lower net industry pricing and unfavorable exchange.
Our results in markets outside of China improved compared to a year ago, particularly in Australia and India.
For 2017, we continue to expect Asia Pacific's pre-tax profit to improve from 2016 due to favorable volume and mix and lower cost. Partial offsets will be lower net industry pricing in China and unfavorable exchange because of a weaker RMB.
49
Item 2. Management's Discussion and Analysis of Financial Condition and Results of Operations (Continued)
FINANCIAL SERVICES SEGMENT
In general, we measure year-over-year changes in Ford Credit's pre-tax results using the causal factors listed below:
• | Volume and Mix: |
◦ | Volume primarily measures changes in net financing margin driven by changes in average managed receivables at prior period financing margin yield (defined below in financing margin) at prior period exchange rates. Volume changes are primarily driven by the volume of new and used vehicle sales and leases, the extent to which Ford Credit purchases retail installment sale and lease contracts, the extent to which Ford Credit provides wholesale financing, the sales price of the vehicles financed, the level of dealer inventories, Ford-sponsored special financing programs available exclusively through Ford Credit, and the availability of cost-effective funding for the purchase of retail installment sale and lease contracts and to provide wholesale financing |
◦ | Mix primarily measures changes in net financing margin driven by period over period changes in the composition of Ford Credit's average managed receivables by product and by country or region |
• Financing Margin:
◦ | Financing margin variance is the period-to-period change in financing margin yield multiplied by the present period average managed receivables at prior period exchange rates. This calculation is performed at the product and country level and then aggregated. Financing margin yield equals revenue, less interest expense and scheduled depreciation for the period, divided by average managed receivables for the same period |
◦ | Financing margin changes are driven by changes in revenue and interest expense. Changes in revenue are primarily driven by the level of market interest rates, cost assumptions in pricing, mix of business, and competitive environment. Changes in interest expense are primarily driven by the level of market interest rates, borrowing spreads, and asset-liability management |
• | Credit Loss: |
◦ | Credit loss is the change in the provision for credit losses at prior period exchange rates. For analysis purposes, management splits the provision for credit losses into net charge-offs and the change in the allowance for credit losses |
◦ | Net charge-off changes are primarily driven by the number of repossessions, severity per repossession, and recoveries. Changes in the allowance for credit losses are primarily driven by changes in historical trends in credit losses and recoveries, changes in the composition and size of Ford Credit's present portfolio, changes in trends in historical used vehicle values, and changes in economic conditions. For additional information on the allowance for credit losses, refer to the "Critical Accounting Estimates - Allowance for Credit Losses" section of Item 7 of Part II of our 2016 Form 10-K Report |
• | Lease Residual: |
◦ | Lease residual measures changes to residual performance at prior period exchange rates. For analysis purposes, management splits residual performance primarily into residual gains and losses, and the change in accumulated supplemental depreciation |
◦ | Residual gain and loss changes are primarily driven by the number of vehicles returned to Ford Credit and sold, and the difference between the auction value and the depreciated value (which includes both base and accumulated supplemental depreciation) of the vehicles sold. Changes in accumulated supplemental depreciation are primarily driven by changes in Ford Credit's estimate of the expected auction value at the end of the lease term, and changes in the estimate of the number of vehicles that will be returned to it and sold. For additional information on accumulated supplemental depreciation, refer to the "Critical Accounting Estimates - Accumulated Depreciation on Vehicles Subject to Operating Leases" section of Item 7 of Part II of our 2016 Form 10-K Report |
• | Exchange: |
◦ | Reflects changes in pre-tax results driven by the effects of converting functional currency income to U.S. dollars |
• | Other: |
◦ | Primarily includes operating expenses, other revenue, and insurance expenses at prior period exchange rates |
◦ | Changes in operating expenses are primarily driven by salaried personnel costs, facilities costs, and costs associated with the origination and servicing of customer contracts |
◦ | In general, other revenue changes are primarily driven by changes in earnings related to market valuation adjustments to derivatives (primarily related to movements in interest rates) and other miscellaneous items |
50
Item 2. Management's Discussion and Analysis of Financial Condition and Results of Operations (Continued)
In addition, the following definitions and calculations apply to Ford Credit when used in this report:
• | Cash (as shown on the Funding Structure, Liquidity Sources, and Leverage charts) – Cash, cash equivalents, and marketable securities, excluding amounts related to insurance activities |
• | Securitizations (as shown on the Public Term Funding Plan chart) – Public securitizations, Rule 144A offerings sponsored by Ford Motor Credit, and widely distributed offerings by Ford Credit Canada |
• | Term Asset-Backed Securities (as shown on the Funding Structure chart) – Obligations issued in securitization transactions that are payable only out of collections on the underlying securitized assets and related enhancements |
• | Total Debt (as shown on the Leverage chart) – Debt on Ford Credit's balance sheet. Includes debt issued in securitizations and payable only out of collections on the underlying securitized assets and related enhancements. Ford Credit holds the right to receive the excess cash flows not needed to pay the debt issued by, and other obligations of, the securitization entities that are parties to those securitization transactions |
The charts on the following pages detail second quarter 2017 key metrics and the change in second quarter 2017 pre-tax results compared with second quarter 2016 by causal factor for Ford Credit.
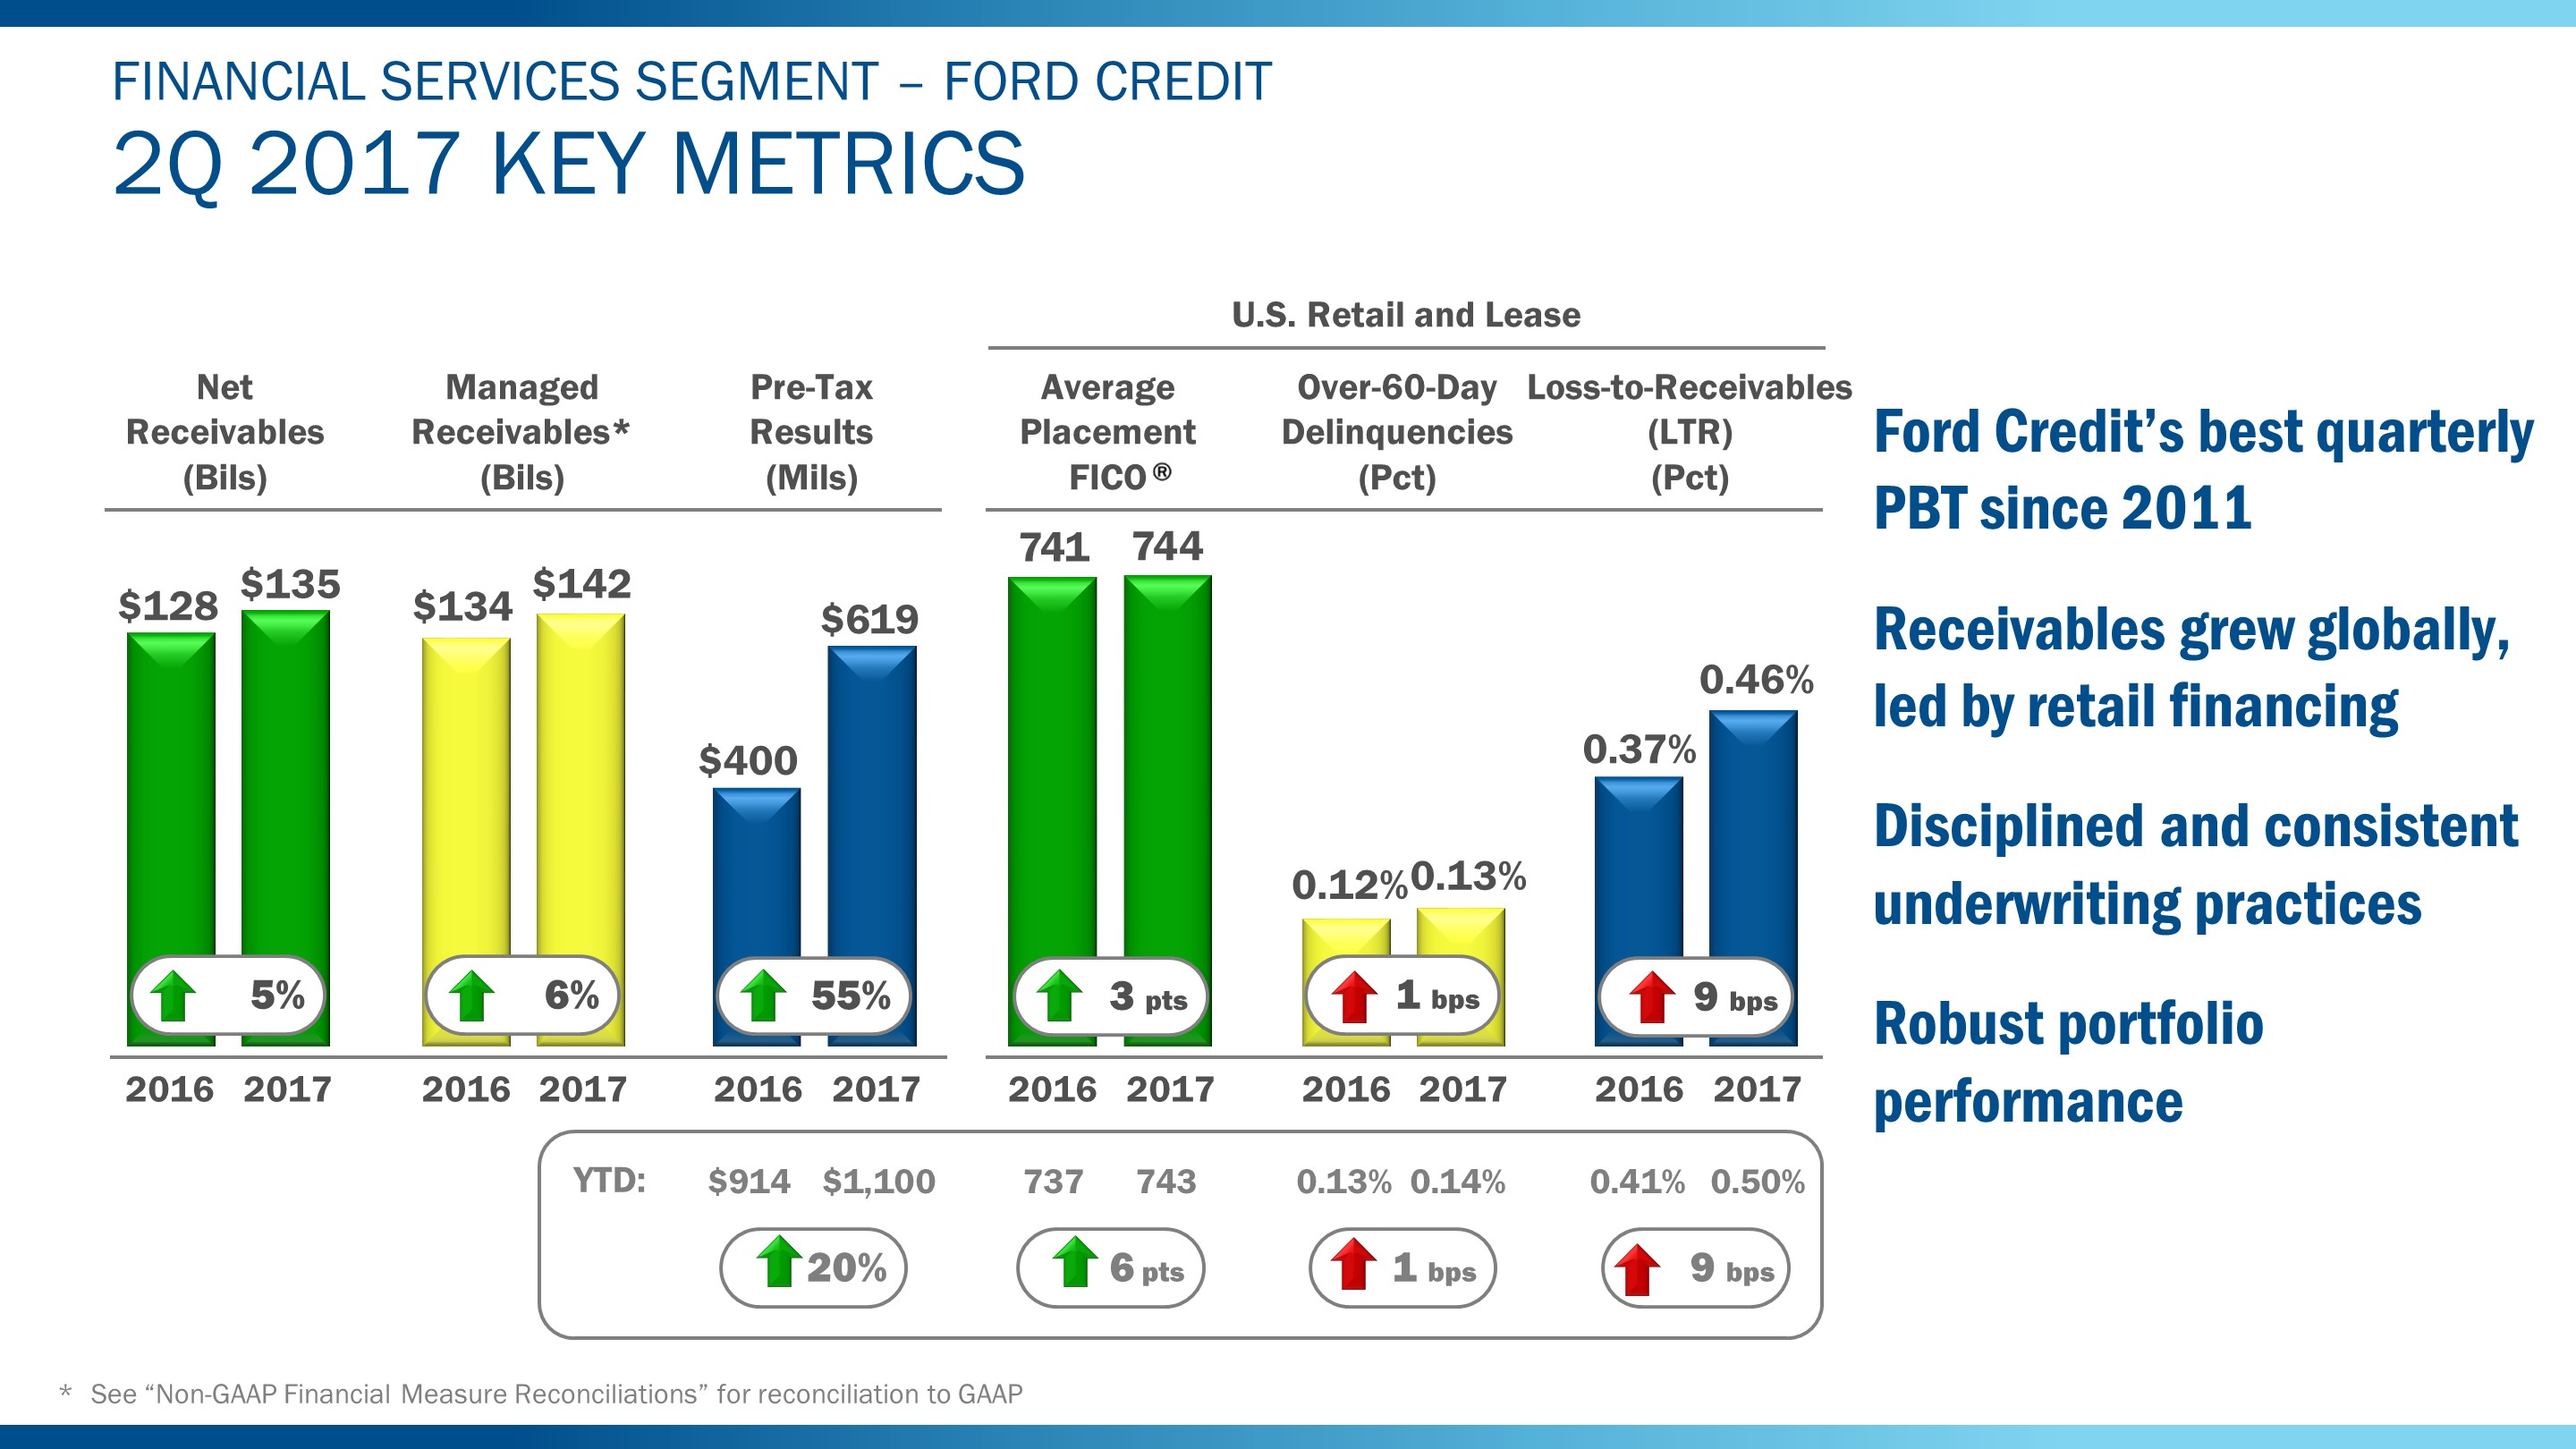
In the second quarter of 2017, Ford Credit's pre-tax profit was $619 million, its best quarterly pre-tax profit since 2011. Receivables were higher than a year ago with growth globally led by retail receivables.
FICO scores remain strong, and origination, servicing, and collection practices continue to be disciplined and consistent. Portfolio performance was robust. The loss-to-receivables ratio of 46 basis points was up 9 basis points and within expectations.
51
Item 2. Management's Discussion and Analysis of Financial Condition and Results of Operations (Continued)
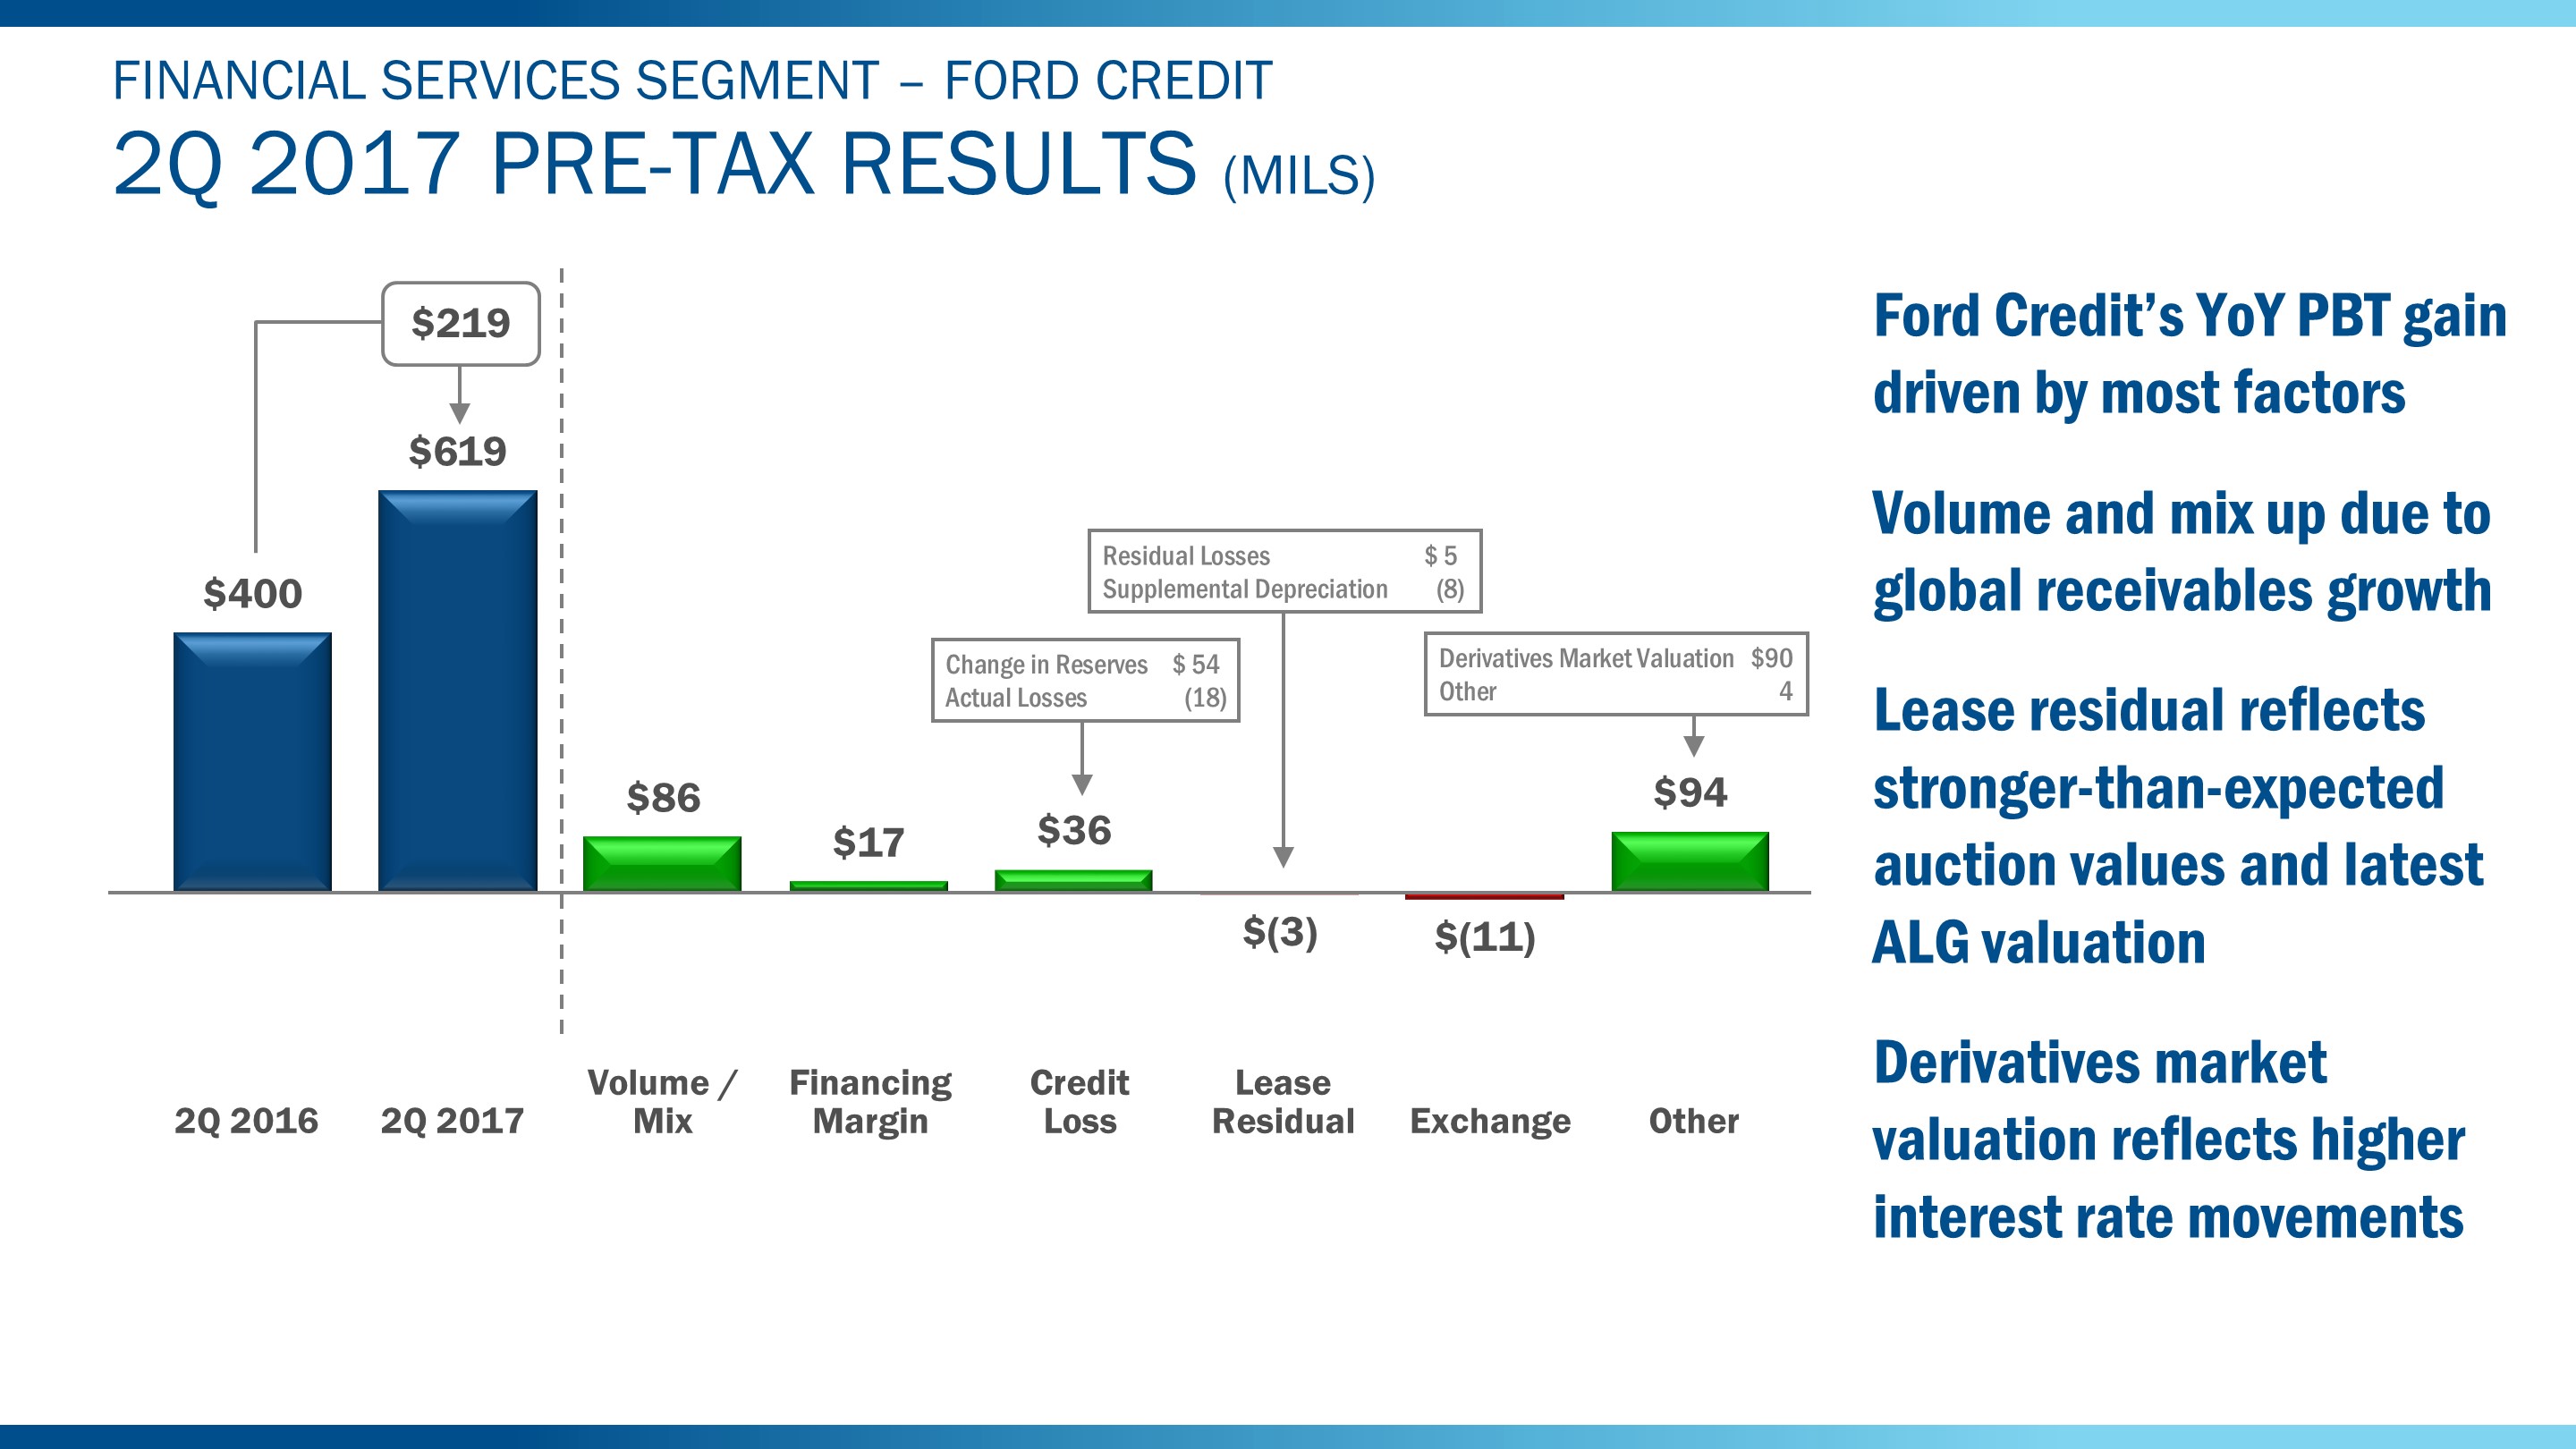
As shown above, Ford Credit's second quarter 2017 pre-tax profit improvement of $219 million from a year ago was driven by most factors. The favorable volume and mix reflects primarily growth in retail receivables globally. Improved credit loss performance is due to a smaller increase in reserves, offset partially by higher losses.
Recent auction value performance has been better than expected. As a result, Ford Credit's year-over - year lease residual performance was flat. Derivatives market valuation was favorable, reflecting primarily higher interest rates in Canada and the United Kingdom in the second quarter of 2017, versus the Brexit effect of lower rates globally in the second quarter of 2016.
For the remainder of 2017, Ford Credit continues to plan for lower auction values; however, Ford Credit's outlook for full-year supplemental depreciation has improved, reflecting the latest third party valuations. Ford Credit's full-year pre-tax profit is now expected to be higher than $1.5 billion, reflecting an improved lease residual outlook, along with higher volume, financing margin, and a strong cost focus. Ford Credit's pre-tax profit in the second half of 2017 is expected to be lower than in the first half of the year due to seasonally higher credit losses and operating costs, along with adverse lease residual performance.
52
Item 2. Management's Discussion and Analysis of Financial Condition and Results of Operations (Continued)
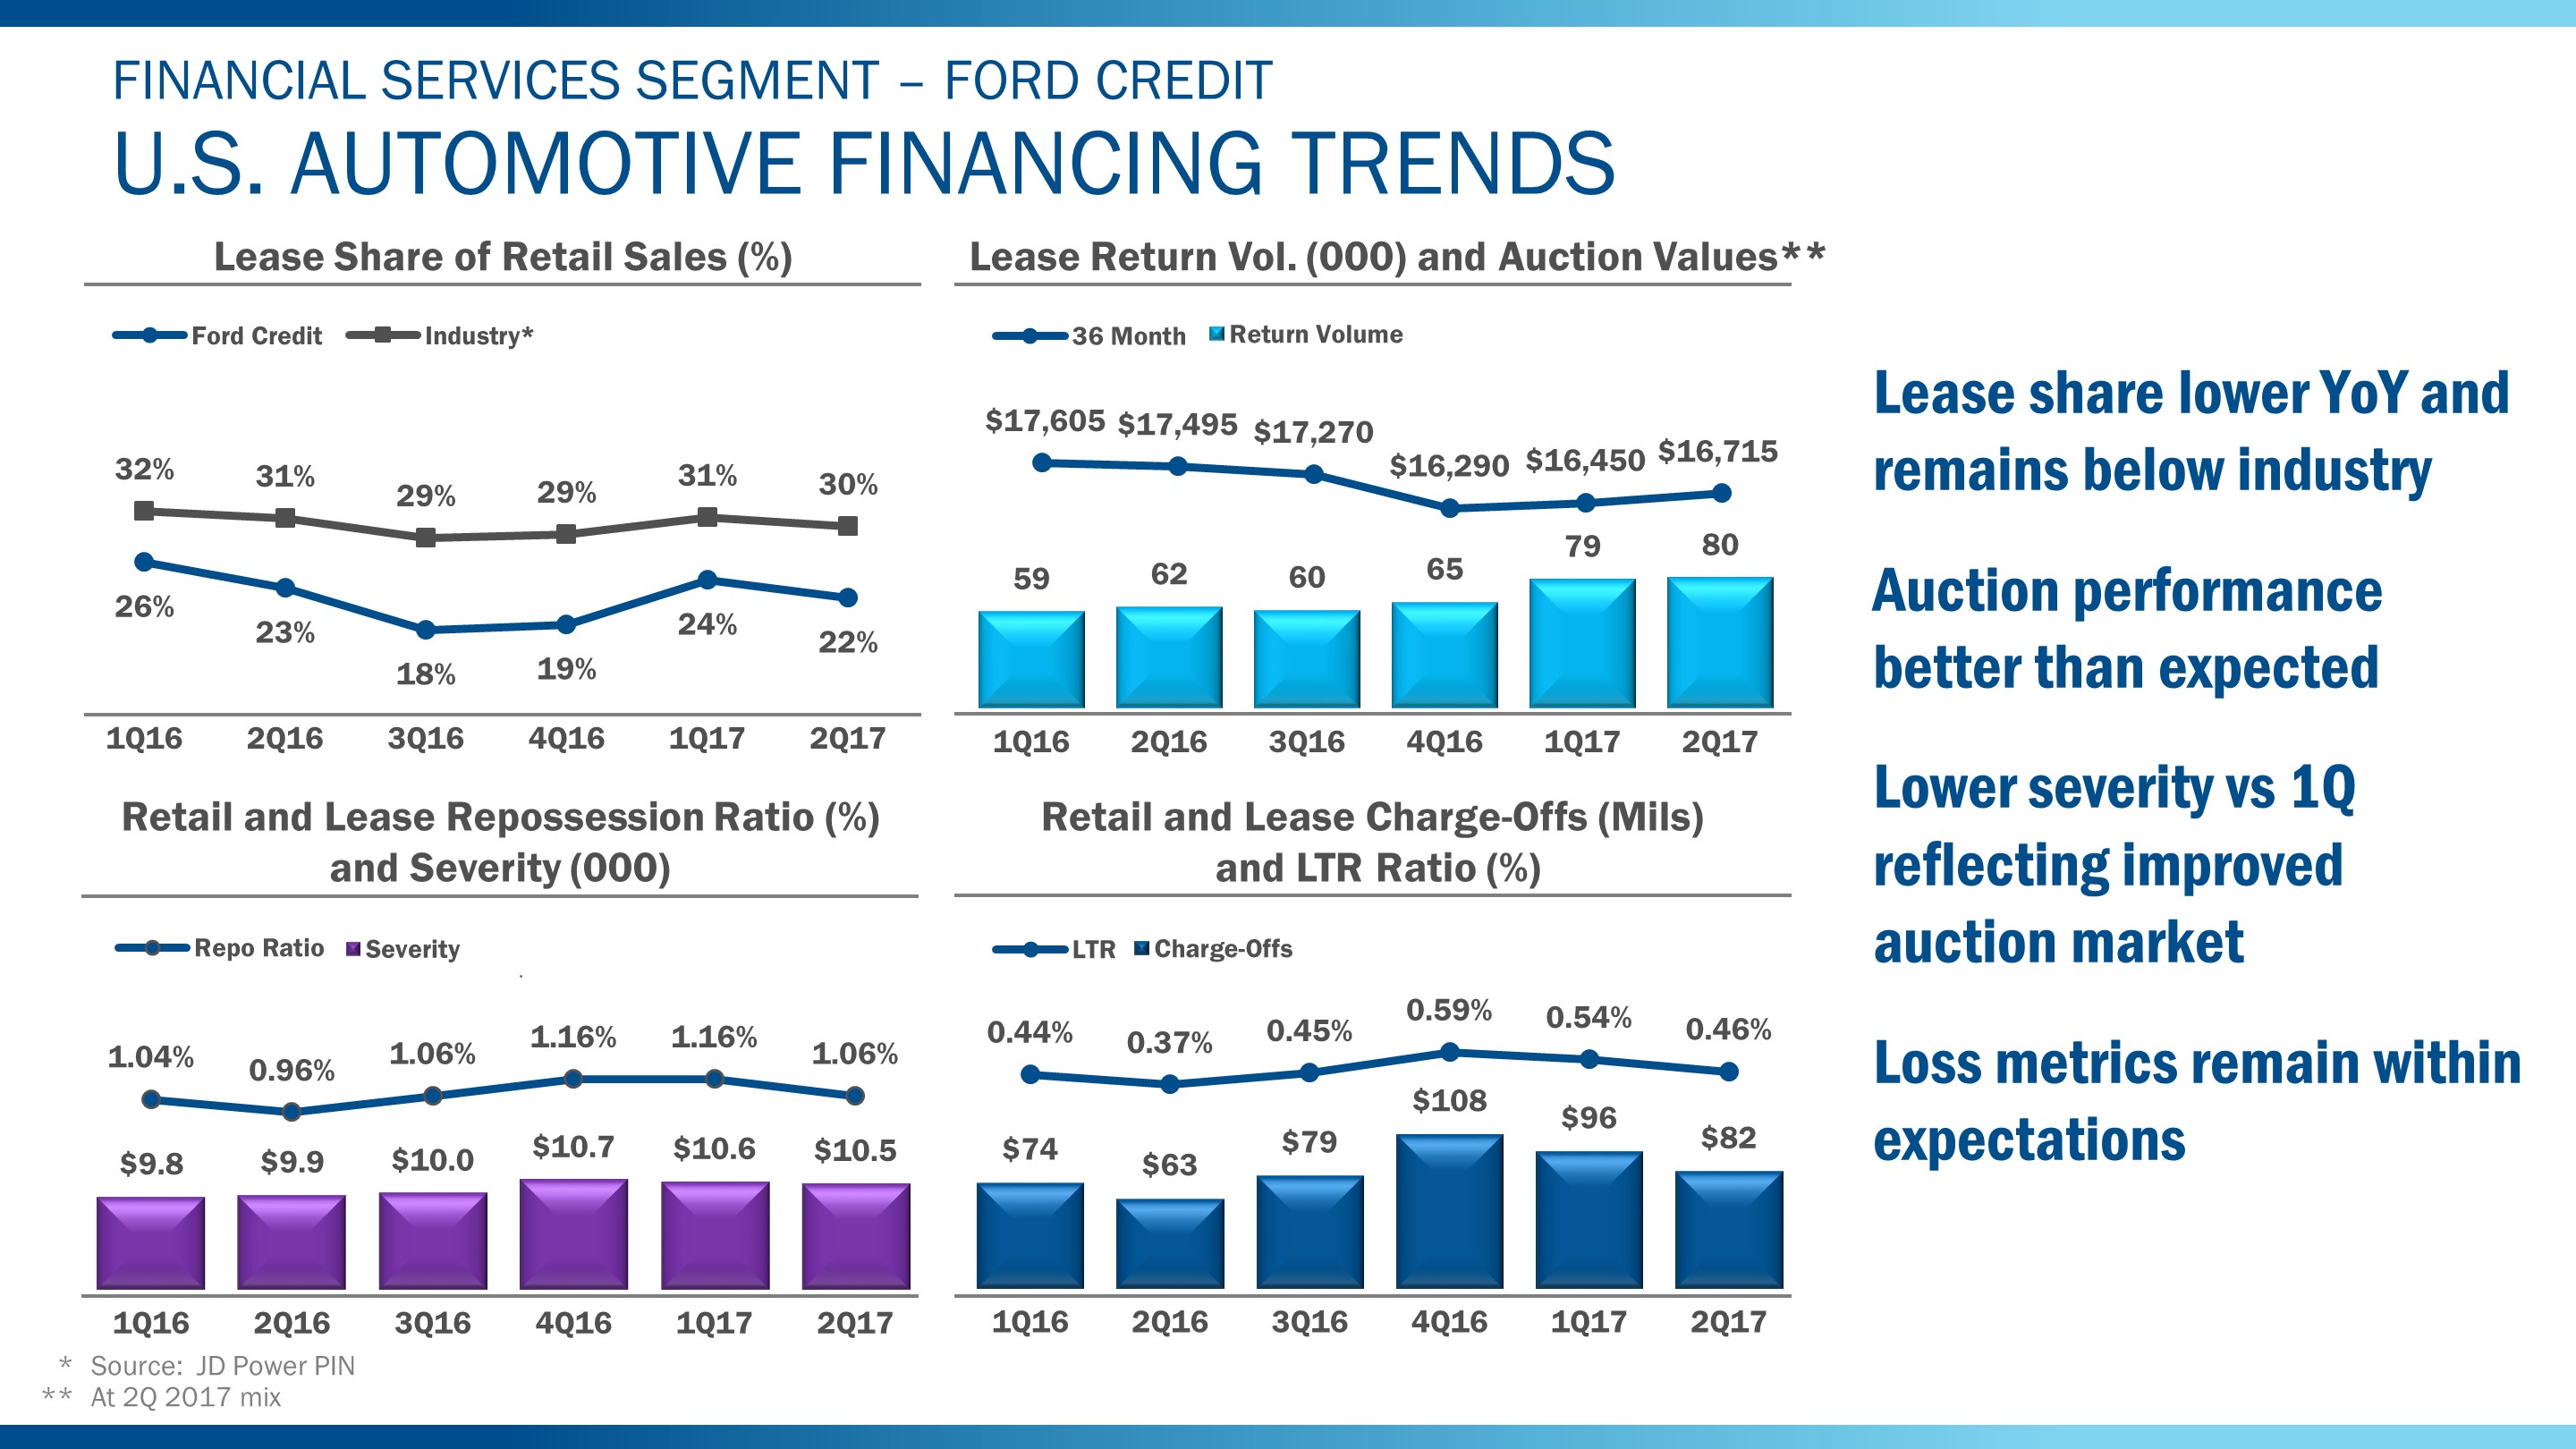
In the second quarter of 2017, lease share was lower compared to a year ago and remains below the industry average. In addition, Ford Credit's lease portfolio continues to be smaller than major competitors.
Ford Credit's off-lease auction values in the second quarter were lower than a year ago, but higher than the prior quarter. Three-year auction values in the quarter were down less than 5% year-over-year.
Ford Credit is encouraged by the relative strength of the used vehicle market given the increase in off-lease volume; however, it continues to plan for three-year full year auction values to be down about 6% at constant mix.
The second quarter repossession ratio was higher than last year but down seasonally from first quarter and remains within expectations. Severity is higher than last year but lower than first quarter, reflecting primarily improvements in auction values.
Charge-offs and LTR were higher than last year but seasonally lower than first quarter.
Credit quality remains strong reflecting a strong business environment and healthy consumer credit conditions.
53
Item 2. Management's Discussion and Analysis of Financial Condition and Results of Operations (Continued)
ALL OTHER
All Other is a combination of Central Treasury Operations and Ford Smart Mobility LLC, two operating segments that did not meet the quantitative thresholds in this reporting period to qualify as reportable segments.
The Central Treasury Operations segment is primarily engaged in decision making for investments, risk management activities, and providing financing for the Automotive segment. Interest income (excluding interest earned on our extended service contract portfolio that is included in our Automotive segment), interest expense, gains and losses on cash equivalents and marketable securities, and foreign exchange derivatives associated with intercompany lending are included in the results of Central Treasury Operations. The underlying assets and liabilities, primarily cash and cash equivalents, marketable securities, debt, and derivatives, remain with the Automotive segment.
Ford Smart Mobility LLC is a subsidiary formed to design, build, grow, and invest in emerging mobility services. Designed to compete like a start-up company, Ford Smart Mobility LLC designs and builds mobility services on its own, and collaborates with start-ups and tech companies.
Our second quarter 2017 All Other pre-tax results were a loss of $287 million, a $63 million greater loss compared with a year ago. This increase is more than explained by higher net interest expense, higher net losses on cash equivalents and marketable securities, and Ford Smart Mobility LLC's results.
SPECIAL ITEMS
In Note 17 of the Notes to the Financial Statements, special items are reflected as a separate reconciling item, as opposed to being allocated among the Automotive segment, Financial Services segment, and All Other. This reflects the fact that management excludes these items from its review of operating segment results for purposes of measuring segment profitability and allocating resources.
Our pre-tax and tax special items were as follows:
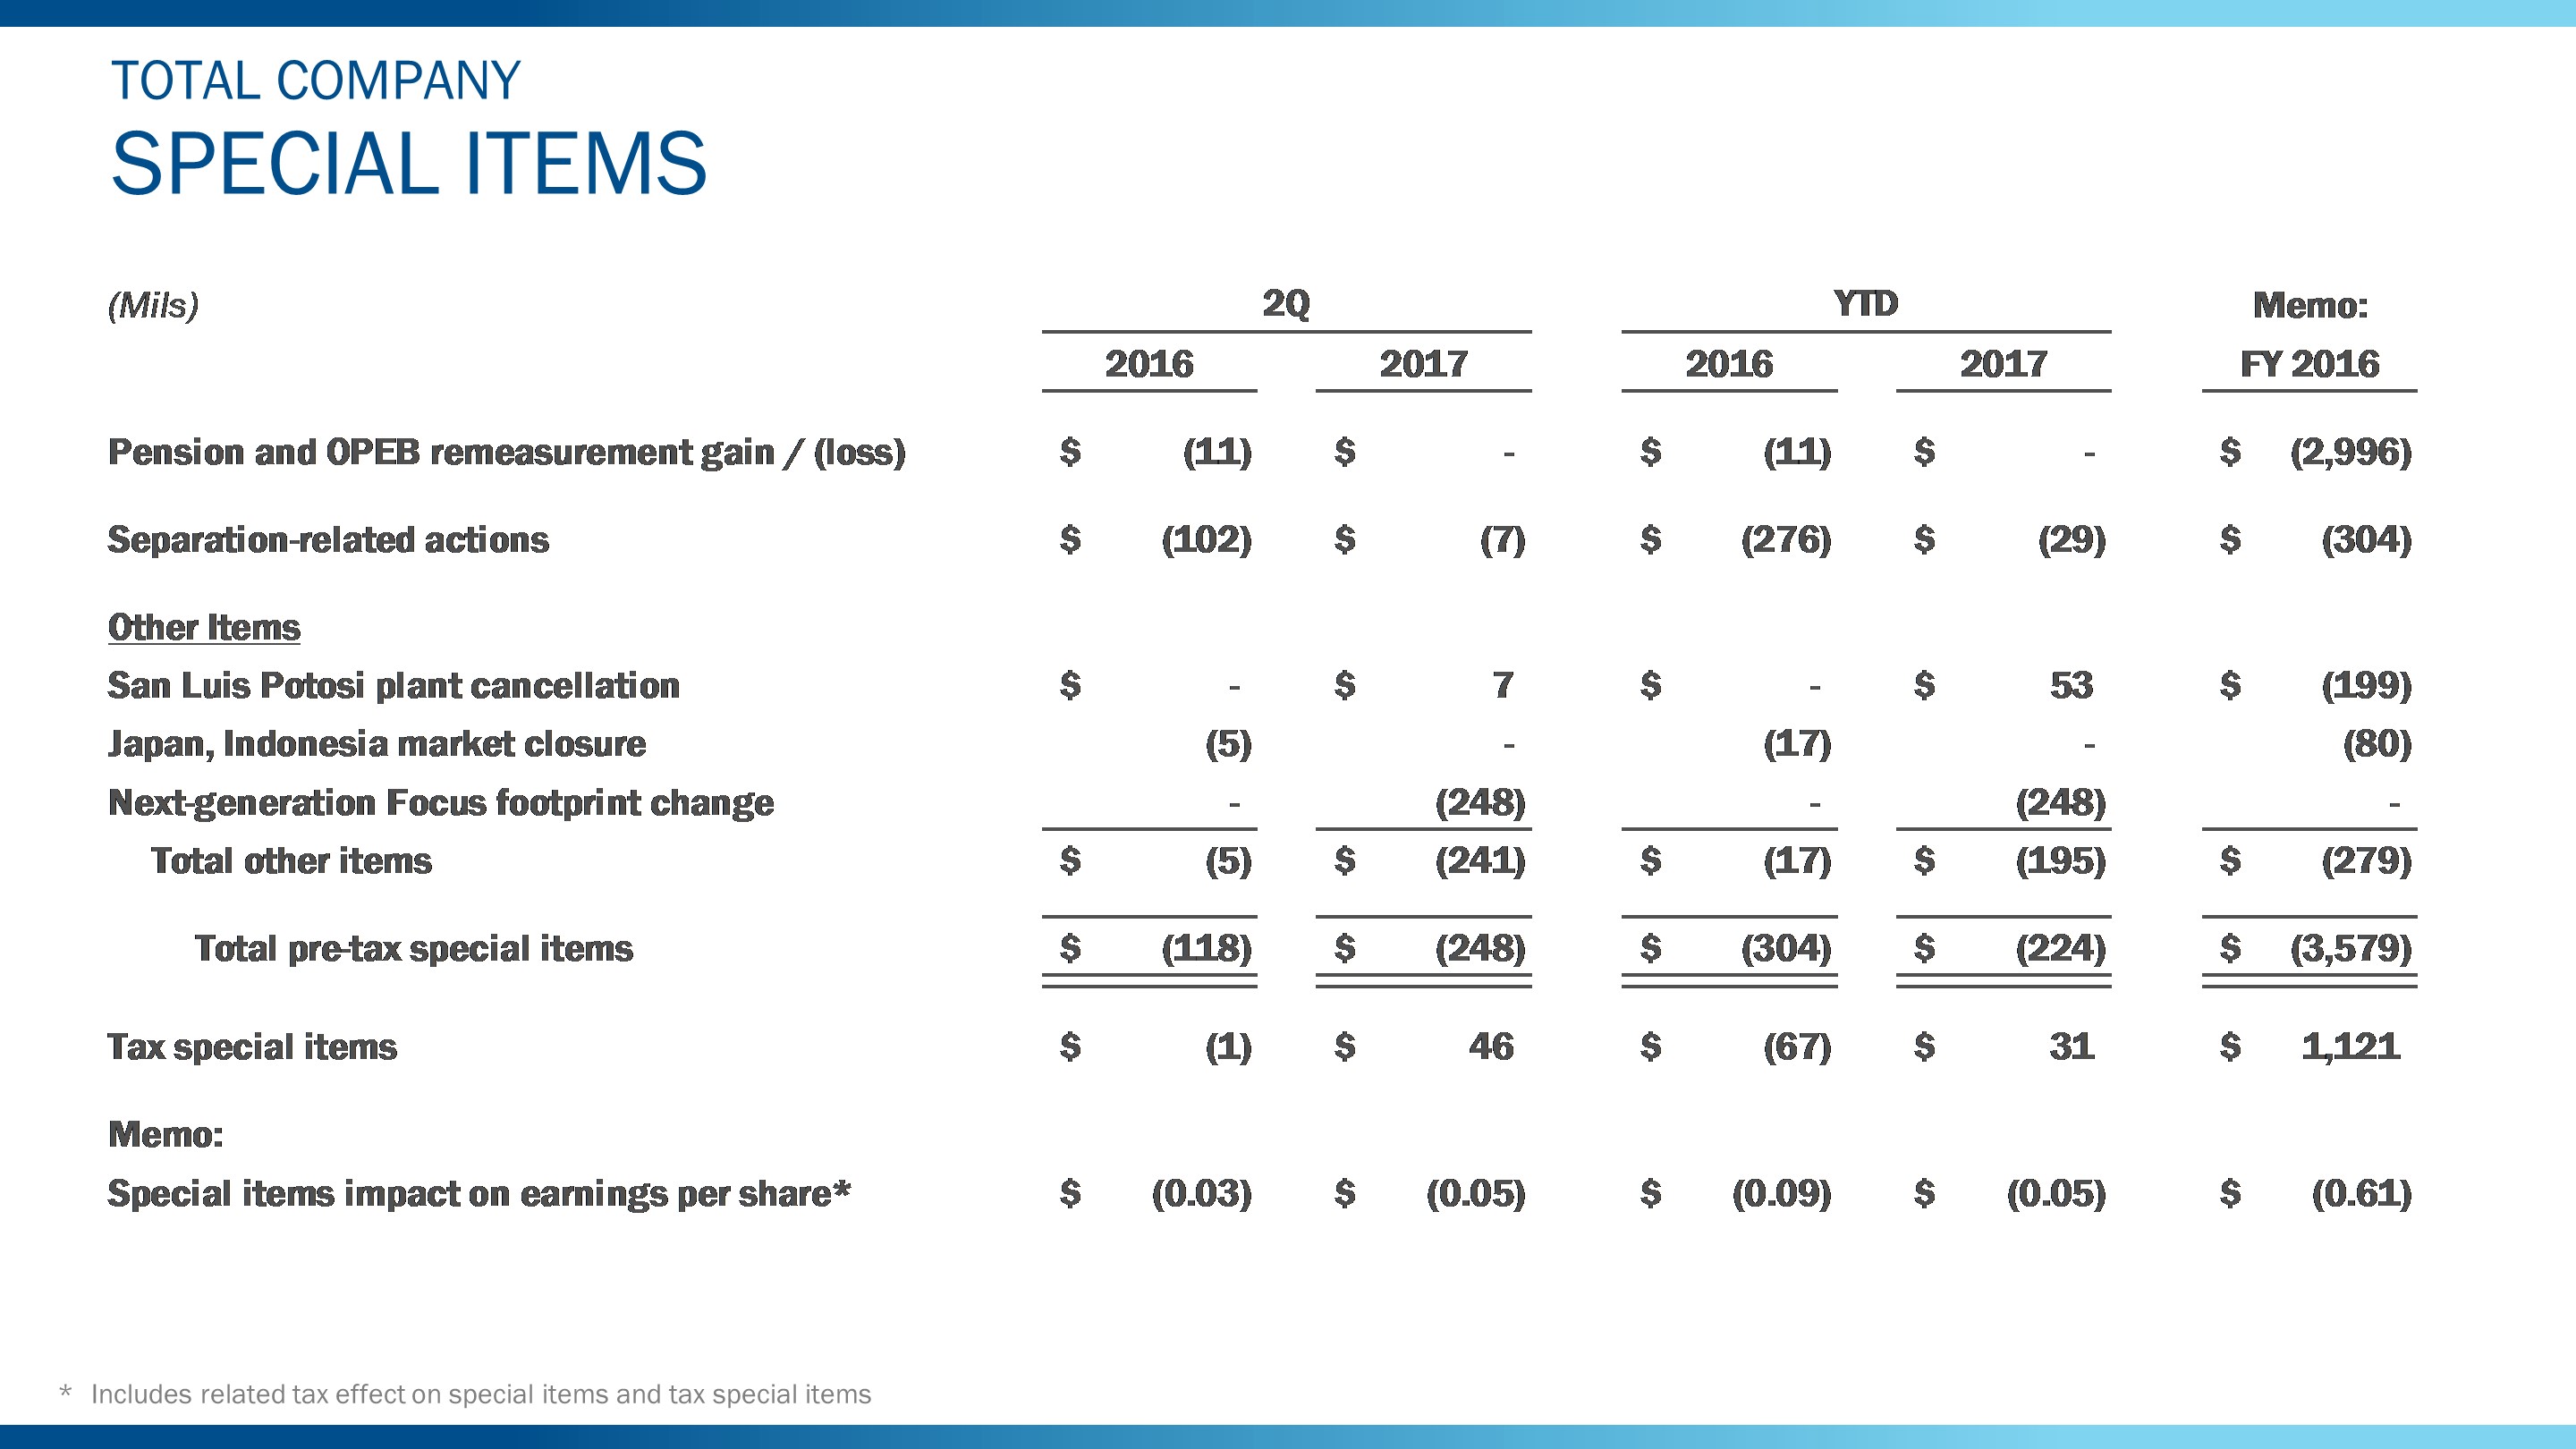
54
Item 2. Management's Discussion and Analysis of Financial Condition and Results of Operations (Continued)
TAXES
Our tax provisions for the second quarter and first six months of 2017 were $209 million and $858 million, respectively, resulting in GAAP effective tax rates of 9.3% and 19.1%, respectively.
Our second quarter and first six months 2017 non-GAAP adjusted effective tax rates, which exclude special items, were 10.2% and 18.8%, respectively, 19.9 and 10.2 percentage points lower than a year ago, reflecting the realization of benefits from foreign tax credits in the second quarter of 2017.
LIQUIDITY AND CAPITAL RESOURCES
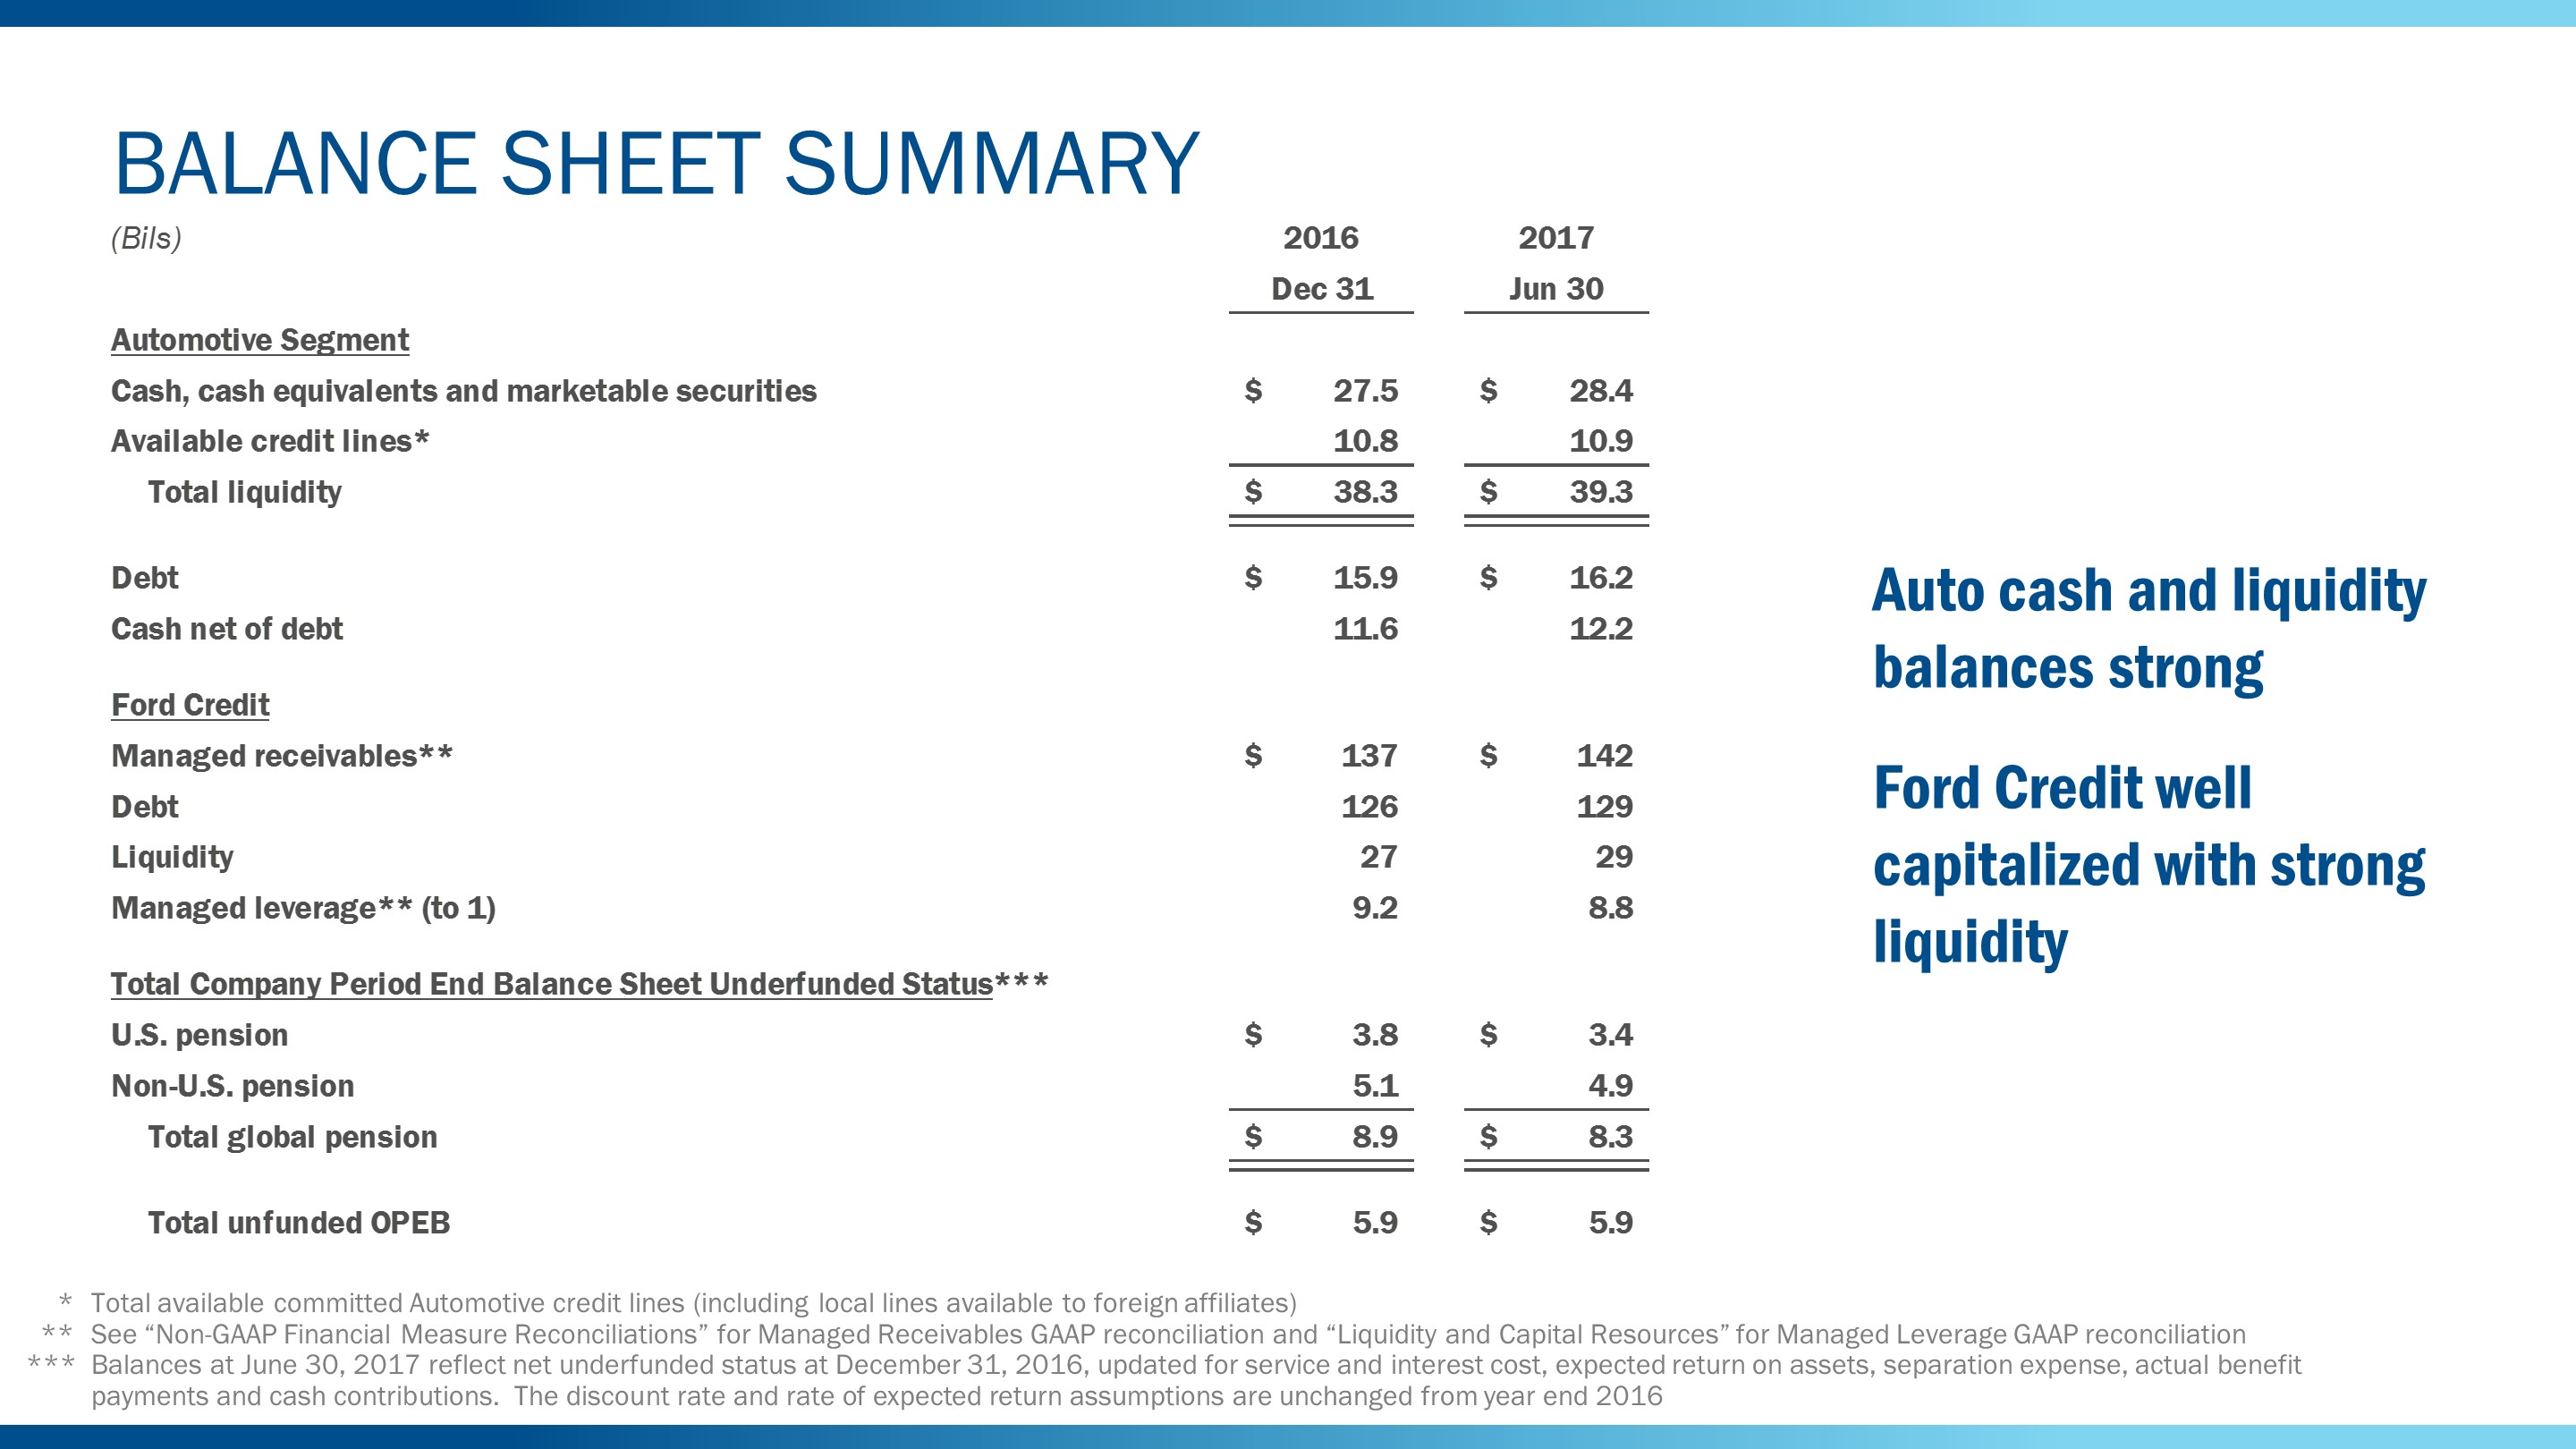
Automotive Segment
Liquidity . One of our key priorities is to maintain a strong balance sheet, while at the same time having resources available to invest in and grow our business. Based on our planning assumptions, we believe we have sufficient liquidity and capital resources to continue to invest in new products and services that customers want and value, transform and grow our business, pay our debts and obligations as and when they come due, pay a sustainable regular dividend at the current level, and provide protection within an uncertain global economic environment.
Our key balance sheet metrics include total cash, cash equivalents, and marketable securities (collectively "Automotive cash"), Automotive liquidity, which includes Automotive cash and total available committed credit lines, and cash net of debt.
55
Item 2. Management's Discussion and Analysis of Financial Condition and Results of Operations (Continued)
At June 30, 2017, we had $28.4 billion of Automotive cash, of which 82% was held by consolidated entities domiciled in the United States. We target to have an average ongoing Automotive cash balance of about $20 billion. We expect to have periods when we will be above or below this amount due to: (i) future cash flow expectations, such as for pension contributions, debt maturities, capital investments, investments in future opportunities, or restructuring requirements, (ii) short-term timing differences, and (iii) changes in the global economic environment.
Our Automotive cash investments primarily include U.S. Department of Treasury obligations, federal agency securities, bank time deposits with investment-grade institutions, corporate investment-grade securities, commercial paper rated A-1/P-1 or higher, and debt obligations of a select group of non-U.S. governments, non-U.S. governmental agencies, and supranational institutions. The average maturity of these investments is approximately one year, and is adjusted based on market conditions and liquidity needs. We monitor our Automotive cash levels and average maturity on a daily basis.
In addition to our target Automotive cash balance, we also target to maintain a corporate credit facility, discussed below, for our Automotive business of about $10 billion to protect against exogenous shocks. We assess the appropriate long-term target for total Automotive liquidity, which includes Automotive cash and the corporate credit facility, to be about $30 billion, which is an amount we believe is sufficient to support our business priorities and to protect our business. At June 30, 2017, we had $39.3 billion of Automotive liquidity. Our Automotive cash and Automotive liquidity targets could be reduced over time based on improved operating performance and changes in our risk profile.
Changes in Automotive Cash. Changes in Automotive cash are summarized below (in billions):
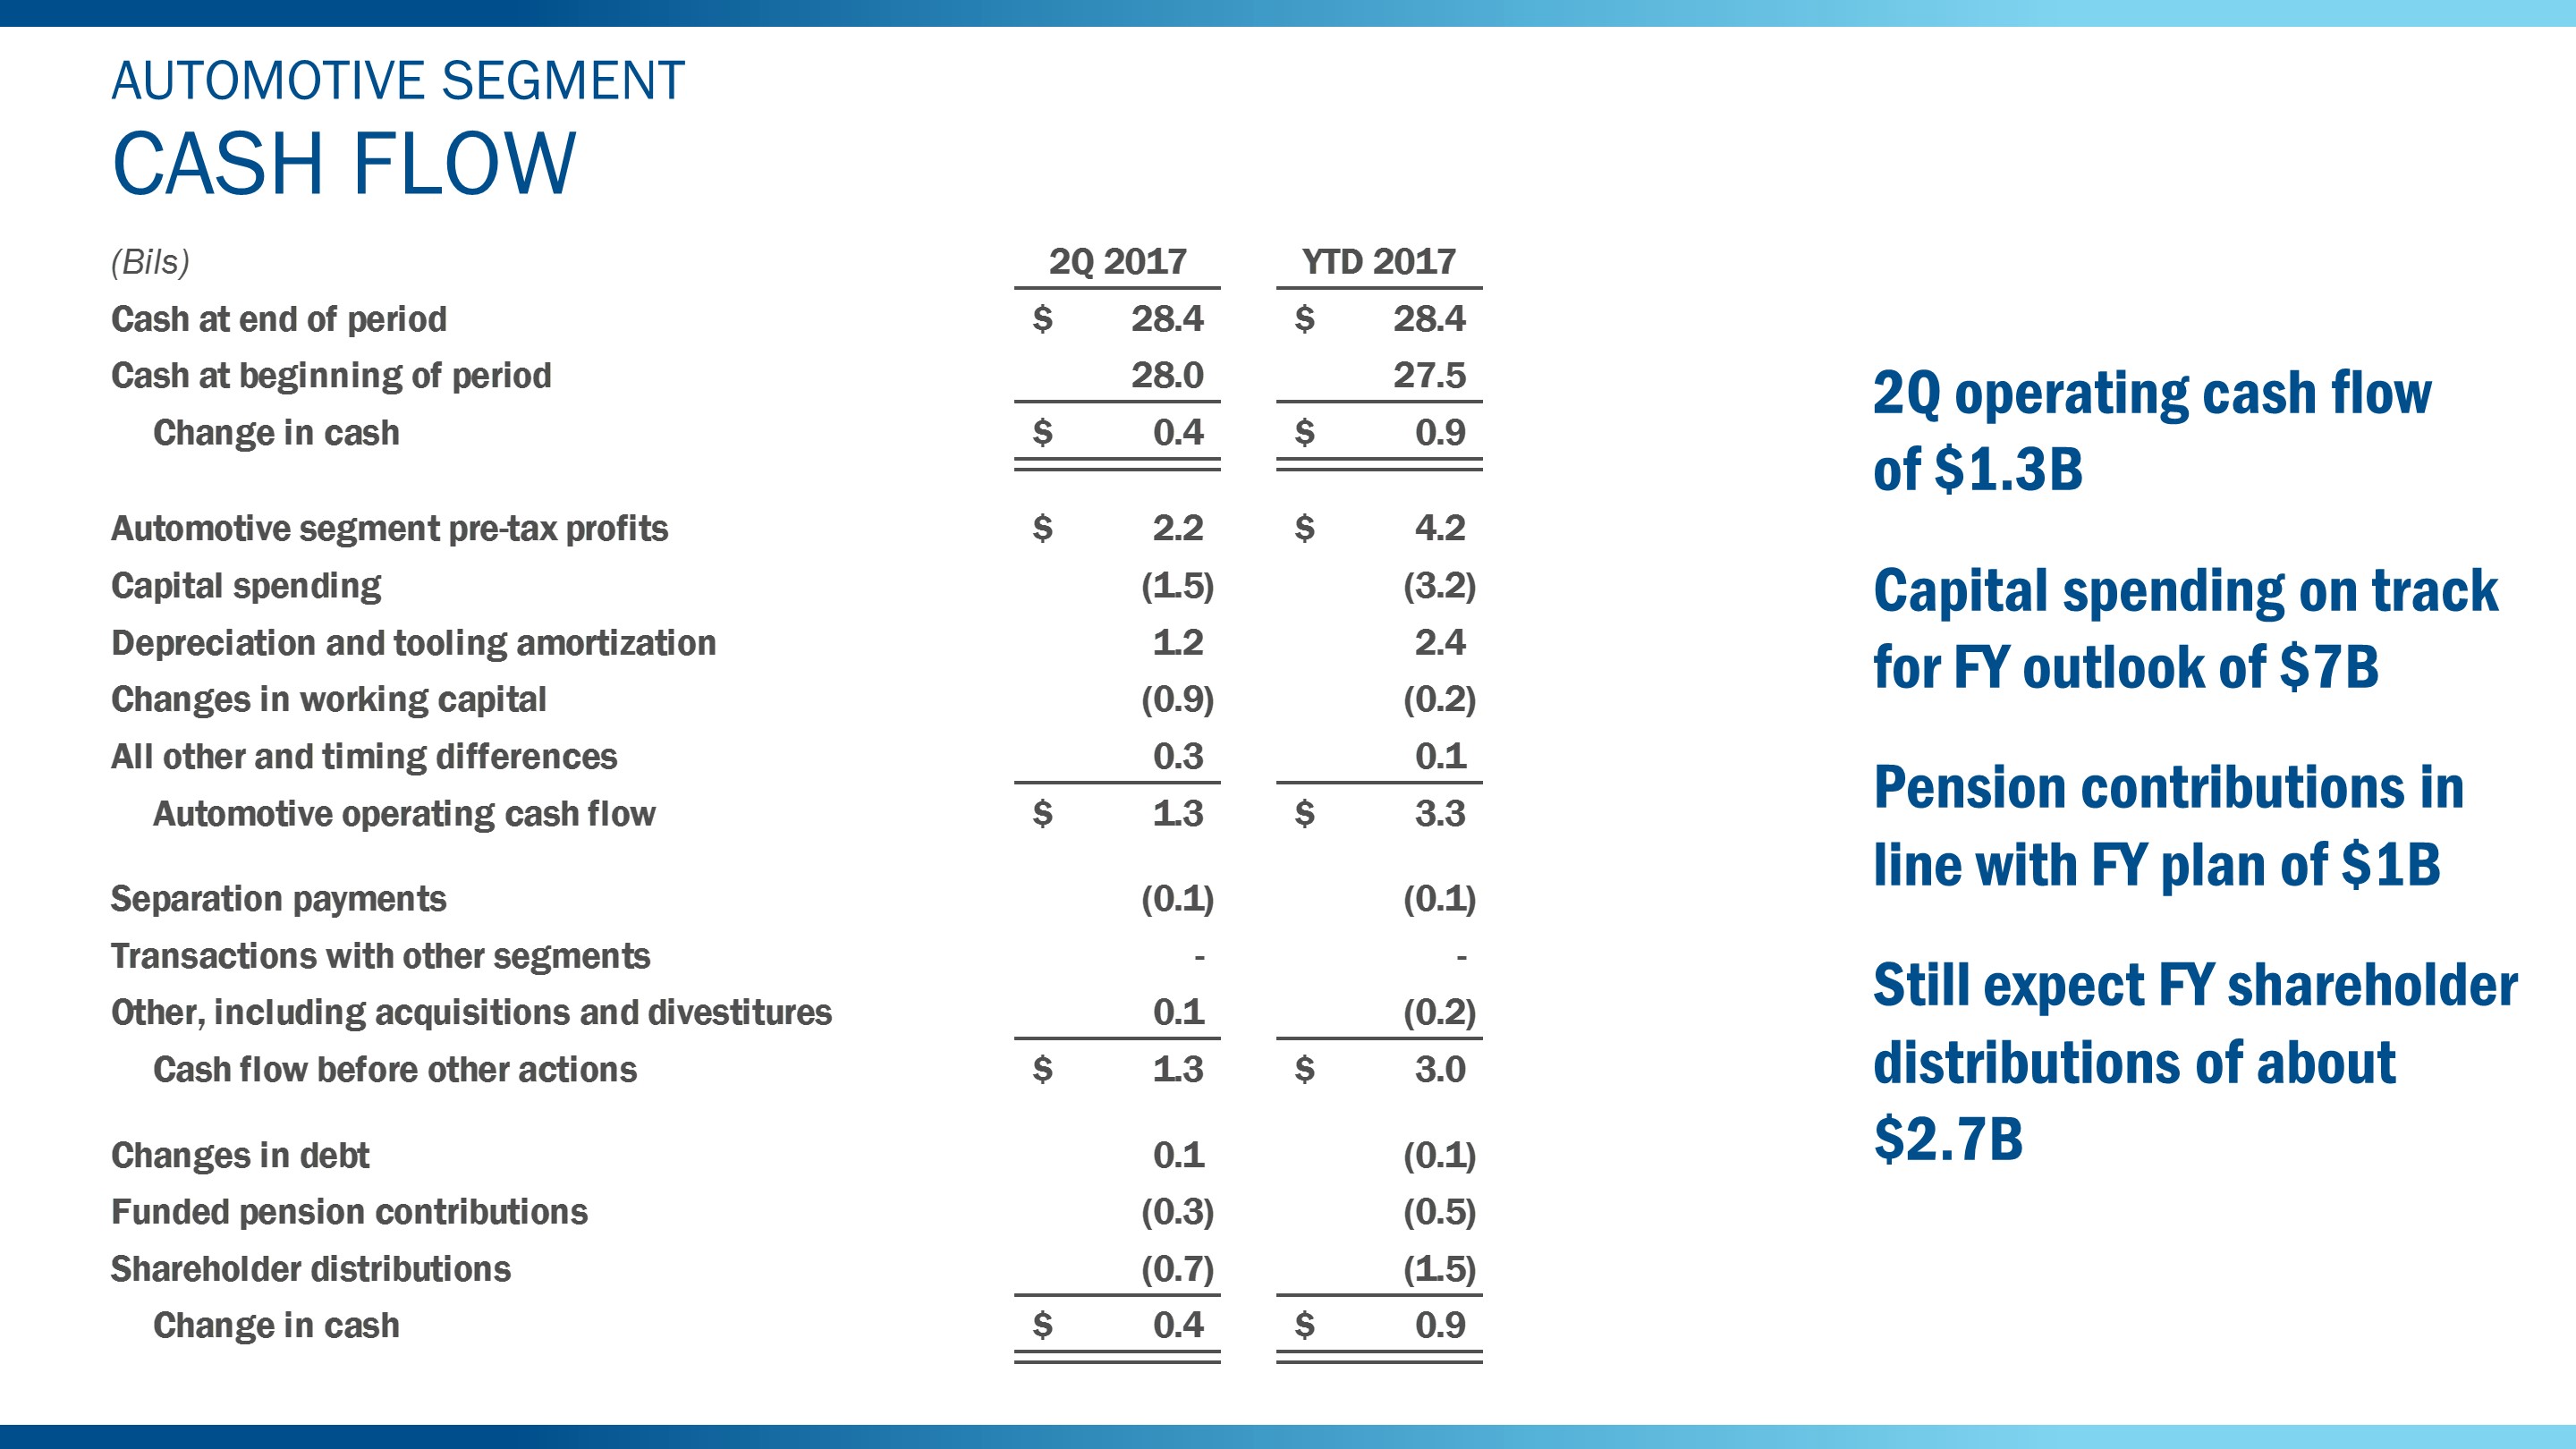
In managing our Automotive business, we classify changes in Automotive cash into operating and other items. Operating items include: Automotive segment pre-tax profits, capital spending, depreciation and tooling amortization, changes in working capital, and All other and timing differences. Non-operating items include: separation payments, transactions with other segments, acquisitions and divestitures, changes in Automotive debt, contributions to funded pension plans, and shareholder distributions.
Automotive operating cash flow was $1.3 billion in the second quarter of 2017, more than explained by Automotive segment pre-tax profit and timing differences, offset partially by unfavorable working capital changes and net spending.
56
Item 2. Management's Discussion and Analysis of Financial Condition and Results of Operations (Continued)
Capital spending was $1.5 billion in the second quarter of 2017, and our outlook for capital spending remains at about $7 billion for the full year. Based on expected cash flows and the identification of additional opportunities for profitable growth, the ongoing amount of capital spending to support product development, growth, restructuring, and infrastructure is now expected to be about $8 billion annually through 2020.
Shareholder distributions, including anti-dilutive share repurchases, were about $700 million in the second quarter of 2017. For the full year, we expect distributions to be about $2.7 billion.
With respect to "Changes in working capital," in general we carry relatively low Automotive segment trade receivables compared with our trade payables because the majority of our Automotive wholesales are financed (primarily by Ford Credit) immediately upon sale of vehicles to dealers, which generally occurs at the time the vehicles are gate-released shortly after being produced. In addition, our inventories are lean because we build to order, not for inventory. In contrast, our Automotive trade payables are based primarily on industry-standard production supplier payment terms generally ranging between 30 days to 45 days. As a result, our cash flow tends to improve as wholesale volumes increase, but can deteriorate significantly when wholesale volumes drop sharply. These working capital balances generally are subject to seasonal changes that can impact cash flow. For example, we typically experience cash flow timing differences associated with inventories and payables due to our annual summer and December shutdown periods, when production, and therefore inventories and wholesale volumes, are usually at their lowest levels, while payables continue to come due and be paid. The net impact of this typically results in cash outflows from changes in our working capital balances during these shutdown periods.
Available Credit Lines . Total committed Automotive credit lines at June 30, 2017 were $11.9 billion, consisting of $10.4 billion of our corporate credit facility and $1.5 billion of local credit facilities for use by our non-U.S. Automotive affiliates. At June 30, 2017, the utilized portion of the corporate credit facility was about $35 million, representing amounts utilized for letters of credit. At June 30, 2017, the utilized portion of the local credit facilities was about $980 million.
Our corporate credit facility was amended as of April 28, 2017 to extend the maturities by one year. Lenders under our corporate credit facility have commitments to us totaling $13.4 billion, with 75% of the commitments maturing on April 30, 2022 and 25% of the commitments maturing on April 30, 2020. We have allocated $3 billion of commitments to Ford Credit on an irrevocable and exclusive basis to support its growth and liquidity. Any borrowings by Ford Credit under the corporate credit facility would be guaranteed by us.
The corporate credit facility is unsecured and free of material adverse change conditions to borrowing, restrictive financial covenants (for example, interest or fixed charge coverage ratio, debt-to-equity ratio, and minimum net worth requirements), and credit rating triggers that could limit our ability to obtain funding. The corporate credit facility contains a liquidity covenant that requires us to maintain a minimum of $4 billion in aggregate of domestic cash, cash equivalents, and loaned and marketable securities and/or availability under the facility. If our senior, unsecured, long-term debt does not maintain at least two investment grade ratings from Fitch, Moody's, and S&P (each as defined under "Credit Ratings" below), the guarantees of certain subsidiaries will be required.
Debt. Total Automotive debt at June 30, 2017 was $16.2 billion, which is $280 million higher than at December 31, 2016. The increase is more than explained by an increase in local debt in international markets (including the impact of the adoption of ASC 606, Revenue from Contracts with Customers) and foreign currency exchange effects, partially offset by debt repayments.
Leverage. We manage Automotive debt levels with a leverage framework to maintain strong, investment grade credit ratings through a normal business cycle. The leverage framework includes a ratio of Automotive debt, underfunded pension liabilities, operating leases, and other adjustments, divided by Automotive income before income tax, adjusted for depreciation, amortization, interest expense on Automotive debt, and other adjustments. Ford Credit's leverage is calculated as a separate business as described in the Liquidity - Financial Services section of Item 2. Ford Credit is self-funding and its debt, which is used to fund its operations, is separate from our Automotive debt.
57
Item 2. Management's Discussion and Analysis of Financial Condition and Results of Operations (Continued)
Financial Services Segment
Ford Credit
Funding Overview. Ford Credit's primary funding and liquidity objective is to be well capitalized with a strong investment grade balance sheet and ample liquidity to support its financing activities and growth under a variety of market conditions, including short-term and long-term market disruptions. Ford Credit's funding strategy remains focused on diversification, and it plans to continue accessing a variety of markets, channels, and investors.
Ford Credit's liquidity profile continues to be diverse, robust, and focused on maintaining liquidity levels that meet its business and funding requirements. Ford Credit annually stress tests its balance sheet and liquidity to ensure that it continues to meet its financial obligations through economic cycles.
Funding Portfolio. The chart below shows the trends in funding for Ford Credit's managed receivables:
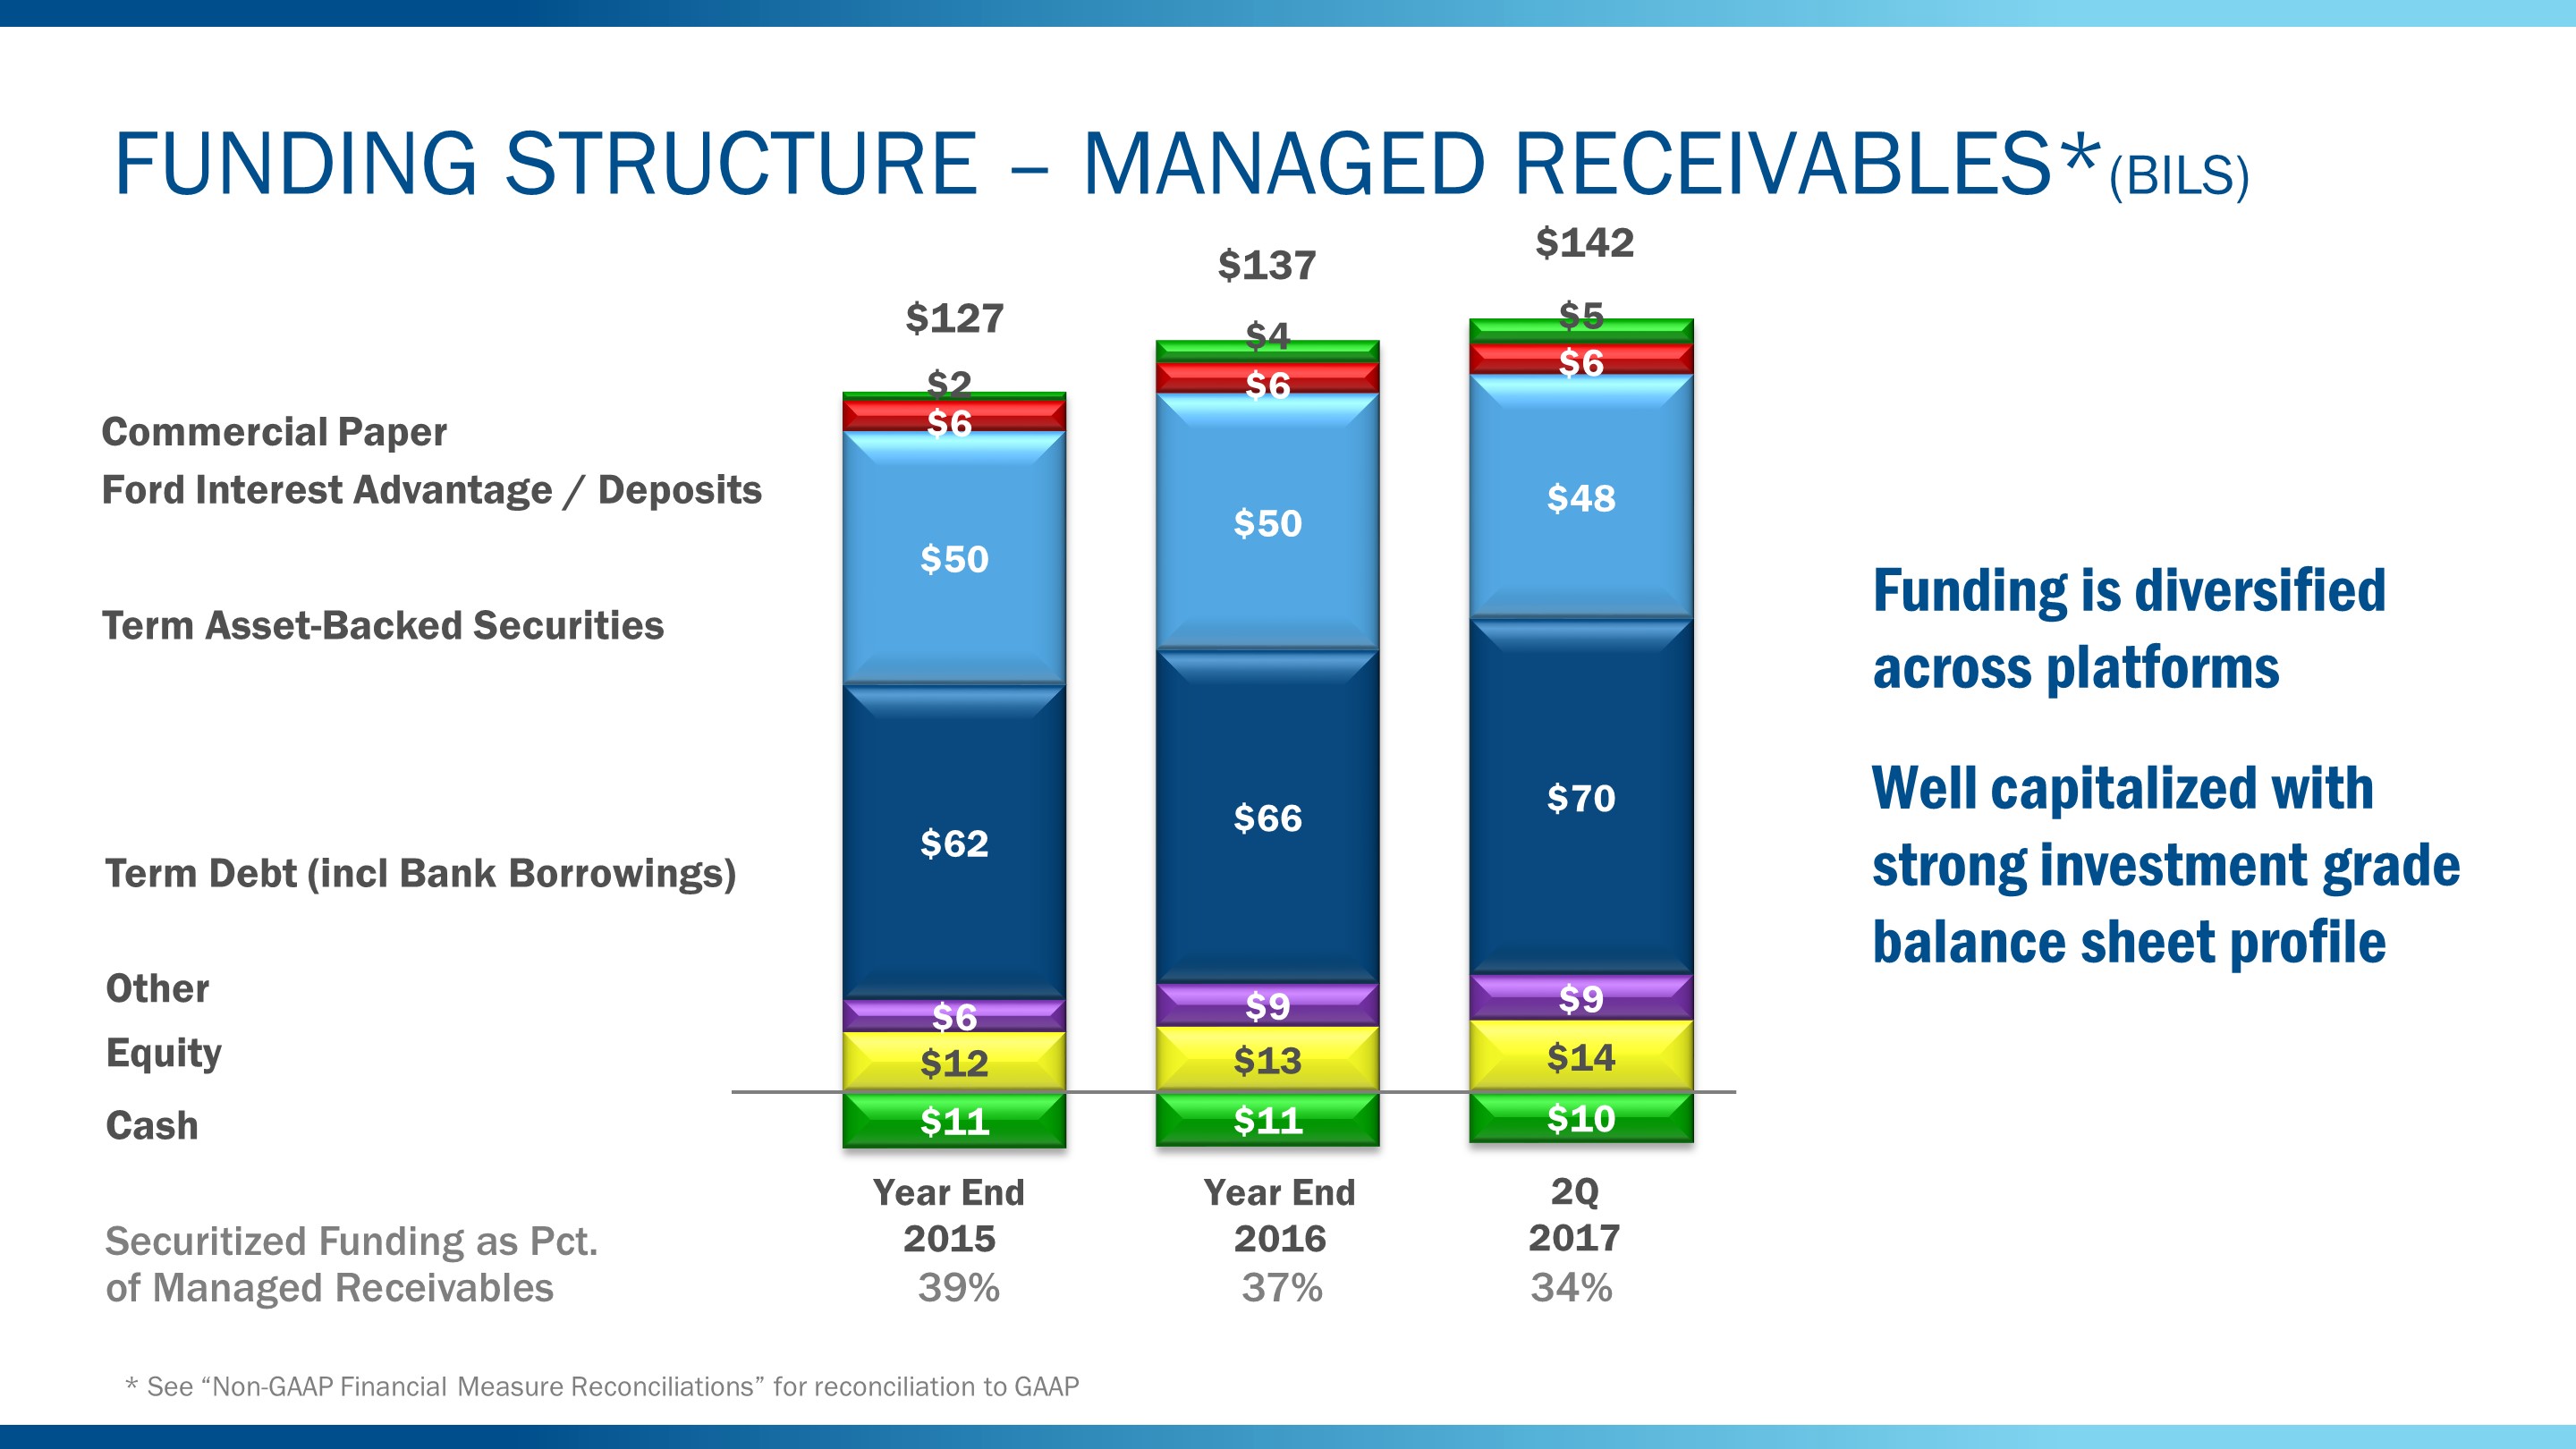
Managed receivables of $142 billion as of June 30, 2017, were funded primarily with term debt and term asset-backed securities. Securitized funding as a percent of managed receivables was 34%.
Ford Credit expects the mix of securitized funding to remain around 35%. The calendarization of the funding plan will result in quarterly fluctuations of the securitized funding percentage.
In April 2017, FCE Bank plc launched retail deposits in the United Kingdom backed by the U.K. Financial Service Compensation Scheme, which further diversifies its funding. As of June 30, 2017, retail deposits represented about $100 million of funding.
58
Item 2. Management's Discussion and Analysis of Financial Condition and Results of Operations (Continued)
Public Term Funding Plan. The following chart shows Ford Credit's issuances for full-year 2015 and 2016, planned issuances for full-year 2017, and its global public term funding issuances through July 25, 2017, excluding short-term funding programs:
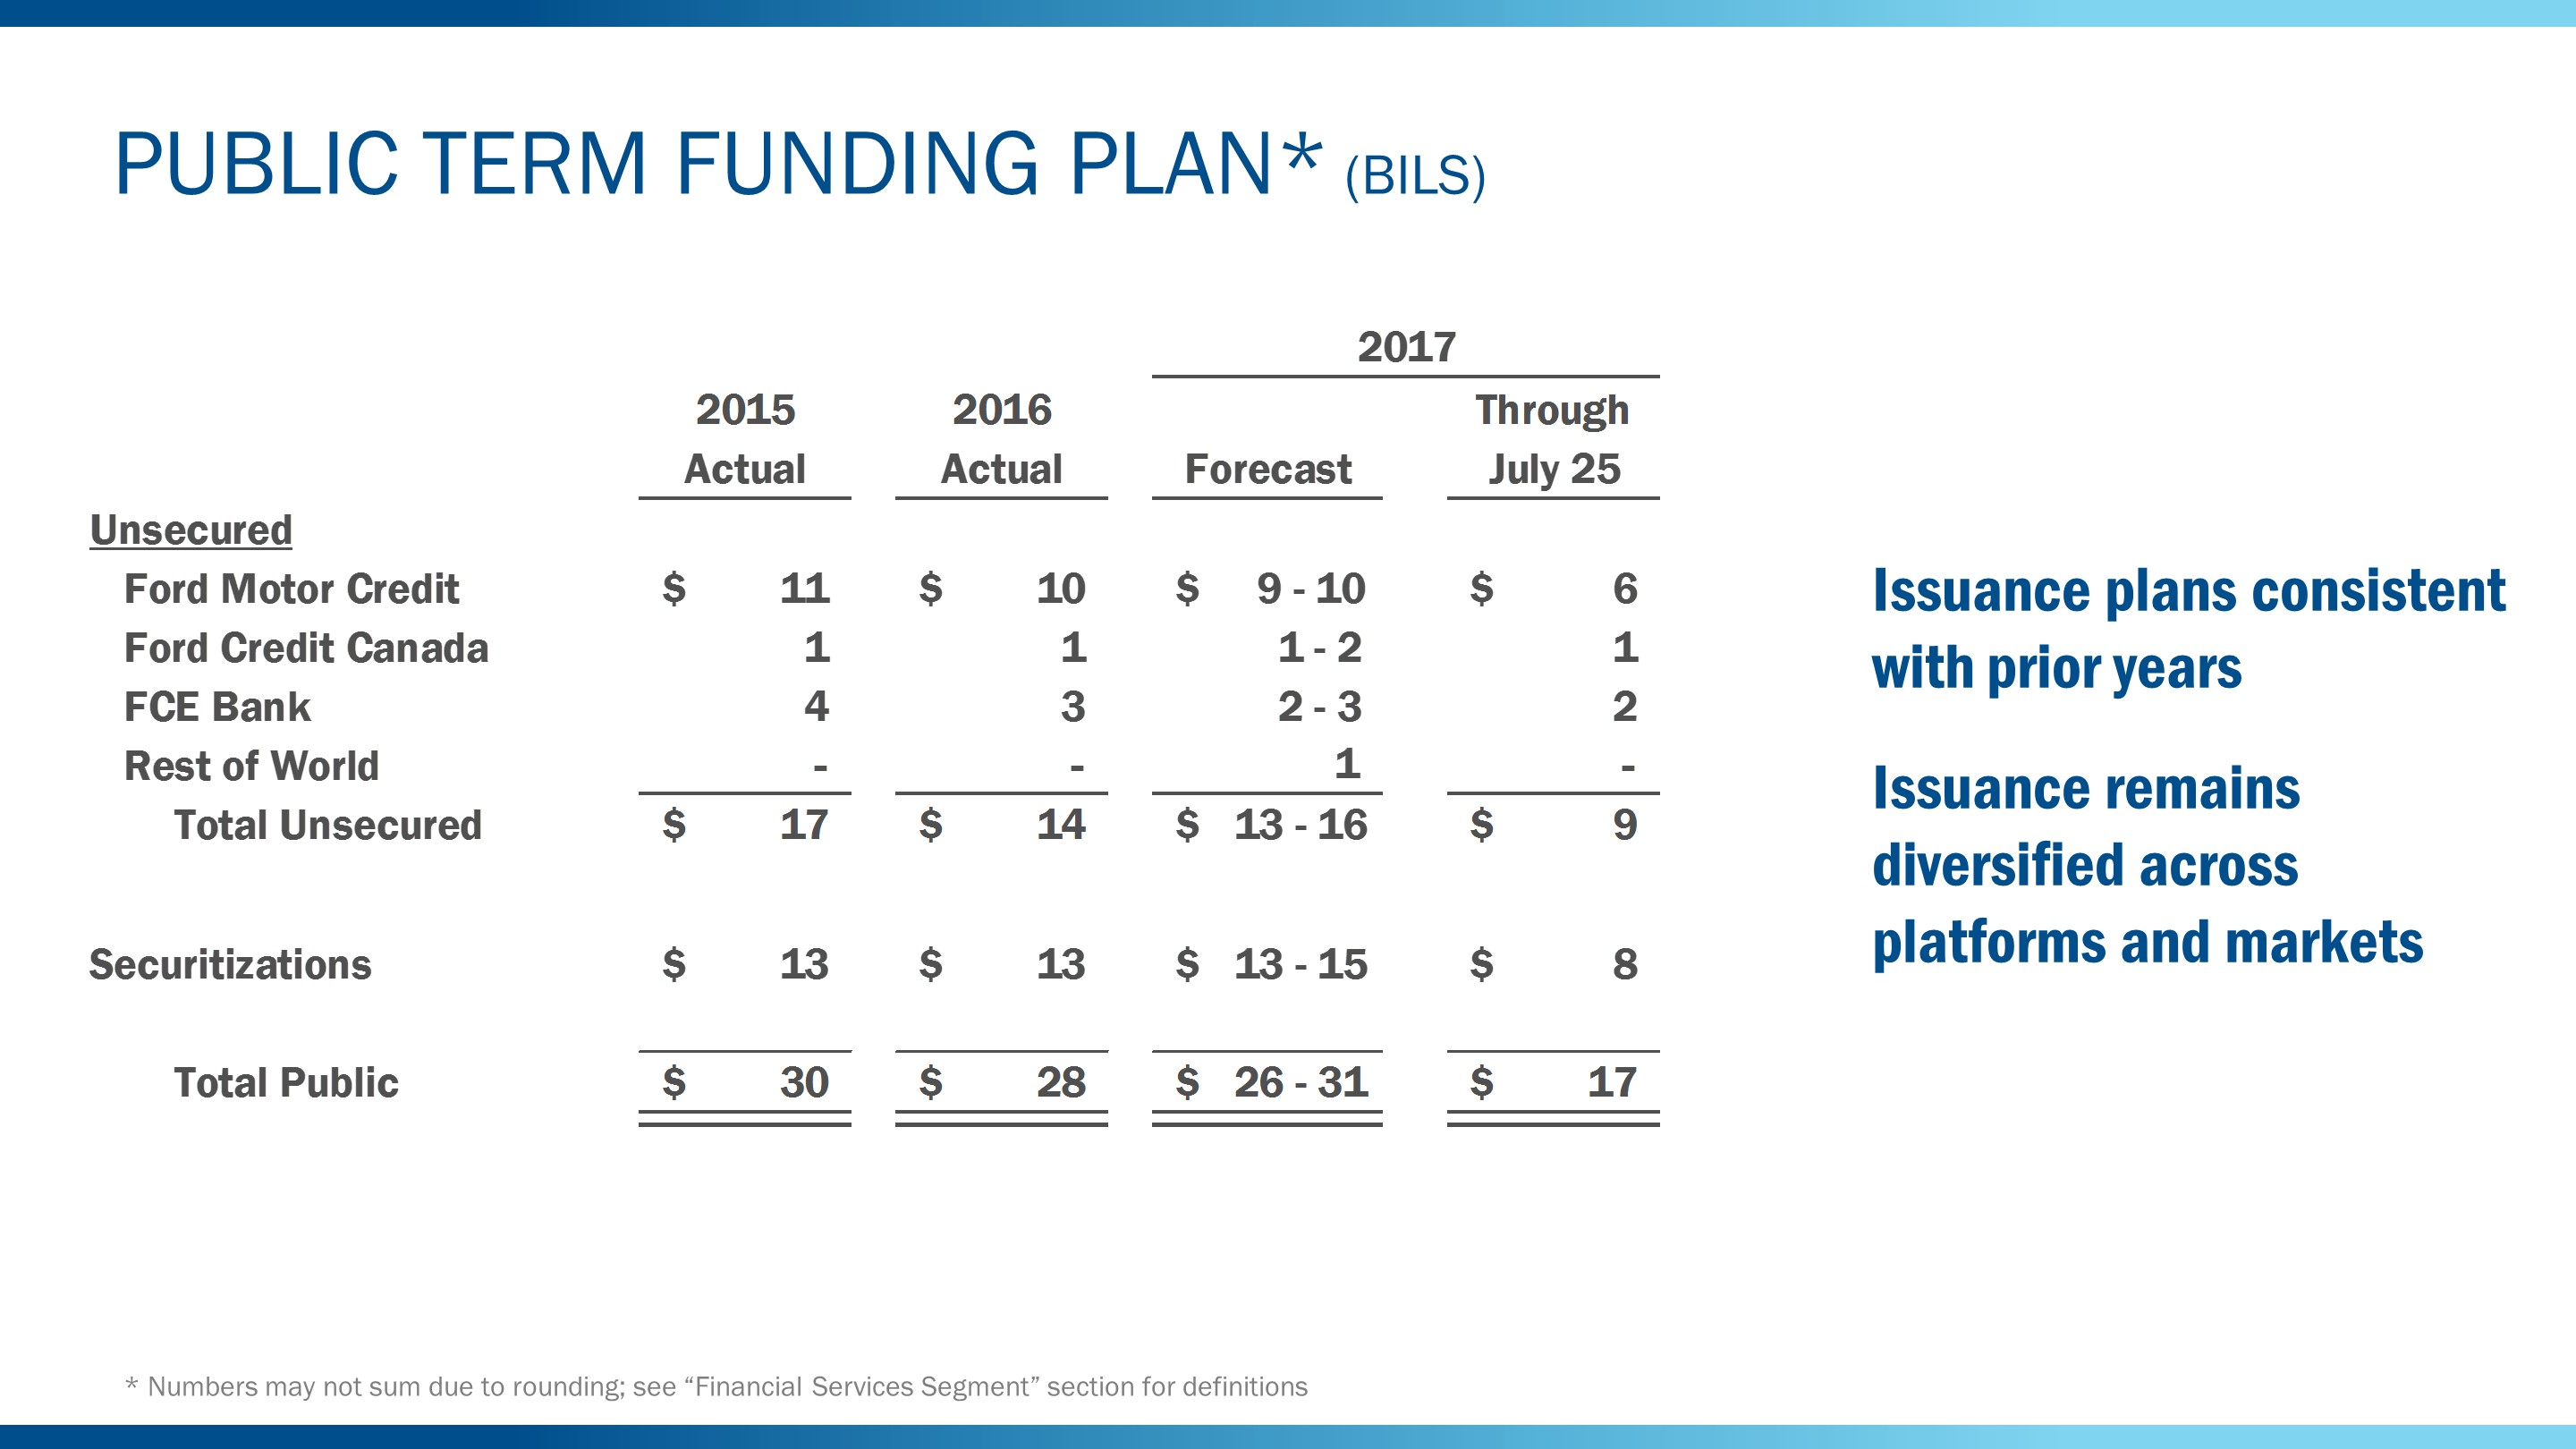
For 2017, Ford Credit's full-year forecast for public term funding is in the range of $26 billion to $31 billion. Through July 25, 2017, Ford Credit has completed over $17 billion of public term issuance.
59
Item 2. Management's Discussion and Analysis of Financial Condition and Results of Operations (Continued)
Liquidity. Ford Credit defines gross liquidity as cash, cash equivalents, and marketable securities (excluding amounts related to insurance activities) and committed capacity (which includes its credit and asset-backed facilities and bank lines), less utilization of liquidity. Utilization of liquidity is the amount funded under Ford Credit's liquidity sources and also includes the cash and cash equivalents required to support securitization transactions. Securitization cash is cash held for the benefit of the securitization investors (for example, a reserve fund). Net liquidity available for use is defined as gross liquidity less certain adjustments for asset-backed capacity in excess of eligible receivables and cash related to the Ford Credit Revolving Extended Variable-utilization program ("FordREV"), which can be accessed through future sales of receivables. While not included in available liquidity, these adjustments represent additional funding sources for future originations
The following chart shows Ford Credit's liquidity sources and utilization:
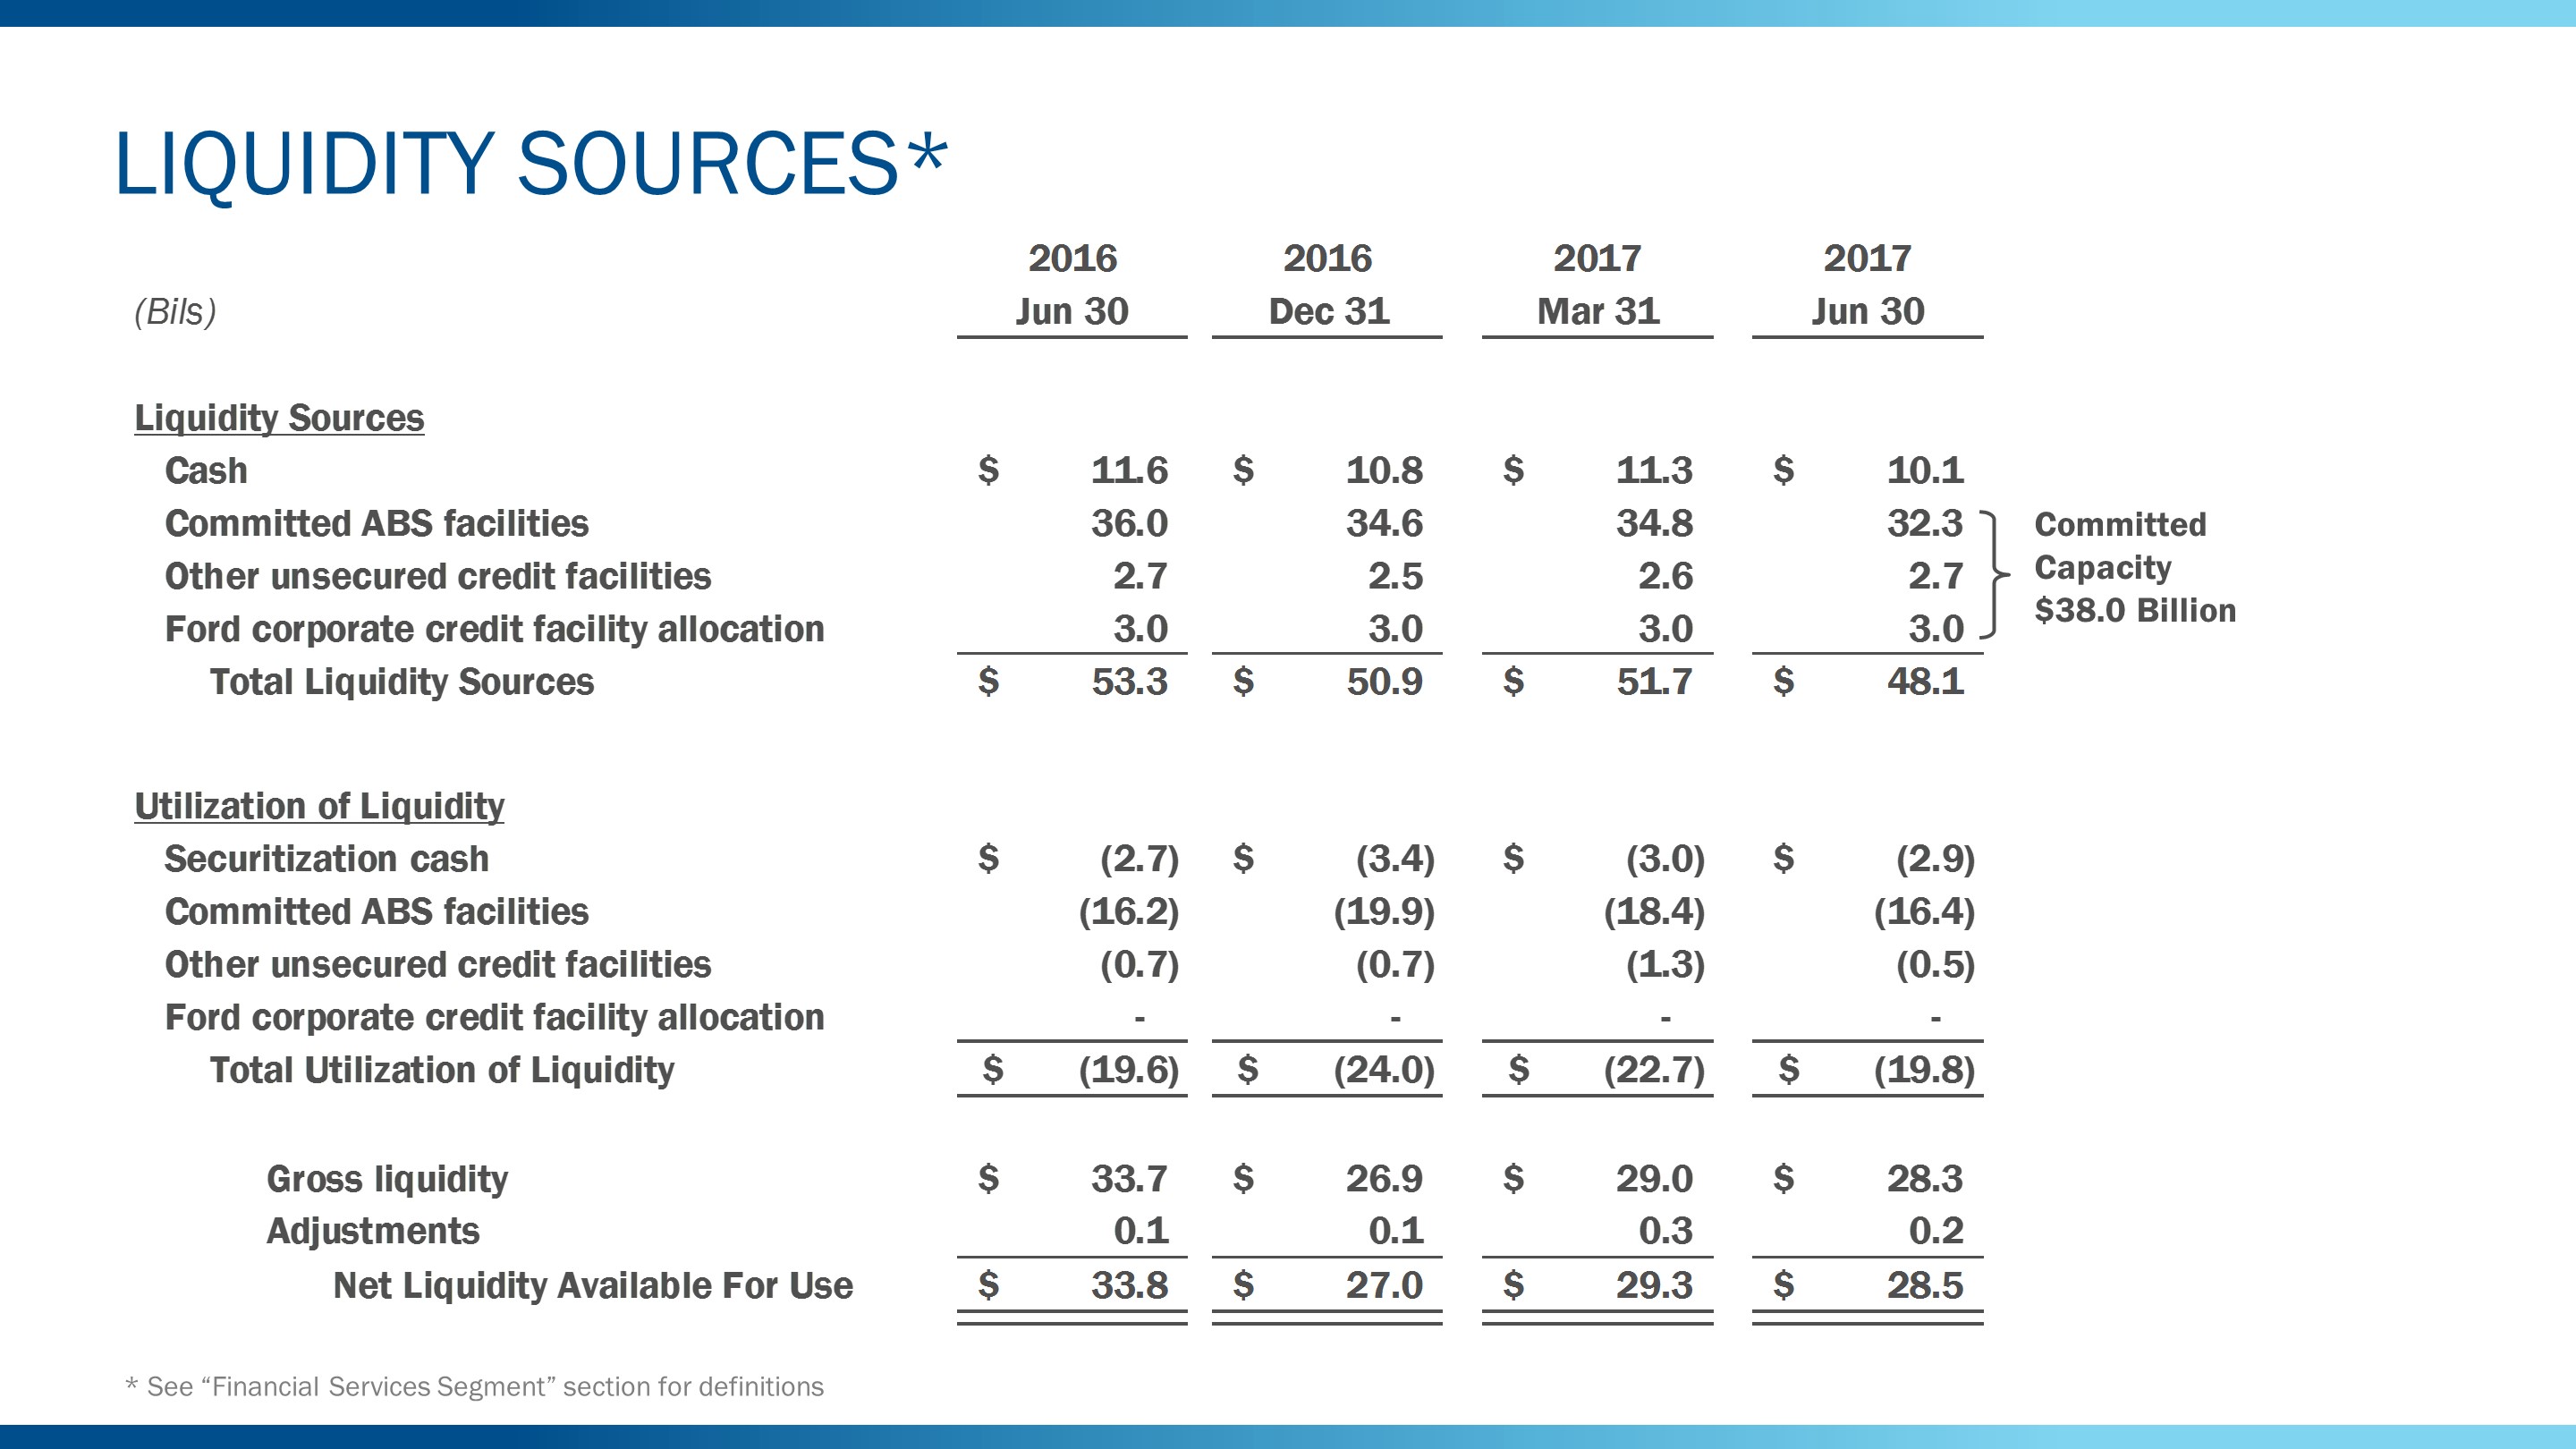
Ford Credit's liquidity available for use will fluctuate quarterly based on factors including near-term debt maturities, receivable growth, and timing of funding transactions. Ford Credit targets liquidity of at least $25 billion. At June 30, 2017, Ford Credit's liquidity available for use was $1.5 billion higher than at year-end 2016 and $0.8 billion lower than at March 31, 2017.
As of June 30, 2017, Ford Credit's liquidity remained strong at $28.5 billion. Ford Credit's sources of liquidity include cash, committed asset-backed facilities, unsecured credit facilities, and the corporate credit facility allocation. As of June 30, 2017, Ford Credit's liquidity sources totaled $48.1 billion, down $2.8 billion from year-end 2016.
60
Item 2. Management's Discussion and Analysis of Financial Condition and Results of Operations (Continued)
Leverage. Ford Credit uses leverage, or the debt-to-equity ratio, to make various business decisions, including evaluating and establishing pricing for finance receivable and operating lease financing, and assessing its capital structure.
The chart below shows the calculation of Ford Credit's financial statement leverage and managed leverage:
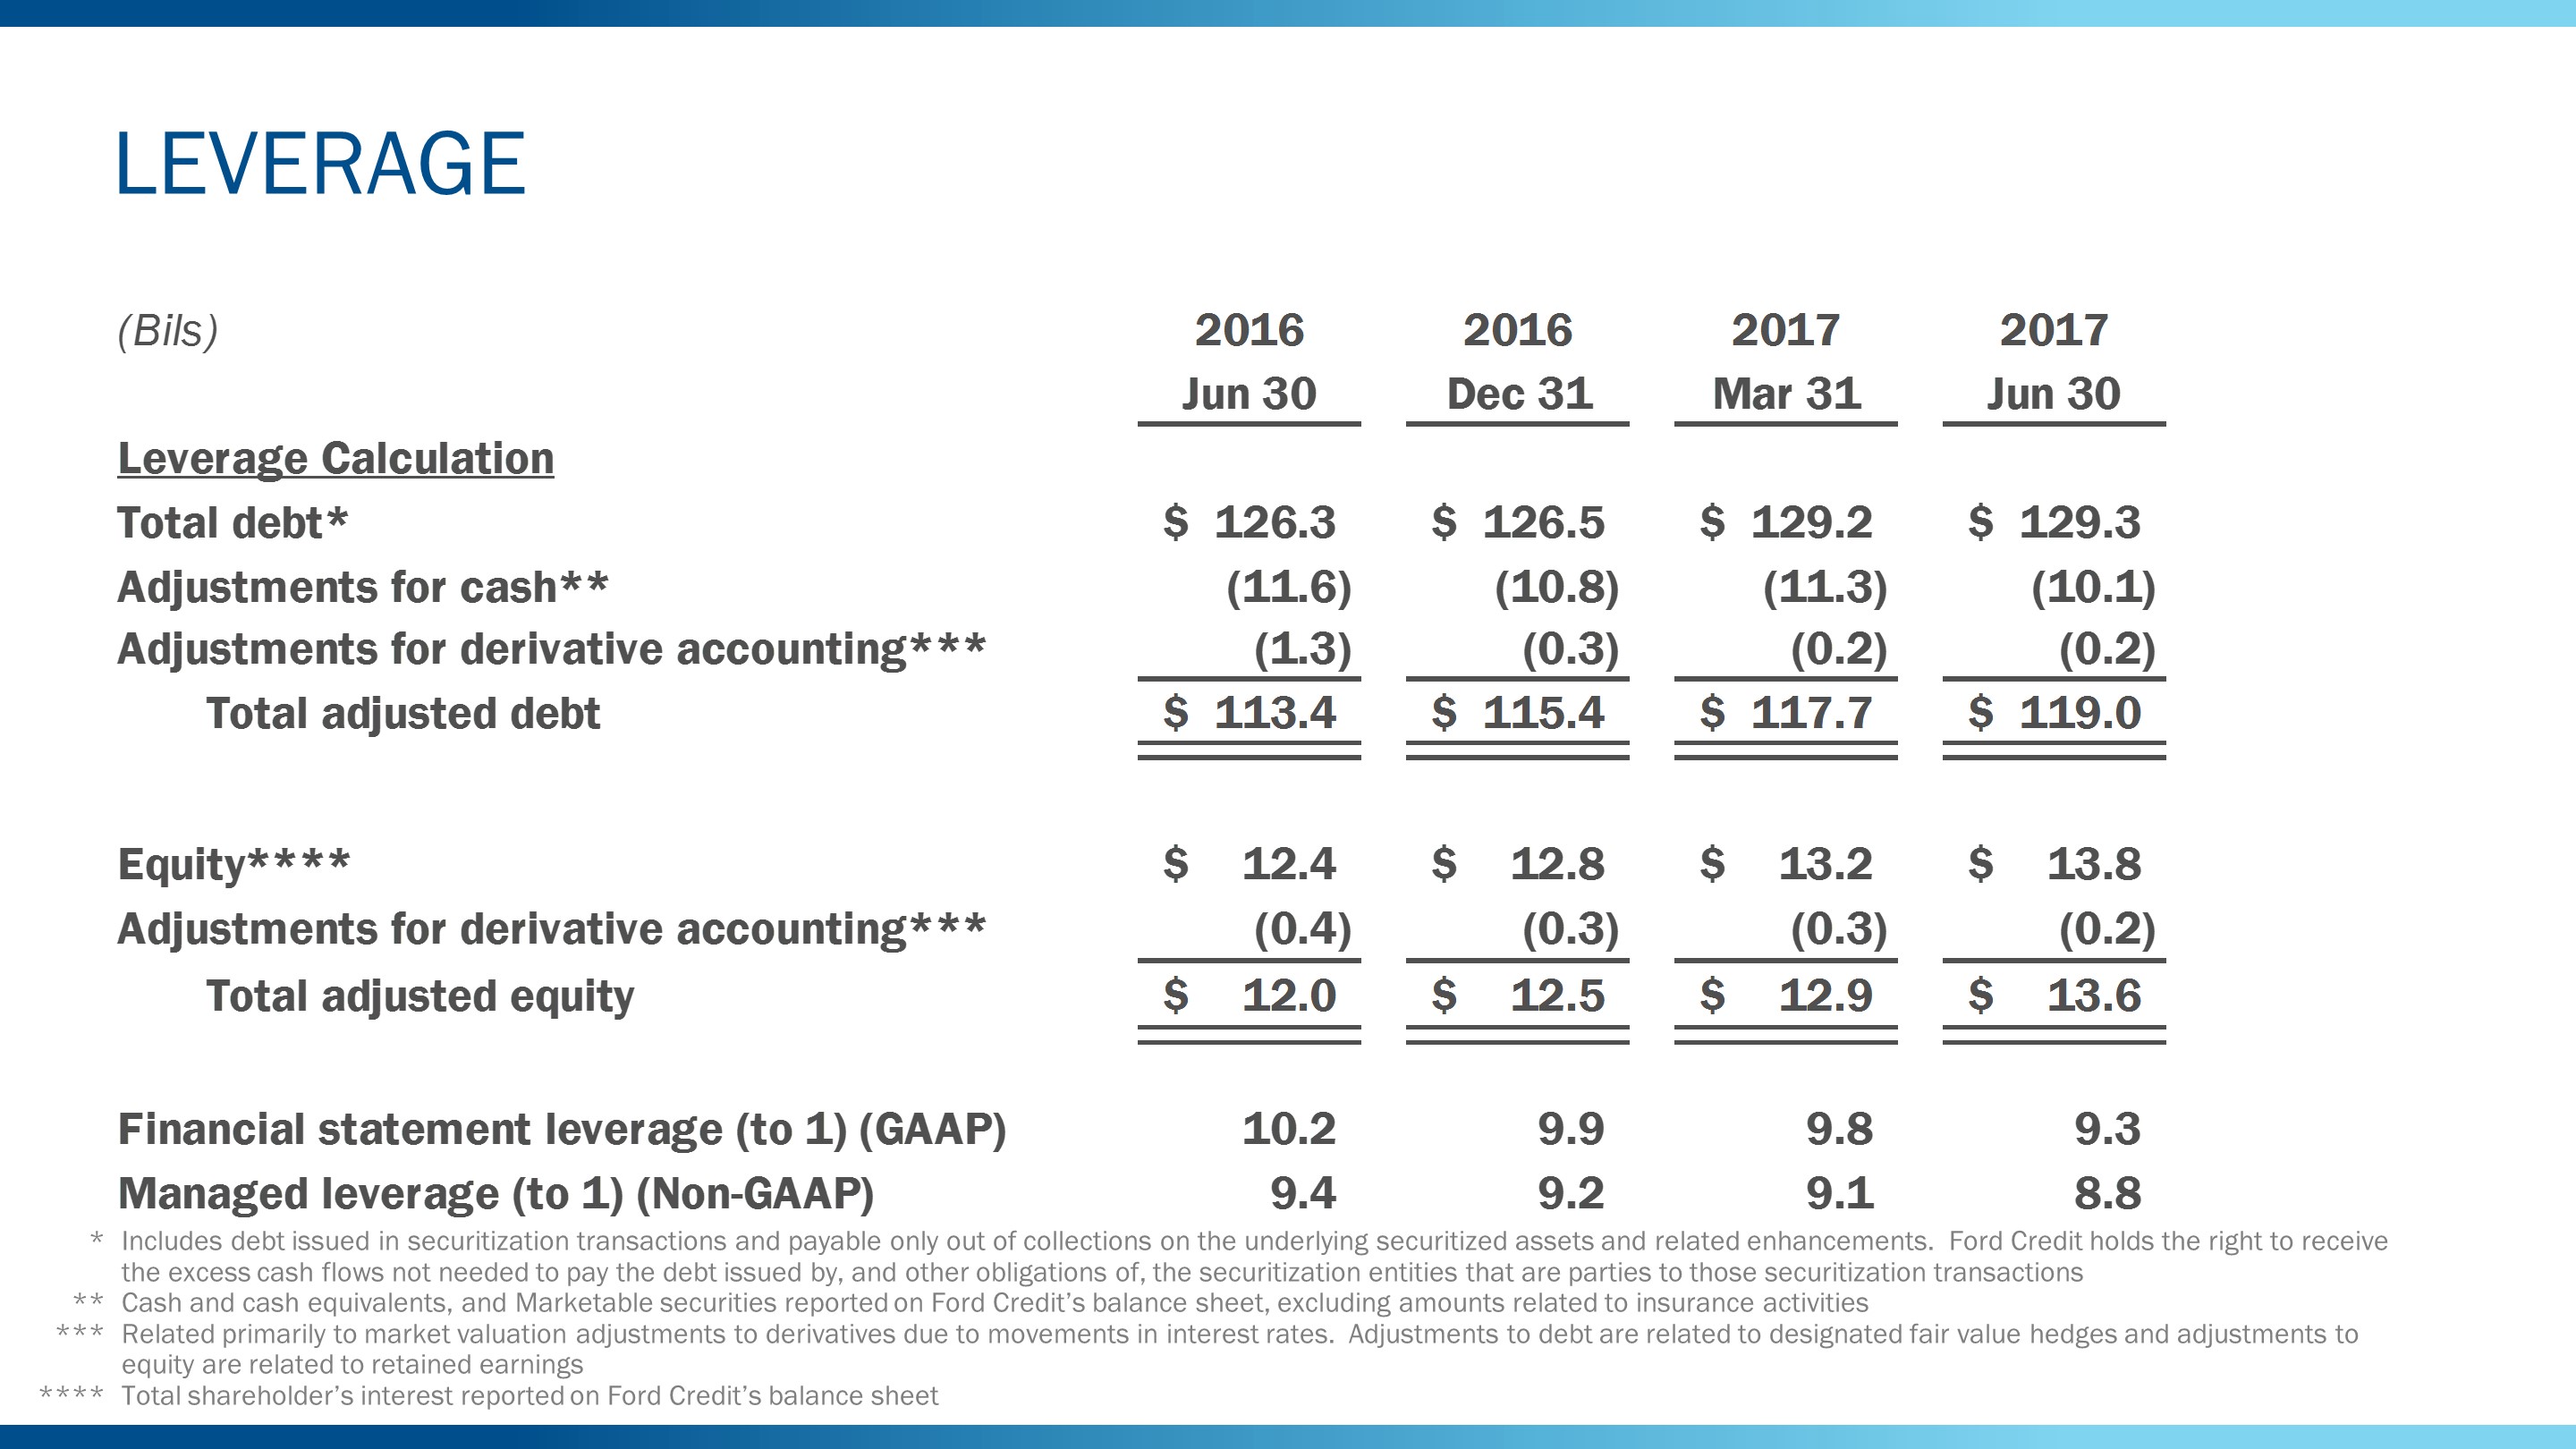
Ford Credit plans its managed leverage by considering prevailing market conditions and the risk characteristics of its business. At June 30, 2017, Ford Credit's financial statement leverage was 9.3:1, and its managed leverage was 8.8:1. Ford Credit targets managed leverage in the range of 8:1 to 9:1.
61
Item 2. Management's Discussion and Analysis of Financial Condition and Results of Operations (Continued)
Total Company
Pension Plans - Underfunded Balances. As of June 30, 2017, our total Company pension underfunded status reported on our balance sheet was $8.3 billion and reflects the net underfunded status at December 31, 2016 updated for service and interest cost, expected return on assets, separation expense, actual benefit payments, and cash contributions. The discount rate and rate of expected return assumptions are unchanged from year-end 2016, and the reported number does not reflect any impact from the changes in interest rates since year-end 2016.
Based on our planning assumptions for asset returns, discount rates, and contributions, we expect our funded status to improve at year-end 2017 compared to the end of last year.
CREDIT RATINGS
Our short-term and long-term debt is rated by four credit rating agencies designated as nationally recognized statistical rating organizations ("NRSROs") by the U.S. Securities and Exchange Commission:
• | DBRS Limited ("DBRS"); |
• | Fitch, Inc. ("Fitch"); |
• | Moody's Investors Service, Inc. ("Moody's"); and |
• | Standard & Poor's Ratings Services, a division of McGraw Hill Financial ("S&P"). |
In several markets, locally-recognized rating agencies also rate us. A credit rating reflects an assessment by the rating agency of the credit risk associated with a corporate entity or particular securities issued by that entity. Rating agencies' ratings of us are based on information provided by us and other sources. Credit ratings are not recommendations to buy, sell, or hold securities, and are subject to revision or withdrawal at any time by the assigning rating agency. Each rating agency may have different criteria for evaluating company risk and, therefore, ratings should be evaluated independently for each rating agency.
There have been no rating actions taken by these NRSROs since the filing of our Quarterly Report on Form 10-Q for the quarter ended March 31, 2017.
The following chart summarizes certain of the credit ratings and outlook presently assigned by these four NRSROs:
| NRSRO RATINGS | ||||||||||||
| Ford |
| Ford Credit |
| NRSROs | ||||||||
| Issuer Default / Corporate / Issuer Rating |
| Long-Term Senior Unsecured |
| Outlook / Trend |
| Long-Term Senior Unsecured |
| Short-Term Unsecured |
| Outlook / Trend |
| Minimum Long-Term Investment Grade Rating |
DBRS | BBB |
| BBB |
| Stable |
| BBB |
| R-2M |
| Stable |
| BBB (low) |
Fitch | BBB |
| BBB |
| Stable |
| BBB |
| F2 |
| Stable |
| BBB- |
Moody's | N/A |
| Baa2 |
| Stable |
| Baa2 |
| P-2 |
| Stable |
| Baa3 |
S&P | BBB |
| BBB |
| Stable |
| BBB |
| A-2 |
| Stable |
| BBB- |
62
Item 2. Management's Discussion and Analysis of Financial Condition and Results of Operations (Continued)
GDP AND INDUSTRY PLANNING ASSUMPTIONS
Based on the current environment, our GDP and industry planning assumptions include the following:
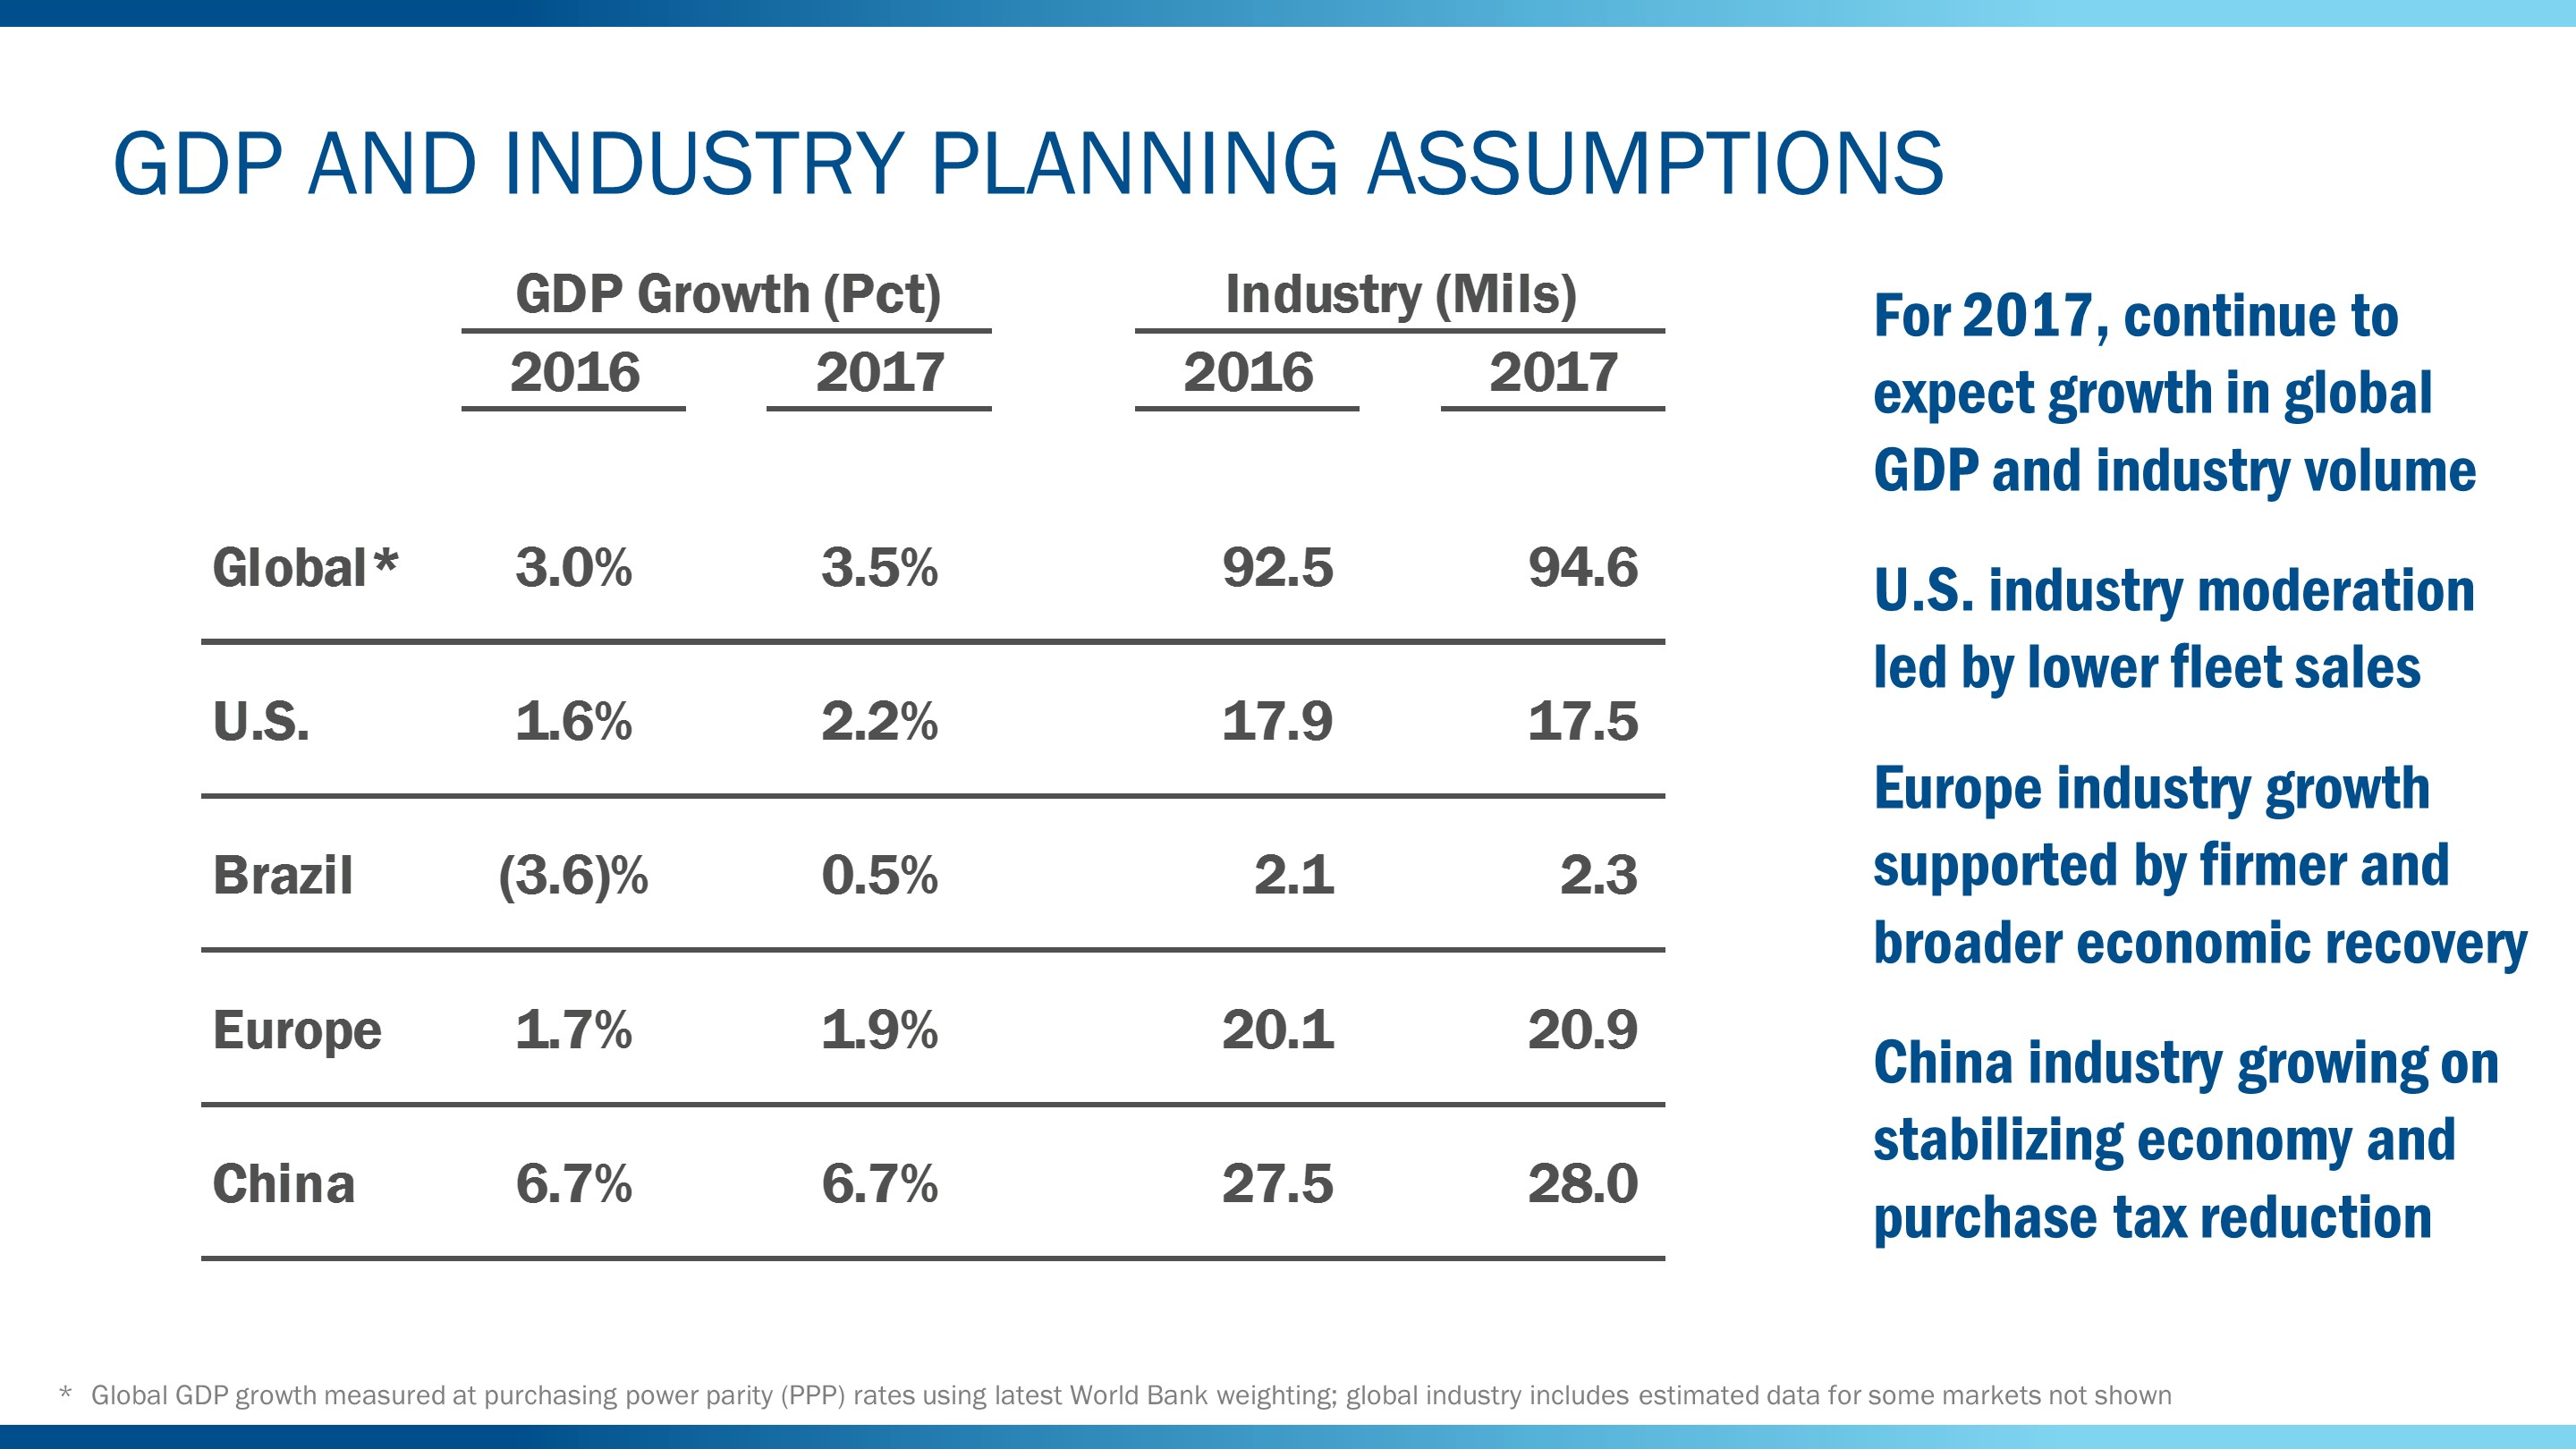
Since the filing of our Quarterly Report on Form 10-Q for the quarter ended March 31, 2017, we have updated our expectations for full year industry sales for the United States, Brazil, Europe, and China.
We are adjusting our 2017 guidance for the United States down to 17.5 million units, primarily because of a weaker fleet industry during the first half of the year. Retail volume remains slightly below our assumptions.
We have raised our outlook for Brazil to 2.3 million units based on second quarter volume, but we are monitoring the political risks.
In Europe, we expect industry volume to be slightly higher compared to our prior guidance for 2017, reflecting gains across most EU20 markets, with the exception of the United Kingdom.
In China, we expect industry volume at 28 million units in 2017 to be supported by a stabilizing economy and the continued tax incentive for vehicles with small displacement engines.
63
Item 2. Management's Discussion and Analysis of Financial Condition and Results of Operations (Continued)
PRODUCTION VOLUMES
The second quarter 2017 actual and third quarter 2017 forecasted production volumes for our Automotive business units are as follows:
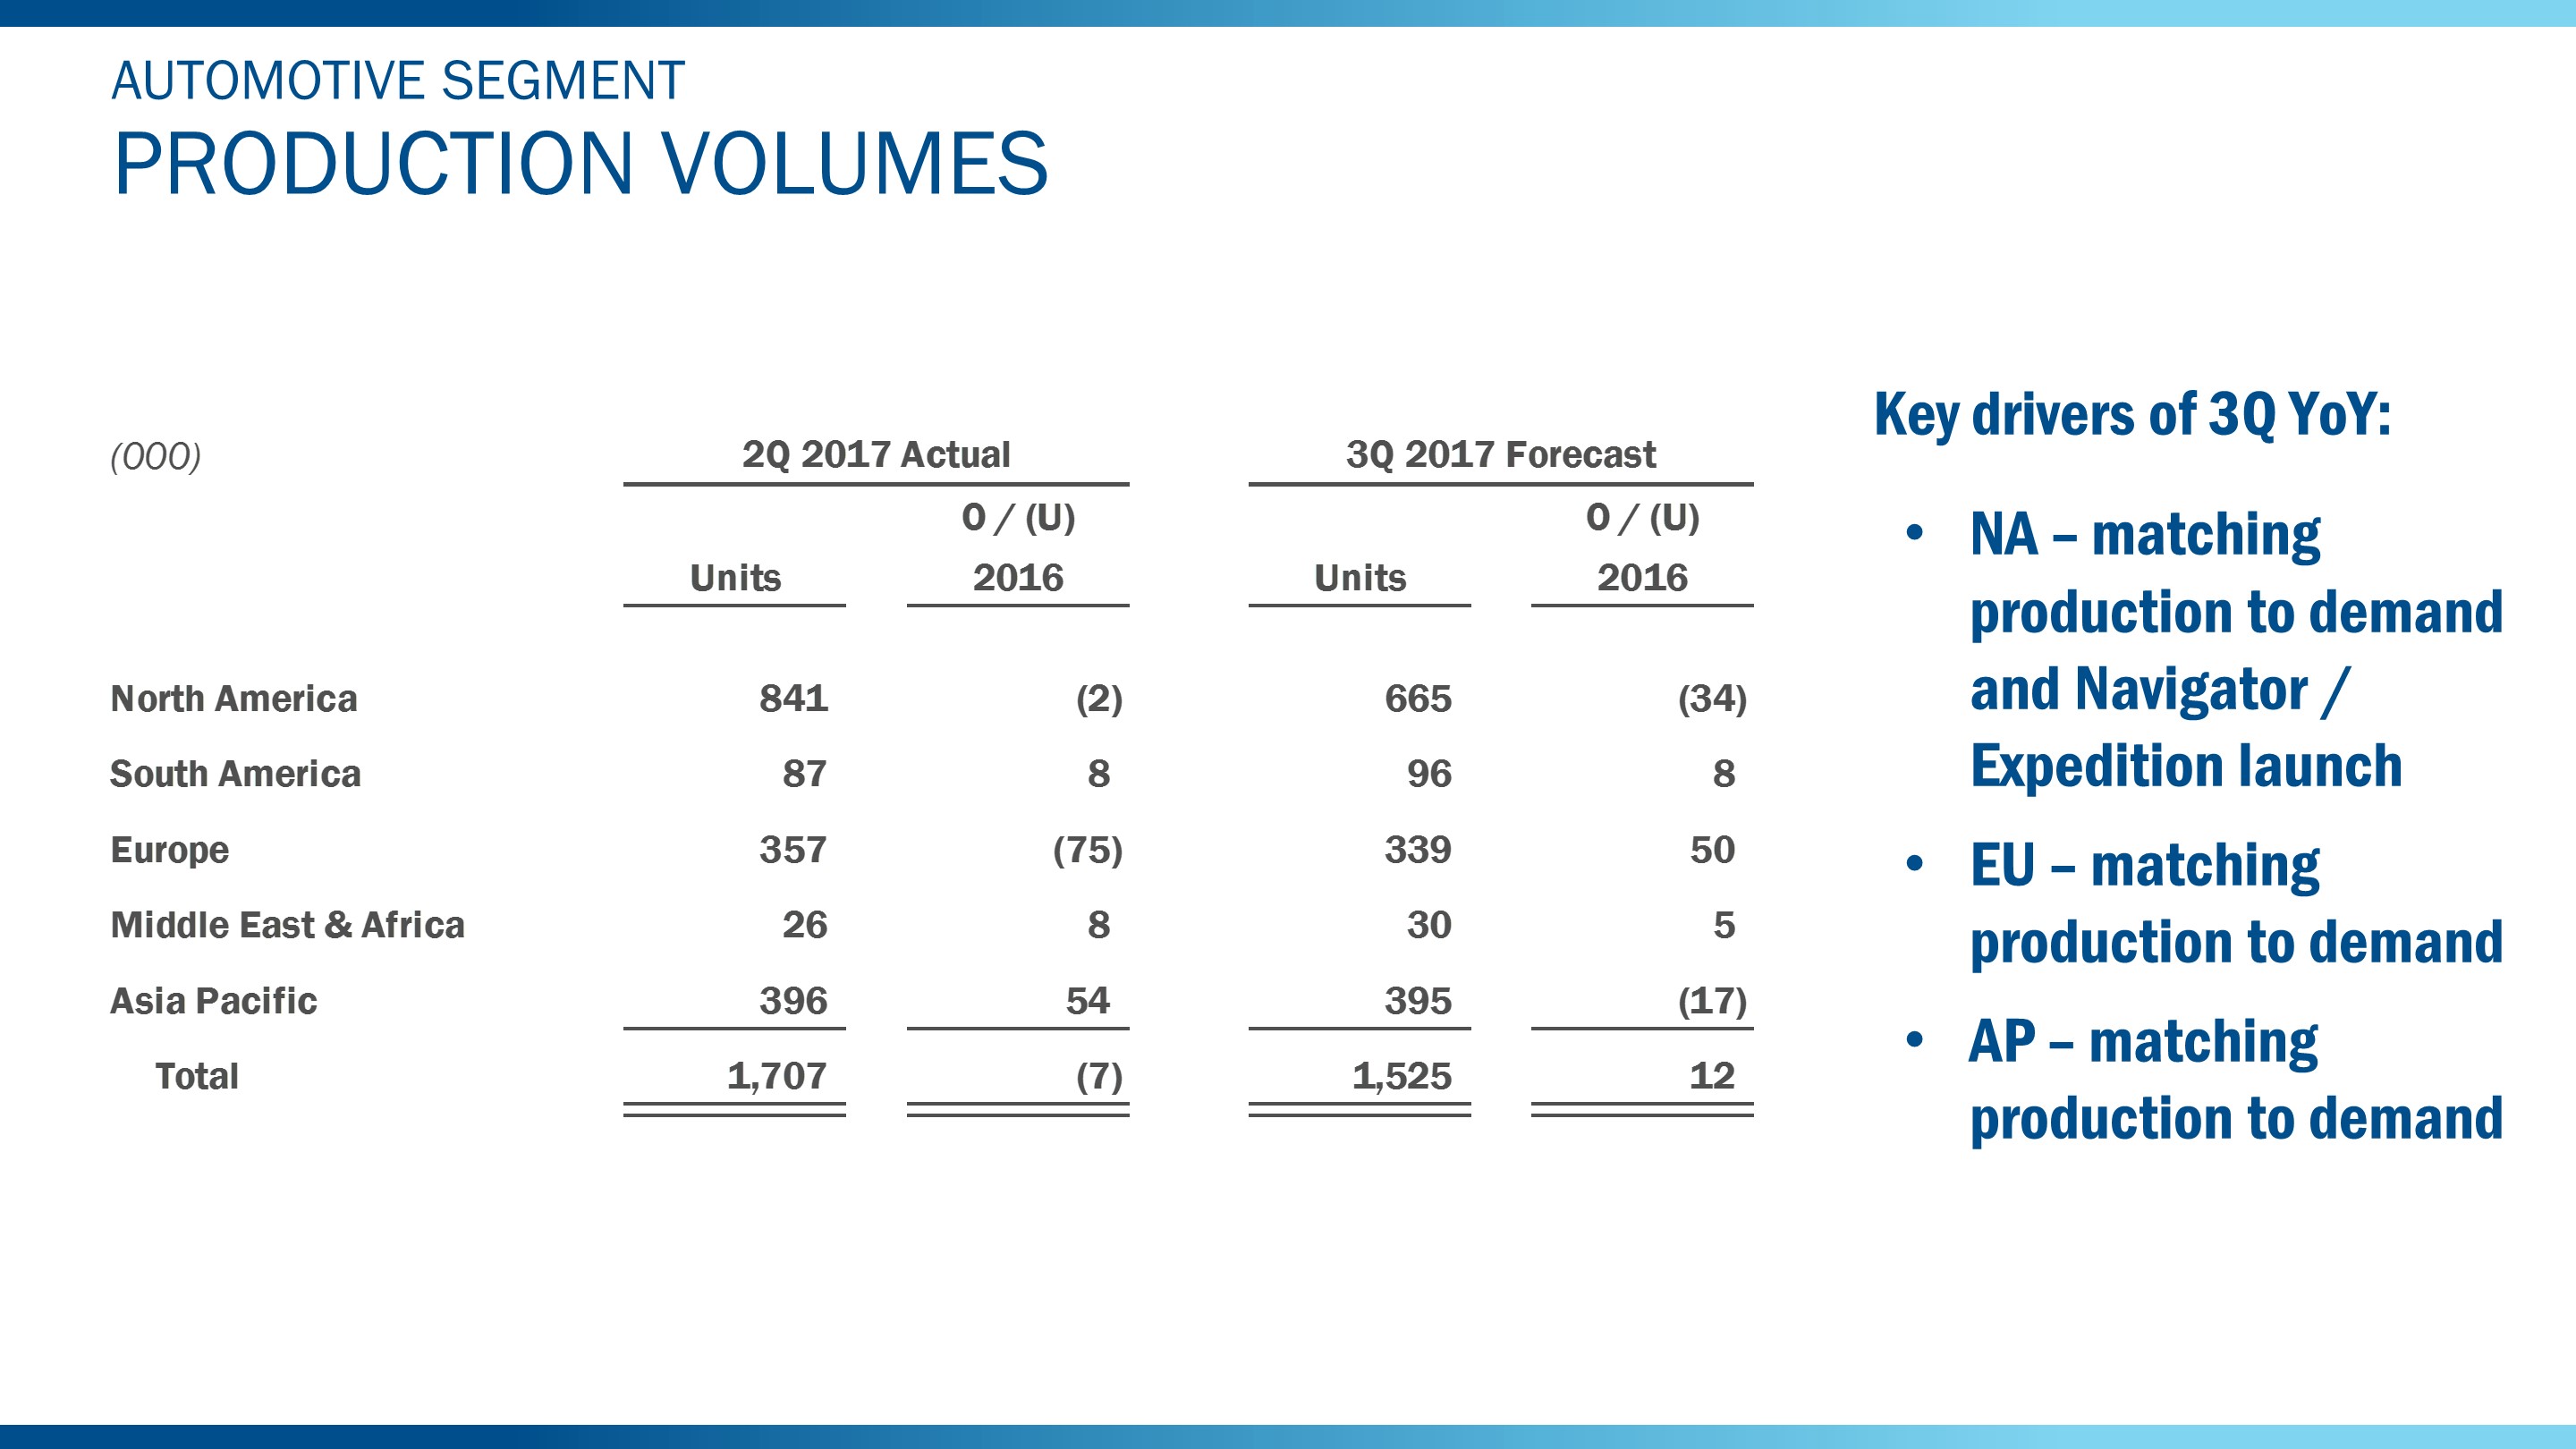
Production volumes above include Ford brand and JMC brand vehicles produced by our unconsolidated affiliates.
64
Item 2. Management's Discussion and Analysis of Financial Condition and Results of Operations (Continued)
OUTLOOK
Based on the current economic environment, our Company guidance for 2017 includes the following:
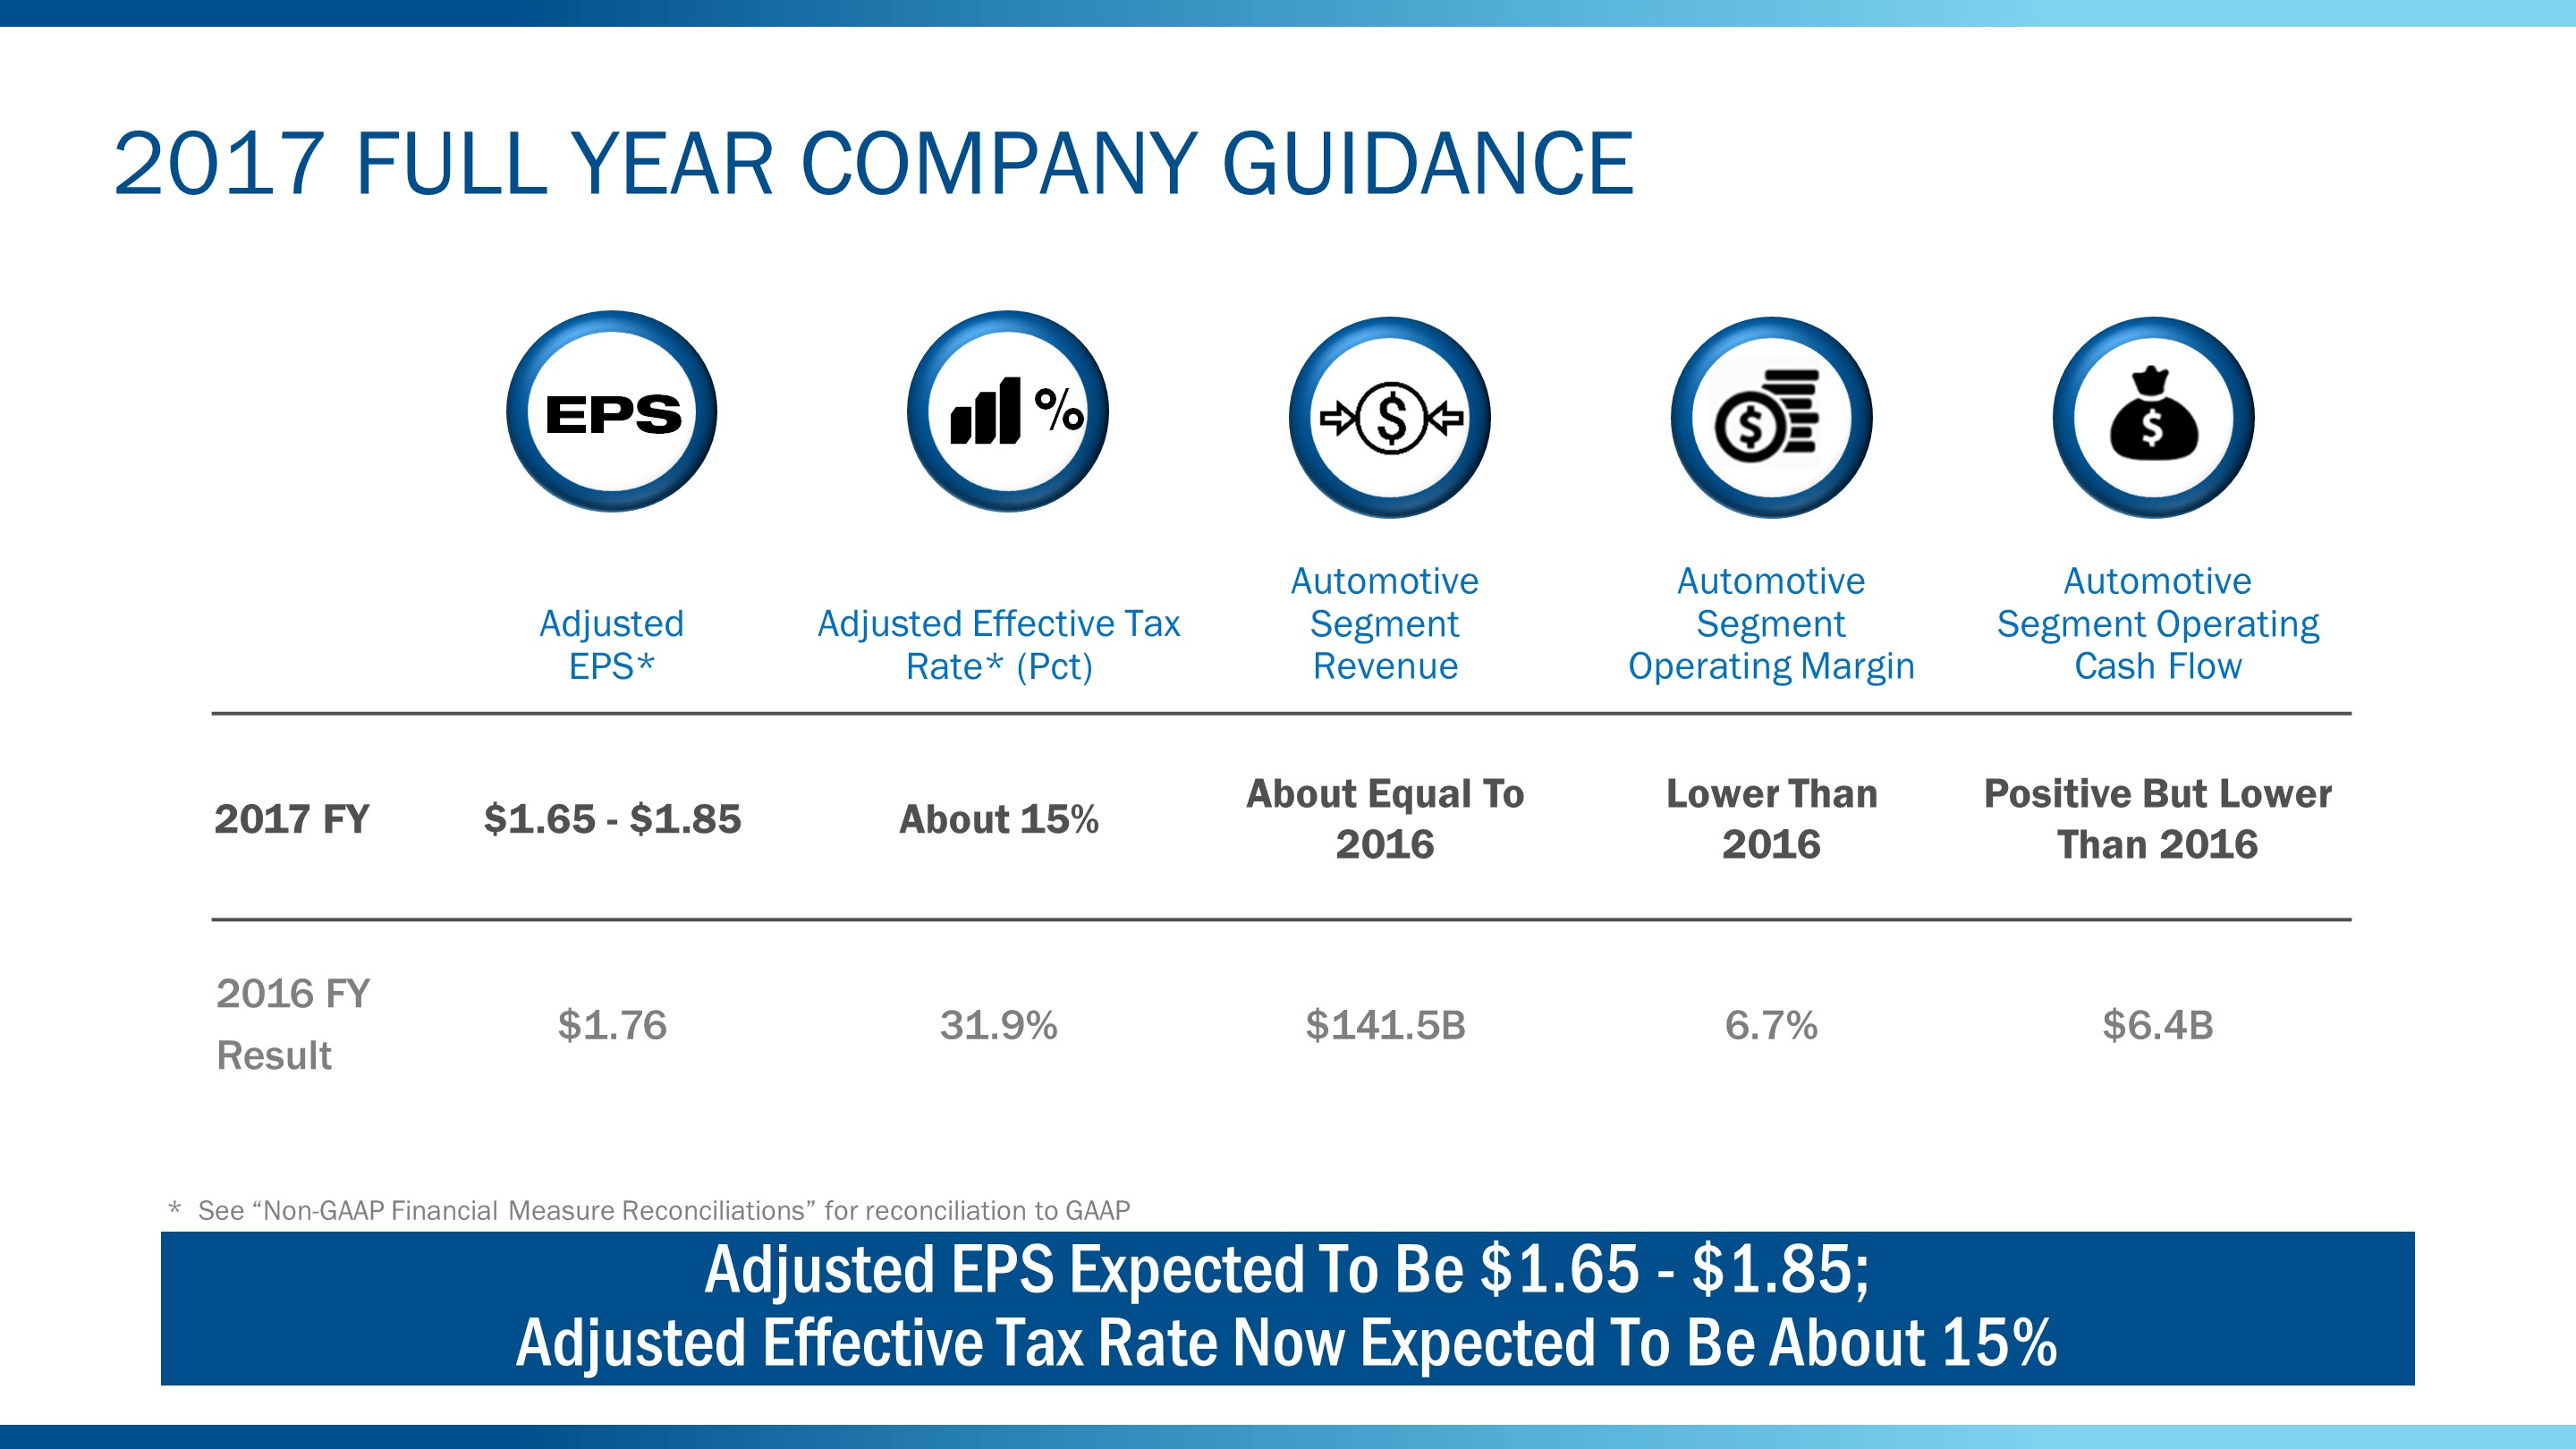
Effective this quarter, we are modifying our approach to Company guidance, adopting a range of adjusted earnings per share. For 2017, our full year guidance is for an adjusted EPS range of $1.65 to $1.85. This reflects different potential outcomes for market factors and cost performance, including warranty expense, over the balance of the year. It also reflects an adjusted effective tax rate of about 15%, which is substantially more favorable than prior guidance and reflects 2017 planned actions to bring foreign tax credits onto our balance sheet. We would expect to return to a more normal adjusted effective tax rate, about 30%, after this year.
Our prior guidance implied a full year adjusted EPS of $1.58. The improvement in our range of adjusted EPS versus the implied $1.58 is more than explained by the lower tax rate.
For the second half of the year, we expect total Company adjusted pre-tax profit to be lower than the first half, consistent with historical experience. The third quarter is expected to be the lowest quarterly profit of the year due to seasonal factors and the launch of the Expedition and Lincoln Navigator.
65
Item 2. Management's Discussion and Analysis of Financial Condition and Results of Operations (Continued)
Our business unit guidance for 2017 includes the following:
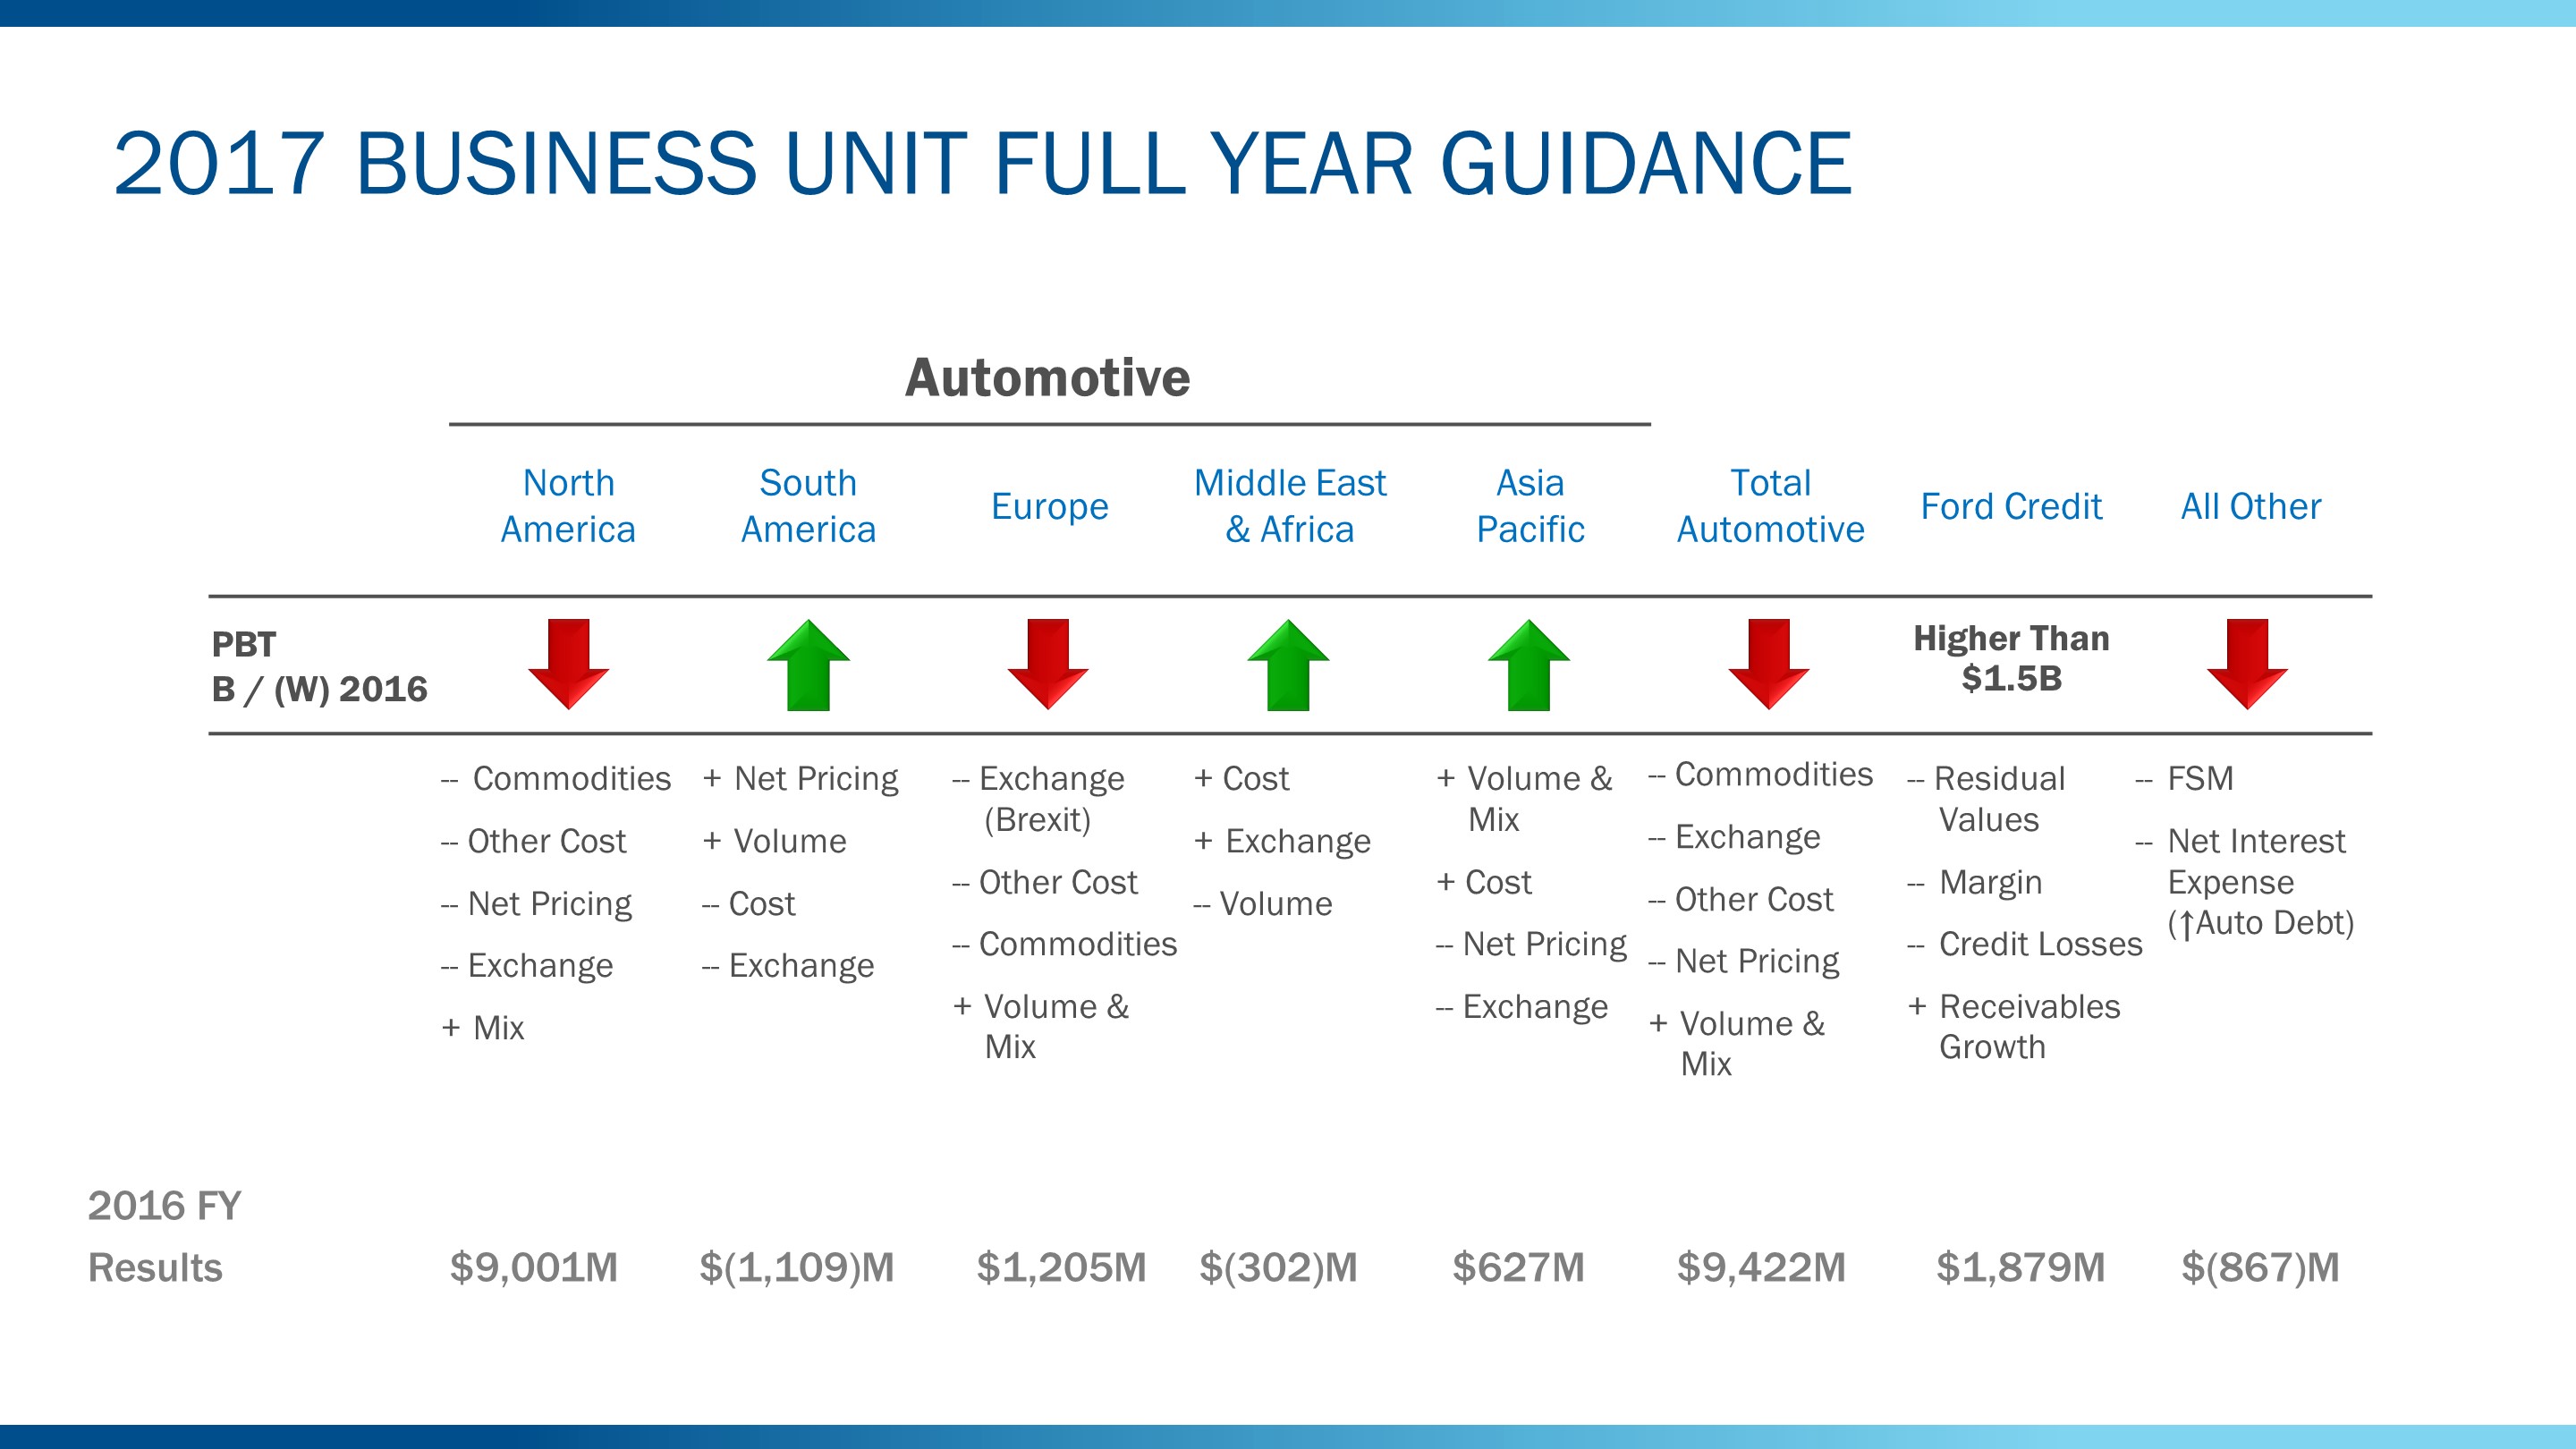
The business unit guidance above provides our latest assessment of full year 2017 "puts and takes" for each region or segment compared to results in 2016.
We are reassessing our 2018 guidance and will provide an updated view at a future date.
66
Item 2. Management's Discussion and Analysis of Financial Condition and Results of Operations (Continued)
NON-GAAP FINANCIAL MEASURE RECONCILIATIONS
The following charts show our Non-GAAP financial measure reconciliations for: Adjusted Pre-Tax Profit, Adjusted Earnings Per Share, Adjusted Effective Tax Rate, and Ford Credit Managed Receivables. The GAAP reconciliation for Ford Credit Managed Leverage can be found in the Financial Services Segment section of "Liquidity and Capital Resources."
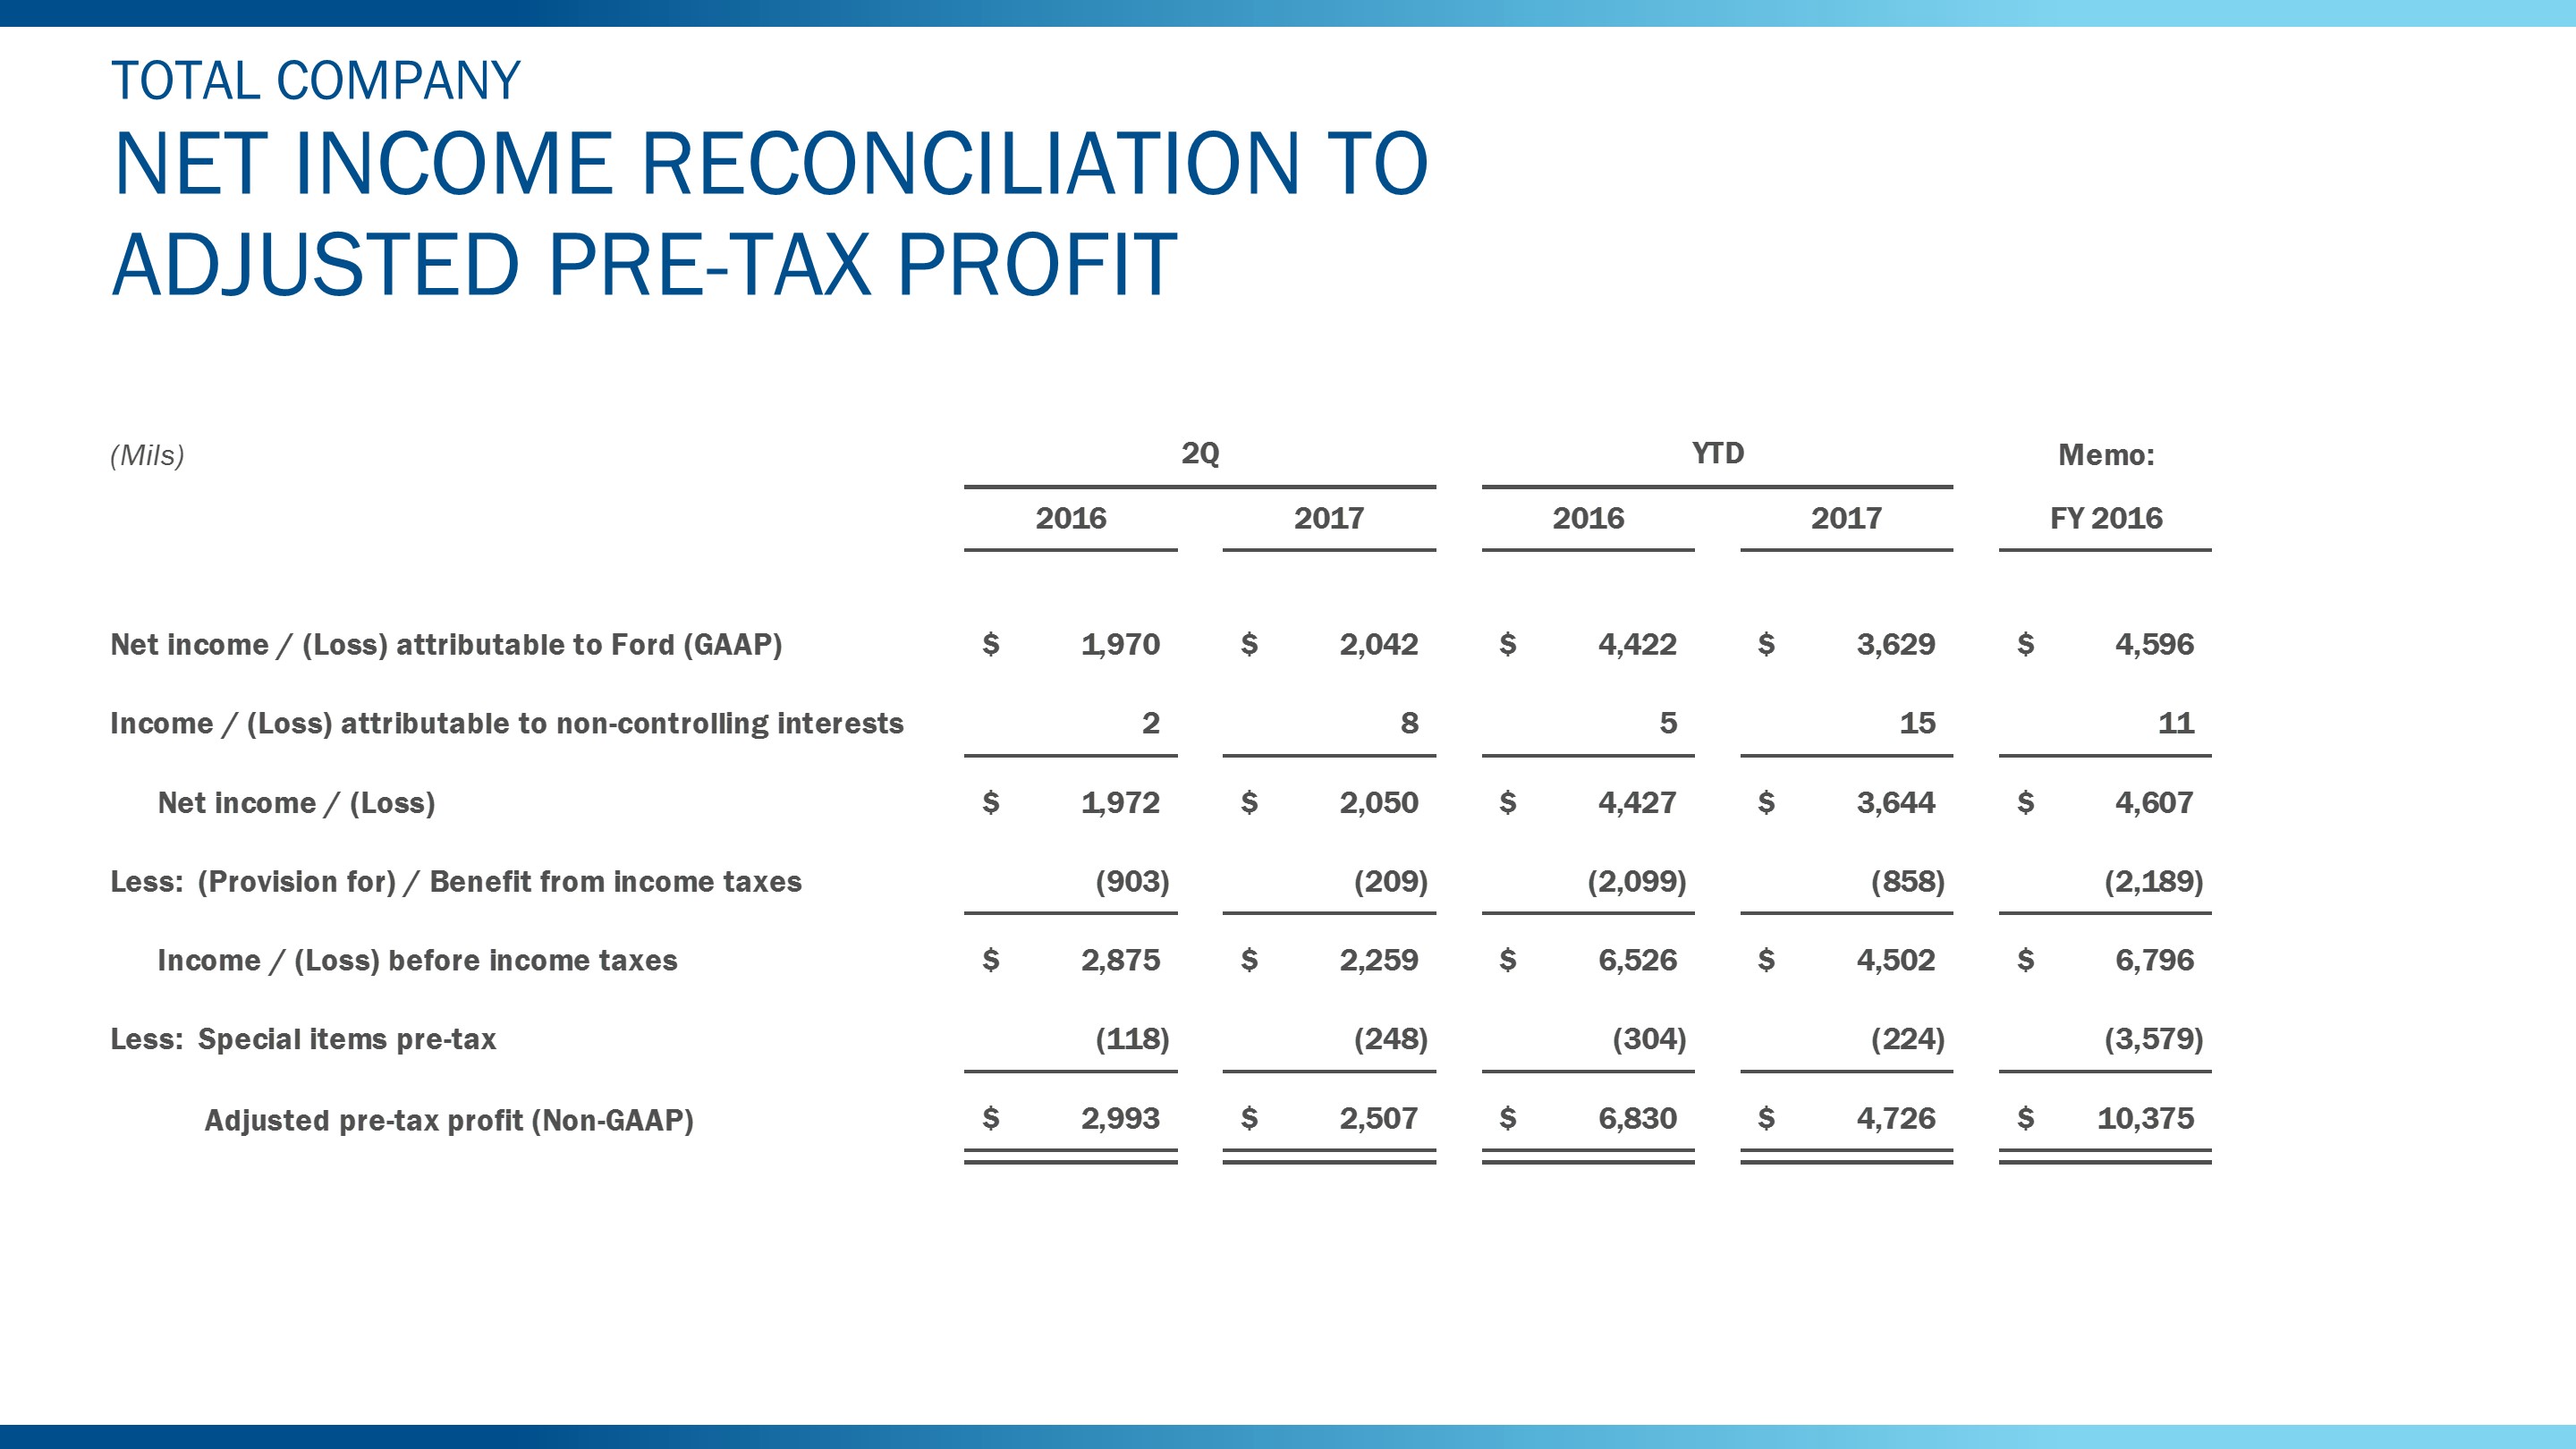
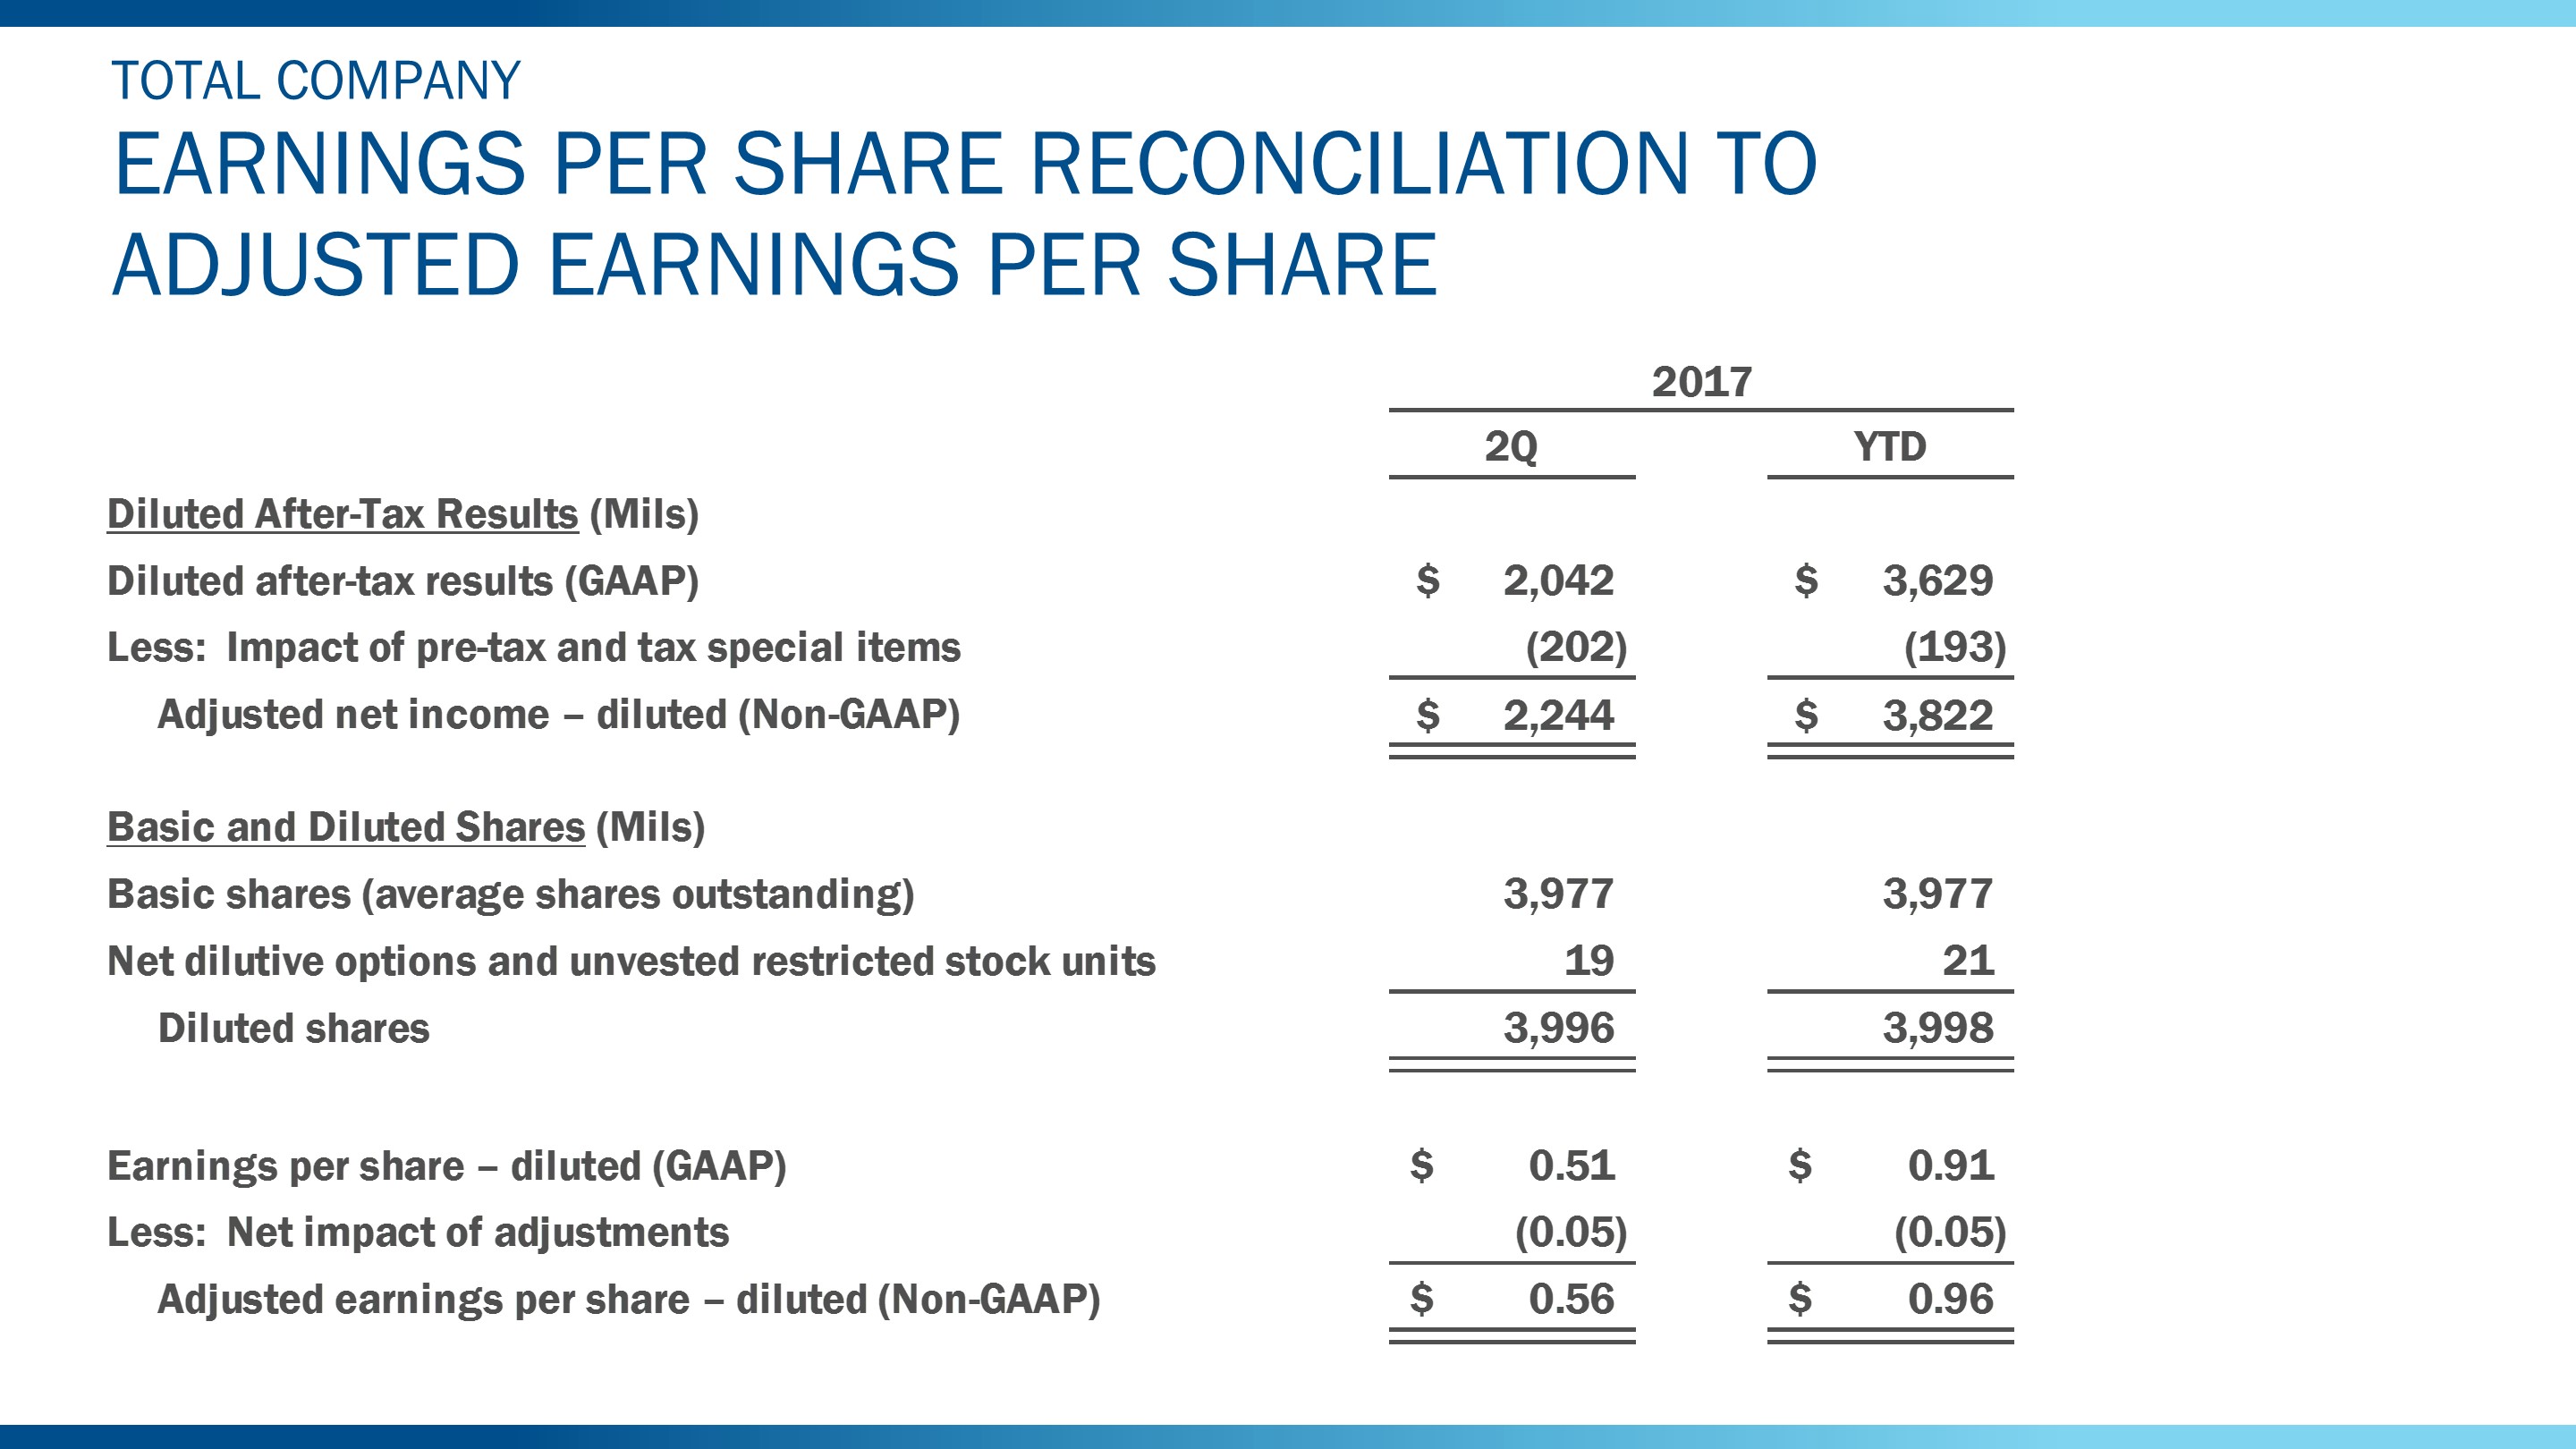
67
Item 2. Management's Discussion and Analysis of Financial Condition and Results of Operations (Continued)
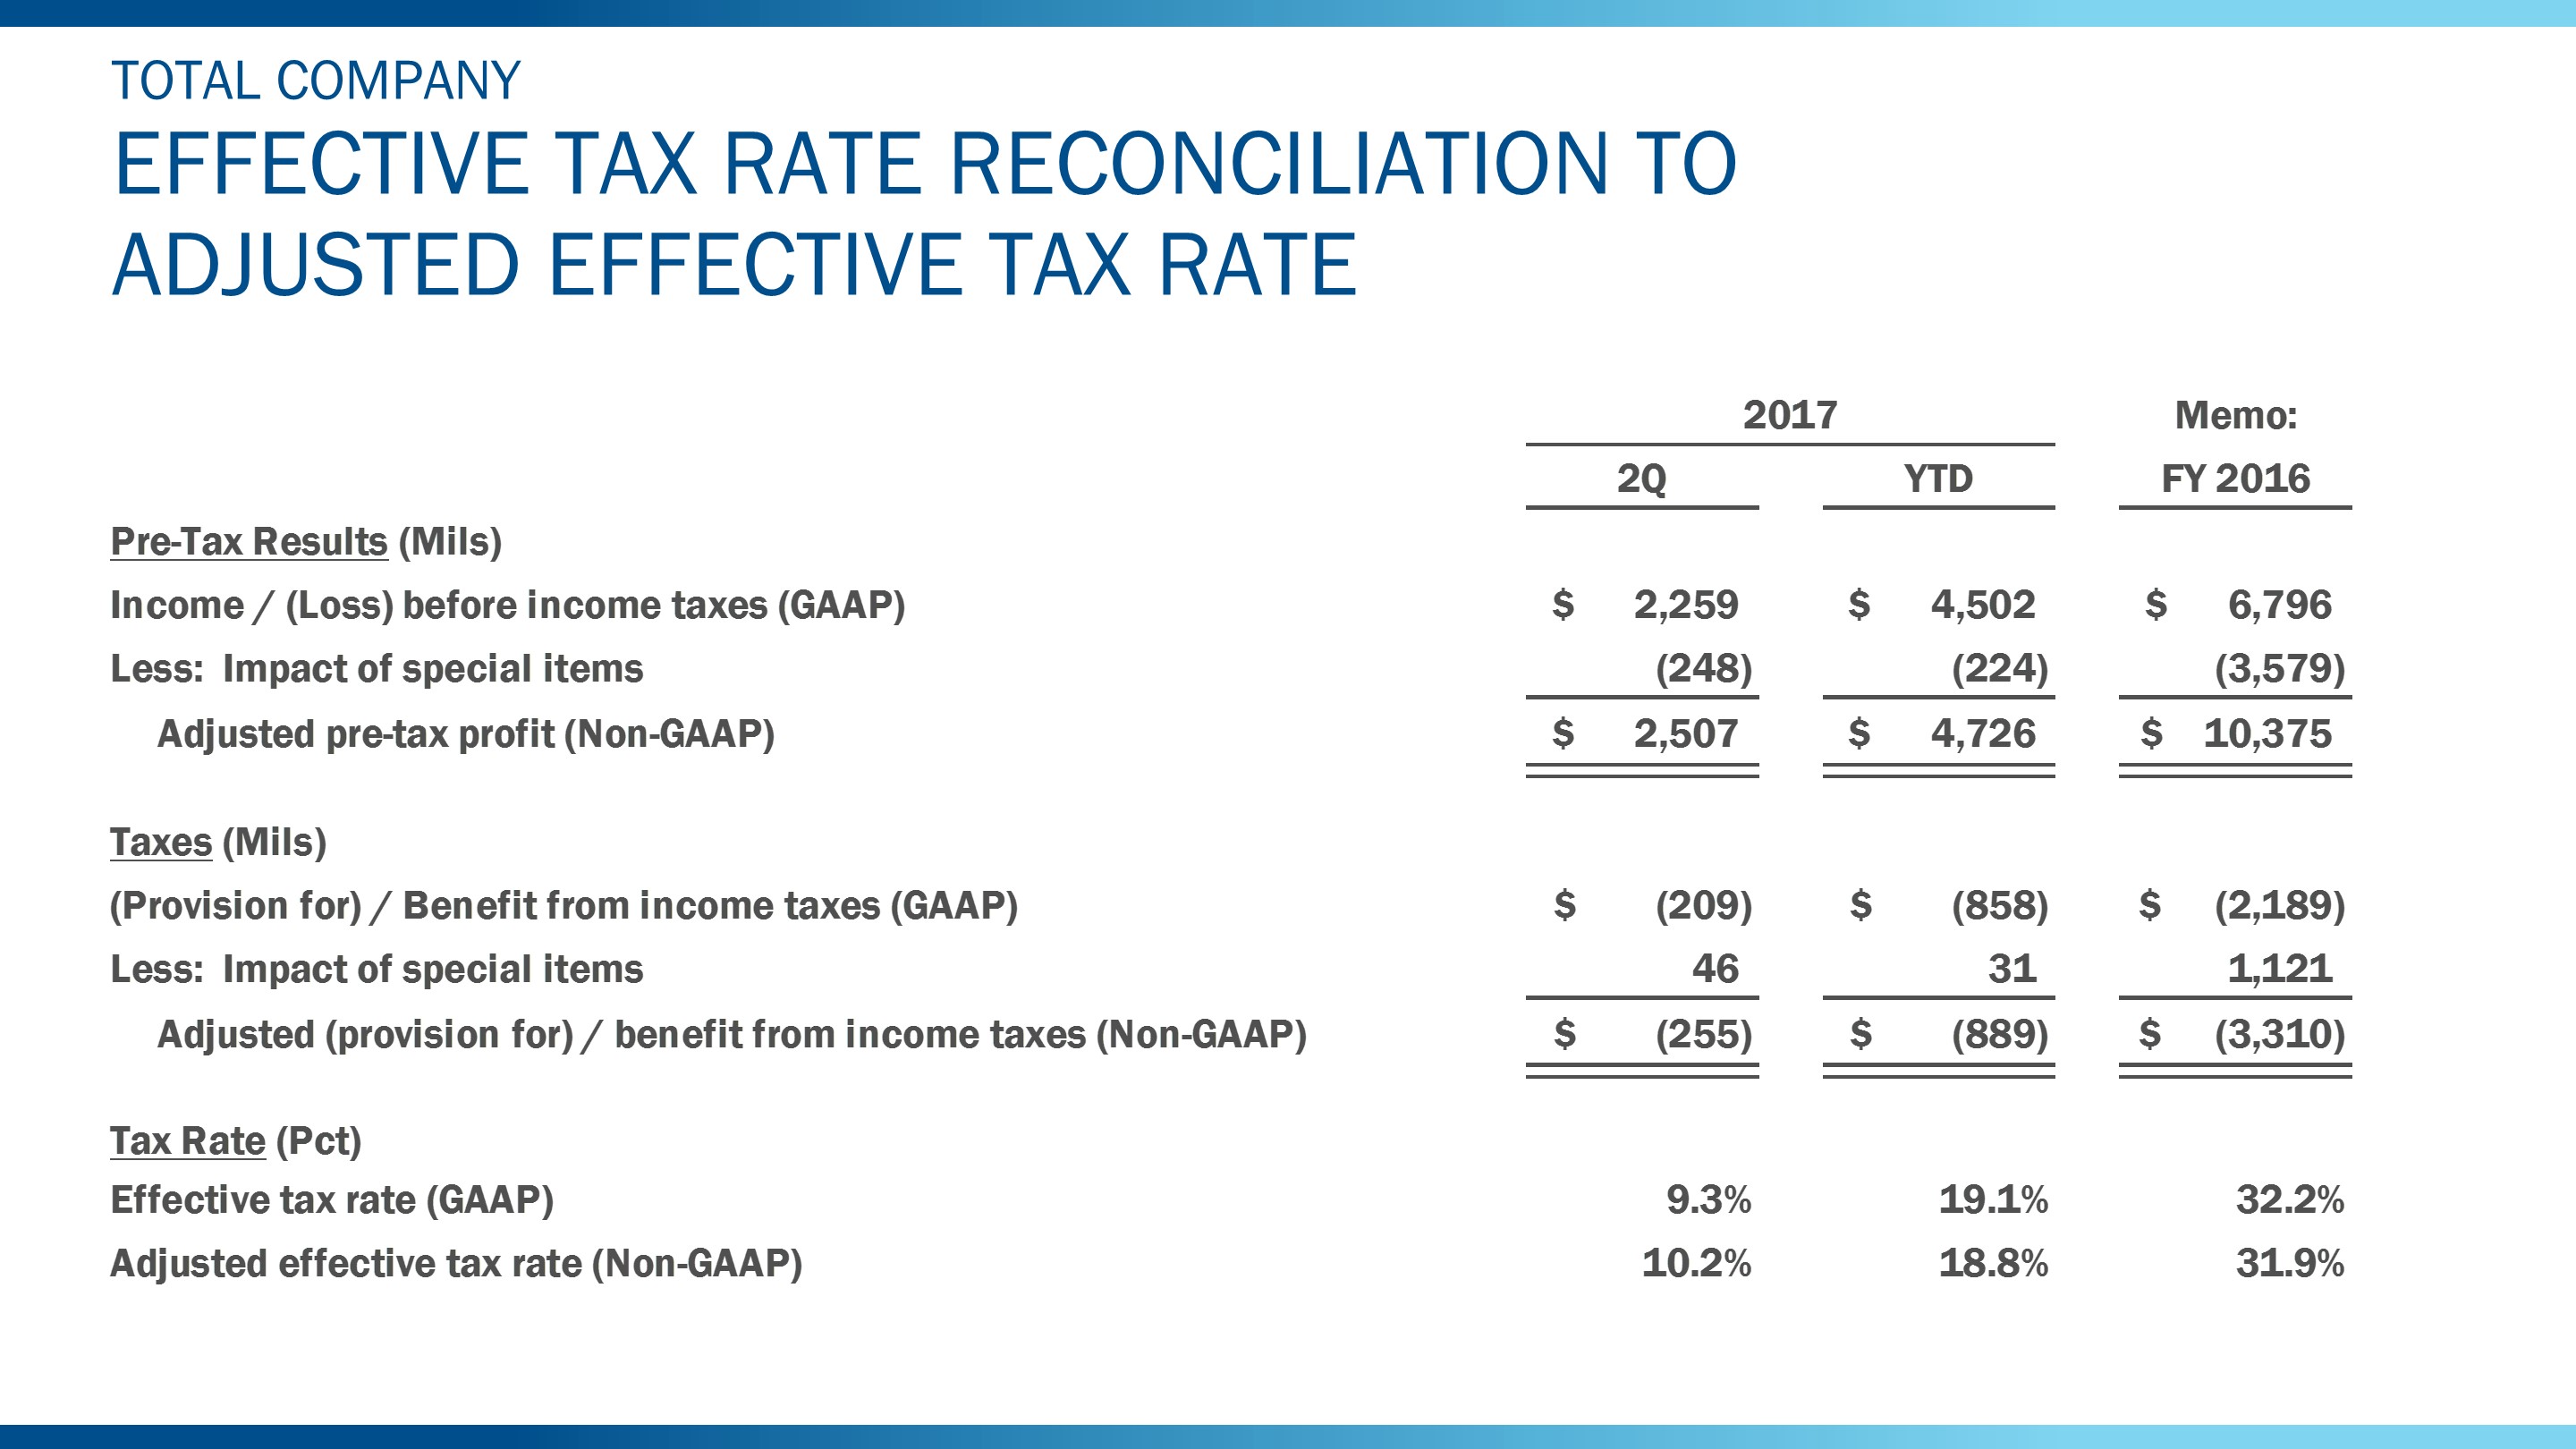
68
Item 2. Management's Discussion and Analysis of Financial Condition and Results of Operations (Continued)
Supplemental Financial Information
The tables below provide supplemental consolidating financial information. The data is presented by our reportable segments, Automotive and Financial Services. All Other, Special Items, and Adjustments include our operating segments that did not meet the quantitative threshold to qualify as a reportable segment, special items, eliminations of intersegment transactions, and deferred tax netting.
Selected Income Statement Information. The following table provides supplemental income statement information, by segment (in millions):
|
| For the period ended June 30, 2017 | ||||||||||||||
|
| Second Quarter | ||||||||||||||
|
| Automotive |
| Financial Services |
| All Other, Special Items, & Adjustments |
| Consolidated | ||||||||
Revenues |
| $ | 37,113 | |
| $ | 2,738 | |
| $ | 2 | |
| $ | 39,853 | |
Total costs and expenses |
| 35,815 | |
| 2,217 | |
| 290 | |
| 38,322 | | ||||
Interest expense on Automotive debt |
| - | |
| - | |
| 277 | |
| 277 | | ||||
Other income/(loss), net |
| 627 | |
| 74 | |
| 31 | |
| 732 | | ||||
Equity in net income of affiliated companies |
| 266 | |
| 8 | |
| (1 | ) |
| 273 | | ||||
Income/(loss) before income taxes |
| 2,191 | |
| 603 | |
| (535 | ) |
| 2,259 | | ||||
Provision for/(Benefit from) income taxes |
| 181 | |
| 174 | |
| (146 | ) |
| 209 | | ||||
Net income/(loss) |
| 2,010 | |
| 429 | |
| (389 | ) |
| 2,050 | | ||||
Less: Income/(Loss) attributable to noncontrolling interests | 8 | |
| - | |
| - | |
| 8 | | |||||
Net income attributable to Ford Motor Company | $ | 2,002 | |
| $ | 429 | |
| $ | (389 | ) |
| $ | 2,042 | | |
|
| For the period ended June 30, 2017 | ||||||||||||||
|
| First Half | ||||||||||||||
|
| Automotive |
| Financial Services |
| All Other, Special Items, & Adjustments |
| Consolidated | ||||||||
Revenues |
| $ | 73,588 | |
| $ | 5,407 | |
| $ | 4 | |
| $ | 78,999 | |
Total costs and expenses |
| 71,295 | |
| 4,449 | |
| 282 | |
| 76,026 | | ||||
Interest expense on Automotive debt |
| - | |
| - | |
| 556 | |
| 556 | | ||||
Other income/(loss), net |
| 1,258 | |
| 96 | |
| 112 | |
| 1,466 | | ||||
Equity in net income of affiliated companies |
| 605 | |
| 15 | |
| (1 | ) |
| 619 | | ||||
Income/(loss) before income taxes |
| 4,156 | |
| 1,069 | |
| (723 | ) |
| 4,502 | | ||||
Provision for/(Benefit from) income taxes |
| 741 | |
| 322 | |
| (205 | ) |
| 858 | | ||||
Net income/(loss) |
| 3,415 | |
| 747 | |
| (518 | ) |
| 3,644 | | ||||
Less: Income/(Loss) attributable to noncontrolling interests | 15 | |
| - | |
| - | |
| 15 | | |||||
Net income attributable to Ford Motor Company | $ | 3,400 | |
| $ | 747 | |
| $ | (518 | ) |
| $ | 3,629 | | |
69
Item 2. Management's Discussion and Analysis of Financial Condition and Results of Operations (Continued)
Selected Balance Sheet Information. The following tables provide supplemental balance sheet information, by segment (in millions):
|
| June 30, 2017 | ||||||||||||||
Assets |
| Automotive |
| Financial Services |
| All Other, Special Items, & Adjustments |
| Consolidated | ||||||||
Cash and cash equivalents |
| $ | 8,853 | |
| $ | 7,366 | |
| $ | 4 | |
| $ | 16,223 | |
Marketable securities |
| 19,575 | |
| 3,311 | |
| - | |
| 22,886 | | ||||
Financial Services finance receivables, net |
| - | |
| 49,888 | |
| - | |
| 49,888 | | ||||
Trade and other receivables, less allowances |
| 4,274 | |
| 5,884 | |
| 1 | |
| 10,159 | | ||||
Inventories |
| 11,092 | |
| - | |
| - | |
| 11,092 | | ||||
Other assets |
| 2,317 | |
| 974 | |
| - | |
| 3,291 | | ||||
Receivable from other segments |
| 20 | |
| 1,730 | |
| (1,750 | ) |
| - | | ||||
Total current assets |
| 46,131 | |
| 69,153 | |
| (1,745 | ) |
| 113,539 | | ||||
|
|
|
|
|
|
|
|
| ||||||||
Financial Services finance receivables, net |
| - | |
| 51,551 | |
| - | |
| 51,551 | | ||||
Net investment in operating leases |
| 1,904 | |
| 26,693 | |
| - | |
| 28,597 | | ||||
Net property |
| 33,620 | |
| 166 | |
| 8 | |
| 33,794 | | ||||
Equity in net assets of affiliated companies |
| 3,048 | |
| 180 | |
| 13 | |
| 3,241 | | ||||
Deferred income taxes |
| 14,008 | |
| 218 | |
| (4,081 | ) |
| 10,145 | | ||||
Other assets |
| 4,872 | |
| 1,676 | |
| 54 | |
| 6,602 | | ||||
Receivable from other segments |
| - | |
| 1,156 | |
| (1,156 | ) |
| - | | ||||
Total assets |
| $ | 103,583 | |
| $ | 150,793 | |
| $ | (6,907 | ) |
| $ | 247,469 | |
Liabilities |
| Automotive |
| Financial Services |
| All Other, Special Items, & Adjustments |
| Consolidated | ||||||||
Payables |
| $ | 22,441 | |
| $ | 1,122 | |
| $ | 5 | |
| $ | 23,568 | |
Other liabilities and deferred revenue |
| 18,707 | |
| 1,239 | |
| 12 | |
| 19,958 | | ||||
Automotive debt payable within one year |
| 2,911 | |
| - | |
| - | |
| 2,911 | | ||||
Financial Services debt payable within one year |
| - | |
| 47,862 | |
| - | |
| 47,862 | | ||||
Payable to other segments |
| 1,730 | |
| - | |
| (1,730 | ) |
| - | | ||||
Total current liabilities |
| 45,789 | |
| 50,223 | |
| (1,713 | ) |
| 94,299 | | ||||
|
|
|
|
|
|
|
|
| ||||||||
Other liabilities and deferred revenue |
| 23,858 | |
| 980 | |
| 2 | |
| 24,840 | | ||||
Automotive long-term debt |
| 13,277 | |
| - | |
| - | |
| 13,277 | | ||||
Financial Services long-term debt |
| - | |
| 81,959 | |
| - | |
| 81,959 | | ||||
Deferred income taxes |
| 158 | |
| 4,658 | |
| (4,081 | ) |
| 735 | | ||||
Payable to other segments |
| 1,147 | |
| - | |
| (1,147 | ) |
| - | | ||||
Total liabilities |
| $ | 84,229 | |
| $ | 137,820 | |
| $ | (6,939 | ) |
| $ | 215,110 | |
70
Item 2. Management's Discussion and Analysis of Financial Condition and Results of Operations (Continued)
Selected Cash Flow Information. The following tables provide supplemental cash flow information, by segment (in millions):
|
| For the period ended June 30, 2017 | ||||||||||||||
|
| First Half | ||||||||||||||
Cash flows from operating activities |
| Automotive |
| Financial Services |
| All Other, Special Items, & Adjustments |
| Consolidated | ||||||||
Net cash provided by/(used in) operating activities |
| $ | 5,748 | |
| $ | 4,236 | |
| $ | (33 | ) |
| $ | 9,951 | |
|
|
|
|
|
|
|
|
| ||||||||
Reconciling Adjustments to Automotive Segment Operating Cash Flows* |
|
|
|
|
|
|
| |||||||||
Automotive capital spending |
| (3,242 | ) |
|
|
|
|
|
| |||||||
Net cash flows from non-designated derivatives |
| 200 | |
|
|
|
|
|
| |||||||
Funded pension contributions |
| 456 | |
|
|
|
|
|
| |||||||
Separation payments |
| 59 | |
|
|
|
|
|
| |||||||
Other |
| 65 | |
|
|
|
|
|
| |||||||
Automotive Segment Operating Cash Flows |
| $ | 3,286 | |
|
|
|
|
|
| ||||||
_________
* | We measure and evaluate our Automotive segment operating cash flow on a different basis than Net cash provided by/(used in) operating activities in our consolidated statement of cash flows. Automotive segment operating cash flow includes additional elements management considers to be related to our Automotive operating activities, primarily capital spending and non-designated derivatives, and excludes outflows for funded pension contributions, separation payments, and other items that are considered operating cash flows under U.S. GAAP. The table above quantifies the reconciling adjustments to Net cash provided by/(used in) operating activities for the period ended June 30, 2017 . |
|
| For the period ended June 30, 2017 | ||||||||||||||
|
| First Half | ||||||||||||||
Cash flows from investing activities |
| Automotive |
| Financial Services |
| All Other, Special Items, & Adjustments |
| Consolidated | ||||||||
Capital spending |
| $ | (3,242 | ) |
| $ | (22 | ) |
| $ | - | |
| $ | (3,264 | ) |
Acquisitions of finance receivables and operating leases |
| - | |
| (27,379 | ) |
| - | |
| (27,379 | ) | ||||
Collections of finance receivables and operating leases |
| - | |
| 21,636 | |
| - | |
| 21,636 | | ||||
Purchases of equity and debt securities |
| (13,578 | ) |
| (3,351 | ) |
| (2 | ) |
| (16,931 | ) | ||||
Sales and maturities of equity and debt securities |
| 13,570 | |
| 3,336 | |
| - | |
| 16,906 | | ||||
Settlements of derivatives |
| 200 | |
| (46 | ) |
| - | |
| 154 | | ||||
Other |
| 10 | |
| 12 | |
| (6 | ) |
| 16 | | ||||
Investing activity (to)/from other segments |
| (38 | ) |
| (11 | ) |
| 49 | |
| - | | ||||
Net cash provided by/(used in) investing activities |
| $ | (3,078 | ) |
| $ | (5,825 | ) |
| $ | 41 | |
| $ | (8,862 | ) |
Cash flows from financing activities |
| Automotive |
| Financial Services |
| All Other, Special Items, & Adjustments |
| Consolidated | ||||||||
Cash dividends |
| $ | (1,392 | ) |
| $ | - | |
| $ | - | |
| $ | (1,392 | ) |
Purchases of common stock |
| (131 | ) |
| - | |
| - | |
| (131 | ) | ||||
Net changes in short-term debt |
| 216 | |
| (144 | ) |
| - | |
| 72 | | ||||
Proceeds from issuance of other debt |
| 507 | |
| 19,960 | |
| - | |
| 20,467 | | ||||
Principal payments on other debt |
| (881 | ) |
| (19,071 | ) |
| - | |
| (19,952 | ) | ||||
Other |
| (50 | ) |
| (52 | ) |
| - | |
| (102 | ) | ||||
Financing activity to/(from) other segments |
| - | |
| 12 | |
| (12 | ) |
| - | | ||||
Net cash provided by/(used in) financing activities |
| $ | (1,731 | ) |
| $ | 705 | |
| $ | (12 | ) |
| $ | (1,038 | ) |
|
|
|
|
|
|
|
|
| ||||||||
Effect of exchange rate changes on cash and cash equivalents | $ | 94 | |
| $ | 173 | |
| $ | - | |
| $ | 267 | | |
71
Item 2. Management's Discussion and Analysis of Financial Condition and Results of Operations (Continued)
Risk Factors
Statements included or incorporated by reference herein may constitute "forward-looking statements" within the meaning of the Private Securities Litigation Reform Act of 1995. Forward-looking statements are based on expectations, forecasts, and assumptions by our management and involve a number of risks, uncertainties, and other factors that could cause actual results to differ materially from those stated, including, without limitation:
• | Decline in industry sales volume, particularly in the United States, Europe, or China, due to financial crisis, recession, geopolitical events, or other factors; |
• | Lower-than-anticipated market acceptance of Ford's new or existing products or services, or failure to achieve expected growth; |
• | Market shift away from sales of larger, more profitable vehicles beyond Ford's current planning assumption, particularly in the United States; |
• | Continued or increased price competition resulting from industry excess capacity, currency fluctuations, or other factors; |
• | Fluctuations in foreign currency exchange rates, commodity prices, and interest rates; |
• | Adverse effects resulting from economic, geopolitical, protectionist trade policies, or other events; |
• | Work stoppages at Ford or supplier facilities or other limitations on production (whether as a result of labor disputes, natural or man-made disasters, tight credit markets or other financial distress, production constraints or difficulties, or other factors); |
• | Single-source supply of components or materials; |
• | Labor or other constraints on Ford's ability to maintain competitive cost structure; |
• | Substantial pension and other postretirement liabilities impairing liquidity or financial condition; |
• | Worse-than-assumed economic and demographic experience for pension and other postretirement benefit plans (e.g., discount rates or investment returns); |
• | Restriction on use of tax attributes from tax law "ownership change;" |
• | The discovery of defects in vehicles resulting in delays in new model launches, recall campaigns, or increased warranty costs; |
• | Increased safety, emissions, fuel economy, or other regulations resulting in higher costs, cash expenditures, and/or sales restrictions; |
• | Unusual or significant litigation, governmental investigations, or adverse publicity arising out of alleged defects in products, perceived environmental impacts, or otherwise; |
• | Adverse effects on results from a decrease in or cessation or clawback of government incentives related to investments; |
• | Cybersecurity risks to operational systems, security systems, or infrastructure owned by Ford, Ford Credit, or a third-party vendor or supplier; |
• | Failure of financial institutions to fulfill commitments under committed credit and liquidity facilities; |
• | Inability of Ford Credit to access debt, securitization, or derivative markets around the world at competitive rates or in sufficient amounts, due to credit rating downgrades, market volatility, market disruption, regulatory requirements, or other factors; |
• | Higher-than-expected credit losses, lower-than-anticipated residual values, or higher-than-expected return volumes for leased vehicles; |
• | Increased competition from banks, financial institutions, or other third parties seeking to increase their share of financing Ford vehicles; and |
• | New or increased credit regulations, consumer or data protection regulations, or other regulations resulting in higher costs and/or additional financing restrictions. |
We cannot be certain that any expectation, forecast, or assumption made in preparing forward-looking statements will prove accurate, or that any projection will be realized. It is to be expected that there may be differences between projected and actual results. Our forward-looking statements speak only as of the date of their initial issuance, and we do not undertake any obligation to update or revise publicly any forward-looking statement, whether as a result of new information, future events, or otherwise. For additional discussion, see "Item 1A. Risk Factors" in our 2016 Form 10-K Report, as updated by our subsequent Quarterly Reports on Form 10-Q and Current Reports on Form 8-K.
72
Item 2. Management's Discussion and Analysis of Financial Condition and Results of Operations (Continued)
ACCOUNTING STANDARDS ISSUED BUT NOT YET ADOPTED
The Financial Accounting Standards Board ("FASB") has issued the following standards, which are not expected to have a material impact (with the exception of standards 2016-02 and 2016-13) to our financial statements or financial statement disclosures:
Standard |
| Effective Date (a) | |
2016-18 | Statement of Cash Flows - Restricted Cash |
| January 1, 2018 |
2016-16 | Income Taxes - Intra-Entity Transfers of Assets Other Than Inventory |
| January 1, 2018 |
2016-15 | Statement of Cash Flows - Classification of Certain Cash Receipts and Cash Payments |
| January 1, 2018 |
2016-01 | Financial Instruments - Recognition and Measurement of Financial Assets and Financial Liabilities |
| January 1, 2018 |
2017-08 | Nonrefundable Fees and Other Costs - Premium Amortization on Purchased Callable Debt Securities |
| January 1, 2019 |
2016-02 | Leases |
| January 1, 2019 (b) |
2016-13 | Credit Losses - Measurement of Credit Losses on Financial Instruments |
| January 1, 2020 (b) |
__________
(a) Early adoption for each of the standards, except standard 2016-01, is permitted.
(b) For additional information, see Note 2 of the Notes to the Financial Statements.
OTHER FINANCIAL INFORMATION
The interim financial information included in this Quarterly Report on Form 10-Q for the periods ended
June 30, 2017 and 2016 has not been audited by PricewaterhouseCoopers LLP ("PwC"). In reviewing such information, PwC has applied limited procedures in accordance with professional standards for reviews of interim financial information. Readers should restrict reliance on PwC's reports on such information accordingly. PwC is not subject to the liability provisions of Section 11 of the Securities Act of 1933 for its reports on interim financial information, because such reports do not constitute "reports" or "parts" of registration statements prepared or certified by PwC within the meaning of Sections 7 and 11 of the Securities Act of 1933.
73
ITEM 3. Quantitative and Qualitative Disclosures About Market Risk.
Automotive Segment
Foreign Currency Risk. The net fair value of foreign exchange forward contracts (including adjustments for credit risk), as of December 31, 2016 , was an asset of $528 million compared with an asset of $227 million as of June 30, 2017 . The potential decrease in fair value from a 10% adverse change in the underlying exchange rates, in U.S. dollar terms, was $2.7 billion at both December 31, 2016 and June 30, 2017 .
Commodity Price Risk. The net fair value of commodity forward contracts (including adjustments for credit risk) as of December 31, 2016 was an asset of $5 million, compared with an asset of $9 million as of June 30, 2017 . The potential decrease in fair value from a 10% adverse change in the underlying commodity prices, in U.S. dollar terms, was $54 million at December 31, 2016 , compared with $56 million at June 30, 2017 .
Financial Services Segment
Interest Rate Risk . To provide a quantitative measure of the sensitivity of its pre-tax cash flow to changes in interest rates, Ford Credit uses interest rate scenarios that assume a hypothetical, instantaneous increase or decrease of one percentage point in all interest rates across all maturities (a "parallel shift"), as well as a base case that assumes that all interest rates remain constant at existing levels. The differences in pre-tax cash flow between these scenarios and the base case over a 12-month period represent an estimate of the sensitivity of Ford Credit's pre-tax cash flow . Under this model, Ford Credit estimates that at June 30, 2017 , all else constant, such an increase in interest rates would increase its pre-tax cash flow by $5 million over the next 12 months, compared with an increase of $21 million at December 31, 2016 . In reality, interest rate changes are rarely instantaneous or parallel and rates could move more or less than the one percentage point assumed in Ford Credit's analysis. As a result, the actual impact to pre-tax cash flow could be higher or lower than the results detailed above.
74
ITEM 4. Controls and Procedures.
Evaluation of Disclosure Controls and Procedures. James P. Hackett, our Chief Executive Officer ("CEO"), and Bob Shanks, our Chief Financial Officer ("CFO"), have performed an evaluation of the Company's disclosure controls and procedures, as that term is defined in Rule 13a-15(e) of the Securities Exchange Act of 1934, as amended ("Exchange Act"), as of June 30, 2017 , and each has concluded that such disclosure controls and procedures are effective to ensure that information required to be disclosed in our periodic reports filed under the Exchange Act is recorded, processed, summarized, and reported within the time periods specified by SEC rules and forms, and that such information is accumulated and communicated to the CEO and CFO to allow timely decisions regarding required disclosures.
Changes in Internal Control Over Financial Reporting. Mark Fields, President and Chief Executive Officer, retired effective May 22, 2017. He was succeeded by James P. Hackett, formerly chairman of Ford Smart Mobility LLC.
PART II. OTHER INFORMATION
ITEM 1. Legal Proceedings.
Notice of Violation to Ford Dearborn Truck Plant . As reported in our 2016 Form 10-K Report, on December 26, 2015, the U.S. Environmental Protection Agency ("EPA") issued a notice of violation to our Dearborn Truck Plant. EPA alleges that the plant violated several requirements related to its air permit. We have reached an agreement with EPA to resolve the matter for $389,000.
ITEM 2. Unregistered Sales of Equity Securities and Use of Proceeds.
Period |
| Total Number of Shares Purchased |
| Average Price Paid per Share |
| Total Number of Shares Purchased as Part of Publicly- Announced Plans or Programs |
| Maximum Number (or Approximate Dollar Value) of Shares that May Yet Be Purchased Under the Plans or Programs | |||||
May 1, 2017 through May 31, 2017 |
| 11,800,000 | |
| $ | 11.11 | |
| - | |
| - | |
Total/Average |
| 11,800,000 | |
| $ | 11.11 | |
|
|
|
| ||
ITEM 6. Exhibits.
Please see exhibit index below.
75
SIGNATURE
Pursuant to the requirements of the Securities Exchange Act of 1934, the registrant has duly caused this report to be signed on its behalf by the undersigned thereunto duly authorized.
FORD MOTOR COMPANY
By: | /s/ John Lawler |
| John Lawler, Vice President and Controller |
| (principal accounting officer) |
|
|
Date: | July 26, 2017 |
76
EXHIBIT INDEX
Designation |
| Description |
| Method of Filing |
Exhibit 10 |
| Executive Separation Waiver and Release Agreement between Ford Motor Company and Mark Fields dated May 21, 2017. |
| Filed with this Report. |
Exhibit 12 |
| Calculation of Ratio of Earnings to Fixed Charges. |
| Filed with this Report. |
Exhibit 15 |
| Letter of PricewaterhouseCoopers LLP, dated July 26, 2017, relating to financial information. |
| Filed with this Report. |
Exhibit 31.1 |
| Rule 15d-14(a) Certification of CEO. |
| Filed with this Report. |
Exhibit 31.2 |
| Rule 15d-14(a) Certification of CFO. |
| Filed with this Report. |
Exhibit 32.1 |
| Section 1350 Certification of CEO. |
| Furnished with this Report. |
Exhibit 32.2 |
| Section 1350 Certification of CFO. |
| Furnished with this Report. |
Exhibit 101.INS |
| XBRL Instance Document. |
| * |
Exhibit 101.SCH |
| XBRL Taxonomy Extension Schema Document. |
| * |
Exhibit 101.CAL |
| XBRL Taxonomy Extension Calculation Linkbase Document. |
| * |
Exhibit 101.LAB |
| XBRL Taxonomy Extension Label Linkbase Document. |
| * |
Exhibit 101.PRE |
| XBRL Taxonomy Extension Presentation Linkbase Document. |
| * |
Exhibit 101.DEF |
| XBRL Taxonomy Extension Definition Linkbase Document. |
| * |
__________
* Submitted electronically with this Report in accordance with the provisions of Regulation S-T.
77