|
UNITED STATES
SECURITIES AND EXCHANGE COMMISSION
Washington, DC 20549
FORM 10-Q
(Mark One) |
|
R | Quarterly report pursuant to Section 13 or 15(d) of the Securities Exchange Act of 1934 |
|
|
| For the quarterly period ended June 30, 2015 |
|
|
| or |
|
|
o | Transition report pursuant to Section 13 or 15(d) of the Securities Exchange Act of 1934 |
|
|
| For the transition period from __________ to __________ |
|
|
| Commission file number 1-3950 |
Ford Motor Company
(Exact name of Registrant as specified in its charter)
Delaware | 38-0549190 |
(State of incorporation) | (I.R.S. Employer Identification No.) |
|
|
One American Road, Dearborn, Michigan | 48126 |
(Address of principal executive offices) | (Zip Code) |
313-322-3000
(Registrant's telephone number, including area code)
Indicate by check mark if the registrant (1) has filed all reports required to be filed by Section 13 or 15(d) of the Securities Exchange Act of 1934 during the preceding 12 months (or for such shorter period that the registrant was required to file such reports), and (2) has been subject to such filing requirements for the past 90 days. Yes R No o
Indicate by check mark whether the registrant has submitted electronically and posted on its corporate Web site, if any, every Interactive Data File required to be submitted and posted pursuant to Rule 405 of Regulation S-T (§232.405 of this chapter) during the preceding 12 months (or for such shorter period that the registrant was required to submit and post such files). Yes R No o
Indicate by check mark whether the registrant is a large accelerated filer, an accelerated filer, a non-accelerated filer, or a smaller reporting company. See definitions of "large accelerated filer," "accelerated filer," and "smaller reporting company" in Rule 12b-2 of the Exchange Act. Large accelerated filer R Accelerated filer o Non-accelerated filer o Smaller reporting company o
Indicate by check mark whether the registrant is a shell company (as defined in Rule 12b-2 of the Exchange Act). Yes o No R
As of July 21, 2015, Ford had outstanding 3,896,985,910 shares of Common Stock and 70,852,076 shares of Class B Stock.
62 |
|
FORD MOTOR COMPANY
QUARTERLY REPORT ON FORM 10-Q
For the Quarter Ended June 30, 2015
| Table of Contents |
| Page |
| Part I - Financial Information |
|
|
Item 1 | Financial Statements |
| 1 |
| Consolidated Income Statement |
| 1 |
| Consolidated Statement of Comprehensive Income |
| 1 |
| Sector Income Statement |
| 2 |
| Consolidated Balance Sheet |
| 3 |
| Sector Balance Sheet |
| 4 |
| Condensed Consolidated Statement of Cash Flows |
| 5 |
| Condensed Sector Statement of Cash Flows |
| 6 |
| Consolidated Statement of Equity |
| 7 |
| Notes to the Financial Statements |
| 8 |
| Report of Independent Registered Public Accounting Firm |
| 31 |
Item 2 | Management's Discussion and Analysis of Financial Condition and Results of Operations |
| 32 |
| Results of Operations |
| 32 |
| Automotive Sector |
| 33 |
| Financial Services Sector |
| 47 |
| Liquidity and Capital Resources |
| 50 |
| Production Volumes |
| 56 |
| Outlook |
| 57 |
| Accounting Standards Issued But Not Yet Adopted |
| 59 |
| Other Financial Information |
| 59 |
Item 3 | Quantitative and Qualitative Disclosures About Market Risk |
| 59 |
| Automotive Sector |
| 59 |
| Financial Services Sector |
| 59 |
Item 4 | Controls and Procedures |
| 59 |
|
|
|
|
| Part II - Other Information |
|
|
Item 1 | Legal Proceedings |
| 60 |
Item 1A | Risk Factors |
| 60 |
Item 2 | Unregistered Sales of Equity Securities and Use of Proceeds |
| 60 |
Item 6 | Exhibits |
| 60 |
| Signature |
| 61 |
| Exhibit Index |
| 62 |
i
PART I. FINANCIAL INFORMATION
ITEM 1. Financial Statements.
FORD MOTOR COMPANY AND SUBSIDIARIES
CONSOLIDATED INCOME STATEMENT
(in millions, except per share amounts)
| For the periods ended June 30, | ||||||||||||||
| 2015 |
| 2014 |
| 2015 |
| 2014 | ||||||||
| Second Quarter |
| First Half | ||||||||||||
| (unaudited) | ||||||||||||||
Revenues |
|
|
|
|
|
|
| ||||||||
Automotive | $ | 35,105 | |
| $ | 35,365 | |
| $ | 66,905 | |
| $ | 69,241 | |
Financial Services | 2,158 | |
| 2,046 | |
| 4,258 | |
| 4,046 | | ||||
Total revenues | 37,263 | |
| 37,411 | |
| 71,163 | |
| 73,287 | | ||||
|
|
|
|
|
|
|
| ||||||||
Costs and expenses |
| |
|
| |
|
|
|
| ||||||
Automotive cost of sales | 30,602 | |
| 31,247 | |
| 59,304 | |
| 62,268 | | ||||
Selling, administrative, and other expenses | 3,718 | |
| 3,476 | |
| 7,327 | |
| 6,848 | | ||||
Financial Services interest expense | 607 | |
| 683 | |
| 1,254 | |
| 1,361 | | ||||
Financial Services provision for credit and insurance losses | 106 | |
| 104 | |
| 179 | |
| 143 | | ||||
Total costs and expenses | 35,033 | |
| 35,510 | |
| 68,064 | |
| 70,620 | | ||||
|
|
|
|
|
|
|
| ||||||||
Automotive interest expense | 190 | |
| 207 | |
| 355 | |
| 415 | | ||||
|
|
|
|
|
|
|
| ||||||||
Automotive interest income and other income/(loss), net (Note 14) | 272 | |
| 270 | |
| 462 | |
| 484 | | ||||
Financial Services other income/(loss), net (Note 14) | 70 | |
| 87 | |
| 144 | |
| 155 | | ||||
Equity in net income of affiliated companies | 486 | |
| 67 | |
| 923 | |
| 486 | | ||||
Income before income taxes | 2,868 | |
| 2,118 | | | 4,273 | | | 3,377 | | ||||
Provision for/(Benefit from) income taxes (Note 16) | 982 | |
| 803 | |
| 1,462 | |
| 1,073 | | ||||
Net income | 1,886 | |
| 1,315 | |
| 2,811 | |
| 2,304 | | ||||
Less: Income/(Loss) attributable to noncontrolling interests | 1 | |
| 4 | |
| 2 | |
| 4 | | ||||
Net income attributable to Ford Motor Company | $ | 1,885 | |
| $ | 1,311 | |
| $ | 2,809 | |
| $ | 2,300 | |
|
|
|
|
|
|
|
| ||||||||
EARNINGS PER SHARE ATTRIBUTABLE TO FORD MOTOR COMPANY COMMON AND CLASS B STOCK (Note 18) | |||||||||||||||
Basic income | $ | 0.47 | |
| $ | 0.33 | |
| $ | 0.71 | |
| $ | 0.58 | |
Diluted income | 0.47 | |
| 0.32 | |
| 0.70 | |
| 0.57 | | ||||
|
|
|
|
|
|
|
| ||||||||
Cash dividends declared | 0.15 | |
| 0.125 | |
| 0.30 | |
| 0.25 | | ||||
CONSOLIDATED STATEMENT OF COMPREHENSIVE INCOME
(in millions)
| For the periods ended June 30, | ||||||||||||||
| 2015 |
| 2014 |
| 2015 |
| 2014 | ||||||||
| Second Quarter |
| First Half | ||||||||||||
| (unaudited) | ||||||||||||||
Net income | $ | 1,886 | |
| $ | 1,315 | |
| $ | 2,811 | |
| $ | 2,304 | |
Other comprehensive income/(loss), net of tax (Note 13) |
|
|
|
|
|
|
| ||||||||
Foreign currency translation | 328 | |
| 317 | |
| (308 | ) |
| 82 | | ||||
Derivative instruments | (76 | ) |
| (287 | ) |
| (166 | ) |
| (195 | ) | ||||
Pension and other postretirement benefits | (107 | ) |
| 53 | |
| 245 | |
| 236 | | ||||
Total other comprehensive income/(loss), net of tax | 145 | |
| 83 | |
| (229 | ) |
| 123 | | ||||
Comprehensive income | 2,031 | |
| 1,398 | |
| 2,582 | |
| 2,427 | | ||||
Less: Comprehensive income/(loss) attributable to noncontrolling interests | - | |
| 4 | |
| 1 | |
| 4 | | ||||
Comprehensive income attributable to Ford Motor Company | $ | 2,031 | |
| $ | 1,394 | |
| $ | 2,581 | |
| $ | 2,423 | |
The accompanying notes are part of the financial statements.
1
Item 1. Financial Statements (Continued)
FORD MOTOR COMPANY AND SUBSIDIARIES
SECTOR INCOME STATEMENT
(in millions)
| For the periods ended June 30, | ||||||||||||||
| 2015 |
| 2014 |
| 2015 |
| 2014 | ||||||||
| Second Quarter |
| First Half | ||||||||||||
| (unaudited) | ||||||||||||||
AUTOMOTIVE |
|
|
|
|
|
|
| ||||||||
Revenues | $ | 35,105 | |
| $ | 35,365 | |
| $ | 66,905 | |
| $ | 69,241 | |
Costs and expenses |
|
|
|
|
|
|
| ||||||||
Cost of sales | 30,602 | |
| 31,247 | |
| 59,304 | |
| 62,268 | | ||||
Selling, administrative, and other expenses | 2,686 | |
| 2,551 | |
| 5,302 | |
| 5,027 | | ||||
Total costs and expenses | 33,288 | |
| 33,798 | |
| 64,606 | |
| 67,295 | | ||||
|
|
|
|
|
|
|
| ||||||||
Interest expense | 190 | |
| 207 | |
| 355 | |
| 415 | | ||||
|
|
|
|
|
|
|
| ||||||||
Interest income and other income/(loss), net (Note 14) | 272 | |
| 270 | |
| 462 | |
| 484 | | ||||
Equity in net income of affiliated companies | 478 | |
| 59 | |
| 907 | |
| 471 | | ||||
Income before income taxes - Automotive | 2,377 | |
| 1,689 | |
| 3,313 | |
| 2,486 | | ||||
|
|
|
|
|
|
|
| ||||||||
FINANCIAL SERVICES |
| |
|
| |
|
|
|
| ||||||
Revenues | 2,158 | |
| 2,046 | |
| 4,258 | |
| 4,046 | | ||||
Costs and expenses |
|
|
|
|
|
|
| ||||||||
Interest expense | 607 | |
| 683 | |
| 1,254 | |
| 1,361 | | ||||
Depreciation on vehicles subject to operating leases | 858 | |
| 742 | |
| 1,674 | |
| 1,448 | | ||||
Operating and other expenses | 174 | |
| 183 | |
| 351 | |
| 373 | | ||||
Provision for credit and insurance losses | 106 | |
| 104 | |
| 179 | |
| 143 | | ||||
Total costs and expenses | 1,745 | |
| 1,712 | |
| 3,458 | |
| 3,325 | | ||||
|
|
|
|
|
|
|
| ||||||||
Other income/(loss), net (Note 14) | 70 | |
| 87 | |
| 144 | |
| 155 | | ||||
Equity in net income of affiliated companies | 8 | |
| 8 | |
| 16 | |
| 15 | | ||||
Income before income taxes - Financial Services | 491 | |
| 429 | |
| 960 | |
| 891 | | ||||
|
|
|
|
|
|
|
| ||||||||
TOTAL COMPANY |
|
|
|
|
|
|
| ||||||||
Income before income taxes | 2,868 | |
| 2,118 | |
| 4,273 | |
| 3,377 | | ||||
Provision for/(Benefit from) income taxes (Note 16) | 982 | |
| 803 | |
| 1,462 | |
| 1,073 | | ||||
Net income | 1,886 | |
| 1,315 | |
| 2,811 | |
| 2,304 | | ||||
Less: Income/(Loss) attributable to noncontrolling interests | 1 | |
| 4 | |
| 2 | |
| 4 | | ||||
Net income attributable to Ford Motor Company | $ | 1,885 | |
| $ | 1,311 | |
| $ | 2,809 | |
| $ | 2,300 | |
The accompanying notes are part of the financial statements.
2
Item 1. Financial Statements (Continued)
FORD MOTOR COMPANY AND SUBSIDIARIES
CONSOLIDATED BALANCE SHEET
(in millions)
| June 30, |
| December 31, | ||||
| (unaudited) | ||||||
ASSETS |
|
|
| ||||
Cash and cash equivalents | $ | 12,897 | |
| $ | 10,757 | |
Marketable securities | 18,405 | |
| 20,393 | | ||
Finance receivables, net (Note 4) | 82,821 | |
| 81,111 | | ||
Other receivables, net | 12,666 | |
| 11,708 | | ||
Net investment in operating leases | 26,148 | |
| 23,217 | | ||
Inventories (Note 6) | 9,438 | |
| 7,866 | | ||
Equity in net assets of affiliated companies | 3,469 | |
| 3,357 | | ||
Net property | 30,750 | |
| 30,126 | | ||
Deferred income taxes | 12,497 | |
| 13,639 | | ||
Other assets | 6,954 | |
| 6,353 | | ||
Total assets | $ | 216,045 | |
| $ | 208,527 | |
|
|
|
| ||||
LIABILITIES |
| |
|
| | ||
Payables | $ | 21,844 | |
| $ | 20,035 | |
Other liabilities and deferred revenue (Note 7) | 43,649 | |
| 43,577 | | ||
Debt (Note 9) | 123,526 | |
| 119,171 | | ||
Deferred income taxes | 578 | |
| 570 | | ||
Total liabilities | 189,597 | |
| 183,353 | | ||
|
|
|
| ||||
Redeemable noncontrolling interest (Note 10) | 93 | |
| 342 | | ||
|
|
|
| ||||
EQUITY |
| |
|
| | ||
Capital stock |
| |
|
| | ||
Common Stock, par value $.01 per share (3,959 million shares issued of 6 billion authorized) | 40 | |
| 39 | | ||
Class B Stock, par value $.01 per share (71 million shares issued of 530 million authorized) | 1 | |
| 1 | | ||
Capital in excess of par value of stock | 21,317 | |
| 21,089 | | ||
Retained earnings | 26,175 | |
| 24,556 | | ||
Accumulated other comprehensive income/(loss) (Note 13) | (20,260 | ) |
| (20,032 | ) | ||
Treasury stock | (939 | ) |
| (848 | ) | ||
Total equity attributable to Ford Motor Company | 26,334 | |
| 24,805 | | ||
Equity attributable to noncontrolling interests | 21 | |
| 27 | | ||
Total equity | 26,355 | |
| 24,832 | | ||
Total liabilities and equity | $ | 216,045 | |
| $ | 208,527 | |
The following table includes assets to be used to settle liabilities of the consolidated variable interest entities ("VIEs"). These assets and liabilities are included in the consolidated balance sheet above. See Note 11 for additional information on our VIEs.
| June 30, |
| December 31, | ||||
| (unaudited) | ||||||
ASSETS |
|
|
| ||||
Cash and cash equivalents | $ | 2,355 | |
| $ | 2,094 | |
Finance receivables, net | 43,563 | |
| 39,522 | | ||
Net investment in operating leases | 11,878 | |
| 9,631 | | ||
Other assets | 55 | |
| 27 | | ||
LIABILITIES |
|
|
| ||||
Other liabilities and deferred revenue | $ | 30 | |
| $ | 22 | |
Debt | 40,595 | |
| 37,156 | | ||
The accompanying notes are part of the financial statements.
3
Item 1. Financial Statements (Continued)
FORD MOTOR COMPANY AND SUBSIDIARIES
SECTOR BALANCE SHEET (in millions)
| June 30, |
| December 31, | ||||
ASSETS | (unaudited) | ||||||
Automotive |
|
|
| ||||
Cash and cash equivalents | $ | 6,130 | |
| $ | 4,567 | |
Marketable securities | 14,599 | |
| 17,135 | | ||
Total cash and marketable securities | 20,729 | |
| 21,702 | | ||
Receivables, less allowances of $403 and $455 | 5,793 | |
| 5,789 | | ||
Inventories (Note 6) | 9,438 | |
| 7,866 | | ||
Deferred income taxes | 2,779 | |
| 2,039 | | ||
Net investment in operating leases | 2,765 | |
| 1,699 | | ||
Other current assets | 1,372 | |
| 1,347 | | ||
Total current assets | 42,876 | |
| 40,442 | | ||
Equity in net assets of affiliated companies | 3,323 | |
| 3,216 | | ||
Net property | 30,623 | |
| 29,795 | | ||
Deferred income taxes | 12,151 | |
| 13,331 | | ||
Other assets | 3,555 | |
| 2,798 | | ||
Non-current receivable from Financial Services | - | |
| 497 | | ||
Total Automotive assets | 92,528 | |
| 90,079 | | ||
Financial Services |
| |
|
| | ||
Cash and cash equivalents | 6,767 | |
| 6,190 | | ||
Marketable securities | 3,806 | |
| 3,258 | | ||
Finance receivables, net (Note 4) | 88,796 | |
| 86,141 | | ||
Net investment in operating leases | 23,383 | |
| 21,518 | | ||
Equity in net assets of affiliated companies | 146 | |
| 141 | | ||
Other assets | 3,229 | |
| 3,613 | | ||
Receivable from Automotive | 256 | |
| 527 | | ||
Total Financial Services assets | 126,383 | |
| 121,388 | | ||
Intersector elimination | (256 | ) |
| (1,024 | ) | ||
Total assets | $ | 218,655 | |
| $ | 210,443 | |
LIABILITIES |
| |
|
| | ||
Automotive |
| |
|
| | ||
Payables | $ | 20,640 | |
| $ | 18,876 | |
Other liabilities and deferred revenue (Note 7) | 18,382 | |
| 17,934 | | ||
Deferred income taxes | 334 | |
| 270 | | ||
Debt payable within one year (Note 9) | 2,188 | |
| 2,501 | | ||
Current payable to Financial Services | 241 | |
| 527 | | ||
Total current liabilities | 41,785 | |
| 40,108 | | ||
Long-term debt (Note 9) | 11,525 | |
| 11,323 | | ||
Other liabilities and deferred revenue (Note 7) | 23,346 | |
| 23,793 | | ||
Deferred income taxes | 301 | |
| 367 | | ||
Non-current payable to Financial Services | 15 | |
| - | | ||
Total Automotive liabilities | 76,972 | |
| 75,591 | | ||
Financial Services |
| |
|
| | ||
Payables | 1,204 | |
| 1,159 | | ||
Debt (Note 9) | 109,813 | |
| 105,347 | | ||
Deferred income taxes | 2,553 | |
| 1,849 | | ||
Other liabilities and deferred income (Note 7) | 1,921 | |
| 1,850 | | ||
Payable to Automotive | - | |
| 497 | | ||
Total Financial Services liabilities | 115,491 | |
| 110,702 | | ||
Intersector elimination | (256 | ) |
| (1,024 | ) | ||
Total liabilities | 192,207 | |
| 185,269 | | ||
|
|
|
| ||||
Redeemable noncontrolling interest (Note 10) | 93 | |
| 342 | | ||
|
|
|
| ||||
EQUITY |
| |
|
| | ||
Capital stock |
| |
|
| | ||
Common Stock, par value $.01 per share (3,959 million shares issued of 6 billion authorized) | 40 | |
| 39 | | ||
Class B Stock, par value $.01 per share (71 million shares issued of 530 million authorized) | 1 | |
| 1 | | ||
Capital in excess of par value of stock | 21,317 | |
| 21,089 | | ||
Retained earnings | 26,175 | |
| 24,556 | | ||
Accumulated other comprehensive income/(loss) (Note 13) | (20,260 | ) |
| (20,032 | ) | ||
Treasury stock | (939 | ) |
| (848 | ) | ||
Total equity attributable to Ford Motor Company | 26,334 | |
| 24,805 | | ||
Equity attributable to noncontrolling interests | 21 | |
| 27 | | ||
Total equity | 26,355 | |
| 24,832 | | ||
Total liabilities and equity | $ | 218,655 | |
| $ | 210,443 | |
The accompanying notes are part of the financial statements.
4
Item 1. Financial Statements (Continued)
FORD MOTOR COMPANY AND SUBSIDIARIES
CONDENSED CONSOLIDATED STATEMENT OF CASH FLOWS
(in millions)
| For the periods ended June 30, | ||||||
| 2015 |
| 2014 | ||||
| First Half | ||||||
| (unaudited) | ||||||
Cash flows from operating activities |
|
|
| ||||
Net cash provided by/(used in) operating activities | $ | 7,623 | |
| $ | 6,970 | |
|
|
|
| ||||
Cash flows from investing activities |
|
|
| ||||
Capital spending | (3,533 | ) |
| (3,428 | ) | ||
Acquisitions of finance receivables and operating leases | (26,505 | ) |
| (24,616 | ) | ||
Collections of finance receivables and operating leases | 18,844 | |
| 18,277 | | ||
Purchases of marketable securities | (21,282 | ) |
| (26,468 | ) | ||
Sales and maturities of marketable securities | 23,193 | |
| 24,397 | | ||
Settlements of derivatives | 192 | |
| 29 | | ||
Other | 141 | |
| 124 | | ||
Net cash provided by/(used in) investing activities | (8,950 | ) |
| (11,685 | ) | ||
|
|
|
| ||||
Cash flows from financing activities |
| |
|
| | ||
Cash dividends | (1,190 | ) |
| (987 | ) | ||
Purchases of Common Stock | (91 | ) |
| (862 | ) | ||
Net changes in short-term debt | 176 | |
| (3,188 | ) | ||
Proceeds from issuance of other debt | 24,912 | |
| 22,755 | | ||
Principal payments on other debt | (19,787 | ) |
| (15,925 | ) | ||
Other | (279 | ) |
| 9 | | ||
Net cash provided by/(used in) financing activities | 3,741 | |
| 1,802 | | ||
|
|
|
| ||||
Effect of exchange rate changes on cash and cash equivalents | (274 | ) |
| 18 | | ||
|
|
|
| ||||
Net increase/(decrease) in cash and cash equivalents | $ | 2,140 | |
| $ | (2,895 | ) |
|
|
|
| ||||
Cash and cash equivalents at January 1 | $ | 10,757 | |
| $ | 14,468 | |
Net increase/(decrease) in cash and cash equivalents | 2,140 | |
| (2,895 | ) | ||
Cash and cash equivalents at June 30 | $ | 12,897 | |
| $ | 11,573 | |
The accompanying notes are part of the financial statements.
5
Item 1. Financial Statements (Continued)
FORD MOTOR COMPANY AND SUBSIDIARIES
CONDENSED SECTOR STATEMENT OF CASH FLOWS
(in millions)
| For the periods ended June 30, | ||||||||||||||
| 2015 |
| 2014 | ||||||||||||
| First Half | ||||||||||||||
| Automotive |
| Financial Services |
| Automotive |
| Financial Services | ||||||||
| (unaudited) | ||||||||||||||
Cash flows from operating activities |
|
|
|
|
|
|
| ||||||||
Net cash provided by/(used in) operating activities (a) | $ | 4,461 | |
| $ | 3,020 | |
| $ | 6,108 | |
| $ | 2,553 | |
|
|
|
|
|
|
|
| ||||||||
Cash flows from investing activities |
|
|
|
|
|
|
| ||||||||
Capital spending | (3,505 | ) |
| (28 | ) |
| (3,402 | ) |
| (26 | ) | ||||
Acquisitions of finance receivables and operating leases (excluding wholesale and other) | - | |
| (26,505 | ) |
| - | |
| (24,616 | ) | ||||
Collections of finance receivables and operating leases (excluding wholesale and other) | - | |
| 18,844 | |
| - | |
| 18,277 | | ||||
Net change in wholesale and other receivables (b) | - | |
| (1,273 | ) |
| - | |
| (3,256 | ) | ||||
Purchases of marketable securities | (14,583 | ) |
| (6,699 | ) |
| (19,465 | ) |
| (7,003 | ) | ||||
Sales and maturities of marketable securities | 17,050 | |
| 6,143 | |
| 18,499 | |
| 5,898 | | ||||
Settlements of derivatives | 29 | |
| 163 | |
| 91 | |
| (62 | ) | ||||
Other | 73 | |
| 68 | |
| 40 | |
| 84 | | ||||
Investing activity (to)/from Financial Services (c) | 28 | |
| - | |
| 21 | |
| - | | ||||
Interest supplements and residual value support from Automotive (a) | - | |
| 1,415 | |
| - | |
| 1,565 | | ||||
Net cash provided by/(used in) investing activities | (908 | ) | | (7,872 | ) | | (4,216 | ) | | (9,139 | ) | ||||
|
|
|
|
|
|
|
| ||||||||
Cash flows from financing activities |
|
|
|
|
|
|
| ||||||||
Cash dividends | (1,190 | ) |
| - | |
| (987 | ) |
| - | | ||||
Purchases of Common Stock | (91 | ) |
| - | |
| (862 | ) |
| - | | ||||
Net changes in short-term debt | 29 | |
| 147 | |
| 192 | |
| (3,380 | ) | ||||
Proceeds from issuance of other debt | 581 | |
| 24,331 | |
| 100 | |
| 22,655 | | ||||
Principal payments on other debt | (1,006 | ) |
| (18,781 | ) |
| (656 | ) |
| (15,269 | ) | ||||
Other | (223 | ) |
| (56 | ) |
| 75 | |
| (66 | ) | ||||
Financing activity to/(from) Automotive (c) | - | |
| (28 | ) |
| - | |
| (21 | ) | ||||
Net cash provided by/(used in) financing activities | (1,900 | ) |
| 5,613 | |
| (2,138 | ) |
| 3,919 | | ||||
|
|
|
|
|
|
|
| ||||||||
Effect of exchange rate changes on cash and cash equivalents | (90 | ) |
| (184 | ) |
| 23 | |
| (5 | ) | ||||
|
|
|
|
|
|
|
| ||||||||
Net increase/(decrease) in cash and cash equivalents | $ | 1,563 | | | $ | 577 | | | $ | (223 | ) | | $ | (2,672 | ) |
|
|
|
|
|
|
|
| ||||||||
Cash and cash equivalents at January 1 | $ | 4,567 | |
| $ | 6,190 | |
| $ | 4,959 | |
| $ | 9,509 | |
Net increase/(decrease) in cash and cash equivalents | 1,563 | |
| 577 | |
| (223 | ) |
| (2,672 | ) | ||||
Cash and cash equivalents at June 30 | $ | 6,130 | | | $ | 6,767 | | | $ | 4,736 | | | $ | 6,837 | |
_________
(a) | Operating activities include outflows of $1,415 million and $1,565 million for the periods ended June 30, 2015 and 2014 , respectively, of interest supplements and residual value support to Financial Services. Interest supplements and residual value support from Automotive to Financial Services are eliminated in the condensed consolidated statement of cash flows. |
(b) | Reclassified to operating activities in the condensed consolidated statement of cash flows. |
(c) | Eliminated in the condensed consolidated statement of cash flows. |
The accompanying notes are part of the financial statements.
6
Item 1. Financial Statements (Continued)
FORD MOTOR COMPANY AND SUBSIDIARIES
CONSOLIDATED STATEMENT OF EQUITY
(in millions, unaudited)
| Equity Attributable to Ford Motor Company |
|
|
|
| ||||||||||||||||||||||||||
| Capital Stock |
| Cap. in Excess of Par Value of Stock |
| Retained Earnings |
| Accumulated Other Comprehensive Income/(Loss) (Note 13) |
| Treasury Stock |
| Total |
| Equity Attributable to Non-controlling Interests |
| Total Equity | ||||||||||||||||
Balance at December 31, 2014 | $ | 40 | |
| $ | 21,089 | |
| $ | 24,556 | |
| $ | (20,032 | ) |
| $ | (848 | ) |
| $ | 24,805 | |
| $ | 27 | |
| $ | 24,832 | |
Net income | - | |
| - | |
| 2,809 | |
| - | |
| - | |
| 2,809 | |
| 2 | |
| 2,811 | | ||||||||
Other comprehensive income/(loss), net of tax | - | |
| - | |
| - | |
| (228 | ) |
| - | |
| (228 | ) |
| (1 | ) |
| (229 | ) | ||||||||
Common stock issued (including share-based compensation impacts) | 1 | |
| 228 | |
| - | |
| - | |
| - | |
| 229 | |
| - | |
| 229 | | ||||||||
Treasury stock/other | - | |
| - | |
| - | |
| - | |
| (91 | ) |
| (91 | ) |
| (1 | ) |
| (92 | ) | ||||||||
Cash dividends declared | - | |
| - | |
| (1,190 | ) |
| - | |
| - | |
| (1,190 | ) |
| (6 | ) |
| (1,196 | ) | ||||||||
Balance at June 30, 2015 | $ | 41 | |
| $ | 21,317 | |
| $ | 26,175 | |
| $ | (20,260 | ) |
| $ | (939 | ) |
| $ | 26,334 | |
| $ | 21 | |
| $ | 26,355 | |
|
|
|
|
|
|
|
|
|
|
|
|
|
|
|
| ||||||||||||||||
Balance at December 31, 2013 | $ | 40 | |
| $ | 21,422 | |
| $ | 23,386 | |
| $ | (18,230 | ) |
| $ | (506 | ) |
| $ | 26,112 | |
| $ | 33 | |
| $ | 26,145 | |
Net income | - | |
| - | |
| 2,300 | |
| - | |
| - | |
| 2,300 | |
| 4 | |
| 2,304 | | ||||||||
Other comprehensive income/(loss), net of tax | - | |
| - | |
| - | |
| 123 | |
| - | |
| 123 | |
| - | |
| 123 | | ||||||||
Common stock issued (including share-based compensation impacts) | - | |
| 201 | |
| - | |
| - | |
| - | |
| 201 | |
| - | |
| 201 | | ||||||||
Treasury stock/other | - | |
| (18 | ) |
| - | |
| - | |
| (955 | ) |
| (973 | ) |
| (4 | ) |
| (977 | ) | ||||||||
Cash dividends declared | - | |
| - | |
| (987 | ) |
| - | |
| - | |
| (987 | ) |
| (2 | ) |
| (989 | ) | ||||||||
Balance at June 30, 2014 | $ | 40 | |
| $ | 21,605 | |
| $ | 24,699 | |
| $ | (18,107 | ) |
| $ | (1,461 | ) |
| $ | 26,776 | |
| $ | 31 | |
| $ | 26,807 | |
The accompanying notes are part of the financial statements.
7
Item 1. Financial Statements (Continued)
FORD MOTOR COMPANY AND SUBSIDIARIES
NOTES TO THE FINANCIAL STATEMENTS
Table of Contents
Footnote |
| Page |
Note 1 | Presentation | 9 |
Note 2 | Accounting Standards Issued But Not Yet Adopted | 10 |
Note 3 | Fair Value Measurements | 11 |
Note 4 | Financial Services Sector Finance Receivables | 12 |
Note 5 | Financial Services Sector Allowance for Credit Losses | 15 |
Note 6 | Inventories | 16 |
Note 7 | Other Liabilities and Deferred Revenue | 16 |
Note 8 | Retirement Benefits | 17 |
Note 9 | Debt | 18 |
Note 10 | Redeemable Noncontrolling Interest | 19 |
Note 11 | Variable Interest Entities | 19 |
Note 12 | Derivative Financial Instruments and Hedging Activities | 20 |
Note 13 | Accumulated Other Comprehensive Income/(Loss) | 22 |
Note 14 | Other Income/(Loss) | 23 |
Note 15 | Employee Separation Actions and Exit and Disposal Activities | 24 |
Note 16 | Income Taxes | 25 |
Note 17 | Changes in Investments in Affiliates | 25 |
Note 18 | Capital Stock and Earnings Per Share | 26 |
Note 19 | Segment Information | 26 |
Note 20 | Commitments and Contingencies | 29 |
8
Item 1. Financial Statements (Continued)
FORD MOTOR COMPANY AND SUBSIDIARIES
NOTES TO THE FINANCIAL STATEMENTS
NOTE 1. PRESENTATION
Our financial statements are presented in accordance with U.S. generally accepted accounting principles ("GAAP") for interim financial information and instructions to the Quarterly Report on Form 10-Q and Rule 10-01 of Regulation S-X. We show certain of our financial statements on both a consolidated and a sector basis for our Automotive and Financial Services sectors. Intercompany items have been eliminated in both the consolidated and sector balance sheets. Where the presentation of these intercompany eliminations or consolidated adjustments differs between the consolidated and sector financial statements, reconciliations of certain line items are explained below in this Note or in the related financial statements and footnotes.
In the opinion of management, these unaudited financial statements reflect a fair statement of the results of operations and financial condition of Ford Motor Company, its consolidated subsidiaries, and consolidated VIEs of which we are the primary beneficiary for the periods and at the dates presented. The results for interim periods are not necessarily indicative of results that may be expected for any other interim period or for the full year. Reference should be made to the financial statements contained in our Annual Report on Form 10-K for the year ended December 31, 2014 (" 2014 Form 10-K Report"). For purposes of this report, "Ford," the "Company," "we," "our," "us" or similar references mean Ford Motor Company, our consolidated subsidiaries, and our consolidated VIEs of which we are the primary beneficiary, unless the context requires otherwise.
We reclassified certain prior year amounts in our consolidated financial statements to conform to current year presentation.
Adoption of New Accounting Standards
Accounting Standards Update ("ASU") 2014-11, Transfers and Servicing - Repurchase-to-Maturity Transactions, Repurchase Financings and Disclosures. On January 1, 2015, we adopted the new accounting standard that changes the accounting for repurchase-to-maturity transactions and repurchase financing arrangements. The new standard also requires additional disclosures for certain transfers of financial assets with agreements that both entitle and obligate the transferor to repurchase the transferred assets from the transferee. The adoption of this accounting standard did not impact our financial statements or financial statement disclosures.
Reconciliations between Consolidated and Sector Financial Statements
Sector to Consolidated Deferred Tax Assets and Liabilities. The difference between the total assets and total liabilities as presented on our sector balance sheet and consolidated balance sheet is the result of netting deferred income tax assets and liabilities. The reconciliation between the totals for the sector and consolidated balance sheets was as follows (in millions):
| June 30, |
| December 31, | ||||
Sector balance sheet presentation of deferred income tax assets |
|
|
| ||||
Automotive sector current deferred income tax assets | $ | 2,779 | |
| $ | 2,039 | |
Automotive sector non-current deferred income tax assets | 12,151 | |
| 13,331 | | ||
Financial Services sector deferred income tax assets (a) | 177 | |
| 185 | | ||
Total | 15,107 | |
| 15,555 | | ||
Reclassification for netting of deferred income taxes | (2,610 | ) |
| (1,916 | ) | ||
Consolidated balance sheet presentation of deferred income tax assets | $ | 12,497 | |
| $ | 13,639 | |
|
|
|
| ||||
Sector balance sheet presentation of deferred income tax liabilities |
| |
|
| | ||
Automotive sector current deferred income tax liabilities | $ | 334 | |
| $ | 270 | |
Automotive sector non-current deferred income tax liabilities | 301 | |
| 367 | | ||
Financial Services sector deferred income tax liabilities | 2,553 | |
| 1,849 | | ||
Total | 3,188 | |
| 2,486 | | ||
Reclassification for netting of deferred income taxes | (2,610 | ) |
| (1,916 | ) | ||
Consolidated balance sheet presentation of deferred income tax liabilities | $ | 578 | |
| $ | 570 | |
__________
(a) | Financial Services deferred income tax assets are included in Financial Services Other assets on our sector balance sheet. |
9
Item 1. Financial Statements (Continued)
FORD MOTOR COMPANY AND SUBSIDIARIES
NOTES TO THE FINANCIAL STATEMENTS
NOTE 2. ACCOUNTING STANDARDS ISSUED BUT NOT YET ADOPTED
ASU 2014-09, Revenue - Revenue from Contracts with Customers. In May 2014, the Financial Accounting Standards Board ("FASB") issued a new accounting standard that requires recognition of revenue to depict the transfer of promised goods or services to customers in an amount that reflects the consideration to which we expect to be entitled in exchange for those goods or services. The new standard supersedes virtually all present U.S. GAAP guidance on revenue recognition and requires the use of more estimates and judgments than the present standards, as well as additional disclosures. The FASB has voted to approve a one-year deferral of the effective date from January 1, 2017 to January 1, 2018, while allowing for early adoption as of January 1, 2017. The new accounting standard is expected to have an impact to our income statement, balance sheet, and financial statement disclosures and we are reviewing our arrangements to evaluate the impact and method of adoption.
The FASB also issued the following standards, none of which are expected to have a material impact to our financial statements or financial statement disclosures.
| Standard |
| Effective Date | |
| 2015-09 | Insurance - Disclosures about Short-Duration Contracts |
| January 1, 2016 |
| 2015-07 | Fair Value Measurement - Disclosures for Investments in Certain Entities that Calculate Net Asset Value per Share (or Its Equivalent) |
| January 1, 2016 |
| 2015-05 | Internal-Use Software - Customer's Accounting for Fees Paid in a Cloud Computing Arrangement |
| January 1, 2016 |
| 2015-03 | Imputation of Interest - Simplifying the Presentation of Debt Issuance Costs |
| January 1, 2016 |
| 2015-02 | Consolidation - Amendments to the Consolidation Analysis |
| January 1, 2016 |
| 2015-01 | Extraordinary and Unusual Items - Simplifying Income Statement Presentation by Eliminating the Concept of Extraordinary Items |
| January 1, 2016 |
| 2014-16 | Derivatives and Hedging - Determining Whether the Host Contract in a Hybrid Financial Instrument Issued in the Form of a Share Is More Akin to Debt or to Equity |
| January 1, 2016 |
| 2014-13 | Consolidation - Measuring the Financial Assets and the Financial Liabilities of a Consolidated Collateralized Financing Entity |
| January 1, 2016 |
| 2014-12 | Stock Compensation - Accounting for Share-Based Payments When the Terms of an Award Provide That a Performance Target Could Be Achieved after the Requisite Service Period |
| January 1, 2016 |
| 2014-15 | Going Concern - Disclosure of Uncertainties about an Entity's Ability to Continue as a Going Concern |
| December 31, 2016 |
| 2015-11 | Inventory - Simplifying the Measurement of Inventory |
| January 1, 2017 |
10
Item 1. Financial Statements (Continued)
FORD MOTOR COMPANY AND SUBSIDIARIES
NOTES TO THE FINANCIAL STATEMENTS
NOTE 3. FAIR VALUE MEASUREMENTS
Cash equivalents, marketable securities, and derivative financial instruments are remeasured and presented on our financial statements on a recurring basis at fair value, while other assets and liabilities are measured at fair value on a nonrecurring basis.
There have been no changes to the types of inputs used or the valuation techniques since year end.
Input Hierarchy of Items Measured at Fair Value on a Recurring Basis
The following table categorizes the fair values of items measured at fair value on a recurring basis on our balance sheet (in millions):
| June 30, 2015 |
| December 31, 2014 | ||||||||||||||||||||||||||||
| Level 1 |
| Level 2 |
| Level 3 |
| Total |
| Level 1 |
| Level 2 |
| Level 3 |
| Total | ||||||||||||||||
Automotive Sector |
|
|
|
|
|
|
|
|
|
|
|
|
|
|
| ||||||||||||||||
Assets |
|
|
|
|
|
|
|
|
|
|
|
|
|
|
| ||||||||||||||||
Cash equivalents – financial instruments |
|
|
|
|
|
|
|
|
|
|
|
|
|
|
| ||||||||||||||||
U.S. government and agencies | $ | - | |
| $ | 8 | |
| $ | - | |
| $ | 8 | |
| $ | - | |
| $ | 64 | |
| $ | - | |
| $ | 64 | |
Non-U.S. government and agencies | - | |
| 249 | |
| - | |
| 249 | |
| - | |
| 122 | |
| - | |
| 122 | | ||||||||
Corporate debt | - | |
| 10 | |
| - | |
| 10 | |
| - | |
| 20 | |
| - | |
| 20 | | ||||||||
Total cash equivalents (a) | - | |
| 267 | |
| - | |
| 267 | |
| - | |
| 206 | |
| - | |
| 206 | | ||||||||
Marketable securities |
| |
|
| |
|
| |
|
|
|
|
|
|
|
|
|
| |||||||||||||
U.S. government and agencies | 846 | |
| 3,706 | |
| - | |
| 4,552 | |
| 969 | |
| 5,789 | |
| - | |
| 6,758 | | ||||||||
Non-U.S. government and agencies | - | |
| 6,068 | |
| - | |
| 6,068 | |
| - | |
| 7,004 | |
| - | |
| 7,004 | | ||||||||
Corporate debt | - | |
| 3,617 | |
| - | |
| 3,617 | |
| - | |
| 2,738 | |
| - | |
| 2,738 | | ||||||||
Equities | 15 | |
| - | |
| - | |
| 15 | |
| 322 | |
| - | |
| - | |
| 322 | | ||||||||
Other marketable securities | - | |
| 347 | |
| - | |
| 347 | |
| - | |
| 313 | |
| - | |
| 313 | | ||||||||
Total marketable securities | 861 | |
| 13,738 | |
| - | |
| 14,599 | |
| 1,291 | |
| 15,844 | |
| - | |
| 17,135 | | ||||||||
Derivative financial instruments (b) | - | |
| 521 | |
| - | |
| 521 | |
| - | |
| 517 | |
| - | |
| 517 | | ||||||||
Total assets at fair value | $ | 861 | |
| $ | 14,526 | |
| $ | - | |
| $ | 15,387 | |
| $ | 1,291 | |
| $ | 16,567 | |
| $ | - | |
| $ | 17,858 | |
Liabilities |
| |
|
| |
|
| |
|
|
|
|
|
|
|
|
|
| |||||||||||||
Derivative financial instruments (b) | $ | - | |
| $ | 991 | |
| $ | 1 | |
| $ | 992 | |
| $ | - | |
| $ | 710 | |
| $ | 3 | |
| $ | 713 | |
Total liabilities at fair value | $ | - | |
| $ | 991 | |
| $ | 1 | |
| $ | 992 | |
| $ | - | |
| $ | 710 | |
| $ | 3 | |
| $ | 713 | |
|
|
|
|
|
|
|
|
|
|
|
|
|
|
|
| ||||||||||||||||
Financial Services Sector |
|
|
|
|
|
|
|
|
|
|
|
|
|
|
| ||||||||||||||||
Assets |
|
|
|
|
|
|
|
|
|
|
|
|
|
|
| ||||||||||||||||
Cash equivalents – financial instruments |
|
|
|
|
|
|
|
|
|
|
|
|
|
|
| ||||||||||||||||
Non-U.S. government and agencies | $ | - | |
| $ | 419 | |
| $ | - | |
| $ | 419 | |
| $ | - | |
| $ | 341 | |
| $ | - | |
| $ | 341 | |
Corporate debt | - | |
| 50 | |
| - | |
| 50 | |
| - | |
| 10 | |
| - | |
| 10 | | ||||||||
Total cash equivalents (a) | - | |
| 469 | |
| - | |
| 469 | |
| - | |
| 351 | |
| - | |
| 351 | | ||||||||
Marketable securities |
| |
|
| |
|
| |
|
|
|
|
|
|
|
|
|
| |||||||||||||
U.S. government and agencies | 669 | |
| 700 | |
| - | |
| 1,369 | |
| 17 | |
| 1,251 | |
| - | |
| 1,268 | | ||||||||
Non-U.S. government and agencies | - | |
| 630 | |
| - | |
| 630 | |
| - | |
| 405 | |
| - | |
| 405 | | ||||||||
Corporate debt | - | |
| 1,780 | |
| - | |
| 1,780 | |
| - | |
| 1,555 | |
| - | |
| 1,555 | | ||||||||
Other marketable securities | - | |
| 27 | |
| - | |
| 27 | |
| - | |
| 30 | |
| - | |
| 30 | | ||||||||
Total marketable securities | 669 | |
| 3,137 | |
| - | |
| 3,806 | |
| 17 | |
| 3,241 | |
| - | |
| 3,258 | | ||||||||
Derivative financial instruments (b) | - | |
| 823 | |
| - | |
| 823 | |
| - | |
| 859 | |
| - | |
| 859 | | ||||||||
Total assets at fair value | $ | 669 | |
| $ | 4,429 | |
| $ | - | |
| $ | 5,098 | |
| $ | 17 | |
| $ | 4,451 | |
| $ | - | |
| $ | 4,468 | |
Liabilities |
| |
|
| |
|
| |
|
|
|
|
|
|
|
|
|
| |||||||||||||
Derivative financial instruments (b) | $ | - | |
| $ | 378 | |
| $ | - | |
| $ | 378 | |
| $ | - | |
| $ | 167 | |
| $ | - | |
| $ | 167 | |
Total liabilities at fair value | $ | - | |
| $ | 378 | |
| $ | - | |
| $ | 378 | |
| $ | - | |
| $ | 167 | |
| $ | - | |
| $ | 167 | |
__________
(a) | Excludes time deposits, certificates of deposit, money market accounts, and other cash equivalents reported at par value on our balance sheet totaling $4.6 billion and $3.3 billion for Automotive sector and $3.9 billion and $3.8 billion for Financial Services sector at June 30, 2015 and December 31, 2014 , respectively. In addition to these cash equivalents, we also had cash on hand totaling $1.2 billion and $1.1 billion for Automotive sector and $2.4 billion and $2 billion for Financial Services sector at June 30, 2015 and December 31, 2014 , respectively. |
(b) | See Note 12 for additional information regarding derivative financial instruments. |
11
Item 1. Financial Statements (Continued)
FORD MOTOR COMPANY AND SUBSIDIARIES
NOTES TO THE FINANCIAL STATEMENTS
NOTE 4. FINANCIAL SERVICES SECTOR FINANCE RECEIVABLES
Our Financial Services sector, primarily Ford Credit, segments finance receivables into "consumer" and "non-consumer" portfolios. The receivables are generally secured by the vehicles, inventory, or other property being financed.
Finance receivables, net were as follows (in millions):
| June 30, |
| December 31, | ||||
Consumer |
|
|
| ||||
Retail financing, gross | $ | 57,646 | |
| $ | 55,856 | |
Unearned interest supplements | (1,739 | ) |
| (1,760 | ) | ||
Consumer finance receivables | 55,907 | |
| 54,096 | | ||
Non-Consumer |
| |
|
| | ||
Dealer financing | 32,093 | |
| 31,340 | | ||
Other financing | 1,131 | |
| 1,026 | | ||
Non-Consumer finance receivables | 33,224 | |
| 32,366 | | ||
Total recorded investment | $ | 89,131 | |
| $ | 86,462 | |
|
|
|
| ||||
Recorded investment in finance receivables | $ | 89,131 | |
| $ | 86,462 | |
Allowance for credit losses | (335 | ) |
| (321 | ) | ||
Finance receivables, net (a) | $ | 88,796 | |
| $ | 86,141 | |
|
|
|
| ||||
Net finance receivables subject to fair value (b) | $ | 87,026 | |
| $ | 84,468 | |
Fair value | 88,315 | |
| 85,941 | | ||
__________
(a) | On the consolidated balance sheet at June 30, 2015 and December 31, 2014 , $6 billion and $5 billion , respectively, are reclassified to Other receivables, net, resulting in Finance receivables, net of $82.8 billion and $81.1 billion , respectively. |
(b) | At June 30, 2015 and December 31, 2014 , excludes $1.8 billion and $1.7 billion , respectively, of certain receivables (primarily direct financing leases) that are not subject to fair value disclosure requirements. |
Excluded from finance receivables at June 30, 2015 and December 31, 2014 , was $185 million and $191 million , respectively, of accrued uncollected interest, which we report in Other assets on the balance sheet.
Included in the recorded investment in finance receivables at June 30, 2015 and December 31, 2014 were consumer receivables of $26.9 billion and $24.4 billion and non-consumer receivables of $23.1 billion and $21.8 billion , respectively, that have been sold for legal purposes in securitization transactions but continue to be reported in our consolidated financial statements. The receivables are available only for payment of the debt issued by, and other obligations of, the securitization entities that are parties to those securitization transactions; they are not available to pay the other obligations or the claims of Ford Credit's other creditors. Ford Credit holds the right to receive the excess cash flows not needed to pay the debt issued by, and other obligations of, the securitization entities that are parties to those securitization transactions (see Note 11 for additional information).
12
Item 1. Financial Statements (Continued)
FORD MOTOR COMPANY AND SUBSIDIARIES
NOTES TO THE FINANCIAL STATEMENTS
NOTE 4. FINANCIAL SERVICES SECTOR FINANCE RECEIVABLES (Continued)
Aging
For all finance receivables, we define "past due" as any payment, including principal and interest, that is at least 31 days past the contractual due date . The recorded investment of consumer receivables greater than 90 days past due and still accruing interest was $13 million and $17 million at June 30, 2015 and December 31, 2014 , respectively. The recorded investment of non-consumer receivables greater than 90 days past due and still accruing interest was $1 million and $3 million at June 30, 2015 and December 31, 2014 , respectively.
The aging analysis of our finance receivables balances were as follows (in millions):
| June 30, |
| December 31, | ||||
Consumer |
|
|
| ||||
31-60 days past due | $ | 566 | |
| $ | 718 | |
61-90 days past due | 85 | |
| 97 | | ||
91-120 days past due | 23 | |
| 29 | | ||
Greater than 120 days past due | 39 | |
| 52 | | ||
Total past due | 713 | |
| 896 | | ||
Current | 55,194 | |
| 53,200 | | ||
Consumer finance receivables | 55,907 | |
| 54,096 | | ||
|
|
|
| ||||
Non-Consumer |
|
|
| ||||
Total past due | 110 | |
| 117 | | ||
Current | 33,114 | |
| 32,249 | | ||
Non-Consumer finance receivables | 33,224 | |
| 32,366 | | ||
Total recorded investment | $ | 89,131 | |
| $ | 86,462 | |
Credit Quality
Consumer Portfolio. Credit quality ratings for consumer receivables are based on aging. Refer to the aging table above.
Consumer receivables credit quality ratings are as follows:
• | Pass – current to 60 days past due |
• | Special Mention – 61 to 120 days past due and in intensified collection status |
• | Substandard – greater than 120 days past due and for which the uncollectible portion of the receivables has already been charged off, as measured using the fair value of collateral |
Non-Consumer Portfolio. Dealers are assigned to one of four groups according to risk ratings as follows:
• | Group I – strong to superior financial metrics |
• | Group II – fair to favorable financial metrics |
• | Group III – marginal to weak financial metrics |
• | Group IV – poor financial metrics, including dealers classified as uncollectible |
13
Item 1. Financial Statements (Continued)
FORD MOTOR COMPANY AND SUBSIDIARIES
NOTES TO THE FINANCIAL STATEMENTS
NOTE 4. FINANCIAL SERVICES SECTOR FINANCE RECEIVABLES (Continued)
The credit quality analysis of our dealer financing receivables was as follows (in millions):
| June 30, |
| December 31, | ||||
Dealer Financing |
|
|
| ||||
Group I | $ | 24,088 | |
| $ | 23,125 | |
Group II | 6,500 | |
| 6,350 | | ||
Group III | 1,402 | |
| 1,783 | | ||
Group IV | 103 | |
| 82 | | ||
Total recorded investment | $ | 32,093 | |
| $ | 31,340 | |
Impaired Receivables
Impaired consumer receivables include accounts that have been rewritten or modified in reorganization proceedings pursuant to the U.S. Bankruptcy Code that are considered to be troubled debt restructurings ("TDRs"), as well as all accounts greater than 120 days past due . Impaired non-consumer receivables represent accounts with dealers that have weak or poor financial metrics or dealer financing that has been modified in TDRs. The recorded investment of consumer receivables that were impaired at June 30, 2015 and December 31, 2014 was $380 million , or 0.7% of consumer receivables, and $415 million , or 0.8% of consumer receivables, respectively. The recorded investment of non-consumer receivables that were impaired at June 30, 2015 and December 31, 2014 was $126 million , or 0.4% of non-consumer receivables, and $105 million , or 0.3% of non-consumer receivables, respectively. Impaired finance receivables are evaluated both collectively and specifically.
14
Item 1. Financial Statements (Continued)
FORD MOTOR COMPANY AND SUBSIDIARIES
NOTES TO THE FINANCIAL STATEMENTS
NOTE 5. FINANCIAL SERVICES SECTOR ALLOWANCE FOR CREDIT LOSSES
An analysis of the allowance for credit losses related to finance receivables for the periods ended June 30 was as follows (in millions):
| Second Quarter 2015 |
| First Half 2015 | ||||||||||||||||||||
| Consumer |
| Non-Consumer |
| Total |
| Consumer |
| Non-Consumer |
| Total | ||||||||||||
Allowance for credit losses |
|
|
|
|
|
|
|
|
|
|
| ||||||||||||
Beginning balance | $ | 301 | |
| $ | 13 | |
| $ | 314 | |
| $ | 305 | |
| $ | 16 | |
| $ | 321 | |
Charge-offs | (70 | ) |
| (2 | ) |
| (72 | ) |
| (150 | ) |
| (1 | ) |
| (151 | ) | ||||||
Recoveries | 31 | |
| 1 | |
| 32 | |
| 61 | |
| 3 | |
| 64 | | ||||||
Provision for credit losses | 57 | |
| - | |
| 57 | |
| 110 | |
| (4 | ) |
| 106 | | ||||||
Other (a) | 3 | |
| 1 | |
| 4 | |
| (4 | ) |
| (1 | ) |
| (5 | ) | ||||||
Ending balance (b) | $ | 322 | |
| $ | 13 | |
| $ | 335 | |
| $ | 322 | |
| $ | 13 | |
| $ | 335 | |
|
|
|
|
|
|
|
|
|
|
|
| ||||||||||||
Analysis of ending balance of allowance for credit losses | |||||||||||||||||||||||
Collective impairment allowance |
|
|
|
|
|
| $ | 303 | |
| $ | 13 | |
| $ | 316 | | ||||||
Specific impairment allowance |
|
|
|
|
|
| 19 | |
| - | |
| 19 | | |||||||||
Ending balance (b) |
|
|
|
|
|
| 322 | |
| 13 | |
| 335 | | |||||||||
|
|
|
|
|
|
|
|
|
|
|
| ||||||||||||
Analysis of ending balance of finance receivables |
|
|
|
|
|
| |||||||||||||||||
Collectively evaluated for impairment |
|
|
|
|
|
| 55,527 | |
| 33,098 | |
| 88,625 | | |||||||||
Specifically evaluated for impairment |
|
|
|
|
|
| 380 | |
| 126 | |
| 506 | | |||||||||
Recorded investment |
|
|
|
|
|
| 55,907 | |
| 33,224 | |
| 89,131 | | |||||||||
|
|
|
|
|
|
|
|
|
|
|
| ||||||||||||
Ending balance, net of allowance for credit losses |
|
|
| $ | 55,585 | |
| $ | 33,211 | |
| $ | 88,796 | | |||||||||
__________
(a) | Primarily represents amounts related to translation adjustments. |
(b) | Total allowance, including reserves for operating leases, was $380 million . |
| Second Quarter 2014 |
| First Half 2014 | ||||||||||||||||||||
| Consumer |
| Non-Consumer |
| Total |
| Consumer |
| Non-Consumer |
| Total | ||||||||||||
Allowance for credit losses |
|
|
|
|
|
|
|
|
|
|
| ||||||||||||
Beginning balance | $ | 307 | |
| $ | 27 | |
| $ | 334 | |
| $ | 327 | |
| $ | 30 | |
| $ | 357 | |
Charge-offs | (58 | ) |
| (3 | ) |
| (61 | ) |
| (133 | ) |
| (5 | ) |
| (138 | ) | ||||||
Recoveries | 34 | |
| 1 | |
| 35 | |
| 68 | |
| 6 | |
| 74 | | ||||||
Provision for credit losses | 17 | |
| - | |
| 17 | |
| 40 | |
| (7 | ) |
| 33 | | ||||||
Other (a) | 3 | |
| (1 | ) |
| 2 | |
| 1 | |
| - | |
| 1 | | ||||||
Ending balance (b) | $ | 303 | |
| $ | 24 | |
| $ | 327 | |
| $ | 303 | |
| $ | 24 | |
| $ | 327 | |
|
|
|
|
|
|
|
|
|
|
|
| ||||||||||||
Analysis of ending balance of allowance for credit losses | |||||||||||||||||||||||
Collective impairment allowance |
|
|
|
|
|
| $ | 281 | |
| $ | 23 | |
| $ | 304 | | ||||||
Specific impairment allowance |
|
|
|
|
|
| 22 | |
| 1 | |
| 23 | | |||||||||
Ending balance (b) |
|
|
|
|
|
| 303 | |
| 24 | |
| 327 | | |||||||||
|
|
|
|
|
|
|
|
|
|
|
| ||||||||||||
Analysis of ending balance of finance receivables |
|
|
|
|
|
| |||||||||||||||||
Collectively evaluated for impairment |
|
|
|
|
|
| 51,505 | |
| 34,293 | |
| 85,798 | | |||||||||
Specifically evaluated for impairment |
|
|
|
|
|
| 419 | |
| 125 | |
| 544 | | |||||||||
Recorded investment |
|
|
|
|
|
| 51,924 | |
| 34,418 | |
| 86,342 | | |||||||||
|
|
|
|
|
|
|
|
|
|
|
| ||||||||||||
Ending balance, net of allowance for credit losses |
| $ | 51,621 | |
| $ | 34,394 | |
| $ | 86,015 | | |||||||||||
__________
(a) | Primarily represents amounts related to translation adjustments. |
(b) | Total allowance, including reserves for operating leases, was $353 million . |
15
Item 1. Financial Statements (Continued)
FORD MOTOR COMPANY AND SUBSIDIARIES
NOTES TO THE FINANCIAL STATEMENTS
NOTE 6. INVENTORIES
All inventories are stated at the lower of cost or market. Cost for a substantial portion of U.S. inventories is determined on a last-in, first-out ("LIFO") basis. LIFO was used for 33% and 28% of total inventories at June 30, 2015 and December 31, 2014 , respectively. Cost of other inventories is determined by costing methods that approximate a first-in, first-out ("FIFO") basis.
Inventories were as follows (in millions):
| June 30, |
| December 31, | ||||
Raw materials, work-in-process, and supplies | $ | 4,282 | |
| $ | 3,822 | |
Finished products | 6,151 | |
| 5,022 | | ||
Total inventories under FIFO | 10,433 | |
| 8,844 | | ||
LIFO adjustment | (995 | ) |
| (978 | ) | ||
Total inventories | $ | 9,438 | |
| $ | 7,866 | |
NOTE 7. OTHER LIABILITIES AND DEFERRED REVENUE
| June 30, |
| December 31, | ||||
Automotive Sector |
|
|
| ||||
Current |
|
|
| ||||
Dealer and dealers' customer allowances and claims | $ | 7,830 | |
| $ | 7,846 | |
Deferred revenue | 5,393 | |
| 3,923 | | ||
Employee benefit plans | 1,353 | |
| 1,994 | | ||
Accrued interest | 239 | |
| 222 | | ||
Other postretirement employee benefits ("OPEB") | 381 | |
| 397 | | ||
Pension (a) | 353 | |
| 374 | | ||
Other | 2,833 | |
| 3,178 | | ||
Total Automotive other liabilities and deferred revenue | 18,382 | |
| 17,934 | | ||
Non-current |
| |
|
| | ||
Pension (a) | 9,266 | |
| 9,721 | | ||
OPEB | 5,843 | |
| 5,991 | | ||
Dealer and dealers' customer allowances and claims | 2,843 | |
| 2,852 | | ||
Deferred revenue | 2,825 | |
| 2,686 | | ||
Employee benefit plans | 1,134 | |
| 1,149 | | ||
Other | 1,435 | |
| 1,394 | | ||
Total Automotive other liabilities and deferred revenue | 23,346 | |
| 23,793 | | ||
Total Automotive sector | 41,728 | |
| 41,727 | | ||
Financial Services Sector | 1,921 | |
| 1,850 | | ||
Total Company | $ | 43,649 | |
| $ | 43,577 | |
__________
(a) | Balances at June 30, 2015 reflect net pension liabilities at December 31, 2014 , updated for service and interest cost, expected return on assets, separation expense, actual benefit payments, cash contributions, and an adjustment recorded in the first quarter of 2015 (see Note 8 for additional information). The discount rate and rate of expected return assumptions are unchanged from year-end 2014 . |
16
Item 1. Financial Statements (Continued)
FORD MOTOR COMPANY AND SUBSIDIARIES
NOTES TO THE FINANCIAL STATEMENTS
NOTE 8. RETIREMENT BENEFITS
In the first quarter of 2015, we recorded a $782 million adjustment to correct for an understatement in the year-end 2014 valuation of our U.S. pension benefit obligation. The adjustment reduced Other assets by $301 million and increased Other liabilities and deferred revenue by $481 million . The resulting after-tax adjustment to Other comprehensive income was a loss of $508 million . The adjustments were not material to current or prior period financial statements.
Defined Benefit Plans - Expense
| Second Quarter | ||||||||||||||||||||||
| Pension Benefits |
|
|
|
| ||||||||||||||||||
| U.S. Plans |
| Non-U.S. Plans |
| Worldwide OPEB | ||||||||||||||||||
| 2015 |
| 2014 |
| 2015 |
| 2014 |
| 2015 |
| 2014 | ||||||||||||
Service cost | $ | 146 | |
| $ | 126 | |
| $ | 133 | |
| $ | 120 | |
| $ | 15 | |
| $ | 14 | |
Interest cost | 455 | |
| 498 | |
| 232 | |
| 302 | |
| 59 | |
| 67 | | ||||||
Expected return on assets | (688 | ) |
| (678 | ) |
| (343 | ) |
| (383 | ) |
| - | |
| - | | ||||||
Amortization of: |
| |
|
| |
|
| |
|
| |
|
| |
|
| | ||||||
Prior service costs/(credits) | 39 | |
| 39 | |
| 11 | |
| 13 | |
| (52 | ) |
| (57 | ) | ||||||
(Gains)/Losses | 116 | |
| 52 | |
| 199 | |
| 148 | |
| 35 | |
| 25 | | ||||||
Separation programs/other | (1 | ) |
| 1 | |
| 12 | |
| 23 | |
| 3 | |
| (1 | ) | ||||||
Recognition of (gains)/losses due to: |
|
|
|
|
|
|
|
|
|
|
| ||||||||||||
Curtailments | - | |
| - | |
| - | |
| - | |
| - | |
| - | | ||||||
Settlements | - | |
| - | |
| - | |
| - | |
| - | |
| - | | ||||||
Total expense/(income) | $ | 67 | |
| $ | 38 | |
| $ | 244 | |
| $ | 223 | |
| $ | 60 | |
| $ | 48 | |
| First Half | ||||||||||||||||||||||
| Pension Benefits |
|
|
|
| ||||||||||||||||||
| U.S. Plans |
| Non-U.S. Plans |
| Worldwide OPEB | ||||||||||||||||||
| 2015 |
| 2014 |
| 2015 |
| 2014 |
| 2015 |
| 2014 | ||||||||||||
Service cost | $ | 293 | |
| $ | 253 | |
| $ | 268 | |
| $ | 238 | |
| $ | 30 | |
| $ | 27 | |
Interest cost | 909 | |
| 996 | |
| 471 | |
| 602 | |
| 119 | |
| 134 | | ||||||
Expected return on assets | (1,377 | ) |
| (1,356 | ) |
| (692 | ) |
| (762 | ) |
| - | |
| - | | ||||||
Amortization of: |
|
|
| |
|
|
|
|
|
|
| | | ||||||||||
Prior service costs/(credits) | 78 | |
| 78 | |
| 23 | |
| 27 | |
| (103 | ) |
| (114 | ) | ||||||
(Gains)/Losses | 232 | |
| 103 | |
| 404 | |
| 296 | |
| 71 | |
| 49 | | ||||||
Separation programs/other | 1 | |
| 1 | |
| 19 | |
| 39 | |
| 2 | |
| - | | ||||||
Recognition of (gains)/losses due to: |
|
|
|
|
|
|
|
|
|
|
| ||||||||||||
Curtailments | - | |
| - | |
| - | |
| - | |
| - | |
| - | | ||||||
Settlements | - | |
| - | |
| - | |
| 14 | |
| - | |
| - | | ||||||
Total expense/(income) | $ | 136 | |
| $ | 75 | |
| $ | 493 | |
| $ | 454 | |
| $ | 119 | |
| $ | 96 | |
Pension Plan Contributions
In 2015 , we expect to contribute $1.1 billion from Automotive cash and cash equivalents to our worldwide funded pension plans (most of which are mandatory contributions), and to make about $400 million of benefit payments to participants in unfunded plans, for a total of $1.5 billion . In the first half of 2015 , we contributed about $900 million to our worldwide funded pension plans and made about $200 million of benefit payments to participants in unfunded plans.
17
Item 1. Financial Statements (Continued)
FORD MOTOR COMPANY AND SUBSIDIARIES
NOTES TO THE FINANCIAL STATEMENTS
NOTE 9. DEBT
The carrying value of debt was $123.5 billion and $119.2 billion at June 30, 2015 and December 31, 2014 , respectively. The carrying value of Automotive sector and Financial Services sector debt was as follows (in millions):
Automotive Sector | June 30, |
| December 31, | ||||
Debt payable within one year |
|
|
| ||||
Short-term | $ | 458 | |
| $ | 373 | |
Long-term payable within one year |
| |
|
| | ||
U.S. Department of Energy ("DOE") Advanced Technology Vehicles Manufacturing ("ATVM") Incentive Program | 591 | |
| 591 | | ||
European Investment Bank ("EIB") loans | 709 | |
| 1,187 | | ||
Other debt | 430 | |
| 350 | | ||
Total debt payable within one year | 2,188 | |
| 2,501 | | ||
Long-term debt payable after one year |
| |
|
| | ||
Public unsecured debt securities | 6,594 | |
| 6,634 | | ||
DOE ATVM Incentive Program | 3,538 | |
| 3,833 | | ||
Other debt | 1,914 | |
| 1,000 | | ||
Unamortized (discount)/premium | (521 | ) |
| (144 | ) | ||
Total long-term debt payable after one year | 11,525 | |
| 11,323 | | ||
Total Automotive sector | $ | 13,713 | |
| $ | 13,824 | |
|
|
|
| ||||
Fair value of Automotive sector debt (a) | $ | 15,163 | |
| $ | 15,553 | |
|
|
|
| ||||
Financial Services Sector |
| |
|
| | ||
Short-term debt |
| |
|
| | ||
Unsecured debt | $ | 9,679 | |
| $ | 9,761 | |
Asset-backed debt | 1,583 | |
| 1,377 | | ||
Total short-term debt | 11,262 | |
| 11,138 | | ||
Long-term debt |
| |
|
| | ||
Unsecured debt |
| |
|
| | ||
Notes payable within one year | 8,535 | |
| 8,795 | | ||
Notes payable after one year | 44,734 | |
| 43,087 | | ||
Asset-backed debt |
| |
|
| | ||
Notes payable within one year | 17,354 | |
| 16,738 | | ||
Notes payable after one year | 27,591 | |
| 25,216 | | ||
Unamortized (discount)/premium | (44 | ) |
| (55 | ) | ||
Fair value adjustments (b) | 381 | |
| 428 | | ||
Total long-term debt | 98,551 | |
| 94,209 | | ||
Total Financial Services sector | $ | 109,813 | |
| $ | 105,347 | |
|
|
|
| ||||
Fair value of Financial Services sector debt (a) | $ | 111,662 | |
| $ | 107,758 | |
__________
(a) | The fair value of debt includes $272 million and $131 million of Automotive sector short-term debt and $9.7 billion and $9.8 billion of Financial Services sector short-term debt at June 30, 2015 and December 31, 2014 , respectively, carried at cost, which approximates fair value. All debt is categorized within Level 2 of the fair value hierarchy. |
(b) | Adjustments related to designated fair value hedges of unsecured debt. |
18
Item 1. Financial Statements (Continued)
FORD MOTOR COMPANY AND SUBSIDIARIES
NOTES TO THE FINANCIAL STATEMENTS
NOTE 10. REDEEMABLE NONCONTROLLING INTEREST
The redeemable noncontrolling interest in our Ford Sollers joint venture is discussed in Note 17 .
AutoAlliance International, Inc. ("AAI") was a 50 / 50 joint venture between Ford and Mazda Motor Corporation ("Mazda") that owned an automobile assembly plant in Flat Rock, Michigan. In January 2015, Mazda exercised its put option and Ford purchased Mazda's 50% equity interest at the exercise price plus accrued interest of $342 million (included in Cash flows from financing activities in our statement of cash flows) and dissolved AAI.
NOTE 11. VARIABLE INTEREST ENTITIES
VIEs of Which We are Not the Primary Beneficiary
Certain of our joint ventures are VIEs, in which the power to direct economically significant activities is shared with the joint venture partner. Our investments in these joint ventures are accounted for as equity method investments. Our maximum exposure to any potential losses associated with these joint ventures is limited to our investment, including loans, and was $280 million and $307 million at June 30, 2015 and December 31, 2014 , respectively.
VIEs of Which We are the Primary Beneficiary
Securitization Entities Through Ford Credit, we securitize, transfer, and service financial assets associated with consumer finance receivables, operating leases, and wholesale loans. Our securitization transactions typically involve the legal transfer of financial assets to bankruptcy remote special purpose entities ("SPEs"). The third-party investors in these securitization entities have legal recourse only to the assets securing the debt and do not have recourse to us, except for the customary representation and warranty provisions. In addition, the cash flows generated by the assets are restricted only to pay such liabilities. We generally retain economic interests in the asset-backed securitization transactions, which are retained in the form of senior or subordinated interests, cash reserve accounts, residual interests, and servicing rights. For accounting purposes, we are precluded from recording the transfers of assets in securitization transactions as sales.
In most cases, the bankruptcy remote SPEs meet the definition of VIEs for which we have determined we have both the power to direct the activities of the entity that most significantly impact the entity's economic performance and the obligation to absorb losses or the right to receive benefits of the entity that could be significant, and would therefore also be consolidated. We account for all securitization transactions as if they were secured financing and therefore the assets, liabilities and related activity of these transactions are consolidated in our financial results and are included in amounts presented on the face of our consolidated balance sheet (see Note 4 for additional information).
19
Item 1. Financial Statements (Continued)
FORD MOTOR COMPANY AND SUBSIDIARIES
NOTES TO THE FINANCIAL STATEMENTS
NOTE 12. DERIVATIVE FINANCIAL INSTRUMENTS AND HEDGING ACTIVITIES
In the normal course of business, our operations are exposed to global market risks, including the effect of changes in foreign currency exchange rates, certain commodity prices, and interest rates. To manage these risks, we enter into highly effective derivatives contracts. We have elected to apply hedge accounting to certain derivatives. Derivatives that are designated in hedging relationships are evaluated for effectiveness using regression analysis at the time they are designated and throughout the hedge period. Some derivatives do not qualify for hedge accounting; for others, we elect not to apply hedge accounting.
Income Effect of Derivative Financial Instruments
The gains/(losses), by hedge designation, recorded in income for the periods ended June 30 were as follows (in millions):
| Second Quarter |
| First Half | ||||||||||||
| 2015 |
| 2014 |
| 2015 |
| 2014 | ||||||||
Automotive Sector |
|
|
|
|
|
|
| ||||||||
Cash flow hedges (a) |
|
|
|
|
|
|
| ||||||||
Reclassified from AOCI to income | $ | (90 | ) |
| $ | 92 | |
| $ | (136 | ) |
| $ | 160 | |
Ineffectiveness | - | |
| - | |
| - | |
| - | | ||||
Derivatives not designated as hedging instruments |
|
|
|
|
|
|
| ||||||||
Foreign currency exchange contracts | (116 | ) |
| (17 | ) |
| 145 | |
| (61 | ) | ||||
Commodity contracts | (15 | ) |
| 47 | |
| (25 | ) |
| 35 | | ||||
Total | $ | (221 | ) |
| $ | 122 | |
| $ | (16 | ) |
| $ | 134 | |
|
|
|
|
|
|
|
| ||||||||
Financial Services Sector |
|
|
|
|
|
|
| ||||||||
Fair value hedges |
|
|
|
|
|
|
| ||||||||
Interest rate contracts |
|
|
|
|
|
|
| ||||||||
Net interest settlements and accruals excluded from the assessment of hedge effectiveness | $ | 89 | |
| $ | 72 | |
| $ | 177 | |
| $ | 141 | |
Ineffectiveness (b) | (10 | ) |
| 5 | |
| (4 | ) |
| 10 | | ||||
Derivatives not designated as hedging instruments |
|
|
|
|
|
|
| ||||||||
Interest rate contracts | (18 | ) |
| (9 | ) |
| (61 | ) |
| (27 | ) | ||||
Foreign currency exchange contracts | (65 | ) |
| (25 | ) |
| - | |
| (30 | ) | ||||
Cross-currency interest rate swap contracts | (77 | ) |
| (11 | ) |
| 12 | |
| (16 | ) | ||||
Total | $ | (81 | ) |
| $ | 32 | |
| $ | 124 | |
| $ | 78 | |
__________
(a) | For the second quarter and first half of 2015 , $217 million loss and a $367 million loss, respectively, were recorded in Other comprehensive income . For the second quarter and first half of 2014 , $338 million loss and a $208 million loss, respectively, were recorded in Other comprehensive income. |
(b) | For the second quarter and first half of 2015 , hedge ineffectiveness reflects the net change in fair value on derivatives of $249 million loss and $28 million loss, respectively, and change in value on hedged debt attributable to the change in benchmark interest rates of $239 million gain and $24 million gain, respectively. For the second quarter and first half of 2014 , hedge ineffectiveness reflects the net change in fair value on derivatives of $162 million gain and $267 million gain, respectively, and change in value on hedged debt attributable to the change in benchmark interest rates of $157 million loss and $257 million loss, respectively. |
20
Item 1. Financial Statements (Continued)
FORD MOTOR COMPANY AND SUBSIDIARIES
NOTES TO THE FINANCIAL STATEMENTS
NOTE 12. DERIVATIVE FINANCIAL INSTRUMENTS AND HEDGING ACTIVITIES (Continued)
Balance Sheet Effect of Derivative Financial Instruments
Derivative financial instruments are recorded on the balance sheet at fair value, presented on a gross basis, and include an adjustment for non-performance risk. Notional amounts are presented on a gross basis. The notional amounts of the derivative financial instruments do not necessarily represent amounts exchanged by the parties and, therefore, are not a direct measure of our financial risk exposure. We enter into master agreements with counterparties that may allow for netting of exposure in the event of default or termination of the counterparty agreement due to breach of contract.
The notional amount and estimated fair value of our derivative financial instruments were as follows (in millions):
| June 30, 2015 |
| December 31, 2014 | ||||||||||||||||||||
| Notional |
| Fair Value of Assets |
| Fair Value of Liabilities |
| Notional |
| Fair Value of Assets |
| Fair Value of Liabilities | ||||||||||||
Automotive Sector |
|
|
|
|
|
|
|
|
|
|
| ||||||||||||
Cash flow hedges |
|
|
|
|
|
|
|
|
|
|
| ||||||||||||
Foreign currency exchange and commodity contracts | $ | 11,280 | |
| $ | 407 | |
| $ | 760 | |
| $ | 15,434 | |
| $ | 359 | |
| $ | 517 | |
|
|
|
|
|
|
|
|
|
|
|
| ||||||||||||
Derivatives not designated as hedging instruments |
|
|
|
|
|
|
|
|
|
| |||||||||||||
Foreign currency exchange contracts | 13,481 | |
| 109 | |
| 212 | |
| 12,198 | |
| 157 | |
| 129 | | ||||||
Commodity contracts | 449 | |
| 5 | |
| 20 | |
| 693 | |
| 1 | |
| 67 | | ||||||
Total derivative financial instruments, gross | $ | 25,210 | |
| 521 | |
| 992 | |
| $ | 28,325 | |
| 517 | |
| 713 | | ||||
Counterparty netting and collateral (a) | | |
| (493 | ) |
| (493 | ) |
| | |
| (463 | ) |
| (463 | ) | ||||||
Total derivative financial instruments, net |
| $ | 28 | |
| $ | 499 | |
| | |
| $ | 54 | |
| $ | 250 | | ||||
|
|
|
|
|
|
|
|
|
|
|
| ||||||||||||
Financial Services Sector |
| |
|
| |
|
| |
|
|
|
|
|
| |||||||||
Fair value hedges |
| |
|
| |
|
| |
|
|
|
|
|
| |||||||||
Interest rate contracts | $ | 24,202 | |
| $ | 572 | |
| $ | 38 | |
| $ | 23,203 | |
| $ | 602 | |
| $ | 38 | |
|
|
|
|
|
|
|
|
|
|
|
| ||||||||||||
Derivatives not designated as hedging instruments |
|
|
|
|
|
|
|
|
|
| |||||||||||||
Interest rate contracts | 57,897 | |
| 157 | |
| 132 | |
| 56,558 | |
| 168 | |
| 89 | | ||||||
Foreign currency exchange contracts | 1,265 | |
| - | |
| 41 | |
| 1,527 | |
| 18 | |
| 1 | | ||||||
Cross-currency interest rate swap contracts | 2,403 | |
| 94 | |
| 167 | |
| 2,425 | |
| 71 | |
| 39 | | ||||||
Total derivative financial instruments, gross | $ | 85,767 | |
| 823 | |
| 378 | |
| $ | 83,713 | |
| 859 | |
| 167 | | ||||
Counterparty netting and collateral (a) |
|
| (161 | ) |
| (161 | ) |
|
|
| (136 | ) |
| (136 | ) | ||||||||
Total derivative financial instruments, net |
| $ | 662 | |
| $ | 217 | | | | |
| $ | 723 | |
| $ | 31 | | ||||
__________
(a) | At June 30, 2015 and December 31, 2014 , we did not receive or pledge any cash collateral. |
21
Item 1. Financial Statements (Continued)
FORD MOTOR COMPANY AND SUBSIDIARIES
NOTES TO THE FINANCIAL STATEMENTS
NOTE 13. ACCUMULATED OTHER COMPREHENSIVE INCOME/(LOSS)
The changes in the accumulated balances for each component of Accumulated other comprehensive income/(loss) attributable to Ford Motor Company for the periods ended June 30 were as follows (in millions):
| Second Quarter |
| First Half | ||||||||||||
| 2015 |
| 2014 |
| 2015 |
| 2014 | ||||||||
Foreign currency translation |
|
|
|
|
|
|
| ||||||||
Beginning balance | $ | (2,984 | ) |
| $ | (1,981 | ) |
| $ | (2,348 | ) |
| $ | (1,746 | ) |
Gains/(Losses) on foreign currency translation | 329 | |
| 298 | |
| (307 | ) |
| 116 | | ||||
Less: Tax/(Tax benefit) | - | |
| - | |
| - | |
| 53 | | ||||
Net gains/(losses) on foreign currency translation | 329 | |
| 298 | |
| (307 | ) |
| 63 | | ||||
(Gains)/Losses reclassified from AOCI to income (a) | - | |
| 19 | |
| - | |
| 19 | | ||||
Other comprehensive income/(loss), net of tax (b) | 329 | |
| 317 | |
| (307 | ) |
| 82 | | ||||
Ending balance | $ | (2,655 | ) |
| $ | (1,664 | ) |
| $ | (2,655 | ) |
| $ | (1,664 | ) |
|
|
|
|
|
|
|
| ||||||||
Derivative instruments (c) |
|
|
|
|
|
|
| ||||||||
Beginning balance | $ | (232 | ) |
| $ | 132 | |
| $ | (142 | ) |
| $ | 40 | |
Gains/(Losses) on derivative instruments | (217 | ) |
| (338 | ) |
| (367 | ) |
| (208 | ) | ||||
Less: Tax/(Tax benefit) | (78 | ) |
| (42 | ) |
| (110 | ) |
| (90 | ) | ||||
Net gains/(losses) on derivative instruments | (139 | ) |
| (296 | ) |
| (257 | ) |
| (118 | ) | ||||
(Gains)/Losses reclassified from AOCI to income | 90 | |
| (92 | ) |
| 136 | |
| (160 | ) | ||||
Less: Tax/(Tax benefit) | 27 | |
| (101 | ) |
| 45 | |
| (83 | ) | ||||
Net (gains)/losses reclassified from AOCI to net income (d) | 63 | |
| 9 | |
| 91 | |
| (77 | ) | ||||
Other comprehensive income/(loss), net of tax | (76 | ) |
| (287 | ) |
| (166 | ) |
| (195 | ) | ||||
Ending balance | $ | (308 | ) |
| $ | (155 | ) |
| $ | (308 | ) |
| $ | (155 | ) |
|
|
|
|
|
|
|
| ||||||||
Pension and other postretirement benefits |
|
|
|
|
|
|
| ||||||||
Beginning balance | $ | (17,190 | ) |
| $ | (16,341 | ) |
| $ | (17,542 | ) |
| $ | (16,524 | ) |
Gains/(Losses) arising during the period | - | |
| - | |
| (769 | ) |
| (13 | ) | ||||
Less: Tax/(Tax benefit) | - | |
| (2 | ) |
| (269 | ) |
| (5 | ) | ||||
Net gains/(losses) arising during the period | - | |
| 2 | |
| (500 | ) |
| (8 | ) | ||||
Amortization of prior service costs/(credits) (e) | (2 | ) |
| (5 | ) |
| (2 | ) |
| (9 | ) | ||||
Amortization of (gains)/losses (e) | 350 | |
| 225 | |
| 707 | |
| 448 | | ||||
Recognition of (gains)/losses due to curtailments (e) | - | |
| - | |
| - | |
| - | | ||||
Recognition of (gains)/losses due to settlements (e) | - | |
| - | |
| - | |
| 14 | | ||||
Less: Tax/(Tax benefit) | 105 | |
| 66 | |
| 276 | |
| 133 | | ||||
Net amortization and (gains)/losses reclassified from AOCI to net income | 243 | |
| 154 | |
| 429 | |
| 320 | | ||||
Translation impact on non-U.S. plans | (350 | ) |
| (103 | ) |
| 316 | |
| (76 | ) | ||||
Other comprehensive income/(loss), net of tax | (107 | ) |
| 53 | |
| 245 | |
| 236 | | ||||
Ending balance | $ | (17,297 | ) |
| $ | (16,288 | ) |
| $ | (17,297 | ) |
| $ | (16,288 | ) |
|
|
|
|
|
|
|
| ||||||||
Total AOCI ending balance at June 30 | $ | (20,260 | ) |
| $ | (18,107 | ) |
| $ | (20,260 | ) |
| $ | (18,107 | ) |
__________
(a) | The accumulated translation adjustments related to an investment in a foreign subsidiary are reclassified to Automotive interest income and other income/(loss), net, Financial Services other income/(loss), net, or Equity in net income of affiliated companies. |
(b) | In the second quarter of 2015, there was a $1 million loss attributable to noncontrolling interests. |
(c) | We expect to reclassify existing net losses of $311 million from Accumulated other comprehensive income/(loss) to Automotive cost of sales during the next twelve months as the underlying exposures are realized. |
(d) | Gains/(Losses) on cash flow hedges are reclassified from Accumulated other comprehensive income/(loss) to income when the hedged item affects earnings and is recognized in Automotive cost of sales. See Note 12 for additional information. |
(e) | These Accumulated other comprehensive income/(loss) components are included in the computation of net periodic pension cost. See Note 8 for additional information. |
22
Item 1. Financial Statements (Continued)
FORD MOTOR COMPANY AND SUBSIDIARIES
NOTES TO THE FINANCIAL STATEMENTS
NOTE 14. OTHER INCOME/(LOSS)
Automotive Sector
The amounts included in Automotive interest income and other income/(loss), net for the periods ended June 30 were as follows (in millions):
| Second Quarter |
| First Half | ||||||||||||
| 2015 |
| 2014 |
| 2015 |
| 2014 | ||||||||
Investment-related interest income | $ | 56 | |
| $ | 41 | |
| $ | 101 | |
| $ | 80 | |
Interest income/(expense) on income taxes | 10 | |
| 11 | |
| 1 | |
| 37 | | ||||
Realized and unrealized gains/(losses) on cash equivalents and marketable securities | (16 | ) |
| 33 | |
| (43 | ) |
| - | | ||||
Gains/(Losses) on changes in investments in affiliates | 18 | |
| - | |
| 18 | |
| 1 | | ||||
Gains/(Losses) on extinguishment of debt | - | |
| - | |
| 1 | |
| (5 | ) | ||||
Royalty income | 157 | |
| 148 | |
| 299 | |
| 302 | | ||||
Other | 47 | |
| 37 | |
| 85 | |
| 69 | | ||||
Total | $ | 272 | |
| $ | 270 | |
| $ | 462 | |
| $ | 484 | |
Financial Services Sector
The amounts included in Financial Services other income/(loss), net for the periods ended June 30 were as follows (in millions):
| Second Quarter |
| First Half | ||||||||||||
| 2015 |
| 2014 |
| 2015 |
| 2014 | ||||||||
Investment-related interest income | $ | 19 | |
| $ | 10 | |
| $ | 37 | |
| $ | 21 | |
Interest income/(expense) on income taxes | (3 | ) |
| (2 | ) |
| (6 | ) |
| (10 | ) | ||||
Realized and unrealized gains/(losses) on cash equivalents and marketable securities | - | |
| 5 | |
| 6 | |
| 8 | | ||||
Insurance premiums earned | 34 | |
| 31 | |
| 65 | |
| 63 | | ||||
Other | 20 | |
| 43 | |
| 42 | |
| 73 | | ||||
Total | $ | 70 | |
| $ | 87 | |
| $ | 144 | |
| $ | 155 | |
23
Item 1. Financial Statements (Continued)
FORD MOTOR COMPANY AND SUBSIDIARIES
NOTES TO THE FINANCIAL STATEMENTS
NOTE 15. EMPLOYEE SEPARATION ACTIONS AND EXIT AND DISPOSAL ACTIVITIES
Automotive Sector
Business Restructuring - Europe
In October 2012, we committed to commence a transformation plan for our Europe operations. As part of this plan, we closed two manufacturing facilities in the United Kingdom in 2013 and closed our assembly plant in Genk, Belgium at the end of 2014. The Genk closure was subject to an information and consultation process with employee representatives, which was completed in June 2013. The costs related to these closures were recorded beginning in the second quarter of 2013.
Separation-related costs (excluding pension costs) totaled $1.1 billion and were recorded in Automotive cost of sales and Selling, administrative and other expenses. These costs include both the costs associated with voluntary separation programs in the United Kingdom and involuntary employee actions at Genk, as well as payments to suppliers. The separation-related activity recorded in Other liabilities and deferred revenue , for the periods ended June 30 was as follows (in millions):
| Second Quarter |
| First Half | ||||||||||||
| 2015 |
| 2014 |
| 2015 |
| 2014 | ||||||||
Beginning balance | $ | 257 | |
| $ | 588 | |
| $ | 730 | |
| $ | 497 | |
Changes in accruals | (4 | ) |
| 107 | |
| (6 | ) |
| 219 | | ||||
Payments | (88 | ) |
| (47 | ) |
| (525 | ) |
| (69 | ) | ||||
Foreign currency translation | 8 | |
| (5 | ) |
| (26 | ) |
| (4 | ) | ||||
Ending balance | $ | 173 | |
| $ | 643 | |
| $ | 173 | |
| $ | 643 | |
Business Restructuring - Australia
In May 2013, we committed to commence a transformation plan for our Australia operations. As part of this plan, we will be closing manufacturing operations in Australia in October 2016. In August 2013, a two-phase separation plan was approved, which included a line-speed reduction in June 2014, ahead of the final closure. The costs related to the line-speed reduction were recorded throughout 2014. The costs related to the second phase of the transformation plan were recorded beginning in the fourth quarter of 2014 after the Enterprise bargaining agreement was agreed and ratified by the local government and we determined these payments were probable.
Separation-related costs recorded in Automotive cost of sales and Selling, administrative and other expenses, include both the costs associated with voluntary separation programs, and involuntary employee actions in Australia, as well as payments to suppliers. The separation-related activity recorded in Other liabilities and deferred revenue , for the period ended June 30, was as follows (in millions):
| Second Quarter |
| First Half | ||||
| 2015 |
| 2015 | ||||
Beginning balance | $ | 116 | |
| $ | 111 | |
Changes in accruals | 17 | |
| 31 | | ||
Payments | (9 | ) |
| (10 | ) | ||
Foreign currency translation | 2 | |
| (6 | ) | ||
Ending balance | $ | 126 | |
| $ | 126 | |
Our current estimate of total separation-related costs (excluding pension costs) for the Australian transformation plan is approximately $230 million . The separation-related costs not yet recorded will be expensed as the employees continue to support Australia plant operations.
24
Item 1. Financial Statements (Continued)
FORD MOTOR COMPANY AND SUBSIDIARIES
NOTES TO THE FINANCIAL STATEMENTS
NOTE 16. INCOME TAXES
For interim tax reporting we estimate one single effective tax rate for tax jurisdictions not subject to a valuation allowance, which is applied to the year-to-date ordinary income/(loss). Tax effects of significant unusual or extraordinary items are excluded from the estimated annual effective tax rate calculation and recognized in the interim period in which they occur.
NOTE 17. CHANGES IN INVESTMENTS IN AFFILIATES
Automotive Sector
Ford Sollers. We formed the Ford Sollers joint venture with Sollers OJSC ("Sollers") in October 2011 to operate in Russia. Upon contribution of our then wholly-owned operations in Russia to the joint venture in exchange for cash, notes receivable and a 50% equity interest in the new joint venture, we deconsolidated the related assets and liabilities and recorded an equity method investment in Ford Sollers at its fair value. The fair value was calculated using a discounted cash flow analysis with our best assumptions of relevant factors at that time.
During the second quarter of 2014, we recorded a $329 million pre-tax impairment as a result of factors in the Russian market, including a weaker ruble, lower industry volume, and industry segmentation changes that negatively impacted the sales of Focus. These factors reduced our expected cash flows for Ford Sollers in the near-term, thereby reducing the investment's fair value recoverability. The non-cash charge was reported in Equity in net income of affiliated companies .
On March 31, 2015, we and Sollers agreed to certain changes to the structure of the joint venture and the related shareholders' agreement to support the business in the near term and provide a platform for future growth in this important market. The changes include Ford providing additional funding to the joint venture and gaining a controlling interest in the joint venture through the acquisition of preferred shares. As a result, effective March 31, 2015, we have consolidated the joint venture for financial reporting purposes. In addition, the partners will have future rights to purchase, or have purchased, Sollers' 50% interest in the ordinary shares of the joint venture at a value established using a pre-determined framework. Both partners will continue to work jointly to improve the business outlook for the Ford Sollers joint venture by expanding its vehicle lineup to better meet the needs of Russian customers and further investing in the localization of component manufacturing.
During the second quarter of 2015, we finalized our purchase accounting. We measured the fair value of Ford Sollers using the income approach. We used cash flows that reflect the Ford Sollers business plan, aligned with assumptions a market participant would have made. We assumed a discount rate of 17% based on the appropriate weighted average cost of capital, adjusted for perceived business risks related to regulatory concerns, political tensions, foreign exchange volatility, and risk associated with the Russian automotive industry.
The following acquired assets and liabilities were measured at fair value and recorded on our balance sheet (in millions):
| March 31, | ||
Assets |
| ||
Cash and cash equivalents | $ | 40 | |
Other receivables, net | 113 | | |
Inventories | 258 | | |
Net property | 541 | | |
Other assets | 25 | | |
Total assets of Ford Sollers (a) | $ | 977 | |
Liabilities |
| ||
Payables | $ | 514 | |
Debt | 370 | | |
Total liabilities of Ford Sollers (a) | $ | 884 | |
__________
(a) | At March 31, 2015, intercompany assets of $10 million and intercompany liabilities of $394 million have been eliminated in both the consolidated and sector balance sheet. |
25
Item 1. Financial Statements (Continued)
FORD MOTOR COMPANY AND SUBSIDIARIES
NOTES TO THE FINANCIAL STATEMENTS
NOTE 17. CHANGES IN INVESTMENTS IN AFFILIATES (Continued)
In addition, we recorded a $93 million redeemable noncontrolling interest in the mezzanine section of our balance sheet, reflecting the redemption features embedded in the 50% equity interest in the joint venture that is held by Sollers. To determine the noncontrolling interest value, we used a Monte Carlo simulation analysis that incorporated market participant assumptions for asset volatilities and credit spreads.
Blue Diamond Truck, S. de R.L. ("BDT"). BDT was a Mexican joint venture created in 2001 by Ford and Navistar that produced medium duty commercial trucks. During the second quarter of 2015, we sold our entire equity interest in BDT to a Navistar affiliate and the joint venture was terminated. As a result of the sale of our interest in BDT, we recognized a pre-tax gain of $19 million , which was reported in Automotive interest income and other income/(loss), net .
NOTE 18. CAPITAL STOCK AND EARNINGS PER SHARE
Earnings Per Share Attributable to Ford Motor Company Common and Class B Stock
Basic and diluted income per share were calculated using the following (in millions):
| Second Quarter |
| First Half | ||||||||||||
| 2015 |
| 2014 |
| 2015 |
| 2014 | ||||||||
Basic and Diluted Income Attributable to Ford Motor Company |
|
|
|
|
|
|
| ||||||||
Basic income | $ | 1,885 | |
| $ | 1,311 | |
| $ | 2,809 | |
| $ | 2,300 | |
Effect of dilutive 2016 Convertible Notes (a) (b) | - | |
| 12 | |
| - | |
| 24 | | ||||
Diluted income | $ | 1,885 | |
| $ | 1,323 | |
| $ | 2,809 | |
| $ | 2,324 | |
|
|
|
|
|
|
|
| ||||||||
Basic and Diluted Shares |
| |
|
| |
|
|
|
| ||||||
Basic shares (average shares outstanding) | 3,974 | |
| 3,940 | |
| 3,968 | |
| 3,943 | | ||||
Net dilutive options and unvested restricted stock units | 33 | |
| 47 | |
| 35 | |
| 46 | | ||||
Dilutive 2016 Convertible Notes (b) | - | |
| 101 | |
| - | |
| 100 | | ||||
Diluted shares | 4,007 | |
| 4,088 | |
| 4,003 | |
| 4,089 | | ||||
__________
(a) | As applicable, includes interest expense, amortization of discount, amortization of fees, and other changes in income or loss that would result from the assumed conversion. |
(b) | In October 2014, we elected to terminate the conversion rights of holders under the 2016 Convertible Notes in accordance with their terms effective as of the close of business on November 20, 2014. On November 21, 2014, we redeemed for cash the remaining outstanding 2016 Convertible Notes. |
NOTE 19. SEGMENT INFORMATION
Our operating activity consists of two operating sectors, Automotive and Financial Services. Our Automotive sector includes the sale of Ford and Lincoln brand vehicles and related service parts and accessories. The Financial Services sector primarily includes our vehicle-related financing and leasing activities at Ford Credit.
Prior to January 1, 2015, we had an Other Financial Services segment, which included holding companies, real estate, and financing of some Volvo vehicles in Europe. Effective January 1, 2015, we realigned the business operations of this segment to our Automotive sector on a prospective basis. The impact of this change on prior periods presented would have been immaterial.
26
Item 1. Financial Statements (Continued)
FORD MOTOR COMPANY AND SUBSIDIARIES
NOTES TO THE FINANCIAL STATEMENTS
NOTE 19. SEGMENT INFORMATION (Continued)
Key operating data for our business segments for the periods ended or at June 30 were as follows (in millions):
| Automotive Sector | ||||||||||||||||||||||||||||||
| Operating Segments | Reconciling Items |
|
| | ||||||||||||||||||||||||||
| North America |
| South America |
| Europe |
| Middle East & Africa |
| Asia Pacific |
| Other Automotive |
| Special Items |
| Total | ||||||||||||||||
Second Quarter 2015 |
| |
|
| |
|
| |
|
|
|
| |
|
| |
|
| |
|
| | |||||||||
Revenues | $ | 23,316 | |
| $ | 1,494 | |
| $ | 6,943 | |
| $ | 904 | |
| $ | 2,448 | |
| $ | - | |
| $ | - | |
| $ | 35,105 | |
Income/(Loss) before income taxes | 2,597 | |
| (185 | ) |
| (14 | ) |
| (46 | ) |
| 192 | |
| (167 | ) |
| - | |
| 2,377 | | ||||||||
Total assets at June 30 | 61,435 | |
| 5,443 | |
| 15,643 | |
| 1,294 | |
| 8,713 | |
| - | |
| - | |
| 92,528 | | ||||||||
|
|
|
|
|
|
|
|
|
|
|
|
|
|
|
| ||||||||||||||||
Second Quarter 2014 |
| |
|
| |
|
| |
|
|
|
| |
|
| |
|
| |
|
| | |||||||||
Revenues | $ | 21,108 | |
| $ | 2,111 | |
| $ | 8,082 | |
| $ | 1,172 | |
| $ | 2,892 | |
| $ | - | |
| $ | - | |
| $ | 35,365 | |
Income/(Loss) before income taxes | 2,440 | |
| (295 | ) |
| 14 | |
| 23 | |
| 159 | |
| (171 | ) |
| (481 | ) |
| 1,689 | | ||||||||
Total assets at June 30 | 61,263 | |
| 7,238 | |
| 16,240 | |
| 1,300 | |
| 8,516 | |
| - | |
| - | |
| 94,557 | | ||||||||
| Automotive Sector | ||||||||||||||||||||||||||||||
| Operating Segments | Reconciling Items |
|
| | ||||||||||||||||||||||||||
| North |
| South |
|
|
| Middle East & Africa |
| Asia |
| Other |
| Special |
| Total | ||||||||||||||||
First Half 2015 |
| |
|
| |
|
| |
|
|
|
| |
|
| |
|
| |
|
| | |||||||||
Revenues | $ | 43,356 | |
| $ | 3,007 | |
| $ | 13,861 | |
| $ | 1,961 | |
| $ | 4,720 | |
| $ | - | |
| $ | - | |
| $ | 66,905 | |
Income/(Loss) before income taxes | 3,937 | |
| (374 | ) |
| (199 | ) |
| 33 | |
| 295 | |
| (379 | ) |
| - | |
| 3,313 | | ||||||||
|
|
|
|
|
|
|
|
|
|
|
|
|
|
|
| ||||||||||||||||
First Half 2014 |
| |
|
| |
|
| |
|
|
|
| |
|
| |
|
| |
|
| | |||||||||
Revenues | $ | 41,553 | |
| $ | 4,002 | |
| $ | 15,836 | |
| $ | 2,327 | |
| $ | 5,523 | |
| $ | - | |
| $ | - | |
| $ | 69,241 | |
Income/(Loss) before income taxes | 3,940 | |
| (805 | ) |
| (180 | ) |
| 77 | |
| 450 | |
| (393 | ) |
| (603 | ) |
| 2,486 | | ||||||||
27
Item 1. Financial Statements (Continued)
FORD MOTOR COMPANY AND SUBSIDIARIES
NOTES TO THE FINANCIAL STATEMENTS
NOTE 19. SEGMENT INFORMATION (Continued)
| Financial Services Sector |
| Company | ||||||||||||||||||||
| Operating Segment |
| Reconciling Items |
|
|
|
|
|
| ||||||||||||||
| Ford Credit |
| Other |
| Elims |
| Total |
| Elims (a) |
| Total | ||||||||||||
Second Quarter 2015 |
|
|
|
|
|
|
|
|
|
|
| | |||||||||||
Revenues | $ | 2,257 | |
| $ | - | |
| $ | (99 | ) |
| $ | 2,158 | |
| $ | - | |
| $ | 37,263 | |
Income/(Loss) before income taxes | 506 | |
| (15 | ) |
| - | |
| 491 | |
| - | |
| 2,868 | | ||||||
Total assets at June 30 | 127,599 | |
| 2 | |
| (1,218 | ) |
| 126,383 | |
| (2,866 | ) |
| 216,045 | | ||||||
|
|
|
|
|
|
|
|
|
|
|
| ||||||||||||
Second Quarter 2014 |
| |
|
| |
|
| |
|
| |
|
| |
|
| | ||||||
Revenues | $ | 2,137 | |
| $ | 33 | |
| $ | (124 | ) |
| $ | 2,046 | |
| $ | - | |
| $ | 37,411 | |
Income/(Loss) before income taxes | 434 | |
| (5 | ) |
| - | |
| 429 | |
| - | |
| 2,118 | | ||||||
Total assets at June 30 | 120,441 | |
| 343 | |
| (1,146 | ) |
| 119,638 | |
| (3,250 | ) |
| 210,945 | | ||||||
| Financial Services Sector |
| Company | ||||||||||||||||||||
| Operating Segment |
| Reconciling Items |
|
|
|
|
|
| ||||||||||||||
| Ford Credit |
| Other |
| Elims |
| Total |
| Elims (a) |
| Total | ||||||||||||
First Half 2015 |
|
|
|
|
|
|
|
|
|
|
| | |||||||||||
Revenues | $ | 4,454 | |
| $ | - | |
| $ | (196 | ) |
| $ | 4,258 | |
| $ | - | |
| $ | 71,163 | |
Income/(Loss) before income taxes | 989 | |
| (29 | ) |
| - | |
| 960 | |
| - | |
| 4,273 | | ||||||
|
|
|
|
|
|
|
|
|
|
|
| ||||||||||||
First Half 2014 |
| |
|
| |
|
| |
|
| |
|
| |
|
| | ||||||
Revenues | $ | 4,213 | |
| $ | 68 | |
| $ | (235 | ) |
| $ | 4,046 | |
| $ | - | |
| $ | 73,287 | |
Income/(Loss) before income taxes | 933 | |
| (42 | ) |
| - | |
| 891 | |
| - | |
| 3,377 | | ||||||
__________
(a) | Includes intersector transactions occurring in the ordinary course of business and deferred tax netting. |
28
Item 1. Financial Statements (Continued)
FORD MOTOR COMPANY AND SUBSIDIARIES
NOTES TO THE FINANCIAL STATEMENTS
NOTE 20. COMMITMENTS AND CONTINGENCIES
Commitments and contingencies primarily consist of guarantees and indemnifications, litigation and claims, and warranty.
Guarantees and Indemnifications
Guarantees and indemnifications are recorded at fair value at their inception. We regularly review our performance risk under these arrangements, and in the event it becomes probable we will be required to perform under guarantee or indemnity, the amount of probable payment is recorded.
We guarantee debt and lease obligations of certain joint ventures, as well as certain financial obligations of outside third parties, including suppliers, to support our business and economic growth. Expiration dates vary through 2033 , and guarantees will terminate on payment and/or cancellation of the underlying obligation. A payment by us would be triggered by failure of the joint venture or other third party to fulfill its obligation covered by the guarantee. In some circumstances, we are entitled to recover from a third party amounts paid by us under the guarantee. However, our ability to enforce these rights is sometimes stayed until the guaranteed party is paid in full, and may be limited in the event of insolvency of the third party or other circumstances.
In the ordinary course of business, we execute contracts involving indemnifications standard in the industry and indemnifications specific to a transaction, such as the sale of a business. These indemnifications might include and are not limited to claims relating to any of the following: environmental, tax, and shareholder matters; intellectual property rights; power generation contracts; governmental regulations and employment-related matters; dealer, supplier, and other commercial contractual relationships; and financial matters, such as securitizations. Performance under these indemnities generally would be triggered by a breach of terms of the contract or by a third-party claim. While some of these indemnifications are limited in nature, many of them do not limit potential payment. Therefore, we are unable to estimate a maximum amount of future payments that could result from claims made under these unlimited indemnities.
The maximum potential payments and the carrying value of recorded liabilities related to guarantees and limited indemnities were as follows (in millions):
| June 30, |
| December 31, | ||||
Maximum potential payments | $ | 592 | |
| $ | 592 | |
Carrying value of recorded liabilities related to guarantees and limited indemnities | 17 | |
| 17 | | ||
Litigation and Claims
Various legal actions, proceedings, and claims (generally, "matters") are pending or may be instituted or asserted against us. These include but are not limited to matters arising out of alleged defects in our products; product warranties; governmental regulations relating to safety, emissions, and fuel economy or other matters; government incentives; tax matters; alleged illegal acts resulting in fines or penalties; financial services; employment-related matters; dealer, supplier, and other contractual relationships; intellectual property rights; environmental matters; shareholder or investor matters; and financial reporting matters. Certain of the pending legal actions are, or purport to be, class actions. Some of the matters involve or may involve claims for compensatory, punitive, or antitrust or other treble damages in very large amounts, or demands for field service actions, environmental remediation programs, sanctions, loss of government incentives, assessments, or other relief, which, if granted, would require very large expenditures.
The extent of our financial exposure to these matters is difficult to estimate. Many matters do not specify a dollar amount for damages, and many others specify only a jurisdictional minimum. To the extent an amount is asserted, our historical experience suggests that in most instances the amount asserted is not a reliable indicator of the ultimate outcome.
We accrue for matters when losses are deemed probable and reasonably estimable. In evaluating matters for accrual and disclosure purposes, we take into consideration factors such as our historical experience with matters of a similar nature, the specific facts and circumstances asserted, the likelihood that we will prevail, and the severity of any potential loss. We reevaluate and update our accruals as matters progress over time.
29
Item 1. Financial Statements (Continued)
FORD MOTOR COMPANY AND SUBSIDIARIES
NOTES TO THE FINANCIAL STATEMENTS
NOTE 20. COMMITMENTS AND CONTINGENCIES (Continued)
For the majority of matters, which generally arise out of alleged defects in our products, we establish an accrual based on our extensive historical experience with similar matters. We do not believe there is a reasonably possible outcome materially in excess of our accrual for these matters.
For the remaining matters, where our historical experience with similar matters is of more limited value (i.e., "non‑pattern matters"), we evaluate the matters primarily based on the individual facts and circumstances. For non‑pattern matters, we evaluate whether there is a reasonable possibility of a material loss in excess of any accrual that can be estimated. Our estimate of reasonably possible loss in excess of our accruals for all material matters currently reflects indirect tax and customs matters, for which we estimate the aggregate risk to be a range of up to a bout $2.8 billion .
As noted, the litigation process is subject to many uncertainties, and the outcome of individual matters is not predictable with assurance. Our assessments are based on our knowledge and experience, but the ultimate outcome of any matter could require payment substantially in excess of the amount that we have accrued and/or disclosed.
Warranty and Field Service Actions
We accrue obligations for warranty costs and field service actions (i.e., safety recalls, emission recalls, and other product campaigns) at the time of sale. We establish estimates for warranty and field service action obligations using a patterned estimation model using historical information regarding the nature, frequency, and average cost of claims for each vehicle line by model year. We reevaluate the adequacy of our accruals on a regular basis and any revisions to our estimated obligation for warranties and field service actions are reported as Changes in accrual related to pre-existing warranties in the table below.
Our estimates of warranty and field service action obligations are accounted for primarily in Other liabilities and deferred revenue for the periods ended June 30 were as follows (in millions):
| First Half | ||||||
| 2015 |
| 2014 | ||||
Beginning balance | $ | 4,785 | |
| $ | 3,927 | |
Payments made during the period | (1,229 | ) |
| (1,310 | ) | ||
Changes in accrual related to warranties issued during the period | 1,005 | |
| 1,121 | | ||
Changes in accrual related to pre-existing warranties | 212 | |
| 763 | | ||
Foreign currency translation and other | (68 | ) |
| 17 | | ||
Ending balance | $ | 4,705 | |
| $ | 4,518 | |
Excluded from the table above are costs accrued for customer satisfaction actions.
30
Report of Independent Registered Public Accounting Firm
To the Board of Directors and Stockholders of
Ford Motor Company:
We have reviewed the accompanying consolidated balance sheet of Ford Motor Company and its subsidiaries as of June 30, 2015 , and the related consolidated statements of income and comprehensive income for the three-month and six-month periods ended June 30, 2015 and 2014 and the condensed consolidated statement of cash flows and the consolidated statement of equity for the six-month periods ended June 30, 2015 and 2014 . These interim financial statements are the responsibility of the Company's management.
The accompanying sector balance sheets and the related sector statements of income and of cash flows are presented for purposes of additional analysis and are not a required part of the basic financial statements. Such information has been subjected to the review procedures applied in the review of the basic financial statements.
We conducted our review in accordance with the standards of the Public Company Accounting Oversight Board (United States). A review of interim financial information consists principally of applying analytical procedures and making inquiries of persons responsible for financial and accounting matters. It is substantially less in scope than an audit conducted in accordance with the standards of the Public Company Accounting Oversight Board (United States), the objective of which is the expression of an opinion regarding the financial statements taken as a whole. Accordingly, we do not express such an opinion.
Based on our review, we are not aware of any material modifications that should be made to the accompanying consolidated interim financial statements for them to be in conformity with accounting principles generally accepted in the United States of America.
We previously audited, in accordance with the standards of the Public Company Accounting Oversight Board (United States), the consolidated balance sheet as of December 31, 2014 , and the related consolidated statements of income, comprehensive income, equity, and cash flows for the year then ended (not presented herein), and in our report dated February 13, 2015, we expressed an unqualified opinion on those consolidated financial statements. In our opinion, the information set forth in the accompanying consolidated balance sheet as of December 31, 2014 , is fairly stated in all material respects in relation to the consolidated balance sheet from which it has been derived.
/s/ PricewaterhouseCoopers LLP
PricewaterhouseCoopers LLP
Detroit, Michigan
July 28, 2015
31
ITEM 2. Management's Discussion and Analysis of Financial Condition and Results of Operations.
RESULTS OF OPERATIONS
Our second quarter and first half 2015 pre-tax results and net income were as follows:
| Second Quarter |
| First Half |
|
| ||||||||||||||
| 2015 |
| Better/(Worse) 2014 |
| 2015 |
| Better/(Worse) 2014 |
| Memo: Full Year 2014 | ||||||||||
| (Mils.) |
| (Mils.) |
| (Mils.) |
| (Mils.) |
| (Mils.) | ||||||||||
Income |
|
|
|
|
|
|
|
|
| ||||||||||
Pre-tax results (excl. special items) | $ | 2,868 | |
| $ | 269 | |
| $ | 4,273 | |
| $ | 293 | |
| $ | 6,282 | |
Special items | - | |
| 481 | |
| - | |
| 603 | |
| (1,940 | ) | |||||
Pre-tax results (incl. special items) | 2,868 | |
| 750 | |
| 4,273 | |
| 896 | |
| 4,342 | | |||||
(Provision for)/Benefit from income taxes | (982 | ) |
| (179 | ) |
| (1,462 | ) |
| (389 | ) |
| (1,156 | ) | |||||
Net income | 1,886 | | | 571 | |
| 2,811 | |
| 507 | |
| 3,186 | | |||||
Less: Income/(Loss) attributable to noncontrolling interests | 1 | |
| (3 | ) |
| 2 | |
| (2 | ) |
| (1 | ) | |||||
Net income attributable to Ford | $ | 1,885 | |
| $ | 574 | |
| $ | 2,809 | |
| $ | 509 | |
| $ | 3,187 | |
Net income includes certain items ("special items") that we have grouped into "Personnel and Dealer-Related Items" and "Other Items" to provide useful information to investors about the nature of the special items. The first category includes items related to our efforts to match production capacity and cost structure to market demand and changing model mix and therefore helps investors track amounts related to those activities. The second category includes items that we do not generally consider to be indicative of our ongoing operating activities, and therefore allows investors analyzing our pre-tax results to identify certain infrequent significant items that they may wish to exclude when considering the trend of ongoing operating results.
As detailed in Note 19 of the Notes to the Financial Statements, we allocate special items to a separate reconciling item, as opposed to allocating them among the operating segments and Other Automotive, reflecting the fact that management excludes these items from its review of operating segment results for purposes of measuring segment profitability and allocating resources among the segments.
For the second quarter and the first half of 2015, we had no special items. The following table details Automotive sector pre-tax special items in each category for the second quarter of 2014, the first half of 2014, and full year 2014:
| Second Quarter 2014 |
| First Half 2014 |
| Memo: Full Year 2014 | ||||||
| (Mils.) |
| (Mils.) |
| (Mils.) | ||||||
Personnel and Dealer-Related Items |
|
|
|
|
| ||||||
Separation-related actions (a) | $ | (152 | ) |
| $ | (274 | ) |
| $ | (685 | ) |
Other Items |
| |
|
| |
|
| ||||
Venezuela accounting change | - | |
| - | |
| (800 | ) | |||
Ford Sollers equity impairment | (329 | ) |
| (329 | ) |
| (329 | ) | |||
2016 Convertible Notes settlement | - | |
| - | |
| (126 | ) | |||
Total Other Items | (329 | ) |
| (329 | ) |
| (1,255 | ) | |||
Total Special Items | $ | (481 | ) |
| $ | (603 | ) |
| $ | (1,940 | ) |
__________
(a) | Primarily related to separation costs for personnel at the Genk and U.K. facilities. |
32
Item 2. Management's Discussion and Analysis of Financial Condition and Results of Operations (Continued)
Discussion of Automotive sector, Financial Services sector, and Company results of operations below is on a pre-tax basis and excludes special items unless otherwise specifically noted. References to records by Automotive segments-North America, South America, Europe, Middle East & Africa, and Asia Pacific-are since at least 2000 when we began reporting specific business unit results.
The chart below shows second quarter 2015 pre-tax results by sector:
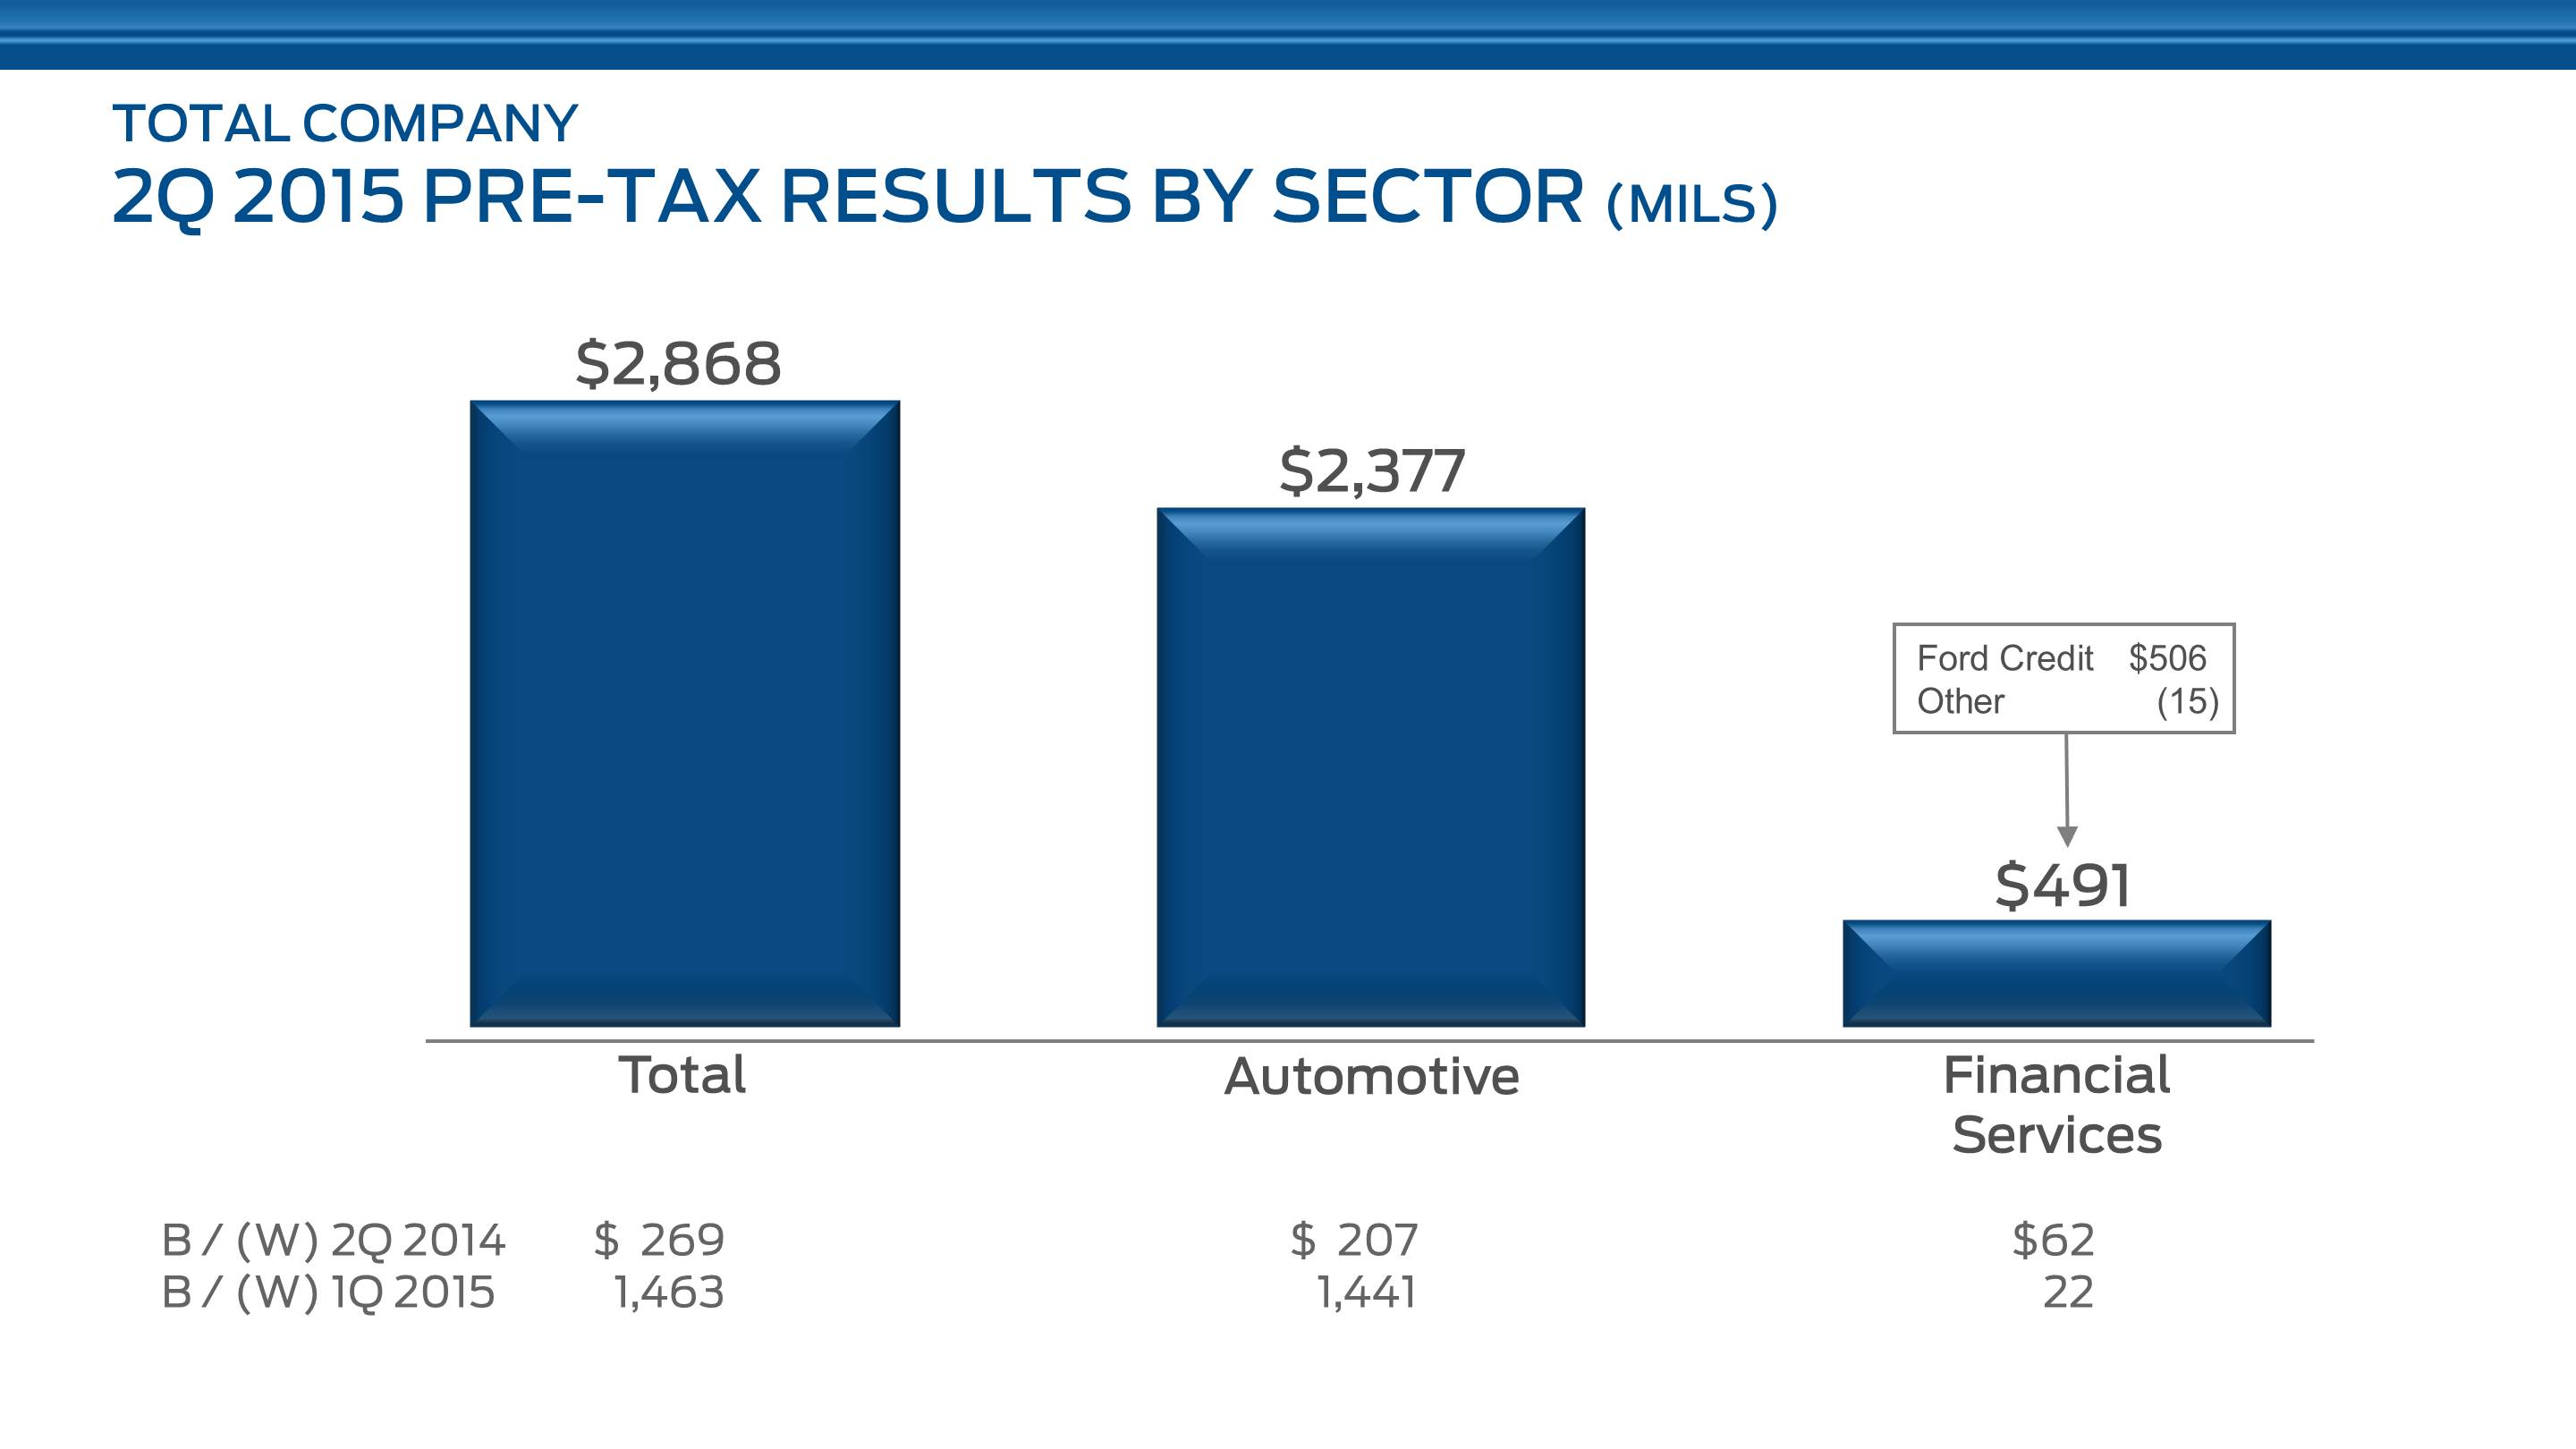
Both of our sectors, Automotive and Financial Services, contributed to the Company's second quarter 2015 pre-tax profit, and both improved compared with the prior year and the first quarter of 2015.
AUTOMOTIVE SECTOR
Definitions and calculations used in this report include:
• | Wholesales and Revenue - Wholesale unit volumes include all Ford and Lincoln badged units (whether produced by Ford or by an unconsolidated affiliate) that are sold to dealerships, units manufactured by Ford that are sold to other manufacturers, units distributed by Ford for other manufacturers, and local brand units produced by our China joint venture, Jiangling Motors Corporation, Ltd. ("JMC"), that are sold to dealerships. Vehicles sold to daily rental car companies that are subject to a guaranteed repurchase option (i.e., rental repurchase), as well as other sales of finished vehicles for which the recognition of revenue is deferred (e.g., consignments), also are included in wholesale unit volumes. Revenue from certain vehicles in wholesale unit volumes (specifically, Ford badged vehicles produced and distributed by our unconsolidated affiliates, as well as JMC brand vehicles) are not included in our revenue |
• | Automotive Operating Margin - defined as Automotive pre-tax results, excluding special items and Other Automotive, divided by Automotive revenue |
• | Industry Volume and Market Share - based, in part, on estimated vehicle registrations; includes medium and heavy duty trucks |
• | SAAR - seasonally adjusted annual rate |
33
Item 2. Management's Discussion and Analysis of Financial Condition and Results of Operations (Continued)
In general, we measure year-over-year change in Automotive pre-tax operating profit for our total Automotive sector and reportable segments using the causal factors listed below, with net pricing and cost variances calculated at present-year volume and mix and exchange:
• | Market Factors : |
◦ | Volume and Mix - primarily measures profit variance from changes in wholesale volumes (at prior-year average margin per unit) driven by changes in industry volume, market share, and dealer stocks, as well as the profit variance resulting from changes in product mix, including mix among vehicle lines and mix of trim levels and options within a vehicle line |
◦ | Net Pricing - primarily measures profit variance driven by changes in wholesale prices to dealers and marketing incentive programs such as rebate programs, low-rate financing offers, and special lease offers |
• | Contribution Costs - primarily measures profit variance driven by per-unit changes in cost categories that typically vary with volume, such as material costs (including commodity and component costs), warranty expense, and freight and duty costs |
• | Structural Costs - primarily measures profit variance driven by absolute change in cost categories that typically do not have a directly proportionate relationship to production volume. Structural costs include the following cost categories: |
◦ | Manufacturing and Engineering - consists primarily of costs for hourly and salaried manufacturing- and engineering-related personnel, plant overhead (such as utilities and taxes), new product launch expense, prototype materials, and outside engineering services |
◦ | Spending-Related - consists primarily of depreciation and amortization of our manufacturing and engineering assets, but also includes asset retirements and operating leases |
◦ | Advertising and Sales Promotions - includes costs for advertising, marketing programs, brand promotions, customer mailings and promotional events, and auto shows |
◦ | Administrative and Selling - includes primarily costs for salaried personnel and purchased services related to our staff activities and selling functions, as well as associated information technology costs |
◦ | Pension and OPEB - consists primarily of past service pension costs and other postretirement employee benefit costs |
• | Exchange - primarily measures profit variance driven by one or more of the following: (i) transactions denominated in currencies other than the functional currencies of the relevant entities, (ii) effects of converting functional currency income to U.S. dollars, (iii) effects of remeasuring monetary assets and liabilities of the relevant entities in currencies other than their functional currency, or (iv) results of our foreign currency hedging |
• | Net Interest and Other |
◦ | Net Interest - primarily measures profit variance driven by changes in our Automotive sector's centrally-managed net interest, which consists of interest expense, interest income, fair market value adjustments on our cash equivalents and marketable securities portfolio (excluding our investment in Mazda), and other adjustments |
◦ | Other - items not included in the causal factors defined above |
The charts on the following pages detail second quarter 2015 key metrics and the change in second quarter 2015 pre-tax results compared with second quarter 2014 by causal factor for our Automotive sector and its operating segments-North America, South America, Europe, Middle East & Africa, and Asia Pacific.
34
Item 2. Management's Discussion and Analysis of Financial Condition and Results of Operations (Continued)
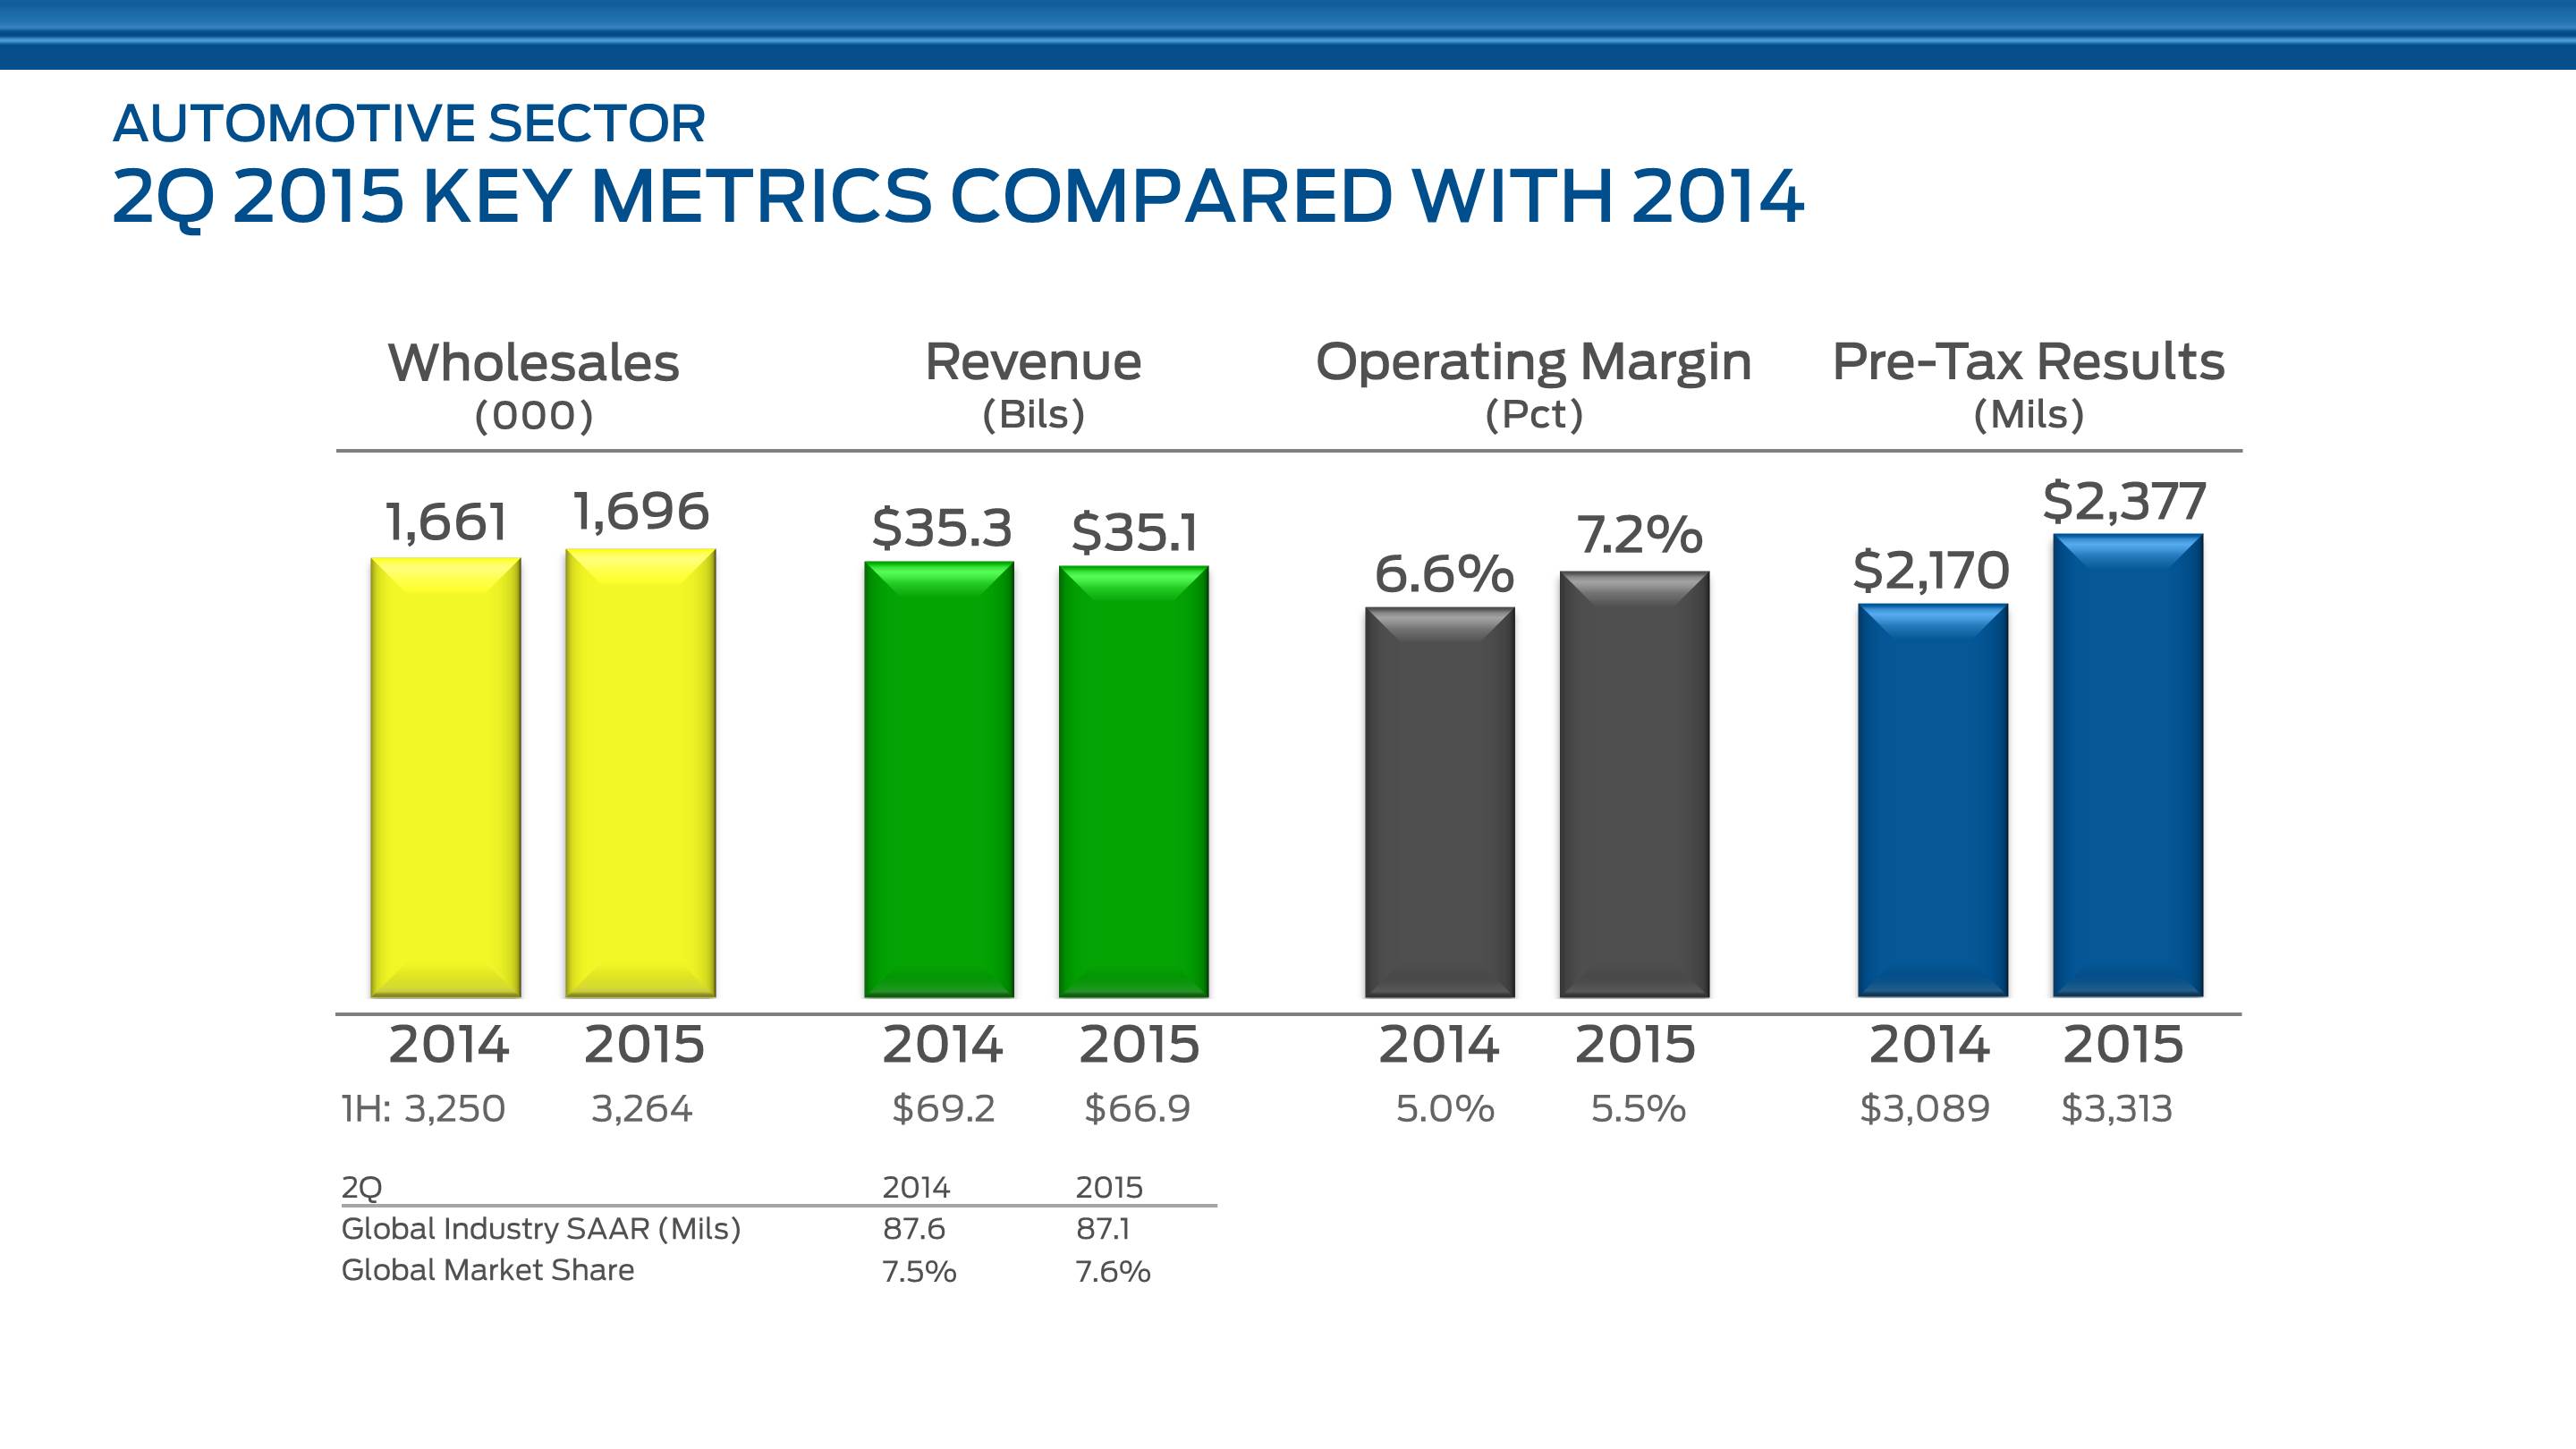
The quarter's financial results were outstanding, with the best Automotive pre-tax profit since 2000. Wholesale volume was up 2% from a year ago and revenue was about flat.
We estimate that global industry SAAR, shown on the lower left, was 87.1 million units, down 1% from a year ago, and we grew our global market share to 7.6%.
Our growth in wholesale volume was driven by North America and Europe.
Our largely unchanged revenue reflects higher net pricing and volume essentially offset by unfavorable translation effects of the strong U.S. dollar on international operations.
Our operating margin was 7.2%, up six-tenths of a percentage point from last year, and pre-tax profit was $2.4 billion, up $207 million.
As shown below the chart, first half volume was largely unchanged from a year ago, while Automotive revenue was down 3% reflecting U.S. dollar strength. Operating margin, at 5.5%, was up half of a percentage point, and pre-tax profit, at $3.3 billion, was up $224 million.
35
Item 2. Management's Discussion and Analysis of Financial Condition and Results of Operations (Continued)
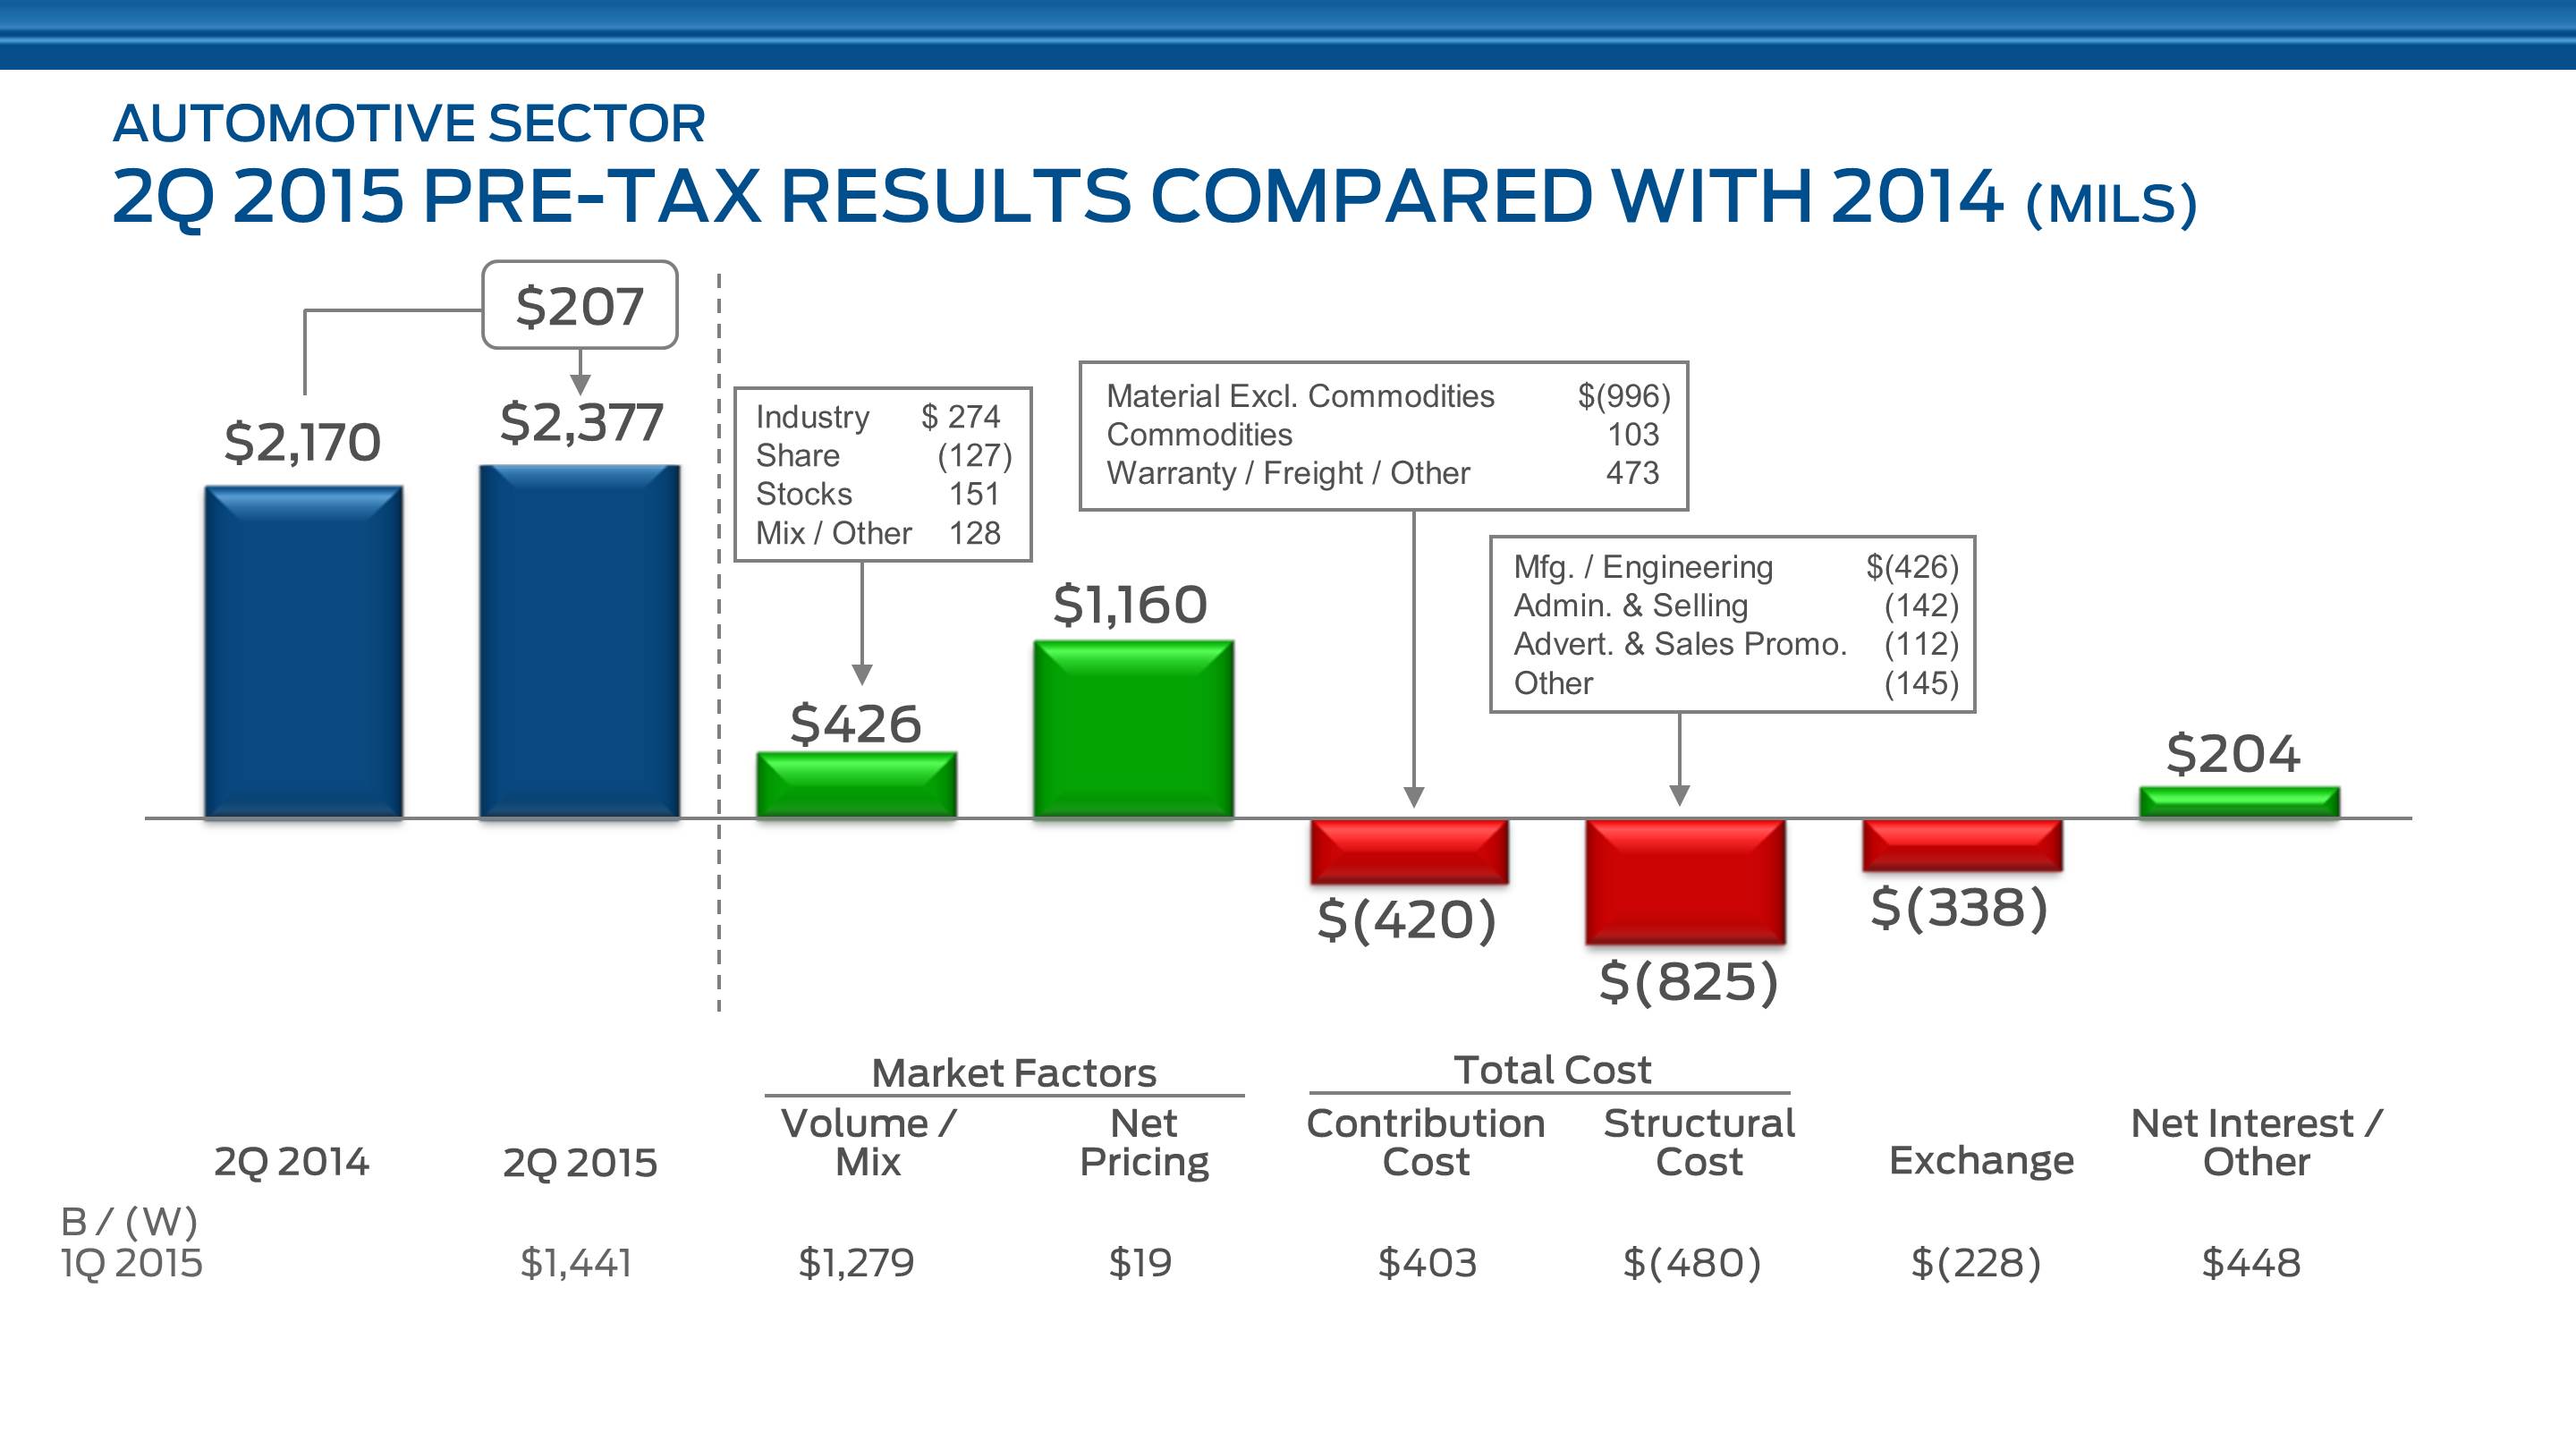
As shown above, our second quarter 2015 Automotive pre-tax profit improved from a year ago. Favorable market factors, more than explained by North and South America and Europe, exceeded cost increases.
As shown below the chart, second quarter Automotive pre-tax profit more than doubled compared with first quarter. Favorable volume and mix, mainly in North America, drove the improvement.
Total costs and expenses for our Automotive sector for the second quarter of 2015 and 2014 was $33.3 billion and $33.8 billion, respectively, a difference of $500 million. Total costs and expenses for our Automotive sector for the first half of 2015 and 2014 was $64.6 billion and $67.3 billion, respectively, a difference of $2.7 billion. An explanation of the second quarter and first half 2015 change is shown below (in billions):
| 2015 Lower/(Higher) 2014 | ||||||
Explanation of change: | Second Quarter |
| First Half | ||||
Volume and mix, exchange, and other | $ | 1.5 | |
| $ | 4.6 | |
Contribution costs |
|
|
| | |||
Material excluding commodities | (1.0 | ) |
| (1.6 | ) | ||
Commodities | 0.1 | |
| 0.1 | | ||
Warranty/Freight/Other | 0.5 | |
| 0.8 | | ||
Structural costs | (0.8 | ) |
| (1.5 | ) | ||
Special items | 0.2 | |
| 0.3 | | ||
Total | $ | 0.5 | |
| $ | 2.7 | |
36
Item 2. Management's Discussion and Analysis of Financial Condition and Results of Operations (Continued)
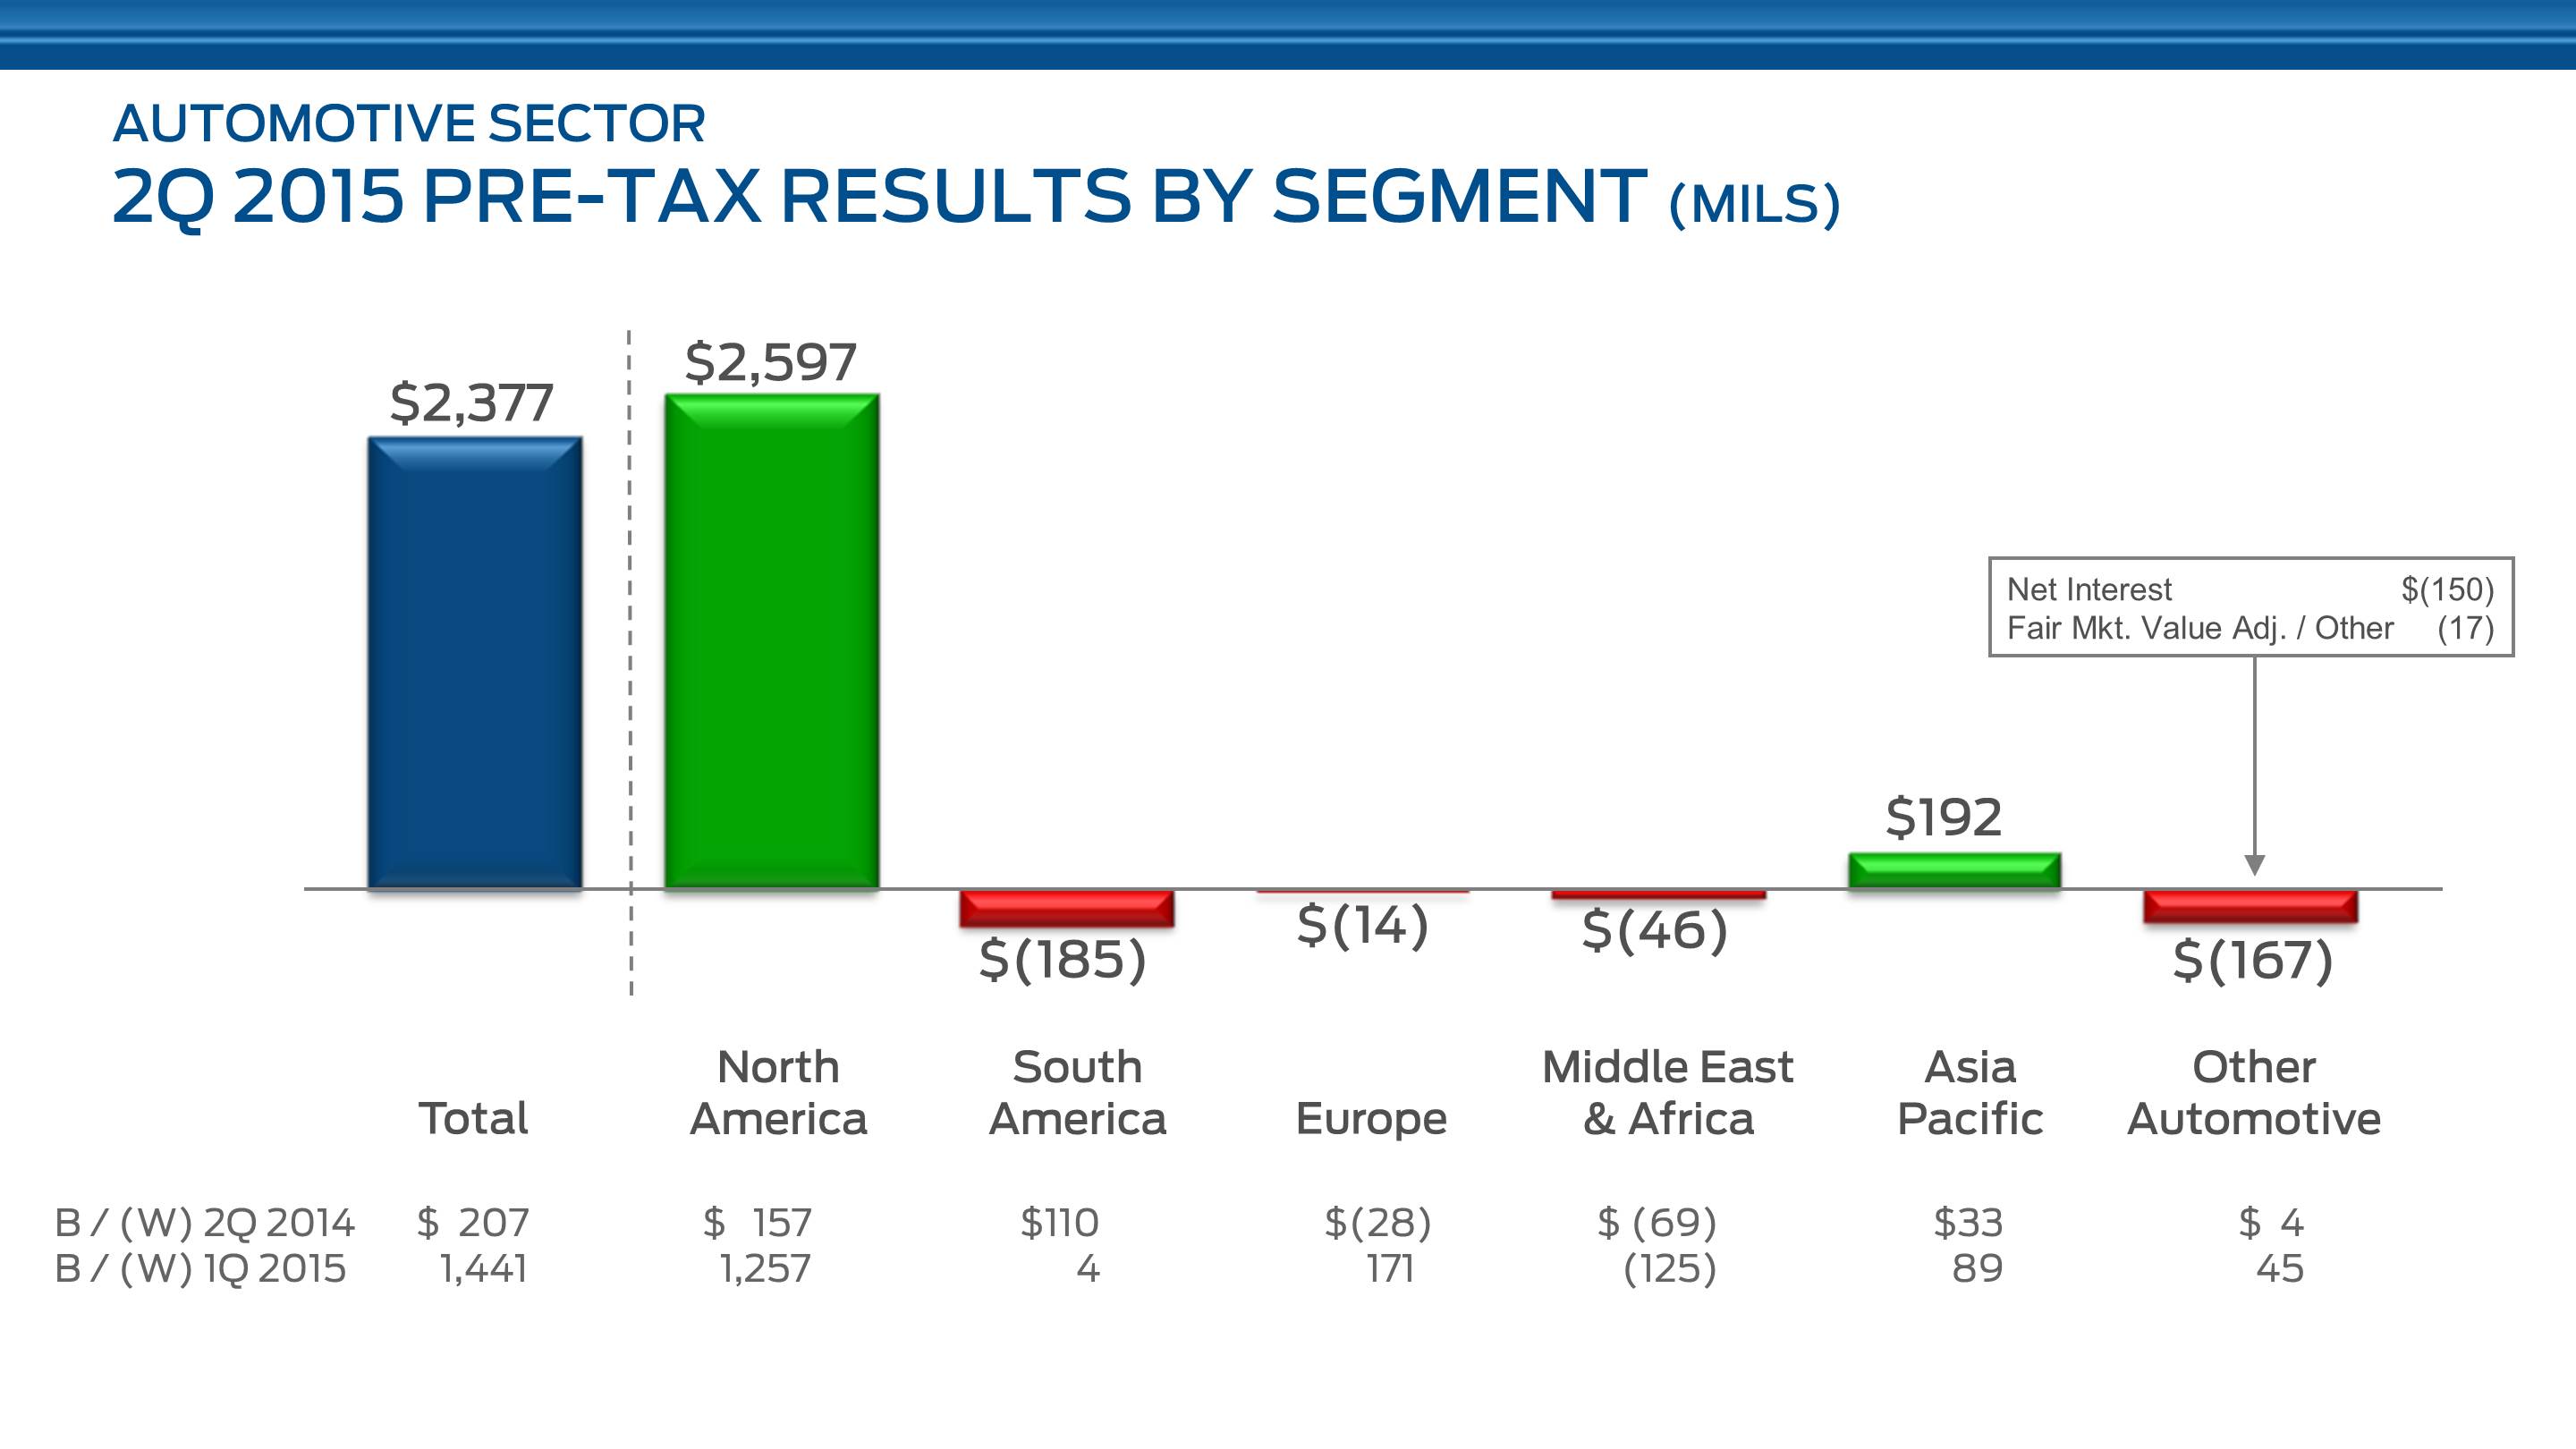
Shown above are second quarter 2015 Automotive pre-tax results by business unit, along with Other Automotive which is mainly net interest expense.
North America's record profit drove the Automotive sector to its outstanding results in the quarter. North America also was the principal factor behind the sector's improved profit compared with last year and first quarter.
Our regions outside North America collectively achieved a result of near breakeven, which also was an improvement from both the prior year and first quarter.
For the full year, we continue to expect to achieve top-line growth in a global industry that we expect to be about flat, including improving our global market share on the strength of our 24 global product launches last year and the 16 expected for 2015, most of which are now complete. We also have more capacity coming on line in Asia Pacific in the second half that will drive incremental volume and revenue. We also expect a stronger bottom line for the full year, including higher Automotive operating margin and pre-tax profit. Within the latter, we continue to expect full year Automotive net interest expense to be about $650 million.
37
Item 2. Management's Discussion and Analysis of Financial Condition and Results of Operations (Continued)
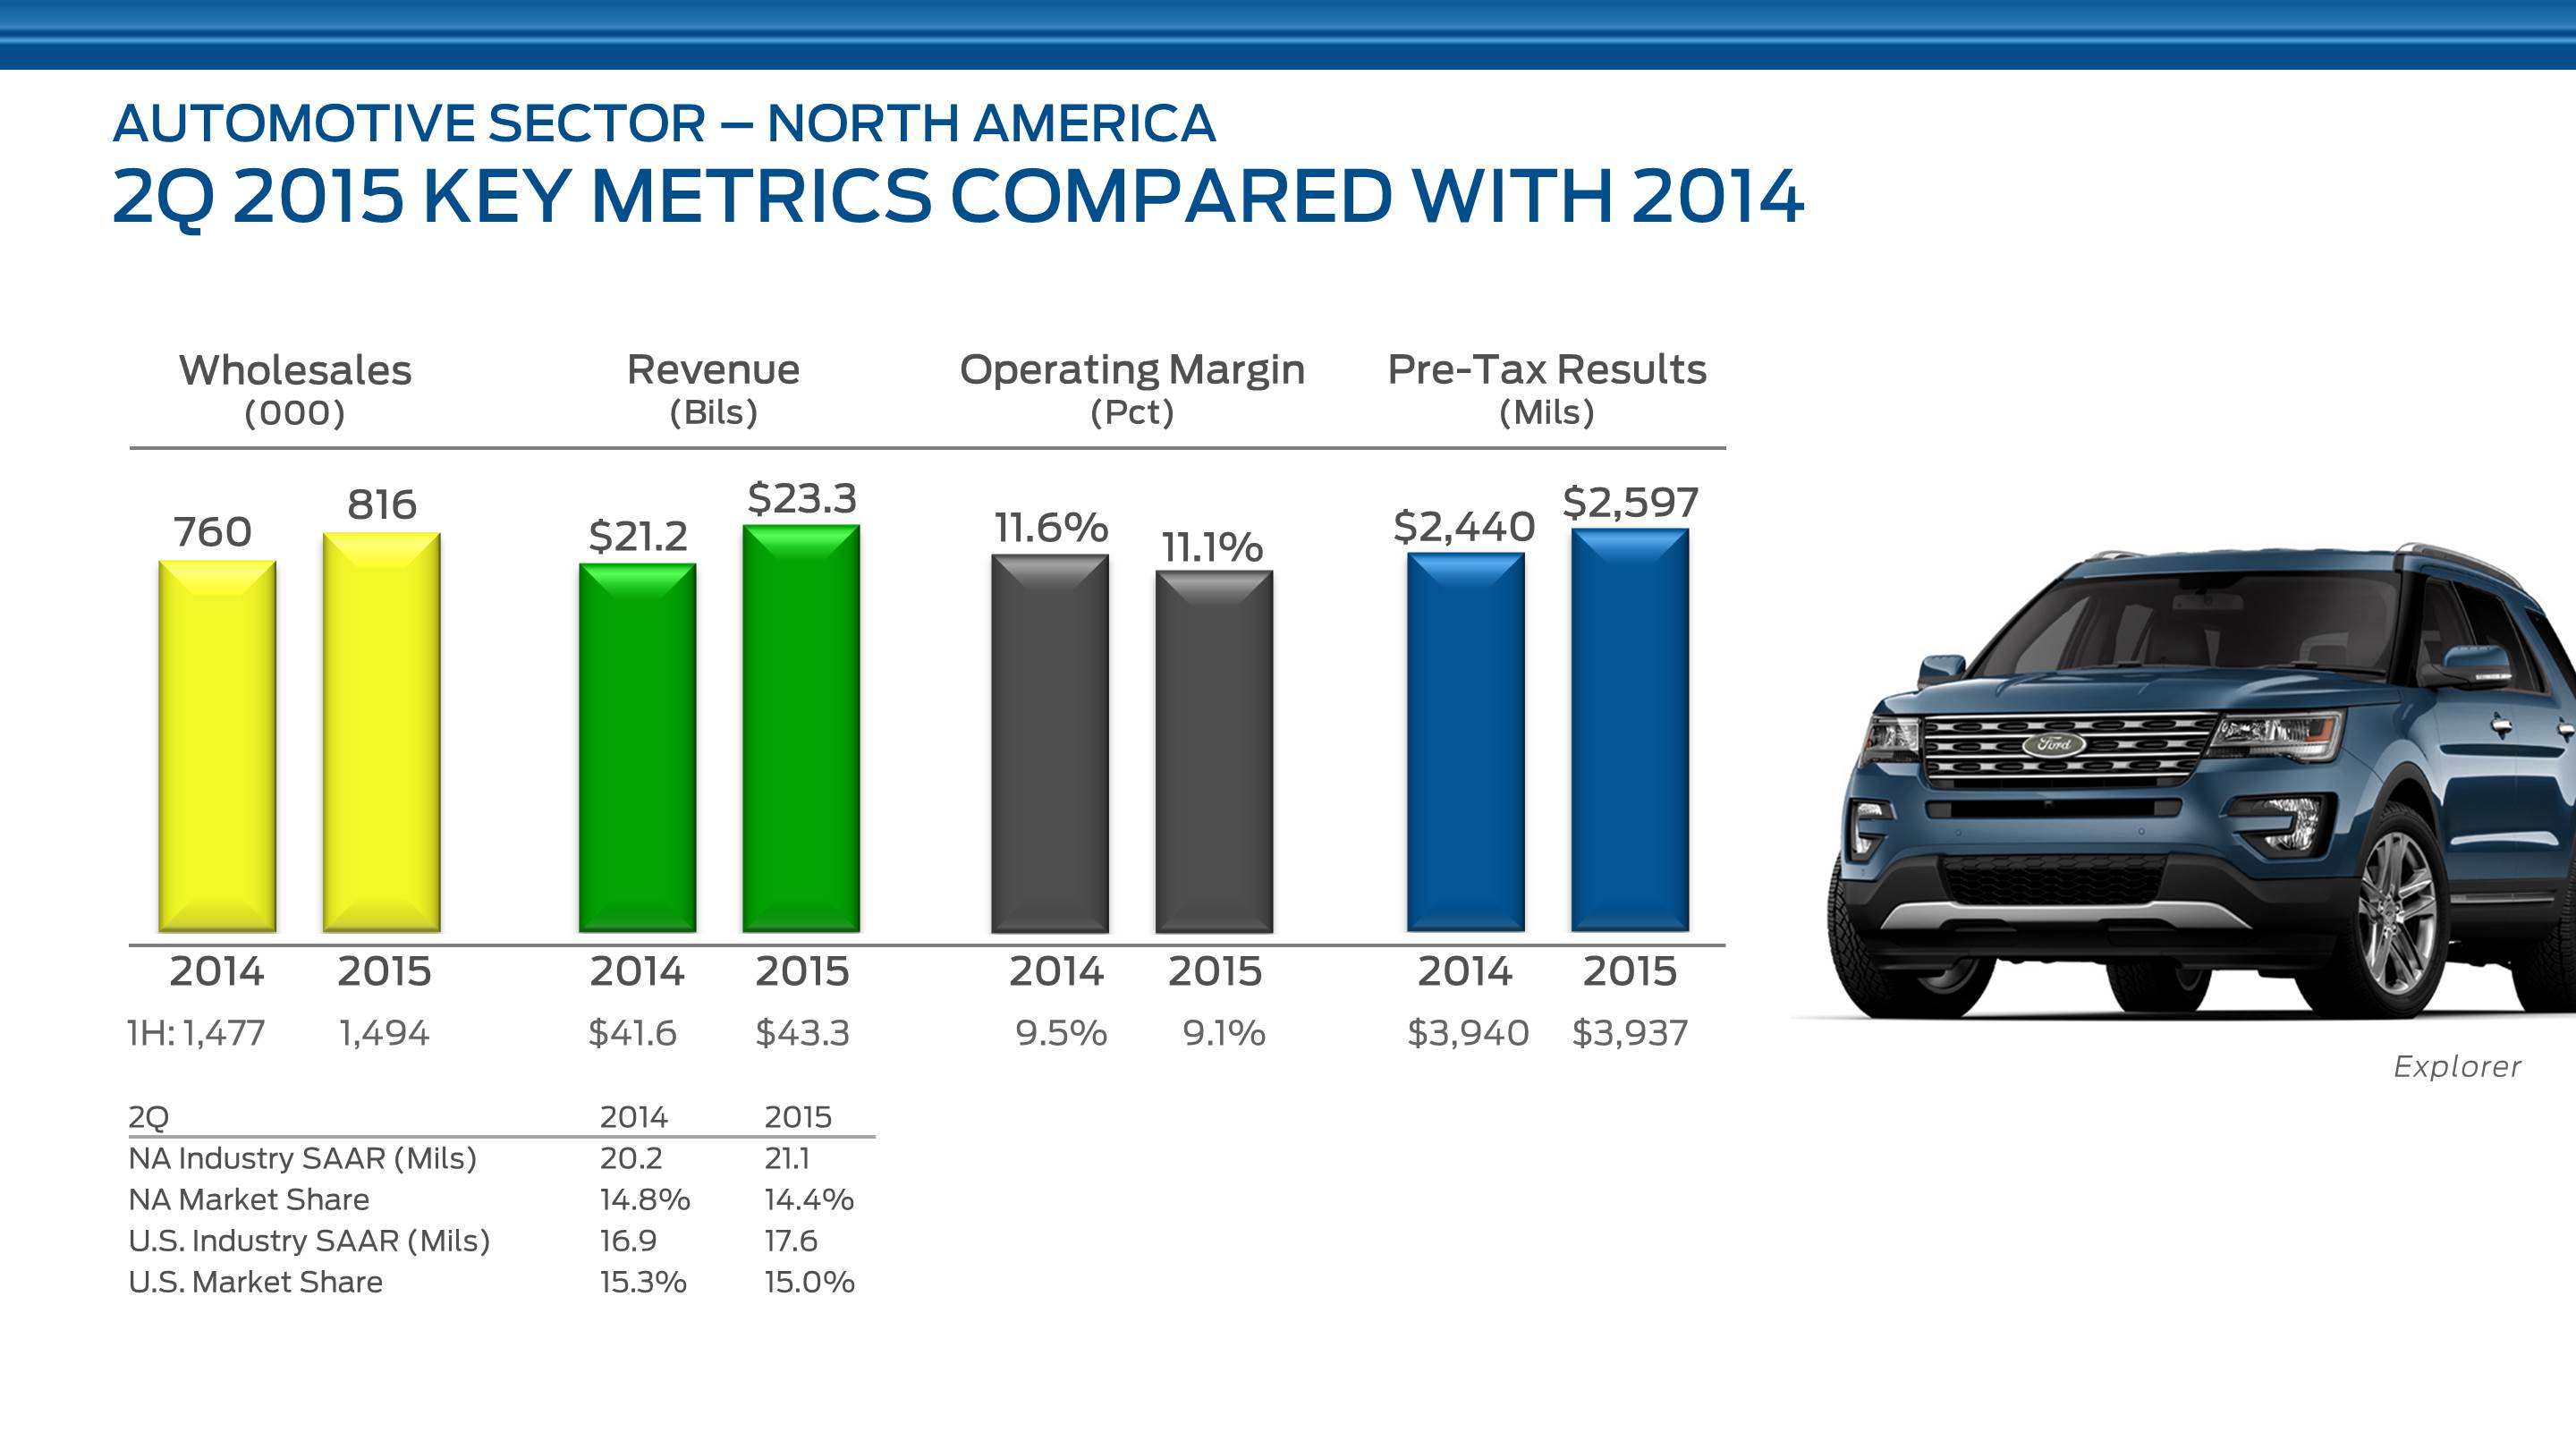
Shown above are the key metrics for North America for second quarter 2015. Both wholesale volume and revenue were up in the quarter from a year ago. Wholesale volume was 7% higher despite a decline of about 15% in F-150 wholesales related to the now-completed launch at our Kansas City Assembly Plant. The higher wholesales in the quarter reflect the non-repeat of last year's stock reduction plus the impact of higher industry sales; U.S. SAAR increased by 4% to 17.6 million units.
Lower availability of F-150 resulted in lower U.S. market share, which was down three-tenths of a percentage point to 15%.
Revenue was up 10% from a year ago driven by the higher wholesale volume, as well as higher net pricing and favorable mix; these factors were offset partially by the adverse effect of the strong U.S. dollar on our revenue in Canada and Mexico.
Operating margin was a strong 11.1%, though down half of a percentage point from last year including the launch effect of F-150. Pre-tax profit was an any-quarter record at $2.6 billion, up $157 million from last year's record profit.
As shown below the chart, our first half volume was up 1% from a year ago, and revenue was up 4%. Operating margin, at 9.1%, was down four-tenths of a percentage point, while pre-tax profit, at $3.9 billion, was about equal.
38
Item 2. Management's Discussion and Analysis of Financial Condition and Results of Operations (Continued)
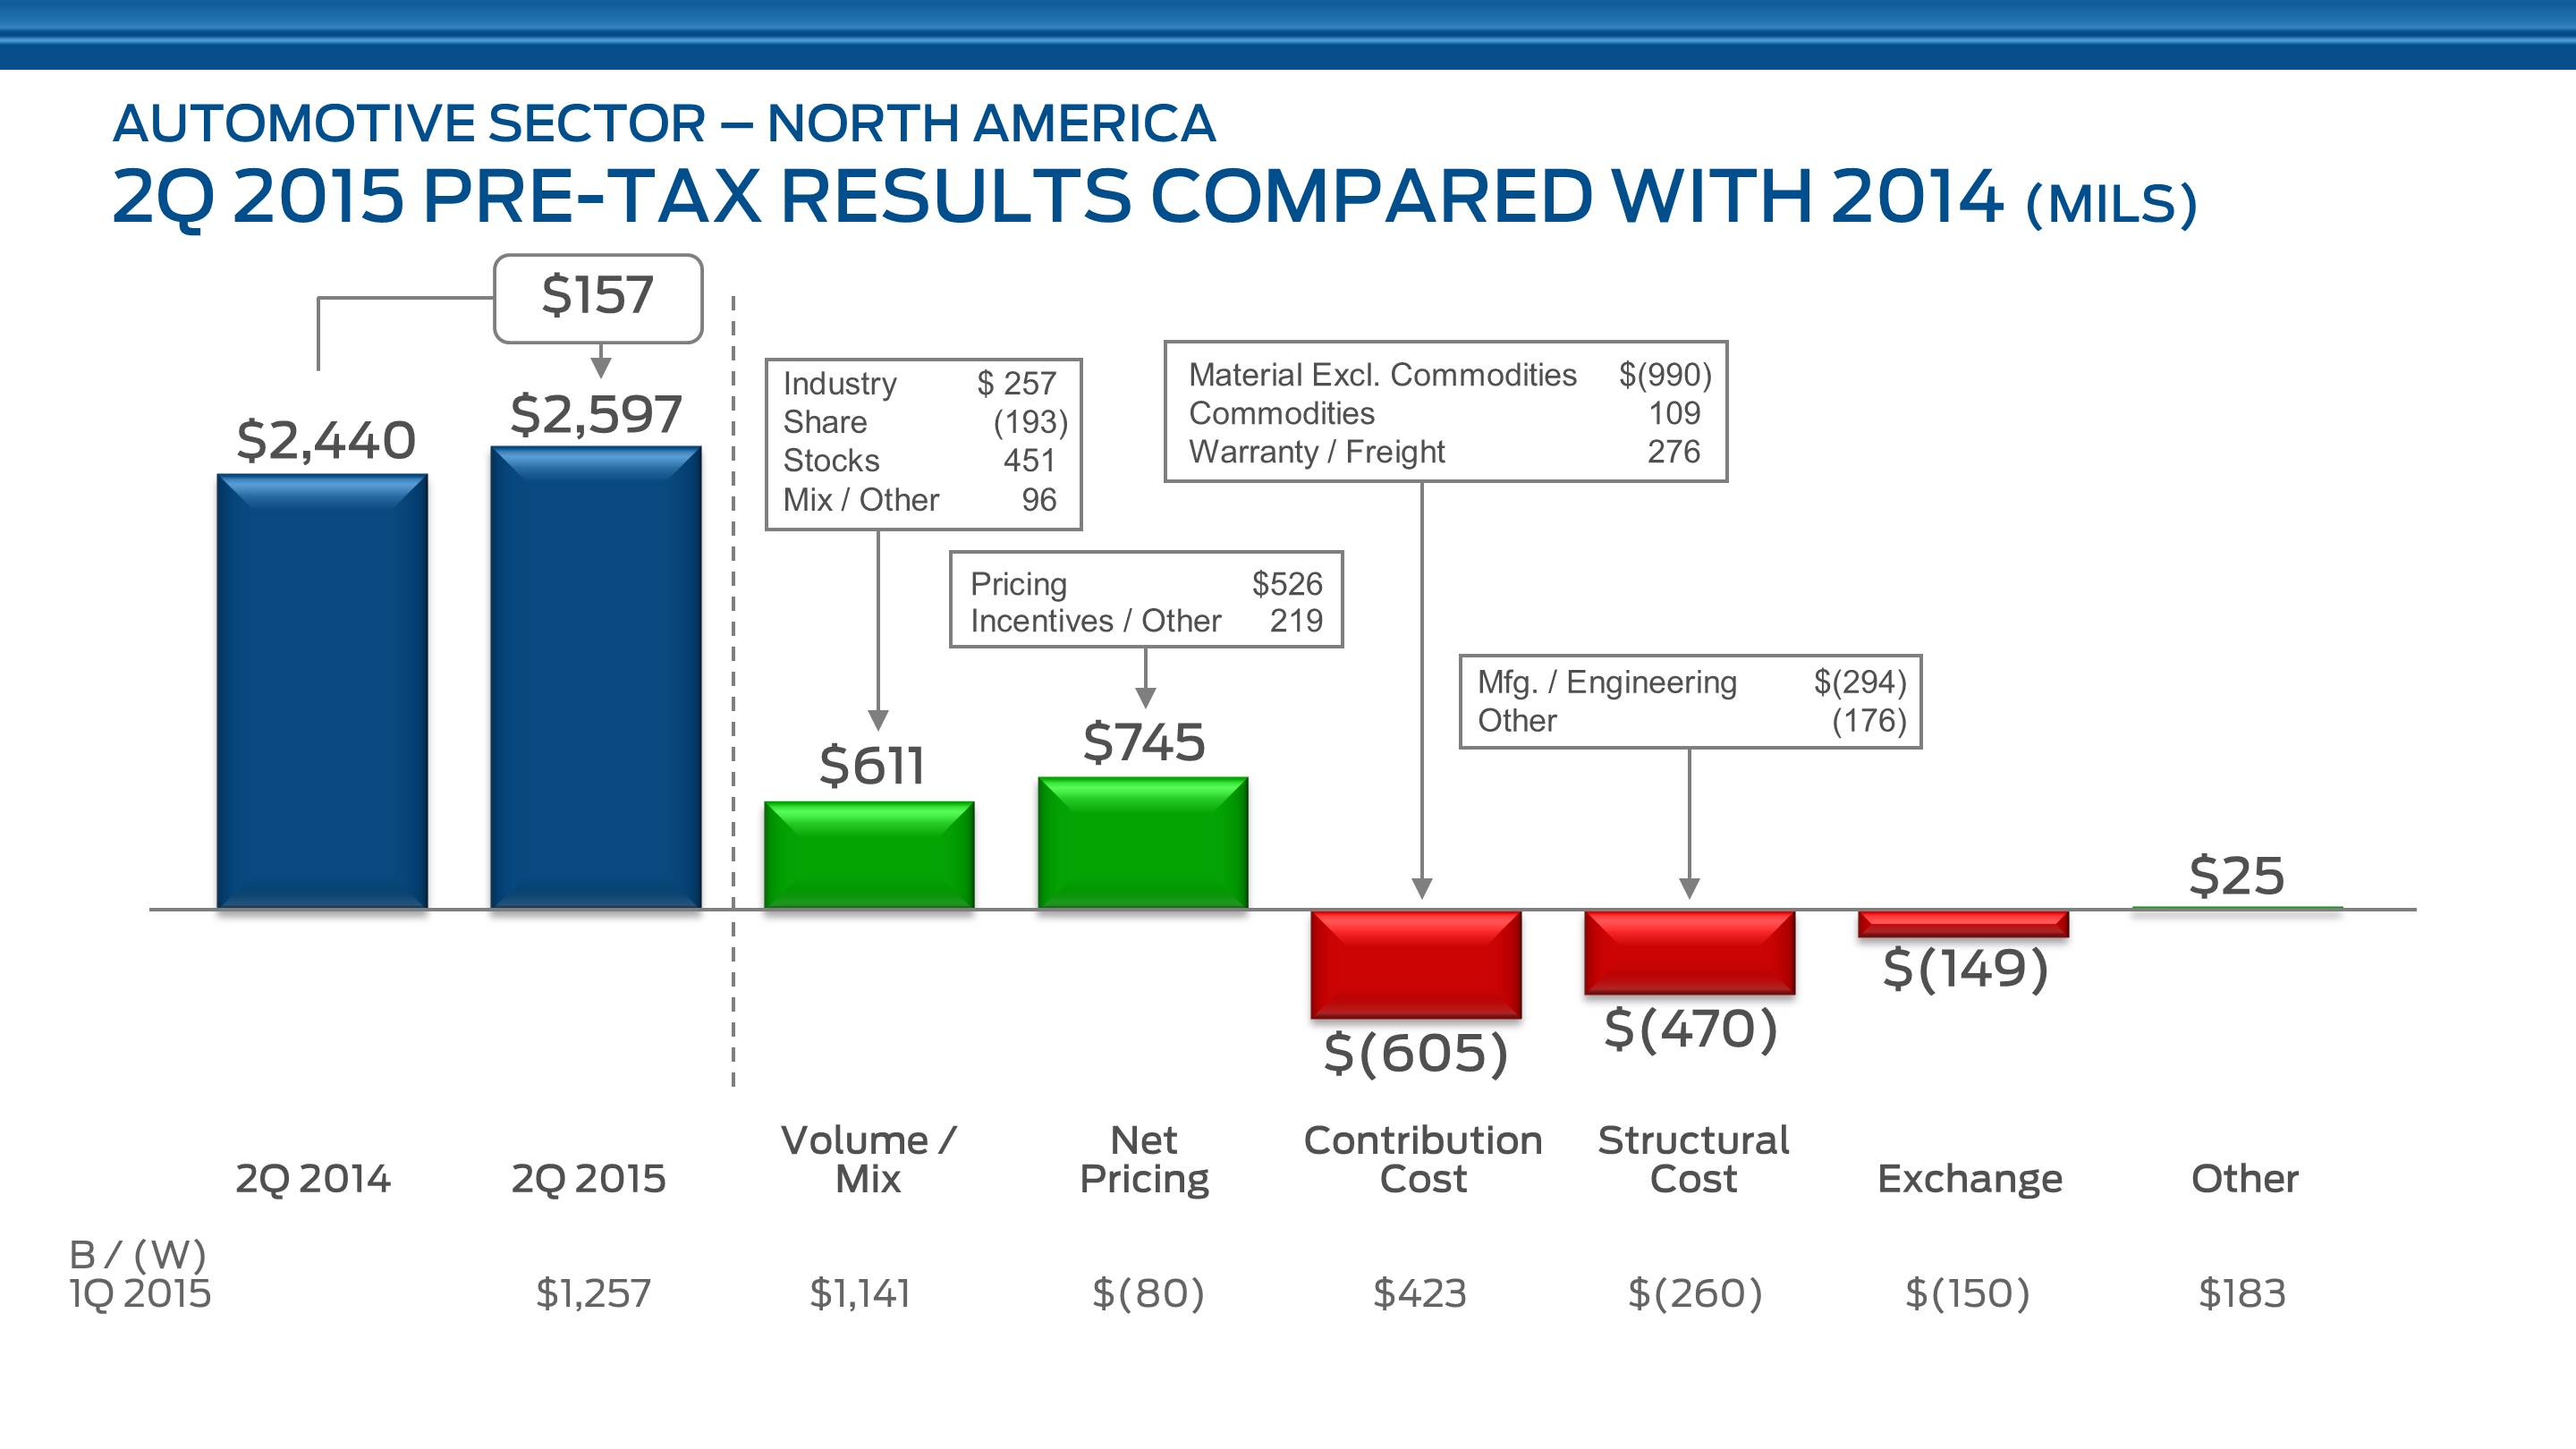
Favorable volume and mix and higher net pricing, which included lower incentives, explain North America's higher pre-tax profit. Higher costs and unfavorable exchange were partial offsets.
As shown below the chart, our pre-tax profit improved nearly $1.3 billion compared with first quarter due to favorable volume and mix and lower costs. All other factors essentially offset one another.
We expect our results in North America to improve in the second half compared with the first half as we benefit from a full supply of F-150 and Edge, as well as the recent launches of Explorer and Lincoln MKX.
We expect North America to have a very strong year, with substantial top-line growth, higher pre-tax profit, and an improved operating margin. This is based on continued robust industry sales, our strong product line-up including products launched last year and planned for 2015, most of which are now complete, our continued discipline in matching production with demand, and a lean cost structure.
For the full year, we continue to expect North America's pre-tax profit to exceed last year's result, and its operating margin to be 8.5% to 9.5%, with an opportunity to be in the upper half of the range.
39
Item 2. Management's Discussion and Analysis of Financial Condition and Results of Operations (Continued)
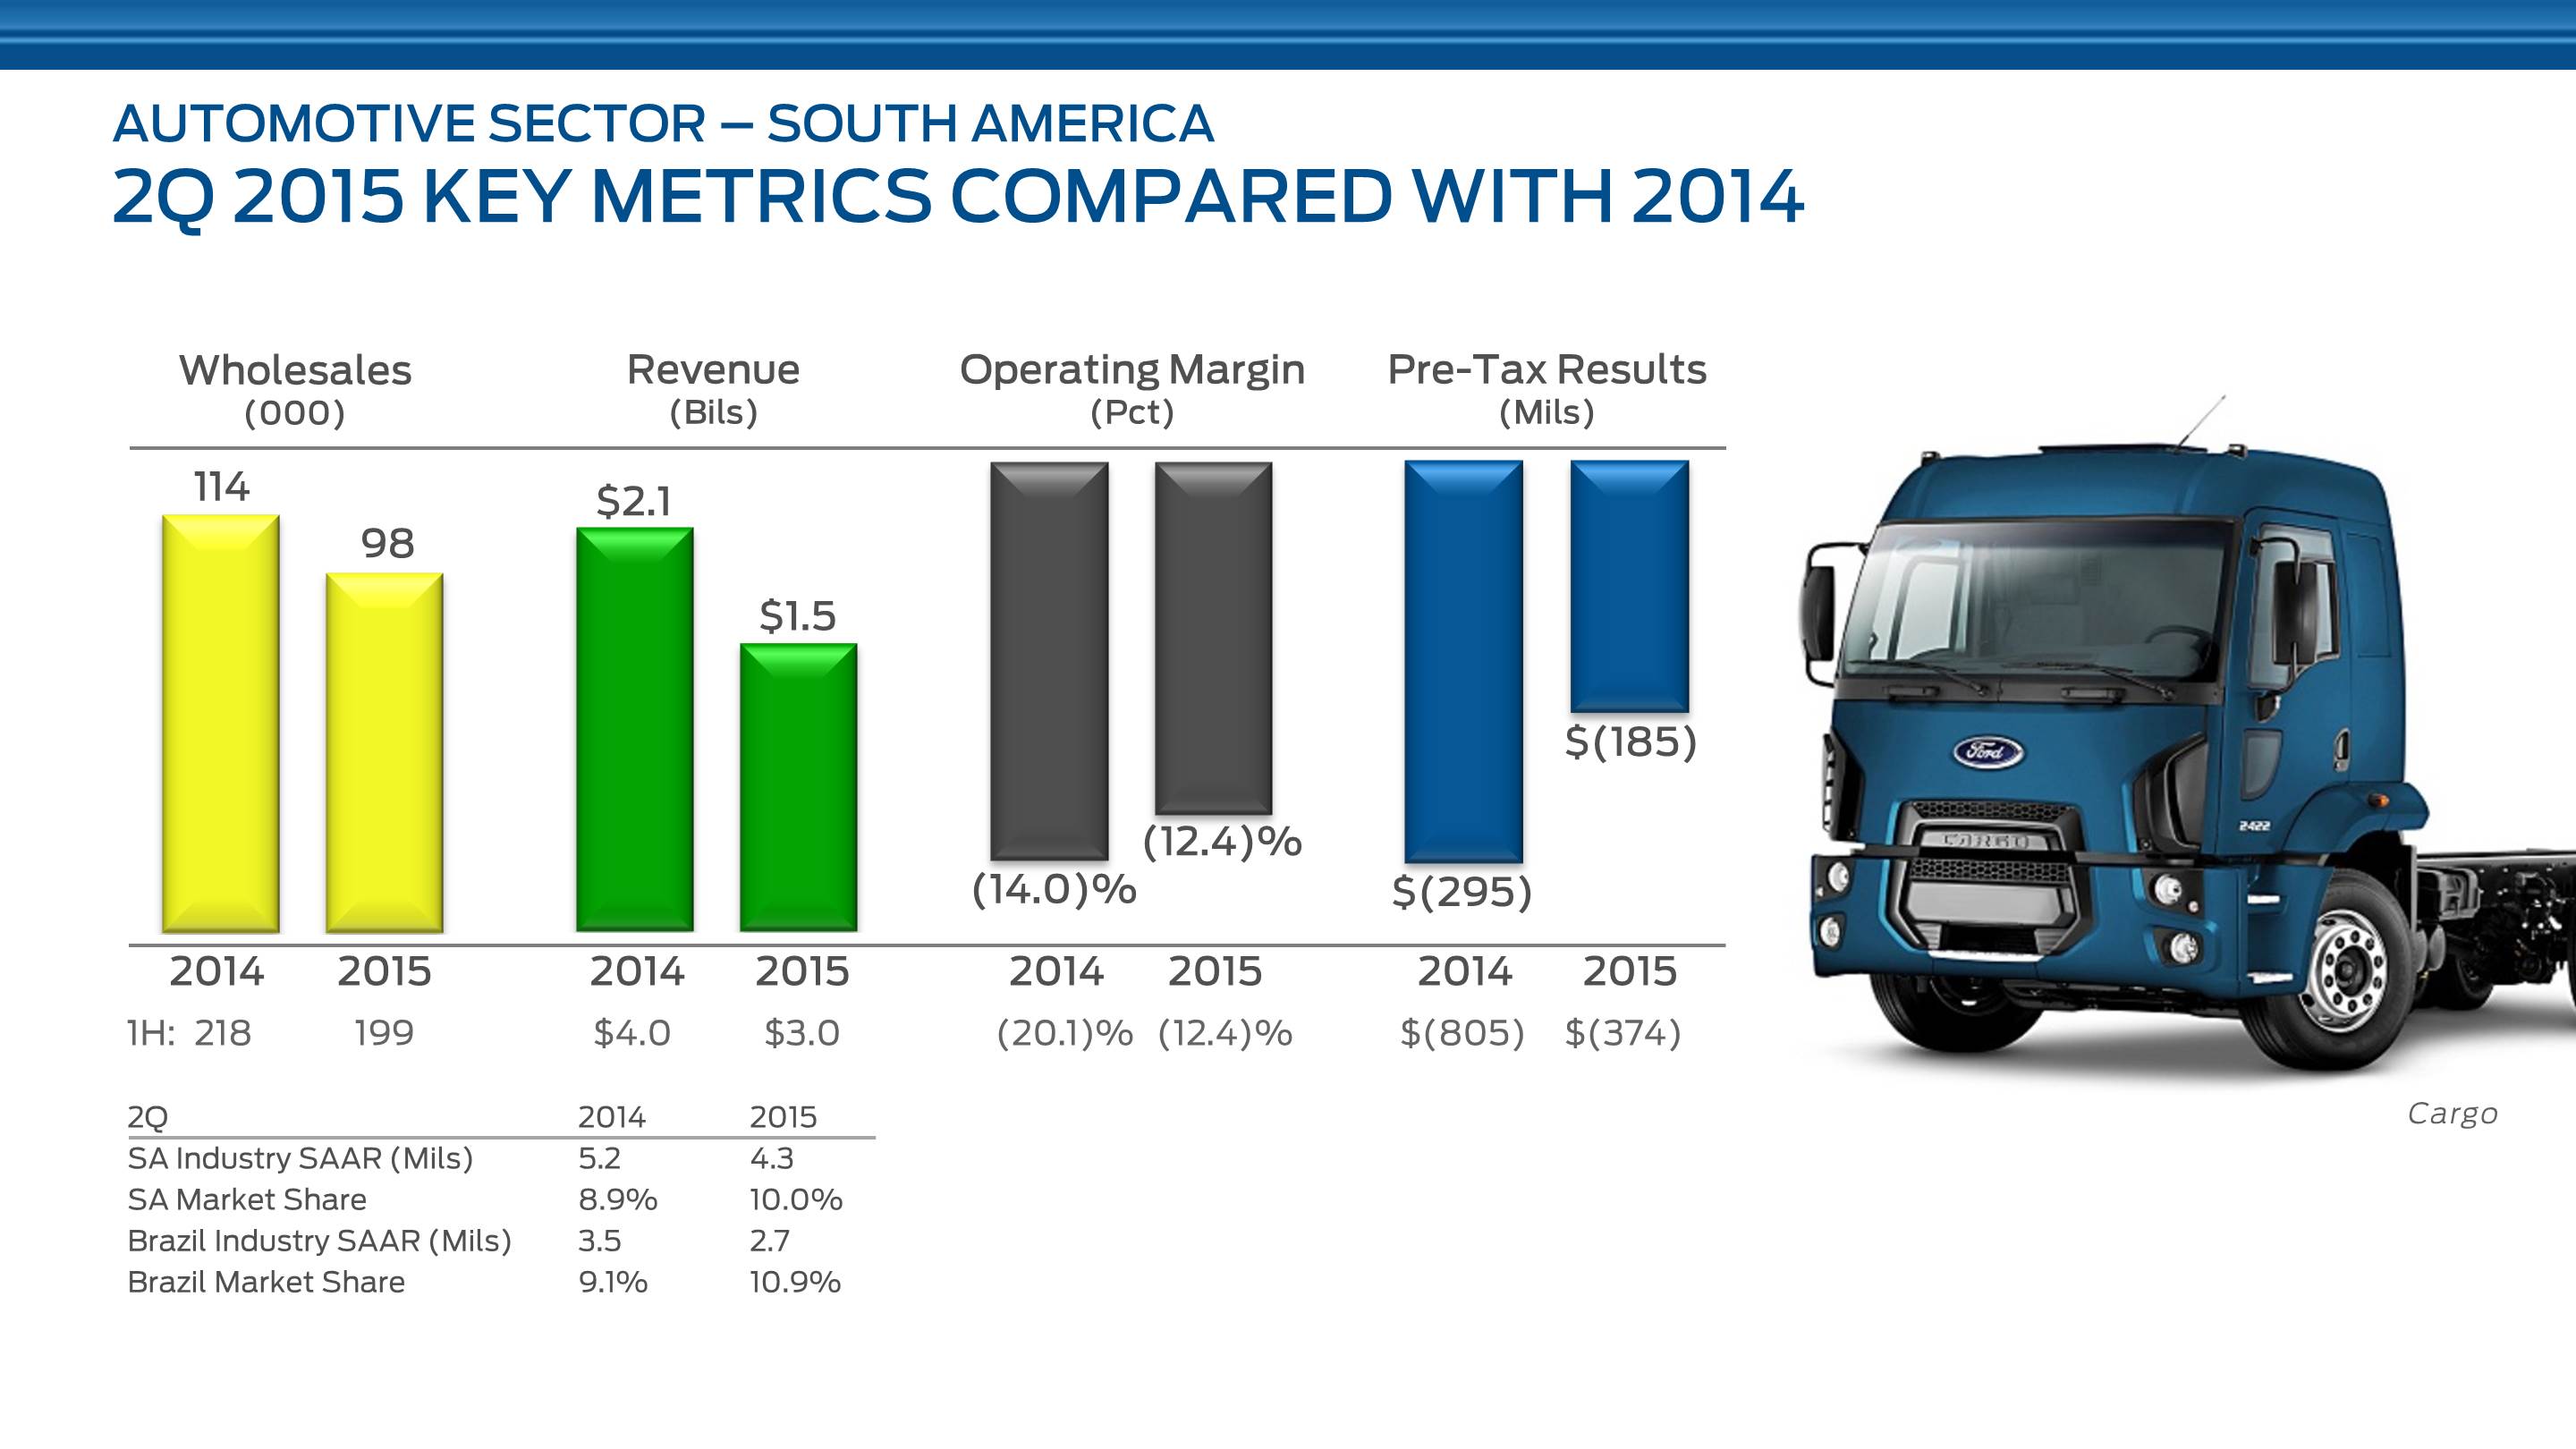
The business environment in South America continues to deteriorate, with negative GDP growth, continued high inflation, and currency weakness across the region. The industry pricing environment remains difficult, particularly in Brazil, with actions taken to date lagging the combined adverse effects of weakening currencies and high local inflation.
Despite these challenges, our strategy of replacing legacy products with One Ford products continues to prove to be the right one. Once again this quarter, the new Ka drove strong market share gains in the region, which, at 10%, was up 1.1 percentage points. In Brazil, Fusion continued to lead its segment and, as a result of the success of the F-Series and Cargo, Ford led the light and semi-light truck segments again this quarter. In Argentina, Ford continued to rank number two in sales, and EcoSport and Mondeo led their segments.
In the second quarter of 2015, our wholesale volume and revenue decreased from a year ago by 14% and 29%, respectively. Our lower volume resulted from a 900,000-unit decline in industry SAAR, reflecting the impact of Brazil's weaker economy and Argentina import restrictions.
Our revenue decline resulted from the weaker currencies and lower volume.
Operating margin was negative 12.4%, 1.6 percentage points better than a year ago, and the pre-tax loss was $185 million, an improvement of $110 million.
As shown below the chart, our first half 2015 volume was down 9% from a year ago and our revenue was down 25%. Operating margin, at negative 12.4%, improved 7.7 percentage points. and pre-tax loss, at $374 million, improved $431 million.
40
Item 2. Management's Discussion and Analysis of Financial Condition and Results of Operations (Continued)
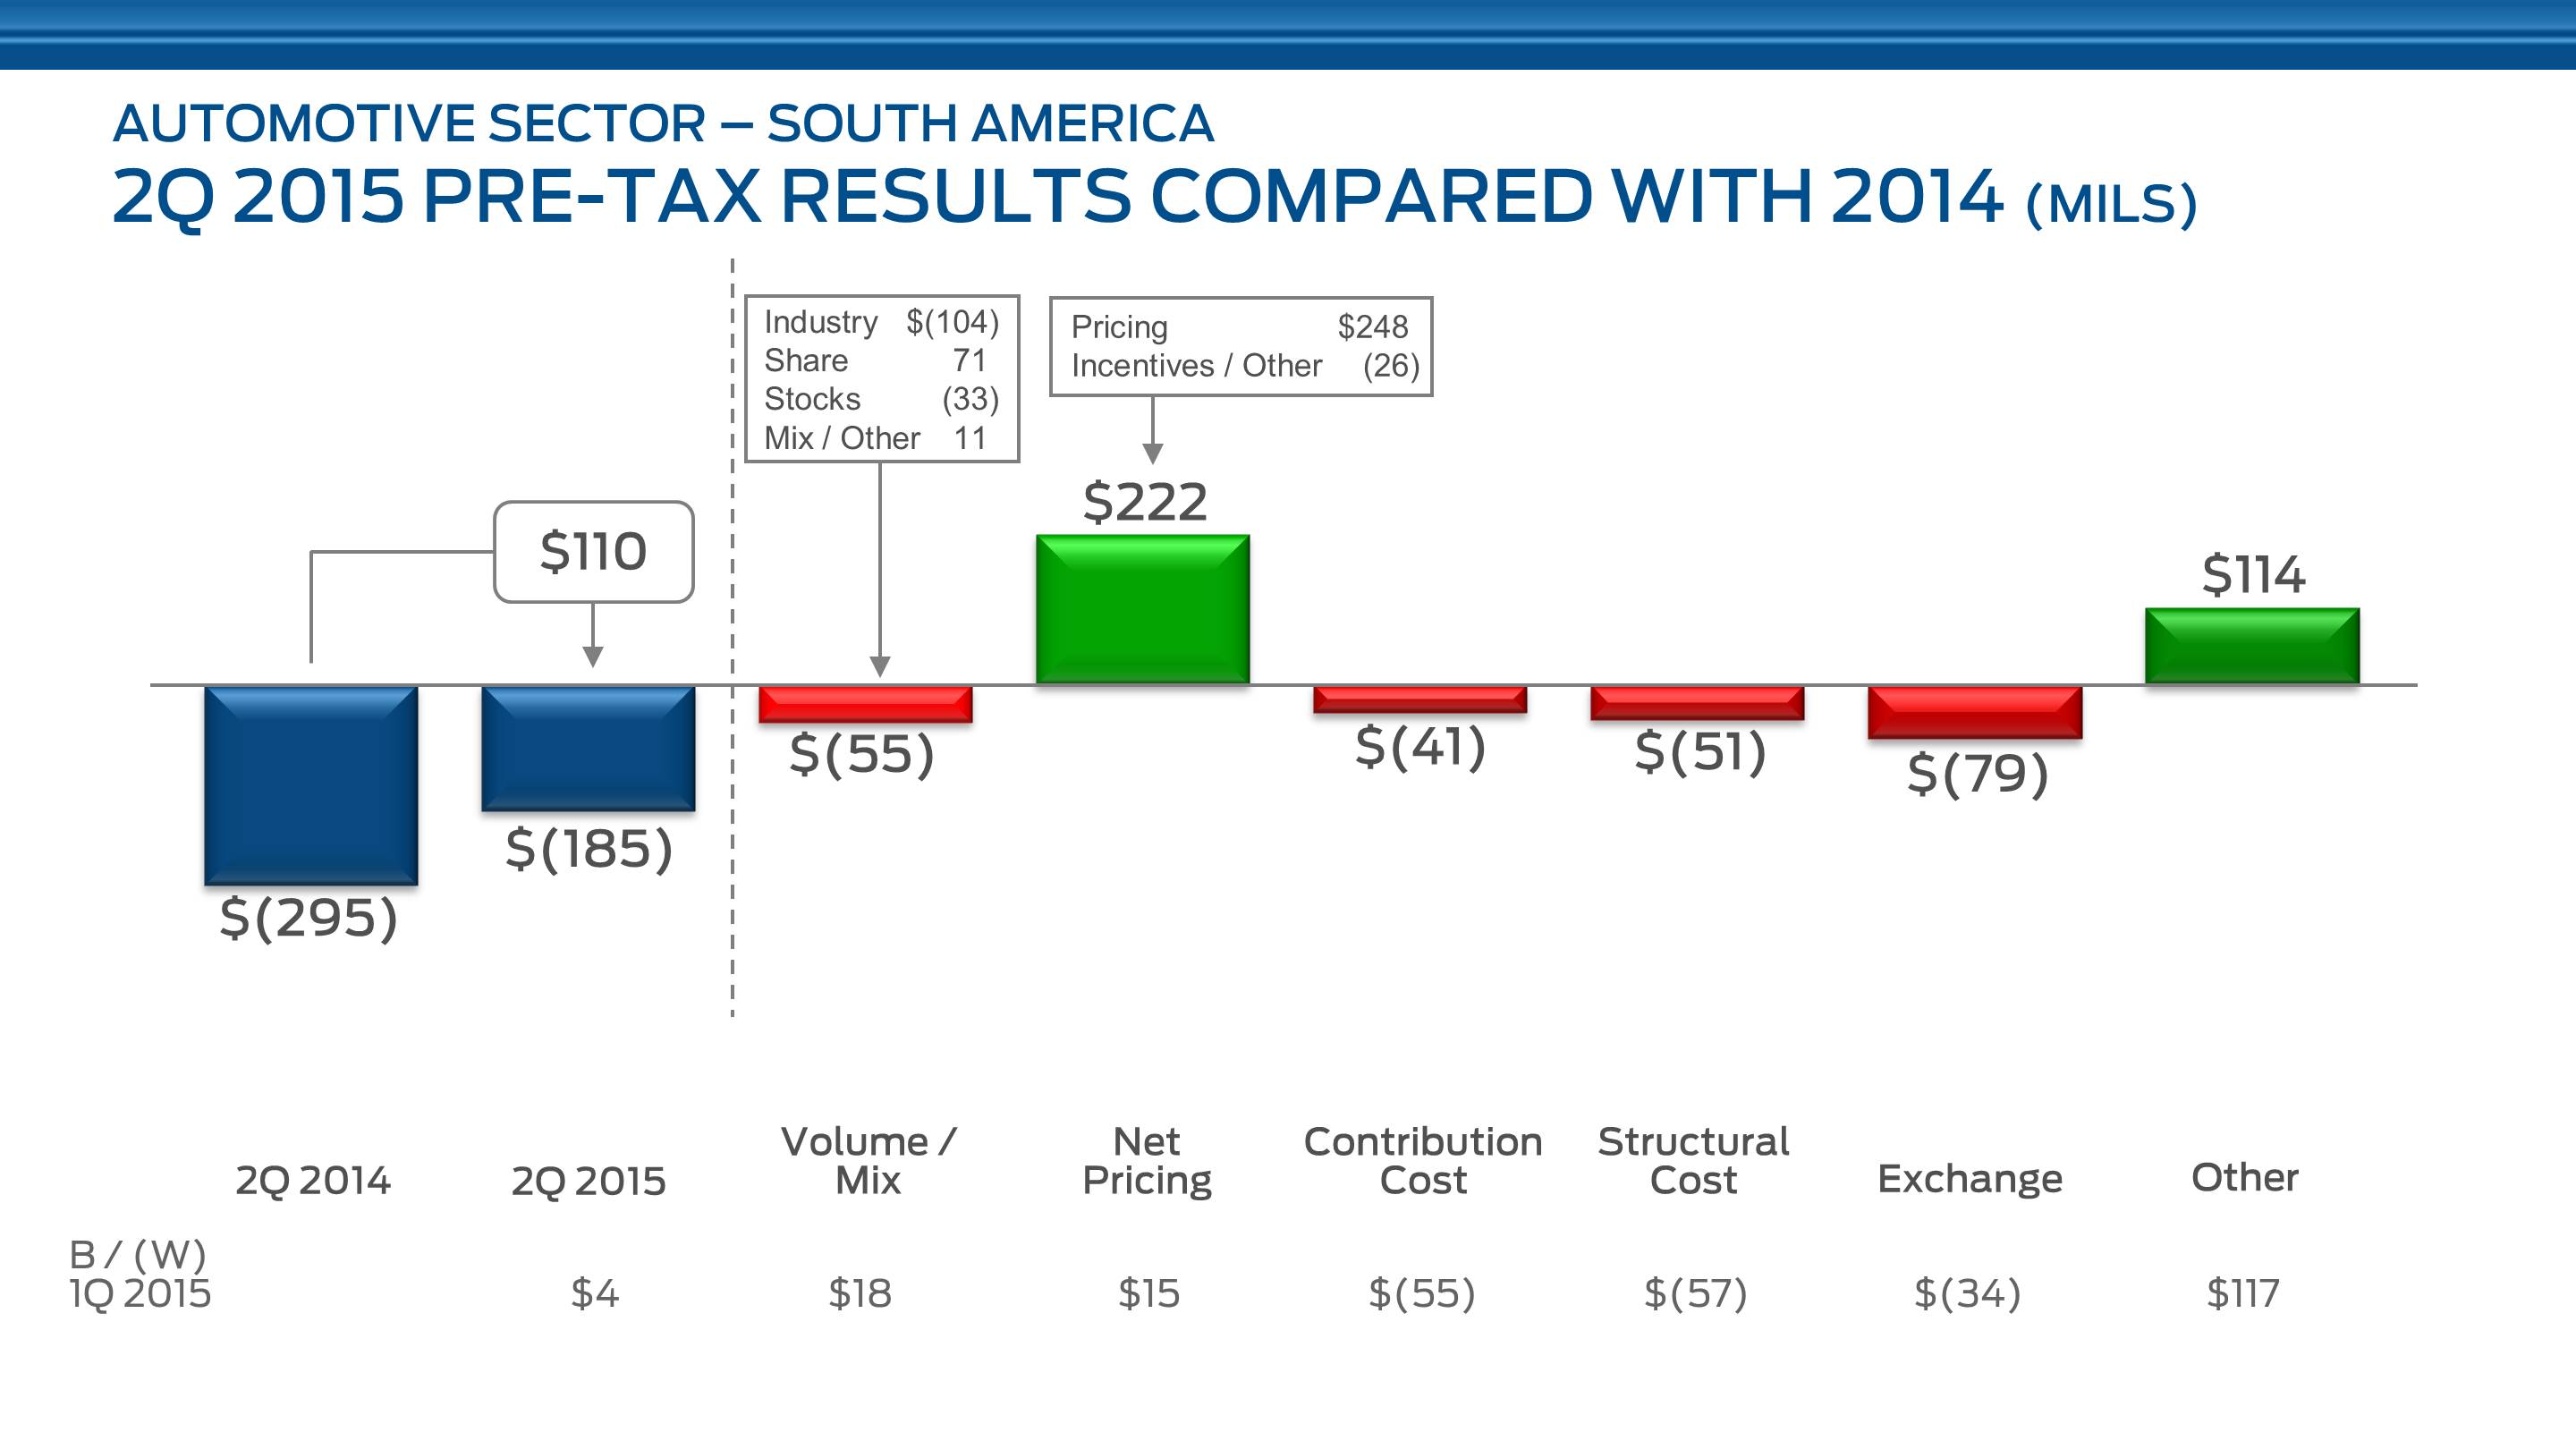
South America's second quarter 2015 improved pre-tax result from a year ago was due to higher net pricing, reflecting the introduction of the new Ka and actions in response to weaker currencies and high local inflation.
Our share improvement continued to provide a partial offset to the declining industry.
As you can see below the chart, our second quarter 2015 result was about equal to first quarter.
We continue to focus on finding revenue opportunities, reducing costs, matching production to demand, and increasing local content to mitigate further the adverse effects of the weak local currencies.
For the full year, we continue to expect our pre-tax loss to improve from 2014.
41
Item 2. Management's Discussion and Analysis of Financial Condition and Results of Operations (Continued)
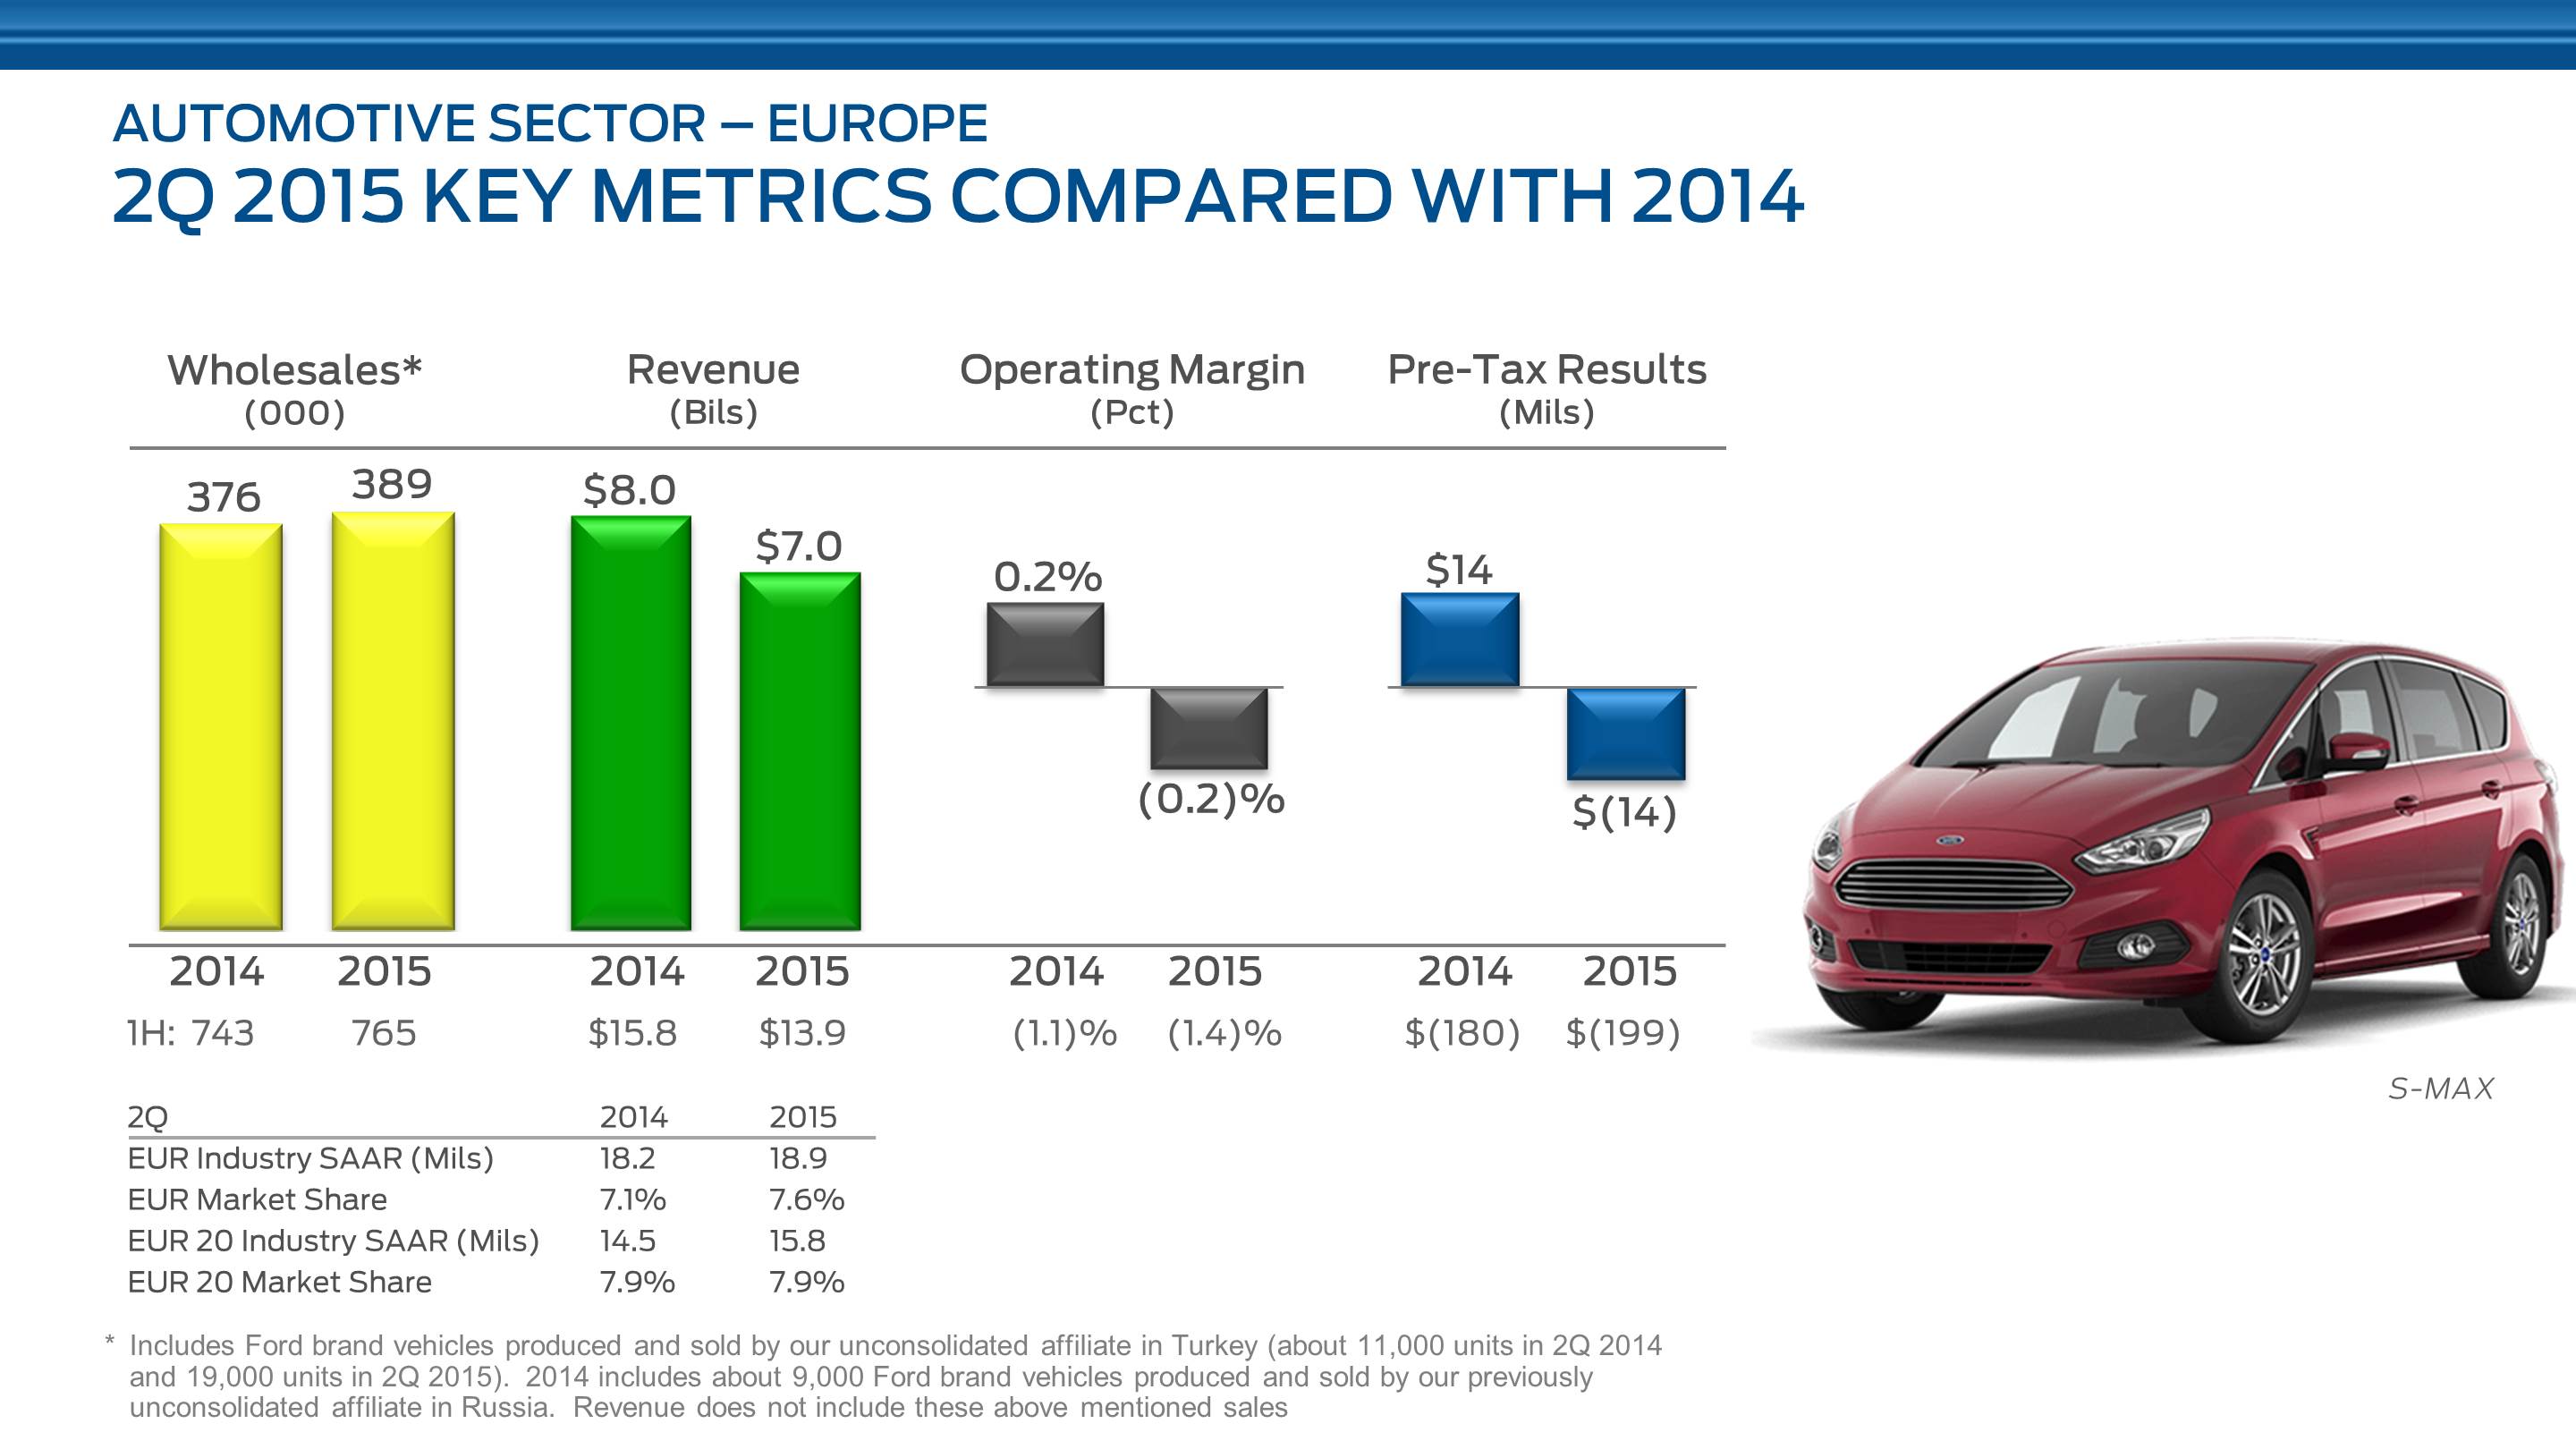
Our Europe wholesale volume improved 3% from a year ago, while revenue declined 14%. The higher volume resulted from a 1.3 million-unit increase in the Europe 20 SAAR, as well as higher industry sales and Ford share in Turkey. These factors were offset partially by the non-repeat of last year's dealer stock increase.
Our Europe 20 market share, at 7.9%, was unchanged from a year ago. Within this, however, the success of our full line of Transit vehicles and continued strong performance of our Ranger compact pick-up contributed to a 1.2 percentage point improvement in our commercial vehicle share, to 11.7%. Our total Europe market share improved half of a percentage point to 7.6%.
Our lower revenue was due to the adverse translation effects of the strong U.S. dollar.
Operating margin and pre-tax results approached breakeven and were very similar to results achieved last year. As a reminder, we began consolidating the financial results of our Russia joint venture as of March 31, 2015.
As shown below the chart, our first half volume was up 3% from a year ago, while our revenue was down 12% due to the strong U.S. dollar. Operating margin, at negative 1.4%, and our pre-tax loss, at $199 million, were roughly in line with a year ago.
42
Item 2. Management's Discussion and Analysis of Financial Condition and Results of Operations (Continued)
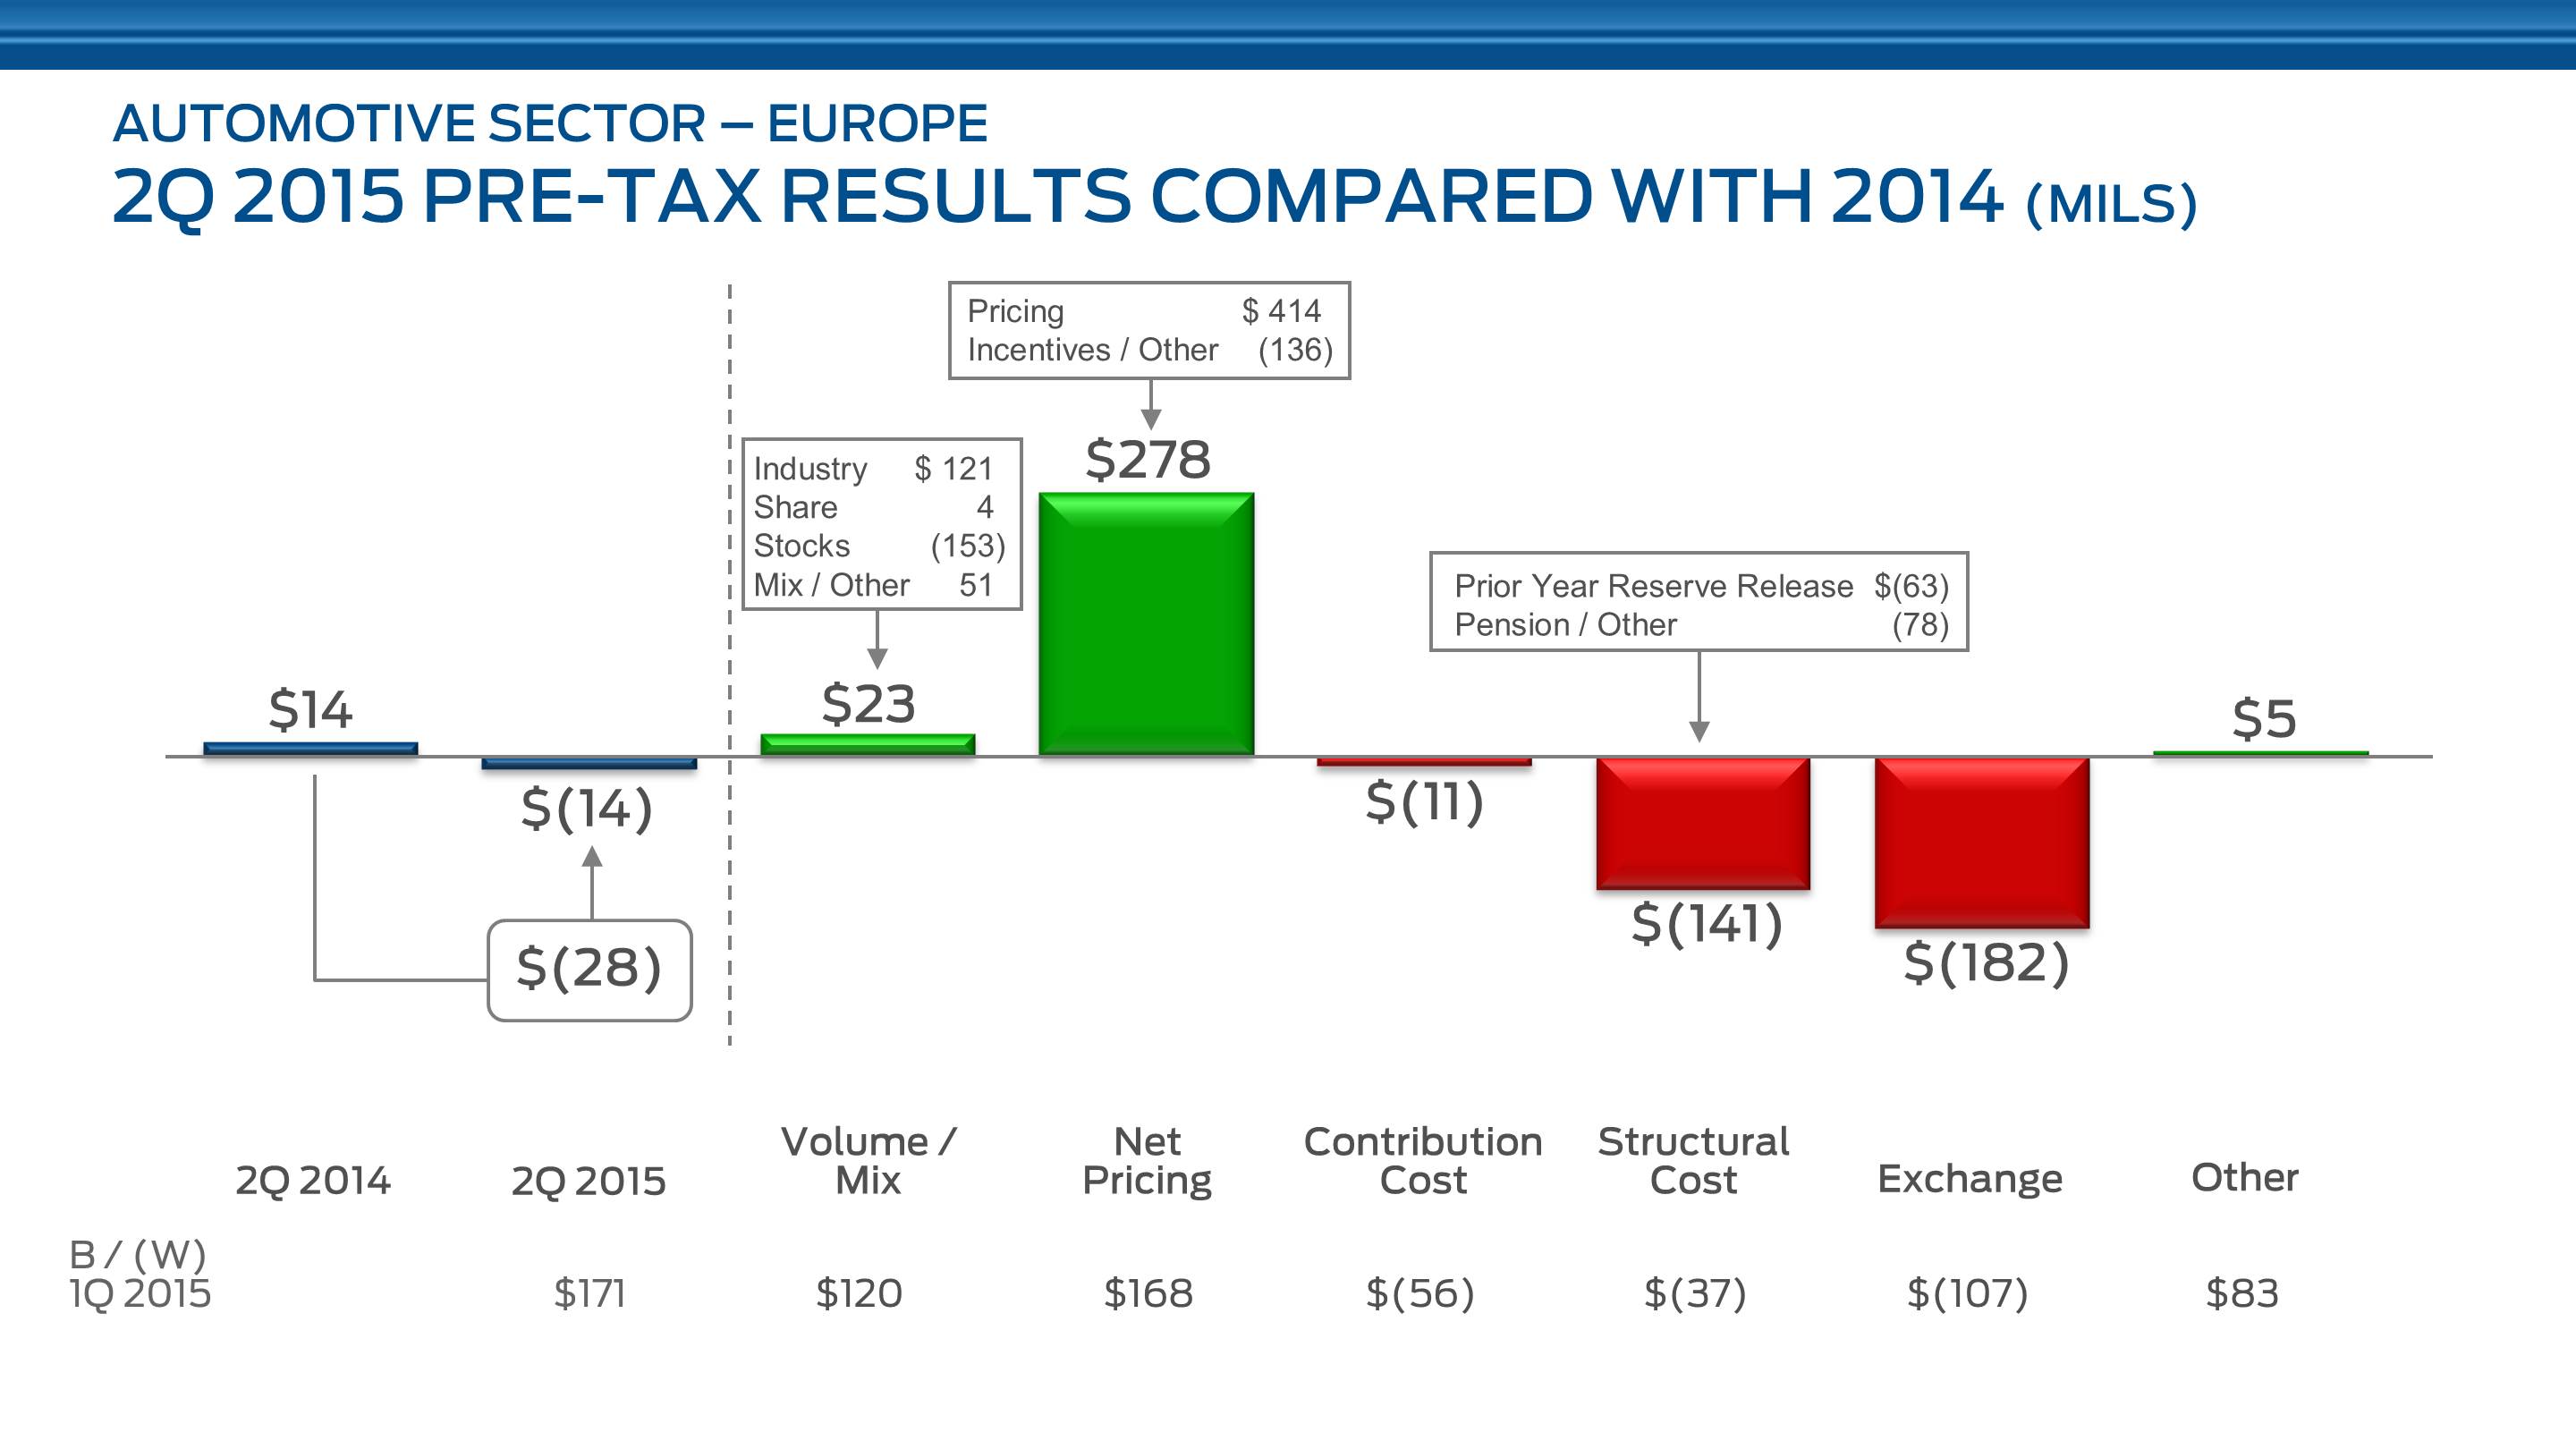
Although results in Europe in the quarter were about the same as last year, the underlying operating performance in Europe was actually somewhat better. This year's results did not benefit from what is usually a seasonal stock increase in the quarter, plus a year ago we reported a one-time reserve release associated with our Cologne investment agreement. In addition, pension costs were higher in the second quarter of 2015 reflecting an increase in the amortization of losses related to pension obligations due to lower discount rates at year-end 2014.
Most importantly, we saw favorable volume and mix, with higher industry volumes, favorable mix, and improved share more than offsetting the unfavorable change in dealer stocks. Net pricing also improved, driven by our new products and actions taken in Russia in response to a weaker ruble.
As shown below the chart, second quarter pre-tax results improved from first quarter due to favorable market factors.
We have made progress on the Europe transformation plan announced in late 2012 in the key areas of product, brand and cost. We have delivered on our commitment to launch 25 new products, increased sales and share, seen improvements to our brand image, reduced our manufacturing capacity, and narrowed our losses each year. It is clear, though, that we have to go further in all three areas to speed our return to profitability and create a solidly profitable, sustainable, and vibrant business, despite increasing competitive and regulatory pressures, and the ongoing difficult business conditions in Russia.
For the full year, we continue to expect our pre-tax loss to improve from 2014. In line with normal seasonality, we expect results in the second half of 2015 to be lower than in the first half of the year.
43
Item 2. Management's Discussion and Analysis of Financial Condition and Results of Operations (Continued)
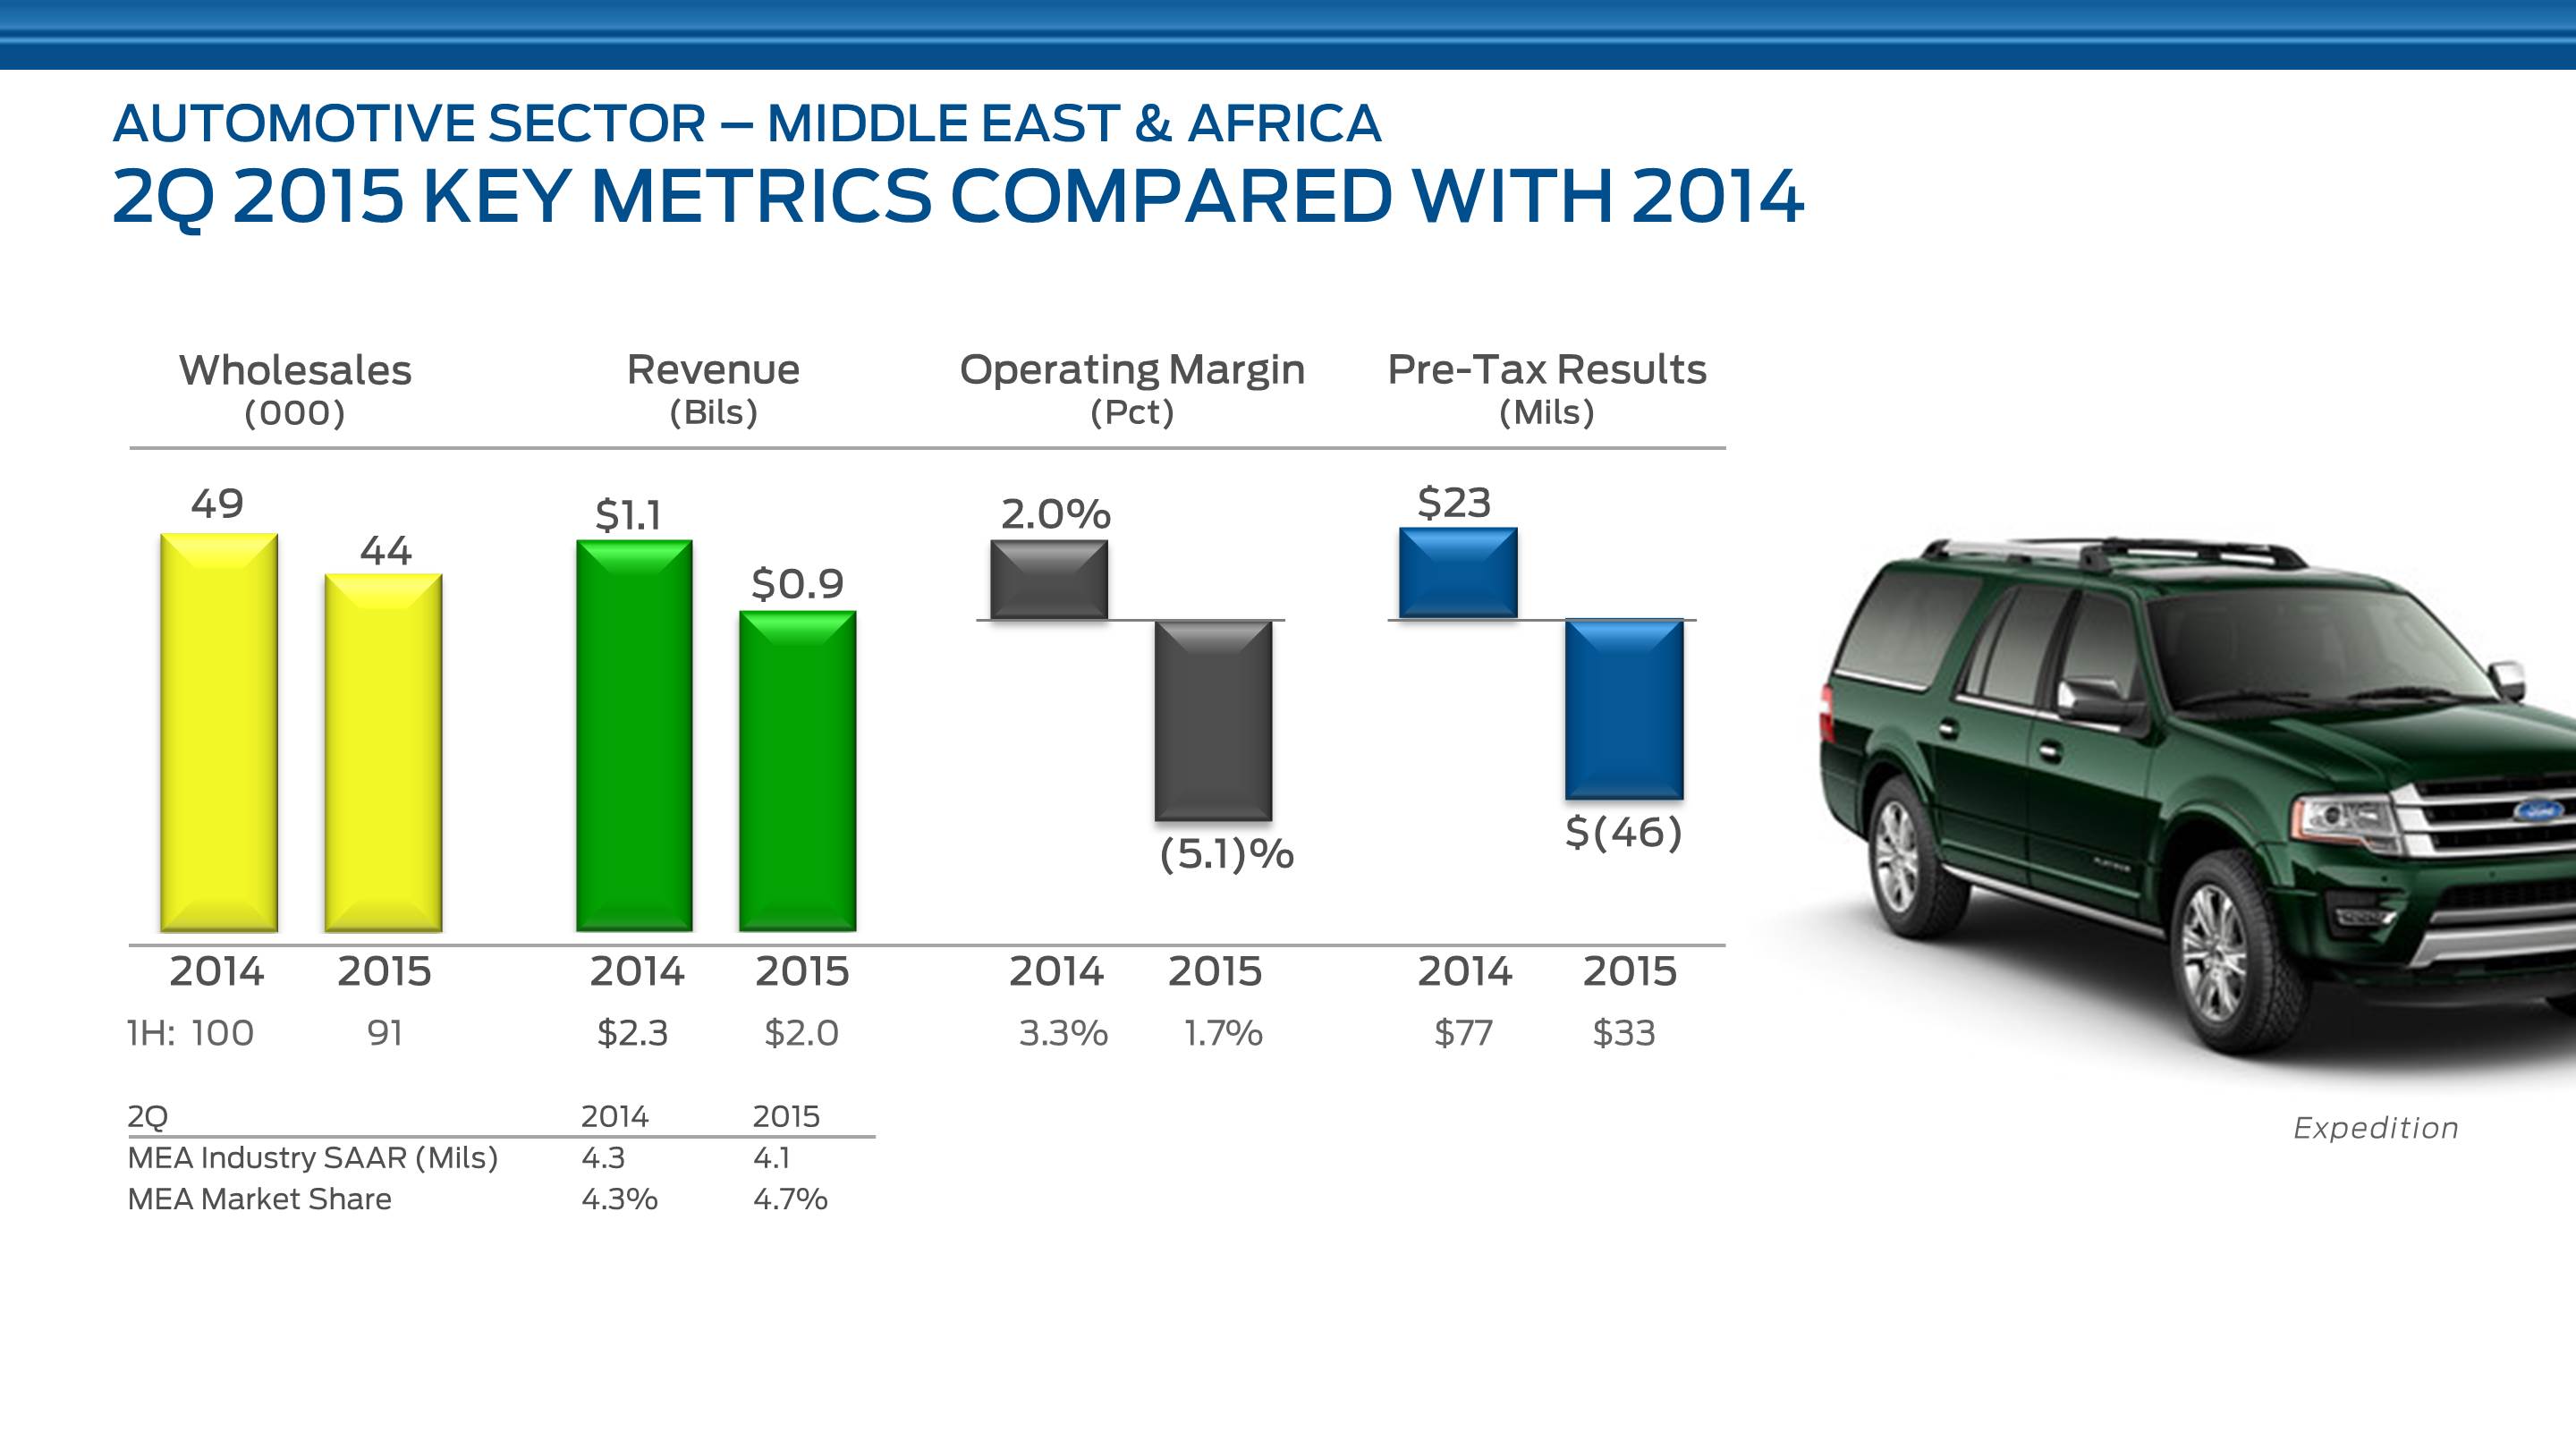
In Middle East & Africa this quarter we expanded our North Africa operations to include a sales office in Casablanca and a purchasing office in Tangiers.
Wholesale volume and revenue in the second quarter declined 10% and 23% from a year ago, respectively. Lower volume resulted from unfavorable changes in dealer stocks due to production timing differences, while the lower revenue reflects the translation effects of the stronger U.S. dollar, as well as the lower volume.
Operating margin, at negative 5.1%, was down from a year ago, and our pre-tax loss was $46 million, a deterioration of $69 million. Both changes were driven by the lower volume.
As shown below the chart, first half volume was down 9% from a year ago, and our revenue was down 16%. Operating margin, at 1.7%, was down 1.6 percentage points, and pre-tax profit, at $33 million, declined $44 million.
We remain focused in Middle East & Africa on building our distribution capability, expanding our One Ford product offering tailored to the needs of markets in the region, and leveraging our global low-cost sourcing hubs.
For the full year, we continue to expect to deliver about breakeven results.
44
Item 2. Management's Discussion and Analysis of Financial Condition and Results of Operations (Continued)
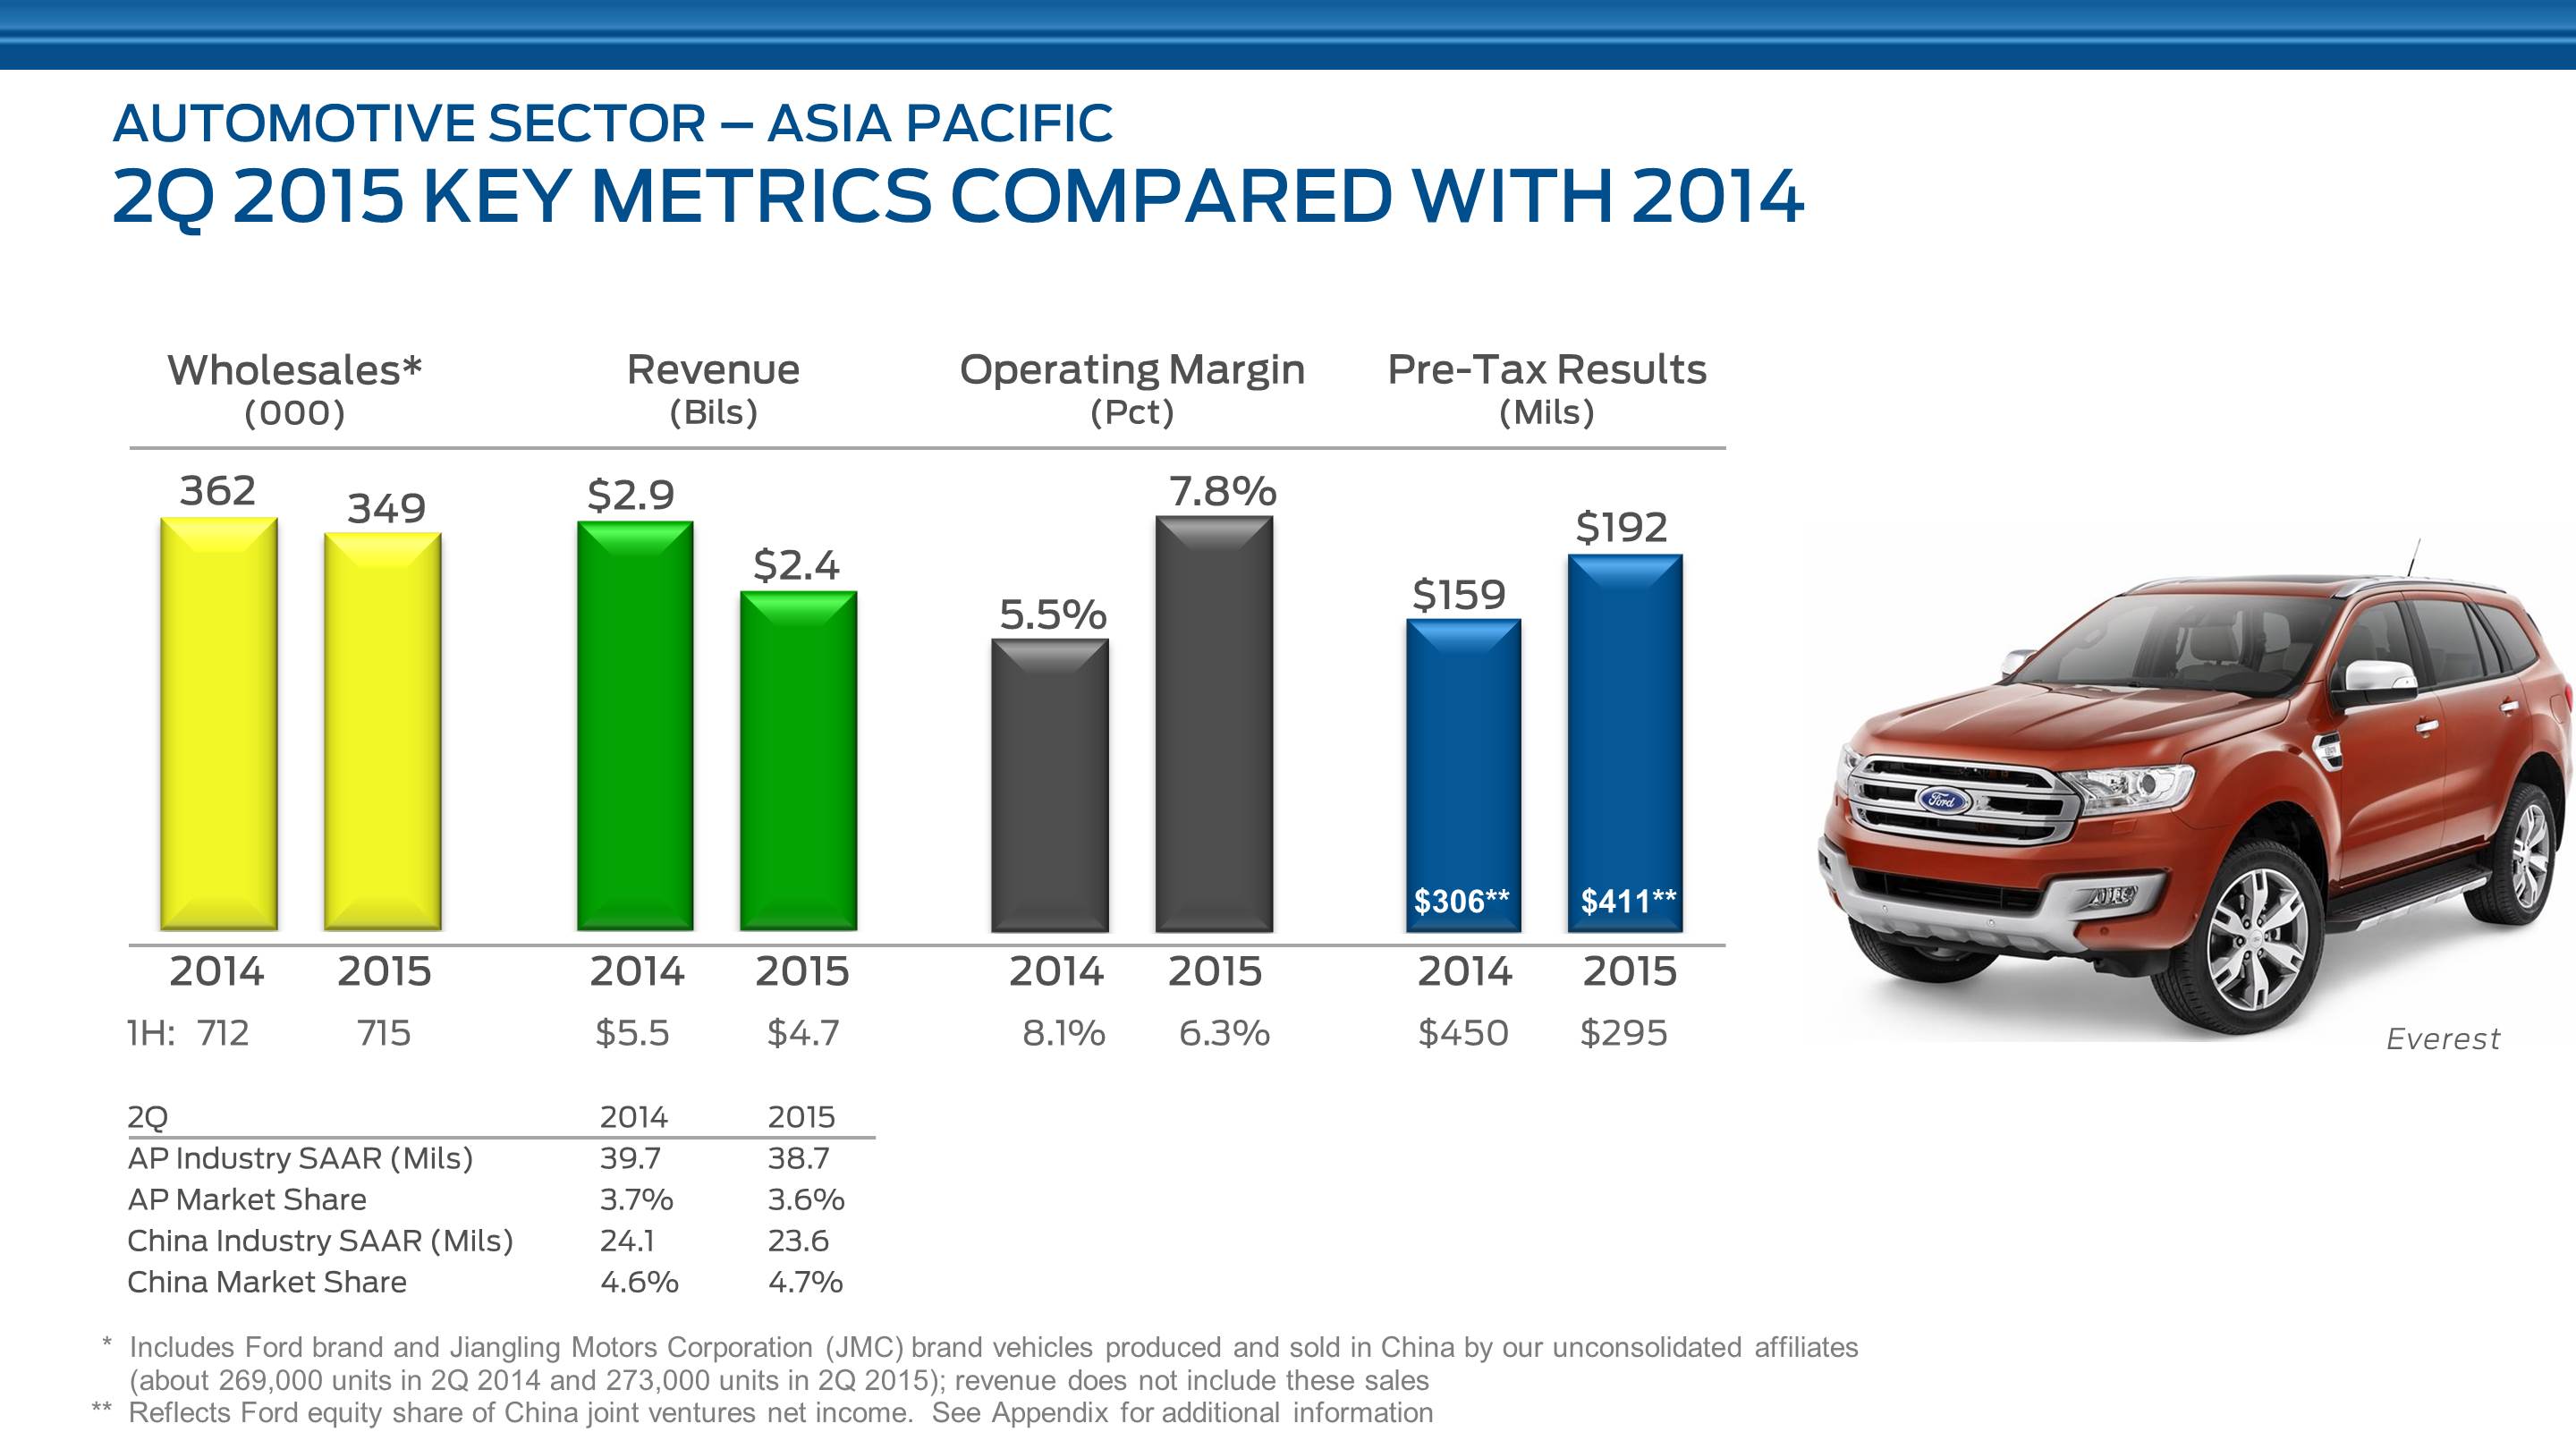
Asia Pacific's second quarter 2015 wholesale volume was down 4% compared with a year ago, and net revenue, which excludes our China joint ventures, declined 15%. China wholesale volume was unchanged from a year ago. Lower volume in the region was driven by lower industry sales and market share. We estimate second quarter SAAR for the region at 38.7 million units, down one million units from a year ago, including a 500,000-unit decline in China industry SAAR.
Our second quarter market share for the region, at 3.6%, was down one-tenth of a percentage point, while our China market share, at 4.7%, was up one-tenth of a percentage point and was equal to the record set in the third quarter last year.
Lower revenue was a result of the lower volume from our consolidated operations, as well as weaker currencies.
Operating margin in the quarter was 7.8%, up 2.3 percentage points from a year ago, and pre-tax profit was $192 million, up $33 million from a year ago. The increase in pre-tax profit was more than explained by improved results outside of China.
Our China joint ventures contributed $411 million to pre-tax profit this quarter, reflecting our equity share of their after-tax earnings.
As shown below the chart, first half volume was about equal to a year ago, while revenue was down 15%. Operating margin, at 6.3%, was down 1.8 percentage points, and pre-tax profit, at $295 million, declined $155 million.
45
Item 2. Management's Discussion and Analysis of Financial Condition and Results of Operations (Continued)
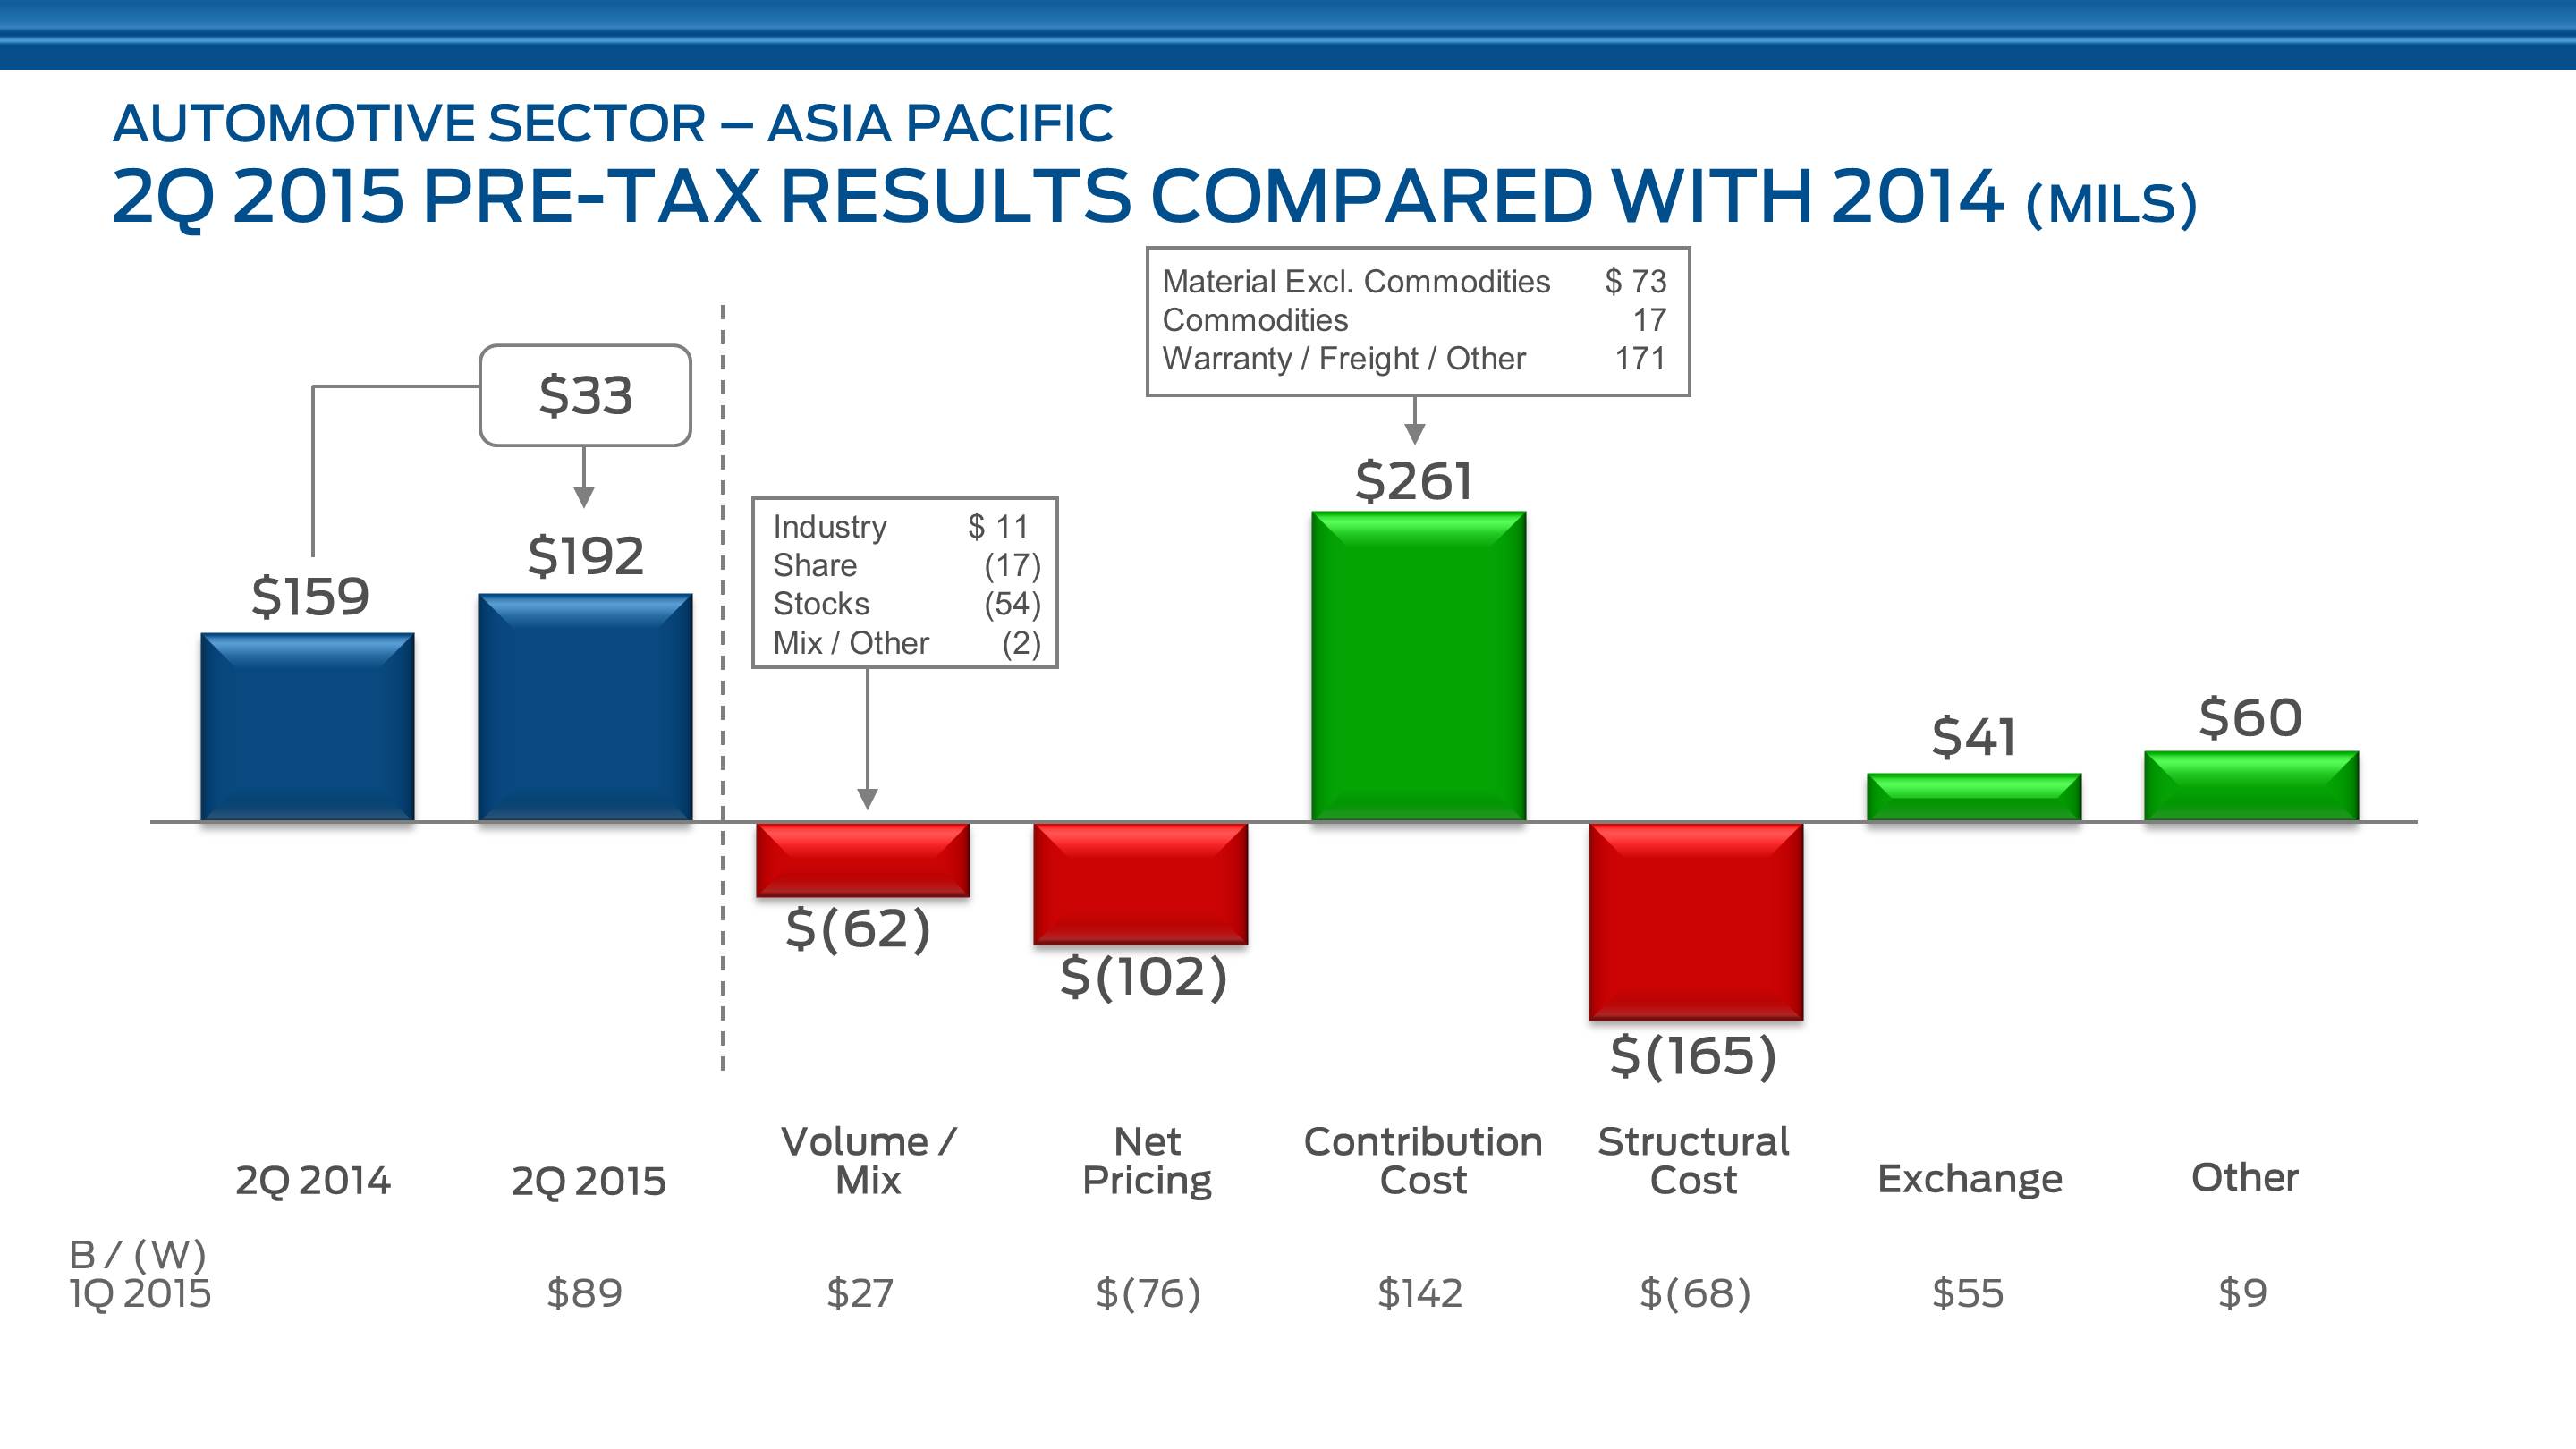
The improvement in Asia Pacific's second quarter 2015 pre-tax profit is more than explained by lower costs, specifically contribution costs, and favorable exchange.
As shown below the chart, our pre-tax profit improved compared with first quarter due to the same factors that drove the year-over-year improvement.
We are continuing our strategy to invest for growth in incremental capacity, new products, and Lincoln in China.
We continue to expect Asia Pacific to have a strong year, with top- and bottom-line results improving in the second half compared with the first half due to added capacity and new products, notably the recently launched all-new three-row Edge, as well as others to be launched in the second half including the all-new Taurus, Figo, Everest, and Lincoln MKX, as well as the new Ranger. New products will be important in an environment of increasing pricing pressure as China industry growth slows.
For the full year, we continue to expect pre-tax profit to be higher than 2014.
46
Item 2. Management's Discussion and Analysis of Financial Condition and Results of Operations (Continued)
FINANCIAL SERVICES SECTOR
In general, we measure period-to-period changes in Ford Credit's pre-tax results using the causal factors listed below:
• | Volume and Mix: |
◦ | Volume primarily measures changes in net financing margin driven by changes in average finance receivables and net investment in operating leases at prior period financing margin yield (defined below in financing margin) at prior period exchange rates. Volume changes are primarily driven by the volume of new and used vehicle sales and leases, the extent to which Ford Credit purchases retail installment sale and lease contracts, the extent to which Ford Credit provides wholesale financing, the sales price of the vehicles financed, the level of dealer inventories, Ford-sponsored special financing programs available exclusively through Ford Credit, and the availability of cost-effective funding for the purchase of retail installment sale and lease contracts and to provide wholesale financing. |
◦ | Mix primarily measures changes in net financing margin driven by period over period changes in the composition of Ford Credit's average managed receivables by product and by country or region. |
• Financing Margin:
◦ | Financing margin variance is the period-to-period change in financing margin yield multiplied by the present period average receivables at prior period exchange rates. This calculation is performed at the product and country level and then aggregated. Financing margin yield equals revenue, less interest expense and scheduled depreciation for the period, divided by average receivables for the same period. |
◦ | Financing margin changes are driven by changes in revenue and interest expense. Changes in revenue are primarily driven by the level of market interest rates, cost assumptions in pricing, mix of business, and competitive environment. Changes in interest expense are primarily driven by the level of market interest rates, borrowing spreads, and asset-liability management. |
• | Credit Loss: |
◦ | Credit loss measures changes in the provision for credit losses at prior period exchange rates. For analysis purposes, management splits the provision for credit losses primarily into net charge-offs and the change in the allowance for credit losses. |
◦ | Net charge-off changes are primarily driven by the number of repossessions, severity per repossession, and recoveries. Changes in the allowance for credit losses are primarily driven by changes in historical trends in credit losses and recoveries, changes in the composition and size of Ford Credit's present portfolio, changes in trends in historical used vehicle values, and changes in economic conditions. For additional information on the allowance for credit losses, refer to the "Critical Accounting Estimates - Allowance for Credit Losses" section of Item 7 of Part II of our 2014 Form 10-K Report. |
• | Lease Residual: |
◦ | Lease residual measures changes to residual performance at prior period exchange rates. For analysis purposes, management splits residual performance primarily into residual gains and losses, and the change in accumulated supplemental depreciation. |
◦ | Residual gain and loss changes are primarily driven by the number of vehicles returned to Ford Credit and sold, and the difference between the auction value and the depreciated value of the vehicles sold. Changes in accumulated supplemental depreciation are primarily driven by changes in Ford Credit's estimate of the number of vehicles that will be returned to it and sold, and changes in the estimate of the expected auction value at the end of the lease term. For additional information on accumulated supplemental depreciation, refer to the "Critical Accounting Estimates - Accumulated Depreciation on Vehicles Subject to Operating Leases" section of Item 7 of Part II of our 2014 Form 10-K Report. |
• | Exchange: |
◦ | Reflects changes in pre-tax results driven by the effects of converting functional currency income to U.S. dollars. |
• | Other: |
◦ | Primarily includes operating expenses, other revenue, and insurance expenses at prior period exchange rates. |
◦ | Changes in operating expenses are primarily driven by salaried personnel costs, facilities costs, and costs associated with the origination and servicing of customer contracts. |
◦ | In general, other revenue changes are primarily driven by changes in earnings related to market valuation adjustments to derivatives (primarily related to movements in interest rates), and other miscellaneous items. |
47
Item 2. Management's Discussion and Analysis of Financial Condition and Results of Operations (Continued)
Ford Credit. The chart below details the change in second quarter 2015 pre-tax results compared with second quarter 2014 by causal factor.
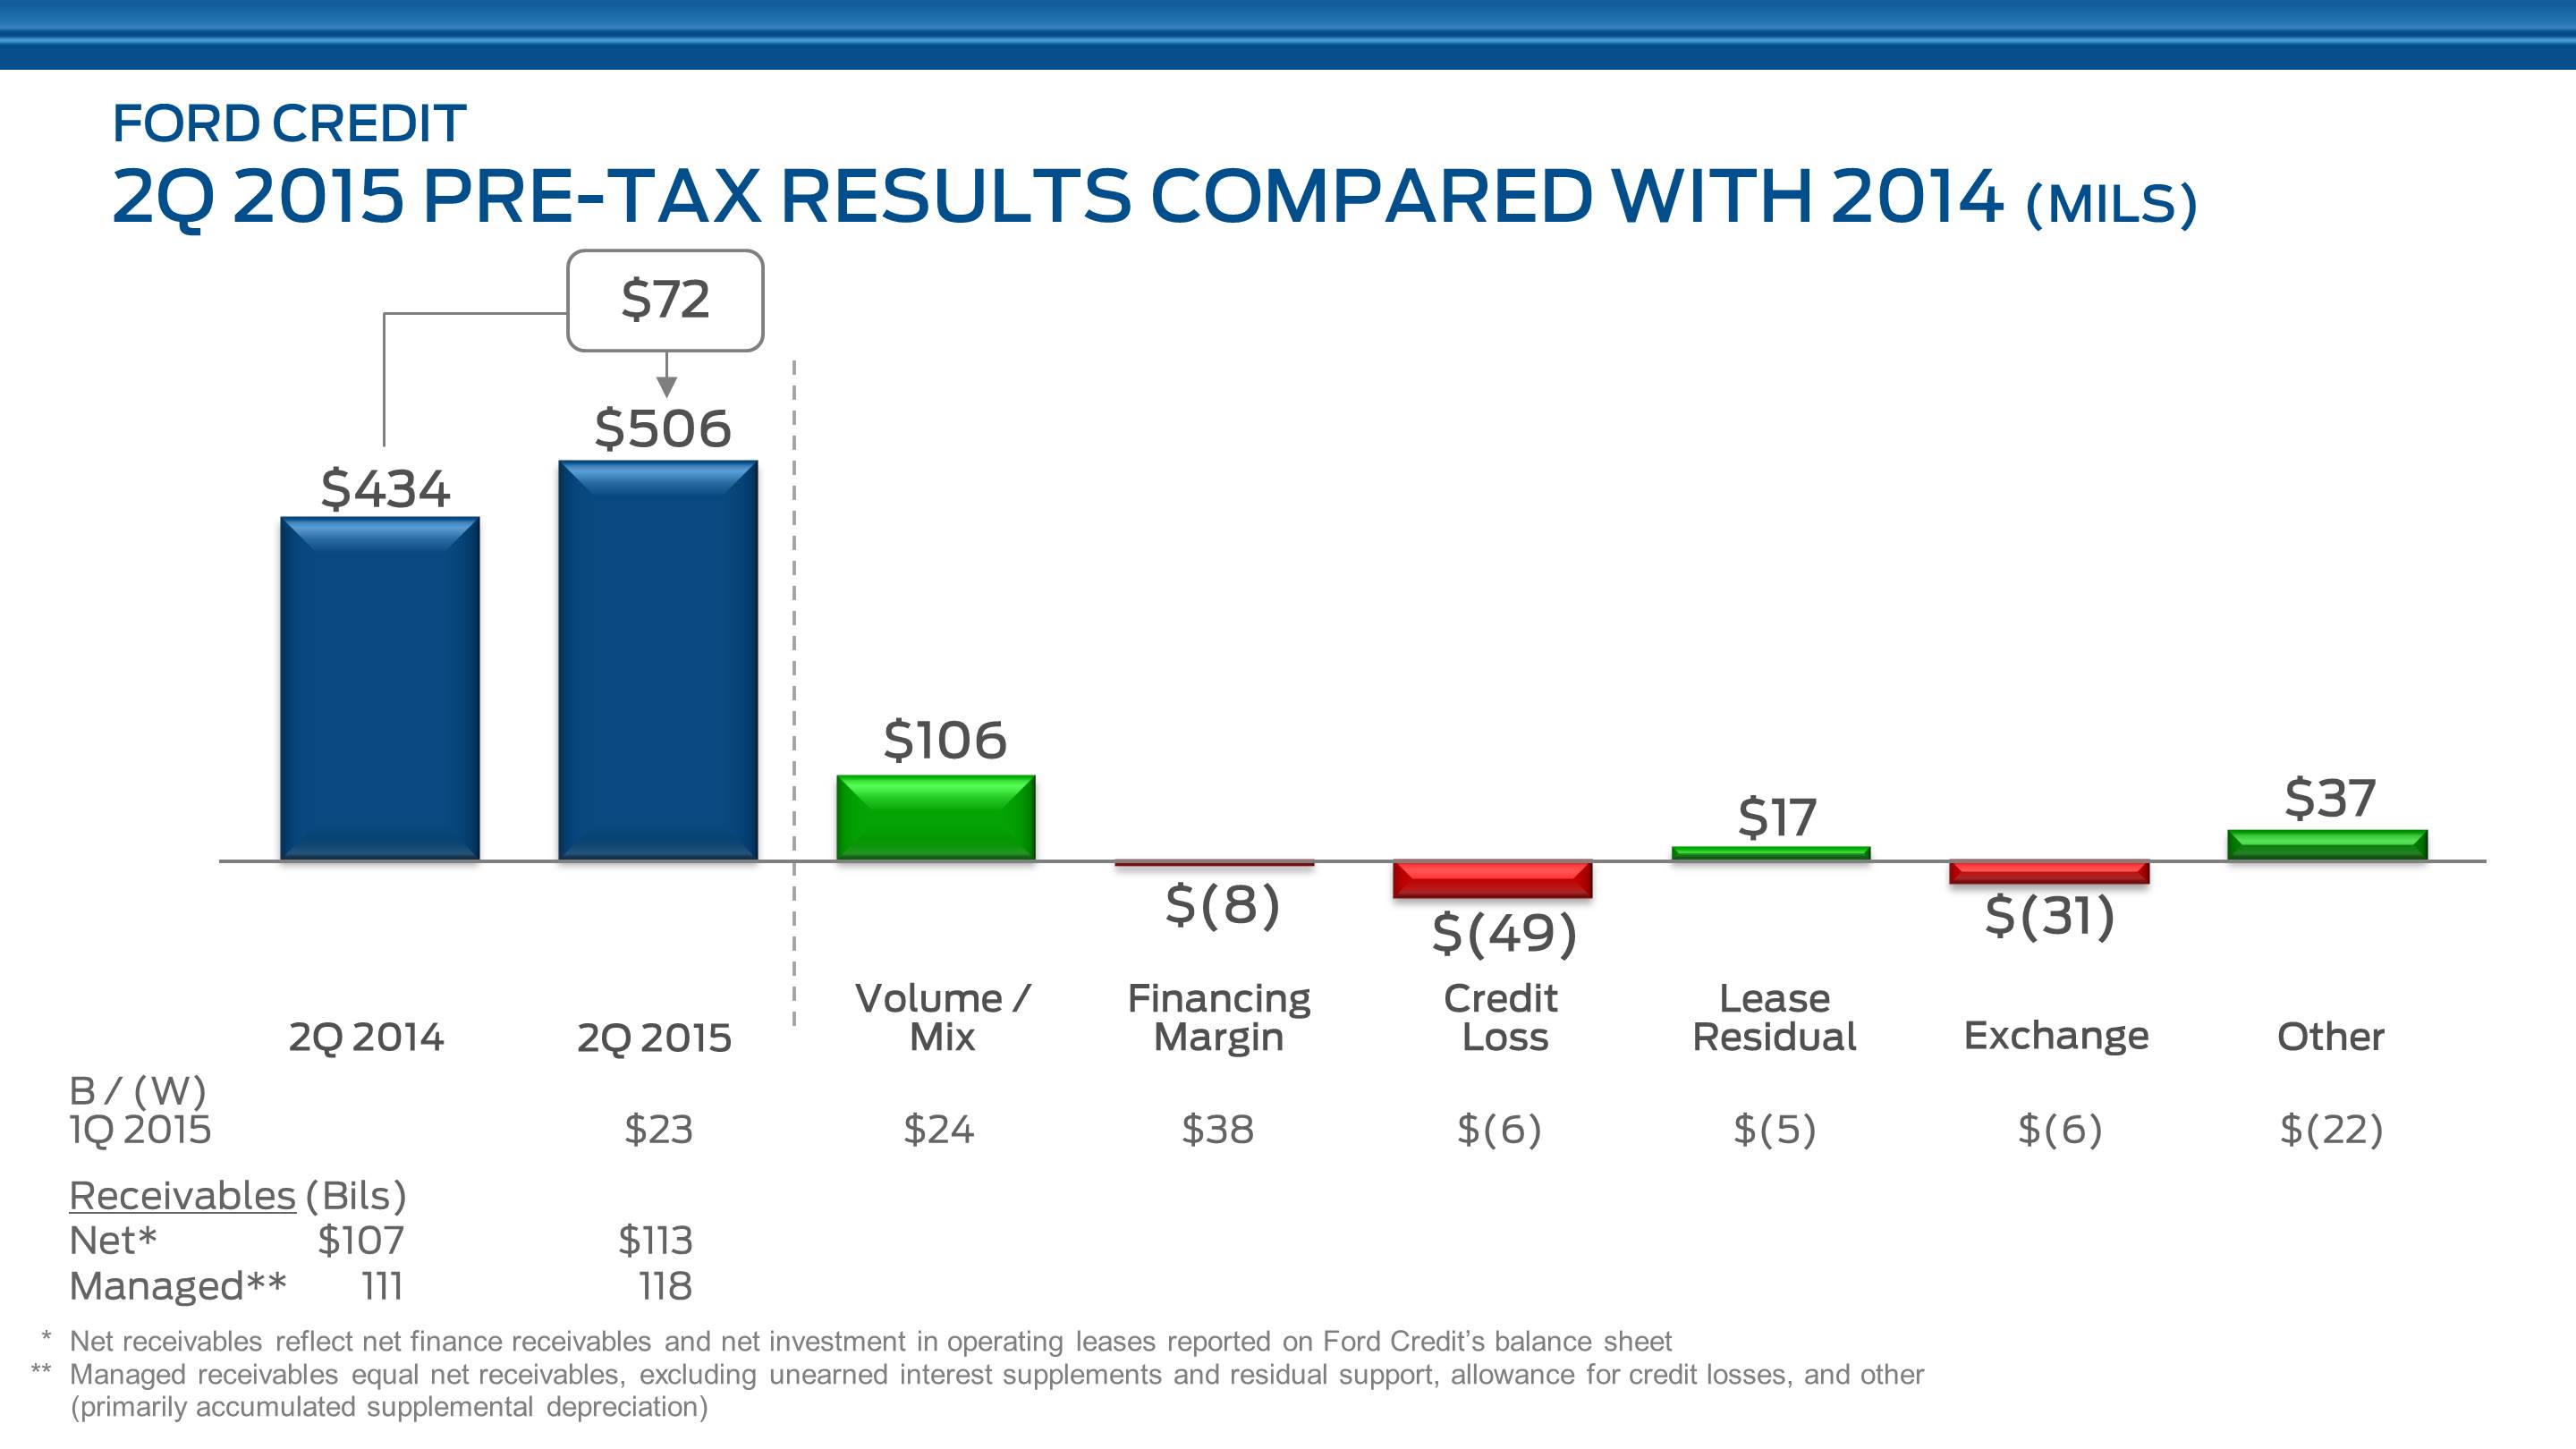
Second quarter pre-tax profit improved compared with a year ago as a result of favorable volume and mix, primarily reflecting higher consumer finance receivables globally and an increase in leasing in North America.
Ford Credit also benefited from the non-recurrence of unusually high insurance losses from storm damage to dealer inventory last year, included in other in the chart above.
Higher credit losses were a partial offset, reflecting an increase in the reserve and higher charge-offs in North America.
As shown below the chart, pre-tax profit was largely unchanged compared with the first quarter of 2015.
Ford Credit is a strategic asset that provides world-class financial services to our dealers and customers and is an integral part of our global growth strategy. It maintains a strong balance sheet that provides solid profits and distributions to Ford.
For the full year, we continue to expect Ford Credit pre-tax profit to be equal to or higher than 2014, year-end managed receivables of $123 billion to $128 billion, distributions of about $250 million, and year-end managed leverage at the upper end of our range of 8 to 9 to 1.
48
Item 2. Management's Discussion and Analysis of Financial Condition and Results of Operations (Continued)
Ford Credit's receivables, including finance receivables and operating leases, were as follows (in billions):
| June 30, 2015 |
| December 31, 2014 | ||||
Net Receivables |
|
|
| ||||
Finance receivables - North America |
|
|
| ||||
Consumer - Retail financing | $ | 45.2 | |
| $ | 44.1 | |
Non-Consumer |
| |
|
| | ||
Dealer financing (a) | 23.1 | |
| 22.5 | | ||
Other | 0.9 | |
| 1.0 | | ||
Total finance receivables - North America (b) | 69.2 | |
| 67.6 | | ||
Finance receivables - International |
|
|
| ||||
Consumer - Retail financing | 12.4 | |
| 11.8 | | ||
Non-Consumer |
|
|
| ||||
Dealer financing (a) | 9.6 | |
| 9.3 | | ||
Other | 0.4 | |
| 0.3 | | ||
Total finance receivables - International (b) | 22.4 | |
| 21.4 | | ||
Unearned interest supplements | (1.7 | ) |
| (1.8 | ) | ||
Allowance for credit losses | (0.4 | ) |
| (0.3 | ) | ||
Finance receivables, net | 89.5 | |
| 86.9 | | ||
Net investment in operating leases (b) | 23.4 | |
| 21.5 | | ||
Total net receivables | $ | 112.9 | |
| $ | 108.4 | |
|
| |
|
| | ||
Managed Receivables |
|
|
| ||||
Total net receivables | $ | 112.9 | |
| $ | 108.4 | |
Unearned interest supplements and residual support | 4.0 | |
| 3.9 | | ||
Allowance for credit losses | 0.4 | |
| 0.4 | | ||
Other, primarily accumulated supplemental depreciation | 0.3 | |
| 0.1 | | ||
Total managed receivables | $ | 117.6 | |
| $ | 112.8 | |
__________
(a) | Dealer financing primarily includes wholesale loans to dealers to finance the purchase of vehicle inventory. |
(b) | At June 30, 2015 and December 31, 2014, includes consumer receivables before allowance for credit losses of $26.9 billion and |
$24.4 billion, respectively, and non-consumer receivables before allowance for credit losses of $23.1 billion and $21.8 billion, respectively, that have been sold for legal purposes in securitization transactions but continue to be reported in Ford Credit's financial statements. In addition, at June 30, 2015 and December 31, 2014, includes net investment in operating leases before allowance for credit losses of $11.9 billion and $9.6 billion, respectively, that have been included in securitization transactions but continue to be reported in Ford Credit's financial statements. The receivables and net investment in operating leases are available only for payment of the debt issued by, and other obligations of, the securitization entities that are parties to those securitization transactions; they are not available to pay Ford Credit's other obligations or the claims of its other creditors. Ford Credit holds the right to receive the excess cash flows not needed to pay the debt issued by, and other obligations of, the securitization entities that are parties to those securitization transactions.
Managed receivables at June 30, 2015 increased from year-end 2014. Ford Credit had growth in all products in all geographic segments, which was offset partially by the exchange rate impact of a strong U.S. dollar.
49
Item 2. Management's Discussion and Analysis of Financial Condition and Results of Operations (Continued)
LIQUIDITY AND CAPITAL RESOURCES
Automotive Sector
Our Automotive liquidity strategy includes ensuring that we have sufficient liquidity available with a high degree of certainty throughout the business cycle by generating cash from operations and maintaining access to other sources of funding. We target to have an average ongoing Automotive gross cash balance of about $20 billion. We expect to have periods when we will be above or below this amount due to (i) future cash flow expectations such as for pension contributions, debt maturities, capital investments, or restructuring requirements, (ii) short-term timing differences, and (iii) changes in the global economic environment. In addition, we also target to maintain a revolving credit facility for our Automotive business of about $10 billion to protect against exogenous shocks. Our revolving credit facility is discussed below.
We assess the appropriate long-term target for total Automotive liquidity, comprised of Automotive gross cash and the revolving credit facility, to be about $30 billion, which is an amount we believe is sufficient to support our business priorities and to protect our business. Our Automotive gross cash and Automotive liquidity targets could be reduced over time based on improved operating performance and changes in our risk profile.
For a discussion of risks to our liquidity, see "Item 1A. Risk Factors," in our 2014 Form 10-K Report, as well as Note 20 of the Notes to the Financial Statements, regarding commitments and contingencies that could impact our liquidity.
Our key liquidity metrics are Automotive gross cash, Automotive liquidity, and operating-related cash flow (which best represents the ability of our Automotive operations to generate cash).
Automotive gross cash includes cash and cash equivalents and marketable securities, net of any securities-in-transit. Automotive gross cash is detailed below as of the dates shown (in billions):
| June 30, 2015 |
| March 31, 2015 |
| December 31, 2014 |
| June 30, 2014 | ||||||||
Cash and cash equivalents | $ | 6.1 | |
| $ | 5.1 | |
| $ | 4.6 | |
| $ | 4.7 | |
Marketable securities | 14.6 | |
| 14.4 | |
| 17.1 | |
| 21.1 | | ||||
Total cash and marketable securities | 20.7 | |
| 19.5 | |
| 21.7 | |
| 25.8 | | ||||
Securities-in-transit (a) | - | |
| - | |
| - | |
| - | | ||||
Automotive gross cash | $ | 20.7 | |
| $ | 19.5 | |
| $ | 21.7 | |
| $ | 25.8 | |
__________
(a) | The purchase or sale of marketable securities for which the cash settlement was not made by period-end and a payable or receivable was recorded on the balance sheet. |
Our cash, cash equivalents, and marketable securities are held primarily in highly liquid investments, which provide for anticipated and unanticipated cash needs. Our cash, cash equivalents, and marketable securities primarily include U.S. Department of Treasury obligations, federal agency securities, bank time deposits with investment-grade institutions, corporate investment-grade securities, commercial paper rated A-1/P-1 or higher, and debt obligations of a select group of non-U.S. governments, non-U.S. governmental agencies, and supranational institutions. The average maturity of these investments ranges from about 90 days to up to about one year, and is adjusted based on market conditions and liquidity needs. We monitor our cash levels and average maturity on a daily basis. Of our total Automotive gross cash at June 30, 2015, 84% was held by consolidated entities domiciled in the United States.
Automotive gross cash and liquidity as of the dates shown were as follows (in billions):
| June 30, |
| December 31, 2014 |
| June 30, 2014 | ||||||
Automotive gross cash | $ | 20.7 | |
| $ | 21.7 | |
| $ | 25.8 | |
Available credit lines |
|
|
| |
|
| | ||||
Revolving credit facility, unutilized portion | 10.4 | |
| 10.1 | |
| 10.1 | | |||
Local lines available to foreign affiliates, unutilized portion | 0.6 | |
| 0.6 | |
| 0.8 | | |||
Automotive liquidity | $ | 31.7 | |
| $ | 32.4 | |
| $ | 36.7 | |
In managing our business, we classify changes in Automotive gross cash into operating-related and other items (which includes the impact of certain special items, contributions to funded pension plans, certain tax-related transactions, acquisitions and divestitures, capital transactions with the Financial Services sector, dividends paid to shareholders, and other-primarily financing-related).
50
Item 2. Management's Discussion and Analysis of Financial Condition and Results of Operations (Continued)
We believe the cash flow analysis reflected in the table below is useful to investors because it includes in operating-related cash flow elements that we consider to be related to our Automotive operating activities (e.g., capital spending) and excludes cash flow elements that we do not consider to be related to the ability of our operations to generate cash. This differs from a cash flow statement prepared in accordance with GAAP and differs from Net cash provided by/(used in) operating activities , the most directly comparable GAAP financial measure.
Changes in Automotive gross cash are summarized below (in billions):
| Second Quarter |
| First Half | ||||||||||||
| 2015 |
| 2014 |
| 2015 |
| 2014 | ||||||||
Automotive gross cash at end of period | $ | 20.7 | |
| $ | 25.8 | |
| $ | 20.7 | |
| $ | 25.8 | |
Automotive gross cash at beginning of period | 19.5 | |
| 25.2 | |
| 21.7 | |
| 24.8 | | ||||
Change in Automotive gross cash | $ | 1.2 | |
| $ | 0.6 | |
| $ | (1.0 | ) |
| $ | 1.0 | |
|
|
|
|
|
|
|
| ||||||||
Automotive pre-tax profits (excluding special items) | $ | 2.4 | |
| $ | 2.2 | |
| $ | 3.3 | |
| $ | 3.1 | |
Capital spending | (1.7 | ) |
| (1.9 | ) |
| (3.5 | ) |
| (3.4 | ) | ||||
Depreciation and tooling amortization | 1.0 | |
| 1.0 | |
| 2.1 | |
| 2.0 | | ||||
Changes in working capital (a) | (0.6 | ) |
| (0.7 | ) |
| 0.2 | |
| 1.0 | | ||||
Other/Timing differences (b) | 0.8 | |
| 2.0 | |
| 0.3 | |
| 1.1 | | ||||
Automotive operating-related cash flows | 1.9 | |
| 2.6 | |
| 2.4 | |
| 3.8 | | ||||
|
|
|
|
|
|
|
| ||||||||
Separation payments | (0.1 | ) |
| (0.1 | ) |
| (0.5 | ) |
| (0.1 | ) | ||||
Net receipts from Financial Services sector (c) | - | |
| - | |
| - | |
| 0.2 | | ||||
Other | - | |
| 0.1 | |
| (0.3 | ) |
| 0.1 | | ||||
Cash flow before other actions | 1.8 | |
| 2.6 | |
| 1.6 | |
| 4.0 | | ||||
|
|
|
|
|
|
|
| ||||||||
Changes in debt | 0.2 | |
| (0.4 | ) |
| (0.4 | ) |
| (0.4 | ) | ||||
Funded pension contributions | (0.1 | ) |
| (0.3 | ) |
| (0.9 | ) |
| (0.8 | ) | ||||
Dividends/Other items | (0.7 | ) |
| (1.3 | ) |
| (1.3 | ) |
| (1.8 | ) | ||||
Change in Automotive gross cash | $ | 1.2 | |
| $ | 0.6 | |
| $ | (1.0 | ) |
| $ | 1.0 | |
_________
(a) | Working capital comprised of changes in receivables, inventory, and trade payables. |
(b) | Primarily expense and payment timing differences for items such as pension and OPEB, compensation, marketing, warranty, and timing differences between unconsolidated affiliate profits and dividends received. Also includes other factors, such as the impact of tax payments and vehicle financing activities between Automotive and FSG sectors. |
(c) | Primarily distributions from Ford Holdings (Ford Credit's parent) and tax payments received from Ford Credit. |
With respect to "Changes in working capital," in general we carry relatively low Automotive sector trade receivables compared with our trade payables because the majority of our Automotive wholesales are financed (primarily by Ford Credit) immediately upon sale of vehicles to dealers, which generally occurs at the time the vehicles are gate-released shortly after being produced. In addition, our inventories are lean because we build to order, not for inventory. In contrast, our Automotive trade payables are based primarily on industry-standard production supplier payment terms generally ranging between 30 days to 45 days. As a result, our cash flow tends to improve as wholesale volumes increase, but can deteriorate significantly when wholesale volumes drop sharply. In addition, these working capital balances generally are subject to seasonal changes that can impact cash flow. For example, we typically experience cash flow timing differences associated with inventories and payables due to our annual summer and December shutdown periods, when production, and therefore inventories and wholesale volumes, are usually at their lowest levels, while payables continue to come due and be paid. The net impact of this typically results in cash outflows from changes in our working capital balances during these shutdown periods.
51
Item 2. Management's Discussion and Analysis of Financial Condition and Results of Operations (Continued)
Shown below is a reconciliation between financial statement Net cash provided by/(used in) operating activities and operating-related cash flows (calculated as shown in the table above), as of the dates shown (in billions):
|
|
|
|
|
|
|
|
| Memo: | ||||||||||
| Second Quarter |
| First Half |
| Full Year | ||||||||||||||
| 2015 |
| 2014 |
| 2015 |
| 2014 |
| 2014 | ||||||||||
Net cash provided by/(used in) operating activities | $ | 3.5 | |
| $ | 4.1 | |
| $ | 4.5 | |
| $ | 6.1 | |
| $ | 8.8 | |
Items included in operating-related cash flows |
| |
|
| |
|
| |
|
|
|
| | ||||||
Capital spending | (1.7 | ) |
| (1.9 | ) |
| (3.5 | ) |
| (3.4 | ) |
| (7.4 | ) | |||||
Proceeds from the exercise of stock options | - | |
| - | |
| 0.1 | |
| 0.1 | |
| 0.2 | | |||||
Net cash flows from non-designated derivatives | (0.1 | ) |
| 0.1 | |
| - | |
| 0.1 | |
| 0.2 | | |||||
Items not included in operating-related cash flows |
|
|
| |
|
|
|
| |
|
| | |||||||
Separation payments | 0.1 | |
| 0.1 | |
| 0.5 | |
| 0.1 | |
| 0.2 | | |||||
Funded pension contributions | 0.1 | |
| 0.3 | |
| 0.9 | |
| 0.8 | |
| 1.5 | | |||||
Tax refunds, tax payments, and tax receipts from affiliates | - | |
| - | |
| - | |
| (0.2 | ) |
| (0.2 | ) | |||||
Other | - | |
| (0.1 | ) |
| (0.1 | ) |
| 0.2 | |
| 0.3 | | |||||
Operating-related cash flows | $ | 1.9 | |
| $ | 2.6 | |
| $ | 2.4 | |
| $ | 3.8 | |
| $ | 3.6 | |
Credit Agreement . Lenders under our Third Amended and Restated Credit Agreement dated as of April 30, 2015 (the "revolving credit facility") have commitments to us totaling $13.4 billion, with 75% of the commitments maturing on April 30, 2020 and 25% of the commitments maturing on April 30, 2018. We have allocated $3 billion of commitments to Ford Credit on an irrevocable and exclusive basis to support its growth and liquidity. Any borrowings by Ford Credit under the revolving credit facility would be guaranteed by us.
The revolving credit facility is unsecured and free of material adverse change conditions to borrowing, restrictive financial covenants (for example, interest or fixed charge coverage ratio, debt-to-equity ratio, and minimum net worth requirements), and credit rating triggers that could limit our ability to obtain funding. The revolving credit facility contains a liquidity covenant that requires us to maintain a minimum of $4 billion in aggregate of domestic cash, cash equivalents, and loaned and marketable securities and/or availability under the revolving credit facility. If our senior, unsecured, long-term debt does not maintain at least two investment grade ratings from Fitch, Moody's, and S&P (each as defined under "Total Company" below), the guarantees of certain subsidiaries will be required.
At June 30, 2015, the utilized portion of the revolving credit facility was $49 million, representing amounts utilized for letters of credit.
Other Automotive Credit Facilities. At June 30, 2015, we had about $1.5 billion of local credit facilities available to non-U.S. Automotive affiliates, of which $860 million had been utilized.
Net Cash. Our Automotive sector net cash calculation as of the dates shown was as follows (in billions):
| June 30, 2015 |
| December 31, 2014 | ||||
Automotive gross cash | $ | 20.7 | |
| $ | 21.7 | |
Less: |
| |
|
| | ||
Long-term debt | 11.5 | |
| 11.3 | | ||
Debt payable within one year | 2.2 | |
| 2.5 | | ||
Total debt | 13.7 | |
| 13.8 | | ||
Net cash | $ | 7.0 | |
| $ | 7.9 | |
52
Item 2. Management's Discussion and Analysis of Financial Condition and Results of Operations (Continued)
Total Automotive debt at June 30, 2015 was $100 million lower than it was at December 31, 2014. The reduction primarily reflects debt repayments, offset partially by the addition of the external debt of our Ford Sollers joint venture as a result of the consolidation of the joint venture on March 31, 2015 and higher local funding in Brazil.
We continue to work toward achieving our Automotive debt target of about $10 billion by 2018. We plan to reduce Automotive debt from current levels by using cash from operations to make scheduled debt repayments.
Liquidity Sufficiency . One of the four key priorities of our One Ford plan is to finance our plan and improve our balance sheet, while at the same time having resources available to grow our business. Based on our planning assumptions, we believe that we have sufficient liquidity and capital resources to continue to invest in new products that customers want and value, transform and grow our business, pay our debts and obligations as and when they come due, pay a sustainable dividend, and provide protection within an uncertain global economic environment.
Based on expected cash flows and the identification of additional opportunities for profitable growth, the ongoing amount of capital spending to support product development, growth, restructuring, and infrastructure is expected to increase to about $9 billion annually by 2020. Our capital spending was $7.4 billion and $6.6 billion in 2014 and 2013, respectively, and is expected to be about $7.5 billion in 2015.
We will continue to work to strengthen further our balance sheet and improve our investment grade ratings; the amount of incremental capital required to do this will diminish over time as we work toward achieving our Automotive debt target and fully fund and de-risk our global funded pension plans.
Financial Services Sector
Ford Credit
Funding Overview. Ford Credit's funding strategy remains focused on diversification, and it plans to continue accessing a variety of markets, channels, and investors.
Ford Credit's liquidity profile continues to be diverse, robust, and focused on maintaining liquidity levels that meet its business and funding requirements. Ford Credit regularly stress tests its balance sheet and liquidity to ensure that it continues to meet its financial obligations through economic cycles.
Public Term Funding Plan. The following table shows Ford Credit's planned issuances for full year 2015, its global public term funding issuances through July 27, 2015, and for full year 2014 and 2013 (in billions), excluding short-term funding programs:
| Public Term Funding Plan | ||||||||||||
| 2015 |
|
|
|
| ||||||||
| Full-Year Forecast |
| Through July 27 |
| Full-Year 2014 |
| Full-Year 2013 | ||||||
Unsecured | $ 12-15 |
| $ | 8 | |
| $ | 13 | |
| $ | 11 | |
Securitizations (a) | 13-16 |
| 9 | |
| 15 | |
| 14 | | |||
Total | $ 25-31 |
| $ | 17 | |
| $ | 28 | |
| $ | 25 | |
(a) | Includes Rule 144A offerings. |
Through June 30, 2015, Ford Credit completed about $17 billion of funding in the public term markets, consisting of about $8 billion of unsecured debt in the United States, Canada, and Europe and about $9 billion of public asset-backed security ("ABS") debt in the United States, Europe, and China.
For 2015, the forecasted ranges are consistent with prior guidance.
53
Item 2. Management's Discussion and Analysis of Financial Condition and Results of Operations (Continued)
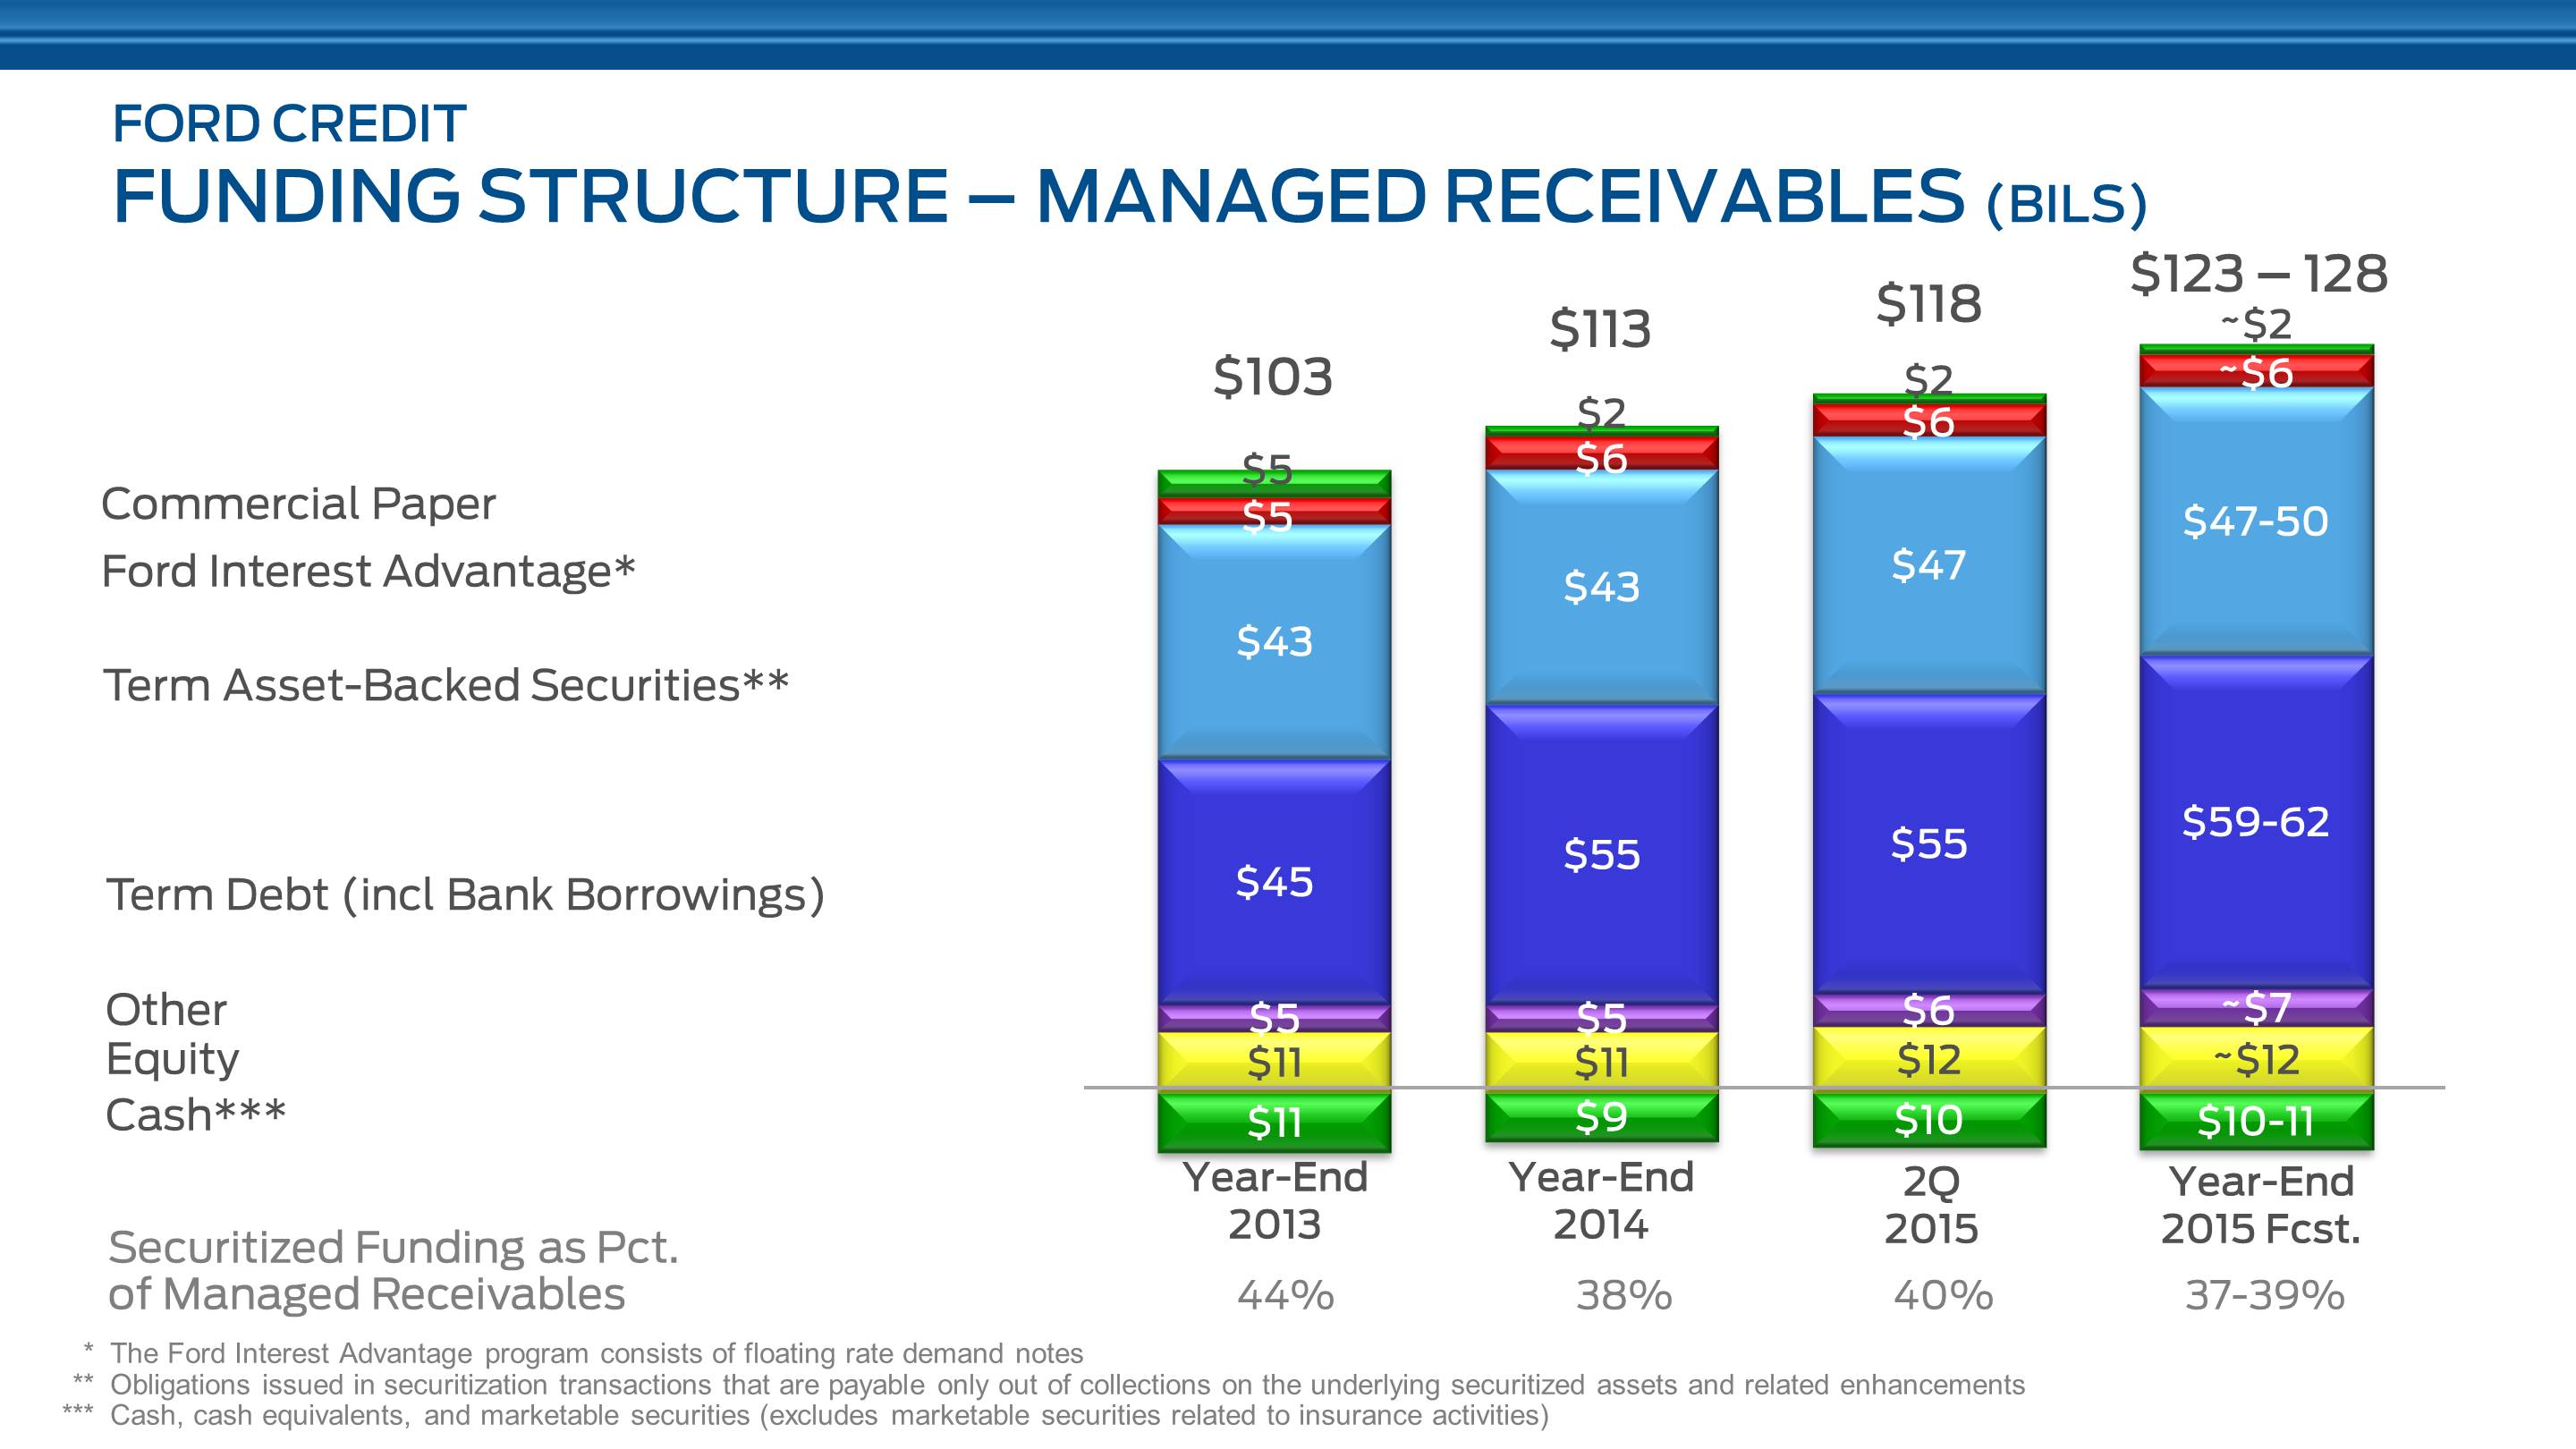
The chart above shows the trends in funding for Ford Credit's managed receivables.
At the end of the second quarter of 2015, managed receivables were $118 billion, and Ford Credit ended the quarter with $10 billion in cash. Securitized funding was 40% of managed receivables .
Ford Credit is projecting 2015 year-end managed receivables of $123 billion to $128 billion and securitized funding as a percentage of managed receivables in the range of 37% to 39%. Ford Credit continues to expect this percentage to decline over time.
Liquidity. The following table illustrates Ford Credit's liquidity programs and utilization (in billions):
| June 30, 2015 |
| December 31, 2014 | ||||
Liquidity Sources |
|
|
| ||||
Cash (a) | $ | 10.0 | |
| $ | 8.9 | |
Committed ABS lines (b) | 31.8 | |
| 33.7 | | ||
FCE/Other unsecured credit facilities | 2.0 | |
| 1.6 | | ||
Ford revolving credit facility allocation | 3.0 | |
| 2.0 | | ||
Total liquidity sources | 46.8 | |
| 46.2 | | ||
|
|
|
| ||||
Utilization of Liquidity |
|
|
| ||||
Securitization cash (c) | (2.7 | ) |
| (2.4 | ) | ||
Committed ABS lines | (16.5 | ) |
| (15.3 | ) | ||
FCE/Other unsecured credit facilities | (0.5 | ) |
| (0.4 | ) | ||
Ford revolving credit facility allocation | - | |
| - | | ||
Total utilization of liquidity | (19.7 | ) |
| (18.1 | ) | ||
Gross liquidity | 27.1 | |
| 28.1 | | ||
Adjustments (d) | (0.5 | ) |
| (1.6 | ) | ||
Net liquidity available for use | $ | 26.6 | |
| $ | 26.5 | |
__________
(a) | Cash, cash equivalents, and marketable securities (excludes marketable securities related to insurance activities). |
(b) | Committed ABS lines are subject to availability of sufficient assets, ability to obtain derivatives to manage interest rate risk, and exclude FCE access to the Bank of England's Discount Window Facility. |
(c) | Used only to support on-balance sheet securitization transactions. |
(d) | Adjustments include other committed ABS lines in excess of eligible receivables and certain cash within FordREV available through future sales of receivables. |
54
Item 2. Management's Discussion and Analysis of Financial Condition and Results of Operations (Continued)
As of June 30, 2015, Ford Credit's liquidity remains strong at $26.6 billion, an increase of $100 million from year end 2014. Ford Credit's sources of liquidity include cash, committed asset-backed lines, unsecured credit facilities, and the corporate revolver allocation.
As of June 30, 2015, Ford Credit's liquidity sources including cash totaled $46.8 billion, up $600 million from year end. Ford Credit is focused on maintaining a strong liquidity position to meet its business and funding requirements through economic cycles .
Leverage. Ford Credit uses leverage, or the debt-to-equity ratio, to make various business decisions, including evaluating and establishing pricing for finance receivable and operating lease financing, and assessing its capital structure. Ford Credit refers to its shareholder's interest as equity.
The following table shows the calculation of Ford Credit's financial statement leverage (in billions, except for ratios):
| June 30, 2015 |
| December 31, 2014 | ||||
Total debt (a) | $ | 109.5 | |
| $ | 105.0 | |
Equity | 11.7 | |
| 11.4 | | ||
Financial statement leverage (to 1) | 9.3 | |
| 9.2 | | ||
__________
(a) | Includes debt issued in securitization transactions and payable only out of collections on the underlying securitized assets and related enhancements. Ford Credit holds the right to receive the excess cash flows not needed to pay the debt issued by, and other obligations of, the securitization entities that are parties to those securitization transactions. |
The following table shows the calculation of Ford Credit's managed leverage (in billions, except for ratios):
| June 30, 2015 |
| December 31, 2014 | ||||
Total debt (a) | $ | 109.5 | |
| $ | 105.0 | |
Adjustments for cash (b) | (10.0 | ) |
| (8.9 | ) | ||
Adjustments for derivative accounting (c) | (0.4 | ) |
| (0.4 | ) | ||
Total adjusted debt | $ | 99.1 | |
| $ | 95.7 | |
|
|
|
| ||||
Equity | $ | 11.7 | |
| $ | 11.4 | |
Adjustments for derivative accounting (c) | (0.3 | ) |
| (0.4 | ) | ||
Total adjusted equity | $ | 11.4 | |
| $ | 11.0 | |
Managed leverage (to 1) (d) | 8.7 | |
| 8.7 | | ||
__________
(a) | Includes debt issued in securitization transactions and payable only out of collections on the underlying securitized assets and related enhancements. Ford Credit holds the right to receive the excess cash flows not needed to pay the debt issued by, and other obligations of, the securitization entities that are parties to those securitization transactions. |
(b) | Cash, cash equivalents, and marketable securities (excludes marketable securities related to insurance activities). |
(c) | Primarily related to market valuation adjustments to derivatives due to movements in interest rates. Adjustments to debt are related to designated fair value hedges and adjustments to equity are related to retained earnings. |
(d) | Equals total adjusted debt over total adjusted equity. |
Ford Credit plans its managed leverage by considering prevailing market conditions and the risk characteristics of its business. At June 30, 2015, Ford Credit's managed leverage was 8.7:1 , unchanged from December 31, 2014.
55
Item 2. Management's Discussion and Analysis of Financial Condition and Results of Operations (Continued)
Total Company
Equity. At June 30, 2015 , Total equity attributable to Ford Motor Company was $26.3 billion, an increase of $1.5 billion compared with December 31, 2014 . The increase primarily reflects favorable changes in Retained earnings of $1.6 billion related to first half 2015 Net income attributable to Ford Motor Company of $2.8 billion, net of cash dividends declared of $1.2 billion; offset by changes in Treasury Stock of $91 million related to stock repurchases.
Credit Ratings. Our short-term and long-term debt is rated by four credit rating agencies designated as nationally recognized statistical rating organizations ("NRSROs") by the U.S. Securities and Exchange Commission:
• | DBRS Limited ("DBRS"); |
• | Fitch, Inc. ("Fitch"); |
• | Moody's Investors Service, Inc. ("Moody's"); and |
• | Standard & Poor's Ratings Services, a division of McGraw Hill Financial ("S&P"). |
In several markets, locally-recognized rating agencies also rate us. A credit rating reflects an assessment by the rating agency of the credit risk associated with a corporate entity or particular securities issued by that entity. Rating agencies' ratings of us are based on information provided by us and other sources. Credit ratings assigned to us from all of the NRSROs are closely associated with their opinions on Ford. Credit ratings are not recommendations to buy, sell, or hold securities, and are subject to revision or withdrawal at any time by the assigning rating agency. Each rating agency may have different criteria for evaluating company risk and, therefore, ratings should be evaluated independently for each rating agency.
The following rating actions have been taken by these NRSROs since the filing of our Quarterly Report on Form 10-Q for the quarter ended March 31, 2015:
• | On July 20, 2015, Fitch affirmed its ratings for Ford and Ford Credit, and maintained a positive outlook for both. |
• | On June 30, 2015, Moody's affirmed its rating for Ford and maintained a stable outlook. |
The following chart summarizes certain of the credit ratings and outlook presently assigned by these four NRSROs:
| NRSRO RATINGS | ||||||||||||
| Ford |
| Ford Credit |
| NRSROs | ||||||||
| Issuer Default / Corporate / Issuer Rating |
| Long-Term Senior Unsecured |
| Outlook / Trend |
| Long-Term Senior Unsecured |
| Short-Term Unsecured |
| Outlook / Trend |
| Minimum Long-Term Investment Grade Rating |
DBRS | BBB (low) |
| BBB (low) |
| Stable |
| BBB (low) |
| R-3 |
| Stable |
| BBB (low) |
Fitch | BBB- |
| BBB- |
| Positive |
| BBB- |
| F3 |
| Positive |
| BBB- |
Moody's | N/A |
| Baa3 |
| Stable |
| Baa3 |
| P-3 |
| Stable |
| Baa3 |
S&P * | BBB- |
| BBB- |
| Stable |
| BBB- |
| A-3 |
| Stable |
| BBB- |
__________
* | S&P assigns FCE Bank plc ("FCE") a long-term senior unsecured credit rating of BBB, a one-notch higher rating than Ford and Ford Credit, with a stable outlook. |
PRODUCTION VOLUMES
Our second quarter 2015 production volumes and third quarter 2015 projected production volumes are as follows (in thousands):
|
| 2015 | ||||||||||
|
| Second Quarter Actual |
| Third Quarter Forecast | ||||||||
|
| Units |
| O/(U) 2014 |
| Units |
| O/(U) 2014 | ||||
North America |
| 815 | |
| 13 | |
| 825 | |
| 130 | |
South America |
| 94 | |
| (9 | ) |
| 90 | |
| (7 | ) |
Europe |
| 403 | |
| 1 | |
| 375 | |
| 49 | |
Middle East & Africa |
| 23 | |
| 3 | |
| 20 | |
| - | |
Asia Pacific |
| 362 | |
| (3 | ) |
| 370 | |
| 18 | |
Total |
| 1,697 | |
| 5 | |
| 1,680 | |
| 190 | |
56
Item 2. Management's Discussion and Analysis of Financial Condition and Results of Operations (Continued)
OUTLOOK
Business Environment
We continue to expect this year to be one of growth globally with GDP expanding in the 2.5% to 3% range. This will be driven by the United States, improved growth in the Euro Area, with the United Kingdom continuing to perform at a higher level, and continued growth in China, although at levels lower than in recent years. The U.S. dollar is expected to remain strong against most major currencies, and commodity prices, including oil, are expected to stabilize but remain at low levels. Two areas of concern are South America, particularly Brazil, and Russia. Low commodity prices and policy uncertainty continue to generate difficult conditions in these markets. We also are closely watching the slower growth in China and ensuring that we continue to respond appropriately to changes in the pricing environment and matching our production with demand. All in all, we now see conditions as being supportive of global automotive industry sales in the 86 million to 89 million unit range in 2015, essentially about flat compared with 2014.
2015 Planning Assumptions and Key Metrics
Based on the current economic environment, our planning assumptions and key metrics for 2015 include the following:
|
| Memo: | |||||||||||
| 2014 |
| 2015 |
| 2015 | ||||||||
| Full Year |
| Full Year |
| First Half | ||||||||
| Results |
| Plan |
| Outlook |
| Results | ||||||
Planning Assumptions (Mils.) |
|
|
|
|
|
|
|
|
| ||||
Industry Volume -- U.S. | 16.8 | |
|
| 17.0 - 17.5 |
| On Track |
| 17.3 | |
| ||
-- Europe 20 | 14.6 | |
|
| 14.8 - 15.3 |
| 15.7 - 16.2 |
| 15.7 | |
| ||
-- China | 24.0 | |
|
| 24.5 - 26.5 |
| 23.0 - 24.0 |
| 23.8 | |
| ||
|
|
|
|
|
|
|
|
|
| ||||
Key Metrics |
|
|
|
|
|
|
|
|
| ||||
Automotive (Compared with 2014): |
|
|
|
|
|
|
|
|
| ||||
- Revenue (Bils.) | $ | 135.8 | |
|
| Higher |
| On Track |
| $ | 66.9 | |
|
|
|
|
|
|
|
|
|
|
| ||||
- Operating Margin | 3.9 | | % |
| Higher |
| On Track |
| 5.5 | | % | ||
|
|
|
|
|
|
|
|
|
| ||||
- Operating-Related Cash Flow (Bils.) (a) | $ | 3.6 | |
|
| Higher |
| On Track |
| $ | 2.4 | |
|
|
|
|
|
|
|
|
|
|
| ||||
Ford Credit (Compared with 2014): |
|
|
|
|
|
|
|
|
| ||||
- Pre-Tax Profit (Bils.) | $ | 1.9 | |
|
| Equal To Or Higher |
| On Track |
| $ | 1.0 | |
|
|
|
|
|
|
|
|
|
|
| ||||
Total Company: |
|
|
|
|
|
|
|
|
| ||||
- Pre-Tax Profit (Bils.) (a) | $ | 6.3 | |
|
| $8.5 - $9.5 |
| On Track |
| $ | 4.3 | |
|
__________
(a) | Excludes special items; reconciliation to GAAP provided in "Results of Operations" and "Liquidity and Capital Resources" above |
We expect this year to be a very strong one for Ford Motor Company.
In terms of industry sales outlook, we are raising our guidance for Europe 20, while reducing our guidance for China. Industry sales in the United States still look to be on track for 17 million to 17.5 million units.
All of our other financial guidance at the Company level remains on track. We expect growth in Automotive revenue compared with 2014, higher Automotive operating margin, higher positive operating-related cash flow, equal or higher results at Ford Credit, and a total Company pre-tax profit, excluding special items, of $8.5 billion to $9.5 billion.
We continue to expect our results in the second half of 2015 to be stronger than the first half of the year.
We expect our operating effective tax rate for the third quarter of 2015 to be about 34%, and we continue to expect the rate for the full year to be about equal to or higher than our 2014 rate of 26%. This continues to assume extension of U.S. research credit legislation in the fourth quarter of 2015.
We believe our first half 2015 results have us on track for the breakthrough year we expect 2015 to be.
57
Item 2. Management's Discussion and Analysis of Financial Condition and Results of Operations (Continued)
Risk Factors
Statements included or incorporated by reference herein may constitute "forward-looking statements" within the meaning of the Private Securities Litigation Reform Act of 1995. Forward-looking statements are based on expectations, forecasts, and assumptions by our management and involve a number of risks, uncertainties, and other factors that could cause actual results to differ materially from those stated, including, without limitation:
• | Decline in industry sales volume, particularly in the United States, Europe, or China, due to financial crisis, recession, geopolitical events, or other factors; |
• | Decline in Ford's market share or failure to achieve growth; |
• | Lower-than-anticipated market acceptance of Ford's new or existing products; |
• | Market shift away from sales of larger, more profitable vehicles beyond Ford's current planning assumption, particularly in the United States; |
• | An increase in or continued volatility of fuel prices, or reduced availability of fuel; |
• | Continued or increased price competition resulting from industry excess capacity, currency fluctuations, or other factors; |
• | Fluctuations in foreign currency exchange rates, commodity prices, and interest rates; |
• | Adverse effects resulting from economic, geopolitical, or other events; |
• | Economic distress of suppliers that may require Ford to provide substantial financial support or take other measures to ensure supplies of components or materials and could increase costs, affect liquidity, or cause production constraints or disruptions; |
• | Work stoppages at Ford or supplier facilities or other limitations on production (whether as a result of labor disputes, natural or man-made disasters, tight credit markets or other financial distress, production constraints or difficulties, or other factors); |
• | Single-source supply of components or materials; |
• | Labor or other constraints on Ford's ability to maintain competitive cost structure; |
• | Substantial pension and postretirement health care and life insurance liabilities impairing liquidity or financial condition; |
• | Worse-than-assumed economic and demographic experience for postretirement benefit plans (e.g., discount rates or investment returns); |
• | Restriction on use of tax attributes from tax law "ownership change;" |
• | The discovery of defects in vehicles resulting in delays in new model launches, recall campaigns, or increased warranty costs; |
• | Increased safety, emissions, fuel economy, or other regulations resulting in higher costs, cash expenditures, and/or sales restrictions; |
• | Unusual or significant litigation, governmental investigations, or adverse publicity arising out of alleged defects in products, perceived environmental impacts, or otherwise; |
• | A change in requirements under long-term supply arrangements committing Ford to purchase minimum or fixed quantities of certain parts, or to pay a minimum amount to the seller ("take-or-pay" contracts); |
• | Adverse effects on results from a decrease in or cessation or clawback of government incentives related to investments; |
• | Inherent limitations of internal controls impacting financial statements and safeguarding of assets; |
• | Cybersecurity risks to operational systems, security systems, or infrastructure owned by Ford, Ford Credit, or a third-party vendor or supplier; |
• | Failure of financial institutions to fulfill commitments under committed credit and liquidity facilities; |
• | Inability of Ford Credit to access debt, securitization, or derivative markets around the world at competitive rates or in sufficient amounts, due to credit rating downgrades, market volatility, market disruption, regulatory requirements, or other factors; |
• | Higher-than-expected credit losses, lower-than-anticipated residual values, or higher-than-expected return volumes for leased vehicles; |
• | Increased competition from banks, financial institutions, or other third parties seeking to increase their share of financing Ford vehicles; and |
• | New or increased credit, consumer, or data protection or other regulations resulting in higher costs and/or additional financing restrictions. |
We cannot be certain that any expectation, forecast, or assumption made in preparing forward-looking statements will prove accurate, or that any projection will be realized. It is to be expected that there may be differences between projected and actual results. Our forward-looking statements speak only as of the date of their initial issuance, and we do not undertake any obligation to update or revise publicly any forward-looking statement, whether as a result of new information, future events, or otherwise. For additional discussion, see "Item 1A. Risk Factors" in our 2014 Form 10-K report, as updated by our subsequent Quarterly Reports on Form 10-Q and Current Reports on Form 8-K.
58
Item 2. Management's Discussion and Analysis of Financial Condition and Results of Operations (Continued)
ACCOUNTING STANDARDS ISSUED BUT NOT YET ADOPTED
For information on accounting standards issued but not yet adopted, see Note 2 of the Notes to the Financial Statements.
OTHER FINANCIAL INFORMATION
The interim financial information included in this Quarterly Report on Form 10-Q for the periods ended
June 30, 2015 and 2014 has not been audited by PricewaterhouseCoopers LLP ("PwC"). In reviewing such information, PwC has applied limited procedures in accordance with professional standards for reviews of interim financial information. Readers should restrict reliance on PwC's reports on such information accordingly. PwC is not subject to the liability provisions of Section 11 of the Securities Act of 1933 for its reports on interim financial information, because such reports do not constitute "reports" or "parts" of registration statements prepared or certified by PwC within the meaning of Sections 7 and 11 of the Securities Act of 1933.
ITEM 3. Quantitative and Qualitative Disclosures About Market Risk.
Automotive Sector
Foreign Currency Risk. The net fair value of foreign exchange forward contracts (including adjustments for credit risk), as of June 30, 2015 , was a liability of $456 million compared with a liability of $130 million as of December 31, 2014 . The potential decrease in fair value from a 10% adverse change in the underlying exchange rates, in U.S. dollar terms, would be $1.8 billion at June 30, 2015 , compared with $2.1 billion at December 31, 2014 .
Commodity Price Risk. The net fair value of commodity forward contracts (including adjustments for credit risk) as of June 30, 2015 was a liability of $15 million, compared with a liability of $66 million as of December 31, 2014 . The potential decrease in fair value from a 10% adverse change in the underlying commodity prices, in U.S. dollar terms, would be $43 million at June 30, 2015 , compared with $63 million at December 31, 2014 .
Financial Services Sector
Interest Rate Risk . To provide a quantitative measure of the sensitivity of its pre-tax cash flow to changes in interest rates, Ford Credit uses interest rate scenarios that assume a hypothetical, instantaneous increase or decrease of one percentage point in all interest rates across all maturities (a "parallel shift"), as well as a base case that assumes that all interest rates remain constant at existing levels. The differences in pre-tax cash flow between these scenarios and the base case over a 12-month period represent an estimate of the sensitivity of Ford Credit's pre-tax cash flow . Under this model, Ford Credit estimates that at June 30, 2015 , all else constant, such an increase in interest rates would increase its pre-tax cash flow by $7 million over the next 12 months, compared with a decrease of $46 million at December 31, 2014 . In reality, interest rate changes are rarely instantaneous or parallel and rates could move more or less than the one percentage point assumed in Ford Credit's analysis. As a result, the actual impact to pre-tax cash flow could be higher or lower than the results detailed above.
ITEM 4. Controls and Procedures.
Evaluation of Disclosure Controls and Procedures. Mark Fields, our Chief Executive Officer ("CEO"), and Bob Shanks, our Chief Financial Officer ("CFO"), have performed an evaluation of the Company's disclosure controls and procedures, as that term is defined in Rule 13a-15(e) of the Securities Exchange Act of 1934, as amended ("Exchange Act"), as of June 30, 2015 , and each has concluded that such disclosure controls and procedures are effective to ensure that information required to be disclosed in our periodic reports filed under the Exchange Act is recorded, processed, summarized, and reported within the time periods specified by SEC rules and forms, and that such information is accumulated and communicated to the CEO and CFO to allow timely decisions regarding required disclosures.
Changes in Internal Control over Financial Reporting. There were no changes in internal control over financial reporting during the quarter ended June 30, 2015 that have materially affected, or are reasonably likely to materially affect, our internal control over financial reporting.
59
PART II. OTHER INFORMATION
ITEM 1 . Legal Proceedings.
Medium/Heavy Truck Sales Procedure Class Action (as previously reported on page 24 of our 2014 Form 10-K Report). As previously reported, this action in the Ohio state court system alleged that Ford breached its Sales and Service Agreement with Ford truck dealers by failing to publish to all Ford dealers all price concessions that were approved for any dealer. On February 7, 2014, the trial court granted plaintiffs' motion for a new trial, but on December 11, 2014, the Ohio Court of Appeals reversed the order granting a new trial and reinstated a verdict in Ford's favor. Plaintiffs sought further review in the Ohio Supreme Court, which was denied on July 8, 2015.
ITEM 1A . Risk Factors.
In Item 1A of our 2014 Form 10-K Report, we included the risk factor " New or increased credit, consumer, or data protection or other regulations resulting in higher costs and/or additional financing restrictions. " The following is an update to that risk factor:
In June 2015, the Consumer Financial Protection Bureau issued a final rule giving it authority to supervise the largest nonbank automotive finance companies, such as Ford Credit, which may lead to examinations of nonbank automotive finance companies for compliance with consumer finance protection laws as early as 2015.
ITEM 2. Unregistered Sales of Equity Securities and Use of Proceeds.
In March 2015, we announced a modest anti-dilutive share repurchase program to offset the dilutive effect of share-based compensation granted during 2015. The plan authorizes repurchases of up to 8.5 million shares of our Common Stock. During the second quarter of 2015, we repurchased shares of Ford Common Stock as follows:
Period |
| Total Number of Shares Purchased(a) |
| Average Price Paid per Share |
| Total Number of Shares Purchased as Part of Publicly- Announced Plans or Programs |
| Maximum Number (or Approximate Dollar Value) of Shares that May Yet Be Purchased Under the Plans or Programs |
| |||||
April 1, 2015 through April 30, 2015 |
| - | |
| $ | - | |
| - | |
| 8,500,000 | |
|
May 1, 2015 through May 31, 2015 |
| 2,669,007 | |
| 15.51 | |
| 2,656,245 | |
| 5,843,755 | |
| |
June 1, 2015 through June 30, 2015 |
| 3,293,747 | |
| 15.13 | |
| 3,293,747 | |
| 2,550,008 | | (b) | |
Total/Average |
| 5,962,754 | |
| $ | 15.32 | |
| 5,949,992 | |
|
|
| |
__________
(a) | In any given month, the difference between the total number of shares purchased and the total number of shares purchased as part of the publicly-announced plans or programs reflects shares that were acquired from our employees or directors related to certain exercises of stock options in accordance with our various compensation plans. |
(b) | Shares were repurchased by July 7, 2015. |
ITEM 6. Exhibits.
Please see exhibit index below.
60
SIGNATURE
Pursuant to the requirements of Section 13 or 15(d) of the Securities Exchange Act of 1934, as amended, Ford has duly caused this Report to be signed on its behalf by the undersigned, thereunto duly authorized.
FORD MOTOR COMPANY
By: | /s/ Stuart Rowley |
| Stuart Rowley, Vice President and Controller |
| (principal accounting officer) |
|
|
Date: | July 28, 2015 |
61
EXHIBIT INDEX
Designation |
| Description |
| Method of Filing |
Exhibit 12 |
| Calculation of Ratio of Earnings to Fixed Charges. |
| Filed with this Report. |
Exhibit 15 |
| Letter of PricewaterhouseCoopers LLP, dated July 28, 2015, relating to financial information. |
| Filed with this Report. |
Exhibit 31.1 |
| Rule 15d-14(a) Certification of CEO. |
| Filed with this Report. |
Exhibit 31.2 |
| Rule 15d-14(a) Certification of CFO. |
| Filed with this Report. |
Exhibit 32.1 |
| Section 1350 Certification of CEO. |
| Furnished with this Report. |
Exhibit 32.2 |
| Section 1350 Certification of CFO. |
| Furnished with this Report. |
Exhibit 101.INS |
| XBRL Instance Document. |
| * |
Exhibit 101.SCH |
| XBRL Taxonomy Extension Schema Document. |
| * |
Exhibit 101.CAL |
| XBRL Taxonomy Extension Calculation Linkbase Document. |
| * |
Exhibit 101.LAB |
| XBRL Taxonomy Extension Label Linkbase Document. |
| * |
Exhibit 101.PRE |
| XBRL Taxonomy Extension Presentation Linkbase Document. |
| * |
Exhibit 101.DEF |
| XBRL Taxonomy Extension Definition Linkbase Document. |
| * |
__________
* Submitted electronically with this Report in accordance with the provisions of Regulation S-T.
62