UNITED STATES
SECURITIES AND EXCHANGE COMMISSION
Washington, D.C. 20549
FORM 10-K
(Mark One)
| ☒ | ANNUAL REPORT PURSUANT TO SECTION 13 OR 15(d) OF THE SECURITIES EXCHANGE ACT OF 1934 |
For the fiscal year ended June 30, 2018
OR
TRANSITION REPORT PURSUANT TO SECTION 13 OR 15(d) OF THE SECURITIES EXCHANGE ACT OF 1934 |
For the transition period from to
Commission file number: 0-25259
BOTTOMLINE TECHNOLOGIES (de), INC.
(Exact name of registrant as specified in its charter)
| Delaware | 02-0433294 | |
(State or other jurisdiction of incorporation or organization) | (I.R.S. Employer Identification No.) | |
| 325 Corporate Drive | ||
Portsmouth, New Hampshire (Address of principal executive offices) | 03801-6808 (Zip Code) |
(603) 436-0700
(Registrant's telephone number, including area code)
Securities registered pursuant to Section 12(b) of the Act:
Title of each class: | Name of each exchange on which registered: | |
| Common Stock, $.001 par value per share | The Nasdaq Global Select Market |
Securities registered pursuant to Section 12(g) of the Act: None
Indicate by check mark if the registrant is a well-known seasoned issuer, as defined in Rule 405 of the Securities Act. Yes ☒ No ☐
Indicate by check mark if the registrant is not required to file reports pursuant to Section 13 or Section 15(d) of the Act. Yes ☐ No ☒
Indicate by check mark whether the registrant: (1) has filed all reports required to be filed by Section 13 or 15(d) of the Securities Exchange Act of 1934 during the preceding 12 months (or for such shorter period that the registrant was required to file such reports), and (2) has been subject to such filing requirements for the past 90 days. Yes ☒ No ☐
Indicate by check mark whether the registrant has submitted electronically and posted on its corporate Web site, if any, every Interactive Data File required to be submitted and posted pursuant to Rule 405 of Regulation S-T (§ 232.405 of this chapter) during the preceding 12 months (or for such shorter period that the registrant was required to submit and post such files). Yes ☒ No ☐
Indicate by check mark if disclosure of delinquent filers pursuant to Item 405 of Regulation S-K (§ 229.405 of this chapter) is not contained herein, and will not be contained, to the best of registrant's knowledge, in definitive proxy or information statements incorporated by reference in Part III of this Form 10-K or any amendment to this Form 10-K. ☒
Indicate by check mark whether the registrant is a large accelerated filer, an accelerated filer, a non-accelerated filer, smaller reporting company, or an emerging growth company. See the definitions of "large accelerated filer," "accelerated filer," "smaller reporting company," and "emerging growth company" in Rule 12b-2 of the Exchange Act.
| Large Accelerated Filer | ☒ | Accelerated Filer | ☐ | |||
| Non-Accelerated Filer | ☐ (Do not check if a smaller reporting company) | Smaller Reporting Company | ☐ | |||
| Emerging Growth Company | ☐ |
If an emerging growth company, indicate by check mark if the registrant has elected not to use the extended transition period for complying with any new or revised financial accounting standards provided pursuant to Section 13(a) of the Exchange Act. ☐
Indicate by check mark whether the registrant is a shell company (as defined in Rule 12b-2 of the Exchange Act). Yes ☐ No ☒
The aggregate market value of the voting stock held by non-affiliates of the registrant, based on the last sale price of the registrant's common stock at the close of business on December 31, 2017 was $1,379,527,848 (reference is made to Part II, Item 5 herein for a statement of assumptions upon which this calculation is based). The registrant has no non-voting stock.
There were 42,406,836 shares of common stock, $.001 par value per share, of the registrant outstanding as of August 17, 2018.
DOCUMENTS INCORPORATED BY REFERENCE
Items 10, 11, 12, 13 and 14 of Part III (except for information required with respect to our executive officers, which is set forth under
"Part I-Item 1. Business-Executive Officers and Other Key Employees of the Registrant") have been omitted from this report, as we expect to file with the Securities and Exchange Commission, not later than 120 days after the close of our fiscal year ended June 30, 2018, a definitive proxy statement for our 2018 annual meeting of stockholders. The information required by Items 10, 11, 12, 13 and 14 of Part III of this report, which will appear in our definitive proxy statement, is incorporated by reference into this report.
BOTTOMLINE TECHNOLOGIES (de), INC.
FORM 10-K
FOR THE FISCAL YEAR ENDED JUNE 30, 2018
TABLE OF CONTENTS
| Page | ||||||
PART I | ||||||
Item 1. | Business | 3 | ||||
Item 1A. | Risk Factors | 11 | ||||
Item 1B. | Unresolved Staff Comments | 22 | ||||
Item 2. | Properties | 22 | ||||
Item 3. | Legal Proceedings | 22 | ||||
Item 4. | Mine Safety Disclosures | 22 | ||||
PART II | ||||||
Item 5. | Market for Registrant's Common Equity, Related Stockholder Matters and Issuer Purchases of Equity Securities | 23 | ||||
Item 6. | Selected Financial Data | 26 | ||||
Item 7. | Management's Discussion and Analysis of Financial Condition and Results of Operations | 28 | ||||
Item 7A. | Quantitative and Qualitative Disclosures About Market Risk | 47 | ||||
Item 8. | Financial Statements and Supplementary Data | 49 | ||||
Item 9. | Changes in and Disagreements with Accountants on Accounting and Financial Disclosure | 94 | ||||
Item 9A. | Controls and Procedures | 94 | ||||
Item 9B. | Other Information | 95 | ||||
PART III | ||||||
Item 10. | Directors, Executive Officers and Corporate Governance | 96 | ||||
Item 11. | Executive Compensation | 96 | ||||
Item 12. | Security Ownership of Certain Beneficial Owners and Management and Related Stockholder Matters | 96 | ||||
Item 13. | Certain Relationships and Related Transactions, and Director Independence | 96 | ||||
Item 14. | Principal Accountant Fees and Services | 96 | ||||
PART IV | ||||||
Item 15. | Exhibits and Financial Statement Schedules | 97 | ||||
Item 16. | Form 10-K Summary | 101 | ||||
| Signatures | 102 | |||||
2
PART I
This Annual Report on Form 10-K contains forward-looking statements that involve risks and uncertainties. Any statements (including statements to the effect that we believe, expect, anticipate, plan, and similar expressions) that are not statements relating to historical matters should be considered forward-looking statements. Our actual results may differ materially from the results discussed in the forward-looking statements as a result of numerous important factors, including those discussed in Item 1A. Risk Factors .
| Item 1. | Business. |
Our Company
We help make complex business payments simple, smart and secure. Corporations and banks rely on us for state of the art domestic and international payments, efficient cash management, payment processing, bill review, and fraud detection, behavioral analytics and regulatory compliance solutions. The majority of our revenues are derived from offerings sold as SaaS-based solutions and paid for on a subscription and transaction basis.
We operate cloud-based settlement networks that facilitate electronic payments and transaction settlement between businesses, their vendors and banks. We offer cloud and on-premise solutions that banks use to provide payment, cash management and treasury capabilities to their business customers, as well as solutions that financial institutions use to facilitate customer acquisition. Our cloud-based legal spend management solutions help manage and determine the right amount to pay for legal services and claims vendor expenditures for insurance companies and other large consumers of outside legal services. Corporate customers rely on our solutions to automate payment and accounts payable processes and to streamline and manage the production and retention of electronic documents. Our healthcare customers use our solutions to streamline financial processes, particularly the patient enrollment process. We also offer cyber fraud and risk management solutions that are designed to non-invasively monitor and analyze user behavior and payment transactions to flag behavioral and data anomalies and other suspicious activity.
Our solutions are designed to complement, leverage and extend our customers' existing information systems, accounting applications and banking relationships so that they can be deployed quickly and efficiently. To help our customers realize the maximum value from our products and meet their specific business requirements, we also provide professional services for installation, training, consulting and product enhancement.
Bottomline was originally organized as a New Hampshire corporation in 1989 and was reincorporated as a Delaware corporation in August 1997. We maintain our corporate headquarters in Portsmouth, New Hampshire and our international headquarters in Reading, England. We maintain a website at www.bottomline.com. Our website includes links to our Code of Business Conduct and Ethics, and the charters of our Audit Committee, Leadership Development and Compensation Committee, and Nominations and Corporate Governance Committee. We are not including the information contained on our website as part of, or incorporating it by reference into, this Annual Report on Form 10-K. We make available free of charge, through our website, our annual reports on Form 10-K, quarterly reports on Form 10-Q, and current reports on Form 8-K, and amendments to these reports, as soon as reasonably practicable after such material is electronically filed with, or furnished to, the Securities and Exchange Commission (SEC). The SEC's website, www.sec.gov, contains reports, proxy and information statements, and other information regarding issuers that file electronically with the SEC.
Unless the context requires otherwise, references in this Annual Report on Form 10-K to we, us, our, Bottomline and the Company refer to Bottomline Technologies (de), Inc. and its subsidiaries. Our fiscal year ends on June 30, and we sometimes identify our fiscal years in this Annual Report on Form 10-K by the calendar years in which they end. For example, we refer to the fiscal year ended June 30, 2018 as "fiscal year 2018."
3
Our Strategy
Our objective is to be the leading global provider of business payment technology. Key elements of our strategy include the following:
| • | providing solutions that allow businesses to make complex and fragmented payment processes simple, smart and secure; |
| • | delivering an increasingly broad set of feature-rich solutions via the cloud to provide ease of deployment and efficiency for our customers and increased recurring revenue to us; |
| • | providing an intuitive, easy-to-use/easy-to-navigate experience, accessible via a variety of technology platforms including mobile devices; |
| • | integrating machine learning and predictive analytics technologies to increase the capabilities and effectiveness of our solutions; |
| • | developing innovative new technologies that will allow us to broaden our market footprint, enhance our competitive position in our current markets and capitalize on new market opportunities; |
| • | growing our business payment settlement network solutions by adding customers, strategic partners and new capabilities; |
| • | delivering solutions that enable organizations to adapt to and leverage business payment environment changes such as faster payments, real-time settlement and open banking; |
| • | providing banking solutions that enable banks of all sizes to offer their business customers leading cash management and treasury capabilities; |
| • | attracting and retaining exceptional technical, industry and management talent who have experience in our markets and the capability to grow our business; |
| • | continuing to develop and broaden strategic relationships that enhance our global position; and |
| • | pursuing strategic acquisitions that expand our geographical footprint and market share or extend our product functionality. |
Our Products and Services
Settlement Network Solutions
Paymode-X is a cloud-based payment network allowing businesses to easily transition to electronic integrated payables, maximizing cost-savings, efficiency and security. With more than 385,000 member businesses, new Paymode-X customers gain immediate benefits because many of their vendors are already part of the Paymode-X network and can be paid electronically upon enrollment. Our vendor enrollment process leverages our proprietary Intelligent Engagement Model which includes predictive analytics tools and proprietary processes designed to maximize vendor adoption. Intelligent Payment Optimization ensures that customers settle vendor payments utilizing the mix of payment types that will yield the greatest financial and efficiency gains. We continually incorporate innovative technologies and features into Paymode-X to make it easier for network members to implement, use and realize value quickly. Examples include the addition of new electronic payment types, the incorporation of machine learning and predictive analytics into processes and services such as our Intelligent Engagement Model for Vendor onboarding and Intelligent Payment Optimization for highest return payment routing and incorporation of voice technology and biometrics into our mobile app. We partner with Visa and Mastercard to offer Paymode-X with card capabilities.
Our cloud-based financial messaging solutions leverage multiple payment networks and schemes, including SWIFT global messaging, Faster Payments, Single Euro Payments Area (SEPA), BACS and others to allow banks and corporations to exchange financial information, including payment instructions, cash reporting and other messages to facilitate transaction settlement with banks and counterparties around the world. Our financial messaging solutions allow banks and corporations to achieve lower costs, rapid implementation, greater security and improved risk management, while avoiding costly internal infrastructure.
4
Banking Solutions
We offer payments, cash management and online banking solutions to financial institutions. Our solutions enable banks of all sizes to offer their customers a host of capabilities including ACH and BACS payments, wires, international payments, check production, customer acquisition, balance and information reporting and other features that facilitate enterprise-wide cash management and interaction with their customers. Our secure payments module integrates with our cloud-based payments and cash management platforms, providing real time security monitoring and automated transaction blocking for fraudulent activity. Our solutions allow our bank customers to attract and service a full range of client segments from small businesses to multi-nationals. These solutions feature an intuitive user interface designed to simplify all aspects of payments and cash management for customers of all sizes and sophistication, through both browser-based and mobile channels. We continue to innovate and adapt our solutions as payment standards, customer needs and expectations and technology evolves.
Legal Spend Management
Our cloud-based legal spend management solutions and services integrate with claims management and time and billing systems to automate legal invoice management processes and to provide insight into all areas of a company's outside legal spend. The combination of automated invoice routing and a sophisticated rules engine allows corporate legal and insurance claims departments to create more efficient processes for managing invoices generated by outside law firms and other service providers, while offering insight into important legal spend factors including expense monitoring and outside counsel performance. We continue to expand the capabilities of these offerings to leverage predictive analytics to facilitate the selection and retention of counsel, forecast claim settlement and litigation expense and augment the management and budgeting of litigation matters.
Cyber Fraud and Risk Management
Our cyber fraud and risk management solutions (CFRM) non-invasively monitor, replay and analyze user behavior and payment transactions to flag and even stop suspicious activity in real time. These solutions are highly configurable and create accountability by recording and analyzing each application interaction and screen view, reducing the risk of theft, information leakage, internal fraud and payments fraud, as well as decreasing the cost of regulatory compliance. Case management capabilities centralize risk management, speed investigations, and facilitate compliance with regulations pertaining to Anti Money Laundering (AML), the Health Insurance Portability and Accountability Act (HIPAA) and Know Your Customer (KYC).
Payment and Document Automation
Our payment automation solutions generate a wide variety of domestic and international payment instructions along with consolidated bank reporting of cash activity. Our web fraud and security module is designed to identify and track fraudulent activity that occurs in a customer's platform. Our solutions reduce administrative expenses and strengthen compliance and anti-fraud controls. Users are able to gather and access data via the web related to payment and bank account information, including account totals and detailed transaction data, providing improved workflow, financial reporting and bank communications.
Our cloud-based PT-X payments and collections solutions offers organizations of any size simple, secure and efficient ways to pay and get paid. The PT-X solutions cover essential UK ACH payment types including Bacs Direct Credit, Direct Debit, Faster Payments and Check production, with easy-to-use management tools for accounts payable and accounts receivable departments and financial document flows. The solutions also take advantage of the latest UK open banking initiatives providing customers, partners and banks with an innovative payments and collections platform that keeps pace with industry change.
To augment financial document workflow and delivery, we also offer a number of solutions designed to automate a wide variety of business documents and supply chain processes as well as a related web-based delivery and document archive. Our products offer advanced design, output formatting and delivery capabilities to replace paper-based forms, as well as automating the labor-intensive accounts payable processing of invoices.
5
Healthcare Solutions
We offer solutions for patient registration, electronic signature, mobile document and payments for healthcare organizations to improve business efficiency, reduce costs and improve care quality. Our solutions are utilized across the acute care hospital enterprise and broader healthcare systems, accelerating the paper-to-electronic transition while helping our customers streamline data flows.
We also offer a cyber fraud and risk management solution designed specifically to provide privacy and data security for healthcare organizations, enabling them to better protect themselves and their patients' data from the growing threat posed by the misuse of valid user credentials. The use of user behavior analytics, profiling and a risk scoring engine allows healthcare organizations to detect user behavior changes and receive alerts in real-time.
Professional Services
Our teams of service professionals draw on extensive payments experience to provide consulting, project implementation and training services. By easing the implementation of our products, these services help our customers accelerate the time to value. By improving the overall customer experience, these services help us retain customers and drive future revenue-generating arrangements from existing customers.
Our Customers
Our customers are in industries such as banking, financial services, insurance, healthcare, technology, retail, communications, education, media, manufacturing and government. Our customers include leading organizations such as Bank of America Merrill Lynch, Berkley Risk Administrators, British Telecommunications plc., Capital One, Cedars-Sinai, CIBC, Cigna Corporation, Citizens Bank, Cleveland Clinic, Deutsche Bank, Franklin Templeton Investments, Fidelity Investments, HCA Healthcare, HSBC, Johnson Controls, Inc., JPMorgan Chase, Lloyds Bank, Metro Bank, Regions Financial Corporation, Santander Bank, Starling Bank, State Farm Insurance, Tesco Stores Ltd., The Hartford, Vodafone and Zurich American Insurance Company.
Our Competition
The markets in which we participate are highly competitive. We believe our ability to compete depends on factors within and beyond our control, including:
| • | our ability to develop new, innovative and feature-rich technology solutions that meet the evolving needs of our customers and the shifting dynamics of the markets we participate in; |
| • | our ability to attract and retain employees with the requisite domain knowledge and technical skill set necessary to develop and support our products; |
| • | the performance, reliability, features, ease-of-use and price of our offerings as compared to competitor alternatives; |
| • | our industry knowledge and expertise; |
| • | the execution of our sales and services organizations; and |
| • | the timing and market acceptance of new products as well as enhancements to existing products, by us and by our current and future competitors. |
For our settlement network solutions, our principal competitors include AvidXchange, US Bank Payments Plus, CSI Enterprises, C2FO, Bill.com, MineralTree, Inc. and combined card and ACH Solutions from JPMorgan Chase, Wells Fargo, Finastra, Eastnets and SWIFT.
For our banking solutions and cash management solutions, we primarily compete with companies such as ACI Worldwide, Fiserv, FIS, Q2, Jack Henry, Backbase, NCR, MeridianLink and Polaris, which offer a wide range of financial services, including electronic banking applications. We also encounter competition in our banking solution customer acquisition offerings from MeridianLink and Finastra.
6
For our legal spend management solutions, we compete with a number of companies, including Wolters Kluwer ELM Solutions, LexisNexis, Mitratech, Quovant and DXC Legal Solutions.
For our cyber fraud and risk management products, we primarily compete with NICE Actimize, Norkom, SAS, Guardian Analytics and FairWarning.
For our healthcare solutions, our primary competitors are Access, FairWarning, FormFast, Iatric Systems, Protenus and Taylor Communications.
Our payment and document automation products compete primarily with companies that provide solutions to create, publish, manage and archive electronic documents and companies that offer payments software and services. We also compete with providers of enterprise resource planning (ERP) solutions and providers of traditional payment products.
Although we believe that we compete favorably in each of the markets in which we participate, the markets for our products and services are intensely competitive and characterized by rapid technological change and a number of factors could adversely affect our ability to compete in the future, including those discussed in Item 1A. Risk Factors .
Our Segments
Operating segments are the components of our business for which separate financial information is available that is evaluated regularly by the chief operating decision maker in deciding how to allocate resources and in assessing performance. Our chief operating decision maker is our chief executive officer. Our operating segments are generally organized by the type of product or service offered and by geography.
Similar operating segments have been aggregated into four reportable segments as follows:
Cloud Solutions. Our Cloud Solutions segment provides customers predominately with SaaS technology offerings that facilitate electronic payment, electronic invoicing, and spend management. Our legal spend management solutions, which enable customers to create more efficient processes for managing invoices generated by outside law firms while offering insight into important legal spend factors such as expense monitoring and outside counsel performance, are included within this segment. This segment also incorporates our settlement network solutions (financial messaging and Paymode-X). Our settlement network solutions are highly scalable, secure and cost effective and facilitate cash payment and transaction settlement between businesses, their vendors and banks. Revenue within this segment is generally recognized on a subscription or transaction basis or ratably over the estimated life of the customer relationship.
Banking Solutions. Our Banking Solutions segment provides solutions that are specifically designed for banking and financial institution customers. Our Banking Solutions products are now sold predominantly on a subscription basis, which has the effect of contributing to recurring subscription and transaction revenue and the revenue predictability of future periods, but which also delays revenue recognition over a longer period.
Payments and Transactional Documents. Our Payments and Transactional Documents segment supplies financial business process management software solutions, including making and collecting payments, sending and receiving invoices, and generating and storing business documents. This segment also provides a range of standard professional services and equipment and supplies that complement and enhance our core software products. Revenue associated with these products and services is typically recorded upon delivery. However, if we license products on a subscription basis, revenue is typically recorded ratably over the subscription period or the expected life of the customer relationship.
Other . Our Other segment consists of our healthcare and cyber fraud and risk management operating segments. In our cyber fraud and risk management operating segment, our privacy and data security solution non-invasively monitors, replays and analyzes user behavior to flag and even stop suspicious activity in real time. Our healthcare solutions for patient registration, electronic signature, mobile document and payments allow healthcare organizations to improve business efficiencies, reduce costs and improve care quality. When licensed on a perpetual license basis, software revenue for our cyber fraud and risk management and healthcare
7
products is typically recorded upon delivery, with software maintenance revenue recorded ratably over a twelve-month period. When licensed on a subscription basis, revenue is normally recorded ratably over the subscription period.
Please refer to Note 15. Operations by Segments and Geographic Areas to our consolidated financial statements included in Item 8 of this Annual Report in Form 10-K for further details regarding our operating segment results.
Financial Information About Geographic Areas
A significant percentage of our revenues are generated by our international operations and our future growth rates and success are in part dependent on continued growth and success in international markets. As is the case with most international operations, the success and profitability of these operations is subject to numerous risks and uncertainties including exchange rate fluctuations. We do not currently hedge against exchange rate fluctuations. A number of other factors could also have a negative effect on our business and results from operations outside the U.S., including different regulatory and industry standards and certification requirements, reduced protection for intellectual property rights in some countries, import or export licensing requirements, the complexities of foreign tax jurisdictions and difficulties and costs of staffing and managing our foreign operations.
Please refer to Note 15. Operations by Segments and Geographic Areas to our consolidated financial statements included in Item 8 of this Annual Report in Form 10-K for further details regarding our financial information about geographic areas.
Sales and Marketing
As of June 30, 2018, we employed 342 sales and marketing employees worldwide, of whom 196 were focused on North American markets, 115 were focused on the United Kingdom and continental Europe markets and 31 were focused on Asia-Pacific and Middle East markets. We market and sell our products directly through our sales force and indirectly through a variety of channel partners and reseller relationships. We market and sell our products domestically and internationally, with an international focus on the United Kingdom and continental Europe. We also maintain an inside sales group which provides a cost effective channel into maintaining existing customers and expanding our customer base.
Product Development and Engineering
Our product development and engineering organization includes employees as well as strategic development partners who provide a flexible supplement to our internal resources. We have three primary development groups: product design and user experience, software engineering and quality assurance. We expensed $57.3 million, $53.0 million and $47.4 million in product development and engineering costs in fiscal years 2018, 2017 and 2016, respectively. In fiscal year 2019 we expect product development and engineering costs to increase as we continue to enhance our products and develop new, innovative, feature-rich solutions.
Our product design and user experience team is extensively involved in the design of all of our products, driving the user-centered design process to ensure elegant, engaging and easy-to-use products. Part of this process is user experience testing that is conducted to provide additional productivity gains for the end user.
Our software engineers have substantial experience in advanced software development techniques as well as extensive knowledge of the complex processes involved in business document workflow, cash management, payment and invoicing applications. They maintain extensive knowledge of software development trends and best practices. Our technology focuses on providing business solutions utilizing industry standards, providing a path for extendibility and scalability of our products. Security, control and fraud prevention, as well as performance, data management and resource efficiencies are priorities in the technology we develop and deploy.
Our quality assurance engineers have extensive knowledge of our products and expertise in software quality assurance techniques. The quality assurance team participates in all phases of our product development
8
processes. Members of the quality assurance group make use of both manual and automated software testing techniques to ensure high-quality software is being delivered to our customers. The quality assurance group members participate in alpha and beta releases, testing of new product releases and performance and security testing for our products.
Proprietary Rights
We use a combination of patents, copyrights, trademarks and trade secret laws to help establish and protect our proprietary rights in our technology and products. During fiscal year 2018, we added 2 patents to our portfolio. In total, we currently hold 33 U.S. patents as well as 9 foreign equivalent patents in Europe, Israel and India. We expect to receive other patents, as we have 8 applications pending before the U.S. Patent and Trademark Office. The earliest year of expiration of any of our remaining patents is 2019.
We intend to continue to file patent applications as we identify patentable technology. There can be no assurance, however, that our existing patent applications, or any others that we may file in the future, will issue or will be of sufficient scope and strength to provide meaningful protection of our technology or any commercial advantage to us, or that the issued patents will not be challenged, invalidated or circumvented. In addition, we rely upon a combination of copyright and trademark laws and non-disclosure and other intellectual property contractual arrangements to help protect our proprietary rights. Given the rapidly changing nature of the industry's technology, the creative abilities of our development, marketing and service personnel may be as or more important to our competitive position as are the legal protections and rights afforded by patents. We also enter into agreements with our employees and clients that seek to limit and protect our intellectual property and the distribution of proprietary information. However, there can be no assurance that the steps we have taken to protect our intellectual property will be adequate to deter misappropriation of proprietary information, and we may not be able to detect unauthorized use and take appropriate steps to enforce our proprietary rights.
Government Regulation
Our U.S. chartered financial institution customers are federally regulated by either the Federal Reserve (FED), the Federal Deposit Insurance Corporation (FDIC), the Office of the Comptroller of the Currency (OCC), the National Credit Union Association (NCUA) or the Consumer Financial Protection Bureau (CFPB). Our non U.S. based financial institution customers are normally subject to a similar regulatory oversight within their respective country of domicile. We are subject to periodic examination by the Federal Financial Institutions Examination Council (FFIEC) interagency in our capacity as a technical financial service provider, during which our operating practices are risk-assessed and compared against applicable laws and regulations. If we, as part of such an examination, were to receive a material unfavorable regulatory rating, our customers may be advised by their direct federal regulators to reassess their commercial relationships with us, including the continued use of our products.
Each of our operating segments provides services and/or products that may be subject to various federal, state or foreign laws or regulations, particularly in the area of data security and privacy. These laws and regulations govern the collection, processing, storage, use and disclosure of personal information as well as notification requirements in the event of security breaches. The legal and regulatory framework in these areas is complex and continually evolving, particularly with respect to data security, payment technology and payment methodologies. We may become subject to new or increased regulation in the future, and the cost of complying with current or future regulatory requirements could exceed our estimates. Our products and services must be designed to work effectively within this legal framework.
Employees
As of June 30, 2018, we had approximately 1,700 full-time employees. None of our employees are represented by a labor union. We have not experienced any work stoppages and we believe that employee relationships are good. Our future success will depend in part on our continued ability to attract, retain and motivate highly-qualified technical and managerial personnel in a highly competitive market.
9
Executive Officers and Other Key Employees of the Registrant
Our executive officers and other key employees and their respective ages as of August 29, 2018, are as follows:
Name | Age | Positions | ||||
Robert A. Eberle | 57 | President, Chief Executive Officer and Director | ||||
Richard D. Booth | 49 | Chief Financial Officer and Treasurer | ||||
Norman J. DeLuca | 58 | Managing Director, Banking Solutions | ||||
Paul J. Fannon | 50 | Deputy Managing Director, EMEA | ||||
John F. Kelly | 61 | General Manager, Legal Solutions | ||||
Stephanie B. Lucey | 44 | Chief People Officer | ||||
John J. Mason | 48 | Chief Information Officer | ||||
Brian S. McLaughlin | 54 | Chief Experience Officer | ||||
Andrew J. Mintzer | 56 | Executive Vice President, Product Strategy and Customer Delivery | ||||
Jessica Pincomb Moran | 44 | General Manager, Paymode-X Business Solutions | ||||
Eric K. Morgan | 48 | Executive Vice President, Global Controller | ||||
Christine M. Nurnberger | 39 | Chief Marketing Officer | ||||
Nigel K. Savory | 51 | Managing Director, Europe | ||||
David G. Sweet | 55 | Executive Vice President, Strategy and Corporate Development | ||||
Robert A. Eberle has served as a director since September 2000, as President since August 2004 and as Chief Executive Officer since November 2006.
Richard D. Booth has served as Chief Financial Officer and Treasurer since April 2015. Mr. Booth served as Vice President and Corporate Controller at Sapient Corporation from January 2014 to March 2015. From November 2012 through January 2014, Mr. Booth served as Vice President Financial Planning and Analysis at Nuance Communications and as Vice President and Assistant Corporate Controller from July 2009 through November 2012.
Norman J. DeLuca has served as Managing Director, Banking Solutions since November 2011. From October 2009 through October 2011, Mr. DeLuca served as Managing Partner at NMD Investments. From January 2008 through October 2009, Mr. DeLuca served as Chief Executive of RBS Global Transaction Services, Americas. From January 2007 through January 2008, Mr. DeLuca served as Vice Chairman, RBS Citizens Financial Group.
Paul J. Fannon has served as Deputy Managing Director, EMEA, since February 2018. From October 2008 through January 2018, Mr. Fannon served as Group Sales Director, Europe.
John F. Kelly has served as General Manager, Legal Solutions since April 2011. From January 2006 through April 2011, Mr. Kelly served as Chief Executive Officer of Allegient Systems, Inc.
Stephanie B. Lucey has served as Chief People Officer since April 2018. From November 2016 through April 2018, Ms. Lucey served as Senior Vice President of Human Resources at Clicksoftware. From August 2015 through November 2016, Ms. Lucey served as Vice President of Human Resources at Everbridge. From March 2014 through August 2015, Ms. Lucey served as Head of HR at Vistaprint. From July 2012 through March 2014, Ms. Lucey served as Senior Director of Business Partnerships at Vistaprint.
John J. Mason has served as Chief Information Officer since June 2010. From March 2009 through June 2010, Mr. Mason served as Vice President of Information Technology at Anacomp, Inc.
Brian S. McLaughlin has served as Chief Experience Officer since November 2016 and as Vice President of Product Design and User Experience from February 2011 through October 2016. From 2009 through February 2011, Mr. McLaughlin served as Director of User Experience at CashStar, Inc.
10
Andrew J. Mintzer has served as Executive Vice President, Product Strategy and Delivery since July 2013 and as Senior Vice President, Product Strategy and Delivery from November 2007 through June 2013.
Jessica Pincomb Moran has served as General Manager, Paymode-X Business Solutions since June 2015 and Vice President, Client Services from June 2011 through May 2015. From February 2008 through May 2011, Ms. Moran served as Vice President, Corporate Services.
Eric K. Morgan has served as Controller since September 2000.
Christine M. Nurnberger has served as Chief Marketing Officer since September 2014. Ms. Nurnberger served as Vice President, Marketing for SunGard Availability Services from January 2012 until August 2014 and as Vice President, Global Marketing Operations for Info Global Solutions from November 2005 until January 2012.
Nigel K. Savory has served as Managing Director, Europe since December 2003.
David G. Sweet has served as Executive Vice President, Strategy and Corporate Development since March 2013. From October 2010 through October 2012, Mr. Sweet served as a strategy and business development executive for IBM's Enterprise Marketing Management group. From April 2005 through October 2010, Mr. Sweet served as Senior Vice President of Corporate Development at Unica Corporation.
| Item 1A. | Risk Factors. |
Investing in our common stock involves a high degree of risk. The discussion below addresses the most significant factors, of which we are currently aware, that could affect our business, operating results and financial condition. You should carefully consider the risks and uncertainties described below before making an investment decision involving our common stock. The risks and uncertainties described below are not the only ones facing us. Additional risks and uncertainties may also impact our business operations.
If any of the following risks actually occur, our business, financial condition or results of operations would likely suffer. In that case, the trading price of our common stock could fall, and you may lose all or part of the money you paid to buy our common stock.
Risks Related To Owning Our Common Stock
Our common stock has experienced and may continue to undergo significant market price fluctuations
The market price of our common stock has recently experienced and may continue to experience significant fluctuations due to a variety of factors, including:
| • | general and industry-specific business, economic and market conditions; |
| • | actual or anticipated fluctuations in our operating results; |
| • | changes in or our failure to meet analysts' or investors' estimates or expectations; |
| • | public announcements concerning us, our competitors or our industry; |
| • | acquisitions, divestitures, strategic partnerships, joint ventures, or capital commitments by us or our competitors; |
| • | adverse developments in patent or other proprietary rights; and |
| • | announcements of technological innovations by our competitors. |
If our revenues are below anticipated levels or if our operating results are below analyst or investor expectations, the market price of our common stock could be adversely affected
A significant percentage of our expenses, particularly personnel and facilities costs, are relatively fixed and based in part on anticipated revenue levels which can be difficult to predict. A decline in revenues without a
11
corresponding and timely slowdown in expense growth could adversely affect our business. Significant revenue shortfalls in any quarter may cause significant declines in operating results since we may be unable to reduce spending in a timely manner.
Quarterly or annual operating results that are below the expectations of public market analysts could adversely affect the market price of our common stock. Factors that could cause fluctuations in our operating results include:
| • | a change in customer demand for our products, which is highly dependent on our ability to continue to offer innovative technology solutions in very competitive markets; |
| • | the timing of customer orders; |
| • | the timing of product implementations, which are highly dependent on customers' resources and discretion; |
| • | overall economic conditions, which may affect our customers' and potential customers' budgets for information technology expenditures; |
| • | foreign exchange rate volatility, which can have a significant effect on our total revenues and costs when our foreign operations are translated to U.S. dollars; |
| • | the incurrence of costs relating to the integration of software products and operations in connection with acquisitions of technologies or businesses; and |
| • | the timing and market acceptance of new products or product enhancements by either us or our competitors. |
Our mix of products and services could have a significant effect on our results of operations and the market price of our common stock
The gross margins for our products and services vary considerably. Our software license and maintenance revenues generally yield significantly higher gross margins than do our subscriptions and transactions, professional services and other revenue streams. If our higher margin revenues or our recurring revenues significantly decline in any future period, or if the mix of our products and services in any given period does not match our expectations, our results of operations and the market price of our common stock could be significantly adversely affected.
Risks Related To Our Business
The markets in which we compete are extremely competitive and we may not be able to compete effectively
The markets in which we compete are intensely competitive and characterized by rapid technological change. There is no assurance that we will be able to maintain our current market share or our customer base.
We compete with a wide range of companies ranging from small start-up enterprises with limited resources, which we compete with principally on the basis of technology features or specific customer relationships, to large companies which can leverage significantly larger customer bases and greater financial resources. Many of our competitors have longer operating histories, significantly greater financial, technical, and sales and marketing resources, greater brand recognition and a larger customer base than we do. We anticipate that the markets in which we compete will continue to attract new competitors and new technologies and we may not be able to compete successfully with them.
To compete successfully, we need to maintain a successful research and development function. If we fail to enhance our current products and develop new, innovative solutions or if we fail to bring new solutions to market quickly enough, our products could become less competitive or obsolete.
12
We continue to make significant investments in our existing products and our new product offerings, which may adversely affect our operating results or may not be successful
Given the highly competitive and rapidly evolving technology environment we operate within, we believe that it is important to constantly enhance our existing product offerings as well as to develop new product offerings to meet strategic opportunities as they evolve. This includes developing and enhancing our products to include what we believe is necessary to meet the future needs of our customers.
Our operating results have been affected by increases in product development expenses in recent years as we have continued to make investments in a number of our products, and as we have funded new product innovation based on the market opportunities we see. We expect to continue to make investments in product innovation and we may at any time, based on product need or marketplace demand, decide to significantly increase our product development expenditures in any of our products.
Investments in existing products and new product offerings can have a negative impact on our operating results, and any new product enhancement or offering may not be accepted in the marketplace or generate material revenues for us.
Acquisitions could disrupt our business and harm our financial condition
An active acquisition program has been an important element of our corporate strategy. We have been an acquisitive company historically, and we expect to continue to make acquisitions in the future. Any acquisition or strategic investment we have made or may make in the future may entail numerous risks, including the following:
| • | difficulties integrating acquired operations, personnel, technologies or products; |
| • | entrance into markets and operating geographies in which we have no or limited prior experience or knowledge; |
| • | failure to realize anticipated revenue increases for any number of reasons, including if a larger than expected number of acquired customers decline to renew software maintenance contracts or subscription based contracts, if we are unsuccessful in selling the acquired products into our existing customer base or if the terms of the acquired contracts do not permit us to recognize revenue on a timely basis; |
| • | costs incurred to combine the operations of companies we acquire, such as integration costs, transitional employee expenses and employee retention or relocation expenses, may be higher than expected; |
| • | write-offs related to existing or acquired assets such as deferred tax assets, goodwill or other intangible assets; |
| • | inability to retain key personnel of the acquired company; |
| • | inadequacy of existing operating, financial and management information systems to support the combined organization, including the difficulty in integrating an acquired company's accounting, financial reporting and other administrative systems to permit effective management; |
| • | difficulties implementing controls, procedures and policies appropriate for a public company at companies that, prior to the acquisition, may have lacked such controls, policies and procedures; |
| • | in the case of foreign acquisitions, challenges integrating operations across different cultures and languages and addressing the particular regulatory, economic, currency and political risks associated with different countries or regions; |
| • | diversion of management's focus from our core business concerns; |
| • | dilution to existing stockholders and our earnings per share; |
| • | incurrence of substantial debt; |
13
| • | exposure to litigation from third parties, including claims related to intellectual property or other assets acquired or liabilities assumed; and |
| • | failure to realize anticipated benefits of the acquisition due to the above factors or other factors. |
There can be no assurance that our acquired businesses will fully integrate successfully or that all future potential benefits will be realized. Any such difficulties encountered as a result of any merger, acquisition or strategic investment could have a material adverse effect on our business, operating results and financial condition.
As a result of our acquisitions, we could be subject to significant future write-offs with respect to intangible assets, which may adversely affect our future operating results
The carrying value of our intangible assets, including goodwill, represented 57% of our total assets at June 30, 2018. We periodically review our goodwill and our other intangible assets for impairment and could, in any future period, be subject to impairment charges with respect to these assets or intangible assets arising as a result of acquisitions in future periods. Any such charges, to the extent occurring, would likely have a material adverse effect on our operating results.
We face risks associated with our international operations that could harm our financial condition and results of operations
A significant percentage of our revenues have been generated by our international operations, and our future growth rates and success are in part dependent on our continued growth and success in international markets. As is the case with most international operations, the success and profitability of these operations are subject to numerous risks and uncertainties that include, in addition to the risks our business as a whole faces, the following:
| • | currency exchange rate fluctuations, particularly with the British Pound Sterling, the Swiss Franc, the European Euro and the Israeli Shekel; |
| • | difficulties and costs of staffing and managing foreign operations; |
| • | differing regulatory and industry standards and certification requirements; |
| • | the complexities of tax laws in foreign jurisdictions; |
| • | the complexities of foreign data privacy laws and regulations; |
| • | the complexities of various sanctions regimes and related commercial restrictions; |
| • | reduced protection for intellectual property rights in some countries; and import or export licensing requirements. |
Weakness or deterioration in domestic and global economic conditions could have a significant adverse impact on our business, financial condition and operating results
Our business, financial condition and operating results are significantly affected by general economic conditions. The U.S. and global economies have experienced deterioration in the recent past. Economic weakness or any downturn in the U.S. or global economies could result in a variety of risks to our business, including:
| • | increased volatility in our stock price; |
| • | increased volatility in foreign currency exchange rates; |
| • | delays in, or curtailment of, purchasing decisions by our customers or potential customers either as a result of continuing economic uncertainty or as a result of their inability to access the liquidity necessary to engage in purchasing initiatives; |
| • | pricing pressures for our products and services, including reductions in the duration or renewal rates for our subscription contracts and software maintenance contracts; |
14
| • | increased credit risk associated with our customers or potential customers, particularly those that may operate in industries or geographic regions most affected by the economic downturn; and |
| • | impairment of our goodwill or other assets. |
To the extent that economic conditions become uncertain or deteriorate, or any of the above risks occur, our business and operating results could be significantly and adversely affected.
The formal notification by the UK of its intention to withdraw from the European Union (EU) (referred to as Brexit), could create disruption and uncertainty to our business, including our relationships with our existing and future customers, suppliers and employees, which could have an adverse effect on our business, financial results and operations
In connection with Brexit, the British government is negotiating the future terms of the UK's relationship with the EU, including the terms of trade between the UK and the EU. The ultimate effects of Brexit will depend on any agreements the UK makes to retain access to EU markets either during a transitional period or more permanently. The measures could potentially disrupt the markets we serve and the tax jurisdictions in which we operate. In addition, Brexit could lead to legal uncertainty and potentially divergent national laws and regulations as the UK determines which EU laws to replace or replicate. Remaining EU member countries may also seek to make it more difficult for our UK subsidiary to trade effectively or competitively in those regions.
We are subject to the political, economic and security conditions in Israel
We have a subsidiary headquartered in Tel Aviv, Israel. Since the establishment of the State of Israel, a number of armed conflicts have taken place between Israel and its neighbors. In the past, Israel has experienced periodic armed conflicts which at times have disrupted day-to-day civilian activity in Israel.
There can be no assurance that future conflicts will not occur and that such conflicts will not affect our premises or major infrastructure and transport facilities in the country, which could have an adverse effect on our ability to conduct business in Israel. In addition, acts of terrorism, armed conflicts or political instability in the region could negatively affect global as well as local economic conditions and adversely impact our operating results.
Our business and operating results are subject to fluctuations in foreign currency exchange rates
We conduct a substantial portion of our operations outside of the U.S., principally in the United Kingdom and in continental Europe and, to a lesser extent, in the Asia-Pacific and Middle East regions. During the twelve months ended June 30, 2018, approximately 39% of our revenues and 41% of our operating expenses were attributable to customers or operations located outside of North America. During the twelve months ended June 30, 2018 as compared to the twelve months ended June 30, 2017, the foreign currency exchange rates of the U.S. Dollar to the British Pound Sterling decreased. Future appreciation of the U.S. Dollar against the foreign currencies in which our international operations are denominated will have the impact of reducing both our revenues and operating expenses associated with our operations in those regions.
We may have larger than anticipated tax liabilities
The determination of our provision for income taxes requires significant judgment and estimation and there are transactions and calculations where the ultimate tax determination is uncertain. We are subject to tax in multiple U.S. and foreign tax jurisdictions and the determination of our tax liability is always subject to audit and review by the applicable domestic or foreign taxing authority. In light of fiscal challenges in U.S. federal and state governments and in many international locations, taxing authorities are increasingly focused on ways to increase revenues which may make resolving tax disputes more difficult. We are regularly under audit by tax authorities in different jurisdictions. While we have established tax reserves using assumptions and estimates that we believe to be reasonable, these reserves may prove insufficient in the event that a taxing authority asserts a tax position that is contrary to our position.
15
Our future financial results will be affected by our success in continuing to sell our products in a subscription and transaction model, which carries with it certain risks
A substantial portion of our revenues and profitability were historically generated from perpetual software license revenues; however, we continue to offer a growing number of products under a subscription and transaction based revenue model. We believe a subscription based revenue model has certain advantages over a perpetual license model, including better predictability of revenue; however, it also presents a number of risks to us including the following:
| • | arrangements entered into on a subscription basis generally delay the timing of revenue recognition and can require the incurrence of up-front costs, which may be significant; |
| • | subscription based revenue arrangements often include specific performance requirements or service levels that we may be unable to consistently achieve, subjecting us to penalties or other costs. A material breach of these arrangements by us, such as a persistent failure to achieve required service levels, might permit the customer to exit the contract prior to its expiration, without additional compensation to us; |
| • | customer retention is critical to our future growth rates. Customers in a subscription arrangement may elect not to renew their contract upon expiration, or they may attempt to renegotiate pricing or other contractual terms at the point of (or prior to) renewal on terms that are less favorable to us; and |
| • | there is no assurance that the solutions we offer on a subscription basis, including new revenue models or new products that we may introduce, will receive broad marketplace acceptance. |
Because we recognize subscription revenue from our customers over the term of their agreements, downturns or upturns in sales of our subscription based offerings will not be immediately reflected in our operating results and may adversely affect revenue in the future
We recognize subscription revenue over the term of our customer agreements. As a result, most of our subscription revenue arises from agreements entered into during previous periods. A shortfall in orders for our subscription based solutions in any one period would most likely not significantly reduce our subscription revenue for that period, but could adversely affect the revenue contribution in future periods. In addition, we may be unable to quickly reduce our cost structure in response to a decrease in these orders. Accordingly, the effect of downturns in sales of our subscription based solutions will not be fully reflected in our operating results until future periods. A subscription revenue model also makes it difficult for us to rapidly increase our revenue through additional subscription sales in any one period, as revenue is generally recognized over a longer period.
If our products and services do not comply with laws, regulations and industry standards to which we and our customers are subject, our business could be adversely affected
Our software products and SaaS offerings facilitate the transmission of cash, business documents and confidential information including, in some cases, personally identifiable information related to individuals and corporations. Our software products and certain of our SaaS offerings store and transmit this data electronically, and therefore our products must operate within the laws, regulations and industry standards regarding security, data protection and electronic commerce. There has been an increased global regulatory focus on privacy issues with respect to the handling of personal information, such as the European Union's General Data Protection Regulation. While we believe that our products comply with current regulatory requirements, the interpretation and application of these requirements continues to evolve and may evolve in ways that we cannot predict; so there can be no assurance that future legal or regulatory actions will not adversely impact us. To the extent that current or future regulatory or legal developments mandate a change in any of our products or services, require us or our customers to comply with any industry specific licensing or compliance requirements, alter the demand for or the competitive environment of our products and services or require us to make material changes to how we operate our business, including any changes to our internal operating, financial or management information systems, we might not be able to respond to such requirements in a timely or cost effective manner. If this were to occur, our business, operating results and financial condition could be materially adversely affected.
16
Failure to comply with the regulations provided by the Financial Conduct Authority (FCA) for certain of our UK operations could adversely impact our business
First Capital Cashflow Ltd., which we acquired in October 2017, is subject to the regulatory framework of the FCA. This component of our operations involves holding and disbursing client funds. The FCA has significant enforcement authority which includes, but is not limited to, withdrawing an organization's authorization, issuing fines and suspending firms from carrying out regulated activities. While we believe we have appropriate controls and procedures around these operations, any failure to comply with FCA requirements may result in disciplinary actions that could have a material adverse effect on our business, operating results and financial condition.
Security or data breaches could have an adverse effect on our business
In the course of providing services to our customers we collect, store, process and transmit highly sensitive and confidential information. We rely on our employees and certain third parties in our current operations who may, as a result of human error or misconduct, expose us to operational risk. Certain of our solutions also facilitate the actual transfer of cash or transmit instructions that initiate cash transfer. Our products and services, particularly our SaaS and Web-based offerings, may be vulnerable to unauthorized access, computer viruses, cyber-attacks, distributed denial of service attacks and other disruptive problems, which could result in the theft, destruction or misappropriation of confidential information. Security risks in recent years have increased significantly given the increased sophistication and activities of hackers, organized crime, including state-sponsored organizations and nation-states, and other external parties. Cyber threats are continuously evolving, increasing the difficulty of defending against them. Breaches of our network could disrupt our internal systems and business applications, including services provided to our customers. Additionally, data breaches could compromise technical and proprietary information, harming our competitive position. We may need to spend significant capital or allocate significant resources to ensure effective ongoing protection against the threat of security breaches or to address security related concerns. Despite our efforts, a security breach or computer virus could still occur, which could have a significant negative impact on our business, including reputational harm, the loss of customers and material financial liability to us.
Defects or disruptions in our products or services could diminish demand for our solutions and have a material adverse effect on our future financial results
Our software products are complex. Despite testing prior to their release and throughout the lifecycle of a product or service, software and SaaS offerings often contain undetected errors or defects that can impact their function, performance and security. Any unanticipated performance problems or defects in our products or services could result in additional development costs, diversion of technical and other resources from our other development efforts, service disruptions for our SaaS offerings, negative publicity and reputational harm to us and our products and exposure to potential liability claims. As a result, any error or defect in our products or services could adversely affect our future financial results.
The failure of our cyber fraud and risk management products to prevent a security breach or detect cyber fraud, or the failure of our customers to take action based on the risks identified by these products, could harm our reputation and adversely impact our operating results
Our cyber fraud and risk management products provide our customers the ability to configure a multitude of settings and establish certain rule-based alerts, and it is possible that a customer could misconfigure these products or fail to configure these products in an optimal manner, which could cause threats to go undetected. Similarly, if our cyber fraud and risk management products detect threats or otherwise alert a customer to suspicious activity but the customer does not take action to investigate those threats or alerts, customers may erroneously believe that our products were not effective.
Any real or perceived defects, errors or vulnerabilities in our cyber fraud and risk management products or any failure of these products to prevent, detect or alert a customer to a threat could result in:
| • | a loss of customers or potential customers; |
17
| • | delayed or lost revenue and harm to our financial condition and results of operations; |
| • | a delay in attaining, or the failure to attain, market acceptance for our cyber fraud and risk management solutions; |
| • | an increase in warranty claims; |
| • | harm to our reputation; or |
| • | litigation, regulatory inquiries or investigations that may be expensive and that would further harm our reputation. |
We rely on certain third-party hardware and software which could cause errors, interruptions or failures to our solutions or be difficult to replace
We rely on third party hardware and software to deliver certain of our solutions. These third party products may not continue to be available to us on commercially reasonable terms, or at all. The loss of the right to use any of these products could result in delays in our ability to provide our solutions until equivalent technology is either developed by us or acquired from another third party, if available, which may not be possible on a cost-effective basis. In addition, errors or defects in third-party products used in conjunction with our solutions could adversely affect the operation of our products.
Catastrophic events may disrupt our business, including our third party data centers
We are a highly-automated business and we rely on our network infrastructure, various software applications and many internal technology systems and data networks for our customer support, development, sales and marketing and accounting and finance functions. Further, our SaaS offerings provide services to our customers from third party data center facilities in different U.S. and international locations over which we have no control. A disruption or failure of these systems or data centers in the event of a natural disaster, telecommunications failure, power outage, cyber-attack, war, terrorist attack, or other catastrophic event could cause system interruptions, reputational harm, delays in product development, breaches of data security and loss of critical data. Such an event could also prevent us from fulfilling customer orders or maintaining certain service level requirements, particularly in respect of our SaaS offerings. While we have developed certain disaster recovery plans and maintain backup systems to reduce the potentially adverse effect of such events, a catastrophic event that resulted in the destruction or disruption of any of our data centers or our critical business or information technology systems could severely affect our ability to conduct normal business operations and, as a result, our business, operating results and financial condition could be adversely affected.
We could incur substantial costs resulting from warranty claims or product liability claims
Our product agreements typically contain provisions that afford customers a degree of warranty protection in the event that our products fail to conform to written specifications. These agreements normally contain provisions intended to limit the nature and extent of our risk of warranty and product liability claims. A court, however, might interpret these terms in a limited way or conclude that part or all of these terms are unenforceable. Furthermore, some of our agreements are governed by non-U.S. law, and there is a risk that foreign law might provide us less or different protection. While we maintain general liability insurance, including coverage for errors and omissions, we cannot be sure that our existing coverage will continue to be available on reasonable terms or will be available in amounts sufficient to cover one or more large claims.
A warranty or product liability claim, whether or not meritorious, could harm our reputation, result in substantial financial costs or divert management's attention, which could have an adverse effect on our business, operating results and financial condition.
We could be adversely affected if we are unable to protect our proprietary technology and could be subject to litigation regarding intellectual property rights, which could cause serious harm to our business
We rely upon a combination of patent, copyright and trademark laws and non-disclosure and other intellectual property contractual arrangements to protect our proprietary rights. However, there is no assurance
18
that our patents, pending applications for patents that may issue in the future, or other intellectual property will be of sufficient scope and strength to provide meaningful protection for our technology or any commercial advantage to us. Further, we cannot be certain that our patents will not be challenged, invalidated or circumvented. We enter into agreements with our employees and customers that seek to limit and protect the distribution of proprietary information. Despite our efforts to safeguard and maintain our proprietary rights, there is no assurance that such rights will remain protected or that we will be able to detect unauthorized use and take appropriate steps to enforce our intellectual property rights.
Litigation involving patents and other intellectual property rights is common in the United States and in other countries where we operate. We may be a party to litigation in the future to protect our intellectual property rights or as a result of an alleged infringement of the intellectual property rights of others. Any such claims, whether or not meritorious, could result in reputational harm to us, require us to spend significant sums in litigation costs or damages, delay product implementations, or require us to develop non-infringing intellectual property or acquire licenses to intellectual property that is the subject of the infringement claim. In addition, under many of our customer contracts, we are required to indemnify our customers for third-party intellectual property infringement claims, which would increase the costs to us of any such claims. These claims could have a material adverse effect on our business, operating results and financial condition.
Our ability to attract and retain qualified employees is critical to the success of our business and failure to do so could adversely affect our operating results
Our success depends upon the efforts and abilities of our executive officers and technical and sales employees who are skilled in e-commerce, payment methodology and regulation, business banking technologies, and web, database and network technologies. Our success and future growth depends to a significant degree on the skills and continued services of our management team. Our current key employees and employees whom we seek to hire in order to support our growth are in high demand within the marketplace. The loss of one or more of our key employees or our failure to consistently attract and retain sufficient qualified employees to grow our operations could have a material adverse effect on our business. We do not maintain key man life insurance policies on any of our employees and our employees are generally free to terminate their employment with us at any time. The loss of the services of any of our executive officers or other key employees could have a material adverse effect on our business, operating results and financial condition.
We engage off-shore development resources which may not be successful and which may put our intellectual property at risk
In order to optimize our research and development capabilities and to meet development timeframes, we contract with off-shore third-party vendors for certain development activities. While our experience to date with these resources has been positive, there are a number of risks associated with off-shore development activities including:
| • | less efficient and less accurate communication and information flow as a consequence of time, distance and language barriers between our primary development organization and the off-shore resources, resulting in delays or deficiencies in development efforts; |
| • | disruption due to political or military conflicts; |
| • | misappropriation of intellectual property, which we may not readily detect; and |
| • | currency exchange rate fluctuations that could adversely impact the cost advantages intended from these agreements. |
To the extent that these or unforeseen risks occur, our operating results and financial condition could be adversely impacted.
19
Changes in financial accounting standards may cause unexpected financial reporting fluctuations and affect our reported results of operations
Changes in accounting standards or practices could adversely affect our reported results of operations. New accounting pronouncements, such as the changes in U.S. GAAP related to revenue recognition and accounting for lease arrangements, and varying interpretations of accounting pronouncements, have occurred and will undoubtedly occur in the future. Changes to existing accounting rules or practices may materially affect our reported results of operations or the way we conduct our business in future periods.
If we fail to maintain appropriate and effective internal control over financial reporting, our ability to produce accurate and timely financial statements could be impaired which could result in a loss of investor confidence in our financial reports and have an adverse effect on our stock price
Ensuring that we have adequate internal financial and accounting controls and procedures in place so that we can produce accurate financial statements on a timely basis is a costly and time-consuming effort that we re-evaluate regularly. Our internal controls over financial reporting are designed to provide reasonable assurance regarding the reliability of financial reporting and the preparation of financial statements in accordance with U.S. GAAP. However, despite our efforts, any failure to maintain or implement the necessary internal controls could cause us to fail to meet our financial reporting obligations or result in misstatements in our financial statements, either of which could cause investors to lose confidence in our reported financial information and lead to a decline in the trading price of our common stock.
In fiscal year 2018, we completed the first phase of our implementation of a complex, company-wide, enterprise resource planning (ERP) system. In fiscal year 2019, we will complete the second phase of this implementation which is designed to modify our existing ERP in conjunction with the adoption of the new revenue recognition standard. If we were to experience significant operating problems once implemented, it could adversely affect our business and results of operations
To comply with the accounting standard update which provides for new revenue recognition guidance beginning in the first quarter of our fiscal year 2019, we have continued to significantly modify and enhance our existing ERP system. ERP implementations are inherently complex and time-consuming projects that involve substantial expenditures on system software, implementation activities and business process reengineering. Any unexpected challenge or performance issue associated with the modification of our existing ERP system could adversely affect our financial reporting systems and processes and our ability to timely and accurately report financial information, including our ability to furnish our quarterly and annual reports with the SEC. Data accuracy problems or other issues may occur which, if not corrected quickly, could impact our business or financial results. In addition, we may experience periodic or prolonged disruption to our financial functions arising from this implementation, including adverse effects on our internal controls over financial reporting. If we encounter unforeseen problems with our financial systems, our business, operations and overall system of internal controls could be adversely affected.
Certain anti-takeover provisions contained in our charter and under Delaware law could hinder a takeover attempt
We are subject to the provisions of Section 203 of the General Corporation Law of the State of Delaware prohibiting, under some circumstances, publicly-held Delaware corporations from engaging in business combinations with some stockholders for a specified period of time without the approval of the holders of substantially all of our outstanding voting stock. Such provisions could delay or impede the removal of incumbent directors and could make more difficult a merger, tender offer or proxy contest involving us, even if such events could be beneficial, in the short term, to the interests of our stockholders. In addition, such provisions could limit the price that some investors might be willing to pay in the future for shares of our common stock. Our certificate of incorporation and bylaws contain provisions relating to the limitation of liability and indemnification of our directors and officers, dividing our board of directors into three classes of directors serving three-year terms and providing that our stockholders can take action only at a duly called annual or special meeting of stockholders.
20
Risks Related to our Indebtedness
Credit Facility
On December 9, 2016, we (as borrower) and certain of our domestic subsidiaries (as guarantors) entered into a credit agreement with Bank of America, N.A. and certain other lenders which provides for a revolving credit facility in the amount of up to $300 million (the Credit Facility). During fiscal year 2018, we borrowed $150 million against the Credit Facility to finance the repayment of a portion of the principal balance of the 1.5% Convertible Senior Notes that matured on December 1, 2017 (the Notes). On July 16, 2018, we entered into an amendment to the Credit Facility which, among other things, lowered certain borrowing costs and extended its term to July 16, 2023.
Our level of indebtedness may limit our financial flexibility
Our level of indebtedness affects our operations in several ways, including:
| • | a portion of our cash flows from operating activities must be used to service our indebtedness and is not available for other purposes; |
| • | we may be at a competitive disadvantage as compared to similar companies that have less debt; and |
| • | additional financing in the future for working capital, capital expenditures, acquisitions, general corporate or other purposes may have higher costs and contain restrictive covenants, or may not be available to us. |
The factors that will affect our ability to obtain additional financing may be beyond our control and include financial market conditions, the value of our assets and our performance at the time we need financing.
The credit agreement contains financial and other covenants, and our failure to comply with any of those covenants could materially adversely impact us or limit or eliminate our ability to access funds under the Credit Facility
The credit agreement requires us to comply with certain financial covenants. Our ability to meet those financial covenants can be affected by events beyond our control, and while at June 30, 2018 we were in compliance with those covenants, we may fail to maintain compliance in future periods. The credit agreement contains customary representations, warranties and covenants including, but not limited to, material adverse events, specified restrictions on indebtedness, liens, investments, acquisitions, sales of assets, dividends and other restricted payments, and transactions with affiliates. These restrictions could place us at a disadvantage relative to our competitors that are not subject to such limitations. A breach of any of these covenants or restrictions could result in an event of default under the credit agreement. Upon the occurrence of an event of default, the lenders could elect to declare all amounts outstanding under the Credit Facility, together with accrued interest, to be immediately due and payable. If we were unable to repay those amounts, the lenders could seek recovery against our assets, including any collateral granted to them to secure the indebtedness. If the lenders under the Credit Facility were to accelerate the payment of any indebtedness, we cannot assure you that our assets would be sufficient to satisfy our obligations.
Our variable rate could cause our debt service obligations to increase or decrease based on changes in market rates
Borrowings under the Credit Facility are at variable rates of interest and expose us to interest rate risk. If interest rates were to increase, our debt service obligations on the variable rate indebtedness would increase even though the amount borrowed remained the same, and our net income and cash flows, including cash available for servicing our indebtedness, would correspondingly decrease. In July 2017, we entered into an interest rate swap intended to mitigate a portion of interest rate volatility arising from the Credit Facility. However, this interest rate swap, and any additional interest rate swap we may enter into in the future, might not fully mitigate our variable interest rate risk.
21
| Item 1B. | Unresolved Staff Comments. |
None.
| Item 2. | Properties. |
The following table sets forth the location, the reportable segment(s) and approximate square footage of each of the principal properties used by us during fiscal year 2018. Our Portsmouth, New Hampshire facility serves as our corporate headquarters and is used by employees associated with all of our reportable segments in addition to our management, administrative, sales and marketing and customer support teams. All properties, except as noted below, are leased under operating leases.
Location | Reportable Segment(s) | Approximate Square Feet | ||||
North America: | ||||||
Alpharetta, Georgia | Payments and Transactional Documents, Banking Solutions and Other | 25,000 | ||||
Charlotte, North Carolina | Banking Solutions | 3,000 | ||||
Englewood Cliffs, New Jersey | Payments and Transactional Documents and Other | 4,000 | ||||
Garden City, New York | All segments | 9,000 | ||||
Marlton, New Jersey | Cloud Solutions | 7,000 | ||||
Morrisville, North Carolina | Payments and Transactional Documents and Other | 8,000 | ||||
Portland, Maine | Cloud Solutions | 27,000 | ||||
Portsmouth, New Hampshire | All segments | 85,000 | ||||
Providence, Rhode Island | Banking Solutions | 11,000 | ||||
Wilton, Connecticut | Cloud Solutions | 13,000 | ||||
Europe: | ||||||
Geneva, Switzerland | Cloud Solutions | 16,000 | ||||
Harlow, England | Payments and Transactional Documents | 4,000 | ||||
London, England | All segments | 6,000 | ||||
Reading, England (1) | All segments | 27,000 | ||||
Runcorn, England | Payments and Transactional Documents | 3,000 | ||||
Asia-Pacific and Middle East: | ||||||
Melbourne, Australia | Payments and Transactional Documents and Banking Solutions | 2,000 | ||||
Sydney, Australia | Payments and Transactional Documents | 2,000 | ||||
Or-Yehuda, Israel | Other | 9,000 | ||||
Singapore | Cloud Solutions | 3,000 | ||||
| (1) | We own 16,000 square feet in Reading, England currently used as our European headquarters. |
| Item 3. | Legal Proceedings. |
We are, from time to time, a party to legal proceedings and claims that arise in the ordinary course of our business. We do not believe that there are claims or proceedings pending against us for which the ultimate resolution would have a material effect on, or require disclosure in, our financial statements.
| Item 4. | Mine Safety Disclosures. |
Not applicable.
22
PART II
| Item 5. | Market for Registrant's Common Equity, Related Stockholder Matters and Issuer Purchases of Equity Securities. |
Our common stock is traded on The Nasdaq Global Select Market under the symbol EPAY. The following table sets forth, for the periods indicated, the high and low sale prices of our common stock, as quoted on The Nasdaq Global Select Market.
Period | High | Low | ||||||
Fiscal Year 2017 | ||||||||
First quarter | $ | 23.98 | $ | 18.80 | ||||
Second quarter | $ | 25.41 | $ | 21.98 | ||||
Third quarter | $ | 26.99 | $ | 23.51 | ||||
Fourth quarter | $ | 26.43 | $ | 21.74 | ||||
Fiscal Year 2018 | ||||||||
First quarter | $ | 32.01 | $ | 25.14 | ||||
Second quarter | $ | 35.65 | $ | 32.13 | ||||
Third quarter | $ | 39.77 | $ | 34.54 | ||||
Fourth quarter | $ | 50.71 | $ | 38.25 | ||||
As of August 17, 2018, there were approximately 546 holders of record of our common stock. Because many of the shares are held by brokers and other institutions on behalf of stockholders, we are unable to estimate the total number of individual stockholders represented by these holders of record.
The closing price for our common stock on August 17, 2018 was $60.82. For purposes of calculating the aggregate market value of the shares of our common stock held by non-affiliates, as shown on the cover page of this report, it has been assumed that all the outstanding shares were held by non-affiliates except for the shares beneficially held by our directors and executive officers. However, there may be other persons who may be deemed to be affiliates of ours.
We have never paid dividends on our common stock. We do not anticipate paying any cash dividends on our common stock for the foreseeable future.
The following table provides information about purchases by us of our common stock during the quarter ended June 30, 2018:
Period | Total Number of Shares Purchased (1) | Average Price Paid per Share | Total Number of Shares Purchased as Part of Publicly Announced Plans or Programs | Approximate Dollar Value of Shares that May Yet be Purchased Under the Plans or Programs | ||||||||||||
April 1, 2018 - April 30, 2018 | - | $ | - | - | $ | 20,140,000 | ||||||||||
May 1, 2018 - May 31, 2018 | - | - | - | 20,140,000 | ||||||||||||
June 1, 2018 - June 30, 2018 | - | - | - | 20,140,000 | ||||||||||||
|
|
|
| |||||||||||||
Total | - | $ | - | - | ||||||||||||
|
|
|
| |||||||||||||
| (1) | On July 8, 2016, our board of directors authorized a repurchase program of our common stock for an aggregate repurchase price not to exceed $60 million. This program expired on July 8, 2018. |
23
Stock Performance Graph
The stock performance graph below compares the percentage change in cumulative stockholder return on our common stock for the period from June 30, 2013 through June 30, 2018, with the cumulative total return on The Nasdaq Stock Market (U.S.) and the Nasdaq Computer & Data Processing Index.
This graph assumes the investment of $100.00 in our common stock (at the closing price of our common stock on June 28, 2013), the Nasdaq Stock Market (U.S.) and the Nasdaq Computer & Data Processing Index on June 28, 2013, and assumes dividends, if any, are reinvested.
The stock price performance shown on the following graph is not necessarily indicative of future price performance.
COMPARISON OF 5 YEAR CUMULATIVE TOTAL RETURN*
Among Bottomline Technologies (de), Inc., the Nasdaq Composite Index
and the Nasdaq Computer & Data Processing Index
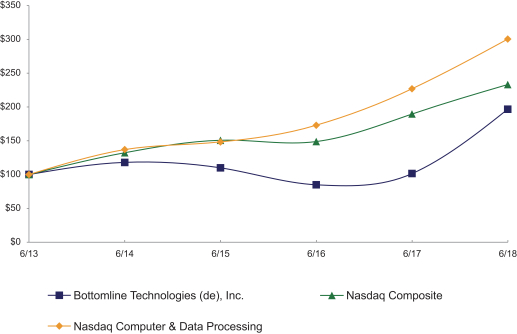
| * | $100 invested on 6/28/13 in stock or index, including reinvestment of dividends. |
Fiscal year ending June 30.
| 6/13 | 6/14 | 6/15 | 6/16 | 6/17 | 6/18 | |||||||||||||||||||
Bottomline Technologies (de), Inc. | $ | 100.00 | $ | 118.31 | $ | 109.96 | $ | 85.13 | $ | 101.58 | $ | 197.03 | ||||||||||||
Nasdaq Composite | 100.00 | 132.45 | 151.00 | 148.88 | 189.66 | 233.12 | ||||||||||||||||||
Nasdaq Computer & Data Processing | 100.00 | 136.90 | 148.29 | 172.95 | 226.96 | 300.54 | ||||||||||||||||||
The information included under the heading Stock Performance Graph in Item 5 of this Annual Report on Form 10-K is furnished and not filed and shall not be deemed to be soliciting material or subject to Regulation 14A, shall not be deemed filed for purposes of Section 18 of the Securities Exchange Act of 1934, as amended (the Exchange Act), or otherwise subject to the liabilities of that section, nor shall it be deemed incorporated by reference in any filing under the Securities Act of 1933, as amended (the Securities Act).
24
Recent Sales of Unregistered Securities
During the three months ended June 30, 2018, we issued approximately 264,000 shares of unregistered common stock to the holders of warrants that we sold in December 2012 for the purchase of up to 6.3 million shares of our common stock, subject to antidilution adjustments, at a strike price of $40.04 per share.
25
| Item 6. | Selected Financial Data. |
You should read the following consolidated financial data in conjunction with the Financial Statements, including the related notes, and Item 7. Management's Discussion and Analysis of Financial Condition and Results of Operations. The results shown herein are not necessarily indicative of the results to be expected for any future periods.
SELECTED CONSOLIDATED FINANCIAL DATA
| Fiscal Year Ended June 30, | ||||||||||||||||||||
| 2018 | 2017 | 2016 | 2015 | 2014 | ||||||||||||||||
| (in thousands, expect per share data) | ||||||||||||||||||||
Revenues: | ||||||||||||||||||||
Subscriptions and transactions | $ | 262,363 | $ | 222,997 | $ | 195,187 | $ | 171,361 | $ | 141,103 | ||||||||||
Software licenses | 10,277 | 11,685 | 20,826 | 21,907 | 20,769 | |||||||||||||||
Service and maintenance | 114,926 | 109,633 | 120,292 | 130,183 | 131,531 | |||||||||||||||
Other | 6,530 | 5,097 | 6,969 | 7,438 | 7,182 | |||||||||||||||
|
|
|
|
|
|
|
|
|
| |||||||||||
Total revenues | 394,096 | 349,412 | 343,274 | 330,889 | 300,585 | |||||||||||||||
Cost of revenues: | ||||||||||||||||||||
Subscriptions and transactions | 117,033 | 103,777 | 87,775 | 79,397 | 69,220 | |||||||||||||||
Software licenses | 815 | 818 | 1,030 | 1,583 | 1,602 | |||||||||||||||
Service and maintenance | 52,250 | 53,494 | 53,236 | 53,094 | 54,463 | |||||||||||||||
Other | 3,032 | 3,737 | 5,059 | 5,367 | 5,383 | |||||||||||||||
|
|
|
|
|
|
|
|
|
| |||||||||||
Total cost of revenues | 173,130 | 161,826 | 147,100 | 139,441 | 130,668 | |||||||||||||||
|
|
|
|
|
|
|
|
|
| |||||||||||
Gross profit | 220,966 | 187,586 | 196,174 | 191,448 | 169,917 | |||||||||||||||
Operating expenses: | ||||||||||||||||||||
Sales and marketing | 85,912 | 77,470 | 84,068 | 80,151 | 72,707 | |||||||||||||||
Product development and engineering | 57,310 | 53,002 | 47,355 | 47,185 | 39,725 | |||||||||||||||
General and administrative | 49,837 | 46,527 | 39,324 | 34,492 | 33,721 | |||||||||||||||
Amortization of acquisition-related intangible assets | 22,076 | 24,246 | 28,978 | 30,383 | 26,242 | |||||||||||||||
Goodwill impairment charge | - | 7,529 | - | - | - | |||||||||||||||
|
|
|
|
|
|
|
|
|
| |||||||||||
Total operating expenses | 215,135 | 208,774 | 199,725 | 192,211 | 172,395 | |||||||||||||||
|
|
|
|
|
|
|
|
|
| |||||||||||
Income (loss) from operations | 5,831 | (21,188 | ) | (3,551 | ) | (763 | ) | (2,478 | ) | |||||||||||
Other expense, net | (4,706 | ) | (17,086 | ) | (15,312 | ) | (15,553 | ) | (14,544 | ) | ||||||||||
|
|
|
|
|
|
|
|
|
| |||||||||||
Income (loss) before income taxes | 1,125 | (38,274 | ) | (18,863 | ) | (16,316 | ) | (17,022 | ) | |||||||||||
Income tax provision (benefit) | (8,203 | ) | (5,137 | ) | 785 | 18,364 | 2,082 | |||||||||||||
|
|
|
|
|
|
|
|
|
| |||||||||||
Net income (loss) | $ | 9,328 | $ | (33,137 | ) | $ | (19,648 | ) | $ | (34,680 | ) | $ | (19,104 | ) | ||||||
|
|
|
|
|
|
|
|
|
| |||||||||||
Net income (loss) per share: | ||||||||||||||||||||
Basic | $ | 0.24 | $ | (0.88 | ) | $ | (0.52 | ) | $ | (0.92 | ) | $ | (0.52 | ) | ||||||
|
|
|
|
|
|
|
|
|
| |||||||||||
Diluted | $ | 0.24 | $ | (0.88 | ) | $ | (0.52 | ) | $ | (0.92 | ) | $ | (0.52 | ) | ||||||
|
|
|
|
|
|
|
|
|
| |||||||||||
Shares used in computing net income (loss) per share: | ||||||||||||||||||||
Basic | 38,227 | 37,842 | 37,957 | 37,806 | 36,834 | |||||||||||||||
|
|
|
|
|
|
|
|
|
| |||||||||||
Diluted | 39,326 | 37,842 | 37,957 | 37,806 | 36,834 | |||||||||||||||
|
|
|
|
|
|
|
|
|
| |||||||||||
26
| At June 30, | ||||||||||||||||||||
| 2018 | 2017 | 2016 | 2015 | 2014 | ||||||||||||||||
| (in thousands) | ||||||||||||||||||||
Balance Sheet Data: | ||||||||||||||||||||
Cash and cash equivalents | $ | 121,860 | $ | 124,569 | $ | 97,174 | $ | 121,163 | $ | 167,673 | ||||||||||
Marketable securities | 10,012 | 1,973 | 35,209 | 23,225 | 23,805 | |||||||||||||||
Working capital (1) | 105,357 | (88,394 | ) | 104,479 | 122,799 | 172,384 | ||||||||||||||
Total assets | 635,968 | 617,439 | 651,210 | 685,623 | 696,298 | |||||||||||||||
Long-term debt (2) | 150,000 | - | 169,857 | 156,899 | 144,750 | |||||||||||||||
Total stockholders' equity | 310,932 | 261,956 | 294,787 | 348,538 | 387,426 | |||||||||||||||
| (1) | At June 30, 2017, the negative working capital position arose due to the inclusion of our convertible senior notes, which matured in December 2017, as a current rather than long-term liability. We financed the repayment of the principal balance of our convertible senior notes through a combination of cash on hand and with borrowings of $150 million under our revolving credit facility in the amount of up to $300 million (Credit Facility). |
| (2) | Our long-term debt as of June 30, 2016, 2015 and 2014 consisted of our convertible senior notes. The convertible senior notes are shown in our consolidated balance sheets at their carrying value which represents the principal balance of $189.8 million less any unamortized discount and debt issuance costs. Our long-term debt as of June 30, 2018 consisted of our borrowings under the Credit Facility. |
27
Item 7. Management's Discussion and Analysis of Financial Condition and Results of Operations.
The following discussion and analysis of our financial condition and results of operations should be read in conjunction with the Selected Consolidated Financial Data and the financial statements and notes thereto appearing elsewhere in this Annual Report on Form 10-K. This Annual Report on Form 10-K contains forward-looking statements that involve risks and uncertainties. The statements contained in this Annual Report that are not purely historical are forward-looking statements within the meaning of Section 27A of the Securities Act of 1933, as amended, and Section 21E of the Securities Exchange Act of 1934, as amended (the Exchange Act). Without limiting the foregoing, the words may, will, should, could, expects, plans, intends, anticipates, believes, estimates, predicts, potential and similar expressions are intended to identify forward-looking statements. All forward-looking statements included in this Annual Report on Form 10-K are based on information available to us up to and including the date of this report, and we assume no obligation to update any such forward-looking statements. Our actual results could differ materially from those anticipated in these forward-looking statements as a result of certain factors, including those set forth in Management's Discussion and Analysis of Financial Condition and Results of Operations and Risk Factors and elsewhere in this Form 10-K. You should carefully review those factors and also carefully review the risks outlined in other documents that we file from time to time with the Securities and Exchange Commission (SEC).
In the management discussion that follows we have highlighted those changes and operating factors that were the primary factors affecting period to period fluctuations. The remainder of the change in period to period fluctuations from that which is specifically discussed arises from various individually insignificant items.
Overview
We help make complex business payments simple, smart and secure. Corporations and banks rely on us for domestic and international payments, efficient cash management, automated workflows for payment processing and bill review, and state of the art fraud detection, behavioral analytics and regulatory compliance solutions. The majority of our revenues are derived from offerings sold as SaaS-based solutions and paid for on a subscription and transaction basis.
We operate cloud-based settlement networks that facilitate electronic payments and transaction settlement between businesses, their vendors and banks. We offer cloud and on-premise solutions that banks use to provide payment, cash management and treasury capabilities to their business customers, as well as solutions that financial institutions use to facilitate customer acquisition and growth. Our cloud-based legal spend management solutions help manage and determine the right amount to pay for legal services and claims vendor expenditures for insurance companies and other large consumers of outside legal services. Corporate customers rely on our solutions to automate payment and accounts payable processes and to streamline and manage the production and retention of electronic documents. Our healthcare customers use our solutions to streamline financial processes, particularly the patient enrollment process. We also offer comprehensive cyber fraud and risk management solutions that are designed to non-invasively monitor and analyze user behavior and payment transactions to flag behavioral and data anomalies and other suspicious activity.
Our solutions are designed to complement, leverage and extend our customers' existing information systems, accounting applications and banking relationships so that they can be deployed quickly and efficiently. To help our customers realize the maximum value from our products and meet their specific business requirements, we also provide professional services for installation, training, consulting and product enhancement.
Financial Highlights
For the fiscal year ended June 30, 2018, our revenue increased to $394.1 million from $349.4 million in the prior fiscal year. The revenue increase was attributable to revenue increases in all of our operating segments. Specifically, we recorded revenue increases in our Cloud Solutions segment of $27.5 million, our Banking Solutions segment of $12.6 million, our Payments and Transactional Documents segment of $3.2 million and our Other segment of $1.4 million. Increased revenue from our legal spend management and settlement network
28
solutions accounted for the revenue increase in our Cloud Solutions segment. The Banking Solutions segment's revenue increase was primarily due to increased subscription and transaction revenue from our cloud based solutions and professional services revenue as customers continued to deploy our solutions. The revenue increase in our Payments and Transactional Documents segment was related to higher European subscription and transaction revenue in our payment products. Our revenue for the fiscal year ended June 30, 2018 was favorably impacted by $6.4 million due to the impact of foreign currency exchange rates primarily related to the British Pound Sterling that appreciated against the U.S. Dollar as compared to the prior fiscal year.
Net income was $9.3 million in the fiscal year ended June 30, 2018 compared to a net loss of $33.1 million in the prior fiscal year. Our net income for the fiscal year ended June 30, 2018 was favorably impacted by gross profit expansion of $33.4 million and reduced other expense, net of $12.4 million, primarily attributable to decreases in the amortization of debt discount costs upon the maturity of our Convertible Senior Notes (Notes) and the contribution of $6.1 million of other income associated with the sale of a cost method investment during fiscal 2018. The increase in gross margins was driven by increases in revenue in our Cloud Solutions and Banking Solutions segments. Our operating expenses increased $6.4 million in the fiscal year ended June 30, 2018 compared to the prior fiscal year, primarily due to an increase in sales and marketing costs of $8.4 million, increased product development and engineering costs of $4.3 million and increased general and administrative costs of $3.3 million, partially offset by the absence of a goodwill impairment charge of $7.5 million we incurred during the prior fiscal year. Our operating expenses in the fiscal year ended June 30, 2018 were unfavorably impacted by $2.1 million due to the impact of foreign currency exchange rates primarily related to the British Pound Sterling which appreciated against the U.S. Dollar as compared to the prior fiscal year. In fiscal 2018 we recorded a non-recurring income tax benefit of $8.0 million as a result of U.S. federal income tax changes enacted during the year.
In the fiscal year ended June 30, 2018, we derived approximately 39% of our revenue from customers located outside of North America, principally in the United Kingdom, continental Europe and the Asia-Pacific region.
We expect future revenue growth to be driven primarily by our banking, legal spend management and settlement network solutions.
Over the past several years we have made strategic investments in innovative new technology offerings that we believe will enhance our competitive position, help us win new business, drive subscription revenue growth and expand our operating margins. We expect to continue to make investments in our suite of products so that we can continue to offer innovative, feature-rich technology solutions to our customers.
Revenue Sources
Our revenues are derived from multiple sources and are reported under the following classifications:
| • | S ubscriptions and Transactions Fees . We derive subscription and transaction fees from a number of sources, principally our SaaS offerings. Subscription revenues are typically recognized on a ratable basis over the subscription period. Transaction revenues are typically recorded at the time transactions are processed. Some of our SaaS products require customers to pay upfront integration or implementation fees. In these cases, since the up-front fees do not represent a separate revenue earnings process, they are deferred and recognized as revenue over the estimated life of the customer relationship, which is generally between five and ten years. A significant part of our focus remains on growing the revenue contribution from our SaaS offerings and subscriptions and transactions based revenue streams. |
| • | Software License Fees . Software license revenues, which we derive from our software applications, are generally based on the number of software applications and user licenses purchased. Fees from the sale of perpetual software licenses are generally recognized upon delivery of the software to the customer, assuming that payment from the customer is probable and there are no extended payment terms. Some of our software arrangements, particularly those related to financial institution customers, are |
29
recognized on a percentage of completion basis over the life of the project because they require significant customization and modification and involve extended implementation periods. Recently however, the number of percentage of completion arrangements we enter into has declined as we have continued to de-emphasize large, highly customized projects in lieu of standard product deployments and our cloud-based solutions. |
| • | Service and Maintenance Fees . Our service and maintenance revenues consist of professional services fees and customer support and maintenance fees. Revenues relating to professional services not associated with highly customized software solutions are normally recognized at the time services are rendered. Professional services revenues associated with software license arrangements that include significant customization and modification are generally recognized on a percentage of completion basis over the life of the project. Software maintenance fees are recognized as revenue ratably over the respective maintenance period, which is typically one year. |
| • | Other Revenues . We derive other revenues from the sale of printers, check paper and magnetic ink character recognition toners. These revenues are normally recognized at the time of delivery. |
Critical Accounting Policies and Significant Judgments and Estimates
We believe that several accounting policies are important to understanding our historical and future performance. We refer to these policies as critical because these specific areas generally require us to make judgments and estimates about matters that are uncertain at the time we make the estimate, and different estimates - which also would have been reasonable - could have been used. These critical accounting policies and estimates relate to revenue recognition, the valuation of goodwill and intangible assets, the valuation of acquired deferred revenue and income taxes. These critical policies and our procedures related to these policies are discussed below. In addition, refer to Note 2 Significant Accounting Policies to our consolidated financial statements included in Item 8 of this Annual Report on Form 10-K for further details regarding this matter.
Revenue Recognition
Software Arrangements
We recognize revenue on our software license arrangements when four basic criteria are met: persuasive evidence of an arrangement exists, delivery of the product has occurred, the fee is fixed and determinable and collectability is probable. We consider a fully executed agreement or a customer purchase order to be persuasive evidence of an arrangement. Delivery is deemed to have occurred upon transfer of the product to the customer or the completion of services rendered. We consider the arrangement fee to be fixed and determinable if it is not subject to adjustment and if the customer has not been granted extended payment terms. Excluding our long term contract arrangements for which revenue is recorded on a percentage of completion basis, extended payment terms are deemed to be present when any portion of the software license fee is due in excess of 90 days after the date of product delivery. In arrangements that contain extended payment terms, software revenue is recorded as customer payments become contractually due, assuming all other revenue recognition criteria have been met. We consider the arrangement fee to be probable of collection if our internal credit analysis indicates that the customer will be able to pay contractual amounts as they become due.
Our software arrangements often contain multiple revenue elements, such as software licenses, professional services and post-contract customer support. For multiple element software arrangements which qualify for separate element treatment, revenue is recognized for each element when each of the four basic criteria is met which, excluding post-contract customer support, is typically upon delivery. Revenue for post-contract customer support agreements is recognized ratably over the term of the agreement, which is generally one year. Revenue is allocated to each element, excluding the software license, based on vendor specific objective evidence (VSOE). VSOE is limited to the price charged when the element is sold separately or, for an element not yet being sold separately, the price established by management having the relevant authority. We do not have VSOE for our software licenses since they are seldom sold separately. Accordingly, revenue is allocated to the software license using the residual value method. Under the residual value method, revenue equal to VSOE
30
of each undelivered element is recognized upon delivery of that element. Any remaining arrangement fee is then allocated to the software license. This has the effect of allocating any sales discount inherent in the arrangement to the software license fee.
Certain of our software arrangements require significant customization and modification and involve extended implementation periods. These arrangements do not qualify for separate element revenue recognition treatment as described above, and instead must be accounted for under contract accounting. Under contract accounting, companies must select from two generally accepted methods of accounting: the completed contract method and the percentage of completion method. The completed contract method recognizes revenue and costs upon contract completion, and all project costs and revenues are reported as deferred items in the balance sheet until that time. The percentage of completion method recognizes revenue and costs on a contract over time, as the work progresses.
We use the percentage of completion method of accounting for our long-term contracts, as we believe that we can make reasonably reliable estimates of progress toward completion. Progress is measured based on labor hours, as measured at the end of each reporting period, as a percentage of total expected labor hours. Accordingly, the revenue we record in any reporting period for arrangements accounted for on a percentage of completion basis is dependent upon our estimates of the remaining labor hours that will be incurred in fulfilling our contractual obligations. Our estimates at the end of any reporting period could prove to be materially different from final project results, as determined only at subsequent stages of project completion. To mitigate this risk, we solicit the input of our project professional staff on a monthly basis, as well as at the end of each financial reporting period, for purposes of evaluating cumulative labor hours incurred and verifying the estimated remaining effort to completion; this ensures that our estimates are always based on the most current projections available.
Non-Software Arrangements
For arrangements governed by general revenue recognition literature, such as with our SaaS offerings or equipment and supplies only sales, we recognize revenue when four basic criteria are met. These criteria are similar to those governing software transactions: persuasive evidence of an arrangement exists, delivery has occurred or services have been rendered, the arrangement fee is fixed or determinable and collectability is reasonably assured. For our SaaS offerings, revenue is generally recognized on a subscription or transaction basis over the period of performance.
For arrangements consisting of multiple elements, revenue is allocated to each element based on a selling price hierarchy. The selling price of each element is based on VSOE if available, third-party evidence (TPE) if VSOE is not available or estimated selling price (ESP) if neither VSOE nor TPE are available. The residual method of allocation in a non-software arrangement is not permitted and, instead, arrangement consideration is allocated at the inception of the arrangement to all deliverables using the relative selling price method. The relative selling price method allocates any discount in the arrangement proportionately to each deliverable based on the proportion of each deliverable's selling price to the total arrangement fee. We are typically unable to establish TPE, which is based on the selling price charged by unrelated third-party vendors for similar deliverables when they are sold separately, as we are generally unable to obtain sufficient information on actual vendor selling prices to substantiate TPE. The objective of ESP is to estimate the price at which we would transact if the deliverable were sold separately rather than as part of a multiple element arrangement. Our determination of ESP considers several factors, including actual selling prices for similar transactions, gross margin expectations and our ongoing pricing strategy. We formally analyze our ESP determinations on at least an annual basis.
Effective July 1, 2018 we will adopt new accounting standards related to revenue recognition. Please see Note 3 Recent Accounting Pronouncements to our consolidated financial statements included in Item 8 of this Annual Report on Form 10-K for further discussion on the pending accounting pronouncement.
31
Goodwill and Acquired Intangible Assets
Goodwill and acquired intangible assets are initially recorded at fair value and tested periodically for impairment. We performed our annual impairment test of the carrying value of our goodwill for fiscal year 2018 during our fourth quarter, which is consistent with the historic timing of our annual goodwill impairment review. Our analysis of goodwill impairment was performed at the reporting unit level, which requires an estimate of the fair value of each reporting unit.
Based on the results of our annual impairment review during the fourth quarter of fiscal year 2018, we concluded there was no goodwill impairment in any of our reporting units. However, there can be no assurance that there will not be impairment charges in subsequent periods as a result of our future impairment reviews. To the extent that future impairment charges occur, it would have a material impact on our financial results. At June 30, 2018, the carrying value of goodwill for all of our reporting units was approximately $200.0 million.
In addition to our annual goodwill impairment review, we also perform periodic reviews of the carrying value and amortization periods of our other acquired intangible assets. These acquired intangible assets consist primarily of acquired customer related assets and acquired core technology. In evaluating potential impairment of these assets we specifically consider whether any indicators of impairment are present, including:
| • | whether there has been a significant adverse change in the business climate that affects the value of an asset; |
| • | whether there has been a significant change in the extent or manner in which an asset is used; and |
| • | whether there is an expectation that the asset will be sold or disposed of before the end of its originally estimated useful life. |
If indicators of impairment are present, an estimate of the undiscounted cash flows that the specific asset is expected to generate must be made to ensure that the carrying value of the asset can be recovered. These estimates involve significant subjectivity. At June 30, 2018, the carrying value of our acquired intangible assets, excluding goodwill, capitalized software and purchased software, was approximately $119.2 million. As a result of our fiscal year 2018 impairment review, we concluded that none of these assets were impaired.
Valuation of Acquired Intangible Assets and Acquired Deferred Revenue
In connection with our acquisitions, we have recorded acquired intangible assets relating principally to customer related assets, acquired technology and acquired contractual rights that include favorable economic terms as compared to overall market rates at the date of acquisition. The valuation process used to calculate the values assigned to these acquired intangible assets is complex and involves significant estimation relative to our financial projections. The principal component of the valuation process is the determination of discounted future cash flows, and there are a number of variables that we consider for purposes of projecting these future cash flows. There is inherent uncertainty involved with this estimation process and, while our estimates are consistent with our internal planning assumptions, the ultimate accuracy of these estimates is only verifiable over time. Further, the projections required for the valuation process generally utilize at least a ten-year forecast, which exceeds our normal internal planning and forecasting timeline. The particularly sensitive components of these estimates include, but are not limited to:
| • | the selection of an appropriate discount rate; |
| • | the required return on all assets employed by the valued asset to generate future income streams; |
| • | our projected overall revenue growth and mix of revenue; |
| • | our gross margin estimates (which are highly dependent on our mix of revenue); |
| • | our technology and product life cycles; |
| • | the attrition rate of our customers, particularly those who contribute to our recurring revenue streams, such as software maintenance; |
32
| • | the determination of third party market rates for leases or other contractual rights we acquire, for purposes of assessing whether we have acquired a favorable, unfavorable or at-market contract; |
| • | our planned level of operating expenses; and |
| • | our effective tax rate by operating geography. |
Additionally, we are required to estimate the acquisition date fair value of acquired deferred revenue that we assume as part of any acquisition. The acquisition date fair value of deferred revenue is estimated based on the costs we expect to incur in fulfilling the acquired obligations, plus a normal profit margin. Cost estimates exclude amounts relating to any selling effort, since those costs would have been incurred by the predecessor company. In the case of acquired software maintenance contracts, cost estimates also exclude any ongoing research and development expenses associated with product upgrades since these amounts typically do not represent a legal obligation that we assume at the time of acquisition.
Income Taxes
We are subject to the income tax laws of the United States (including its states and municipalities) as well as the tax laws of the foreign jurisdictions in which we operate. Our annual tax rate is determined based on our income, statutory tax rates and the tax impact of items treated differently for tax purposes than for financial statement purposes. The income tax expense we record in any interim period is based on our estimated tax rate for the full fiscal year, which requires us to estimate our annual pretax income and tax expense by jurisdiction. This process is inherently subjective and requires us to make estimates relative to our business plans, tax planning opportunities and operating results. An interim tax rate is subject to adjustment if, in later periods, there are changes to our estimate of total tax expense or pretax income, including income by jurisdiction. We update these estimates on a quarterly basis, so that our interim financial statements reflect our most current projections for the full fiscal year.
Our income tax expense consists of two components: current and deferred. Current tax expense represents our estimate of taxes to be paid for the current period, including income tax expense arising from uncertain tax positions. Deferred tax expense results from changes in deferred tax assets and liabilities between periods. Deferred tax assets and liabilities arise due to differences between when certain transactions are reflected in our financial statements and when those same items are included in a tax return. Deferred tax assets generally reflect the impact of a tax deduction, tax credit or operating loss carryforward that we have available for use in future year tax returns. Deferred tax liabilities generally reflect the impact of a deduction or expenditure that we have already taken in a tax return but that we have not yet reflected in our financial statements.
We record a deferred tax asset if we believe that it is more likely than not that we will realize a future tax benefit. Ultimate realization of any deferred tax asset is dependent on our ability to generate sufficient future taxable income in the appropriate tax jurisdiction before the expiration of carryforward periods, if any. Our assessment of deferred tax asset recoverability considers many different factors including historical and projected operating results, the reversal of existing deferred tax liabilities that provide a source of future taxable income, the impact of current tax planning strategies and the availability of future tax planning strategies. We establish a valuation allowance against any deferred tax asset for which we are unable to conclude that recoverability is more likely than not. This is inherently judgmental, since we are required to assess many different factors and evaluate as much objective evidence as we can in reaching an overall conclusion. The particularly sensitive component of our evaluation is our projection of future operating results since this relies heavily on our estimates of future revenue and expense levels by tax jurisdiction.
We establish reserves to remove some or all of the tax benefit we would have otherwise recorded if a tax position is uncertain. In evaluating whether a tax position is uncertain, we base our assessment on existing tax legislation, case law and legal statute. We also presume that the tax position will be examined by the relevant taxing authority that has full knowledge of all relevant information. We recognize tax benefits related to uncertain tax positions at the largest amount deemed more likely than not will be realized upon tax examination. We review our tax positions quarterly and adjust the balances as necessary.
33
Recent Accounting Pronouncements
For information with respect to recent accounting pronouncements and the impact of these pronouncements on our consolidated financial statements, see Note 3 Recent Accounting Pronouncements to our consolidated financial statements included in Item 8 of this Annual Report on Form 10-K.
Results of Operations
Fiscal Year Ended June 30, 2018 Compared to Fiscal Year Ended June 30, 2017
Segment Information
Operating segments are components of an enterprise for which separate financial information is available that is evaluated regularly by the chief operating decision maker in deciding how to allocate resources and in assessing performance. Our chief operating decision maker is our chief executive officer.
Our operating segments are organized principally by the type of product or service offered and by geography. Similar operating segments have been aggregated into four reportable segments: Cloud Solutions, Banking Solutions, Payments and Transactional Documents and Other.
The following tables represent our segment revenues and our segment measure of profit (loss):
| Fiscal Year Ended June 30, | Increase (Decrease) Between Periods | |||||||||||||||
| 2018 | 2017 | $ Change Inc (Dec) | % Change Inc (Dec) | |||||||||||||
| (Dollars in thousands) | ||||||||||||||||
Segment revenue: | ||||||||||||||||
Cloud Solutions | $ | 182,290 | $ | 154,821 | $ | 27,469 | 17.7 % | |||||||||
Banking Solutions | 91,851 | 79,227 | 12,624 | 15.9 % | ||||||||||||
Payments and Transactional Documents | 101,372 | 98,150 | 3,222 | 3.3 % | ||||||||||||
Other | 18,583 | 17,214 | 1,369 | 8.0 % | ||||||||||||
|
|
|
|
|
| |||||||||||
Total segment revenue | $ | 394,096 | $ | 349,412 | $ | 44,684 | 12.8 % | |||||||||
|
|
|
|
|
| |||||||||||
Segment measure of profit (loss): | ||||||||||||||||
Cloud Solutions | $ | 37,862 | $ | 28,044 | $ | 9,818 | 35.0 % | |||||||||
Banking Solutions | 9,703 | 2,901 | 6,802 | 234.5 % | ||||||||||||
Payments and Transactional Documents | 28,373 | 29,832 | (1,459 | ) | (4.9)% | |||||||||||
Other | (2,199 | ) | (3,075 | ) | 876 | 28.5 % | ||||||||||
|
|
|
|
|
| |||||||||||
Total measure of segment profit | $ | 73,739 | $ | 57,702 | $ | 16,037 | 27.8 % | |||||||||
|
|
|
|
|
| |||||||||||
34
A reconciliation of the measure of total segment profit to our GAAP income (loss) before income taxes is as follows:
| Fiscal Year Ended June 30, | ||||||||
| 2018 | 2017 | |||||||
| (in thousands) | ||||||||
Total measure of segment profit | $ | 73,739 | $ | 57,702 | ||||
Less: | ||||||||
Amortization of acquisition-related intangible assets | (22,076 | ) | (24,246 | ) | ||||
Goodwill impairment charge | - | (7,529 | ) | |||||
Fixed asset charge | - | (2,399 | ) | |||||
Stock-based compensation plan expense | (34,200 | ) | (31,913 | ) | ||||
Acquisition and integration-related expenses | (2,564 | ) | (2,596 | ) | ||||
Restructuring expenses | (1,495 | ) | (547 | ) | ||||
Legal settlement | (1,269 | ) | - | |||||
Minimum pension liability adjustments | (24 | ) | (1,079 | ) | ||||
Other non-core income | 150 | 223 | ||||||
Global ERP system implementation and other costs | (6,430 | ) | (8,804 | ) | ||||
Other expense, net | (4,706 | ) | (17,086 | ) | ||||
|
|
|
| |||||
Income (loss) before income taxes | $ | 1,125 | $ | (38,274 | ) | |||
|
|
|
| |||||
Cloud Solutions
Revenues from our Cloud Solutions segment increased $27.5 million for the fiscal year ended June 30, 2018 as compared to the prior fiscal year, inclusive of a favorable impact of foreign currency exchange rates of $2.3 million, due primarily to increased revenue of $20.8 million from our settlement network solutions and $6.7 million from our legal spend management solutions. Our legal spend management solutions revenue for the fiscal year ended June 30, 2017 included the revenue impact of a large customer program which went live, impacting our year over year growth rate in the fiscal year ended June 30, 2018. Segment profit increased $9.8 million for the fiscal year ended June 30, 2018 as compared to the prior fiscal year, inclusive of a favorable impact of foreign currency exchange rates of $0.5 million, due primarily to the revenue increase described above, partially offset by increased cost of revenues of $9.8 million and increased operating expenses of $7.9 million primarily related to increased sales and marketing costs. We expect revenue and profit for the Cloud Solutions segment to increase in fiscal year 2019 as a result of increased revenue from both our legal spend management solutions and settlement network solutions.
Banking Solutions
Revenues from our Banking Solutions segment increased $12.6 million for the fiscal year ended June 30, 2018 as compared to the prior fiscal year, due primarily to increased services revenue of $5.3 million as a result of our continued deployment of our newer banking solutions and increased subscriptions and transactions revenue as we continued to expand the number of customers on our SaaS platforms, of $3.3 million. The Banking Solutions segment also recorded other revenues of $2.6 million, which represented the one-time buyout of a revenue share arrangement. Segment profit increased $6.8 million for the fiscal year ended June 30, 2018 as compared to the prior fiscal year, due primarily to the revenue increase described above, partially offset by increased cost of revenues of $4.1 million and increased sales and marketing expenses of $1.1 million. We expect revenue and profit for the Banking Solutions segment to remain relatively consistent in fiscal year 2019.
35
Payments and Transactional Documents
Revenues from our Payments and Transactional Documents segment increased $3.2 million for the fiscal year ended June 30, 2018 as compared to the prior fiscal year, inclusive of a favorable impact of foreign currency exchange rates of $4.0 million, due primarily to increased subscription and transaction revenue of $9.3 million from our European payments and transactional documents solutions, partially offset by decreased software license revenue of $3.3 million and decreased service and maintenance revenue of $1.7 million. The segment profit decrease of $1.5 million for the fiscal year ended June 30, 2018 as compared to the prior fiscal year, inclusive of a favorable impact of foreign currency exchange rates of $1.4 million, was primarily attributable to increased sales and marketing expenses of $3.2 million and increased product development and engineering expenses of $1.3 million, partially offset by the revenue increase described above. We expect revenue for the Payments and Transactional Documents segment to increase and profit to remain relatively consistent in fiscal year 2019 as a result of increased sales of our payment and document automation solutions.
Other
Revenues and profit from our Other segment remained relatively consistent for the fiscal year ended June 30, 2018 as compared to the prior fiscal year. We expect Other segment revenue to increase slightly and profit to decrease slightly in fiscal year 2019 principally as the result of increased sales of our cyber fraud and risk management products, offset by increased product development expenditures.
Revenues by Category
| Fiscal Year Ended June 30, | Increase (Decrease) Between Periods | |||||||||||||
| 2018 | 2017 | $ Change Inc (Dec) | % Change | |||||||||||
| (Dollars in thousands) | ||||||||||||||
Revenues: | ||||||||||||||
Subscriptions and transactions | $ | 262,363 | $ | 222,997 | $ | 39,366 | 17.7 % | |||||||
Software licenses | 10,277 | 11,685 | (1,408 | ) | (12.0)% | |||||||||
Service and maintenance | 114,926 | 109,633 | 5,293 | 4.8 % | ||||||||||
Other | 6,530 | 5,097 | 1,433 | 28.1 % | ||||||||||
|
|
|
|
|
| |||||||||
Total revenues | $ | 394,096 | $ | 349,412 | $ | 44,684 | 12.8 % | |||||||
|
|
|
|
|
| |||||||||
Subscriptions and Transactions
Revenues from subscriptions and transactions increased $39.4 million for the fiscal year ended June 30, 2018 as compared to the prior fiscal year, inclusive of a favorable impact of foreign currency exchange rates of $3.0 million. The overall revenue increase was due principally to increases in revenue from our Cloud Solutions segment and Payments and Transactional Documents segment of $26.6 million and $9.3 million, respectively, as well as an increase in revenue from our Banking Solutions segment of $3.3 million. We expect subscriptions and transactions revenues to increase in fiscal year 2019 as compared to the prior fiscal year, primarily as a result of the revenue contribution from our legal spend management solutions and settlement network solutions and revenue increases in our Banking Solutions segment.
Software Licenses
Revenues from software licenses decreased $1.4 million for the fiscal year ended June 30, 2018 as compared to the prior fiscal year, primarily as a result of decreased revenue from our Payments and Transactional Documents segment of $3.3 million, partially offset by increased revenue from our Banking Solutions segment and Other segment of $1.0 and $0.9 million, respectively. The decreased revenue from our Payments and Transactional Documents segment was primarily due to our European payments and documents automation solutions, where we are consciously de-emphasizing software license sales in favor of our cloud payments products. We expect software license revenues to increase in fiscal year 2019, primarily as a result of revenue contribution from our Banking Solutions segment and Payments and Transactional Documents segment.
36
Service and Maintenance
Revenues from service and maintenance increased $5.3 million for the fiscal year ended June 30, 2018 as compared to the prior fiscal year, inclusive of a favorable impact of foreign currency exchange rates of $2.7 million. The overall revenue increase was primarily the result of increased revenue from our Banking Solutions segment and Cloud Solutions segment of $5.8 million and $0.8 million, respectively, partially offset by decreased revenue from our Payments and Transactional Documents segment of $1.7 million, primarily due to our European payments and documents automation solutions. We expect service and maintenance revenues will decrease slightly in fiscal year 2019 as a result of decreased revenue contribution from our Banking Solutions segment.
Other
Our other revenues consist principally of equipment and supplies sales, which remained minor components of our overall revenue. The increase in other revenues was due to the impact in fiscal 2018 of $2.6 million in our Banking Solutions segment, arising from the one-time buyout of a revenue share arrangement. We expect other revenues will decrease in fiscal year 2019, primarily due to the absence of this revenue amount.
Cost of Revenues
| Fiscal Year Ended June 30, | Increase (Decrease) Between Periods | |||||||||||||
| 2018 | 2017 | $ Change Inc (Dec) | % Change | |||||||||||
| (Dollars in thousands) | ||||||||||||||
Cost of revenues: | ||||||||||||||
Subscriptions and transactions | $ | 117,033 | $ | 103,777 | $ | 13,256 | 12.8 % | |||||||
Software licenses | 815 | 818 | (3 | ) | (0.4)% | |||||||||
Service and maintenance | 52,250 | 53,494 | (1,244 | ) | (2.3)% | |||||||||
Other | 3,032 | 3,737 | (705 | ) | (18.9)% | |||||||||
|
|
|
|
|
| |||||||||
Total cost of revenues | $ | 173,130 | $ | 161,826 | $ | 11,304 | 7.0 % | |||||||
|
|
|
|
|
| |||||||||
Gross profit | $ | 220,966 | $ | 187,586 | $ | 33,380 | 17.8 % | |||||||
|
|
|
|
|
| |||||||||
Subscriptions and Transactions
Subscriptions and transactions costs include salaries and other related costs for our professional services teams as well as costs related to our hosting infrastructure such as depreciation and facilities related expenses. Subscriptions and transactions costs as a percentage of subscriptions and transactions revenues decreased slightly to 45% for the fiscal year ended June 30, 2018 as compared to 47% for the prior fiscal year, due primarily to the revenue increases in our legal spend management and settlement network solutions. We expect subscriptions and transactions costs as a percentage of subscriptions and transactions revenues will decrease slightly in fiscal year 2019 as a result of increased revenue contribution from our cloud-based banking, legal spend management and settlement network solutions.
Software Licenses
Software license costs consist of expenses incurred by us to manufacture, package and distribute our software products and related documentation and costs of licensing third party software that is incorporated into or sold with certain of our products. Software license costs as a percentage of software license revenues remained consistent at 8% for the fiscal year ended June 30, 2018 as compared to 7% for the prior fiscal year. We expect software license costs as a percentage of software license revenues will remain relatively consistent in fiscal year 2019.
37
Service and Maintenance
Service and maintenance costs include salaries and other related costs for our customer service, maintenance and help desk support staffs, as well as third party contractor expenses used to complement our professional services team. Service and maintenance costs as a percentage of service and maintenance revenues decreased to 45% for the fiscal year ended June 30, 2018 as compared to 49% for the prior fiscal year, due primarily to gross margin improvement in our Banking Solutions segment, as new customers continued to deploy our solutions. We expect service and maintenance costs as a percentage of service and maintenance revenues will increase slightly in fiscal year 2019 as we continue the implementation phases of certain customers in our Banking Solutions segment.
Other
Other costs include the costs associated with equipment and supplies that we resell, as well as freight, shipping and postage costs associated with the delivery of our products and remain minor components of our business. We expect other costs as a percentage of other revenues will increase in fiscal year 2019, due to the absence of a one-time revenue transaction recorded in fiscal 2018.
Operating Expenses
| Fiscal Year Ended June 30, | Increase (Decrease) Between Periods | |||||||||||||||
| 2018 | 2017 | $ Change Inc (Dec) | % Change Inc (Dec) | |||||||||||||
| (Dollars in thousands) | ||||||||||||||||
Operating expenses: | ||||||||||||||||
Sales and marketing | $ | 85,912 | $ | 77,470 | $ | 8,442 | 10.9 % | |||||||||
Product development and engineering | 57,310 | 53,002 | 4,308 | 8.1 % | ||||||||||||
General and administrative | 49,837 | 46,527 | 3,310 | 7.1 % | ||||||||||||
Amortization of acquisition-related intangible assets | 22,076 | 24,246 | (2,170 | ) | (8.9)% | |||||||||||
Goodwill impairment charge | - | 7,529 | (7,529 | ) | (100.0)% | |||||||||||
|
|
|
|
|
| |||||||||||
Total operating expenses | $ | 215,135 | $ | 208,774 | $ | 6,361 | 3.0 % | |||||||||
|
|
|
|
|
| |||||||||||
Sales and Marketing
Sales and marketing expenses consist primarily of salaries and other related costs for sales and marketing personnel, sales commissions, travel, public relations and marketing materials and trade show participation. Sales and marketing expenses increased by $8.4 million for the fiscal year ended June 30, 2018 as compared to the prior fiscal year, due primarily to an increase in employee related costs of $7.3 million due in part to the impact of our recent acquisitions and the overall growth of our business. We expect sales and marketing expenses as a percentage of total revenue will remain relatively consistent in fiscal year 2019.
Product Development and Engineering
Product development and engineering expenses consist primarily of personnel costs to support product development, which consists of enhancements and revisions to our products based on customer feedback and general marketplace demands. Product development and engineering expenses increased by $4.3 million for the fiscal year ended June 30, 2018 as compared to the prior fiscal year, principally as a result of an increase in headcount related costs as we continued to invest in the development of innovative, feature-rich products. We expect product development and engineering expenses as a percentage of total revenues will remain relatively consistent in fiscal year 2019.
General and Administrative
General and administrative expenses consist primarily of salaries and other related costs for operations and finance employees and legal and accounting services. General and administrative expenses increased by
38
$3.3 million for the fiscal year ended June 30, 2018 as compared to the prior fiscal year, due primarily to increased employee related costs of $3.7 million, the non-recurring settlement of a legal claim of $1.3 million and facilities related costs of $0.8 million, partially offset by decreased global ERP implementation and other costs of $2.4 million. We expect general and administrative expenses as a percentage of total revenues will remain relatively consistent in fiscal year 2019.
Amortization of Acquisition-related Intangible Assets
We amortize our acquired intangible assets in proportion to the estimated rate at which the asset provides economic benefit to us. Accordingly, amortization expense rates are often higher in the earlier periods of an asset's estimated life. The decrease in amortization expense of $2.2 million for the fiscal year ended June 30, 2018 as compared to the prior fiscal year occurred as a result of amortization rates decreasing over the underlying asset lives. We expect that total amortization expense for acquired intangible assets for fiscal year 2019 will be approximately $20.4 million.
Goodwill Impairment Charge
For the fiscal year ended June 30, 2017, we recorded a $7.5 million goodwill impairment charge as a result of an impairment test conducted for our Intellinx reporting unit. There were no similar changes in fiscal 2018.
Other Income (Expense), Net
| Fiscal Year Ended June 30, | Increase (Decrease) Between Periods | |||||||||||||||
| 2018 | 2017 | $ Change Inc (Dec) | % Change Inc (Dec) | |||||||||||||
| (Dollars in thousands) | ||||||||||||||||
Interest income | $ | 273 | $ | 451 | $ | (178 | ) | (39.5)% | ||||||||
Interest expense | (11,170 | ) | (17,059 | ) | 5,889 | 34.5 % | ||||||||||
Other income (expense), net | 6,191 | (478 | ) | 6,669 | 1,395.2 % | |||||||||||
|
|
|
|
|
| |||||||||||
Other expense, net | $ | (4,706 | ) | $ | (17,086 | ) | $ | 12,380 | 72.5 % | |||||||
|
|
|
|
|
| |||||||||||
Other Income (Expense), Net
Other expense, net decreased $12.4 million for the fiscal year ended June 30, 2018 as compared to the prior fiscal year, primarily due to decreases in the amortization of debt discount costs upon the maturity of our Notes on December 1, 2017 as well as non-recurring other income of $6.1 million attributable to the sale of a cost method investment.
Provision for Income Taxes
We recorded an income tax benefit of $8.2 million and $5.1 million for the fiscal years ended June 30, 2018 and 2017, respectively. The income tax benefit for the fiscal year ended June 30, 2018 was primarily due to a discrete tax benefit of $8.0 million arising from the impact of the U.S. Tax Cuts and Jobs Act in the United States. The income tax benefit for the fiscal year ended June 30, 2017 includes a discrete tax benefit in Switzerland of $4.5 million related to the impairment of its investment in Intellinx Ltd. (a wholly owned subsidiary). Please refer to Note 16 Income Taxes to our consolidated financial statements included in Item 8 of this Annual Report on Form 10-K for further details regarding this matter.
39
Fiscal Year Ended June 30, 2017 Compared to Fiscal Year Ended June 30, 2016
Segment Information
The following tables represent our segment revenues and our segment measure of profit (loss):
| Fiscal Year Ended June 30, | Increase (Decrease) Between Periods | |||||||||||||
| 2017 | 2016 | $ Change Inc (Dec) | % Change | |||||||||||
| (Dollars in thousands) | ||||||||||||||
Segment revenue: | ||||||||||||||
Cloud Solutions | $ | 154,821 | $ | 138,641 | $ | 16,180 | 11.7 % | |||||||
Banking Solutions | 79,227 | 70,747 | 8,480 | 12.0 % | ||||||||||
Payments and Transactional Documents | 98,150 | 115,213 | (17,063 | ) | (14.8)% | |||||||||
Other | 17,214 | 18,673 | (1,459 | ) | (7.8)% | |||||||||
|
|
|
|
|
| |||||||||
Total segment revenue | $ | 349,412 | $ | 343,274 | $ | 6,138 | 1.8 % | |||||||
|
|
|
|
|
| |||||||||
Segment measure of profit (loss): | ||||||||||||||
Cloud Solutions | $ | 28,044 | $ | 23,380 | $ | 4,664 | 19.9 % | |||||||
Banking Solutions | 2,901 | 5,696 | (2,795 | ) | (49.1)% | |||||||||
Payments and Transactional Documents | 29,832 | 34,225 | (4,393 | ) | (12.8)% | |||||||||
Other | (3,075 | ) | (1,795 | ) | (1,280 | ) | (71.3)% | |||||||
|
|
|
|
|
| |||||||||
Total measure of segment profit | $ | 57,702 | $ | 61,506 | $ | (3,804 | ) | (6.2)% | ||||||
|
|
|
|
|
| |||||||||
A reconciliation of the measure of total segment profit to our GAAP loss before income taxes is as follows:
| Fiscal Year Ended June 30, | ||||||||
| 2017 | 2016 | |||||||
| (in thousands) | ||||||||
Total measure of segment profit | $ | 57,702 | $ | 61,506 | ||||
Less: | ||||||||
Amortization of acquisition-related intangible assets | (24,246 | ) | (28,978 | ) | ||||
Goodwill impairment charge | (7,529 | ) | - | |||||
Fixed asset charge | (2,399 | ) | - | |||||
Stock-based compensation plan expense | (31,913 | ) | (30,279 | ) | ||||
Acquisition and integration-related expenses | (2,596 | ) | (741 | ) | ||||
Restructuring expenses | (547 | ) | (850 | ) | ||||
Minimum pension liability adjustments | (1,079 | ) | (203 | ) | ||||
Other non-core income | 223 | 246 | ||||||
Global ERP system implementation and other costs | (8,804 | ) | (4,252 | ) | ||||
Other expense, net | (17,086 | ) | (15,312 | ) | ||||
|
|
|
| |||||
Loss before income taxes | $ | (38,274 | ) | $ | (18,863 | ) | ||
|
|
|
| |||||
Cloud Solutions
Revenues from our Cloud Solutions segment increased $16.2 million for the fiscal year ended June 30, 2017 as compared to the prior fiscal year, inclusive of an unfavorable impact of foreign currency exchange rates
40
of $4.1 million, due primarily to increased revenue of $11.3 million from our legal spend management solutions and $4.9 million from our settlement network solutions. Segment profit increased $4.7 million for the fiscal year ended June 30, 2017, as compared to the prior fiscal year, inclusive of an unfavorable impact of foreign currency exchange rates of $0.4 million, due primarily to the revenue increase described above, partially offset by increased cost of revenues of $8.6 million and increased operating expenses of $2.9 million; the majority of which related to increased product development costs.
Banking Solutions
Revenues from our Banking Solutions segment increased $8.5 million for the fiscal year ended June 30, 2017 as compared to the prior fiscal year, due primarily to increases of $6.7 million in subscription and transaction revenue and $3.3 million in service and maintenance revenue, partially offset by a decrease of $1.5 million in software license revenue. Segment profit decreased $2.8 million for the fiscal year ended June 30, 2017 as compared to the prior fiscal year, due primarily to increased product development costs of $3.4 million, partially offset by increased gross margins of $0.7 million and reduced sales and marketing costs of $0.7 million.
Payments and Transactional Documents
Revenues from our Payments and Transactional Documents segment decreased $17.1 million for the fiscal year ended June 30, 2017 as compared to the prior fiscal year, inclusive of an unfavorable impact of foreign currency exchange rates of $9.5 million. The overall revenue decrease was primarily attributable to revenue decreases of $12.0 million in service and maintenance revenue, $6.9 million in software license revenue and $1.9 million in other revenue, partially offset by increases of $3.7 million in subscriptions and transactions revenue. The segment profit decrease of $4.4 million for the fiscal year ended June 30, 2017, as compared to the prior fiscal year, included an unfavorable impact of foreign currency exchange rates of $2.8 million, and was primarily attributable to the revenue decrease described above, partially offset by decreased cost of revenues of $5.7 million and decreased sales and marketing expenses of $5.3 million.
Other
Revenues from our Other segment decreased $1.5 million for the fiscal year ended June 30, 2017 as compared to the prior fiscal year, due primarily to decreases in subscriptions and transactions and software license revenue. Segment profit decreased $1.3 million for the fiscal year ended June 30, 2017 as compared to the prior fiscal year, due primarily to the reduction in revenue.
Revenues by Category
| Fiscal Year Ended June 30, | Increase (Decrease) Between Periods | |||||||||||||
| 2017 | 2016 | $ Change Inc (Dec) | % Change | |||||||||||
| (Dollars in thousands) | ||||||||||||||
Revenues: | ||||||||||||||
Subscriptions and transactions | $ | 222,997 | $ | 195,187 | $ | 27,810 | 14.2 % | |||||||
Software licenses | 11,685 | 20,826 | (9,141 | ) | (43.9)% | |||||||||
Service and maintenance | 109,633 | 120,292 | (10,659 | ) | (8.9)% | |||||||||
Other | 5,097 | 6,969 | (1,872 | ) | (26.9)% | |||||||||
|
|
|
|
|
| |||||||||
Total revenues | $ | 349,412 | $ | 343,274 | $ | 6,138 | 1.8 % | |||||||
|
|
|
|
|
| |||||||||
Subscriptions and Transactions
Revenues from subscriptions and transactions increased $27.8 million for the fiscal year ended June 30, 2017 as compared to the prior fiscal year, inclusive of an unfavorable impact of foreign currency exchange rates of $7.5 million. The overall revenue increase was due principally to increases in revenue from our Cloud Solutions segment and Banking Solutions segment of $18.3 million and $6.7 million, respectively.
41
Software Licenses
Revenues from software licenses decreased $9.1 million for the fiscal year ended June 30, 2017 as compared to the prior fiscal year, inclusive of an unfavorable impact of foreign currency exchange rates of $1.0 million. The overall revenue decrease was primarily as a result of decreases in revenue from our European payments and transactional documents solutions of $5.1 million, our North American payments and transactional documents solutions of $1.9 million and our Banking Solutions segment of $1.5 million.
Service and Maintenance
Revenues from service and maintenance decreased $10.7 million for the fiscal year ended June 30, 2017 as compared to the prior fiscal year, inclusive of an unfavorable impact of foreign currency exchange rates of $4.9 million. The overall decrease was primarily the result of decreases in revenue from our European payments and transactional documents solutions of $10.1 million.
Other
Our other revenues in fiscal year 2017 consisted principally of equipment and supplies sales which remained minor components of our overall revenue.
Cost of Revenues
| Fiscal Year Ended June 30, | Increase (Decrease) Between Periods | |||||||||||||||
| 2017 | 2016 | $ Change Inc (Dec) | % Change Inc (Dec) | |||||||||||||
| (Dollars in thousands) | ||||||||||||||||
Cost of revenues: | ||||||||||||||||
Subscriptions and transactions | $ | 103,777 | $ | 87,775 | $ | 16,002 | 18.2 % | |||||||||
Software licenses | 818 | 1,030 | (212 | ) | (20.6)% | |||||||||||
Service and maintenance | 53,494 | 53,236 | 258 | 0.5 % | ||||||||||||
Other | 3,737 | 5,059 | (1,322 | ) | (26.1)% | |||||||||||
|
|
|
|
|
| |||||||||||
Total cost of revenues | $ | 161,826 | $ | 147,100 | $ | 14,726 | 10.0 % | |||||||||
|
|
|
|
|
| |||||||||||
Gross profit | $ | 187,586 | $ | 196,174 | $ | (8,588 | ) | (4.4)% | ||||||||
|
|
|
|
|
| |||||||||||
Subscriptions and Transactions
Subscriptions and transactions costs as a percentage of subscriptions and transactions revenues increased slightly to 47% for the fiscal year ended June 30, 2017 as compared to 45% for the prior fiscal year.
Software Licenses
Software license costs as a percentage of software license revenues increased slightly to 7% for the fiscal year ended June 30, 2017 as compared to 5% for the prior fiscal year, due primarily to a reduction in revenues from our European payments and transactional documents solutions and relatively unchanged cost of revenues.
Service and Maintenance
Service and maintenance costs as a percentage of service and maintenance revenues increased to 49% for the fiscal year ended June 30, 2017 as compared to 44% for the prior fiscal year, due primarily to the decrease in service and maintenance revenue in our European and North American payments and transactional documents solutions, and relatively unchanged cost of revenues.
Other
Other costs remained minor components of our business in the fiscal year ended June 30, 2017 and 2016.
42
Operating Expenses
| Fiscal Year Ended June 30, | Increase (Decrease) Between Periods | |||||||||||||
| 2017 | 2016 | $ Change Inc (Dec) | % Change | |||||||||||
| (Dollars in thousands) | ||||||||||||||
Operating expenses: | ||||||||||||||
Sales and marketing | $ | 77,470 | $ | 84,068 | $ | (6,598 | ) | (7.8)% | ||||||
Product development and engineering | 53,002 | 47,355 | 5,647 | 11.9 % | ||||||||||
General and administrative | 46,527 | 39,324 | 7,203 | 18.3 % | ||||||||||
Amortization of acquisition-related intangible assets | 24,246 | 28,978 | (4,732 | ) | (16.3)% | |||||||||
Goodwill impairment charge | 7,529 | - | 7,529 | 100.0 % | ||||||||||
|
|
|
|
|
| |||||||||
Total operating expenses | $ | 208,774 | $ | 199,725 | $ | 9,049 | 4.5 % | |||||||
|
|
|
|
|
| |||||||||
Sales and Marketing
Sales and marketing expenses decreased by $6.6 million for the fiscal year ended June 30, 2017 as compared to the prior fiscal year, inclusive of a favorable impact of foreign currency exchange rates of $2.9 million, due primarily to a decrease in employee related costs of $4.0 million, advertising expenses of $1.0 million and travel expenses of $0.6 million.
Product Development and Engineering
Product development and engineering expenses increased by $5.6 million for the fiscal year ended June 30, 2017 as compared to the prior fiscal year, principally as a result of an increase in headcount related costs.
General and Administrative
General and administrative expenses increased by $7.2 million for the fiscal year ended June 30, 2017 as compared to the prior fiscal year, inclusive of a favorable impact of foreign currency exchange rates of $1.4 million, due primarily to an increase in costs associated with our global internal system implementations of $4.6 million and acquisition related costs of $1.4 million.
Amortization of Acquisition-related Intangible Assets
The decrease in amortization expense of $4.7 million for the fiscal year ended June 30, 2017 as compared to the prior fiscal year occurred as a result of amortization rates decreasing over the underlying asset lives.
Goodwill Impairment Charge
For the fiscal year ended June 30, 2017, we recorded a $7.5 million goodwill impairment charge as a result of an impairment test conducted for our Intellinx reporting unit. Please refer to Note 7 Goodwill and Other Intangible Assets to our consolidated financial statements included in Item 8 of this Annual Report on Form 10-K for further details regarding this matter.
Other Income (Expense), Net
| Fiscal Year Ended June 30, | Increase (Decrease) Between Periods | |||||||||||||
| 2017 | 2016 | $ Change Inc (Dec) | % Change | |||||||||||
| (Dollars in thousands) | ||||||||||||||
Interest income | $ | 451 | $ | 533 | $ | (82 | ) | (15.4)% | ||||||
Interest expense | (17,059 | ) | (15,539 | ) | (1,520 | ) | (9.8)% | |||||||
Other expense, net | (478 | ) | (306 | ) | (172 | ) | (56.2)% | |||||||
|
|
|
|
|
| |||||||||
Other expense, net | $ | (17,086 | ) | $ | (15,312 | ) | $ | (1,774 | ) | (11.6)% | ||||
|
|
|
|
|
| |||||||||
43
Other Income (Expense), Net
For the fiscal year ended June 30, 2017 as compared to the prior fiscal year, interest income decreased slightly. Interest expense increased due to increased amortization of the debt discount related to our Notes. Other expense in fiscal year 2017 was primarily the result of foreign exchange losses.
Provision for Income Taxes
We recorded an income tax benefit of $5.1 million for the fiscal year ended June 30, 2017 compared to income tax expense of $0.8 million for the fiscal year ended June 30, 2016. The tax benefit in fiscal year 2017 was primarily due to a discrete tax benefit in Switzerland of $4.5 million related to the impairment of its investment in Intellinx Ltd. We also recorded a tax benefit associated with our Swiss and Israeli operations and a discrete tax benefit of approximately $0.1 million from the enactment of legislation that decreased United Kingdom (UK) income tax rates. The income tax benefit was offset in part by tax expense associated with our U.S. and UK operations. The U.S. income tax expense was principally due to an increase in deferred tax liabilities for goodwill that is deductible for tax purposes but not amortized for financial reporting purposes. The tax expense in fiscal year 2016 was principally due to tax expense associated with our U.S. and UK operations, which was offset in part by a tax benefit associated with our Swiss and Israeli operations. Our tax expense in fiscal year 2016 was offset in part by a discrete tax benefit of approximately $0.2 million from the enactment of legislation that decreased UK income tax rates. The U.S. income tax expense was principally due to an increase in deferred tax liabilities for goodwill that is deductible for tax purposes but not amortized for financial reporting purposes.
Liquidity and Capital Resources
On December 9, 2016, we (as borrower) and certain of our domestic subsidiaries (as guarantors) entered into a credit agreement with Bank of America, N.A. and certain other lenders, which provides for a five-year revolving credit facility in the amount of up to $300 million (the Credit Facility). In July 2018, we entered into an amendment to the Credit Facility that, among other things, lowered certain borrowing costs and extended its term to July 16, 2023. In August 2018, we used $20.0 million of cash on hand to pay down a portion of the borrowings under our Credit Facility.
On December 1, 2017, we repaid the aggregate principal balance of $189.8 million of our Notes through a combination of cash on hand and by borrowing $150 million under the Credit Facility. In connection with the maturity of the Notes, we issued to the Note holders approximately 0.6 million shares of our common stock to satisfy the Notes' conversion premium. Simultaneously, we redeemed a portion of the convertible note hedge transactions (Note Hedges) and received from the Note Hedge counterparties approximately 0.6 million shares of our common stock. The redemption of these shares offset the dilution that otherwise would have occurred as a result of the common stock we issued upon settlement of the conversion premium.
During the three months ended June 30, 2018, the holders of warrants in our common stock exercised approximately 264,000 warrants and we issued shares of common stock in the same amount. We have approximately 2.7 million warrants outstanding as of June 30, 2018.
We have financed our operations primarily from cash provided by operating activities, the sale of our common stock and debt proceeds. We have historically generated positive operating cash flows. Accordingly, we believe that the cash generated from our operations and the cash and cash equivalents we have on hand will be sufficient to meet our operating requirements for the foreseeable future. If our existing cash resources along with cash generated from operations is insufficient to satisfy our operating requirements, we may need to sell additional equity or debt securities or seek other financing arrangements.
As of June 30, 2018, we were in compliance with the covenants associated with the Credit Facility.
44
One of our financial goals is to maintain and improve our capital structure. The key metrics we focus on in assessing the strength of our liquidity and a summary of our cash activity for the fiscal years ended June 30, 2018 and 2017 are summarized in the tables below:
| June 30, | June 30, | |||||||
| 2018 | 2017 | |||||||
| (in thousands) | ||||||||
Cash and cash equivalents | $ | 121,860 | $ | 124,569 | ||||
Marketable securities | 10,012 | 1,973 | ||||||
Borrowings under credit facility | 150,000 | - | ||||||
Convertible senior notes (1) | - | 183,682 | ||||||
| (1) | The Notes are shown on our June 30, 2017 Consolidated Balance Sheet at their carrying value, which represents the principal balance of $189.8 million less the unamortized discount of $5.6 million and debt issuance costs of $0.5 million. |
| Fiscal Year Ended June 30, | ||||||||
| 2018 | 2017 | |||||||
| (in thousands) | ||||||||
Cash provided by operating activities | $ | 76,028 | $ | 61,084 | ||||
Cash provided by (used in) investing activities | (38,683 | ) | 4,755 | |||||
Cash used in financing activities | (38,824 | ) | (39,101 | ) | ||||
Effect of exchange rates on cash | (1,230 | ) | 657 | |||||
Cash, cash equivalents and marketable securities. At June 30, 2018, our cash and cash equivalents of $121.9 million consisted primarily of cash deposits held at major banks and money market funds. The $2.7 million decrease in cash and cash equivalents from June 30, 2017 was primarily due to the repayment of the Notes of $189.8 million, offset by $150.0 million of proceeds borrowed under our Credit Facility; cash used to fund business acquisitions, net of cash acquired, of $13.7 million; purchases of available-for-sale securities of $14.2 million and capital expenditures, including capitalization of software costs of $21.4 million, partially offset by cash generated from operations of $76.0 million; proceeds from sales of available-for-sale securities of $6.2 million and proceeds from the sale of a cost-method investment of $4.4 million.
At June 30, 2018, our marketable securities of $10.0 million consisted primarily of U.S. government debt securities.
Cash, cash equivalents and marketable securities included approximately $67.5 million held by our foreign subsidiaries as of June 30, 2018. During the quarter ended June 30, 2018, as a result of the provisions of U.S. tax reform, we reassessed and changed our assertion that cumulative earnings by our UK and Switzerland subsidiaries were indefinitely reinvested. We continue to permanently reinvest the earnings, if any, of our international subsidiaries other than the UK and Switzerland and therefore we do not provide for U.S. income taxes that could result from the distribution of those earnings to the U.S. parent. If our reinvestment plans change based on future events and we decide to repatriate these amounts from our international subsidiaries other than the UK and Switzerland to fund our domestic operations, the amounts would generally become subject to state tax in the U.S. to the extent there were cumulative profits in the foreign subsidiary from which the distribution to the U.S. was made.
Cash and cash equivalents held by our foreign subsidiaries are denominated in currencies other than U.S. Dollars. Decreases primarily in the foreign currency exchange rate of the Swiss Franc to the U.S. Dollar decreased our overall cash balances by approximately $1.2 million for the fiscal year ended June 30, 2018. Further changes in the foreign currency exchange rates of this and other currencies could have a significant effect on our overall cash balances. However, we continue to believe that our existing cash balances, even in light of
45
the foreign currency volatility we frequently experience, are adequate to meet our operating requirements for the foreseeable future.
Operating Activities . Operating cash flow is derived by adjusting our net income or loss for non-cash operating items, such as depreciation and amortization, stock-based compensation plan expense, deferred income tax benefits or expenses, and impairment charges and changes in operating assets and liabilities, which reflect timing differences between the receipt and payment of cash associated with transactions and when they are recognized in our results of operations. Cash generated from operations increased by $14.9 million for the fiscal year ended June 30, 2018 as compared to the prior fiscal year. The increase was primarily related to a decrease in our net loss of $42.5 million, partially offset by a decrease in cash flows from accounts receivable of $7.2 million and a decrease in non-cash adjustments to our net income (loss) of $18.4 million.
At June 30, 2018, we had U.S. net operating loss carryforwards of $104.8 million, which expire at various times through fiscal year 2037, Switzerland net operating loss carryforwards of $12.8 million, which expire in fiscal year 2024, and other foreign net operating loss carryforwards of $28.7 million, primarily in Europe and Israel, which have no statutory expiration date. We also have approximately $6.2 million of research and development tax credit carryforwards available, which expire at various points through fiscal year 2038. Our operating losses and tax credit carryforwards may be subject to limitations under provisions of the Internal Revenue Code.
At June 30, 2018, a substantial portion of our deferred tax assets have been reserved since, given the available evidence, it was deemed more likely than not that these deferred tax assets would not be realized.
Investing Activities . Investing cash flows consist primarily of capital expenditures, inclusive of capitalized software costs, investment purchases and sales and cash used for the acquisition of businesses and assets. The $43.4 million increase in net cash used in investing activities for the fiscal year ended June 30, 2018 versus the prior fiscal year was primarily due to a decrease in proceeds from the sale of available-for-sale securities of $40.8 million and cash used to fund business acquisitions, net of cash acquired, of $13.7 million, partially offset by a decrease in capital expenditures of $6.8 million and proceeds from the sale of a cost-method investment of $4.4 million.
Financing Activities. Financing cash flows consist primarily of repurchases of common stock, issuance and repayment of debt, and proceeds from the sale of shares of common stock through employee equity incentive plans. The $0.3 million decrease in net cash used in financing activities for the fiscal year ended June 30, 2018 as compared to the prior fiscal year was primarily due to the repayment of the Notes of $189.8 million, net of $150.0 million borrowed under our Credit Facility, and further offset by a decrease in cash used to repurchase our common stock of $39.9 million.
Contractual Obligations
Following is a summary of future payments that we are required to make under existing contractual obligations as of June 30, 2018:
| Payment Due by Fiscal Year | ||||||||||||||||||||
| 2019 | 2020-2021 | 2022-2023 | Thereafter | Total | ||||||||||||||||
| (in thousands) | ||||||||||||||||||||
Credit Facility | ||||||||||||||||||||
Principal payment | $ | - | $ | - | $ | 150,000 | $ | - | $ | 150,000 | ||||||||||
Interest payments (1) | 5,138 | 10,392 | 2,296 | - | 17,826 | |||||||||||||||
Commitment fee (2) | 300 | 600 | 133 | - | 1,033 | |||||||||||||||
Note payable | 733 | 367 | - | - | 1,100 | |||||||||||||||
Operating leases | 5,526 | 8,651 | 5,001 | 4,763 | 23,941 | |||||||||||||||
Purchase commitments | 6,475 | 2,025 | 59 | - | 8,559 | |||||||||||||||
|
|
|
|
|
|
|
|
|
| |||||||||||
Total contractual obligations | $ | 18,172 | $ | 22,035 | $ | 157,489 | $ | 4,763 | $ | 202,459 | ||||||||||
|
|
|
|
|
|
|
|
|
| |||||||||||
46
| (1) | The Credit Facility carries a variable rate of interest. Interest payments were estimated using the applicable interest rate as of June 30, 2018 net of the impact of the interest rate swap we entered into on July 10, 2017. |
| (2) | The Credit Facility agreement includes a commitment fee, which we have included in the table above, based on the applicable interest rate as of June 30, 2018 and our unborrowed capacity of $150 million. |
Purchase orders are not included in the table above. Our purchase orders represent authorizations to purchase rather than binding agreements. The contractual obligation amounts in the table above are associated with agreements that are enforceable and legally binding and that specify all significant terms, including: fixed or minimum services to be used; fixed, minimum or variable price provisions; and the approximate timing of the transaction. Obligations under contract that we can cancel without a significant penalty are not included in the table above.
Our estimate of unrecognized tax benefits for which cash settlement may be required, in the amount of $1.3 million, has been excluded from the table above. These amounts have been excluded because, as of June 30, 2018, we are unable to estimate the timing of future cash outflows, if any, associated with these liabilities as we do not currently anticipate settling any of these tax positions with cash payment in the foreseeable future.
The contractual obligations table above also excludes our estimate of the contributions we will make to our Swiss defined benefit pension plan in fiscal year 2019, which is $1.7 million based on foreign exchange rates in effect on June 30, 2018. We have not disclosed contributions for periods after fiscal year 2019, as those amounts are subject to future changes.
Off-Balance Sheet Arrangements
We did not have any off-balance sheet arrangements during the fiscal year ended June 30, 2018.
| Item 7A. | Quantitative and Qualitative Disclosures about Market Risk. |
Interest rate risk
Our exposure to financial risk, including changes in interest rates, relates primarily to our cash and cash equivalents and marketable securities. Our cash and cash equivalents typically consist of demand deposit accounts, money market mutual funds and U.S. Treasury securities. Based on our current average balances of cash and cash equivalents, a significant change in interest rates could have a material effect on our operating results. Based on our average cash and cash equivalents balance, average actual interest rates and actual interest income during the respective annual periods, a 100 basis point increase in interest rates would result in a hypothetical increase of approximately $1.0 million, $1.1 million and $1.1 million for the fiscal years ended June 30, 2018, 2017 and 2016, respectively, in our results of operations and cash flows. A 100 basis point decrease in interest rates would reduce our interest income to zero.
Our marketable securities are held in U.S. corporate and government debt securities with maturities of less than one year. A 100 basis point change in interest rates would not have had a significant impact on our income from marketable securities for the fiscal years ended June 30, 2018, 2017 and 2016.
Our Credit Facility bears interest at variable interest rates. We entered into an interest rate swap agreement in July 2017 to minimize our exposure to interest rate fluctuations under our Credit Facility.
Foreign currency exchange rate risk
We have significant operations located in the United Kingdom, where the functional currency is British Pound Sterling and in Switzerland, where the functional currency is the Swiss Franc. We also have operations in Australia, where the functional currency is the Australian Dollar; in Germany and France, where the functional currency is the European Euro; in Singapore, where the functional currency is the Singapore Dollar; in Canada, where the functional currency is the Canadian Dollar; in Indonesia, where the functional currency is the Indonesian Rupiah; in China, where the functional currency is the Chinese Yuan Renminbi; in Malaysia, where
47
the functional currency is the Malaysian Ringgit and in Thailand, where the functional currency is the Thai Baht. We have not entered into any foreign currency hedging transactions or other instruments to minimize our exposure to foreign currency exchange rate fluctuations nor do we presently plan to in the future.
Foreign currency translation risk
The following sensitivity analysis is based on a hypothetical 10 percent increase or decrease in foreign currency exchange rates and presents the impact that such an increase or decrease would have had on our cash balances as of June 30, 2018 and 2017:
| Effect of a 10% Increase or Decrease in Average Exchange Rates | ||||||||
| Cash and cash equivalents | ||||||||
| 2018 | 2017 | |||||||
| (in thousands) | ||||||||
Between U.S. Dollar and: | ||||||||
British Pound Sterling (+/-) | $ | 3,846 | $ | 4,115 | ||||
Swiss Franc (+/-) | 2,175 | 1,418 | ||||||
European Euro (+/-) | 312 | 337 | ||||||
Australian Dollar (+/-) | 293 | 293 | ||||||
A 10% increase or decrease in the exchange rate between the Israeli Shekel and the U.S. Dollar, the Singapore Dollar and the U.S. Dollar, the Canadian Dollar and the U.S. Dollar, the Indonesian Rupiah and the U.S. Dollar, the Chinese Yuan Renminbi and the U.S. Dollar, the Malaysian Ringgit and the U.S. Dollar and the Thai Baht and the U.S. Dollar would not have had a significant impact on our cash and cash equivalents at June 30, 2018 or June 30, 2017.
The following sensitivity analysis is based on a hypothetical 10 percent increase or decrease in foreign currency exchange rates and presents the impact that such an increase or decrease would have had on our revenue and net income (loss) for the fiscal years ended June 30, 2018, 2017 and 2016:
| Effect of a 10% Increase or Decrease in Average Exchange Rates | ||||||||||||||||||||||||
| Revenue | Net income (loss) | |||||||||||||||||||||||
| 2018 | 2017 | 2016 | 2018 | 2017 | 2016 | |||||||||||||||||||
| (in thousands) | ||||||||||||||||||||||||
Between U.S. Dollar and: | ||||||||||||||||||||||||
British Pound Sterling (+/-) | $ | 9,149 | $ | 8,042 | $ | 9,624 | $ | 1,127 | $ | 268 | $ | 754 | ||||||||||||
Swiss Franc (+/-) | 3,976 | 3,496 | 3,467 | 637 | 544 | 197 | ||||||||||||||||||
Israeli Shekel (+/-) | 769 | 547 | 542 | 954 | 1,847 | 1,046 | ||||||||||||||||||
European Euro (+/-) | 382 | 363 | 420 | 17 | 20 | 27 | ||||||||||||||||||
Australian Dollar (+/-) | 339 | 332 | 299 | 11 | 7 | 2 | ||||||||||||||||||
A 10% increase or decrease in the average exchange rate between the Singapore Dollar and the U.S. Dollar; the Canadian Dollar and the U.S. Dollar; the Indonesian Rupiah and the U.S. Dollar, the Chinese Yuan Renminbi and the U.S. Dollar, the Malaysian Ringgit and the U.S. Dollar and the Thai Baht and the U.S. Dollar would not have had a significant impact on our revenue or net income (loss) for the fiscal years ended June 30, 2018, 2017 or 2016.
Foreign currency transaction risk
Foreign currency transaction gains and losses are generally not significant and our financial results would not be significantly impacted in the event of a 10% increase or decrease in the average exchange rates between the U.S. dollar and the respective functional currencies of our international subsidiaries.
48
| Item 8. | Consolidated Financial Statements and Supplementary Data. |
BOTTOMLINE TECHNOLOGIES (de), INC.
INDEX TO CONSOLIDATED FINANCIAL STATEMENTS
| Page | ||||
Reports of Independent Registered Public Accounting Firm | 50 | |||
Consolidated Balance Sheets as of June 30, 2018 and 2017 | 53 | |||
Consolidated Statements of Comprehensive Income (Loss) for the fiscal years ended June 30, 2018, 2017 and 2016 | 54 | |||
Consolidated Statements of Stockholders' Equity for the fiscal years ended June 30, 2018, 2017 and 2016 | 55 | |||
Consolidated Statements of Cash Flows for the fiscal years ended June 30, 2018, 2017 and 2016 | 56 | |||
Notes to Consolidated Financial Statements | 57 | |||
49
REPORT OF INDEPENDENT REGISTERED PUBLIC ACCOUNTING FIRM
Board of Directors and Stockholders
Bottomline Technologies (de), Inc.
Opinion on the Financial Statements
We have audited the accompanying consolidated balance sheets of Bottomline Technologies (de), Inc. (the Company) as of June 30, 2018 and 2017, the related consolidated statements of comprehensive income (loss), stockholders' equity and cash flows for each of the three years in the period ended June 30, 2018, and the related notes and financial statement schedule listed in the Index at Item 15(a)(2) (collectively referred to as the "consolidated financial statements"). In our opinion, the consolidated financial statements present fairly, in all material respects, the financial position of the Company at June 30, 2018 and 2017, and the results of its operations and its cash flows for each of the three years in the period ended June 30, 2018, in conformity with U.S. generally accepted accounting principles.
We also have audited, in accordance with the standards of the Public Company Accounting Oversight Board (United States) (PCAOB), the Company's internal control over financial reporting as of June 30, 2018, based on criteria established in Internal Control-Integrated Framework issued by the Committee of Sponsoring Organizations of the Treadway Commission (2013 framework) and our report dated August 29, 2018 expressed an unqualified opinion thereon.
Basis for Opinion
These financial statements are the responsibility of the Company's management. Our responsibility is to express an opinion on the Company's financial statements based on our audits. We are a public accounting firm registered with the PCAOB and are required to be independent with respect to the Company in accordance with the U.S. federal securities laws and the applicable rules and regulations of the Securities and Exchange Commission and the PCAOB.
We conducted our audits in accordance with the standards of the PCAOB. Those standards require that we plan and perform the audit to obtain reasonable assurance about whether the financial statements are free of material misstatement, whether due to error or fraud. Our audits included performing procedures to assess the risks of material misstatement of the financial statements, whether due to error or fraud, and performing procedures that respond to those risks. Such procedures include examining, on a test basis, evidence regarding the amounts and disclosures in the financial statements. Our audits also included evaluating the accounting principles used and significant estimates made by management, as well as evaluating the overall presentation of the financial statements. We believe that our audits provide a reasonable basis for our opinion.
/s/ Ernst & Young LLP
We have served as the Company's auditor since 1991.
Boston, Massachusetts
August 29, 2018
50
REPORT OF INDEPENDENT REGISTERED PUBLIC ACCOUNTING FIRM
Board of Directors and Stockholders
Bottomline Technologies (de), Inc.
Opinion on Internal Control over Financial Reporting
We have audited Bottomline Technologies (de), Inc.'s internal control over financial reporting as of June 30, 2018, based on criteria established in Internal Control-Integrated Framework issued by the Committee of Sponsoring Organizations of the Treadway Commission (2013 framework) (the COSO criteria). In our opinion, Bottomline Technologies (de), Inc. (the Company) maintained, in all material respects, effective internal control over financial reporting as of June 30, 2018, based on the COSO criteria.
As indicated in the accompanying Management's Annual Report on Internal Control over Financial Reporting, management's assessment of and conclusion on the effectiveness of internal control over financial reporting did not include the internal controls of Decillion Group and First Capital Cashflow Ltd., which are included in the 2018 consolidated financial statements of the Company and constituted 1 percent and 3 percent of total assets, respectively, as of June 30, 2018 and less than 1 percent of revenues, each, for the year then ended. Our audit of internal control over financial reporting of the Company also did not include an evaluation of the internal control over financial reporting of Decillion Group and First Capital Cashflow Ltd.
We also have audited, in accordance with the standards of the Public Company Accounting Oversight Board (United States) (PCAOB), the consolidated balance sheets of the Company as of June 30, 2018 and 2017, the related consolidated statements of comprehensive income (loss), stockholders' equity and cash flows for each of the three years in the period ended June 30, 2018, and the related notes and financial statement schedule listed in the Index at Item 15(a)(2) and our report dated August 29, 2018 expressed an unqualified opinion thereon.
Basis for Opinion
The Company's management is responsible for maintaining effective internal control over financial reporting and for its assessment of the effectiveness of internal control over financial reporting included in the accompanying Management's Annual Report on Internal Control over Financial Reporting. Our responsibility is to express an opinion on the Company's internal control over financial reporting based on our audit. We are a public accounting firm registered with the PCAOB and are required to be independent with respect to the Company in accordance with the U.S. federal securities laws and the applicable rules and regulations of the Securities and Exchange Commission and the PCAOB.
We conducted our audit in accordance with the standards of the PCAOB. Those standards require that we plan and perform the audit to obtain reasonable assurance about whether effective internal control over financial reporting was maintained in all material respects.
Our audit included obtaining an understanding of internal control over financial reporting, assessing the risk that a material weakness exists, testing and evaluating the design and operating effectiveness of internal control based on the assessed risk, and performing such other procedures as we considered necessary in the circumstances. We believe that our audit provides a reasonable basis for our opinion.
Definition and Limitations of Internal Control Over Financial Reporting
A company's internal control over financial reporting is a process designed to provide reasonable assurance regarding the reliability of financial reporting and the preparation of financial statements for external purposes in accordance with generally accepted accounting principles. A company's internal control over financial reporting includes those policies and procedures that (1) pertain to the maintenance of records that, in reasonable detail, accurately and fairly reflect the transactions and dispositions of the assets of the company; (2) provide reasonable assurance that transactions are recorded as necessary to permit preparation of financial statements in accordance with generally accepted accounting principles, and that receipts and expenditures of the company are being made only in accordance with authorizations of management and directors of the company; and (3) provide reasonable
51
assurance regarding prevention or timely detection of unauthorized acquisition, use, or disposition of the company's assets that could have a material effect on the financial statements.
Because of its inherent limitations, internal control over financial reporting may not prevent or detect misstatements. Also, projections of any evaluation of effectiveness to future periods are subject to the risk that controls may become inadequate because of changes in conditions, or that the degree of compliance with the policies or procedures may deteriorate.
/s/ Ernst & Young LLP
Boston, Massachusetts
August 29, 2018
52
BOTTOMLINE TECHNOLOGIES (de), INC.
CONSOLIDATED BALANCE SHEETS
(in thousands)
| June 30, | June 30, | |||||||
| 2018 | 2017 | |||||||
ASSETS | ||||||||
Current assets: | ||||||||
Cash and cash equivalents | $ | 121,860 | $ | 124,569 | ||||
Cash and cash equivalents, held for customers | 2,753 | - | ||||||
Marketable securities | 10,012 | 1,973 | ||||||
Accounts receivable net of allowances for doubtful accounts of $996 at June 30, 2018 and $923 at June 30, 2017 | 74,305 | 64,244 | ||||||
Prepaid expenses and other current assets | 19,781 | 16,807 | ||||||
|
|
|
| |||||
Total current assets | 228,711 | 207,593 | ||||||
Property and equipment, net | 28,895 | 26,195 | ||||||
Goodwill | 200,024 | 194,700 | ||||||
Intangible assets, net | 161,785 | 171,280 | ||||||
Other assets | 16,553 | 17,671 | ||||||
|
|
|
| |||||
Total assets | $ | 635,968 | $ | 617,439 | ||||
|
|
|
| |||||
LIABILITIES AND STOCKHOLDERS' EQUITY | ||||||||
Current liabilities: | ||||||||
Accounts payable | $ | 10,251 | $ | 9,013 | ||||
Accrued expenses and other current liabilities | 34,994 | 29,179 | ||||||
Customer account liabilities | 2,753 | - | ||||||
Deferred revenue | 75,356 | 74,113 | ||||||
Convertible senior notes | - | 183,682 | ||||||
|
|
|
| |||||
Total current liabilities | 123,354 | 295,987 | ||||||
Borrowings under credit facility | 150,000 | - | ||||||
Deferred revenue, non-current | 23,371 | 22,047 | ||||||
Deferred income taxes | 8,367 | 15,433 | ||||||
Other liabilities | 19,944 | 22,016 | ||||||
|
|
|
| |||||
Total liabilities | 325,036 | 355,483 | ||||||
Stockholders' equity | ||||||||
Preferred Stock, $.001 par value: | ||||||||
Authorized shares-4,000; issued and outstanding shares-none | - | - | ||||||
Common Stock, $.001 par value: | ||||||||
Authorized shares-100,000; issued shares-44,834 at June 30, 2018 and 42,797 at June 30, 2017; outstanding shares-39,028 at June 30, 2018 and 37,443 at June 30, 2017 | 45 | 43 | ||||||
Additional paid-in-capital | 678,549 | 624,001 | ||||||
Accumulated other comprehensive loss | (30,633 | ) | (32,325 | ) | ||||
Treasury stock: 5,806 shares at June 30, 2018 and 5,354 shares at June 30, 2017, at cost | (129,914 | ) | (113,071 | ) | ||||
Accumulated deficit | (207,115 | ) | (216,692 | ) | ||||
|
|
|
| |||||
Total stockholders' equity | 310,932 | 261,956 | ||||||
|
|
|
| |||||
Total liabilities and stockholders' equity | $ | 635,968 | $ | 617,439 | ||||
|
|
|
| |||||
See accompanying notes.
53
BOTTOMLINE TECHNOLOGIES (de), INC.
CONSOLIDATED STATEMENTS OF COMPREHENSIVE INCOME (LOSS)
(in thousands, except per share amounts)
| Fiscal Year Ended June 30, | ||||||||||||
| 2018 | 2017 | 2016 | ||||||||||
Revenues: | ||||||||||||
Subscriptions and transactions | $ | 262,363 | $ | 222,997 | $ | 195,187 | ||||||
Software licenses | 10,277 | 11,685 | 20,826 | |||||||||
Service and maintenance | 114,926 | 109,633 | 120,292 | |||||||||
Other | 6,530 | 5,097 | 6,969 | |||||||||
|
|
|
|
|
| |||||||
Total revenues | 394,096 | 349,412 | 343,274 | |||||||||
|
|
|
|
|
| |||||||
Cost of revenues: | ||||||||||||
Subscriptions and transactions | 117,033 | 103,777 | 87,775 | |||||||||
Software licenses | 815 | 818 | 1,030 | |||||||||
Service and maintenance | 52,250 | 53,494 | 53,236 | |||||||||
Other | 3,032 | 3,737 | 5,059 | |||||||||
|
|
|
|
|
| |||||||
Total cost of revenues | 173,130 | 161,826 | 147,100 | |||||||||
|
|
|
|
|
| |||||||
Gross profit | 220,966 | 187,586 | 196,174 | |||||||||
Operating expenses: | ||||||||||||
Sales and marketing | 85,912 | 77,470 | 84,068 | |||||||||
Product development and engineering | 57,310 | 53,002 | 47,355 | |||||||||
General and administrative | 49,837 | 46,527 | 39,324 | |||||||||
Amortization of acquisition-related intangible assets | 22,076 | 24,246 | 28,978 | |||||||||
Goodwill impairment charge | - | 7,529 | - | |||||||||
|
|
|
|
|
| |||||||
Total operating expenses | 215,135 | 208,774 | 199,725 | |||||||||
|
|
|
|
|
| |||||||
Income (loss) from operations | 5,831 | (21,188 | ) | (3,551 | ) | |||||||
Interest income | 273 | 451 | 533 | |||||||||
Interest expense | (11,170 | ) | (17,059 | ) | (15,539 | ) | ||||||
Other income (expense), net | 6,191 | (478 | ) | (306 | ) | |||||||
|
|
|
|
|
| |||||||
Other expense, net | (4,706 | ) | (17,086 | ) | (15,312 | ) | ||||||
|
|
|
|
|
| |||||||
Income (loss) before income taxes | 1,125 | (38,274 | ) | (18,863 | ) | |||||||
Provision for (benefit from) income taxes | (8,203 | ) | (5,137 | ) | 785 | |||||||
|
|
|
|
|
| |||||||
Net income (loss) | $ | 9,328 | $ | (33,137 | ) | $ | (19,648 | ) | ||||
|
|
|
|
|
| |||||||
Net income (loss) per share: | ||||||||||||
Basic | $ | 0.24 | $ | (0.88 | ) | $ | (0.52 | ) | ||||
|
|
|
|
|
| |||||||
Diluted | $ | 0.24 | $ | (0.88 | ) | $ | (0.52 | ) | ||||
|
|
|
|
|
| |||||||
Shares used in computing net income (loss) per share: | ||||||||||||
Basic | 38,227 | 37,842 | 37,957 | |||||||||
|
|
|
|
|
| |||||||
Diluted | 39,326 | 37,842 | 37,957 | |||||||||
|
|
|
|
|
| |||||||
Other comprehensive income (loss), net of tax: | ||||||||||||
Unrealized gain (loss) on available for sale securities | (5 | ) | (75 | ) | 55 | |||||||
Unrealized gain on interest rate hedging transactions | 2,590 | - | - | |||||||||
Minimum pension liability adjustments (net of income tax provision (benefit) of $300, $1,558 and ($2,020)) | 1,087 | 4,859 | (6,198 | ) | ||||||||
Foreign currency translation adjustments | (1,980 | ) | 559 | (18,014 | ) | |||||||
|
|
|
|
|
| |||||||
Other comprehensive income (loss), net of tax: | $ | 1,692 | $ | 5,343 | $ | (24,157 | ) | |||||
|
|
|
|
|
| |||||||
Comprehensive income (loss) | $ | 11,020 | $ | (27,794 | ) | $ | (43,805 | ) | ||||
|
|
|
|
|
| |||||||
See accompanying notes.
54
BOTTOMLINE TECHNOLOGIES (de), INC.
CONSOLIDATED STATEMENTS OF STOCKHOLDERS' EQUITY
(in thousands)
| Common Stock | Additional Paid-in Capital | Accumulated Other Comprehensive Income (Loss) | Treasury Stock | Accumulated Deficit | Total Stockholders' Equity | |||||||||||||||||||||||||||
| Shares | Amount | Shares | Amount | |||||||||||||||||||||||||||||
Balance at June 30, 2015 | 40,337 | $ | 40 | $ | 560,083 | $ | (13,511 | ) | 2,232 | $ | (34,167 | ) | $ | (163,907 | ) | $ | 348,538 | |||||||||||||||
Issuance of common stock for employee stock purchase plan and upon exercise of stock options | 92 | 1 | 1,229 | (125 | ) | 2,297 | 3,527 | |||||||||||||||||||||||||
Vesting of restricted stock awards | 1,173 | 1 | (1 | ) | - | |||||||||||||||||||||||||||
Stock compensation plan expense | 30,279 | 30,279 | ||||||||||||||||||||||||||||||
Repurchase of common stock to be held in treasury | 1,725 | (43,962 | ) | (43,962 | ) | |||||||||||||||||||||||||||
Tax benefit (deficit) associated with non qualified stock option exercises and forfeitures | 210 | 210 | ||||||||||||||||||||||||||||||
Minimum pension liability adjustments, net of tax | (6,198 | ) | (6,198 | ) | ||||||||||||||||||||||||||||
Net income (loss) | (19,648 | ) | (19,648 | ) | ||||||||||||||||||||||||||||
Unrealized gain (loss) on available for sale securities, net of tax | 55 | 55 | ||||||||||||||||||||||||||||||
Foreign currency translation adjustment | (18,014 | ) | (18,014 | ) | ||||||||||||||||||||||||||||
|
|
|
|
|
|
|
|
|
|
|
|
|
|
|
| |||||||||||||||||
Balance at June 30, 2016 | 41,602 | $ | 42 | $ | 591,800 | $ | (37,668 | ) | 3,832 | $ | (75,832 | ) | $ | (183,555 | ) | $ | 294,787 | |||||||||||||||
Issuance of common stock for employee stock purchase plan and upon exercise of stock options | 32 | 301 | (133 | ) | 2,674 | 2,975 | ||||||||||||||||||||||||||
Vesting of restricted stock awards | 1,163 | 1 | (1 | ) | - | |||||||||||||||||||||||||||
Stock compensation plan expense | 31,913 | 31,913 | ||||||||||||||||||||||||||||||
Repurchase of common stock to be held in treasury | 1,655 | (39,913 | ) | (39,913 | ) | |||||||||||||||||||||||||||
Tax benefit (deficit) associated with non qualified stock option exercises and forfeitures | (12 | ) | (12 | ) | ||||||||||||||||||||||||||||
Minimum pension liability adjustments, net of tax | 4,859 | 4,859 | ||||||||||||||||||||||||||||||
Net income (loss) | (33,137 | ) | (33,137 | ) | ||||||||||||||||||||||||||||
Unrealized gain (loss) on available for sale securities, net of tax | (75 | ) | (75 | ) | ||||||||||||||||||||||||||||
Foreign currency translation adjustment | 559 | 559 | ||||||||||||||||||||||||||||||
|
|
|
|
|
|
|
|
|
|
|
|
|
|
|
| |||||||||||||||||
Balance at June 30, 2017 | 42,797 | $ | 43 | $ | 624,001 | $ | (32,325 | ) | 5,354 | $ | (113,071 | ) | $ | (216,692 | ) | $ | 261,956 | |||||||||||||||
Issuance of common stock for employee stock purchase plan and upon exercise of stock options | 70 | 388 | (143 | ) | 3,121 | 3,509 | ||||||||||||||||||||||||||
Vesting of restricted stock awards | 1,115 | 1 | (1 | ) | - | |||||||||||||||||||||||||||
Stock compensation plan expense | 34,200 | 34,200 | ||||||||||||||||||||||||||||||
Settlement of conversion premium upon maturity of the Notes | 588 | 1 | (1 | ) | - | |||||||||||||||||||||||||||
Settlement of note hedges | 19,964 | 595 | (19,964 | ) | - | |||||||||||||||||||||||||||
Warrant settlements | 264 | (2 | ) | (2 | ) | |||||||||||||||||||||||||||
Cumulative effect of adoption of updated share-based compensation standard | 249 | 249 | ||||||||||||||||||||||||||||||
Minimum pension liability adjustments, net of tax | 1,087 | 1,087 | ||||||||||||||||||||||||||||||
Net income (loss) | 9,328 | 9,328 | ||||||||||||||||||||||||||||||
Unrealized gain (loss) on available for sale securities, net of tax | (5 | ) | (5 | ) | ||||||||||||||||||||||||||||
Unrealized gain (loss) on interest rate hedging transactions | 2,590 | 2,590 | ||||||||||||||||||||||||||||||
Foreign currency translation adjustment | (1,980 | ) | (1,980 | ) | ||||||||||||||||||||||||||||
|
|
|
|
|
|
|
|
|
|
|
|
|
|
|
| |||||||||||||||||
Balance at June 30, 2018 | 44,834 | $ | 45 | $ | 678,549 | $ | (30,633 | ) | 5,806 | $ | (129,914 | ) | $ | (207,115 | ) | $ | 310,932 | |||||||||||||||
See accompanying notes.
55
BOTTOMLINE TECHNOLOGIES (de), INC.
CONSOLIDATED STATEMENTS OF CASH FLOWS
(in thousands)
| Fiscal Year Ended June 30, | ||||||||||||
| 2018 | 2017 | 2016 | ||||||||||
Operating activities: | ||||||||||||
Net income (loss) | $ | 9,328 | $ | (33,137 | ) | $ | (19,648 | ) | ||||
Adjustments to reconcile net income (loss) to net cash provided by operating activities: | ||||||||||||
Amortization of acquisition-related intangible assets | 22,076 | 24,246 | 28,978 | |||||||||
Stock-based compensation plan expense | 34,200 | 31,913 | 30,279 | |||||||||
Depreciation and other amortization | 19,994 | 19,528 | 13,489 | |||||||||
Goodwill impairment charge | - | 7,529 | - | |||||||||
Gain on sale of cost-method investment | (2,419 | ) | - | - | ||||||||
Deferred income tax benefit | (9,465 | ) | (7,996 | ) | (3,111 | ) | ||||||
Provision for allowances on accounts receivable | 238 | 121 | 415 | |||||||||
Amortization of debt issuance costs | 928 | 1,426 | 1,184 | |||||||||
Amortization of debt discount | 5,574 | 12,641 | 11,774 | |||||||||
Amortization of premium (discount) on investments | (62 | ) | 238 | 338 | ||||||||
Loss on disposal of equipment | 65 | 111 | 24 | |||||||||
Write down of fixed assets | - | - | 17 | |||||||||
(Gain) loss on foreign exchange | (106 | ) | (310 | ) | 171 | |||||||
Changes in operating assets and liabilities: | ||||||||||||
Accounts receivable | (9,675 | ) | (2,447 | ) | (543 | ) | ||||||
Prepaid expenses and other current assets | (1,023 | ) | (666 | ) | (2,449 | ) | ||||||
Other assets | (222 | ) | 910 | (4,412 | ) | |||||||
Accounts payable | 157 | (900 | ) | (682 | ) | |||||||
Accrued expenses | 4,056 | 4,587 | 1,835 | |||||||||
Deferred revenue | 2,852 | 2,337 | 10,361 | |||||||||
Other liabilities | (468 | ) | 953 | (598 | ) | |||||||
|
|
|
|
|
| |||||||
Net cash provided by operating activities | 76,028 | 61,084 | 67,422 | |||||||||
Investing activities: | ||||||||||||
Acquisition of businesses and assets, net of cash acquired | (13,747 | ) | - | (1,763 | ) | |||||||
Purchases of cost-method investments | - | - | (4,010 | ) | ||||||||
Proceeds from sale of cost-method investment | 4,415 | - | - | |||||||||
Purchases of held-to-maturity securities | - | - | (168 | ) | ||||||||
Proceeds from sales of held-to-maturity securities | - | - | 168 | |||||||||
Purchases of available-for-sale securities | (14,188 | ) | (14,058 | ) | (28,113 | ) | ||||||
Proceeds from sales of available-for-sale securities | 6,203 | 46,986 | 15,836 | |||||||||
Capital expenditures, including capitalization of software costs | (21,376 | ) | (28,173 | ) | (27,717 | ) | ||||||
Proceeds from disposal of property and equipment | 10 | - | 8 | |||||||||
|
|
|
|
|
| |||||||
Net cash provided by (used in) investing activities | (38,683 | ) | 4,755 | (45,759 | ) | |||||||
Financing activities: | ||||||||||||
Repurchase of common stock | - | (39,913 | ) | (43,962 | ) | |||||||
Repayment of convertible senior notes | (189,750 | ) | - | - | ||||||||
Amounts borrowed under revolving credit facility | 150,000 | - | - | |||||||||
Repayment of notes payable | (2,581 | ) | - | - | ||||||||
Settlement of warrants | (2 | ) | ||||||||||
Debt issuance costs related to credit facility | - | (2,163 | ) | - | ||||||||
Proceeds from exercise of stock options and employee stock purchase plan | 3,509 | 2,975 | 3,527 | |||||||||
|
|
|
|
|
| |||||||
Net cash used in financing activities | (38,824 | ) | (39,101 | ) | (40,435 | ) | ||||||
Effect of exchange rate changes on cash | (1,230 | ) | 657 | (5,217 | ) | |||||||
|
|
|
|
|
| |||||||
Increase (decrease) in cash and cash equivalents | (2,709 | ) | 27,395 | (23,989 | ) | |||||||
Cash and cash equivalents at beginning of period | 124,569 | 97,174 | 121,163 | |||||||||
|
|
|
|
|
| |||||||
Cash and cash equivalents at end of period | $ | 121,860 | $ | 124,569 | $ | 97,174 | ||||||
|
|
|
|
|
| |||||||
Supplemental disclosure of cash flow information: | ||||||||||||
Cash paid during the fiscal year for: | ||||||||||||
Interest, net of amounts capitalized | $ | 4,873 | $ | 2,964 | $ | 2,847 | ||||||
Income taxes | $ | 3,109 | $ | 3,321 | $ | 4,771 | ||||||
Non-cash financing activities: |
| |||||||||||
Issuance of note payable to seller in connection with acquisition | $ | 1,836 | $ | - | $ | - | ||||||
Issuance of common stock upon conversion of convertible senior notes | $ | 19,736 | $ | - | $ | - | ||||||
Receipt of common stock upon settlement of note hedges | $ | 19,964 | $ | - | $ | - | ||||||
Issuance of common stock upon settlement of the warrants | $ | 12,739 | $ | - | $ | - | ||||||
See accompanying notes.
56
BOTTOMLINE TECHNOLOGIES (de), INC.
NOTES TO CONSOLIDATED FINANCIAL STATEMENTS
Fiscal Years Ended June 30, 2018, 2017 and 2016
Note 1-Organization and Nature of Business
Bottomline Technologies (de), Inc. is a Delaware corporation that helps make complex business payments simple, smart, and secure. Corporations and banks rely on us for domestic and international payments, efficient cash management, automated workflows for payment processing and bill review, and state of the art fraud detection, behavioral analytics and regulatory compliance solutions. The majority of our revenues are derived from offerings sold as SaaS-based solutions and paid for on a subscription and transaction basis. Our products and services are sold to customers operating in many different industries throughout the world, but principally in the U.S., United Kingdom (UK) and continental Europe regions.
Note 2-Significant Accounting Policies
Principles of Consolidation
The consolidated financial statements include our accounts and the accounts of our subsidiaries, all of which are wholly owned. All intercompany balances and transactions have been eliminated in consolidation.
Use of Estimates in the Preparation of Consolidated Financial Statements
The preparation of financial statements in conformity with accounting principles generally accepted in the United States requires us to make estimates and assumptions that affect the amounts reported in the financial statements and accompanying notes. Estimates include, but are not limited to, revenue recognition (particularly revenue recognition associated with contracts accounted for on a percentage of completion basis), allowances for doubtful accounts, recoverability of deferred tax assets, determining the fair value associated with acquired assets and liabilities including deferred revenue, intangible asset and goodwill impairment, pension benefit obligations, accruals for uncertain tax positions and certain other of our accrued liabilities. Actual results could differ from those estimates.
Foreign Currency Translation
We have international subsidiaries in Europe, the Asia-Pacific region and Canada, whose functional currencies are typically the local currencies. Assets and liabilities of all of our international subsidiaries have been translated into U.S. dollars at year-end exchange rates, and results of operations and cash flows have been translated at the average exchange rates in effect during the year. Gains or losses resulting from foreign currency translation are included as a component of accumulated other comprehensive income (loss). Foreign currency transaction gains and losses are included in results of operations as incurred and are not significant to our overall operations.
Cash and Cash Equivalents
We consider all highly liquid instruments with an original maturity of three months or less to be cash equivalents. The carrying value of these instruments approximates their fair value. At June 30, 2018, our cash equivalents consisted of demand deposit accounts and money market funds.
Cash and Cash Equivalents Held for Customers and Customer Account Liabilities
At June 30, 2018, our consolidated balance sheet reflects $2.8 million of cash and cash equivalents held for customers and a corresponding liability in the same amount. Cash and cash equivalents held for customers and customer account liabilities arise as a by-product of our First Capital Cashflow Ltd. operations as it is customary to collect client funds and hold them for a short transient period before ultimately disbursing the amounts and settling the corresponding liability. Cash we hold on behalf of clients is segregated from our other corporate cash accounts and is not available for use by us other than to settle the corresponding client liability.
57
Marketable Securities
All marketable securities must be classified as one of the following: held to maturity, available for sale, or trading. At June 30, 2018, we held $10.0 million of marketable securities which consisted primarily of U.S. corporate and government debt securities.
Our held to maturity investments, all of which mature within one year, are recorded at amortized cost and interest income is recognized in earnings when earned. The cost of securities sold is determined based on the specific identification method. At June 30, 2018 and 2017, the amortized cost of our held-to-maturity investments approximated their fair value.
Our securities classified as available for sale are recorded at fair value, with all unrealized gains or losses recorded as a component of accumulated other comprehensive income (loss). At June 30, 2018 and 2017, all of our available for sale securities had maturities of less than one year. The cost of securities sold is determined based on the specific identification method. At June 30, 2018 and 2017, our net unrealized loss associated with our investment securities was not significant.
The table below presents information regarding our marketable securities by major security type as of June 30, 2018 and 2017.
| June 30, 2018 | June 30, 2017 | |||||||||||||||||||||||
| Held to Maturity | Available for Sale | Total | Held to Maturity | Available for Sale | Total | |||||||||||||||||||
| (in thousands) | ||||||||||||||||||||||||
Marketable securities: | ||||||||||||||||||||||||
Corporate and other debt securities | $ | 65 | $ | 9,947 | $ | 10,012 | $ | 67 | $ | 1,906 | $ | 1,973 | ||||||||||||
|
|
|
|
|
|
|
|
|
|
|
| |||||||||||||
Total marketable securities | $ | 65 | $ | 9,947 | $ | 10,012 | $ | 67 | $ | 1,906 | $ | 1,973 | ||||||||||||
|
|
|
|
|
|
|
|
|
|
|
| |||||||||||||
All of our available for sale marketable securities are classified as current assets as we do not have the positive intent to hold these investments until maturity. At June 30, 2018 and June 30, 2017, the difference between the fair value of our available for sale securities and their amortized cost was not significant.
The following table presents the aggregate fair values and gross unrealized losses for those available for sale investments that were in an unrealized loss position as of June 30, 2018 and June 30, 2017, respectively, aggregated by investment category and the length of time that individual securities have been in a continuous loss position:
| At June 30, 2018 | At June 30, 2017 | |||||||||||||||
| Less than 12 Months | ||||||||||||||||
| Fair Value | Unrealized Loss | Fair Value | Unrealized Loss | |||||||||||||
| (in thousands) | ||||||||||||||||
U.S. Corporate | $ | - | $ | - | $ | 1,628 | $ | (1 | ) | |||||||
Government-U.S. | 6,480 | (6 | ) | - | - | |||||||||||
|
|
|
|
|
|
|
| |||||||||
Total | $ | 6,480 | $ | (6 | ) | $ | 1,628 | $ | (1 | ) | ||||||
|
|
|
|
|
|
|
| |||||||||
Other Investments
We have certain other investments accounted for at cost. The carrying value of these investments was $4.4 million and $7.4 million at June 30, 2018 and 2017, respectively, and they are reported as a component of our other assets. The investments are evaluated periodically for indicators of impairment and impairment losses, to the extent occurring, would be recorded as an operating expense in the period incurred. At June 30, 2018, we reviewed the carrying value of these investments and concluded that they were not impaired.
58
For all but one of our investments, we are unable to exercise significant influence over the investee. In respect of one of our investments, we are able to exercise significant influence over the investee, although we are unable to exercise control. This investment is in preferred stock of a privately held, early-stage technology company. The preferred stock underlying our investment is not in-substance common stock. Accordingly, we account for this investment under the cost method of accounting, subject to periodic review for impairment. Our maximum investment exposure, which is determined based on the cost of our investment, was $3.5 million as of June 30, 2018 and is classified as a component of other assets on our consolidated balance sheet. There were no indicators of impairment identified as of June 30, 2018.
We concluded that this company is a VIE as it lacks sufficient equity to finance its activities. However, we also concluded that we are not the primary beneficiary of the VIE as we do not have the power to exert control or direct the activities that most significantly impact the VIE's economic performance. As we have determined we are not the primary beneficiary, consolidation of the VIE is not required.
Sale of Investment
During the fiscal year ended June 30, 2018, one of the entities in which we held an investment was acquired by another entity and our investment was liquidated. We recorded, as a component of Other Income, a gain on the sale of this investment of $2.4 million. The cost basis of this investment was $3.0 million. A portion of the proceeds due to us, $1.0 million, will be paid in June 2019; this amount is recorded as a component of prepaid expenses and other current assets in our consolidated balance sheet.
In addition, the acquisition of the entity in which we held our investment provided for the payment to us of $2.6 million which represented the buyout of a revenue share arrangement that we had with the predecessor company and a payment to us of $3.7 million in exchange for our release of certain market exclusivity and distribution rights. These amounts were recorded as components of Other Revenue and Other Income, respectively, in our consolidated statement of comprehensive income (loss) for the fiscal year ended June 30, 2018. The Other Revenue was recorded in our Banking Solutions segment.
Concentration of Credit Risk
Financial instruments that potentially subject us to significant concentrations of credit risk consist of cash and cash equivalents and accounts receivable. We had approximately $114.2 million of cash and cash equivalents invested with six financial institutions at June 30, 2018. Balances of cash and cash equivalents are typically in excess of any insurance, such as FDIC coverage, that may protect our deposits.
Our accounts receivable are reported in our consolidated balance sheets net of allowances for uncollectible accounts. We believe that the concentration of credit risk with respect to accounts receivable is limited due to the large number of companies and diverse industries comprising our customer base. On-going credit evaluations are performed, generally with a focus on new customers or customers with whom we have had no prior collections history, and collateral is generally not required. We maintain reserves for potential losses based on customer specific situations as well as our historic experience and such losses, in the aggregate, have not historically exceeded our expectations. There were no customers that, individually, accounted for more than 10% of our consolidated accounts receivable balance at June 30, 2018 or 2017. For the fiscal years ended June 30, 2018, 2017 and 2016, we had no customer that accounted for 10% or greater of our consolidated revenues.
Financial Instruments
The fair value of our financial instruments, which include cash and cash equivalents, cash and cash equivalents held for customers, marketable securities, accounts receivable, accounts payable, customer account liabilities, a derivative interest rate swap and debt drawn under our Credit Facility are based on assumptions concerning the amount and timing of estimated future cash flows and assumed discount rates reflecting varying degrees of perceived risk. Please refer to Note 4 Fair Value for further details on the fair value of these financial instruments.
59
Accounts Receivable
Accounts receivable includes unbilled receivables of approximately $8.9 million and $4.2 million at June 30, 2018 and 2017, respectively. Unbilled receivables include revenues recognized for which billings have not yet been presented to the customers, based on the contractually stipulated billing requirements.
Property and Equipment
Property and equipment are stated at cost, net of depreciation. Depreciation is recorded on a straight-line basis over the estimated useful lives of the assets as follows:
| Property, equipment, furniture, fixtures and vehicles | 3-7 years | |
| Technical equipment | 3-5 years | |
| Building (Reading, England) | 50 years | |
| Leasehold improvements | Lower of estimated life or remaining lease term |
Periodically, based on specific transactions, we may assign a life outside of the general range of useful lives noted here if a particular asset's estimated period of use falls outside of the normal range.
Goodwill and Other Intangible Assets
We initially record goodwill and other acquired intangible assets at their estimated fair values, and we review these assets periodically for impairment. Goodwill represents the excess of the purchase price over the fair value of identifiable tangible and intangible assets acquired and liabilities assumed in a business combination and is tested at least annually for impairment; historically during our fourth quarter.
Our specifically identifiable intangible assets, which consist principally of customer related assets and core technology, are reported net of accumulated amortization and are amortized over their estimated useful lives at amortization rates that are proportional to each asset's estimated economic benefit. We review the carrying value of these intangible assets annually, or more frequently if indicators of impairment are present.
In performing our review of the recoverability of goodwill and other intangible assets we consider several factors, including whether there have been significant changes in legal factors or the overall business climate that could affect the underlying value of an asset. We also consider whether there is an expectation that the asset will be sold or disposed of before the end of its originally estimated useful life. In the case of goodwill, we must estimate the fair value of the reporting unit to which the goodwill is assigned. If as a result of examining any of these factors we conclude that the carrying value of goodwill or any other intangible asset exceeds its estimated fair value, we will recognize an impairment charge.
Effective July 1, 2017, we adopted an accounting standard update requiring that purchased software be classified as an intangible asset rather than an element of property and equipment. Purchased software is amortized on a straight-line basis over an estimated useful life, typically ranging from 3 to 5 years. During the fiscal years ended June 30, 2017 and 2016, we capitalized $3.1 million and $0.2 million, respectively, of costs associated with our implementation of a new, global ERP solution, which will be amortized over a useful life of 10 years.
Advertising Costs
We expense advertising costs as incurred. Advertising costs were $2.0 million, $2.6 million and $2.6 million for the fiscal years ended June 30, 2018, 2017 and 2016, respectively.
Shipping and Handling Costs
We expense all shipping, handling and delivery costs in the period incurred, generally as a component of other cost of revenues.
60
Commissions Expense
We record commissions as a component of sales and marketing expense when earned by the respective salesperson. Excluding certain arrangements within our Banking Solutions segment, for which commissions are earned as revenue is recorded over the period of project performance, substantially all software commissions are earned in the month in which a customer order is received. Commissions associated with professional services are typically earned in the month that services are rendered. Commissions associated with post-contract customer support arrangements and subscription-based arrangements are typically earned when the customer is billed for the underlying contractual period, or in the period the order is received. Commissions are normally paid within thirty days of the month in which they are earned.
Research and Development Expenditures
Research and development costs incurred prior to the establishment of technological feasibility (for software to be sold, leased or otherwise marketed), or prior to application development (for internal-use software), are expensed as incurred and are reported as product development and engineering operating expenses in our statements of comprehensive income (loss).
Debt Issuance Costs
We incurred certain third party costs in connection with the Credit Facility, as defined in Note 10 Indebtedness , principally related to underwriting and legal fees. These costs are included as part of our other assets on our consolidated balance sheets and are being amortized to interest expense ratably over the five-year term of the Credit Facility.
Income Taxes and Income Tax Uncertainties
We recognize deferred tax assets and deferred tax liabilities based on differences in the financial reporting and tax basis of the underlying assets or liabilities, measured at tax rates that are expected to be in effect when the differences reverse. A valuation allowance to reduce the carrying value of deferred tax assets is recorded if, based on the weight of available evidence, it is more likely than not that some portion or all of the deferred tax assets will not be realized.
In respect of income tax uncertainties, we perform a two-step analysis for all tax positions. The first step involves an evaluation of the underlying tax position based solely on technical merits (such as tax law) and the second step involves measuring the tax position based on the probability of it being sustained in the event of a tax examination. We recognize tax benefits at the largest amount that we deem more likely than not will be realized upon ultimate settlement of any tax uncertainty. Tax positions that fail to qualify for recognition are recognized in the period in which the more-likely-than-not standard has been reached, when the tax positions are resolved with the respective taxing authority or when the statute of limitations for tax examination has expired.
We record any interest or penalties accruing in respect of uncertain tax positions as a component of income tax expense.
Share-Based Compensation
We recognize expense for the estimated fair value of our share-based compensation. The expense associated with share-based payment awards is recognized on a straight-line basis over the award's vesting period.
Capitalized Software Costs
Capitalization of software development costs for software that is to be sold, leased or otherwise marketed begins upon the establishment of technological feasibility. The establishment of technological feasibility and the ongoing assessment of recoverability of capitalized software development costs requires considerable judgment by us with respect to certain factors, including, but not limited to, technological feasibility, anticipated future gross revenues, estimated economic life, and changes in software and hardware technologies. Capitalized costs commence amortization on the date of general release using the greater of the straight-line method over the
61
estimated useful life, or the ratio of revenue in the period to total expected revenues over the product's expected useful life. For the fiscal years ended June 30, 2018, 2017 and 2016, we capitalized $3.2 million, $3.4 million and $7.8 million, respectively, and recorded amortization expense of $2.8 million, $2.2 million and $1.2 million, respectively, of software development costs, excluding software developed for internal use. At June 30, 2018 and 2017, the net carrying value of capitalized software excluding software developed for internal use, which is included in intangible assets, net on our consolidated balance sheets, was $13.3 million and $12.9 million, respectively.
We capitalize certain development costs associated with internal use software incurred during the application development stage. We expense costs associated with preliminary project phase activities, training, maintenance and any post-implementation period costs as incurred. For the fiscal years ended June 30, 2018, 2017 and 2016, we capitalized $6.3 million, $6.6 million and $6.0 million, respectively, of internal use software development costs associated with our SaaS-based technology platforms. Capitalized internal use software costs are normally amortized over estimated useful lives ranging from 2 to 7 years once the related project has been completed and deployed for use. For the fiscal years ended June 30, 2018, 2017 and 2016, we recorded amortization expense of $5.2 million, $3.8 million and $2.5 million, respectively, of capitalized internal use software costs associated with our SaaS-based technology platforms. At June 30, 2018 and 2017, the net carrying value of capitalized internal use software associated with our SaaS-based technology platforms, which is included in intangible assets, net on our consolidated balance sheets, was $16.8 million and $15.7 million, respectively.
Revenue Recognition
Software Arrangements
We recognize revenue on our software license arrangements when four basic criteria are met: persuasive evidence of an arrangement exists, delivery of the product has occurred, the fee is fixed and determinable and collectability is probable. We consider a fully executed agreement or a customer purchase order to be persuasive evidence of an arrangement. Delivery is deemed to have occurred upon transfer of the product to the customer or the completion of services rendered. We consider the arrangement fee to be fixed and determinable if it is not subject to adjustment and if the customer has not been granted extended payment terms. Excluding our long term contract arrangements where revenue is recorded on a percentage of completion basis, extended payment terms are deemed to be present when any portion of the software license fee is due in excess of 90 days after the date of product delivery. In arrangements that contain extended payment terms, software revenue is recorded as customer payments become contractually due, assuming all other revenue recognition criteria have been met. We consider the arrangement fee to be probable of collection if our internal credit analysis indicates that the customer will be able to pay contractual amounts as they become due.
Our software arrangements often contain multiple revenue elements, such as software licenses, professional services and post-contract customer support. For multiple element software arrangements which qualify for separate element treatment, revenue is recognized for each element when each of the four basic criteria is met which, excluding post-contract customer support, is typically upon delivery. Revenue for post-contract customer support agreements is recognized ratably over the term of the agreement, which is generally one year. Revenue is allocated to each element, excluding the software license, based on vendor specific objective evidence (VSOE). VSOE is limited to the price charged when the element is sold separately or, for an element not yet being sold separately, the price established by management having the relevant authority. We do not have VSOE for our software licenses since they are seldom sold separately. Accordingly, revenue is allocated to the software license using the residual value method. Under the residual value method, revenue equal to VSOE of each undelivered element is recognized upon delivery of that element. Any remaining arrangement fee is then allocated to the software license. This has the effect of allocating any sales discount inherent in the arrangement to the software license fee.
Certain of our software arrangements require significant customization and modification and involve extended implementation periods. These arrangements do not qualify for separate element revenue recognition treatment as described above, and instead must be accounted for under contract accounting. Under contract
62
accounting, companies must select from two generally accepted methods of accounting: the completed contract method and the percentage of completion method. The completed contract method recognizes revenue and costs upon contract completion, and all project costs and revenues are reported as deferred items in the balance sheet until that time. The percentage of completion method recognizes revenue and costs on a contract over time, as the work progresses.
We use the percentage of completion method of accounting for our long-term contracts, as we believe that we can make reasonably reliable estimates of progress toward completion. Progress is measured based on labor hours, as measured at the end of each reporting period, as a percentage of total expected labor hours. Accordingly, the revenue we record in any reporting period for arrangements accounted for on a percentage of completion basis is dependent upon our estimates of the remaining labor hours that will be incurred in fulfilling our contractual obligations. Our estimates at the end of any reporting period could prove to be materially different from final project results, as determined only at subsequent stages of project completion. To mitigate this risk, we solicit the input of our project professional staff on a monthly basis, as well as at the end of each financial reporting period, for purposes of evaluating cumulative labor hours incurred and verifying the estimated remaining effort to completion; this ensures that our estimates are always based on the most current projections available.
Non-Software Arrangements
For arrangements governed by general revenue recognition literature, such as with our SaaS offerings or equipment and supplies only sales, we recognize revenue when four basic criteria are met. These criteria are similar to those governing software transactions: persuasive evidence of an arrangement exists, delivery has occurred or services have been rendered, the arrangement fee is fixed or determinable and collectability is reasonably assured. For our SaaS offerings, revenue is generally recognized on a subscription or transaction basis over the period of performance.
For arrangements consisting of multiple elements, revenue is allocated to each element based on a selling price hierarchy. The selling price of each element is based on VSOE if available, third-party evidence (TPE) if VSOE is not available or estimated selling price (ESP) if neither VSOE nor TPE are available. The residual method of allocation in a non-software arrangement is not permitted and, instead, arrangement consideration is allocated at the inception of the arrangement to all deliverables using the relative selling price method. The relative selling price method allocates any discount in the arrangement proportionately to each deliverable based on the proportion of each deliverable's selling price to the total arrangement fee. We are typically unable to establish TPE, which is based on the selling price charged by unrelated third-party vendors for similar deliverables when they are sold separately, as we are generally unable to obtain sufficient information on actual vendor selling prices to substantiate TPE. The objective of ESP is to estimate the price at which we would transact if the deliverable were sold separately rather than as part of a multiple element arrangement. Our determination of ESP considers several factors including actual selling prices for similar transactions, gross margin expectations and our ongoing pricing strategy. We formally analyze our ESP determinations on at least an annual basis.
Whether a deliverable represents a separate unit of accounting, thus resulting in discrete revenue recognition as the revenue recognition criteria for that deliverable are met, is dependent on whether the deliverable has value to the customer on a standalone basis. A deliverable has standalone value if it is sold separately by us or any other vendor or if the deliverable could be resold by the customer. Additionally, in an arrangement that includes a general right of return related to delivered items, delivery or performance of any undelivered items must be considered probable and substantially within our control.
We periodically charge up-front fees related to installation and integration services in connection with certain of our SaaS offerings. These fees typically do not have stand-alone value and are deferred and recognized as revenue ratably over the estimated customer relationship period (generally five to ten years). The revenue recognition period associated with these fees normally commences upon customer implementation.
Contract origination costs and incremental direct costs are expensed as incurred.
63
Arrangements Including Both Software and Non-Software Deliverables
Periodically we will enter an arrangement that contains both software and non-software deliverables. In such a transaction, the arrangement consideration is allocated to the software deliverables and non-software deliverables as a group, using the relative selling prices of each of the deliverables, by following the aforementioned selling price hierarchy. After this allocation is completed, the arrangement consideration allocated to the software deliverables is further allocated using the residual value method described above.
Regardless of the allocation methodology or the nature of the deliverables, we limit the amount of revenue that can be recognized for delivered items to the amount that is not contingent on future deliverables or subject to customer specific return or refund rights.
Earnings per Share
We report both basic and diluted earnings per share. Basic earnings per share is calculated based on the weighted average number of shares of common stock outstanding and excludes the dilutive effect of warrants, stock options or any other type of convertible securities. Diluted earnings per share is calculated based on the weighted average number of shares of common stock outstanding and the dilutive effect of stock options, warrants and other types of convertible securities are included in the calculation. Dilutive securities are excluded from the diluted earnings per share calculation if their effect is anti-dilutive.
Comprehensive Income or Loss
Comprehensive income or loss includes all changes in equity during a period from non-owner sources, such as net income or loss, foreign currency translation adjustments, certain pension adjustments, unrealized gains and losses on available for sale securities and unrealized gains and losses on our interest rate hedging transactions.
Note 3-Recent Accounting Pronouncements
Recently Adopted Pronouncements
Cloud Computing Arrangements: In April 2015, the Financial Accounting Standards Board (FASB) issued an accounting standard update which provides guidance as to whether a cloud computing arrangement (e.g., software as a service, platform as a service, infrastructure as a service, and other similar arrangements) includes a software license and, based on that determination, how to account for such arrangements. We adopted this standard effective July 1, 2016 on a prospective basis. The adoption of this standard did not have a material impact on our financial statements. In December 2016, the FASB issued a technical update to this standard, clarifying that any software license within the scope of this accounting standard shall be accounted for as an intangible asset by the licensee. We adopted the technical update on July 1, 2017 and reclassified software licenses from property and equipment, net to intangible assets, net in our consolidated balance sheets for all periods presented. The total amount reclassified in our June 30, 2017 consolidated balance sheet was $29.1 million.
Share-Based Compensation: In March 2016, the FASB issued an accounting standard update intended to simplify several areas of accounting for share-based compensation arrangements, including the income tax impact of excess tax benefits and tax deficiencies, accounting for forfeitures, statutory tax withholding requirements and the presentation of excess tax benefits in the statement of cash flows. We adopted this standard on July 1, 2017. Upon adoption of this standard, excess tax benefits of $0.2 million were recognized as a component of our net deferred tax assets, with an offsetting cumulative effect adjustment recorded as a reduction to our accumulated deficit in our consolidated balance sheet.
We adopted the cash flow presentation of excess tax benefits retrospectively, which resulted in the reclassification of excess tax benefits associated with stock compensation of $0.1 million and $0.3 million from financing activities to operating activities for the fiscal years ended June 30, 2017 and 2016, respectively, in our consolidated statement of cash flows.
64
The new standard also allows companies to make an accounting policy election to either estimate expected forfeitures or account for them as they occur, and we have elected to continue to estimate forfeitures.
Consolidation: In October 2016, the FASB issued an accounting standard update to remove the requirement that a single decision maker consider, in its assessment of primary beneficiary, its indirect interest held through related parties under common control to be the equivalent of a direct interest in a variable interest entity (VIE). Instead, indirect interest held through related parties under common control will be included in the primary beneficiary assessment based on proportionate basis, consistent with the indirect interest held through other parties. We adopted this standard effective July 1, 2017. The adoption of this standard did not have an impact on our financial statements.
Accounting Pronouncements to be Adopted
Revenue Recognition: In May 2014, the FASB issued an accounting standard update which provides for new revenue recognition guidance, superseding nearly all previously existing revenue recognition guidance. The core principle of the new guidance is to recognize revenue when promised goods or services are transferred to customers, in an amount that reflects the consideration which the vendor expects to receive for those goods or services. The new standard requires significantly more judgment and estimation within the revenue recognition process than required under previously existing U.S. GAAP, including identifying performance obligations in the contract, estimating the amount of variable consideration to include in the transaction price and allocating the transaction price to separate performance obligations. The new standard is also expected to significantly increase the financial statement disclosure related to revenue recognition. This standard is effective for us on July 1, 2018 and we will adopt this standard using the modified retrospective method with the cumulative effect of initially applying the standard recognized at the date of initial application inclusive of certain additional disclosures.
We are continuing to evaluate the expected impact of this standard on our consolidated financial statements. While our assessment of the impact of this standard is not complete, we believe that the most significant impacts will be in certain areas:
| • | Under the new standard, vendor specific objective evidence (VSOE) is no longer required to determine the fair value of elements in a software arrangement. As a result, the absence of VSOE in software arrangements will no longer result in strict revenue deferral. We believe that this will result in greater up-front recognition of software revenue for certain of our license arrangements. |
| • | Under the new standard, certain expenses we incur will require deferral and recognition over the period in which revenue is recognized, which may be longer than the initial term of the contract. This will result in the deferral of certain fulfillment costs associated with our SaaS offerings which would then be recognized as expense over a multi-year period; such costs are expensed directly as incurred today. |
| • | Under the new standard, costs to obtain a contract, including sales commissions, will be capitalized and amortized on a basis that is consistent with the transfer of goods and services to its customer. This will result in the deferral of certain commission related costs that, today, are expensed as incurred. However, we will recognize commissions expense as incurred when the amortization period of the asset that otherwise would have been recognized is one year or less. |
| • | Significantly enhanced financial statement disclosures related to revenue, including information related to the allocation of transaction price across undelivered performance obligations, will be required. |
We are unable to quantify the impact of these outcomes at this time and our continuing analysis and interpretation of the standard could identify additional financial reporting consequences in addition to those described here.
Financial Instruments - Classification and Measurement: In January 2016, the FASB issued an accounting standard update which requires, among other things, that entities measure equity investments (except those accounted for under the equity method of accounting or those that result in consolidation of the investee) at fair value, with changes in fair value recognized in earnings. Under the standard, entities will no longer be able to recognize unrealized holding gains and losses on equity securities classified as available for sale as a component
65
of other comprehensive income (OCI). Subject to certain exceptions, entities will be able to elect to record equity investments without readily determinable fair values at cost, less impairment, plus or minus adjustments for observable price changes, with all such changes recognized in earnings. This new standard does not change the guidance for classifying and measuring investments in debt securities and loans. The standard is effective for us on July 1, 2018 on a prospective basis. We do not believe this standard will have a material impact on our financial statements with respect to the accounting change for available for sale securities. We have certain cost method investments of $4.4 million at June 30, 2018 and to the extent that there are observable price changes following the date of adoption the accounting for these investments could be affected.
Leases: In February 2016, the FASB issued an accounting standard update which requires balance sheet recognition of a lease liability and a corresponding right-of-use asset for all leases with terms longer than twelve months. The pattern of recognition of lease related revenue and expenses will be dependent on its classification. The updated standard requires additional disclosures to enable users of the financial statements to assess the amount, timing and uncertainty of cash flows arising from leases. This standard is effective for us on July 1, 2019, with early adoption permitted; adoption is on a modified retrospective basis. We anticipate that the adoption of this standard will have a material impact to our consolidated balance sheet due to the recognition of right of use assets and lease liabilities; however, we are still evaluating the anticipated impact of this standard on our financial statements.
Financial Instruments - Credit Losses: In June 2016, the FASB issued an accounting standard update that introduces a new forward-looking approach, based on expected losses, to estimate credit losses on certain types of financial instruments including trade receivables. The estimate of expected credit losses will require entities to incorporate historical information, current information and reasonable and supportable forecasts. This standard also expands the disclosure requirements to enable users of financial statements to understand the entity's assumptions, models and methods for estimating expected credit losses. This standard is effective for us on July 1, 2020, with early application permitted. We are currently evaluating the anticipated impact of this standard on our financial statements.
Statement of Cash Flows: In August and November of 2016, the FASB issued updates to the accounting standards which address the classification and presentation of certain cash receipts, cash payments and restricted cash in the statement of cash flows. The standards are effective for us on July 1, 2018 and require a retrospective approach. Early adoption is permitted, including adoption in an interim period. We do not anticipate the adoption of these standards will have a material impact on our consolidated statements of cash flows.
Goodwill Impairment: In January 2017, the FASB issued an accounting standard update to simplify the test for goodwill impairment which removes step 2 from the goodwill impairment test. Under the revised standard, an entity will perform its annual or interim goodwill impairment test by comparing the fair value of a reporting unit with its carrying amount and recognize an impairment charge for the amount by which the carrying amount exceeds the reporting unit's fair value. The loss should not exceed the total amount of goodwill allocated to the reporting unit. The standard is effective for us on July 1, 2020 on a prospective basis, with early adoption permitted for periods beginning on or after January 1, 2017. We are currently evaluating the impact of this standard on our financial statements and the timing of adoption.
Defined Benefit Plan Expenses: In March 2017, the FASB issued an accounting standard update that changes the income statement presentation of defined benefit plan expense by requiring separation between operating expense (service cost component) and non-operating expense (all other components of net periodic defined benefit cost). Under the revised standard, the operating expense component will be reported with similar compensation costs, while the non-operating components will be reported in Other Income and Expense. In addition, only the service cost component is eligible for capitalization as part of an asset such as property, plant and equipment. This standard is effective for us on July 1, 2018. We do not currently believe that the adoption of this standard will have a material impact on our financial statements.
Share-Based Compensation - Nonemployee Share-Based Payment Accounting: In June 2018, the FASB issued an accounting standard update to simplify the accounting for share-based payments to nonemployees by aligning it with the accounting for share-based payments to employees. Under the revised standard, measurement
66
of nonemployee awards will be fixed at the grant date by estimating the fair value of the equity instruments to be issued. Additionally, during the vesting period, nonemployee awards that contain a performance condition that affects the quantity or other terms of the award are measured based on the probable outcome. Upon adoption, entities must recognize a cumulative-effect adjustment to retained earnings as of the beginning of the annual period of adoption for equity-classified nonemployee awards for which a measurement date has not been established and liability-classified nonemployee awards that have not been settled. This standard is effective for us on July 1, 2019. Early adoption is permitted, including in an interim period, but not before an entity adopts the new revenue guidance. We are currently evaluating the impact of this standard on our financial statements and the timing of adoption.
Note 4-Fair Value
Fair Value of Assets and Liabilities
We measure fair value at the price that would be received to sell an asset or paid to transfer a liability in an orderly transaction between market participants at the measurement date. In determining fair value, the assumptions that market participants would use in pricing an asset or liability (the inputs) are based on a tiered fair value hierarchy consisting of three levels, as follows:
Level 1: Observable inputs such as quoted prices for identical assets or liabilities in active markets.
Level 2: Other inputs that are observable directly or indirectly, such as quoted prices for similar instruments in active markets or for similar markets that are not active.
Level 3: Unobservable inputs for which there is little or no market data and which require us to develop our own assumptions about how market participants would price the asset or liability.
Valuation techniques for assets and liabilities include methodologies such as the market approach, the income approach or the cost approach, and may use unobservable inputs such as projections, estimates and management's interpretation of current market data. These unobservable inputs are only utilized to the extent that observable inputs are not available or cost-effective to obtain.
At June 30, 2018 and June 30, 2017, our assets and liabilities measured at fair value on a recurring basis were as follows:
| June 30, 2018 | June 30, 2017 | |||||||||||||||||||||||||||||||
| Fair Value Measurements Using Input Types | Fair Value Measurements Using Input Types | |||||||||||||||||||||||||||||||
| Level 1 | Level 2 | Level 3 | Total | Level 1 | Level 2 | Level 3 | Total | |||||||||||||||||||||||||
| (in thousands) | ||||||||||||||||||||||||||||||||
Assets | ||||||||||||||||||||||||||||||||
Money market funds (cash and cash equivalents) | $ | 154 | $ | - | $ | - | $ | 154 | $ | 593 | $ | - | $ | - | $ | 593 | ||||||||||||||||
Available for sale securities-Debt | ||||||||||||||||||||||||||||||||
U.S. Corporate | $ | - | $ | 3,467 | $ | - | $ | 3,467 | $ | - | $ | 1,906 | $ | - | $ | 1,906 | ||||||||||||||||
Government-U.S. | - | 6,480 | - | 6,480 | - | - | - | - | ||||||||||||||||||||||||
|
|
|
|
|
|
|
|
|
|
|
|
|
|
|
| |||||||||||||||||
Total available for sale securities | $ | - | $ | 9,947 | $ | - | $ | 9,947 | $ | - | $ | 1,906 | $ | - | $ | 1,906 | ||||||||||||||||
Short-term derivative interest rate swap | $ | - | $ | 407 | $ | - | $ | 407 | $ | - | $ | - | $ | - | $ | - | ||||||||||||||||
Long-term derivative interest rate swap | $ | - | $ | 2,183 | $ | - | $ | 2,183 | $ | - | $ | - | $ | - | $ | - | ||||||||||||||||
Fair Value of Financial Instruments
We have certain financial instruments which consist of cash and cash equivalents, cash and cash equivalents held for customers, marketable securities, accounts receivable, accounts payable, customer account
67
liabilities, a derivative interest rate swap and debt drawn on our Credit Facility. Fair value information for each of these instruments is as follows:
| • | Cash and cash equivalents, cash and cash equivalents held for customers, accounts receivable, accounts payable and customer account liabilities fair values approximates their carrying values, due to the short-term nature of these instruments. |
| • | Marketable securities classified as held to maturity, all of which mature within one year, are recorded at amortized cost, which at June 30, 2018 and June 30, 2017, approximated fair value. |
| • | Marketable securities classified as available for sale are recorded at fair value. Unrealized gains and losses are included as a component of other accumulated comprehensive loss in stockholders' equity, net of tax. We use the specific identification method to determine any realized gains or losses from the sale of our marketable securities classified as available for sale. |
| • | The fair value of our derivative interest rate swap is based on the present value of projected cash flows that will occur over the life of the instrument, after considering certain contractual terms of the arrangement and counterparty credit risk. |
| • | The carrying value of assets related to deposits we have made to fund future requirements associated with Israeli severance arrangements was $1.4 million and $1.5 million at June 30, 2018 and June 30, 2017, respectively, which approximated their fair value. |
| • | We have certain other investments accounted for at cost. The carrying value of these investments was $4.4 million and $7.4 million at June 30, 2018 and June 30, 2017, respectively, and they are reported as a component of our other assets. These investments are recorded at cost, less any write-downs for other-than-temporary impairment charges. To determine the fair value of these investments, we use readily available financial information including information based on recent or pending third-party equity investments in these entities. In certain instances, a cost method investment's fair value may not be estimated if there are no identified events or changes in circumstances that would indicate a significant adverse effect on the fair value of the investment and to do so would be impractical. |
| • | We have borrowings of $150 million against our Credit Facility. The fair value of these borrowings, which are classified as Level 2, approximates their carrying value at June 30, 2018, as the instrument carries a variable rate of interest which reflects current market rates. |
Note 5-Acquisitions
First Capital Cashflow Ltd.
On October 4, 2017, we acquired First Capital Cashflow Ltd. (FCC) for 10.5 million British Pound Sterling (approximately $13.9 million based on the exchange rate in effect at the acquisition date) in cash and 42,080 shares of our common stock. The shares, which were issued to the selling stockholders of FCC who became employees of Bottomline, have vesting conditions tied to continued employment; as such the shares are compensatory and we will record share-based payment expense over the underlying stock vesting period of five years. FCC is headquartered and operates in the United Kingdom and is a provider of transaction settlement solutions. The acquisition is expected to strengthen our payment solution capabilities and further enhance our ability to provide secure, scalable technology solutions that enable customers to adapt to and leverage changes in the business payments environment.
In the preliminary allocation of the purchase price, we recorded $4.8 million of goodwill. The goodwill is not deductible for income tax purposes and arose principally due to anticipated future benefits arising from the acquisition. Identifiable intangible assets of $10.4 million, consisting of customer related and other intangible assets, are being amortized over a weighted average estimated useful life of eleven years. FCC's operating results are included in the Payments and Transactional Documents segment from the date of the acquisition forward and did not have a material impact on our revenue or earnings.
68
Decillion
On August 14, 2017, we acquired Singapore-based Decillion Group (Decillion) for total consideration of 6.2 million Singapore Dollars (approximately $4.6 million based on the exchange rate in effect at the acquisition date), consisting of $2.8 million in cash and a note payable of $1.8 million. The note is payable in equal installments over ten quarters starting during the three months ended September 30, 2017. Decillion is a financial messaging solution provider in the Asia-Pacific region. Headquartered in Singapore, Decillion has offices in Australia, China, Indonesia, Malaysia and Thailand and operates a SWIFT service bureau which connects more than 130 financial institutions and corporations to the SWIFT community. This acquisition expands the depth and breadth of our financial messaging solutions, particularly in the Asia-Pacific region.
In the preliminary allocation of the purchase price, we recorded $1.3 million of goodwill. The goodwill is not deductible for income tax purposes and arose principally due to anticipated future benefits arising from the acquisition. Identifiable intangible assets of $2.4 million, consisting of customer related intangible assets, are being amortized over their estimated useful life of twelve years. Decillion's operating results have been included in our Cloud Solutions segment from the date of the acquisition forward and did not have a material impact on our revenue or earnings.
Acquisition expenses of approximately $0.9 million were expensed during the fiscal year ended June 30, 2018 related to the Decillion and FCC acquisitions, principally as a component of general and administrative expense.
Note 6-Property and Equipment
Property and equipment consisted of the following:
| June 30, | ||||||||
| 2018 | 2017 | |||||||
| (in thousands) | ||||||||
Land | $ | 250 | $ | 246 | ||||
Building and improvements | 18,218 | 17,054 | ||||||
Furniture and fixtures | 7,026 | 6,573 | ||||||
Technical equipment | 45,756 | 42,491 | ||||||
Motor vehicles | 30 | 31 | ||||||
|
|
|
| |||||
Total property and equipment, gross | 71,280 | 66,395 | ||||||
Less: Accumulated depreciation | 42,385 | 40,200 | ||||||
|
|
|
| |||||
Total property and equipment, net (1) | $ | 28,895 | $ | 26,195 | ||||
|
|
|
| |||||
| (1) | We adopted a technical update to the cloud computing arrangement accounting pronouncement on July 1, 2017 and reclassified $29.1 million of software licenses from property and equipment, net to intangible assets, net in our June 30, 2017 consolidated balance sheet. |
Note 7-Goodwill and Other Intangible Assets
Goodwill and acquired intangible assets are initially recorded at fair value and tested periodically for impairment. We perform an impairment test of goodwill during the fourth quarter of each fiscal year or sooner, if indicators of potential impairment arise.
In the second quarter of fiscal year 2017, based on continued shortfalls of revenue against our revenue projections, we performed the first step of the goodwill impairment test for the Intellinx reporting unit and determined that its fair value was lower than its carrying value. Accordingly, we performed the second step of the goodwill impairment test which compared the estimated fair value of this reporting unit's goodwill to its carrying
69
value. As a result of this test, we recorded a non-cash, pretax, goodwill impairment charge of $7.5 million. The goodwill impairment charge did not affect our liquidity or the financial covenants in any of our outstanding debt agreements. The primary driver of this impairment charge was related to revenue estimates being below the revenue estimates we made at the time of our Intellinx acquisition (January 2015). Our Intellinx reporting unit is a component of our Other reportable segment.
In calculating the goodwill impairment charge recorded during the second quarter of fiscal year 2017, we completed a discounted cash flow model associated with our Intellinx business, including the amount and timing of future expected cash flows, tax attributes, technology and customer attrition rates, a terminal value growth rate and an appropriate market-participant, risk-adjusted, weighted average cost of capital in each case using estimates that we considered to be reasonable and appropriate. The overall fair value estimate utilized a combination of a discounted cash flow methodology and a consideration of market multiples.
Prior to performing the goodwill impairment test, we performed a test of recoverability for the finite lived intangible assets related to the Intellinx reporting unit, including the core technology intangible asset. The test of recoverability for these assets is based on an undiscounted cash flow model. Based on that analysis, we concluded the finite lived intangible assets were not impaired.
We performed our annual goodwill impairment test during the fourth quarter of fiscal years 2017 and 2018. Based on these reviews, we concluded that there was no goodwill impairment.
There can be no assurance that there will not be additional impairment charges in future periods as a result of future impairment reviews. To the extent that future impairment charges occur it would likely have a material impact on our financial results. At June 30, 2018, the carrying value of goodwill for all of our reporting units was $200.0 million, and the carrying value of goodwill in the Intellinx reporting unit was $4.4 million.
Effective July 1, 2017, we adopted an accounting standard update requiring that software be classified as an intangible asset rather than an element of property and equipment, and reclassified $29.1 million of software from property and equipment, net to intangible assets, net in our June 30, 2017 consolidated balance sheet. Intangible asset information as of June 30, 2017 has been recast in the table that follows to reflect this change.
The following tables set forth the information for intangible assets subject to amortization and for intangible assets not subject to amortization.
| As of June 30, 2018 | ||||||||||||||||
| Gross Carrying Amount | Accumulated Amortization | Net Carrying Value | Weighted Average Remaining Life | |||||||||||||
| (in thousands) | (in years) | |||||||||||||||
Amortized intangible assets: | ||||||||||||||||
Customer related | $ | 201,214 | $ | (134,133 | ) | $ | 67,081 | 8.4 | ||||||||
Core technology | 130,257 | (82,815 | ) | 47,442 | 8.1 | |||||||||||
Other intangible assets | 21,983 | (17,299 | ) | 4,684 | 5.3 | |||||||||||
Capitalized software development costs | 19,527 | (6,265 | ) | 13,262 | 4.0 | |||||||||||
Software (1) | 62,711 | (33,395 | ) | 29,316 | 4.6 | |||||||||||
|
|
|
|
|
| |||||||||||
Total | $ | 435,692 | $ | (273,907 | ) | $ | 161,785 | |||||||||
|
|
|
| |||||||||||||
Unamortized intangible assets: | ||||||||||||||||
Goodwill | 200,024 | |||||||||||||||
|
| |||||||||||||||
Total intangible assets | $ | 361,809 | ||||||||||||||
|
| |||||||||||||||
70
| As of June 30, 2017 | ||||||||||||||||
| Gross Carrying Amount | Accumulated Amortization | Net Carrying Value | Weighted Average Remaining Life | |||||||||||||
| (in thousands) | (in years) | |||||||||||||||
Amortized intangible assets: | ||||||||||||||||
Customer related | $ | 190,965 | $ | (122,698 | ) | $ | 68,267 | 8.7 | ||||||||
Core technology | 130,572 | (74,452 | ) | 56,120 | 8.8 | |||||||||||
Other intangible assets | 20,591 | (15,691 | ) | 4,900 | 6.6 | |||||||||||
Capitalized software development costs | 16,304 | (3,423 | ) | 12,881 | 5.0 | |||||||||||
Software (1) | 54,489 | (25,377 | ) | 29,112 | 3.5 | |||||||||||
|
|
|
|
|
| |||||||||||
Total | $ | 412,921 | $ | (241,641 | ) | $ | 171,280 | |||||||||
|
|
|
| |||||||||||||
Unamortized intangible assets: | ||||||||||||||||
Goodwill | 194,700 | |||||||||||||||
|
| |||||||||||||||
Total intangible assets | $ | 365,980 | ||||||||||||||
|
| |||||||||||||||
| (1) | Software includes purchased software and software developed for internal use. |
Estimated amortization expense for fiscal year 2019 and subsequent fiscal years for acquired intangible assets, capitalized software development costs and software, in each case that have been placed in service as of June 30, 2018, is as follows:
| Acquired Intangible Assets | Capitalized Software Development Costs | Software | ||||||||||
| (in thousands) | ||||||||||||
2019 | $ | 20,389 | $ | 3,144 | $ | 8,346 | ||||||
2020 | 17,937 | 3,144 | 6,655 | |||||||||
2021 | 16,240 | 3,144 | 4,346 | |||||||||
2022 | 14,105 | 3,144 | 2,905 | |||||||||
2023 | 13,106 | 256 | 1,451 | |||||||||
2024 and thereafter | 37,430 | - | 2,241 | |||||||||
Each period, for capitalized software development costs, we evaluate whether amortization expense using a ratio of revenue in the period to total expected revenue over the product's expected useful life would result in greater amortization than as calculated under a straight-line methodology and, if that were to occur, amortization in that period would be accelerated accordingly.
The following table represents a rollforward of our goodwill balances, by reportable segment:
| Cloud Solutions | Banking Solutions | Payments and Transactional Documents | Other | Total | ||||||||||||||||
| (in thousands) | ||||||||||||||||||||
Balance at June 30, 2016 | $ | 89,573 | $ | 35,880 | $ | 60,852 | $ | 15,723 | $ | 202,028 | ||||||||||
Goodwill impairment | - | - | - | (7,529 | ) | (7,529 | ) | |||||||||||||
Impact of foreign currency translation | 496 | - | (295 | ) | - | 201 | ||||||||||||||
|
|
|
|
|
|
|
|
|
| |||||||||||
Balance at June 30, 2017 (1) | $ | 90,069 | $ | 35,880 | $ | 60,557 | $ | 8,194 | $ | 194,700 | ||||||||||
Goodwill acquired during the period | 1,326 | - | 4,825 | - | 6,151 | |||||||||||||||
Impact of foreign currency translation | (1,125 | ) | - | 298 | - | (827 | ) | |||||||||||||
|
|
|
|
|
|
|
|
|
| |||||||||||
Balance at June 30, 2018 (1) | $ | 90,270 | $ | 35,880 | $ | 65,680 | $ | 8,194 | $ | 200,024 | ||||||||||
|
|
|
|
|
|
|
|
|
| |||||||||||
| (1) | Other goodwill balance is net of $7.5 million accumulated impairment losses. |
71
Note 8-Accrued Expenses
Accrued expenses consisted of the following:
| June 30, | ||||||||
| 2018 | 2017 | |||||||
| (in thousands) | ||||||||
Employee compensation and benefits | $ | 19,535 | $ | 16,092 | ||||
Accrued customer rebates | 3,677 | 2,963 | ||||||
Professional fees | 2,182 | 2,163 | ||||||
Sales and value added taxes | 1,983 | 1,790 | ||||||
Accrued income taxes payable | 563 | 1,172 | ||||||
Accrued royalties | 332 | 287 | ||||||
Accrued interest | 2 | 237 | ||||||
Other | 6,720 | 4,475 | ||||||
|
|
|
| |||||
Total accrued expenses | $ | 34,994 | $ | 29,179 | ||||
|
|
|
| |||||
Note 9-Commitments and Contingencies
Leases
We lease our principal office facility in Portsmouth, NH under a non-cancelable operating lease expiring in 2027. In addition, we have two five-year options to further extend the term of this lease. Rent expense is fixed for the base term of the lease. We are also required to pay certain incremental operating costs above the base rent.
We lease office space in certain other cities worldwide under operating leases that expire at various dates. In addition to the base rent, we are typically also responsible for a portion of the operating expenses associated with these facilities. Where operating leases contain rent escalation clauses or certain types of landlord concessions, the estimated financial effect of these items are included in the determination of the straight-line expense over the lease term.
Rent expense, net of sublease income, for the fiscal years ended June 30, 2018, 2017 and 2016 was $6.5 million, $6.7 million and $6.4 million, respectively. Sublease income for the fiscal years ended June 30, 2018, 2017 and 2016 was insignificant.
Future minimum annual rental commitments under our facilities, equipment and vehicle leases at June 30, 2018 are as follows:
| (in thousands) | ||||
2019 | $ | 5,526 | ||
2020 | 4,654 | |||
2021 | 3,997 | |||
2022 | 3,179 | |||
2023 | 1,822 | |||
2024 and thereafter | 4,763 | |||
|
| |||
| $ | 23,941 | |||
|
| |||
Long Term Service Arrangements
We have entered into service agreements with initial minimum commitments ranging between one and six years that expire between the fiscal years 2019 and 2023, primarily for software licenses, hosting services and
72
disaster recovery services. In addition to the base terms, we have certain options to extend the terms of the service agreements. Payments are fixed for the initial terms and are subject to increase in the event that we elect to extend the service.
Future minimum annual commitments under our long term service arrangements as of June 30, 2018 are as follows:
| (in thousands) | ||||
2019 | $ | 6,475 | ||
2020 | 1,858 | |||
2021 | 167 | |||
2022 | 30 | |||
2023 | 29 | |||
|
| |||
| $ | 8,559 | |||
|
| |||
Legal Matters
In May 2017, we received notification from a former customer alleging a breach of contract by us, based on software we licensed to them in September 2013. In August 2018, we paid $1.3 million to settle this claim. This amount was expensed in our consolidated statement of comprehensive income (loss) for the fiscal year ended June 30, 2018.
We are, from time to time, a party to legal proceedings and claims that arise out of the ordinary course of our business. We are not currently a party to any material legal proceedings.
Restructuring
During the fiscal year 2018, we recorded restructuring expenses associated with a facility closure and severance related benefits of $1.5 million, primarily within our general and administrative and sales and marketing expense lines, and this amount was substantially paid at June 30, 2018. We also recorded accelerated stock compensation expense of $0.2 million, primarily within general and administrative expenses.
Note 10-Indebtedness
Credit Agreement
On December 9, 2016, we (as borrower) and certain of our existing and future domestic material restricted subsidiaries (the Guarantors) entered into a credit agreement (the Credit Agreement) with Bank of America, N.A. and certain other lenders (the Lenders) that provides for a five-year revolving credit facility in the amount of up to $300 million (the Credit Facility). We also have the right to request an increase of the aggregate commitments under the Credit Facility by up to $150 million without the consent of any Lenders not participating in such increase, subject to specified conditions. In July 2018, we entered into an amendment to the Credit Facility that, among other things, lowered certain borrowing costs and extended its term to July 16, 2023. The discussion that follows relates to the Credit Facility as amended.
The proceeds of the Credit Facility may be used for lawful corporate purposes of Bottomline and its subsidiaries, including acquisitions, share buybacks, capital expenditures, the repayment or refinancing of indebtedness and general corporate purposes. The Credit Facility is available for the issuance of up to $20 million of letters of credit and up to $20 million of swing line loans.
Loans outstanding under the Credit Facility will bear interest, at our option, at either (i) a Eurodollar rate plus a margin of between 1.125% and 1.75% based on the Consolidated Net Leverage Ratio (as defined in the Credit Agreement), or (ii) a base rate plus a margin of between 0.125% and 0.75% based on the Consolidated Net
73
Leverage Ratio. Loans under the Credit Agreement may be prepaid at par and commitments under the Credit Agreement may be reduced at any time, in whole or in part, without premium or penalty (except for LIBOR breakage costs).
The Credit Facility is guaranteed by the Guarantors and is secured by substantially all of our domestic assets and those of the Guarantors, including a pledge of all of the shares of capital stock of the Guarantors and 65% of the shares of the capital stock of our first-tier foreign subsidiaries or those of any Guarantor, in each case subject to certain exceptions as set forth in the Credit Agreement. The collateral does not include, among other things, any real property or the capital stock or any assets of any unrestricted subsidiary.
The Credit Agreement contains customary representations, warranties and covenants, including, but not limited to, material adverse events, specified restrictions on indebtedness, liens, investments, acquisitions, sales of assets, dividends and other restricted payments, and transactions with affiliates. We are required to comply with (a) a maximum consolidated net leverage ratio of 3.75 to 1.00, stepping down to 3.50 to 1.00 for the quarter ending June 30, 2020; and (b) a minimum consolidated interest coverage ratio of 3.00 to 1.00.
The Credit Agreement also contains customary events of default and related cure provisions. In the case of a continuing event of default, the administrative agent would be entitled to exercise various remedies on behalf of the Lenders, including the acceleration of any outstanding loans.
As of June 30, 2018, we were in compliance with the covenants associated with the Credit Facility.
Convertible Senior Notes
On December 1, 2017, we repaid the aggregate principal balance of our 1.5% Convertible Senior Notes (the Notes). We borrowed $150 million under our Credit Facility and used $39.8 million of cash on hand to finance the repayment.
The principal balance of the Notes was required to be settled in cash. However, we were permitted at our election to settle any conversion obligation in excess of the principal portion in cash, shares of our common stock, or a combination of cash and shares of our common stock. Upon the maturity of the Notes, we elected to settle the conversion premium with shares of our common stock and, accordingly, issued approximately 0.6 million shares with a fair value of $33.54 per share. The impact of the share issuance was recorded entirely within stockholder's equity in our consolidated balance sheet and we recorded no gain or loss on the settlement of the Notes.
The following table sets forth total interest expense related to the Notes:
| Fiscal Year Ended June 30, | ||||||||||||
| 2018 | 2017 | 2016 | ||||||||||
| (in thousands) | ||||||||||||
Contractual interest expense (cash) | $ | 1,194 | $ | 2,846 | $ | 2,846 | ||||||
Amortization of debt discount (non-cash) | 5,574 | 12,641 | 11,774 | |||||||||
Amortization of debt issue costs (non-cash) | 494 | 1,184 | 1,184 | |||||||||
|
|
|
|
|
| |||||||
| $ | 7,262 | $ | 16,671 | $ | 15,804 | |||||||
|
|
|
|
|
| |||||||
Effective interest rate of the liability component | 8.45 | % | 8.16 | % | 7.70 | % | ||||||
|
|
|
|
|
| |||||||
Note Hedges
In December 2012, we entered into privately negotiated transactions to purchase hedge instruments (the Note Hedges), covering approximately 6.3 million shares of our common stock. The Note Hedges, subject to anti-dilution provisions substantially similar to those of the Notes, had a strike price that corresponds to the conversion price of the Notes, were exercisable by us upon any conversion under the Notes and expired on
74
December 1, 2017. On December 1, 2017, in connection with the maturity of the Notes, we redeemed a portion of the Note Hedges and received from the Note Hedge counterparties approximately 0.6 million shares of our common stock with a fair value $33.54 per share. The impact of the share redemption was recorded as treasury stock in our consolidated balance sheet and we recorded no gain or loss on the redemption of these shares. The redemption of these shares offset the dilution that otherwise would have occurred as a result of the common stock we issued upon the settlement of the Notes.
Warrants
In December 2012, we received aggregate proceeds of $25.8 million, net of issue costs, from the sale of warrants (the Warrants), for the purchase of up to 6.3 million shares of our common stock, subject to antidilution adjustments, at a strike price of $40.04 per share. The Warrants are exercisable in equal tranches over a period of 150 days beginning on March 1, 2018 and ending on October 2, 2018. Each warrant is exercisable into one share of our common stock. During the three months ended June 30, 2018, the holders of the Warrants exercised approximately 264,000 Warrants and as a result we issued shares of common stock in the same amount. We have approximately 2.7 million Warrants outstanding as of June 30, 2018. The Warrants can be net settled and, to-date, all Warrant exercises have been net settled.
The Warrants are transactions that are separate from the terms of the Notes and the Note Hedges, and holders of the Notes and Note Hedges had no rights with respect to the Warrants.
Note Payable
We financed a portion of the purchase price for our acquisition of Decillion by entering into a note payable for 2.5 million Singapore Dollars (approximately $1.8 million based on the exchange rate in effect at the acquisition date). The note is payable in equal installments over ten quarters starting during the three months ended September 30, 2017.
Note 11-Derivative Instruments
Note Hedges, Conversion Feature and Warrants
In December 2017, in connection with the maturity of the Notes, we settled the Note Hedges and the embedded conversion option (Conversion Feature) as discussed in Note 10 Indebtedness . The remaining derivative instruments related to the Notes at June 30, 2018 consist of the Warrants. The Warrants continue to meet the classification requirements for inclusion within stockholders' equity and as such they were not subject to fair value re-measurement. We are required to assess whether we continue to meet the stockholders' equity classification requirements. If in any future period we failed to satisfy those requirements, we would be required to reclassify the derivative instruments out of stockholders' equity, to either assets or liabilities depending on their nature, and record those instruments at fair value with changes in fair value reflected in earnings.
Cash Flow Hedges
Interest Rate Swap
In July 2017, we entered into an interest rate swap to hedge our exposure to interest rate risk. The agreement has a notional value of $100.0 million, was effective as of December 1, 2017 and expires on December 1, 2021. The notional amount of the swap matches the corresponding principal amount of a portion of our borrowings under the Credit Facility with the Lenders. During the term of the agreement, we have a fixed interest rate of 1.9275 percent on the notional amount and Citizens Bank, National Association, as counterparty to the agreement, will pay us interest at a floating rate based on the 1 month USD-LIBOR-BBA swap rate on the notional amount. Interest payments are made quarterly on a net settlement basis.
We designated the interest rate swap as a hedging instrument and it qualified for hedge accounting upon inception and at June 30, 2018. To continue to qualify for hedge accounting, the instrument must retain a "highly effective" ability to hedge interest rate risk for borrowings under the Credit Facility. We are required to test
75
hedge effectiveness at the end of each financial reporting period. If a derivative qualifies for hedge accounting, changes in fair value of the hedge instrument are recognized in accumulated other comprehensive income (loss) (AOCI) and subsequently reclassified into earnings in the period that the hedged transaction affects earnings. The reclassification into earnings is recorded as a component of our interest expense within other expense, net. If the instrument were to lose some or all of its hedge effectiveness, changes in fair value for the "ineffective" portion of the instrument would be recorded immediately in earnings.
The fair values of the interest rate swap and their respective locations in our consolidated balance sheet at June 30, 2018 were as follows:
Description | Balance Sheet Location | June 30, 2018 | ||||
| (in thousands) | ||||||
Derivative interest rate swap | ||||||
Short-term derivative asset | Prepaid expenses and other current assets | $ | 407 | |||
Long-term derivative asset | Other assets | $ | 2,183 | |||
The following table presents the effect of the derivative interest rate swap in our consolidated statement of comprehensive income (loss) for the fiscal year ended June 30, 2018.
| Amount of Gain (Loss) Recognized in OCI on Derivative Instruments (Effective Portion) | Amount of Gain (Loss) Reclassified from AOCI into Net Income (Loss) (Effective Portion) | |||||||||||||||||||||||
| Fiscal Year Ended June 30, | Fiscal Year Ended June 30, | |||||||||||||||||||||||
| 2018 | 2017 | 2016 | 2018 | 2017 | 2016 | |||||||||||||||||||
| (in thousands) | ||||||||||||||||||||||||
Derivative interest rate swap | $ | 2,458 | $ | - | $ | - | $ | (132 | ) | $ | - | $ | - | |||||||||||
During the twelve months ended June 30, 2018, we concluded that no portion of the hedge was ineffective.
As of June 30, 2018, there was $2.6 million of unrealized gain in accumulated other comprehensive loss. We expect to reclassify approximately $0.5 million of this unrealized gain from accumulated other comprehensive loss to earnings over the next twelve months.
Note 12-Postretirement and Other Employee Benefits
Defined Contribution Pension Plans
We have a 401(k) Plan (the Plan), whereby eligible U.S. employees may contribute up to 60% of their eligible compensation, subject to limitations established by the Internal Revenue Code. We may contribute a discretionary matching contribution annually equal to 50% of each such participant's contribution to the Plan up to the first 5% of their annual eligible compensation. We charged approximately $2.2 million, $2.1 million and $1.8 million to expense in the fiscal years ended June 30, 2018, 2017 and 2016, respectively, associated with our matching contribution for those years.
We have a Group Personal Pension Plan (GPPP) for employees in the UK, whereby eligible employees may contribute a portion of their compensation, subject to their age and other limitations established by HM Revenue & Customs. We contribute 3% of the employee's annual compensation as long as the individual contributes a minimum of 1% of their annual compensation to the GPPP. We charged approximately $1.8 million, $1.3 million and $1.5 million to expense in the fiscal years ended June 30, 2018, 2017 and 2016, respectively, under the GPPP.
We have a GPPP related to European employees from our acquisition of Sterci and governed by local regulatory requirements. We contributed approximately $1.5 million, $1.4 million and $1.4 million in the fiscal years ended June 30, 2018, 2017 and 2016, respectively, under the GPPP.
We have a retirement contribution plan with respect to our employees in Israel (Israel plan) under which we contribute 6.5% of each eligible employee's annual compensation. Employees are entitled to amounts accumulated in the Israel plan upon reaching retirement age. We charged approximately $0.4 million,
76
$0.4 million and $0.3 million to expense in the fiscal years ended June 30, 2018, 2017 and 2016, respectively, related to the Israel plan.
Defined Benefit Pension Plan
We sponsor a defined benefit pension plan for our Swiss-based employees (the Swiss pension plan) that is governed by local regulatory requirements. As of June 30, 2018, we had 125 employees, which is approximately 7% of our workforce, covered under the Swiss pension plan. The Swiss pension plan is governed by the Swiss Federal Law on Occupational Retirements, Survivors' and Disability Pension plans. We use a third party pension fund, Profond, to administer this plan. We charged approximately $1.8 million, $2.8 million and $1.9 million to expense in the fiscal years ended June 30, 2018, 2017 and 2016, respectively, related to this plan. The annual measurement date for our pension benefits is June 30.
During fiscal years ended June 30, 2014 and June 30, 2018, Profond decreased the pension benefit conversion rates over two respective five year periods, from a maximum of 7.2% to 6.8% in fiscal year 2014 (2014 plan amendment) and from a maximum of 6.8% to 6.2% in fiscal year 2018 (2018 plan amendment). The changes in conversion rates reduced the projected benefits at retirement for all employees and qualified as plan amendments. The prior service credits arising from the amendments were recorded as components of accumulated other comprehensive income (loss) for the fiscal years ended June 30, 2014 and June 30, 2018. For the fiscal year ended June 30, 2018, we decreased accumulated other comprehensive loss by $2.4 million as a result of the 2018 plan amendment. In fiscal year 2019, we expect to recognize approximately $0.1 million and $0.2 million as reductions of our overall net periodic benefit cost related to the 2014 and 2018 plan amendments, respectively.
77
The accumulated benefit obligation (ABO) represents the obligations of a pension plan for past service as of the measurement date, which is the present value of benefits earned to date based on current compensation levels. The Swiss pension plan ABO as of June 30, 2018 was $48.0 million. The projected benefit obligation (PBO) is the ABO adjusted to reflect the impact of future compensation levels. The following table represents the PBO, change in plan assets, funded status and amounts recognized in our consolidated balance sheets at June 30, 2018 and 2017:
| June 30, | ||||||||
| 2018 | 2017 | |||||||
| (in thousands) | ||||||||
Change in benefit obligation: | ||||||||
Projected benefit obligation at beginning of year | $ | 51,904 | $ | 50,550 | ||||
Service cost | 2,539 | 2,954 | ||||||
Interest cost | 353 | 123 | ||||||
Actuarial (gain) loss | 684 | (3,889 | ) | |||||
Plan participant contributions | 839 | 787 | ||||||
Benefits paid, net of transfers into plan | (664 | ) | 228 | |||||
Plan change | (2,440 | ) | - | |||||
Effect of foreign currency exchange rate changes | (1,847 | ) | 1,151 | |||||
|
|
|
| |||||
Projected benefit obligation at end of year | $ | 51,368 | $ | 51,904 | ||||
|
|
|
| |||||
Change in plan assets: | ||||||||
Fair value of plan assets at beginning of year | $ | 35,688 | $ | 29,268 | ||||
Actual return on plan assets | 536 | 2,873 | ||||||
Employer contribution | 1,799 | 1,674 | ||||||
Plan participant contributions | 839 | 787 | ||||||
Benefits paid, net of transfers into plan | (664 | ) | 228 | |||||
Effect of foreign currency exchange rate changes | (1,269 | ) | 858 | |||||
|
|
|
| |||||
Fair value of plan assets at end of year | $ | 36,929 | $ | 35,688 | ||||
|
|
|
| |||||
Pension liability at end of fiscal year | $ | (14,439 | ) | $ | (16,216 | ) | ||
| Accumulated other comprehensive loss consists of the following: | ||||||||
Net prior service credit | $ | 3,140 | $ | 817 | ||||
Net actuarial loss | (7,105 | ) | (6,214 | ) | ||||
|
|
|
| |||||
Accumulated other comprehensive loss, before income tax | $ | (3,965 | ) | $ | (5,397 | ) | ||
|
|
|
| |||||
For the fiscal year ended June 30, 2018, we reclassified approximately $0.2 million of net actuarial loss and $0.1 million of net prior service credit as components of net periodic benefit cost from accumulated other comprehensive loss. For the fiscal year ending June 30, 2019, we expect to reclassify approximately $0.2 million of net actuarial loss and $0.3 million of net prior service credit as components of net periodic benefit cost from accumulated other comprehensive loss.
The net unfunded balance of our defined benefit pension plan is recorded as a non-current liability and all unrecognized gains or losses, net of tax, are recorded as a component of other comprehensive loss within stockholders' equity at June 30, 2018.
78
Assumptions:
| Fiscal Year Ended June 30, | ||||||||||||
| 2018 | 2017 | 2016 | ||||||||||
Weighted-average assumptions used to determine net benefit costs: | ||||||||||||
Discount rate | 0.70 | % | 0.25 | % | 1.25 | % | ||||||
Expected return on plan assets | 3.50 | % | 3.00 | % | 3.00 | % | ||||||
Rate of compensation increase | 1.50 | % | 1.50 | % | 1.75 | % | ||||||
Weighted-average assumptions used to determine benefit obligations at year end: | ||||||||||||
Discount rate | 0.90 | % | 0.70 | % | 0.25 | % | ||||||
Expected return on plan assets | 3.75 | % | 3.50 | % | 3.00 | % | ||||||
Rate of compensation increase | 1.75 | % | 1.50 | % | 1.50 | % | ||||||
The expected return on plan assets is determined by adjusting the market value of assets to reflect the investment gains and losses from prior years. We amortize gains and losses in our net periodic benefit cost which result from actual experience different from that assumed and from changes in assumptions. If, as of the beginning of the year, the net gain or loss exceeds 10% of the greater of the projected benefit obligation and the market related value of plan assets, the amortization is that excess divided by the average remaining service period of participating employees expected to receive benefits under the plan.
The fair value of plan assets for the Swiss pension plan was $36.9 million at June 30, 2018. As is customary with Swiss pension plans, the plan assets are invested in a collective fund with multiple employers through a Swiss insurance company. We do not have rights to the individual assets of the plan nor do we have investment authority over the assets of the plan. The collective fund maintains a variety of investment positions primarily in equity securities and highly rated debt securities. The valuation of the collective fund assets as a whole is a Level 3 measurement; however the individual investments of the fund are generally Level 1 (equity securities), Level 2 (fixed income) and Level 3 (real estate) investments. We determine the fair value of the plan assets based on information provided by the collective fund, through review of the collective fund's annual financial statements, and we further consider whether there are other indicators that the investment balances reported by the fund could be impaired. We concluded that no such impairment indicators were present at June 30, 2018.
The Swiss pension plan's actual asset allocation as compared to Profond's target asset allocations for fiscal year 2018 were as follows:
Actual | Target | |||
Asset Category: | ||||
Cash and cash equivalents | 4% | 2% | ||
Equity Securities | 50% | 49% | ||
Fixed Income | 12% | 17% | ||
Real Estate | 31% | 27% | ||
Other | 3% | 5% |
79
As of June 30, 2018, the estimated future benefit payments (inclusive of any future service) were as follows:
| (in thousands) | ||||
2019 | $ | 1,873 | ||
2020 | 1,696 | |||
2021 | 2,323 | |||
2022 | 2,156 | |||
2023 | 1,945 | |||
2024-2028 | 11,636 | |||
Net periodic pension costs for the Swiss pension plan included the following components:
| Fiscal Year Ended June 30, | ||||||||||||
| 2018 | 2017 | 2016 | ||||||||||
| (in thousands) | ||||||||||||
Components of net periodic cost | ||||||||||||
Service cost | $ | 2,539 | $ | 2,954 | $ | 2,279 | ||||||
Interest cost | 353 | 123 | 484 | |||||||||
Net prior service credit | (91 | ) | (89 | ) | (90 | ) | ||||||
Net actuarial loss | 217 | 648 | 69 | |||||||||
Expected return on plan assets | (1,196 | ) | (884 | ) | (805 | ) | ||||||
|
|
|
|
|
| |||||||
Net periodic cost | $ | 1,822 | $ | 2,752 | $ | 1,937 | ||||||
|
|
|
|
|
| |||||||
We expect to make a contribution of approximately $1.7 million to our pension plan in fiscal year 2019, which is the legal funding regulation minimum for the Swiss pension plan.
Israeli Severance Pay
We provide severance payments based on the Israeli severance pay law and certain other circumstances to employees of our Israeli subsidiary.
Our liability for severance pay for service periods prior to January 12, 2015 is calculated based on the most recent employee salaries multiplied by the number of years of employment as of January 12, 2015. We make monthly deposits in insurance funds designed to fund a portion of this overall severance liability and the value of these deposits, inclusive of earnings and losses attributable to these deposits, is recorded as an asset on our consolidated balance sheet. In the event of a separation, the employee receives the balance in deposited funds with any remaining severance liability balance paid by us. As of June 30, 2018, for service periods prior to January 12, 2015, our severance liability (classified in other liabilities within our consolidated balance sheet) was $1.6 million and our severance deposit (classified as other assets within the consolidated balance sheet) was $1.4 million.
Effective January 12, 2015, our statutory severance liability is covered under the provisions of Section 14 of the Israel severance pay law (Section 14). Under Section 14 we are released from any future severance liability once we fund the statutory severance requirement via payment to an insurance fund on behalf of the employee. As a result, for severance obligations arising after January 12, 2015, we do not recognize any liability (or asset) for severance related obligations once we fund the statutory severance requirement.
Note 13-Share-Based Payments
We recognize expense for the estimated fair value of all share-based payments to employees on a straight-line basis over the award vesting period. For the fiscal years ended June 30, 2018, 2017 and 2016, we recorded
80
expense of approximately $34.2 million, $31.9 million and $30.3 million, respectively, in connection with our share-based payment awards. For the fiscal years ended June 30, 2018, 2017 and 2016, we recognized tax benefits of $1.7 million, $1.8 million and $1.8 million, respectively, related to the expense recorded in connection with our share-based payment awards.
Share-Based Compensation Plans
Employee Stock Purchase Plan
On November 16, 2000, we adopted the 2000 Employee Stock Purchase Plan, which was amended on November 18, 2004 and November 18, 2010, and which provides for the issuance of up to a total of 4,000,000 shares of common stock to participating employees. At the end of each designated purchase period, which occurs every six months on March 31 and September 30, employees can elect to purchase shares of our common stock with contributions of between 1% and 10% of their base pay, accumulated via payroll deductions, at an amount equal to 85% of the lower of the fair market value of the common stock on the first day of each 24-month offering period or the last day of the applicable six-month purchase period.
Our employee stock purchase plan has several complex features that make determining fair value on the grant date impracticable. Accordingly, we measure the fair value of these awards at intrinsic value (the value of our common stock less the employee purchase price) at the end of each reporting period. For the fiscal year ended June 30, 2018, we recorded compensation cost of approximately $3.2 million associated with our employee stock purchase plan. As a result of employee stock purchases in fiscal year 2018 we issued approximately 143,000 shares of our common stock. The aggregate intrinsic value of shares issued under the employee stock plan during fiscal year 2018 was $2.2 million. At June 30, 2018, based on employee withholdings and our common stock price at that date, approximately 40,000 shares of common stock, with an approximate intrinsic value of $1.2 million would have been eligible for issuance were June 30, 2018 to have been a designated stock purchase date.
Stock Incentive Plans
2009 Stock Incentive Plan
On November 19, 2009, we adopted the 2009 Stock Incentive Plan (the 2009 Plan), which provides for the issuance of stock options, stock appreciation rights, restricted stock, restricted stock units and other share-based awards. Stock option awards under this plan have a 10-year maximum contractual term and must be issued at an exercise price of not less than 100% of the fair market value of the common stock at the date of grant. The 2009 Plan is administered by the Board of Directors, which has the authority to determine to whom options and other equity awards may be granted, the period of exercise and what other restrictions, if any, should apply. Vesting for awards granted to date under the 2009 Plan is principally over four years from the date of the grant, with 25% of the award vesting after one year and 6.25% of the award vesting each quarter thereafter.
We initially reserved 2,750,000 shares of our common stock for issuance under the 2009 Plan, plus additional shares equal to the number of shares subject to outstanding awards under our prior plans which expire, terminate or are otherwise surrendered, cancelled, forfeited or repurchased by us. On November 16, 2017, we adopted an amendment to our 2009 Stock Incentive Plan to increase the number of shares of common stock authorized for issuance under the 2009 Plan by an additional 2,500,000 shares. To date under the 2009 Plan, 12,750,000 shares of common stock have been authorized for issuance.
Valuation and Related Activity
Stock options are valued using a Black Scholes method of valuation and the resulting fair value is recorded as compensation cost on a straight line basis over the option vesting period. There were no stock option grants during the fiscal years ended June 30, 2018, 2017 and 2016.
81
A summary of stock option and restricted stock activity for the fiscal year ended June 30, 2018 is as follows; in respect of shares available for grant, the shares are available for issuance by us as either a stock option or as a restricted stock award:
| Non-vested Stock | Stock Options | |||||||||||||||||||||||||||
| Shares Available for Grant | Number of Shares | Weighted Average Grant Date Fair Value | Number of Shares | Weighted Average Exercise Price | Weighted Average Remaining Contractual Term | Aggregate Intrinsic Value | ||||||||||||||||||||||
| (in thousands, except per share data) | ||||||||||||||||||||||||||||
Awards outstanding at June 30, 2017 | 2,621 | 1,990 | $ | 25.10 | 130 | $ | 10.23 | 2.0 | $ | 2,005 | ||||||||||||||||||
Plan Amendment | 2,500 | |||||||||||||||||||||||||||
Awards granted (1) | (1,575 | ) | 1,231 | 32.78 | ||||||||||||||||||||||||
Shares vested | (942 | ) | 25.53 | |||||||||||||||||||||||||
Stock options exercised | (70 | ) | 9.86 | |||||||||||||||||||||||||
Awards forfeited (1) | 114 | (89 | ) | 26.04 | ||||||||||||||||||||||||
Awards expired | (1 | ) | 7.01 | |||||||||||||||||||||||||
|
|
|
|
|
|
|
| |||||||||||||||||||||
Awards outstanding at June 30, 2018 | 3,660 | 2,190 | $ | 29.19 | 59 | $ | 10.69 | 1.3 | $ | 2,321 | ||||||||||||||||||
|
|
|
|
|
|
|
| |||||||||||||||||||||
Stock options exercisable at June 30, 2018 | 59 | $ | 10.69 | 1.3 | $ | 2,321 | ||||||||||||||||||||||
|
| |||||||||||||||||||||||||||
| (1) | The 2009 Plan has a fungible share pool in which restricted stock awards are counted against the plan (or replenished within the plan, in respect of award forfeitures) as 1.28 shares for each one share of common stock subject to such restricted stock award. |
The total intrinsic value of stock options exercised during the fiscal years ended June 30, 2018, 2017 and 2016 was approximately $1.9 million, $0.5 million and $1.6 million, respectively. The total fair value of stock options that vested during the fiscal year ended June 30, 2016 was approximately $0.1 million. There were no stock options that vested during the fiscal years ended June 30, 2018 or 2017.
The majority of our restricted stock awards vest over a four year period on a vesting schedule similar to our employee stock options; however, certain restricted stock awards vest over either a two or five year period and restricted stock awards granted to our non-employee directors upon his or her election to the Board of Directors and annually thereafter vest after a one year period. Restricted stock awards are valued based on the closing price of our common stock on the date of grant, and compensation cost is recorded on a straight line basis over the share vesting period. The weighted average grant date fair value for restricted stock awards granted during the fiscal years ended June 30, 2018, 2017 and 2016 was $32.78, $22.28 and $27.40, respectively. The total fair value of restricted stock awards that vested during the fiscal years ended June 30, 2018, 2017 and 2016 was approximately $37.5 million, $27.5 million and $32.4 million, respectively. We recorded expense of approximately $31.0 million associated with our restricted stock awards for the fiscal year ended June 30, 2018. As of June 30, 2018, there was approximately $59.6 million of unrecognized compensation cost related to restricted stock awards that will be recognized as expense over a weighted average period of 1.5 years. Excluding the impact of shares issued as purchase consideration with forfeiture provisions, approximately 0.9 million shares of restricted stock awards vested during the fiscal year ended June 30, 2018.
82
Stock Issued in Acquisitions
Retention of key personnel in businesses we acquire is critical to us because it helps to ensure that we maximize the value of companies we acquire, which we believe is vitally important to our stockholders. Accordingly, in order to maximize the retention of key employees, we attach forfeiture provisions to the shares we issue to acquire certain businesses. This has the effect of requiring key employees to stay in our employment, post-acquisition, in order to earn the full value of the stock we issue. These shares are issued as purchase consideration, but as a result of the forfeiture provisions we attach they are categorized as compensatory awards under U.S. GAAP. The forfeiture provisions on these shares typically lapse over a four or five year period.
During the fiscal year ended June 30, 2018, we issued 42,080 shares of our common stock as purchase consideration in our acquisition of First Capital Cashflow Ltd. The shares were issued to certain equity holders of the acquired companies, all of whom joined us as employees or were otherwise required to render post-acquisition services in order to vest in the shares.
Activity associated with shares issued as purchase consideration with forfeiture provisions for the fiscal year ended June 30, 2018 is reflected in the table below. These shares were not issued out of our shareholder approved stock plans and do not represent grants or awards of shares from those plans.
| Non-vested Stock | ||||||||
| Number of Shares (in thousands) | Weighted Average Grant Date Fair Value | |||||||
Purchase consideration shares with forfeiture provisions outstanding at June 30, 2017 | 380 | $ | 22.81 | |||||
Issuance of purchase consideration shares with forfeiture provisions | 42 | 32.76 | ||||||
Lapse of forfeiture provisions | (173 | ) | 23.18 | |||||
Shares forfeited | (11 | ) | 22.50 | |||||
|
| |||||||
Purchase consideration shares with forfeiture provisions outstanding at June 30, 2018 | 238 | $ | 24.32 | |||||
|
| |||||||
Note 14-Net Income (Loss) Per Share
The following table sets forth the computation of basic and diluted net income (loss) per share:
| Fiscal Year Ended June 30, | ||||||||||||
| 2018 | 2017 | 2016 | ||||||||||
| (in thousands, except per share amounts) | ||||||||||||
Numerator - basic and diluted: | ||||||||||||
Net income (loss) | $ | 9,328 | $ | (33,137 | ) | $ | (19,648 | ) | ||||
|
|
|
|
|
| |||||||
Denominator: | ||||||||||||
Shares used in computing basic net income (loss) per share attributable to common stockholders | 38,227 | 37,842 | 37,957 | |||||||||
|
|
|
|
|
| |||||||
Impact of dilutive securities | 1,099 | - | - | |||||||||
|
|
|
|
|
| |||||||
Shares used in computing diluted net income (loss) per share attributable to common stockholders | 39,326 | 37,842 | 37,957 | |||||||||
|
|
|
|
|
| |||||||
Basic net income (loss) per share attributable to common stockholders | $ | 0.24 | $ | (0.88 | ) | $ | (0.52 | ) | ||||
|
|
|
|
|
| |||||||
Diluted net income (loss) per share attributable to common stockholders | $ | 0.24 | $ | (0.88 | ) | $ | (0.52 | ) | ||||
|
|
|
|
|
| |||||||
For the fiscal years ended June 30, 2017 and 2016, approximately 2.9 million and 3.1 million shares of unvested restricted stock and stock options, respectively, were excluded from the calculation of diluted earnings
83
per share as their effect on the calculation would have been anti-dilutive. We have also issued Warrants for up to 6.3 million shares of our common stock at an exercise price of $40.04 per share. For the fiscal years ended June 30, 2017 and 2016, shares potentially issuable upon conversion or maturity of the Notes or upon exercise of the Warrants were excluded from our earnings per share calculations as their effect would have been anti-dilutive.
Note 15-Operations by Segments and Geographic Areas
Segment Information
Operating segments are the components of our business for which separate financial information is available that is evaluated regularly by the chief operating decision maker in deciding how to allocate resources and in assessing performance. Our chief operating decision maker is our chief executive officer. Our operating segments are generally organized by the type of product or service offered and by geography.
Similar operating segments have been aggregated into four reportable segments as follows:
Cloud Solutions. Our Cloud Solutions segment provides customers predominately with SaaS technology offerings that facilitate electronic payment, electronic invoicing, and spend management. Our legal spend management solutions, which enable customers to create more efficient processes for managing invoices generated by outside law firms while offering insight into important legal spend factors such as expense monitoring and outside counsel performance, are included within this segment. This segment also incorporates our settlement network solutions (financial messaging and Paymode-X). Our settlement network solutions are highly scalable, secure and cost effective and facilitate cash payment and transaction settlement between businesses, their vendors and banks. Revenue within this segment is generally recognized on a subscription or transaction basis or ratably over the estimated life of the customer relationship.
Banking Solutions. Our Banking Solutions segment provides solutions that are specifically designed for banking and financial institution customers. Our Banking Solutions products are now sold predominantly on a subscription basis, which has the effect of contributing to recurring subscription and transaction revenue and the revenue predictability of future periods, but which also delays revenue recognition over a longer period.
Payments and Transactional Documents. Our Payments and Transactional Documents segment supplies financial business process management software solutions, including making and collecting payments, sending and receiving invoices, and generating and storing business documents. This segment also provides a range of standard professional services and equipment and supplies that complement and enhance our core software products. Revenue associated with these products and services is typically recorded upon delivery. However, if we license products on a subscription basis, revenue is typically recorded ratably over the subscription period or the expected life of the customer relationship.
Other . Our Other segment consists of our healthcare and cyber fraud and risk management operating segments. In our cyber fraud and risk management operating segment, our privacy and data security solution non-invasively monitors, replays and analyzes user behavior to flag and even stop suspicious activity in real time. Our healthcare solutions for patient registration, electronic signature, mobile document and payments allow healthcare organizations to improve business efficiencies, reduce costs and improve care quality. When licensed on a perpetual license basis, software revenue for our cyber fraud and risk management and healthcare products is typically recorded upon delivery, with software maintenance revenue recorded ratably over a twelve-month period. When licensed on a subscription basis, revenue is normally recorded ratably over the subscription period.
Periodically a sales person in one operating segment will sell products and services that are typically sold within a different operating segment. In such cases, the transaction is generally recorded by the operating segment to which the sales person is assigned. Accordingly, segment results can include the results of transactions that have been allocated to a specific segment based on the contributing sales resources, rather than the nature of the product or service. Conversely, a transaction can be recorded by the operating segment primarily responsible for delivery to the customer, even if the sales person is assigned to a different operating segment.
84
Our chief operating decision maker assesses segment performance based on a variety of factors that normally include segment revenue and a segment measure of profit or loss. Each segment's measure of profit or loss is on a pre-tax basis and excludes certain items as presented in our reconciliation of the measure of total segment profit to GAAP loss before income taxes that follows. There are no inter-segment sales; accordingly, the measure of segment revenue and profit or loss reflects only revenues from external customers. The costs of certain corporate level expenses, primarily general and administrative expenses, are allocated to our operating segments based on a percentage of the segment's revenues.
We do not track or assign our assets by operating segment.
Segment information for the fiscal years ended June 30, 2018, 2017 and 2016, according to the segment descriptions above, is as follows:
| Fiscal Year Ended June 30, | ||||||||||||
| 2018 | 2017 | 2016 | ||||||||||
| (in thousands) | ||||||||||||
Segment revenue: | ||||||||||||
Cloud Solutions (1) | $ | 182,290 | $ | 154,821 | $ | 138,641 | ||||||
Banking Solutions | 91,851 | 79,227 | 70,747 | |||||||||
Payments and Transactional Documents | 101,372 | 98,150 | 115,213 | |||||||||
Other | 18,583 | 17,214 | 18,673 | |||||||||
|
|
|
|
|
| |||||||
Total segment revenue | $ | 394,096 | $ | 349,412 | $ | 343,274 | ||||||
|
|
|
|
|
| |||||||
Segment measure of profit (loss): | ||||||||||||
Cloud Solutions | $ | 37,862 | $ | 28,044 | $ | 23,380 | ||||||
Banking Solutions | 9,703 | 2,901 | 5,696 | |||||||||
Payments and Transactional Documents | 28,373 | 29,832 | 34,225 | |||||||||
Other | (2,199 | ) | (3,075 | ) | (1,795 | ) | ||||||
|
|
|
|
|
| |||||||
Total measure of segment profit | $ | 73,739 | $ | 57,702 | $ | 61,506 | ||||||
|
|
|
|
|
| |||||||
| (1) | Revenues from our legal spend management solutions were $65.3 million, $58.6 million and $47.3 million for the fiscal years ended June 30, 2018, 2017 and 2016, respectively. Revenues from our settlement network solutions were $117.0 million, $96.2 million and $91.3 million for the fiscal years ended June 30, 2018, 2017 and 2016, respectively. |
85
A reconciliation of the measure of segment profit to GAAP income (loss) before income taxes is as follows:
| Fiscal Year Ended June 30, | ||||||||||||
| 2018 | 2017 | 2016 | ||||||||||
| (in thousands) | ||||||||||||
Total measure of segment profit | $ | 73,739 | $ | 57,702 | $ | 61,506 | ||||||
Less: | ||||||||||||
Amortization of acquisition-related intangible assets | (22,076 | ) | (24,246 | ) | (28,978 | ) | ||||||
Goodwill impairment charge | - | (7,529 | ) | - | ||||||||
Fixed asset charge | - | (2,399 | ) | - | ||||||||
Stock-based compensation plan expense | (34,200 | ) | (31,913 | ) | (30,279 | ) | ||||||
Acquisition and integration-related expenses | (2,564 | ) | (2,596 | ) | (741 | ) | ||||||
Restructuring expenses | (1,495 | ) | (547 | ) | (850 | ) | ||||||
Legal settlement | (1,269 | ) | - | - | ||||||||
Minimum pension liability adjustments | (24 | ) | (1,079 | ) | (203 | ) | ||||||
Other non-core income | 150 | 223 | 246 | |||||||||
Global ERP system implementation and other costs | (6,430 | ) | (8,804 | ) | (4,252 | ) | ||||||
Other expense, net | (4,706 | ) | (17,086 | ) | (15,312 | ) | ||||||
|
|
|
|
|
| |||||||
Income (loss) before income taxes | $ | 1,125 | $ | (38,274 | ) | $ | (18,863 | ) | ||||
|
|
|
|
|
| |||||||
The following depreciation and other amortization expense amounts are included in the segment measure of profit:
| Fiscal Year Ended June 30, | ||||||||||||
| 2018 | 2017 | 2016 | ||||||||||
| (in thousands) | ||||||||||||
Depreciation and other amortization expense: | ||||||||||||
Cloud Solutions | $ | 10,444 | $ | 8,078 | $ | 6,088 | ||||||
Banking Solutions | 6,333 | 7,856 | 4,093 | |||||||||
Payments and Transactional Documents | 2,829 | 3,214 | 2,861 | |||||||||
Other | 388 | 380 | 447 | |||||||||
|
|
|
|
|
| |||||||
Total depreciation and other amortization expense | $ | 19,994 | $ | 19,528 | $ | 13,489 | ||||||
|
|
|
|
|
| |||||||
86
Geographic Information
We have presented geographic information about our revenues below. This presentation allocates revenue based on the point of sale, not the location of the customer. Accordingly, we derive revenues from geographic locations based on the location of the customer that would vary from the geographic areas listed here; particularly in respect of financial institution customers located in Australia for which the point of sale was the United States.
| Fiscal Year Ended June 30, | ||||||||||||
| 2018 | 2017 | 2016 | ||||||||||
| (in thousands) | ||||||||||||
United States | $ | 242,170 | $ | 219,758 | $ | 197,523 | ||||||
United Kingdom | 91,489 | 80,421 | 96,244 | |||||||||
Switzerland | 39,759 | 34,957 | 34,652 | |||||||||
Other | 20,678 | 14,276 | 14,855 | |||||||||
|
|
|
|
|
| |||||||
Total revenues from unaffiliated customers | $ | 394,096 | $ | 349,412 | $ | 343,274 | ||||||
|
|
|
|
|
| |||||||
Long-lived assets based on geographical location, excluding deferred tax assets and intangible assets, were as follows:
| At June 30, | ||||||||
| 2018 | 2017 | |||||||
| (in thousands) | ||||||||
Long-lived assets: | ||||||||
United States | $ | 36,374 | $ | 35,569 | ||||
United Kingdom | 5,586 | 5,188 | ||||||
Other | 3,488 | 3,109 | ||||||
|
|
|
| |||||
Total long-lived assets | $ | 45,448 | $ | 43,866 | ||||
|
|
|
| |||||
Note 16-Income Taxes
Provision for Income Taxes
We file U.S. federal income tax returns and returns in various state, local and foreign jurisdictions. Generally, we are no longer subject to U.S. federal, state and local, or foreign income tax examinations by tax authorities for years before 2001.
The U.S. Tax Cuts and Jobs Act (the Tax Act) was signed into U.S. law on December 22, 2017 and made broad and complex changes to the U.S. tax code. This legislation contains a variety of income tax changes, including a reduction to the federal corporate income tax rate from 35% to 21%, a repeal of the corporate alternative minimum tax, a one-time transition tax on accumulated foreign earnings, a move to a territorial tax system, a limitation on the tax deductibility of interest expense and an acceleration of tax deductions for qualifying capital expenditures.
The Tax Act resulted in four consequences to us, as follows:
| • | Assessing whether we would incur any tax liability under the one-time transition tax . Under the Tax Act, un-repatriated foreign earnings post-1986 are subject to a one-time transition tax at rates that vary depending on the composition of foreign assets. We did not incur any transition tax liability as we are in an accumulated deficit position with respect to our foreign subsidiaries. |
| • | Re-valuing our U.S. deferred tax balances to reflect lower income tax rates . Deferred tax assets and deferred tax liabilities are recorded based on the income tax rates expected to be in effect when book and tax basis differences reverse. We are in a net U.S. deferred tax liability position. As such, we reduced the carrying value of our net deferred tax liabilities to reflect the impact of lower future income tax rates and recognized a non-recurring income tax benefit of $3.7 million. |
87
| • | Recognizing the ability to recover amounts paid for alternative minimum tax . The Tax Act eliminated the alternative minimum tax calculation and provided for the ability to recover certain amounts previously paid for such tax. We expect to receive a tax refund of $0.7 million and have recognized a non-recurring income tax benefit for this amount. |
| • | Reversal of indefinite-lived deferred tax liabilities as a source of future taxable income when assessing the realizability of indefinite-lived net operating loss carryforwards . Under the Tax Act, net operating loss carryforwards arising in tax years beginning after December 31, 2017 are limited to 80% of taxable income in any year, and net operating losses generated in tax years ending after December 31, 2017 can be carried forward indefinitely. We performed an analysis of the future reversals of our deferred tax differences as of June 30, 2018 and determined that we could use a portion of our indefinite-lived deferred tax liabilities as a source of taxable income when assessing the realizability of future indefinite-lived net operating loss carryforwards. Accordingly, we recognized an income tax benefit of $4.1 million (via a reduction to our valuation allowance in the quarter ended June 30, 2018). |
All of our accounting calculations, estimates and financial reporting positions for consequences arising from the Tax Act are provisional as of June 30, 2018, due to the possibility of future legislative developments, accounting and tax interpretations or other guidance that could require an update to the provisional accounting. Any required future adjustment would be recorded in the period in which we determine that an adjustment is required.
The Tax Act also provides that the repatriation to the U.S. of foreign earnings can be done without federal tax consequence. However, there are certain states that continue to subject the repatriation of foreign earnings to income tax. During fiscal 2018, as a result of the Tax Act provisions, we reassessed and changed our assertion that cumulative earnings by our UK and Switzerland subsidiaries were indefinitely reinvested. A deferred tax liability of $0.5 million was established relating to the estimated state tax consequences of this change in assertion. We continue to permanently reinvest the earnings, if any, of our international subsidiaries other than the UK and Switzerland and therefore we do not provide for U.S. income taxes or withholding taxes that could result from the distribution of those earnings to the U.S. parent. If any such earnings were ultimately distributed to the U.S. in the form of dividends or otherwise, or if the shares of our international subsidiaries were sold or transferred, we would likely be subject to additional U.S. state income taxes. It is not practicable to estimate the amount of unrecognized deferred U.S. taxes on these undistributed earnings.
Our provision for (benefit from) income taxes consisted of the following:
| Fiscal Year Ended June 30, | ||||||||||||
| 2018 | 2017 | 2016 | ||||||||||
| (in thousands) | ||||||||||||
Current: | ||||||||||||
Federal | $ | (673 | ) | $ | 41 | $ | (362 | ) | ||||
State | 20 | 32 | 43 | |||||||||
Foreign | 1,915 | 2,786 | 4,215 | |||||||||
|
|
|
|
|
| |||||||
| 1,262 | 2,859 | 3,896 | ||||||||||
Deferred: | ||||||||||||
Federal | (7,271 | ) | 700 | 1,004 | ||||||||
State | 687 | 81 | 217 | |||||||||
Foreign | (2,881 | ) | (8,777 | ) | (4,332 | ) | ||||||
|
|
|
|
|
| |||||||
| (9,465 | ) | (7,996 | ) | (3,111 | ) | |||||||
|
|
|
|
|
| |||||||
| $ | (8,203 | ) | $ | (5,137 | ) | $ | 785 | |||||
|
|
|
|
|
| |||||||
88
Our income tax expense (benefit) included a tax benefit of $0.4 million, $0.3 million and $0.2 million in fiscal years 2018, 2017 and 2016, respectively, relating to a reduction in our unrecognized tax benefits upon the expiration of certain statutes of limitations.
We recorded a decrease to other comprehensive income of $0.3 million during fiscal year 2018 as a result of the deferred tax consequence of minimum pension liability adjustments related to our Swiss pension.
Income (loss) before income taxes by geographic area is as follows:
| Fiscal Year Ended June 30, | ||||||||||||
| 2018 | 2017 | 2016 | ||||||||||
| (in thousands) | ||||||||||||
North America | $ | (29 | ) | $ | (25,315 | ) | $ | (19,892 | ) | |||
United Kingdom | 7,144 | 7,263 | 15,400 | |||||||||
Continental Europe | 6,062 | 86 | (2,191 | ) | ||||||||
Asia-Pacific and Middle East | (12,052 | ) | (20,308 | ) | (12,180 | ) | ||||||
|
|
|
|
|
| |||||||
| $ | 1,125 | $ | (38,274 | ) | $ | (18,863 | ) | |||||
|
|
|
|
|
| |||||||
A reconciliation of the federal statutory rate to the effective income tax rate is as follows:
| Fiscal Year Ended June 30, | ||||||||||||
| 2018 | 2017 | 2016 | ||||||||||
Tax expense (benefit) at federal statutory rate | 28.1% | (35.0%) | (35.0%) | |||||||||
State taxes, net of federal benefit | 5.5% | (4.0%) | (4.3%) | |||||||||
Foreign branch operations, net of foreign tax deductions | 91.2% | 2.7% | 19.0% | |||||||||
Non-deductible executive compensation | 90.3% | 2.5% | 5.2% | |||||||||
Non-deductible other expenses | 39.2% | 1.6% | 1.6% | |||||||||
Non-deductible acquisition costs | 26.0% | 0.8% | 0.5% | |||||||||
Changes in uncertain tax positions | 12.9% | 2.2% | 8.6% | |||||||||
Goodwill impairment | -% | 6.9% | -% | |||||||||
Investment impairment | -% | (29.6%) | -% | |||||||||
Share-based payments | (33.4%) | 1.2% | 3.7% | |||||||||
Research and development credit | (33.4%) | (2.9%) | (8.5%) | |||||||||
Tax rate differential on foreign earnings | (50.7%) | 9.3% | (3.5%) | |||||||||
Change in valuation allowance | (168.9%) | 30.3% | 16.8% | |||||||||
Changes in tax laws or rates (1) | (738.7%) | (0.2%) | 1.1% | |||||||||
Other | 2.6% | 0.8% | (1.0%) | |||||||||
|
|
|
|
|
| |||||||
| (729.3%) | (13.4%) | 4.2% | ||||||||||
|
|
|
|
|
| |||||||
| (1) | The impact on our effective tax rate due to changes in tax laws or rates includes the revaluation of deferred tax assets, deferred tax liabilities and the corresponding change in our valuation allowance. |
The decrease in our effective tax rate compared to the statutory tax rate for the fiscal year ended June 30, 2018 is principally due to the provisions of the Tax Act, which reduced the U.S. federal income tax rate from 35% to 21%. Our blended U.S. federal income tax rate for the fiscal year ended June 30, 2018 was 28.06%. The excess of our effective tax rate (or decrease in our effective tax benefit rate) over statutory tax rates for the fiscal years ended June 30, 2017 and 2016 was primarily due to the inability to benefit U.S. and Swiss losses and our inability to utilize certain foreign tax credits as a reduction to foreign income that is included in our U.S. tax return. This has the effect of taxing certain income twice, resulting in a higher overall tax rate.
89
Deferred Tax Assets and Liabilities
We recognize deferred tax assets and liabilities based on the differences between their financial reporting and tax basis by applying tax rates that are expected to be in effect when the differences reverse. Significant components of our deferred income taxes are as follows:
| June 30, | ||||||||
| 2018 | 2017 | |||||||
| (in thousands) | ||||||||
Deferred tax assets: | ||||||||
Net operating loss carryforwards | $ | 37,908 | $ | 35,503 | ||||
Research and development and other credits | 6,225 | 6,755 | ||||||
Stock compensation | 4,826 | 6,414 | ||||||
Deferred revenue | 4,482 | 6,433 | ||||||
Accrued pension | 3,471 | 3,898 | ||||||
Various accrued expenses | 3,271 | 3,774 | ||||||
Allowances and reserves | 216 | 252 | ||||||
Property and equipment | 160 | 229 | ||||||
Other | 95 | 98 | ||||||
|
|
|
| |||||
Total deferred tax assets | $ | 60,654 | $ | 63,356 | ||||
Valuation allowance | (33,553 | ) | (37,415 | ) | ||||
|
|
|
| |||||
Deferred tax assets, net of valuation allowance | 27,101 | 25,941 | ||||||
Deferred tax liabilities: | ||||||||
Acquired intangible assets | (22,674 | ) | (26,229 | ) | ||||
Property and equipment, inclusive of capitalized software | (11,361 | ) | (14,434 | ) | ||||
Unrealized gain-interest swap | (717 | ) | - | |||||
Unremitted foreign earnings | (475 | ) | - | |||||
Convertible debt | - | (588 | ) | |||||
Other | (241 | ) | (123 | ) | ||||
|
|
|
| |||||
Total deferred tax liabilities | (35,468 | ) | (41,374 | ) | ||||
|
|
|
| |||||
Net deferred tax liabilities | $ | (8,367 | ) | $ | (15,433 | ) | ||
|
|
|
| |||||
Effective July 1, 2017, we adopted a new accounting standard intended to simplify certain aspects of accounting for share-based compensation arrangements, including the associated income tax consequences. Upon adoption, excess tax benefits associated with share-based compensation arrangements that previously were only recognized for financial reporting purposes when they actually reduced currently payable income taxes were recognized as deferred tax assets, net of any required valuation allowance. Accordingly, after adoption, we recognized the following:
| (in thousands) | ||||
Increase to deferred tax assets for excess tax benefits | $ | 17,393 | ||
Increase to deferred tax asset valuation allowance | (17,144 | ) | ||
|
| |||
Net increase to deferred tax assets | $ | 249 | ||
|
| |||
This net increase to our deferred tax assets was recorded as a cumulative effect adjustment, reducing the accumulated deficit in our consolidated balance sheet.
90
At June 30, 2018, we had U.S. net operating loss carryforwards of $104.8 million which expire at various times through fiscal year 2037.
From a foreign tax perspective, we had Swiss net operating loss carryforwards of $12.8 million, which expire in fiscal year 2024, and foreign net operating loss carryforwards (primarily in Europe and Israel) of $28.7 million, which have no statutory expiration date.
We utilized approximately $13.8 million of net operating losses in fiscal year 2018, consisting of $0.2 million utilized in the U.S. and $13.6 million utilized in our foreign operations, predominately in continental Europe.
We have approximately $6.2 million of research and development tax credit carryforwards available, which expire at various points through fiscal year 2038. Our operating losses and tax credit carryforwards may be subject to limitations under provisions of the Internal Revenue Code.
Valuation Allowance
We record a deferred tax asset if we believe that it is more likely than not that we will realize a future tax benefit. Ultimate realization of any deferred tax asset is dependent on our ability to generate sufficient future taxable income in the appropriate tax jurisdiction before the expiration of carryforward periods, if any. Our assessment of deferred tax asset recoverability considers many different factors including historical and projected operating results, the reversal of existing deferred tax liabilities that provide a source of future taxable income, the impact of current tax planning strategies and the availability of future tax planning strategies. We establish a valuation allowance against any deferred tax asset for which we are unable to conclude that recoverability is more likely than not. This is inherently judgmental, since we are required to assess many different factors and evaluate as much objective evidence as we can in reaching an overall conclusion. The particularly sensitive component of our evaluation is our projection of future operating results since this relies heavily on our estimates of future revenue and expense levels by tax jurisdiction.
At June 30, 2018, we had a $33.6 million valuation allowance against certain deferred tax assets given the uncertainty of recoverability of these amounts. The valuation allowance decreased by $3.9 million in fiscal year 2018 from fiscal year 2017 primarily due to a decrease in our Switzerland valuation allowance and a decrease in our U.S. valuation allowance as a result of the provisions of the Tax Act, offset in part by an increase in our U.S. valuation allowance due to our adoption of a new accounting standard intended to simplify certain aspects of accounting for share-based compensation arrangements, including the associated income tax consequences.
Uncertain Tax Positions
As of June 30, 2018, we had approximately $8.7 million of total gross unrecognized tax benefits, of which approximately $1.3 million represented the amount of unrecognized tax benefits that, if recognized, would favorably affect our effective income tax rate in future periods. Approximately $4.3 million of the gross unrecognized tax benefits resulted in reductions to the deferred tax asset relating to net operating losses and to the valuation allowance, and approximately $3.1 million of the gross unrecognized tax benefits resulted in a reduction to tax credit carryforwards and other deferred tax assets. We currently anticipate that our unrecognized tax benefits will decrease within the next twelve months by approximately $0.4 million, as a result of the expiration of certain statutes of limitations associated with intercompany transactions subject to tax in multiple jurisdictions.
91
A summary of the changes in the gross amount of unrecognized tax benefits is shown below:
| (in thousands) | ||||
Balance at July 1, 2015 | $ | 6,305 | ||
Additions related to current year tax positions | 1,647 | |||
Additions related to prior year tax positions | 215 | |||
Reductions due to lapse of statute of limitations | (229 | ) | ||
Foreign currency translation | (129 | ) | ||
|
| |||
Balance at July 1, 2016 | 7,809 | |||
Additions related to current year tax positions | 1,160 | |||
Additions related to prior year tax positions | 13 | |||
Reductions due to lapse of statute of limitations | (335 | ) | ||
Foreign currency translation | 9 | |||
|
| |||
Balance at July 1, 2017 | 8,656 | |||
Additions related to current year tax positions | 1,041 | |||
Reductions related to prior year tax positions | (85 | ) | ||
Reductions due to lapse of statute of limitations | (432 | ) | ||
Reductions due to audit closure | (122 | ) | ||
Change in tax rates | (368 | ) | ||
Foreign currency translation | 11 | |||
|
| |||
Balance at July 1, 2018 | $ | 8,701 | ||
|
| |||
We recognize interest and penalties related to uncertain tax positions as a component of income tax expense. To the extent that the accrued interest and penalties do not ultimately become payable, the amounts accrued will be derecognized and reflected as an income tax benefit in the period that such a determination is made. Our accrued interest and penalties related to uncertain tax positions for all periods presented were not significant.
Note 17-Guarantees
We generally offer a standard warranty on our products and services, specifying that our software products will perform in accordance with published product specifications and that any professional services will conform with applicable specifications and industry standards. Further, we offer, as an element of our standard licensing arrangements, an indemnification clause that protects the licensee against liability and damages, including legal defense costs arising from claims of patent, copyright, trademark or other similar infringements by our software products. At June 30, 2018 and 2017, warranty accruals were not significant.
Certain of our arrangements with customers include clauses whereby we may be subject to penalties for failure to meet certain service level requirements; however, we have not incurred any related material penalties to date.
Note 18-Subsequent Events
On July 2, 2018, we acquired Microgen Banking Systems Limited, a UK-based BACS payment company, for 6.9 million British Pound Sterling (approximately $9.1 million based on the exchange rate in effect at the acquisition date). Microgen Banking Systems Limited provides BACS payment products and supporting services to a wide range of UK-based customers and is expected to complement our existing payment products. The results of the acquisition will be included in the Payments and Transactional Documents segment from the date of the acquisition forward.
92
In August 2018, we used $20.0 million of cash on hand to pay down a portion of the borrowings under our Credit Facility.
Note 19-Quarterly Financial Data (unaudited)
The following table contains selected quarterly financial data for the fiscal years ended June 30, 2018 and 2017. The quarterly earnings per share information is computed separately for each period. Therefore, the sum of the quarterly per share amounts may differ from the total year per share amounts.
| For the quarters ended | ||||||||||||||||||||||||||||||||
| September 30, 2016 | December 31, 2016 | March 31, 2017 | June 30, 2017 | September 30, 2017 | December 31, 2017 | March 31, 2018 | June 30, 2018 | |||||||||||||||||||||||||
| (in thousands, except per share data) | ||||||||||||||||||||||||||||||||
Revenues | $ | 83,084 | $ | 86,728 | $ | 86,099 | $ | 93,501 | $ | 91,296 | $ | 95,195 | $ | 101,136 | $ | 106,469 | ||||||||||||||||
Gross profit | 44,907 | 47,156 | 46,525 | 48,998 | 50,816 | 54,096 | 55,420 | 60,634 | ||||||||||||||||||||||||
Net income (loss) (1)(2)(3) | $ | (10,508 | ) | $ | (10,346 | ) | $ | (6,624 | ) | $ | (5,659 | ) | $ | (4,241 | ) | $ | 3,088 | $ | (1,002 | ) | $ | 11,483 | ||||||||||
Basic net income (loss) per share | $ | (0.28 | ) | $ | (0.27 | ) | $ | (0.17 | ) | $ | (0.15 | ) | $ | (0.11 | ) | $ | 0.08 | $ | (0.03 | ) | $ | 0.30 | ||||||||||
Diluted net income (loss) per share | $ | (0.28 | ) | $ | (0.27 | ) | $ | (0.17 | ) | $ | (0.15 | ) | $ | (0.11 | ) | $ | 0.08 | $ | (0.03 | ) | $ | 0.28 | ||||||||||
Shares used in computing basic net income (loss) per share | 37,940 | 37,769 | 37,965 | 37,693 | 37,730 | 38,087 | 38,348 | 38,743 | ||||||||||||||||||||||||
Shares used in computing diluted net income (loss) per share | 37,940 | 37,769 | 37,965 | 37,693 | 37,730 | 39,344 | 38,348 | 40,316 | ||||||||||||||||||||||||
| (1) | We recorded an impairment charge related to goodwill in the quarter ended December 31, 2016 in the amount of $7.5 million. |
| (2) | We recorded a discrete tax benefit of $4.4 million in the quarter ended December 31, 2017 and $3.6 million in the quarter ended June 30, 2018 as a result of the impact of the Tax Act, primarily arising from the revaluation of U.S.-based deferred tax liabilities and the release of valuation allowance on deferred tax assets. |
| (3) | We liquidated a $3.0 million cost method investment in the quarter ended June 30, 2018. As a result of the sale, we recorded $6.1 million in other income in our consolidated statement of comprehensive income (loss). |
93
Item 9. Changes in and Disagreements with Accountants on Accounting and Financial Disclosure.
None.
| Item 9A. | Controls and Procedures. |
Evaluation of Disclosure Controls and Procedures
Our management, with the participation of our chief executive officer and chief financial officer, evaluated the effectiveness of our disclosure controls and procedures as of June 30, 2018. The term disclosure controls and procedures, as defined in Rules 13a-15(e) and 15d-15(e) under the Exchange Act, means controls and other procedures of a company that are designed to ensure that information required to be disclosed by a company in the reports that it files or submits under the Exchange Act is recorded, processed, summarized and reported within the time periods specified in the SEC's rules and forms. Disclosure controls and procedures include, without limitation, controls and procedures designed to ensure that information required to be disclosed by a company in the reports that it files or submits under the Exchange Act is accumulated and communicated to the company's management, including its principal executive and principal financial officers as appropriate, to allow timely decisions regarding required disclosure. Management recognizes that any controls and procedures, no matter how well designed and operated, can provide only reasonable assurance of achieving their objectives and management necessarily applies its judgment in evaluating the cost-benefit relationship of possible controls and procedures.
Based on the evaluation of our disclosure controls and procedures as of June 30, 2018, our chief executive officer and chief financial officer concluded that, as of such date, our disclosure controls and procedures were effective at the reasonable assurance level.
Management's Annual Report on Internal Control Over Financial Reporting
The management of the Company is responsible for establishing and maintaining adequate internal control over financial reporting. Internal control over financial reporting is defined in Rule 13a-15(f) or 15d-15(f) promulgated under the Securities Exchange Act of 1934 as a process designed by, or under the supervision of, the Company's principal executive and principal financial officers and effected by the Company's board of directors, management and other personnel, to provide reasonable assurance regarding the reliability of financial reporting and the preparation of financial statements for external purposes in accordance with generally accepted accounting principles and includes those policies and procedures that:
| • | Pertain to the maintenance of records that in reasonable detail accurately and fairly reflect the transactions and dispositions of the assets of the Company; |
| • | Provide reasonable assurance that transactions are recorded as necessary to permit preparation of financial statements in accordance with generally accepted accounting principles, and that receipts and expenditures of the Company are being made only in accordance with authorizations of management and directors of the Company; and |
| • | Provide reasonable assurance regarding prevention or timely detection of unauthorized acquisition, use or disposition of the Company's assets that could have a material effect on the financial statements. |
Because of its inherent limitations, internal control over financial reporting may not prevent or detect misstatements. Projections of any evaluation of effectiveness to future periods are subject to the risk that controls may become inadequate because of changes in conditions, or that the degree of compliance with the policies or procedures may deteriorate.
The Company's management assessed the effectiveness of the Company's internal control over financial reporting as of June 30, 2018. In making this assessment, the Company's management used the criteria set forth by the Committee of Sponsoring Organizations of the Treadway Commission (COSO) in Internal Control-Integrated Framework (2013 framework).
94
Based on our assessment, management concluded that, as of June 30, 2018, the Company's internal control over financial reporting is effective based on those criteria.
As allowed by SEC guidance, management excluded from its assessment the operations of Decillion Group and First Capital Cashflow Ltd., which were acquired in August and October of 2017, respectively, and which represented approximately 1 percent and 3 percent of our total assets, respectively, primarily consisting of goodwill and other intangible assets which arose from the acquisitions, and less than 1 percent of our total revenues, each, as of and for the fiscal year ended June 30, 2018.
The Company's independent registered public accounting firm has issued an audit report on the Company's internal control over financial reporting, which is included within Part II, Item 8 of this Form 10-K.
Changes in Internal Control over Financial Reporting
In fiscal year 2018, we implemented the first phase of a company-wide enterprise resource planning (ERP) system. We have assessed and continued to monitor the impact of this implementation on our processes and procedures, as well as the impact on our internal controls over financial reporting. Where appropriate, we have made changes to our internal controls to address system changes and to help ensure that we maintained effective internal controls over financial reporting as of June 30, 2018.
There has been no change in our internal control over financial reporting that occurred during the fiscal quarter ended June 30, 2018 that has materially affected, or is reasonably likely to materially affect, our internal control over financial reporting.
| Item 9B. | Other Information. |
Not applicable.
95
PART III
| Item 10. | Directors, Executive Officers and Corporate Governance. |
See Executive Officers and Other Key Employees of the Registrant in Part I of this Annual Report on Form 10-K. We will file with the Securities and Exchange Commission a definitive Proxy Statement (the Proxy Statement) not later than 120 days after the close of the fiscal year ended June 30, 2018. The information required by this item is incorporated herein by reference to the information contained under the captions Proposal I - Election of Class II Directors, Section 16(a) Beneficial Ownership Reporting Compliance and Corporate Governance of the Proxy Statement.
We have adopted a Code of Business Conduct and Ethics that applies to our principal executive officer, principal financial officer, principal accounting officer or controller, or persons performing similar functions. The text of our Code of Business Conduct and Ethics is posted in the Corporate Governance section of our website, www.bottomline.com. We intend to disclose on our website any amendments to, or waivers from, our Code of Business Conduct and Ethics that are required to be disclosed pursuant to the disclosure requirements of Item 5.05 of Form 8-K.
| Item 11. | Executive Compensation. |
The information required by this item is incorporated herein by reference to the information contained under the captions Executive Compensation, Director Compensation, Leadership Development and Compensation Committee Interlocks and Insider Participation, Leadership Development and Compensation Committee Report, and Employment and Other Agreements and Potential Payments Upon Termination or Change in Control of the Proxy Statement.
| Item 12. | Security Ownership of Certain Beneficial Owners and Management and Related Stockholder Matters. |
The information required by this item is incorporated herein by reference to the information contained under the captions Security Ownership of Certain Beneficial Owners and Management and Equity Compensation Plan Information of the Proxy Statement.
| Item 13. | Certain Relationships and Related Transactions, and Director Independence. |
The information required by this item is incorporated herein by reference to the information contained under the captions Employment and Other Agreements and Potential Payments Upon Termination or Change in Control, Proposal I - Election of Class II Directors, Corporate Governance and Certain Relationships and Related Transactions of the Proxy Statement.
| Item 14. | Principal Accountant Fees and Services. |
The information required to be disclosed by this item is incorporated herein by reference to the information contained under the captions Principal Accounting Fees and Services and Pre-Approval Policies and Procedures of the Proxy Statement.
96
PART IV
| Item 15. | Exhibits and Financial Statement Schedules. |
| (a) | Financial Statements, Financial Statement Schedule and Exhibits |
| Page | ||||||
(1) | Financial Statements: See "Index to Consolidated Financial Statements" in Part II, Item 8 of this Form 10-K | 49 | ||||
(2) | Financial Statement Schedule for the Fiscal Years Ended June 30, 2018, 2017 and 2016: Schedule II-Valuation and Qualifying Accounts | 100 | ||||
| Financial statement schedules not included have been omitted because of the absence of conditions under which they are required or because the required information, where material, is shown in the financial statements or notes. | ||||||
(3) | Exhibits: | |||||
| Incorporated by Reference | ||||||||||||||||||||||
| Exhibit Number | Description | Form | File No. | Exhibit | Filing Date | Filed Herewith | ||||||||||||||||
3.1 | Amended and Restated Certificate of Incorporation of the Registrant, as amended. | 8-K | 000-25259 | 3.1 | 1/18/2013 | |||||||||||||||||
3.2 | Amended and Restated By-Laws of the Registrant, as amended. | 10-K | 000-25259 | 3.2 | 9/12/2007 | |||||||||||||||||
4.1 | Specimen Certificate for Shares of Common Stock. | S-1 | 333-67309 | 4.1 | 1/7/1999 | |||||||||||||||||
4.2 | Warrant dated September 14, 2009 issued by the Registrant to Bank of America, N.A. | 10-Q | 000-25259 | 4.1 | 11/9/2009 | |||||||||||||||||
4.3 | Registration Rights Agreement dated September 14, 2009 between the Registrant and Bank of America, N.A. | 10-Q | 000-25259 | 4.2 | 11/9/2009 | |||||||||||||||||
10.1 | Sublease dated August 31, 2000, between the Registrant and 325 Corporate Drive II, LLC. | 10-K | 000-25259 | 10.35 | 9/28/2000 | |||||||||||||||||
10.2 | First Amendment to Sublease between the Registrant and 325 Corporate Drive II, LLC. | 10-K | 000-25259 | 10.52 | 9/30/2002 | |||||||||||||||||
10.3 | Second Amendment to Sublease, effective as of October 1, 2001, between the Registrant and 325 Corporate Drive II, LLC. | 10-Q | 000-25259 | 10.1 | 11/13/2001 | |||||||||||||||||
10.4 | Third Amendment to Sublease, effective as of June 30, 2010, between the Registrant and 325 Corporate Drive II, LLC. | 10-K | 000-25259 | 10.45 | 9/10/2010 | |||||||||||||||||
10.5 | Fourth Amendment to Sublease, effective as of April 1, 2012, between the Registrant and 325 Corporate Drive II, LLC. | 10-K | 000-25259 | 10.7 | 8/27/2012 | |||||||||||||||||
10.6 | Fifth Amendment to Sublease, effective as of March 12, 2014, between the Registrant and 325 Corporate Drive II, LLC. | 10-K | 000-25259 | 10.8 | 8/28/2014 | |||||||||||||||||
10.7 | Legal Charge dated as of December 17, 2001 between Bottomline Technologies Europe Ltd and National Westminster Bank Plc. | 10-Q | 000-25259 | 10.4 | 2/14/2002 | |||||||||||||||||
10.8 | Debenture dated as of December 17, 2001 between Bottomline Technologies Europe Ltd and National Westminster Bank Plc. | 10-Q | 000-25259 | 10.5 | 2/14/2002 | |||||||||||||||||
10.9 | Credit Agreement dated as of December 9, 2016 among the Registrant; the domestic subsidiaries of the Registrant identified therein from time to time party thereto as guarantors; Bank of America, N.A., as Administrative Agent, Swing Line Lender and L/C Issuer; and the Lenders identified therein from time to time party thereto. | 8-K | 000-25259 | 10.1 | 12/14/2016 | |||||||||||||||||
10.10# | 1998 Director Stock Option Plan, including form of non-statutory stock option agreement. | S-1 | 333-67309 | 10.3 | 11/13/1998 | |||||||||||||||||
10.11# | Forms of Restricted Stock Agreement under 2000 Stock Incentive Plan. | 10-Q | 000-25259 | 10.1 | 2/9/2006 | |||||||||||||||||
10.12# | 2009 Stock Incentive Plan, as amended. | 8-K | 000-25259 | 99.2 | 11/20/2017 | |||||||||||||||||
10.13# | Form of Restricted Stock Agreement for UK Participants under 2009 Stock Incentive Plan. | 10-Q | 000-25259 | 10.1 | 5/7/2010 | |||||||||||||||||
10.14# | Form of Restricted Stock Agreement for Robert A. Eberle under 2009 Stock Incentive Plan. | 10-Q | 000-25259 | 10.2 | 5/7/2010 | |||||||||||||||||
97
| Incorporated by Reference | ||||||||||||||||||||||
| Exhibit Number | Description | Form | File No. | Exhibit | Filing Date | Filed Herewith | ||||||||||||||||
10.15# | Form of Restricted Stock Agreement for US Participants under 2009 Stock Incentive Plan. | 10-Q | 000-25259 | 10.3 | 5/7/2010 | |||||||||||||||||
10.16# | Form of Stock Option Agreement for US Participants under 2009 Stock Incentive Plan. | 10-Q | 000-25259 | 10.5 | 5/7/2010 | |||||||||||||||||
10.17# | Form of Stock Option Agreement for UK Participants under 2009 Stock Incentive Plan. | 10-Q | 000-25259 | 10.6 | 5/7/2010 | |||||||||||||||||
10.18# | 2000 Stock Incentive Plan, including form of stock option agreement for incentive and non-statutory stock options and form of stock option agreement for United Kingdom personnel. | 10-K | 000-25259 | 10.16 | 9/14/2004 | |||||||||||||||||
10.19# | Amended and Restated 2000 Employee Stock Purchase Plan. | 8-K | 000-25259 | 99.2 | 11/19/2010 | |||||||||||||||||
10.20# | Form of Restricted Stock Agreement for Non-Employee Directors under 2009 Stock Incentive Plan. | 10-Q | 000-25259 | 10.4 | 5/7/2010 | |||||||||||||||||
10.21 | Form of Indemnification Letter dated as of September 21, 2000. | 10-Q | 000-25259 | 10.1 | 11/14/2000 | |||||||||||||||||
10.22# | Amended and Restated Employment Agreement dated as of November 21, 2002 between the Registrant and Joseph L. Mullen. | 10-Q | 000-25259 | 10.1 | 2/12/2003 | |||||||||||||||||
10.23# | Amended and Restated Employment Agreement dated as of November 21, 2002 between the Registrant and Robert A. Eberle. | 10-Q | 000-25259 | 10.2 | 2/12/2003 | |||||||||||||||||
10.24# | Letter Agreement dated as of September 30, 2005 between the Registrant and Joseph L. Mullen amending the Amendment and Restated Employment Agreement of Mr. Mullen dated as of November 21, 2002. | 10-Q | 000-25259 | 10.1 | 11/8/2005 | |||||||||||||||||
10.25# | Letter Agreement dated as of September 30, 2005 between the Registrant and Robert A. Eberle amending the Amendment and Restated Employment Agreement of Mr. Eberle dated as of November 21, 2002. | 10-Q | 000-25259 | 10.2 | 11/8/2005 | |||||||||||||||||
10.26# | Letter Agreement dated as of November 16, 2006 between the Registrant and Robert A. Eberle. | 10-Q | 000-25259 | 10.4 | 2/8/2007 | |||||||||||||||||
10.27# | Letter Agreement dated November 18, 2010 with Joseph L. Mullen. | 10-Q | 000-25259 | 10.1 | 2/7/2011 | |||||||||||||||||
10.28# | Amendment dated November 17, 2016 to Letter Agreement dated November 18, 2010 with Joseph L. Mullen. | 10-Q | 000-25259 | 10.3 | 2/8/2017 | |||||||||||||||||
10.29# | Service Agreement dated November 22, 1999 between Bottomline Technologies Limited and Nigel Savory. | 10-Q/A | 000-25259 | 10.1 | 11/8/2010 | |||||||||||||||||
10.30# | Deed of Variation to Service Agreement dated February 18, 2011 between Bottomline Technologies Limited and Nigel Savory. | 10-Q | 000-25259 | 10.1 | 5/6/2011 | |||||||||||||||||
10.31# | Letter Agreement dated as of December 23, 2008 between the Registrant and Robert A. Eberle. | 10-Q | 000-25259 | 10.2 | 2/6/2009 | |||||||||||||||||
10.32# | Employment Agreement dated October 10, 2011 between the Registrant and Norman J. Deluca. | 10-Q | 000-25259 | 10.1 | 5/8/2015 | |||||||||||||||||
10.33# | Employment Agreement dated March 31, 2015 between the Registrant and Richard D. Booth. | 8-K | 000-25259 | 10.1 | 5/5/2015 | |||||||||||||||||
10.34# | Executive Retention Agreement dated as of August 5, 2016 between the Registrant and John F. Kelly. | 8-K | 000-25259 | 10.1 | 8/5/2016 | |||||||||||||||||
10.35# | Form of Indemnification Agreement . | 8-K | 000-25259 | 10.1 | 11/24/2015 | |||||||||||||||||
21.1 | List of Subsidiaries. | X | ||||||||||||||||||||
23.1 | Consent of Ernst & Young LLP. | X | ||||||||||||||||||||
31.1 | Rule 13a-14(a)/15d-14(a) Certification of Principal Executive Officer. | X | ||||||||||||||||||||
31.2 | Rule 13a-14(a)/15d-14(a) Certification of Principal Financial Officer. | X | ||||||||||||||||||||
98
| Incorporated by Reference | ||||||||||||||||||||||
| Exhibit Number | Description | Form | File No. | Exhibit | Filing Date | Filed Herewith | ||||||||||||||||
32.1 | Section 1350 Certification of Principal Executive Officer. | X | ||||||||||||||||||||
32.2 | Section 1350 Certification of Principal Financial Officer. | X | ||||||||||||||||||||
101.INS** | XBRL Instance Document. | X | ||||||||||||||||||||
101.SCH** | XBRL Taxonomy Extension Schema Document. | X | ||||||||||||||||||||
101.CAL** | XBRL Taxonomy Extension Calculation Linkbase Document. | X | ||||||||||||||||||||
101.DEF** | XBRL Taxonomy Extension Definition Linkbase Document. | X | ||||||||||||||||||||
101.LAB** | XBRL Taxonomy Extension Label Linkbase Document. | X | ||||||||||||||||||||
101.PRE** | XBRL Taxonomy Extension Presentation Linkbase Document. | X | ||||||||||||||||||||
| # | Management contract or compensatory plan or arrangement required to be filed as an exhibit pursuant to Item 15(b) of Form 10-K. |
| ** | Submitted electronically herewith. |
Attached as Exhibit 101 to this report are the following formatted in XBRL: (i) Consolidated Balance Sheets as of June 30, 2018 and 2017, (ii) Consolidated Statements of Comprehensive Income (Loss) for the fiscal years ended June 30, 2018, 2017 and 2016, (iii) Consolidated Statements of Stockholders' Equity for the fiscal years ended June 30, 2018, 2017 and 2016, (iv) Consolidated Statements of Cash Flows for the fiscal years ended June 30, 2018, 2017 and 2016, and (v) Notes to Consolidated Financial Statements.
99
SCHEDULE II-VALUATION AND QUALIFYING ACCOUNTS
ALLOWANCE FOR DOUBTFUL ACCOUNTS
Fiscal Years Ended June 30, 2018, 2017 and 2016
| Activity | ||||||||||||||||||||
| Fiscal Year Ended | Balance at Beginning of Year | (Charged to Revenue, Costs and Expenses) | Additions and Recoveries (1) | Deductions (2) | Balance at End of Year | |||||||||||||||
| (in thousands) | ||||||||||||||||||||
June 30, 2018 | $ | 923 | 238 | 2 | (167 | ) | $ | 996 | ||||||||||||
June 30, 2017 | $ | 982 | 121 | - | (180 | ) | $ | 923 | ||||||||||||
June 30, 2016 | $ | 924 | 415 | 39 | (396 | ) | $ | 982 | ||||||||||||
| (1) | Additions primarily represent increases to the allowance for doubtful accounts balance as a result of the impact of increases in foreign currency exchange rates. |
| (2) | Deductions are principally write-offs as well as the impact of decreases in foreign currency exchange rates. |
100
| Item 16. | Form 10-K Summary. |
None.
101
SIGNATURES
Pursuant to the requirements of Section 13 or 15(d) of the Securities Exchange Act of 1934, the registrant has duly caused this report to be signed on its behalf by the undersigned, thereunto duly authorized.
| BOTTOMLINE TECHNOLOGIES (DE), INC. | ||||||
| Date: August 29, 2018 | By: | / S / R ICHARD D. B OOTH | ||||
| Richard D. Booth | ||||||
| Chief Financial Officer and Treasurer | ||||||
| (Principal Financial and Accounting Officer) | ||||||
Pursuant to the requirements of the Securities Exchange Act of 1934, this report has been signed below by the following persons on behalf of the registrant and in the capacities and on the dates indicated:
Name | Title | Date | ||
/ S / J OSEPH L. M ULLEN Joseph L. Mullen | Chairman of the Board | August 29, 2018 | ||
/ S / R OBERT A. E BERLE Robert A. Eberle | President, Chief Executive Officer and Director (Principal Executive Officer) | August 29, 2018 | ||
/ S / R ICHARD D. B OOTH Richard D. Booth | Chief Financial Officer and Treasurer (Principal Financial and Accounting Officer) | August 29, 2018 | ||
/ S / K ENNETH J. D'A MATO Kenneth J. D'Amato | Director | August 29, 2018 | ||
/ S / P ETER G IBSON Peter Gibson | Director | August 29, 2018 | ||
/ S / J ENNIFER M. G RAY Jennifer M. Gray | Director | August 29, 2018 | ||
/ S / P AUL H. H OUGH Paul H. Hough | Director | August 29, 2018 | ||
/ S / J EFFREY C. L EATHE Jeffrey C. Leathe | Director | August 29, 2018 | ||
/ S / B ENJAMIN E. R OBINSON III Benjamin E. Robinson III | Director | August 29, 2018 | ||
102