Table of Contents
| ||||
UNITED STATES SECURITIES AND EXCHANGE COMMISSION
WASHINGTON, D.C. 20549
FORM 10-K
x | ANNUAL REPORT PURSUANT TO SECTION 13 OR 15(d) OF THE SECURITIES EXCHANGE ACT OF 1934 |
For the fiscal year ended June 30, 2013
OR
o | TRANSITION REPORT PURSUANT TO SECTION 13 OR 15(d) OF THE SECURITIES EXCHANGE ACT OF 1934 |
Commission file number: 000-52082
CARDIOVASCULAR SYSTEMS, INC.
(Exact name of registrant as specified in its charter)
Delaware |
| 41-1698056 |
(State or other jurisdiction of incorporation or organization) |
| (I.R.S. Employer Identification No.) |
|
|
|
651 Campus Drive St. Paul, Minnesota |
| 55112-3495 |
(Address of principal executive offices) |
| (Zip Code) |
Registrant's telephone number, including area code:
(651) 259-1600
Securities registered pursuant to Section 12(b) of the Act:
Title of each class |
| Name of each exchange on which registered |
Common Stock, One-tenth of One Cent ($0.001) Par Value Per Share |
| The NASDAQ Stock Market LLC |
Securities registered pursuant to Section 12(g) of the Act:
None.
Indicate by check mark if the registrant is a well-known seasoned issuer, as defined in Rule 405 of the Securities Act. Yes o No ☑
Indicate by check mark if the registrant is not required to file reports pursuant to Section 13 or Section 15(d) of the Exchange Act. Yes o No ☑
Indicate by check mark whether the registrant (1) has filed all reports required to be filed by Section 13 or 15(d) of the Securities Exchange Act of 1934 during the preceding 12 months (or for such shorter period that the registrant was required to file such reports), and (2) has been subject to such filing requirements for the past 90 days. Yes ☑ No o
Indicate by check mark whether the registrant has submitted electronically and posted on its corporate Web site, if any, every Interactive Data File required to be submitted and posted pursuant to Rule 405 of Regulation S-T during the preceding 12 months (or for such shorter period that the registrant was required to submit and post such files). Yes ☑ No o
Indicate by check mark if disclosure of delinquent filers pursuant to Item 405 of Regulation S-K is not contained herein, and will not be contained, to the best of registrant's knowledge, in definitive proxy or information statements incorporated by reference in Part III of this Form 10-K or any amendment to this Form 10-K. o
Indicate by check mark whether the registrant is a large accelerated filer, an accelerated filer, a non-accelerated filer or a smaller reporting company. See the definitions of "large accelerated filer," "accelerated filer" and "smaller reporting company" in Rule 12b-2 of the Exchange Act.
Large accelerated filer o |
| Accelerated filer x |
| Non-accelerated filer o |
| Smaller reporting company o |
(Do not check if a smaller reporting company)
Indicate by check mark whether the registrant is a shell company (as defined in Rule 12b-2 of the Exchange Act). Yes o No ☑
As of December 31, 2012, the aggregate market value of the registrant's common stock held by non-affiliates of the registrant was $231,162,115 based on the closing sale price as reported on the NASDAQ Global Market.
The number of shares of the registrant's common stock outstanding as of August 27, 2013 was 24,905,857.
DOCUMENTS INCORPORATED BY REFERENCE
Portions of the proxy statement for the registrant's 2013 Annual Meeting of Stockholders are incorporated by reference into Items 10, 11, 12, 13 and 14 of Part III of this report.
| ||||
Table of Contents
|
| Page No. |
PART I | 1 | |
Item 1. | Business | 1 |
Item 1A. | Risk Factors | 19 |
Item 1B. | Unresolved Staff Comments | 27 |
Item 2. | Properties | 27 |
Item 3. | Legal Proceedings | 27 |
Item 4. | Mine Safety Disclosures | 27 |
|
| |
PART II | 29 | |
Item 5. | Market for Registrant's Common Equity, Related Stockholder Matters and Issuer Purchases of Equity Securities | 29 |
Item 6. | Selected Financial Data | 31 |
Item 7. | Management's Discussion and Analysis of Financial Condition and Results of Operations | 32 |
Item 7A. | Quantitative and Qualitative Disclosures About Market Risk | 43 |
Item 8. | Financial Statements and Supplementary Data | 44 |
Item 9. | Changes in and Disagreements With Accountants on Accounting and Financial Disclosure | 45 |
Item 9A. | Controls and Procedures | 45 |
Item 9B. | Other Information | 45 |
|
| |
PART III | 46 | |
Item 10. | Directors, Executive Officers and Corporate Governance | 46 |
Item 11. | Executive Compensation | 46 |
Item 12. | Security Ownership of Certain Beneficial Owners and Management and Related Stockholder Matters | 46 |
Item 13. | Certain Relationships and Related Transactions, and Director Independence | 46 |
Item 14. | Principal Accounting Fees and Services | 47 |
|
| |
PART IV | 47 | |
Item 15. | Exhibits, Financial Statement Schedules | 47 |
We make available, free of charge, copies of our annual report on Form 10-K, quarterly reports on Form 10-Q, current reports on Form 8-K and amendments to those reports filed or furnished pursuant to Section 13(a) or 15(d) of the Securities Exchange Act on our web site, http://www.csi360.com , as soon as reasonably practicable after filing such material electronically or otherwise furnishing it to the Securities and Exchange Commission ("SEC"). We are not including the information on our web site as a part of, or incorporating it by reference into, our Form 10-K.
Table of Contents
PART I
Item 1. Business.
Special Note Regarding Forward Looking Statements
This report contains plans, intentions, objectives, estimates and expectations that constitute forward-looking statements within the meaning of Section 27A of the Securities Act of 1933, as amended, and Section 21E of the Securities Exchange Act of 1934, as amended (the "Exchange Act"), which are subject to the "safe harbor" created by those sections. Forward-looking statements are based on our management's beliefs and assumptions and on information currently available to our management. In some cases, you can identify forward-looking statements by terms such as "may," "will," "should," "could," "would," "expect," "plans," "anticipates," "believes," "estimates," "projects," "predicts," "potential" and similar expressions intended to identify forward-looking statements. Examples of these statements include, but are not limited to, any statements regarding our future financial performance, results of operations or sufficiency of capital resources to fund our operating requirements, and other statements that are other than statements of historical fact. Our actual results could differ materially from those discussed in these forward-looking statements due to a number of factors, including the risks and uncertainties that are described more fully by us in Part I, Item 1A and Part II, Item 7 of this report and in our other filings with the SEC. You should not place undue reliance on these forward-looking statements, which apply only as of the date of this report. You should read this report completely and with the understanding that our actual future results may be materially different from what we expect. Except as required by law, we assume no obligation to update these forward-looking statements publicly, or to update the reasons actual results could differ materially from those anticipated in these forward-looking statements, even if new information becomes available in the future.
Corporate Information
We were incorporated as Replidyne, Inc. in Delaware in 2000. On February 25, 2009, Replidyne, Inc. completed its business combination with Cardiovascular Systems, Inc., a Minnesota corporation ("CSI-MN"), in accordance with the terms of the Agreement and Plan of Merger and Reorganization, dated as of November 3, 2008, by and among Replidyne, Responder Merger Sub, Inc., a wholly-owned subsidiary of Replidyne ("Merger Sub"), and CSI-MN (the "Merger Agreement"). Pursuant to the Merger Agreement, Merger Sub merged with and into CSI-MN, with CSI-MN continuing after the merger as the surviving corporation and a wholly-owned subsidiary of Replidyne. At the effective time of the merger, Replidyne changed its name to Cardiovascular Systems, Inc. and CSI-MN changed its name to CSI Minnesota, Inc. Following the merger of Merger Sub with CSI-MN, CSI-MN merged with and into CSI, with CSI continuing after the merger as the surviving corporation.
Our principal executive office is located at 651 Campus Drive, St. Paul, Minnesota 55112. Our telephone number is (651) 259-1600, and our website is www.csi360.com. The information contained in or accessible through our website is not incorporated by reference into, and should not be considered part of, this Annual Report on Form 10-K.
We have received 14 federal registrations in the U.S. Patent and Trademark Office, or USPTO, of certain marks, including "Diamondback ®, " "CSI ®, " "Diamondback 360° ®, " "Predator 360° ®, " "Stealth 360° ®, " a first "CSI" logo, a second "CSI" logo, "Lumen Library ®, " "ViperWire ®, " "ViperWire Advance ®, " "Viperslide ®, " "ViperTrack ®, " and "ViperCaddy. ® " We have applied for federal trademark registration with the USPTO of certain marks, including "Diamondback," "Diamondback 360," Diamondback 360 (Stylized) Logo," "Patriot 360," "Patriot 360 (Stylized) Logo," "Stay A Step Ahead of PAD," "Stealth 360," "Stealth 360 (Stylized)," "Viperslide (Stylized)," "Vipertrack (Stylized)," "Viperwire Advance (Stylized)." All other trademarks, trade names and service marks appearing in this Form 10-K are the property of their respective owners.
Business Overview
We are a medical device company focused on developing and commercializing minimally invasive treatment solutions for vascular disease. Interventional endovascular treatment of peripheral artery disease, or PAD, is our initial area of focus. PAD is caused by the accumulation of plaque in peripheral arteries, most commonly occurring in the pelvis and legs. PAD is a progressive disease, and, if left untreated, can lead to limb amputation or death.
1
Table of Contents
Our primary products, the Stealth 360° PAD System ("Stealth 360°"), Diamondback 360° PAD System ("Diamondback 360°"), and Diamondback Predator 360° PAD System ("Predator 360°"), are catheter-based platforms capable of treating a broad range of plaque types in leg arteries both above and below the knee and address many of the limitations associated with existing treatment alternatives. We refer to the Stealth 360°, the Diamondback 360°, and the Predator 360° collectively in this annual report as the "PAD Systems." In August 2007, the U.S. Food and Drug Administration, or FDA, granted us 510(k) clearance for the use of the Diamondback 360° as a therapy in patients with PAD. We commenced commercial introduction of the Diamondback 360° in the United States in September 2007. We received 510(k) clearance of the Predator 360° in March 2009 and commenced a commercial launch in April 2009. We received 510(k) clearance of the Stealth 360° in March 2011 and commenced a commercial launch that same month. The Stealth 360° contains additional ease of use and physician control features while incorporating the orbital mechanism of action and crown configurations of the Diamondback 360° and Predator 360°. As of June 30, 2013, nearly 120,000 of our devices had been sold to leading institutions across the United States.
We intend to expand into the interventional coronary market, though we need to receive FDA approval to do so. In May 2011, we received approval from the FDA to complete enrollment of 429 patients in our ORBIT II clinical trial for a coronary application for the Diamondback 360°, which followed the FDA's review of data from the first 50 cases in the trial. In July 2012, we received approval from the FDA to include in the trial our new electric coronary device (similar to Stealth 360° technology used in PAD and customized specifically for the coronary application), which improves ease of use. The FDA required 100 enrollments with the new electric coronary device and allowed up to 50 additional patients in the trial, as needed, to achieve that enrollment level, bringing the maximum trial enrollment to 479.
During our second quarter of fiscal 2013, we completed enrollment in our ORBIT II trial, enrolling 443 patients. Our ORBIT II trial evaluated the safety and effectiveness of our orbital atherectomy technology in treating severely calcified coronary arteries. Statistical analysis shows that the study met its primary safety and efficacy endpoints by significant margins. In March 2013, we presented data from our ORBIT II trial at the 2013 American College of Cardiology conference. We and the FDA agreed to a modular pre-market approval, or PMA, submission. Modules 1 (preclinical) and 2 (manufacturing/quality system) were submitted to the FDA in late 2012, and our PMA application was final upon submission on March 15, 2013 of module 3, which included ORBIT II clinical data and proposed labeling. It is estimated that moderate to severe arterial calcium is present in approximately 38% of those treated annually for coronary artery disease. ORBIT II is the first investigational device exemption, or IDE, trial designed to study these difficult-to-treat patients with severely calcified coronary disease.
In addition to the PAD Systems, we have expanded our product portfolio through internal product development and establishment of business relationships with other medical device companies. We offer multiple accessory products designed to complement the use of the PAD Systems, and we have an exclusive distribution agreement with Asahi-Intecc Co., Ltd. to market its peripheral guidewire line in the United States.
Market Overview
Peripheral Artery Disease
PAD is a circulatory problem in which plaque deposits build up on the walls of the arteries, resulting in inadequate blood flow to the limbs. Arteries above the knee are generally long, straight and relatively wide, while arteries below the knee are shorter and branch into arteries that are progressively smaller in diameter. The most common early symptoms of PAD are pain, cramping or fatigue in the leg or hip muscles while walking. Symptoms may progress to include numbness, tingling or weakness in the leg and, in severe cases, burning or aching pain in the leg, foot or toes while resting. As PAD progresses, additional signs and symptoms occur, including cooling or color changes in the skin of the legs or feet, and wounds or sores on the legs or feet that will not heal. If left untreated, PAD may continue to progress and lead to a condition called Critical Limb Ischemia (CLI), a condition in which the amount of oxygenated blood being delivered to the limb is insufficient to keep the tissue alive. CLI may lead to large non-healing ulcers, infections, gangrene and limb amputation or death.
2
Table of Contents
There are two primary bases for estimating PAD prevalence: the patient Ankle Brachial Index (ABI) or diabetes rates. The most recent comprehensive study based on ABI estimates the U.S. prevalence at 8.5 million (Allison et al, "Ethnic-Specific Prevalence of Peripheral Arterial Disease in the United States," Circulation, 2007). Podiatry Today, in a 2006 article, estimated the prevalence of PAD in the United States at 12 million people. Alternatively, a study by The SAGE Group based on the diabetes method estimates prevalence at 17.6 million in 2010. An aging population, coupled with increasing incidence of diabetes and obesity, is likely to continue to increase the prevalence of PAD. In many older PAD patients, particularly those with diabetes, PAD is characterized by fibrotic (moderately hard) or calcified (extremely hard) plaque deposits that are very challenging to treat. Although we believe the rate of diagnosis of PAD is increasing, under-diagnosis continues due to patients failing to display symptoms or physicians misinterpreting symptoms as normal aging. Emphasis on PAD education from industry, medical associations, insurance companies and other groups, coupled with publications in medical journals and public news channels, is increasing physician and patient awareness of PAD risk factors, symptoms, and treatment options. As a result of additional clinical trial outcomes, new 2011 guidelines of the American College of Cardiology Foundation/American Heart Association lowered the recommended age for testing for PAD from 70 to 65, or 50 if patient has a history of smoking or diabetes.
Physicians treat a significant portion of the PAD diagnosed population using medical management, which includes lifestyle changes, such as diet and exercise and drug treatment. For instance, within a reference group of more than 1,000 patients from the 2001 AMA PARTNERS study, 54% of the patients with a prior diagnosis of PAD were receiving antiplatelet medication treatment. While medications, diet and exercise may improve blood flow, they do not treat the underlying obstruction and many patients have difficulty maintaining lifestyle changes. Additionally, many prescribed medications are contraindicated, or inadvisable, for patients with heart disease, which often exists in PAD patients. As a result of these challenges, many medically managed patients develop more severe symptoms that require procedural intervention.
Coronary Artery Disease
Based on data from the Millennium Research Group's U.S. Markets for Interventional Cardiology Devices 2011 Report, approximately 1.1 million percutaneous coronary interventions, or PCI, procedures were projected to occur in the United States in 2012. Based on the article in Circulation in 1995 entitled "Patterns of Calcification in Coronary Artery Disease," 38% of PCI procedures involve moderate to severe levels of calcified coronary arteries. Patients with severely calcified coronary disease may benefit from the use of our device if approved for commercial use. In addition, based on Millennium Research Group's Coronary Bypass Graft 2010 Report, approximately 288,620 coronary artery bypass graft surgeries were performed in the United States in 2010. These patients generally have higher rates of calcification and we believe they may benefit from the use of our device if approved for commercial use.
Our Product
Components of the PAD Systems
The PAD Systems each use a single-use, low-profile catheter that travels over our proprietary ViperWire Advance™ Guide Wire and is powered by either a saline infusion pump (Stealth 360°) or an external control unit (Diamondback 360° or Predator 360°).
Catheter. The catheter consists of:
• | a control handle, which allows precise movement of the crown and predictable crown location; |
• | a flexible drive shaft with a diamond grit coated offset crown, which tracks and orbits over the guidewire; and |
• | a sheath, which covers the drive shaft and permits delivery of saline or medications to the treatment area. |
ViperWire Advance Guidewire. The ViperWire Advance is the second generation of the ViperWire. The ViperWire Advance was designed to offer an improved ability to maneuver through tortuous, twisting blood vessels and cross challenging lesions. The PAD Systems travel over this wire to the lesion and operate on this wire.
ViperSlide Lubricant. ViperSlide is an exclusive lubricant designed to optimize the smooth operation of the PAD Systems.
3
Table of Contents
Saline Infusion Pump. Used exclusively with the Stealth 360°, the saline infusion pump mounts directly to the intravenous pole and bathes the device's shaft and crown and provides an electric power supply for the operation of the catheter. The constant flow of saline reduces the risk of heat generation and improves the flush of particulates.
Control Unit. Used in conjunction with the Diamondback 360° and Predator 360° PAD Systems, the control unit incorporates a touch-screen interface on an easily maneuverable pole. Using an external air supply, the control unit regulates air pressure to drive the turbine located in the catheter handle to speeds ranging up to 200,000 revolutions per minute. Saline, delivered by a pumping mechanism on the control unit, bathes the device shaft and crown. The constant flow of saline reduces the risk of heat generation and improves the flush of particulates.
Technology Overview
Plaque Modification through Differential Sanding. The PAD Systems were designed to allow the devices to differentiate between soft compliant and harder diseased tissue in the artery. Arterial lesions tend to be harder and stiffer than compliant, undiseased vessel tissue, and they often are fibrotic or calcified. The diamond grit coated crown preferentially engages and sands the harder material, but is designed not to damage more compliant parts of the artery. The PAD Systems also treat soft plaque, which is still harder than a normal vessel wall. The mechanism of action is a function of the centrifugal force generated by the PAD Systems as they rotate. As the crown moves outward, the centrifugal force is offset by the counterforce exerted by the arterial wall. If the tissue is compliant, it flexes away, rather than generating an opposing force that would allow the PAD Systems to engage and sand the wall. Diseased tissue provides resistance and is able to generate an opposing force that allows the PAD Systems to engage and sand the plaque. The sanded plaque is broken down into particles generally smaller than circulating red blood cells that are washed away downstream with the patient's natural blood flow. Testing performed in carbon blocks, animal and cadaver models showed:
• | greater than 93% of particles were smaller than a red blood cell, and |
• | greater than 99% of particles were smaller than the lumen of the capillaries (which provide the connection between the arterial and venous system). |
The small particle size minimizes the risk of vascular bed overload, or a saturation of the peripheral vessels with large particles, which may cause slow or reduced blood flow to the foot. The small size of the particles allows them to be managed by the body's natural cleansing of the blood, whereby various types of white blood cells eliminate worn-out cells and other debris in the bloodstream.
Mechanism of Action. The systems operate on the principles of centrifugal force. As the speed of the crown's rotation increases, it creates centrifugal force, which increases the crown's orbit and presses the diamond grit coated offset crown against the lesion or plaque, removing a small amount of plaque with each orbit. The characteristics of the orbit and the resulting lumen size can be adjusted by modifying three variables:
• | Speed. An increase in speed creates a larger orbital circle, thus accommodating larger diameter vessels. Our current Stealth 360° system allows the user to choose between three rotational speeds. |
• | Crown Characteristics. The crown can be designed with various weights (as determined by crown geometry and material density) and coated with diamond grit. The crown is available in two configurations - classic and solid. Physicians select crown sizes and configurations based on several case criteria, including reference vessel size, lesion length and degree of stenosis, stenosis morphology, and anatomy tortuosity. Physicians often use the classic crown configuration in small, more tortuous vessels or when less aggressive sanding is desired. The solid crown configuration is designed with a tapered, leading edge for frontal sanding, which can be used in tight calcified disease. The Stealth 360° device is available with a 1.50 millimeter and 2.00 millimeter classic crown, and 1.25 millimeter, 1.50 millimeter and 2.00 millimeter solid crown configuration. There is also a 1.25 millimeter solid micro crown available with the Stealth 360° device, which is designed to provide hybrid performance between the classic and solid configurations and treat very small arteries in the lower leg and foot. For both configurations, the catheter length is 145 centimeters, which addresses procedural approach and target lesion locations both above and below the knee. |
The Diamondback 360° utilizes the classic crown and the Predator 360° utilizes the solid crown. Both systems are available in multiple sizes, including 1.25, 1.50, 1.75, and 2.00 millimeter. There is also a 2.25 millimeter Predator 360° device.
4
Table of Contents
The PAD Systems are versatile in that by adjusting one or more of the speeds in conjunction with crown selection, multiple lesions and vessel sizes can be treated.
Applications
The PAD Systems can be used to treat plaque in multiple anatomic locations.
Below-the-Knee and Behind-the-Knee Peripheral Artery Disease. Arteries below and behind the knee have small diameters and may be diffusely diseased, calcified or both, limiting the effectiveness of traditional devices. Behind-the-knee lesions also present challenges if a stent is required because stents frequently fracture due to the forces exerted on the vessels when the knee bends or flexes. The PAD Systems are effective in both diffused and calcified vessels. This was demonstrated in the OASIS trial, where 94.5% of lesions treated with the Diamondback 360° were behind or below the knee.
Above-the-Knee Peripheral Artery Disease. Arteries above the knee are longer, straighter and wider than below-the-knee vessels. Plaque in these arteries may also be diffuse, fibrotic and calcific. Our products are often used to treat lesions above the knee by using higher speeds or larger crown sizes.
Potential Applications
Coronary Artery Disease. We have developed modified versions of the Stealth 360° and Diamondback 360° to treat coronary arteries. A coronary application requires us to conduct a clinical trial and file a premarket application, or PMA, and obtain approval from the FDA. We participated in three pre-IDE meetings with the FDA and completed the human feasibility portion of a coronary trial in the summer of 2008 in India, enrolling 50 patients. The FDA agreed to accept the data from the India trial to support an IDE submission. The FDA granted unconditional approval in April 2010 to begin the ORBIT II coronary study in the United States. In May 2011, we received approval from the FDA to complete enrollment of 429 patients in our ORBIT II clinical trial for a coronary application for the Diamondback 360°, which followed the FDA's review of data from the first 50 cases in the ORBIT II trial. In July 2012 we received approval from the FDA to include the new electric coronary device (similar to Stealth 360° technology used in PAD and customized specifically for the coronary application), which improves ease of use. The FDA required 100 enrollments with the new electric coronary device and would have allowed up to 50 additional patients in the trial, as needed, to achieve that enrollment level. A total of 443 patients were enrolled in the trial. The results of the study also demonstrated that 92.8% of patients were free from severe angiographic complications. Post-atherectomy stents were successfully delivered in 97.7% of the patients with a low core lab assessed final procedure mean residual stenosis of 4.7%. The ORBIT II study results met the primary safety and efficacy endpoints by significant margins with success rates of 89.6% and 88.9%, respectively, compared to primary endpoint targets of 83.0% and 82.0%, respectively. Compared to previous studies of calcified lesions, the ORBIT II study results also showed that 92.8% of patients were free from angiographic complications and had significantly lower rates of major adverse cardiac event (MACE) and death.
Our Solution
The PAD Systems represent an innovative approach to the treatment of PAD that provides physicians and patients with a procedure that addresses many of the limitations of traditional treatment alternatives. Each of the PAD Systems utilizes single-use catheters that incorporate a flexible drive shaft with an offset diamond grit coated crown. Physicians position the crown at the site of an arterial plaque-containing lesion and remove the plaque by positioning the crown to orbit against it, creating a smooth lumen, or channel, in the vessel. The PAD Systems are designed to differentiate between hard plaque and soft, compliant arterial tissue, a concept that we refer to as "differential sanding."
Normal arteries are compliant and have the ability to expand and contract as needed to supply blood flow. Arteries burdened with fibrotic and/or calcified plaque due to PAD lose their compliance, which makes other therapies such as angioplasty, stenting, surgical bypass and other atherectomy technologies problematic. The PAD Systems sand plaque into small particles and restore both blood flow and vessel compliance. The particles created by the PAD Systems are generally smaller than red blood cells and are carried away by the bloodstream. The small size of the particles avoids the need for plaque collection reservoirs. The PAD Systems can typically treat the diseased arteries with less than two minutes of sanding time, potentially reducing the overall procedure time.
We believe the PAD Systems offer the following key benefits:
5
Table of Contents
Strong Safety Profile
• | Differential Sanding Reduces Risk of Adverse Events. The PAD Systems are designed to differentiate between hard plaque and soft compliant arterial tissue. Arteries are composed of three tissue layers. The diamond grit coated offset crown at the working end of the devices engages and removes plaque from the artery wall with minimal likelihood of penetrating or damaging the fragile, inner layer of the arterial wall because soft, compliant tissue flexes away from the crown. Furthermore, the PAD Systems have rarely penetrated the middle or outer layers of the artery's wall. The Diamondback 360°'s perforation rate was 1.6% during our pivotal OASIS trial. Analysis by an independent pathology laboratory of more than 434 consecutive cross sections of porcine arteries treated with the Diamondback 360° revealed there was minimal to no damage, on average, to the middle layer, which is typically associated with restenosis. In addition, the safety profile of the Diamondback 360° was found to be non-inferior to that of angioplasty, which is a common interventional method. |
• | Eliminates Need for Distal Protection. The PAD Systems sand plaque away from artery walls in a manner that produces particles of such a small size - generally smaller than red blood cells - that they are carried away by the bloodstream. The small size of the particles avoids the need for plaque collection reservoirs on the catheter and reduces the need for ancillary distal protection devices, commonly used with directional cutting atherectomy, and also significantly reduces the risk that larger pieces of removed plaque will block blood flow downstream. |
• | Allows Continuous Blood Flow During Procedure. The PAD Systems allow for continuous blood flow during the procedure, except when initially used in chronic total occlusions. Other devices may restrict blood flow due to the size of the catheter required or the use of distal protection devices, which could result in complications such as excessive heat and tissue damage. |
Proven Efficacy
• | Efficacy Demonstrated in a 124-Patient Clinical Trial. Our pivotal OASIS clinical trial was a prospective 20-center study that involved 124 patients with 201 lesions treated by the Diamondback 360°. Performance targets were established cooperatively with the FDA before the trial began. Despite 55% of the lesions consisting of calcified plaque, the Diamondback 360° in the OASIS trial successfully met the FDA's study endpoints. Because the Predator 360° and Stealth 360° mechanism of action is identical to that of the Diamondback 360°, no additional efficacy trials were required by the FDA for 510(k) clearance of either PAD System. |
• | Treats Difficult, Fibrotic and Calcified Lesions. The PAD Systems enable physicians to remove plaque from long, fibrotic, calcified or bifurcated lesions, as well as lesions with softer plaque, in peripheral arteries both above and below the knee. |
• | Orbital Motion Improves Lesion Compliance. The orbiting action of the PAD Systems removes the hard plaque in the artery by sanding. As the crown sands away the plaque, the lumen of the artery is opened and the vessel wall becomes more compliant. The orbital motion and speed of the crown increases, thus allowing for continuous removal of plaque as the opening of the lumen increases during the operation of the devices. Non-orbiting rotational atherectomy catheters remove plaque by either abrading the lesion with a spinning, abrasive burr, or by shaving the lesion with sharp blades. The burr-type device acts in a manner similar to a drill and only creates a lumen the same size or slightly smaller than the size of the burr. They also generate heat that can traumatize the vessel. The shaving devices are not able to discriminate between lesion disease and healthy vessel tissue and can generate large debris. |
• | Differential Sanding Creates Smooth Lumens. The differential sanding of the PAD Systems creates a smooth surface inside the lumen of a fibrotic or calcified lesion. We believe that the smooth lumens created by the device increases the velocity of blood flow and decreases the resistance to blood flow, which may decrease the potential for restenosis, or renarrowing of the arteries. |
Ease of Use
• | Utilizes Familiar Techniques. Physicians using the PAD Systems employ techniques similar to those used in angioplasty, which are familiar to interventional cardiologists, vascular surgeons and interventional radiologists who are trained in endovascular techniques. The devices' simple user interfaces require minimal additional training. |
6
Table of Contents
• | Single Insertion to Complete Treatment. The orbital technology and differential sanding process of the PAD Systems allows for a single insertion to treat lesions, in most cases. Because the particles of plaque sanded away are of such small sizes, the PAD Systems do not require a collection reservoir that needs to be repeatedly emptied or cleaned during the procedure, or add time and cost to the procedure. Rather, the PAD Systems allow for multiple passes of the device over the lesion until plaque is removed and a smooth lumen is created. |
Treatment Area
• | Treats Entire Leg. The PAD Systems have the ability to treat the entire leg, including small vessels below the knee and arterial-venus (AV) shunt. |
Cost and Time Efficient Procedure
• | Short Procedure Time. The PAD Systems have a short treatment time, typically less than two minutes. |
• | Single Crown Can Create Various Lumen Sizes Limiting Hospital Inventory Costs. The orbital mechanism of action with the PAD Systems allows one device to create various diameter lumens inside the artery. Adjusting the rotational speed of the crown changes the orbit to create the desired lumen diameter, thereby potentially avoiding the need to use multiple catheters of different sizes to treat multiple lesions. |
• | Single Insertion Reduces Procedural Time. Since the physician does not need to insert and remove multiple catheters or clean a plaque collection reservoir to complete the procedure, there is a potential for decreased procedure time. |
Our Strategy
Our goal is to be the leading provider of minimally invasive solutions for the treatment of vascular disease. The key elements of our strategy include:
• | Drive Adoption through Our Direct Sales Organization and Key Opinion Leaders. We expect to continue to drive adoption of the PAD Systems through our direct sales force, which targets interventional cardiologists, vascular surgeons, and interventional radiologists. As a key element of our strategy, we focus on educating and training physicians on the PAD Systems through our direct sales force and through seminars where physician industry leaders discuss case studies and treatment techniques using the devices. |
• | Collect Additional Clinical Evidence on Benefits of the PAD Systems. Physicians are increasingly requesting clinical study evidence to allow them to make the best treatment decisions to achieve the best possible short-term and long-term outcomes for their patients. We are focused on collecting and using clinical evidence to demonstrate the advantages of the PAD Systems and drive physician acceptance. |
• | Enhance PAD Systems and Expand Product Portfolio within the Market for Treatment of Peripheral Arteries. In addition to enhancing the PAD Systems, we have expanded our product portfolio. We offer multiple accessory devices designed to complement the use of the PAD Systems. We continue to market the following products: |
◦ | ViperWire Advance - guidewire offering improved ability to maneuver through tortuous, twisting blood vessels and cross challenging lesions |
◦ | ViperSlide Lubricant - an exclusive lubricant designed to optimize the smooth operation of the PAD Systems |
◦ | ViperTrack Radiopaque Tape - a radiopaque tape to assist in measuring lesion lengths and marking lesion locations |
We are continuing to evaluate internal product development to further expand our portfolio of PAD treatment solutions.
7
Table of Contents
• | Leveraging our core technology into the coronary market. We are leveraging our orbital technology to expand into the interventional coronary market. A coronary application would address a large market opportunity, further leveraging our core technology and expanding its market potential. In 2008, we completed the ORBIT I trial, a 50-patient study in India that investigated the safety of the Diamondback 360º device in treating calcified coronary artery lesions. Results successfully met both safety and efficacy endpoints. An IDE application was approved by the FDA for ORBIT II, and a pivotal trial that enrolled 443 patients in the United States was completed to evaluate the safety and effectiveness of the PAD Systems in treating severely calcified coronary lesions. The ORBIT II study results met the primary safety and efficacy endpoints by significant margins with success of 89.6% and 88.9%, respectively, compared to primary endpoint targets of 83.0% and 82.0%, respectively. The ORBIT II study also showed significantly lower rates of MACE and death. |
• | Expansion Internationally. With the anticipated coronary approval, we are evaluating a variety of options for international expansion to maximize the coronary and peripheral market opportunities. The options include a clinical approach in some countries and a commercial approach in others. Sales channels will also be based on specific country dynamics. As a result, distributors - including potential strategic partners - and direct sales channels are being evaluated. |
• | Pursue Strategic Acquisitions and Partnerships. In August 2009, we signed an exclusive distribution agreement with Asahi to market two peripheral guidewire lines in the United States. In August 2011, we signed an amendment to expand the agreement to include three additional peripheral guidewires. The product portfolio now includes the Treasure Floppy and Regalia and three specialty wires: Astato 20, Astato 30, and Treasure 12. In June 2013, we signed an amendment to extend the exclusive guidewire agreement two more years. |
In addition to adding to our product portfolio through internal development efforts, we intend to continue to explore the acquisition of other product lines, technologies or companies that may leverage our sales force or complement our strategic objectives. We plan to continue to evaluate distribution agreements, licensing transactions, and other strategic partnerships.
Clinical Studies for Our Products
We are committed to providing relevant clinical evidence that enables physicians to select and utilize the best treatment options for their patients. We have conducted 12 clinical studies to demonstrate the safety and efficacy of the PAD Systems in treating PAD. A total of 3,703 patients were enrolled in our PAD I and PAD II pilot studies, OASIS pivotal study, CONFIRM DIAMONDBACK, CONFIRM PREDATOR, CONFIRM OUTFLOW Post-Market Registries and the CALCIUM 360° and COMPLIANCE 360° post-market, randomized feasibility studies. The results of these studies consistently demonstrated that the PAD systems provide predictable, repeatable and durable results that differentiate themselves from other PAD treatments. Driven by our ongoing commitment to clinical research, we have initiated three new peripheral clinical studies in 2013, TRUTH, CLARITY, and LIBERTY 360.
Coronary artery disease (CAD), the most common form of heart disease, continues to grow significantly worldwide. Performing percutaneous coronary intervention (PCI) on calcified lesions can lead to MACE rates as high as 24% at 30 days, stent malapposition, and a number of procedural complications. Despite being a relatively common problem, there have been no FDA IDE PMA trials studying only patients with severe coronary calcification. The ORBIT I coronary clinical study was completed in India in 2009 to demonstrate the safety and effectiveness of orbital atherectomy for use in calcified coronary arteries. Working closely with the FDA, the ORBIT II study was designed as a single arm trial since there were no other approved devices indicated to treat severely calcified coronary vessels. In 2010, we began the ORBIT II pivotal study in the United States, evaluating the use of the Diamondback 360° in treating coronary arteries. The ORBIT II study is the first study in the United States designed specifically for difficult-to-treat calcified coronary artery disease.
8
Table of Contents
Metrics Used in PAD and CAD Studies
The common metrics used to evaluate plaque modification and removal devices for PAD include:
Metric |
| Description |
Change in Compliance |
| Compliance change as defined in the COMPLIANCE 360° protocol is to achieve ≤ 30% residual stenosis with orbital atherectomy followed by a "low-pressure balloon inflation" of ≤ 4 atmospheres pressure (atm). |
Absolute Plaque Reduction |
| Absolute plaque reduction is the difference between the pre-treatment percent stenosis, or the narrowing of the vessel, and the post-treatment percent stenosis as measured angiographically. |
Target Lesion Revascularization (TLR) |
| The target lesion revascularization (TLR) rate is the percentage of patients who have another peripheral intervention in the same lesion due to repeat or worsening symptoms. Treatments such as angioplasty, stenting, surgery or atherectomy may be used to reopen the previously treated lesion site. |
Ankle Brachial Index (ABI) |
| The Ankle Brachial Index (ABI) is a useful measurement in evaluating the adequacy of circulation in the legs and the improvement or worsening of leg circulation over time. The ABI is a ratio between the blood pressure in a patient's ankle and arm; a ratio above 0.9 is normal. |
Serious Adverse Events (SAE) |
| SAEs include any event that is fatal or life-threatening, permanently disabling, that requires or prolongs hospitalization, or intervention to prevent permanent impairment or damage. SAEs may or may not be related to the device. |
Perforation |
| Perforation occurs when the artery is punctured during treatment. Perforations may be non-serious or serious adverse events (SAEs) depending on the treatment required to repair the perforation. |
The common metrics used to evaluate atherectomy devices for CAD include:
Metric |
| Description |
Target Lesion Revascularization (TLR) |
| TLR is any repeat revascularization procedure of the original target lesion site due to worsening symptoms. This includes angioplasty, stenting, coronary artery bypass grafting (CABG) and atherectomy. |
Major Adverse Cardiac Events (MACE) |
| MACE includes death, myocardial infarction, or target vessel revascularization. MACE may or may not be related to the device. |
Perforation |
| Perforation occurs when the artery is punctured during treatment. Perforations may be non-serious or serious adverse events (SAEs) depending on the treatment required to repair the perforation. |
PAD Feasibility Studies
PAD I, our first clinical study, was a two-site, 17-patient feasibility clinical study in Europe initiated in March 2005. Patients enrolled in the study had lesions less than 10 cm in length in arteries between 2.0 mm and 5.0 mm in diameter, with Rutherford Class scores of IV or lower. Patients were evaluated at the time of the procedure and at 30 days following treatment. The purpose of PAD I was to obtain the first human clinical experience and evaluate the safety of the Diamondback 360°, which was determined by estimating the cumulative incidence of patients experiencing one or more SAEs within 30 days post-treatment.
The results of PAD I confirmed that the Diamondback 360° System was safe and established that the Diamondback 360° could be used to treat vessels in the range of 2.0 mm and 5.0 mm diameter found primarily below the knee. PAD I also showed that removal of plaque could be accomplished with a resulting device-to-lumen ratio of approximately 1.0 to 2.0. The SAE rate in PAD I was 6% (one of 17 patients).
After being granted the CE Mark in May 2005, we initiated PAD II, a 66-patient European clinical study at seven sites, in August 2005. All patients had stenosis in vessels below the femoral artery of between 1.5 mm and 4.0 mm in diameter, with at least 50% blockage. The primary objectives of this study were to evaluate the acute (30 days or less) risk of experiencing an SAE post-procedure and provide evidence of device effectiveness. Effectiveness was confirmed angiographically and based on the percentage of absolute plaque reduction.
9
Table of Contents
The PAD II results demonstrated safe and effective debulking in vessels with diameters ranging from 1.5 mm to 4.0 mm with a mean absolute plaque reduction of 55%. The SAE rate in PAD II was 9% (six of 66 patients), which did not differ significantly from existing non-invasive treatment options.
OASIS Pivotal Study
An IDE was approved in September 2005 to begin OASIS, our pivotal United States study. OASIS was a 124-patient, 20-center, prospective study that began enrollment in January 2006. Patients included in the study had an ABI of less than 0.9, a Rutherford Class score of class V or lower and treated arteries of between 1.5 mm and 4.0 mm or less in diameter via angiogram measurement, with a well-defined lesion of at least 50% diameter stenosis and lesions of no greater than 10.0 cm in length.
The primary efficacy study endpoint was absolute plaque reduction of the target lesions from baseline to immediately post-procedure. The primary safety endpoint was the cumulative incidence of SAEs at 30 days.
In the OASIS study, 94.5% of lesions treated were behind or below the knee, an area where lesions have traditionally gone untreated until they require bypass surgery or amputation. Of the lesions treated in OASIS, 55% were comprised of calcified plaque, which presents a challenge to proper expansion and apposition of balloons and stents, and 48% were diffuse, or greater than 3 cm in length, which typically requires multiple balloon expansions or stent placements. Competing plaque removal devices are often ineffective with these difficult-to-treat lesions.
The average time of treatment in the OASIS study was three minutes per lesion, which compares favorably to the treatment time required by other plaque removal devices. The following table is a summary of the OASIS study results:
Item | FDA Target | OASIS Result |
Absolute Plaque Reduction | 55% | 59.4% |
SAEs at 30 days | 8%, with an upper bound of 16% | 4.8%, device-related; 9.7%, overall |
TLR | 20% or less | 2.4% |
*Mean ± Standard Deviation
In August 2007, the FDA granted us 510(k) clearance for the use of the Diamondback 360° Peripheral Orbital Atherectomy System as a therapy in patients with PAD.
CLEAR 360° Study
We conducted the CLEAR 360° study to evaluate the incidence of clinically significant hemolysis associated with orbital atherectomy used to treat severe peripheral arterial disease. Enrolling 31 patients at four U.S. medical centers and completed in 2009, this study concluded that there was no clinically significant hemolysis after orbital atherectomy.
Post-Market Studies
In May 2010, enrollment was completed in the COMPLIANCE 360° clinical study. This post-market prospective, randomized, multi-center study evaluated the clinical and economic benefits of modifying plaque to change large vessel compliance above the knee with the Diamondback 360° or Predator 360°. The study compared the performance of the Diamondback 360° or Predator 360°, plus low-pressure balloon angioplasty, if desired, with that of high-pressure balloon inflation alone. Fifty patients were enrolled at nine U.S. medical centers with six and 12-month follow-up periods. The study proved that, compared to balloon angioplasty alone, the Diamondback 360° or Predator 360° plus low pressure balloon angioplasty leads to better luminal gain by improving lesion compliance and decreases the need for adjunctive stenting for the treatment of calcified femoral popliteal disease. Restenosis and TLR were similar at 12 months despite the large disparity of stent usage between the two groups. The results of this study demonstrated that the Diamondback 360° or Predator 360° can achieve results in calcified plaque by improving lesion compliance through differential sanding, without the need for stent placement. Results from the COMPLIANCE Study were presented at American College of Cardiology (ACC) in Chicago, Illinois in March 2012.
10
Table of Contents
In April 2010, enrollment was completed in the CALCIUM 360 o study, a prospective, randomized, multi-center study comparing the effectiveness of the Diamondback 360° or Predator 360° Peripheral Orbital Atherectomy Systems to balloon angioplasty in treating calcified lesions below the knee. Calcified plaque exists in about 80 percent of lesions below the knee, which makes them difficult to treat and can lead to increased complications. Fifty patients were enrolled at eight U.S. medical centers. This study demonstrated procedural success of 93.1% (27 out of 29 lesions) for the Diamondback 360° or Predator 360° plus balloon angioplasty and 82.4% (28 out of 34 lesions) for balloon angioplasty alone. At one year follow-up there were no amputations in either group. Freedom from target vessel revascularization and death was seen in 93.3% and 100% in the Diamondback 360° and Predator 360° device groups, respectively, and 80.0% and 68.4% of the balloon angioplasty group, respectively. Six and 12-month results showed that the Diamondback 360° or Predator 360° treatment outperformed balloon angioplasty. A key finding was that by modifying calcified lesions first, the Diamondback 360° or Predator 360° allowed use of a lower-pressure adjunctive balloon therapy, reducing the need for bail-out stenting with improved longer-term patient outcomes. Results of the CALCIUM 360 o study were published in the Journal of Endovascular Therapy in August 2012.
CONFIRM Post-Market Clinical Registry Series
The CONFIRM Post-Market Clinical Registry Series were designed to further evaluate acute parameters related to the use of the PAD Systems. The CONFIRM Series consisted of three registries: CONFIRM I DIAMONDBACK, CONFIRM II PREDATOR, and CONFIRM III OUTFLOW.
Enrollment of 733 patients in the CONFIRM I DIAMONDBACK Post-Market Registry was completed in March 2010. In this prospective registry, 1,146 lesions were treated by 84 investigators at 57 medical centers with the Diamondback 360°. Lesions treated were above the knee (46.5%), behind the knee (17.5%), and below the knee (36.0%). Long and calcified lesions were treated with the Diamondback 360° followed by low pressure balloon angioplasty, if desired. An average residual stenosis of 12.0% was achieved following treatment, which is consistent with results achieved in PAD I, PAD II, and OASIS. Bailout stenting, or stenting required due to tears in the vessel wall, occurred in 4.6% of lesions. This is lower than the 35% to 40% bail-out stent rate reported in the literature for patients treated with high-pressure balloon angioplasty alone in this type of challenging patient population. Results of this study were presented at the Complex Cardiovascular Catheter Therapeutic, or C3, conference in Orlando, Florida in June 2012.
Enrollment of 1,127 patients by 153 investigators at 122 institutions in the prospective CONFIRM II PREDATOR Post-Market Registry was completed in December 2010. Data on acute clinical performance were collected during this study. In this prospective registry, the average patient age was 70.7 years; 61.5% were male and 90% had lesions with mild to severe calcium. The average lesion length was 72 mm. The Predator 360° was used followed by balloon angioplasty (mean 5.44 atms) in 86% of lesions. Average stenosis was 87.8% pre-procedure, 33.9% post-orbital and 9.6% post-adjunctive treatment. The CONFIRM II PREDATOR study validates the use of this iteration of orbital technology in restoring flow by changing lesion compliance, thus allowing low-pressure balloon angioplasty with limited complications and reduced need for bail-out stenting. These results were presented at the San Francisco Transcatheter Cardiovascular Therapeutics ( TCT) conference in November 2011.
Data from the CONFIRM DIAMONDBACK and PREDATOR registries were used to design the CONFIRM III OUTFLOW Post-Market Registry. This was the third study in the CONFIRM series to further evaluate acute procedural outcomes associated with use of the Diamondback 360°. Enrollment of 1,275 patients in the CONFIRM III OUTFLOW Post-Market Registry was completed in June 2011. In this prospective registry 59% were male with an average patient age of 72. Of the lesions treated, 42% were above the knee, 16% were behind the knee, 41% were below the knee, and 2% were unknown. The average lesion length was 69.6 mm. Lesions were treated with the Diamondback 360° or Predator 360° followed by low pressure balloon angioplasty, if desired. Pre-procedure stenosis was 87% and the average residual stenosis of 10% was achieved following orbital and adjunctive treatment. The dissection rate was 9.9%, bail-out stenting occurred in 6.0% of lesions, and there was a low perforation rate of 0.7%. The CONFIRM III OUTFLOW Registry provides additional evidence of the consistent results obtained using the Diamondback 360° or Predator 360° to treat difficult peripheral arterial disease.
The combined CONFIRM Series of 3,135 patients represents the largest PAD registry ever collected. The CONFIRM Series presented at the Vascular Intervention Advancements (VIVA) Conference in Las Vegas in October 2012 concluded that vessel preparation through compliance change with orbital atherectomy enables lower-pressure adjunctive balloon angioplasty leading to low procedural events while preserving future treatment options. The CONFIRM Series was published online in Catheterization and Cardiovascular Interventions in June 2013.
CSI continues to invest in clinical research through three peripheral studies currently underway. The LIBERTY 360, TRUTH and CLARITY clinical studies will investigate the Diamondback 360°'s acute and long term clinical outcomes, patient quality of life, comparative effectiveness and cost-effectiveness.
11
Table of Contents
ORBIT I Coronary Feasibility Safety Study
The ORBIT I feasibility study evaluated performance of the Diamondback 360° for the treatment of de novo calcified coronary lesions. The ORBIT I study completed in India in 2009 enrolled 50 patients. The endpoints were measured by device performance, MACE rate, and TLR at six months. Device performance success was 98%. The observed MACE rate at 30 days and at 6 months was 6% and 8% respectively. The 30-day and 6-month TLR was 2%. A single center follow-up of 33 patients demonstrated a MACE rate of 18.2% at three year follow up as presented at Cardiovascular Research Technologies (CRT) in Washington DC in April 2013. The ORBIT I study demonstrates that the Diamondback system can be used to modify de novo calcified coronary lesions and facilitated stent delivery in this difficult-to-treat plaque morphology. Results from the ORBIT I study were published in Catheterization and Cardiovascular Interventions in June 2013.
ORBIT II Coronary IDE Study
To commercialize the Diamondback 360° in the United States for use in the coronary arteries, we are required to conduct further clinical studies to evaluate the safety and effectiveness in treating calcified coronary lesions and obtain a PMA from the FDA. With FDA approval of the IDE in May 2010, the ORBIT II pivotal clinical study was initiated. Enrollment of 443 patients was completed in November 2012 and the PMA application was submitted to the FDA in March 2013. The average age of patients enrolled in the study was 71.4 years and 64.6% were male. The results of the study demonstrated that 92.8% of patients were free from severe angiographic complications. Post atherectomy stents were successfully delivered in 97.7% of the patients with a low core lab assessed final procedure mean residual stenosis of 4.7%. Most importantly, the ORBIT II study met the primary safety and efficacy endpoints by significant margins with success of 89.6% and 88.9%, respectively, compared to primary endpoint targets of 83.0% and 82.0%, respectively. The ORBIT II study also showed significantly lower rates of MACE and death. Results from the study were presented at the American College of Cardiology (ACC) in San Francisco in March 2013.
MACE Coronary Clinical Registry
The MACE study is a multi-center, prospective study to evaluate Major Adverse Coronary Events (MACE) along with target lesion revascularization and perforations in the treatment of moderate to severely calcified coronary lesions. This registry will include commercially available devices for revascularization involving stent deployment in de novo coronary lesions. The data from this registry will demonstrate the rate of calcification in the "real-world" setting as well as examine health care resource utilization.
Sales and Marketing
We market and sell our products through a direct sales force in the United States. Revenues for the PAD Systems for fiscal 2013 , fiscal 2012 and fiscal 2011 were $91.2 million , $73.0 million and $69.3 million , respectively. We have targeted sales and marketing efforts to interventional cardiologists, vascular surgeons and interventional radiologists with experience using similar catheter-based procedures, such as angioplasty, stenting, and cutting or laser atherectomy. Physician referral programs and peer-to-peer education are other key elements of our sales strategy. Patient referrals come from general practitioners, podiatrists, nephrologists and endocrinologists.
We target our marketing efforts to practitioners through physician education, medical conferences, seminars, peer-reviewed journals and marketing materials. Our sales and marketing program focuses on:
• | educating physicians regarding the proper use and application of the PAD Systems; |
• | clinical results showing safety and efficacy of products; |
• | educating physicians on the prevalence and complications of calcium in PAD; |
• | developing relationships with key opinion leaders; and |
• | facilitating regional referral marketing programs. |
We are not marketing our products internationally; however, we continue to evaluate international opportunities.
We executed a Purchasing Agreement with HealthTrust Purchasing Group, L.P., or HPG, that became effective on July 15, 2011. HPG acts as a group purchasing organization for the healthcare providers belonging to HPG as participants. Under the Purchasing Agreement, all of HPG's participants located in the United States or its territories are eligible to purchase the PAD Systems and related products at prices set forth in the Purchasing Agreement. HPG has agreed not to contract with more than one alternative supplier from which participants may purchase products comparable to ours under the agreement. During the term of the agreement, we have agreed to not solicit any HPG participant to enter into a separate agreement for our products.
12
Table of Contents
Research and Development
Our research and development efforts are focused in the development of products to penetrate our three key target markets: below and behind-the-knee, above-the-knee and coronary vessels. Research and development projects include the development of new products, enhancement of existing products, and PAD and coronary clinical trials. Research and development expenses for fiscal 2013 , fiscal 2012 and fiscal 2011 were $15.2 million , $11.4 million and $8.9 million , respectively.
Manufacturing
We use internally-manufactured and externally-sourced components to manufacture the PAD Systems. Most of the externally-sourced components are available from multiple suppliers; however, certain key components, including the diamond grit coated crown, and our ViperSlide Lubricant are single sourced. We have strategies and arrangements in place for procuring our key components from alternative suppliers in the event that one or more of our single source suppliers were to discontinue supplying us with a key component. We assemble the shaft, crown and handle components on-site, and test, pack, seal and label the finished assembly before sending the packaged product to a contract sterilization facility. Upon return from the sterilizer, the product is held in inventory prior to shipping to our customers.
Our manufacturing facility in Minnesota, including the shaft manufacturing and the controlled-environment assembly areas, is equipped to accommodate approximately 30,000 devices per shift annually. It also has storage capacity for approximately 8,000 devices and 100 Stealth 360˚ saline infusion pumps.
Our Pearland, Texas facility is 46,000 square feet and includes a custom-built clean room and production space for future expansion of value-add processes, including machining and electronics assembly. The facility, when it becomes fully staffed and equipped, will have the capacity to produce approximately 75,000 devices per shift annually. This facility has finished goods storage capacity for greater than 15,000 PAD Systems devices and other accessory products and over 500 Stealth 360° saline infusion pumps.
We are registered with the FDA as a medical device manufacturer. We have opted to maintain quality assurance and quality management certifications to enable us to market our products in the member states of the European Union, the European Free Trade Association and countries that have entered into Mutual Recognition Agreements with the European Union. We are ISO 13485:2003 certified, and our renewal is due by December 2015. Under these registrations, our plants
are audited by FDA and our Notified Body for the EU CE mark.
Third-Party Reimbursement and Pricing
Third-party payors, including private insurers, and government insurance programs, such as Medicare and Medicaid, pay for a significant portion of patient care provided in the United States. The single largest payor in the United States is the Medicare program, a federal governmental health insurance program administered by the Centers for Medicare and Medicaid Services, or CMS. Medicare covers certain medical care expenses for eligible elderly and disabled individuals, including a large percentage of the population with PAD who could be treated with the PAD Systems. In addition, private insurers often follow the coverage and reimbursement policies of Medicare. Consequently, Medicare's coverage and reimbursement policies are important to our operations.
CMS has established Medicare reimbursement codes describing atherectomy products and procedures using atherectomy products. We believe that physicians and hospitals that treat PAD with the PAD Systems will generally be eligible to receive reimbursement from Medicare and private insurers for the cost of the single-use catheter and the physician's services.
13
Table of Contents
Competition
The medical device industry is highly competitive, subject to rapid change and significantly affected by new product introductions and other activities of industry participants. The PAD Systems compete with a variety of other products or devices for the treatment of vascular disease, including stents, balloon angioplasty catheters and atherectomy catheters, as well as products used in vascular surgery. Large competitors in the stent and balloon angioplasty market segments include Abbott Laboratories, Boston Scientific, Cook Medical, Johnson & Johnson and Medtronic. We also compete against manufacturers of atherectomy catheters including, among others, Covidien, Spectranetics, Boston Scientific and MEDRAD, a business of Bayer HealthCare, as well as other manufacturers that may enter the market due to the increasing demand for treatment of vascular disease. Other competitors include pharmaceutical companies that manufacture drugs for the treatment of mild to moderate PAD and companies that provide products used by surgeons in peripheral bypass procedures. We are not aware of any competing catheter systems either currently on the market or in development that also use an orbital motion to create lumens larger than the catheter itself.
Because of the size of the peripheral opportunities, competitors and potential competitors have historically dedicated significant resources to aggressively promote their products. We believe that the PAD Systems compete primarily on the basis of:
• | safety and efficacy; |
• | predictable clinical performance; |
• | ease of use; |
• | price; |
• | physician relationships; |
• | customer service and support; and |
• | adequate third-party reimbursement. |
Patents and Intellectual Property
We rely on a combination of patent, copyright and other intellectual property laws, trade secrets, nondisclosure agreements and other measures to protect our proprietary rights. As of July 31, 2013, we held 32 issued U.S. patents and have 42 U.S. patent applications pending, as well as 118 issued or granted foreign patents and 133 foreign patent applications, each of which corresponds to aspects of our U.S. patents and applications. Our issued U.S. patents expire between 2012 and 2032, and our most important patents, U.S. Patent No. 6,494,890 and two key design patents covering our eccentric abrasive crown technology are due to expire on June 1, 2019, February 16, 2024 and December 29, 2023, respectively. In addition, we have many additional patents relating to our core technology currently pending in the USPTO which will extend our key covered subject matter and coverage dates significantly. Our issued patents and patent applications relate primarily to the design and operation of interventional atherectomy devices, including the PAD Systems. These patents and applications include claims covering key aspects of orbital atherectomy devices, including the design, manufacture and therapeutic use of certain atherectomy abrasive heads, drive shafts, control systems, handles and couplings. As we continue to research and develop our atherectomy technology, we intend to file additional U.S. and foreign patent applications related to the design, manufacture and therapeutic uses of atherectomy devices. In addition, we hold 14 registered U.S. trademarks, 14 registered marks in the Madrid Protocol, six registered marks in Europe, five registered marks in Canada, five registered marks in Mexico, and three registered marks in Hong Kong. We hold 11 trademark applications pending in the U.S, 12 trademark applications pending in Canada, six trademark applications pending in Hong Kong, and 16 trademark applications pending in India.
We also rely on trade secrets, technical know-how and continuing innovation to develop and maintain our competitive position. We seek to protect our proprietary information and other intellectual property by requiring our employees, consultants, contractors, outside scientific collaborators and other advisors to execute non-disclosure and assignment of invention agreements on commencement of their employment or engagement. Agreements with our employees also forbid them from bringing the proprietary rights of third parties to us. We also require confidentiality or material transfer agreements from third parties that receive our confidential data or materials.
Government Regulation of Medical Devices
Governmental authorities in the United States at the federal, state and local levels and in other countries extensively regulate, among other things, the development, testing, manufacture, labeling, promotion, advertising, distribution, marketing and export and import of medical devices such as the PAD Systems.
Failure to obtain approval to market our products under development and to meet the ongoing requirements of these regulatory authorities could prevent us from marketing and continuing to market our products.
14
Table of Contents
United States
The Federal Food, Drug, and Cosmetic Act, or FDCA, and the FDA's implementing regulations govern medical device design and development, preclinical and clinical testing, premarket clearance or approval, registration and listing, manufacturing, labeling, storage, advertising and promotion, sales and distribution, export and import, and post-market surveillance. Medical devices and their manufacturers are also subject to inspection by the FDA. The FDCA, supplemented by other federal and state laws, also provides civil and criminal penalties for violations of its provisions. We manufacture and market medical devices that are regulated by the FDA, comparable state agencies and regulatory bodies in other countries.
Unless an exemption applies, each medical device we wish to commercially distribute in the United States will require marketing authorization from the FDA prior to distribution. The two primary types of FDA marketing authorization are premarket notification (also called 510(k) clearance) and premarket approval (also called PMA approval). The type of marketing authorization applicable to a device - 510(k) clearance or PMA approval - is generally linked to classification of the device. The FDA classifies medical devices into one of three classes (Class I, II or III) based on the degree of risk FDA determines to be associated with a device and the extent of control deemed necessary to ensure the device's safety and effectiveness. Devices requiring fewer controls because they are deemed to pose lower risk are placed in Class I or II. Class I devices are deemed to pose the least risk and are subject only to general controls applicable to all devices, such as requirements for device labeling, premarket notification, and adherence to the FDA's current good manufacturing practice requirements, as reflected in its Quality System Regulation, or QSR. Class II devices are intermediate risk devices that are subject to general controls and may also be subject to special controls such as performance standards, product-specific guidance documents, special labeling requirements, patient registries or postmarket surveillance. Class III devices are those for which insufficient information exists to assure safety and effectiveness solely through general or special controls, and include life-sustaining, life-supporting or implantable devices, and devices not "substantially equivalent" to a device that is already legally marketed.
Most Class I devices and some Class II devices are exempted by regulation from the 510(k) clearance requirement and can be marketed without prior authorization from FDA. Class I and Class II devices that have not been so exempted are eligible for marketing through the 510(k) clearance pathway. By contrast, devices placed in Class III generally require PMA approval prior to commercial marketing. The PMA approval process is generally more stringent, time-consuming and expensive than the 510(k) clearance process.
510(k) Clearance. To obtain 510(k) clearance for a medical device, an applicant must submit a premarket notification to the FDA demonstrating that the device is "substantially equivalent" to a predicate device legally marketed in the United States. A device is substantially equivalent if, with respect to the predicate device, it has the same intended use and has either (i) the same technological characteristics or (ii) different technological characteristics and the information submitted demonstrates that the device is as safe and effective as a legally marketed device and does not raise different questions of safety or effectiveness. A showing of substantial equivalence sometimes, but not always, requires clinical data. Generally, the 510(k) clearance process can exceed 90 days and may extend to a year or more.
After a device has received 510(k) clearance for a specific intended use, any modification that could significantly affect its safety or effectiveness, such as a significant change in the design, materials, method of manufacture or intended use, will require a new 510(k) clearance or PMA approval (if the device as modified is not substantially equivalent to a legally marketed predicate device). The determination as to whether new authorization is needed is initially left to the manufacturer; however, the FDA may review this determination to evaluate the regulatory status of the modified product at any time and may require the manufacturer to cease marketing and recall the modified device until 510(k) clearance or PMA approval is obtained. The manufacturer may also be subject to significant regulatory fines or penalties.
We received 510(k) clearance for use of the Diamondback 360° as a therapy in patients with PAD in the United States on August 22, 2007. We received additional 510(k) clearances for the control unit used with the Diamondback 360° on October 25, 2007 and for the solid crown version of the Diamondback 360° on November 9, 2007. We were granted 510(k) clearance of the Predator 360° in March 2009 and Stealth 360° in March 2011.
Premarket Approval. A PMA application requires the payment of significant user fees and must be supported by valid scientific evidence, which typically requires extensive data, including technical, preclinical, clinical and manufacturing data, to demonstrate to the FDA's satisfaction the safety and efficacy of the device. A PMA application must also include a complete description of the device and its components, a detailed description of the methods, facilities and controls used to manufacture the device, and proposed labeling. After a PMA application is submitted and found to be sufficiently complete, the FDA begins an in-depth review of the submitted information. During this review period, the FDA may request additional information or clarification of information already provided. Also during the review period, an advisory panel of experts from outside the FDA may be convened to review and evaluate the application and provide recommendations to the FDA as to the approvability of the device. In addition, the FDA will conduct a pre-approval inspection of the manufacturing facilities to ensure compliance with the FDA's Quality System Regulations, or QSR, which requires manufacturers to follow design, testing, control, documentation and other quality assurance procedures.
15
Table of Contents
FDA review of a PMA application is required by statute to take no longer than 180 days, although the process typically takes significantly longer, and may require several years to complete. The FDA can delay, limit or deny approval of a PMA application for many reasons, including:
• | the systems may not be safe or effective to the FDA's satisfaction; |
• | the data from preclinical studies and clinical trials may be insufficient to support approval; |
• | the manufacturing process or facilities used may not meet applicable requirements; and |
• | changes in FDA approval policies or adoption of new regulations may require additional data. |
If the FDA evaluations of both the PMA application and the manufacturing facilities are favorable, the FDA will either issue an approval letter or an approvable letter, which usually contains a number of conditions that must be met in order to secure final approval of the PMA. When and if those conditions have been fulfilled to the satisfaction of the FDA, the agency will issue a PMA approval letter authorizing commercial marketing of the device for certain indications. If the FDA's evaluation of the PMA or manufacturing facilities is not favorable, the FDA will deny approval of the PMA or issue a not approvable letter. The FDA may also determine that additional clinical trials are necessary, in which case the PMA approval may be delayed for several months or years while the trials are conducted and then the data submitted in an amendment to the PMA. Even if a PMA application is approved, the FDA may approve the device with an indication that is narrower or more limited than originally sought. The agency can also impose restrictions on the sale, distribution or use of the device as a condition of approval, or impose post approval requirements such as continuing evaluation and periodic reporting on the safety, efficacy and reliability of the device for its intended use.
New PMA applications or PMA supplements may be required for modifications to the manufacturing process, labeling, device specifications, materials or design of a device that is approved through the PMA process. PMA approval supplements often require submission of the same type of information as an initial PMA application, except that the supplement is limited to information needed to support any changes from the device covered by the original PMA application and may not require as extensive clinical data or the convening of an advisory panel.
We have completed the enrollment of patients in an FDA approved IDE trial to support a PMA to use the Diamondback 360° as a therapy in treating patients with calcified coronary artery disease. The FDA granted unconditional approval in April 2010 to begin the ORBIT II coronary trial in the United States. This pivotal trial was set up in two phases; Phase I allowed us to enroll up to 100 patients at as many as 50 U.S. sites, Phase II allowed us to expand the trial to the full complement of 429 patients. In May 2011, we received approval from the FDA to complete enrollment of 429 patients in our ORBIT II clinical trial for a coronary application for the Diamondback 360°, which followed the FDA's review of data from the first 50 cases in the ORBIT II trial. In July 2012, we received approval from the FDA to include the new electric coronary device (similar to Stealth 360° technology used in PAD and customized specifically for the coronary application), which improves ease of use. The FDA required 100 enrollments with the new electric coronary device and would have allowed up to 50 additional patients in the trial, as needed, to achieve that enrollment level. A total of 443 patients were enrolled in the trial.
Clinical Trials. Clinical trials are almost always required to support a PMA application and are sometimes required for a 510(k) clearance. These trials generally require submission of an application for an IDE to the FDA. The IDE application must be supported by appropriate data, such as animal and laboratory testing results, showing that it is safe to test the device in humans and that the testing protocol is scientifically sound. The IDE application must be approved in advance by the FDA for a specified number of patients, unless the product is deemed a non- significant risk device and eligible for more abbreviated IDE requirements. Generally, clinical trials for a significant risk device may begin once the IDE application is approved by the FDA and the study protocol and informed consent are approved by appropriate institutional review boards at the clinical trial sites.
FDA approval of an IDE allows clinical testing to go forward but does not bind the FDA to accept the results of the trial as sufficient to prove the product's safety and efficacy, even if the trial meets its intended success criteria. With certain exceptions, changes made to an investigational plan after an IDE is approved must be submitted in an IDE supplement and approved by FDA (and by governing institutional review boards when appropriate) prior to implementation.
All clinical trials must be conducted in accordance with regulations and requirements collectively known as good clinical practice. Good clinical practices include the FDA's IDE regulations, which describe the conduct of clinical trials with medical devices, including the recordkeeping, reporting and monitoring responsibilities of sponsors and investigators, and labeling of investigation devices. They also prohibit promotion, test marketing or commercialization of an investigational device and any representation that such a device is safe or effective for the purposes being investigated. Good clinical practices also include the FDA's regulations for institutional review board approval and for protection of human subjects (such as informed consent), as well as disclosure of financial interests by clinical investigators.
16
Table of Contents
Required records and reports are subject to inspection by the FDA. The results of clinical testing may be unfavorable or, even if the intended safety and efficacy success criteria are achieved, may not be considered sufficient for the FDA to grant approval or clearance of a product. The commencement or completion of any clinical trials may be delayed or halted, or be inadequate to support approval of a PMA application or clearance of a premarket notification for numerous reasons, including, but not limited to, the following:
• | the FDA or other regulatory authorities do not approve a clinical trial protocol or a clinical trial (or a change to a previously approved protocol or trial that requires approval), or place a clinical trial on hold; |
• | patients do not enroll in clinical trials or follow up at the rate expected; |
• | patients do not comply with trial protocols or experience greater than expected adverse side effects; |
• | institutional review boards and third-party clinical investigators may delay or reject the trial protocol or changes to the trial protocol; |
• | third-party clinical investigators decline to participate in a trial or do not perform a trial on the anticipated schedule or consistent with the clinical trial protocol, investigator agreements, good clinical practices or other FDA requirements; |
• | third-party organizations do not perform data collection and analysis in a timely or accurate manner; |
• | regulatory inspections of the clinical trials or manufacturing facilities, which may, among other things, require corrective action or suspension or termination of the clinical trials; |
• | changes in governmental regulations or administrative actions; |
• | the interim or final results of the clinical trial are inconclusive or unfavorable as to safety or efficacy; and |
• | the FDA concludes that the trial design is inadequate to demonstrate safety and efficacy. |
Continuing Regulation. After a device is approved and placed in commercial distribution, numerous regulatory requirements continue to apply. These include:
• | establishment registration and device listing upon the commencement of manufacturing; |
• | the QSR, which requires manufacturers, including third-party manufacturers, to follow design, testing, control, documentation and other quality assurance procedures during medical device design and manufacturing processes; |
• | labeling regulations, which prohibit the promotion of products for unapproved or "off-label" uses and impose other restrictions on labeling and promotional activities; |
• | medical device reporting regulations, which require that manufacturers report to the FDA if a device may have caused or contributed to a death or serious injury or malfunctioned in a way that would likely cause or contribute to a death or serious injury if malfunctions were to recur; |
• | corrections and removal reporting regulations, which require that manufacturers report to the FDA field corrections; and |
• | product recalls or removals if undertaken to reduce a risk to health posed by the device or to remedy a violation of the FDCA caused by the device that may present a risk to health. |
Since commercialization, we have had three minor instances of recall, involving a single lot of Diamondback 360° devices (8 units), two boxes of ViperWire products (10 wires), and 70 lots of Stealth 360º devices (145 units), related to "Use By" date labeling issues. While these recalls were reported to the FDA, according to regulations, they did not present a risk to patient safety. A separate recall, initiated in 2009 and completed in 2010, involved the ViperSheath, which is owned and manufactured by Thomas Medical Products. As the distributor for the ViperSheath, we were required to recall all unused units from our customers and return them to Thomas Medical Products. All of the unused ViperSheath products were captured and subsequently destroyed by Thomas Medical Products, with FDA observance. We also completed a recall in 2012 involving six lots of Stealth 360º micro crown devices (45 units) due to the potential for an insufficient solder bond. All unused devices were returned and no patient injuries resulted from this recall.
In addition, the FDA may require a company to conduct postmarket surveillance studies or order it to establish and maintain a system for tracking its products through the chain of distribution to the patient level.
Failure to comply with applicable regulatory requirements, including those applicable to the conduct of clinical trials, can result in enforcement action by the FDA, which may lead to any of the following sanctions:
• | warning letters or untitled letters; |
• | fines, injunctions and civil penalties; |
• | product recall or seizure; |
• | unanticipated expenditures; |
• | delays in clearing or approving or refusal to clear or approve products; |
17
Table of Contents
• | withdrawal or suspension of FDA approval; |
• | orders for physician notification or device repair, replacement or refund; |
• | operating restrictions, partial suspension or total shutdown of production or clinical trials; and |
• | criminal prosecution. |
We and our contract manufacturers, specification developers and suppliers are also required to manufacture our products in compliance with current Good Manufacturing Practice, or GMP, requirements set forth in the QSR.
The QSR requires a quality system for the design, manufacture, packaging, labeling, storage, installation and servicing of marketed devices, and includes extensive requirements with respect to quality management and organization, device design, buildings, equipment, purchase and handling of components, production and process controls, packaging and labeling controls, device evaluation, distribution, installation, complaint handling, servicing and record keeping. The FDA enforces the QSR through periodic announced and unannounced inspections that may include the manufacturing facilities of subcontractors. If the FDA believes that we or any of our contract manufacturers or regulated suppliers is not in compliance with these requirements, it can shut down our manufacturing operations, require recall of our products, refuse to clear or approve new marketing applications, institute legal proceedings to detain or seize products, enjoin future violations or assess civil and criminal penalties against us or our officers or other employees. Any such action by the FDA would have a material adverse effect on our business.
Fraud and Abuse
Our operations will be directly, or indirectly through our customers, subject to various state and federal fraud and abuse laws, including, without limitation, the FDCA, federal Anti-Kickback Statute and False Claims Act. These laws may impact, among other things, our proposed sales, marketing, and education programs. In addition, these laws require us to screen individuals and other companies, suppliers and vendors in order to ensure that they are not "debarred" by the federal government and therefore prohibited from doing business in the healthcare industry.
The federal Anti-Kickback Statute prohibits persons from knowingly and willfully soliciting, offering, receiving or providing remuneration, directly or indirectly, in exchange for or to induce either the referral of an individual, or the furnishing or arranging for a good or service, for which payment may be made under a federal healthcare program such as the Medicare and Medicaid programs. Several courts have interpreted the statute's intent requirement to mean that if any one purpose of an arrangement involving remuneration is to induce referrals of federal healthcare covered business, the statute has been violated. The Anti-Kickback Statute is broad and prohibits many arrangements and practices that are lawful in businesses outside of the healthcare industry. Many states have also adopted laws similar to the federal Anti-Kickback Statute, some of which apply to the referral of patients for healthcare items or services reimbursed by any source, not only the Medicare and Medicaid programs.
The federal False Claims Act prohibits persons from knowingly filing or causing to be filed a false claim to, or the knowing use of false statements to obtain payment from, the federal government. Various states have also enacted laws modeled after the federal False Claims Act.
In addition to the laws described above, the Health Insurance Portability and Accountability Act of 1996 created two new federal crimes: healthcare fraud and false statements relating to healthcare matters. The healthcare fraud statute prohibits knowingly and willfully executing a scheme to defraud any healthcare benefit program, including private payors. The false statements statute prohibits knowingly and willfully falsifying, concealing or covering up a material fact or making any materially false, fictitious or fraudulent statement in connection with the delivery of or payment for healthcare benefits, items or services.
The federal Physician Payments Sunshine Act, or the Sunshine Act, was enacted by Congress in 2010 as part of the comprehensive health care reform legislation, and the implementing Open Payment regulations, released in February 2013, require persons to begin collecting certain data on payments and other transfers of value to physicians and teaching hospitals beginning in August 2013 for public reporting by the end of March 2014. It is widely anticipated that public reporting under the Sunshine Act and implementing Open Payment regulations will result in increased scrutiny of the financial relationships between industry, physicians and teaching hospitals.
Voluntary industry codes, federal guidance documents and a variety of state laws address the tracking and reporting of marketing practices relative to gifts given and other expenditures made to doctors and other healthcare professionals. In addition to impacting our marketing and educational programs, internal business processes will be affected by the numerous legal requirements and regulatory guidance at the state, federal and industry levels.
18
Table of Contents
International Regulation
International sales of medical devices are subject to foreign government regulations, which may vary substantially from country to country. The time required to obtain approval in a foreign country may be longer or shorter than that required for FDA approval and the requirements may differ. For example, the primary regulatory environment in Europe with respect to medical devices is that of the European Union, which includes most of the major countries in Europe. Other countries, such as Switzerland, have voluntarily adopted laws and regulations that mirror those of the European Union with respect to medical devices. The European Union has adopted numerous directives and standards regulating the design, manufacture, clinical trials, labeling and adverse event reporting for medical devices. Devices that comply with the requirements of a relevant directive will be entitled to bear the CE conformity marking, indicating that the device conforms to the essential requirements of the applicable directives and, accordingly, can be commercially distributed throughout the European Union, although actual implementation of these directives may vary on a country-by-country basis. The method of assessing conformity varies depending on the class of the product, but normally involves a combination of submission of a design dossier, self-assessment by the manufacturer, a third-party assessment and, review of the design dossier by a "Notified Body." This third-party assessment generally consists of an audit of the manufacturer's quality system and manufacturing site, as well as review of the technical documentation used to support application of the CE Mark to one's product and possibly specific testing of the manufacturer's product. An assessment by a Notified Body of one country within the European Union is required in order for a manufacturer to commercially distribute the product throughout the European Union. We obtained CE marking approval for sale of the Diamondback 360° in May 2005.
Environmental Regulation
Our operations are subject to regulatory requirements relating to the environment, waste management and health and safety matters, including measures relating to the release, use, storage, treatment, transportation, discharge, disposal and remediation of hazardous substances. We are currently classified and licensed as a Very Small Quantity Hazardous Waste Generator within Ramsey County, Minnesota. There are no regulated wastes requiring licensing in our Texas facility.
Employees
As of June 30, 2013 , we had 345 employees, including 79 employees in manufacturing, 174 employees in sales, 18 employees in marketing, 25 employees in clinical, 29 employees in general and administrative, and 20 employees in research and development, all of which are full-time employees. None of our employees are represented by a labor union or are parties to a collective bargaining agreement, and we believe that our employee relations are good.
Item 1A. Risk Factors .
Risks Relating to Our Business and Operations
We have a history of net losses and a short commercialization experience, and we are likely to continue to incur losses.
We are not profitable and have incurred net losses in each fiscal year since our formation in 1989. In particular, we had net losses of $24.0 million in fiscal 2013 , $16.8 million in fiscal 2012 , and $11.1 million in fiscal 2011 . As of June 30, 2013 , we had an accumulated deficit of approximately $203.3 million . We commenced commercial sales of the Diamondback 360° in September 2007, and our short commercialization experience makes it difficult for us to predict future performance. We also expect to incur significant additional expenses for sales and marketing, research and development and manufacturing as we continue to commercialize the PAD Systems and additional expenses as we seek to develop and commercialize future versions of the PAD Systems, a coronary application for our technology, and other products. Additionally, we expect that our general and administrative expenses will increase as our business grows. As a result, our operating losses are likely to continue.
We may be unable to sustain our revenue growth.
Our revenue has grown in each of the fiscal years since we commenced commercial sales of the Diamondback 360° in September 2007. Our ability to continue to increase our revenues in future periods will depend on our ability to increase sales of the PAD Systems and new and improved products we introduce, including growing our customer base and reorders from those customers, and obtaining new applications for our technology. The extent of our future success will also depend on our ability to successfully obtain regulatory approval for and successfully commercialize our technology for coronary applications. We may not be able to generate, sustain or increase revenues on a quarterly or annual basis. If we cannot achieve or sustain revenue growth for an extended period, our financial results will be adversely affected and our stock price may decline.
19
Table of Contents
Economic conditions may adversely affect our business.
Adverse worldwide economic conditions may have adverse implications on our business. A significant change in the liquidity or financial condition of our customers could cause unfavorable trends in their purchases and also in our receivable collections and additional allowances may be required, which could adversely affect our operating results. Adverse worldwide economic conditions may also adversely impact our suppliers' ability to provide us with materials and components, which could adversely affect our business and operating results.
The PAD Systems and future products may never achieve broad market acceptance.
The PAD Systems and future products we may develop may never gain broad market acceptance among physicians, patients and the medical community. The degree of market acceptance of any of our products will depend on a number of factors, including:
• | the actual and perceived effectiveness and reliability of our products; |
• | the prevalence and severity of any adverse patient events involving our products; |
• | the results of any clinical trials relating to use of our products, including coronary applications; |
• | the availability, relative cost and perceived advantages and disadvantages of alternative technologies or treatment methods for conditions treated by our products; |
• | the degree to which treatments using our products are approved for reimbursement by public and private insurers; |
• | the degree to which physicians adopt the PAD Systems; |
• | the extent to which we are successful in educating physicians about PAD in general and the existence of the PAD Systems in particular; |
• | the strength of our marketing and distribution infrastructure; and |
• | the level of education and awareness among physicians and hospitals concerning our products. |
Failure of the PAD Systems to significantly penetrate current or new markets would negatively impact our business, financial condition and results of operations.
Our customers may not be able to achieve adequate reimbursement for using the PAD Systems, which could affect the acceptance of our products and cause our business to suffer.
The availability of insurance coverage and reimbursement for newly approved medical devices and procedures is uncertain. The commercial success of our products is substantially dependent on whether third-party insurance coverage and reimbursement for the use of such products and related services are available. We expect the PAD Systems to continue to be purchased by hospitals and other providers who will then seek reimbursement from various public and private third-party payors, such as Medicare, Medicaid and private insurers, for the services provided to patients. While third-party payors are currently providing reimbursement for use of the PAD Systems, we can give no assurance that these third-party payors will continue to provide adequate reimbursement for use of the PAD Systems to permit hospitals and doctors to consider the products cost-effective for patients requiring PAD treatment, or that current reimbursement levels for the PAD Systems will continue. In particular, the Centers for Medicaid and Medicare Services has proposed reductions in reimbursement levels for office-based labs that, if implemented, could adversely affect our business. In addition, the overall amount of reimbursement available for PAD treatment could decrease in the future. Failure by hospitals and other users of our products to obtain sufficient reimbursement could cause our business to suffer.
Medicare, Medicaid, health maintenance organizations and other third-party payors are increasingly attempting to contain healthcare costs by limiting both coverage and the level of reimbursement, and, as a result, they may not cover or provide adequate payment for use of the PAD Systems. In order to position the PAD Systems for acceptance by third-party payors, we may have to agree to lower prices than we might otherwise charge.
Governmental and private sector payors have instituted initiatives to limit the growth of healthcare costs using, for example, price regulation or controls and competitive pricing programs. Some third-party payors also require demonstrated superiority, on the basis of randomized clinical trials, or pre-approval of coverage, for new or innovative devices or procedures before they will reimburse healthcare providers who use such devices or procedures. It is uncertain whether the PAD Systems or any future products we may develop will be viewed as sufficiently cost-effective to warrant adequate coverage and reimbursement levels.
If third-party coverage and reimbursement for the PAD Systems is limited or not available, the acceptance of the PAD Systems and, consequently, our business will be substantially harmed.
20
Table of Contents
Healthcare reform legislation could adversely affect our operating results and financial condition.
There have been and continue to be proposals by the federal government, state governments, regulators and third-party payors to control healthcare costs and, more generally, to reform the U.S. healthcare system, some of which have been enacted into law, such as the Patient Protection and Affordable Care Act, or the Patient Act. The Patient Act imposes significant new taxes on medical device makers and these taxes will adversely affect our financial results. The Patient Act and any additional healthcare proposals and laws that may be enacted in the future could also limit the prices we are able to charge for our products or the amounts of reimbursement available for our products and could limit the acceptance and availability of our products. The Patient Act and future healthcare legislation could adversely affect our revenue and financial condition.
Our financial performance may be adversely affected by medical device tax provisions in the health care reform legislation.
The imposition of the 2.3% medical device excise tax enacted as part of the Patient Act may require us to identify ways to reduce spending in other areas or raise additional capital to offset the expected increased expense. We do not expect to be able to pass along the cost of the tax to our customers or to be able to offset the cost of the tax through higher sales volumes resulting from the expansion of health insurance coverage because of the demographics of the current uninsured population. The level of difficulty in terms of complying with the medical device tax will depend on the regulations put forth by the U.S. Department of Treasury. Ongoing implementation of this legislation could have a material adverse effect on our results of operations and cash flows.
We have limited data and experience regarding the safety and efficacy of the PAD Systems. Any long-term data that is generated may not be positive or consistent with our limited short-term data, which would affect market acceptance of these products.
Because our technology is relatively new in the treatment of PAD, we have performed clinical trials only with limited patient populations. The long-term effects of using the PAD Systems in a large number of patients have not been studied and the results of short-term clinical use of the PAD Systems do not necessarily predict long-term clinical benefit or reveal long-term adverse effects.
Clinical trials conducted with the PAD Systems have involved procedures performed by physicians who are very technically proficient. Consequently, both short and long-term results reported in these studies may be significantly more favorable than typical results achieved by physicians, which could negatively impact market acceptance of the PAD Systems.
We face significant competition, must innovate to stay competitive, and may be unable to sell the PAD Systems at profitable levels.
The market for medical devices is highly competitive, dynamic and marked by rapid and substantial technological development and product innovation. Our ability to compete depends on our ability to innovate successfully, and while certain barriers exist to entry into our market we cannot assure that new entrants or existing competitors will not be able to develop products that compete directly with our products. We compete against very large and well-known stent and balloon angioplasty device manufacturers, atherectomy catheter manufacturers, pharmaceutical companies, and companies that provide products used by surgeons in peripheral bypass procedures. We may have difficulty competing effectively with these competitors because of their well-established positions in the marketplace, significant financial and human capital resources, established reputations and worldwide distribution channels.
Our competitors may:
• | develop and patent processes or products earlier than we will; |
• | obtain regulatory clearances or approvals for competing medical device products more rapidly than we will; |
• | market their products more effectively than we will; or |
• | develop more effective or less expensive products or technologies that render our technology or products obsolete or non-competitive. |
We have encountered and expect to continue to encounter potential customers who, due to existing relationships with our competitors, are committed to or prefer the products offered by these competitors. If we are unable to compete successfully, our revenue will suffer. Increased competition might lead to price reductions and other concessions that might adversely affect our operating results. Competitive pressures may decrease the demand for our products and could adversely affect our financial results.
21
Table of Contents
We have limited commercial manufacturing experience and could experience difficulty in producing the PAD Systems or may need to depend on third parties to manufacture the products.
We have limited experience in commercially manufacturing the PAD Systems and have no experience manufacturing these products in the volume that we anticipate will be required if we achieve planned levels of commercial sales. As a result, we may not be able to develop and implement efficient, low-cost manufacturing capabilities and processes that will enable us to manufacture the PAD Systems or future products in significant volumes, while meeting the legal, regulatory, quality, price, durability, engineering, design and production standards required to market our products successfully.
The forecasts of demand we use to determine order quantities and lead times for components purchased from outside suppliers may be incorrect. Our failure to obtain required components or subassemblies when needed and at a reasonable cost would adversely affect our business.
In addition, we may in the future need to depend upon third parties to manufacture the PAD Systems and future products. Any difficulties in locating and hiring third-party manufacturers, or in the ability of third-party manufacturers to supply quantities of our products at the times and in the quantities we need, could have a material adverse effect on our business.
We depend upon third-party suppliers, including single source suppliers to us and our customers, making us vulnerable to supply problems and price fluctuations.
We rely on third-party suppliers to provide us with certain components of our products and to provide key components or supplies to our customers for use with our products. We rely on single source suppliers for certain components of the PAD Systems. We depend on our suppliers to provide us and our customers with materials in a timely manner that meet our and their quality, quantity and cost requirements. These suppliers may encounter problems during manufacturing for a variety of reasons, any of which could delay or impede their ability to meet our demand and our customers' demands.
Any supply interruption from our suppliers or failure to obtain additional suppliers for any of the components used in our products would limit our ability to manufacture our products and could have a material adverse effect on our business, financial condition and results of operations.
We may need to increase the size of our organization and we may experience difficulties managing growth. If we are unable to manage the anticipated growth of our business, our future revenue and operating results may be adversely affected.
The growth we may experience in the future may provide challenges to our organization, requiring us to rapidly expand our sales and marketing personnel and manufacturing operations. Rapid expansion in personnel may result in less experienced people producing and selling our products, which could result in unanticipated costs and disruptions to our operations. If we cannot scale and manage our business appropriately, our anticipated growth may be impaired and our financial results will suffer.
We may require additional financing, and our failure to obtain additional financing when needed could force us to delay, reduce or eliminate our product development programs or commercialization efforts.
We may be dependent on additional financing to execute our business plan. Additional funds may not be available when we need them on terms that are acceptable to us, or at all. In the event we need or desire additional financing, we may be unable to obtain it by borrowing money in the credit markets or raising money in the capital markets. If adequate funds are not available on a timely basis, we may terminate or delay the development of one or more of our products, or delay establishment of sales and marketing capabilities or other activities necessary to commercialize our products.
We face a risk of non-compliance with the financial covenants in our loan and security agreements with Silicon Valley Bank and Partners for Growth.
We are party to loan and security agreements with Silicon Valley Bank and Partners for Growth. These agreements require us to maintain, among other things, a monthly specified liquidity ratio and contain customary events of default, including, among others, the failure to comply with certain covenants or other agreements. Upon the occurrence and during the continuation of an event of default, amounts due under the agreements may be accelerated by Silicon Valley Bank or Partners for Growth. If we are unable to meet the financial or other covenants under the current loan and security agreements or negotiate future waivers or amendments of such covenants, events of default could occur under the agreements. Upon the occurrence and during the continuance of an event of default under the agreements, Silicon Valley Bank and Partners for Growth have available a range of remedies customary in these circumstances, including declaring all outstanding debt, together with accrued and unpaid interest thereon, to be due and payable, foreclosing on the assets securing the agreements and/or ceasing to provide additional loans, which could have a material adverse effect on us.
22
Table of Contents
The restrictive covenants under these agreements could limit our ability to obtain future financing, withstand a future downturn in our business or the economy in general or otherwise conduct necessary corporate activities. The financial and restrictive covenants contained in the agreements could also adversely affect our ability to respond to changing economic and business conditions and place us at a competitive disadvantage relative to other companies that may be subject to fewer restrictions. Transactions that we may view as important opportunities, such as acquisitions, may be subject to the consent of Silicon Valley Bank and Partners for Growth, which consents may be withheld or granted subject to conditions specified at the time that may affect the attractiveness or viability of the transaction.
We are dependent on our senior management team and highly skilled personnel, and our business could be harmed if we are unable to attract and retain personnel necessary for our success.
We are highly dependent on our senior management. Our success will depend on our ability to retain senior management and to attract and retain qualified personnel in the future, including scientists, clinicians, engineers and other highly skilled personnel and to integrate current and additional personnel in all departments. The loss of members of our senior management, scientists, clinical and regulatory specialists, engineers and sales personnel could prevent us from achieving our objectives of continuing to grow our company. We do not carry key person life insurance on any of our employees.
Our stock price is volatile and subject to significant fluctuations.
The market price of our common stock could be subject to significant fluctuations. Market prices for securities of early-stage pharmaceutical, medical device, biotechnology and other life sciences companies have historically been particularly volatile. Our common stock traded as low as $8.60 and as high as $22.67 per share during the 12-month period ended June 30, 2013 . Factors that may cause the market price of our common stock to fluctuate include, but are not limited to:
• | announcements of technological or medical innovations for the treatment of vascular disease; |
• | quarterly variations in our or our competitors' results of operations; |
• | failure to meet estimates or recommendations by securities analysts who cover our stock; |
• | accusations that we have violated a law or regulation; |
• | sales of large blocks of our common stock, including sales by our executive officers, directors and significant stockholders; |
• | changes in accounting principles; and |
• | general market conditions and other factors, including factors unrelated to our operating performance or the operating performance of our competitors. |
Moreover, the stock markets in general have experienced substantial volatility that has often been unrelated to the operating performance of individual companies. These broad market fluctuations may also adversely affect the trading price of our common stock.
Our ability to use our net operating loss carryforwards and certain other tax attributes may be limited.
Under Sections 382 and 383 of the Internal Revenue Code of 1986, as amended, or Code, if a corporation undergoes an "ownership change," the corporation's ability to use its pre-change net operating loss carryforwards and other pre-change tax attributes, such as research tax credits, to offset its post-change income may be limited. In general, an "ownership change" will occur if there is a cumulative change in our ownership by "5-percent shareholders" that exceeds 50 percentage points over a rolling three-year period. Similar rules may apply under state tax laws. We may have experienced an ownership change in the past and we may also experience ownership changes in the future as a result of future transactions in our stock, some of which may be outside our control. As a result, if we earn net taxable income, our ability to use our pre-change net operating loss carryforwards or other pre-change tax attributes to offset United States federal and state taxable income may be subject to limitations.
Risks Related to Government Regulation
Our ability to market the PAD Systems in the United States is limited to use as a therapy in patients with PAD, and if we want to expand our marketing claims, we will need to file for additional FDA clearances or approvals and conduct further clinical trials, which would be expensive and time consuming and may not be successful.
The PAD Systems received FDA 510(k) clearances in the United States for use as a therapy in patients with PAD. This general clearance restricts our ability to market or advertise the PAD Systems beyond this use and could affect our growth.
23
Table of Contents
If we determine to market our orbital technology in the United States for other uses, we would need to conduct further clinical trials and obtain premarket approval from the FDA. For example, we recently completed clinical trials for use of our devices in the coronary arteries. Clinical trials are complex, expensive, time consuming, uncertain and subject to substantial and unanticipated delays. There is no assurance that we will be able to obtain FDA approval to use our orbital atherectomy technology for the treatment of coronary artery disease or for applications other than the treatment of PAD.
We are or will be subject to an extensive set of post-market controls that apply to us as we commercialize our products, including annual PMA reports, Medical Device Reports (MDRs) on serious adverse events, complaint handling and analysis under the FDA's Quality System Regulation, or QSR, export controls, advertising and promotion requirements, and potential post-market studies required by the FDA.
We and our suppliers are also subject to regulation by various state authorities, which may inspect our or our suppliers' facilities and manufacturing processes and enforce state regulations. Failure to comply with applicable state regulations may result in seizures, injunctions or other types of enforcement actions.
Our promotion of the PAD Systems is closely controlled by the FDA and enforcement activities could limit our ability to inform potential customers of the features of the products.
We may not receive FDA approval to market our orbital atherectomy technology for use in coronary arteries or we may be significantly delayed in obtaining such approval or such approval may be subject to limitations or other requirements.
We are required to file a PMA application with the FDA and obtain the FDA's approval before we are permitted to begin marketing our orbital atherectomy technology for use in treating coronary artery disease. We completed our PMA application on March 15, 2013. The FDA will review our PMA application to evaluate the safety and effectiveness of our device in treating coronary artery disease. The FDA may conclude that our device does not meet appropriate standards of safety and effectiveness and may not grant the approval necessary to market our device for use in coronary arteries in the United States. Our business will be adversely affected if we are unable to obtain such FDA approval.
The length of time required for the FDA's review will depend upon factors over which we have no control, including whether the FDA submits the review to a panel of independent experts in which case the review is likely to take longer than if the review is not submitted to a panel. We cannot predict when the FDA will complete its review, and even if approval is ultimately granted, such approval may be significantly delayed. Any delay in obtaining such FDA approval would delay the commercialization of our coronary application, which would adversely affect our business.
If the FDA approves our orbital atherectomy product for treatment of coronary artery disease, we will be subject to all the postmarket requirements for PMA products, such as an annual report. Our manufacturing processes, post-approval clinical data and promotional activities for such product will be subject to continual review and periodic inspections by the FDA and other regulatory bodies. Even if FDA approval is granted, the approval may be subject to limitations on the indicated uses for which the product may be marketed or contain requirements for costly post-marketing testing and surveillance to monitor the safety or effectiveness of the product. Later discovery of previously unknown problems with the use of orbital atherectomy in coronary arteries, including unanticipated adverse events or adverse events of unanticipated severity or frequency, manufacturer or manufacturing processes, or failure to comply with regulatory requirements, may result in restrictions on such products or manufacturing processes, withdrawal of the product from the market, voluntary or mandatory recall, fines, suspension of regulatory approvals, product seizures, injunctions or the imposition of civil or criminal penalties.
The PAD Systems may in the future be subject to product recalls that could harm our reputation and product liability claims that could exceed the limits of available insurance coverage.
The FDA and similar governmental authorities in other countries have the authority to require the recall of commercialized products in the event of material regulatory deficiencies or defects in design or manufacture. For example, since commercialization, we have had minor instances of recall involving a single lot of Diamondback 360° devices, two boxes of ViperWire products, and 70 lots of Stealth 360º devices, related to "Use By" date labeling issues; a recall of unused ViperSheath products, which we formerly distributed for Thomas Medical Products; and a recall involving six lots of Stealth 360º micro crown devices due to the potential for an insufficient solder bond. Any recalls of our products or products that we distribute would divert managerial and financial resources, harm our reputation with customers and have an adverse effect on our financial condition and results of operations.
Also, if the PAD Systems are defectively designed, manufactured or labeled, contain defective components or are misused, we may become subject to costly litigation by our customers or their patients. The use, misuse or off-label use of the PAD Systems may result in injuries that lead to product liability suits, which could be costly to our business. We cannot prevent a physician from using the PAD Systems for off-label applications. While we have product liability insurance coverage for our products and intend to maintain such insurance coverage in the future, there can be no assurance that we will be adequately protected from claims that are brought against us.
24
Table of Contents
We are subject to many laws and governmental regulations and any adverse regulatory action may materially adversely affect our financial condition and business operations.
The PAD Systems and related manufacturing processes, clinical data, adverse events, recalls or corrections and promotional activities are subject to extensive regulation by the FDA and other regulatory bodies. In particular, we are required to comply with the QSR and other regulations, which cover the methods and documentation of the design, testing, production, control, quality assurance, labeling, packaging, storage and shipping of any product for which we obtain marketing clearance or approval. We are also responsible for the quality of components received by our suppliers. Failure to comply with the QSR requirements or other statutes and regulations administered by the FDA and other regulatory bodies, or failure to adequately respond to any observations, could result in, among other things:
• | warning or other letters from the FDA; |
• | fines, injunctions and civil penalties; |
• | product recall or seizure; |
• | unanticipated expenditures; |
• | delays in clearing or approving or refusal to clear or approve products; |
• | withdrawal or suspension of approval or clearance by the FDA or other regulatory bodies; |
• | orders for physician notification or device repair, replacement or refund; |
• | operating restrictions, partial suspension or total shutdown of production or clinical trials; and |
• | criminal prosecution. |
If any of these actions were to occur, it would harm our reputation and cause our product sales to suffer.
Our operations are also subject to regulatory requirements relating to the environment, waste management and health and safety matters, including measures relating to the release, use, storage, treatment, transportation, discharge, disposal and remediation of hazardous substances. Environmental laws and regulations could become more stringent over time, imposing greater compliance costs and increasing risks and penalties associated with violations.
In addition, our relationships with physicians, hospitals and the marketers of our products are subject to scrutiny under various federal anti-kickback, self-referral, false claims and similar laws, often referred to collectively as healthcare fraud and abuse laws, as further described below.
If our operations are found to be in violation of these laws, we, as well as our employees, may be subject to penalties, including monetary fines, civil and criminal penalties, exclusion from federal and state healthcare programs, including Medicare, Medicaid, Veterans Administration health programs, workers' compensation programs and TRICARE (the healthcare system administered by or on behalf of the U.S. Department of Defense for uniformed services beneficiaries, including active duty and their dependents, retirees and their dependents), and forfeiture of amounts collected in violation of such prohibitions, which could materially adversely affect our financial condition and business operations.
We are subject to federal and state laws prohibiting "kickbacks" and false and fraudulent claims which, if violated, could subject us to substantial penalties. Additionally, any challenges to or investigations into our practices under these laws could cause adverse publicity and be costly to respond to, and thus could harm our business.
The federal healthcare program Anti-Kickback Statute, and similar state laws, prohibit payments that are intended to induce health care professionals or others either to refer patients or to purchase, lease, order or arrange for or recommend the purchase, lease or order of healthcare products or services. A number of states have enacted laws that require pharmaceutical and medical device companies to monitor and report payments, gifts and other remuneration made to physicians and other health care professionals and health care organizations. In addition, some state statutes, most notably laws in Massachusetts and Vermont, impose outright bans on certain gifts to physicians. Some of these laws, referred to as "aggregate spend" or "gift" laws, carry substantial fines if they are violated. The federal Physician Payments Sunshine Act, or the Sunshine Act, was enacted by Congress in 2010 as part of the comprehensive health care reform legislation, and the implementing Open Payments regulations under the Sunshine Act, released in February 2013, require us to begin collecting certain data on payments and other transfers of value to physicians and teaching hospitals beginning in August 2013 for public reporting by the end of March 2014.
25
Table of Contents
It is widely anticipated that public reporting under the Sunshine Act and implementing Open Payments regulations will result in increased scrutiny of the financial relationships between industry, physicians and teaching hospitals. These anti-kickback, public reporting and aggregate spend laws affect our sales, marketing and other promotional activities by limiting the kinds of financial arrangements, including sales programs, we may have with hospitals, physicians or other potential purchasers or users of medical devices. They also impose additional administrative and compliance burdens on us. In particular, these laws influence, among other things, how we structure our sales offerings, including discount practices, customer support, education and training programs and physician consulting and other service arrangements. If we were to offer or pay inappropriate inducements to purchase our products, we could be subject to a claim under the federal healthcare program Anti-Kickback Statute or similar state laws. If we fail to comply with particular reporting requirements, we could be subject to penalties under applicable federal or state laws. Other federal and state laws generally prohibit individuals or entities from knowingly presenting, or causing to be presented, claims for payments to Medicare, Medicaid or other third-party payors that are false or fraudulent, or for items or services that were not provided as claimed. Although we do not submit claims directly to government healthcare programs or other payors, manufacturers can be held liable under these laws if they are deemed to "cause" the submission of false or fraudulent claims by providing inaccurate billing or coding information to customers, by providing improper financial inducements, or through certain other activities.
In providing billing and coding information to customers, we make every effort to ensure that the billing and coding information furnished is accurate and that treating physicians understand that they are responsible for all treatment decisions. Nevertheless, we cannot provide assurance that the government will regard any billing errors that may be made as inadvertent or that the government will not examine our role in providing information to our customers and physicians concerning the benefits of therapy with our devices. Likewise, our financial relationships with customers, physicians, or others in a position to influence the purchase or use of our products may be subject to government scrutiny or be alleged or found to violate applicable fraud and abuse laws. False claims laws prescribe civil, criminal and administrative penalties for noncompliance, which can be substantial. Moreover, an unsuccessful challenge or investigation into our practices could cause adverse publicity, and be costly to respond to, and thus could harm our business and results of operations.
New regulations related to "conflict minerals" may force us to incur additional expenses, may result in damage to our business reputation and may adversely impact our ability to conduct our business.
Pursuant to the Dodd-Frank Wall Street Reform and Consumer Protection Act, the SEC promulgated final rules regarding disclosure of the use of certain minerals, known as conflict minerals, that are mined from the Democratic Republic of the Congo and adjoining countries, as well as procedures regarding a manufacturer's efforts to prevent the sourcing of such minerals and metals produced from those minerals. These new requirements will require due diligence efforts for the 2013 calendar year, with initial disclosure requirements effective in May 2014. There will be costs associated with complying with these disclosure requirements, including for diligence in regards to the sources of any conflict minerals used in our products, in addition to the cost of remediation and other changes to products, processes, or sources of supply as a consequence of such verification activities. In addition, the implementation of these rules could adversely affect the sourcing, supply, and pricing of materials used in our products.
Risks Relating to Our Intellectual Property
Our inability to adequately protect our intellectual property could allow our competitors and others to produce products based on our technology, which could substantially impair our ability to compete.
Our success and ability to compete depends, in part, upon our ability to maintain the proprietary nature of our technologies. We rely on a combination of patents, copyrights and trademarks, as well as trade secrets and nondisclosure agreements, to protect our intellectual property. Our issued patents and related intellectual property may not be adequate to protect us or permit us to gain or maintain a competitive advantage. Also, we cannot assure you that any of our pending patent applications will result in the issuance of patents to us. Further, if any patents we obtain or license are deemed invalid and unenforceable, or have their scope narrowed, it could impact our ability to commercialize or license our technology and achieve competitive advantages.
Changes in either the patent laws or in interpretations of patent laws in the United States and other countries may diminish the value of our intellectual property. In addition, the laws of some foreign countries may not protect our intellectual property rights to the same extent as the laws of the United States, if at all.
We may, in the future, need to assert claims of infringement against third parties to protect our intellectual property. The outcome of litigation to enforce our intellectual property rights in patents, copyrights, trade secrets or trademarks is highly unpredictable, could result in substantial costs and diversion of resources, and could have a material adverse effect on our financial condition, reputation and results of operations regardless of the final outcome of such litigation.
26
Table of Contents
Despite our efforts to safeguard our unpatented and unregistered intellectual property rights, we may not be successful in doing so or the steps taken by us in this regard may not be adequate to detect or deter misappropriation of our technology or to prevent an unauthorized third party from copying or otherwise obtaining and using our products, technology or other information that we regard as proprietary. In addition, we may not have sufficient resources to litigate, enforce or defend our intellectual property rights. Additionally, third parties may be able to design around our patents.
We also rely on trade secrets, technical know-how and continuing innovation to develop and maintain our competitive position. In this regard, we seek to protect our proprietary information and other intellectual property by having a policy that our employees, consultants, contractors, outside scientific collaborators and other advisors execute non-disclosure and assignment of invention agreements on commencement of their employment or engagement. We cannot provide any assurance that employees and third parties will abide by the confidentiality or assignment terms of these agreements, or that we will be effective in securing necessary assignments from these third parties.
Claims of infringement or misappropriation of the intellectual property rights of others could prohibit us from commercializing products, require us to obtain licenses from third parties or require us to develop non-infringing alternatives, and subject us to substantial monetary damages and injunctive relief.
The medical technology industry is characterized by extensive litigation and administrative proceedings over patent and other intellectual property rights. The likelihood that patent infringement or misappropriation claims may be brought against us increases as we achieve more visibility in the marketplace and introduce products to market. We are aware of numerous patents issued to third parties that relate to the manufacture and use of medical devices for the treatment of vascular disease. The owners of each of these patents could assert that the manufacture, use or sale of our products infringes one or more claims of their patents. There could also be existing patents of which we are unaware that one or more aspects of our technology may inadvertently infringe. In some cases, litigation may be threatened or brought by a patent-holding company or other adverse patent owner who has no relevant product revenues and against whom our patents may provide little or no deterrence.
Any infringement or misappropriation claim could cause us to incur significant costs, place significant strain on our financial resources, divert management's attention from our business and harm our reputation. If the relevant patents were upheld in litigation as valid and enforceable and we were found to infringe, we could be prohibited from commercializing any infringing products unless we could obtain licenses to use the technology covered by the patent or are able to design around the patent. We may be unable to obtain a license on terms acceptable to us, if at all, and we may not be able to redesign any infringing products to avoid infringement.
Item 1B. Unresolved Staff Comments.
Not applicable.
Item 2. Properties.
Our principal executive offices are located in a 47,000 square foot facility located in St. Paul, Minnesota. We have leased this facility through November 2015 with an option to renew through November 2020. This facility accommodates our research and development, sales, marketing, manufacturing, finance and administrative activities.
In September 2009, we entered into an agreement to lease a 46,000 square foot production facility in Pearland, Texas beginning on April 1, 2010. We have leased this facility through March 2020. This facility primarily accommodates additional manufacturing activities.
We believe that our current premises are substantially adequate for our current and anticipated future needs for the foreseeable future.
Item 3. Legal Proceedings .
None.
Item 4. Mine Safety Disclosures.
None.
27
Table of Contents
Executive Officers of the Registrant.
The names, ages and positions of our executive officers are as follows:
Name | Age |
| Position | |
David L. Martin | 49 | |
| President and Chief Executive Officer |
Laurence L. Betterley | 59 | |
| Chief Financial Officer |
James E. Flaherty | 59 | |
| Chief Administrative Officer and Secretary |
Kevin Kenny | 48 | |
| Executive Vice President of Sales and Marketing |
Paul Koehn | 50 | |
| Senior Vice President of Quality and Operations |
Robert J. Thatcher | 58 | |
| Executive Vice President |
David L. Martin, President and Chief Executive Officer. Mr. Martin has been our President and Chief Executive Officer since February 2007, and a director since August 2006. Mr. Martin also served as our Interim Chief Financial Officer from January 2008 to April 2008. Prior to joining us, Mr. Martin was Chief Operating Officer of FoxHollow Technologies, Inc. from January 2004 to February 2006, Executive Vice President of Sales and Marketing of FoxHollow Technologies, Inc. from January 2003 to January 2004, Vice President of Global Sales and International Operations at CardioVention Inc. from October 2001 to May 2002, Vice President of Global Sales for RITA Medical Systems, Inc. from March 2000 to October 2001 and Director of U.S. Sales, Cardiac Surgery for Guidant Corporation from September 1999 to March 2000. Mr. Martin has also held sales and sales management positions for The Procter & Gamble Company and Boston Scientific Corporation.
Laurence L. Betterley, Chief Financial Officer. Mr. Betterley joined us in April 2008 as our Chief Financial Officer. Previously, Mr. Betterley was Chief Financial Officer at Cima NanoTech, Inc. from May 2007 to April 2008, Senior Vice President and Chief Financial Officer of PLATO Learning, Inc. from 2004 to 2007, Senior Vice President and Chief Financial Officer of Diametrics Medical, Inc. from 1996 to 2003, and Chief Financial Officer of Cray Research Inc. from 1994 to 1996.
James E. Flaherty, Chief Administrative Officer and Secretary. Mr. Flaherty has been our Chief Administrative Officer since January 14, 2008. Mr. Flaherty was our Chief Financial Officer from March 2003 to January 14, 2008. As Chief Administrative Officer, Mr. Flaherty reports directly to our Chief Executive Officer and has responsibility for information technology, facilities, legal matters, financial analysis of business development opportunities and business operations. Prior to joining us, Mr. Flaherty served as an independent financial consultant from 2001 to 2003 and Chief Financial Officer of Zomax Incorporated from 1997 to 2001 and Racotek, Inc. from 1990 to 1996. On June 9, 2005, the Securities and Exchange Commission filed a civil injunctive action charging Zomax Incorporated with violations of federal securities law by filing a materially misstated Form 10-Q for the period ended June 30, 2000. The SEC further charged that in a conference call with analysts, certain of Zomax's executive officers, including Mr. Flaherty, misrepresented or omitted to state material facts regarding Zomax's prospects of meeting quarterly revenue and earnings targets, in violation of federal securities law. Without admitting or denying the SEC's charges, Mr. Flaherty consented to the entry of a court order enjoining him from any violation of certain provisions of federal securities law. In addition, Mr. Flaherty agreed to disgorge $16,770 plus prejudgment interest and pay a $75,000 civil penalty.
Kevin Kenny, Executive Vice President of Sales and Marketing. Mr. Kenny joined us in May 2011 as Executive Vice President of Sales and Marketing. From 2002 to 2011, Mr. Kenny served in various positions with Medtronic Inc.'s U.S. Spine and Biologics division, including Vice President of Sales. Previously, Mr. Kenny served as Vice President of U.S. sales for Bausch and Lomb and held various sales and marketing leadership roles with B. Braun/McGaw and Smithkline Beecham.
Paul Koehn, Senior Vice President of Quality and Operations. Mr. Koehn joined us in March 2007 as Director of Manufacturing and was promoted to Vice President of Quality and Manufacturing in October 2007. In August 2011, Mr. Koehn became Vice President of Quality and Operations and in September 2013, he became Senior Vice President of Quality and Operations. Previously, Mr. Koehn was Vice President of Operations for Sewall Gear Manufacturing from 2000 to March 2007 and before joining Sewall Gear, Mr. Koehn held various quality and manufacturing management roles with Dana Corporation.
Robert J. Thatcher, Executive Vice President. Mr. Thatcher joined us as Senior Vice President of Sales and Marketing in October 2005 and became Vice President of Operations in September 2006. Mr. Thatcher became Executive Vice President in August 2007. Previously, Mr. Thatcher was Senior Vice President of TriVirix Inc. from October 2003 to October 2005. Mr. Thatcher has more than 30 years of medical device experience in both large and start-up companies. Mr. Thatcher has held various sales management, marketing management and general management positions at Medtronic, Inc., Schneider USA, Inc. (a former division of Pfizer Inc.), Boston Scientific Corporation and several startup companies.
28
Table of Contents
PART II
Item 5. Market for Registrant's Common Equity, Related Stockholder Matters and Issuer Purchases of Equity Securities.
Price Range of Common Stock and Dividend Policy
Prior to the closing of the merger on February 25, 2009, the stock of Replidyne was traded on the Nasdaq Global Market under the symbol "RDYN." On February 26, 2009, the stock of CSI began trading on the Nasdaq Global Market under the symbol "CSII." The following table sets forth the high and low sales prices for our common stock (based upon intra-day trading) as reported by the Nasdaq Global Market:
| Common Stock | ||||||
| High |
| Low | ||||
Fiscal Year Ended June 30, 2013 |
|
|
| ||||
First quarter | $ | 11.64 | |
| $ | 8.60 | |
Second quarter | 12.95 | |
| 10.38 | | ||
Third quarter | 20.64 | |
| 12.70 | | ||
Fourth quarter | 22.67 | |
| 16.51 | | ||
Fiscal Year Ended June 30, 2012 |
|
|
| ||||
First quarter | $ | 16.25 | |
| $ | 11.10 | |
Second quarter | 11.39 | |
| 7.26 | | ||
Third quarter | 10.55 | |
| 8.54 | | ||
Fourth quarter | 10.20 | |
| 8.24 | | ||
The number of record holders of our common stock on August 27, 2013 was approximately 561. No cash dividends have been previously paid on our common stock and none are anticipated during fiscal year 2014. We are restricted from paying dividends under our Loan and Security Agreements with Silicon Valley Bank and Partners for Growth.
Recent Sales of Unregistered Securities
During the three months ended June 30, 2013, and not previously reported, we had 30 cashless exercises of unregistered warrants. We issued 88,748 and 7,580 shares of common stock pursuant to the cashless exercise of unregistered warrants to acquire an aggregate of 162,242 and 13,274 shares at exercise prices of $8.83 and $9.33 per share, respectively. The issuances of these shares were exempt from registration by virtue of Section 3(a)(9) of the Securities Act.
In addition, during the three months ended June 30, 2013, and not previously reported, we issued 12,983 shares of common stock pursuant to the cash exercise of five unregistered warrants having an exercise price of $8.83 per share, and we issued 11,594 shares of common stock pursuant to the cash exercise of one unregistered warrant having an exercise price of $9.28 per share. We issued the shares pursuant to Rule 506 of Regulation D promulgated under the Securities Act. The warrant holders represented that they are accredited investors.
Issuer Purchases of Equity Securities
None.
Securities Authorized For Issuance Under Equity Compensation Plans
For information on our equity compensation plans, refer to Item 12, "Security Ownership of Certain Beneficial Owners and Management and Related Stockholder Matters."
Table of Contents
Performance Graph
The graph below compares the five-year total return to stockholders on our common stock with the return of the Standard & Poor's 500 Stock Index ("S&P") and the S&P Health Care Index ("S&P HC"). The graph assumes $100 was invested in the common stock of our predecessor company, Replidyne Inc., and in each of the named indices on December 31, 2007, and that all dividends were reinvested, if any. The graph reflects our Merger, as more fully described in Part I, Item 1 of this Annual Report on Form 10-K, and the effects of our 1-for-10 reverse stock split and our change in fiscal year from December 31 to June 30, both effective February 25, 2009.
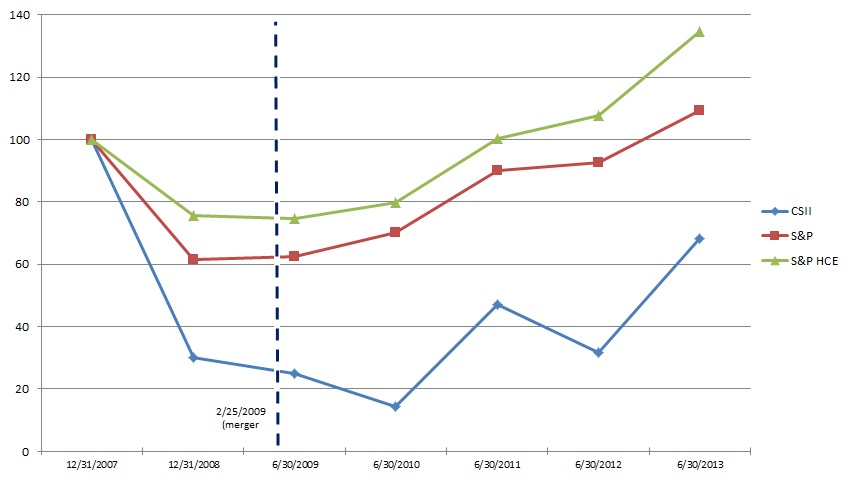
The following supplemental graph compares the five-year total return to stockholders of the common stock of Cardiovascular Systems, Inc., a Minnesota corporation ("CSI-MN"), with the return of the S&P and S&P HC. The graph assumes $100 was invested in the common stock of CSI-MN and in each of the named indices on December 31, 2007, and that all dividends were reinvested, if any. Please note that at 12/31/07 and 12/31/08, CSI-MN was a private company and the values presented are based on estimates of fair market value made by management of CSI-MN for accounting purposes. The graph reflects our Merger, in which each share of CSI-MN was converted into the right to receive 0.647 shares of CSI, and our change in fiscal year from December 31 to June 30, both effective February 25, 2009.
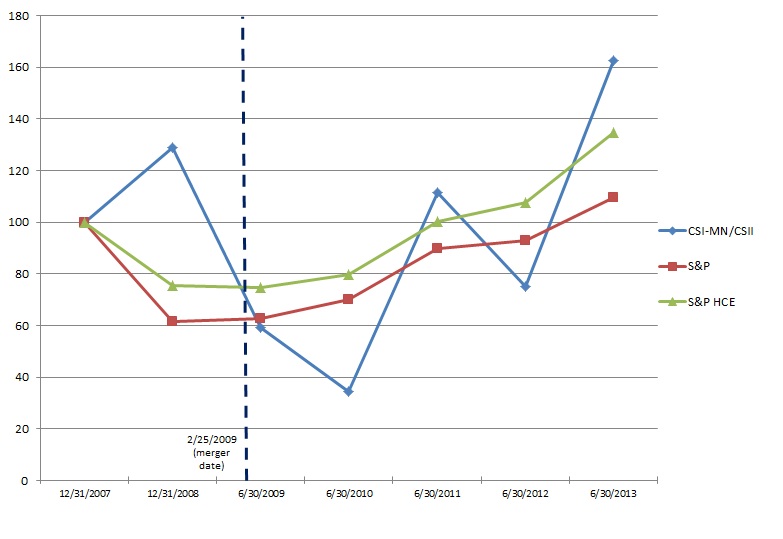
30
Table of Contents
Item 6. Selected Financial Data.
Five-Year Selected Financial Data
(in thousands, except per share amounts)
| 2013 |
| 2012 |
| 2011 |
| 2010 |
| 2009 | ||||||||||
SUMMARY OF OPERATIONS FOR THE FISCAL YEAR: | |||||||||||||||||||
Revenues | $ | 103,897 | |
| $ | 82,490 | |
| $ | 78,780 | |
| $ | 64,829 | |
| $ | 56,461 | |
Loss from operations | $ | (22,419 | ) |
| $ | (14,466 | ) |
| $ | (8,809 | ) |
| $ | (22,899 | ) |
| $ | (34,233 | ) |
Net loss available to common stockholders | $ | (24,037 | ) |
| $ | (16,790 | ) |
| $ | (11,125 | ) |
| $ | (23,904 | ) |
| $ | (31,895 | ) |
Basic and diluted loss per share | $ | (1.11 | ) |
| $ | (0.93 | ) |
| $ | (0.70 | ) |
| $ | (1.62 | ) |
| $ | (1.13 | ) |
Cash dividends declared per share | $ | - | |
| $ | - | |
| $ | - | |
| $ | - | |
| $ | - | |
FINANCIAL POSITION AT YEAR END: |
|
|
|
|
|
|
|
|
| ||||||||||
Total assets | $ | 96,897 | |
| $ | 63,124 | |
| $ | 46,758 | |
| $ | 42,722 | |
| $ | 72,370 | |
Total long-term liabilities | $ | 7,652 | |
| $ | 13,083 | |
| $ | 9,937 | |
| $ | 11,602 | |
| $ | 5,864 | |
Stockholders' equity | $ | 66,832 | |
| $ | 32,189 | |
| $ | 21,635 | |
| $ | 17,715 | |
| $ | 30,332 | |
31
Table of Contents
Item 7. Management's Discussion and Analysis of Financial Condition and Results of Operations.
You should read the following discussion and analysis of financial condition and results of operations together with our consolidated financial statements and the related notes included elsewhere in this Form 10-K. This discussion and analysis contains forward-looking statements about our business and operations, based on current expectations and related to future events and our future financial performance, that involve risks and uncertainties. Our actual results may differ materially from those we currently anticipate as a result of many important factors, including the factors we describe under "Risk Factors" and elsewhere in this Form 10-K.
OVERVIEW
We are a medical device company focused on developing and commercializing interventional treatment systems for vascular disease. Our primary products, the Stealth 360° PAD System (the "Stealth 360°"), the Diamondback 360° PAD System (the "Diamondback 360°"), and the Diamondback Predator 360° PAD System (the "Predator 360°") are catheter-based platforms capable of treating a broad range of plaque types in leg arteries both above and below the knee and address many of the limitations associated with existing treatment alternatives. We also are pursuing approval of our products for coronary use. We refer to the Stealth 360°, Diamondback 360°, and the Predator 360° collectively in this report as the "PAD Systems."
We were incorporated as Replidyne, Inc. in Delaware in 2000. On February 25, 2009, Replidyne, Inc. completed its business combination with Cardiovascular Systems, Inc., a Minnesota corporation ("CSI-MN"), in accordance with the terms of the Agreement and Plan of Merger and Reorganization, dated as of November 3, 2008 (the "Merger Agreement"). Pursuant to the Merger Agreement, CSI-MN continued after the merger as the surviving corporation and a wholly-owned subsidiary of Replidyne. Replidyne changed its name to Cardiovascular Systems, Inc. ("CSI") and CSI-MN merged with and into CSI, with CSI continuing after the merger as the surviving corporation. These transactions are referred to herein as the "merger." Replidyne was a biopharmaceutical company focused on discovering, developing, in-licensing and commercializing anti-infective products.
CSI was incorporated in Minnesota in 1989. From 1989 to 1997, we engaged in research and development on several different product concepts that were later abandoned. Since 1997, we have devoted substantially all of our resources to the development of the PAD Systems and since 2007, to obtaining approval for a coronary application of our orbital technology.
From 2003 to 2005, we conducted numerous bench and animal tests in preparation for application submissions to the FDA. We initially focused our testing on providing a solution for coronary in-stent restenosis, but later changed the focus to peripheral artery disease, or PAD. In 2006, we obtained an investigational device exemption from the FDA to conduct our pivotal OASIS clinical trial, which was completed in January 2007. The OASIS clinical trial was a prospective 20-center study that involved 124 patients with 201 lesions.
In August 2007, the FDA granted us 510(k) clearance for the use of the Diamondback 360° as a therapy in patients with PAD. We commenced commercial introduction of the Diamondback 360° in the United States in September 2007. We were granted 510(k) clearance of the Predator 360° in March 2009 and Stealth 360° in March 2011. We market the PAD Systems in the United States through a direct sales force and expend significant capital on our sales and marketing efforts to expand our customer base and utilization per customer. We assemble at our facilities the saline infusion pump used with our Stealth 360° product and the single-use catheter used in the PAD Systems with components purchased from third-party suppliers, as well as with components manufactured in-house. Supplemental products are purchased from third-party suppliers.
We have developed modified versions of the Stealth 360° and Diamondback 360° to treat coronary arteries. A coronary application requires us to conduct a clinical trial and file a premarket application, or PMA, and obtain approval from the FDA. On March 15, 2013, we completed submission of our PMA application to the FDA for our orbital atherectomy system to treat calcified coronary arteries.
As of June 30, 2013 , we had an accumulated deficit of $203.3 million . We expect our losses to continue as we invest in sales, marketing, medical education, clinical studies and product research and development for our next phase of growth in the peripheral market and preparation for a potential coronary application. To date, we have financed our operations primarily from the issuance of common and preferred stock, convertible promissory notes, and debt.
32
Table of Contents
FINANCIAL OVERVIEW
Revenues. We derive substantially all of our revenues from the sale of PAD Systems and other ancillary products. The PAD Systems each use a disposable, single-use, low-profile catheter that travels over our proprietary ViperWire guidewire. The electric powered Stealth 360° PAD System uses a saline infusion pump as a power supply for the operation of the catheter, while the air powered Diamondback 360° and Predator 360° PAD Systems use an external control unit that powers the system. Our ancillary products include the ViperSlide Lubricant and ViperTrack Radiopaque Tape. We also have an exclusive distribution agreement with Asahi to market its peripheral guide wire line in the United States.
Cost of Goods Sold. We assemble the single-use catheter with components purchased from third-party suppliers, as well as with components manufactured in-house. The infusion pump and guidewires are purchased from third-party suppliers. Our cost of goods sold consists primarily of raw materials, direct labor, and manufacturing overhead.
Selling, General and Administrative Expenses. Selling, general and administrative expenses include compensation for executive, sales, marketing, finance, information technology, human resources and administrative personnel, including stock-based compensation. Other significant expenses include travel and marketing costs and professional fees.
Research and Development Expenses. Research and development expenses include costs associated with the design, development, testing, enhancement and regulatory approval of our products. Research and development expenses include employee compensation including stock-based compensation, supplies and materials, patent expenses, consulting expenses, travel and facilities overhead. We also incur significant expenses to operate clinical trials, including trial design, third-party fees, clinical site reimbursement, data management and travel expenses. All research and development expenses are expensed as incurred. Approved patent applications are capitalized and amortized using the straight-line method over their remaining estimated lives. Patent amortization begins at the time of patent application approval, and does not exceed 20 years.
Interest and Other Income (Expense). Interest and other income (expense) primarily includes interest expense (including premium and discount amortization), interest income, change in the fair value of the debt conversion option, debt refinancing costs, and net write-offs upon debt conversion (option and unamortized premium or discount).
• | Interest Expense (Including Premium and Discount Amortization). Interest expense results from outstanding debt balances, and debt premium and discount amortization. |
• | Interest Income. Interest income is attributed to interest earned on deposits in investments that consist of money market funds. |
• | Change in Fair Value of Debt Conversion Option. Change in fair value of debt conversion option represents the period to period change in fair value of the debt conversion option associated with outstanding convertible debt. |
• | Net Write-offs Upon Debt Conversion (Option and Unamortized Premium or Discount). Net write-offs upon debt conversion (option and unamortized premium) are the result of the conversion of convertible debt, and include the write-off of the related debt conversion option and any unamortized debt premium or discount. |
• | Other. Other consists of miscellaneous non-operating expenses, including state taxes. |
Net Operating Loss Carryforwards. We have established valuation allowances to fully offset our deferred tax assets due to the uncertainty about our ability to generate the future taxable income necessary to realize these deferred assets, particularly in light of our historical losses. The future use of net operating loss carryforwards is dependent on us attaining profitable operations and will be limited in any one year under Internal Revenue Code Section 382 due to significant ownership changes (as defined in Section 382) resulting from our equity financings. At June 30, 2013 , we had net operating loss carryforwards for federal and state income tax reporting purposes of approximatel y $150.4 million , which will expire at various dates through fiscal 2033.
33
Table of Contents
CRITICAL ACCOUNTING POLICIES AND SIGNIFICANT JUDGMENTS AND ESTIMATES
Our management's discussion and analysis of our financial condition and results of operations are based on our consolidated financial statements, which have been prepared in accordance with accounting principles generally accepted in the United States. The preparation of our consolidated financial statements requires us to make estimates, assumptions and judgments that affect amounts reported in those statements. Our estimates, assumptions and judgments, including those related to revenue recognition, allowance for doubtful accounts, excess and obsolete inventory, the debt conversion option, and stock-based compensation are updated as appropriate at least quarterly. We use authoritative pronouncements, our technical accounting knowledge, cumulative business experience, valuation specialists, judgment and other factors in the selection and application of our accounting policies. While we believe that the estimates, assumptions and judgments that we use in preparing our consolidated financial statements are appropriate, these estimates, assumptions and judgments are subject to factors and uncertainties regarding their outcome. Therefore, actual results may materially differ from these estimates.
Some of our significant accounting policies require us to make subjective or complex judgments or estimates. An accounting estimate is considered to be critical if it meets both of the following criteria: (1) the estimate requires assumptions about matters that are highly uncertain at the time the accounting estimate is made, and (2) different estimates that reasonably could have been used, or changes in the estimate that are reasonably likely to occur from period to period, would have a material impact on the presentation of our financial condition, results of operations, or cash flows.
Revenue Recognition. We sell the majority of our products via direct shipment to hospitals or office-based labs. We recognize revenue when all of the following criteria are met: persuasive evidence of an arrangement exists; delivery has occurred; the sales price is fixed or determinable; and collectability is reasonably assured. We record estimated sales returns, discounts and rebates as a reduction of net sales in the same period revenue is recognized.
Costs related to products delivered are recognized in the period revenue is recognized. Cost of goods sold consists primarily of raw materials, direct labor, and manufacturing overhead.
Allowance for Doubtful Accounts. We maintain an allowance for doubtful accounts. This allowance is an estimate and is regularly evaluated for adequacy by taking into consideration factors such as past experience, credit quality of the customer base, age of the receivable balances, both individually and in the aggregate, and current economic conditions that may affect a customer's ability to pay. Provisions for the allowance for doubtful accounts attributed to bad debt are recorded in general and administrative expenses.
Excess and Obsolete Inventory. We have inventories that are principally comprised of capitalized direct labor and manufacturing overhead, raw materials and components, and finished goods. Due to the technological nature of our products, there is a risk of obsolescence to changes in our technology and the market, which is impacted by technological developments and events. Accordingly, we write down our inventories as we become aware of any situation where the carrying amount exceeds the estimated realizable value based on assumptions about future demands and market conditions. The evaluation includes analyses of inventory levels, expected product lives, product at risk of expiration, sales levels by product and projections of future sales demand.
Debt Conversion Option. The fair value of the debt conversion option is related to the loan and security agreement with Partners for Growth and has been included as a component of debt conversion option and other assets on our balance sheet. The Monte Carlo option pricing model used to determine the value of the debt conversion option includes various inputs including historical volatility, stock price simulations, and the assessed behavior of us and Partners for Growth based on those simulations.
Stock-Based Compensation. We recognize stock-based compensation expense in an amount equal to the fair value of share-based payments computed at the date of grant. The fair value of all restricted stock awards and units are expensed in the consolidated statements of operations over the related vesting period.
All restricted stock awards and units we have granted become exercisable over periods established at the date of grant. The fair value of each restricted stock award and unit was equal to the fair market value of our common stock at the date of grant, as determined by management and the board of directors.
Legal Proceedings. In accordance with FASB guidance, we record a liability in our consolidated financial statements related to legal proceedings when a loss is known or considered probable and the amount can be reasonably estimated. If the reasonable estimate of a known or probable loss is a range, and no amount within the range is a better estimate than any other, the minimum amount of the range is accrued. If a loss is possible, but not known or probable, and can be reasonably estimated, the estimated loss or range of loss is disclosed in the notes to the consolidated financial statements. In most cases, significant judgment is required to estimate the amount and timing of a loss to be recorded.
34
Table of Contents
RESULTS OF OPERATIONS
The following table sets forth, for the periods indicated, our results of operations expressed as dollar amounts (in thousands), and, for certain line items, the changes between the specified periods expressed as percent increases or decreases:
| Year Ended June 30, |
| Year Ended June 30, | ||||||||||||||||||
| 2013 |
| 2012 |
| Percent Change |
| 2012 |
| 2011 |
| Percent Change | ||||||||||
Revenues | $ | 103,897 | |
| $ | 82,490 | |
| 26.0 | % |
| $ | 82,490 | |
| $ | 78,780 | |
| 4.7 | % |
Cost of goods sold | 24,382 | |
| 19,216 | |
| 26.9 | |
| 19,216 | |
| 16,277 | |
| 18.1 | | ||||
Gross profit | 79,515 | |
| 63,274 | |
| 25.7 | |
| 63,274 | |
| 62,503 | |
| 1.2 | | ||||
Expenses: |
|
|
|
|
|
|
|
|
|
|
| ||||||||||
Selling, general and administrative | 86,718 | |
| 66,366 | |
| 30.7 | |
| 66,366 | |
| 62,372 | |
| 6.4 | | ||||
Research and development | 15,216 | |
| 11,374 | |
| 33.8 | |
| 11,374 | |
| 8,940 | |
| 27.2 | | ||||
Total expenses | 101,934 | |
| 77,740 | |
| 31.1 | |
| 77,740 | |
| 71,312 | |
| 9.0 | | ||||
Loss from operations | (22,419 | ) |
| (14,466 | ) |
| 55.0 | |
| (14,466 | ) |
| (8,809 | ) |
| 64.2 | | ||||
Interest and other, net | (1,618 | ) |
| (2,324 | ) |
| (30.4 | ) |
| (2,324 | ) |
| (2,316 | ) |
| 0.3 | | ||||
Net loss | $ | (24,037 | ) |
| $ | (16,790 | ) |
| 43.2 | |
| $ | (16,790 | ) |
| $ | (11,125 | ) |
| 50.9 | |
Comparison of Fiscal Year Ended June 30, 2013 with Fiscal Year Ended June 30, 2012
Revenues. Revenues increased by $21.4 million , or 26.0% , from $82.5 million for the year ended June 30, 2012 to $103.9 million for the year ended June 30, 2013 . This increase was primarily attributable to an $18.2 million , or 25.0% , increase in the number of PAD Systems sold and a $3.2 million , or 33.6% , increase in sales of supplemental and other revenue during the year ended June 30, 2013 , compared to the year ended June 30, 2012 . Currently, all of our revenues are in the United States; however, we may potentially sell internationally in the future. We expect our revenue to increase as we continue to increase the number of physicians using the devices and the usage per physician as we continue to focus on physician education programs, introduce new and improved products, and generate clinical data.
Cost of Goods Sold. Cost of goods sold increased by $5.2 million , or 26.9% , from $19.2 million for the year ended June 30, 2012 , to $24.4 million for the year ended June 30, 2013 . These amounts represent the cost of materials, labor and overhead for single-use catheters, guidewires, control units, pumps, and other supplemental products. The decrease in gross margin from 76.7% during the year ended June 30, 2012 , to 76.5% for the year ended June 30, 2013 , was primarily due to a higher mix of Stealth 360° sales, which carries a higher unit cost than its predecessor product, and to lower average selling prices, partially offset by the favorable effect of increased production volumes. Cost of goods sold for the years ended June 30, 2013 and 2012 includes $427,000 and $296,000 , respectively, for stock-based compensation. We expect that gross margin in fiscal 2014 will improve slightly compared to fiscal 2013 as cost improvements will be made throughout the year. Quarterly fluctuations could occur based on production volumes, timing of new product introductions, sales mix, pricing changes, or other unanticipated circumstances.
Selling, General and Administrative Expenses . Selling, general, and administrative expense increased by $20.4 million , or 30.7% , from $66.4 million for the year ended June 30, 2012 , to $86.7 million for the year ended June 30, 2013 . Our selling, general and administrative expenses for the year ended June 30, 2013 have increased due to increased variable compensation, expansion in our sales and marketing organizations, increased medical education programs, and the medical device excise tax, which became effective January 1, 2013 and resulted in an expense of $987,000 for the year ended June 30, 2013 . Selling, general, and administrative expenses for the years ended June 30, 2013 and 2012 includes $6.2 million and $4.4 million , respectively, for stock-based compensation. We expect our selling, general and administrative expenses to increase in the future as a result of the costs associated with expanding our sales and marketing organization and programs to further commercialize our PAD products and prepare for a potential future coronary application.
Research and Development Expenses. Research and development expenses increased by $3.8 million , or 33.8% , from $11.4 million for the year ended June 30, 2012 , to $15.2 million for the year ended June 30, 2013 . Research and development expenses relate to the development of new products, enhancement of existing products and PAD and coronary clinical trials. The increase in clinical expenses related to advancement of the ORBIT II coronary trial and related expansion of the clinical organization. Research and development expenses for the year ended June 30, 2013 and 2012 include $798,000 and $474,000 , respectively, for stock-based compensation. As we continue to expand our product portfolio within the market for the treatment of peripheral arteries and leverage our core technology into the coronary market, we generally expect to incur research and development expenses significantly above amounts incurred for the year ended June 30, 2013 . Fluctuations could occur based on the number of projects and studies and the timing of expenditures.
35
Table of Contents
Interest and Other, net. Interest and other income (expense) was $(1.6) million and $(2.3) million for the years ended June 30, 2013 and 2012 , respectively. Significant changes in interest and other expense during these periods included:
• | Interest Expense. Interest expense decreased by $100,000, from $(1.4) million for the year ended June 30, 2012 to $(1.3) million for the year ended June 30, 2013 . Interest expense results from outstanding debt balances and debt premium and discount amortization. |
• | Change in Fair Value of Debt Conversion Option. The change in fair value of the debt conversion option was $(554,000) for the year ended June 30, 2012 and $370,000 for the year ended June 30, 2013 . The debt conversion option is associated with our outstanding convertible debt and changes in its fair value are primarily driven by the change in the market value of our common stock. |
• | Net Write-offs Upon Conversion (Option and Unamortized Premium or Discount). Net write-offs upon conversion were $(182,000) during the year ended June 30, 2012 and $(551,000) during the year ended June 30, 2013 . Net write-offs upon conversion are the result of the conversion of convertible debt and include the write-off of the debt conversion option and any unamortized debt premium or discount. |
Net Loss. Net loss for the year ended June 30, 2013 was $24.0 million , compared to $16.8 million for the year ended June 30, 2012 . Our net loss has increased as a result of increased operating expenses, partially offset by higher gross profit.
Comparison of Fiscal Year Ended June 30, 2012 with Fiscal Year Ended June 30, 2011
Revenues. Revenues increased by $3.7 million, or 4.7%, from $78.8 million for the year ended June 30, 2011 to $82.5 million for the year ended June 30, 2012. This increase was primarily attributable to a $3.7 million, or 5.4%, increase in average selling prices of PAD Systems during the year ended June 30, 2012, compared to the year ended June 30, 2011.
Cost of Goods Sold. Cost of goods sold increased by $2.9 million, or 18.1%, from $16.3 million for the year ended June 30, 2011 to $19.2 million for the year ended June 30, 2012. These amounts represent the cost of materials, labor and overhead for single-use catheters, guidewires, control units, pumps, and other supplemental products. The decrease in gross margin from 79.3% during the year ended June 30, 2011 to 76.7% for the year ended June 30, 2012 was primarily due to a higher mix of Stealth 360° sales, which currently carry higher unit costs than its predecessor products due to limited initial component purchasing volumes, and to reserves for inventory transitions. Also, the addition of our second manufacturing facility in Texas for future production capacity temporarily increased production costs, but we believe will enhance efficiencies over time. Cost of goods sold for the years ended June 30, 2012 and 2011 includes $296,000 and $312,000, respectively, for stock-based compensation.
Selling, General and Administrative Expenses . Selling, general, and administrative expense increased by $4.0 million, or 6.4%, from $62.4 million for the year ended June 30, 2011 to $66.4 million for the year ended June 30, 2012. Our selling, general and administrative expenses for the year ended June 30, 2012 have increased due to the expansion of our marketing organization, increased variable compensation, and increased medical education programs, partially offset by lower stock-based compensation. Selling, general, and administrative expenses for the years ended June 30, 2012 and 2011 include $4.4 million and $5.6 million, respectively, for stock-based compensation.
36
Table of Contents
Research and Development Expenses. Research and development expenses increased by $2.4 million, or 27.2%, from $8.9 million for the year ended June 30, 2011, to $11.4 million for the year ended June 30, 2012. Research and development expenses relate to specific projects to improve our product or expand into new markets, such as the development of an electric version of the PAD Systems, shaft designs, crown designs, and PAD and coronary clinical trials. The increase in clinical expenses related to advancement of the ORBIT II coronary trial, partially offset by lower stock-based compensation. Research and development expenses for the year ended June 30, 2012 and 2011 include $474,000 and $587,000, respectively, for stock-based compensation.
Interest and Other, net. Interest and other income (expense) was $(2.3) million for the years ended June 30, 2012 and 2011. Significant changes in interest and other income (expense) during these periods included:
• | Interest Expense. Interest expense was $(1.4) million for the years ended June 30, 2012 and 2011. Interest expense results from outstanding debt balances and debt premium and discount amortization. |
• | Change in Fair Value of Debt Conversion Option. The change in fair value of the debt conversion option was $491,000 for the year ended June 30, 2011 and $(554,000) for the year ended June 30, 2012. The debt conversion option is associated with our outstanding convertible debt and changes in its fair value are primarily driven by the change in the market value of our common stock. |
• | Net Write-offs Upon Conversion (Option and Unamortized Premium or Discount). Net write-offs upon conversion were $(1.4) million during the year ended June 30, 2011 and $(182,000) during the year ended June 30, 2012. Net write-offs upon conversion are the result of the conversion of convertible debt and include the write-off of the conversion option and any unamortized debt premium or discount. |
Net Loss. Net loss for the year ended June 30, 2012 was $16.8 million, compared to $11.1 million for the year ended June 30, 2011. Our net loss has increased as a result of increased operating expenses, partially offset by higher gross profit.
37
Table of Contents
NON-GAAP FINANCIAL INFORMATION
To supplement our consolidated financial statements prepared in accordance with GAAP, our management uses a non-GAAP financial measure referred to as "Adjusted EBITDA." The following table sets forth, for the periods indicated, a reconciliation of Adjusted EBITDA to the most comparable U.S. GAAP measure expressed as dollar amounts (in thousands):
| Year Ended June 30, | ||||||
| 2013 |
| 2012 | ||||
Loss from operations | $ | (22,419 | ) |
| $ | (14,466 | ) |
Add: Stock-based compensation | 7,442 | |
| 5,165 | | ||
Add: Depreciation and amortization | 973 | |
| 872 | | ||
Adjusted EBITDA | $ | (14,004 | ) |
| $ | (8,429 | ) |
The decrease in Adjusted EBITDA of $5.6 million, or 66.1%, is primarily the result of the $8.0 million, or 55.0%, increase in the loss from operations. The loss from operations was significantly impacted by increases in operating expenses.
Adjusted EBITDA was also impacted by an increase in stock-based compensation and increase in depreciation and amortization. Stock-based compensation increased $2.3 million, or 44.1%, from $5.2 million for the year ended June 30, 2012 to $7.4 million for the year ended June 30, 2013 . Stock-based compensation increased as a result of vesting of previously granted share awards with a higher grant date fair value, and the granting of performance based restricted stock awards with shorter vesting periods than service based awards. Depreciation and amortization increased as a result of additional investment in capital equipment and patents.
Use and Economic Substance of Non-GAAP Financial Measures Used and Usefulness of Such Non-GAAP Financial Measures to Investors
We use Adjusted EBITDA as a supplemental measure of performance and believe this measure facilitates operating performance comparisons from period to period and company to company by factoring out potential differences caused by depreciation and amortization expense and non-cash charges such as stock-based compensation. Our management uses Adjusted EBITDA to analyze the underlying trends in our business, assess the performance of our core operations, establish operational goals and forecasts that are used to allocate resources and evaluate our performance period over period and in relation to our competitors' operating results.
We believe that presenting Adjusted EBITDA provides investors greater transparency to the information used by our management for its financial and operational decision-making and allows investors to see our results "through the eyes" of management. We also believe that providing this information better enables our investors to understand our operating performance and evaluate the methodology used by our management to evaluate and measure such performance. Adjusted EBITDA is also used to measure performance in our financial covenants as required by Silicon Valley Bank and Partners for Growth.
The following is an explanation of each of the items that management excluded from Adjusted EBITDA and the reasons for excluding each of these individual items:
• | Stock-based compensation. We exclude stock-based compensation expense from our non-GAAP financial measures primarily because such expense, while constituting an ongoing and recurring expense, is not an expense that requires cash settlement. Our management also believes that excluding this item from our non-GAAP results is useful to investors to understand its impact on our operational performance, liquidity and ability to make additional investments in the Company, and it allows for greater transparency to certain line items in our financial statements. |
• | Depreciation and amortization expense. We exclude depreciation and amortization expense from our non-GAAP financial measures primarily because such expenses, while constituting ongoing and recurring expenses, are not expenses that require cash settlement and are not used by our management to assess the core profitability of our business operations. Our management also believes that excluding these items from our non-GAAP results is useful to investors to understand our operational performance, liquidity and ability to make additional investments in the Company. |
Material Limitations Associated with the Use of Non-GAAP Financial Measures and Manner in which We Compensate for these Limitations
Non-GAAP financial measures have limitations as analytical tools and should not be considered in isolation or as a substitute for our financial results prepared in accordance with GAAP. Some of the limitations associated with our use of these non-GAAP financial measures are:
38
Table of Contents
• | Items such as stock-based compensation do not directly affect our cash flow position; however, such items reflect economic costs to us and are not reflected in our Adjusted EBITDA and therefore these non-GAAP measures do not reflect the full economic effect of these items. |
• | Non-GAAP financial measures are not based on any comprehensive set of accounting rules or principles and therefore other companies may calculate similarly titled non-GAAP financial measures differently than we do, limiting the usefulness of those measures for comparative purposes. |
• | Our management exercises judgment in determining which types of charges or other items should be excluded from the non-GAAP financial measures we use. |
We compensate for these limitations by relying primarily upon our GAAP results and using non-GAAP financial measures only supplementally.
LIQUIDITY AND CAPITAL RESOURCES
We had cash and cash equivalents of $67.9 million and $35.5 million at June 30, 2013 and 2012 , respectively. During the year ended June 30, 2013 , net cash used in operations amounted to $10.8 million . As of June 30, 2013 , we had an accumulated deficit of $203.3 million . We have historically funded our operating losses primarily from the issuance of common and preferred stock, convertible promissory notes, debt, and the merger with Replidyne in February 2009.
Loan and Security Agreement with Silicon Valley Bank
On March 29, 2010, we entered into an amended and restated loan and security agreement with Silicon Valley Bank. The agreement was amended on December 27, 2011 to increase outstanding borrowings, and subsequently amended on June 29, 2012 to modify financial covenants and reduce the interest rate and other fees, and on May 10, 2013 to modify financial covenants. The agreement, as amended, includes a $12.0 million term loan and a $15.0 million line of credit. The terms of each of these loans are as follows:
• | The $12.0 million term loan has an initial interest rate of 8.0%, which can be reduced to 7.0% based on the achievement of positive EBITDA for the trailing six month period. The term loan has a 36 month maturity, with repayment terms that include interest only payments during the first six months, followed by 30 equal principal payments of $400,000 plus interest, and a final payment of $100,000 due at maturity. This term loan also includes an acceleration provision that requires us to pay the entire outstanding balance, plus a penalty ranging from 1.0% to 3.0% of the commitment amount, upon the occurrence and continuance of an event of default. The balance outstanding on the term loan at June 30, 2013 , was $7.0 million net of the unamortized discount associated with warrants issued to Silicon Valley Bank in connection with the loan. The unamortized discount associated with warrants and other fees paid to the lender are being amortized over the 36 month maturity period. |
• | The $15.0 million line of credit expires on June 30, 2014 and has a floating interest rate equal to the Wall Street Journal's prime rate, plus 1.25%, with an interest rate floor of 4.5%. Interest on borrowings is due monthly and the principal balance is due at maturity. Borrowings on the line of credit are based on 85% of eligible accounts. Accounts receivable receipts are deposited into a lockbox account in the name of Silicon Valley Bank. The line of credit is subject to non-use fees, annual fees, and cancellation fees. There was not an outstanding balance on the line of credit at June 30, 2013 . |
Borrowings from Silicon Valley Bank are secured by all of our assets. The borrowings are subject to prepayment penalties and financial covenants, including maintaining certain liquidity and fixed charge coverage ratios. We were in compliance with all financial covenants as of June 30, 2013 . Any non-compliance by us under the terms of debt arrangements could result in an event of default under the Silicon Valley Bank loan, which, if not cured, could result in the acceleration of this debt.
Loan and Security Agreement with Partners for Growth
On April 14, 2010, we entered into a loan and security agreement with Partners for Growth III, L.P. (PFG), as amended on August 23, 2011, December 27, 2011, June 30, 2012 and May 10, 2013. The amended agreement provides that PFG will make loans to us up to $5.0 million. The agreement has a maturity date of April 14, 2015. The loans bear interest at a floating per annum rate equal to 2.75% above Silicon Valley Bank's prime rate, and such interest is payable monthly. The principal balance of and any accrued and unpaid interest on any notes are due on the maturity date and may not be prepaid by us at any time in whole or in part.
39
Table of Contents
As of June 30, 2013 , PFG has provided us with the following five loans totaling $5.0 million that are outstanding:
Date of Loan | Amount of Loan | Conversion Price |
August 4, 2011 (as amended August 24, 2011) | $500,000 | $15.30 |
February 7, 2013 | $1.0 million | $15.26 |
February 19, 2013 | $1.5 million | $15.53 |
February 27, 2013 | $1.5 million | $15.80 |
March 6, 2013 | $500,000 | $15.94 |
At any time prior to the maturity date, PFG may at its option convert any of the outstanding loans into shares of our common stock at the applicable conversion price, which in each case equaled the ten-day volume weighted average price per share of our common stock prior to the issuance date of each note. We may also effect at any time a mandatory conversion of amounts, subject to certain terms, conditions and limitations provided in the agreement, including a requirement that the ten-day volume weighted average price of our common stock prior to the date of conversion is at least 15% greater than the conversion price. We may reduce the conversion price to a price that represents a 15% discount to the ten-day volume weighted average price of our common stock to satisfy this condition and effect a mandatory conversion. We recorded a benefit (expense) of $370,000 and $(554,000) for the years ended June 30, 2013 and 2012 related to the change in fair value of the debt conversion options on all outstanding loans. This amount is a component of interest and other, net on our statement of operations. The balance outstanding under the loan and security agreement at June 30, 2013 and 2012 was $5.3 million and $5.6 million, respectively, including the net unamortized premium. The net unamortized premium associated with the loan, a beneficial conversion feature, and other fees paid to the lender is being amortized over the remaining maturity period.
During the years ended June 30, 2013 and 2012 , PFG converted various loans, in accordance with the conversion terms set forth in the agreement, as follows:
Date of Conversion | Amount Converted | Shares Issued Upon Conversion |
July 26, 2011 | $500,000 | 40,323 |
February 1, 2013 | $1.0 million | 74,516 |
February 7, 2013 | $500,000 | 36,657 |
February 11, 2013 | $1.0 million | 73,314 |
February 20, 2013 | $1.0 million | 73,314 |
February 21, 2013 | $500,000 | 36,657 |
February 26, 2013 | $500,000 | 36,657 |
Following these conversions, PFG provided us with new loans under the existing loan and security agreement, included in the table of outstanding loans above.
The loans are secured by certain of our assets, and the agreement contains customary covenants limiting our ability to, among other things, incur debt or liens, make certain investments and loans, effect certain redemptions of and declare and pay certain dividends on its stock, permit or suffer certain change of control transactions, dispose of collateral, or change the nature of its business. In addition, the PFG loan and security agreement contains financial covenants requiring us to maintain certain liquidity and fixed charge coverage ratios. We were in compliance with all financial covenants at June 30, 2013 . If we do not comply with the various covenants, PFG may, subject to various customary cure rights, decline to provide additional loans, require amortization of the loan over its remaining term, or require the immediate payment of all amounts outstanding under the loan and foreclose on any or all collateral, depending on which financial covenants are not maintained.
Subsequent to June 30, 2013 , PFG converted the $500,000 loan dated August 4, 2011 for 32,680 shares of our common stock at a conversion price of $15.30.
Equity Offerings
On March 25, 2013, we sold 2,300,000 shares of our common stock at $17.60 per share in a registered underwritten public offering. Net proceeds to us, after deducting underwriting discounts, commissions, and other expenses, were $38.2 million.
On May 22, 2012, we sold 1,780,000 shares of our common stock at $9.00 per share in a registered underwritten public offering. Net proceeds to us, after deducting underwriting discounts, commissions, and estimated expenses, were $14.9 million.
We intend to use the net proceeds from the 2013 offering for working capital and general corporate purposes, which may include, but not be limited to:
40
Table of Contents
• | the funding of clinical trials and studies; |
• | expanding our sales and marketing organization in preparation for commercialization of our coronary application; |
• | physician education and awareness programs; |
• | funding the commercialization of our coronary application if approved by the FDA; |
• | expansion into international markets; |
• | development of new products; and |
• | repayment of indebtedness with Silicon Valley Bank and Partners for Growth. |
We may also use a portion of the net proceeds from the 2013 offering for the potential acquisition of businesses, technologies and products, although we have no current understandings, commitments or arrangements to do so.
We cannot specify with certainty all of the particular uses for the net proceeds to us from the 2013 offering. Accordingly, we will retain broad discretion over the use of these proceeds. Pending these uses, we intend to invest the net proceeds in investment-grade, interest-bearing securities.
Cash and Cash Equivalents. Cash and cash equivalents was $67.9 million and $35.5 million at June 30, 2013 and 2012 , respectively. The increase is primarily attributable to net cash provided by financing activities during the year ended June 30, 2013 , partially offset by net cash used in operating and investing activities and payments of long term debt.
Operating Activities. Net cash used in operating activities was $(10.8) million , $(11.3) million , and $(8.4) million for the years ended June 30, 2013 , 2012 , and 2011 , respectively. For the years ended June 30, 2013 , 2012 , and 2011 , we had a net loss of $(24.0) million , $(16.8) million , and $(11.1) million , respectively. Changes in working capital accounts also contributed to the net cash used in the years ended June 30, 2013 , 2012 , and 2011 . Significant changes in working capital during these periods included:
• | Cash used in accounts receivable of $(1.3) million , $(391,000) , and $(3.7) million during the years ended June 30, 2013 , 2012 , and 2011 respectively. Cash used in accounts receivable is due to higher receivable balances from revenue growth which was greater in fiscal year 2013 as compared to fiscal year 2012 and 2011. |
• | Cash provided by (used in) inventories of $818,000 , $(1.2) million , and $(1.5) million during the years ended June 30, 2013 , 2012 , and 2011 , respectively. Cash provided by (used in) inventories was primarily due to the timing of inventory purchases and sales. |
• | Cash provided by (used in) prepaid expenses and other current assets of $925,000 , $(379,000) , and $323,000 during the years ended June 30, 2013 , 2012 , and 2011 respectively. Cash provided by (used in) prepaid expenses and other current assets was primarily due to payment timing of vendor deposits and other expenditures. |
• | Cash provided by accounts payable of $1.5 million , $269,000 , and $1.8 million during the years ended June 30, 2013 , 2012 , and 2011 , respectively. Cash provided by accounts payable was primarily due to timing of purchases and vendor payments. |
• | Cash provided by (used in) accrued expenses and other liabilities of $2.5 million , $7,000 , and $(2.4) million during the years ended June 30, 2013 , 2012 , and 2011 respectively. Cash provided by (used in) accrued expenses and other liabilities was primarily related to the timing and payment of accruals. |
Investing Activities . Net cash used in investing activities was $(2.5) million , $(975,000) , and $(1.7) million for the years ended June 30, 2013 , 2012 , and 2011 , respectively. Cash used in investing activities resulted from investment in property, plant and equipment, and patents.
Financing Activities . Net cash provided by financing activities was $45.6 million , $26.7 million , and $7.5 million during the years ended June 30, 2013 , 2012 , and 2011 , respectively. Cash provided by financing activities during these periods included:
• | employee stock purchase plan purchases of $1.8 million , $1.4 million , and $1.0 million during the years ended June 30, 2013 , 2012 , and 2011 , respectively; |
• | exercise of stock options and warrants of $5.9 million , $4.4 million , and $1.5 million during the years ended June 30, 2013 , 2012 , and 2011 , respectively; |
• | proceeds from long-term debt of $4.5 million , $7.9 million , and $7.5 million during the years ended June 30, 2013 , 2012 , and 2011 , respectively; and |
• | proceeds from the sale of common stock, net of issuance costs, of $38.2 million and $14.9 million during the years ended June 30, 2013 and 2012 , respectively. |
Cash used in financing activities in these periods included payments on long-term debt of $(4.8) million , $(1.9) million , and $(2.4) million during the years ended June 30, 2013 , 2012 , and 2011 , respectively.
41
Table of Contents
Our future liquidity and capital requirements will be influenced by numerous factors, including the extent and duration of future operating losses, the level and timing of future sales and expenditures, the results and scope of ongoing research and product development programs, working capital required to support our sales growth, the receipt of and time required to obtain regulatory clearances and approvals, our sales and marketing programs, the continuing acceptance of our products in the marketplace, competing technologies and market and regulatory developments. As of June 30, 2013 , we believe our current cash and cash equivalents and available debt will be sufficient to fund working capital requirements, capital expenditures and operations for greater than 12 months. We intend to retain any future earnings to support operations and to finance the growth and development of our business, and we do not anticipate paying any dividends in the foreseeable future. We may raise additional capital in the future, to fund acceleration of our current growth initiatives or additional growth opportunities, if we believe it will significantly enhance our value.
Contractual Cash Obligations. Our contractual obligations and commercial commitments as of June 30, 2013 are summarized below:
| Payments Due by Period (in thousands) | ||||||||||||||||||
Contractual Obligations | Total |
| Less Than 1 Year |
| 1-3 Years |
| 3-5 Years |
| More Than 5 Years | ||||||||||
Operating leases(1) | $ | 4,287 | |
| $ | 940 | |
| $ | 1,622 | |
| $ | 920 | |
| $ | 805 | |
Purchase commitments(2) | 5,431 | |
| 5,431 | |
| - | |
| - | |
| - | | |||||
Debt maturities(3) | 12,450 | |
| 5,050 | |
| 7,400 | |
| - | |
| - | | |||||
Total | $ | 22,168 | |
| $ | 11,421 | |
| $ | 9,022 | |
| $ | 920 | |
| $ | 805 | |
_____________________
(1) | The amounts reflected in the table above for operating leases represent future minimum payments under a non-cancellable operating lease for our office and production facility along with equipment. |
(2) | This amount reflects open purchase orders. |
(3) | The amounts reflected in the table above represents debt maturities under various debt agreements. |
INFLATION
We do not believe that inflation has had a material impact on our business and operating results during the periods presented.
OFF-BALANCE SHEET ARRANGEMENTS
Since inception, we have not engaged in any off-balance sheet arrangements as defined in Item 303(a)(4) of Regulation S-K.
RECENT ACCOUNTING PRONOUNCEMENTS
In June 2011, the FASB issued guidance requiring that all non-owner changes in stockholders' equity be presented either in a single continuous statement of comprehensive income or in two separate but consecutive statements. In the two-statement approach, the first statement should present total net income and its components followed consecutively by a second statement that should present total other comprehensive income, the components of other comprehensive income, and the total of comprehensive income. The new guidance became effective for us beginning July 1, 2012. Other than requiring additional disclosures, there has not been a material impact on our consolidated financial statements upon adoption as we have no other comprehensive income.
In July 2013, the FASB issued Accounting Standards Update (ASU) 2013-11, "Presentation of an Unrecognized Tax Benefit When a Net Operating Loss Carryforward, a Similar Tax Loss, or a Tax Credit Carryforward Exists." The amendments in ASU 2013-11 require us to present an unrecognized tax benefit, or a portion thereof, as a reduction to a deferred tax asset for a net operating loss (NOL) carryforward or a similar tax loss or tax credit carryforward, unless the uncertain tax position is not available to reduce, or would not be used to reduce, the NOL or carryforward under the tax law in the same jurisdiction; otherwise, the unrecognized tax benefit should be presented as a gross liability and should not net the unrecognized tax benefit with a deferred tax asset. ASU 2013-11 is effective for annual periods beginning after December 15, 2013 and should be applied to all unrecognized tax benefits that exist as of the effective date. Companies may choose to apply this guidance retrospectively to each prior reporting period presented. We do not anticipate a material impact on our consolidated financial statements upon adoption .
42
Table of Contents
PRIVATE SECURITIES LITIGATION REFORM ACT
The Private Securities Litigation Reform Act of 1995 provides a "safe harbor" for forward-looking statements. Such "forward-looking" information is included in this Form 10-K and in other materials filed or to be filed by us with the Securities and Exchange Commission (as well as information included in oral statements or other written statements made or to be made by us). Forward-looking statements include all statements based on future expectations. This Form 10-K contains forward-looking statements that involve risks and uncertainties, including our expectations regarding the adoption of the PAD Systems through our direct sales force; the use of the PAD Systems to treat coronary lesions and the potential market for this application in the interventional coronary market; our clinical trials and clinical evidence expectations; our plans to explore the acquisition of other product lines, technologies or companies and to continue to evaluate distribution agreements, licensing transactions and other strategic partnerships; use of proceeds from our public offering; future reimbursement for the PAD Systems; the possibility that we may sell internationally in the future; the conversion of and future capacity of our facilities; patent expiration expectations; our expectations regarding increased revenues; future efficiencies resulting from an increase in production costs; our expectations regarding improved fiscal year 2014 gross margins over fiscal 2013; an increase in selling, general and administrative expenses; research and development expenses being significantly above amounts incurred in fiscal 2013; no payment of dividends in the foreseeable future; and the sufficiency of our current and anticipated financial resources to fund operating expenses for at least the next 12 months and our expectations regarding raising additional capital. In some cases, you can identify forward-looking statements by the following words: "anticipate," "believe," "continue," "could," "estimate," "expect," "intend," "may," "ongoing," "plan," "potential," "predict," "project," "should," "will," "would," or the negative of these terms or other comparable terminology, although not all forward-looking statements contain these words. Forward-looking statements are only predictions and are not guarantees of performance. These statements are based on our management's beliefs and assumptions, which in turn are based on their interpretation of currently available information.
These statements involve known and unknown risks, uncertainties and other factors that may cause our results or our industry's actual results, levels of activity, performance or achievements to be materially different from the information expressed or implied by these forward-looking statements. These factors include regulatory developments in the U.S. and foreign countries; the experience of physicians regarding the effectiveness and reliability of the PAD Systems; the potential for unanticipated delays in enrolling medical centers and patients for clinical trials; actual clinical trial results; dependence on market growth; the reluctance of physicians to accept new products; the effectiveness of the Stealth 360°; the difficulty of successfully managing operating costs; FDA clearances and approvals; the impact of competitive products and pricing; approval of products for reimbursement and the level of reimbursement; unanticipated developments affecting our estimates regarding expenses, future revenues and capital requirements; fluctuations in results and expenses based on new product introductions, sales mix, unanticipated warranty claims, and the timing of project expenditures; our inability to expand our sales and marketing organization and research and development efforts; our ability to obtain and maintain intellectual property protection for product candidates; our actual financial resources; general economic conditions; and those matters identified and discussed in Item 1A of this Form 10-K under "Risk Factors."
You should read these risk factors and the other cautionary statements made in this Form 10-K as being applicable to all related forward-looking statements wherever they appear in this Form 10-K. We cannot assure you that the forward-looking statements in this Form 10-K will prove to be accurate. Furthermore, if our forward-looking statements prove to be inaccurate, the inaccuracy may be material. You should read this Form 10-K completely. Other than as required by law, we undertake no obligation to update these forward-looking statements, even though our situation may change in the future.
Item 7A. Quantitative and Qualitative Disclosures About Market Risk.
The primary objective of our investment activities is to preserve our capital for the purpose of funding operations while at the same time maximizing the income we receive from our investments without significantly increasing risk or availability. To achieve these objectives, our investment policy allows us to maintain a portfolio of cash equivalents and investments in a variety of marketable securities, including money market funds, U.S. government securities, and certain bank obligations. Our cash and cash equivalents as of June 30, 2013 include liquid money market accounts. Due to the short-term nature of these investments, we believe that there is no material exposure to interest rate risk.
43
Table of Contents
Item 8. Financial Statements and Supplementary Data.
Index to Financial Statements
| Page | |
Report of Independent Registered Public Accounting Firm |
| F-1 |
|
| |
Consolidated Balance Sheets |
| F-2 |
|
| |
Consolidated Statements of Operations |
| F-3 |
|
| |
Consolidated Statements of Changes in Stockholders' Equity and Comprehensive Loss |
| F-4 |
|
| |
Consolidated Statements of Cash Flows |
| F-5 |
|
| |
Notes to Consolidated Financial Statements |
| F-6 |
44
Table of Contents
Report of Independent Registered Public Accounting Firm
To the Board of Directors and Shareholders of
Cardiovascular Systems, Inc.
In our opinion, the accompanying consolidated balance sheets and the related consolidated statements of operations, of changes in shareholders' equity and comprehensive loss and of cash flows present fairly, in all material respects, the financial position of Cardiovascular Systems, Inc. at June 30, 2013 and 2012 , and the results of their operations and cash flows for each of the three years in the period ended June 30, 2013 in conformity with accounting principles generally accepted in the United States of America. Also in our opinion, the Company maintained, in all material respects, effective internal control over financial reporting as of June 30, 2013 , based on criteria established in Internal Control-Integrated Framework issued by the Committee of Sponsoring Organizations of the Treadway Commission (COSO). The Company's management is responsible for these financial statements, for maintaining effective internal control over financial reporting and for its assessment of the effectiveness of internal control over financial reporting, included in the accompanying Management's Report on Internal Control over Financial Reporting. Our responsibility is to express opinions on these financial statements and on the Company's internal control over financial reporting based on our integrated audits. We conducted our audits in accordance with the standards of the Public Company Accounting Oversight Board (United States). Those standards require that we plan and perform the audits to obtain reasonable assurance about whether the financial statements are free of material misstatement and whether effective internal control over financial reporting was maintained in all material respects. Our audits of the financial statements included examining, on a test basis, evidence supporting the amounts and disclosures in the financial statements, assessing the accounting principles used and significant estimates made by management, and evaluating the overall financial statement presentation. Our audit of internal control over financial reporting included obtaining an understanding of internal control over financial reporting, assessing the risk that a material weakness exists, and testing and evaluating the design and operating effectiveness of internal control based on the assessed risk. Our audits also included performing such other procedures as we considered necessary in the circumstances. We believe that our audits provide a reasonable basis for our opinions.
A company's internal control over financial reporting is a process designed to provide reasonable assurance regarding the reliability of financial reporting and the preparation of financial statements for external purposes in accordance with generally accepted accounting principles. A company's internal control over financial reporting includes those policies and procedures that (i) pertain to the maintenance of records that, in reasonable detail, accurately and fairly reflect the transactions and dispositions of the assets of the company; (ii) provide reasonable assurance that transactions are recorded as necessary to permit preparation of financial statements in accordance with generally accepted accounting principles, and that receipts and expenditures of the company are being made only in accordance with authorizations of management and directors of the company; and (iii) provide reasonable assurance regarding prevention or timely detection of unauthorized acquisition, use, or disposition of the company's assets that could have a material effect on the financial statements.
Because of its inherent limitations, internal control over financial reporting may not prevent or detect misstatements. Also, projections of any evaluation of effectiveness to future periods are subject to the risk that controls may become inadequate because of changes in conditions, or that the degree of compliance with the policies or procedures may deteriorate.
/s/ PricewaterhouseCoopers LLP
Minneapolis, MN
September 10, 2013
F-1
Table of Contents
Cardiovascular Systems, Inc.
Consolidated Balance Sheets
| June 30, |
| June 30, | ||||
| (Dollars in thousands, except per share and share amounts) | ||||||
ASSETS |
|
|
| ||||
Current assets |
|
|
| ||||
Cash and cash equivalents | $ | 67,897 | |
| $ | 35,529 | |
Accounts receivable, net | 14,730 | |
| 13,644 | | ||
Inventories | 6,243 | |
| 7,061 | | ||
Prepaid expenses and other current assets | 959 | |
| 1,536 | | ||
Total current assets | 89,829 | |
| 57,770 | | ||
Property and equipment, net | 2,999 | |
| 2,163 | | ||
Patents, net | 3,219 | |
| 2,635 | | ||
Debt conversion option and other assets | 850 | |
| 556 | | ||
Total assets | $ | 96,897 | |
| $ | 63,124 | |
LIABILITIES AND STOCKHOLDERS' EQUITY |
|
|
| ||||
Current liabilities |
|
|
| ||||
Current maturities of long-term debt | $ | 5,095 | |
| $ | 4,678 | |
Accounts payable | 7,230 | |
| 5,610 | | ||
Deferred grant incentive | 156 | |
| 302 | | ||
Accrued expenses | 9,932 | |
| 7,262 | | ||
Total current liabilities | 22,413 | |
| 17,852 | | ||
Long-term liabilities |
|
|
| ||||
Long-term debt, net of current maturities | 7,472 | |
| 12,842 | | ||
Other liabilities | 180 | |
| 241 | | ||
Total long-term liabilities | 7,652 | |
| 13,083 | | ||
Total liabilities | 30,065 | |
| 30,935 | | ||
Commitments and contingencies | |
| | ||||
Common stock, $0.001 par value at June 30, 2013 and 2012; authorized 100,000,000 common shares at June 30, 2013 and 2012; issued and outstanding 24,382,025 at June 30, 2013 and 20,089,556 at June 30, 2012 | 24 | |
| 20 | | ||
Additional paid in capital | 261,722 | |
| 201,793 | | ||
Common stock warrants | 8,361 | |
| 9,614 | | ||
Accumulated deficit | (203,275 | ) |
| (179,238 | ) | ||
Total stockholders' equity | 66,832 | |
| 32,189 | | ||
Total liabilities and stockholders' equity | $ | 96,897 | |
| $ | 63,124 | |
The accompanying notes are an integral part of these consolidated financial statements.
F-2
Table of Contents
Cardiovascular Systems, Inc.
Consolidated Statements of Operations
| Year Ended June 30, | ||||||||||
| 2013 |
| 2012 |
| 2011 | ||||||
| (Dollars in thousands, except per share and share amounts) | ||||||||||
Revenues | $ | 103,897 | |
| $ | 82,490 | |
| $ | 78,780 | |
Cost of goods sold | 24,382 | |
| 19,216 | |
| 16,277 | | |||
Gross profit | 79,515 | |
| 63,274 | |
| 62,503 | | |||
Expenses |
|
|
|
|
| ||||||
Selling, general and administrative | 86,718 | |
| 66,366 | |
| 62,372 | | |||
Research and development | 15,216 | |
| 11,374 | |
| 8,940 | | |||
Total expenses | 101,934 | |
| 77,740 | |
| 71,312 | | |||
Loss from operations | (22,419 | ) |
| (14,466 | ) |
| (8,809 | ) | |||
Interest and other, net | (1,618 | ) |
| (2,324 | ) |
| (2,316 | ) | |||
Net loss | $ | (24,037 | ) |
| $ | (16,790 | ) |
| $ | (11,125 | ) |
Loss per common share |
|
|
|
|
| ||||||
Basic and diluted | $ | (1.11 | ) |
| $ | (0.93 | ) |
| $ | (0.70 | ) |
Weighted average common shares used in computation |
|
|
|
|
| ||||||
Basic and diluted | 21,685,932 | |
| 18,035,635 | |
| 15,915,800 | | |||
The accompanying notes are an integral part of these consolidated financial statements.
F-3
Table of Contents
Cardiovascular Systems, Inc.
Consolidated Statements of Changes in Stockholders' Equity and Comprehensive Loss
| Common Stock |
| Additional Paid In Capital |
| Warrants |
| Accumulated Deficit |
| Total |
| Comprehensive Loss | |||||||||||||||
| Shares |
| Amount |
|
|
| ||||||||||||||||||||
| (Dollars in thousands, except per share and share amounts) | |||||||||||||||||||||||||
Balances at June 30, 2010 | 15,148,549 | |
| $ | 15 | |
| $ | 157,718 | |
| $ | 11,305 | |
| $ | (151,323 | ) |
| $ | 17,715 | |
| $ | (23,904 | ) |
Stock-based compensation related to restricted stock awards, net | 604,249 | |
| 1 | |
| 4,814 | |
|
|
|
|
| 4,815 | |
|
| |||||||||
Stock-based compensation related to stock options |
|
|
|
| 1,306 | |
|
|
|
|
| 1,306 | |
|
| |||||||||||
Exercise of stock options and warrants at $5.43-$8.83 per share | 435,709 | |
|
|
| 3,234 | |
| (1,606 | ) |
|
|
| 1,628 | |
|
| |||||||||
Issuance/expiration of common stock warrants |
|
|
|
| 6 | |
| 210 | |
|
|
| 216 | |
|
| ||||||||||
Employee Stock Purchase Plan Activity | 160,000 | |
|
|
| 1,313 | |
|
|
|
|
| 1,313 | |
|
| ||||||||||
Conversion of convertible debt | 638,561 | |
| 1 | |
| 5,530 | |
|
|
|
|
| 5,531 | |
|
| |||||||||
Beneficial conversion feature on convertible debt |
|
|
|
| 236 | |
|
|
|
|
| 236 | |
|
| |||||||||||
Net loss and comprehensive loss |
|
|
|
|
|
|
|
| (11,125 | ) |
| (11,125 | ) |
| (11,125 | ) | ||||||||||
Balances at June 30, 2011 | 16,987,068 | |
| $ | 17 | |
| $ | 174,157 | |
| $ | 9,909 | |
| $ | (162,448 | ) |
| $ | 21,635 | |
| $ | (11,125 | ) |
Stock-based compensation related to restricted stock awards, net | 564,068 | |
| 1 | |
| 4,754 | |
|
|
|
|
| 4,755 | |
|
| |||||||||
Exercise of stock options and warrants at $7.90-$12.15 per share | 548,097 | |
|
|
| 5,261 | |
| (776 | ) |
|
|
| 4,485 | |
|
| |||||||||
Issuance/expiration of common stock warrants |
|
|
|
| 16 | |
| 481 | |
|
|
| 497 | |
|
| ||||||||||
Employee Stock Purchase Plan Activity | 170,000 | |
|
|
| 2,118 | |
|
|
|
|
| 2,118 | |
|
| ||||||||||
Conversion of convertible debt | 40,323 | |
|
|
| 600 | |
|
|
|
|
| 600 | |
|
| ||||||||||
Sale of common stock, net of issuance costs of $1,131 | 1,780,000 | |
| 2 | |
| 14,887 | |
|
|
|
|
| 14,889 | |
|
| |||||||||
Net loss and comprehensive loss |
|
|
|
|
|
|
|
| (16,790 | ) |
| (16,790 | ) |
| (16,790 | ) | ||||||||||
Balances at June 30, 2012 | 20,089,556 | |
| $ | 20 | |
| $ | 201,793 | |
| $ | 9,614 | |
| $ | (179,238 | ) |
| $ | 32,189 | |
| $ | (16,790 | ) |
Stock-based compensation related to restricted stock awards, net | 799,465 | |
| 1 | |
| 7,240 | |
|
|
|
|
| 7,241 | |
|
| |||||||||
Exercise of stock options and warrants at $7.90-$13.98 per share | 681,889 | |
| 1 | |
| 7,179 | |
| (1,253 | ) |
|
|
| 5,927 | |
|
| ||||||||
Employee Stock Purchase Plan Activity | 180,000 | |
|
|
| 2,403 | |
|
|
|
|
| 2,403 | |
|
| ||||||||||
Conversion of convertible debt | 331,115 | |
|
|
| 4,900 | |
|
|
|
|
| 4,900 | |
|
| ||||||||||
Sale of common stock, net of issuance costs of $2,125 | 2,300,000 | |
| 2 | |
| 38,207 | |
|
|
|
|
| 38,209 | |
|
| |||||||||
Net loss and comprehensive loss |
|
|
|
|
|
|
|
| (24,037 | ) |
| (24,037 | ) |
| (24,037 | ) | ||||||||||
Balances at June 30, 2013 | 24,382,025 | |
| $ | 24 | |
| $ | 261,722 | |
| $ | 8,361 | |
| $ | (203,275 | ) |
| $ | 66,832 | |
| $ | (24,037 | ) |
The accompanying notes are an integral part of these consolidated financial statements.
F-4
Table of Contents
Cardiovascular Systems, Inc.
Consolidated Statements of Cash Flows
| Year Ended June 30, | ||||||||||
| 2013 |
| 2012 |
| 2011 | ||||||
| (Dollars in thousands) | ||||||||||
Cash flows from operating activities |
| ||||||||||
Net loss | $ | (24,037 | ) |
| $ | (16,790 | ) |
| $ | (11,125 | ) |
Adjustments to reconcile net loss to net cash used in operations |
|
|
|
|
| ||||||
Depreciation of property and equipment | 903 | |
| 817 | |
| 662 | | |||
Provision for (recoveries of) doubtful accounts | 195 | |
| 60 | |
| (36 | ) | |||
Amortization of patents | 70 | |
| 55 | |
| 54 | | |||
Write-off of patent costs | 130 | |
| 162 | |
| - | | |||
Amortization of debt premium | (59 | ) |
| (68 | ) |
| (25 | ) | |||
Debt conversion and valuation of conversion options, net | 181 | |
| 736 | |
| 859 | | |||
Stock-based compensation | 7,442 | |
| 5,165 | |
| 6,468 | | |||
Other | - | |
| 260 | |
| 250 | | |||
Changes in assets and liabilities |
|
|
|
|
| ||||||
Accounts receivable | (1,281 | ) |
| (391 | ) |
| (3,718 | ) | |||
Inventories | 818 | |
| (1,243 | ) |
| (1,499 | ) | |||
Prepaid expenses and other assets | 925 | |
| (379 | ) |
| 323 | | |||
Accounts payable | 1,484 | |
| 269 | |
| 1,828 | | |||
Accrued expenses and other liabilities | 2,464 | |
| 7 | |
| (2,402 | ) | |||
Net cash used in operations | (10,765 | ) |
| (11,340 | ) |
| (8,361 | ) | |||
Cash flows from investing activities |
| ||||||||||
Expenditures for property and equipment | (1,672 | ) |
| (437 | ) |
| (1,081 | ) | |||
Patent acquisition costs | (783 | ) |
| (538 | ) |
| (656 | ) | |||
Net cash used in investing activities | (2,455 | ) |
| (975 | ) |
| (1,737 | ) | |||
Cash flows from financing activities |
| ||||||||||
Issuance of common stock under employee stock purchase plan | 1,752 | |
| 1,418 | |
| 965 | | |||
Exercise of stock options and warrants | 5,927 | |
| 4,428 | |
| 1,523 | | |||
Proceeds from long-term debt | 4,500 | |
| 7,885 | |
| 7,500 | | |||
Payments on long-term debt | (4,800 | ) |
| (1,935 | ) |
| (2,448 | ) | |||
Proceeds from sale of common stock, net of issuance costs | 38,209 | |
| 14,889 | |
| - | | |||
Net cash provided by financing activities | 45,588 | |
| 26,685 | |
| 7,540 | | |||
Net change in cash and cash equivalents | 32,368 | |
| 14,370 | |
| (2,558 | ) | |||
Cash and cash equivalents |
| ||||||||||
Beginning of period | 35,529 | |
| 21,159 | |
| 23,717 | | |||
End of period | $ | 67,897 | |
| $ | 35,529 | |
| $ | 21,159 | |
Noncash investing and financing activities |
| ||||||||||
Issuance and expiration of common stock warrants | $ | - | |
| $ | 497 | |
| $ | 216 | |
Beneficial conversion feature on convertible debt | 108 | |
| 28 | |
| 236 | | |||
Board retainer fees paid in stock | 340 | |
| - | |
| - | | |||
Equipment included in accounts payable | 66 | |
| 160 | |
| - | | |||
Conversion of convertible debt | 4,900 | |
| 600 | |
| 5,531 | | |||
Net exercise of common stock warrants | 1,130 | |
| 335 | |
| 1,505 | | |||
Premium on convertible debt | 304 | |
| 267 | |
| 1,263 | | |||
Other | - | |
| - | |
| 250 | | |||
Supplemental cash flow information |
| ||||||||||
Interest paid | $ | 1,132 | |
| $ | 1,383 | |
| $ | 1,447 | |
The accompanying notes are an integral part of these consolidated financial statements.
F-5
CARDIOVASCULAR SYSTEMS, INC.
NOTES TO CONSOLIDATED FINANCIAL STATEMENTS
(dollars in thousands, except per share and share amounts)
1. Summary of Significant Accounting Policies
Company Description
Cardiovascular Systems, Inc. was incorporated as Replidyne, Inc. in Delaware in 2000 . On February 25, 2009, Replidyne, Inc. completed its reverse merger with Cardiovascular Systems, Inc., a Minnesota corporation incorporated in 1989 ("CSI-MN"), in accordance with the terms of the Agreement and Plan of Merger and Reorganization, dated as of November 3, 2008 (the "Merger Agreement"). Pursuant to the Merger Agreement, CSI-MN continued after the merger as the surviving corporation and a wholly-owned subsidiary of Replidyne. At the effective time of the merger, Replidyne, Inc. changed its name to Cardiovascular Systems, Inc. ("CSI") and CSI-MN merged with and into CSI, with CSI continuing after the merger as the surviving corporation. These transactions are referred to herein as the "merger."
The Company develops, manufactures and markets devices for the treatment of vascular diseases. The Company's primary products, the Stealth 360° PAD System, the Diamondback 360° PAD System, and the Diamondback Predator 360° PAD System, are catheter-based platforms capable of treating a broad range of plaque types in leg arteries both above and below the knee and address many of the limitations associated with existing treatment alternatives.
Principles of Consolidation
The consolidated balance sheets, statements of operations, changes in stockholders' equity and comprehensive loss, and cash flows include the accounts of the Company and its wholly-owned subsidiary, after elimination of all intercompany transactions and accounts.
Cash and Cash Equivalents
The Company considers all money market funds and other investments purchased with an original maturity of three months or less to be cash and cash equivalents.
Accounts Receivable and Allowance for Doubtful Accounts
Trade accounts receivable are recorded at the invoiced amount and do not bear interest. Customer credit terms are established prior to shipment with the general standard being net 30 days. Collateral or any other security to support payment of these receivables generally is not required. The Company maintains an allowance for doubtful accounts. This allowance is an estimate and is regularly evaluated by the Company for adequacy by taking into consideration factors such as past experience, credit quality of the customer base, age of the receivable balances, both individually and in the aggregate, and current economic conditions that may affect a customer's ability to pay. Provisions for the allowance for doubtful accounts attributed to bad debt are recorded in general and administrative expenses. The following table shows allowance for doubtful accounts activity for the fiscal years ended June 30, 2013 and 2012 :
| Amount | ||
Balances at June 30, 2011 | $ | 351 | |
Provision for doubtful accounts | 60 | | |
Write-offs | (19 | ) | |
Balances at June 30, 2012 | 392 | | |
Provision for doubtful accounts | 195 | | |
Write-offs | (129 | ) | |
Balances at June 30, 2013 | $ | 458 | |
Inventories
Inventories are stated at the lower of cost or market with cost determined on a first-in, first-out ("FIFO") method of valuation. The establishment of inventory allowances for excess and obsolete inventories is based on estimated exposure on specific inventory items.
F-6
CARDIOVASCULAR SYSTEMS, INC.
NOTES TO CONSOLIDATED FINANCIAL STATEMENTS - (Continued)
Property and Equipment
Property and equipment is carried at cost, less accumulated depreciation and amortization. Depreciation is computed using the straight-line method over estimated useful lives of five years for production equipment and furniture and fixtures; three years for computer equipment and software; and the shorter of their estimated useful lives or the lease term for leasehold improvements. Expenditures for maintenance and repairs and minor renewals and betterments which do not extend or improve the life of the respective assets are expensed as incurred. All other expenditures for renewals and betterments are capitalized. The assets and related depreciation accounts are adjusted for property retirements and disposals with the resulting gains or losses included in the consolidated statement of operations.
Patents
The capitalized costs incurred to obtain patents are amortized using the straight-line method over their remaining estimated lives. Patent amortization begins at the time of patent application approval, and does not exceed 20 years. The recoverability of capitalized patent costs is dependent upon the Company's ability to derive revenue-producing products from such patents or the ultimate sale or licensing of such patent rights. Patents that are abandoned are written off at the time of abandonment.
Long-Lived Assets
The Company regularly evaluates the carrying value of long-lived assets for events or changes in circumstances that indicate that the carrying amount may not be recoverable or that the remaining estimated useful life should be changed. An impairment loss is recognized when the carrying amount of an asset exceeds the anticipated future undiscounted cash flows expected to result from the use of the asset and its eventual disposition. The amount of the impairment loss to be recorded, if any, is calculated by the excess of the asset's carrying value over its fair value.
Operating Leases
The Company leases manufacturing and office space under operating lease agreements. One lease contains rent escalation clauses for which the lease expense is recognized on a straight-line basis over the lease term. Rent expense that is recognized but not yet paid is included in other liabilities on the consolidated balance sheets.
Revenue Recognition
The Company sells the majority of its products via direct shipment to hospitals or clinics. The Company recognizes revenue when all of the following criteria are met: persuasive evidence of an arrangement exists; delivery has occurred; the sales price is fixed or determinable; and collectability is reasonably assured. The Company records estimated sales returns, discounts and rebates as a reduction of net sales in the same period revenue is recognized.
Costs related to products delivered are recognized in the period revenue is recognized. Cost of goods sold consists primarily of raw materials, direct labor, and manufacturing overhead.
Warranty Costs
The Company provides its customers with the right to receive a replacement if a product is determined to be defective at the time of shipment. Warranty reserve provisions are estimated based on Company experience, volume, and expected warranty claims. Warranty reserve, provisions and claims for the fiscal years ended June 30, 2013 and 2012 were as follows:
| Amount | ||
Balances at June 30, 2011 | $ | 70 | |
Provision | 297 | | |
Claims | (264 | ) | |
Balances at June 30, 2012 | 103 | | |
Provision | 327 | | |
Claims | (314 | ) | |
Balances at June 30, 2013 | $ | 116 | |
F-7
CARDIOVASCULAR SYSTEMS, INC.
NOTES TO CONSOLIDATED FINANCIAL STATEMENTS - (Continued)
Income Taxes
Deferred income taxes are recorded to reflect the tax consequences in future years of differences between the tax bases of assets and liabilities and their financial reporting amounts based on enacted tax rates applicable to the periods in which the differences are expected to affect taxable income. Valuation allowances are established when necessary to reduce deferred tax assets to the amount expected to be realized.
Developing a provision for income taxes, including the effective tax rate and the analysis of potential tax exposure items, if any, requires significant judgment and expertise in federal and state income tax laws, regulations and strategies, including the determination of deferred tax assets. The Company's judgment and tax strategies are subject to audit by various taxing authorities.
Accounting guidance requires that accounting for uncertainty in income taxes is recognized in the financial statements. The guidance provides that a tax benefit from an uncertain tax position may be recognized when it is more likely than not that the position will be sustained upon examination, including resolutions of any related appeals or litigation processes, based on the technical merits of the position. Income tax positions must meet a more-likely-than-not recognition threshold to be recognized. The guidance also provides guidance on measurement, derecognition, classification, interest and penalties, accounting in interim periods, disclosure and transition.
Research and Development Expenses
Research and development expenses include costs associated with the design, development, testing, enhancement and regulatory approval of the Company's products. Research and development expenses include employee compensation, including stock-based compensation, supplies and materials, consulting expenses, patent amortization, travel and facilities overhead. The Company also incurs significant expenses to operate clinical trials, including trial design, third-party fees, clinical site reimbursement, data management and travel expenses. Research and development expenses are expensed as incurred. Approved patent applications are capitalized and amortized using the straight-line method over their remaining estimated lives. Patent amortization begins at the time of patent application approval, and does not exceed 20 years .
Concentration of Credit Risk
Financial instruments that potentially expose the Company to concentration of credit risk consist primarily of cash and cash equivalents and accounts receivable. The Company maintains its cash balances primarily with one financial institution. These balances exceed federally insured limits. The Company has not experienced any losses in such accounts and believes it is not exposed to any significant credit risk in cash and cash equivalents.
Fair Value of Financial Instruments
Under the authoritative guidance for fair value measurements, fair value is defined as the exit price, or the amount that would be received to sell an asset or paid to transfer a liability in an orderly transaction between market participants as of the measurement date. The authoritative guidance also establishes a hierarchy for inputs used in measuring fair value that maximizes the use of observable inputs and minimizes the use of unobservable inputs by requiring that the most observable inputs be used when available. Observable inputs are inputs market participants would use in valuing the asset or liability developed based on market data obtained from sources independent of the Company. Unobservable inputs are inputs that reflect the Company's assumptions about the factors market participants would use in valuing the asset or liability developed based upon the best information available in the circumstances. The categorization of financial assets and financial liabilities within the valuation hierarchy is based upon the lowest level of input that is significant to the fair value measurement. The hierarchy is broken down into three levels defined as follows:
Level 1 Inputs - quoted prices in active markets for identical assets and liabilities
Level 2 Inputs - observable inputs other than quoted prices in active markets for identical assets and liabilities
Level 3 Inputs - unobservable inputs
F-8
CARDIOVASCULAR SYSTEMS, INC.
NOTES TO CONSOLIDATED FINANCIAL STATEMENTS - (Continued)
The following table sets forth the fair value of the Company's financial instruments that were measured on a recurring basis as of June 30, 2013 . Assets are measured on a recurring basis if they are remeasured at least annually:
| Debt Conversion Option | ||
Balance at June 30, 2011 | $ | 925 | |
Issuance of convertible notes | 295 | | |
Conversion of convertible notes | (182 | ) | |
Change in conversion option valuation | (554 | ) | |
Balance at June 30, 2012 | 484 | | |
Issuance of convertible notes | 413 | | |
Conversion of convertible notes | (551 | ) | |
Change in conversion option valuation | 370 | | |
Balance at June 30, 2013 | $ | 716 | |
The fair value of the debt conversion option is related to the loan and security agreement with Partners for Growth (described in Note 3) and has been included as a component of debt conversion option and other assets on the balance sheet. The Monte Carlo option pricing model used to determine the value of the debt conversion option included various inputs including expected volatility, stock price simulations, and assessed behavior of the Company and Partners for Growth based on those simulations. Based upon these inputs, the Company considers the conversion option to be a Level 3 investment. Significant changes in any of these inputs in isolation would result in a significant change in the fair value measurement. The following assumptions were utilized in determining the fair value at June 30, 2013 :
| June 30, 2013 | |
Risk-free interest rate | 0.32 | % |
Contractual term | 1.79 years | |
Expected volatility | 51.1 | % |
As of June 30, 2013 , the Company believes that the carrying amounts of its other financial instruments, including accounts receivable, accounts payable and accrued liabilities, approximate their fair value due to the short-term maturities of these instruments. The carrying amount of long-term debt approximates fair value based on interest rates currently available for debt with similar terms and maturities.
Use of Estimates
The preparation of the Company's consolidated financial statements in conformity with accounting principles generally accepted in the United States of America requires management to make estimates and assumptions that affect the reported amounts of assets and liabilities and disclosure of contingent assets and liabilities at the date of the financial statements and the reported amounts of revenues and expenses during the reporting period. Actual results could differ from those estimates.
Stock-Based Compensation
The Company recognizes stock-based compensation expense in an amount equal to the fair value of share-based payments computed at the date of grant. The fair value of all stock option and restricted stock awards are expensed in the consolidated statements of operations ratably over the related vesting period.
Recent Accounting Pronouncements
In June 2011, the FASB issued guidance requiring that all non-owner changes in stockholders' equity be presented either in a single continuous statement of comprehensive income or in two separate but consecutive statements. In the two-statement approach, the first statement should present total net income and its components followed consecutively by a second statement that should present total other comprehensive income, the components of other comprehensive income, and the total of comprehensive income. The new guidance became effective for the Company beginning July 1, 2012. Other than requiring additional disclosures, there have not been material impacts on the Company's consolidated financial statements upon adoption as the Company has no other comprehensive income.
F-9
CARDIOVASCULAR SYSTEMS, INC.
NOTES TO CONSOLIDATED FINANCIAL STATEMENTS - (Continued)
In July 2013, the FASB issued Accounting Standards Update (ASU) 2013-11, "Presentation of an Unrecognized Tax Benefit When a Net Operating Loss Carryforward, a Similar Tax Loss, or a Tax Credit Carryforward Exists." The amendments in ASU 2013-11 require companies to present an unrecognized tax benefit, or a portion thereof, as a reduction to a deferred tax asset for a net operating loss (NOL) carryforward or a similar tax loss or tax credit carryforward, unless the uncertain tax position is not available to reduce, or would not be used to reduce, the NOL or carryforward under the tax law in the same jurisdiction; otherwise, the unrecognized tax benefit should be presented as a gross liability and should not net the unrecognized tax benefit with a deferred tax asset. ASU 2013-11 is effective for annual periods beginning after December 15, 2013 and should be applied to all unrecognized tax benefits that exist as of the effective date. Companies may choose to apply this guidance retrospectively to each prior reporting period presented. T he Company does not anticipate a material impact on its consolidated financial statements upon adoption.
2. Selected Consolidated Financial Statement Information
| June 30, | ||||||
| 2013 |
| 2012 | ||||
Accounts Receivable |
|
|
| ||||
Accounts receivable | $ | 15,188 | |
| $ | 14,036 | |
Less: Allowance for doubtful accounts | (458 | ) |
| (392 | ) | ||
| $ | 14,730 | |
| $ | 13,644 | |
Inventories |
|
|
| ||||
Raw materials | $ | 2,477 | |
| $ | 2,558 | |
Work in process | 688 | |
| 1,022 | | ||
Finished goods | 3,078 | |
| 3,481 | | ||
| $ | 6,243 | |
| $ | 7,061 | |
Property and equipment |
|
|
| ||||
Equipment | $ | 5,914 | |
| $ | 4,564 | |
Furniture | 490 | |
| 318 | | ||
Leasehold improvements | 217 | |
| 180 | | ||
| 6,621 | |
| 5,062 | | ||
Less: Accumulated depreciation and amortization | (3,622 | ) |
| (2,899 | ) | ||
| $ | 2,999 | |
| $ | 2,163 | |
Patents |
|
|
| ||||
Patents | $ | 3,801 | |
| $ | 3,145 | |
Less: Accumulated amortization | (582 | ) |
| (510 | ) | ||
| $ | 3,219 | |
| $ | 2,635 | |
F-10
CARDIOVASCULAR SYSTEMS, INC.
NOTES TO CONSOLIDATED FINANCIAL STATEMENTS - (Continued)
As of June 30, 2013 , future estimated amortization of patents and patent licenses will be:
2014 | $ | 84 | |
2015 | 84 | | |
2016 | 79 | | |
2017 | 73 | | |
2018 | 68 | | |
Thereafter | 2,831 | | |
| $ | 3,219 | |
This future amortization expense is an estimate. Actual amounts may vary from these estimated amounts due to additional intangible asset acquisitions, approval of patents-in-process, potential impairment, accelerated amortization or other events.
| June 30, | ||||||
| 2013 |
| 2012 | ||||
Accrued expenses | |
| | ||||
Salaries and bonus | $ | 2,038 | |
| $ | 1,034 | |
Commissions | 4,956 | |
| 4,087 | | ||
Accrued vacation | 2,151 | |
| 1,592 | | ||
Other | 787 | |
| 549 | | ||
| $ | 9,932 | |
| $ | 7,262 | |
3. Debt
Loan and Security Agreement with Silicon Valley Bank
On March 29, 2010, the Company entered into an amended and restated loan and security agreement with Silicon Valley Bank. The agreement was amended on December 27, 2011 to increase outstanding borrowings, and subsequently amended on June 29, 2012 to modify financial covenants and reduce the interest rate and other fees and May 10, 2013 to modify financial covenants. The agreement, as amended, includes a $12,000 term loan and a $15,000 line of credit. The terms of each of these loans are as follows:
• | The $12,000 term loan has an initial interest rate of 8.0% , which can be reduced to 7.0% based on the achievement of positive EBITDA for the trailing six month period. The term loan has a maturity of 36 months , with repayment terms that include interest only payments during the first six months , followed by 30 equal principal payments of $400 plus interest, and a final payment of $100 due at maturity. This term loan also includes an acceleration provision that requires the Company to pay the entire outstanding balance, plus a penalty ranging from 1.0% to 3.0% of the commitment amount, upon prepayment or the occurrence and continuance of an event of default. The balance outstanding on the term loan at June 30, 2013 and 2012 was $7,017 and $11,694 , respectively, net of the unamortized discount associated with warrants issued to Silicon Valley Bank in connection with the loan. The unamortized discount associated with warrants and other fees paid to the lender will be amortized over the 36 months maturity period. See Note 6 for additional information. |
• | The $15,000 line of credit expires on June 30, 2014 and has a floating interest rate equal to the Wall Street Journal's prime rate, plus 1.25% , with an interest rate floor of 4.5% . Interest on borrowings is due monthly and the principal balance is due at maturity. Borrowings on the line of credit are based on 85% of eligible accounts. Accounts receivable receipts are deposited into a lockbox account in the name of Silicon Valley Bank. The line of credit is subject to non-use fees, annual fees, and cancellation fees. There was not an outstanding balance on the line of credit at June 30, 2013 . |
Borrowings from Silicon Valley Bank are secured by all of the Company's assets. The borrowings are subject to prepayment penalties and financial covenants, including maintaining certain liquidity and fixed charge coverage ratios. The Company was in compliance with all financial covenants as of June 30, 2013 . Any non-compliance by the Company under the terms of debt arrangements could result in an event of default under the Silicon Valley Bank loan, which, if not cured, could result in the acceleration of this debt.
F-11
CARDIOVASCULAR SYSTEMS, INC.
NOTES TO CONSOLIDATED FINANCIAL STATEMENTS - (Continued)
Loan and Security Agreement with Partners for Growth
On April 14, 2010, the Company entered into a loan and security agreement with Partners for Growth III, L.P. (PFG), as amended on August 23, 2011, December 27, 2011, June 30, 2012 and May 10, 2013. The amended agreement provides that PFG will make loans to the Company up to $5,000 . The agreement has a maturity date of April 14, 2015. The loans bear interest at a floating per annum rate equal to 2.75% above Silicon Valley Bank's prime rate, and such interest is payable monthly. The principal balance of and any accrued and unpaid interest on any notes are due on the maturity date and may not be prepaid by the Company at any time in whole or in part.
As of June 30, 2013 , PFG has provided the Company with the following five loans totaling $5,000 that are outstanding:
Date of Loan | Amount of Loan | Conversion Price | ||||
August 4, 2011 (as amended August 24, 2011) | $ | 500 | | $ | 15.30 | |
February 7, 2013 | $ | 1,000 | | $ | 15.26 | |
February 19, 2013 | $ | 1,500 | | $ | 15.53 | |
February 27, 2013 | $ | 1,500 | | $ | 15.80 | |
March 6, 2013 | $ | 500 | | $ | 15.94 | |
At any time prior to the maturity date, PFG may at its option convert any of the outstanding loans into shares of the Company's common stock at the applicable conversion price, which in each case equaled the ten -day volume weighted average price per share of the Company's common stock prior to the issuance date of each note. The Company may also effect at any time a mandatory conversion of amounts, subject to certain terms, conditions and limitations provided in the agreement, including a requirement that the ten -day volume weighted average price of the Company's common stock prior to the date of conversion is at least 15% greater than the conversion price. The Company may reduce the conversion price to a price that represents a 15% discount to the ten -day volume weighted average price of its common stock to satisfy this condition and effect a mandatory conversion. The Company recorded a benefit (expense) of $370 and $(554) for the years ended June 30, 2013 and 2012 related to the change in fair value of the conversion options on all outstanding loans. This amount is a component of interest and other, net on the accompanying statement of operations. The balance outstanding under the loan and security agreement at June 30, 2013 and 2012 was $5,300 and $5,575 , respectively, including the net unamortized premium. The net unamortized premium associated with the loan, a beneficial conversion feature, and other fees paid to the lender is being amortized over the remaining maturity period.
During the years ended June 30, 2013 and 2012 , PFG converted various loans, in accordance with the conversion terms set forth in the agreement, as follows:
Date of Conversion | Amount Converted | Shares Issued Upon Conversion | |||
July 26, 2011 | $ | 500 | | 40,323 | |
February 1, 2013 | $ | 1,000 | | 74,516 | |
February 7, 2013 | $ | 500 | | 36,657 | |
February 11, 2013 | $ | 1,000 | | 73,314 | |
February 20, 2013 | $ | 1,000 | | 73,314 | |
February 21, 2013 | $ | 500 | | 36,657 | |
February 26, 2013 | $ | 500 | | 36,657 | |
Following these conversions, PFG provided us with new loans under the existing loan and security agreement, included in the table of outstanding loans above.
The loans are secured by certain of the Company's assets, and the agreement contains customary covenants limiting the Company's ability to, among other things, incur debt or liens, make certain investments and loans, effect certain redemptions of and declare and pay certain dividends on its stock, permit or suffer certain change of control transactions, dispose of collateral, or change the nature of its business. In addition, the PFG loan and security agreement contains financial covenants requiring the Company to maintain certain liquidity and fixed charge coverage ratios. The Company was in compliance with all financial covenants at June 30, 2013 . If the Company does not comply with the various covenants, PFG may, subject to various customary cure rights, decline to provide additional loans, require amortization of the loan over its remaining term, or require the immediate payment of all amounts outstanding under the loan and foreclose on any or all collateral, depending on which financial covenants are not maintained.
F-12
CARDIOVASCULAR SYSTEMS, INC.
NOTES TO CONSOLIDATED FINANCIAL STATEMENTS - (Continued)
As of June 30, 2013 , debt maturities (including debt discount and premium) were as follows:
2014 | $ | 5,050 | |
2015 | 7,400 | | |
Total | 12,450 | | |
Less: Current maturities | (5,095 | ) | |
Long-term debt (excluding net unamortized premium) | 7,355 | | |
Add: Net unamortized premium and discounts | 117 | | |
Long-term debt | $ | 7,472 | |
Subsequent to June 30, 2013 , PFG converted the $500 loan dated August 4, 2011 for 32,680 shares of the Company's common stock at a conversion price of $15.30 .
4. Interest and Other, Net
Interest and other, net, includes the following:
| Year Ended June 30, | ||||||||||
| 2013 |
| 2012 |
| 2011 | ||||||
Interest expense, including premium and discount amortization | $ | (1,345 | ) |
| $ | (1,356 | ) |
| $ | (1,417 | ) |
Interest income | 28 | |
| 5 | |
| 12 | | |||
Change in fair value of conversion option | 370 | |
| (554 | ) |
| 491 | | |||
Net write-offs upon conversion (option and unamortized premium) | (551 | ) |
| (182 | ) |
| (1,350 | ) | |||
Other | (120 | ) |
| (237 | ) |
| (52 | ) | |||
Total | $ | (1,618 | ) |
| $ | (2,324 | ) |
| $ | (2,316 | ) |
5. Equity Offerings
On March 25, 2013, the Company, in a registered underwritten public offering, sold 2,300,000 shares of its common stock at $17.60 per share. Net proceeds to the Company, after deducting underwriting discounts, commissions, and estimated expenses, were $38,209 .
On May 22, 2012, the Company, in a registered underwritten public offering, sold 1,780,000 shares of its common stock at $9.00 per share. Net proceeds to the Company, after deducting underwriting discounts, commissions, and estimated expenses, were $14,889 .
6. Common Stock Warrants
In connection with, and as additional consideration for, the December 27, 2011 amendment to the amended and restated loan agreement with Silicon Valley Bank, the Company issued Silicon Valley Bank a warrant to purchase 12,760 shares of the Company's common stock at an exercise price of $9.796 per share. The fair value of this warrant was $91 . Additionally, in connection with an amendment to the loan and security agreement with PFG, on December 27, 2011, the Company issued Silicon Valley Bank a warrant to purchase 24,900 shares of the Company's common stock at an exercise price of $9.33 per share. This fair value of this warrant was $136 . In connection with the amendment to the loan and security agreement with PFG on December 27, 2011, the Company issued PFG a warrant to purchase 23,151 shares of Company common stock and issued PFG Equity Investors, LLC a warrant to purchase 3,396 shares of Company common stock, all at an exercise price of $9.33 per share. The fair value of this warrant was $145 . On June 29, 2012, in connection with and as additional consideration for entering into a subsequent amendment to the amended and restated loan agreement with Silicon Valley Bank, the company issued a warrant to purchase 18,649 shares of the Company's common stock to Silicon Valley Bank at an exercise price of $9.652 per share. The fair value of this warrant was $125 .
F-13
CARDIOVASCULAR SYSTEMS, INC.
NOTES TO CONSOLIDATED FINANCIAL STATEMENTS - (Continued)
During the year ended June 30, 2010, the Company entered into a loan and security agreement with Partners for Growth III, L.P. In connection with this agreement the Company issued PFG a warrant to purchase 66,299 shares of the Company's common stock at an exercise price of $5.43 per share. In connection with the same agreement, PFG Equity Investors, LLC and Silicon Valley Bank were also issued warrants to purchase 9,724 and 71,307 shares of Company common stock, respectively, at an exercise price of $5.43 per share. One-half of each warrant was immediately exercisable, and the remaining half became exercisable as additional funds were drawn during the year ended June 30, 2011. The fair value of the immediately exercisable warrants was $97 , while the fair value of the warrants that vested during the year ended June 30, 2011 was $216 . The warrants were exercised in June 2011.
The following summarizes common stock warrant activity:
| Warrants Outstanding |
| Price Range per Share | |||
Warrants outstanding at June 30, 2010 | 3,241,992 | |
| $ | 5.43-61.30 | |
Exercised | (548,366 | ) |
| $ | 5.43-8.83 | |
Expired | (3,202 | ) |
| $ | 9.28 | |
Warrants outstanding at June 30, 2011 | 2,690,424 | |
| $ | 8.78-61.30 | |
Issued | 82,856 | |
| $ | 9.33-9.80 | |
Exercised | (313,239 | ) |
| $ | 8.78-8.83 | |
Expired | (2,608 | ) |
| $ | 8.79-8.83 | |
Warrants outstanding at June 30, 2012 | 2,457,433 | |
| $ | 8.78-61.30 | |
Exercised | (362,861 | ) |
| $ | 8.83-9.80 | |
Expired | (2,854 | ) |
| $ | - | |
Warrants outstanding at June 30, 2013 | 2,091,718 | |
| $ | 8.78-61.30 | |
There were no warrants issued during the year ended June 30, 2013. The weighted average fair value per share of warrants issued during the year ended June 30, 2012 , was $6.00 .
The aggregate intrinsic value of a warrant is the amount by which the market value of the underlying stock exceeds the exercise price of the warrant. The aggregate intrinsic value for warrants at June 30, 2013 , 2012 and 2011 was $25,697 , $2,167 , and $15,267 , respectively.
7. Stock Options and Restricted Stock Awards
The Company has a 2007 Equity Incentive Plan (the "2007 Plan"), which was assumed from CSI-MN, under which options to purchase common stock and restricted stock awards have been granted to employees, directors and consultants at exercise prices determined by the board of directors; and also in connection with the merger the Company assumed options and restricted stock awards granted by CSI-MN under its 1991 Stock Option Plan (the "1991 Plan") and 2003 Stock Option Plan (the "2003 Plan") (the 2007 Plan, the 1991 Plan and the 2003 Plan collectively, the "Plans"). The 1991 Plan and 2003 Plan permitted the granting of incentive stock options and nonqualified options. A total of 485,250 shares of common stock were originally reserved for issuance under the 1991 Plan, but with the approval of the 2003 Plan no additional options were granted under it. A total of 2,458,600 shares of common stock were originally reserved for issuance under the 2003 Plan, but with the approval of the 2007 Plan no additional options will be granted under it.
The 2007 Plan originally allowed for the granting of up to 1,941,000 shares of common stock as approved by the board of directors in the form of nonqualified or incentive stock options, restricted stock awards, restricted stock unit awards, performance share awards, performance unit awards or stock appreciation rights to officers, directors, consultants and employees of the Company. The Plan was amended in February 2009 to increase the number of authorized shares to 2,509,969 . Generally, options or shares granted under the 2007 Plan expire ten years from the date of grant and vest over three years. The amended 2007 Plan includes a renewal provision whereby the number of shares shall automatically be increased on the first day of each fiscal year ending on July 1, 2017, by the lesser of (i) 970,500 shares, (ii) 5% of the outstanding common shares on such date, or (iii) a lesser amount determined by the board of directors. On July 1, 2013, the number of shares available for grant was increased by 475,000 under the 2007 Plan renewal provision, which was 1.9% of shares outstanding at June 30, 2013 .
The Company also maintains the 2006 Equity Incentive Plan (the "2006 Plan"), relating to Replidyne activity prior to the merger in February 2009. A total of 794,641 shares were originally reserved under the 2006 Plan, but effective with the merger no additional options will be granted under it. Generally, options granted under the 2006 Plan expire ten years from the date of grant and vested over four years. Vested options granted to employees terminated 90 days after termination.
F-14
CARDIOVASCULAR SYSTEMS, INC.
NOTES TO CONSOLIDATED FINANCIAL STATEMENTS - (Continued)
All options granted under the Plans become exercisable over periods established at the date of grant. The option exercise price is generally not less than the estimated fair market value of the Company's common stock at the date of grant, as determined by the Company's management and board of directors. In addition, the Company has granted nonqualified stock options to a director outside of the Plans.
Stock option activity is as follows:
| Number of Options(a) |
| Weighted Average Exercise Price | |||
Options outstanding at June 30, 2010 | 3,356,993 | |
| $ | 10.49 | |
Exercised | (180,702 | ) |
| $ | 8.60 | |
Forfeited or expired | (105,292 | ) |
| $ | 12.32 | |
Options outstanding at June 30, 2011 | 3,070,999 | |
| $ | 10.54 | |
Exercised | (311,814 | ) |
| $ | 9.12 | |
Forfeited or expired | (387,987 | ) |
| $ | 13.11 | |
Options outstanding at June 30, 2012 | 2,371,198 | |
| $ | 10.31 | |
Exercised | (533,954 | ) |
| $ | 11.59 | |
Forfeited or expired | (97,581 | ) |
| $ | 12.49 | |
Options outstanding at June 30, 2013 | 1,739,663 | |
| $ | 9.79 | |
______________________________
(a) | Includes the effect of options granted, exercised, forfeited or expired from the 1991 Plan, 2003 Plan, 2007 Plan, 2006 Plan and options granted outside the stock option plans described above. |
Options outstanding and exercisable at June 30, 2013 were as follows:
| Options Outstanding |
| Options Exercisable | ||||||
Exercise Price | Number of Outstanding Shares |
| Remaining Weighted Average Contractual Life (Years) |
| Number of Exercisable Shares |
| Remaining Weighted Average Contractual Life (Years) | ||
$5.01 | 12,940 | |
| 6.43 |
| 12,940 | |
| 6.43 |
$7.90 | 317,551 | |
| 4.10 |
| 317,551 | |
| 4.10 |
$8.75 | 85,080 | |
| 5.67 |
| 85,080 | |
| 5.67 |
$8.83 | 750,995 | |
| 3.38 |
| 750,995 | |
| 3.38 |
$9.28 | 19,408 | |
| 1.39 |
| 19,408 | |
| 1.39 |
$11.38 | 54,968 | |
| 4.38 |
| 54,968 | |
| 4.38 |
$12.15 | 363,795 | |
| 4.45 |
| 363,795 | |
| 4.45 |
$12.37 | 103,475 | |
| 2.32 |
| 103,475 | |
| 2.32 |
$18.55 | 31,451 | |
| 2.75 |
| 31,451 | |
| 2.75 |
| 1,739,663 | |
| 3.81 |
| 1,739,663 | |
| 3.81 |
As of June 30, 2013 , all options were fully vested. An employee's vested options must be exercised at or within 90 days of termination to avoid forfeiture. The Company determined the fair value of options using the Black-Scholes option pricing model. The estimated fair value of options, including the effect of estimated forfeitures, was recognized as expense on a straight-line basis over the options' vesting periods. There were no options granted during the years ended June 30, 2013 or 2012 .
The aggregate intrinsic value of a stock option award is the amount by which the market value of the underlying stock exceeds the exercise price of the award. The aggregate intrinsic value for vested and outstanding options at June 30, 2013 , 2012 and 2011 , was $19,842 , $1,624 , and $12,712 , respectively. The total aggregate intrinsic value of options exercised during the years ended June 30, 2013 , 2012 and 2011 , was $1,712 , $770 and $736 , respectively. Shares supporting option exercises are sourced from new share issuances.
The fair value of each restricted stock award was equal to the fair market value of the Company's common stock at the date of grant. Vesting of restricted stock awards range from one to three years. The estimated fair value of restricted stock awards, including the effect of estimated forfeitures, is recognized on a straight-line basis over the restricted stock's vesting period.
F-15
CARDIOVASCULAR SYSTEMS, INC.
NOTES TO CONSOLIDATED FINANCIAL STATEMENTS - (Continued)
On August 13, 2012, the Company granted performance based restricted stock awards to certain executives. The awards included a grant of 67,854 shares measuring total shareholder return during periods within fiscal 2013 compared to a pre-determined peer group of companies, and a grant of 67,854 shares measuring annual revenue growth during fiscal 2013 compared to a pre-determined peer group of companies. The amount of shares vested at June 30, 2013 under both grants is based on the Company compared to the median of the pre-determined peer group.
Restricted stock award activity is as follows:
| Number of Shares |
| Weighted Average Grant Date Fair Value | |||
Restricted stock awards outstanding at June 30, 2010 | 1,105,883 | |
| $ | 7.69 | |
Granted | 804,159 | |
| $ | 6.08 | |
Forfeited | (199,910 | ) |
| $ | 6.91 | |
Vested | (511,925 | ) |
| $ | 7.68 | |
Restricted stock awards outstanding at June 30, 2011 | 1,198,207 | |
| $ | 6.39 | |
Granted | 817,878 | |
| $ | 11.32 | |
Forfeited | (253,810 | ) |
| $ | 7.80 | |
Vested | (517,445 | ) |
| $ | 12.88 | |
Restricted stock awards outstanding at June 30, 2012 | 1,244,830 | |
| $ | 9.08 | |
Granted | 880,282 | |
| $ | 11.46 | |
Forfeited | (123,494 | ) |
| $ | 9.31 | |
Vested | (571,488 | ) |
| $ | 8.76 | |
Restricted stock awards outstanding at June 30, 2013 | 1,430,130 | |
| $ | 10.78 | |
Estimated pre-vesting forfeitures are considered in determining stock-based compensation expense. As of June 30, 2013 , 2012 and 2011 , the Company estimated its weighted average forfeiture rate at 11.5% , 11.6% and 10.7% , respectively. As of June 30, 2013 , 2012 and 2011 , the total compensation cost for non-vested awards not yet recognized in the consolidated statements of operations was $9,981 , $7,767 and $5,128 , respectively, net of the effect of estimated forfeitures. These amounts are expected to be recognized over a weighted-average period of 2.32 , 2.44 and 2.27 years, respectively.
The Company grants restricted stock units to members of the Board of Directors. Restricted stock units represent the right to receive payment in the form of shares of the Company's common stock or in cash at the Company's option. Restricted stock unit payments would occur within 30 days following the six month anniversary of the date that the director ceases to serve on the Board. The estimated fair value of restricted stock awards is recognized on a straight-line basis over the vesting period. Restricted stock unit activity is as follows:
| Number of Shares |
| Weighted Average Grant Date Fair Value | |||
Restricted stock units outstanding at June 30, 2010 | 129,448 | |
| $ | 8.65 | |
Granted | 158,880 | |
| $ | 4.79 | |
Converted to common stock | (28,212 | ) |
| $ | 7.09 | |
Forfeited | (22,397 | ) |
| $ | 6.70 | |
Restricted stock units outstanding at June 30, 2011 | 237,719 | |
| $ | 6.51 | |
Granted | 50,344 | |
| $ | 13.91 | |
Forfeited | (3,596 | ) |
| $ | 13.91 | |
Restricted stock units outstanding at June 30, 2012 | 284,467 | |
| $ | 7.67 | |
Granted | 70,883 | |
| $ | 9.41 | |
Converted to common stock | (42,677 | ) |
| $ | 7.03 | |
Restricted stock units outstanding at June 30, 2013 | 312,673 | |
| $ | 8.15 | |
F-16
CARDIOVASCULAR SYSTEMS, INC.
NOTES TO CONSOLIDATED FINANCIAL STATEMENTS - (Continued)
The following amounts were recognized as stock-based compensation expense in the consolidated statements of operations for the year ended June 30, 2013:
| Restricted Stock Awards |
| Employee Stock Purchase Plan |
| Restricted Stock Units |
| Total | ||||||||
Cost of goods sold | $ | 392 | |
| $ | 35 | |
| $ | - | |
| $ | 427 | |
Selling, general and administrative | 4,954 | |
| 596 | |
| 667 | |
| 6,217 | | ||||
Research and development | 780 | |
| 18 | |
| - | |
| 798 | | ||||
Total | $ | 6,126 | |
| $ | 649 | |
| $ | 667 | |
| $ | 7,442 | |
The following amounts were recognized as stock-based compensation expense in the consolidated statements of operations for the year ended June 30, 2012:
| Restricted Stock Awards |
| Employee Stock Purchase Plan |
| Restricted Stock Units |
| Total | ||||||||
Cost of goods sold | $ | 256 | |
| $ | 40 | |
| $ | - | |
| $ | 296 | |
Selling, general and administrative | 3,105 | |
| 621 | |
| 669 | |
| 4,395 | | ||||
Research and development | 439 | |
| 35 | |
| - | |
| 474 | | ||||
Total | $ | 3,800 | |
| $ | 696 | |
| $ | 669 | |
| $ | 5,165 | |
The following amounts were recognized as stock-based compensation expense in the consolidated statements of operations for the year ended June 30, 2011:
| Stock Options |
| Restricted Stock Awards |
| Employee Stock Purchase Plan |
| Restricted Stock Units |
| Total | ||||||||||
Cost of goods sold | $ | 97 | |
| $ | 200 | |
| $ | 15 | |
| $ | - | |
| $ | 312 | |
Selling, general and administrative | 1,175 | |
| 3,384 | |
| 298 | |
| 712 | |
| 5,569 | | |||||
Research and development | 34 | |
| 518 | |
| 35 | |
| - | |
| 587 | | |||||
Total | $ | 1,306 | |
| $ | 4,102 | |
| $ | 348 | |
| $ | 712 | |
| $ | 6,468 | |
The following summarizes shares available for grant under the Company's various equity incentive plans:
| Shares Available for Grant(a) | |
Shares available for grant at June 30, 2010 | 110,173 | |
Reserved | 757,427 | |
Granted | (1,092,500 | ) |
Forfeited, expired or cancelled | 275,623 | |
Shares available for grant at June 30, 2011 | 50,723 | |
Reserved | 849,353 | |
Granted | (868,222 | ) |
Forfeited, expired or cancelled | 581,447 | |
Shares available for grant at June 30, 2012 | 613,301 | |
Reserved | 450,000 | |
Granted | (951,165 | ) |
Forfeited, expired or cancelled | 211,155 | |
Shares available for grant at June 30, 2013 | 323,291 | |
______________________________
(a) | Excludes the effect of shares granted, exercised, forfeited or expired related to activity from shares granted outside the stock option plans described above. Excludes share forfeitures from grants not under the 2007 Plan. |
F-17
CARDIOVASCULAR SYSTEMS, INC.
NOTES TO CONSOLIDATED FINANCIAL STATEMENTS - (Continued)
Employee Stock Purchase Plan
The Company maintains an employee stock purchase plan (ESPP). The plan provides eligible employees the opportunity to acquire common stock in accordance with Section 423 of the Internal Revenue Code of 1986. Stock can be purchased each six -month period per year (twice per year). The purchase price is equal to 85% of the lower of the price at the beginning or the end of the respective period. The ESPP allows for an annual increase in reserved shares on each July 1 equal to the lesser of (i) one percent of the common shares outstanding, or (ii) 180,000 shares, provided that the Board of Directors may designate a smaller amount of shares to be reserved. On July 1, 2013, 180,000 shares were added to the plan. Employees purchased 180,000 shares at an average price of $9.75 per share during the year ended June 30, 2013 . Shares reserved under the plan for the year ending June 30, 2014 totaled 180,709 .
8. Income Taxes
The components of the Company's overall deferred tax assets and liabilities are as follows:
| June 30, | ||||||
| 2013 |
| 2012 | ||||
Deferred tax assets |
|
|
| ||||
Stock-based compensation | $ | 5,202 | |
| $ | 5,415 | |
Accrued expenses | 1,403 | |
| 1,065 | | ||
Inventories | 825 | |
| 1,049 | | ||
Depreciation and amortization | 221 | |
| 175 | | ||
Other | 301 | |
| 354 | | ||
Research and development credit carryforwards | 3,299 | |
| 3,204 | | ||
Net operating loss carryforwards | 53,560 | |
| 45,203 | | ||
Total deferred tax assets | 64,811 | |
| 56,465 | | ||
Valuation allowance | (64,811 | ) |
| (56,465 | ) | ||
Net deferred tax assets | $ | - | |
| $ | - | |
The Company has established valuation allowances to fully offset its deferred tax assets due to the uncertainty about the Company's ability to generate the future taxable income necessary to realize these deferred assets, particularly in light of the Company's historical losses. The future use of net operating loss carryforwards is dependent on the Company attaining profitable operations, and may be limited in any one year under Internal Revenue Code Section 382 due to significant ownership changes, as defined under such Section, as a result of the Company's equity financings. A summary of the valuation allowances are as follows:
| Amount | ||
Balance at June 30, 2011 | $ | 52,373 | |
Additions | 4,092 | | |
Balance at June 30, 2012 | 56,465 | | |
Additions | 8,346 | | |
Balance at June 30, 2013 | $ | 64,811 | |
As of June 30, 2013 and 2012, the Company had federal tax NOL carryforwards of approximately $150,381 and $128,273 , respectively. These NOL carryforwards are available to offset taxable income through 2033 and begin to expire in 2018. The Company also had various state NOL carryforwards available to offset future state taxable income. These state NOL carryforwards typically have the same expirations as the Company's federal tax NOL carryforwards.
As of June 30, 2013 and 2012, the Company had approximately $3,171 and $3,065 of federal research and development credit carryforwards, respectively. As of June 30, 2013 and 2012, the Company had approximately $749 of state research and development credit carryforwards. The federal and state research and development credit carryforwards will begin to expire in 2024.
F-18
CARDIOVASCULAR SYSTEMS, INC.
NOTES TO CONSOLIDATED FINANCIAL STATEMENTS - (Continued)
As required by FASB ASC Topic 740, "Income Taxes," the Company recognizes the financial statement benefit of a tax position only after determining that the relevant tax authority would more likely than not sustain the position following an audit. For tax positions meeting the more likely than not threshold, the amount recognized in the financial statements is the largest benefit that has a greater than 50 percent likelihood of being realized upon ultimate settlement with the relevant tax authority. The Company recorded a liability relating to unrecognized tax benefits of $392 and $381 at June 30, 2013 and 2012, respectively. Due to the Company having a full valuation allowance, this liability has been netted against the deferred tax asset. The Company recognizes interest and penalties related to uncertain tax provisions as part of the provision for income taxes. The Company has not currently reserved for any interest or penalties for such reserves due to the Company being in an NOL position. The Company does not expect to recognize any benefits from the unrecognized tax benefits within the next twelve months. A reconciliation of the beginning and ending amount of unrecognized tax benefits is as follows:
| Amount | ||
Balance at July 1, 2011 | $ | 383 | |
Increases related to prior year tax positions | (6 | ) | |
Increases related to current year tax positions | 4 | | |
Balance at June 30, 2012 | 381 | | |
Increases related to prior year tax positions | 3 | | |
Increases related to current year tax positions | 8 | | |
Balance at June 30, 2013 | $ | 392 | |
The Company is subject to income taxes in the U.S. federal jurisdiction and various state jurisdictions. Tax regulations within each jurisdiction are subject to the interpretation of the related tax laws and regulations and require significant judgment to apply. The Company is potentially subject to income tax examinations by tax authorities for the tax years ended June 30, 2013, 2012, 2011, and 2010. The Company is not currently under examination by any taxing jurisdiction.
9. Commitment and Contingencies
Operating Leases
The Company leases manufacturing and office space and equipment under various lease agreements which expire at various dates through March 2020 . Rental expenses were $1,350 , $1,200 , and $1,188 , for the years ended June 30, 2013 , 2012 , and 2011 , respectively.
Future minimum lease payments under the agreements as of June 30, 2013 are as follows:
|
| ||
2014 | $ | 940 | |
2015 | 951 | | |
2016 | 671 | | |
2017 | 460 | | |
2018 | 460 | | |
Thereafter | 805 | | |
| $ | 4,287 | |
Amounts payable under the Company's Texas production facility lease are included in the amounts above. A portion of those rent payments may reduce the deferred grant incentive liability rather than being recorded as expense. See Note 11 for additional information.
10. Employee Benefits
The Company offers a 401(k) plan to its employees. Eligible employees may authorize up to $18 of their annual compensation as a contribution to the plan, subject to Internal Revenue Service limitations. The plan also allows eligible employees over 50 years old to contribute an additional $6 subject to Internal Revenue Service limitations. All employees must be at least 21 years of age to participate in the plan. The Company did not provide any employer matching contributions for the years ended June 30, 2013 , 2012 , and 2011 .
F-19
CARDIOVASCULAR SYSTEMS, INC.
NOTES TO CONSOLIDATED FINANCIAL STATEMENTS - (Continued)
11. Texas Production Facility
Effective on September 9, 2009, the Company entered into an agreement with the Pearland Economic Development Corporation (the "PEDC") for the construction and lease of an approximately 46,000 square foot production facility located in Pearland, Texas. The facility will primarily serve as an additional manufacturing location for the Company.
The Company and the PEDC entered into a Corporate Job Creation Agreement dated June 17, 2009 , which was subsequently amended July 2, 2012 . The Job Creation Agreement, as amended, provided the Company with $2,975 in net cash incentive funds. The Company believes it will be able to comply with the conditions specified in the amended agreement. The PEDC will provide the Company with an additional $850 of net cash incentive funds in the following amounts and upon achievement of the following milestones:
• | $425 upon the hiring of the 75th full-time employee at the facility on or before March 31, 2014, and maintaining 75 employees at the facility through March 31, 2015; |
• | $425 upon the hiring of the 125th full-time employee at the facility on or before June 30, 2015, and maintaining 125 employees at the facility through June 30, 2016. |
In order to retain all of the cash incentives, the Company must maintain no fewer than 25 jobs at the Texas facility through June 30, 2015. Failure to meet this requirement will result in an obligation to make reimbursement payments to the PEDC as outlined in the amended agreement. The Company will not have any reimbursement requirements after June 30, 2015. As of June 30, 2013 , the Company was in compliance with all minimum requirements under the amended agreement. The Company believes it will be able to comply with the conditions specified in the amended agreement.
The Job Creation Agreement, as amended, also provided the Company with a net $1,020 award, of which $510 was received from the PEDC and the remainder is funded through the Texas Enterprise Fund program associated with the State of Texas. As of June 30, 2013 , $340 has been received and the remaining $170 will be provided upon the hiring of the 75th full-time employee at the facility. The grant from the State of Texas is subject to reimbursement if the Company fails to meet certain job creation targets through 2014 and maintain these positions through 2020.
The Company has presented the net cash incentive funds as a current and long-term liability on the balance sheet. The liabilities are reduced through the term of the agreement and recorded as an offset to expenditures incurred using a systematic methodology. As of June 30, 2013 , the deferred grant incentive liabilities have been reduced by $3,525 in cumulative expenses, resulting in a remaining current liability of $156 and long-term liability of $83 .
12. Earnings Per Share
The following table presents a reconciliation of the numerators and denominators used in the basic and diluted earnings per common share computations:
| Year Ended June 30, | ||||||||||
| 2013 |
| 2012 |
| 2011 | ||||||
Numerator | |
| |
| | ||||||
Net loss | $ | (24,037 | ) |
| $ | (16,790 | ) |
| $ | (11,125 | ) |
Denominator | |
| |
| | ||||||
Weighted average common shares - basic | 21,685,932 | |
| 18,035,635 | |
| 15,915,800 | | |||
Effect of dilutive stock options and warrants(a)(b)(c) | - | |
| - | |
| - | | |||
Weighted average common shares outstanding - diluted | 21,685,932 | |
| 18,035,635 | |
| 15,915,800 | | |||
Loss per common share - basic and diluted | $ | (1.11 | ) |
| $ | (0.93 | ) |
| $ | (0.70 | ) |
______________________________
(a) | At June 30, 2013 , 2012 , and 2011 , 2,091,718 , 2,457,433 , and 2,690,424 , warrants, respectively, were outstanding. The effect of the shares that would be issued upon exercise of these warrants has been excluded from the calculation of diluted loss per share, because those shares are anti-dilutive. |
(b) | At June 30, 2013 , 2012 , and 2011 , 1,739,663 , 2,371,198 , and 3,070,999 stock options, respectively, were outstanding. The effect of the shares that would be issued upon exercise of these options has been excluded from the calculation of diluted loss per share, because those shares are anti-dilutive. |
(c) | At June 30, 2013 , 2012 , and 2011 , 321,099 , 363,794 and 296,921 additional shares of common stock are issuable upon the conversion of outstanding convertible debt agreements. The effect of the shares that would be issued upon conversion of these debt agreements has been excluded from the calculation of diluted loss per share because those shares are anti-dilutive. |
F-20
Table of Contents
Item 9. Changes in and Disagreements With Accountants on Accounting and Financial Disclosure.
None.
Item 9A. Controls and Procedures.
Evaluation of Disclosure Controls and Procedures
Our Chief Executive Officer and Chief Financial Officer, referred to collectively herein as the Certifying Officers, are responsible for establishing and maintaining our disclosure controls and procedures. The Certifying Officers have reviewed and evaluated the effectiveness of the Company's disclosure controls and procedures (as defined in Rules 240.13a-15(e) and 15d-15(e) promulgated under the Securities Exchange Act of 1934 (the "Exchange Act")) as of June 30, 2013 . Based on that review and evaluation, which included inquiries made to certain other employees of the Company, the Certifying Officers have concluded that, as of the end of the period covered by this Annual Report on Form 10-K, the Company's disclosure controls and procedures, as designed and implemented, are effective.
Management's Annual Report on Internal Control Over Financial Reporting
Management is responsible for establishing and maintaining adequate internal control over financial reporting (as defined in Rule 13a-15(f) under the Exchange Act) for the Company. Management conducted an evaluation of the effectiveness of internal control over financial reporting based on the framework in Internal Control - Integrated Framework issued by the Committee of Sponsoring Organizations of the Treadway Commission (COSO). Based on this evaluation, management concluded that the Company's internal control over financial reporting was effective as of June 30, 2013 . PricewaterhouseCoopers LLP, the independent registered public accounting firm that audited the consolidated financial statements included in this Annual Report on Form 10-K, has also audited the Company's internal control over financial reporting as of June 30, 2013 , as stated in their attestation report included in Part IV, Item 15 of this Annual Report on Form 10-K.
Changes in Internal Control Over Financial Reporting
There were no changes in our internal control over financial reporting (as defined in Rules 13a-15(f) and 15d-15(f) under the Exchange Act) during the three months ended June 30, 2013 that have materially affected, or are reasonably likely to materially affect, our internal control over financial reporting.
Item 9B. Other Information.
Annual Compensation for Named Executive Officers
On September 4, 2013, the Board of Directors (the "Board") of the Company, upon recommendation of the Compensation Committee of the Board, approved the fiscal 2014 base salaries for the Company's executive officers. Effective for the fiscal year ending June 30, 2014, the named executive officers will receive the following base salaries as part of their compensation for fiscal 2014:
Name/Title | FY2014 Salary | ||
David L. Martin President and Chief Executive Officer | $ | 540,000 | |
Laurence L. Betterley Chief Financial Officer | $ | 330,723 | |
Robert J. Thatcher Executive Vice President | $ | 318,347 | |
Kevin Kenny Executive Vice President of Sales and Marketing | $ | 297,413 | |
James E. Flaherty Chief Administrative Officer and Secretary | $ | 295,250 | |
45
Bonus Plan for Fiscal 2014
Also on September 4, 2013, the Board, based upon the recommendation of its Compensation Committee, approved the fiscal 2014 executive officer bonus plan (the "Bonus Plan"). Pursuant to the Bonus Plan, the Company's executive officers are eligible to receive cash incentive compensation based on the Company's achievement of revenue and adjusted EBITDA financial goals for fiscal 2014. Adjusted EBITDA is defined as EBITDA with stock compensation added back into the calculation, in addition to the add-back of depreciation and amortization. Target bonus amounts are weighted 67% for the revenue goal and 33% for the adjusted EBITDA goal. Target bonus levels as a percentage of base salary are 100% for the President and Chief Executive Officer, 60% for the Chief Financial Officer and 50% for the other executive officers. Depending upon the Company's performance against the goals, participants are eligible to earn 50% to 200% of each of the adjusted EBITDA and revenue portions of their target bonus amount. The Bonus Plan criteria are the same for all of the executive officers.
The Bonus Plan also provides "management by objective" (MBO) targets for certain predetermined milestones for fiscal 2014 relating to FDA approval of a coronary application, sales productivity, clinical studies and product enhancements. Achievement of the MBO targets could result in additional cash bonuses to executive officers for each target achieved of 3.75% of their annual base salaries. The Compensation Committee also has authority to grant additional discretionary cash bonuses of up to 20% of annual base salary for any executive officer.
PART III
Item 10. Directors, Executive Officers and Corporate Governance.
Other than the information included in this Form 10-K under the heading "Executive Officers of the Registrant," which is set forth at the end of Part I, the information required by Item 10 is incorporated by reference to the sections labeled "Election of Directors," "Information Regarding the Board of Directors and Corporate Governance" and "Section 16(a) Beneficial Ownership Reporting Compliance," all of which will appear in our definitive proxy statement for our 2013 Annual Meeting.
Item 11. Executive Compensation.
The information required by Item 11 is incorporated herein by reference to the sections entitled "Executive Compensation," "Director Compensation," "Human Resources and Compensation Committee" and "Compensation Committee Interlocks and Insider Participation," all of which will appear in our definitive proxy statement for our 2013 Annual Meeting.
Item 12. Security Ownership of Certain Beneficial Owners and Management and Related Stockholder Matters.
The information required by Item 12 is incorporated herein by reference to the sections entitled "Security Ownership of Certain Beneficial Owners and Management" and "Equity Compensation Plan Information," which will appear in our definitive proxy statement for our 2013 Annual Meeting.
Item 13. Certain Relationships and Related Transactions, and Director Independence.
The information required by Item 13 is incorporated herein by reference to the sections entitled "Information Regarding the Board of Directors and Corporate Governance - Independence of the Board of Directors" and "Transactions With Related Persons," which will appear in our definitive proxy statement for our 2013 Annual Meeting.
46
Table of Contents
Item 14. Principal Accounting Fees and Services.
The information required by Item 14 is incorporated herein by reference to the section entitled "Principal Accountant Fees and Services," which will appear in our definitive proxy statement for our 2013 Annual Meeting.
PART IV
Item 15. Exhibits, Financial Statement Schedules.
(a) Documents filed as part of this report.
(1) Financial Statements. The following financial statements are included in Part II, Item 8 of this Annual Report on Form 10-K:
• | Report of Independent Registered Public Accounting Firm |
• | Consolidated Balance Sheets as of June 30, 2013 and 2012 |
• | Consolidated Statements of Operations for the years ended June 30, 2013 , 2012 and 2011 |
• | Consolidated Statements of Stockholders' Equity and Comprehensive Loss for the years ended June 30, 2013 , 2012 and 2011 |
• | Consolidated Statements of Cash Flows for the years ended June 30, 2013 , 2012 and 2011 |
• | Notes to Consolidated Financial Statements |
(2) Financial Statement Schedules.
• | All financial statement schedules have been omitted, because they are not applicable, are not required, or the information is included in the Financial Statements or Notes thereto |
(3) Exhibits. See "Exhibit Index" immediately following the signature page of this Form 10-K
47
Table of Contents
SIGNATURES
Pursuant to the requirements of Section 13 or 15(d) of the Securities Exchange Act of 1934, the registrant has duly caused this report to be signed on its behalf by the undersigned, thereunto duly authorized.
| CARDIOVASCULAR SYSTEMS, INC. | ||
|
|
| |
Date: September 10, 2013 | By: |
| /s/ David L. Martin |
|
|
| David L. Martin |
|
|
| President and Chief Executive Officer |
Pursuant to the requirements of the Securities Exchange Act of 1934, this report has been signed below by the following persons on behalf of the registrant and in the capacities and on the dates indicated.
Each person whose signature appears below constitutes and appoints David L. Martin and Laurence L. Betterley as the undersigned's true and lawful attorneys-in fact and agents, each acting alone, with full power of substitution and resubstitution, for the undersigned and in the undersigned's name, place and stead, in any and all amendments to this Annual Report on Form 10-K and to file the same, with all exhibits thereto, and other documents in connection therewith, with the Securities and Exchange Commission, granted unto said attorneys-in-fact and agents, each acting alone, full power and authority to do and perform each and every act and thing requisite and necessary to be done in and about the premises, as fully to all intents and purposes as the undersigned might or could do in person, hereby ratifying and confirming all said attorneys-in-fact and agents, each acting alone, or his substitute or substitutes, may lawfully do or cause to be done by virtue thereof.
Signature |
| Title |
| Date |
|
|
| ||
/s/ David L. Martin |
| President, Chief Executive Officer and Director (principal executive officer) |
| September 10, 2013 |
David L. Martin |
|
| ||
|
|
| ||
/s/ Laurence L. Betterley |
| Chief Financial Officer (principal financial and accounting officer) |
| September 10, 2013 |
Laurence L. Betterley |
|
| ||
|
|
| ||
/s/ Edward Brown |
| Director |
| September 10, 2013 |
Edward Brown |
|
| ||
|
|
| ||
/s/ Brent G. Blackey |
| Director |
| September 10, 2013 |
Brent G. Blackey |
|
| ||
|
|
| ||
/s/ John H. Friedman |
| Director |
| September 10, 2013 |
John H. Friedman |
|
| ||
|
|
| ||
|
| Director |
| September 10, 2013 |
Leslie Trigg |
|
| ||
|
|
| ||
/s/ Augustine Lawlor |
| Director |
| September 10, 2013 |
Augustine Lawlor |
|
| ||
|
|
| ||
/s/ Glen D. Nelson |
| Director |
| September 10, 2013 |
Glen D. Nelson |
|
| ||
|
|
| ||
/s/ Scott Bartos |
| Director |
| September 10, 2013 |
Scott Bartos |
|
| ||
48
Table of Contents
EXHIBIT INDEX
CARDIOVASCULAR SYSTEMS, INC.
FORM 10-K
Exhibit No. |
| Description |
3.1 |
| Restated Certificate of Incorporation, as amended.(7) |
3.2 |
| Amended and Restated Bylaws.(2) |
4.1 |
| Specimen Common Stock Certificate.(2) |
4.2 |
| Form of Cardiovascular Systems, Inc. common stock warrant issued to former preferred stockholders.(2) |
4.3 |
| Registration Rights Agreement by and among Cardiovascular Systems, Inc. and certain of its stockholders, dated as of March 16, 2009.(1) |
4.4 |
| Termination of Fourth Amended and Restated Stockholders Agreement by and among Cardiovascular Systems, Inc. and certain of its stockholders, dated as of March 16, 2009.(1) |
10.1 |
| Lease, dated September 26, 2005, by and between Cardiovascular Systems, Inc., a Minnesota corporation, and Industrial Equities Group LLC.(3) |
10.2 |
| First Amendment to the Lease, dated February 20, 2007, by and between Cardiovascular Systems, Inc., a Minnesota corporation, and Industrial Equities Group LLC.(3) |
10.3 |
| Second Amendment to the Lease, dated March 9, 2007, by and between Cardiovascular Systems, Inc., a Minnesota corporation, and Industrial Equities Group LLC.(3) |
10.4 |
| Third Amendment to the Lease, dated September 26, 2007, by and between Cardiovascular Systems, Inc., a Minnesota corporation, and Industrial Equities Group LLC.(3) |
10.5 |
| Lease Agreement, dated October 25, 2005, by and between Cardiovascular Systems, Inc., a Minnesota corporation, and Triumph 1450 LLC.(8) |
10.6 |
| Assumption of Lease, dated March 23, 2009 by Cardiovascular Systems, Inc.(7) |
10.7† |
| Employment Agreement, dated December 19, 2006, by and between Cardiovascular Systems, Inc., a Minnesota corporation, and David L. Martin.(3) |
10.8† |
| Employment Agreement, dated April 7, 2008, by and between Cardiovascular Systems, Inc., a Minnesota corporation, and Laurence L. Betterley.(3) |
10.9† |
| Employment Agreement, dated May 9, 2011, by and between Cardiovascular Systems, Inc. and Kevin J. Kenny.(13) |
10.10† |
| Form of Standard Employment Agreement.(3) |
10.11†* |
| Summary of Fiscal Year 2014 Executive Officer Base Salaries. |
10.12†* |
| Fiscal Year 2014 Director Compensation Arrangements. |
10.13+ |
| Purchasing Agreement between Cardiovascular Systems, Inc. and HealthTrust Purchasing Group, L.P., dated effective as of July 15, 2011, and amendment to Purchasing Agreement dated effective as of July 15, 2011.(13) |
10.14† |
| Form of Director and Officer Indemnification Agreement.(7) |
10.15† |
| Cardiovascular Systems, Inc. Amended and Restated 2007 Equity Incentive Plan.(5) |
10.16† |
| Form of Incentive Stock Option Agreement under the Amended and Restated 2007 Equity Incentive Plan.(7) |
10.17† |
| Form of Non-Qualified Stock Option Agreement under the Amended and Restated 2007 Equity Incentive Plan.(7) |
10.18† |
| Form of Restricted Stock Agreement under the Amended and Restated 2007 Equity Incentive Plan.(13) |
10.19† |
| Form of Restricted Stock Unit Agreement under the Amended and Restated 2007 Equity Incentive Plan.(13) |
49
Table of Contents
Exhibit No. |
| Description |
10.20† |
| Form of Performance Share Award under the Amended and Restated 2007 Equity Incentive Plan.(7) |
10.21† |
| Form of Performance Unit Award under the Amended and Restated 2007 Equity Incentive Plan.(7) |
10.22† |
| Form of Stock Appreciation Rights Agreement under the Amended and Restated 2007 Equity Incentive Plan.(7) |
10.23† |
| 2003 Stock Option Plan of Cardiovascular Systems, Inc., a Minnesota corporation, as amended.(3) |
10.24† |
| Form of Incentive Stock Option Agreement under the 2003 Stock Option Plan of Cardiovascular Systems, Inc., a Minnesota corporation.(3) |
10.25† |
| Form of Nonqualified Stock Option Agreement under the 2003 Stock Option Plan of Cardiovascular Systems, Inc., a Minnesota corporation.(3) |
10.26† |
| 1991 Stock Option Plan of Cardiovascular Systems, Inc., a Minnesota corporation.(3) |
10.27† |
| Form of Non-Qualified Stock Option Agreement outside the 1991 Stock Option Plan of Cardiovascular Systems, Inc., a Minnesota corporation.(3) |
10.28† |
| Cardiovascular Systems, Inc. Amended and Restated 2006 Employee Stock Purchase Plan.(6) |
10.29† |
| Cardiovascular Systems, Inc. Executive Officer Severance Plan.(13) |
10.30 |
| Corporate Job Creation Agreement between Pearland Economic Development Corporation and Cardiovascular Systems, Inc., dated June 17, 2009.(4) |
10.31 |
| Build-To-Suit Lease Agreement between Pearland Economic Development Corporation and Cardiovascular Systems, Inc., dated September 9, 2009.(4) |
10.32 |
| Letter Agreement between Silicon Valley Bank and Cardiovascular Systems, Inc., dated September 9, 2009.(4) |
10.33 |
| Amended and Restated Loan and Security Agreement, dated March 29, 2010, by and between Cardiovascular Systems, Inc. and Silicon Valley Bank.(11) |
10.34 |
| Loan and Security Agreement, dated April 14, 2010, by and between Cardiovascular Systems, Inc. and Partners for Growth III, L.P.(11) |
10.35 |
| Intellectual Property Security Agreement, dated April 14, 2010, by and between Cardiovascular Systems, Inc. and Partners for Growth III, L.P.(11) |
10.36 |
| Copyright Collateral Agreement and Notice, dated April 14, 2010, by and between Cardiovascular Systems, Inc. and Partners for Growth III, L.P.(11) |
10.37 |
| Domain Rights Collateral Agreement and Notice, dated April 14, 2010, by and between Cardiovascular Systems, Inc. and Partners for Growth III, L.P.(11) |
10.38 |
| Patent Collateral Agreement and Notice, dated April 14, 2010, by and between Cardiovascular Systems, Inc. and Partners for Growth III, L.P.(11) |
10.39 |
| Trademark Collateral Agreement and Notice, dated April 14, 2010, by and between Cardiovascular Systems, Inc. and Partners for Growth III, L.P.(11) |
10.40 |
| Letter Agreement, dated April 14, 2010, by and between Cardiovascular Systems, Inc. and Partners for Growth III, L.P.(11) |
10.41 |
| Settlement Agreement among ev3, Inc., ev3 Endovascular, Inc., FoxHollow Technologies, Inc., Tyco Healthcare Group LP d/b/a Covidien, Cardiovascular Systems, Inc., Aaron Lew, Paul Tyska, Sean Collins, David Gardner, Michael Micheli, Kevin Moore, Steve Pringle, Jason Proffitt, Thadd Taylor and Rene Treanor-Sarria, dated October 29, 2010.(9) |
10.42+ |
| Supply Agreement between Cardiovascular Systems, Inc. and Fresenius Kabi AB, dated April 4, 2011.(10) |
10.43+ |
| Amendment dated effective November 1, 2011 to Purchasing Agreement with Healthtrust Purchasing Group, L.P.(14) |
10.44 |
| Modification No.1 dated August 23, 2011 to Loan and Security Agreement with Partners for Growth III, L.P.(14) |
50
Table of Contents
Exhibit No. |
| Description |
10.45 |
| First Amendment to Loan and Security Agreement, dated as of December 27, 2011, by and between the Company and Silicon Valley Bank.(15) |
10.46 |
| Warrant to Purchase Stock, dated December 27, 2011, issued by the Company to Silicon Valley Bank.(15) |
10.47 |
| Warrant, dated December 27, 2011, issued by the Company to Silicon Valley Bank.(15) |
10.48 |
| Modification No. 2 to Loan and Security Agreement, dated as of December 27, 2011, by and between the Company and Partners for Growth III, L.P.(15) |
10.49 |
| Warrant, dated December 27, 2011, issued by the Company to PFG Equity Investors, LLC.(15) |
10.50 |
| Warrant, dated December 27, 2011, issued by the Company to Partners for Growth III, L.P.(15) |
10.51†* |
| Fiscal 2014 Executive Officer Bonus Plan. |
10.52 |
| Fourth Amendment to Lease, dated March 23, 2012, by and between the Company and Industrial Equities Group LLC.(16) |
10.53 |
| Second Amendment to Loan and Security Agreement, dated June 29, 2012, by and between the Company and Silicon Valley Bank.(17) |
10.54 |
| Modification No. 3 to Loan and Security Agreement, dated as of June 30, 2012, by and between the Company and Partners for Growth III, L.P. (17) |
10.55 |
| Amendment to Corporate Job Creation Agreement, dated effective July 2, 2012, by and between the Company and Pearland Economic Development Corporation. (17) |
10.56 |
| Warrant, dated June 29, 2012, issued by the Company to Silicon Valley Bank. (17) |
10.57† |
| Amendment to Employment Agreement, dated December 31, 2012, by and between the Company and David L. Martin.(18) |
10.58† |
| Amendment to Employment Agreement, dated December 31, 2012, by and between the Company and Laurence L. Betterley.(18) |
10.59† |
| Amendment to Employment Agreement, dated December 31, 2012, by and between the Company and Kevin J. Kenny.(18) |
10.60† |
| Amendment to Executive Officer Severance Plan.(18) |
10.61* |
| Third Amendment to Loan and Security Agreement, dated May 10, 2013, by and between the Company and Silicon Valley Bank. |
10.62* |
| Modification No. 4 to Loan and Security Agreement, dated as of May 10, 2013, by and between the Company and Partners for Growth III, L.P. |
23.1* |
| Consent of PricewaterhouseCoopers LLP. |
24.1* |
| Power of Attorney (included on the signature page). |
31.1* |
| Certification of principal executive officer required by Rule 13a-14(a). |
31.2* |
| Certification of principal financial officer required by Rule 13a-14(a). |
32.1* |
| Section 1350 Certification of principal executive officer. |
32.2* |
| Section 1350 Certification of principal financial officer. |
101** |
| Financial statements from the annual report on Form 10-K of the Company for the year ended June 30, 2013, formatted, in XBRL: (i) the Consolidated Balance Sheets, (ii) the Consolidated Statements of Operations, (iii) the Consolidated Statements of Changes in Stockholders' Equity (Deficiency) and Comprehensive Loss, (iv) the Consolidated Statements of Cash Flows, and (v) the Notes to Financial Statements. |
* | Filed herewith. |
** | Furnished herewith. |
† | Compensatory plan or agreement. |
+ | Confidential treatment has been granted for certain portions omitted from this exhibit pursuant to Rule 24b-2 under the Securities Exchange Act of 1934, as amended. |
51
Table of Contents
(1) | Previously filed with the SEC as an Exhibit to and incorporated herein by reference from the Company's Current Report on Form 8-K filed on March 18, 2009. |
(2) | Previously filed with the SEC as an Exhibit to and incorporated herein by reference from the Company's Current Report on Form 8-K filed on March 3, 2009. |
(3) | Previously filed with the SEC as an Exhibit to and incorporated herein by reference from CSI Minnesota, Inc.'s Registration Statement on Form S-1, File No. 333-148798. |
(4) | Previously filed with the SEC as an Exhibit to and incorporated herein by reference from the Company's Annual Report on Form 10-K filed on September 29, 2009. |
(5) | Previously filed with the SEC as an Exhibit to and incorporated herein by reference from the Company's Registration Statement on Form S-8, File No. 333-158755. |
(6) | Previously filed with the SEC as an Exhibit to and incorporated herein by reference from the Company's Registration Statement on Form S-8, File No. 333-158987. |
(7) | Previously filed with the SEC as an Exhibit to and incorporated herein by reference from the Company's Quarterly Report on Form 10-Q for the quarter ended March 31, 2009. |
(8) | Previously filed with the SEC as an Exhibit to and incorporated herein by reference from the Company's Registration Statement on Form S-1, File No. 333-133021. |
(9) | Previously filed with the SEC as an Exhibit to and incorporated herein by reference from the Company's Quarterly Report on Form 10-Q filed on November 12, 2010. |
(10) | Previously filed with the SEC as an Exhibit to and incorporated herein by reference from the Company's Quarterly Report on Form 10-Q filed on May 13, 2011. |
(11) | Previously filed with the SEC as an Exhibit to and incorporated herein by reference from the Company's Quarterly Report on Form 10-Q filed on May 14, 2010. |
(12) | Previously filed with the SEC as an Exhibit to and incorporated herein by reference from the Company's Annual Report on Form 10-K filed on September 28, 2010. |
(13) | Previously filed with the SEC as an Exhibit to and incorporated herein by reference from the Company's Annual Report on Form 10-K filed on September 12, 2011. |
(14) | Previously filed with the SEC as an Exhibit to and incorporated herein by reference from the Company's Quarterly Report on Form 10-Q filed on November 8, 2011. |
(15) | Previously filed with the SEC as an Exhibit to and incorporated herein by reference from the Company's Quarterly Report on Form 10-Q filed on February 9, 2012. |
(16) | Previously filed with the SEC as an Exhibit to and incorporated herein by reference from the Company's Quarterly Report on Form 10-Q filed on May 8, 2012. |
(17) | Previously filed with the SEC as an Exhibit to and incorporated herein by reference from the Company's Annual Report on Form 10-K filed September 10, 2012. |
(18) | Previously filed with the SEC as an Exhibit to and incorporated herein by reference from the Company's Quarterly Report on Form 10-Q filed February 8, 2013. |
52