UNITED STATES
SECURITIES AND EXCHANGE COMMISSION
Washington, D.C. 20549
Form 10-K
Annual Report Pursuant to Section 13 or 15(d) of
the Securities Exchange Act of 1934
For the Fiscal Year Ended
December 31, 2018
Commission File Number 000-29187-87
Carrizo Oil & Gas, Inc.
(Exact name of registrant as specified in its charter)
Texas |
| 76-0415919 |
(State or other jurisdiction of incorporation or organization) |
| (I.R.S. Employer Identification No.) |
|
| |
500 Dallas Street, Suite 2300 Houston, Texas |
| 77002 |
(Principal executive offices) |
| (Zip Code) |
Registrant's telephone number, including area code: (713) 328-1000
Securities Registered Pursuant to Section 12(b) of the Act:
Common Stock, $0.01 par value |
| NASDAQ Global Select Market |
(Title of class) |
| (Name of exchange on which registered) |
Indicate by check mark if the registrant is a well-known seasoned issuer, as defined in Rule 405 of the Securities Act.
YES ☑ NO ¨
Indicate by check mark if the registrant is not required to file reports pursuant to Section 13 or Section 15(d) of the Exchange Act.
YES ¨ NO ☑
Indicate by check mark whether the registrant (1) has filed all reports required to be filed by Section 13 or 15(d) of the Securities Exchange Act of 1934 during the preceding 12 months (or for such shorter period that the registrant was required to file such reports), and (2) has been subject to such filing requirements for the past 90 days. YES ☑ NO ¨
Indicate by check mark whether the registrant has submitted electronically every Interactive Data File required to be submitted pursuant to Rule 405 of Regulation S-T during the preceding 12 months (or for such shorter period that the registrant was required to submit such files). YES ☑ NO ¨
Indicate by check mark if disclosure of delinquent filers pursuant to Item 405 of Regulation S-K is not contained herein, and will not be contained, to the best of registrant's knowledge, in definitive proxy or information statements incorporated by reference in Part III of this Form 10-K or any amendment to this Form 10-K. ¨
Indicate by check mark whether the registrant is a large accelerated filer, an accelerated filer, a non-accelerated filer, a smaller reporting company, or an emerging growth company. See the definitions of "large accelerated filer," "accelerated filer," "smaller reporting company," and "emerging growth company" in Rule 12b-2 of the Exchange Act. (Check one):
Large accelerated filer | ☑ |
| Accelerated filer | ¨ |
|
|
|
|
|
Non-accelerated filer | ¨ |
| Smaller reporting company | ¨ |
|
|
|
|
|
|
|
| Emerging growth company | ¨ |
If an emerging growth company, indicate by check mark if the registrant has elected not to use the extended transition period for complying with any new or revised financial accounting standards provided pursuant to Section 13(a) of the Exchange Act. ¨
Indicate by check mark whether the registrant is a shell company (as defined in Rule 12b-2 of the Act). YES ¨ NO ☑
At June 29, 2018, the aggregate market value of the registrant's Common Stock held by non-affiliates of the registrant was approximately $2.2 billion based on the closing price of such stock on such date of $27.85 .
At February 22, 2019 , the number of shares outstanding of the registrant's Common Stock was 91,627,738 .
DOCUMENTS INCORPORATED BY REFERENCE
Portions of the definitive proxy statement for the Registrant's 2019 Annual Meeting of Shareholders are incorporated by reference in Part III of this Form 10-K. Such definitive proxy statement will be filed with the U.S. Securities and Exchange Commission not later than 120 days subsequent to December 31, 2018 .
TABLE OF CONTENTS
|
|
Forward-Looking Statements | 3 |
PART I |
|
Item 1. Business | 5 |
Item 1A. Risk Factors | 25 |
Item 1B. Unresolved Staff Comments | 42 |
Item 2. Properties | 42 |
Item 3. Legal Proceedings | 42 |
Item 4. Mine Safety Disclosures | 42 |
PART II |
|
Item 5. Market for Registrant's Common Equity, Related Shareholder Matters and Issuer Purchases of Equity Securities | 42 |
Item 6. Selected Financial Data | 44 |
Item 7. Management's Discussion and Analysis of Financial Condition and Results of Operations | 45 |
Item 7A. Qualitative and Quantitative Disclosures about Market Risk | 60 |
Item 8. Financial Statements and Supplementary Data | 62 |
Item 9. Changes In and Disagreements With Accountants on Accounting and Financial Disclosures | 62 |
Item 9A. Controls and Procedures | 62 |
Item 9B. Other Information | 63 |
PART III |
|
Item 10. Directors, Executive Officers and Corporate Governance | 63 |
Item 11. Executive Compensation | 63 |
Item 12. Security Ownership of Certain Beneficial Owners and Management and Related Shareholder Matters | 63 |
Item 13. Certain Relationships and Related Transactions, and Director Independence | 63 |
Item 14. Principal Accounting Fees and Services | 64 |
PART IV |
|
Item 15. Exhibits and Financial Statement Schedules | 64 |
2
Forward-Looking Statements
This annual report contains statements concerning our intentions, expectations, projections, assessments of risks, estimations, beliefs, plans or predictions for the future, objectives, goals, strategies, future events or performance and underlying assumptions and other statements that are not historical facts. These statements are "forward-looking statements" within the meaning of the Private Securities Litigation Reform Act of 1995. These forward-looking statements include, among others, statements regarding:
• | our growth strategies; |
• | our ability to explore for and develop oil and gas resources successfully and economically; |
• | our estimates and forecasts of the timing, number, profitability and other results of wells we expect to drill and other exploration activities; |
• | our estimates, guidance and forecasts, including those regarding timing and levels of production; |
• | changes in working capital requirements, reserves, and acreage; |
• | the use of commodity derivative instruments to mitigate the effects of commodity price volatility for a portion of our forecasted sales of production; |
• | anticipated trends in our business; |
• | availability of pipeline connections and water disposal on economic terms; |
• | effects of competition on us; |
• | our future results of operations; |
• | profitability of drilling locations; |
• | our liquidity and our ability to finance our exploration and development activities, including accessibility of borrowings under our revolving credit facility, our borrowing base, modification to financial covenants and the result of any borrowing base redetermination; |
• | our planned expenditures, prospects and capital expenditure plan; |
• | future market conditions in the oil and gas industry; |
• | our ability to make, integrate and develop acquisitions and realize any expected benefits or effects of any acquisitions or the timing, final purchase price, financing or consummation of any acquisitions; |
• | possible future divestitures or disposition transactions and the proceeds, results or benefits of any such transactions, including the timing thereof; |
• | the benefits, effects, availability of and results of new and existing joint ventures and sales transactions; |
• | our ability to maintain a sound financial position; |
• | receipt of receivables and proceeds from divestitures; |
• | our ability to complete planned transactions on desirable terms; and |
• | the impact of governmental regulation, taxes, market changes and world events. |
You generally can identify our forward-looking statements by the words "anticipate," "believe," budgeted," "continue," "could," "estimate," "expect," "forecast," "goal," "intend," "may," "objective," "plan," "potential," "predict," "projection," "scheduled," "should," or other similar words. Such statements rely on assumptions and involve risks and uncertainties, many of which are beyond our control, including, but not limited to, those relating to a worldwide economic downturn, availability of financing, our dependence on our exploratory drilling activities, the volatility of and changes in oil and gas prices, the need to replace reserves depleted by production, impairments of proved oil and gas properties, operating risks of oil and gas operations, our dependence on our key personnel, factors that affect our ability to manage our growth and achieve our business strategy, results, delays and uncertainties that may be encountered in drilling, development or production, interpretations and impact of oil and gas reserve estimation and disclosure requirements, activities and approvals of our partners and parties with whom we have alliances, technological changes, capital requirements, the timing and amount of borrowing base redeterminations and availability under our revolving credit facility, evaluations of us by lenders under our revolving credit facility, waivers or amendments under our revolving credit facility in connection with acquisitions, other actions by lenders and holders of our capital stock, the potential impact of government regulations, including current and proposed legislation and regulations related to hydraulic fracturing, oil and natural gas drilling, air emissions and climate change, regulatory determinations, litigation, competition, the uncertainty of reserve information and future net revenue estimates, failure to realize the anticipated benefits of an acquisition, market conditions
3
and other factors affecting our ability to pay dividends on or redeem our preferred stock, integration and other acquisition risks, other factors affecting our ability to reach agreements or complete acquisitions or divestitures, actions by seller and buyers, effects of purchase price adjustments, availability of equipment and crews, actions by midstream and other industry participants, weather, our ability to obtain permits and licenses, the results of audits and assessments, the failure to obtain certain bank and lease consents, the existence and resolution of title defects, new taxes and impact fees, delays, costs and difficulties relating to our joint ventures, actions by joint venture parties, results of exploration activities, the availability, market conditions and completion of land acquisitions and dispositions, costs of oilfield services, completion and connection of wells, and other factors detailed in this annual report.
We have based our forward-looking statements on our management's beliefs and assumptions based on information available to our management at the time the statements are made. We caution you that assumptions, beliefs, expectations, intentions and projections about future events may and often do vary materially from actual results. Therefore, we cannot assure you that actual results will not differ materially from those expressed or implied by our forward-looking statements.
Some of the factors that could cause actual results to differ from those expressed or implied in forward-looking statements are described under Part I, "Item 1A. Risk Factors", other sections of this annual report, and in our other filings with the SEC. Should one or more of these risks or uncertainties materialize, or should underlying assumptions prove incorrect, actual outcomes may vary materially from those indicated. All subsequent written and oral forward-looking statements attributable to us or persons acting on our behalf are expressly qualified in their entirety by reference to these risks and uncertainties. You should not place undue reliance on our forward-looking statements. Each forward-looking statement speaks only as of the date of the particular statement, and, except as required by law, we undertake no duty to update or revise any forward-looking statement.
Certain terms used herein relating to the oil and gas industry are defined in "Glossary of Certain Industry Terms" included under Part I, "Item 1. Business."
4
PART I
Item 1. Business
General Overview
Carrizo Oil & Gas, Inc. is a Houston-based energy company which, together with its subsidiaries (collectively, "Carrizo," the "Company" or "we"), is actively engaged in the exploration, development, and production of crude oil, NGLs, and natural gas from resource plays located in the United States. Our current operations are principally focused in proven, producing oil and gas plays in the Eagle Ford Shale in South Texas and the Permian Basin in West Texas.
Significant Developments in 2018
Acquisitions. On October 17, 2018, we closed on the acquisition with Devon Energy Production Company, L.P. ("Devon"), a subsidiary of Devon Energy Corporation, of oil and gas properties in the Delaware Basin in Reeves and Ward counties, Texas (the "Devon Acquisition"). The estimated aggregate purchase price of $196.6 million remains subject to post-closing adjustments.
Divestitures. In the first quarter of 2018, we closed on divestitures of substantially all of our assets in the Niobrara Formation and a portion of our assets in the Eagle Ford for aggregate net proceeds of approximately $381.3 million. In addition, we could receive contingent consideration of $5.0 million per year if crude oil prices exceed specified thresholds for each of the years of 2018 through 2020 as part of the Niobrara Formation divestiture.
On July 11, 2018, we closed on the divestiture of certain non-operated assets in the Delaware Basin for aggregate net proceeds of $30.9 million .
See "Note 3. Acquisitions and Divestitures of Oil and Gas Properties" of the Notes to our Consolidated Financial Statements for further discussion.
Liquidity and financings. On August 17, 2018, we completed a public offering of 9.5 million shares of our common stock at a price per share of $22.55 . We used the proceeds of $213.7 million , net of offering costs, to fund the Devon Acquisition and for general corporate purposes.
We also redeemed the remaining $450.0 million aggregate principal amount outstanding of 7.50% Senior Notes due 2020 (the "7.50% Senior Notes") and 50,000 shares of our 8.875% redeemable preferred stock (the "Preferred Stock"), representing 20% of the then issued and outstanding Preferred Stock.
During 2018, the borrowing base under our revolving credit facility increased from $830.0 million to $1.3 billion, primarily as a result of our continued development of our Eagle Ford and Delaware Basin assets. As of December 31, 2018, our elected commitment amount under our borrowing base was $1.1 billion.
See "Note 6. Long-Term Debt" and "Note 10. Shareholders' Equity" of the Notes to our Consolidated Financial Statements for further discussion.
Production. Crude oil production in 2018 was 38,992 Bbls/d, an increase of 13% despite the divestitures in Niobrara and Eagle Ford in the first quarter of 2018, as compared to 34,428 Bbls/d in 2017 , primarily driven by strong performance from our new wells in the Eagle Ford and Delaware Basin. Total production in 2018 was 60,382 Boe/d, an increase of 12% from 53,805 Boe/d in 2017 , primarily due to the same reasons discussed above. See "-Summary of 2018 Proved Reserves, Production and Drilling by Area" for further discussion.
5
Proved reserves. At year-end 2018 , our proved reserves of 329.4 MMBoe consist of 55% crude oil, 21% natural gas liquids and 24% natural gas. Our reserves increased 67.7 MMBoe, or 26%, from our year-end 2017 proved reserves of 261.7 MMBoe primarily as a result of our ongoing drilling program in the Eagle Ford and the Delaware Basin. The following is a summary of our proved reserves as of December 31, 2018 and 2017 . See "-Additional Oil and Gas Disclosures-Proved Oil and Gas Reserves" for further discussion.
|
| Proved Reserves | ||||
|
| December 31, 2018 |
| December 31, 2017 | ||
Region |
| (MMBoe) | ||||
Eagle Ford (1) |
| 149.1 | |
| 167.0 | |
Delaware Basin |
| 180.3 | |
| 90.9 | |
Other (2) |
| - | |
| 3.8 | |
Total |
| 329.4 | |
| 261.7 | |
|
(1) | Included in the December 31, 2017 proved reserves are 10.9 MMBoe associated with a portion of our assets in the Eagle Ford that were divested in January 2018. |
(2) | In January 2018, we closed on the divestiture of substantially all of our Niobrara assets. |
Recent Developments
Contingent consideration arrangements. For the year ended December 31, 2018, the specified pricing thresholds related to the Contingent ExL Consideration, the Contingent Niobrara Consideration, and the Contingent Utica Consideration (each as defined in "Note 3. Acquisitions and Divestitures of Oil and Gas Properties" of the Notes to our Consolidated Financial Statements) were exceeded. As a result, in January 2019, we paid $50.0 million and received $10.0 million from settlement of these contingent consideration arrangements. See "Note 12. Derivative Instruments" of the Notes to our Consolidated Financial Statements for further discussion.
2019 Drilling, completion, and infrastructure ("DC&I") capital expenditure plan. Our 2019 DC&I capital expenditure plan is currently $525.0 million to $575.0 million . The assumptions in the 2019 DC&I capital expenditure plan include an expectation that we will achieve an improvement in capital efficiency relative to 2018 resulting from a combination of service cost reductions, efficiency gains, and changes to completion techniques that have already been implemented. We intend to finance our 2019 capital expenditure plan primarily from cash flow from operations and our senior secured revolving credit facility as well as other sources described in "Item 7. Management's Discussion and Analysis of Financial Condition and Results of Operations-Liquidity and Capital Resources." Our capital expenditure plan has the flexibility to adjust, should the commodity price environment change.
The following is a summary of our actual capital expenditures for 2018 and our planned capital expenditures for 2019 :
|
| Capital Expenditures | ||||||
|
| 2019 Plan (1) |
| 2018 Actual | ||||
|
| (In millions) | ||||||
DC&I |
|
|
|
| ||||
Eagle Ford |
| | $325.0 | |
| | $522.9 | |
Delaware Basin |
| 225.0 | |
| 321.2 | | ||
Other |
| - | |
| 0.3 | | ||
Total DC&I |
| 550.0 | |
| 844.4 | | ||
Leasehold and seismic (2) |
| - | |
| 22.4 | | ||
Total (3) |
| | $550.0 | |
| | $866.8 | |
|
(1) | Represents the midpoint of our 2019 DC&I capital expenditure plan of $525.0 million to $575.0 million . |
(2) | We do not provide guidance for leasehold and seismic capital expenditures given the discretionary nature of this spending. |
(3) | Our capital expenditure plan and the actual capital expenditures exclude acquisitions of oil and gas properties, capitalized general and administrative expense, interest expense and asset retirement costs. |
6
|
| Eagle Ford |
| Delaware Basin |
| Total | ||||||||||||
Proved reserves |
|
|
|
|
|
|
|
|
|
|
|
| ||||||
Crude oil (MBbls) |
|
|
| 110,907 | |
|
|
| 68,829 | |
|
|
| 179,736 | | |||
NGLs (MBbls) |
|
|
| 19,183 | |
|
|
| 49,940 | |
|
|
| 69,123 | | |||
Natural gas (MMcf) |
|
|
| 114,092 | |
|
|
| 368,969 | |
|
|
| 483,061 | | |||
Total proved reserves (MBoe) |
|
|
| 149,105 | |
|
|
| 180,264 | |
|
|
| 329,369 | | |||
|
|
|
|
|
|
| ||||||||||||
Proved reserves by classification (MBoe) |
|
|
|
|
|
|
|
| ||||||||||
Proved developed |
|
|
| 74,999 | |
|
|
| 55,900 | |
|
|
| 130,899 | | |||
Proved undeveloped |
|
|
| 74,106 | |
|
|
| 124,364 | |
|
|
| 198,470 | | |||
Total proved reserves (MBoe) |
|
|
| 149,105 | |
|
|
| 180,264 | |
|
|
| 329,369 | | |||
|
|
|
|
|
|
| ||||||||||||
Percent of proved developed reserves |
|
|
| 57 | % |
|
|
| 43 | % |
|
|
| 100 | % | |||
Percent of proved undeveloped reserves |
| | |
| 37 | % |
| | |
| 63 | % |
|
|
| 100 | % | |
Percent of total reserves |
|
|
| 45 | % |
|
|
| 55 | % |
|
|
| 100 | % | |||
|
|
|
|
|
|
|
|
|
|
|
|
| ||||||
Production volumes |
| Total |
| Per Day |
| Total |
| Per Day |
| Total |
| Per Day | ||||||
Crude oil (MBbls and Bbls/d) |
| 10,655 | |
| 29,192 | |
| 3,534 | |
| 9,682 | |
| 14,232 | |
| 38,992 | |
NGLs (MBbls and Bbls/d) |
| 1,575 | |
| 4,316 | |
| 2,118 | |
| 5,802 | |
| 3,701 | |
| 10,139 | |
Natural gas (MMcf and Mcf/d) |
| 8,941 | |
| 24,495 | |
| 15,604 | |
| 42,751 | |
| 24,639 | |
| 67,503 | |
Total production volumes |
| 13,721 | |
| 37,591 | |
| 8,252 | |
| 22,609 | |
| 22,040 | |
| 60,382 | |
|
|
|
|
|
|
| ||||||||||||
Percent of total production |
|
|
| 62 | % |
|
|
| 38 | % |
|
|
| 100 | % | |||
|
|
|
|
|
|
|
|
|
|
|
|
| ||||||
|
| Eagle Ford |
| Delaware Basin |
| Total | ||||||||||||
Operated Well Data |
| Gross |
| Net |
| Gross |
| Net |
| Gross |
| Net | ||||||
Year Ended December 31, 2018 |
|
|
|
|
|
|
|
|
|
|
|
| ||||||
Drilled |
| 100 | |
| 94.4 | |
| 31 | |
| 24.1 | |
| 131 | |
| 118.5 | |
Completed |
| 92 | |
| 81.5 | |
| 25 | |
| 20.1 | |
| 117 | |
| 101.6 | |
|
|
|
|
|
|
|
|
|
|
|
|
| ||||||
December 31, 2018 |
|
|
|
|
|
|
|
|
|
|
|
| ||||||
Drilled but uncompleted |
| 39 | |
| 38.7 | |
| 11 | |
| 9.0 | |
| 50 | |
| 47.7 | |
Producing |
| 534 | |
| 479.4 | |
| 80 | |
| 69.7 | |
| 614 | |
| 549.1 | |
Regional Overview
Eagle Ford Shale
For 2018, the Eagle Ford remained our most significant operational area. Our core Eagle Ford properties are located in LaSalle County and, to a lesser extent, in McMullen, Frio and Atascosa counties in Texas. As of December 31, 2018 , we held interests in approximately 91,770 gross ( 76,462 net) acres. In the first quarter of 2018, we closed on the sale of a portion of our assets in the Eagle Ford to EP Energy E&P Company, L.P. for aggregate net proceeds of $245.7 million. Excluding 1.3 MMBoe of production in 2017 from the divested assets, total Eagle Ford production increased approximately 10% over the year ended December 31, 2017. In 2018, we spent approximately $522.9 million in the Eagle Ford, which was approximately 19% above our 2018 DC&I capital expenditure plan for the Eagle Ford, due to our decision to shift capital to the Eagle Ford to take advantage of the superior returns that were offered from the play and avoid aggressively developing our Delaware Basin inventory during a period of weak local market pricing. We currently plan for approximately 59% of our 2019 DC&I capital expenditure plan to be directed towards opportunities in the Eagle Ford.
Delaware Basin
During 2014, we began to build an acreage position in the Delaware Basin in Culberson and Reeves counties, Texas, targeting the Wolfcamp Formation. In the third quarter of 2017, we closed on an acquisition of 16,508 net acres located in Reeves and Ward Counties, Texas from ExL Petroleum Management, LLC and ExL Petroleum Operating Inc. (the "ExL Acquisition"). In the fourth quarter of 2018, we closed on the Devon Acquisition which added approximately 10,000 net acres. As of December 31, 2018 , we held interests in approximately 70,335 gross ( 46,004 net) acres in the Delaware Basin. Production in the Delaware Basin for the year ended December 31, 2018 increased 237% from the same period in 2017. Excluding production associated with the Devon
7
Acquisition, production in the Delaware Basin for the year ended December 31, 2018 increased 231% as compared to the same period in 2017. In 2018, we spent approximately $321.2 million in the Delaware Basin, which was approximately 4% below our 2018 DC&I capital expenditure plan for the Delaware Basin, due to the capital shift discussed above. We currently plan for approximately 41% of our 2019 DC&I capital expenditure plan to be directed towards opportunities in the Delaware Basin.
Additional Oil and Gas Disclosures
Proved Oil and Gas Reserves
The following table sets forth summary information with respect to our estimated proved reserves and PV-10 for the years ended December 31, 2018, 2017 and 2016 that were prepared by Ryder Scott Company, L.P. ("Ryder Scott"), our independent third party reserve engineers. For further information concerning Ryder Scott's estimates of our proved reserves as of December 31, 2018 , see the reserve report included as an exhibit to this Annual Report on Form 10-K.
The prices used in the calculation of our estimated proved reserves and PV-10 were based on the average realized prices for sales of crude oil, NGLs and natural gas on the first calendar day of each month during the year ("12-Month Average Realized Price") in accordance with SEC rules. The following prices were used in the calculation of estimated proved reserves for the respective years.
|
| Years Ended December 31, | ||||||||||
|
| 2018 |
| 2017 |
| 2016 | ||||||
Crude oil ($ per Bbl) |
| | $63.80 | |
| | $49.87 | |
| | $39.60 | |
NGLs ($ per Bbl) |
| | $26.15 | |
| | $19.78 | |
| | $11.66 | |
Natural Gas ($ per Mcf) |
| | $2.46 | |
| | $2.96 | |
| | $1.89 | |
For further information concerning the present value of estimated future net revenues from these proved reserves, see "Note 2. Summary of Significant Accounting Policies" and "Note 17. Supplemental Disclosures about Oil and Gas Producing Activities (Unaudited)" of the Notes to our Consolidated Financial Statements. See also "-Other Reserve Matters" below for further discussion.
8
The following table summarizes our estimated proved reserves, standardized measure of discounted future net cash flows and PV-10 for the years ended December 31, 2018, 2017 and 2016 .
|
| As of December 31, | ||||||||||
|
| 2018 |
| 2017 |
| 2016 | ||||||
Proved developed reserves |
|
|
|
|
|
| ||||||
Crude oil (MBbls) |
| 75,267 | |
| 69,632 | |
| 51,062 | | |||
NGLs (MBbls) |
| 25,809 | |
| 17,447 | |
| 9,387 | | |||
Natural Gas (MMcf) |
| 178,941 | |
| 131,355 | |
| 187,054 | | |||
Total proved developed reserves (MBoe) |
| 130,899 | |
| 108,972 | |
| 91,625 | | |||
|
|
|
|
|
|
| ||||||
Proved undeveloped reserves |
|
|
|
|
| | ||||||
Crude oil (MBbls) |
| 104,469 | |
| 97,742 | |
| 77,256 | | |||
NGLs (MBbls) |
| 43,314 | |
| 25,151 | |
| 14,550 | | |||
Natural Gas (MMcf) |
| 304,120 | |
| 179,115 | |
| 100,391 | | |||
Total proved undeveloped reserves (MBoe) |
| 198,470 | |
| 152,745 | |
| 108,538 | | |||
|
|
|
|
|
|
| ||||||
Total proved reserves |
|
|
|
|
|
| ||||||
Crude oil (MBbls) |
| 179,736 | |
| 167,374 | |
| 128,318 | | |||
NGLs (MBbls) |
| 69,123 | |
| 42,598 | |
| 23,937 | | |||
Natural Gas (MMcf) |
| 483,061 | |
| 310,470 | |
| 287,445 | | |||
Total proved reserves (MBoe) |
| 329,369 | |
| 261,717 | |
| 200,163 | | |||
Proved developed reserves % |
| 40 | % |
| 42 | % |
| 46 | % | |||
Proved undeveloped reserves % |
| 60 | % |
| 58 | % |
| 54 | % | |||
|
|
|
|
|
|
| ||||||
Reserve data (In millions): |
|
|
|
|
|
| ||||||
Standardized measure of discounted future net cash flows (GAAP) |
| | $3,635.6 | |
| | $2,465.1 | |
| | $1,303.4 | |
PV-10 (Non-GAAP): |
|
|
|
|
|
| ||||||
Proved developed PV-10 |
| | $2,383.9 | |
| | $1,621.0 | |
| | $854.3 | |
Proved undeveloped PV-10 |
| 1,707.5 | |
| 1,017.4 | |
| 449.1 | | |||
Total PV-10 (Non-GAAP) |
| | $4,091.4 | |
| | $2,638.4 | |
| | $1,303.4 | |
Reconciliation of Standardized Measure of Discounted Future Net Cash Flows (GAAP) to PV-10 (Non-GAAP)
We believe that the presentation of PV-10 provides greater comparability when evaluating oil and gas companies due to the many factors unique to each individual company that impact the amount and timing of future income taxes. In addition, we believe that PV-10 is widely used by investors and analysts as a basis for comparing the relative size and value of our proved reserves to other oil and gas companies. PV-10 should not be considered in isolation or as a substitute for the standardized measure of discounted future net cash flows or any other measure of a company's financial or operating performance presented in accordance with GAAP. The definition of PV-10 as defined in "Item 1. Business-Glossary of Certain Industry Terms" may differ significantly from the definitions used by other companies to compute similar measures. As a result, PV-10 as defined may not be comparable to similar measures provided by other companies. A reconciliation of the standardized measure of discounted future net cash flows to PV-10 is presented below. Neither PV-10 nor the standardized measure of discounted future net cash flows purport to represent the fair value of our proved oil and gas reserves.
|
| As of December 31, | ||||||||||
|
| 2018 |
| 2017 |
| 2016 | ||||||
|
| (In millions) | ||||||||||
Standardized measure of discounted future net cash flows (GAAP) |
| | $3,635.6 | |
| | $2,465.1 | |
| | $1,303.4 | |
Add: present value of future income taxes discounted at 10% per annum |
| 455.8 | |
| 173.3 | |
| - | | |||
PV-10 (Non-GAAP) |
| | $4,091.4 | |
| | $2,638.4 | |
| | $1,303.4 | |
9
Proved Reserves
The following table provides a summary of the changes in our proved reserves for the year ended December 31, 2018 .
|
| Crude Oil (MBbls) |
| NGLs (MBbls) |
| Natural Gas (MMcf) |
| Total (MBoe) | ||||
Proved reserves as of December 31, 2017 |
| 167,374 | |
| 42,598 | |
| 310,470 | |
| 261,717 | |
Extensions and discoveries |
| 65,352 | |
| 30,195 | |
| 212,758 | |
| 131,007 | |
Revisions of previous estimates |
| (31,287 | ) |
| 1,936 | |
| (6,006 | ) |
| (30,352 | ) |
Purchases of reserves in place |
| 2,205 | |
| 967 | |
| 7,953 | |
| 4,498 | |
Sales of reserves in place |
| (9,676 | ) |
| (2,872 | ) |
| (17,475 | ) |
| (15,461 | ) |
Production |
| (14,232 | ) |
| (3,701 | ) |
| (24,639 | ) |
| (22,040 | ) |
Proved reserves as of December 31, 2018 |
| 179,736 | |
| 69,123 | |
| 483,061 | |
| 329,369 | |
Extensions and discoveries of 131,007 MBoe were comprised of 12,687 MBoe of proved developed reserves and 118,320 MBoe of proved undeveloped reserves ("PUDs") that were added through our drilling program and associated offset locations. Eagle Ford and Delaware Basin comprised 30% and 70% , respectively, of the total extensions and discoveries.
Revisions of previous estimates reduced our reserves by 30,352 MBoe. Included in the revisions of previous estimates were the following components;
• | Negative revisions of 21,753 MBoe, primarily in the Eagle Ford, due to changes in our previously approved development plan, which resulted in the timing of development for certain PUD locations to move beyond five years from initial booking. The primary drivers of the changes in our previously approved development plan are the reallocation of capital to areas providing the greatest opportunities to increase capital efficiency and maximize project-level economics within our reduced capital expenditure plan, which includes a shift to larger-scale development projects. |
• | Net negative revisions of 12,363 MBoe, primarily due to negative revisions of 14,907 MBoe in the Eagle Ford, partially offset by positive revisions of 2,544 MBoe in the Delaware Basin. The negative revisions in the Eagle Ford were primarily a result of completion of new wells that negatively impacted the production of adjacent existing producing wells and the associated impact to certain PUD locations, as well as a reduction in spacing and the average lateral length for certain PUD locations. |
• | Positive revisions due to price of 3,764 MBoe. |
Purchases of reserves in place included 4,498 MBoe of proved developed reserves associated with the Devon Acquisition.
Sales of reserves in place included 13,465 MBoe of proved developed reserves and 1,996 MBoe of proved undeveloped reserves associated with the Eagle Ford and Niobrara Formation divestitures.
Proved Undeveloped Reserves
The following table provides a summary of the changes in our PUDs for the year ended December 31, 2018 .
|
| Crude Oil (MBbls) |
| NGLs (MBbls) |
| Natural Gas (MMcf) |
| Total (MBoe) | ||||
PUDs as of December 31, 2017 |
| 97,742 | |
| 25,151 | |
| 179,115 | |
| 152,745 | |
Extensions and discoveries |
| 58,373 | |
| 27,581 | |
| 194,196 | |
| 118,320 | |
Removed due to changes in development plan |
| (15,847 | ) |
| (2,686 | ) |
| (16,219 | ) |
| (21,236 | ) |
Revisions of previous estimates |
| (9,040 | ) |
| 2,274 | |
| 8,980 | |
| (5,268 | ) |
Sales of reserves in place |
| (1,403 | ) |
| (289 | ) |
| (1,823 | ) |
| (1,996 | ) |
Converted to proved developed reserves |
| (25,356 | ) |
| (8,717 | ) |
| (60,129 | ) |
| (44,095 | ) |
PUDs as of December 31, 2018 |
| 104,469 | |
| 43,314 | |
| 304,120 | |
| 198,470 | |
Extensions and discoveries of 118,320 MBoe were due to additional offset locations associated with our drilling program, of which 84,399 MBoe were in the Delaware Basin and 33,921 MBoe were in the Eagle Ford. We incurred $36.6 million during 2018 for certain of these PUD locations that were drilled but uncompleted as of December 31, 2018, with $18.7 million incurred in the Eagle Ford and $17.9 million in the Delaware Basin.
We removed 21,236 MBoe of PUDs, primarily in the Eagle Ford, due to changes in our previously approved development plan, which resulted in the timing of development for certain PUD locations to move beyond five years from initial booking. The primary drivers of the changes in our previously approved development plan are the reallocation of capital to areas providing the greatest opportunities to increase capital efficiency and maximize project-level economics within our reduced capital expenditure plan, which includes a shift to larger-scale development projects.
10
Revisions of previous estimates of 5,268 MBoe included 5,917 MBoe of negative revisions, partially offset by 649 MBoe of positive revisions due to pricing. The negative revisions, of which 4,792 MBoe were in the Eagle Ford, were primarily a result of incorporating the impact to estimated future production for certain PUD locations where future completions are adjacent to the respective PUD location, as well as a reduction in spacing and the average lateral length for certain PUD locations.
Sales of PUDs in place of 1,996 MBoe were related to the sale of a portion of our assets in the Eagle Ford in the first quarter of 2018. We had no PUDs associated with the divestiture in the Niobrara Formation.
We converted 44,095 MBoe of PUDs that were booked as PUDs as of December 31, 2017 to proved developed during 2018, of which 23,181 MBoe were in the Eagle Ford and 20,914 MBoe were in the Delaware Basin, at a total cost of $490.5 million, or $11.12 per Boe.
We converted an additional 10,430 MBoe of PUDs that were booked as PUDs during 2018 to proved developed, and therefore not included in the table above, of which 5,161 MBoe were in the Eagle Ford and 5,269 MBoe in the Delaware Basin. The total cost to convert these PUDs was $126.6 million, or $12.14 per Boe, of which $79.2 million, or $15.35 per Boe, was in the Eagle Ford and $47.4 million, or $9.00 per Boe, was in the Delaware Basin.
During 2018, we also incurred $68.0 million on PUDs that were drilled but uncompleted as of December 31, 2018 that were booked as PUDs as of December 31, 2017, of which $42.7 million was in the Eagle Ford and $25.3 million was in the Delaware Basin. As of December 31, 2018, we had 25,616 MBoe of PUDs associated with wells that were drilled but uncompleted, 14,430 MBoe of which were in the Eagle Ford and 11,186 MBoe in the Delaware Basin. All of the reserves associated with drilled but uncompleted wells are scheduled to be completed in 2019. We expect to incur $212.6 million of capital expenditures to complete these wells, with $154.4 million allocated to the Eagle Ford and $58.2 million allocated to the Delaware Basin.
At December 31, 2018 , we did not have any reserves that have remained undeveloped for five or more years since the date of their initial booking and all PUD locations are scheduled to be developed within five years of their initial booking.
Qualifications of Technical Persons
In accordance with the Standards Pertaining to the Estimating and Auditing of Oil and Gas Reserves Information promulgated by the Society of Petroleum Engineers and the guidelines established by the Securities and Exchange Commission ("SEC"), Ryder Scott estimated 100% of our proved reserves as of December 31, 2018 , 2017 , and 2016 as presented in this Annual Report on Form 10-K. The technical persons responsible for preparing the reserves estimates meet the requirements regarding qualifications, independence, objectivity and confidentiality set forth in the Standards Pertaining to Estimating and Auditing of Oil and Gas Reserves Information promulgated by the Society of Petroleum Engineers. Ryder Scott does not own an interest in our properties and is not employed on a contingent fee basis.
Our internal reserve engineers each have over 25 years of experience in the petroleum industry and extensive experience in the estimation of reserves and the review of reserve reports prepared by third party engineering firms. The reserve reports are also reviewed by senior management, including the Chief Executive Officer, who is a registered petroleum engineer and holds a B.S. in Mechanical Engineering and the Chief Operating Officer, who holds a B.S. in Petroleum Engineering.
Internal Controls Over Reserve Estimation Process
The primary inputs to the reserve estimation process are comprised of technical information, financial data, production data, and ownership interests. All field and reservoir technical information, which is updated annually, is assessed for validity when the internal reserve engineers hold technical meetings with our geoscientists, operations, and land personnel to discuss field performance and to validate future development plans. The other inputs used in the reserve estimation process, including, but not limited to, future capital expenditures, commodity price differentials, production costs, and ownership percentages are subject to internal controls over financial reporting and are assessed for effectiveness annually.
Our internal reserve engineers work closely with Ryder Scott to ensure the integrity, accuracy, and timeliness of the data furnished to Ryder Scott for use in their reserves estimation process. Our internal reserve engineers meet regularly with Ryder Scott to review and discuss methods and assumptions used in Ryder Scott's preparation of the year-end reserves estimates. The internal reserve engineers review the inputs and assumptions made in the reserves estimates prepared by Ryder Scott and assess them for reasonableness.
Specific internal control procedures include, but are not limited to, the following:
• | Review by our internal reserve engineers of all of our reported proved reserves at the close of each quarter, including review of all additions to PUD reserves |
• | Quarterly updates by our senior management to our Board of Directors regarding operational data, including production, drilling and completion activity and any significant changes in our reserves estimates |
• | Quarterly and annual preparation of a reserve reconciliation that is reviewed by members of our senior management |
11
• | Annual review by our senior management of our year-end reserves estimates prepared by Ryder Scott |
• | Annual review by our senior management and Board of Directors of our multi-year development plan and approval by the Board of Directors of our capital expenditure plan |
• | Review by our senior management of changes, if applicable, in our previously approved development plan |
Other Reserve Matters
No estimates of proved reserves comparable to those included herein have been included in reports to any federal agency other than the SEC. The reserves data set forth in this Annual Report on Form 10-K represents only estimates. See "Item 1A. Risk Factors-Our reserve data and estimated discounted future net cash flows are estimates based on assumptions that may be inaccurate and are based on existing economic and operating conditions that may change in the future."
Our future oil and gas production is highly dependent upon our level of success in finding or acquiring additional reserves. See "Item 1A. Risk Factors-We depend on successful exploration, development and acquisitions to maintain reserves and revenue in the future." Also, the failure of an operator of our wells to adequately perform operations, or such operator's breach of the applicable agreements, could adversely impact us. See "Item 1A. Risk Factors-We cannot control the activities on properties we do not operate."
The prices used in calculating the estimated future net revenue attributable to proved reserves do not necessarily reflect market prices for oil and gas production. See "Item 1A. Risk Factors-Our reserve data and estimated discounted future net cash flows are estimates based on assumptions that may be inaccurate and are based on existing economic and operating conditions that may change in the future." There can be no assurance that all of the proved reserves will be produced and sold within the periods indicated, that the assumed prices will actually be realized for such production or that existing contracts will be honored or judicially enforced.
12
Oil and Gas Production, Prices and Costs
The following table sets forth certain information regarding the production volumes, average realized prices and average production costs associated with our sales of crude oil and natural gas for the periods indicated.
|
| Years Ended December 31, | ||||||||||
|
| 2018 |
| 2017 |
| 2016 | ||||||
Total production volumes |
|
|
| |
|
| ||||||
Crude oil (MBbls) |
| 14,232 | |
| 12,566 | |
| 9,423 | | |||
NGLs (MBbls) |
| 3,701 | |
| 2,327 | |
| 1,788 | | |||
Natural gas (MMcf) |
| 24,639 | |
| 28,472 | |
| 25,574 | | |||
Total barrels of oil equivalent (MBoe) |
| 22,040 | |
| 19,639 | |
| 15,473 | | |||
|
|
|
|
|
|
| ||||||
Daily production volumes by product |
|
|
|
|
|
| ||||||
Crude oil (Bbls/d) |
| 38,992 | |
| 34,428 | |
| 25,745 | | |||
NGLs (Bbls/d) |
| 10,139 | |
| 6,376 | |
| 4,885 | | |||
Natural gas (Mcf/d) |
| 67,503 | |
| 78,006 | |
| 69,873 | | |||
Total barrels of oil equivalent per day (Boe/d) |
| 60,382 | |
| 53,805 | |
| 42,276 | | |||
|
|
|
|
|
|
| ||||||
Daily production volumes by region (Boe/d) |
|
|
|
|
|
| ||||||
Eagle Ford |
| 37,591 | |
| 37,825 | |
| 30,664 | | |||
Delaware Basin |
| 22,609 | |
| 6,713 | |
| 1,115 | | |||
Other |
| 182 | |
| 9,267 | |
| 10,497 | | |||
Total barrels of oil equivalent (Boe/d) |
| 60,382 | |
| 53,805 | |
| 42,276 | | |||
|
|
|
|
|
|
| ||||||
Average realized prices |
|
|
| |
|
| ||||||
Crude oil ($ per Bbl) |
| | $64.05 | |
| | $50.39 | |
| | $40.12 | |
NGLs ($ per Bbl) |
| 26.10 | |
| 20.37 | |
| 12.54 | | |||
Natural gas ($ per Mcf) |
| 2.35 | |
| 2.29 | |
| 1.69 | | |||
Total average realized price ($ per Boe) |
| | $48.36 | |
| | $37.98 | |
| | $28.67 | |
|
|
|
|
|
|
| ||||||
Average production costs ($ per Boe) |
|
|
|
|
|
| ||||||
Lease operating expense |
| | $7.33 | |
| | $7.12 | |
| | $6.38 | |
Production taxes |
| | $2.30 | |
| | $1.66 | |
| | $1.23 | |
Ad valorem taxes |
| | $0.47 | |
| | $0.37 | |
| | $0.36 | |
Total average production costs ($ per Boe) |
| | $10.10 | |
| | $9.15 | |
| | $7.97 | |
Drilling Activity
The following table sets forth our operated and non-operated drilling activity for the years ended December 31, 2018, 2017 and 2016 . In the table, "gross" refers to the total wells in which we have a working interest and "net" refers to gross wells multiplied by our working interest therein. As defined by the SEC, the number of wells drilled refers to the number of wells completed at any time during the respective year, regardless of when drilling was initiated. For definitions of exploratory wells, development wells, productive wells, and non-productive wells, see "-Glossary of Certain Industry Terms".
|
| Years Ended December 31, | ||||||||||||||||
|
| 2018 |
| 2017 |
| 2016 | ||||||||||||
|
| Gross |
| Net |
| Gross |
| Net |
| Gross |
| Net | ||||||
Exploratory Wells - Productive |
| 38 | |
| 2.5 | |
| 47 | | (1) | 7.1 | | (1) | 29 | |
| 4.5 | |
Exploratory Wells - Non-productive |
| - | |
| - | |
| - | |
| - | |
| - | |
| - | |
Development Wells - Productive |
| 117 | |
| 101.8 | |
| 102 | | (2) | 89.7 | | (2) | 81 | |
| 73.5 | |
Development Wells - Non-productive |
| - | |
| - | |
| - | |
| - | |
| - | |
| - | |
|
(1) | Includes 37 gross (6.3 net) productive exploratory wells which were part of the divestitures of substantially all of our assets in the Utica, Marcellus, and Niobrara, as well as a portion of our assets in the Eagle Ford. |
(2) | Includes 5 gross (3.8 net) productive development wells which were part of the divestiture of a portion of our assets in the Eagle Ford. |
13
As of December 31, 2018 , we had 80 gross ( 63.7 net) operated and non-operated wells in various stages of drilling, completion or waiting on completion that are not included in the table above.
Productive Wells
The following table sets forth the number of productive crude oil and natural gas wells in which we owned an interest as of December 31, 2018 .
|
| Crude Oil |
| Natural Gas |
| Total | ||||||||||||
|
| Gross |
| Net |
| Gross |
| Net |
| Gross |
| Net | ||||||
Eagle Ford - Operated |
| 532 | |
| 477.6 | |
| 2 | |
| 1.8 | |
| 534 | |
| 479.4 | |
Eagle Ford - Non-operated |
| 12 | |
| 2.0 | |
| - | |
| - | |
| 12 | |
| 2.0 | |
Total Eagle Ford |
| 544 | |
| 479.6 | |
| 2 | |
| 1.8 | |
| 546 | |
| 481.4 | |
|
|
|
|
|
|
|
|
|
|
|
|
| ||||||
Delaware Basin - Operated |
| 54 | |
| 44.8 | |
| 30 | |
| 28.6 | |
| 84 | |
| 73.4 | |
Delaware Basin - Non-operated |
| 14 | |
| 1.9 | |
| 43 | |
| 2.1 | |
| 57 | |
| 4.0 | |
Total Delaware Basin |
| 68 | |
| 46.7 | |
| 73 | |
| 30.7 | |
| 141 | |
| 77.4 | |
|
|
|
|
|
|
|
|
|
|
|
|
| ||||||
Other (1) |
| - | |
| - | |
| 14 | |
| 0.6 | |
| 14 | |
| 0.6 | |
Total |
| 612 | |
| 526.3 | |
| 89 | |
| 33.1 | |
| 701 | |
| 559.4 | |
|
(1) | All wells included in Other were non-operated wells. |
Acreage Data
The following table sets forth certain information regarding our developed and undeveloped acreage as of December 31, 2018 . Developed acreage refers to acreage on which wells have been completed to a point that would permit production of oil and gas in commercial quantities. Undeveloped acreage refers to acreage on which wells have not been drilled or completed to a point that would permit production of oil and gas in commercial quantities whether or not the acreage contains proved reserves.
|
| Developed Acreage |
| Undeveloped Acreage |
| Total Acreage |
| Net Undeveloped Acreage Expiring |
| |||||||||||||||||||
|
| Gross |
| Net |
| Gross |
| Net |
| Gross |
| Net |
| 2019 |
| 2020 |
| 2021 |
| |||||||||
Eagle Ford |
| 76,644 | |
| 63,970 | |
| 15,126 | |
| 12,492 | |
| 91,770 | |
| 76,462 | |
| 3,228 | | (1) | 1,499 | | (1) | - | |
|
Delaware Basin |
| 39,533 | |
| 28,076 | |
| 30,802 | |
| 17,928 | |
| 70,335 | |
| 46,004 | |
| 1,760 | | (2) | 11,563 | | (2) | 348 | | (2) |
Other |
| 2,467 | |
| 404 | |
| 72,847 | |
| 42,900 | |
| 75,314 | |
| 43,304 | |
| 2,920 | | (3) | - | |
| 1,234 | | (3) |
Total |
| 118,644 | |
| 92,450 | |
| 118,775 | |
| 73,320 | |
| 237,419 | |
| 165,770 | |
| 7,908 | |
| 13,062 | |
| 1,582 | |
|
|
(1) | Approximately 100% and 68% of the acreage expiring in 2019 and 2020, respectively, will be developed prior to expiration or extended by lease extension payments. We have no current development plans and no proved undeveloped reserves associated with the remaining acreage as of December 31, 2018. |
(2) | Approximately 73%, 6% and 90% of the acreage expiring in 2019, 2020 and 2021, respectively, will be developed prior to expiration or extended by lease extension payments. The acreage expiring in 2020 is primarily in our Alpine High area where, along with the other remaining acreage, we have no current development plans and no proved undeveloped reserves. |
(3) | Other includes non-core acreage principally located in Texas, Wyoming, Ohio, and Illinois. We have no current development plans or proved undeveloped reserves associated with this acreage as of December 31, 2018. |
Our lease agreements generally terminate if producing wells have not been drilled on the acreage within their primary term or an extension thereof (a period that can be from three to five years depending on the area). The percentage of net undeveloped acreage expiring in 2019, 2020, and 2021 assumes that no producing wells have been drilled on acreage within their primary term or have been extended. We manage our lease expirations to ensure that we do not experience unintended material expirations. Our leasehold management efforts include scheduling drilling in order to hold leases by production or timely exercising our contractual rights to extend the terms of leases by continuous operations or the payment of lease extension payments and delay rentals. We may choose to allow some leases to expire that are no longer part of our development plans.
The proved undeveloped reserves associated with acreage expiring over the next three years are not material to the Company.
14
Marketing
Typically, our production is sold at the wellhead to unaffiliated third party purchasers. Crude oil is sold at prices based on posted prices or NYMEX plus or minus market differentials for the respective area. Natural gas and NGLs are sold under contract at a negotiated price which is based on the market price for the area or at published prices for specified locations or pipelines and then discounted by the purchaser back to the wellhead based upon a number of factors normally considered in the industry (such as distance from the well to the central market location, well pressure, quality of natural gas and prevailing supply and demand conditions). Natural gas is generally delivered to a midstream processing entity at the wellhead or the inlet of the midstream processing entity's system. The midstream processing entity gathers and processes the natural gas and remits proceeds for the resulting sales of NGLs and residue gas. We sell at competitive market prices based on a differential to several market locations. In instances of depressed oil and gas prices, we may elect to shut-in wells until commodity prices are more favorable. We do not believe the loss of any one of our purchasers would materially affect our ability to sell the oil and gas we produce because we believe other purchasers are available in all our areas of operations.
Our marketing objective is to receive competitive wellhead prices for our product. There are a variety of factors that affect the market for oil and gas generally, including:
• | demand for oil and gas; |
• | the extent of supply of oil and gas and, in particular, domestic production and imports; |
• | the proximity and capacity of natural gas pipelines and other transportation facilities; |
• | the marketing of competitive fuels; and |
• | the effects of state and federal regulations on oil and gas production and sales. |
See "Item 1A. Risk Factors-Oil and gas prices are highly volatile, and continued low oil and gas prices or further price decreases will negatively affect our financial position, planned capital expenditures and results of operations," "-We are subject to various environmental risks and governmental regulations, including those relating to benzene emissions, hydraulic fracturing and global climate change, and future regulations may be more stringent resulting in increased operating costs and decreased demand for the oil and gas that we produce," and "-If our access to markets is restricted, it could negatively impact our production, our income and ultimately our ability to retain our leases. Our ability to sell oil and natural gas and receive market prices for our oil and natural gas may be adversely affected by pipeline and gathering system capacity constraints."
We work with various pipeline companies to procure and to assure capacity for our natural gas. For further discussion of this matter, see "Item 1A. Risk Factors-If our access to markets is restricted, it could negatively impact our production, our income and ultimately our ability to retain our leases. Our ability to sell oil and natural gas and receive market prices for our oil and natural gas may be adversely affected by pipeline and gathering system capacity constraints." We have entered into various long-term gathering, processing, and transportation contracts with various parties which require us to deliver fixed, determinable quantities of production over specified periods of time. Certain of these contracts require us to make payments for any shortfalls in delivering or transporting minimum volumes under these commitments. As of the filing of this report, we do not expect any material shortfalls in our delivery commitments. See "Item 7. Management's Discussion and Analysis of Financial Condition and Results of Operations-Contractual Obligations" and "Note 8. Commitments and Contingencies" of the Notes to our Consolidated Financial Statements for further discussion.
Competition and Technological Changes
We encounter competition from other oil and gas companies in all areas of our operations, including the acquisition of exploratory prospects and proven properties, obtaining necessary equipment, supplies and services, and recruiting and retaining skilled employees. Many of our competitors are large, well-established companies that have been engaged in the oil and gas business for much longer than we have and possess substantially larger operating staffs and greater capital resources than we do. We may not be able to conduct our operations, evaluate and select suitable properties and consummate transactions successfully in this highly competitive environment.
The oil and gas industry is characterized by rapid and significant technological advancements and introductions of new products and services using new technologies. If one or more of the technologies we use now or in the future were to become obsolete or if we are unable to use the most advanced commercially available technology, our business, financial condition and results of operations could be materially adversely affected.
Regulation
Oil and gas operations are subject to various federal, state, local and international environmental regulations that may change from time to time, including regulations governing oil and gas production and transportation, federal and state regulations governing
15
environmental quality and pollution control and state limits on allowable rates of production by well or proration unit. These regulations may affect the amount of oil and gas available for sale, the availability of adequate pipeline and other regulated processing and transportation facilities and the marketing of competitive fuels. For example, a productive natural gas well may be "shut-in" because of an oversupply of natural gas or lack of an available natural gas pipeline in the areas in which we may conduct operations. State and federal regulations generally are intended to prevent waste of oil and gas, protect rights to produce oil and gas between owners in a common reservoir, control the amount of oil and gas produced by assigning allowable rates of production, provide nondiscriminatory access to common carrier pipelines and control contamination of the environment. Pipelines are subject to the jurisdiction of various federal, state and local agencies. We are also subject to changing and extensive tax laws, the effects of which cannot be predicted.
The following discussion summarizes the regulation of the United States oil and gas industry. We believe we are in substantial compliance with the various statutes, rules, regulations and governmental orders to which our operations may be subject, although we cannot assure you that this is or will remain the case. Moreover, those statutes, rules, regulations and government orders may be changed or reinterpreted from time to time in response to economic or political conditions, and any such changes or reinterpretations could materially adversely affect our results of operations and financial condition. The following discussion is not intended to constitute a complete discussion of the various statutes, rules, regulations and governmental orders to which our operations may be subject.
Regulation of Natural Gas and Oil Exploration and Production
Our operations are subject to various types of regulation at the federal, state and local levels that:
• | require permits for the drilling of wells; |
• | mandate that we maintain bonding requirements in order to drill or operate wells; and |
• | regulate the location of wells, the method of drilling and casing wells, the surface use and restoration of properties upon which wells are drilled, groundwater sampling requirements prior to drilling, the plugging and abandoning of wells and the disposal of fluids used in connection with operations. |
Our operations are also subject to various conservation laws and regulations. These regulations govern the size of drilling and spacing units or proration units, setback rules, the density of wells that may be drilled in oil and gas properties and the unitization or pooling of oil and gas properties. In this regard, some states allow the forced pooling or integration of tracts to facilitate exploration while other states (including Texas) rely primarily or exclusively on voluntary pooling of lands and leases. In areas where pooling is primarily or exclusively voluntary, it may be more difficult to form units and therefore more difficult to develop a project if the operator owns less than 100% of the leasehold. In addition, state conservation laws that establish maximum rates of production from oil and gas wells generally prohibit the venting or flaring of natural gas and impose specified requirements regarding the ratability of production. The effect of these regulations may limit the amount of oil and gas we can produce from our wells and may limit the number of wells or the locations at which we can drill. The regulatory burden on the oil and gas industry increases our costs of doing business and, consequently, affects our profitability. Because these laws and regulations are frequently expanded, amended and reinterpreted, we are unable to predict the future cost or impact of complying with such regulations.
Regulation of Sales and Transportation of Natural Gas
Federal legislation and regulatory controls have historically affected the price of natural gas we produce and the manner in which our production is transported and marketed. Under the Natural Gas Act of 1938 ("NGA"), the Federal Energy Regulatory Commission ("FERC") regulates the interstate transportation and the sale in interstate commerce for resale of natural gas. Effective January 1, 1993, the Natural Gas Wellhead Decontrol Act (the "Decontrol Act") deregulated natural gas prices for all "first sales" of natural gas, including all of our sales of our own production. As a result, all of our domestically produced natural gas is sold at market prices, subject to the terms of any private contracts that may be in effect. The FERC's jurisdiction over interstate natural gas transportation, however, was not affected by the Decontrol Act.
Under the NGA, facilities used in the production or gathering of natural gas are exempt from the FERC's jurisdiction. We own certain natural gas pipelines that we believe satisfy the FERC's criteria for establishing that these are all gathering facilities not subject to FERC jurisdiction under the NGA. State regulation of gathering facilities generally includes various safety, environmental, and in some circumstances, nondiscriminatory take requirements and complaint-based rate regulation.
One of our pipeline subsidiaries, Hondo Pipeline Inc., may exercise the power of eminent domain and is a regulated public utility within the meaning of Section 101.003 ("GURA") and Section 121.001 (the "Cox Act") of the Texas Utilities Code. Both GURA and the Cox Act prohibit unreasonable discrimination in the transportation of natural gas and authorize the Texas Railroad Commission to regulate gas transportation rates. However, GURA provides for negotiated rates with transportation, industrial or similar large-volume contract customers so long as neither party has an unfair negotiating advantage, the negotiated rate is
16
substantially the same as that negotiated with at least two other customers under similar conditions, or sufficient competition existed when the rate was negotiated.
Although we do not own or operate any pipelines or facilities that are directly regulated by the FERC, its regulations of third-party pipelines and facilities could indirectly affect our ability to market our production. Beginning in the 1980s, the FERC initiated a series of major restructuring orders that required pipelines, among other things, to perform open access transportation, "unbundle" their sales and transportation functions, and allow shippers to release their pipeline capacity to other shippers. As a result of these changes, sellers and buyers of natural gas have gained direct access to the particular pipeline services they need and are better able to conduct business with a larger number of counterparties. We believe these changes generally have improved our access to markets while, at the same time, substantially increasing competition in the natural gas marketplace. It remains to be seen, however, what effect the FERC's other activities will have on access to markets, the fostering of competition and the cost of doing business. We cannot predict what new or different regulations the FERC and other regulatory agencies may adopt, or what effect subsequent regulations may have on our activities.
In the past, Congress has been very active in the area of natural gas regulation. However, the more recent trend has been in favor of deregulation or "lighter handed" regulation and the promotion of competition in the gas industry. In light of this increased reliance on competition, the Energy Policy Act of 2005 amended the NGA to prohibit any forms of market manipulation in connection with the transportation, purchase or sale of natural gas. In addition to the regulations implementing these prohibitions, the FERC has established new regulations that are intended to increase natural gas pricing transparency through, among other things, expanded dissemination of information about the availability and prices of gas sold and new regulations that require both interstate pipelines and certain non-interstate pipelines to post daily information regarding their design capacity and daily scheduled flow volumes at certain points on their systems. The Energy Policy Act of 2005 also significantly increased the penalties for violations of the NGA and the FERC's regulations to up to $1.0 million per day for each violation. This maximum penalty authority established by statute has been and will continue to be adjusted periodically to account for inflation.
Oil Price Controls and Transportation Rates
Our sales of crude oil, condensate and NGLs are not currently regulated and are made at market prices. The price we receive from the sale of these products may be affected by the cost of transporting the products to market. Much of that transportation is through interstate common carrier pipelines. Effective as of January 1, 1995, the FERC implemented regulations generally grandfathering all previously approved interstate transportation rates and establishing an indexing system for those rates by which adjustments are made annually based on the rate of inflation, subject to specified conditions and limitations. These regulations may tend to increase the cost of transporting crude oil and NGLs by interstate pipeline, although the annual adjustments may result in decreased rates in a given year. Every five years, the FERC must examine the relationship between the annual change in the applicable index and the actual cost changes experienced in the oil pipeline industry. In December 2015, to implement the latest required five-yearly re-determination, the FERC established an upward adjustment in the index to track oil pipeline cost changes. For the five-year period beginning July 1, 2016, FERC established an annual index adjustment equal to the change in the producer price index for finished goods plus 1.23%. Under FERC's regulations, liquids pipelines can request a rate increase that exceeds the rate obtained through application of the indexing methodology by using a cost-of-service approach, but only after the pipeline establishes that a substantial divergence exists between the actual costs experienced by the pipeline and the rates resulting from application of the indexing methodology. We are not able at this time to predict the effects of this indexing system or any new FERC regulations on the transportation costs associated with oil production from our oil producing operations.
There regularly are legislative proposals pending in the federal and state legislatures which, if enacted, would significantly affect the petroleum industry. At the present time, it is impossible to predict what proposals, if any, might actually be enacted by Congress or the various state legislatures and what effect, if any, such proposals might have on us. Similarly, we cannot predict whether or to what extent the trend toward federal deregulation of the petroleum industry will continue, or what the ultimate effect on our sales of oil, gas and other petroleum products will be.
17
Environmental Regulations
Our operations are subject to numerous international, federal, state and local laws and regulations governing the discharge of materials into the environment or otherwise relating to environmental protection. These laws and regulations may require the acquisition of a permit before drilling commences, restrict the types, quantities and concentration of various substances that can be released into the environment in connection with drilling and production activities, limit or prohibit drilling activities on specified lands within wilderness, wetlands and other protected areas, require remedial measures to mitigate pollution from former operations, such as pit closure and plugging abandoned wells, and impose substantial liabilities for pollution resulting from production and drilling operations. The failure to comply with these laws and regulations may result in the assessment of administrative, civil and criminal penalties, imposition of investigatory or remedial obligations or the issuance of injunctions prohibiting or limiting the extent of our operations. Public interest in the protection of the environment has increased dramatically in recent years. The trend of applying more expansive and stricter environmental legislation and regulations to the oil and gas industry could continue, resulting in increased costs of doing business and consequently affecting our profitability. To the extent laws are enacted or other governmental action is taken that restricts drilling or imposes more stringent and costly waste handling, disposal and cleanup requirements, our business and prospects could be adversely affected.
We currently own or lease numerous properties that for many years have been used for the exploration and production of oil and gas. Although we believe that we have generally implemented appropriate operating and waste disposal practices, prior owners and operators of these properties may not have used similar practices, and hydrocarbons or other waste may have been disposed of or released on or under the properties we own or lease or on or under locations where such waste has been taken for disposal. In addition, many of these properties have been operated by third parties whose treatment and disposal or release of hydrocarbons or other waste was not under our control. These properties and the waste disposed thereon may be subject to the federal Resource Conservation and Recovery Act ("RCRA"), the Comprehensive Environmental Response, Compensation and Liability Act ("CERCLA"), and analogous state laws as well as state laws governing the management of oil and gas waste. Under these laws, we could be required to remove or remediate previously disposed waste (including waste disposed of or released by prior owners or operators) or property contamination (including groundwater contamination) or to perform remedial plugging operations to prevent future contamination.
We generate waste that may be subject to RCRA and comparable state statutes. The U.S. Environmental Protection Agency (the "EPA") and various state agencies have limited the approved methods of disposal for certain hazardous and nonhazardous waste. Furthermore, certain waste generated by our oil and gas operations that are currently exempt from treatment as "hazardous waste" may in the future be designated as "hazardous waste" and therefore become subject to more rigorous and costly operating and disposal requirements.
CERCLA, also known as the "Superfund" law, and analogous state laws impose liability, without regard to fault or the legality of the original conduct, on specified classes of persons that are considered to have contributed to the release of a "hazardous substance" into the environment. These classes of persons include the owner or operator of the disposal site or sites where the release occurred and companies that disposed or arranged for the disposal of the hazardous substances found at the site. Persons who are or were responsible for releases of hazardous substances under CERCLA may be subject to joint and several liability for the costs of cleaning up the hazardous substances that have been released into the environment, for damages to natural resources and for the costs of certain health studies. It is not uncommon for neighboring landowners and other third parties to file claims for personal injury and property damage allegedly caused by the hazardous substances released into the environment.
Our operations may be subject to the Clean Air Act and comparable state and local requirements. In 1990 Congress adopted amendments to the Clean Air Act containing provisions that have resulted in the gradual imposition of certain pollution control requirements with respect to air emissions from our operations. The EPA and states have developed and continue to develop regulations to implement these requirements. We may be required to incur certain capital expenditures in the next several years for air pollution control equipment in connection with maintaining or obtaining operating permits and approvals addressing other air emission-related issues. Moreover, changes in environmental laws and regulations occur frequently, and stricter laws, regulations or enforcement policies could significantly increase our compliance costs. Further, stricter requirements could negatively impact our production and operations. For example, on October 1, 2015, the EPA released a final rule tightening the primary and secondary NAAQS for ground-level ozone from its 2008 standard levels of 75 parts per billion ("ppb") to 70 ppb. None of the Texas counties in which we operate have been designated by the EPA as nonattainment areas under this revised standard. However, areas in which we operate could be designated as nonattainment in the future if the EPA were to further reduce ozone standards. States that contain any areas designated nonattainment, and any tribes that choose to do so, are required to develop state implementation plans demonstrating how the area will attain the standard within a prescribed period of time. These plans may require the installation of additional equipment to control emissions. Similar initiatives could lead to more stringent air permitting, increased regulation and possible enforcement actions at the local, state, and federal levels.
18
Additionally, the EPA has established new air emission control requirements for natural gas and NGLs production, processing and transportation activities, including New Source Performance Standards to address emissions of sulfur dioxide and volatile organic compounds, and National Emission Standards for Hazardous Air Pollutants ("NESHAPS") to address hazardous air pollutants frequently associated with gas production and processing activities. Among other things, these rules require the reduction of volatile organic compound emissions from natural gas wells through the use of reduced emission completions or "green completions" on all hydraulically fractured wells constructed or refractured after January 1, 2015. In addition, gas wells are required to use completion combustion device equipment (i.e., flaring) by October 15, 2012 if emissions cannot be directed to a gathering line. Further, the final rules under NESHAPS include maximum achievable control technology ("MACT") standards for "small" glycol dehydrators that are located at major sources of hazardous air pollutants and modifications to the leak detection standards for valves. In June 2016, the EPA published updates to new source performance standard requirements that would impose more stringent controls on methane and volatile organic compounds emissions from oil and gas development and production operations, including hydraulic fracturing and other well completion activity. In October 2018, the EPA published a proposed rule that would amend certain requirements of the June 2016 rule. Among other things, the proposed rule would reduce monitoring frequencies for fugitive emissions and clarify and streamline certain other requirements. However, the 2016 rule currently remains in effect. Similarly in November 2016, the Bureau of Land Management ("BLM") issued rules requiring additional efforts by producers to reduce venting, flaring, and leaking of natural gas produced on federal and Native American lands. In February 2018, the BLM proposed to repeal certain requirements of the 2016 rules. In September 2018, BLM published a final rule that largely adopted the February 2018 proposal and rescinded several requirements. The September 2018 rule was challenged in the U.S. District Court for the Northern District of California almost immediately after issuance. The challenge is still pending. Compliance with the November 2016 rule or the revised September 2018 rule may require modifications to certain of our operations, including the installation of new equipment to control emissions at the well site that could result in significant costs, including increased capital expenditures and operating costs, and could adversely impact our business.
Federal regulations require certain owners or operators of facilities that store or otherwise handle oil, such as us, to prepare and implement spill prevention, control, countermeasure and response plans relating to the possible discharge of oil into surface waters. The Oil Pollution Act of 1990 ("OPA") contains numerous requirements relating to the prevention of and response to oil spills into waters of the United States. The OPA subjects owners and operators of facilities to strict joint and several liability for all containment and cleanup costs and certain other damages arising from a spill, including, but not limited to, the costs of responding to a release of oil to surface waters. The OPA also requires owners and operators of offshore facilities that could be the source of an oil spill into federal or state waters, including wetlands, to post a bond, letter of credit or other form of financial assurance in amounts ranging from $10.0 million in specified state waters to $35.0 million in federal outer continental shelf waters to cover costs that could be incurred by governmental authorities in responding to an oil spill. These financial assurances may be increased by as much as $150.0 million if a formal risk assessment indicates that the increase is warranted. Noncompliance with OPA may result in varying civil and criminal penalties and liabilities.
Our operations are also subject to the federal Clean Water Act ("CWA") and analogous state laws that impose restrictions and strict controls regarding the discharge of pollutants into state waters as well as U.S. waters. Pursuant to the requirements of the CWA, the EPA has adopted regulations concerning discharges of storm water runoff. This program requires covered facilities to obtain individual permits or seek coverage under an EPA general permit. Like OPA, the CWA and analogous state laws relating to the control of water pollution provide varying civil and criminal penalties and liabilities for releases of petroleum or its derivatives into surface waters or into the ground. Similarly, the U.S. Congress has considered legislation to subject hydraulic fracturing operations to federal regulation and to require the disclosure of chemicals used by us and others in the oil and gas industry in the hydraulic fracturing process. Please read "Item 1A. Risk Factors-We are subject to various environmental risks and governmental regulations, including those relating to benzene emissions, hydraulic fracturing and global climate change, and future regulations may be more stringent resulting in increased operating costs and decreased demand for the oil and gas that we produce."
The Endangered Species Act ("ESA") restricts activities that may affect endangered or threatened species or their habitats. Some of our operations are located in or near areas that may be designated as habitats for endangered or threatened species, such as the Attwater's prairie chicken. In these areas, we may be obligated to develop and implement plans to avoid potential adverse effects to protected species and their habitats, and we may be prohibited from conducting operations in certain locations or during certain seasons, such as breeding and nesting seasons, when our operations could have an adverse effect on the species. It is also possible that a federal or state agency could restrict drilling activities in certain locations if it is determined that such activities may have a serious adverse effect on a protected species. The presence of a protected species in areas where we operate could result in increased costs of or limitations on our ability to perform operations and thus have an adverse effect on our business. We believe that we are in substantial compliance with the ESA, and we are not aware of any proposed listings that will affect our operations. However, the designation of previously unidentified endangered or threatened species could cause us to incur additional costs or become subject to operating restrictions or bans in the affected states.
The Safe Drinking Water Act ("SDWA") and comparable local and state provisions restrict the disposal, treatment or release of water produced or used during oil and gas development. Subsurface emplacement of fluids (including disposal wells or enhanced
19
oil recovery) is governed by federal or state regulatory authorities that, in some cases, includes the state oil and gas regulatory authority or the state's environmental authority. These regulations may increase the costs of compliance for some facilities. We believe that we substantially comply with the SDWA and related state provisions.
We also are subject to a variety of federal, state, local and foreign permitting and registration requirements relating to protection of the environment. We believe we are in substantial compliance with current applicable environmental laws and regulations and that continued compliance with existing requirements will not have a material adverse effect on our financial position or results of operations.
Global Climate Change
There is increasing attention in the United States and worldwide being paid to the issue of climate change and the contributing effect of greenhouse gas ("GHG") emissions. The EPA has adopted regulations under existing provisions of the federal Clean Air Act that, among other things, regulates GHG emissions from certain large stationary sources under the Clean Air Act Prevention of Significant Deterioration ("PSD") and Title V permitting programs. Facilities required to obtain PSD permits for their GHG emissions also will be required to meet "best available control technology" standards, which will be established by the states or, in some instances, by the EPA on a case-by-case basis. The EPA also expanded its existing GHG emissions reporting rule to apply to the oil and gas source category, including oil and natural gas production facilities and natural gas processing, transmission, distribution and storage facilities. Facilities containing petroleum and natural gas systems that emit 25,000 metric tons or more of CO2 equivalent per year were required to report annual GHG emissions to the EPA, for the first time by September 28, 2012. In addition, in June 2016, the EPA published updates to new source performance standard requirements that would impose more stringent controls on methane and volatile organic compounds emissions from oil and gas development and production operations, including hydraulic fracturing and other well completion activity. In October 2018, the EPA published a proposed rule that would amend certain requirements of the June 2016 rule. Among other things, the proposed rule would reduce monitoring frequencies for fugitive emissions and clarify and streamline certain other requirements. However, the 2016 rule currently remains in effect.
The U.S. Congress has considered a number of legislative proposals to restrict GHG emissions and more than 20 states, either individually or as part of regional initiatives, have begun taking actions to control or reduce GHG emissions. Efforts have been made and continue to be made in the international community toward the adoption of international treaties or protocols that would address global climate change issues. In April 2016, the United States signed the Paris Agreement, which requires countries to review and "represent a progression" in their intended nationally determined contributions, which set GHG emission reduction goals, every five years beginning in 2020. However, in August of 2017, the United States informed the United Nations of its intent to withdraw from the Paris Agreement. The earliest possible effective withdrawal date from the Paris Agreement is November 2020.
While it is not possible at this time to predict how regulation that may be enacted to address GHG emissions would impact our business, the modification of existing laws or regulations or the adoption of new laws or regulations curtailing oil and gas exploration in the areas of the United States in which we operate could materially and adversely affect our operations by limiting drilling opportunities or imposing materially increased costs. In addition, existing or new laws, regulations or treaties (including incentives to conserve energy or use alternative energy sources) could have a negative impact on our business if such incentives reduce demand for oil and gas.
In addition to the effects of future regulation, the meteorological effects of global climate change could pose additional risks to our operations in the form of more frequent and/or more intense storms and flooding, which could in turn adversely affect our cost of doing business.
Title to Properties
We believe we currently have satisfactory title to all of our producing properties in the specific areas in which we operate in accordance with standards generally accepted in the oil and gas industry, except where failure to do so would not have a material adverse effect on our business and operations in such area, taken as a whole. Individual properties may be subject to burdens such as royalty and overriding royalty interests, working and other outstanding interests customary in the industry. Additionally, substantially all of our producing properties are subject to mortgage liens securing our obligations under our senior secured revolving credit facility. For additional information, please see "Item 1A. Risk Factors-We may incur losses as a result of title deficiencies."
20
Customers
The following table presents customers that represented 10% or more of our total revenues for at least one of the periods presented:
| Years Ended December 31, | ||||
| 2018 |
| 2017 |
| 2016 |
Shell Trading (US) Company | 73% |
| 69% |
| 56% |
Flint Hills Resources, LP | * |
| * |
| 15% |
|
* - Less than 10% for the respective year.
We do not believe the loss of any one of our purchasers would materially affect our ability to sell the crude oil and natural gas we produce as other purchasers are available in our primary areas of activity. See "Additional Oil and Gas Disclosures-Marketing."
Employees
At December 31, 2018 , we had 239 full-time employees. None of our employees are subject to a collective bargaining agreement, and we consider our relations with our employees to be good.
We regularly use independent contractors and consultants to perform various field and other services.
Available Information
Our website can be accessed at www.carrizo.com. We make our website content available for informational purposes only. It should not be relied upon for investment purposes, nor is it incorporated by reference in this Form 10-K. Within our website's investor relations section, we make available free of charge our annual reports on Form 10-K, quarterly reports on Form 10-Q and current reports on Form 8-K, including exhibits and amendments to these reports, as soon as reasonably practicable after we electronically file such material with, or furnish such material to, the SEC. Reports filed with the SEC are made available on its website at www.sec.gov.We also make available through our website information related to our corporate governance including the following:
• | Audit Committee Charter; |
• | Compensation Committee Charter; |
• | Nominating and Corporate Governance Committee Charter; |
• | Code of Ethics and Business Conduct; and |
• | Compliance Employee Report Line. |
We intend to satisfy the requirement under Item 5.05 of Form 8-K to disclose any amendments to our Code of Ethics and Business Conduct and any waiver from a provision of our Code of Ethics by posting such information on our website at www.carrizo.com under "About-Governance."
Glossary of Certain Industry Terms
The definitions set forth below shall apply to the indicated terms as used herein.
3-D seismic data. Three-dimensional pictures of the subsurface created by collecting and measuring the intensity and timing of sound waves transmitted into the earth as they reflect back to the surface.
Bbl. One stock tank barrel, or 42 U.S. gallons liquid volume, used herein in reference to oil or other liquid hydrocarbons.
Bbls/d. Stock tank barrels per day.
Boe . Barrels of oil equivalent. A Boe is determined using the ratio of 6 Mcf of natural gas to one Bbl of oil or NGLs which approximates their relative energy content.
Boe/d. Barrels of oil equivalent per day.
Btu or British Thermal Unit. The quantity of heat required to raise the temperature of a one-pound mass of water by one degree Fahrenheit.
21
Completion. The process of treating a drilled well followed by the installation of permanent equipment for the production of oil, NGLs or natural gas, or in the case of a dry well, the reporting of abandonment to the appropriate authority.
Condensate. Condensate is a mixture of hydrocarbons that exists in the gaseous phase at original reservoir temperature and pressure, but that, when produced, is in the liquid phase at surface pressure and temperature.
Developed acreage. The number of acres allocated or assignable to productive wells or wells capable of production.
Developed oil and gas reserves. Reserves of any category that can be expected to be recovered (i) through existing wells with existing equipment and operating methods or for which the cost of the required equipment is relatively minor compared to the cost of a new well, and (ii) through installed extraction equipment and infrastructure operational at the time of the reserves estimate if the extraction is by means not involving a well.
Development costs. Costs incurred to obtain access to proved reserves and to provide facilities for extracting, treating, gathering and storing the oil and gas. Development costs, including depreciation and applicable operating costs of support equipment and facilities and other costs of development activities, are costs incurred to (i) gain access to and prepare well locations for drilling, including surveying well locations for the purpose of determining specific development drilling sites, clearing ground, draining, road building and relocating public roads, gas lines and power lines, to the extent necessary in developing the proved reserves, (ii) drill and equip development wells, development-type stratigraphic test wells and service wells, including the costs of platforms and of well equipment such as casing, tubing, pumping equipment, and the wellhead assembly, (iii) acquire, construct and install, production facilities such as lease flow lines, separators, treaters, heaters, manifolds, measuring devices and production storage tanks, natural gas cycling and processing plants, and central utility and waste disposal systems, and (iv) provide improved recovery systems.
Development well. A well drilled within the proved area of an oil or natural gas reservoir to the depth of a stratigraphic horizon known to be productive.
Dry well. An exploratory, development or extension well that proves to be incapable of producing either oil or gas in sufficient quantities to justify completion as an oil or gas well.
Economically producible. A resource which generates revenue that exceeds, or is reasonably expected to exceed, the costs of the operation. The value of the products that generate revenue shall be determined at the terminal point of "oil and gas producing activities" as defined in Rule 4-10(a)(16) of Regulation S-X promulgated under the Securities Exchange Act of 1934, as amended.
Estimated ultimate recovery (EUR). Estimated ultimate recovery is the sum of reserves remaining as of a given date and cumulative production as of that date.
Exploratory well . A well drilled to find a new field or to find a new reservoir in a field previously found to be productive of oil or gas in another reservoir.
Field. An area consisting of a single reservoir or multiple reservoirs all grouped on or related to the same individual geological structural feature or stratigraphic condition, or both. The geological terms "structural feature" and "stratigraphic condition" are intended to identify localized geological features as opposed to the broader terms of basins, trends, provinces, plays, areas of interest, etc.
Gross acres or gross wells. The total acres or wells, as the case may be, in which a working interest is owned.
Hydraulic fracturing. Hydraulic fracturing is a well stimulation process using a liquid (usually water with an amount of chemicals mixed in) that is forced into an underground formation under high pressure to open or enlarge fractures in reservoirs with low permeability to stimulate and improve the flow of hydrocarbons from these reservoirs. As the formation is fractured, a proppant (usually sand or ceramics) is pumped into the fractures to "prop" or keep them from closing after they are opened by the liquid. Hydraulic fracturing is a technology used in shale reservoirs and other unconventional resource plays in order to enable commercial hydrocarbon production.
MBbls . Thousand barrels of oil or other liquid hydrocarbons.
MBoe . Thousand barrels of oil equivalent.
Mcf. Thousand cubic feet of natural gas.
Mcf/d. Thousand cubic feet of natural gas per day.
MMBbls. Million barrels of oil or other liquid hydrocarbons.
22
MMBoe . Million barrels of oil equivalent.
MMBtu. Million British Thermal Units.
MMcf. Million cubic feet of natural gas.
Net acres or net wells. The sum of the fractional working interests owned in gross acres or gross wells.
Non-productive well. A well that is found to be incapable of producing oil or gas in sufficient quantities to justify completion, or upon completion, the economic operation of an oil or gas well.
NYMEX. New York Mercantile Exchange.
Production costs. Costs incurred to operate and maintain wells and related equipment and facilities, including depreciation and applicable operating costs of support equipment and facilities and other costs of operating and maintaining those wells and related equipment and facilities.
Productive well. A well that is found to be capable of producing oil or gas in sufficient quantities to justify completion as an oil or gas well.
Proved developed reserves. Reserves that can be expected to be recovered through existing wells with existing equipment and operating methods.
Proved reserves. Has the meaning given to such term in Rule 4-10(a)(22) of Regulation S-X, which defines proved reserves as:
The quantities of oil and gas which, by analysis of geoscience and engineering data, can be estimated with reasonable certainty to be economically producible from a given date forward, from known reservoirs, and under existing economic conditions, operating methods, and government regulations, prior to the time at which contracts providing the right to operate expire, unless evidence indicates that renewal is reasonably certain, regardless of whether deterministic or probabilistic methods are used for estimation. The project to extract the hydrocarbons must have commenced or the operator must be reasonably certain that it will commence the project within a reasonable time.
The area of a reservoir considered proved includes (i) the area identified by drilling and limited by fluid contacts, if any, and (ii) adjacent undrilled portions of the reservoir that can, with reasonable certainty, be judged to be continuous with it and to contain economically producible oil or gas on the basis of available geoscience and engineering data.
In the absence of data on fluid contacts, proved quantities in a reservoir are limited by the lowest known hydrocarbons as seen in a well penetration unless geoscience, engineering or performance data and reliable technology establish a lower contact with reasonable certainty.
Where direct observation from well penetrations has defined a highest known oil elevation and the potential exists for an associated gas cap, proved oil reserves may be assigned in the structurally higher portions of the reservoir only if geoscience, engineering or performance data and reliable technology establish the higher contact with reasonable certainty.
Reserves that can be produced economically, based on prices used to estimate reserves, through application of improved recovery techniques (including, but not limited to, fluid injection) are included in the proved classification when (i) successful testing by a pilot project in an area of the reservoir with properties no more favorable than in the reservoir as a whole, the operation of an installed program in the reservoir, or an analogous reservoir, or other evidence using reliable technology establishes the reasonable certainty of the engineering analysis on which the project or program was based and (ii) the project has been approved for development by all necessary parties and entities, including governmental entities.
Existing economic conditions include prices and costs at which economic producibility from a reservoir is to be determined. The price shall be the average price during the 12-month period prior to the ending date of the period covered by the report, determined as an unweighted arithmetic average of the first-day-of-the-month price for each month within such period, unless prices are defined by contractual arrangements, excluding escalations based upon future conditions.
Proved undeveloped oil and gas reserves or PUDs. Reserves that are expected to be recovered from new wells on undrilled acreage or from existing wells where a relatively major expenditure is required for recompletion.
(i) Reserves on undrilled acreage are limited to those directly offsetting development spacing areas that are reasonably certain of production when drilled, unless evidence using reliable technology exists that establishes reasonable certainty of economic producibility, based on pricing used to estimate reserves, at greater distances.
23
(ii) Undrilled locations are classified as having proved undeveloped reserves only if a development plan has been adopted indicating that they are scheduled to be drilled within five years, unless the specific circumstances justify a longer time.
(iii) Under no circumstances are estimates for proved undeveloped reserves attributable to any acreage for which an application of fluid injection or other improved recovery technique is contemplated, unless such techniques have been proved effective by actual projects in the same reservoir or an analogous reservoir or by other evidence using reliable technology establishing reasonable certainty.
PV-10 (Non-GAAP). The present value of estimated future revenue to be generated from the production of estimated net proved reserves, net of estimated production and future development costs, based on prices used in estimating the proved reserves and costs in effect as of the date indicated (unless such costs are subject to change pursuant to contractual provisions), without giving effect to non-property related expenses such as general and administrative expenses, debt service, future income tax expenses, or depreciation, depletion, and amortization, discounted using an annual discount rate of 10 percent. While this measure does not include the effect of income taxes as it would in the use of the standardized measure of discounted future net cash flows calculation, it does provide an indicative representation of the relative value of the Company on a comparative basis to other companies and from period to period. This is a non-GAAP measure. See "Item 1. Business-Additional Oil and Gas Disclosures-Reconciliation of Standardized Measure of Discounted Future Net Cash Flows (GAAP) to PV-10 (Non-GAAP)".
Reasonable certainty. If deterministic methods are used, reasonable certainty means a high degree of confidence that the quantities will be recovered. If probabilistic methods are used, there should be at least a 90% probability that the quantities actually recovered will equal or exceed the estimate. A high degree of confidence exists if the quantity is much more likely to be achieved than not, and, as changes due to increased availability of geoscience (geological, geophysical, and geochemical), engineering, and economic data are made to EUR with time, reasonably certain EUR is much more likely to increase or remain constant than to decrease.
Recompletion. The completion for production of an existing well bore in another formation from that in which the well has been previously completed.
Reserves. Estimated remaining quantities of oil and gas and related substances anticipated to be economically producible, as of a given date, by application of development projects to known accumulations. In addition, there must exist, or there must be a reasonable expectation that there will exist, the legal right to produce or a revenue interest in the production, installed means of delivering oil and gas or related substances to market, and all permits and financing required to implement the project.
Reservoir. A porous and permeable underground formation containing a natural accumulation of producible oil or gas, or both, that is confined by impermeable rock or water barriers and is individual and separate from other reservoirs.
Standardized measure. The present value, discounted at 10%, of future net cash flows from estimated proved reserves after income taxes, calculated holding prices and costs constant at amounts in effect on the date of the report (unless such prices or costs are subject to change pursuant to contractual provisions) and otherwise in accordance with the U.S. Securities Exchange Commission's rules for inclusion of oil and gas reserve information in financial statements filed with the U.S. Securities Exchange Commission.
Undeveloped acreage. Lease acreage on which wells have not been drilled or completed to a point that would permit the production of economic quantities of oil or gas regardless of whether such acreage contains proved reserves.
Working interest. The operating interest that gives the owner the right to drill, produce and conduct operating activities on the property and a share of production.
24
Item 1A. Risk Factors
Oil and gas prices are highly volatile, and low oil and gas prices or further price decreases will negatively affect our financial position, planned capital expenditures and results of operations.
Our revenue, profitability, cash flow, future growth and ability to borrow funds or obtain additional capital, as well as the carrying value of our properties, are substantially dependent on prevailing prices of oil and gas. Historically, the markets for oil and gas have been volatile, and those markets are likely to continue to be volatile in the future. Oil and gas commodity prices are affected by events beyond our control, including changes in market supply and demand, overall economic activity, weather, pipeline capacity constraints, inventory storage levels, basis differentials and other factors. In the past, we have reduced or curtailed activity to mitigate the impact of low oil and gas prices. Particularly in recent years, decreases in both oil and gas prices led us to suspend or curtail drilling and other exploration activities, which will limit our ability to produce oil and gas and therefore impact our revenues. We are particularly dependent on the production and sale of oil and this commodity price decline has had, and may continue to have, an adverse effect on us. Further volatility in oil and gas prices or a continued prolonged period of low oil or gas prices may materially adversely affect our financial position, liquidity (including our borrowing capacity under our revolving credit facility), ability to finance planned capital expenditures and results of operations.
It is impossible to predict future oil and gas price movements with certainty. Prices for oil and gas are subject to wide fluctuation in response to relatively minor changes in the supply of and demand for oil and gas, market uncertainty and a variety of additional factors beyond our control. These factors include, but are not limited to:
• | the level of consumer product demand; |
• | the levels and location of oil and gas supply and demand and expectations regarding supply and demand, including the supply of oil and natural gas due to increased production from resource plays; |
• | overall economic conditions; |
• | weather conditions; |
• | domestic and foreign governmental relations, regulations and taxes; |
• | the price and availability of alternative fuels; |
• | political conditions or hostilities and unrest in oil producing regions; |
• | the level and price of foreign imports of oil and liquefied natural gas; |
• | the ability of the members of the Organization of Petroleum Exporting Countries and other exporting nations to agree upon and maintain production constraints and oil price controls; |
• | the extent to which U.S. shale producers become "swing producers" adding or subtracting to the world supply; |
• | technological advances affecting energy consumption; |
• | speculation by investors in oil and gas; and |
• | variations between product prices at sales points and applicable index prices. |
The profitability of wells, particularly in the shale plays in which we primarily operate, is generally reduced or eliminated as commodity prices decline. In addition, certain wells that are profitable may not meet our internal return targets. Based on our current estimates of drilling and completion costs, ultimate recoveries per well, differentials and operating costs, we believe a portion of our acreage if drilled would not be economical at commodity prices existing in 2018. There can be no assurance, however, that any wells, including wells drilled on our Eagle Ford and Delaware Basin acreage, will actually be profitable at any estimated prices. The sustained declines in commodity prices have caused us to significantly reduce our exploration and development activity which may adversely affect our results of operations, cash flows and our business.
Oil and gas drilling is a speculative activity and involves numerous risks and substantial and uncertain costs that could adversely affect us.
Our success will be largely dependent upon the success of our drilling program. We acquire unproved properties and lease undeveloped acreage that we believe will enhance our growth potential and increase our earnings over time. However, we cannot assure you that all prospects will be economically viable or that we will not abandon our investments.
Drilling for oil and gas involves numerous risks, including the risk that no commercially productive oil or gas reservoirs will be discovered. The cost of drilling, completing and operating wells is substantial and uncertain, and drilling operations may be curtailed, delayed or canceled as a result of a variety of factors beyond our control, including:
• | unexpected or adverse drilling conditions; |
25
• | elevated pressure or irregularities in geologic formations; |
• | equipment failures or accidents; |
• | adverse weather conditions; |
• | fluctuations in the price of oil and gas; |
• | surface access restrictions; |
• | loss of title or other title related issues; |
• | compliance with governmental requirements; and |
• | shortages or delays in the availability of midstream transportation, drilling rigs, crews and equipment. |
Because we identify the areas desirable for drilling in certain areas from 3-D seismic data covering large areas, we may not seek to acquire an option or lease rights until after the seismic data is analyzed or until the drilling locations are also identified; in those cases, we may not be permitted to lease, drill or produce oil or gas from those locations.
Even if drilled, our completed wells may not produce reserves of oil or gas that are economically viable or that meet our earlier estimates of economically recoverable reserves. Our overall drilling success rate or our drilling success rate for activity within a particular project area may decline. Unsuccessful drilling activities could result in a significant decline in our production and revenues and materially harm our operations and financial position by reducing our available cash and resources. The potential for production decline rates for our wells could be greater than we expect. Because of the risks and uncertainties of our business, our future performance in exploration and drilling may not be comparable to our historical performance described herein.
We may not adhere to our proposed drilling schedule.
Our final determination of whether to drill any wells will be dependent on a number of factors, including:
• | the results of our exploration efforts and the acquisition, review and analysis of the seismic data; |
• | the availability and cost of sufficient capital resources to us and the other participants for the drilling of the prospects; |
• | the approval of the prospects by the other participants after additional data has been compiled; |
• | economic and industry conditions at the time of drilling or completion, including prevailing and anticipated prices for oil and gas and the availability and prices of drilling rigs, drilling and hydraulic fracturing crews and equipment, other services, supplies and equipment, and pipeline system and transportation constraints; |
• | lease expirations; |
• | access to water supplies or restrictions on water disposal; |
• | regulatory approvals; and |
• | the availability of leases and permits on reasonable terms for the prospects. |
Although we have identified or budgeted for numerous drilling prospects, we may not be able to lease or drill those prospects within our expected time frame or at all. Wells that are currently part of our capital plan may be based on statistical results of drilling activities in other 3-D project areas that we believe are geologically similar rather than on analysis of seismic or other data in the prospect area, in which case actual drilling and results are likely to vary, possibly materially, from those statistical results. In addition, our drilling schedule may vary from our expectations because of future uncertainties. We may not be able to raise the capital required to drill all of our identified or budgeted wells. In addition, our ability to produce oil and gas may be significantly affected by the availability and prices of hydraulic fracturing equipment and crews. There can be no assurance that these projects can be successfully developed or that any identified drill sites or budgeted wells will, if drilled, encounter reservoirs of commercially productive oil or gas. We may seek to sell or reduce all or a portion of our interest in a project area or with respect to prospects or budgeted wells within such project area.
Our reserve data and estimated discounted future net cash flows are estimates based on assumptions that may be inaccurate and are based on existing economic and operating conditions that may change in the future.
There are uncertainties inherent in estimating oil and gas reserves and their estimated value, including many factors beyond the control of the producer. The reserve data included herein represents only estimates. Reservoir engineering is a subjective and inexact process of estimating underground accumulations of oil and gas that cannot be measured in an exact manner and is based on assumptions that may vary considerably from actual results. These include subjective estimates of underground accumulations of oil and natural gas and assumptions concerning future oil and natural gas prices, production levels, ultimate recoveries and
26
operating and development costs. As a result, estimated quantities of proved reserves, projections of future production rates and the timing of development expenditures may be incorrect. Furthermore, different reserve engineers may make different estimates of reserves and cash flows based on the same data. Reserve estimates may be subject to upward or downward adjustment, and actual production, revenue and expenditures with respect to our reserves likely will vary, possibly materially, from estimates. Additionally, in recent years, there has been increased debate and disagreement over the classification of reserves, with particular focus on proved undeveloped reserves. The interpretation of SEC rules regarding the classification of reserves and their applicability in different situations remain unclear in many respects. Changing interpretations of the classification standards of reserves or disagreements with our interpretations could cause us to write down reserves.
SEC rules require that, subject to limited exceptions, proved undeveloped reserves may only be booked if they relate to wells scheduled to be drilled within five years after the date of booking. This requirement may limit our ability to book additional proved undeveloped reserves as we pursue our drilling program. Moreover, we may be required to write down our proved undeveloped reserves if we do not drill those wells within the required five-year timeframe. We have deferred some of our exploration activities in response to the severe price downturn beginning in the summer of 2014 and such continued deferral may increase the impact of this requirement.
As of December 31, 2018 , approximately 60% of our proved reserves were proved undeveloped. Moreover, some of the producing wells included in our reserve reports as of December 31, 2018 had produced for a relatively short period of time as of that date. Because most of our reserve estimates are calculated using volumetric analysis, those estimates are less reliable than estimates based on a lengthy production history. Volumetric analysis involves estimating the volume of a reservoir based on the net feet of pay of the structure and an estimation of the area covered by the structure based on seismic analysis. In addition, realization or recognition of our proved undeveloped reserves will depend on our development schedule and plans. Lack of reasonable certainty with respect to development plans for proved undeveloped reserves could cause the discontinuation of the classification of these reserves as proved.
The discounted future net cash flows included herein are not necessarily the same as the current market value of our estimated oil and gas reserves. As required by the current requirements for oil and gas reserve estimation and disclosures, the estimated discounted future net cash flows from proved reserves are based on the average of the sales price on the first day of each month during the trailing 12-month period prior to December 31, 2018 , with costs determined as of the date of the estimate. If commodity prices remain at their current levels, the estimated discounted future net cash flows from our proved reserves would generally be expected to decrease as earlier months with higher commodity sales prices will be removed from this calculation in the future.
Actual future net cash flows also will be affected by factors such as:
• | the actual prices we receive for oil and gas; |
• | our actual operating costs in producing oil and gas; |
• | the amount and timing of actual production; |
• | supply and demand for oil and gas; |
• | increases or decreases in consumption of oil and gas; and |
• | changes in governmental regulations or taxation. |
In addition, the 10% discount factor we use when calculating discounted future net cash flows for reporting requirements in compliance with the Financial Accounting Standards Board Accounting Standards Codification Topic 932, "Extractive Activities-Oil and Gas" may not be the most appropriate discount factor based on interest rates in effect from time to time and risks associated with us or the oil and gas industry in general.
We depend on successful exploration, development and acquisitions to maintain reserves and revenue in the future.
In general, the volume of production from oil and gas properties declines as reserves are depleted, with the rate of decline depending on reservoir characteristics. Except to the extent we conduct successful exploration and development activities or acquire properties containing proved reserves, or both, our proved reserves will decline as reserves are produced. Our future oil and gas production is, therefore, highly dependent on our level of success in developing, finding or acquiring additional reserves that are economically recoverable. There can be no assurance that undeveloped properties acquired by us will be profitably developed, that new wells drilled by us in prospects that we pursue will be productive or that we will recover all or any portion of our investment in such undeveloped properties or wells.
Our future acquisitions may yield revenues or production that varies significantly from our projections.
In acquiring producing properties, we assess the recoverable reserves, current and future oil and gas prices, development and operating costs, potential environmental and other liabilities and other factors relating to the properties. Our assessments are necessarily inexact and their accuracy is inherently uncertain. Our review of a subject property in connection with our acquisition
27
assessment will not reveal all existing or potential problems or permit us to become sufficiently familiar with the property to assess fully its deficiencies and capabilities. We may not inspect every well, and we may not be able to observe structural and environmental problems even when we do inspect a well. If problems are identified, the seller may be unwilling or unable to provide effective contractual protection against all or part of those problems and we may be forced to assume liabilities that we did not accurately quantify. We may increase our emphasis on producing property acquisitions. We have relatively less experience in such acquisitions as our past acquisition focus has been primarily on nonproducing acreage. Any acquisition of property interests may not be economically successful, and unsuccessful acquisitions may have a material adverse effect on our financial position and future results of operations.
Our overall level of debt and Preferred Stock obligations could adversely affect us.
As of December 31, 2018 , we had a level of outstanding debt and Preferred Stock that could have significant adverse consequences on our business and future prospects, including the following:
• | we may not be able to obtain financing in the future on acceptable terms or at all for working capital, capital expenditures, acquisitions, debt service requirements or other purposes; |
• | less-levered competitors could have a competitive advantage because they have lower debt service requirements; |
• | credit rating agencies could downgrade our credit ratings below currently expected levels; |
• | we may be less able to take advantage of significant business opportunities and to react to changes in market or industry conditions than our competitors; |
• | we may be required to dedicate a substantial portion of our cash flows from operations to the repayment of our debt and Preferred Stock and the service of interest costs and dividends associated with our debt and Preferred Stock, rather than to productive investments; and |
• | we may be vulnerable in the event of adverse economic or industry conditions or a downturn in our business. |
A future issuance, sale or exchange of our stock or warrants could trigger a limitation on our ability to utilize net operating loss carryforwards.
Our ability to utilize U.S. net operating loss carryforwards to reduce future taxable income is subject to various limitations under the Internal Revenue Code of 1986, as amended (the "Code"). The utilization of such carryforwards may be limited under Section 382 of the Code upon the occurrence of ownership changes resulting from issuances of our stock or the sale or exchange of our stock by certain shareholders if, as a result, there is an aggregate change of more than 50% in the beneficial ownership of our stock during any three-year period. For this purpose, "stock" includes certain preferred stock and common stock warrants (including the Preferred Stock and the Warrants issued to finance in part, the ExL Acquisition). In the event of such an ownership change, Section 382 of the Code imposes an annual limitation on the amount of our taxable income that can be offset by these loss carryforwards. The limitation is generally equal to the product of (a) the fair market value of our equity multiplied by (b) a percentage approximately equivalent to the yield on long-term tax exempt bonds during the month in which an ownership change occurs. In addition, the limitation is increased if there are recognized built-in gains during any post-change year, but only to the extent of any net unrealized built-in gains inherent in the assets sold. We do not believe we have a Section 382 limitation on the ability to utilize our U.S. loss carryforwards as of December 31, 2018 . However, future issuances, sales or exchanges of our stock (including, potentially, relatively small transactions and transactions beyond our control) could, taken together with prior transactions with respect to our stock, trigger an ownership change under Section 382 of the Code and therefore a limitation on our ability to utilize our U.S. loss carryforwards. Any such limitation could cause some of such loss carryforwards to expire before we would be able to utilize them to reduce taxable income in future periods, possibly resulting in a substantial income tax expense or write down of our tax assets or both.
Holders of the Preferred Stock have rights that may restrict our ability to operate our business or be adverse to holders of our common stock.
The Statement of Resolutions Establishing Series of 8.875% Redeemable Preferred Stock of Carrizo Oil & Gas, Inc. (the "Statement of Resolutions") contains covenants that, among other things, so long as the GSO Funds (as defined below) and their affiliates beneficially own more than 50% of the outstanding Preferred Stock, limit our ability to, without the written consent of a designated representative of the Preferred Stock, but subject to certain exceptions, (i) issue stock senior to or on parity with the Preferred Stock, (ii) incur indebtedness that would cause us to exceed a specified leverage ratio, (iii) amend, modify, alter or supplement our articles of incorporation or the Statement of Resolutions in a manner that would adversely affect the rights, preferences or privileges of the Preferred Stock, (iv) enter into or amend certain debt agreements that would be more restrictive on the payment of dividends on, or redemption of, the Preferred Stock than those existing on the Preferred Stock closing and (v) pay distributions on, purchase or redeem our common stock or other stock junior to the Preferred Stock that would cause us to
28
exceed a specified leverage ratio. We can be required to redeem the Preferred Stock (i) after the seventh anniversary of its initial issuance or (ii) at any time we fail to pay a dividend, subject to limited cure rights.
Holders of the Preferred Stock will, in certain circumstances, have additional rights in the event we fail to timely pay dividends, fail to redeem the Preferred Stock upon a change of control if required or fail to redeem the Preferred Stock upon request of the holders of the Preferred Stock following the seventh anniversary of the date of issuing the Preferred Stock. These rights include, subject to certain exceptions, (i) that holders of a majority of the then-outstanding Preferred Stock will have the exclusive right, voting separately as a class, to appoint and elect up to two directors to our board of directors, (ii) that approval of the holders of a majority of the then-outstanding Preferred Stock will be required prior to incurring indebtedness subject to a leverage ratio, declaring or paying prohibited distributions or issuing equity of subsidiaries to third parties; and (iii) that holders of a majority of the then-outstanding Preferred Stock will have the right to increase dividend payments and the ability to require us to pay dividends in common stock.
Holders of the Preferred Stock also have limited voting rights, including those with respect to potential amendments to our articles of incorporation or the Statement of Resolutions that have an adverse effect on the existing terms of the Preferred Stock and in certain other limited circumstances or as required by law.
We participate in oil and gas leases with third parties and these third parties may not be able to fulfill their commitments to our projects.
We frequently own less than 100% of the working interest in the oil and gas leases on which we conduct operations, and other parties will own the remaining portion of the working interest. Financial risks are inherent in any operation where the cost of drilling, equipping, completing and operating wells is shared by more than one person. We could be held liable for joint activity obligations of the other working interest owners such as nonpayment of costs and liabilities arising from the actions of the other working interest owners. Some of these working interest owners may experience liquidity and cash flow problems. These problems may lead these parties to attempt to delay the pace of drilling or project development in order to preserve cash. A working interest owner may be unable or unwilling to pay its share of project costs. In some cases, a working interest owner may declare bankruptcy. In the event any of these third party working interest owners do not pay their share of such costs, we would likely have to pay those costs, and we may be unsuccessful in any efforts to recover these costs from such parties, which could materially adversely affect our financial position.
Certain of our undeveloped leasehold assets are subject to leases that will expire over the next several years unless production is established on units containing the acreage or we timely exercise our contractual rights to extend the terms of such leases by continuous operations or the payment of lease extension payments or delay rentals.
Leases on oil and natural gas properties typically have a primary term of three to five years, after which they expire unless, prior to expiration, a well is drilled and production of hydrocarbons in paying quantities is established, applicable lease extension payments or delay rentals are made, or such lease is otherwise maintained pursuant to any applicable continuous operations provision. If our leases on our undeveloped properties expire and we are unable to renew the leases, we will lose our right to develop the related properties. Although we seek to actively manage our undeveloped properties, our drilling plans for these areas are subject to change based upon various factors, including drilling results, oil and natural gas prices, the availability and cost of capital, drilling and production costs, availability of drilling services and equipment, gathering system and pipeline transportation constraints and regulatory approvals. If commodity prices remain low, we may be required to delay our drilling plans and, as a result, may lose our right to develop the related properties.
We have substantial capital requirements that, if not met, may hinder operations.
We have experienced and expect to continue to experience substantial capital needs as a result of our active exploration and development program and acquisitions. We expect that additional external financing will be required in the future to fund our growth. We may not be able to obtain additional financing, and financing under our existing revolving credit facility or new credit facilities may not be available in the future. Even if additional capital becomes available, it may not be on terms acceptable to us. As in the past, without additional capital resources, we may be forced to limit or defer our planned oil and gas exploration and development drilling program by releasing rigs or deferring fracturing, completion and hookup of the wells to pipelines and thereby adversely affect our production, cash flow, and the recoverability and ultimate value of our oil and gas properties, in turn negatively affecting our business, financial position and results of operations.
If our access to markets is restricted, it could negatively impact our production, our income and ultimately our ability to retain our leases. Our ability to sell oil and natural gas and receive market prices for our oil and natural gas may be adversely affected by pipeline and gathering system capacity constraints, including insufficient transportation capacity in the Delaware Basin.
Market conditions or the unavailability of satisfactory oil and gas transportation arrangements may hinder our access to oil and gas markets or delay our production. The availability of a ready market for our oil and gas production depends on a number
29
of factors, including the demand for and supply of oil and gas and the proximity of reserves to pipelines and terminal facilities. Our ability to market our production depends in substantial part on the availability and capacity of gathering systems, pipelines and processing facilities owned and operated by third parties. Our failure to obtain such services on acceptable terms could materially harm our business. Our productive properties may be located in areas with limited or no access to pipelines, thereby necessitating delivery by other means, such as trucking, or requiring compression facilities. However, such trucking and compression facilities may not always be available to us in acceptable terms or at all. Such restrictions on our ability to sell our oil or gas may have several adverse effects, including higher transportation costs, fewer potential purchasers (thereby potentially resulting in a lower selling price) or, in the event we were unable to market and sustain production from a particular lease for an extended time, possibly causing us to lose a lease due to lack of production. Pipeline and gathering constraints have in the past required, and may in the future require, us to flare natural gas occasionally, decreasing the volumes sold from our wells. Our lease terms may require us to pay royalties on such flared gas to maintain our leases, which could adversely affect our business.
There is currently limited pipeline and gathering system capacity in areas where we operate. See "-Interruption to crude oil and natural gas gathering systems, pipelines and transportation and processing facilities we do not own could result in the loss of production and revenues." This capacity shortage is particularly pronounced in the Delaware Basin and this area of operation has been characterized by periods when oil production has surpassed local transportation capacity, resulting in substantial discounts to the price received for crude oil prices quoted for WTI oil. During the year ended December 31, 2018 , the Delaware Basin market crude oil price has experienced a substantial discount to WTI-Cushing prices, primarily due to limited pipeline capacity constraining transportation of crude oil out of the Delaware Basin to major marketing hubs. The amount of oil and gas being produced by us and others could continue to exceed the capacity of, and result in strains on, the various gathering and transportation systems, pipelines, processing facilities, and other infrastructure available in that area. It will be necessary for additional infrastructure, pipelines, gathering and transportation systems and processing facilities to be expanded, built, or developed to accommodate anticipated production from these areas. The expansion and construction of pipeline facilities that could alleviate transportation restrictions are affected by the availability and costs of necessary equipment, supplies, labor and other services, as well as the length of time to complete such projects. In addition, these projects can be affected by changes in international trade relationships, including the imposition of trade restrictions or tariffs relating to crude oil and natural gas and any materials or products used to expand or construct pipeline facilities, such as certain imported steel mill products that are currently subject to an additional global tariff. All of these factors could negatively impact our realized oil prices, as well as actual results of our operations.
Historically, when available we have generally delivered our oil and gas production through gathering systems and pipelines that we do not own under interruptible or short-term transportation agreements. Under the interruptible transportation agreements, the transportation of our oil and gas production may be interrupted due to capacity constraints on the applicable system, for maintenance or repair of the system, or for other reasons as dictated by the particular agreements. In the Delaware Basin, we have entered into firm transportation agreements for a portion of our production in such areas in order to assure our ability, and that of our purchasers, to successfully market the oil and gas that we produce. We may also enter into firm transportation arrangements for additional production in the future. These firm transportation agreements may be more costly than interruptible or short-term transportation agreements.
A portion of our oil and gas production in any region may be interrupted, or shut in, from time to time for numerous reasons, including as a result of weather conditions, accidents, loss or unavailability of pipeline or gathering system access and capacity, field labor issues or strikes, or we might voluntarily curtail production in response to market conditions, including low oil and gas prices. If a substantial amount of our production is interrupted at the same time, it could temporarily adversely affect our cash flow. Furthermore, if we were required to shut in wells we might also be obligated to pay shut-in royalties to certain mineral interest owners in order to maintain our leases.
Interruption to crude oil and natural gas gathering systems, pipelines and transportation and processing facilities we do not own could result in the loss of production and revenues.
Our operations are dependent upon the availability, proximity and capacity of pipelines, natural gas gathering systems and transportation and processing facilities we do not own. Any significant change affecting these infrastructure facilities could materially harm our business. The lack of available capacity of gathering systems, pipelines and facilities could reduce the price offered for our production or result in the shut-in of producing wells or the delay or discontinuance of development plans for properties. These systems and facilities may be temporarily unavailable due to adverse weather conditions or operational issues or may not be available to us in the future. See "-Our operations are subject to various operating and other casualty risks that could result in liability exposure or the loss of production and revenues." Additionally, activists or other efforts may delay or halt the construction of additional pipelines or facilities. To the extent these services are unavailable, we would be unable to realize revenue from wells served by such systems and facilities until suitable arrangements are made to market our production. As a result, we could experience reductions in revenue that could reduce or eliminate the funds available for our exploration and development programs and acquisitions, or result in the loss of property.
30
Instability in the global financial system or in the oil and gas industry sector may have impacts on our liquidity and financial condition that we currently cannot predict.
Instability in the global financial system or in the oil and gas industry sector may have a material impact on our liquidity and our financial condition. We rely upon access to both our revolving credit facility and longer-term capital markets as sources of liquidity for any capital requirements not satisfied by the cash flow from operations or other sources. Our ability to access the capital markets or borrow money may be restricted or made more expensive at a time when we would like, or need, to raise capital, which could have an adverse impact on our flexibility to react to changing economic and business conditions and on our ability to fund our operations and capital expenditures in the future. The economic situation could have an impact on our lenders or customers, causing them to fail to meet their obligations to us, and on the liquidity of our operating partners, resulting in delays in operations or their failure to make required payments. Also, market conditions, including with respect to commodity prices such as for oil and gas, could have an impact on our oil and gas derivative instruments if our counterparties are unable to perform their obligations or seek bankruptcy protection. Additionally, challenges in the economy have led and could further lead to reductions in the demand for oil and gas, or further reductions in the prices of oil and gas, or both, which could have a negative impact on our financial position, results of operations and cash flows.
The risks associated with our debt and the provisions of our debt agreements could adversely affect our business, financial position and results of operations.
We have demands on our cash resources, including interest expense, operating expenses and funding of our capital expenditures. Our level of long-term debt, the demands on our cash resources and the provisions of the credit agreement governing our revolving credit facility and the indentures governing our 6.25% Senior Notes due 2023 (the "6.25% Senior Notes") and our 8.25% Senior Notes may have adverse consequences on our operations and financial results, including:
• | placing us at a competitive disadvantage compared to our competitors that have lower debt service obligations and significantly greater operating and financial flexibility than we do; |
• | limiting our financial flexibility, including our ability to borrow additional funds, pay dividends, make certain investments and issue equity on favorable terms or at all; |
• | limiting our flexibility in planning for, and reacting to, changes in business conditions; |
• | increasing our interest expense on our variable rate borrowings if interest rates increase; |
• | requiring us to use a substantial portion of our cash flow to make debt service payments, which will reduce the funds that would otherwise be available for operations and future business opportunities; |
• | requiring us to modify our operations, including by curtailing portions of our drilling program, selling assets, reducing our capital expenditures, refinancing all or a portion of our existing debt or obtaining additional financing, which may be on unfavorable terms; and |
• | making us more vulnerable to downturns in our business or the economy, including a decline in oil prices. |
In addition, the provisions of our revolving credit facility and our 6.25% Senior Notes and our 8.25% Senior Notes place restrictions on us and certain of our subsidiaries with respect to incurring additional indebtedness and liens, making dividends and other payments to shareholders, repurchasing our common stock, repurchasing or redeeming our 6.25% Senior Notes and our 8.25% Senior Notes, making investments, acquisitions, mergers and asset dispositions, entering into hedging transactions and other matters. Our revolving credit facility also requires compliance with covenants to maintain specified financial ratios. Our business plan and our compliance with these covenants are based on a number of assumptions, the most important of which is relatively stable oil and gas prices at economically sustainable levels. If the prices that we receive for our oil and gas production continue to remain at low levels or to decline, it could lead to further reduced revenues, cash flow and earnings, which in turn could lead to a default under certain financial covenants contained in our revolving credit facility, including the covenants related to working capital and the ratios described above. Also, a further decline in or sustained low oil and gas prices could result in a lowering of our credit ratings by rating agencies, which could adversely impact the pricing of, or our ability to issue, new debt instruments. Because the calculations of the financial ratios are made as of certain dates, the financial ratios can fluctuate significantly from period to period as the amounts outstanding under our revolving credit facility are dependent on the timing of cash flows related to operations, capital expenditures, sales of oil and gas properties and securities offerings. If a further decline in oil or gas prices were to occur in the future or if low prices continue for an extended period, it could further increase the risk of a lowering in our credit rating or our inability to comply with covenants to maintain specified financial ratios. Additionally, these ratios may have the effect of restricting us from borrowing the full amount available under the borrowing base for our revolving credit facility. In order to provide a margin of comfort with regard to these financial covenants, we may seek to further reduce our capital expenditure plan, sell additional non-strategic assets or opportunistically modify or increase our derivative instruments to the extent permitted under our revolving credit facility. We cannot assure you that we will be able to successfully
31
execute any of these strategies, or if executed, that they will be sufficient to avoid a default under our revolving credit facility if a further decline in oil or gas prices were to occur in the future or if low prices continue for an extended period.
The terms of our Preferred Stock have many of the same effects as our debt and terms of our debt agreements. See "-Our overall level of debt and Preferred Stock obligations could adversely affect us." and "-Holders of the Preferred Stock have rights that may restrict our ability to operate our business or be adverse to holders of our common stock."
The borrowing base under our revolving credit facility may be reduced below the amount of borrowings outstanding under such facility.
Under the terms of our revolving credit facility, our borrowing base is subject to redeterminations at least semi-annually based in part on assumptions of the administrative agent with respect to, among other things, crude oil and natural gas prices. A negative adjustment could occur if the crude oil and natural gas prices used by the banks in calculating the borrowing base are significantly lower than those used in the last redetermination, including as a result of a decline in crude oil prices or an expectation that such reduced prices will continue. The next redetermination of our borrowing base is scheduled to occur in Spring 2019. In addition, the portion of our borrowing base made available to us is subject to the terms and covenants of our revolving credit facility, including compliance with the ratios and other financial covenants of such facility. In the event the amount outstanding under our revolving credit facility exceeds the redetermined borrowing base, we could be forced to repay a portion of our borrowings. We may not have sufficient funds to make any required repayment. If we do not have sufficient funds and are otherwise unable to negotiate renewals of our borrowings or arrange new financing, we may have to sell a portion of our assets.
We may face difficulties in securing and operating under authorizations and permits to drill, complete or operate our wells.
The recent growth in oil and gas exploration in the United States has drawn intense scrutiny from environmental and community interest groups, regulatory agencies and other governmental entities. As a result, we may face significant opposition to, or increased regulation of, our operations that may make it difficult or impossible to obtain permits and other needed authorizations to drill, complete or operate, result in operational delays, or otherwise make oil and gas exploration more costly or difficult than in other countries.
Many of our properties are in areas that may have been partially depleted or drained by our existing wells or other offset wells and certain of our wells may be adversely affected by actions other operators may take when drilling, completing, or operating wells that they own.
Many of our properties are in areas that may have already been partially depleted or drained by earlier drilling, including offset drilling by other operators. The owners of leasehold interests adjoining any of our properties could take actions, such as drilling and completing additional wells, which could inhibit our ability to find or recover commercial quantities of oil and adversely affect our operations. When a new well is completed and produced, the pressure differential in the vicinity of the well causes the migration of reservoir fluids toward the new wellbore (and potentially away from existing wellbores). As a result, the drilling and production of these potential locations could cause a depletion of our proved reserves, may result in an acceleration in the decline in production of our wells and may inhibit our ability to further develop our proved reserves. In addition, completion operations and other activities conducted on adjacent or nearby wells could cause production from our producing wells to be shut in for indefinite periods of time, could result in increased lease operating expenses and could adversely affect the production and reserves from our wells after they recommence production. We have no control over the operations or activities of offsetting operators.
We have only limited experience drilling wells in the Delaware Basin and less information regarding reserves and decline rates in these shale formations than in some other areas of our operations.
We have limited exploration and development experience in the Delaware Basin. We have participated in the drilling of only 117 gross (48.4 net) operated and non-operated wells in the Delaware Basin. Other operators in these areas have significantly more experience in the drilling of wells, including the drilling of horizontal wells. As a result, we have less information with respect to the ultimate recoverable reserves, the production decline rate and other matters relating to the exploration, drilling and development of the Delaware Basin than we have in our Eagle Ford area in which we operate.
If we are unable to acquire adequate supplies of water for our operations or are unable to dispose of the water we use at a reasonable cost and within applicable environmental rules, our ability to produce oil and gas commercially and in commercial quantities could be impaired.
We use a substantial amount of water in our operations, including in the hydraulic fracturing process. Our inability to locate sufficient amounts of water, or to treat and dispose of water after drilling at a reasonable cost, could adversely impact our operations. Moreover, the imposition of new environmental initiatives and regulations could include restrictions on our ability to conduct certain operations such as hydraulic fracturing or disposal of waste, including, but not limited to, produced water, drilling fluids and other wastes associated with the exploration, development or production of oil and gas. Furthermore, future environmental regulations and permit requirements governing the withdrawal, storage and use of surface water or groundwater necessary for
32
hydraulic fracturing of wells could increase operating costs and cause delays, interruptions or termination of operations, the extent of which cannot be predicted, all of which could have an adverse effect on our operations and financial performance. For example, in June 2016, the EPA established pretreatment standards for disposal of wastewater produced from unconventional oil and natural gas extraction facilities into publicly owned treatment works. In response to these actions, operators including us have begun to rely more on recycling of flowback and produced water from well sites as a preferred alternative to disposal.
We may not increase our acreage positions in areas with exposure to oil, condensate and NGLs.
If we are unable to increase our acreage positions in the Eagle Ford and Delaware Basin, this may detract from our efforts to realize our growth strategy in crude oil plays. Additionally, we may be unable to find or consummate other opportunities in these areas or in other areas with similar exposure to oil, condensate and NGLs on similar terms or at all.
Restricted land access could reduce our ability to explore for and develop oil and gas reserves.
Our ability to adequately explore for and develop oil and gas resources is affected by a number of factors related to access to land. Examples of factors which reduce our access to land include, among others:
• | new municipal or state land use regulations, which may restrict drilling locations or certain activities such as hydraulic fracturing; |
• | local and municipal government control of land or zoning requirements, which can conflict with state law and deprive land owners of property development rights; |
• | landowner or foreign governments' opposition to infrastructure development; |
• | regulation of federal land by the U.S. Department of the Interior Bureau of Land Management or other federal government agencies; |
• | anti-development activities, which can reduce our access to leases through legal challenges or lawsuits, disruption of drilling, or damage to equipment; |
• | disputes regarding leases; and |
• | disputes with landowners, royalty owners, or other operators over such matters as title transfer, joint interest billing arrangements, revenue distribution, or production or cost sharing arrangements. |
Loss of access to land for which we own mineral rights could result in a reduction in our proved reserves and a negative impact on our results of operations and cash flows. Reduced ability to obtain new leases could constrain our future growth and opportunity set by limiting the expansion of our operations.
We face strong competition from other oil and gas companies.
We encounter competition from other oil and gas companies in all areas of our operations, including the acquisition of exploratory prospects and proven properties. Our competitors include major integrated oil and gas companies and numerous independent oil and gas companies, individuals and drilling and income programs. Many of our competitors are large, well-established companies that have been engaged in the oil and gas business much longer than we have and possess substantially larger operating staffs and greater capital resources than we do. These companies may be able to pay more for exploratory projects and productive oil and gas properties and may be able to define, evaluate, bid for and purchase a greater number of properties and prospects than our financial or human resources permit. In addition, these companies may be able to expend greater resources on the existing and changing technologies that we believe are and will be increasingly important to attaining success in the industry. Such competitors may also be in a better position to secure oilfield services and equipment on a timely basis or on favorable terms. These companies may also have a greater ability to continue drilling activities during periods of low oil and gas prices, such as the current commodity price environment, and to absorb the burden of current and future governmental regulations and taxation. We may not be able to conduct our operations, evaluate and select suitable properties and consummate transactions successfully in this highly competitive environment.
We may not be able to keep pace with technological developments in our industry.
The oil and gas industry is characterized by rapid and significant technological advancements and introductions of new products and services using new technologies. As others use or develop new technologies, we may be placed at a competitive disadvantage, and competitive pressures may force us to implement those new technologies at substantial cost. In addition, other oil and gas companies may have greater financial, technical and personnel resources that allow them to enjoy technological advantages and may in the future allow them to implement new technologies before we can. We may not be able to respond to these competitive pressures and implement new technologies on a timely basis or at an acceptable cost. If one or more of the technologies we use now or in the future were to become obsolete or if we are unable to use the most advanced commercially available technology, our business, financial condition and results of operations could be materially adversely affected.
33
Part of our strategy involves drilling existing or emerging shale plays using some of the latest available seismic, horizontal drilling and completion techniques. The results of our planned exploratory and delineation drilling in these plays are subject to drilling and completion technique risks, and drilling results may not meet our expectations for reserves or production. As a result, the value of our undeveloped acreage could decline if drilling results are unsuccessful.
We rely to a significant extent on seismic data and other advanced technologies in evaluating undeveloped properties and in conducting our exploration activities. The seismic data and other technologies we use do not allow us to know conclusively, prior to drilling and completing a well, whether oil or natural gas is present or may be produced economically.
Many of our operations involve drilling and completion techniques developed by us or our service providers in order to maximize cumulative recoveries. Risks that we face while drilling include, but are not limited to, landing our well bore in the desired drilling zone, staying in the desired drilling zone while drilling horizontally through the formation, running our casing the entire length of the well bore, and being able to run tools and recover equipment consistently through the horizontal well bore. Risks that we face while completing our wells include, but are not limited to, being able to fracture stimulate the planned number of stages, being able to run tools and other equipment the entire length of the well bore during completion operations, being able to recover such tools and other equipment, and successfully cleaning out the well bore after completion of the final fracture stimulation.
Ultimately, the success of these drilling and completion techniques can only be evaluated over time as more wells are drilled and production profiles are established over a sufficiently long time period. If our drilling results are less than anticipated or we are unable to execute our drilling program because of capital constraints, lease expirations, limited access to gathering systems and takeaway capacity, commodity price decline, or other reasons, then the return on our investment for a particular project may not be as attractive as we anticipated and the value of our undeveloped acreage could decline in the future.
We are subject to various environmental risks and governmental regulations, including those relating to benzene emissions, hydraulic fracturing and global climate change, and future regulations may be more stringent resulting in increased operating costs and decreased demand for the oil and gas that we produce.
Oil and gas operations are subject to various federal, state, local and foreign laws and government regulations that may change from time to time. Matters subject to regulation include discharge permits for drilling operations, well testing, plug and abandonment requirements and bonds, reports concerning operations, the spacing of wells, unitization and pooling of properties and taxation. From time to time, regulatory agencies have imposed price controls and limitations on production by restricting the rate of flow of oil and gas wells below actual production capacity in order to conserve supplies of oil and gas. Other federal, state, local and foreign laws and regulations relating primarily to the protection of human health and the environment apply to the development, production, handling, storage, transportation and disposal of oil and gas, by-products thereof and other substances and materials produced or used in connection with oil and gas operations, including drilling fluids and wastewater. We may incur costs arising out of property damage, including environmental damage caused by previous owners or operators of property we purchase or lease or relating to third party sites, or injuries to employees and other persons. As a result, we may incur substantial liabilities to third parties or governmental entities and may be required to incur substantial remediation costs. We also are subject to changing and extensive tax laws, the effects of which cannot be predicted. Compliance with existing, new or modified laws and regulations could result in substantial costs, delay our operations or otherwise have a material adverse effect on our business, financial position and results of operations.
Moreover, changes in environmental laws and regulations occur frequently and such laws and regulations tend to become more stringent over time. Increased scrutiny of our industry may also occur as a result of the EPA's 2017-2019 National Enforcement Initiative ("NEI"), "Ensuring Energy Extraction Activities Comply with Environmental Laws," through which the EPA will address incidences of noncompliance from natural gas extraction and production activities that may cause or contribute to significant harm to public health or the environment. However, the EPA has proposed a 2020-2023 National Compliance Initiative (formerly referred to as an NEI) that would transition the 2017-2019 NEI to focus on significant sources of volatile organic compounds that have a substantial impact on air quality, without regard to sector. Stricter laws, regulations or enforcement policies could significantly increase our compliance costs and negatively impact our production and operations, which could have a material adverse effect on our results of operations and cash flows. See "Item 1. Business-Additional Oil and Gas Disclosures-Regulation-Environmental Regulations" for additional information.
There is increasing attention in the United States and worldwide to the issue of climate change and the contributing effect of GHG emissions. The modification of existing laws or regulations or the adoption of new laws or regulations curtailing oil and gas exploration in the areas in which we operate could materially and adversely affect our operations by limiting drilling opportunities or imposing materially increased costs. See "Item 1. Business-Additional Oil and Gas Disclosures-Regulation- Global Climate Change" for additional information.
Hydraulic fracturing is an important and commonly used process in the completion of oil and gas wells, particularly in unconventional resource plays. Hydraulic fracturing involves the injection of water, sand and chemicals under pressure into rock
34
formations to stimulate oil and gas production. The U.S. Congress has considered legislation to subject hydraulic fracturing operations to federal regulation and to require the disclosure of chemicals used by us and others in the oil and gas industry in the hydraulic fracturing process. The EPA has asserted federal regulatory authority over hydraulic fracturing involving diesel under the federal Safe Drinking Water Act and has released permitting guidance for hydraulic fracturing operations that use diesel fuel in fracturing fluids in those states where the EPA is the permitting authority. In addition, in March 2015, the BLM issued a final rule to regulate hydraulic fracturing on federal and Indian land. However, in December 2017, the BLM published a final rule rescinding the 2015 rule. The rescission rule is currently subject to legal challenge. A number of federal agencies are also analyzing, or have been requested to review, a variety of environmental issues associated with hydraulic fracturing. For example, in December 2016, the EPA released the final results of a study of the potential impacts of hydraulic fracturing activities on drinking water resources in the states where the EPA is the permitted authority. The study concluded that hydraulic fracturing activities can impact drinking water resources under some circumstances, including large volume spills and inadequate mechanical integrity of wells. These ongoing or proposed studies, depending on their course and any meaningful results obtained, could spur initiatives to further regulate hydraulic fracturing under the Safe Drinking Water Act, the Toxic Substances Control Act, or other regulatory mechanisms.
State and federal regulatory agencies recently have focused on a possible connection between hydraulic fracturing related activities and the increased occurrence of seismic activity. When caused by human activity, such events are called induced seismicity. In a few instances, operators of injection wells in the vicinity of seismic events have been ordered to reduce injection volumes or suspend operations. Some state regulatory agencies, including those in Texas, have modified their regulations to account for induced seismicity. Regulatory agencies at all levels are continuing to study the possible linkage between oil and gas activity and induced seismicity. A 2012 report published by the National Academy of Sciences concluded that only a very small fraction of the tens of thousands of injection wells have been suspected to be, or have been, the likely cause of induced seismicity; and a 2015 report by researchers at the University of Texas has suggested that the link between seismic activity and wastewater disposal may vary by region. In March 2016, the United States Geological Survey (the "USGS") identified states with the most significant hazards from induced seismicity, which included Texas. Subsequent USGS seismic hazard forecasts have continued to include Texas, but have found greater probability of seismic hazards in other states. A number of lawsuits have been filed alleging that disposal well operations have caused damage to neighboring properties or otherwise violated state and federal rules regulating waste disposal. These developments could result in additional regulation and restrictions on the use of injection wells and hydraulic fracturing. Such regulations and restrictions could cause delays and impose additional costs and restrictions on our operations and on our and our contractors' waste disposal activities.
Several states, including states where we operate such as Texas, have proposed or adopted legislative or regulatory restrictions on hydraulic fracturing through additional permit requirements, public disclosure of fracturing fluid contents, water sampling requirements, and operational restrictions. Further, some states and local governments have adopted or are considering adopting bans on drilling. For example, the City of Denton, Texas adopted a moratorium on hydraulic fracturing in November 2014, which was later lifted in 2015. We use hydraulic fracturing extensively and any increased federal, state, local, foreign or international regulation of hydraulic fracturing or offshore drilling, including legislation and regulation in the state of Texas, could reduce the volumes of oil and gas that we can economically recover, which could materially and adversely affect our revenues and results of operations. See "Item 1. Business-Additional Oil and Gas Disclosures-Regulation-Regulation of Natural Gas and Oil Exploration and Production" and "-Environmental Regulations" for additional information.
From time to time legislation is introduced in the U.S. Congress that, if enacted into law, would make significant changes to United States tax laws, including the elimination of certain key U.S. federal income tax incentives currently available to oil and gas exploration and production companies. These or any other similar changes in U.S. federal income tax laws could defer or eliminate certain tax deductions that are currently available with respect to oil and gas exploration and development, and any such change could negatively affect our financial position and results of operations.
We face various risks associated with the trend toward increased anti-development activity.
As new technologies have been applied to our industry, we have seen significant growth in oil and gas supply in recent years, particularly in the U.S. With this expansion of oil and gas development activity, opposition toward oil and gas drilling and development activity has been growing both in the U.S. and globally. Companies in the oil and gas industry, such as us, can be the target of opposition to development from certain stakeholder groups. These anti-development efforts could be focused on:
• | limiting oil and gas development; |
• | reducing access to federal and state owned lands; |
• | delaying or canceling certain projects such as shale development and pipeline construction; |
• | limiting or banning the use of hydraulic fracturing; |
• | denying air-quality permits for drilling; and |
• | advocating for increased regulations on shale drilling and hydraulic fracturing. |
35
Future anti-development efforts could result in the following:
• | blocked development; |
• | denial or delay of drilling permits; |
• | shortening of lease terms or reduction in lease size; |
• | restrictions on installation or operation of gathering or processing facilities; |
• | restrictions on the use of certain operating practices, such as hydraulic fracturing; |
• | reduced access to water supplies or restrictions on water disposal; |
• | limited access or damage to or destruction of our property; |
• | legal challenges or lawsuits; |
• | increased regulation of our business; |
• | damaging publicity and reputational harm; |
• | increased costs of doing business; |
• | reduction in demand for our products; and |
• | other adverse effects on our ability to develop our properties and expand production. |
Our need to incur costs associated with responding to these initiatives or complying with any new legal or regulatory requirements resulting from these activities that are substantial and not adequately provided for, could have a material adverse effect on our business, financial condition and results of operations. In addition, the use of social media channels can be used to cause rapid, widespread reputational harm.
Our operations are subject to various operating and other casualty risks that could result in liability exposure or the loss of production and revenues.
The oil and gas business involves operating hazards such as:
• | well blowouts; |
• | mechanical failures; |
• | explosions; |
• | pipe or cement failures and casing collapses, which could release oil, natural gas, drilling fluids or hydraulic fracturing fluids; |
• | uncontrollable flows of oil, natural gas or well fluids; |
• | fires; |
• | geologic formations with abnormal pressures; |
• | spillage handling and disposing of materials, including drilling fluids and hydraulic fracturing fluids and other pollutants; |
• | pipeline ruptures or spills; |
• | releases of toxic gases; |
• | adverse weather conditions, including drought, flooding, winter storms, snow, hurricanes or other severe weather events; and |
• | other environmental hazards and risks including conditions caused by previous owners and lessors of our properties. |
Any of these hazards and risks can result in substantial losses to us from, among other things, injury or loss or life, severe damage to or destruction of property, natural resources and equipment, pollution or other environmental damage, cleanup responsibilities, regulatory investigation and penalties and suspension of operations. As a result we could incur substantial liabilities or experience reductions in revenue that could reduce or eliminate the funds available for our exploration and development programs and acquisitions.
36
We may not have enough insurance to cover all of the risks we face.
We maintain insurance against losses and liabilities in accordance with customary industry practices and in amounts that management believes to be prudent; however, insurance against all operational risks is not available to us. We do not carry business interruption insurance. We may elect not to carry insurance if management believes that the cost of available insurance is excessive relative to the risks presented. In addition, losses could occur for uninsured risks or in amounts in excess of existing insurance coverage. We cannot insure fully against pollution and environmental risks. We cannot assure you that we will be able to maintain adequate insurance in the future at rates we consider reasonable or that any particular types of coverage will be available. The occurrence of an event not fully covered by insurance could have a material adverse effect on our financial position and results of operations.
We conduct a portion of our operations through a joint venture, which subjects us to additional risks that could have a material adverse effect on the success of these operations, our financial position and our results of operations.
We conduct a portion of our operations through a joint venture with GAIL. We may also enter into other joint venture arrangements in the future. These third parties may have obligations that are important to the success of the joint venture, such as the obligation to pay carried costs pertaining to the joint venture and to pay their share of capital and other costs of the joint venture. The performance of these third party obligations, including the ability of the third parties to satisfy their obligations under these arrangements, is outside our control. If these parties do not satisfy their obligations under these arrangements, our business may be adversely affected.
Our joint venture arrangements may involve risks not otherwise present when exploring and developing properties directly, including, for example:
• | our joint venture partners may share certain approval rights over major decisions; |
• | our joint venture partners may not pay their share of the joint venture's obligations, leaving us liable for their shares of joint venture liabilities; |
• | we may incur liabilities as a result of an action taken by our joint venture partners; |
• | we may be required to devote significant management time to the requirements of and matters relating to the joint ventures; |
• | our joint venture partners may be in a position to take actions contrary to our instructions or requests or contrary to our policies or objectives; and |
• | disputes between us and our joint venture partners may result in delays, litigation or operational impasses. |
The risks described above or the failure to continue our joint ventures or to resolve disagreements with our joint venture partners could adversely affect our ability to transact the business that is the subject of such joint venture, which would in turn negatively affect our financial condition and results of operations. The risks described above or the failure to continue our joint ventures or to resolve disagreements with our joint venture partners could adversely affect our ability to transact the business that is the subject of such joint venture, which would in turn negatively affect our financial condition and results of operations. The agreements under which we formed certain joint ventures may subject us to various risks, limit the actions we may take with respect to the properties subject to the joint venture and require us to grant rights to our joint venture partners that could limit our ability to benefit fully from future positive developments. Some joint ventures require us to make significant capital expenditures. If we do not timely meet our financial commitments or otherwise do not comply with our joint venture agreements, our rights to participate, exercise operator rights or otherwise influence or benefit from the joint venture may be adversely affected. Certain of our joint venture partners may have greater financial resources than we have and we may not be able to secure the funding necessary to participate in operations our joint venture partners propose, thereby reducing our ability to benefit from the joint venture.
We cannot control the activities on properties we do not operate.
We do not operate all of the properties in which we have an interest. As a result, we have limited ability to exercise influence over, and control the risks associated with, operations of these properties. The failure of an operator of our wells to adequately perform operations, an operator's breach of the applicable agreements or an operator's failure to act in ways that are in our best interests could reduce our production and revenues or could create liability for us for the operator's failure to properly maintain the well and facilities and to adhere to applicable safety and environmental standards. With respect to properties that we do not operate:
• | the operator could refuse to initiate exploration or development projects; |
• | if we proceed with any of those projects the operator has refused to initiate, we may not receive any funding from the operator with respect to that project; |
37
• | the operator may initiate exploration or development projects on a different schedule than we would prefer; |
• | the operator may propose greater capital expenditures than we wish, including expenditures to drill more wells or build more facilities on a project than we have funds for, which may mean that we cannot participate in those projects or participate in a substantial amount of the revenues from those projects; and |
• | the operator may not have sufficient expertise or resources. |
Any of these events could significantly and adversely affect our anticipated exploration and development activities.
Our business may suffer if we lose key personnel.
We depend to a large extent on the services of certain key management personnel, including our executive officers and other key employees, the loss of any of whom could have a material adverse effect on our operations. We have entered into employment agreements with many of our key employees as a way to assist in retaining their services and motivating their performance. We do not maintain key-man life insurance with respect to any of our employees. Our success will also be dependent on our ability to continue to employ and retain skilled technical personnel.
We may experience difficulty in achieving and managing future growth.
We have experienced growth in the past primarily through the expansion of our drilling program. Future growth may place strains on our financial, technical, operational and administrative resources and cause us to rely more on project partners and independent contractors, possibly negatively affecting our financial position and results of operations. Our ability to grow will depend on a number of factors, including:
• | our ability to obtain leases or options on properties, including those for which we have 3-D seismic data; |
• | our ability to acquire additional 3-D seismic data; |
• | our ability to identify and acquire new exploratory prospects; |
• | our ability to develop existing prospects; |
• | our ability to continue to retain and attract skilled personnel; |
• | our ability to maintain or enter into new relationships with project partners and independent contractors; |
• | the results of our drilling program; |
• | hydrocarbon prices; and |
• | our access to capital. |
We may not be successful in upgrading our technical, operations and administrative resources or in increasing our ability to internally provide certain of the services currently provided by outside sources, and we may not be able to maintain or enter into new relationships with project partners and independent contractors. Our inability to achieve or manage growth may adversely affect our financial position and results of operations.
We may continue to enter into or exercise commodity derivative transactions to manage the price risks associated with our production, which may expose us to risk of financial loss and limit the benefit to us of increases in prices for oil and gas.
Because oil and gas prices are unstable, we periodically enter into price-risk-management transactions such as fixed-rate swaps, costless collars, three-way collars, puts, calls and basis differential swaps to reduce our exposure to price declines associated with a portion of our oil and gas production and thereby to achieve a more predictable cash flow. Additionally, some of our agreements for both the acquisition and disposition of oil and gas properties include arrangements whereby we will be required to make or entitled to receive additional payments if commodity prices exceed specified levels for certain periods of time. The use of these arrangements limits our ability to benefit from increases in the prices of oil and gas. Additionally, some derivative transactions may help to assure favorable pricing in the near term, but at the cost of limiting our ability to benefit from price increases that occur in subsequent years. At any given time our derivative arrangements may apply to only a portion of our production, including following the exercise of any then-existing derivative instruments, thereby providing only partial protection against declines in oil and gas prices. These arrangements may expose us to the risk of financial loss in certain circumstances, including instances in which production is less than expected, our customers fail to purchase contracted quantities of oil and gas or a sudden, unexpected event materially impacts oil or gas prices. In addition, the counterparties under our derivatives contracts may fail to fulfill their contractual obligations to us or there may be an adverse change in the expected differential between the underlying price in the derivative instrument and the actual prices received for our production. During periods of declining commodity prices, our commodity price derivative positions increase, which increases our counterparty exposure.
38
As our derivatives expire, more of our future production will be sold at market prices unless we enter into additional derivative transactions. If we are unable to enter into new derivative contracts in the future at favorable pricing and for a sufficient amount of our production, our financial condition and results of operations could be materially adversely affected. It is also possible that a larger percentage of our future production will not be hedged as our derivative policies may change, which would result in our oil and gas revenue becoming more sensitive to commodity price changes.
The Commodity Futures Trading Commission has promulgated regulations to implement statutory requirements for swap transactions. These regulations are intended to implement a regulated market in which most swaps are executed on registered exchanges or swap execution facilities and cleared through central counterparties. While we believe that our use of swap transactions exempt us from certain regulatory requirements, the changes to the swap market due to increased regulation could significantly increase the cost of entering into new swaps or maintaining existing swaps, materially alter the terms of new or existing swap transactions and/or reduce the availability of new or existing swaps. If we reduce our use of swaps as a result of the Dodd-Frank Act and regulations, our results of operations may become more volatile and our cash flows may be less predictable.
Periods of high demand for oil field services and equipment and the ability of suppliers to meet that demand may limit our ability to drill and produce our oil and gas properties.
Our industry is cyclical and, from time to time, well service providers and related equipment and personnel may be in short supply. These shortages can cause escalating prices, delays in drilling and other exploration activities and the possibility of poor services coupled with potential damage to downhole reservoirs and personnel injuries. Such pressures may increase the actual cost of services, extend the time to secure such services and add costs for damages due to any accidents sustained from the overuse of equipment and inexperienced personnel. After a period of general declines in oilfield service and equipment costs following commodity price decreases, such costs could increase as commodity prices rise and may limit our ability to drill and produce our oil and gas properties.
If crude oil and natural gas prices decline to near or below the low levels experienced in 2015 and 2016 we could be required to record additional impairments of proved oil and gas properties that would constitute a charge to earnings and reduce our shareholders' equity.
At the end of each quarter, the net book value of oil and gas properties, less related deferred income taxes, are limited to the "cost center ceiling" equal to (i) the sum of (A) the present value of estimated future net revenues from proved oil and gas reserves, less estimated future expenditures to be incurred in developing and producing the proved reserves computed using a discount factor of 10%, (B) the costs of unproved properties not being amortized, and (C) the lower of cost or estimated fair value of unproved properties included in the costs being amortized; less (ii) related income tax effects. Any excess of the net book value of oil and gas properties, less related deferred income taxes, over the cost center ceiling is recognized as an impairment of proved oil and gas properties. An impairment recognized in one period may not be reversed in a subsequent period even if higher commodity prices in the future result in a cost center ceiling in excess of the net book value of oil and gas properties, less related deferred income taxes.
The estimated future net revenues used in the cost center ceiling are calculated using the 12-Month Average Realized Price. We recognized no impairments of proved oil and gas properties for the years ended December 31, 2018 and December 31, 2017, but did recognize an impairment of $576.5 million for the year ended December 31, 2016, primarily due to declines in the 12-Month Average Realized Price of crude oil. Declines in the 12-Month Average Realized Price of crude oil in subsequent quarters would result in a lower present value of the estimated future net revenues from proved oil and gas reserves and may result in impairments of proved oil and gas properties.
Unproved properties, not being amortized, are assessed on a quarterly basis to determine whether or not and to what extent proved reserves have been assigned to the properties or if an impairment has occurred, in which case the related costs along with associated capitalized interest are added to the oil and gas property costs subject to amortization. This assessment requires the use of judgment and estimates all of which may prove to be inaccurate. If crude oil and natural gas prices decline from their current levels, we may need to write down the carrying value of our unproved oil and gas properties, which will result in increased DD&A for future periods.
An impairment does not impact cash flows from operating activities but does reduce earnings and our shareholders' equity and increases the balance sheet leverage as measured by debt-to-total capitalization. The risk that we will be required to recognize impairments of our proved oil and gas properties increases during periods of low or declining oil or gas prices. In addition, impairments would occur if we were to experience sufficient downward adjustments to our estimated proved reserves or the present value of estimated future net revenues, as further discussed under "-Our reserve data and estimated discounted future net cash flows are estimates based on assumptions that may be inaccurate and are based on existing economic and operating conditions that may change in the future." We have in the past and could in the future incur additional impairments of oil and gas properties, particularly if oil and natural gas prices decline or remain at low levels.
39
A valuation allowance on a deferred tax asset could reduce our earnings.
Deferred tax assets are recorded for net operating losses and temporary differences between the book and tax basis of assets and liabilities expected to produce tax deductions in future periods. The ultimate realization of the deferred tax assets is dependent upon the generation of future taxable income during the periods in which those deferred tax assets would be deductible. We assess the realizability of the deferred tax assets each period by considering whether it is more likely than not that all or a portion of our deferred tax assets will not be realized. If we conclude that it is more likely than not that the deferred tax assets will not be realized, we record a valuation allowance against the net deferred tax asset, which has occurred since 2015 where we recorded a valuation allowance, reducing the net deferred tax asset to zero. This valuation allowance reduces earnings and our shareholders' equity and increases the balance sheet leverage as measured by debt-to-total capitalization. The valuation allowance remained as of December 31, 2018 , and will remain until such time, if ever, that we can determine that the net deferred tax assets are more likely than not to be realized.
The taxation of independent producers is subject to change, and federal and state proposals being considered could increase our cost of doing business.
From time to time, legislative proposals are made that would, if enacted into law, make significant changes to United States tax laws, including the elimination or postponement of certain key United States federal income tax incentives currently available to independent producers of oil and natural gas. Proposals that would significantly affect us could include a repeal of the expensing of intangible drilling costs, a repeal of the percentage depletion allowance and an increase in the amortization period of geological and geophysical expenses. These changes, if enacted, will make it more costly for us to explore for and develop our oil and natural gas resources.
We may incur losses as a result of title deficiencies.
We purchase working and revenue interests in the oil and gas leasehold interests upon which we will perform our exploration activities from third parties or directly from the mineral fee owners. The existence of a material title deficiency can render a lease worthless and can adversely affect our results of operations and financial condition. Title insurance covering mineral leaseholds is not generally available and, in all instances, we forego the expense of retaining lawyers to examine the title to the mineral interest to be placed under lease or already placed under lease until the drilling block is assembled and ready to be drilled. Even then, the cost of performing detailed title work can be expensive. We may choose to forgo detailed title examination by title lawyers on a portion of the mineral leases that we place in a drilling unit or conduct less title work than we have traditionally performed. As is customary in our industry, we generally rely upon the judgment of oil and gas lease brokers or independent landmen who perform the field work in examining records in the appropriate governmental offices and abstract facilities before attempting to acquire or place under lease a specific mineral interest and before drilling a well on a leased tract. We, in some cases, perform curative work to correct deficiencies in the marketability or adequacy of the title to us. The work might include obtaining affidavits of heirship or causing an estate to be administered. In cases involving more serious title problems, the amount paid for affected oil and gas leases can be generally lost and the target area can become undrillable. The failure of title may not be discovered until after a well is drilled, in which case we may lose the lease and the right to produce all or a portion of the minerals under the property.
The threat and impact of terrorist attacks, cyber attacks or similar hostilities may adversely impact our operations.
We face various security threats to the safety of our employees; threats to the security of our infrastructure or third party facilities and infrastructure, such as processing plants and pipelines; and threats from terrorist acts and acts of war. We also face cyber security and other threats including attempts by third parties to gain unauthorized access to sensitive information or to render data or systems unusable. These threats relate both to information relating to us and to third parties with whom we do business including landowners, employees, suppliers, customers and others. There can be no assurance that the procedures and controls we use to monitor these threats and mitigate our exposure to them will be sufficient in preventing them from materializing. If any of these events were to materialize, they could lead to losses of sensitive information, critical infrastructure, personnel or capabilities essential to our operations and could have a material adverse effect on our reputation, financial condition, results of operations, or cash flows.
In particular, the oil and gas industry has become increasingly dependent on digital technologies to conduct day-to-day operations including certain exploration, development and production activities. For example, software programs are used to interpret seismic data, manage drilling activities, conduct reservoir modeling and reserves estimation, and to process and record financial and operating data. We rely extensively on digital technology, including information technology systems and related infrastructure as well as internet sites, computer software, data hosting facilities, cloud application and services and other hardware and platforms, some of which are hosted by third parties to store, transmit, process and record sensitive information (including trade secrets, employee information and financial and operating data), communicate with our employees and business associates, analyze seismic and drilling information, estimate quantities of oil and gas reserves and for many other activities related to our business. The complexity of the technologies needed to explore for and develop oil and gas makes certain information particularly attractive to thieves.
40
Our business associates, including vendors, service providers, operating partners, purchasers of our production, and financial institutions, are also dependent on digital technology and some may be provided limited access to our sensitive information or our information systems and related infrastructure in the ordinary course of business. As dependence on digital technologies has increased so has the risk of cyber incidents, including deliberate attacks and unintentional events. Cybersecurity threat actors are becoming more sophisticated and coordinated in their attempts to access other parties' information technology systems and data, including those of cloud providers and third parties with which such other parties conduct business. Our technologies, systems and networks, and those of others with whom we do business, may become the target of cyber-attacks or information security breaches that could result in the unauthorized release, gathering, monitoring, misuse, loss or destruction of proprietary and other information, theft of property or other disruption of our business operations. These may result from among other things, unauthorized access, denial-of-service attacks, malicious software, data privacy and other breaches by employees, or others with authorized access, cyber or phishing-attacks, ransomware, malware, social engineering, physical breaches or other actions. A cyber incident involving our information systems and related infrastructure, or that of our business associates, could disrupt our business plans and negatively impact our operations in a variety of ways, including, but no limited to, the following:
• | Unauthorized access to seismic data, reserves information and other operational incidents, or other sensitive or proprietary information could have a negative impact on our ability to compete for oil and natural gas resources; |
• | Data corruption, or other operational disruption during drilling or completion activities could result in failure to reach the intended target or a drilling or other operational incident, personal injury, damage to equipment or the subsurface or otherwise adversely affect our operations; |
• | Data corruption or operational disruptions of production-related infrastructure could result in a loss of production, accidental discharge, and other operational incidents; |
• | A cyber attack on, or other disruptions to a vendor or service provider or other third party could result in disruptions which could delay or halt our operations; |
• | A cyber attack on third-party gathering, pipeline, or other transportation systems could delay or prevent us from transporting and marketing our production; |
• | A cyber attack on our automated and surveillance systems could cause a loss in production, potential environmental hazards and other operational problems; and |
• | A corruption or loss of our financial or operating data could result in events of non-compliance which could then lead to regulatory fines or penalties. |
In addition, certain cyber incidents, such as surveillance, may remain undetected for an extended period. We may be the target of such attacks and, as cyber threats continue to evolve, we may be required to expend significant additional resources to continue to modify or enhance our protective measures or to investigate and remediate any security vulnerabilities. Additionally, the growth of cyber attacks has resulted in evolving legal and compliance matters which impose significant costs that are likely to increase over time.
We cannot assess the extent of either the threat or the potential impact of future terrorist or cyber security attacks on the energy industry in general, and on us in particular, either in the short-term or in the long-term. Uncertainty surrounding such attacks may affect our operations in unpredictable ways.
Certain anti-takeover provisions may affect your rights as a shareholder.
Our articles of incorporation authorize our board of directors to set the terms of and issue preferred stock without shareholder approval. Our board of directors could use the preferred stock as a means to delay, defer or prevent a takeover attempt that a shareholder might consider to be in our best interest. In addition, our revolving credit facility, our indentures governing our senior notes and our existing Preferred Stock contain terms that may restrict our ability to enter into change of control transactions, including requirements to repay borrowings under our revolving credit facility and to offer to repurchase senior notes or to redeem our Preferred Stock, in either event upon a change in control, as determined under the relevant documents relating to such indebtedness or Preferred Stock. Furthermore, provisions in our bylaws, among other things, impose requirements on shareholders who wish to make nominations for the election of directors, propose other actions at shareholder meetings or take action to call shareholder meetings. These provisions, along with specified provisions of the Texas Business Organizations Code and our articles of incorporation and bylaws, may discourage or impede transactions involving actual or potential changes in our control, including transactions that otherwise could involve payment of a premium over prevailing market prices to holders of our common stock.
Failure to adequately protect critical data and technology systems and the impact of data privacy regulation could materially affect us.
Information technology solution failures, network disruptions and breaches of data security could disrupt our operations by causing delays or canceling or impeding processing of transactions and reporting financial results, resulting in the unintentional
41
disclosure of employee, royalty owner, or other third party or our information, or damage to our reputation. There can be no assurance that a system failure or data security breach will not have a material adverse effect on our operations, financial condition, results of operations or cash flows. In addition, new laws and regulations governing data privacy and the unauthorized disclosure of confidential information, including the European Union General Data Protection Regulation and recent California legislation, pose increasingly complex compliance challenges and potentially elevate costs, and any failure to comply with these laws and regulations could result in significant penalties and legal liability.
Item 1B. Unresolved Staff Comments
None.
Item 2. Properties
Information regarding our properties is included in "Item 1. Business" above and in "Note 3. Acquisitions and Divestitures of Oil and Gas Properties" and "Note 4. Property and Equipment, Net" of the Notes to our Consolidated Financial Statements included in "Item 8. Financial Statements and Supplementary Data," which information is incorporated herein by reference.
Item 3. Legal Proceedings
From time to time, we are party to certain legal actions and claims arising in the ordinary course of business. While the outcome of these events cannot be predicted with certainty, management does not currently expect these matters to have a materially adverse effect on our financial position or results of operations.
Barrow-Shaver Litigation
On September 24, 2014 an unfavorable jury verdict was delivered against the Company in a case entitled Barrow-Shaver Resources Company v. Carrizo Oil & Gas, Inc. in the amount of $27.7 million. On January 5, 2015, the court entered a judgment awarding the verdict amount plus $2.9 million in attorneys' fees plus pre-judgment interest. On January 31, 2017, the Twelfth Court of Appeals at Tyler, Texas reversed the trial court decision and rendered judgment in favor of the Company, declaring that the plaintiff take nothing on any of its claims. The plaintiff petitioned the Texas Supreme Court for review, which was granted, and oral arguments were held on December 4, 2018. The payment of damages per the original judgment was superseded by posting a bond in the amount of $25.0 million, which will remain outstanding pending resolution of the appeals process (which could take an extended period of time) or agreement of the parties.
The case was filed September 19, 2012 in the 7th Judicial District Court of Smith County, Texas and arises from an agreement between the plaintiff and the Company whereby the plaintiff could earn an assignment of certain of the Company's leasehold interests in Archer and Baylor counties, Texas for each commercially productive oil and gas well drilled by the plaintiff on acreage covered by the agreement. The agreement contained a provision that the plaintiff had to obtain the Company's written consent to any assignment of rights provided by such agreement. The plaintiff subsequently entered into a purchase and sale agreement with a third-party purchaser allowing the third-party purchaser to purchase rights in approximately 62,000 leasehold acres, including the rights under the agreement with the Company, for approximately $27.7 million. The plaintiff requested the Company's consent to make the assignment to the third-party purchaser and the Company refused. The plaintiff alleged that, as a result of the Company's refusal, the third-party purchaser terminated such purchase and sale agreement. The plaintiff sought damages for breach of contract, tortious interference with existing contract and other grounds in an amount not to exceed $35.0 million plus exemplary damages and attorneys' fees. As mentioned previously, the Twelfth Court of Appeals at Tyler, Texas found in favor of the Company on all grounds.
Item 4. Mine Safety Disclosures
Not applicable.
PART II
Item 5. Market for Registrant's Common Equity, Related Shareholder Matters and Issuer Purchases of Equity Securities
Market Information. Our common stock, par value $0.01 per share, trades on the NASDAQ Global Select Market under the symbol "CRZO." As of February 22, 2019 , there were an estimated 49 owners of record of our common stock. See "Note 10. Shareholders' Equity" of the Notes to our Consolidated Financial Statements for further discussion.
Common Stock Dividends. We have not paid any dividends on our common stock in the past and do not intend to pay such dividends in the foreseeable future. We currently intend to retain any earnings for the future operation and development of our business, including exploration, development and acquisition activities. Our revolving credit facility, our senior notes and the terms of our preferred stock restrict our ability to pay dividends. See "Item 7. Management's Discussion and Analysis of Financial Condition and Results of Operations-Liquidity and Capital Resources."
42
Purchases of Equity Securities by the Issuer and Affiliated Purchasers. For the year ended December 31, 2018, there were no purchases made by the Company or affiliated purchasers (as defined in Rule 10b-18(a)(3) under the Securities Exchange Act of 1934), of shares of the Company's common stock.
Common Stock Total Return Performance Graph. The following performance graph contained in this section is not deemed to be "soliciting material" or to be "filed" with the SEC, and will not be incorporated by reference into any other filings under the Securities Act of 1933, as amended (the "Securities Act") or Securities Exchange Act of 1934, except to the extent that the Company specifically incorporates it by reference into such filing. Shareholders are cautioned against drawing any conclusions from the data contained therein, as past results are not necessarily indicative of future financial performance.
The performance graph below presents a comparison of the yearly percentage change in the cumulative total return on our common stock over the period from December 31, 2013 to December 31, 2018 , with the cumulative total return of the S&P 500 Index and the Dow Jones U.S. Exploration & Production Index, over the same period.
The graph assumes an investment of $100 (with reinvestment of all dividends) was invested on December 31, 2013, in our common stock at the closing market price at the beginning of this period and in each of the other two indexes.
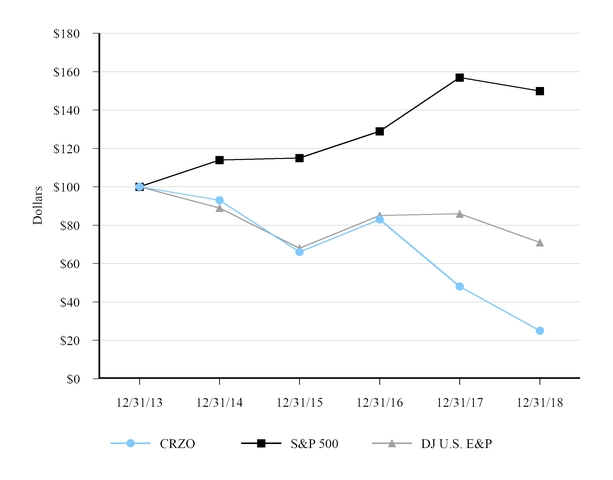
|
| CRZO |
| S&P 500 |
| DJ U.S. E&P |
December 31, 2013 |
| $100 |
| $100 |
| $100 |
December 31, 2014 |
| $93 |
| $114 |
| $89 |
December 31, 2015 |
| $66 |
| $115 |
| $68 |
December 31, 2016 |
| $83 |
| $129 |
| $85 |
December 31, 2017 |
| $48 |
| $157 |
| $86 |
December 31, 2018 |
| $25 |
| $150 |
| $71 |
See "Item 12. Security Ownership of Certain Beneficial Owners and Management and Related Shareholder Matters" for information regarding shares of common stock authorized for issuance under our stock incentive plans.
43
Item 6. Selected Financial Data
Our financial information set forth below for each of the five years in the period ended December 31, 2018 , has been derived from information included in our audited consolidated financial statements. This information should be read in conjunction with "Item 7. Management's Discussion and Analysis of Financial Condition and Results of Operations" and our Consolidated Financial Statements and related Notes included in "Item 8. Financial Statements and Supplementary Data."
| | Years Ended December 31, | ||||||||||||||||||
| | 2018 |
| 2017 |
| 2016 |
| 2015 |
| 2014 | ||||||||||
| | (In thousands, except per share amounts) | ||||||||||||||||||
Statements of Operations Information: | | | | | | | | | | | ||||||||||
Total revenues | | | $1,065,942 | | | | $745,888 | |
| | $443,594 | | | | $429,203 | | | | $710,187 | |
Total costs and expenses | | 656,342 | |
| 654,748 | |
| 1,119,068 | |
| 1,727,963 | |
| 359,977 | | |||||
Income (loss) from continuing operations | | 404,427 | |
| 87,110 | |
| (675,474 | ) |
| (1,157,885 | ) |
| 222,283 | | |||||
Net income (loss) attributable to common shareholders |
| 376,076 | |
| 78,467 | |
| (675,474 | ) |
| (1,155,154 | ) |
| 226,343 | | |||||
Income (loss) from continuing operations per common share: |
|
|
|
|
|
|
|
|
|
| ||||||||||
Basic | | | $4.73 | | | | $1.19 | | | | ($11.27 | ) | | | ($22.50 | ) | | | $4.90 | |
Diluted | | | $4.64 | | | | $1.18 | | | | ($11.27 | ) | | | ($22.50 | ) | | | $4.81 | |
Net income (loss) attributable to common shareholders per common share: |
|
|
|
|
|
|
|
|
|
| ||||||||||
Basic |
| | $4.40 | |
| | $1.07 | |
| | ($11.27 | ) |
| | ($22.45 | ) |
| | $4.99 | |
Diluted |
| | $4.32 | |
| | $1.06 | |
| | ($11.27 | ) |
| | ($22.45 | ) |
| | $4.90 | |
Weighted average common shares outstanding: |
|
|
|
|
|
|
|
|
|
| ||||||||||
Basic | | 85,509 | | | 73,421 | |
| 59,932 | | | 51,457 | | | 45,372 | | |||||
Diluted | | 87,143 | | | 73,993 | |
| 59,932 | | | 51,457 | | | 46,194 | | |||||
|
|
|
|
|
|
|
|
|
|
| ||||||||||
Statements of Cash Flows Information: | |
|
|
|
|
|
|
|
|
| ||||||||||
Net cash provided by operating activities from continuing operations | | | $653,555 | |
| | $422,981 | |
| | $272,768 | | | | $378,735 | | | | $502,275 | |
Net cash used in investing activities from continuing operations | | (795,968 | ) |
| (1,159,452 | ) |
| (619,832 | ) | | (673,376 | ) | | (940,676 | ) | |||||
Net cash provided by financing activities from continuing operations | | 135,155 | |
| 741,817 | |
| 308,340 | | | 330,767 | | | 300,290 | | |||||
|
|
|
|
|
|
|
|
|
|
| ||||||||||
Balance Sheet Information: | |
|
|
|
|
|
|
|
|
| ||||||||||
Total assets | | 3,185,100 | | | 2,778,304 | | | 1,626,327 | | | 2,007,246 | | | 2,962,305 | | |||||
Long-term debt | | 1,633,591 | | | 1,629,209 | | | 1,325,418 | | | 1,236,017 | | | 1,332,175 | | |||||
Preferred stock |
| 174,422 | |
| 214,262 | |
| - | |
| - | |
| - | | |||||
Total shareholders' equity | | 980,904 | | | 370,897 | | | 23,458 | | | 444,054 | | | 1,103,441 | | |||||
44
Item 7. Management's Discussion and Analysis of Financial Condition and Results of Operations
The following discussion and analysis of our financial condition and results of operations should be read in conjunction with our Consolidated Financial Statements and related Notes included in "Item 8. Financial Statements and Supplementary Data." The following discussion and analysis contains statements, including, but not limited to, statements relating to our plans, strategies, objectives, and expectations. Please see "Forward-Looking Statements" and "Item 1A. Risk Factors" for further details about these statements.
General Overview
Significant Developments in 2018
• | In the first quarter of 2018, we closed on divestitures of substantially all of our assets in the Niobrara Formation and a portion of our assets in the Eagle Ford for aggregate net proceeds of approximately $381.3 million. In addition, we could receive contingent consideration of $5.0 million per year if crude oil prices exceed specified thresholds for each of the years of 2018 through 2020 as part of the Niobrara divestiture. |
• | In the first quarter of 2018, we redeemed 50,000 shares of our 8.875% redeemable preferred stock (the "Preferred Stock"), representing 20% of the then issued and outstanding Preferred Stock, for $50.5 million. |
• | On July 11, 2018, we closed on the divestiture of certain non-operated assets in the Delaware Basin for aggregate net proceeds of $30.9 million . |
• | On August 17, 2018, we completed a public offering of 9.5 million shares of our common stock at a price per share of $22.55 . We used the proceeds of $213.7 million , net of offering costs, to fund the Devon Acquisition (described below) and for general corporate purposes. |
• | On October 17, 2018, we closed on the acquisition of oil and gas properties with Devon Energy Production Company, L.P. ("Devon"), a subsidiary of Devon Energy Corporation (the "Devon Acquisition"). The estimated aggregate net consideration of $196.6 million remains subject to post-closing adjustments. |
• | During 2018, our borrowing base increased from $830.0 million to $1.3 billion, with an elected commitment amount of $1.1 billion. |
• | In 2018, we fully redeemed the remaining $450.0 million aggregate principal amount outstanding of our 7.50% Senior Notes due 2020 (the "7.50% Senior Notes"). |
• | Our 2018 drilling, completion, and infrastructure ("DC&I") capital expenditures were $844.4 million, of which 62% was in the Eagle Ford with the remaining 38% in the Delaware Basin. The midpoint of our current 2019 DC&I capital expenditure plan of $550.0 million is approximately 35% lower than our 2018 actual DC&I capital expenditures. See "-Liquidity and Capital Resources- 2019 DC&I Capital Expenditure Plan and Funding Strategy" for additional details. |
Recent Developments
• | For the year ended December 31, 2018, the specified pricing thresholds related to the Contingent ExL Consideration, the Contingent Niobrara Consideration, and the Contingent Utica Consideration were exceeded. As a result, in January 2019, we paid $50.0 million and received $10.0 million from settlement of these contingent consideration arrangements. |
45
Results of Operations
Comparison of Results Between Years Ended December 31, 2018 and 2017 and Between Years Ended December 31, 2017 and 2016
Production volumes
The following table summarizes total production volumes and daily production volumes for the periods indicated:
|
| Years Ended December 31, |
| Amount Change Between |
| Percent Change Between | |||||||||||||||
|
| 2018 |
| 2017 |
| 2016 |
| 2018/2017 |
| 2017/2016 |
| 2018/2017 |
| 2017/2016 | |||||||
Total production volumes |
|
|
|
|
|
|
|
|
|
|
|
|
|
| |||||||
Crude oil (MBbls) |
| 14,232 | |
| 12,566 | |
| 9,423 | |
| 1,666 | |
| 3,143 | |
| 13 | % |
| 33 | % |
NGLs (MBbls) |
| 3,701 | |
| 2,327 | |
| 1,788 | |
| 1,374 | |
| 539 | |
| 59 | % |
| 30 | % |
Natural gas (MMcf) |
| 24,639 | |
| 28,472 | |
| 25,574 | |
| (3,833 | ) |
| 2,898 | |
| (13 | %) |
| 11 | % |
Total barrels of oil equivalent (MBoe) |
| 22,040 | |
| 19,639 | |
| 15,473 | |
| 2,401 | |
| 4,166 | |
| 12 | % |
| 27 | % |
|
|
|
|
|
|
|
|
|
|
|
|
|
|
| |||||||
Daily production volumes by product |
|
|
|
|
|
|
|
|
|
|
|
|
|
| |||||||
Crude oil (Bbls/d) |
| 38,992 | |
| 34,428 | |
| 25,745 | |
| 4,564 | |
| 8,683 | |
| 13 | % |
| 34 | % |
NGLs (Bbls/d) |
| 10,139 | |
| 6,376 | |
| 4,885 | |
| 3,763 | |
| 1,491 | |
| 59 | % |
| 31 | % |
Natural gas (Mcf/d) |
| 67,503 | |
| 78,006 | |
| 69,873 | |
| (10,503 | ) |
| 8,133 | |
| (13 | %) |
| 12 | % |
Total barrels of oil equivalent (Boe/d) |
| 60,382 | |
| 53,805 | |
| 42,276 | |
| 6,577 | |
| 11,529 | |
| 12 | % |
| 27 | % |
|
|
|
|
|
|
|
|
|
|
|
|
|
|
| |||||||
Daily production volumes by region (Boe/d) |
|
|
|
|
|
|
|
|
|
|
|
|
|
| |||||||
Eagle Ford |
| 37,591 | |
| 37,825 | |
| 30,664 | |
| (234 | ) |
| 7,161 | |
| (1 | %) |
| 23 | % |
Delaware Basin |
| 22,609 | |
| 6,713 | |
| 1,115 | |
| 15,896 | |
| 5,598 | |
| 237 | % |
| 502 | % |
Other |
| 182 | |
| 9,267 | |
| 10,497 | |
| (9,085 | ) |
| (1,230 | ) |
| (98 | %) |
| (12 | %) |
Total barrels of oil equivalent (Boe/d) |
| 60,382 | |
| 53,805 | |
| 42,276 | |
| 6,577 | |
| 11,529 | |
| 12 | % |
| 27 | % |
The increase in production volumes in 2018 as compared to 2017 is primarily due to production from new wells in the Delaware Basin, primarily drilled on properties from the ExL Acquisition, as well as in Eagle Ford, partially offset by the divestitures in Utica and Marcellus in the fourth quarter of 2017 and Niobrara and Eagle Ford in the first quarter of 2018 and normal production declines.
The increase in production volumes in 2017 as compared to 2016 is primarily due to production from new wells in the Eagle Ford and Delaware Basin and the addition of production from our acquisition of oil and gas properties located in the Eagle Ford Shale from Sanchez Energy Corporation and SN Cotulla Assets, LLC, a subsidiary of Sanchez Energy Corporation, in the fourth quarter of 2016 (the "Sanchez Acquisition") and the ExL Acquisition in the third quarter of 2017, partially offset by the divestitures in Utica and Marcellus in the fourth quarter of 2017 and normal production declines.
Average realized prices and revenues
The following table summarizes average realized prices and revenues for the periods indicated:
|
| Years Ended December 31, |
| Amount Change Between |
| Percent Change Between | ||||||||||||||||||||
|
| 2018 |
| 2017 |
| 2016 |
| 2018/2017 |
| 2017/2016 |
| 2018/2017 |
| 2017/2016 | ||||||||||||
Average realized prices |
|
|
|
|
|
|
|
|
|
|
|
|
|
| ||||||||||||
Crude oil ($ per Bbl) |
| | $64.05 | |
| | $50.39 | |
| | $40.12 | |
| | $13.66 | |
| | $10.27 | |
| 27 | % |
| 26 | % |
NGLs ($ per Bbl) |
| 26.10 | |
| 20.37 | |
| 12.54 | |
| 5.73 | |
| 7.83 | |
| 28 | % |
| 62 | % | |||||
Natural gas ($ per Mcf) |
| 2.35 | |
| 2.29 | |
| 1.69 | |
| 0.06 | |
| 0.60 | |
| 3 | % |
| 36 | % | |||||
Total average realized price ($ per Boe) |
| | $48.36 | |
| | $37.98 | |
| | $28.67 | |
| | $10.38 | |
| | $9.31 | |
| 27 | % |
| 32 | % |
|
|
|
|
|
|
|
|
|
|
|
|
|
|
| ||||||||||||
Revenues (In thousands) |
|
|
|
|
|
|
|
|
|
|
|
|
|
| ||||||||||||
Crude oil |
| | $911,554 | |
| | $633,233 | |
| | $378,073 | |
| | $278,321 | |
| | $255,160 | |
| 44 | % |
| 67 | % |
NGLs |
| 96,585 | |
| 47,405 | |
| 22,428 | |
| 49,180 | |
| 24,977 | |
| 104 | % |
| 111 | % | |||||
Natural gas |
| 57,803 | |
| 65,250 | |
| 43,093 | |
| (7,447 | ) |
| 22,157 | |
| (11 | %) |
| 51 | % | |||||
Total revenues |
| | $1,065,942 | |
| | $745,888 | |
| | $443,594 | |
| | $320,054 | |
| | $302,294 | |
| 43 | % |
| 68 | % |
The increase in revenues in 2018 as compared to 2017 is primarily due to higher crude oil prices and production.
The increase in revenues in 2017 as compared to 2016 is also primarily due to higher crude oil prices and production.
46
Lease operating expense
The following table summarizes lease operating expense for the periods indicated:
|
| Years Ended December 31, | ||||||||||||||||||||||
|
| 2018 |
| 2017 |
| 2016 | ||||||||||||||||||
|
| (In thousands, except per Boe amounts) | ||||||||||||||||||||||
|
| Amount |
| Per Boe |
| Amount |
| Per Boe |
| Amount |
| Per Boe | ||||||||||||
Lease operating expense |
| | $161,596 | |
| | $7.33 | |
| | $139,854 | |
| | $7.12 | |
| | $98,717 | |
| | $6.38 | |
The increase in lease operating expense in 2018 as compared to 2017 is primarily due to costs associated with increased production. The increase in lease operating expense per Boe between the periods is primarily due to processing fees for certain of our natural gas and NGL processing contracts that, effective January 1, 2018, are presented in lease operating expense as a result of the adoption of ASC 606 as well as an increased proportion of total production from crude oil properties, which have a higher operating cost per Boe than natural gas properties, as a result of the divestiture in Marcellus in the fourth quarter of 2017. These increases were partially offset by the increased proportion of production from properties acquired in the ExL Acquisition, which have lower operating costs per Boe than our other Delaware Basin and Eagle Ford properties.
The increase in lease operating expense in 2017 as compared to 2016 is primarily due to increased production and increased workover costs primarily on wells acquired in the Sanchez Acquisition. The increase in lease operating expense per Boe between the periods is primarily due to the workover costs described above as well as to an increased proportion of total production from crude oil properties, which have a higher operating cost per Boe than natural gas properties.
Production and ad valorem taxes
The following table summarizes production taxes and ad valorem taxes for the periods indicated:
|
| Years Ended December 31, | |||||||||||||||||||
|
| 2018 |
| 2017 |
| 2016 | |||||||||||||||
|
| (In thousands, except % of revenues amounts) | |||||||||||||||||||
|
| Amount |
| % of Revenues |
| Amount |
| % of Revenues |
| Amount |
| % of Revenues | |||||||||
Production taxes |
| | $50,591 | |
| 4.7 | % |
| | $32,509 | |
| 4.4 | % |
| | $19,046 | |
| 4.3 | % |
Ad valorem taxes |
| 10,422 | |
| 1.0 | % |
| 7,267 | |
| 1.0 | % |
| 5,559 | |
| 1.3 | % | |||
The increase in production taxes in 2018 as compared to 2017 is primarily due to the increase in crude oil and NGL revenues. The increase in production taxes as a percentage of revenues between the periods is due to the divestiture of substantially all of our assets in Marcellus in the fourth quarter of 2017, as our production in Marcellus was not subject to production taxes. The increase in ad valorem taxes in 2018 as compared to 2017 is due to new wells drilled in the Eagle Ford and new wells drilled or acquired in the Delaware Basin and higher property tax valuations as a result of the increase in crude oil prices, partially offset by a reduction in ad valorem taxes resulting from the divestitures discussed above.
The increase is production taxes in 2017 as compared to 2016 is primarily due to the increase in crude oil, NGL, and natural gas revenues. The increase in production taxes as a percentage of revenues between the periods is due primarily to a decreased proportion of total revenues attributable to Marcellus production, which is not subject to production taxes. The increase in ad valorem taxes in 2017 as compared to 2016 is due to new wells drilled in the Eagle Ford and Delaware Basin in 2016 and new wells acquired in the Sanchez Acquisition in December 2016. The decrease in ad valorem taxes as a percentage of revenue between the periods is primarily due to the timing of when wells are included in the ad valorem tax assessment as wells drilled and producing during 2017 would not be included in the ad valorem tax assessment until 2018.
47
Depreciation, depletion and amortization
The following table sets forth the components of our depreciation, depletion and amortization ("DD&A") expense for the periods indicated:
|
| Years Ended December 31, | ||||||||||||||||||||||
|
| 2018 |
| 2017 |
| 2016 | ||||||||||||||||||
|
| (In thousands, except per Boe amounts) | ||||||||||||||||||||||
|
| Amount |
| Per Boe |
| Amount |
| Per Boe |
| Amount |
| Per Boe | ||||||||||||
DD&A of proved oil and gas properties |
| | $295,044 | |
| | $13.39 | |
| | $257,057 | |
| | $13.09 | |
| | $208,849 | |
| | $13.50 | |
Depreciation of other property and equipment |
| 2,522 | |
| 0.11 | |
| 2,484 | |
| 0.13 | |
| 2,613 | |
| 0.17 | | ||||||
Amortization of other assets |
| 598 | |
| 0.03 | |
| 1,249 | |
| 0.06 | |
| 1,136 | |
| 0.07 | | ||||||
Accretion of asset retirement obligations |
| 1,366 | |
| 0.06 | |
| 1,799 | |
| 0.09 | |
| 1,364 | |
| 0.09 | | ||||||
DD&A |
| | $299,530 | |
| | $13.59 | |
| | $262,589 | |
| | $13.37 | |
| | $213,962 | |
| | $13.83 | |
DD&A expense for 2018 increased $36.9 million compared to 2017 . The increase in DD&A expense is attributable to increased production, as well as an increase in the DD&A rate per Boe. The increase in the DD&A rate per Boe is due primarily to an increase to proved oil and gas properties as a result of our ongoing capital expenditure program, partially offset by the reduction in proved oil and gas properties as a result of the divestitures in Niobrara and Eagle Ford in the first quarter of 2018 and an increase in proved oil and gas reserves.
DD&A expense for 2017 increased $48.6 million compared to 2016 . The increase in DD&A expense is attributable to increased production, partially offset by the decrease in the DD&A rate per Boe. The decrease in the DD&A rate per Boe is due primarily to impairments of our proved oil and gas properties recorded during 2016, reductions in estimated future development costs as a result of reduced service costs that occurred in the fourth quarter of 2016, and the addition of crude oil reserves in the fourth quarter of 2017, partially offset by the allocation to proved oil and gas properties related to the ExL Acquisition.
Impairment of proved oil and gas properties
Details of the 12-Month Average Realized Price of crude oil for 2018 , 2017 , and 2016 and impairments of proved oil and gas properties for 2016 are summarized in the table below:
|
| Years Ended December 31, | |||||||||
|
| 2018 |
| 2017 |
| 2016 | |||||
Impairment of proved oil and gas properties (In thousands) |
| | $- | |
| | $- | |
| $576,540 | |
Crude Oil 12-Month Average Realized Price ($/Bbl) - Beginning of period |
| $49.87 |
| $39.60 |
| $47.24 | |||||
Crude Oil 12-Month Average Realized Price ($/Bbl) - End of period |
| $63.80 |
| $49.87 |
| $39.60 | |||||
Crude Oil 12-Month Average Realized Price percentage increase (decrease) during period |
| 28 | % |
| 26 | % |
| (16 | %) | ||
We did not recognize impairments of proved oil and gas properties for the years ended December 31, 2018 and 2017 . Primarily due to declines in the 12-Month Average Realized Price of crude oil, we recognized impairments of proved oil and gas properties in 2016 .
General and administrative expense, net
The following table summarizes general and administrative expense, net for the periods indicated:
|
| Years Ended December 31, | ||||||||||
|
| 2018 |
| 2017 |
| 2016 | ||||||
|
| (In thousands) | ||||||||||
General and administrative expense, net |
| | $68,617 | |
| | $66,229 | |
| | $74,972 | |
The increase in general and administrative expense, net in 2018 as compared to 2017 is primarily due to an increase in personnel costs and higher annual bonuses awarded in the first quarter of 2018 compared to the first quarter of 2017.
The decrease in general and administrative expense, net in 2017 as compared to 2016 is primarily due to a decrease in stock-based compensation, net as a result of a decrease in the fair value of stock appreciation rights for 2017 due to exercises and expirations and a decrease in fair value of stock appreciation rights in 2017 as compared to an increase in the fair value of stock appreciation rights in 2016, partially offset by higher compensation costs for 2017 as compared to 2016, resulting from an increase in personnel as well as higher annual bonuses awarded in the first quarter of 2017 compared to the first quarter of 2016.
48
(Gain) loss on derivatives, net
The following table sets forth the components of our (gain) loss on derivatives, net for the periods indicated:
|
| Years Ended December 31, | ||||||||||
|
| 2018 |
| 2017 |
| 2016 | ||||||
|
| (In thousands) | ||||||||||
Crude oil derivative instruments |
| | ($9,726 | ) |
| | $22,839 | |
| | $23,609 | |
NGL derivative instruments |
| 4,439 | |
| 1,322 | |
| - | | |||
Natural gas derivative instruments |
| (421 | ) |
| (15,399 | ) |
| 19,584 | | |||
Deferred premium obligations |
| 1,875 | |
| 18,401 | |
| 5,880 | | |||
Contingent consideration arrangements |
| (2,876 | ) |
| 31,940 | |
| - | | |||
(Gain) loss on derivatives, net |
| | ($6,709 | ) |
| | $59,103 | |
| | $49,073 | |
The gain on derivatives, net in 2018 was primarily due to the downward shift in the futures curve of forecasted crude oil prices from January 1, 2018 to December 31, 2018 on crude oil derivative instruments outstanding at the beginning of 2018 as well as on our Contingent ExL Consideration and the downward shift in the futures curve of forecasted crude oil prices subsequent to contract executions of new crude oil derivative instruments. The gain was partially offset by deferred premium obligations incurred during 2018, the effect of the downward shift in the futures curve of forecasted crude oil prices mentioned above on our Contingent Niobrara Consideration and Contingent Utica Consideration, and the upward shift in crude oil and NGL settlement prices during the majority of 2018.
The loss on derivatives, net in 2017 was primarily due to the upward shift in the futures curve of forecasted crude oil and NGL prices subsequent to contract executions of new crude oil and NGL derivative instruments, as well as the upward shift in the futures curve of forecasted crude oil prices subsequent to the acquisition date related to the Contingent ExL Consideration. Additionally, we incurred approximately $18.4 million in deferred premium obligations during 2017. The loss was partially offset by the downward shift in the futures curve of forecasted crude oil and natural gas prices from January 1, 2017 to December 31, 2017 on crude oil and natural gas derivative instruments outstanding at the beginning of 2017.
The loss on derivatives, net in 2016 was primarily due to the upward shift in the futures curve of forecasted crude oil prices from January 1, 2016 to December 31, 2016 on crude oil derivative instruments outstanding at the beginning of 2016 as well as the upward shift in the futures curve of forecasted crude oil and natural gas prices subsequent to contract executions of new crude oil and natural gas derivative instruments. Additionally, we incurred approximately $5.9 million in deferred premium obligations during 2016.
Interest expense, net
The following table sets forth the components of our interest expense, net for the periods indicated:
|
| Years Ended December 31, | ||||||||||
|
| 2018 |
| 2017 |
| 2016 | ||||||
|
| (In thousands) | ||||||||||
Interest expense on Senior Notes |
| | $73,534 | |
| | $95,272 | |
| | $85,819 | |
Interest expense on revolving credit facility |
| 20,910 | |
| 8,293 | |
| 3,907 | | |||
Amortization of debt issuance costs, premiums, and discounts |
| 4,077 | |
| 4,529 | |
| 5,565 | | |||
Other interest expense |
| 531 | |
| 1,029 | |
| 1,138 | | |||
Capitalized interest |
| (36,639 | ) |
| (28,253 | ) |
| (17,026 | ) | |||
Interest expense, net |
| | $62,413 | |
| | $80,870 | |
| | $79,403 | |
The decrease in interest expense, net in 2018 as compared to 2017 is primarily due to reduced interest expense as a result of the redemptions of the 7.50% Senior Notes in the fourth quarter of 2017 and the first and fourth quarters of 2018 as well as an increase in capitalized interest as a result of higher average balances of unevaluated leasehold and seismic costs for 2018 as compared to 2017, primarily due to the ExL Acquisition in the third quarter of 2017 and the Devon Acquisition in the fourth quarter of 2018. The decrease was partially offset by interest expense on $250.0 million aggregate principal amount of our 8.25% Senior Notes that were issued in the third quarter of 2017 and increased borrowings and associated interest expense on our revolving credit facility for 2018 as compared to 2017.
The increase in interest expense, net in 2017 as compared to 2016 is primarily due to interest expense on the $250.0 million aggregate principal amount of our 8.25% Senior Notes that were issued in the third quarter of 2017 and an increase in interest expense on our revolving credit facility as a result of increased borrowings in 2017 as compared to 2016, partially offset by an
49
increase in capitalized interest as a result of higher average balances of unevaluated leasehold and seismic costs for 2017 as compared to 2016, primarily due to the ExL Acquisition in the third quarter of 2017.
Loss on extinguishment of debt
As a result of our redemption of $450.0 million aggregate principal amount of our 7.50% Senior Notes in 2018 , we recorded a loss on extinguishment of debt of $9.6 million for the year ended December 31, 2018 , which included redemption premiums of $6.0 million paid to redeem the notes and non-cash charges of $3.6 million attributable to the write-off of unamortized premium and debt issuance costs.
As a result of our redemption of $150.0 million aggregate principal amount of our 7.50% Senior Notes in 2017 , we recorded a loss on extinguishment of debt of $4.2 million for the year ended December 31, 2017 , which included a redemption premium of $2.8 million paid to redeem the notes and non-cash charges of $1.4 million attributable to the write-off of unamortized premium and debt issuance costs.
Income taxes and deferred tax assets valuation allowance
The effective income tax rate for the years ended December 31, 2018, 2017, and 2016 was 1.3% , 4.4% , and 0.0%, respectively, which were nominal as a result of maintaining a full valuation allowance against our net deferred tax assets. For the years ended December 31, 2018 and 2017, we recognized income tax expense of $5.2 million and $4.0 million, respectively, related to the Texas franchise tax due to an increase in the apportionment of income to the state of Texas as a result of our divestitures in the fourth quarter of 2017 and first quarter of 2018.
For the year ended December 31, 2016, the effective income tax rate was 0.0% as a result of a full valuation allowance against our net deferred tax assets driven by the impairments of proved oil and gas properties we recognized beginning in the third quarter of 2015 and continuing through the third quarter of 2016.
For each of the years ended December 31, 2018, 2017, and 2016, we maintained a full valuation allowance against our deferred tax assets based on our conclusion, considering all available evidence (both positive and negative), that it was more likely than not that the deferred tax assets would not be realized. A significant item of objective negative evidence considered was the cumulative pre-tax loss incurred over the three-year period ended December 31, 2018, primarily due to impairments of proved oil and gas properties recognized in the first three quarters of 2016, which limits our ability to consider subjective positive evidence, such as its projections of future taxable income.
Dividends on preferred stock
For the years ended December 31, 2018 and 2017 , we declared and paid cash dividends of $18.2 million and $7.8 million , respectively, on our Preferred Stock. There were no dividends on our Preferred Stock for the year ended December 31, 2016.
Loss on redemption of preferred stock
During the first quarter of 2018, we redeemed 50,000 shares of Preferred Stock, representing 20% of the issued and outstanding Preferred Stock, for $50.5 million, consisting of the $50.0 million redemption price and $0.5 million accrued and unpaid dividends. We recognized a $7.1 million loss on the redemption due to the excess of the $50.0 million redemption price over the $42.9 million redemption date carrying value of the Preferred Stock.
50
Liquidity and Capital Resources
2019 DC&I Capital Expenditure Plan and Funding Strategy. Our 2019 DC&I capital expenditure plan is $525.0 million to $575.0 million , of which approximately 59% is allocated to the Eagle Ford and the remaining 41% is allocated to the Delaware Basin. We currently intend to finance our 2019 DC&I capital expenditure plan primarily from the sources described below under "-Sources and Uses of Cash." Our capital program could vary depending upon various factors, including, but not limited to, the availability of drilling rigs and completion crews, the cost of completion services, acquisitions and divestitures of oil and gas properties, land and industry partner issues, our available cash flow and financing, success of drilling programs, weather delays, commodity prices, market conditions, the acquisition of leases with drilling commitments and other factors. The following is a summary of our 2018 capital expenditures:
| Three Months Ended |
| Year Ended | ||||||||||||||||
| March 31, 2018 |
| June 30, 2018 |
| September 30, 2018 |
| December 31, 2018 |
| December 31, 2018 | ||||||||||
| (In thousands) | ||||||||||||||||||
DC&I |
|
|
|
|
|
|
|
|
| ||||||||||
Eagle Ford | | $135,677 | |
| | $101,249 | |
| | $149,386 | |
| | $136,644 | |
| | $522,956 | |
Delaware Basin | 73,892 | |
| 116,743 | |
| 91,761 | |
| 38,768 | |
| 321,164 | | |||||
Other | 284 | |
| - | |
| - | |
| - | |
| 284 | | |||||
Total DC&I | 209,853 | |
| 217,992 | |
| 241,147 | |
| 175,412 | |
| 844,404 | | |||||
Leasehold and seismic | 5,520 | |
| 6,129 | |
| 6,668 | |
| 4,034 | |
| 22,351 | | |||||
Total (1) | | $215,373 | |
| | $224,121 | |
| | $247,815 | |
| | $179,446 | |
| | $866,755 | |
|
(1) | Capital expenditures exclude acquisitions of oil and gas properties, capitalized general and administrative expense, interest expense and asset retirement costs. |
Sources and Uses of Cash. Our primary use of cash is related to our DC&I capital expenditures and, to a lesser extent, our leasehold and seismic capital expenditures. For the year ended December 31, 2018 , we funded our capital expenditures with cash provided by operations and borrowings under our revolving credit facility. Potential sources of future liquidity include the following:
• | Cash provided by operations. Cash flows from operations are highly dependent on crude oil prices. As such, we hedge a portion of our forecasted production to reduce our exposure to commodity price volatility in order to achieve a more predictable level of cash flows. |
• | Borrowings under revolving credit facility . As of February 22, 2019 , our revolving credit facility had a borrowing base of $1.3 billion , with an elected commitment amount of $1.1 billion , and $819.0 million of borrowings outstanding. The amount we are able to borrow is subject to compliance with the financial covenants and other provisions of the credit agreement governing our revolving credit facility. |
• | Securities offerings . As situations or conditions arise, we may choose to issue debt, equity or other securities to supplement our cash flows. However, we may not be able to obtain such financing on terms that are acceptable to us, or at all. See "Note 10. Shareholders' Equity" of the Notes to our Consolidated Financial Statements for details of our August 2018 common stock offering. |
• | Divestitures . We may consider divesting certain properties or assets that are not part of our core business or are no longer deemed essential to our future growth, provided we are able to divest such assets on terms that are acceptable to us. See "Note 3. Acquisitions and Divestitures of Oil and Gas Properties" of the Notes to our Consolidated Financial Statements for further details. |
• | Joint ventures . Joint ventures with third parties through which such third parties fund a portion of our exploration activities to earn an interest in our exploration acreage or purchase a portion of interests, or both. |
Overview of Cash Flow Activities. Net cash provided by operating activities was $653.6 million, $423.0 million and $272.8 million for the years ended December 31, 2018, 2017 and 2016 , respectively. The increase from 2017 to 2018 was driven primarily by an increase in revenues as a result of higher crude oil prices and higher crude oil production and a decrease in working capital requirements, partially offset by an increase in the net cash paid for derivative settlements and an increase in operating expenses and cash general and administrative expense. The increase from 2016 to 2017 was driven primarily by an increase in revenues as a result of higher production and commodity prices and a decrease in working capital requirements, partially offset by a decrease in the net cash received from derivative settlements and an increase in operating expenses and cash general and administrative expense.
Net cash used in investing activities was $796.0 million, $1.2 billion and $619.8 million for the years ended December 31, 2018, 2017 and 2016 , respectively. The decrease from 2017 to 2018 was primarily due to a decrease in cash payments for acquisitions
51
of oil and gas properties, as well as cash received from the divestitures in Niobrara and Eagle Ford in early 2018, partially offset by an increase in capital expenditures as a result of our ongoing DC&I activity in Eagle Ford and the Delaware Basin. The increase from 2016 to 2017 was due primarily to funding the ExL Acquisition and increased capital expenditures, primarily in the Eagle Ford Shale and the Delaware Basin, partially offset by increased net proceeds from divestitures of oil and gas properties, which primarily related to the divestitures of substantially all of our assets in the Marcellus Shale and Utica Shale as well as deposits received in connection with the divestitures of a portion of our assets in the Eagle Ford Shale and substantially all of our assets in the Niobrara.
Net cash provided by financing activities for the years ended December 31, 2018, 2017 and 2016 was $135.2 million, $741.8 million and $308.3 million, respectively. The decrease from 2017 to 2018 was primarily due to payments for the redemptions of our 7.50% Senior Notes and Preferred Stock, decreased cash provided by the issuance of senior notes and Preferred Stock in 2017, and increased cash dividends paid on the Preferred Stock, partially offset by increased borrowings, net of repayments under our revolving credit facility. The increase from 2016 to 2017 was due to net proceeds related to the issuance of the 8.25% Senior Notes, the sale of Preferred Stock, the sale of common stock, and increased borrowings net of repayments under our revolving credit facility in 2017 as compared to 2016, partially offset by the redemption of $150.0 million of the 7.50% Senior Notes, increased debt issuance costs related to the amendments to the credit agreement governing the revolving credit facility and dividends paid on the Preferred Stock.
Liquidity/Cash Flow Outlook . Economic downturns may adversely affect our ability to access capital markets in the future. Cash flows from operations are primarily driven by crude oil production, crude oil prices, and settlements of our crude oil derivatives. We currently believe that cash flows from operations and borrowings under our revolving credit facility will provide adequate financial flexibility and will be sufficient to fund our immediate cash flow requirements.
• | Revolving credit facility. The borrowing base under our revolving credit facility is affected by assumptions of the administrative agent with respect to, among other things, crude oil and, to a lesser extent, natural gas prices. Our borrowing base may decrease if our administrative agent reduces the crude oil and natural gas prices from those used to determine our existing borrowing base. See "-Sources and Uses of Cash-Borrowings under revolving credit facility" and "-Financing Arrangements-Senior Secured Revolving Credit Facility" for further details of our revolving credit facility. |
• | Contingent consideration arrangements. As part of the ExL Acquisition, as well as in each of the divestitures of our assets in Niobrara, Marcellus, and Utica, we agreed to contingent consideration arrangements, where we will receive or be required to pay certain amounts if commodity prices are greater than specified thresholds. For the year ended December 31, 2018, the specified pricing thresholds related to the Contingent ExL Consideration, the Contingent Niobrara Consideration, and the Contingent Utica Consideration were exceeded. As a result, in January 2019, we paid $50.0 million and received $10.0 million from settlement of these contingent consideration arrangements. See "Note 12. Derivative Instruments" of the Notes to our Consolidated Financial Statements for further details of each of these contingent consideration arrangements and "Item 7A. Qualitative and Quantitative Disclosures about Market Risk" for details of the sensitivities to commodity price for each contingent consideration arrangement. |
• | Commodity derivative instruments. We use commodity derivative instruments to mitigate the effects of commodity price volatility for a portion of our forecasted sales of production and achieve a more predictable level of cash flow. |
52
As of February 22, 2019 , we had the following outstanding commodity derivative instruments at weighted average contract volumes and prices:
Commodity |
| Period |
| Type of Contract |
| Index |
| Volumes |
| Fixed Price ($ per Bbl) |
| Sub-Floor |
| Floor Price |
| Ceiling Price |
| Fixed Price | |||||||||||
Crude oil |
| 1Q19 |
| Three-Way Collars |
| NYMEX WTI |
| 27,000 | |
| - | |
| | $41.67 | |
| | $50.96 | |
| | $74.23 | |
| - | | ||
Crude oil |
| 1Q19 |
| Basis Swaps |
| LLS-WTI Cushing |
| 6,000 | |
| - | |
| - | |
| - | |
| - | |
| | $5.16 | | ||||
Crude oil |
| 1Q19 |
| Basis Swaps |
| WTI Midland-WTI Cushing |
| 5,500 | |
| - | |
| - | |
| - | |
| - | |
| | ($5.24 | ) | ||||
Crude oil |
| 1Q19 |
| Sold Call Options |
| NYMEX WTI |
| 3,875 | |
| - | |
| - | |
| - | |
| | $81.07 | |
| - | | ||||
|
|
|
|
|
|
|
|
|
|
|
|
|
|
|
|
|
|
| |||||||||||
Crude oil |
| 2Q19 |
| Three-Way Collars |
| NYMEX WTI |
| 27,000 | |
| - | |
| | $41.67 | |
| | $50.96 | |
| | $74.23 | |
| - | | ||
Crude oil |
| 2Q19 |
| Basis Swaps |
| LLS-WTI Cushing |
| 6,000 | |
| - | |
| - | |
| - | |
| - | |
| | $5.16 | | ||||
Crude oil |
| 2Q19 |
| Basis Swaps |
| WTI Midland-WTI Cushing |
| 6,000 | |
| - | |
| - | |
| - | |
| - | |
| | ($5.38 | ) | ||||
Crude oil |
| 2Q19 |
| Sold Call Options |
| NYMEX WTI |
| 3,875 | |
| - | |
| - | |
| - | |
| | $81.07 | |
| - | | ||||
|
|
|
|
|
|
|
|
|
|
|
|
|
|
|
|
|
|
| |||||||||||
Crude oil |
| 3Q19 |
| Three-Way Collars |
| NYMEX WTI |
| 27,000 | |
| - | |
| | $41.67 | |
| | $50.96 | |
| | $74.23 | |
| - | | ||
Crude oil |
| 3Q19 |
| Basis Swaps |
| LLS-WTI Cushing |
| 6,000 | |
| - | |
| - | |
| - | |
| - | |
| | $5.16 | | ||||
Crude oil |
| 3Q19 |
| Basis Swaps |
| WTI Midland-WTI Cushing |
| 7,000 | |
| - | |
| - | |
| - | |
| - | |
| | ($5.56 | ) | ||||
Crude oil |
| 3Q19 |
| Sold Call Options |
| NYMEX WTI |
| 3,875 | |
| - | |
| - | |
| - | |
| | $81.07 | |
| - | | ||||
|
|
|
|
|
|
|
|
|
|
|
|
|
|
|
|
|
|
| |||||||||||
Crude oil |
| 4Q19 |
| Three-Way Collars |
| NYMEX WTI |
| 27,000 | |
| - | |
| | $41.67 | |
| | $50.96 | |
| | $74.23 | |
| - | | ||
Crude oil |
| 4Q19 |
| Basis Swaps |
| LLS-WTI Cushing |
| 6,000 | |
| - | |
| - | |
| - | |
| - | |
| | $5.16 | | ||||
Crude oil |
| 4Q19 |
| Basis Swaps |
| WTI Midland-WTI Cushing |
| 11,000 | |
| - | |
| - | |
| - | |
| - | |
| | ($3.84 | ) | ||||
Crude oil |
| 4Q19 |
| Sold Call Options |
| NYMEX WTI |
| 3,875 | |
| - | |
| - | |
| - | |
| | $81.07 | |
| - | | ||||
|
|
|
|
|
|
|
|
|
|
|
|
|
|
|
|
|
|
| |||||||||||
Crude oil |
| 2020 |
| Price Swaps |
| NYMEX WTI |
| 3,000 | |
| | $55.06 | |
| - | |
| - | |
| - | |
| - | | ||||
Crude oil |
| 2020 |
| Three-Way Collars |
| NYMEX WTI |
| 6,000 | |
| - | |
| | $45.00 | |
| | $55.00 | |
| | $64.69 | |
| - | | ||
Crude oil |
| 2020 |
| Basis Swaps |
| WTI Midland-WTI Cushing |
| 13,000 | |
| - | |
| - | |
| - | |
| - | |
| | ($1.27 | ) | ||||
Crude oil |
| 2020 |
| Sold Call Options |
| NYMEX WTI |
| 4,575 | |
| - | |
| - | |
| - | |
| | $75.98 | |
| - | | ||||
|
|
|
|
|
|
|
|
|
|
|
|
|
|
|
|
|
|
| |||||||||||
Crude oil |
| 2021 |
| Basis Swaps |
| WTI Midland-WTI Cushing |
| 6,000 | |
| - | |
| - | |
| - | |
| - | |
| | $0.03 | | ||||
Commodity |
| Period |
| Type of Contract |
| Index |
| Volumes (MMBtu per day) |
| Fixed Price ($ per MMBtu) |
| Sub-Floor Price ($ per MMBtu) |
| Floor Price ($ per MMBtu) |
| Ceiling Price ($ per MMBtu) |
| Fixed Price Differential ($ per MMBtu) | |||||||
Natural gas |
| 1Q19 |
| Sold Call options |
| NYMEX Henry Hub |
| 33,000 | |
| - | |
| - | |
| - | |
| | $3.25 | |
| - | |
|
|
|
|
|
|
|
|
|
|
|
|
|
|
|
|
|
|
| |||||||
Natural gas |
| 2Q19 |
| Sold Call options |
| NYMEX Henry Hub |
| 33,000 | |
| - | |
| - | |
| - | |
| | $3.25 | |
| - | |
|
|
|
|
|
|
|
|
|
|
|
|
|
|
|
|
|
|
| |||||||
Natural gas |
| 3Q19 |
| Sold Call options |
| NYMEX Henry Hub |
| 33,000 | |
| - | |
| - | |
| - | |
| | $3.25 | |
| - | |
|
|
|
|
|
|
|
|
|
|
|
|
|
|
|
|
|
|
| |||||||
Natural gas |
| 4Q19 |
| Sold Call options |
| NYMEX Henry Hub |
| 33,000 | |
| - | |
| - | |
| - | |
| | $3.25 | |
| - | |
|
|
|
|
|
|
|
|
|
|
|
|
|
|
|
|
|
|
| |||||||
Natural gas |
| 2020 |
| Sold Call options |
| NYMEX Henry Hub |
| 33,000 | |
| - | |
| - | |
| - | |
| | $3.50 | |
| - | |
53
Credit Ratings. Our ability to borrow money will be impacted by several factors, including our credit ratings. Credit ratings agencies perform independent analyses when assigning credit ratings. A downgrade of our credit rating could increase our future cost of borrowing, thereby negatively affecting our available liquidity. The following table presents our credit ratings as of February 22, 2019:
|
| Credit Rating |
Standard and Poor's |
|
|
Corporate Credit Rating |
| B+ |
Senior Unsecured Debt Rating |
| B+ |
Outlook |
| Stable |
|
| |
Moody's Investors Service |
|
|
Corporate Credit Rating |
| B1 |
Senior Unsecured Debt Rating |
| B2 |
Outlook |
| Stable |
If cash flows from operations and borrowings under our revolving credit facility and the other sources of cash described under "-Sources and Uses of Cash" are insufficient to fund our remaining 2019 DC&I capital expenditure plan, we may need to reduce our capital expenditure plan or seek other financing alternatives. We may not be able to obtain financing needed in the future on terms that would be acceptable to us, or at all. If we cannot obtain adequate financing, we may be required to limit or defer a portion of our remaining 2019 DC&I capital expenditure plan, thereby potentially adversely affecting the recoverability and ultimate value of our oil and gas properties. Based on existing market conditions and our expected liquidity needs, among other factors, we may use a portion of our cash flows from operations, proceeds from divestitures, securities offerings or borrowings to reduce debt prior to scheduled maturities through debt repurchases, either in the open market or in privately negotiated transactions, through debt redemptions or tender offers, or through repayments of bank borrowings.
Contractual Obligations
The following table sets forth estimates of our contractual obligations as of December 31, 2018 (In thousands):
| 2019 |
| 2020 |
| 2021 |
| 2022 |
| 2023 |
| 2024 and Thereafter |
| Total | ||||||||||||||
Long-term debt (1) | | $- | |
| | $- | |
| | $- | |
| | $744,431 | |
| | $650,000 | |
| | $250,000 | |
| | $1,644,431 | |
Cash interest on senior notes (2) | 61,250 | |
| 61,250 | |
| 61,250 | |
| 61,250 | |
| 40,938 | |
| 41,250 | |
| 327,188 | | |||||||
Cash interest and commitment fees on revolving credit facility (3) | 32,839 | |
| 32,839 | |
| 32,839 | |
| 11,311 | |
| - | |
| - | |
| 109,828 | | |||||||
Operating leases | 10,024 | |
| 9,154 | |
| 6,249 | |
| 3,639 | |
| 3,680 | |
| 20,978 | |
| 53,724 | | |||||||
Drilling rig contracts (4) | 37,077 | |
| 16,867 | |
| 813 | |
| - | |
| - | |
| - | |
| 54,757 | | |||||||
Delivery commitments (5) | 3,726 | |
| 2,807 | |
| 2,487 | |
| 30 | |
| 7 | |
| 19 | |
| 9,076 | | |||||||
Produced water disposal commitments (6) | 18,139 | |
| 20,894 | |
| 20,898 | |
| 20,954 | |
| 10,471 | |
| 9,769 | |
| 101,125 | | |||||||
Asset retirement obligations and other (7) | 4,537 | |
| 1,898 | |
| 378 | |
| 270 | |
| 152 | |
| 17,623 | |
| 24,858 | | |||||||
Total Contractual Obligations | | $167,592 | |
| | $145,709 | |
| | $124,914 | |
| | $841,885 | |
| | $705,248 | |
| | $339,639 | |
| | $2,324,987 | |
|
(1) | Long-term debt consists of the principal amounts of the 6.25% Senior Notes due 2023, the 8.25% Senior Notes due 2025, and borrowings outstanding under our revolving credit facility which matures in 2022. |
(2) | Cash interest on senior notes includes cash payments for interest on the 6.25% Senior Notes due 2023 and the 8.25% Senior Notes due 2025. |
(3) | Cash interest on our revolving credit facility was calculated using the weighted average interest rate of the outstanding borrowings under the revolving credit facility as of December 31, 2018 of 4.17% . Commitment fees on our revolving credit facility were calculated based on the unused portion of lender commitments as of December 31, 2018 , at the applicable commitment fee rate of 0.500%. |
(4) | Drilling rig contracts represent gross contractual obligations and accordingly, other joint owners in the properties operated by us will generally be billed for their working interest share of such costs. As of December 31, 2018, early termination of these contracts would have resulted in termination penalties of $29.8 million, which would be in lieu of paying the remaining commitments presented in the table above, and are generally not billed to joint owners. For the years ended December 31, 2018 and 2017 , we did not incur any termination penalties. For the year ended December 31, 2016 , we incurred $1.8 million of termination penalties which were recorded to other expense, net. |
(5) | Delivery commitments represent contractual obligations we have entered into for certain gathering, processing and transportation service agreements which require minimum volumes of natural gas to be delivered. The amounts in the table above reflect the aggregate undiscounted deficiency fees assuming no delivery of any natural gas. For the years ended December 31, 2018 , 2017 and 2016 , we paid |
54
deficiency fees in the amount of $2.0 million, $1.4 million, and $1.4 million, respectively, which were recorded to lease operating expense when incurred. However, as of the filing of this report, we do not expect any material shortfalls in our delivery commitments.
(6) | Produced water disposal commitments represent contractual obligations we have entered into for certain service agreements which require minimum volumes of produced water to be delivered. The amounts in the table above reflect the aggregate undiscounted deficiency fees assuming no delivery of any produced water. For the years ended December 31, 2018 , 2017 and 2016 , we were not required to pay any deficiency fees. Additionally, as of the filing of this report, we do not expect any material shortfalls in our produced water disposal commitments. |
(7) | Asset retirement obligations and other are based on estimates and assumptions that affect the reported amounts as of December 31, 2018 . Certain of such estimates and assumptions are inherently unpredictable and will differ from actual results. See "Note 2. Summary of Significant Accounting Policies" of the Notes to our Consolidated Financial Statements for further discussion of estimates and assumptions that may affect the reported amounts. |
Off Balance Sheet Arrangements
We currently have no off balance sheet arrangements.
Financing Arrangements
Senior Secured Revolving Credit Facility
We have a senior secured revolving credit facility with a syndicate of banks that, as of December 31, 2018 , had a borrowing base of $1.3 billion , with an elected commitment amount of $1.1 billion , and $744.4 million of borrowings outstanding at a weighted average interest rate of 4.17% . The credit agreement governing our senior secured revolving credit facility provides for interest-only payments until May 4, 2022, when the credit agreement matures and any outstanding borrowings are due.
On January 31, 2018, as a result of the divestiture in the Eagle Ford Shale, the borrowing base under the senior secured revolving credit facility was reduced from $900.0 million to $830.0 million, however, the elected commitment amount remained unchanged at $800.0 million.
On May 4, 2018, we entered into the twelfth amendment to the credit agreement governing the revolving credit facility to, among other things, increase the borrowing base and elected commitment amount, reduce the margins applied to Eurodollar and base rate loans, and amend the covenant limiting payment of dividends and distributions on equity to increase our ability to make dividends and distributions on our equity interests.
On October 29, 2018, we entered into the thirteenth amendment to the credit agreement governing the revolving credit facility to, among other things, increase the borrowing base and elected commitment amount and reduce the margins applied to Eurodollar and base rate loans.
See "Note 6. Long-Term Debt" of the Notes to our Consolidated Financial Statements for additional details of the twelfth and thirteenth amendments, rates of interest on outstanding borrowings, commitment fees on the unused portion of lender commitments, and the financial covenants we are subject to under the terms of the credit agreement.
Redemptions of 7.50% Senior Notes
During the fourth quarter of 2017, we redeemed $150.0 million of the outstanding aggregate principal amount of our 7.50% Senior Notes at a price equal to 101.875% of par, plus accrued and unpaid interest. We paid $156.0 million upon the redemption, which included a redemption premium of $2.8 million and accrued and unpaid interest of $3.2 million. As a result of the redemption, we recorded a loss on extinguishment of debt of $4.2 million, which included the redemption premium of $2.8 million and the write-off of associated unamortized premiums and debt issuance costs of $1.4 million.
During the first and fourth quarters of 2018, we redeemed the remaining $320.0 million of the outstanding aggregate principal amount of our 7.50% Senior Notes at a price equal to 101.875% of par and the remaining $130.0 million outstanding aggregate principal amount at a redemption price of 100% of par, respectively, both plus accrued and unpaid interest. We paid a total of $468.6 million upon the redemptions, which included redemption premiums of $6.0 million and accrued and unpaid interest of $12.6 million . As a result of the redemptions, we recorded a loss on extinguishment of debt of $9.6 million , which included the redemption premiums of $6.0 million and the write-off of associated unamortized premiums and debt issuance costs of $3.6 million .
Redemption of Preferred Stock
During the first quarter of 2018, we redeemed 50,000 shares of Preferred Stock, representing 20% of the issued and outstanding Preferred Stock, for $50.5 million , consisting of the $50.0 million redemption price and $0.5 million accrued and unpaid dividends. We recognized a $7.1 million loss on the redemption due to the excess of the $50.0 million redemption price over the $42.9 million redemption date carrying value of the Preferred Stock.
55
Redemption of Other Long-Term Debt
During the second quarter of 2018, we redeemed the remaining $4.4 million outstanding principal amount of our 4.375% Convertible Senior Notes due 2028 at a price equal to 100% of par. Upon redemption, we paid $4.5 million , which included accrued and unpaid interest of $0.1 million .
Common Stock Offering
On August 17, 2018, we completed a public offering of 9.5 million shares of our common stock at a price per share of $22.55 . We used the net proceeds of $213.7 million , net of offering costs, to fund the Devon Acquisition and for general corporate purposes.
Summary of Critical Accounting Policies
The following summarizes our critical accounting policies. See a complete list of significant accounting policies in "Note 2. Summary of Significant Accounting Policies" of the Notes to our Consolidated Financial Statements.
Use of Estimates
The preparation of financial statements in conformity with GAAP requires management to make estimates and assumptions that affect the reported amounts of assets and liabilities and disclosures of contingent assets and liabilities at the date of the financial statements and the reported amounts of revenues and expenses during the periods reported. Certain of such estimates and assumptions are inherently unpredictable and will differ from actual results. We evaluate subsequent events through the date the financial statements are issued.
Significant estimates include volumes of proved oil and gas reserves, which are used in calculating DD&A of proved oil and gas property costs, the present value of estimated future net revenues included in the full cost ceiling test, estimates of future taxable income used in assessing the realizability of deferred tax assets, and the estimated costs and timing of cash outflows underlying asset retirement obligations. Oil and gas reserve estimates, and therefore calculations based on such reserve estimates, are subject to numerous inherent uncertainties, the accuracy of which, is a function of the quality and quantity of available data, the application of engineering and geological interpretation and judgment to available data and the interpretation of mineral leaseholds and other contractual arrangements, including adequacy of title and drilling requirements. These estimates also depend on assumptions regarding quantities and production rates of recoverable oil and gas reserves, oil and gas prices, timing and amounts of development costs and operating expenses, all of which will vary from those assumed in our estimates. Other significant estimates are involved in determining acquisition date fair values of assets acquired and liabilities assumed, impairments of unevaluated leasehold costs, fair values of commodity derivative assets and liabilities, fair values of contingent consideration arrangements, preferred stock fair value upon issuance, grant date fair value of stock-based awards, and evaluating disputed claims, interpreting contractual arrangements and contingencies. Estimates are based on current assumptions that may be materially affected by the results of subsequent drilling and completion, testing and production as well as subsequent changes in oil and gas prices, interest rates and the market value and volatility of our common stock.
Oil and Gas Properties
Oil and gas properties are accounted for using the full cost method of accounting under which all productive and nonproductive costs directly associated with property acquisition, exploration and development activities are capitalized to cost centers established on a country-by-country basis. The internal cost of employee compensation and benefits, including stock-based compensation, directly associated with acquisition, exploration and development activities are capitalized to either proved or unproved oil and gas properties based on the type of activity. Internal costs related to production, general corporate overhead and similar activities are expensed as incurred.
Capitalized oil and gas property costs within a cost center are amortized on an equivalent unit-of-production method, converting natural gas to barrels of oil equivalent at the ratio of six thousand cubic feet of gas to one barrel of oil, which represents their approximate relative energy content. The equivalent unit-of-production amortization rate is computed on a quarterly basis by dividing current quarter production by proved oil and gas reserves at the beginning of the quarter then applying such amortization rate to proved oil and gas property costs, which includes estimated asset retirement costs, less accumulated amortization, plus the estimated future expenditures (based on current costs) to be incurred in developing proved reserves, net of estimated salvage values.
Unproved properties, not being amortized, include unevaluated leasehold and seismic costs associated with specific unevaluated properties and related capitalized interest. Individually significant unevaluated leaseholds are assessed on a quarterly basis to determine whether or not and to what extent proved reserves have been assigned to the properties or if an impairment has occurred, in which case the related costs along with associated capitalized interest are reclassified to proved oil and gas properties. Factors we consider in our impairment assessment include drilling results by us and other operators, the terms of oil and gas leases not held by production and DC&I capital expenditure plans. Individually insignificant unevaluated leaseholds are grouped by major area and added to proved oil and gas properties based on the average primary lease term of the properties. Geological and
56
geophysical costs not associated with specific prospects are recorded to proved oil and gas property costs as incurred. The amount of interest costs capitalized is determined on a quarterly basis based on the average balance of unproved properties and the weighted average interest rate of outstanding borrowings.
Proceeds from the sale of proved and unproved oil and gas properties are recognized as a reduction of proved oil and gas property costs with no gain or loss recognized, unless the sale significantly alters the relationship between capitalized costs and proved reserves of oil and gas attributable to a cost center. For the years ended December 31, 2018 , 2017 and 2016 , we did not have any sales of oil and gas properties that significantly altered such relationship.
Impairment of Proved Oil and Gas Properties
At the end of each quarter, the net book value of oil and gas properties, less related deferred income taxes, are limited to the "cost center ceiling" equal to (i) the sum of (a) the present value of estimated future net revenues from proved oil and gas reserves, less estimated future expenditures to be incurred in developing and producing the proved reserves computed using a discount factor of 10% , (b) the costs of unproved properties not being amortized, and (c) the lower of cost or estimated fair value of unproved properties included in the costs being amortized; less (ii) related income tax effects. Any excess of the net book value of oil and gas properties, less related deferred income taxes, over the cost center ceiling is recognized as an impairment of proved oil and gas properties. An impairment recognized in one period may not be reversed in a subsequent period even if higher commodity prices in the future result in a cost center ceiling in excess of the net book value of oil and gas properties, less related deferred income taxes.
The estimated future net revenues used in the cost center ceiling are calculated using the average realized prices for sales of crude oil, NGLs, and natural gas on the first calendar day of each month during the 12-month period prior to the end of the current quarter ("12-Month Average Realized Price"), held flat for the life of the production, except where different prices are fixed and determinable from applicable contracts for the remaining term of those contracts. Prices do not include the impact of derivative instruments as we elected not to meet the criteria to qualify derivative instruments for hedge accounting treatment.
We did not recognize impairments of proved oil and gas properties for the years ended December 31, 2018 and 2017 . Primarily due to declines in the 12-Month Average Realized Prices of crude oil, we recognized impairments of proved oil and gas properties for the year ended December 31, 2016. Details of the 12-Month Average Realized Price of crude oil for the years ended December 31, 2018, 2017 and 2016 and the impairments of proved oil and gas properties for the year ended December 31, 2016 are summarized in the table below:
|
| Years Ended December 31, | |||||||||
|
| 2018 |
| 2017 |
| 2016 | |||||
Impairment of proved oil and gas properties (In thousands) |
| | $- | |
| | $- | |
| $576,540 | |
Crude Oil 12-Month Average Realized Price ($/Bbl) - Beginning of period |
| $49.87 |
| $39.60 |
| $47.24 | |||||
Crude Oil 12-Month Average Realized Price ($/Bbl) - End of period |
| $63.80 |
| $49.87 |
| $39.60 | |||||
Crude Oil 12-Month Average Realized Price percentage increase (decrease) during period |
| 28 | % |
| 26 | % |
| (16 | %) | ||
57
The table below presents various pricing scenarios to demonstrate the sensitivity of our December 31, 2018 cost center ceiling to changes in 12-month average benchmark crude oil and natural gas prices underlying the 12-Month Average Realized Prices. The sensitivity analysis is as of December 31, 2018 and, accordingly, does not consider drilling and completion activity, acquisitions or dispositions of oil and gas properties, production, changes in crude oil and natural gas prices, and changes in development and operating costs occurring subsequent to December 31, 2018 that may require revisions to estimates of proved reserves. See also Part I, "Item 1A. Risk Factors-If crude oil and natural gas prices decline to near or below levels experienced in 2015 and 2016 we could be required to record additional impairments of proved oil and gas properties that would constitute a charge to earnings and reduce our shareholders' equity."
|
| 12-Month Average Realized Prices |
| Excess (deficit) of cost center ceiling over net book value, less related deferred income taxes |
| Increase (decrease) of cost center ceiling over net book value, less related deferred income taxes | ||
Full Cost Pool Scenarios |
| Crude Oil ($/Bbl) |
| Natural Gas ($/Mcf) |
| (In millions) |
| (In millions) |
December 31, 2018 Actual |
| $63.80 |
| $2.46 |
| $1,369 |
|
|
|
|
|
|
|
|
|
|
|
Crude Oil and Natural Gas Price Sensitivity |
|
|
|
|
|
|
|
|
Crude Oil and Natural Gas +10% |
| $70.36 |
| $2.78 |
| $1,947 |
| $578 |
Crude Oil and Natural Gas -10% |
| $57.26 |
| $2.14 |
| $795 |
| ($574) |
|
|
|
|
|
|
|
|
|
Crude Oil Price Sensitivity |
|
|
|
|
|
|
|
|
Crude Oil +10% |
| $70.36 |
| $2.46 |
| $1,894 |
| $525 |
Crude Oil -10% |
| $57.26 |
| $2.46 |
| $849 |
| ($520) |
|
|
|
|
|
|
|
|
|
Natural Gas Price Sensitivity |
|
|
|
|
|
|
|
|
Natural Gas +10% |
| $63.80 |
| $2.78 |
| $1,422 |
| $53 |
Natural Gas -10% |
| $63.80 |
| $2.14 |
| $1,315 |
| ($54) |
The price of crude oil, which is the commodity price that our cost center ceiling is most sensitive to as presented in the table above, decreased during the fourth quarter of 2018 and has remained at lower levels in early 2019. We estimate that the first quarter of 2019 cost center ceiling will exceed the net book value, less related deferred income taxes, resulting in no impairment of proved oil and gas properties. This estimate of the first quarter of 2019 cost center ceiling test is based on the estimated 12-Month Average Realized Price of crude oil of $61.27 per barrel as of March 31, 2019, which is based on the average realized price for sales of crude oil on the first calendar day of each month for the first 11 months and an estimate for the twelfth month based on a quoted forward price.
We further sensitized the 12-Month Average Realized Price of crude oil by using $50.00 per barrel. Under this scenario, our cost center ceiling would exceed the net book value, less related deferred income taxes, resulting in no impairment of proved oil and gas properties.
Both of these estimates assume that all other inputs and assumptions are as of December 31, 2018, other than the price of crude oil, and remain unchanged. As such, drilling and completion activity, acquisitions or dispositions of oil and gas properties, production, and changes in development and operating costs occurring subsequent to December 31, 2018 may require revisions to estimates of proved reserves, which would impact the calculation of the cost center ceiling.
Oil and Gas Reserve Estimates
The proved oil and gas reserve estimates as of December 31, 2018 included in this document have been prepared by Ryder Scott Company, L.P., ("Ryder Scott"), independent third party reserve engineers. Reserve engineering is a subjective process of estimating underground accumulations of hydrocarbons that cannot be measured in an exact manner. The process relies on judgment and the interpretation of available geologic, geophysical, engineering and production data. The extent, quality and reliability of this data can vary. The process also requires assumptions regarding drilling and operating costs, taxes and availability of funds. The oil and gas reserve estimation and disclosure requirements mandate certain of these assumptions such as existing economic and operating conditions, average crude oil and natural gas prices and the discount rate.
Proved oil and gas reserve estimates prepared by others may be substantially higher or lower than Ryder Scott's estimates. Significant assumptions used in the proved oil and gas reserve estimates are assessed by both Ryder Scott and our internal reserve team. All reserve reports prepared by Ryder Scott are reviewed by our senior management team, including the Chief Executive
58
Officer and Chief Operating Officer. Because these estimates depend on many assumptions, all of which may differ from actual results, reserve quantities actually recovered may be significantly different than estimated. Material revisions to reserve estimates may be made depending on the results of drilling, testing, and production.
It should not be assumed that the present value of future net cash flows is the current market value of our estimated proved oil and gas reserves. In accordance with the oil and gas reserve estimation and disclosure requirements, the discounted future net cash flows from proved reserves are based on the unweighted average of the first day of the month price for each month in the previous twelve-month period, using current costs and a 10% discount rate.
Our depletion rate depends on our estimate of total proved reserves. Holding all other factors constant, if our estimates of total proved reserves increased or decreased, the depletion rate and therefore DD&A expense of proved oil and gas properties would decrease or increase, respectively.
Derivative Instruments
We use commodity derivative instruments to mitigate the effects of commodity price volatility for a portion of our forecasted sales of production and achieve a more predictable level of cash flow. All commodity derivative instruments are recorded in the consolidated balance sheets as either an asset or liability measured at fair value. We net our commodity derivative instrument fair value amounts executed with the same counterparty, along with any deferred premium obligations, to a single asset or liability pursuant to International Swap Dealers Association Master Agreements ("ISDAs"), which provide for net settlement over the term of the contract and in the event of default or termination of the contract. We do not enter into commodity derivative instruments for speculative purposes.
We have entered into agreements for acquisitions or divestitures of oil and gas properties that include obligations to pay the seller or rights to receive from the buyer, respectively, additional consideration if commodity prices exceed specified thresholds during certain periods in the future. These contingent consideration liabilities and assets are required to be bifurcated and accounted for separately as derivative instruments as they are not considered to be clearly and closely related to the host contract, and recognized at their acquisition or divestiture date fair value in the consolidated balance sheets.
We have elected not to meet the criteria to qualify our commodity derivative instruments for hedge accounting treatment. Therefore, all gains and losses as a result of changes in the fair value of commodity derivative instruments, as well as our contingent consideration arrangements, are recognized as "(Gain) loss on derivatives, net" in the consolidated statements of operations in the period in which the changes occur. Deferred premium obligations associated with our commodity derivative instruments are recognized as "(Gain) loss on derivatives, net" in the consolidated statements of operations in the period in which the deferred premium obligations are incurred.
Cash flows are impacted to the extent that settlements of commodity derivative instruments, including deferred premium obligations, and contingent consideration arrangements result in cash received or paid during the period and are recognized as "Cash received (paid) for derivative settlements, net" in the consolidated statements of cash flows. Cash received or paid in settlement of contingent consideration assets or liabilities, respectively, are classified as cash flows from financing activities up to the divestiture or acquisition date fair value with any excess classified as cash flows from operating activities.
Our Board of Directors establishes risk management policies and, on a quarterly basis, reviews our commodity derivative instruments, including volumes, types of instruments and counterparties. These policies require that commodity derivative instruments be executed only by the President or Chief Financial Officer after consultation with and concurrence by the President, Chief Financial Officer and Chairman of the Board.
Preferred Stock and Common Stock Warrants
We apply the accounting standards for distinguishing liabilities from equity when determining the classification and measurement of preferred stock. Preferred stock that is not mandatorily redeemable is excluded from liability classification and is evaluated for classification in shareholders' equity or temporary equity. As the number of common shares that could be delivered upon the holders' optional redemption is indeterminate, we cannot assert that we will be able to settle in shares of our common stock and, as a result, present preferred stock as temporary equity. On a quarterly basis, we reassess the presentation of preferred stock in the consolidated balance sheets.
When preferred stock is issued in conjunction with common stock warrants, the common stock warrants are evaluated separately as a freestanding financial instrument to determine whether they must be recorded as a derivative instrument. We further evaluate the common stock warrants for equity classification and have determined that they qualify for equity classification and, therefore, are presented in additional paid-in capital in the consolidated balance sheets. The preferred stock and common stock warrants are recorded based on the net proceeds received allocated to the two instrument's relative fair values. The preferred stock is subject to accretion from its relative fair value at the issuance date to the redemption value using the effective interest method. The common stock warrants do not require further adjustments from their relative fair value at the issuance date.
59
Dividends and accretion associated with preferred stock are presented in the consolidated statements of operations as reductions to net income, or increases of net loss, to derive net income (loss) attributable to common shareholders. Dividend payments are presented as a financing activity in the consolidated statement of cash flows.
Income Taxes
Income taxes are recognized based on earnings reported for tax return purposes in addition to a provision for deferred income taxes. Deferred income taxes are recognized at the end of each reporting period for the future tax consequences of cumulative temporary differences between the tax bases of assets and liabilities and their reported amounts in our financial statements based on existing tax laws and enacted statutory tax rates applicable to the periods in which the temporary differences are expected to affect taxable income. We assess the realizability of our deferred tax assets on a quarterly basis by considering whether it is more likely than not that all or a portion of the deferred tax assets will not be realized. We consider all available evidence (both positive and negative) when determining whether a valuation allowance is required. In making this assessment, we evaluated possible sources of taxable income that may be available to realize the deferred tax assets, including projected future taxable income, the reversal of existing temporary differences, taxable income in carryback years and available tax planning strategies.
For each of the years ended December 31, 2018, 2017, and 2016, we maintained a full valuation allowance against our deferred tax assets based on our conclusion, considering all available evidence (both positive and negative), that it was more likely than not that the deferred tax assets would not be realized. A significant item of objective negative evidence considered was the cumulative pre-tax loss incurred over the three-year period ended December 31, 2018, primarily due to impairments of proved oil and gas properties recognized in the first three quarters of 2016, which limits our ability to consider subjective positive evidence, such as its projections of future taxable income.
We currently believe it is reasonably possible for us to achieve a three-year cumulative level of profitability within the next 12 months, as early as the first quarter of 2019, which would enhance our ability to conclude that it is more likely than not that the deferred tax assets would be realized and support a release of a portion or substantially all of the valuation allowance. A release of the valuation allowance would result in the recognition of an increase in deferred tax assets and an income tax benefit in the period in which the release occurs, although the exact timing and amount of the release is subject to change based on numerous factors, including our projections of future taxable income, which we continue to assess based on available information each reporting period.
We classify interest and penalties associated with income taxes as interest expense. We apply the tax law ordering approach to determine the sequence in which deferred tax assets and other tax attributes are utilized.
Commitments and Contingencies
Liabilities are recognized for contingencies when (i) it is both probable that an asset has been impaired or that a liability has been incurred and (ii) the amount of such loss is reasonably estimable. See "Note 8. Commitments and Contingencies" of the Notes to our Consolidated Financial Statements for further discussion.
Recently Adopted and Recently Issued Accounting Pronouncements
See "Note 2. Summary of Significant Accounting Policies" of the Notes to our Consolidated Financial Statements for discussion of the recent accounting pronouncements issued by the Financial Accounting Standards Board.
Item 7A. Qualitative and Quantitative Disclosures about Market Risk
Commodity Price Risk
Our revenues, future rate of growth, results of operations, financial position and ability to borrow funds or obtain additional capital are substantially dependent upon prevailing prices of crude oil, NGLs, and natural gas, which are affected by changes in market supply and demand and other factors. The markets for crude oil, NGLs, and natural gas have been volatile, especially over the last several years, and these markets will likely continue to be volatile in the future.
The following table sets forth our crude oil, NGL, and natural gas revenues for the year ended December 31, 2018 as well as the impact on the crude oil, NGL, and natural gas revenues assuming a 10% increase and decrease in our average realized crude oil, NGL, and natural gas prices, excluding the impact of derivative settlements:
|
| Year Ended December 31, 2018 | ||||||||||||||
|
| Crude oil |
| NGLs |
| Natural gas |
| Total | ||||||||
|
| (In thousands) | ||||||||||||||
Revenues |
| | $911,554 | |
| | $96,585 | |
| | $57,803 | |
| | $1,065,942 | |
|
|
|
|
|
|
|
|
| ||||||||
Impact of a 10% fluctuation in average realized prices |
| | $91,155 | |
| | $9,659 | |
| | $5,780 | |
| | $106,594 | |
60
We use commodity derivative instruments to mitigate the effects of commodity price volatility for a portion of our forecasted sales of production and achieve a more predictable level of cash flow. We do not enter into commodity derivative instruments for speculative purposes. As of December 31, 2018 , our commodity derivative instruments consisted of three-way collars, basis swaps, and sold call options. See "Note 12. Derivative Instruments" and "Note 16. Subsequent Events" of the Notes to our Consolidated Financial Statements for further discussion of our commodity derivative instruments as of December 31, 2018 and our commodity derivative instruments entered into subsequent to December 31, 2018 .
The following table sets forth the cash paid for derivative settlements, net, excluding deferred premium obligations, for the year ended December 31, 2018 as well as the impact on the cash paid for derivative settlements, net assuming a 10% increase and decrease in the respective settlement prices:
|
| Year Ended December 31, 2018 | ||||||||||||||
|
| Crude oil |
| NGLs |
| Natural gas |
| Total | ||||||||
|
| (In thousands) | ||||||||||||||
Cash paid for derivative settlements, net |
| | ($78,570 | ) |
| | ($6,378 | ) |
| | ($1,710 | ) |
| | ($86,658 | ) |
|
|
|
|
|
|
|
|
| ||||||||
Impact of a 10% increase in settlement prices |
| | ($69,853 | ) |
| | ($5,383 | ) |
| | ($3,501 | ) |
| | ($78,737 | ) |
Impact of a 10% decrease in settlement prices |
| | $54,698 | |
| | $5,383 | |
| | $3,018 | |
| | $63,099 | |
The primary drivers of our commodity derivative instrument fair values are the underlying forward oil and gas price curves. The following table sets forth the average forward oil and gas price curves as of December 31, 2018 for each of the years in which we have commodity derivative instruments:
|
| 2019 |
| 2020 |
| 2021 |
Crude oil: |
|
|
|
|
|
|
NYMEX WTI |
| $47.09 |
| $49.14 |
| $50.37 |
LLS-WTI Cushing |
| $4.81 |
| $4.03 |
| $3.42 |
WTI Midland-WTI Cushing |
| ($4.09) |
| ($0.15) |
| $0.55 |
Natural gas: |
|
|
|
|
|
|
NYMEX Henry Hub |
| $2.78 |
| $2.66 |
| $2.61 |
The following table sets forth the fair values as of December 31, 2018 , excluding deferred premium obligations, as well as the impact on the fair values assuming a 10% increase and decrease in the underlying forward oil and gas price curves that are shown above:
|
| Crude oil |
| NGLs |
| Natural gas |
| Total | ||||||||
|
| (In thousands) | ||||||||||||||
Fair value (liability) asset as of December 31, 2018 |
| | $31,775 | |
| | $617 | |
| | ($2,000 | ) |
| | $30,392 | |
|
|
|
|
|
|
|
|
| ||||||||
Impact of a 10% increase in forward commodity prices |
| | ($21,915 | ) |
| | $- | |
| | ($1,617 | ) |
| | ($23,532 | ) |
Impact of a 10% decrease in forward commodity prices |
| | $16,890 | |
| | $- | |
| | $819 | |
| | $17,709 | |
We had no settlements of contingent consideration arrangements for the year ended December 31, 2018 .
The fair values of the contingent consideration arrangements were determined by a third-party valuation specialist using Monte Carlo simulations including significant inputs such as forward oil and gas price curves, volatility factors and risk adjusted discount rates. See "Note 12. Derivative Instruments" and "Note 13. Fair Value Measurements" of the Notes to our Consolidated Financial Statements for further discussion.
61
The following table sets forth the fair values of the contingent consideration arrangements as of December 31, 2018 , as well as the impact on the fair values assuming a 10% increase and decrease in the underlying forward oil and gas price curves that are shown above:
|
| Contingent ExL Consideration |
| Contingent Niobrara Consideration |
| Contingent Marcellus Consideration |
| Contingent Utica Consideration | ||||||||
|
| (In thousands) | ||||||||||||||
Potential (payment) receipt per year |
| | ($50,000 | ) |
| | $5,000 | |
| | $3,000 | |
| | $5,000 | |
Maximum potential (payment) receipt |
| | ($125,000 | ) |
| | $15,000 | |
| | $7,500 | |
| | $15,000 | |
|
|
|
|
|
|
|
|
| ||||||||
Fair value (liability) asset as of December 31, 2018 |
| | ($80,584 | ) |
| | $7,035 | |
| | $1,369 | |
| | $7,501 | |
Impact of a 10% increase in forward commodity prices |
| | ($7,466 | ) |
| | $900 | |
| | $669 | |
| | $972 | |
Impact of a 10% decrease in forward commodity prices |
| | $7,846 | |
| | ($775 | ) |
| | ($564 | ) |
| | ($887 | ) |
Interest Rate Risk
We are exposed to market risk due to the floating interest rate associated with any outstanding borrowings on our revolving credit facility. Changes in interest rates do not impact the amount of interest we pay on our fixed-rate 6.25% Senior Notes and 8.25% Senior Notes, but can impact their fair values. As of December 31, 2018 , we had approximately $1.6 billion of long-term debt outstanding. Of this amount, approximately $0.9 billion was fixed-rate debt with a weighted average interest rate of 7.01% and approximately $0.7 billion was floating-rate debt on outstanding borrowings on our revolving credit facility with a weighted average interest rate of 4.17% . A 1% increase or decrease in the interest rate on outstanding borrowings on our revolving credit facility would have a corresponding increase or decrease in our interest expense of approximately $4.8 million. See "Note 13. Fair Value Measurements" of the Notes to our Consolidated Financial Statements for further details on the fair value of our 6.25% Senior Notes and 8.25% Senior Notes.
Item 8. Financial Statements and Supplementary Data
The financial statements and information required by this Item appears on pages F-1 through F-50 of this Annual Report on Form 10-K.
Item 9. Changes In and Disagreements With Accountants on Accounting and Financial Disclosures
None.
Item 9A. Controls and Procedures
(a) Disclosure Controls and Procedures
We maintain disclosure controls and procedures that are designed to provide reasonable assurance that information required to be disclosed by us in the reports that we file or submit to the SEC under the Securities Exchange Act of 1934, as amended (the "Exchange Act"), is recorded, processed, summarized and reported within the time periods specified by the SEC's rules and forms, and that information is accumulated and communicated to our management, including our Chief Executive Officer and Chief Financial Officer, as appropriate to allow timely decisions regarding required disclosure.
In accordance with Rules 13a-15(b) and 15d-15(b) under the Exchange Act, we carried out an evaluation, under the supervision and with the participation of management, including our Chief Executive Officer and Chief Financial Officer, of the effectiveness of our disclosure controls and procedures (as defined by Rules 13a-15(e) and 15d-15(e) under the Exchange Act) as of the end of the period covered by this Annual Report on Form 10-K. As described below under paragraph (b) within Management's Annual Report on Internal Control over Financial Reporting, our Chief Executive Officer and Chief Financial Officer have concluded that, as of the end of the period covered by this Annual Report on Form 10-K, our disclosure controls and procedures were effective to provide reasonable assurance that information required to be disclosed by us in the reports that we file or submit to the SEC under the Exchange Act is recorded, processed, summarized and reported within the time periods specified by the SEC's rules and forms and that such information is accumulated and communicated to our management, including our Chief Executive Officer and Chief Financial Officer, as appropriate to allow timely decisions regarding required disclosure.
The audit report of Ernst & Young LLP which is included in this Annual Report on Form 10-K, expressed an unqualified opinion on our consolidated financial statements.
62
(b) Management's Annual Report on Internal Control over Financial Reporting
Our management is responsible for establishing and maintaining adequate internal control over financial reporting as defined in Rules 13a-15(f) and 15d-15(f) under the Exchange Act. Our internal control over financial reporting is designed to provide reasonable assurance regarding the reliability of financial reporting and the preparation of financial statements for external purposes in accordance with generally accepted accounting principles. Our internal control over financial reporting includes those policies and procedures that:
• | pertain to the maintenance of records that, in reasonable detail, accurately and fairly reflect our transactions and dispositions of our assets; |
• | provide reasonable assurance that transactions are recorded as necessary to permit preparation of financial statements in accordance with generally accepted accounting principles, and that our receipts and expenditures are being made only in accordance with authorizations of our management and directors; and |
• | provide reasonable assurance regarding prevention or timely detection of unauthorized acquisition, use, or disposition of our assets that could have a material effect on the financial statements. |
While "reasonable assurance" is a high level of assurance, it does not mean absolute assurance. Because of its inherent limitations, internal control over financial reporting may not prevent or detect every misstatement and instance of fraud. Controls are susceptible to manipulation, especially in instances of fraud caused by collusion of two or more people, including our senior management. Also, projections of any evaluation of effectiveness to future periods are subject to the risk that controls may become inadequate because of changes in conditions, or that the degree of compliance with the policies or procedures may deteriorate.
Under the supervision and with the participation of our Chief Executive Officer and Chief Financial Officer, our management conducted an evaluation of the effectiveness of our internal control over financial reporting as of December 31, 2018 . In making this evaluation, management used the Internal Control – Integrated Framework (2013) issued by the Committee of Sponsoring Organizations of the Treadway Commission ("COSO"). Based on the results of our evaluation, our management concluded that our internal control over financial reporting was effective as of December 31, 2018 .
Ernst & Young LLP, our independent registered public accounting firm that audited our consolidated financial statements, has also issued its own audit report on the effectiveness of our internal control over financial reporting as of December 31, 2018 , which is filed with this Annual Report on Form 10-K.
(c) Changes in Internal Control over Financial Reporting
There have not been any changes in our internal control over financial reporting during the quarter ended December 31, 2018 that have materially affected, or are reasonably likely to materially affect, our internal control over financial reporting.
Item 9B. Other Information
None.
PART III
Item 10. Directors, Executive Officers and Corporate Governance
The information required by this item is incorporated herein by reference to our definitive Proxy Statement (the "2019 Proxy Statement") for our 2019 annual meeting of shareholders to be held on May 16, 2019. The 2019 Proxy Statement will be filed with the SEC not later than 120 days subsequent to December 31, 2018 .
Item 11. Executive Compensation
The information required by this item is incorporated herein by reference to the 2019 Proxy Statement, which will be filed with the SEC not later than 120 days subsequent to December 31, 2018 .
Item 12. Security Ownership of Certain Beneficial Owners and Management and Related Shareholder Matters
The information required by this item is incorporated herein by reference to the 2019 Proxy Statement, which will be filed with the SEC not later than 120 days subsequent to December 31, 2018 .
Item 13. Certain Relationships and Related Transactions, and Director Independence
The information required by this item is incorporated herein by reference to the 2019 Proxy Statement, which will be filed with the SEC not later than 120 days subsequent to December 31, 2018 .
63
Item 14. Principal Accounting Fees and Services
The information required by this item is incorporated herein by reference to the 2019 Proxy Statement, which will be filed with the SEC not later than 120 days subsequent to December 31, 2018 .
PART IV
Item 15. Exhibits and Financial Statement Schedules
(a)(1) Financial Statements
Refer to the Index to Consolidated Financial Statements on page F-1 of this Form 10-K for a list of all financial statements filed as part of this report.
(a)(2) Financial Statement Schedules
Financial statement schedules have been omitted because they are either not required, not applicable or the information required to be presented is included in the Company's consolidated financial statements and related notes.
(a)(3) Exhibits
EXHIBIT INDEX
Exhibit Number |
| Description |
†3.1 | - | Amended and Restated Articles of Incorporation of Carrizo Oil & Gas, Inc. (incorporated herein by reference to Exhibit 3.1 to the Company's Annual Report on Form 10-K for the year ended December 31, 1997 (File No. 000-29187-87)). |
†3.2 | - | Articles of Amendment to Amended and Restated Articles of Incorporation of Carrizo Oil & Gas, Inc. dated as of June 24, 2008 (incorporated herein by reference to Exhibit 3.1 to the Company's Current Report on Form 8-K filed on June 25, 2008 (File No. 000-29187-87)). |
†3.3 | - | Articles of Amendment to Amended and Restated Articles of Incorporation of Carrizo Oil & Gas, Inc. dated as of May 16, 2017 (incorporated herein by reference to Exhibit 3.1 to the Company's Current Report on Form 8-K filed on May 16, 2017 (File No. 000-291870-87)). |
†3.4 | - | Composite Articles of Incorporation of Carrizo Oil & Gas, Inc., giving effect to all amendments through May 16, 2017 (incorporated herein by reference to Exhibit 3.2 to the Company's Current Report on Form 8-K filed on May 16, 2017 (File No. 000-291870-87)). |
†3.5 | - | Statement of Resolutions Establishing Series of 8.875% Redeemable Preferred Stock of Carrizo Oil & Gas, Inc., effective August 10, 2017 (incorporated herein by reference to Exhibit 3.1 to the Company's Current Report on Form 8-K filed on August 11, 2017 (File No. 000-291870-87)). |
†3.6 | - | Amended and Restated Bylaws of Carrizo Oil & Gas, Inc., adopted May 23, 2018 (incorporated herein by reference to Exhibit 3.1 to the Company's Current Report on Form 8-K filed on May 29, 2018 (File No. 000-29187-87)). |
†4.1 | - | Indenture dated May 28, 2008 among Carrizo Oil & Gas, Inc., the subsidiaries named therein and Wells Fargo Bank, National Association, as trustee (incorporated herein by reference to Exhibit 4.1 to the Company's Current Report on Form 8-K filed on May 28, 2008 (File No. 000-29187-87)). |
†4.2 | - | First Supplemental Indenture dated May 28, 2008 between Carrizo Oil & Gas, Inc. and Wells Fargo Bank, National Association, as trustee (incorporated herein by reference to Exhibit 4.2 to the Company's Current Report on Form 8-K filed on May 28, 2008 (File No. 000-29187-87)). |
†4.3 | - | Second Supplemental Indenture dated May 14, 2009 among Carrizo Oil & Gas, Inc., the subsidiaries named therein and Wells Fargo Bank, National Association, as trustee (incorporated herein by reference to Exhibit 4.21 to the Company's Registration Statement on Form S-3 (Registration No. 333-159237)). |
†4.4 | - | Third Supplemental Indenture dated October 19, 2009 among Carrizo Oil & Gas, Inc., the subsidiary named therein and Wells Fargo Bank, National Association, as trustee (incorporated herein by reference to Exhibit 4.19 to the Company's Registration Statement on Form S-3 (Registration No. 333-159237)). |
†4.5 | - | Fourth Supplemental Indenture dated November 2, 2010 among Carrizo Oil & Gas, Inc., the subsidiary guarantors named therein and Wells Fargo Bank, National Association, as trustee (incorporated herein by reference to Exhibit 4.2 to the Company's Current Report on Form 8-K filed on November 2, 2010 (File No. 000-29187-87)). |
64
†4.6 | - | Fifth Supplemental Indenture dated November 2, 2010 among Carrizo Oil & Gas, Inc., the subsidiary guarantors named therein and Wells Fargo Bank, National Association, as trustee (incorporated herein by reference to Exhibit 4.3 to the Company's Current Report on Form 8-K filed on November 2, 2010 (File No. 000-29187-87)). |
†4.7 | - | Sixth Supplemental Indenture dated May 4, 2011 among Carrizo Oil & Gas, Inc., the subsidiary guarantors named therein and Wells Fargo Bank, National Association, as trustee (incorporated herein by reference to Exhibit 4.1 to the Company's Quarterly Report on Form 10-Q for the quarter ended March 31, 2011 (File No. 000-29187-87)). |
†4.8 | - | Seventh Supplemental Indenture dated May 4, 2011 among Carrizo Oil & Gas, Inc., the subsidiary guarantors named therein and Wells Fargo Bank, National Association, as trustee (incorporated herein by reference to Exhibit 4.2 to the Company's Quarterly Report on Form 10-Q for the quarter ended March 31, 2011 (File No. 000-29187-87)). |
†4.9 | - | Eighth Supplemental Indenture dated August 5, 2011 among Carrizo Oil & Gas, Inc., the subsidiary guarantors named therein and Wells Fargo Bank, National Association, as trustee (incorporated herein by reference to Exhibit 4.3 to the Company's Quarterly Report on Form 10-Q for the quarter ended June 30, 2011 (File No. 000-29187-87)). |
†4.10 | - | Ninth Supplemental Indenture dated August 5, 2011 among Carrizo Oil & Gas, Inc., the subsidiary guarantors named therein and Wells Fargo Bank, National Association, as trustee (incorporated herein by reference to Exhibit 4.4 to the Company's Quarterly Report on Form 10-Q for the quarter ended June 30, 2011 (File No. 000-29187-87)). |
†4.11 | - | Tenth Supplemental Indenture dated September 10, 2012 among Carrizo Oil & Gas, Inc., the subsidiary guarantors named therein and Wells Fargo Bank, National Association, as trustee (incorporated herein by reference to Exhibit 4.2 to the Company's Current Report on Form 8-K filed on September 13, 2012 (File No. 000-29187-87)). |
†4.12 | - | Eleventh Supplemental Indenture dated November 6, 2012 among Carrizo Oil & Gas, Inc., the subsidiary guarantors named therein and Wells Fargo Bank, National Association, as trustee (incorporated herein by reference to Exhibit 4.1 to the Company's Quarterly Report on Form 10-Q for the quarter ended September 30, 2012 (File No. 000-29187-87)). |
†4.13 | - | Twelfth Supplemental Indenture dated November 6, 2012 among Carrizo Oil & Gas, Inc., the subsidiary guarantors named therein and Wells Fargo Bank, National Association, as trustee (incorporated herein by reference to Exhibit 4.2 to the Company's Quarterly Report on Form 10-Q for the quarter ended September 30, 2012 (File No. 000-29187-87)). |
†4.14 | - | Thirteenth Supplemental Indenture dated November 6, 2012 among Carrizo Oil & Gas, Inc., the subsidiary guarantors named therein and Wells Fargo Bank, National Association, as trustee (incorporated herein by reference to Exhibit 4.3 to the Company's Quarterly Report on Form 10-Q for the quarter ended September 30, 2012 (File No. 000-29187-87)). |
†4.15 | - | Fourteenth Supplemental Indenture dated November 6, 2012 among Carrizo Oil & Gas, Inc., the subsidiary guarantors named therein and Wells Fargo Bank, National Association, as trustee (incorporated herein by reference to Exhibit 4.4 to the Company's Quarterly Report on Form 10-Q for the quarter ended September 30, 2012 (File No. 000-29187-87)). |
†4.16 | - | Fifteenth Supplemental Indenture dated October 30, 2014 among Carrizo Oil & Gas, Inc., the subsidiary guarantors named therein and Wells Fargo Bank, National Association, as trustee (incorporated herein by reference to Exhibit 4.2 to the Company's Current Report on Form 8-K filed on October 30, 2014 (File No. 000-29187-87)). |
†4.17 | - | Sixteenth Supplemental Indenture dated April 28, 2015 among Carrizo Oil & Gas, Inc., the subsidiary guarantors named therein and Wells Fargo Bank, National Association, as trustee (incorporated herein by reference to Exhibit 4.2 to the Company's Current Report on Form 8-K filed on April 28, 2015 (File No. 000-29187-87)). |
†4.18 | - | Seventeenth Supplemental Indenture dated May 20, 2015 among Carrizo Oil & Gas, Inc., the subsidiary guarantors named therein and Wells Fargo Bank, National Association, as trustee (incorporated herein by reference to Exhibit 4.1 to the Company's Current Report on Form 8-K filed on May 22, 2015 (File No. 000-29187-87)). |
65
†4.19 | - | Eighteenth Supplemental Indenture dated May 20, 2015 among Carrizo Oil & Gas, Inc., the subsidiary guarantors named therein and Wells Fargo Bank, National Association, as trustee (incorporated herein by reference to Exhibit 4.2 to the Company's Current Report on Form 8-K filed on May 22, 2015 (File No. 000-29187-87)). |
†4.20 | - | Nineteenth Supplemental Indenture dated May 20, 2015 among Carrizo Oil & Gas, Inc., the subsidiary guarantors named therein and Wells Fargo Bank, National Association, as trustee (incorporated herein by reference to Exhibit 4.3 to the Company's Current Report on Form 8-K filed on May 22, 2015 (File No. 000-29187-87)). |
†4.21 | - | Twentieth Supplemental Indenture dated July 14, 2017 among Carrizo Oil & Gas, Inc., the subsidiary guarantors named therein and Wells Fargo Bank, National Association, as trustee (incorporated herein by reference to Exhibit 4.2 to the Company's Current Report on Form 8-K filed on July 14, 2017 (File No. 000-29187-87)). |
†4.22 | - | Officers' Certificate of Carrizo Oil & Gas, Inc. dated as of November 17, 2011 (incorporated herein by reference to Exhibit 4.5 to the Company's Current Report on Form 8-K filed on November 17, 2011 (File No. 000-29187-87)). |
†4.23 | - | Officers' Certificate of Carrizo Oil & Gas, Inc. dated as of February 23, 2015 (incorporated herein by reference to Exhibit 4.17 to the Company's Annual Report on Form 10-K for the year ended December 31, 2014 (File No. 000-29187-87)). |
†4.24 | - | Warrant Agreement, dated as of August 10, 2017, between Carrizo Oil & Gas, Inc. and Wells Fargo Bank, N.A., as warrant agent (incorporated herein by reference to Exhibit 4.1 to the Company's Current Report on Form 8-K filed on August 11, 2017 (File No. 000-291870-87)). |
*†10.1 | - | Amended and Restated Incentive Plan of Carrizo Oil & Gas, Inc. effective as of May 15, 2014 (the "2014 Incentive Plan") (incorporated herein by reference to Exhibit 10.1 to the Company's Current Report on Form 8-K filed on May 16, 2014 (File No. 000-29187-87)). |
*†10.2 | - | 2017 Incentive Plan of Carrizo Oil & Gas, Inc. effective as of May 16, 2017 (the "2017 Incentive Plan") (incorporated herein by reference to Exhibit 10.1 to the Company's Current Report on Form 8-K filed on May 16, 2017 (File No. 000-291870-87)). |
*†10.3 | - | Carrizo Oil & Gas, Inc. Cash-Settled Stock Appreciation Rights Plan (incorporated herein by reference to Exhibit 10.10 to the Company's Current Report on Form 8-K filed on June 9, 2009 (File No. 000-29187-87)). |
*†10.4 | - | Form of Employee Restricted Stock Award Agreement (Officer) under the 2014 Incentive Plan (incorporated herein by reference to Exhibit 10.2 to the Company's Current Report on Form 8-K filed on June 17, 2013 (File No. 000-29187-87)). |
*†10.5 | - | Form of Employee Restricted Stock Unit Award Agreement (Officer) under the 2014 Incentive Plan (incorporated herein by reference to Exhibit 10.3 to the Company's Current Report on Form 8-K filed on June 17, 2013 (File No. 000-29187-87)). |
*†10.6 | - | Form of Employee Performance Share Award Agreement under the 2014 Incentive Plan (incorporated herein by reference to Exhibit 10.1 to the Company's Quarterly Report on Form 10-Q for the quarter ended March 31, 2014 (File No. 000-29187-87)). |
*†10.7 | - | Form of Employee Stock Appreciation Rights Agreement (Officer) under the 2014 Incentive Plan (incorporated herein by reference to Exhibit 10.4 to the Company's Current Report on Form 8-K filed on June 17, 2013 (File No. 000-29187-87)). |
*†10.8 | - | Form of Director Restricted Stock Unit Agreement under the 2017 Incentive Plan (incorporated herein by reference to Exhibit 10.2 to the Company's Current Report on Form 8-K filed on May 16, 2017 (File No. 000-29187-87)). |
*†10.9 | - | Form of Employee Restricted Stock Unit Agreement under the 2017 Incentive Plan (incorporated herein by reference to Exhibit 10.3 to the Company's Current Report on Form 8-K filed on May 16, 2017 (File No. 000-29187-87)). |
*†10.10 | - | Form of Employee Restricted Stock Agreement under the 2017 Incentive Plan (incorporated herein by reference to Exhibit 10.19 to the Company's Annual Report on Form 10-K for the year ended December 31, 2017 (File No. 000-29187-87)). |
*†10.11 | - | Form of Employee Performance Share Award Agreement (Officer) under the 2017 Incentive Plan (incorporated herein by reference to Exhibit 10.20 to the Company's Annual Report on Form 10-K for the year ended December 31, 2017 (File No. 000-29187-87)). |
66
*†10.12 | - | Form of Employee Stock Appreciation Rights Agreement (Officer) under the 2017 Incentive Plan (incorporated herein by reference to Exhibit 10.21 to the Company's Annual Report on Form 10-K for the year ended December 31, 2017 (File No. 000-29187-87)). |
*†10.13 | - | Form of Employee Stock Appreciation Rights Agreement (Officer) under the Carrizo Oil & Gas, Inc. Cash-Settled Stock Appreciation Rights Plan (incorporated herein by reference to Exhibit 10.5 to the Company's Current Report on Form 8-K filed on June 17, 2013 (File No. 000-29187-87)). |
*†10.14 | - | Form of Employee Stock Appreciation Rights Agreement (Officer) under the Carrizo Oil & Gas, Inc. Cash-Settled Stock Appreciation Rights Plan (incorporated herein by reference to Exhibit 10.22 to the Company's Annual Report on Form 10-K for the year ended December 31, 2017 (File No. 000-29187-87)). |
*10.15 | - | Carrizo Oil & Gas, Inc. Change in Control Severance Plan effective February 14, 2019. |
*10.16 | - | Form of Employment Agreement of Carrizo Oil & Gas, Inc. as of February 14, 2019. |
*†10.17 | - | Amended and Restated Employment Agreement dated June 5, 2009 between the Company and S.P. Johnson IV (incorporated herein by reference to Exhibit 10.2 to the Company's Current Report on Form 8-K filed on June 9, 2009 (File No. 000-29187-87)). |
*†10.18 | - | Amended and Restated Employment Agreement dated June 5, 2009 between the Company and J. Bradley Fisher (incorporated herein by reference to Exhibit 10.4 to the Company's Current Report on Form 8-K filed on June 9, 2009 (File No. 000-29187-87)). |
*†10.19 | - | Amended and Restated Employment Agreement dated June 5, 2009 between the Company and Richard H. Smith (incorporated herein by reference to Exhibit 10.6 to the Company's Current Report on Form 8-K filed on June 9, 2009 (File No. 000-29187-87)). |
*†10.20 | - | Employment Agreement dated January 15, 2010 between the Company and David L. Pitts (incorporated herein by reference to Exhibit 10.1 to the Company's Current Report on Form 8-K filed on January 20, 2010 (File No. 000-29187-87)). |
*†10.21 | - | Employment Agreement dated July 11, 2011 between the Company and Gregory F. Conaway (incorporated herein by reference to Exhibit 10.10 to the Company's Annual Report on Form 10-K for the year ended December 31, 2014 (File No. 100-29187-87)). |
*†10.22 | - | Employment Agreement dated June 5, 2009 between the Company and Gerald A. Morton (incorporated herein by reference to Exhibit 10.11 to the Company's Annual Report on Form 10-K for the year ended December 31, 2015 (File No. 100-29187-87)). |
*10.23 | - | Amended and Restated Employment Agreement dated February 14, 2019 between the Company and S.P. Johnson IV |
*10.24 | - | Amended and Restated Employment Agreement dated February 14, 2019 between the Company and Brad Fisher |
*10.25 | - | Amended and Restated Employment Agreement dated February 14, 2019 between the Company and David L. Pitts |
*10.26 | - | Amended and Restated Employment Agreement dated February 14, 2019 between the Company and Gerald A. Morton |
*10.27 | - | Amended and Restated Employment Agreement dated February 14, 2019 between the Company and Richard H. Smith |
*10.28 | - | Amended and Restated Employment Agreement dated February 14, 2019 between the Company and Gregory F. Conaway |
†10.29 | - | Credit Agreement dated as of January 27, 2011 among Carrizo Oil & Gas, Inc., as Borrower, BNP Paribas, as Administrative Agent, Credit Agricole Corporate and Investment Bank and Royal Bank of Canada, as Co-Syndication Agents, Capital One, N.A. and Compass Bank, as Co-Documentation Agents, BNP Paribas Securities Corp. as Sole Lead Arranger and Sole Bookrunner, and the Lenders party thereto (incorporated herein by reference to Exhibit 10.1 to the Company's Current Report on Form 8-K filed on February 2, 2011 (File No. 000-29187-87)). |
†10.30 | - | First Amendment, dated as of March 26, 2012, to Credit Agreement dated as of January 27, 2011, among Carrizo Oil & Gas, Inc., BNP Paribas as administrative agent, and the Lenders party thereto (incorporated herein by reference to Exhibit 10.1 to the Company's Quarterly Report on Form 10-Q for the quarter ended March 31, 2012 (File No. 000-29187-87)). |
67
†10.31 | - | Second Amendment to Credit Agreement, dated as of September 4, 2012, among Carrizo Oil & Gas, Inc., as borrower, Wells Fargo Bank, National Association, as administrative agent, and the lender parties thereto (incorporated herein by reference to Exhibit 10.1 to the Company's Current Report on Form 8-K filed on September 5, 2012 (File No. 000-29187-87)). |
†10.32 | - | Third Amendment to Credit Agreement, dated as of September 27, 2012, among Carrizo Oil & Gas, Inc., as borrower, Wells Fargo Bank, National Association, as administrative agent, and the lender parties thereto (incorporated herein by reference to Exhibit 10.2 to the Company's Quarterly Report on Form 10-Q for the quarter ended September 30, 2012 (File No. 000-29187-87)). |
†10.33 | - | Fourth Amendment to Credit Agreement, dated as of October 9, 2013, among Carrizo Oil & Gas, Inc., as borrower, Wells Fargo Bank, National Association, as administrative agent, and the lender parties thereto (incorporated herein by reference to Exhibit 10.1 to the Company's Current Report on Form 8-K filed on October 11, 2013 (File No. 000-29187-87)). |
†10.34 | - | Fifth Amendment to Credit Agreement, dated as of October 7, 2014, among Carrizo Oil & Gas, Inc., as borrower, Wells Fargo Bank, National Association, as administrative agent, and the lender parties thereto (incorporated herein by reference to Exhibit 10.1 to the Company's Current Report on Form 8-K filed on October 9, 2014 (File No. 000-29187-87)). |
†10.35 | - | Sixth Amendment to Credit Agreement, dated as of May 5, 2015, among Carrizo Oil & Gas, Inc., as borrower, Wells Fargo Bank, National Association, as administrative agent, and the lender parties thereto (incorporated herein by reference to Exhibit 10.1 to the Company's Quarterly Report on Form 10-Q for the quarter ended March 31, 2015 (File No. 000-29187-87)). |
†10.36 | - | Seventh Amendment to Credit Agreement, dated as of October 30, 2015, among Carrizo Oil & Gas, Inc., as borrower, Wells Fargo Bank, National Association, as administrative agent, and the lender parties thereto (incorporated herein by reference to Exhibit 10.1 to the Company's Quarterly Report on Form 10-Q for the quarter ended September 30, 2015 (File No. 000-29187-87)). |
†10.37 | - | Eighth Amendment to Credit Agreement, dated as of May 3, 2016, among Carrizo Oil & Gas, Inc., as borrower, Wells Fargo Bank, National Association, as administrative agent, and the lender parties thereto (incorporated herein by reference to Exhibit 10.1 to the Company's Current Report on Form 8-K filed on May 4, 2016 (File No. 000-29187-87)). |
†10.38 | - | Ninth Amendment to Credit Agreement, dated as of May 4, 2017, among Carrizo Oil & Gas, Inc., as borrower, Wells Fargo Bank, National Association, as administrative agent, and the lender parties thereto (incorporated herein by reference to Exhibit 10.1 to the Company's Quarterly Report on Form 10-Q for the quarter ended March 31, 2017 (File No. 000-29187-87)). |
†10.39 | - | Tenth Amendment to Credit Agreement, dated as of June 28, 2017, among Carrizo Oil & Gas, Inc., as borrower, Wells Fargo Bank, National Association, as administrative agent, and the lender parties thereto (incorporated herein by reference to Exhibit 10.1 to the Company's Current Report on Form 8-K filed on June 28, 2017 (File No. 000-291870-87)). |
†10.40 | - | Eleventh Amendment to Credit Agreement, dated as of November 3, 2017, among Carrizo Oil & Gas, Inc., as borrower, Wells Fargo Bank, National Association, as administrative agent, and the lender parties thereto (incorporated herein by reference to Exhibit 10.3 to the Company's Quarterly Report on Form 10-Q for the quarter ended September 30, 2017 (File No. 000-291870-87)). |
†10.41 | - | Twelfth Amendment to Credit Agreement, dated as of May 4, 2018, among Carrizo Oil & Gas, Inc., as borrower, Wells Fargo Bank, National Association, as administrative agent, and the lender parties thereto (incorporated herein by reference to Exhibit 10.1 to the Company's Current Report on Form 10-Q filed on May 9, 2018 (File No. 000-291870-87)). |
†10.42 | - | Thirteenth Amendment to Credit Agreement, dated as of October 29, 2018, among Carrizo Oil & Gas, Inc., as borrower, Wells Fargo Bank, National Association, as administrative agent, and the lender parties thereto (incorporated herein by reference to Exhibit 10.1 to the Company's Current Report on Form 10-Q filed on November 1, 2018 (File No. 000-291870-87)). |
†10.43 | - | Form of Indemnification Agreement for directors and executive officers of the Company, adopted May 23, 2018 (incorporated herein by reference to Exhibit 10.1 to the Company's Current Report on Form 8-K filed on May 29, 2018 (File No. 000-29187-87)). |
†10.44 | - | Preferred Stock Purchase Agreement dated as of June 28, 2017 between Carrizo Oil & Gas, Inc. and the purchasers named therein (incorporated herein by reference to Exhibit 10.1 to the Company's Current Report on Form 8-K filed on June 28, 2017 (File No. 000-29187087)). |
68
†10.45 | - | Registration Rights Agreement dated as of August 10, 2017 between Carrizo Oil & Gas, Inc. and the GSO Funds party thereto (incorporated herein by reference to Exhibit 10.1 to the Company's Current Report on Form 8-K filed on August 11, 2017 (File No. 000-291870-87)). |
†10.46 | - | Standstill and Voting Agreement dated as of August 10, 2017 between Carrizo Oil & Gas, Inc. and the GSO Funds party thereto (incorporated herein by reference to Exhibit 10.2 to the Company's Current Report on Form 8-K filed on August 11, 2017 (File No. 000-291870-87)). |
21.1 | - | Subsidiaries of the Company. |
23.1 | - | Consent of Ernst & Young LLP. |
23.2 | - | Consent of KPMG LLP. |
23.3 | - | Consent of Ryder Scott Company, L.P. |
31.1 | - | CEO Certification Pursuant to Section 302 of the Sarbanes-Oxley Act of 2002. |
31.2 | - | CFO Certification Pursuant to Section 302 of the Sarbanes-Oxley Act of 2002. |
32.1 | - | CEO Certification Pursuant to Section 906 of the Sarbanes-Oxley Act of 2002. |
32.2 | - | CFO Certification Pursuant to Section 906 of the Sarbanes-Oxley Act of 2002. |
99.1 | - | Summary of Reserve Report and Report of Ryder Scott Company, L.P. as of December 31, 2018. |
101 | - | Interactive Data Files. |
|
† Incorporated by reference as indicated.
* Management contract or compensatory plan or arrangement.
+ | Schedules to this exhibit have been omitted pursuant to Item 601(b) of Regulation S-K; a copy of the omitted schedules will be furnished to the U.S. Securities and Exchange Commission supplementally upon request. |
69
INDEX TO CONSOLIDATED FINANCIAL STATEMENTS
| PAGE |
Reports of Independent Registered Public Accounting Firms | F-2 |
Consolidated Balance Sheets as of December 31, 2018 and 2017 | F-5 |
Consolidated Statements of Operations for the Years Ended December 31, 2018, 2017 and 2016 | F-6 |
Consolidated Statements of Shareholders' Equity for the Years Ended December 31, 2018, 2017 and 2016 | F-7 |
Consolidated Statements of Cash Flows for the Years Ended December 31, 2018, 2017 and 2016 | F-8 |
Notes to Consolidated Financial Statements | F-9 |
F-1
Report of Independent Registered Public Accounting Firm
To the Shareholders and the Board of Directors of Carrizo Oil & Gas, Inc.
Opinion on the Financial Statements
We have audited the accompanying consolidated balance sheets of Carrizo Oil & Gas, Inc. (the Company) as of December 31, 2018 and 2017, and the related consolidated statements of operations, shareholders' equity and cash flows for each of the two years in the period ended December 31, 2018, and the related notes (collectively referred to as the "consolidated financial statements"). In our opinion, the consolidated financial statements present fairly, in all material respects, the financial position of the Company at December 31, 2018 and 2017, and the results of its operations and its cash flows for each of the two years in the period ended December 31, 2018 in conformity with U.S. generally accepted accounting principles.
We also have audited, in accordance with the standards of the Public Company Accounting Oversight Board (United States) (PCAOB), the Company's internal control over financial reporting as of December 31, 2018, based on criteria established in Internal Control-Integrated Framework issued by the Committee of Sponsoring Organizations of the Treadway Commission (2013 framework) and our report dated February 28, 2019 expressed an unqualified opinion thereon.
Basis for Opinion
These financial statements are the responsibility of the Company's management. Our responsibility is to express an opinion on the Company's financial statements based on our audits. We are a public accounting firm registered with the PCAOB and are required to be independent with respect to the Company in accordance with the U.S. federal securities laws and the applicable rules and regulations of the Securities and Exchange Commission and the PCAOB.
We conducted our audits in accordance with the standards of the PCAOB. Those standards require that we plan and perform the audit to obtain reasonable assurance about whether the financial statements are free of material misstatement, whether due to error or fraud. Our audits included performing procedures to assess the risks of material misstatement of the financial statements, whether due to error or fraud, and performing procedures that respond to those risks. Such procedures included examining, on a test basis, evidence regarding the amounts and disclosures in the financial statements. Our audits also included evaluating the accounting principles used and significant estimates made by management, as well as evaluating the overall presentation of the financial statements. We believe that our audits provide a reasonable basis for our opinion.
/s/ Ernst & Young LLP
We have served as the Company's auditor since 2017.
Houston, Texas
February 28, 2019
F-2
Report of Independent Registered Public Accounting Firm
To the Shareholders and the Board of Directors of Carrizo Oil & Gas, Inc.
Opinion on Internal Control over Financial Reporting
We have audited Carrizo Oil & Gas, Inc.'s internal control over financial reporting as of December 31, 2018, based on criteria established in Internal Control-Integrated Framework issued by the Committee of Sponsoring Organizations of the Treadway Commission (2013 framework) (the COSO criteria). In our opinion, Carrizo Oil & Gas, Inc. (the Company) maintained, in all material respects, effective internal control over financial reporting as of December 31, 2018, based on the COSO criteria.
We also have audited, in accordance with the standards of the Public Company Accounting Oversight Board (United States) (PCAOB), the consolidated balance sheets as of December 31, 2018 and 2017, and the related consolidated statements of operations, shareholders' equity and cash flows for each of the two years in the period ended December 31, 2018, and the related notes and our report dated February 28, 2019 expressed an unqualified opinion thereon.
Basis for Opinion
The Company's management is responsible for maintaining effective internal control over financial reporting and for its assessment of the effectiveness of internal control over financial reporting included in the accompanying Management's Annual Report on Internal Control over Financial Reporting. Our responsibility is to express an opinion on the Company's internal control over financial reporting based on our audit. We are a public accounting firm registered with the PCAOB and are required to be independent with respect to the Company in accordance with the U.S. federal securities laws and the applicable rules and regulations of the Securities and Exchange Commission and the PCAOB.
We conducted our audit in accordance with the standards of the PCAOB. Those standards require that we plan and perform the audit to obtain reasonable assurance about whether effective internal control over financial reporting was maintained in all material respects.
Our audit included obtaining an understanding of internal control over financial reporting, assessing the risk that a material weakness exists, testing and evaluating the design and operating effectiveness of internal control based on the assessed risk, and performing such other procedures as we considered necessary in the circumstances. We believe that our audit provides a reasonable basis for our opinion.
Definition and Limitations of Internal Control Over Financial Reporting
A company's internal control over financial reporting is a process designed to provide reasonable assurance regarding the reliability of financial reporting and the preparation of financial statements for external purposes in accordance with generally accepted accounting principles. A company's internal control over financial reporting includes those policies and procedures that (1) pertain to the maintenance of records that, in reasonable detail, accurately and fairly reflect the transactions and dispositions of the assets of the company; (2) provide reasonable assurance that transactions are recorded as necessary to permit preparation of financial statements in accordance with generally accepted accounting principles, and that receipts and expenditures of the company are being made only in accordance with authorizations of management and directors of the company; and (3) provide reasonable assurance regarding prevention or timely detection of unauthorized acquisition, use, or disposition of the company's assets that could have a material effect on the financial statements.
Because of its inherent limitations, internal control over financial reporting may not prevent or detect misstatements. Also, projections of any evaluation of effectiveness to future periods are subject to the risk that controls may become inadequate because of changes in conditions, or that the degree of compliance with the policies or procedures may deteriorate.
/s/ Ernst & Young LLP
Houston, Texas
February 28, 2019
F-3
Report of Independent Registered Public Accounting Firm
The Board of Directors and Shareholders
Carrizo Oil & Gas, Inc.:
We have audited the accompanying Carrizo Oil & Gas, Inc. and subsidiaries (the "Company") consolidated statements of operations, shareholders' equity, and cash flows for the year ended December 31, 2016. These consolidated financial statements are the responsibility of the Company's management. Our responsibility is to express an opinion on these consolidated financial statements based on our audit.
We conducted our audit in accordance with the standards of the Public Company Accounting Oversight Board (United States). Those standards require that we plan the audit and perform the audit to obtain reasonable assurance about whether the financial statements are free of material misstatement. An audit includes examining, on a test basis, evidence supporting the amounts and disclosures in the financial statements. An audit also includes assessing the accounting principles used and significant estimates made by management, as well as evaluating the overall financial statement presentation. We believe that our audit provides a reasonable basis for our opinion.
In our opinion, the consolidated financial statements referred to above present fairly, in all material respects, the Company's results of operations, shareholders' equity and cash flows for the year ended December 31, 2016, in conformity with U.S. generally accepted accounting principles.
/s/ KPMG LLP
Houston, Texas
February 27, 2017
F-4
CARRIZO OIL & GAS, INC.
CONSOLIDATED BALANCE SHEETS
(In thousands, except share and per share amounts)
|
| December 31, | ||||||
|
| 2018 |
| 2017 | ||||
Assets |
|
|
|
| ||||
Current assets |
|
|
|
| ||||
Cash and cash equivalents |
| | $2,282 | |
| | $9,540 | |
Accounts receivable, net |
| 99,723 | |
| 107,441 | | ||
Derivative assets |
| 39,904 | |
| - | | ||
Other current assets |
| 8,460 | |
| 5,897 | | ||
Total current assets |
| 150,369 | |
| 122,878 | | ||
Property and equipment |
|
|
|
| ||||
Oil and gas properties, full cost method |
|
|
|
| ||||
Proved properties, net |
| 2,333,470 | |
| 1,965,347 | | ||
Unproved properties, not being amortized |
| 673,833 | |
| 660,287 | | ||
Other property and equipment, net |
| 11,221 | |
| 10,176 | | ||
Total property and equipment, net |
| 3,018,524 | |
| 2,635,810 | | ||
Other long-term assets |
| 16,207 | |
| 19,616 | | ||
Total Assets |
| | $3,185,100 | |
| | $2,778,304 | |
|
|
|
|
| ||||
Liabilities and Shareholders' Equity |
|
|
|
| ||||
Current liabilities |
|
|
|
| ||||
Accounts payable |
| | $98,811 | |
| | $74,558 | |
Revenues and royalties payable |
| 49,003 | |
| 52,154 | | ||
Accrued capital expenditures |
| 60,004 | |
| 119,452 | | ||
Accrued interest |
| 18,377 | |
| 28,362 | | ||
Derivative liabilities |
| 55,205 | |
| 57,121 | | ||
Other current liabilities | | 40,609 | |
| 41,175 | | ||
Total current liabilities |
| 322,009 | |
| 372,822 | | ||
Long-term debt |
| 1,633,591 | |
| 1,629,209 | | ||
Asset retirement obligations |
| 18,360 | |
| 23,497 | | ||
Derivative liabilities |
| 40,817 | |
| 112,332 | | ||
Deferred income taxes |
| 8,017 | |
| 3,635 | | ||
Other long-term liabilities |
| 6,980 | |
| 51,650 | | ||
Total liabilities |
| 2,029,774 | |
| 2,193,145 | | ||
Commitments and contingencies |
| | |
| | | ||
Preferred stock |
|
|
|
| ||||
Preferred stock, $0.01 par value, 10,000,000 shares authorized; 200,000 issued and outstanding as of December 31, 2018 and 250,000 issued and outstanding as of December 31, 2017 |
| 174,422 | |
| 214,262 | | ||
Shareholders' equity |
|
|
|
| ||||
Common stock, $0.01 par value, 180,000,000 shares authorized; 91,627,738 issued and outstanding as of December 31, 2018 and 81,454,621 issued and outstanding as of December 31, 2017 |
| 916 | |
| 815 | | ||
Additional paid-in capital |
| 2,131,535 | |
| 1,926,056 | | ||
Accumulated deficit |
| (1,151,547 | ) |
| (1,555,974 | ) | ||
Total shareholders' equity |
| 980,904 | |
| 370,897 | | ||
Total Liabilities and Shareholders' Equity |
| | $3,185,100 | |
| | $2,778,304 | |
The accompanying notes are an integral part of these consolidated financial statements.
F-5
CARRIZO OIL & GAS, INC.
CONSOLIDATED STATEMENTS OF OPERATIONS
(In thousands, except per share amounts)
|
| Years Ended December 31, | ||||||||||
|
| 2018 |
| 2017 |
| 2016 | ||||||
Revenues |
|
|
|
|
|
| ||||||
Crude oil |
| | $911,554 | |
| | $633,233 | |
| | $378,073 | |
Natural gas liquids |
| 96,585 | |
| 47,405 | |
| 22,428 | | |||
Natural gas |
| 57,803 | |
| 65,250 | |
| 43,093 | | |||
Total revenues |
| 1,065,942 | |
| 745,888 | |
| 443,594 | | |||
|
|
|
|
|
|
| ||||||
Costs and Expenses |
|
|
|
|
|
| ||||||
Lease operating |
| 161,596 | |
| 139,854 | |
| 98,717 | | |||
Production taxes |
| 50,591 | |
| 32,509 | |
| 19,046 | | |||
Ad valorem taxes |
| 10,422 | |
| 7,267 | |
| 5,559 | | |||
Depreciation, depletion and amortization |
| 299,530 | |
| 262,589 | |
| 213,962 | | |||
General and administrative, net |
| 68,617 | |
| 66,229 | |
| 74,972 | | |||
(Gain) loss on derivatives, net |
| (6,709 | ) |
| 59,103 | |
| 49,073 | | |||
Interest expense, net |
| 62,413 | |
| 80,870 | |
| 79,403 | | |||
Impairment of proved oil and gas properties |
| - | |
| - | |
| 576,540 | | |||
Loss on extinguishment of debt |
| 9,586 | |
| 4,170 | |
| - | | |||
Other expense, net |
| 296 | |
| 2,157 | |
| 1,796 | | |||
Total costs and expenses |
| 656,342 | |
| 654,748 | |
| 1,119,068 | | |||
|
|
|
|
|
|
| ||||||
Income (Loss) Before Income Taxes |
| 409,600 | |
| 91,140 | |
| (675,474 | ) | |||
Income tax expense |
| (5,173 | ) |
| (4,030 | ) |
| - | | |||
Net Income (Loss) |
| | $404,427 | |
| | $87,110 | |
| | ($675,474 | ) |
Dividends on preferred stock |
| (18,161 | ) |
| (7,781 | ) |
| - | | |||
Accretion on preferred stock |
| (3,057 | ) |
| (862 | ) |
| - | | |||
Loss on redemption of preferred stock |
| (7,133 | ) |
| - | |
| - | | |||
Net Income (Loss) Attributable to Common Shareholders |
| | $376,076 | |
| | $78,467 | |
| | ($675,474 | ) |
|
|
|
|
|
|
| ||||||
Net Income (Loss) Attributable to Common Shareholders Per Common Share |
|
|
|
|
|
| ||||||
Basic |
| | $4.40 | |
| | $1.07 | |
| | ($11.27 | ) |
Diluted |
| | $4.32 | |
| | $1.06 | |
| | ($11.27 | ) |
|
|
|
|
|
|
| ||||||
Weighted Average Common Shares Outstanding |
|
|
|
|
|
| ||||||
Basic |
| 85,509 | |
| 73,421 | |
| 59,932 | | |||
Diluted |
| 87,143 | |
| 73,993 | |
| 59,932 | | |||
The accompanying notes are an integral part of these consolidated financial statements.
F-6
CARRIZO OIL & GAS, INC.
CONSOLIDATED STATEMENTS OF SHAREHOLDERS' EQUITY
|
| Common Stock |
| Additional |
|
Deficit |
| Total | |||||||||||
|
| Shares |
| Amount |
|
|
| ||||||||||||
Balance as of January 1, 2016 |
| 58,332,993 | |
| | $583 | |
| | $1,411,081 | |
| | ($967,610 | ) |
| | $444,054 | |
Stock-based compensation expense |
| - | |
| - | |
| 31,194 | |
| - | |
| 31,194 | | ||||
Issuance of common stock upon grants of restricted stock awards and vestings of restricted stock units |
| 799,506 | |
| 8 | |
| (63 | ) |
| - | |
| (55 | ) | ||||
Sale of common stock, net of offering costs |
| 6,000,000 | |
| 60 | |
| 223,679 | |
| - | |
| 223,739 | | ||||
Net loss |
| - | |
| - | |
| - | |
| (675,474 | ) |
| (675,474 | ) | ||||
Balance as of December 31, 2016 |
| 65,132,499 | |
| | $651 | |
| | $1,665,891 | |
| | ($1,643,084 | ) |
| | $23,458 | |
Stock-based compensation expense |
| - | |
| - | |
| 23,625 | |
| - | |
| 23,625 | | ||||
Issuance of common stock upon grants of restricted stock awards and vestings of restricted stock units and performance shares |
| 722,122 | |
| 8 | |
| (42 | ) |
| - | |
| (34 | ) | ||||
Sale of common stock, net of offering costs |
| 15,600,000 | |
| 156 | |
| 222,222 | |
| - | |
| 222,378 | | ||||
Issuance of warrants |
| - | |
| - | |
| 23,003 | |
| - | |
| 23,003 | | ||||
Dividends on preferred stock |
| - | |
| - | |
| (7,781 | ) |
| - | |
| (7,781 | ) | ||||
Accretion on preferred stock |
| - | |
| - | |
| (862 | ) |
| - | |
| (862 | ) | ||||
Net income |
| - | |
| - | |
| - | |
| 87,110 | |
| 87,110 | | ||||
Balance as of December 31, 2017 |
| 81,454,621 | |
| | $815 | |
| | $1,926,056 | |
| | ($1,555,974 | ) |
| | $370,897 | |
Stock-based compensation expense |
| - | |
| - | |
| 20,412 | |
| - | |
| 20,412 | | ||||
Issuance of common stock upon grants of restricted stock awards and vestings of restricted stock units and performance shares, net of forfeitures |
| 673,117 | |
| 6 | |
| (233 | ) |
| - | |
| (227 | ) | ||||
Sale of common stock, net of offering costs |
| 9,500,000 | |
| 95 | |
| 213,651 | |
| - | |
| 213,746 | | ||||
Dividends on preferred stock |
| - | |
| - | |
| (18,161 | ) |
| - | |
| (18,161 | ) | ||||
Accretion on preferred stock |
| - | |
| - | |
| (3,057 | ) |
| - | |
| (3,057 | ) | ||||
Loss on redemption of preferred stock |
| - | |
| - | |
| (7,133 | ) |
| - | |
| (7,133 | ) | ||||
Net income |
| - | |
| - | |
| - | |
| 404,427 | |
| 404,427 | | ||||
Balance as of December 31, 2018 |
| 91,627,738 | |
| | $916 | |
| | $2,131,535 | |
| | ($1,151,547 | ) |
| | $980,904 | |
The accompanying notes are an integral part of these consolidated financial statements.
F-7
CARRIZO OIL & GAS, INC.
CONSOLIDATED STATEMENTS OF CASH FLOWS
(In thousands)
|
| Years Ended December 31, | ||||||||||
|
| 2018 |
| 2017 |
| 2016 | ||||||
Cash Flows From Operating Activities |
|
|
|
|
|
| ||||||
Net income (loss) |
| | $404,427 | |
| | $87,110 | |
| | ($675,474 | ) |
Adjustments to reconcile net income (loss) to net cash provided by operating activities |
|
|
|
|
|
| ||||||
Depreciation, depletion and amortization |
| 299,530 | |
| 262,589 | |
| 213,962 | | |||
Impairment of proved oil and gas properties |
| - | |
| - | |
| 576,540 | | |||
(Gain) loss on derivatives, net |
| (6,709 | ) |
| 59,103 | |
| 49,073 | | |||
Cash received (paid) for derivative settlements, net |
| (96,307 | ) |
| 7,773 | |
| 119,369 | | |||
Loss on extinguishment of debt |
| 9,586 | |
| 4,170 | |
| - | | |||
Stock-based compensation expense, net |
| 13,524 | |
| 14,309 | |
| 36,086 | | |||
Deferred income tax expense |
| 4,381 | |
| 3,635 | |
| - | | |||
Non-cash interest expense, net |
| 2,567 | |
| 3,657 | |
| 4,172 | | |||
Other, net |
| 4,216 | |
| 2,337 | |
| 3,753 | | |||
Changes in components of working capital and other assets and liabilities- |
|
|
|
|
|
| ||||||
Accounts receivable |
| 24,008 | |
| (41,630 | ) |
| (12,836 | ) | |||
Accounts payable |
| 16,013 | |
| 11,822 | |
| (30,130 | ) | |||
Accrued liabilities |
| (19,154 | ) |
| 11,512 | |
| (7,938 | ) | |||
Other assets and liabilities, net |
| (2,527 | ) |
| (3,406 | ) |
| (3,809 | ) | |||
Net cash provided by operating activities |
| 653,555 | |
| 422,981 | |
| 272,768 | | |||
Cash Flows From Investing Activities |
|
|
|
|
|
| ||||||
Capital expenditures |
| (968,828 | ) |
| (654,711 | ) |
| (480,929 | ) | |||
Acquisitions of oil and gas properties |
| (204,854 | ) |
| (695,774 | ) |
| (153,521 | ) | |||
Proceeds from divestitures of oil and gas properties |
| 381,434 | |
| 197,564 | |
| 15,564 | | |||
Other, net |
| (3,720 | ) |
| (6,531 | ) |
| (946 | ) | |||
Net cash used in investing activities |
| (795,968 | ) |
| (1,159,452 | ) |
| (619,832 | ) | |||
Cash Flows From Financing Activities |
|
|
|
|
|
| ||||||
Issuance of senior notes, net of issuance costs |
| - | |
| 245,418 | |
| - | | |||
Redemptions of senior notes and other long-term debt |
| (460,540 | ) |
| (152,813 | ) |
| - | | |||
Redemption of preferred stock |
| (50,030 | ) |
| - | |
| - | | |||
Borrowings under credit agreement |
| 3,309,400 | |
| 1,992,523 | |
| 770,291 | | |||
Repayments of borrowings under credit agreement |
| (2,856,269 | ) |
| (1,788,223 | ) |
| (683,291 | ) | |||
Payments of credit facility amendment fees |
| (1,674 | ) |
| (4,469 | ) |
| (1,330 | ) | |||
Sale of common stock, net of offering costs |
| 213,746 | |
| 222,378 | |
| 223,739 | | |||
Sale of preferred stock, net of issuance costs |
| - | |
| 236,404 | |
| - | | |||
Payments of dividends on preferred stock |
| (18,161 | ) |
| (7,781 | ) |
| - | | |||
Other, net |
| (1,317 | ) |
| (1,620 | ) |
| (1,069 | ) | |||
Net cash provided by financing activities |
| 135,155 | |
| 741,817 | |
| 308,340 | | |||
Net Increase (Decrease) in Cash and Cash Equivalents |
| (7,258 | ) |
| 5,346 | |
| (38,724 | ) | |||
Cash and Cash Equivalents, Beginning of Year |
| 9,540 | |
| 4,194 | |
| 42,918 | | |||
Cash and Cash Equivalents, End of Year |
| | $2,282 | |
| | $9,540 | |
| | $4,194 | |
The accompanying notes are an integral part of these consolidated financial statements.
F-8
CARRIZO OIL & GAS, INC.
NOTES TO CONSOLIDATED FINANCIAL STATEMENTS
1. Nature of Operations
Carrizo Oil & Gas, Inc. is a Houston-based energy company which, together with its subsidiaries (collectively, the "Company"), is actively engaged in the exploration, development, and production of crude oil, NGLs, and natural gas from resource plays located in the United States. The Company's current operations are principally focused in proven, producing oil and gas plays in the Eagle Ford Shale in South Texas and the Permian Basin in West Texas.
2. Summary of Significant Accounting Policies
Basis of Presentation and Principles of Consolidation
The consolidated financial statements include the accounts of the Company after elimination of intercompany transactions and balances and are presented in accordance with U.S. generally accepted accounting principles ("GAAP"). The Company proportionately consolidates its undivided interests in oil and gas properties as well as investments in unincorporated entities, such as partnerships and limited liability companies where the Company, as a partner or member, has undivided interests in the oil and gas properties. Certain reclassifications have been made to prior period amounts to conform to the current period presentation. Such reclassifications had no material impact on prior period amounts.
Use of Estimates
The preparation of financial statements in conformity with GAAP requires management to make estimates and assumptions that affect the reported amounts of assets and liabilities and disclosures of contingent assets and liabilities at the date of the financial statements and the reported amounts of revenues and expenses during the periods reported. Certain of such estimates and assumptions are inherently unpredictable and will differ from actual results.
Significant estimates include volumes of proved oil and gas reserves, which are used in calculating depreciation, depletion and amortization ("DD&A") of proved oil and gas property costs, the present value of estimated future net revenues included in the full cost ceiling test, estimates of future taxable income used in assessing the realizability of deferred tax assets, and the estimated timing of cash outflows underlying asset retirement obligations. Oil and gas reserve estimates, and therefore calculations based on such reserve estimates, are subject to numerous inherent uncertainties, the accuracy of which, is a function of the quality and quantity of available data, the application of engineering and geological interpretation and judgment to available data and the interpretation of mineral leaseholds and other contractual arrangements, including adequacy of title and drilling requirements. These estimates also depend on assumptions regarding quantities and production rates of recoverable oil and gas reserves, oil and gas prices, timing and amounts of development costs and operating expenses, all of which will vary from those assumed in the Company's estimates. Other significant estimates are involved in determining acquisition date fair values of assets acquired and liabilities assumed, impairments of unevaluated leasehold costs, fair values of commodity derivative assets and liabilities, fair values of contingent consideration arrangements, fair value of preferred stock upon issuance, grant date fair value of stock-based awards, and evaluating disputed claims, interpreting contractual arrangements and contingencies. Estimates are based on current assumptions that may be materially affected by the results of subsequent drilling and completion, testing and production as well as subsequent changes in oil and gas prices, interest rates and the market value and volatility of the Company's common stock.
Cash and Cash Equivalents
Cash equivalents include highly liquid investments with original maturities of three months or less. Certain of the Company's cash accounts are zero-balance controlled disbursement accounts that do not have the right of offset against the Company's other cash balances. The outstanding checks written against these zero-balance accounts have been classified as a component of accounts payable in the consolidated balance sheets and totaled $70.4 million and $62.6 million as of December 31, 2018 and 2017 , respectively.
Accounts Receivable
The Company's accounts receivable consist primarily of receivables from crude oil, NGL, and natural gas purchasers and joint interest owners in properties the Company operates. The Company generally has the right to withhold future revenue distributions to recover past due receivables from joint interest owners. Generally, the Company's receivables from the sale of crude oil are collected within one month and receivables from the sale of NGL and natural gas are collected within two months. The Company establishes an allowance for doubtful accounts when it determines it is probable that it will not collect all or a part of an accounts receivable balance. The Company assesses the collectability of its accounts receivable on a quarterly basis and adjusts the allowance as necessary using the specific identification method. The Company's allowance for doubtful accounts and bad debt expense was immaterial for all periods presented.
F-9
Concentration of Credit Risk and Major Customers
The concentration of accounts receivable from entities in the oil and gas industry may impact the Company's overall credit risk such that these entities may be similarly affected by changes in economic and other industry conditions. The Company generally does not require collateral from its purchasers or joint interest owners.
The Company does not believe the loss of any one of its purchasers would materially affect its ability to sell the oil and gas it produces as other purchasers are available in its primary areas of activity. The Company had the following major customers that represented 10% or more of its total revenues for at least one of the periods presented:
| Years Ended December 31, | ||||
| 2018 |
| 2017 |
| 2016 |
Shell Trading (US) Company | 73% |
| 69% |
| 56% |
Flint Hills Resources, LP | * |
| * |
| 15% |
|
* - Less than 10% for the respective year.
The Company's counterparties to its commodity derivative instruments include lenders under the Company's credit agreement ("Lender Counterparty") as well as counterparties who are not lenders under the Company's credit agreement ("Non-Lender Counterparty"). As each Lender Counterparty has an investment grade credit rating and the Company has obtained a guaranty from each Non-Lender Counterparty's parent company which has an investment grade credit rating, the Company believes it does not have significant credit risk with its commodity derivative instrument counterparties. Although the Company does not currently anticipate nonperformance from its counterparties, it continually monitors the credit ratings of each Lender Counterparty and each Non-Lender Counterparty's parent company. The Company executes its derivative instruments with seventeen counterparties to minimize its credit exposure to any individual counterparty.
Oil and Gas Properties
Oil and gas properties are accounted for using the full cost method of accounting under which all productive and nonproductive costs directly associated with property acquisition, exploration and development activities are capitalized to cost centers established on a country-by-country basis. The internal cost of employee compensation and benefits, including stock-based compensation, directly associated with acquisition, exploration and development activities are capitalized to either proved or unproved oil and gas properties based on the type of activity. Internal costs related to production, general corporate overhead and similar activities are expensed as incurred.
Capitalized oil and gas property costs within a cost center are amortized on an equivalent unit-of-production method, converting natural gas to barrels of oil equivalent at the ratio of six thousand cubic feet of gas to one barrel of oil, which represents their approximate relative energy content. The equivalent unit-of-production amortization rate is computed on a quarterly basis by dividing current quarter production by proved oil and gas reserves at the beginning of the quarter then applying such amortization rate to proved oil and gas property costs, which includes estimated asset retirement costs, less accumulated amortization, plus the estimated future expenditures (based on current costs) to be incurred in developing proved reserves, net of estimated salvage values.
Unproved properties, not being amortized, include unevaluated leasehold and seismic costs associated with specific unevaluated properties and related capitalized interest. Individually significant unevaluated leaseholds are assessed on a quarterly basis to determine whether or not and to what extent proved reserves have been assigned to the properties or if an impairment has occurred, in which case the related costs along with associated capitalized interest are reclassified to proved oil and gas properties. Factors the Company considers in its impairment assessment include drilling results by the Company and other operators, the terms of oil and gas leases not held by production and drilling, completion, and infrastructure capital expenditure plans. Individually insignificant unevaluated leaseholds are grouped by major area and added to proved oil and gas properties based on the average primary lease term of the properties. Geological and geophysical costs not associated with specific prospects are recorded to proved oil and gas property costs as incurred. The amount of interest costs capitalized is determined on a quarterly basis based on the average balance of unproved properties and the weighted average interest rate of outstanding borrowings.
At the end of each quarter, the net book value of oil and gas properties, less related deferred income taxes, are limited to the "cost center ceiling" equal to (i) the sum of (a) the present value of estimated future net revenues from proved oil and gas reserves, less estimated future expenditures to be incurred in developing and producing the proved reserves computed using a discount factor of 10% , (b) the costs of unproved properties not being amortized, and (c) the lower of cost or estimated fair value of unproved properties included in the costs being amortized; less (ii) related income tax effects. Any excess of the net book value of oil and gas properties, less related deferred income taxes, over the cost center ceiling is recognized as an impairment of proved oil and gas properties. An impairment recognized in one period may not be reversed in a subsequent period even if higher commodity
F-10
prices in the future result in a cost center ceiling in excess of the net book value of oil and gas properties, less related deferred income taxes.
The estimated future net revenues used in the cost center ceiling are calculated using the average realized prices for sales of crude oil, NGLs and natural gas on the first calendar day of each month during the 12-month period prior to the end of the current quarter ("12-Month Average Realized Price"), held flat for the life of the production, except where different prices are fixed and determinable from applicable contracts for the remaining term of those contracts. Prices do not include the impact of commodity derivative instruments as the Company elected not to meet the criteria to qualify its commodity derivative instruments for hedge accounting treatment.
Proceeds from the sale of proved and unproved oil and gas properties are recognized as a reduction of proved oil and gas property costs with no gain or loss recognized, unless the sale significantly alters the relationship between capitalized costs and proved reserves of oil and gas attributable to a cost center. For the years ended December 31, 2018 , 2017 and 2016 , the Company did not have any sales of oil and gas properties that significantly altered such relationship.
Depreciation of other property and equipment is recognized using the straight-line method based on estimated useful lives ranging from three to ten years.
Debt Issuance Costs
Debt issuance costs associated with the revolving credit facility are classified in "Other long-term assets" in the consolidated balance sheets and are amortized to interest expense on a straight-line basis over the term of the facility. Debt issuance costs associated with the senior notes are classified as a reduction of the related long-term debt in the consolidated balance sheets and are amortized to interest expense using the effective interest method over the terms of the related senior notes.
Financial Instruments
The Company's financial instruments consist of cash and cash equivalents, receivables, payables, commodity derivative assets and liabilities, contingent consideration arrangements determined to be embedded derivatives and long-term debt. The carrying amounts of cash and cash equivalents, receivables and payables approximate fair value due to the highly liquid or short-term nature of these instruments. The fair values of the Company's commodity derivative assets and liabilities are based on a third-party industry-standard pricing model using contract terms and prices and assumptions and inputs that are substantially observable in active markets throughout the full term of the instruments, including forward oil and gas price curves, discount rates, volatility factors and credit risk adjustments. The fair values of the Company's contingent consideration arrangements are determined by a third-party valuation specialist using Monte Carlo simulations including significant inputs such as future commodity prices, volatility factors for the future commodity prices and a risk adjusted discount rate.
The carrying amount of long-term debt associated with borrowings outstanding under the Company's revolving credit facility approximates fair value as borrowings bear interest at variable rates. The carrying amounts of the Company's senior notes and other long-term debt may not approximate fair value because carrying amounts are net of unamortized premiums and debt issuance costs, and the senior notes and other long-term debt bear interest at fixed rates. See "Note 6. Long-Term Debt" and "Note 13. Fair Value Measurements" for additional discussion.
Asset Retirement Obligations
The Company's asset retirement obligations represent the present value of the estimated future costs associated with plugging and abandoning oil and gas wells, removing production equipment and facilities and restoring the surface of the land in accordance with the terms of oil and gas leases and applicable local, state and federal laws. Determining asset retirement obligations requires estimates of the costs of plugging and abandoning oil and gas wells, removing production equipment and facilities and restoring the surface of the land as well as estimates of the economic lives of the oil and gas wells and future inflation rates. The resulting estimate of future cash outflows are discounted using a credit-adjusted risk-free interest rate that corresponds with the timing of the cash outflows. Cost estimates consider historical experience, third party estimates, the requirements of oil and gas leases and applicable local, state and federal laws, but do not consider estimated salvage values. Asset retirement obligations are recognized when the well is drilled or acquired or when the production equipment and facilities are installed or acquired with an associated increase in proved oil and gas property costs. Asset retirement obligations are accreted each period through DD&A to their expected settlement values with any difference between the actual cost of settling the asset retirement obligations and recorded amount being recognized as an adjustment to proved oil and gas property costs. Cash paid to settle asset retirement obligations is included in net cash provided by operating activities in the consolidated statements of cash flows. On a quarterly basis, when indicators suggest there have been material changes in the estimates underlying the obligation, the Company reassesses its asset retirement obligations to determine whether any revisions to the obligations are necessary. At least annually, the Company reassesses all of its asset retirement obligations to determine whether any revisions to the obligations are necessary. Revisions typically occur due to changes in estimated costs or economic lives of the oil and gas wells, or if federal or state regulators enact new requirements regarding plugging and abandoning oil and gas wells. See "Note 7. Asset Retirement Obligations" for additional discussion.
F-11
Commitments and Contingencies
Liabilities are recognized for contingencies when (i) it is both probable that an asset has been impaired or that a liability has been incurred and (ii) the amount of such loss is reasonably estimable. See "Note 8. Commitments and Contingencies" for additional discussion.
Revenue Recognition
The Company's revenues are comprised solely of revenues from customers and include the sale of crude oil, NGLs, and natural gas. The Company believes that the disaggregation of revenue into these three major product types appropriately depicts how the nature, amount, timing and uncertainty of revenue and cash flows are affected by economic factors based on its single geographic location. Crude oil, NGL, and natural gas revenues are recognized at a point in time when production is sold to a purchaser at a fixed or determinable price, delivery has occurred, control has transferred and collectability of the revenue is probable. The transaction price used to recognize revenue is a function of the contract billing terms. Revenue is invoiced by calendar month based on volumes at contractually based rates with payment typically required within 30 days of the end of the production month. At the end of each month when the performance obligation is satisfied, the variable consideration can be reasonably estimated and amounts due from customers are accrued in "Accounts receivable, net" in the consolidated balance sheets. As of December 31, 2018 and December 31, 2017 , receivables from contracts with customers were $77.1 million and $85.6 million , respectively. Taxes assessed by governmental authorities on crude oil, NGL, and natural gas sales are presented separately from such revenues in the consolidated statements of operations.
Crude oil sales. Crude oil production is primarily sold at the wellhead at an agreed upon index price, net of pricing differentials. Revenue is recognized when control transfers to the purchaser at the wellhead, net of transportation costs incurred by the purchaser.
Natural gas and NGL sales. Natural gas is delivered to a midstream processing entity at the wellhead or the inlet of the midstream processing entity's system. The midstream processing entity gathers and processes the natural gas and remits proceeds for the resulting sales of NGLs and residue gas. The Company evaluates whether it is the principal or agent in the transaction and has concluded it is the principal and the purchasers of the NGLs and residue gas are the customers. Revenue is recognized on a gross basis, with gathering, processing and transportation fees recognized as lease operating expense in the consolidated statements of operations as the Company maintains control throughout processing.
Transaction Price Allocated to Remaining Performance Obligations . The Company applied the practical expedient in ASC 606 exempting the disclosure of the transaction price allocated to remaining performance obligations if the variable consideration is allocated entirely to a wholly unsatisfied performance obligation. Each unit of product typically represents a separate performance obligation, therefore, future volumes are wholly unsatisfied and disclosure of the transaction price allocated to remaining performance obligations is not required.
Derivative Instruments
The Company uses commodity derivative instruments to mitigate the effects of commodity price volatility for a portion of its forecasted sales of production and achieve a more predictable level of cash flow. All commodity derivative instruments are recorded in the consolidated balance sheets as either an asset or liability measured at fair value. The Company nets its commodity derivative instrument fair value amounts executed with the same counterparty, along with any deferred premium obligations, to a single asset or liability pursuant to International Swap Dealers Association Master Agreements ("ISDAs"), which provide for net settlement over the term of the contract and in the event of default or termination of the contract. The Company does not enter into commodity derivative instruments for speculative purposes.
The Company has entered into agreements for acquisitions or divestitures of oil and gas properties that include obligations to pay the seller or rights to receive from the buyer, respectively, additional consideration if commodity prices exceed specified thresholds during certain periods in the future. These contingent consideration assets and liabilities are required to be bifurcated and accounted for separately as derivative instruments as they are not considered to be clearly and closely related to the host contract, and recognized at their acquisition or divestiture date fair value in the consolidated balance sheets.
The Company has elected not to meet the criteria to qualify its commodity derivative instruments for hedge accounting treatment. Therefore, all gains and losses as a result of changes in the fair value of commodity derivative instruments, as well as its contingent consideration arrangements, are recognized as "(Gain) loss on derivatives, net" in the consolidated statements of operations in the period in which the changes occur. Deferred premium obligations associated with the Company's commodity derivative instruments are recognized as "(Gain) loss on derivatives, net" in the consolidated statements of operations in the period in which the deferred premium obligations are incurred.
Cash flows are impacted to the extent that settlements of commodity derivative instruments, including deferred premium obligations, and contingent consideration arrangements result in cash received or paid during the period and are recognized as "Cash received (paid) for derivative settlements, net" in the consolidated statements of cash flows. Cash received or paid in
F-12
settlement of contingent consideration assets or liabilities, respectively, are classified as cash flows from financing activities up to the divestiture or acquisition date fair value with any excess classified as cash flows from operating activities.
The Company's Board of Directors establishes risk management policies and, on a quarterly basis, reviews its commodity derivative instruments, including volumes, types of instruments and counterparties. These policies require that commodity derivative instruments be executed only by the President or Chief Financial Officer after consultation with and concurrence by the President, Chief Financial Officer and Chairman of the Board. See "Note 12. Derivative Instruments" for additional discussion.
Preferred Stock and Common Stock Warrants
The Company applies the accounting standards for distinguishing liabilities from equity when determining the classification and measurement of preferred stock. Preferred stock that is not mandatorily redeemable is excluded from liability classification and is evaluated for classification in shareholders' equity or temporary equity. As the number of common shares that could be delivered upon the holders' optional redemption is indeterminate, the Company cannot assert that it will be able to settle in shares of its common stock and, as a result, presents preferred stock as temporary equity. On a quarterly basis, the Company reassesses the presentation of preferred stock in the consolidated balance sheets.
When preferred stock is issued with common stock warrants, the common stock warrants are evaluated separately to determine if they are a freestanding financial instrument to determine whether they must be recorded as a derivative instrument. The Company further evaluates the common stock warrants for equity classification and has determined they qualify for equity classification and, therefore, are presented in additional paid-in capital in the consolidated balance sheets. The preferred stock and common stock warrants are recorded based on the net proceeds received allocated to the two instrument's relative fair values. The preferred stock is subject to accretion from its relative fair value at the issuance date to the redemption value using the effective interest method. The common stock warrants do not require further adjustments from their relative fair value at the issuance date.
Dividends and accretion associated with preferred stock are presented in the consolidated statements of operations as reductions to net income, or increases of net loss, to derive net income (loss) attributable to common shareholders. Dividend payments are presented as a financing activity in the consolidated statement of cash flows.
See "Note 9. Preferred Stock and Common Stock Warrants" for further details of the Company's outstanding preferred stock and common stock warrants.
Stock-Based Compensation
The Company recognized stock-based compensation expense, net of amounts capitalized to oil and gas properties associated with restricted stock awards and units, stock appreciation rights to be settled in cash ("Cash SARs"), and performance share awards, which is recognized as "General and administrative expense, net" in the consolidated statements of operations. The Company accounts for forfeitures of equity-based incentive awards as they occur. See "Note 11. Stock-Based Compensation" for further details of the awards discussed below.
Restricted Stock Awards and Units . Stock-based compensation expense is based on the price of the Company's common stock on the grant date and recognized over the vesting period (generally one to three years) using the straight-line method, except for awards or units with performance conditions, in which case the Company uses the graded vesting method. For restricted stock awards and units granted to independent contractors, stock-based compensation expense is based on the fair value remeasured at each reporting period and recognized over the vesting period (generally three years) using the straight-line method, except for awards or units with performance conditions, in which case the Company uses the graded vesting method.
Stock Appreciation Rights. For Cash SARs, stock-based compensation expense is initially based on the grant date fair value determined using a Black-Scholes-Merton option pricing model, with the fair value liability subsequently remeasured at the end of each reporting period and recognized over the vesting period (generally two or three years) using the straight-line method, except for Cash SARs with performance conditions, in which case the Company uses the graded vesting method. For periods subsequent to vesting and prior to exercise, stock-based compensation expense is based on the fair value liability remeasured at the end of each reporting period based on the intrinsic value of the Cash SAR. The liability for Cash SARs is classified as "Other current liabilities" for the portion of the fair value liability attributable to awards that are vested or are expected to vest within the next 12 months, with the remainder classified as "Other long-term liabilities" in the consolidated balance sheets. Cash SARs typically expire between five and seven years after the date of grant. If Cash SARs expire unexercised, the cumulative compensation costs associated with such Cash SARs will be zero .
Performance Shares. For performance shares, stock-based compensation expense is based on the grant date fair value determined using a Monte Carlo valuation model and recognized over an approximate three year vesting period using the straight-line method. Each performance share represents the right to receive one share of common stock, however, the number of performance shares that vest ranges from zero to 200% of the target performance shares granted based on the total shareholder return ("TSR") of the Company's common stock relative to the TSR achieved by a specified industry peer group over an approximate three year performance period, the last day of which is also the vesting date. Compensation costs related to the performance shares will be
F-13
recognized if the requisite service period is fulfilled and the performance condition is met, even if the market condition is not achieved.
Income Taxes
Income taxes are recognized based on earnings reported for tax return purposes in addition to a provision for deferred income taxes. Deferred income taxes are recognized at the end of each reporting period for the future tax consequences of cumulative temporary differences between the tax basis of assets and liabilities and their reported amounts in the Company's consolidated financial statements based on existing tax laws and enacted statutory tax rates applicable to the periods in which the temporary differences are expected to affect taxable income. The Company assesses the realizability of its deferred tax assets on a quarterly basis by considering all available evidence (both positive and negative) to determine whether it is more likely than not that all or a portion of the deferred tax assets will not be realized and a valuation allowance is required. In making this assessment, the Company evaluates possible sources of taxable income that may be available to realize the deferred tax assets, including projected future taxable income, the reversal of existing temporary differences, taxable income in carryback years and available tax planning strategies. See "Note 5. Income Taxes" for further discussion of the deferred tax assets valuation allowance. The Company classifies interest and penalties associated with income taxes as interest expense. The Company applies the tax law ordering approach to determine the sequence in which deferred tax assets and other tax attributes are utilized.
Net Income (Loss) Attributable to Common Shareholders Per Common Share
Basic net income (loss) attributable to common shareholders per common share is based on the weighted average number of shares of common stock outstanding during the year. Diluted net income (loss) attributable to common shareholders per common share is based on the weighted average number of common shares and all potentially dilutive common shares outstanding during the year which include restricted stock awards and units, performance shares, and common stock warrants. The Company includes the number of restricted stock awards and units and common stock warrants in the calculation of diluted weighted average shares outstanding when the grant date or exercise prices are less than the average market prices of the Company's common stock for the period. The Company includes the number of performance shares in the calculation of diluted weighted average common shares outstanding based on the number of shares, if any, that would be issuable as if the end of the period was the end of the performance period. The Company has excluded any impact of the preferred stock to the calculation of diluted weighted average common shares outstanding as it has the positive intent and ability to redeem the preferred stock in cash. When a loss attributable to common shareholders exists, all potentially dilutive common shares outstanding are anti-dilutive and therefore excluded from the calculation of diluted weighted average shares outstanding.
The following table summarizes the calculation of net income (loss) attributable to common shareholders per common share:
|
| Years Ended December 31, | ||||||||||
|
| 2018 |
| 2017 |
| 2016 | ||||||
|
| (In thousands, except per share amounts) | ||||||||||
Net Income (Loss) |
| | $404,427 | |
| | $87,110 | |
| | ($675,474 | ) |
Dividends on preferred stock |
| (18,161 | ) |
| (7,781 | ) |
| - | | |||
Accretion on preferred stock |
| (3,057 | ) |
| (862 | ) |
| - | | |||
Loss on redemption of preferred stock |
| (7,133 | ) |
| - | |
| - | | |||
Net Income (Loss) Attributable to Common Shareholders |
| | $376,076 | |
| | $78,467 | |
| | ($675,474 | ) |
|
|
|
|
|
|
| ||||||
Basic weighted average common shares outstanding |
| 85,509 | |
| 73,421 | |
| 59,932 | | |||
Dilutive effect of restricted stock and performance shares |
| 949 | |
| 269 | |
| - | | |||
Dilutive effect of common stock warrants |
| 685 | |
| 303 | |
| - | | |||
Diluted weighted average common shares outstanding |
| 87,143 | |
| 73,993 | |
| 59,932 | | |||
|
|
|
|
|
|
| ||||||
Net Income (Loss) Attributable to Common Shareholders Per Common Share |
|
|
|
|
|
| ||||||
Basic |
| | $4.40 | |
| | $1.07 | |
| | ($11.27 | ) |
Diluted |
| | $4.32 | |
| | $1.06 | |
| | ($11.27 | ) |
F-14
The computation of diluted net income attributable to common shareholders per common share excluded certain restricted stock and performance shares as the impacts were anti-dilutive. The following table presents the weighted average anti-dilutive securities for the periods presented:
|
| Years Ended December 31, | |||||||
|
| 2018 |
| 2017 |
| 2016 | |||
|
| (In thousands) | |||||||
Anti-dilutive restricted stock and performance shares |
| 19 | |
| 52 | |
| 669 | |
Industry Segment and Geographic Information
The Company operates in only one industry segment, which is the exploration, development, and production of crude oil, NGLs, and natural gas. All of the Company's operations are located in the United States and currently all revenues are attributable to customers located in the United States.
Recently Adopted Accounting Standards
Revenue From Contracts with Customers . Effective January 1, 2018, the Company adopted ASU No. 2014-09, Revenue From Contracts With Customers (Topic 606) ("ASC 606") using the modified retrospective method and has applied the standard to all existing contracts. ASC 606 supersedes previous revenue recognition requirements in ASC 605 - Revenue Recognition ("ASC 605") and includes a five-step revenue recognition model to depict the transfer of goods or services to customers in an amount that reflects the consideration in exchange for those goods or services. As a result of adopting ASC 606, the Company did not have a cumulative-effect adjustment in retained earnings. The comparative information for the years ended December 31, 2017 and 2016 has not been recast and continues to be reported under the accounting standards in effect for that period. Additionally, adoption of ASC 606 did not impact net income attributable to common shareholders.
The tables below summarize the impact of adoption for the year ended December 31, 2018 :
|
| Year Ended December 31, 2018 | |||||||||||||
|
| Under ASC 606 |
| Under ASC 605 |
| Increase |
| % Increase | |||||||
|
| (In thousands) |
|
| |||||||||||
Revenues |
|
|
|
|
|
|
|
| |||||||
Crude oil |
| | $911,554 | |
| | $910,975 | |
| | $579 | |
| 0.1 | % |
Natural gas liquids |
| 96,585 | |
| 91,608 | |
| 4,977 | |
| 5.4 | % | |||
Natural gas |
| 57,803 | |
| 55,023 | |
| 2,780 | |
| 5.1 | % | |||
Total revenues |
| 1,065,942 | |
| 1,057,606 | |
| 8,336 | |
| 0.8 | % | |||
|
|
|
|
|
|
|
|
| |||||||
Costs and Expenses |
|
|
|
|
|
|
|
| |||||||
Lease operating |
| 161,596 | |
| 153,260 | |
| 8,336 | |
| 5.4 | % | |||
|
|
|
|
|
|
|
|
| |||||||
Income Before Income Taxes |
| | $409,600 | |
| | $409,600 | |
| | $- | |
| - | % |
Changes to crude oil, NGL, and natural gas revenues and lease operating expense are due to the conclusion that the Company controls the product throughout processing before transferring to the customer for certain natural gas processing arrangements. Therefore, any transportation, gathering, and processing fees incurred prior to transfer of control are included in lease operating expense.
Business Combinations. In January 2017, the Financial Accounting Standards Board ("FASB") issued ASU No. 2017-01, Business Combinations (Topic 805): Clarifying the Definition of a Business ("ASU 2017-01"), which clarifies the definition of a business to assist entities with evaluating whether transactions should be accounted for as acquisitions (or divestitures) of assets or businesses. Effective January 1, 2018, the Company adopted ASU 2017-01 using the prospective method and applied the clarified definition of a business to subsequent acquisitions and divestitures.
Statement of Cash Flows. In August 2016, the FASB issued ASU No. 2016-15, Statement of Cash Flows (Topic 230): Classification of Certain Cash Receipts and Cash Payments ("ASU 2016-15"), which is intended to reduce diversity in practice in how certain transactions are classified in the statement of cash flows. The guidance addresses eight specific cash flow issues for which current GAAP is either unclear or does not include specific guidance. Effective January 1, 2018, the Company adopted ASU 2016-15 using the retrospective approach as prescribed by ASU 2016-15. There were no changes to the statement of cash flows as a result of adoption.
Stock Compensation. In March 2016, the Financial Accounting Standards Board ("FASB") issued Accounting Standards Update ("ASU") No. 2016-09, Compensation - Stock Compensation (Topic 718): Improvements to Employee Share-Based Payment
F-15
Accounting ("ASU 2016-09"), which amends certain aspects of accounting for share-based payment arrangements. ASU 2016-09 revises or provides alternative accounting for the tax impacts of share-based payment arrangements, forfeitures, minimum statutory tax withholdings, and prescribes certain disclosures to be made in the period of adoption.
Effective January, 1, 2017, the Company adopted ASU 2016-09. Using the modified retrospective approach as prescribed by ASU 2016-09, the Company recognized previously unrecognized windfall tax benefits which resulted in a cumulative-effect adjustment to retained earnings of approximately $15.7 million . This adjustment increased deferred tax assets, which in turn increased the valuation allowance by the same amount as of the beginning of 2017, resulting in a net cumulative-effect adjustment to retained earnings of zero . Effective January 1, 2017, all windfall tax benefits and tax shortfalls are recorded as income tax expense or benefit in the consolidated statements of operations, whereas prior to adoption, windfall tax benefits were recorded as an increase to additional paid-in capital. In addition, windfall tax benefits, along with tax shortfalls, are now required to be classified as an operating cash flow as opposed to a financing cash flow. Further, the Company has elected to account for forfeitures of share-based payment awards as they occur, which resulted in an immaterial cumulative-effect adjustment to retained earnings.
Recently Issued Accounting Pronouncements
Leases. In February 2016, the FASB issued ASU No. 2016-02, Leases (Topic 842) ("ASU 2016-02"), which significantly changes accounting for leases by requiring that lessees recognize a right-of-use ("ROU") asset and a related lease liability representing the obligation to make lease payments, for virtually all lease transactions. ASU 2016-02 does not apply to leases of mineral rights to explore for or use crude oil and natural gas. Additional disclosures about an entity's lease transactions will also be required. ASU 2016-02 defines a lease as "a contract, or part of a contract, that conveys the right to control the use of identified property, plant or equipment (an identified asset) for a period of time in exchange for consideration." ASU 2016-02 is effective for interim and annual periods beginning after December 15, 2018 with early adoption permitted. ASU 2016-02 requires companies to recognize and measure leases at the beginning of the earliest period presented in the financial statements using a modified retrospective approach.
The Company will adopt ASU 2016-02 effective January 1, 2019, using the modified retrospective approach. The Company will make certain elections allowing it to not reassess contracts that commenced prior to adoption, to continue applying its current accounting policy for land easements, not to recognize ROU assets or lease liabilities for short-term leases, and will not separate lease components from non-lease components for specified asset classes. The Company has implemented a third party software which will be used to track and account for lease activity. As of December 31, 2018, the Company anticipates that the adoption of ASU 2016-02 will result in the recognition of ROU assets and lease liabilities on its consolidated balance sheets ranging from $75.0 million to $100.0 million primarily associated with office space contracts, drilling rig contracts, and contracts for the use of vehicles, information technology infrastructure and well equipment. However, the Company does not expect ASU 2016-02 to have a significant impact on its consolidated statements of operations or consolidated statements of cash flows. The Company is finalizing its accounting policies, controls, processes, and disclosures that will change as a result of adopting the new standard. As permitted by ASU No. 2018-11, Leases (Topic 842): Targeted Improvements, the Company does not expect to adjust comparative-period financial statements.
Subsequent Events
The Company evaluates subsequent events through the date the financial statements are issued. See "Note 16. Subsequent Events" for further discussion.
3. Acquisitions and Divestitures of Oil and Gas Properties
2018 Acquisitions and Divestitures
Devon Acquisition. On August 13, 2018, the Company entered into a purchase and sale agreement with Devon Energy Production Company, L.P. ("Devon"), a subsidiary of Devon Energy Corporation, to acquire oil and gas properties in the Delaware Basin in Reeves and Ward counties, Texas (the "Devon Properties") for an agreed upon price of $215.0 million , with an effective date of April 1, 2018, subject to customary purchase price adjustments (the "Devon Acquisition"). The Company paid $21.5 million as a deposit on August 13, 2018 and $183.4 million upon initial closing on October 17, 2018, which included purchase price adjustments primarily related to the net cash flows from the effective date to the closing date. The Company estimates the aggregate purchase price will be $196.6 million , however, the final purchase price remains subject to post-closing adjustments. The Company funded the Devon Acquisition with net proceeds from the common stock offering completed on August 17, 2018, which, pending the closing of the Devon Acquisition, were used to temporarily repay a portion of the borrowings outstanding under the revolving credit facility. See "Note 10. Shareholders' Equity" for further discussion.
The Devon Acquisition was accounted for as a business combination, therefore, the purchase price was allocated to the assets acquired and the liabilities assumed based on their estimated acquisition date fair values based on then currently available information. A combination of a discounted cash flow model and market data was used by a third-party valuation specialist in determining the fair value of the oil and gas properties. Significant inputs into the calculation included future commodity prices,
F-16
estimated volumes of oil and gas reserves, expectations for timing and amount of future development and operating costs, future plugging and abandonment costs and a risk adjusted discount rate. The following presents the preliminary allocation of the purchase price to the assets acquired and liabilities assumed as of the acquisition date.
|
| Preliminary Purchase Price Allocation | ||
|
| (In thousands) | ||
Assets |
|
| ||
Oil and gas properties |
|
| ||
Proved properties |
| | $47,370 | |
Unproved properties |
| 150,253 | | |
Total oil and gas properties |
| | $197,623 | |
Total assets acquired |
| | $197,623 | |
|
|
| ||
Liabilities |
|
| ||
Revenues and royalties payable |
| | $855 | |
Asset retirement obligations |
| 170 | | |
Total liabilities assumed |
| | $1,025 | |
Net Assets Acquired |
| | $196,598 | |
The results of operations for the Devon Acquisition have been included in the Company's consolidated statements of operations since the October 17, 2018 closing date, including total revenues $4.6 million and net income attributable to common shareholders of $2.7 million for the year ended December 31, 2018 .
Pro Forma Operating Results (Unaudited). The following unaudited pro forma financial information presents a summary of the Company's consolidated results of operations for the years ended December 31, 2018 and 2017 , assuming the Devon Acquisition had been completed as of January 1, 2017, including adjustments to reflect the acquisition date fair values assigned to the assets acquired and liabilities assumed. The pro forma financial information does not purport to represent what the actual results of operations would have been had the transactions been completed as of the date assumed, nor is this information necessarily indicative of future consolidated results of operations. The Company believes the assumptions used provide a reasonable basis for reflecting the significant pro forma effects directly attributable to the Devon Acquisition.
|
| Years Ended December 31, | ||||||
|
| 2018 |
| 2017 | ||||
|
| (In thousands, except per share amounts) | ||||||
Total revenues |
| | $1,086,742 | |
| | $753,474 | |
Net Income Attributable to Common Shareholders |
| | $384,639 | |
| | $78,118 | |
|
|
|
|
| ||||
Net Income Attributable to Common Shareholders Per Common Share |
|
|
|
| ||||
Basic |
| | $4.21 | |
| | $0.94 | |
Diluted |
| | $4.13 | |
| | $0.94 | |
|
|
|
|
| ||||
Weighted Average Common Shares Outstanding |
|
|
|
| ||||
Basic |
| 91,444 | |
| 82,921 | | ||
Diluted |
| 93,077 | |
| 83,493 | | ||
Delaware Basin Divestiture. On July 11, 2018, the Company closed on the divestiture of certain non-operated assets in the Delaware Basin for an agreed upon price of $30.0 million , with an effective date of May 1, 2018, subject to customary purchase price adjustments. The Company received $31.4 million upon closing on July 11, 2018 and paid $0.5 million upon post-closing on October 22, 2018, for aggregate net proceeds of $30.9 million .
Eagle Ford Divestiture. On December 11, 2017, the Company entered into a purchase and sale agreement with EP Energy E&P Company, L.P. to sell a portion of its assets in the Eagle Ford Shale for an agreed upon price of $245.0 million , with an effective date of October 1, 2017, subject to adjustment and customary terms and conditions. The Company received $24.5 million as a deposit on December 11, 2017, $211.7 million upon closing on January 31, 2018, $10.0 million for leases that were not conveyed at closing on February 16, 2018, and paid $0.5 million upon post-closing on July 19, 2018, for aggregate net proceeds of $245.7 million .
F-17
Niobrara Divestiture. On November 20, 2017, the Company entered into a purchase and sale agreement to sell substantially all of its assets in the Niobrara Formation for an agreed upon price of $140.0 million , with an effective date of October 1, 2017, subject to customary purchase price adjustments. The Company received $14.0 million as a deposit on November 20, 2017, $122.6 million upon closing on January 19, 2018, and paid $1.0 million upon post-closing on August 14, 2018, for aggregate net proceeds of $135.6 million . As part of this divestiture, the Company agreed to a contingent consideration arrangement (the "Contingent Niobrara Consideration"), which was determined to be an embedded derivative. See "Note 12. Derivative Instruments" and "Note 13. Fair Value Measurements" for further discussion.
The aggregate net proceeds for each of the 2018 divestitures discussed above were recognized as a reduction of proved oil and gas properties with no gain or loss recognized.
2017 Acquisitions and Divestitures
ExL Acquisition. On June 28, 2017, the Company entered into a purchase and sale agreement with ExL Petroleum Management, LLC and ExL Petroleum Operating Inc. to acquire oil and gas properties located in the Delaware Basin in Reeves and Ward counties, Texas for an agreed upon price of $648.0 million , with an effective date of May 1, 2017, subject to customary purchase price adjustments (the "ExL Acquisition"). The Company paid $75.0 million as a deposit on June 28, 2017, $601.0 million upon closing on August 10, 2017 and $3.8 million upon post-closing on December 8, 2017, for an aggregate cash consideration of $679.8 million , which included purchase price adjustments primarily related to the net cash flows from the effective date to the closing date. As part of the ExL Acquisition, the Company agreed to a contingent consideration arrangement (the "Contingent ExL Consideration"), which was determined to be an embedded derivative. See "Note 12. Derivative Instruments" and "Note 13. Fair Value Measurements" for further discussion.
The Company funded the ExL Acquisition with net proceeds from the sale of preferred stock on August 10, 2017, net proceeds from the common stock offering completed on July 3, 2017, and net proceeds from the senior notes offering completed on July 14, 2017. See "Note 9. Preferred Stock and Common Stock Warrants", "Note 10. Shareholders' Equity" and "Note 6. Long-Term Debt" for further discussion.
The ExL Acquisition was accounted for as a business combination, therefore, the purchase price was allocated to the assets acquired and the liabilities assumed based on their estimated acquisition date fair values based on then currently available information. A combination of a discounted cash flow model and market data was used by a third-party valuation specialist in determining the fair value of the oil and gas properties. Significant inputs into the calculation included future commodity prices, estimated volumes of oil and gas reserves, expectations for timing and amount of future development and operating costs, future plugging and abandonment costs and a risk adjusted discount rate. The fair value of the Contingent ExL Consideration was determined by a third-party valuation specialist using a Monte Carlo simulation. Significant inputs into the calculation included future commodity prices, volatility factors for the future commodity prices and a risk adjusted discount rate. See "Note 13. Fair Value Measurements" for further discussion.
The following presents the final allocation of the purchase price to the assets acquired and liabilities assumed as of the acquisition date.
|
| Purchase Price Allocation | ||
|
| (In thousands) | ||
Assets |
|
| ||
Other current assets |
| | $106 | |
Oil and gas properties |
|
| ||
Proved properties |
| 294,754 | | |
Unproved properties |
| 443,194 | | |
Total oil and gas properties |
| | $737,948 | |
Total assets acquired |
| | $738,054 | |
|
|
| ||
Liabilities |
|
| ||
Revenues and royalties payable |
| | $5,785 | |
Asset retirement obligations |
| 153 | | |
Contingent ExL Consideration |
| 52,300 | | |
Total liabilities assumed |
| | $58,238 | |
Net Assets Acquired |
| | $679,816 | |
F-18
The results of operations for the ExL Acquisition have been included in the Company's consolidated statements of operations since the August 10, 2017 closing date, including total revenues and net income attributable to common shareholders for the years ended December 31, 2018 and 2017 as shown in the table below:
|
| Years Ended December 31, | ||||||
|
| 2018 |
| 2017 | ||||
|
| (In thousands) | ||||||
Total revenues |
| | $225,135 | |
| | $53,548 | |
|
|
|
|
| ||||
Net Income Attributable to Common Shareholders |
| | $176,881 | |
| | $44,304 | |
Pro Forma Operating Results (Unaudited). The following unaudited pro forma financial information presents a summary of the Company's consolidated results of operations for the years ended December 31, 2017 and 2016, assuming the ExL Acquisition had been completed as of January 1, 2016, including adjustments to reflect the acquisition date fair values assigned to the assets acquired and liabilities assumed. The pro forma financial information does not purport to represent what the actual results of operations would have been had the transactions been completed as of the date assumed, nor is this information necessarily indicative of future consolidated results of operations. The Company believes the assumptions used provide a reasonable basis for reflecting the significant pro forma effects directly attributable to the ExL Acquisition.
|
| Years Ended December 31, | ||||||
|
| 2017 |
| 2016 | ||||
|
| (In thousands, except per share amounts) | ||||||
Total revenues |
| | $781,378 | |
| | $454,913 | |
Net Income (Loss) Attributable to Common Shareholders |
| | $91,931 | |
| | ($688,180 | ) |
|
|
|
|
| ||||
Net Income (Loss) Attributable to Common Shareholders Per Common Share |
|
|
|
| ||||
Basic |
| | $1.25 | |
| | ($9.11 | ) |
Diluted |
| | $1.24 | |
| | ($9.11 | ) |
|
|
|
|
| ||||
Weighted Average Common Shares Outstanding |
|
|
|
| ||||
Basic |
| 73,421 | |
| 75,532 | | ||
Diluted |
| 73,993 | |
| 75,532 | | ||
Marcellus Divestiture. On October 5, 2017, the Company entered into a purchase and sale agreement with BKV Chelsea, LLC, a subsidiary of Kalnin Ventures LLC, to sell substantially all of its assets in the Marcellus Shale for an agreed upon price of $84.0 million . The Company received $6.3 million into escrow as a deposit on October 5, 2017 and $67.6 million upon closing on November 21, 2017, for aggregate net proceeds of $73.9 million . As part of this divestiture, the Company agreed to a contingent consideration arrangement (the "Contingent Marcellus Consideration"), which was determined to be an embedded derivative. See "Note 12. Derivative Instruments" and "Note 13. Fair Value Measurements" for further discussion.
Effective August 2008, the Company's wholly-owned subsidiary, Carrizo (Marcellus) LLC, entered into a joint venture with ACP II Marcellus LLC ("ACP II"), an affiliate of Avista Capital Partners, LP, a private equity fund (Avista Capital Partners, LP, together with its affiliates, "Avista"). There have been no revenues, expenses, or operating cash flows in the Avista Marcellus joint venture during the years ended December 31, 2018, 2017, and 2016. The Avista Marcellus joint venture agreements terminated during the third quarter of 2018 in connection with the sale of the remaining immaterial assets.
Steven A. Webster, Chairman of the Company's Board of Directors, serves as Co-Managing Partner and President of Avista Capital Holdings, LP, which has the ability to control Avista and its affiliates. ACP II's Board of Managers has the sole authority for determining whether, when and to what extent any cash distributions will be declared and paid to members of ACP II. Mr. Webster is not a member of ACP II's Board of Managers. The terms of the Avista Marcellus joint venture were approved by a special committee of the Company's independent directors. Additionally, in 2018, the Company's Board of Directors determined that Mr. Webster is independent with respect to the Company.
Utica Divestiture . On August 31, 2017, the Company entered into a purchase and sale agreement to sell substantially all of its assets in the Utica Shale for an agreed upon price of $62.0 million . The Company received $6.2 million as a deposit on August 31, 2017, $54.4 million upon closing on November 15, 2017, and $2.5 million upon post-closing on December 28, 2017, for aggregate net proceeds of $63.1 million . As part of this divestiture, the Company agreed to a contingent consideration arrangement (the "Contingent Utica Consideration"), which was determined to be an embedded derivative. See "Note 12. Derivative Instruments" and "Note 13. Fair Value Measurements" for further discussion.
F-19
Delaware Basin Divestiture. During the first quarter of 2017, the Company sold a small undeveloped acreage position in the Delaware Basin for aggregate net proceeds of $15.3 million .
The aggregate net proceeds for each of the 2017 divestitures discussed above were recognized as a reduction of proved oil and gas properties with no gain or loss recognized.
2016 Acquisitions and Divestitures
Sanchez Acquisition. On October 24, 2016, the Company entered into a purchase and sale agreement with Sanchez Energy Corporation and SN Cotulla Assets, LLC, a subsidiary of Sanchez Energy Corporation to acquire oil and gas properties located in the Eagle Ford Shale for an agreed upon price of $181.0 million , with an effective date of June 1, 2016, subject to customary purchase price adjustments (the "Sanchez Acquisition"). The Company paid $10.0 million as a deposit on October 24, 2016, $143.5 million upon initial closing on December 14, 2016, and $7.0 million and $9.8 million on January 9, 2017 and April 13, 2017, respectively, for leases that were not conveyed to the Company at the time of the initial closing, for aggregate cash consideration of $170.3 million , which included purchase price adjustments primarily related to the net cash flows from the effective date to the closing date.
The Sanchez Acquisition was accounted for as a business combination, therefore, the purchase price was allocated to the assets acquired and liabilities assumed based on their estimated acquisition date fair values based on then currently available information.
The results of operations for the Sanchez Acquisition have been included in the Company's consolidated statements of operations since the December 14, 2016 closing date, including total revenues and net income attributable to common shareholders for the years ended December 31, 2018 , 2017 , and 2016 as shown in the table below:
|
| Years Ended December 31, | ||||||||||
|
| 2018 |
| 2017 |
| 2016 | ||||||
|
| (In thousands) | ||||||||||
Total revenues |
| | $57,780 | |
| | $37,780 | |
| | $1,459 | |
|
|
|
|
|
|
| ||||||
Net Income Attributable to Common Shareholders |
| | $38,551 | |
| | $16,459 | |
| | $966 | |
The Company did not have any material divestitures for the year ended December 31, 2016 .
4. Property and Equipment, Net
As of December 31, 2018 and 2017 , total property and equipment, net consisted of the following:
|
| December 31, | ||||||
|
| 2018 |
| 2017 | ||||
Oil and gas properties, full cost method |
| (In thousands) | ||||||
Proved properties |
| | $6,278,321 | |
| | $5,615,153 | |
Accumulated DD&A and impairments |
| (3,944,851 | ) |
| (3,649,806 | ) | ||
Proved properties, net |
| 2,333,470 | |
| 1,965,347 | | ||
Unproved properties, not being amortized |
|
|
|
| ||||
Unevaluated leasehold and seismic costs |
| 608,830 | |
| 612,589 | | ||
Capitalized interest |
| 65,003 | |
| 47,698 | | ||
Total unproved properties, not being amortized |
| 673,833 | |
| 660,287 | | ||
Other property and equipment |
| 29,191 | |
| 25,625 | | ||
Accumulated depreciation |
| (17,970 | ) |
| (15,449 | ) | ||
Other property and equipment, net |
| 11,221 | |
| 10,176 | | ||
Total property and equipment, net |
| | $3,018,524 | |
| | $2,635,810 | |
The Company capitalized internal costs of employee compensation and benefits, including stock-based compensation, directly associated with acquisition, exploration and development activities totaling $17.0 million , $14.8 million and $10.5 million for the years ended December 31, 2018, 2017 and 2016 , respectively.
The Company capitalized interest costs to unproved properties totaling $36.6 million , $28.3 million and $17.0 million for the years ended December 31, 2018, 2017 and 2016 , respectively.
Costs not subject to amortization totaling $673.8 million at December 31, 2018 were incurred in the following periods: $218.9 million in 2018 , $397.7 million in 2017 and $57.2 million in 2016 .
F-20
Impairments of Proved Oil and Gas Properties
The Company did not recognize impairments of proved oil and gas properties for the years ended December 31, 2018 and 2017 . Primarily due to declines in the 12-Month Average Realized Price of crude oil, the Company recognized impairments of proved oil and gas properties of $576.5 million for the year ended December 31, 2016.
5. Income Taxes
The components of income tax expense were as follows:
|
| Years Ended December 31, | ||||||||||
|
| 2018 |
| 2017 |
| 2016 | ||||||
|
| (In thousands) | ||||||||||
Current income tax expense |
|
|
|
|
|
| ||||||
U.S. Federal |
| | $- | |
| | $- | |
| | $- | |
State |
| (792 | ) |
| (395 | ) |
| - | | |||
Total current income tax expense |
| (792 | ) |
| (395 | ) |
| - | | |||
Deferred income tax expense |
|
|
|
|
|
| ||||||
U.S. Federal |
| - | |
| - | |
| - | | |||
State |
| (4,381 | ) |
| (3,635 | ) |
| - | | |||
Total deferred income tax expense |
| (4,381 | ) |
| (3,635 | ) |
| - | | |||
Income tax expense |
| | ($5,173 | ) |
| | ($4,030 | ) |
| | $- | |
The Company's income tax expense differs from the income tax expense computed by applying the U.S. federal statutory corporate income tax rate of 21% for the year ended December 31, 2018 and 35% for the years ended December 31, 2017 and 2016, to income (loss) before income taxes as follows:
|
| Years Ended December 31, | ||||||||||
|
| 2018 |
| 2017 |
| 2016 | ||||||
|
| (In thousands) | ||||||||||
Income (loss) before income taxes |
| | $409,600 | |
| | $91,140 | |
| | ($675,474 | ) |
Income tax (expense) benefit at the U.S. federal statutory rate |
| (86,016 | ) |
| (31,899 | ) |
| 236,416 | | |||
State income tax (expense) benefit, net of U.S. federal income tax benefit |
| (5,173 | ) |
| (4,030 | ) |
| 3,894 | | |||
Tax deficiencies related to stock-based compensation |
| (2,572 | ) |
| (3,089 | ) |
| - | | |||
Provisional impact of Tax Cuts and Jobs Act |
| - | |
| (211,724 | ) |
| - | | |||
Change in valuation allowance from provisional impact of Tax Cuts and Jobs Act |
| - | |
| 211,724 | |
| - | | |||
(Increase) decrease in valuation allowance due to current period activity |
| 90,116 | |
| 35,376 | |
| (240,864 | ) | |||
Other |
| (1,528 | ) |
| (388 | ) |
| 554 | | |||
Income tax expense |
| | ($5,173 | ) |
| | ($4,030 | ) |
| | $- | |
Significant changes in the Company's operations impact the apportionment of taxable income to the states where the Company owns oil and gas properties. As discussed in "Note 3. Acquisitions and Divestitures of Oil and Gas Properties," beginning in 2017 and continuing into 2018, the Company divested all of its assets in Marcellus, Utica, and Niobrara, and is currently operating solely in Texas. This operational shift has resulted in current and deferred tax liabilities in Texas that cannot be offset against the full valuation allowance that the Company has maintained.
F-21
Deferred Income Taxes
As of December 31, 2018 and 2017 , the net deferred income tax liabilities are comprised of the following:
|
| December 31, | ||||||
|
| 2018 |
| 2017 | ||||
|
| (In thousands) | ||||||
Deferred income tax liabilities |
|
|
|
| ||||
Oil and gas properties |
| | ($16,610 | ) |
| | ($3,635 | ) |
Derivative assets |
| (10,008 | ) |
| (2,140 | ) | ||
Total deferred income tax liabilities |
| (26,618 | ) |
| (5,775 | ) | ||
Deferred income tax assets |
|
|
|
| ||||
Net operating loss carryforward - U.S. federal and state |
| 235,788 | |
| 242,915 | | ||
Oil and gas properties |
| - | |
| 50,177 | | ||
Asset retirement obligations |
| 3,927 | |
| 4,996 | | ||
Derivative liabilities |
| 20,165 | |
| 35,585 | | ||
Other |
| 1,634 | |
| 1,496 | | ||
Total deferred income tax assets |
| 261,514 | |
| 335,169 | | ||
Deferred income tax asset valuation allowance |
| (242,913 | ) |
| (333,029 | ) | ||
Net deferred income tax assets |
| 18,601 | |
| 2,140 | | ||
Net deferred income tax liabilities |
| | ($8,017 | ) |
| | ($3,635 | ) |
Tax Cuts and Jobs Act
On December 22, 2017, the U.S. Congress enacted the Tax Cuts and Jobs Act (the "Act") which made significant changes to U.S. federal income tax law, including lowering the federal statutory corporate income tax rate to 21% from 35% beginning January 1, 2018. Due to the uncertainty regarding the application of ASC 740 in the period of enactment of the Act, the SEC issued Staff Accounting Bulletin 118 ("SAB 118") which allowed the Company to provide a provisional estimate of the impacts of the Act in its earnings for the year ended December 31, 2017 and also provided a one-year measurement period in which the Company would record additional impacts from the enactment of the Act as they are identified. As a result, the Company remeasured its deferred tax balances by applying the reduced rate and recorded a provisional deferred tax expense of $211.7 million during the year ended December 31, 2017. This provisional deferred tax expense was fully offset by a $211.7 million deferred tax benefit as a result of the associated change in the valuation allowance against the net deferred tax assets. As reflected in the rate reconciliation above, the change in the deferred tax balances due to the rate reduction had no impact on the net deferred tax balances reported in the consolidated balance sheets as of December 31, 2017 and no impact in the consolidated statements of operations for the year ended December 31, 2017.
In August 2018, the Internal Revenue Service ("IRS") issued Notice 2018-68, Guidance on the Application of Section 162(m) ("Notice 2018-68"), which provides initial guidance on the application of Section 162(m), as amended. Notice 2018-68 provided guidance regarding the group of covered employees subject to Section 162(m)'s deduction limit under the Act and the scope of transition relief available under the Act.
In November 2018, the IRS issued proposed regulations on business interest expense deduction limitations for tax years beginning after 2017, which included an expanded definition of what is considered interest expense as well as changes to the calculation of a taxpayer's adjusted taxable income in computing the interest expense limitation. The Company has assessed these proposed regulations as they pertain to the provisional tax estimate for the year ended December 31, 2018, and has concluded it will have no interest expense deduction limitation to be carried forward to future years for the 2018 tax year.
As of December 31, 2018, the Company has completed its accounting for the tax effects of enactment of the Act, with immaterial changes made to the provisional estimate that was recorded in earnings for the year ended December 31, 2017.
Deferred Tax Asset Valuation Allowance
The deferred tax asset valuation allowance was $242.9 million , $333.0 million , and $564.4 million as of December 31, 2018, 2017, and 2016, respectively. Effective January 1, 2017, the Company adopted ASU 2016-09, and recognized previously unrecognized windfall tax benefits which resulted in a cumulative-effect adjustment to retained earnings of approximately $15.7 million . This adjustment increased deferred tax assets, which in turn increased the valuation allowance by the same amount as of the beginning of 2017, resulting in a net cumulative-effect adjustment to retained earnings of zero and brought the valuation allowance to $580.1 million as of January 1, 2017. Decreases in the valuation allowance for the years ended December 31, 2018 and 2017 were based primarily on the pre-tax income recorded during those periods.
F-22
Throughout 2016, 2017, and 2018, the Company maintained a full valuation allowance against its deferred tax assets based on its conclusion, considering all available evidence (both positive and negative), that it was more likely than not the deferred taxes would not be realized. The Company intends to maintain a full valuation allowance against its deferred tax assets until there is sufficient evidence to support the reversal of such valuation allowance.
Net Operating Loss Carryforwards and Other
Net Operating Loss Carryforwards. As of December 31, 2018 , the Company had U.S. federal net operating loss carryforwards of approximately $1,062.5 million that, if not utilized in earlier periods, will expire between 2026 and 2037 .
The ability of the Company to utilize its U.S. loss carryforwards to reduce future taxable income is subject to various limitations under the Internal Revenue Code of 1986, as amended (the "Code"). The utilization of such carryforwards may be limited upon the occurrence of certain ownership changes, including the purchase or sale of stock by 5% shareholders and the offering of stock by the Company during any three-year period resulting in an aggregate change of more than 50% in the beneficial ownership of the Company. In the event of an ownership change, Section 382 of the Code imposes an annual limitation on the amount of the Company's taxable income that can be offset by these carryforwards. The limitation is generally equal to the product of (i) the fair market value of the equity of the Company multiplied by (ii) a percentage approximately equivalent to the yield on long-term tax exempt bonds during the month in which an ownership change occurs. In addition, the limitation is increased if there are recognized built-in gains during any post-change year, but only to the extent of any net unrealized built-in gains inherent in the assets sold.
Due to the issuance of the Preferred Stock and the common stock offering associated with the ExL Acquisition, as well as the common stock offering in August 2018, the Company's calculated ownership change percentage increased, however, as of December 31, 2018, the Company did not have a Section 382 limitation on the ability to utilize its U.S. net operating loss carryforwards. Future equity transactions involving the Company or 5% shareholders of the Company (including, potentially, relatively small transactions and transactions beyond the Company's control) could cause further ownership changes and therefore a limitation on the annual utilization of the U. S. net operating loss carryforwards.
Other. The Company files income tax returns in the U.S. federal jurisdiction and various states, each with varying statutes of limitations. The 2006 through 2018 tax years generally remain subject to examination by federal and state tax authorities. As of December 31, 2018 , 2017 and 2016 , the Company had no uncertain tax positions.
6. Long-Term Debt
Long-term debt consisted of the following as of December 31, 2018 and 2017 :
|
| December 31, | ||||||
|
| 2018 |
| 2017 | ||||
|
| (In thousands) | ||||||
Senior Secured Revolving Credit Facility due 2022 |
| | $744,431 | |
| | $291,300 | |
7.50% Senior Notes due 2020 |
| - | |
| 450,000 | | ||
Unamortized premium for 7.50% Senior Notes |
| - | |
| 579 | | ||
Unamortized debt issuance costs for 7.50% Senior Notes |
| - | |
| (4,492 | ) | ||
6.25% Senior Notes due 2023 |
| 650,000 | |
| 650,000 | | ||
Unamortized debt issuance costs for 6.25% Senior Notes |
| (6,878 | ) |
| (8,208 | ) | ||
8.25% Senior Notes due 2025 |
| 250,000 | |
| 250,000 | | ||
Unamortized debt issuance costs for 8.25% Senior Notes |
| (3,962 | ) |
| (4,395 | ) | ||
Other long-term debt due 2028 |
| - | |
| 4,425 | | ||
Long-term debt |
| | $1,633,591 | |
| | $1,629,209 | |
Senior Secured Revolving Credit Facility
The Company has a senior secured revolving credit facility with a syndicate of banks that, as of December 31, 2018 , had a borrowing base of $1.3 billion , with an elected commitment amount of $1.1 billion , and borrowings outstanding of $744.4 million at a weighted average interest rate of 4.17% . The credit agreement governing the revolving credit facility provides for interest-only payments until May 4, 2022, when the credit agreement matures and any outstanding borrowings are due. The borrowing base under the credit agreement is subject to regular redeterminations in the spring and fall of each year, as well as special redeterminations described in the credit agreement, which in each case may reduce the amount of the borrowing base. The amount the Company is able to borrow with respect to the borrowing base is subject to compliance with the financial covenants and other provisions of the credit agreement. The capitalized terms which are not defined in this description of the revolving credit facility, shall have the meaning given to such terms in the credit agreement.
F-23
On January 31, 2018, as a result of the Eagle Ford divestiture, the Company's borrowing base under the senior secured revolving credit facility was reduced from $900.0 million to $830.0 million , however, the elected commitment amount remained unchanged at $800.0 million . See "Note 3. Acquisitions and Divestitures of Oil and Gas Properties" for details of the Eagle Ford divestiture.
On May 4, 2018, the Company entered into the twelfth amendment to its credit agreement governing the revolving credit facility to, among other things, (i) establish the borrowing base at $1.0 billion , with an elected commitment amount of $900.0 million , until the next redetermination thereof, (ii) reduce the applicable margins for Eurodollar loans from 2.00% - 3.00% to 1.50% - 2.50% and base rate loans from 1.00% - 2.00% to 0.50% - 1.50% , each depending on level of facility usage, (iii) amend the covenant limiting payment of dividends and distributions on equity to increase the Company's ability to make dividends and distributions on its equity interests and (iv) amend certain other provisions, in each case as set forth therein.
On October 29, 2018, the Company entered into the thirteenth amendment to its credit agreement governing its revolving credit facility to, among other things, (i) establish the borrowing base at $1.3 billion , with an elected commitment amount of $1.1 billion , until the next redetermination thereof, (ii) reduce the applicable margins for Eurodollar loans from 1.50% - 2.50% to 1.25% - 2.25% and base rate loans from 0.50% - 1.50% to 0.25% - 1.25% , each depending on the level of facility usage and each subject to an increase of 0.25% for any period during which the ratio of Total Debt to EBITDA exceeds 3.00 to 1.00, (iii) amend the definition of Capital Leases, and (iv) amend certain other definitions and provisions.
The obligations of the Company under the credit agreement are guaranteed by the Company's material subsidiaries and are secured by liens on substantially all of the Company's assets, including a mortgage lien on oil and gas properties having at least 90% of the total value of the oil and gas properties included in the Company's reserve report used in its most recent redetermination.
Borrowings outstanding under the credit agreement bear interest at the Company's option at either (i) a base rate for a base rate loan plus the margin set forth in the table below, where the base rate is defined as the greatest of the prime rate, the federal funds rate plus 0.50% and the adjusted LIBO rate plus 1.00% , or (ii) an adjusted LIBO rate for a Eurodollar loan plus the margin set forth in the table below. The Company also incurs commitment fees at rates as set forth in the table below on the unused portion of lender commitments, which are included in "Interest expense, net" in the consolidated statements of operations.
Ratio of Outstanding Borrowings to Lender Commitments |
| Applicable Margin for Base Rate Loans |
| Applicable Margin for Eurodollar Loans |
| Commitment Fee |
Less than 25% |
| 0.25% |
| 1.25% |
| 0.375% |
Greater than or equal to 25% but less than 50% |
| 0.50% |
| 1.50% |
| 0.375% |
Greater than or equal to 50% but less than 75% |
| 0.75% |
| 1.75% |
| 0.500% |
Greater than or equal to 75% but less than 90% |
| 1.00% |
| 2.00% |
| 0.500% |
Greater than or equal to 90% |
| 1.25% |
| 2.25% |
| 0.500% |
The Company is subject to certain covenants under the terms of the credit agreement, which include the maintenance of the following financial covenants determined as of the last day of each quarter: (1) a ratio of Total Debt to EBITDA of not more than 4.00 to 1.00 and (2) a Current Ratio of not less than 1.00 to 1.00. As defined in the credit agreement, Total Debt excludes debt issuance costs and is net of cash and cash equivalents, EBITDA will be calculated based on the last four fiscal quarters after giving pro forma effect to EBITDA for material acquisitions and divestitures of oil and gas properties, and the Current Ratio includes an add back of the unused portion of lender commitments. As of December 31, 2018 , the ratio of Total Debt to EBITDA was 2.41 to 1.00 and the Current Ratio was 1.51 to 1.00. Because the financial covenants are determined as of the last day of each quarter, the ratios can fluctuate significantly period to period as the level of borrowings outstanding under the credit agreement are impacted by the timing of cash flows from operations, capital expenditures, acquisitions and divestitures of oil and gas properties and securities offerings.
The credit agreement also places restrictions on the Company and certain of its subsidiaries with respect to additional indebtedness, liens, dividends and other payments to shareholders, repurchases or redemptions of the Company's common stock, redemptions of senior notes, investments, acquisitions and divestitures of oil and gas properties, mergers, transactions with affiliates, hedging transactions and other matters.
The credit agreement is subject to customary events of default, including in connection with a change in control. If an event of default occurs and is continuing, the lenders may elect to accelerate amounts due under the credit agreement (except in the case of a bankruptcy event of default, in which case such amounts will automatically become due and payable).
Senior Notes
8.25% Senior Notes due 2025. On July 14, 2017, the Company closed a public offering of $250.0 million aggregate principal amount of 8.25% Senior Notes due 2025 (the " 8.25% Senior Notes"), which mature on July 15, 2025 and have interest payable semi-annually each January 15 and July 15. Before July 15, 2020, the Company may, at its option, redeem all or a portion of the 8.25% Senior Notes at 100% of the principal amount plus accrued and unpaid interest and a make-whole premium. Thereafter,
F-24
the Company may redeem all or a portion of the 8.25% Senior Notes at redemption prices decreasing annually from 106.188% to 100% of the principal amount redeemed plus accrued and unpaid interest. The Company used the net proceeds of $245.4 million , net of underwriting discounts and commissions and offering costs, to fund a portion of the purchase price for the ExL Acquisition that closed during the third quarter of 2017 and for general corporate purposes.
6.25% Senior Notes due 2023. Since April 15, 2018, the Company has had the right to redeem all or a portion of the 6.25% Senior Notes due 2023 (the " 6.25% Senior Notes") at redemption prices decreasing from 104.688% to 100% of the principal amount on April 15, 2021, plus accrued and unpaid interest.
If a Change of Control (as defined in the indentures governing the 8.25% Senior Notes and the 6.25% Senior Notes) occurs, the Company may be required by holders to repurchase the 8.25% Senior Notes and the 6.25% Senior Notes for cash at a price equal to 101% of the principal amount purchased, plus any accrued and unpaid interest.
The indentures governing the 8.25% Senior Notes and the 6.25% Senior Notes contain covenants that, among other things, limit the Company's ability and the ability of its restricted subsidiaries to: pay distributions on, purchase or redeem the Company's common stock or other capital stock or redeem the Company's subordinated debt; make investments; incur or guarantee additional indebtedness or issue certain types of equity securities; create certain liens; sell assets; consolidate, merge or transfer all or substantially all of the Company's assets; enter into agreements that restrict distributions or other payments from the Company's restricted subsidiaries to the Company; engage in transactions with affiliates; and create unrestricted subsidiaries. Such indentures governing the Company's senior notes are also subject to customary events of default, including those related to failure to comply with the terms of the notes and the indenture, certain failures to file reports with the SEC, certain cross defaults of other indebtedness and mortgages and certain failures to pay final judgments. At December 31, 2018 , the 8.25% Senior Notes and the 6.25% Senior Notes are guaranteed by the same subsidiaries that also guarantee the revolving credit facility.
Redemptions of 7.50% Senior Notes
During the fourth quarter of 2017, the Company redeemed $150.0 million of the outstanding aggregate principal amount of its 7.50% Senior Notes at a price equal to 101.875% of par, plus accrued and unpaid interest. The Company paid $156.0 million upon the redemption, which included a redemption premium of $2.8 million and accrued and unpaid interest of $3.2 million . As a result of the redemption, the Company recorded a loss on extinguishment of debt of $4.2 million , which included the redemption premium of $2.8 million and the write-off of associated unamortized premiums and debt issuance costs of $1.4 million .
During the first and fourth quarters of 2018, the Company redeemed $320.0 million of the outstanding aggregate principal amount of its 7.50% Senior Notes at a price equal to 101.875% of par and the remaining $130.0 million outstanding aggregate principal amount at a redemption price of 100% of par, respectively, both plus accrued and unpaid interest. The Company paid a total of $468.6 million upon the redemptions, which included redemption premiums of $6.0 million and accrued and unpaid interest of $12.6 million . As a result of the redemptions, the Company recorded a loss on extinguishment of debt of $9.6 million , which included the redemption premiums of $6.0 million and the write-off of associated unamortized premiums and debt issuance costs of $3.6 million .
Redemption of Other Long-Term Debt
On May 3, 2018, the Company redeemed the remaining $4.4 million outstanding aggregate principal amount of its 4.375% Convertible Senior Notes due 2028 at a price equal to 100% of par. Upon the redemption, the Company paid $4.5 million , which included accrued and unpaid interest of $0.1 million .
F-25
7. Asset Retirement Obligations
|
| Years Ended December 31, | ||||||
|
| 2018 |
| 2017 | ||||
|
| (In thousands) | ||||||
Asset retirement obligations, beginning of period |
| | $23,792 | |
| | $21,240 | |
Liabilities incurred |
| 1,676 | |
| 3,920 | | ||
Increase due to acquisition of oil and gas properties |
| 170 | |
| 153 | | ||
Liabilities settled |
| - | |
| (343 | ) | ||
Reduction due to divestitures of oil and gas properties |
| (8,547 | ) |
| (2,671 | ) | ||
Accretion expense |
| 1,366 | |
| 1,799 | | ||
Revisions to estimated cash flows |
| 245 | |
| (306 | ) | ||
Asset retirement obligations, end of period |
| 18,702 | |
| 23,792 | | ||
Current asset retirement obligations (included in other current liabilities) |
| (342 | ) |
| (295 | ) | ||
Non-current asset retirement obligations |
| | $18,360 | |
| | $23,497 | |
8. Commitments and Contingencies
From time to time, the Company is party to certain legal actions and claims arising in the ordinary course of business. Pursuant to various purchase and sale agreements related to our divested assets in the Eagle Ford Shale, Marcellus Shale, Utica Shale, and Niobrara Formation, the Company has indemnified the respective purchasers against certain liabilities that they may incur with respect to the assets acquired from the Company. The Company believes such indemnities are customary in purchase and sale transactions in our industry. Such indemnities may include, among others, breach of representations and warranties, tax liabilities, employee compensation, litigation, personal injury, transport or disposal of hazardous substances, calculation and payments of royalties, environmental matters and rights-of-way.
While the outcome of these events cannot be predicted with certainty, as of December 31, 2018, management does not expect these indemnifications to have a materially adverse effect on the financial position or results of operations of the Company.
The financial position and results of operations of the Company continue to be affected from time to time in varying degrees by domestic and foreign political developments as well as legislation and regulations pertaining to restrictions on oil and gas production, imports and exports, tax changes, environmental regulations and cancellation of contract rights. Both the likelihood and overall effect of such occurrences on the Company vary greatly and are not predictable.
Rent expense included in general and administrative expense, net for the years ended December 31, 2018 , 2017 and 2016 was $1.4 million , $1.7 million , and $2.0 million , respectively, and includes rent expense for the Company's corporate and field offices. The table below presents total minimum commitments associated with long-term, non-cancelable leases, drilling rig contracts and gathering, processing and transportation service agreements, which require minimum volumes of natural gas or produced water to be delivered, as of December 31, 2018 .
| 2019 |
| 2020 |
| 2021 |
| 2022 |
| 2023 |
| 2024 and Thereafter |
| Total | ||||||||||||||
| (In thousands) | ||||||||||||||||||||||||||
Operating leases | | $10,024 | |
| | $9,154 | |
| | $6,249 | |
| | $3,639 | |
| | $3,680 | |
| | $20,978 | |
| | $53,724 | |
Drilling rig contracts (1) | 37,077 | |
| 16,867 | |
| 813 | |
| - | |
| - | |
| - | |
| 54,757 | | |||||||
Delivery commitments (2) | 3,726 | |
| 2,807 | |
| 2,487 | |
| 30 | |
| 7 | |
| 19 | |
| 9,076 | | |||||||
Produced water disposal commitments (3) | 18,139 | |
| 20,894 | |
| 20,898 | |
| 20,954 | |
| 10,471 | |
| 9,769 | |
| 101,125 | | |||||||
Other | 1,800 | |
| 1,050 | |
| - | |
| - | |
| - | |
| - | |
| 2,850 | | |||||||
Total | | $70,766 | |
| | $50,772 | |
| | $30,447 | |
| | $24,623 | |
| | $14,158 | |
| | $30,766 | |
| | $221,532 | |
|
(1) | Drilling rig contracts represent gross contractual obligations and accordingly, other joint owners in the properties operated by us will generally be billed for their working interest share of such costs. |
(2) | Delivery commitments represent contractual obligations we have entered into for certain gathering, processing and transportation service agreements which require minimum volumes of natural gas to be delivered. The amounts in the table above reflect the aggregate undiscounted deficiency fees assuming no delivery of any natural gas. |
F-26
(3) | Produced water disposal commitments represent contractual obligations we have entered into for certain service agreements which require minimum volumes of produced water to be delivered. The amounts in the table above reflect the aggregate undiscounted deficiency fees assuming no delivery of any produced water. |
9. Preferred Stock and Common Stock Warrants
On August 20, 2017, the Company closed on the issuance and sale in a private placement of (i) $250.0 million initial liquidation preference ( 250,000 shares) of 8.875% redeemable preferred stock, par value $0.01 per share (the "Preferred Stock") and (ii) warrants for 2,750,000 shares of the Company's common stock, with a term of ten years and an exercise price of $16.08 per share, exercisable only on a net share settlement basis (the "Warrants"), for a cash purchase price equal to $970.00 per share of Preferred Stock to certain funds managed or sub-advised by GSO Capital Partners LP and its affiliates (the "GSO Funds"). The closing occurred contemporaneously with the closing of the ExL Acquisition. The Company used the proceeds of approximately $236.4 million , net of issuance costs to fund a portion of the purchase price for the ExL Acquisition and for general corporate purposes.
Net proceeds were allocated between the Preferred Stock and the Warrants based on their relative fair values at the issuance date, with $213.4 million allocated to the Preferred Stock and $23.0 million allocated to the Warrants. The fair value of the Preferred Stock was calculated by a third-party valuation specialist using a discounted cash flow model. Significant inputs into the calculation included the per share cash purchase price, redemption premiums, and liquidation preference, all as discussed further below, as well as redemption assumptions provided by the Company. The fair value of the Warrants was calculated using a Black-Scholes-Merton option pricing model, incorporating the following assumptions at the issuance date:
|
| Issuance Date Fair Value Assumptions | |
Exercise price |
| $16.08 | |
Expected term (in years) |
| 10.0 | |
Expected volatility |
| 62.9 | % |
Risk-free interest rate |
| 2.2 | % |
Dividend yield |
| - | % |
See "Note 13. Fair Value Measurements" for further discussion of the significant inputs used in the Preferred Stock fair value calculation.
The Preferred Stock is presented as temporary equity in the consolidated balance sheets with the issuance date fair value accreted to the initial liquidation preference using the effective interest method. The Warrants are presented in "Additional paid-in capital" in the consolidated balance sheets at their issuance date fair value.
The following table sets forth a reconciliation of changes in the carrying amount of Preferred Stock for the years ended December 31, 2018 and 2017 :
|
| Years Ended December 31, | ||||||
|
| 2018 |
| 2017 | ||||
|
| (In thousands) | ||||||
Preferred Stock, beginning of period |
| | $214,262 | |
| | $- | |
Relative fair value at issuance |
| - | |
| 213,400 | | ||
Redemption of Preferred Stock |
| (42,897 | ) |
| - | | ||
Accretion on Preferred Stock |
| 3,057 | |
| 862 | | ||
Preferred Stock, end of period |
| | $174,422 | |
| | $214,262 | |
The Preferred Stock has a liquidation preference of $1,000.00 per share and bears an annual cumulative dividend rate of 8.875% , payable on March 15, June 15, September 15 and December 15 of any given year. The Company may elect to pay all or a portion of the Preferred Stock dividends in shares of its common stock in decreasing percentages as follows with respect to any preferred stock dividend declared by the Company's Board of Directors and paid in respect of a quarter ending:
Period |
| Percentage | |
On or after December 15, 2018 and on or prior to September 15, 2019 |
| 75 | % |
On or after December 15, 2019 and on or prior to September 15, 2020 |
| 50 | % |
If the Company fails to satisfy the Preferred Stock dividend on the applicable dividend payment date, then the unpaid dividend will be added to the liquidation preference until paid.
The Preferred Stock outstanding is not mandatorily redeemable, but can be redeemed at the Company's option and, in certain circumstances, at the option of the holders of the Preferred Stock. On or prior to August 10, 2018, the Company had the right to redeem up to 50,000 shares of Preferred Stock, in cash, at $1,000.00 per share, plus accrued and unpaid dividends in an amount
F-27
not to exceed the sum of the cash proceeds of divestitures of oil and gas properties and related assets, the sale or issuance of the Company's common stock and the sale of any of the Company's wholly owned subsidiaries.
In addition, at any time on or prior to August 10, 2020, the Company may redeem all or part of the Preferred Stock in cash at a redemption premium of 104.4375% , plus accrued and unpaid dividends and the present value on the redemption date of all quarterly dividends that would be payable from the redemption date through August 10, 2020. After August 10, 2020, the Company may redeem all or part of the Preferred Stock in cash at redemption premiums, as presented in the table below, plus accrued but unpaid dividends.
Period |
| Percentage | |
After August 10, 2020 but on or prior to August 10, 2021 |
| 104.4375 | % |
After August 10, 2021 but on or prior to August 10, 2022 |
| 102.21875 | % |
After August 10, 2022 |
| 100 | % |
The holders of the Preferred Stock have the option to cause the Company to redeem the Preferred Stock under the following conditions:
• | Upon the Company's failure to pay a quarterly dividend within three months of the applicable payment date; |
• | On or after August 10, 2024, if the Preferred Shares remain outstanding; or |
• | Upon the occurrence of certain changes of control. |
For the first two conditions described above, the Company has the option to settle any such redemption in cash or shares of its common stock and the holders of the Preferred Stock may elect to revoke or reduce the redemption if the Company elects to settle in shares of common stock.
The Preferred Stock are non-voting shares except as required by the Company's articles of incorporation or bylaws. However, so long as the GSO Funds beneficially own more than 50% of the Preferred Stock, the consent of the holders of the Preferred Stock will be required prior to issuing stock senior to or on parity with the Preferred Stock, incurring indebtedness subject to a leverage ratio, agreeing to certain restrictions on dividends on, or redemption of, the Preferred Stock and declaring or paying dividends on the Company's common stock in excess of $15.0 million per year subject to a leverage ratio. Additionally, if the Company does not redeem the Preferred Stock before August 10, 2024, in connection with a change of control or failure to pay a quarterly dividend within three months of the applicable payment date, the holders of the Preferred Stock are entitled to additional rights including:
• | Increasing the dividend rate to 12.0% per annum until August 10, 2024 and thereafter to the greater of 12.0% per annum and the one-month LIBOR plus 10.0% ; |
• | Electing up to two directors to the Company's Board of Directors; and |
• | Requiring approval by the holders of the Preferred Stock to incur indebtedness subject to a leverage ratio, declaring or paying dividends on the Company's common stock in excess of $15.0 million per year or issuing equity of the Company's subsidiaries to third parties. |
Loss on Redemption of Preferred Stock
During the first quarter of 2018, the Company redeemed 50,000 shares of Preferred Stock, representing 20% of the issued and outstanding Preferred Stock, for $50.5 million , consisting of the $50.0 million redemption price and accrued and unpaid dividends of $0.5 million . The Company recognized a $7.1 million loss on the redemption due to the excess of the $50.0 million redemption price over the $42.9 million redemption date carrying value of the Preferred Stock.
10. Shareholders' Equity
Increase in Authorized Common Shares
At the Company's annual meeting of shareholders on May 16, 2017, shareholders approved an amendment to the Company's Amended and Restated Articles of Incorporation to increase the number of authorized shares of common stock from 90,000,000 to 180,000,000 .
Sales of Common Stock
On August 17, 2018, the Company completed a public offering of 9.5 million shares of its common stock at a price per share of $22.55 . The Company used the proceeds of $213.7 million , net of offering costs, to fund the Devon Acquisition and for general corporate purposes. Pending the closing of the Devon Acquisition, the Company used the net proceeds to temporarily repay a portion of the borrowings outstanding under the revolving credit facility.
F-28
On July 3, 2017, the Company completed a public offering of 15.6 million shares of its common stock at a price per share of $14.28 . The Company used the proceeds of $222.4 million , net of offering costs, to fund a portion of the ExL Acquisition and for general corporate purposes.
On October 28, 2016, the Company completed a public offering of 6.0 million shares of its common stock at a price per share of $37.32 . The Company used the proceeds of $223.7 million , net of offering costs, to fund the Sanchez Acquisition and repay borrowings under the revolving credit facility. See "Note 3. Acquisitions and Divestitures of Oil and Gas Properties" for further details of the ExL Acquisition.
See "Note 3. Acquisitions and Divestitures of Oil and Gas Properties" for further details of the acquisitions discussed above.
11. Stock-Based Compensation
Equity-based incentive awards are granted under the 2017 Incentive Plan of Carrizo Oil & Gas, Inc. (the "2017 Incentive Plan") and the Carrizo Oil & Gas, Inc. Cash-Settled Stock Appreciation Rights Plan ("Cash SAR Plan"). The 2017 Incentive Plan replaced the Incentive Plan of Carrizo Oil & Gas, Inc., as amended and restated effective May 15, 2014 (the "Prior Incentive Plan") and, from the effective date of the 2017 Incentive Plan, no further awards may be granted under the Prior Incentive Plan. However, awards previously granted under the Prior Incentive Plan will remain outstanding in accordance with their terms. Under the 2017 Incentive Plan, the Compensation Committee of the Board of Directors (the "Committee") may grant restricted stock awards and units, stock appreciation rights that can be settled in cash or shares of common stock, performance shares, and stock options to employees, independent contractors, and non-employee directors. Under the Cash SAR Plan, the Committee may grant stock appreciation rights that may only be settled in cash to employees and independent contractors.
The 2017 Incentive Plan provides that up to 2,675,000 shares of the Company's common stock, plus the shares remaining available for awards under the Prior Incentive Plan at the effective date of the 2017 Incentive Plan, may be granted (the "Maximum Share Limit"). Each restricted stock award and unit and performance share granted under the 2017 Incentive Plan counts as 1.35 shares against the Maximum Share Limit. Each stock option and stock appreciation right to be settled in shares of common stock granted under the 2017 Incentive Plan counts as 1.00 share against the Maximum Share Limit. Cash SARs granted under the 2017 Incentive Plan and the Cash SAR Plan do not count against the Maximum Share Limit. There have been no grants of stock appreciation rights to be settled in shares of common stock and there are no outstanding stock options. As of December 31, 2018 , there were 258,785 shares of common stock available for grant under the 2017 Incentive Plan.
Restricted Stock Awards and Units
The table below summarizes restricted stock award and unit activity for the years ended December 31, 2018 , 2017 and 2016 :
|
| Restricted Stock Awards and Units |
| Weighted Average Grant Date Fair Value | |||
For the Year Ended December 31, 2016 |
|
|
|
| |||
Unvested restricted stock awards and units, beginning of period |
| 1,041,997 | |
| | $44.22 | |
Granted |
| 887,254 | |
| | $27.80 | |
Vested |
| (811,136 | ) |
| | $36.32 | |
Forfeited |
| (6,405 | ) |
| | $34.46 | |
Unvested restricted stock awards and units, end of period |
| 1,111,710 | |
| | $36.93 | |
For the Year Ended December 31, 2017 |
|
|
|
| |||
Unvested restricted stock awards and units, beginning of period |
| 1,111,710 | |
| | $36.93 | |
Granted |
| 1,020,465 | |
| | $25.63 | |
Vested |
| (635,965 | ) |
| | $39.62 | |
Forfeited |
| (13,555 | ) |
| | $29.11 | |
Unvested restricted stock awards and units, end of period |
| 1,482,655 | |
| | $28.07 | |
For the Year Ended December 31, 2018 |
|
|
|
| |||
Unvested restricted stock awards and units, beginning of period |
| 1,482,655 | |
| | $28.07 | |
Granted |
| 1,458,421 | |
| | $15.49 | |
Vested |
| (621,399 | ) |
| | $31.48 | |
Forfeited |
| (53,010 | ) |
| | $17.72 | |
Unvested restricted stock awards and units, end of period |
| 2,266,667 | |
| | $19.28 | |
Grant activity primarily consisted of restricted stock units to employees and independent contractors as part of the annual grant of long-term equity incentive awards that occurred in the first quarter of each of the years presented in the table above and vest ratably over an approximate three -year period. As of December 31, 2018 , unrecognized compensation costs related to unvested
F-29
restricted stock awards and units was $23.2 million and will be recognized over a weighted average period of 1.9 years. The aggregate fair value of restricted stock awards and units that vested during the years ended December 31, 2018 , 2017 and 2016 was $10.2 million , $20.3 million and $26.3 million , respectively.
Cash SARs
The table below summarizes the Cash SAR activity for the years ended December 31, 2018 , 2017 and 2016 :
|
| Stock Appreciation Rights |
| Weighted Average Exercise Prices |
| Weighted Average Remaining Life (In years) |
| Aggregate Intrinsic Value (In millions) |
| Aggregate Intrinsic Value of Exercises (In millions) | |||||||
For the Year Ended December 31, 2016 |
|
|
|
|
|
|
|
|
|
| |||||||
Outstanding, beginning of period |
| 700,453 | |
| | $21.86 | |
|
|
|
|
|
| ||||
Granted |
| 376,260 | |
| | $27.30 | |
|
|
|
|
|
| ||||
Exercised |
| (354,075 | ) |
| | $23.89 | |
|
|
|
|
| | $5.2 | | ||
Forfeited |
| - | |
| - | |
|
|
|
|
|
| |||||
Expired |
| - | |
| - | |
|
|
|
|
|
| |||||
Outstanding, end of period |
| 722,638 | |
| | $23.69 | |
|
|
|
|
|
| ||||
Vested, end of period |
| 350,840 | |
| | $19.87 | |
|
|
|
|
|
| ||||
Vested and exercisable, end of period |
| 350,840 | |
| | $19.87 | |
|
|
|
|
|
| ||||
For the Year Ended December 31, 2017 |
|
|
|
|
|
|
|
|
|
| |||||||
Outstanding, beginning of period |
| 722,638 | |
| | $23.69 | |
|
|
|
|
|
| ||||
Granted |
| 342,440 | |
| | $26.94 | |
|
|
|
|
|
| ||||
Exercised |
| (219,279 | ) |
| | $17.28 | |
|
|
|
|
| | $2.1 | | ||
Forfeited |
| - | |
| - | |
|
|
|
|
|
| |||||
Expired |
| (131,561 | ) |
| | $24.19 | |
|
|
|
|
|
| ||||
Outstanding, end of period |
| 714,238 | |
| | $27.12 | |
|
|
|
|
|
| ||||
Vested, end of period |
| 185,899 | |
| | $27.30 | |
|
|
|
|
|
| ||||
Vested and exercisable, end of period |
| - | |
| | $27.30 | |
|
|
|
|
|
| ||||
For the Year Ended December 31, 2018 |
|
|
|
|
|
|
|
|
|
| |||||||
Outstanding, beginning of period |
| 714,238 | |
| | $27.12 | |
|
|
|
|
|
| ||||
Granted |
| 616,686 | |
| | $14.67 | |
|
|
|
|
|
| ||||
Exercised |
| - | |
| - | |
|
|
|
|
| | $- | | |||
Forfeited |
| - | |
| - | |
|
|
|
|
|
| |||||
Expired |
| - | |
| - | |
|
|
|
|
|
| |||||
Outstanding, end of period |
| 1,330,924 | |
| | $21.35 | |
| 4.3 |
| | $- | |
|
| ||
Vested, end of period |
| 543,018 | |
| | $27.18 | |
|
|
|
|
|
| ||||
Vested and exercisable, end of period |
| - | |
| | $27.18 | |
| 2.5 |
| | $- | |
|
| ||
Grant activity primarily consisted of Cash SARs to certain employees and independent contractors as part of the annual grant of long-term equity incentive awards that occurred in the first quarter of each of the years presented in the table above. The Cash SARs granted during the year ended December 31, 2018 vest ratably over an approximate three year period and expire approximately seven years from the grant date. The Cash SARs granted during the years ended December 31, 2017 and 2016 vest ratably over an approximate two year period and expire approximately five years from the grant date.
F-30
The grant date fair value of the Cash SARs, calculated using the Black-Scholes-Merton option pricing model, was $4.9 million , $4.1 million , and $3.7 million for the years ended December 31, 2018, 2017, and 2016, respectively. The following table summarizes the assumptions used and the resulting grant date fair value per Cash SAR granted during the years ended December 31, 2018 , 2017 , and 2016 :
|
| Years Ended December 31, | |||||||
|
| 2018 |
| 2017 |
| 2016 | |||
Expected term (in years) |
| 6.0 | |
| 4.2 | |
| 3.9 | |
Expected volatility |
| 54.3 | % |
| 54.3 | % |
| 45.1 | % |
Risk-free interest rate |
| 2.8 | % |
| 1.8 | % |
| 1.3 | % |
Dividend yield |
| - | % |
| - | % |
| - | % |
Grant date fair value per Cash SAR |
| $7.89 |
| $12.00 |
| $9.88 | |||
The liability for Cash SARs as of December 31, 2018 and 2017 was $1.8 million and $4.4 million , respectively, all of which was classified as "Other current liabilities" in the consolidated balance sheets in the respective period. Unrecognized compensation costs related to unvested Cash SARs were $2.4 million as of December 31, 2018 , and will be recognized over a weighted average period of 2.2 years.
Performance Shares
The table below summarizes performance share activity for the years ended December 31, 2018 , 2017 and 2016 :
|
| Target Performance Shares (1) |
| Weighted Average Grant Date Fair Value | |||
For the Year Ended December 31, 2016 |
|
|
|
| |||
Unvested performance shares, beginning of period |
| 112,859 | |
| | $66.83 | |
Granted |
| 41,651 | |
| | $35.71 | |
Vested at end of performance period |
| - | |
| - | | |
Forfeited |
| - | |
| - | | |
Unvested performance shares, end of period |
| 154,510 | |
| | $58.44 | |
For the Year Ended December 31, 2017 |
|
|
|
| |||
Unvested performance shares, beginning of period |
| 154,510 | |
| | $58.44 | |
Granted |
| 46,787 | |
| | $35.14 | |
Vested at end of performance period |
| (56,342 | ) |
| | $68.15 | |
Forfeited |
| - | |
| - | | |
Unvested performance shares, end of period |
| 144,955 | |
| | $47.14 | |
For the Year Ended December 31, 2018 |
|
|
|
| |||
Unvested performance shares, beginning of period |
| 144,955 | |
| | $47.14 | |
Granted |
| 93,771 | |
| | $19.09 | |
Vested at end of performance period |
| (49,458 | ) |
| | $65.51 | |
Did not vest at end of performance period |
| (7,059 | ) |
| | $65.51 | |
Forfeited |
| - | |
| - | | |
Unvested performance shares, end of period |
| 182,209 | |
| | $27.01 | |
|
(1) | The number of performance shares that vest may vary from the number of target performance shares granted depending on the Company ' s final TSR ranking for the approximate three -year performance period. |
Grant activity primarily consisted of performance shares to certain employees and independent contractors as part of the annual grant of long-term equity incentive awards that occurred in the first quarter of each of the years presented in the table above.
For the year ended December 31, 2018, as a result of the Company's final TSR ranking during the performance period, a multiplier of 88% was applied to the 56,517 target performance shares that were granted in 2015, resulting in the vesting of 49,458 shares and 7,059 shares that did not vest. For the year ended December 31, 2017, as a result of the Company's final TSR ranking during the performance period, a multiplier of 164% was applied to the 56,342 target performance shares that were granted in 2014, resulting in the vesting of 92,200 shares. The Company did not have any performance shares that vested during the year ended December 31, 2016. The aggregate fair value of performance shares that vested during the years ended December 31, 2018 and 2017 was $0.8 million and $2.6 million , respectively.
F-31
For the years ended December 31, 2018, 2017 and 2016, the grant date fair value of the performance shares, calculated using a Monte Carlo simulation, was $1.8 million , $1.6 million , and $1.5 million , respectively. The following table summarizes the assumptions used and the resulting grant date fair value per performance share granted during the years ended December 31, 2018 , 2017 and 2016 :
|
| Years Ended December 31, | |||||||
|
| 2018 |
| 2017 |
| 2016 | |||
Number of simulations |
| 500,000 | |
| 500,000 | |
| 500,000 | |
Expected term (in years) |
| 3.0 | |
| 3.0 | |
| 3.0 | |
Expected volatility |
| 61.5 | % |
| 59.2 | % |
| 55.3 | % |
Risk-free interest rate |
| 2.4 | % |
| 1.5 | % |
| 1.2 | % |
Dividend yield |
| - | % |
| - | % |
| - | % |
Grant date fair value per performance share |
| $19.09 |
| $35.14 |
| $35.71 | |||
As of December 31, 2018 , unrecognized compensation costs related to unvested performance shares were $2.1 million and will be recognized over a weighted average period of 1.8 years.
Stock-Based Compensation Expense, Net
The following table sets forth the components of stock-based compensation expense, net:
|
| Years Ended December 31, | ||||||||||
|
| 2018 |
| 2017 |
| 2016 | ||||||
|
| (In thousands) | ||||||||||
Restricted stock awards and units |
| | $18,434 | |
| | $21,372 | |
| | $28,196 | |
Cash SARs |
| (2,571 | ) |
| (5,023 | ) |
| 9,675 | | |||
Performance shares |
| 1,785 | |
| 2,442 | |
| 2,806 | | |||
|
| 17,648 | |
| 18,791 | |
| 40,677 | | |||
Less: amounts capitalized to oil and gas properties |
| (4,124 | ) |
| (4,482 | ) |
| (4,591 | ) | |||
Total stock-based compensation expense, net |
| | $13,524 | |
| | $14,309 | |
| | $36,086 | |
12. Derivative Instruments
Commodity Derivative Instruments
The Company uses commodity derivative instruments to mitigate the effects of commodity price volatility for a portion of its forecasted sales of production and achieve a more predictable level of cash flow. Since the Company derives a significant portion of its revenues from sales of crude oil, crude oil price volatility represents the Company's most significant commodity price risk. While the use of commodity derivative instruments limits or partially reduces the downside risk of adverse commodity price movements, such use also limits the upside from favorable commodity price movements. The Company does not enter into commodity derivative instruments for speculative purposes.
The Company's commodity derivative instruments, which settle on a monthly basis over the term of the contract for contracted volumes, consist of over-the-counter price swaps, three-way collars, sold call options and basis swaps, each of which is described below.
Price swaps are settled based on differences between a fixed price and the settlement price of a referenced index. If the settlement price of the referenced index is below the fixed price, the Company receives the difference from the counterparty. If the referenced settlement price is above the fixed price, the Company pays the difference to the counterparty.
Three-way collars consist of a purchased put option (floor price), a sold call option (ceiling price) and a sold put option (sub-floor price) and are settled based on differences between the floor or ceiling prices and the settlement price of a referenced index or the difference between the floor price and sub-floor price. If the settlement price of the referenced index is below the sub-floor price, the Company receives the difference between the floor price and sub-floor price from the counterparty. If the settlement price of the referenced index is between the floor price and sub-floor price, the Company receives the difference between the floor price and the settlement price of the referenced index from the counterparty. If the settlement price of the referenced index is between the floor price and ceiling price, no payments are due to or from either party. If the settlement price of the referenced index is above the ceiling price, the Company pays the difference to the counterparty.
Sold call options are settled based on differences between the ceiling price and the settlement price of a referenced index. If the settlement price of the referenced index is above the ceiling price, the Company pays the difference to the counterparty. If the settlement price of the referenced index is below the ceiling price, no payments are due to or from either party. Premiums
F-32
from the sale of call options have been used to enhance the fixed price of certain contemporaneously executed price swaps. Purchased call options executed contemporaneously with sold call options in order to increase the ceiling price of existing sold call options have been presented on a net basis in the table below.
Basis swaps are settled based on differences between a fixed price differential and the differential between the settlement prices of two referenced indexes. If the differential between the settlement prices of the two referenced indexes is greater than the fixed price differential, the Company receives the difference from the counterparty. If the differential between the settlement prices of the two referenced indexes is less than the fixed price differential, the Company pays the difference to the counterparty.
The referenced index of the Company's price swaps, three-way collars and sold call options is U.S. New York Mercantile Exchange ("NYMEX") West Texas Intermediate ("WTI") for crude oil and NYMEX Henry Hub for natural gas, as applicable. The prices received by the Company for the sale of its production generally vary from these referenced index prices due to adjustments for delivery location (basis) and other factors. The referenced indexes of the Company's basis swaps, which are used to mitigate location price risk for a portion of its production, are Argus WTI Cushing ("WTI Cushing") and the applicable index price of the Company's crude oil sales contracts is Argus WTI Midland ("WTI Midland") for its Delaware Basin crude oil production and Argus Light Louisiana Sweet ("LLS") for its Eagle Ford crude oil production.
The Company has incurred premiums on certain of its commodity derivative instruments in order to obtain a higher floor price and/or higher ceiling price. Payment of these premiums are deferred until the applicable contracts settle on a monthly basis over the term of the contract or, in some cases, during the final 12 months of the contract and are referred to as deferred premium obligations.
As of December 31, 2018 , the Company had the following outstanding commodity derivative instruments at weighted average contract volumes and prices:
Commodity |
| Period |
| Type of Contract |
| Index |
| Volumes |
| Sub-Floor |
| Floor Price |
| Ceiling Price |
| Fixed | |||||||||
Crude oil |
| 1Q19 |
| Three-Way Collars |
| NYMEX WTI |
| 27,000 | |
| | $41.67 | |
| | $50.96 | |
| | $74.23 | |
| - | | |
Crude oil |
| 1Q19 |
| Basis Swaps |
| LLS-WTI Cushing |
| 6,000 | |
| - | |
| - | |
| - | |
| | $5.16 | | |||
Crude oil |
| 1Q19 |
| Basis Swaps |
| WTI Midland-WTI Cushing |
| 5,500 | |
| - | |
| - | |
| - | |
| | ($5.24 | ) | |||
Crude oil |
| 1Q19 |
| Sold Call Options |
| NYMEX WTI |
| 3,875 | |
| - | |
| - | |
| | $81.07 | |
| - | | |||
|
|
|
|
|
|
|
|
|
|
|
|
|
|
|
|
| |||||||||
Crude oil |
| 2Q19 |
| Three-Way Collars |
| NYMEX WTI |
| 27,000 | |
| | $41.67 | |
| | $50.96 | |
| | $74.23 | |
| - | | |
Crude oil |
| 2Q19 |
| Basis Swaps |
| LLS-WTI Cushing |
| 6,000 | |
| - | |
| - | |
| - | |
| | $5.16 | | |||
Crude oil |
| 2Q19 |
| Basis Swaps |
| WTI Midland-WTI Cushing |
| 6,000 | |
| - | |
| - | |
| - | |
| | ($5.38 | ) | |||
Crude oil |
| 2Q19 |
| Sold Call Options |
| NYMEX WTI |
| 3,875 | |
| - | |
| - | |
| | $81.07 | |
| - | | |||
|
|
|
|
|
|
|
|
|
|
|
|
|
|
|
|
| |||||||||
Crude oil |
| 3Q19 |
| Three-Way Collars |
| NYMEX WTI |
| 27,000 | |
| | $41.67 | |
| | $50.96 | |
| | $74.23 | |
| - | | |
Crude oil |
| 3Q19 |
| Basis Swaps |
| LLS-WTI Cushing |
| 6,000 | |
| - | |
| - | |
| - | |
| | $5.16 | | |||
Crude oil |
| 3Q19 |
| Basis Swaps |
| WTI Midland-WTI Cushing |
| 7,000 | |
| - | |
| - | |
| - | |
| | ($5.56 | ) | |||
Crude oil |
| 3Q19 |
| Sold Call Options |
| NYMEX WTI |
| 3,875 | |
| - | |
| - | |
| | $81.07 | |
| - | | |||
|
|
|
|
|
|
|
|
|
|
|
|
|
|
|
|
| |||||||||
Crude oil |
| 4Q19 |
| Three-Way Collars |
| NYMEX WTI |
| 27,000 | |
| | $41.67 | |
| | $50.96 | |
| | $74.23 | |
| - | | |
Crude oil |
| 4Q19 |
| Basis Swaps |
| LLS-WTI Cushing |
| 6,000 | |
| - | |
| - | |
| - | |
| | $5.16 | | |||
Crude oil |
| 4Q19 |
| Basis Swaps |
| WTI Midland-WTI Cushing |
| 11,000 | |
| - | |
| - | |
| - | |
| | ($3.84 | ) | |||
Crude oil |
| 4Q19 |
| Sold Call Options |
| NYMEX WTI |
| 3,875 | |
| - | |
| - | |
| | $81.07 | |
| - | | |||
|
|
|
|
|
|
|
|
|
|
|
|
|
|
|
|
| |||||||||
Crude oil |
| 2020 |
| Basis Swaps |
| WTI Midland-WTI Cushing |
| 13,000 | |
| - | |
| - | |
| - | |
| | ($1.27 | ) | |||
Crude oil |
| 2020 |
| Sold Call Options |
| NYMEX WTI |
| 4,575 | |
| - | |
| - | |
| | $75.98 | |
| - | | |||
|
|
|
|
|
|
|
|
|
|
|
|
|
|
|
|
| |||||||||
Crude oil |
| 2021 |
| Basis Swaps |
| WTI Midland-WTI Cushing |
| 6,000 | |
| - | |
| - | |
| - | |
| | $0.03 | | |||
F-33
Commodity |
| Period |
| Type of Contract |
| Index |
| Volumes (MMBtu per day) |
| Sub-Floor Price ($ per MMBtu) |
| Floor Price ($ per MMBtu) |
| Ceiling Price ($ per MMBtu) |
| Fixed Price Differential ($ per MMBtu) | ||||||
Natural gas |
| 1Q19 |
| Sold Call options |
| NYMEX Henry Hub |
| 33,000 | |
| - | |
| - | |
| | $3.25 | |
| - | |
|
|
|
|
|
|
|
|
|
|
|
|
|
|
|
|
| ||||||
Natural gas |
| 2Q19 |
| Sold Call options |
| NYMEX Henry Hub |
| 33,000 | |
| - | |
| - | |
| | $3.25 | |
| - | |
|
|
|
|
|
|
|
|
|
|
|
|
|
|
|
|
| ||||||
Natural gas |
| 3Q19 |
| Sold Call options |
| NYMEX Henry Hub |
| 33,000 | |
| - | |
| - | |
| | $3.25 | |
| - | |
|
|
|
|
|
|
|
|
|
|
|
|
|
|
|
|
| ||||||
Natural gas |
| 4Q19 |
| Sold Call options |
| NYMEX Henry Hub |
| 33,000 | |
| - | |
| - | |
| | $3.25 | |
| - | |
|
|
|
|
|
|
|
|
|
|
|
|
|
|
|
|
| ||||||
Natural gas |
| 2020 |
| Sold Call options |
| NYMEX Henry Hub |
| 33,000 | |
| - | |
| - | |
| | $3.50 | |
| - | |
The Company typically has numerous commodity derivative instruments outstanding with a counterparty that were executed at various dates, for various contract types, commodities and time periods often resulting in both commodity derivative asset and liability positions with that counterparty. The Company nets its commodity derivative instrument fair values executed with the same counterparty, along with any deferred premium obligations, to a single asset or liability pursuant to ISDAs, which provide for net settlement over the term of the contract and in the event of default or termination of the contract.
Counterparties to the Company's commodity derivative instruments who are a Lender Counterparty allow the Company to satisfy any need for margin obligations associated with commodity derivative instruments where the Company is in a net liability position with the Lender Counterparty with the collateral securing the credit agreement, thus eliminating the need for independent collateral posting. Counterparties to the Company's commodity derivative instruments who are a Non-Lender Counterparty can require commodity derivative instruments to be novated to a Lender Counterparty if the Company's net liability position exceeds the Company's unsecured credit limit with the Non-Lender Counterparty and therefore do not require the posting of cash collateral.
Because each Lender Counterparty has an investment grade credit rating and the Company has obtained a guaranty from each Non-Lender Counterparty's parent company which has an investment grade credit rating, the Company believes it does not have significant credit risk and accordingly does not currently require its counterparties to post collateral to support the net asset positions of its commodity derivative instruments. Although the Company does not currently anticipate nonperformance from its counterparties, it continually monitors the credit ratings of each Lender Counterparty and each Non-Lender Counterparty's parent company. The Company executes its derivative instruments with seventeen counterparties to minimize its credit exposure to any individual counterparty.
F-34
Contingent Consideration Arrangements
The purchase and sale agreements of the ExL Acquisition and divestitures of the Company's assets in the Niobrara, Marcellus and Utica, included contingent consideration arrangements that require the Company to pay or entitle the Company to receive specified amounts if commodity prices exceed specified thresholds, which are summarized in the table below. See "Note 3. Acquisitions and Divestitures of Oil and Gas Properties" for further discussion.
Contingent Consideration Arrangements |
| Years |
| Threshold (1) |
| Contingent Receipt (Payment) - Annual |
| Contingent Receipt (Payment) - Aggregate Limit | ||||||
|
|
|
|
|
| (In thousands) | ||||||||
Contingent ExL Consideration |
| 2018 |
| | $50.00 | |
| | ($50,000 | ) |
|
| ||
|
| 2019 |
| 50.00 | |
| (50,000 | ) |
|
| ||||
|
| 2020 |
| 50.00 | |
| (50,000 | ) |
|
| ||||
|
| 2021 |
| 50.00 | |
| (50,000 | ) |
| | ($125,000 | ) | ||
|
|
|
|
|
|
|
|
| ||||||
Contingent Niobrara Consideration |
| 2018 |
| | $55.00 | |
| | $5,000 | |
|
| ||
|
| 2019 |
| 55.00 | |
| 5,000 | |
|
| ||||
|
| 2020 |
| 60.00 | |
| 5,000 | |
| - | | |||
|
|
|
|
|
|
|
|
| ||||||
Contingent Marcellus Consideration |
| 2018 |
| | $3.13 | |
| | $3,000 | |
|
| ||
|
| 2019 |
| 3.18 | |
| 3,000 | |
|
| ||||
|
| 2020 |
| 3.30 | |
| 3,000 | |
| | $7,500 | | ||
|
|
|
|
|
|
|
|
| ||||||
Contingent Utica Consideration |
| 2018 |
| | $50.00 | |
| | $5,000 | |
|
| ||
|
| 2019 |
| 53.00 | |
| 5,000 | |
|
| ||||
|
| 2020 |
| 56.00 | |
| 5,000 | |
| - | | |||
|
(1) | The price used to determine whether the specified threshold for each year has been met for the Contingent ExL Consideration, Contingent Niobrara Consideration and Contingent Utica Consideration is the average daily closing spot price per barrel of WTI crude oil as measured by the U.S. Energy Information Administration. The price used to determine whether the specified threshold for each year has been met for the Contingent Marcellus Consideration is the average monthly settlement price per MMBtu of Henry Hub natural gas for the next calendar month, as determined on the last business day preceding each calendar month as measured by the CME Group Inc. |
F-35
Derivative Assets and Liabilities
The derivative instrument asset and liability fair values recorded in the consolidated balance sheets as of December 31, 2018 and December 31, 2017 are summarized below:
|
| December 31, 2018 | ||||||||||
|
| Gross Amounts Recognized |
| Gross Amounts Offset in the Consolidated Balance Sheets |
| Net Amounts Presented in the Consolidated Balance Sheets | ||||||
|
| (In thousands) | ||||||||||
Commodity derivative instruments |
| | $50,406 | |
| | ($20,502 | ) |
| | $29,904 | |
Contingent Niobrara Consideration |
| 5,000 | |
| - | |
| 5,000 | | |||
Contingent Utica Consideration |
| 5,000 | |
| - | |
| 5,000 | | |||
Derivative assets |
| | $60,406 | |
| | ($20,502 | ) |
| | $39,904 | |
Commodity derivative instruments |
| 6,083 | |
| (4,236 | ) |
| 1,847 | | |||
Contingent Niobrara Consideration |
| 2,035 | |
| - | |
| 2,035 | | |||
Contingent Marcellus Consideration |
| 1,369 | |
| - | |
| 1,369 | | |||
Contingent Utica Consideration |
| 2,501 | |
| - | |
| 2,501 | | |||
Other long-term assets |
| | $11,988 | |
| | ($4,236 | ) |
| | $7,752 | |
|
|
|
|
|
|
| ||||||
Commodity derivative instruments |
| | ($15,345 | ) |
| | $10,140 | |
| | ($5,205 | ) |
Deferred premium obligations |
| (10,362 | ) |
| 10,362 | |
| - | | |||
Contingent ExL Consideration |
| (50,000 | ) |
| - | |
| (50,000 | ) | |||
Derivative liabilities-current |
| | ($75,707 | ) |
| | $20,502 | |
| | ($55,205 | ) |
Commodity derivative instruments |
| (10,751 | ) |
| 518 | |
| (10,233 | ) | |||
Deferred premium obligations |
| (3,718 | ) |
| 3,718 | |
| - | | |||
Contingent ExL Consideration |
| (30,584 | ) |
| - | |
| (30,584 | ) | |||
Derivative liabilities-non current |
| | ($45,053 | ) |
| | $4,236 | |
| | ($40,817 | ) |
|
| December 31, 2017 | ||||||||||
|
| Gross Amounts Recognized |
| Gross Amounts Offset in the Consolidated Balance Sheets |
| Net Amounts Presented in the Consolidated Balance Sheets | ||||||
|
| (In thousands) | ||||||||||
Commodity derivative instruments |
| | $4,869 | |
| | ($4,869 | ) |
| | $- | |
Derivative assets |
| | $4,869 | |
| | ($4,869 | ) |
| | $- | |
Commodity derivative instruments |
| 9,505 | |
| (9,505 | ) |
| - | | |||
Contingent Marcellus Consideration |
| 2,205 | |
| - | |
| 2,205 | | |||
Contingent Utica Consideration |
| 7,985 | |
| - | |
| 7,985 | | |||
Other long-term assets |
| | $19,695 | |
| | ($9,505 | ) |
| | $10,190 | |
|
|
|
|
|
|
| ||||||
Commodity derivative instruments |
| | ($52,671 | ) |
| | ($4,450 | ) |
| | ($57,121 | ) |
Deferred premium obligations |
| (9,319 | ) |
| 9,319 | |
| - | | |||
Derivative liabilities-current |
| | ($61,990 | ) |
| | $4,869 | |
| | ($57,121 | ) |
Commodity derivative instruments |
| (24,609 | ) |
| (2,098 | ) |
| (26,707 | ) | |||
Deferred premium obligations |
| (11,603 | ) |
| 11,603 | |
| - | | |||
Contingent ExL Consideration |
| (85,625 | ) |
| - | |
| (85,625 | ) | |||
Derivative liabilities-non current |
| | ($121,837 | ) |
| | $9,505 | |
| | ($112,332 | ) |
See "Note 13. Fair Value Measurements" for additional information regarding the fair value of the Company's derivative instruments.
F-36
(Gain) Loss on Derivatives, Net
The components of "(Gain) loss on derivatives, net" in the consolidated statements of operations for the years ended December 31, 2018 , 2017 , and 2016 are summarized below:
|
| Years Ended December 31, | ||||||||||
|
| 2018 |
| 2017 |
| 2016 | ||||||
|
| (In thousands) | ||||||||||
(Gain) Loss on Derivatives, Net |
|
|
|
|
|
| ||||||
Crude oil |
| | ($9,726 | ) |
| | $22,839 | |
| | $23,609 | |
NGL |
| 4,439 | |
| 1,322 | |
| - | | |||
Natural gas |
| (421 | ) |
| (15,399 | ) |
| 19,584 | | |||
Deferred premium obligations |
| 1,875 | |
| 18,401 | |
| 5,880 | | |||
Contingent ExL Consideration |
| (5,041 | ) |
| 33,325 | |
| - | | |||
Contingent Niobrara Consideration |
| 845 | |
| - | |
| - | | |||
Contingent Marcellus Consideration |
| 836 | |
| 455 | |
| - | | |||
Contingent Utica Consideration |
| 484 | |
| (1,840 | ) |
| - | | |||
(Gain) Loss on Derivatives, Net |
| | ($6,709 | ) |
| | $59,103 | |
| | $49,073 | |
Cash Received (Paid) for Derivative Settlements, Net
For the years ended December 31, 2018 , 2017 , and 2016 , there were no settlements of contingent consideration arrangements, however, the specified pricing thresholds related to the Contingent ExL Consideration, the Contingent Niobrara Consideration, and the Contingent Utica Consideration were exceeded for the year ended December 31, 2018. See "Note 16. Subsequent Events" for further discussion.
The components of "Cash received (paid) for derivative settlements, net" in the consolidated statements of cash flows for the years ended December 31, 2018 , 2017 , and 2016 are summarized below:
|
| Years Ended December 31, | ||||||||||
|
| 2018 |
| 2017 |
| 2016 | ||||||
Cash Flows from Operating Activities |
| (In thousands) | ||||||||||
Cash Received (Paid) for Derivative Settlements, Net |
|
|
|
|
|
| ||||||
Crude oil |
| | ($78,570 | ) |
| | $9,883 | |
| | $125,098 | |
NGL |
| (6,378 | ) |
| - | |
| - | | |||
Natural gas |
| (1,710 | ) |
| (54 | ) |
| - | | |||
Deferred premium obligations |
| (9,649 | ) |
| (2,056 | ) |
| (5,729 | ) | |||
Cash Received (Paid) for Derivative Settlements, Net |
| | ($96,307 | ) |
| | $7,773 | |
| | $119,369 | |
13. Fair Value Measurements
Accounting guidelines for measuring fair value establish a three-level valuation hierarchy for disclosure of fair value measurements. The valuation hierarchy categorizes assets and liabilities measured at fair value into one of three different levels depending on the observability of the inputs employed in the measurement. The three levels are defined as follows:
Level 1 – Observable inputs such as quoted prices in active markets at the measurement date for identical, unrestricted assets or liabilities.
Level 2 – Other inputs that are observable directly or indirectly such as quoted prices in markets that are not active, or inputs which are observable, either directly or indirectly, for substantially the full term of the asset or liability.
Level 3 – Unobservable inputs for which there is little or no market data and which the Company makes its own assumptions about how market participants would price the assets and liabilities.
F-37
Assets and Liabilities Measured at Fair Value on a Recurring Basis
The following tables summarize the Company's derivative instrument assets and liabilities measured at fair value on a recurring basis as of December 31, 2018 and 2017 :
|
| December 31, 2018 | ||||||||||
|
| Level 1 |
| Level 2 |
| Level 3 | ||||||
|
| (In thousands) | ||||||||||
Assets |
|
|
|
|
|
| ||||||
Commodity derivative instruments |
| | $- | |
| | $31,751 | |
| | $- | |
Contingent Niobrara Consideration |
| - | |
| 7,035 | |
| - | | |||
Contingent Marcellus Consideration |
| - | |
| 1,369 | |
| - | | |||
Contingent Utica Consideration |
| - | |
| 7,501 | |
| - | | |||
|
|
|
|
|
|
| ||||||
Liabilities |
|
|
|
|
|
| ||||||
Commodity derivative instruments |
| | $- | |
| | ($15,438 | ) |
| | $- | |
Contingent ExL Consideration |
| - | |
| (80,584 | ) |
| - | | |||
|
| December 31, 2017 | ||||||||||
|
| Level 1 |
| Level 2 |
| Level 3 | ||||||
|
| (In thousands) | ||||||||||
Assets |
|
|
|
|
|
| ||||||
Commodity derivative instruments |
| | $- | |
| | $- | |
| | $- | |
Contingent Niobrara Consideration |
| - | |
| - | |
| - | | |||
Contingent Marcellus Consideration |
| - | |
| - | |
| 2,205 | | |||
Contingent Utica Consideration |
| - | |
| - | |
| 7,985 | | |||
|
|
|
|
|
|
| ||||||
Liabilities |
|
|
|
|
|
| ||||||
Commodity derivative instruments |
| | $- | |
| | ($83,828 | ) |
| | $- | |
Contingent ExL Consideration |
| - | |
| - | |
| (85,625 | ) | |||
The asset and liability fair values reported in the consolidated balance sheets are as of the balance sheet date and subsequently change as a result of changes in commodity prices, market conditions and other factors.
Commodity derivative instruments. The fair value of the Company's commodity derivative instruments is based on a third-party industry-standard pricing model which uses contract terms and prices and assumptions and inputs that are substantially observable in active markets throughout the full term of the instruments including forward oil and gas price curves, discount rates and volatility factors, and are therefore designated as Level 2 within the valuation hierarchy. The fair values are also compared to the values provided by the counterparties for reasonableness and are adjusted for the counterparties' credit quality for commodity derivative assets and the Company's credit quality for commodity derivative liabilities.
Contingent consideration arrangements. The fair values of the contingent consideration arrangements were determined by a third-party valuation specialist using Monte Carlo simulations including significant inputs such as forward oil and gas price curves, volatility factors, and risk adjusted discount rates, which include adjustments for the counterparties' credit quality for contingent consideration assets and the Company's credit quality for the contingent consideration liabilities. These inputs are substantially observable in active markets throughout the full term of the contingent consideration arrangements or can be derived from observable data and are therefore designated as Level 2 within the valuation hierarchy. The Company reviewed the valuations, including the related inputs, and analyzed changes in fair value measurements between periods.
F-38
The following tables present the reconciliation of changes in the fair values of the contingent consideration arrangements, which were designated within the valuation hierarchy as Level 2 for the year ended December 31, 2018 and Level 3 for the year ended December 31, 2017 :
|
| Contingent Consideration Arrangements | ||||||
|
| Assets |
| Liability | ||||
|
| (In thousands) | ||||||
Balance as of January 1, 2017 |
| | $- | |
| | $- | |
Recognition of (acquisition) divestiture date fair value |
| 8,805 | |
| (52,300 | ) | ||
Gain (loss) on change in fair value, net (1) |
| 1,385 | |
| (33,325 | ) | ||
Transfers into (out of) Level 3 |
| - | |
| - | | ||
Balance as of December 31, 2017 |
| | $10,190 | |
| | ($85,625 | ) |
Recognition of divestiture date fair value |
| 7,880 | |
| - | | ||
Gain (loss) on changes in fair value, net (1) |
| (2,165 | ) |
| 5,041 | | ||
Transfers out of Level 3 |
| (15,905 | ) |
| 80,584 | | ||
Balance as of December 31, 2018 |
| | $- | |
| | $- | |
|
(1) | Recognized as "(Gain) loss on derivatives, net" in the consolidated statements of operations. |
During 2018, the Company determined that the contingent consideration arrangements met the requirements to be designated as Level 2 in the valuation hierarchy due to the increased observability of the forward oil and gas price curves used in determining the fair value throughout the full term of the contingent consideration arrangements resulting in the transfer out of Level 3.
See "Note 12. Derivative Instruments" for additional information regarding the contingent consideration arrangements.
Assets and Liabilities Measured at Fair Value on a Non-Recurring Basis
The fair value measurements of assets acquired and liabilities assumed, other than contingent consideration which is discussed above, are measured as of the acquisition date by a third-party valuation specialist using a discounted cash flow model based on inputs that are not observable in the market and are therefore designated as Level 3 inputs. Significant inputs to the valuation of acquired oil and gas properties include forward oil and gas price curves, estimated volumes of oil and gas reserves, expectations for timing and amount of future development and operating costs, future plugging and abandonment costs, and a risk adjusted discount rate. See "Note 3. Acquisitions and Divestitures of Oil and Gas Properties" for additional discussion.
The fair value measurements of asset retirement obligations are measured as of the date a well is drilled or when production equipment and facilities are installed using a discounted cash flow model based on inputs that are not observable in the market and therefore are designated as Level 3 within the valuation hierarchy. Significant inputs to the fair value measurement of asset retirement obligations include estimates of the costs of plugging and abandoning oil and gas wells, removing production equipment and facilities and restoring the surface of the land as well as estimates of the economic lives of the oil and gas wells and future inflation rates. See "Note 7. Asset Retirement Obligations" for additional discussion.
The fair value measurements of the Preferred Stock are measured as of the issuance date by a third-party valuation specialist using a discounted cash flow model based on inputs that are not observable in the market and therefore are designated as Level 3 inputs. Significant inputs to the valuation of the Preferred Stock include the per share cash purchase price, redemption premiums, liquidation preference, and redemption assumptions provided by the Company. See "Note 9. Preferred Stock and Common Stock Warrants" for details regarding the allocation of the net proceeds based on the relative fair values of the Preferred Stock and Warrants.
F-39
Fair Value of Other Financial Instruments
The Company's other financial instruments consist of cash and cash equivalents, receivables, payables, and long-term debt. The carrying amounts of cash and cash equivalents, receivables, and payables approximate fair value due to the highly liquid or short-term nature of these instruments. The carrying amount of long-term debt associated with borrowings outstanding under the Company's revolving credit facility approximates fair value as borrowings bear interest at variable rates. The following table presents the principal amounts of the Company's senior notes and other long-term debt with the fair values measured using quoted secondary market trading prices which are designated as Level 1 within the valuation hierarchy. See "Note 6. Long-Term Debt" for additional discussion.
|
| December 31, 2018 |
| December 31, 2017 | ||||||||||||
|
| Principal Amount |
| Fair Value |
| Principal Amount |
| Fair Value | ||||||||
|
| (In thousands) | ||||||||||||||
7.50% Senior Notes due 2020 |
| | $- | |
| | $- | |
| | $450,000 | |
| | $459,518 | |
6.25% Senior Notes due 2023 |
| 650,000 | |
| 599,625 | |
| 650,000 | |
| 674,375 | | ||||
8.25% Senior Notes due 2025 |
| 250,000 | |
| 244,375 | |
| 250,000 | |
| 274,375 | | ||||
Other long-term debt due 2028 |
| - | |
| - | |
| 4,425 | |
| 4,445 | | ||||
14. Condensed Consolidating Financial Information
The rules of the SEC require that condensed consolidating financial information be provided for a subsidiary that has guaranteed the debt of a registrant issued in a public offering, where the guarantee is full, unconditional and joint and several and where the voting interest of the subsidiary is 100% owned by the registrant. The Company is, therefore, presenting condensed consolidating financial information on a parent company, combined guarantor subsidiaries, combined non-guarantor subsidiaries and consolidated basis and should be read in conjunction with the consolidated financial statements. The financial information may not necessarily be indicative of results of operations, cash flows, or financial position had such guarantor subsidiaries operated as independent entities.
F-40
CARRIZO OIL & GAS, INC.
CONDENSED CONSOLIDATING BALANCE SHEETS
(In thousands)
|
| December 31, 2018 | ||||||||||||||||||
|
| Parent Company |
| Combined Guarantor Subsidiaries |
| Combined Non- Guarantor Subsidiaries |
| Eliminations |
| Consolidated | ||||||||||
Assets |
|
|
|
|
|
|
|
|
|
| ||||||||||
Total current assets |
| | $3,341,680 | |
| | $114,005 | |
| | $- | |
| | ($3,305,316 | ) |
| | $150,369 | |
Total property and equipment, net |
| 7,951 | |
| 3,011,387 | |
| 3,028 | |
| (3,842 | ) |
| 3,018,524 | | |||||
Investment in subsidiaries |
| (419,159 | ) |
| - | |
| - | |
| 419,159 | |
| - | | |||||
Other long-term assets |
| 28,124 | |
| 5,906 | |
| - | |
| (17,823 | ) |
| 16,207 | | |||||
Total Assets |
| | $2,958,596 | |
| | $3,131,298 | |
| | $3,028 | |
| | ($2,907,822 | ) |
| | $3,185,100 | |
|
|
|
|
|
|
|
|
|
|
| ||||||||||
Liabilities and Shareholders' Equity |
|
|
|
|
|
|
|
|
|
| ||||||||||
Current liabilities |
| | $135,980 | |
| | $3,491,337 | |
| | $3,028 | |
| | ($3,308,336 | ) |
| | $322,009 | |
Long-term liabilities |
| 1,650,589 | |
| 59,120 | |
| - | |
| (1,944 | ) |
| 1,707,765 | | |||||
Preferred stock |
| 174,422 | |
| - | |
| - | |
| - | |
| 174,422 | | |||||
Total shareholders' equity |
| 997,605 | |
| (419,159 | ) |
| - | |
| 402,458 | |
| 980,904 | | |||||
Total Liabilities and Shareholders' Equity |
| | $2,958,596 | |
| | $3,131,298 | |
| | $3,028 | |
| | ($2,907,822 | ) |
| | $3,185,100 | |
|
| December 31, 2017 | ||||||||||||||||||
|
| Parent Company |
| Combined Guarantor Subsidiaries |
| Combined Non- Guarantor Subsidiaries |
| Eliminations |
| Consolidated | ||||||||||
Assets |
|
|
|
|
|
|
|
|
|
| ||||||||||
Total current assets |
| | $3,441,633 | |
| | $105,533 | |
| | $- | |
| | ($3,424,288 | ) |
| | $122,878 | |
Total property and equipment, net |
| 5,953 | |
| 2,630,707 | |
| 3,028 | |
| (3,878 | ) |
| 2,635,810 | | |||||
Investment in subsidiaries |
| (999,793 | ) |
| - | |
| - | |
| 999,793 | |
| - | | |||||
Other long-term assets |
| 9,270 | |
| 10,346 | |
| - | |
| - | |
| 19,616 | | |||||
Total Assets |
| | $2,457,063 | |
| | $2,746,586 | |
| | $3,028 | |
| | ($2,428,373 | ) |
| | $2,778,304 | |
|
|
|
|
|
|
|
|
|
|
| ||||||||||
Liabilities and Shareholders' Equity |
|
|
|
|
|
|
|
|
|
| ||||||||||
Current liabilities |
| | $165,701 | |
| | $3,631,401 | |
| | $3,028 | |
| | ($3,427,308 | ) |
| | $372,822 | |
Long-term liabilities |
| 1,689,466 | |
| 114,978 | |
| - | |
| 15,879 | |
| 1,820,323 | | |||||
Preferred stock |
| 214,262 | |
| - | |
| - | |
| - | |
| 214,262 | | |||||
Total shareholders' equity |
| 387,634 | |
| (999,793 | ) |
| - | |
| 983,056 | |
| 370,897 | | |||||
Total Liabilities and Shareholders' Equity |
| | $2,457,063 | |
| | $2,746,586 | |
| | $3,028 | |
| | ($2,428,373 | ) |
| | $2,778,304 | |
F-41
CARRIZO OIL & GAS, INC.
CONDENSED CONSOLIDATING STATEMENTS OF OPERATIONS
(In thousands)
|
| Year Ended December 31, 2018 | ||||||||||||||||||
|
| Parent Company |
| Combined Guarantor Subsidiaries |
| Combined Non- Guarantor Subsidiaries |
| Eliminations |
| Consolidated | ||||||||||
Total revenues |
| | $162 | |
| | $1,065,780 | |
| | $- | |
| | $- | |
| | $1,065,942 | |
Total costs and expenses |
| 176,406 | |
| 479,973 | |
| - | |
| (37 | ) |
| 656,342 | | |||||
Income (loss) before income taxes |
| (176,244 | ) |
| 585,807 | |
| - | |
| 37 | |
| 409,600 | | |||||
Income tax expense |
| - | |
| (5,173 | ) |
| - | |
| - | |
| (5,173 | ) | |||||
Equity in income of subsidiaries |
| 580,634 | |
| - | |
| - | |
| (580,634 | ) |
| - | | |||||
Net income |
| | $404,390 | |
| | $580,634 | |
| | $- | |
| | ($580,597 | ) |
| | $404,427 | |
Dividends on preferred stock |
| (18,161 | ) |
| - | |
| - | |
| - | |
| (18,161 | ) | |||||
Accretion on preferred stock |
| (3,057 | ) |
| - | |
| - | |
| - | |
| (3,057 | ) | |||||
Loss on redemption of preferred stock |
| (7,133 | ) |
| - | |
| - | |
| - | |
| (7,133 | ) | |||||
Net income attributable to common shareholders |
| | $376,039 | |
| | $580,634 | |
| | $- | |
| | ($580,597 | ) |
| | $376,076 | |
|
| Year Ended December 31, 2017 | ||||||||||||||||||
|
| Parent Company |
| Combined Guarantor Subsidiaries |
| Combined Non- Guarantor Subsidiaries |
| Eliminations |
| Consolidated | ||||||||||
Total revenues |
| | $302 | |
| | $745,586 | |
| | $- | |
| | $- | |
| | $745,888 | |
Total costs and expenses |
| 195,728 | |
| 459,057 | |
| - | |
| (37 | ) |
| 654,748 | | |||||
Income (loss) before income taxes |
| (195,426 | ) |
| 286,529 | |
| - | |
| 37 | |
| 91,140 | | |||||
Income tax expense |
| - | |
| (4,030 | ) |
| - | |
| - | |
| (4,030 | ) | |||||
Equity in income of subsidiaries |
| 282,499 | |
| - | |
| - | |
| (282,499 | ) |
| - | | |||||
Net income |
| | $87,073 | |
| | $282,499 | |
| | $- | |
| | ($282,462 | ) |
| | $87,110 | |
Dividends on preferred stock |
| (7,781 | ) |
| - | |
| - | |
| - | |
| (7,781 | ) | |||||
Accretion on preferred stock |
| (862 | ) |
| - | |
| - | |
| - | |
| (862 | ) | |||||
Loss on redemption of preferred stock |
| - | |
| - | |
| - | |
| - | |
| - | | |||||
Net income attributable to common shareholders |
| | $78,430 | |
| | $282,499 | |
| | $- | |
| | ($282,462 | ) |
| | $78,467 | |
|
| Year Ended December 31, 2016 | ||||||||||||||||||
|
| Parent Company |
| Combined Guarantor Subsidiaries |
| Combined Non- Guarantor Subsidiaries |
| Eliminations |
| Consolidated | ||||||||||
Total revenues |
| | $482 | |
| | $443,112 | |
| | $- | |
| | $- | |
| | $443,594 | |
Total costs and expenses |
| 208,054 | |
| 910,522 | |
| - | |
| 492 | |
| 1,119,068 | | |||||
Loss before income taxes |
| (207,572 | ) |
| (467,410 | ) |
| - | |
| (492 | ) |
| (675,474 | ) | |||||
Income tax expense |
| - | |
| - | |
| - | |
| - | |
| - | | |||||
Equity in loss of subsidiaries |
| (467,410 | ) |
| - | |
| - | |
| 467,410 | |
| - | | |||||
Net loss |
| | ($674,982 | ) |
| | ($467,410 | ) |
| | $- | |
| | $466,918 | |
| | ($675,474 | ) |
Dividends on preferred stock |
| - | |
| - | |
| - | |
| - | |
| - | | |||||
Accretion on preferred stock |
| - | |
| - | |
| - | |
| - | |
| - | | |||||
Loss on redemption of preferred stock |
| - | |
| - | |
| - | |
| - | |
| - | | |||||
Net loss attributable to common shareholders |
| | ($674,982 | ) |
| | ($467,410 | ) |
| | $- | |
| | $466,918 | |
| | ($675,474 | ) |
F-42
CARRIZO OIL & GAS, INC.
CONDENSED CONSOLIDATING STATEMENTS OF CASH FLOWS
(In thousands)
|
| Year Ended December 31, 2018 | ||||||||||||||||||
|
| Parent Company |
| Combined Guarantor Subsidiaries |
| Combined Non- Guarantor Subsidiaries |
| Eliminations |
| Consolidated | ||||||||||
Net cash provided by (used in) operating activities |
| | ($269,318 | ) |
| | $922,873 | |
| | $- | |
| | $- | |
| | $653,555 | |
Net cash provided by (used in) investing activities |
| 126,905 | |
| (792,383 | ) |
| - | |
| (130,490 | ) |
| (795,968 | ) | |||||
Net cash provided by (used in) financing activities |
| 135,155 | |
| (130,490 | ) |
| - | |
| 130,490 | |
| 135,155 | | |||||
Net decrease in cash and cash equivalents |
| (7,258 | ) |
| - | |
| - | |
| - | |
| (7,258 | ) | |||||
Cash and cash equivalents, beginning of year |
| 9,540 | |
| - | |
| - | |
| - | |
| 9,540 | | |||||
Cash and cash equivalents, end of year |
| | $2,282 | |
| | $- | |
| | $- | |
| | $- | |
| | $2,282 | |
|
| Year Ended December 31, 2017 | ||||||||||||||||||
|
| Parent Company |
| Combined Guarantor Subsidiaries |
| Combined Non- Guarantor Subsidiaries |
| Eliminations |
| Consolidated | ||||||||||
Net cash provided by (used in) operating activities |
| | ($121,107 | ) |
| | $544,088 | |
| | $- | |
| | $- | |
| | $422,981 | |
Net cash used in investing activities |
| (615,364 | ) |
| (1,155,340 | ) |
| - | |
| 611,252 | |
| (1,159,452 | ) | |||||
Net cash provided by financing activities |
| 741,817 | |
| 611,252 | |
| - | |
| (611,252 | ) |
| 741,817 | | |||||
Net increase in cash and cash equivalents |
| 5,346 | |
| - | |
| - | |
| - | |
| 5,346 | | |||||
Cash and cash equivalents, beginning of year |
| 4,194 | |
| - | |
| - | |
| - | |
| 4,194 | | |||||
Cash and cash equivalents, end of year |
| | $9,540 | |
| | $- | |
| | $- | |
| | $- | |
| | $9,540 | |
|
| Year Ended December 31, 2016 | ||||||||||||||||||
|
| Parent Company |
| Combined Guarantor Subsidiaries |
| Combined Non- Guarantor Subsidiaries |
| Eliminations |
| Consolidated | ||||||||||
Net cash provided by (used in) operating activities |
| | ($34,773 | ) |
| | $307,541 | |
| | $- | |
| | $- | |
| | $272,768 | |
Net cash used in investing activities |
| (312,291 | ) |
| (575,824 | ) |
| (740 | ) |
| 269,023 | |
| (619,832 | ) | |||||
Net cash provided by financing activities |
| 308,340 | |
| 268,283 | |
| 740 | |
| (269,023 | ) |
| 308,340 | | |||||
Net decrease in cash and cash equivalents |
| (38,724 | ) |
| - | |
| - | |
| - | |
| (38,724 | ) | |||||
Cash and cash equivalents, beginning of year |
| 42,918 | |
| - | |
| - | |
| - | |
| 42,918 | | |||||
Cash and cash equivalents, end of year |
| | $4,194 | |
| | $- | |
| | $- | |
| | $- | |
| | $4,194 | |
F-43
15. Supplemental Cash Flow Information
Supplemental cash flow disclosures and non-cash investing and financing activities are presented below:
|
| Years Ended December 31, | ||||||||||
|
| 2018 |
| 2017 |
| 2016 | ||||||
|
| (In thousands) | ||||||||||
Operating activities: |
|
|
|
|
|
| ||||||
Cash paid for interest, net of amounts capitalized |
| | $59,846 | |
| | $77,213 | |
| | $75,231 | |
Cash paid for income taxes |
| - | |
| - | |
| - | | |||
|
|
|
|
|
|
| ||||||
Investing activities: |
|
|
|
|
|
| ||||||
Increase (decrease) in capital expenditure payables and accruals |
| | ($53,722 | ) |
| | $102,272 | |
| | ($21,492 | ) |
|
|
|
|
|
|
| ||||||
Supplemental non-cash investing activities: |
|
|
|
|
|
| ||||||
Fair value of contingent consideration assets on date of divestiture |
| (7,880 | ) |
| (8,805 | ) |
| - | | |||
Fair value of contingent consideration liabilities on date of acquisition |
| - | |
| 52,300 | |
| - | | |||
Liabilities assumed in connection with the Sanchez Acquisition |
| - | |
| - | |
| 4,880 | | |||
Stock-based compensation expense capitalized to oil and gas properties |
| 4,124 | |
| 4,482 | |
| 4,591 | | |||
Asset retirement obligations capitalized to oil and gas properties |
| 2,132 | |
| 3,726 | |
| 1,927 | | |||
|
|
|
|
|
|
| ||||||
Supplemental non-cash financing activities: |
| | |
| | |
| | | |||
Non-cash loss on extinguishment of debt, net |
| 3,586 | |
| 1,357 | |
| - | | |||
16. Subsequent Events (Unaudited)
Hedging
Subsequent to December 31, 2018 , the Company entered into the following commodity derivative instruments at weighted average contract volumes and prices:
Commodity |
| Period |
| Type of Contract |
| Index |
| Volumes |
| Fixed Price |
| Sub-Floor |
| Floor Price |
| Ceiling Price | |||||||||
Crude oil |
| 2020 |
| Price Swaps |
| NYMEX WTI |
| 3,000 | |
| | $55.06 | |
| - | |
| - | |
| - | | |||
Crude oil |
| 2020 |
| Three-Way Collars |
| NYMEX WTI |
| 6,000 | |
| - | |
| | $45.00 | |
| | $55.00 | |
| | $64.69 | | |
Contingent Consideration Arrangements
For the year ended December 31, 2018, the specified pricing thresholds related to the Contingent ExL Consideration, the Contingent Niobrara Consideration, and the Contingent Utica Consideration were exceeded. As a result, in January 2019, we paid $50.0 million and received $10.0 million from settlement of these contingent consideration arrangements.
17. Supplemental Disclosures about Oil and Gas Producing Activities (Unaudited)
Costs Incurred
Costs incurred in oil and gas property acquisition, exploration and development activities are summarized below:
|
| Years Ended December 31, | ||||||||||
|
| 2018 |
| 2017 |
| 2016 | ||||||
|
| (In thousands) | ||||||||||
Property acquisition costs |
|
|
|
|
|
| ||||||
Proved properties |
| | $47,370 | |
| | $303,307 | |
| | $90,661 | |
Unproved properties |
| 182,220 | |
| 525,061 | |
| 113,535 | | |||
Total property acquisition costs |
| 229,590 | |
| 828,368 | |
| 204,196 | | |||
Exploration costs |
| 48,570 | |
| 91,098 | |
| 37,508 | | |||
Development costs |
| 809,637 | |
| 569,982 | |
| 374,134 | | |||
Total costs incurred |
| | $1,087,797 | |
| | $1,489,448 | |
| | $615,838 | |
F-44
Costs incurred exclude capitalized interest on unproved properties of $36.6 million , $28.3 million , and $17.0 million for the years ended December 31, 2018 , 2017 and 2016 , respectively. Included in exploration and development costs are non-cash additions related to the estimated future asset retirement obligations of the Company's oil and gas properties of $1.9 million , $3.5 million and $1.9 million for the years ended December 31, 2018 , 2017 and 2016 , respectively. Non-cash additions related to the estimated future asset retirement obligations associated with the Devon Acquisition of $0.2 million , the ExL Acquisition of $0.1 million , and the Sanchez Acquisition of $2.0 million are included in acquisition costs of proved properties for the years ended December 31, 2018, 2017 and 2016, respectively. The internal cost of employee compensation and benefits, including stock-based compensation, capitalized to proved or unproved oil and gas properties of $17.0 million , $14.8 million and $10.5 million for the years ended December 31, 2018 , 2017 and 2016 , respectively, are included in exploration, development and unproved property acquisition costs.
Proved Oil and Gas Reserve Quantities
Proved oil and gas reserves are generally those quantities of crude oil, NGLs and natural gas, which by analysis of geoscience and engineering data, can be estimated with reasonable certainty to be economically producible in future years from known reservoirs under existing economic conditions, operating methods and government regulations. Proved developed reserves include reserves that can be expected to be produced through existing wells with existing equipment and operating methods or in which the cost of the required equipment is relatively minor compared to the cost of a new well. Proved undeveloped reserves include reserves that are expected to be recovered from new wells on undrilled acreage or from existing wells where a relatively major expenditure is required for recompletion. Proved reserve quantities at December 31, 2018 , 2017 , and 2016 and the related discounted future net cash flows before income taxes are based on estimates prepared by Ryder Scott Company, L.P. Such estimates have been prepared in accordance with guidelines established by the SEC. All of the Company's proved reserves are attributable to properties within the United States.
F-45
The Company's proved reserves and changes in proved reserves are as follows:
|
| Crude Oil (MBbls) |
| NGLs (MBbls) |
| Natural Gas (MMcf) |
| Total Proved Reserves (MBoe) | ||||
Proved reserves: |
|
|
|
|
|
|
|
| ||||
January 1, 2016 |
| 109,588 | |
| 20,221 | |
| 244,938 | |
| 170,632 | |
Extensions and discoveries |
| 40,074 | |
| 8,612 | |
| 59,318 | |
| 58,572 | |
Revisions of previous estimates |
| (16,731 | ) |
| (3,230 | ) |
| 1,481 | |
| (19,713 | ) |
Purchases of reserves in place |
| 4,810 | |
| 122 | |
| 7,282 | |
| 6,145 | |
Production |
| (9,423 | ) |
| (1,788 | ) |
| (25,574 | ) |
| (15,473 | ) |
December 31, 2016 |
| 128,318 | |
| 23,937 | |
| 287,445 | |
| 200,163 | |
Extensions and discoveries |
| 50,476 | |
| 13,781 | |
| 98,980 | |
| 80,754 | |
Revisions of previous estimates |
| (19,838 | ) |
| (909 | ) |
| 27,774 | |
| (16,118 | ) |
Purchases of reserves in place |
| 21,634 | |
| 8,642 | |
| 94,962 | |
| 46,103 | |
Sales of reserves in place |
| (650 | ) |
| (526 | ) |
| (170,219 | ) |
| (29,546 | ) |
Production |
| (12,566 | ) |
| (2,327 | ) |
| (28,472 | ) |
| (19,639 | ) |
December 31, 2017 |
| 167,374 | |
| 42,598 | |
| 310,470 | |
| 261,717 | |
Extensions and discoveries |
| 65,352 | |
| 30,195 | |
| 212,758 | |
| 131,007 | |
Revisions of previous estimates |
| (31,287 | ) |
| 1,936 | |
| (6,006 | ) |
| (30,352 | ) |
Purchases of reserves in place |
| 2,205 | |
| 967 | |
| 7,953 | |
| 4,498 | |
Sales of reserves in place |
| (9,676 | ) |
| (2,872 | ) |
| (17,475 | ) |
| (15,461 | ) |
Production |
| (14,232 | ) |
| (3,701 | ) |
| (24,639 | ) |
| (22,040 | ) |
December 31, 2018 |
| 179,736 | |
| 69,123 | |
| 483,061 | |
| 329,369 | |
|
|
|
|
|
|
|
|
| ||||
Proved developed reserves: |
|
|
|
|
|
|
|
| ||||
December 31, 2015 |
| 42,311 | |
| 7,933 | |
| 154,725 | |
| 76,032 | |
December 31, 2016 |
| 51,062 | |
| 9,387 | |
| 187,054 | |
| 91,625 | |
December 31, 2017 |
| 69,632 | |
| 17,447 | |
| 131,355 | |
| 108,972 | |
December 31, 2018 |
| 75,267 | |
| 25,809 | |
| 178,941 | |
| 130,899 | |
|
|
|
|
|
|
|
|
| ||||
Proved undeveloped reserves: |
|
|
|
|
|
|
|
| ||||
December 31, 2015 |
| 67,277 | |
| 12,288 | |
| 90,213 | |
| 94,600 | |
December 31, 2016 |
| 77,256 | |
| 14,550 | |
| 100,391 | |
| 108,538 | |
December 31, 2017 |
| 97,742 | |
| 25,151 | |
| 179,115 | |
| 152,745 | |
December 31, 2018 |
| 104,469 | |
| 43,314 | |
| 304,120 | |
| 198,470 | |
Extensions and discoveries
For the year ended December 31, 2018, the Company added 12,687 MBoe of proved developed reserves and 118,320 MBoe of proved undeveloped reserves through its drilling program and associated offset locations. Eagle Ford and Delaware Basin comprised 30% and 70% , respectively, of the total extensions and discoveries.
For the year ended December 31, 2017, the Company added 6,473 MBoe of proved developed reserves and 74,281 MBoe of proved undeveloped reserves through its drilling program and associated offset locations. Eagle Ford and Delaware Basin comprised 51% and 48% , respectively, of the total extensions and discoveries.
For the year ended December 31, 2016, the Company added 6,525 MBoe of proved developed reserves and 52,047 MBoe of proved undeveloped reserves through its drilling program and associated offset locations. Eagle Ford and Delaware Basin comprised 79% and 20% , respectively, of the total extensions and discoveries.
Revisions of previous estimates
For the year ended December 31, 2018, revisions of previous estimates reduced the Company's proved reserves by 30,352 MBoe. Included in revisions of previous estimates were:
• | Positive revisions due to price of 3,764 MBoe. |
F-46
• | Net negative revisions of 12,363 MBoe primarily due to negative revisions of 14,907 MBoe in the Eagle Ford, partially offset by positive revisions of 2,544 MBoe in the Delaware Basin. The negative revisions in the Eagle Ford were primarily a result of completion of new wells that negatively impacted the production of adjacent existing producing wells and the associated impact to certain PUD locations, as well as a reduction in spacing and the average lateral length for certain PUD locations. |
• | Negative revisions of 21,753 MBoe, primarily in the Eagle Ford due to changes in the Company's previously approved development plan which resulted in the timing of development for certain PUD locations to move beyond five years from initial booking. The primary drivers of the changes in our previously approved development plan are the reallocation of capital to areas providing the greatest opportunities to increase capital efficiency and maximize project-level economics within our reduced capital expenditure plan, which includes a shift to larger-scale development projects. |
For the year ended December 31, 2017, revisions of previous estimates reduced the Company's proved reserves by 16,118 MBoe. Included in revisions of previous estimates were:
• | Positive revisions due to price of 2,684 MBoe. |
• | Negative revisions of 4,500 MBoe primarily in the Eagle Ford due to a downward shift of the type curve for certain PUD locations partially offset by positive revisions due to well performance in Marcellus which occurred prior to the sale in November 2017. |
• | Negative revisions in proved undeveloped reserves of 14,302 MBoe in the Eagle Ford due to changes in the Company's previously approved development plan which resulted in the timing of development for certain PUD locations to move beyond five years from initial booking. The drivers of the changes in the Company's previously approved development plan were the ExL Acquisition and the move to a more efficient development plan which includes drilling and completing larger pads. |
For the year ended December 31, 2016, revisions of previous estimates reduced the Company's proved reserves by 19,713 MBoe. Included in revisions of previous estimates were:
• | Negative revisions due to price of 6,705 MBoe primarily due to the decline in the 12-Month Average Realized price for crude oil, of which 3,228 MBoe related to proved developed and proved undeveloped locations that were no longer economic and 3,477 MBoe related to reductions in the level of economic reserves in proved developed and proved undeveloped reserve locations due to loss of tail reserves; |
• | Negative revisions of 6,083 MBoe primarily in Eagle Ford as the EURs for certain PUD locations were reduced as a result of tighter spacing and shorter lateral lengths partially offset by positive revisions in Marcellus; |
• | Negative revisions in proved undeveloped reserves of 6,925 MBoe in the Eagle Ford due to changes in the Company's previously approved development plan which resulted in the timing of development for certain PUD locations to move beyond five years from initial booking. The drivers of the changes in the Company's previously approved development plan were the move to a more efficient development plan which includes drilling and completing larger pads and the recent Sanchez Acquisition. |
Purchases of reserves in place
For the year ended December 31, 2018, purchases of reserves in place included 4,498 MBoe of proved developed reserves associated with the Devon Acquisition.
For the year ended December 31, 2017, purchases of reserves in place included 26,009 MBoe of proved developed reserves and 20,094 MBoe of proved undeveloped reserves associated with the ExL Acquisition.
For the year ended December 31, 2016, purchases of reserves in place included 4,978 MBoe of proved developed reserves and 1,167 MBoe of proved undeveloped reserves associated with the Sanchez Acquisition.
Sales of reserves in place
For the year ended December 31, 2018, sales of reserves in place included 13,465 MBoe of proved developed reserves and 1,996 MBoe of proved undeveloped reserves associated with the Eagle Ford and Niobrara Formation divestitures.
For the year ended December 31, 2017, sales of reserves in place included 22,249 MBoe of proved developed reserves and 7,297 MBoe of proved undeveloped reserves associated with the Marcellus Shale and Utica Shale divestitures.
There were no sales of reserves in place for the year ended December 31, 2016.
F-47
Standardized Measure
The standardized measure of discounted future net cash flows relating to proved reserves is as follows:
|
| December 31, | ||||||||||
|
| 2018 |
| 2017 |
| 2016 | ||||||
|
| (In thousands) | ||||||||||
Future cash inflows |
| | $14,461,143 | |
| | $10,109,752 | |
| | $5,903,629 | |
Future production costs |
| (4,572,397 | ) |
| (3,202,201 | ) |
| (2,241,928 | ) | |||
Future development costs |
| (1,964,450 | ) |
| (1,699,909 | ) |
| (1,264,493 | ) | |||
Future income taxes (1) |
| (1,005,837 | ) |
| (445,056 | ) |
| - | | |||
Future net cash flows |
| 6,918,459 | |
| 4,762,586 | |
| 2,397,208 | | |||
Less 10% annual discount to reflect timing of cash flows |
| (3,282,901 | ) |
| (2,297,544 | ) |
| (1,093,779 | ) | |||
Standardized measure of discounted future net cash flows |
| | $3,635,558 | |
| | $2,465,042 | |
| | $1,303,429 | |
|
(1) | Future income taxes in the calculation of the standardized measure of discounted future net cash flows were zero as of December 31, 2016, as the historical tax basis of proved oil and gas properties, net operating loss carryforwards, and future tax deductions exceeded the undiscounted future net cash flows before income taxes of the Company's proved oil and gas reserves as of December 31, 2016. |
Proved reserve estimates and future cash flows are based on the average realized prices for sales of crude oil, NGLs and natural gas on the first calendar day of each month during the year. The following average realized prices were used in the calculation of proved reserves and the standardized measure of discounted future net cash flows.
|
| Years Ended December 31, | ||||||||||
|
| 2018 |
| 2017 |
| 2016 | ||||||
Crude oil ($/Bbl) |
| | $63.80 | |
| | $49.87 | |
| | $39.60 | |
NGLs ($/Bbl) |
| | $26.15 | |
| | $19.78 | |
| | $11.66 | |
Natural gas ($/Mcf) |
| | $2.46 | |
| | $2.96 | |
| | $1.89 | |
Future operating and development costs are computed primarily by the Company's petroleum engineers by estimating the expenditures to be incurred in developing and producing the Company's proved reserves at the end of the year, based on current costs and assuming continuation of existing economic conditions. Future income taxes, which include the effects of the Tax Cuts and Jobs Act for the years ended December 31, 2018 and 2017, are based on current statutory rates, adjusted for the tax basis of oil and gas properties and available applicable tax assets. A discount factor of 10% was used to reflect the timing of future net cash flows. The standardized measure of discounted future net cash flows is not intended to represent the replacement cost or fair value of the Company's oil and gas properties. An estimate of fair value would also take into account, among other things, the recovery of reserves not presently classified as proved, anticipated future changes in prices and costs, and a discount factor more representative of the time value of money and the risks inherent in proved reserve estimates.
F-48
Changes in Standardized Measure
Changes in the standardized measure of discounted future net cash flows relating to proved reserves are summarized below:
|
| Years Ended December 31, | ||||||||||
|
| 2018 |
| 2017 |
| 2016 | ||||||
|
| (In thousands) | ||||||||||
Standardized measure at beginning of year |
| | $2,465,042 | |
| | $1,303,429 | |
| | $1,365,224 | |
Revisions to reserves proved in prior years: |
|
|
|
|
|
| ||||||
Net change in sales prices and production costs related to future production |
| | $809,182 | |
| | $710,773 | |
| | ($346,763 | ) |
Net change in estimated future development costs |
| (9,627 | ) |
| (51,854 | ) |
| 74,407 | | |||
Net change due to revisions in quantity estimates |
| (250,817 | ) |
| (42,214 | ) |
| (150,245 | ) | |||
Accretion of discount |
| 263,837 | |
| 130,343 | |
| 136,522 | | |||
Changes in production rates (timing) and other |
| (19,539 | ) |
| (116,056 | ) |
| (111,137 | ) | |||
Total revisions to reserves proved in prior years |
| 793,036 | |
| 630,992 | |
| (397,216 | ) | |||
Net change due to extensions and discoveries, net of estimated future development and production costs |
| 1,127,748 | |
| 597,502 | |
| 313,201 | | |||
Net change due to purchases of reserves in place |
| 60,264 | |
| 452,932 | |
| 43,426 | | |||
Net change due to divestitures of reserves in place |
| (181,308 | ) |
| (106,608 | ) |
| - | | |||
Sales of crude oil, NGLs and natural gas produced, net of production costs |
| (843,333 | ) |
| (566,258 | ) |
| (320,272 | ) | |||
Previously estimated development costs incurred |
| 496,600 | |
| 326,383 | |
| 299,066 | | |||
Net change in income taxes |
| (282,491 | ) |
| (173,330 | ) |
| - | | |||
Net change in standardized measure of discounted future net cash flows |
| 1,170,516 | |
| 1,161,613 | |
| (61,795 | ) | |||
Standardized measure at end of year |
| | $3,635,558 | |
| | $2,465,042 | |
| | $1,303,429 | |
18. Quarterly Financial Data (Unaudited)
The following is a summary of the unaudited quarterly financial data for the years ended December 31, 2018 and 2017 :
Year Ended December 31, 2018 | First Quarter (3) |
| Second Quarter (4) |
| Third Quarter |
| Fourth Quarter (5) | ||||||||
| (In thousands, except per share amounts) | ||||||||||||||
Total revenues | | $225,280 | |
| | $263,973 | |
| | $303,375 | |
| | $273,314 | |
Operating profit (1) | | $108,992 | |
| | $140,265 | |
| | $165,141 | |
| | $129,405 | |
Net income | | $27,492 | |
| | $35,309 | |
| | $81,346 | |
| | $260,280 | |
Net income attributable to common shareholders | | $14,743 | |
| | $30,095 | |
| | $76,118 | |
| | $255,120 | |
|
|
|
|
|
|
|
| ||||||||
Net income attributable to common shareholders per common share (2) |
|
|
|
|
|
|
| ||||||||
Basic | | $0.18 | |
| | $0.37 | |
| | $0.88 | |
| | $2.79 | |
Diluted | | $0.18 | |
| | $0.36 | |
| | $0.85 | |
| | $2.75 | |
Year Ended December 31, 2017 | First Quarter |
| Second Quarter |
| Third Quarter (6) |
| Fourth Quarter (7) | ||||||||
| (In thousands, except per share amounts) | ||||||||||||||
Total revenues | | $151,355 | |
| | $166,483 | |
| | $181,279 | |
| | $246,771 | |
Operating profit (1) | | $57,953 | |
| | $63,147 | |
| | $69,364 | |
| | $113,205 | |
Net income (loss) | | $40,021 | |
| | $56,306 | |
| | $7,823 | |
| | ($17,040 | ) |
Net income (loss) attributable to common shareholders | | $40,021 | |
| | $56,306 | |
| | $5,574 | |
| | ($23,434 | ) |
|
|
|
|
|
|
|
| ||||||||
Net income (loss) attributable to common shareholders per common share (2) |
|
|
|
|
|
|
| ||||||||
Basic | | $0.61 | |
| | $0.86 | |
| | $0.07 | |
| | ($0.29 | ) |
Diluted | | $0.61 | |
| | $0.85 | |
| | $0.07 | |
| | ($0.29 | ) |
|
(1) | Total revenues less lease operating expense, production taxes, ad valorem taxes and DD&A. |
F-49
(2) | The sum of quarterly net income (loss) attributable to common shareholders per common share does not agree with the total year net income (loss) attributable to common shareholders per common share as each computation is based on the weighted average of common shares outstanding during the period. |
(3) | First quarter of 2018 included the following: |
a. | $29.6 million loss on derivatives, net |
b. | $8.7 million loss on extinguishment of debt as a result of the redemption of $320.0 million aggregate principal amount of 7.50% Senior Notes. |
b. | $7.1 million loss on redemption of preferred stock as a result of the redemption of 50,000 shares of Preferred Stock. |
(4) | Second quarter of 2018 included the following: |
a. | $67.7 million loss on derivatives, net |
(5) | Fourth quarter of 2018 included the following: |
a. | $159.4 million gain on derivatives, net |
(6) | Third quarter of 2017 included the following: |
a. | $24.4 million loss on derivatives, net |
(7) | Fourth quarter of 2017 included the following: |
a. | $86.1 million loss on derivatives, net. |
b. | $4.2 million loss on extinguishment of debt as a result of the redemption of $150.0 million aggregate principal amount of 7.50% Senior Notes. |
F-50
SIGNATURES
Pursuant to the requirements of Section 13 or 15(d) of the Securities Exchange Act of 1934, the registrant has caused this report to be signed on its behalf by the undersigned, thereunto duly authorized.
|
|
|
| CARRIZO OIL & GAS, INC. | |
|
|
|
| By: | /s/ David L. Pitts |
|
| David L. Pitts |
|
| Vice President and Chief Financial Officer |
Date: February 28, 2019
Pursuant to the requirements of the Securities Exchange Act of 1934, this report has been signed below by the following persons on behalf of the registrant and in the capacities and on the dates indicated.
|
|
|
|
Name |
| Capacity | Date |
|
|
|
|
/s/ S.P. Johnson IV |
| President, Chief Executive Officer and Director | February 28, 2019 |
S. P. Johnson IV |
| (Principal Executive Officer) |
|
|
|
|
|
/s/ David L. Pitts |
| Vice President and Chief Financial Officer | February 28, 2019 |
David L. Pitts |
| (Principal Financial Officer) |
|
|
|
|
|
/s/ Gregory F. Conaway |
| Vice President and Chief Accounting Officer | February 28, 2019 |
Gregory F. Conaway |
| (Principal Accounting Officer) |
|
|
|
|
|
/s/ Steven A. Webster |
| Chairman of the Board | February 28, 2019 |
Steven A. Webster |
|
|
|
|
|
|
|
/s/ Frances Aldrich Sevilla-Sacasa |
| Director | February 28, 2019 |
Frances Aldrich Sevilla-Sacasa |
|
|
|
|
|
|
|
/s/ Thomas L. Carter, Jr. |
| Director | February 28, 2019 |
Thomas L. Carter, Jr. |
|
|
|
|
|
|
|
/s/ Robert F. Fulton |
| Director | February 28, 2019 |
Robert F. Fulton |
|
|
|
|
|
|
|
/s/ F. Gardner Parker |
| Director | February 28, 2019 |
F. Gardner Parker |
|
|
|
|
|
|
|
/s/ Roger A. Ramsey |
| Director | February 28, 2019 |
Roger A. Ramsey |
|
|
|
|
|
|
|
/s/ Frank A. Wojtek |
| Director | February 28, 2019 |
Frank A. Wojtek |
|
|
|
S-1