UNITED STATES
SECURITIES AND EXCHANGE COMMISSION
Washington, D.C. 20549
Form 10-K
Annual Report Pursuant to Section 13 or 15(d) of
the Securities Exchange Act of 1934
For the Fiscal Year Ended
December 31, 2012
Commission File Number 000-29187-87
Carrizo Oil & Gas, Inc.
(Exact name of registrant as specified in its charter)
Texas |
| 76-0415919 |
(State or other jurisdiction of incorporation or organization) |
| (I.R.S. Employer Identification No.) |
|
| |
500 Dallas Street, Suite 2300, Houston, Texas |
| 77002 |
(Principal executive offices) |
| (Zip Code) |
Registrant's telephone number, including area code: (713) 328-1000
Securities Registered Pursuant to Section 12(b) of the Act:
Common Stock, $0.01 par value
Indicate by check mark if the registrant is a well-known seasoned issuer, as defined in Rule 405 of the Securities Act.
YES ☑ NO ¨
Indicate by check mark if the registrant is not required to file reports pursuant to Section 13 or Section 15(d) of the Exchange Act.
YES ¨ NO ☑
Indicate by check mark whether the registrant (1) has filed all reports required to be filed by Section 13 or 15(d) of the Securities Exchange Act of 1934 during the preceding 12 months (or for such shorter period that the registrant was required to file such reports), and (2) has been subject to such filing requirements for the past 90 days. YES ☑ NO ¨
Indicate by check mark whether the registrant has submitted electronically and posted on its corporate Web site, if any, every Interactive Data File required to be submitted and posted pursuant to Rule 405 of Regulation S-T during the preceding 12 months (or for such shorter period that the registrant was required to submit and post such files). YES ☑ NO ¨
Indicate by check mark if disclosure of delinquent filers pursuant to Item 405 of Regulation S-K is not contained herein, and will not be contained, to the best of registrant's knowledge, in definitive proxy or information statements incorporated by reference in Part III of this Form 10-K or any amendment to this Form 10-K. ¨
Indicate by check mark whether the registrant is a large accelerated filer, an accelerated filer, a non-accelerated filer, or a smaller reporting company. See the definitions of "large accelerated filer," "accelerated filer" and "smaller reporting company" in Rule 12b-2 of the Exchange Act. (Check one):
Large accelerated filer | ☑ |
| Accelerated filer | ¨ |
|
|
|
|
|
Non-accelerated filer | ¨ | (Do not check if a smaller reporting company) | Smaller reporting company | ¨ |
Indicate by check mark whether the registrant is a shell company (as defined in Rule 12b-2 of the Act). YES ¨ NO ☑
At June 30, 2012, the aggregate market value of the registrant's Common Stock held by non-affiliates of the registrant was approximately $848.1 million based on the closing price of such stock on such date of $23.49 .
At February 25, 2013 , the number of shares outstanding of the registrant's Common Stock was 40,281,069.
DOCUMENTS INCORPORATED BY REFERENCE
Portions of the definitive proxy statement for the Registrant's 2013 Annual Meeting of Shareholders are incorporated by reference in Part III of this Form 10-K. Such definitive proxy statement will be filed with the U.S. Securities and Exchange Commission not later than 120 days subsequent to December 31, 2012 .
TABLE OF CONTENTS
|
|
Forward-Looking Statements | 3 |
PART I |
|
Item 1. Business | 4 |
Item 1A. Risk Factors | 28 |
Item 1B. Unresolved Staff Comments | 40 |
Item 2. Properties | 41 |
Item 3. Legal Proceedings | 41 |
Item 4. Mine Safety Disclosures | 41 |
PART II |
|
Item 5. Market for Registrant's Common Stock, Related Shareholder Matters and Issuer Purchases of Equity Securities | 42 |
Item 6. Selected Financial Data | 44 |
Item 7. Management's Discussion and Analysis of Financial Condition and Results of Operations | 45 |
Item 7A. Qualitative and Quantitative Disclosures about Market Risk | 60 |
Item 8. Financial Statements and Supplementary Data | 61 |
Item 9. Changes In and Disagreements With Accountants on Accounting and Financial Disclosures | 61 |
Item 9A. Controls and Procedures | 61 |
Item 9B. Other Information | 62 |
PART III |
|
Item 10. Directors, Executive Officers and Corporate Governance | 63 |
Item 11. Executive Compensation | 63 |
Item 12. Security Ownership of Certain Beneficial Owners and Management and Related Shareholder Matters | 63 |
Item 13. Certain Relationships and Related Transactions, and Director Independence | 63 |
Item 14. Principal Accountant Fees and Services | 63 |
PART IV |
|
Item 15. Exhibits and Financial Statement Schedules | 64 |
2
Forward-Looking Statements
This annual report contains statements concerning our expectations, beliefs, plans, objectives, goals, strategies, future events or performance and underlying assumptions and other statements that are not historical facts. These statements are "forward-looking statements" within the meaning of the Private Securities Litigation Reform Act of 1995. These forward-looking statements include, among others, statements regarding:
• | our growth strategies; |
• | our ability to explore for and develop oil and gas resources successfully and economically; |
• | our estimates and forecasts of the timing and number of wells we expect to drill and other exploration activities; |
• | our estimates regarding timing and levels of production; |
• | anticipated trends in our business; |
• | the effects of competition on us; |
• | our future results of operations; |
• | our liquidity and our ability to finance our exploration and development activities; |
• | our capital expenditure plan; |
• | plans regarding our U.K. North Sea assets; |
• | future market conditions in the oil and gas industry; |
• | our ability to make, integrate and develop acquisitions; and |
• | the impact of governmental regulation, taxes, market changes and world events. |
You generally can identify our forward-looking statements by the words "anticipate," "believe," budgeted," "continue," "could," "estimate," "expect," "forecast," "goal," "intend," "may," "objective," "plan," "potential," "predict," "projection," "scheduled," "should," or other similar words. Such statements involve risks and uncertainties, including, but not limited to, those relating to the worldwide economic downturn, availability of financing, our dependence on our exploratory drilling activities, the volatility of and changes in oil and gas prices, the need to replace reserves depleted by production, operating risks of oil and gas operations, our dependence on our key personnel, factors that affect our ability to manage our growth and achieve our business strategy, results, delays and uncertainties that may be encountered in drilling, development or production, interpretations and impact of oil and gas reserve estimation and disclosure requirements, activities and approvals of our partners and parties with whom we have alliances, technological changes, capital requirements, borrowing base determinations and availability under our credit facilities, evaluations of us by lenders under our credit facilities, the potential impact of government regulations, including current and proposed legislation and regulations related to hydraulic fracturing, oil and natural gas drilling, air emissions and climate change, regulatory determinations, litigation, competition, the uncertainty of reserve information and future net revenue estimates, property acquisition risks, availability of equipment and crews, actions by our midstream and other industry partners, weather, availability of financing, actions by lenders, our ability to obtain permits and licenses, the results of audits and assessments, the failure to obtain certain bank and lease consents, the existence and resolution of title defects, new taxes and impact fees, delays, costs and difficulties relating to our joint ventures, actions by joint venture partners, results of exploration activities, the availability and completion of land acquisitions, completion and connection of wells, and other factors detailed in this annual report.
We have based our forward-looking statements on our management's beliefs and assumptions based on information available to our management at the time the statements are made. We caution you that assumptions, beliefs, expectations, intentions and projections about future events may and often do vary materially from actual results. Therefore, we cannot assure you that actual results will not differ materially from those expressed or implied by our forward-looking statements.
Some of the factors that could cause actual results to differ from those expressed or implied in forward-looking statements are described under Part I, "Item 1A. Risk Factors" and in other sections of this annual report. Should one or more of these risks or uncertainties materialize, or should underlying assumptions prove incorrect, actual outcomes may vary materially from those indicated. All subsequent written and oral forward-looking statements attributable to us or persons acting on our behalf are expressly qualified in their entirety by reference to these risks and uncertainties. You should not place undue reliance on our forward-looking statements. Each forward-looking statement speaks only as of the date of the particular statement, and, except as required by law, we undertake no duty to update or revise any forward-looking statement.
Certain terms used herein relating to the oil and gas industry are defined in "Glossary of Certain Industry Terms" included under Part I, "Item 1. Business."
3
PART I
Item 1. Business
General Overview
Carrizo Oil & Gas, Inc. is a Houston-based independent energy company which, together with its subsidiaries (collectively, "Carrizo," the "Company" or "we"), is actively engaged in the exploration, development, and production of oil and gas primarily from resource plays located in the United States. Our current operations are principally focused in proven, producing oil and gas plays primarily in the Eagle Ford Shale in South Texas, the Niobrara Formation in Colorado, the Marcellus Shale in Pennsylvania, the Barnett Shale in North Texas, and the Utica Shale in Ohio.
Since we began focusing a significant portion of our efforts in shale plays, particularly in the Barnett Shale in 2003 and Eagle Ford Shale in 2010, we have grown our reserves at a compounded annual growth rate ("CAGR") of 30%, while simultaneously maintaining a CAGR on our production of 25%. After adjusting for 2012 sales of oil and gas interests in the Barnett Shale and other U.S. areas, and joint ventures in the Niobrara Formation, we added, net of production, 28.4 MMBoe to proved reserves, for a reserve replacement ratio of 301% during 2012 . Please read "Oil and Gas Reserve Replacement" for more information on our reserve replacement ratio. This reserve replacement ratio was achieved in spite of record production in 2012 of 9.4 MMBoe , a 26% increase from 2011 . At year-end 2012 , our proved reserves of 121.1 MMBoe were approximately 41% crude oil, condensate and natural gas liquids and approximately 59% natural gas, as compared to 22% and 78% at year-end 2011 , respectively.
The following table provides details about the Company's proved reserves as of the dates indicated.
|
| Proved Reserves (MMBoe) | ||||
|
| December 31, 2012 |
| December 31, 2011 | ||
U.S. |
|
|
|
| ||
Barnett Shale |
| 50.6 | |
| 109.6 | |
Eagle Ford Shale |
| 49.0 | |
| 28.5 | |
Marcellus Shale |
| 12.5 | |
| 6.2 | |
Niobrara Formation |
| 2.0 | |
| 1.0 | |
Other U.S. |
| 1.0 | |
| 4.3 | |
Total U.S. |
| 115.1 | |
| 149.6 | |
U.K. North Sea (discontinued operations) |
| 6.0 | |
| 6.3 | |
Worldwide |
| 121.1 | |
| 155.9 | |
Our Board of Directors has approved a U.S. capital expenditure plan of $624.0 million for 2013 . This plan reflects our strategy of controlling capital costs and maintaining financial flexibility in light of current economic conditions. We currently expect to commit the majority of our 2013 U.S. capital expenditure plan to the continued development of our properties in the Eagle Ford Shale, the Marcellus Shale and the Niobrara Formation. The level of our expected Niobrara Formation capital expenditures reflects the obligation of our joint venture partners to carry a portion of our costs. We intend to finance our 2013 U.S. capital expenditure plan primarily from cash flow from operations and our senior secured credit facility. Other available sources of funding include proceeds from the possible selective sale of assets and offerings of securities.The table below highlights capital expenditures in our primary areas of activity:
|
| Capital Expenditures ($ in millions) | ||||||
|
| 2013 Plan |
| 2012 Actual | ||||
U.S. |
|
|
|
| ||||
Eagle Ford Shale |
| $ | 385.0 | |
| $ | 402.0 | |
Marcellus Shale |
| 70.0 | |
| 78.8 | | ||
Niobrara Formation |
| 35.0 | |
| 62.7 | | ||
Barnett Shale and Other U.S. |
| 10.0 | |
| 20.1 | | ||
Total U.S. drilling and completion |
| 500.0 | |
| 563.6 | | ||
U.S. leasehold and seismic |
| 124.0 | |
| 132.2 | | ||
Total U.S. |
| 624.0 | |
| 695.8 | | ||
U.K. North Sea (discontinued operations) |
| - | |
| 46.4 | | ||
Worldwide |
| 624.0 | |
| 742.2 | | ||
4
Crude Oil and Liquids Plays and Projects
At December 31, 2012 , our crude oil and liquids proved reserves were 49.7 MMBoe , a 43% increase from 34.7 MMBoe at December 31, 2011 . The significant increase in crude oil and liquids reserves was primarily due to the execution of our growth strategy in crude oil and liquids-rich plays in the Eagle Ford Shale and, to a lesser extent, the Niobrara Formation, collectively adding 18.1 MMBoe of crude oil and liquids to our proved reserves (21.5 MMBoe including associated gas) during 2012 , which was partially offset by the sale of an aggregate 40% of substantially all of our interest in oil and gas properties in the Niobrara formation to new joint venture partners (0.4 MMBoe of crude oil and liquids reserves as of December 31, 2011 ). See also "Niobrara Formation-OIL Joint Venture" and "-Haimo Joint Venture" below.
Eagle Ford Shale
The Eagle Ford Shale has become our most significant operational area. Our core Eagle Ford Shale properties are located in LaSalle county and, to a lesser extent, in McMullen, Frio and Atascosa counties in Texas. Our drilling targets in this area are substantially all in the Eagle Ford Shale, although we have recently begun drilling to the Pearsall Shale, which is found below the Eagle Ford Shale. Following the April 2010 announcement of our growth strategy to increase crude oil and liquids production, we commenced a leasing program targeting the liquids-rich window of the Eagle Ford Shale. As of December 31, 2012 , we held interests in approximately 95,599 gross ( 49,003 net) acres, 72 gross ( 57.0 net) producing wells and 19 gross ( 15.8 net) wells that were drilled but waiting on completion. We operated all of these wells mentioned. During 2012 , we drilled 59 gross ( 46.7 net) wells, all of which we operated, and completed and brought on production 51 gross (29.2 net) wells. Approximately 43% of our 49,003 gross acres in the Eagle Ford Shale is either in currently designated producing units or in units on which wells have been drilled and are waiting on completion. Our 2012 production in the Eagle Ford Shale was 2,910.0 MBoe (7,950.0 Boe /d), 352% above 2011 production of 644.0 MBoe (1,764.0 Boe /d). Total proved reserves for the Eagle Ford Shale were 49.0 MMBoe at December 31, 2012 , approximately 85%, or 41.7 MMBoe , of which was crude oil (36.5 MMBbls) and liquids (5.2 MMBoe).
As of December 31, 2012 , we were operating three rigs in the Eagle Ford Shale and expect to operate three rigs in the Eagle Ford Shale throughout 2013 . We currently expect our 2013 Eagle Ford Shale development efforts to require an investment of approximately $385.0 million for drilling and completion costs, which will be spent primarily in our core area within the Eagle Ford Shale in LaSalle county and, to a lesser extent, in McMullen, Frio and Atascosa counties.
GAIL Joint Venture. In September 2011, we completed the sale of 20% of our interests in certain oil and gas properties in the Eagle Ford Shale to GAIL GLOBAL (USA) INC. ("GAIL"), a wholly owned subsidiary of GAIL (India) Limited, for $63.7 million in cash and a commitment by GAIL to pay a "development carry" of 50% of certain of our future development costs up to approximately $31.3 million net to our interest. The GAIL development carry was fully utilized in 2012.
In connection with this sale transaction, we and GAIL also entered into agreements to form a new joint venture with respect to the interests purchased by GAIL. Under the terms of the agreement, we generally retained a 80% working interest in the acreage and GAIL purchased a 20% working interest. We also granted an option in favor of GAIL to purchase a 20% share of acreage acquired by us after the closing located in specified areas adjacent to the initially purchased areas. This option is exercisable at our cost plus a specified premium, and is subject to specified exceptions. We serve as operator of the properties covered by this joint venture. As of December 31, 2012 , the joint venture with GAIL included approximately 23,320 net acres in the Eagle Ford Shale.
Niobrara Formation
As another part of our growth strategy in crude oil and liquids, starting in 2010, we also acquired working interests in the Niobrara Formation located in the Denver-Julesberg Basin, primarily in Weld and Adams counties, Colorado. During 2012 , we drilled 26 gross wells ( 9.1 net), of which we operated 23 gross wells ( 8.9 net), and completed and brought on production 23 gross wells (8.0 net). As of December 31, 2012 , we held interests in approximately 112,946 gross ( 36,213 net) acres, 37 gross ( 13.4 net) producing wells and 2 gross ( 0.6 net) wells that were drilled but waiting on completion. Of these wells, we operated 31 gross ( 12.5 net) producing wells and 2 gross ( 0.6 net) wells drilled and waiting on completion. Our 2012 production in the Niobrara was 460.9 MBoe (1,259.2 Boe /d), compared to 2011 production of 154.3 MBoe (422.7 Boe/d). Total proved reserves for the Niobrara were 2.0 MMBoe at December 31, 2012 , approximately 85%, or 1.7 MMBoe , of which was crude oil and liquids.
OIL Joint Venture. In October 2012, we completed the sale of 30% of our interests in certain oil and gas properties in the Niobrara Formation to OIL India (USA) Inc. and IOCL (USA) Inc., wholly owned subsidiaries of OIL India Ltd. and Indian Oil Corporation Ltd., respectively, for $41.25 million in cash and a commitment to pay a development carry of 50% of our future development costs up to $41.25 million net to our interest as described below. For convenience, in this annual report on Form 10-K the term "OIL JV Partners" is used to refer collectively to OIL India (USA) Inc. and IOCL (USA) Inc. The OIL JV Partners' development carry period lasts until March 2014, unless earlier utilized, and any remaining portion of the OIL JV Partners' development ca
5
rry is to be paid to us at the end of the development carry period. The Niobrara Formation assets conveyed to the OIL JV Partners under the terms of the agreement are located primarily in Weld and Adams counties, Colorado.
In connection with this sale transaction, we and the OIL JV Partners entered into agreements to form a new joint venture with respect to the interests purchased by the OIL JV Partners. Under the terms of the agreement, we serve as operator of the properties covered by the joint venture. We also granted an option in favor of the OIL JV Partners to purchase a 30% share of acreage acquired by us after the effective date of the transaction in specified areas of the play. This option is exercisable at our cost plus a specified premium and is subject to specified exceptions.
Haimo Joint Venture. In December 2012, we completed the sale of an additional portion of our remaining interests in the same oil and gas properties sold to the OIL JV Partners in the transaction described above to Haimo Oil & Gas LLC ("Haimo"), a wholly owned subsidiary of Lanzhou Haimo Technologies Co. Ltd., for $27.5 million in cash. Following the closing of the Haimo transaction, the joint venture ownership interests in our Niobrara Formation development activities were 60% Carrizo, 30% the OIL JV Partners, and 10% Haimo. As of December 31, 2012 , the collective Niobrara Formation joint ventures included approximately 58,607 net acres.
In connection with the sale transaction with Haimo, Carrizo (Niobrara) LLC and Haimo entered into agreements to form a new joint venture with respect to the interests purchased by Haimo. Under the terms of the agreement, we serve as operator of the properties covered by the joint venture. We also granted an option in favor of Haimo to purchase a 10% share of acreage acquired by us after the effective date of the transaction in specified areas of the play, which areas are the same as the OIL joint venture described above. This option is exercisable at our cost plus a specified premium, and is subject to specified exceptions.
In 2013 , we currently expect to invest approximately $35.0 million in drilling and completion costs for the Niobrara Formation, net of carry.
Utica Shale
In 2011, we commenced acquiring acreage in the Utica Shale located in eastern Ohio and northwestern Pennsylvania. Our activities in the Utica Shale are currently conducted through a joint venture described below.
Avista Utica Joint Venture. Effective September 2011, our wholly owned subsidiary, Carrizo (Utica) LLC, entered into a joint venture with ACP II Marcellus LLC ("ACP II"), which is also one of our joint venture partners in the Marcellus Shale, and ACP III Utica LLC ("ACP III"), both affiliates of Avista Capital Holdings, LP, a private equity firm (collectively with ACP II and ACP III, "Avista"). As of December 31, 2012 , our Avista Utica joint venture held approximately 27,883 net acres, in Ohio and Pennsylvania (including 13,177 net acres located in Guernsey County, Ohio.)
Under the terms of this joint venture, we and Avista have the right to contribute cash and properties to acquire and develop acreage in the Utica Shale play. The joint venture agreements established an area of mutual interest between us and Avista and provided us options on specified categories of properties to increase our participating interest in such properties to equal Avista's. Under the joint venture agreements, we serve as operator of the Utica joint venture properties and have agreed to provide certain management services to Avista related to the Utica joint venture. Avista or its designee has the right to become a co-operator of the joint venture properties if (i) Avista sells substantially all of its interests in the Utica joint venture properties or (ii) we default under the terms of any pledge of our interest in the Utica joint venture properties.
In October 2012, we sold substantially all of our interests in oil and gas properties dedicated to the Avista Utica joint venture in the northern portion of the Utica Shale play to a third party and received net cash proceeds of $51.7 million . Simultaneously with the closing of this Utica Shale transaction, Avista sold substantially all of its interests in the same oil and gas properties. The proceeds from such sale were recognized as a reduction of proved oil and gas properties, net. In connection with these sale transactions, we elected to exercise our option to increase our participating interest in the same oil and gas properties on a "net proceeds basis" so that we received net proceeds with respect to 50% of the properties subject to the sale rather than the 10% we initially held. Pursuant to the terms of the Avista Utica joint venture agreement, as amended, we paid $24.0 million for the 40% additional interest in the acreage subject to the sale and certain other Avista Utica joint venture properties. Concurrently with the exercise and closing of our option to increase our participating interest in such oil and gas properties, our right to receive distributions associated with properties owned by ACP II in the Avista Utica joint venture through our "B Units" interest in ACP II described below under "Natural Gas Plays-Avista Marcellus Joint Venture," was terminated.
Following the sale transactions described above, on October 24, 2012, we and Avista amended the Utica Shale joint venture agreements to provide that the expiration date of our remaining option to increase our participating interest in the Avista Utica joint venture properties was accelerated from March 2013 to January 15, 2013. We exercised this option on January 15, 2013 by paying $63.1 million for an additional 40% interest in approximately 11,000 acres pursuant to the terms of the Avista Utica jo
6
int venture agreement. We and Avista also agreed that after the option was exercised, our participating interest in subsequently acquired properties within the area of mutual interest continued to be 10% and Avista's participating interest is 90%, and we were granted an additional option to increase our 10% ownership in such subsequently acquired properties to 50% at 8.625% above acreage cost and associated improvements (compounded monthly following Avista's contribution of purchase proceeds). This additional option will expire May 31, 2013. In connection with the January 2013 exercise of our option to increase our participating interest in the Avista Utica joint venture properties, our right to receive distributions associated with properties owned by ACP III through our "B Units" interest in ACP III that we acquired at the formation of the Utica joint venture was terminated.
The area of mutual interest for the Utica joint venture, consisting of the portions of the State of Ohio that are prospective for Utica Shale exploration, will remain in place until the earliest to occur of the following events, at which time the area of mutual interest will only continue to apply to those areas where the joint venture is active: (i) September 1, 2014, (ii) ACP III's investment reaches $170.0 million and Avista declines to participate in specified Utica acquisitions or other specified conditions are met, (iii) upon ACP II's or ACP III's request to be designated (or have its designee designated) as a co-operator of the properties, (iv) upon our required designation of ACP II or ACP III (or either's designee) as a co-operator of the applicable properties in connection with a default by us under the terms of any pledge of our interest in the Utica joint venture properties, (v) the sale by Avista of substantially all of its interest in the Utica joint venture properties or (vi) termination of the ACP III management services agreement.
Each party's ability to transfer its interest in the Utica joint venture to third parties is generally subject to "tag along" rights. Avista's tag along rights do not apply upon a change of control of the Company.
Steven A. Webster, Chairman of our Board of Directors, serves as Co-Managing Partner and President of Avista Capital Holdings, LP, which entity has the ability to control Avista and its affiliates. ACP II's and ACP III's Boards of Managers have the sole authority for determining whether, when and to what extent any cash distributions will be declared and paid to members of ACP II or ACP III, respectively. Mr. Webster is not a member of either entity's Board of Managers. As previously disclosed, we have been a party to prior arrangements with affiliates of Avista Capital Holdings LP, including in respect of our existing joint venture with Avista in the Marcellus Shale. The terms of the joint ventures with Avista in the Utica Shale and the Marcellus Shale were approved by a special committee of the Company's disinterested directors. See also "Natural Gas Plays-Avista Marcellus Joint Venture" and "Note 11. Related Party Transactions" of the Notes to our Consolidated Financial Statements.
U.K. North Sea
We used a low cost entry business model in the U.K. North Sea that allowed us to acquire prospective acreage without making any initial capital commitments. This strategy led directly to the acquisition of our interest in the Huntington Field discovery located primarily on block 22/14b, where our wholly owned subsidiary Carrizo UK Huntington Ltd ("Carrizo UK") owned a 15% non-operated working interest and certain overriding royalty interests. On December 27, 2012, we agreed to sell Carrizo UK, and all of its interest in the Huntington Field discovery, to a subsidiary of Iona Energy Inc. ("Iona Energy") for net proceeds of approximately $116.5 million, subject to final post-closing adjustments, which represents an agreed upon price of $184.0 million, including the assumption of $55.0 million in debt and net purchase price adjustments. Purchase price adjustments primarily relate to working capital and other adjustments, transaction costs and accrual of other obligations related to the transaction. The sale closed on February 22, 2013 . We classified our U.K. North Sea assets and liabilities as held for sale in the consolidated balance sheets along with the related results of operations and cash flows as discontinued operations, net of income taxes, in the consolidated statements of income and cash flows.
The Carrizo UK senior secured multicurrency credit facility agreement that was secured by substantially all of Carrizo UK's assets with limited recourse to us (the "Huntington Facility") was repaid by Iona Energy in connection with the sale transaction described above. As of December 31, 2012 and February 22, 2013, borrowings outstanding under the Huntington Facility were $52.0 million and $55.0 million , respectively. The Huntington Facility provided financing for a substantial portion of Carrizo UK's 15% share of the development costs associated with the Huntington Field development project through a term loan facility, a cost overrun facility and a letter of credit facility. For further information concerning the sale of the U.K. North Sea assets see "Note 3. Assets Held for Sale" and "-Discontinued Operations" of the Notes to our Consolidated Financial Statements.
As of February 25, 2013 , we held interests in four other licenses in the U.K. North Sea. We currently have satisfied or believe that we can satisfy all remaining committed work obligations on these four licenses at no material additional cost to us.
Natural Gas Plays
At December 31, 2012 , our natural gas proved reserves were 428.3 Bcf, approximately 71% of which was located in the Barnett Shale, a 41% decrease from 727.7 Bcf at December 31, 2011 . Our natural gas production decreased to 37.6 Bcf ( 102.8 MMcf/d) in 2012 , a 4% decrease from the 39.0 Bcf ( 106.8 MMcf/d) in 2011 . The decrease in natural gas proved reserves and
7
natural gas production was primarily related to the sale of a substantial portion of our Barnett Shale properties in the second quarter of 2012. See "Barnett Shale" below for additional information.
Marcellus Shale
We began active participation in the Marcellus Shale in 2007. We believe that we have leveraged the knowledge and experience that we gained in the Barnett Shale to effectively explore for and develop natural gas in the Marcellus Shale. Our activities in the Marcellus Shale are currently conducted through two joint ventures described below.
As of December 31, 2012 , we owned interests in 223,899 gross ( 80,505 net) acres in the Marcellus Shale, principally in Pennsylvania, New York and West Virginia. During 2012 , we drilled 39 gross ( 12.5 net) wells, of which we operated 38 gross ( 12.5 net) wells, and completed and brought on production 32 gross (9.0 net) wells. We commenced producing from our first operated Marcellus well in late October 2011 when the Laser pipeline was completed and brought on line. Our 2012 production in the Marcellus Shale was 7.9 Bcfe. As of December 31, 2012 , we had a backlog of 28 gross ( 8.2 net) wells in Northeastern Pennsylvania that were drilled and waiting on completion and 5 gross ( 2.0 net) wells that were drilled and waiting on pipeline connection. Total proved reserves for the Marcellus Shale were 74.8 Bcfe at December 31, 2012 , all of which was natural gas.
In 2013 , we plan to spend approximately $ 70.0 million in the Marcellus Shale, all of which we expect to use for drilling, completion, and other infrastructure in northeastern Pennsylvania, principally in Susquehanna and Wyoming counties. As a result of the material decline in natural gas prices, we and our joint venture partners are carefully reviewing our development program and have reduced our planned spending in the Marcellus shale during 2013. We will continue to monitor prices and, consistent with our existing contractual commitments, may decrease our activity level and capital expenditures further, or may increase such activity, if natural gas prices so warrant. We are currently operating one rig capable of drilling horizontal wells in the Marcellus Shale.
Avista Marcellus Joint Venture. Effective as of August 2008, our wholly owned subsidiary, Carrizo (Marcellus) LLC, entered into a joint venture with ACP II, an affiliate of Avista with which we also have a joint venture in the Utica Shale. See also "Crude Oil and Liquids Plays-Avista Utica Joint Venture" and "Note 11. Related Party Transactions" of the Notes to our Consolidated Financial Statements.
We serve as operator of the properties covered by this joint venture and also perform specified management services for ACP II. An operating committee composed of one representative of each party provides overall supervision and direction of joint operations. Avista or its designee has the right to become a co-operator of the Avista Marcellus joint venture properties if all of its membership interests or substantially all of its assets are sold to an unaffiliated third party or if we default under the terms of any pledge of our interest in the Avista Marcellus joint venture properties. The joint venture agreements provide for an area of mutual interest applicable to specified halos in which the joint venture is active.
8
Subject to specified exceptions (including the Reliance transactions described below), net cash flow from hydrocarbon production from the Avista Marcellus joint venture properties and related sales proceeds, if such properties are sold, will be allocated (a) 75% to Avista and 25% to us until Avista has recovered the remainder of its investment, (b) thereafter, 100% to us until we recover an equal amount and (c) thereafter in accordance with the parties' participating interests, which are currently 50/50. We have also agreed to jointly market Avista's share of the production from the Marcellus joint venture properties with our own until the cash flows and sale proceeds are allocated in accordance with the parties' participating interests under this joint operating agreement.
In connection with the formation of ACP II, we were issued "B Units" in ACP II. Concurrently with the exercise and closing of our option to increase our participating interest in certain oil and gas properties in the Utica Shale in October 2012, our right to receive distributions associated with properties owned by ACP II in the Avista Utica joint venture through our "B Units" interest in ACP II was terminated. See "Crude Oil and Liquids Plays-Avista Utica Joint Venture" above for more information.
Each party's ability to transfer its interest in the Marcellus joint venture properties to third parties is subject in most instances to preferential purchase rights for transfers of less than 10% of its interest in such joint venture properties or to "tag along" rights for most other transfers.
As part of the closing of the transactions with Reliance, we and Avista amended our then-existing joint venture agreements to provide that the properties that we and Avista sold to Reliance, as well as the properties we committed to the joint venture with Reliance, are not subject to the terms of our Avista Marcellus joint venture, and that the area of mutual interest of our Avista Marcellus joint venture will generally not include Pennsylvania, in which those properties are located. Our Avista Marcellus joint venture will otherwise continue and, as of December 31, 2012, included approximately 71,774 net acres, primarily in West Virginia and New York.
Reliance Joint Venture. In September 2010, we completed the sale of 20% of our interests in substantially all of our oil and gas properties in Pennsylvania that had been subject to the Avista Marcellus joint venture to Reliance Marcellus II, LLC ("Reliance"), a wholly owned subsidiary of Reliance Holding USA, Inc. and an affiliate of Reliance Industries Limited, for $13.1 million in cash and a commitment by Reliance to pay 75% of certain of our future drilling and completion costs up to approximately $52.0 million. As of December 31, 2012, the development carry had been fully utilized. Simultaneously with the closing of our transaction with Reliance, ACP II closed the sale of its entire interest in the same properties to Reliance for a purchase price of approximately $327.0 million .
In connection with these sale transactions, we and Reliance also entered into agreements to form a new joint venture with respect to the interests purchased by Reliance from us and Avista. The Carrizo/Reliance joint venture agreement included approximately 103,232 net acres in northern and central Pennsylvania as of December 31, 2012.
We have agreed to various restrictions on our ability to transfer our properties covered by the Reliance joint venture. Additionally, since the expiration of the Reliance development carry, we are subject to a mutual right of first offer on direct and indirect property transfers for the remainder of a ten-year development period (through September 2020), subject to specified exceptions. We have also granted an option in favor of Reliance to purchase a 60% (as adjusted over time) share of acreage purchased directly or indirectly by us after the closing. This option, which covers substantially all of Pennsylvania, is exercisable at our cost plus, in the case of direct property sales, a specified premium, and is subject to specified exceptions. We serve as operator of the properties covered by the Reliance joint venture, with Reliance having the right to assume operatorship of 60% of undeveloped acreage in portions of central Pennsylvania and until September 2014 to purchase all of our 40% interest in such acreage at a specified price. Operations under the Reliance joint venture will generally be required to conform to a budget approved by an operating committee that includes representatives of both parties, subject to exceptions, including those for sole risk operations and in the event of defaults by the parties. The parties have also generally agreed to certain restrictions regarding sole risk operations and other operations.
Barnett Shale
We have been operating in the Barnett Shale since 2003. As of December 31, 2012 , we held interests in approximately 11,788 gross ( 9,615 net) acres, 85 gross ( 54.9 net) producing wells and 1 gross ( 1.0 net) wells that were drilled but waiting on completion. Of these wells, we operated 72 gross ( 50.3 net) producing wells and 1 gross ( 1.0 net) wells drilled and waiting on completion. During 2012 , we drilled 6 gross ( 1.7 net) wells, of which we operated 1 gross ( 1.0 net) wells, and completed and brought on production 10 gross (4.1 net) wells. Approximately 90% of our 11,788 gross acres in the Barnett Shale is either in currently designated producing units or in units on which wells have been drilled and are waiting on completion. Our 2012 production in the Barnett Shale was 25.4 Bcfe, a 29% decrease from 2011 production of 35.7 Bcfe, primarily related to the sale of a substantial portion of our Barnett Shale properties in the second quarter of 2012. Total proved reserves for the Barnett Shale were 303.5 Bcfe at December 31, 2012 all of which was natural gas.
9
As of December 31, 2012 , we were not operating any drilling rigs in the Barnett Shale. We completed the hydraulic fracturing of one well in first quarter 2013 and currently expect only minimal expenditures in the Barnett Shale in 2013 due to non-operated drilling and completion costs.
In April 2012, we sold a substantial portion of our Barnett Shale properties to an affiliate of Atlas Resource Partners, L.P. ("Atlas"). Net proceeds received from the sale were approximately $187.4 million , which represents an agreed upon purchase price of approximately $190.0 million less net purchase price adjustments.
Business Strategy
Measured Growth Through the Drillbit
Our objective is to increase value through the execution of a business strategy focused on organic growth through the drillbit. Key elements of our business strategy include:
• | Grow Primarily Through Drilling. We pursue a technology-driven exploration drilling program. We generate exploration prospects through geological and geophysical analysis of 3-D seismic and other data. Our ability to successfully define and drill exploratory prospects is demonstrated by our 99% apparent drilling success rate in the Barnett Shale, Eagle Ford Shale, Marcellus Shale and Niobrara Formation areas since our entrance into such plays. We have shown consistent success in rapidly growing oil and gas reserves and production in our oil and gas focused resource plays. Additionally, we believe our success and ability to execute our growth strategy is demonstrated by our ability to attract joint venture partners in our existing acreage in the Eagle Ford, Marcellus and Utica Shales and the Niobrara Formation. |
• | Pursue Growth in Crude Oil and Liquids-Rich Plays. Since April 2010, we have pursued a growth strategy in crude oil and liquids-rich plays driven by the attractive economics associated with those commodities. By focusing on and implementing this strategy, our crude oil revenue as a percentage of total revenues has increased significantly from 10% for the year ended December 31, 2010 to 78% for the year ended December 31, 2012. Additionally, over 67% of our 2013 U.S. drilling and completion capital expenditure plan is directed towards opportunities that we believe are predominantly prospective for crude oil and liquids development. |
• | Control Operating and Capital Costs. We emphasize efficiencies to lower our costs to find, develop and produce our oil and gas reserves. This includes concentrating on our core areas, which allows us to optimize drilling and completion techniques as well as benefit from economies of scale. In addition, as we operate a significant percentage of our properties, the majority of our capital expenditure plan is discretionary allowing us the ability to reduce or reallocate our spending in response to changes in market conditions. For example, our discretionary capital spending has been strategically redeployed to pursue growth in crude oil and liquids-rich plays. |
• | Maintain Our Financial Flexibility. We are committed to preserving our financial flexibility. We have historically funded our capital program with a combination of cash generated from operations, proceeds from the sale of assets, proceeds from sales of securities, proceeds, payments or carried interest from our joint ventures and borrowings under our senior secured revolving credit facility. |
• | Utilize Our Experience as a Technical Advantage. We believe we have developed a technical advantage from our extensive experience drilling over 450 horizontal wells in the Barnett, Eagle Ford and Marcellus Shales and the Niobrara Formation, which has allowed our management, technical staff and field operations teams to gain significant experience in resource plays. We are now leveraging this advantage in our existing and other shale trends, including the Utica Shale. We plan to focus substantially all of our capital expenditures in these core areas, where we have acquired, or are acquiring significant acreage positions and a large prospect inventory. |
• | Maintain a Conservative Exploration and Development Portfolio. We continue to focus our exploration effort and capital program on resource plays where individual wells tend to have lower risk, such as our operations in the Eagle Ford Shale and the Niobrara Formation. |
• | Manage Risk Exposure. We seek to limit our financial risks, in part by seeking well-funded partners to ensure that we are able to move forward on projects in a timely manner. Our joint ventures with Reliance in most of Pennsylvania, with GAIL in the Eagle Ford Shale and with the OIL JV Partners and Haimo in the Niobrara Formation are prominent examples of this strategy. We also attempt to limit our exposure to reductions in commodity prices by actively hedging production of both crude oil and natural gas. Our current long-term strategy is to manage exposure for a substantial, but varying, portion of forecasted production up to 60 months. |
Our Competitive Strengths
We believe we have the following competitive strengths that will support our efforts to successfully execute our business strategy:
10
• | Large inventory of oil-focused drilling locations. We have developed a significant inventory of future drilling locations, primarily in our well-established position in LaSalle and McMullen counties in the Eagle Ford Shale and Weld and Adams counties in the Niobrara Formation. As of December 31, 2012 , we owned leases covering approximately 208,545 gross acres in our focus areas of the Eagle Ford Shale and the Niobrara Formation. At December 31, 2012 , we also had a substantial inventory of already drilled wells that were waiting on completion, including 19 gross ( 15.8 net) wells in the Eagle Ford Shale and 2 gross ( 0.6 net) wells in the Niobrara Formation. Approximately 54% of our estimated U.S. proved reserves at December 31, 2012 were undeveloped. In 2012, our crude oil revenue as a percentage of total revenues was 78% . |
• | Successful drilling history. We follow a disciplined approach to drilling wells by applying proven horizontal drilling and hydraulic-fracturing technology. Additionally, we rely on advanced technologies such as 3-D seismic and microseismic analysis to better define geologic risk and enhance the results of our drilling efforts. |
• | Experienced management and professional workforce. We employ 54 oil and gas professionals, including geophysicists, petrophysicists, geologists, petroleum engineers and production and reservoir engineers and technical support staff, who have an average of over 19 years of experience. We believe our experience and expertise, particularly as they relate to successfully identifying and developing resource plays, is a competitive advantage. |
• | Operational control. As of December 31, 2012 , we operated approximately 81% of the wells in which we held an interest. Of those wells we operate, we hold an average interest of approximately 73% . Our significant operational control provides us with the flexibility to align capital expenditures with cash flow and control our costs as we are generally able to adjust drilling plans in response to changes in commodity prices. |
Exploration Approach
Our exploration strategy in our shale resource plays has been to accumulate significant leasehold positions in areas with known shale thickness and thermal maturity in the proximity of known or emerging pipeline infrastructures. A component of our exploitation strategy is to first identify and acquire surface tracts or "well pads" from which multiple wells can be drilled. We then seek to acquire contiguous lease blocks in the areas immediately adjacent to these well pads that can be developed quickly. We next acquire 3-D seismic data over these leases to assist in well placement and development optimization. Even in the relatively lower-risk, reserve-proven trends, such as the Eagle Ford Shale, Niobrara Formation, Marcellus Shale and Barnett Shale, 3-D seismic data interpretation is instrumental in our development program, significantly reducing geologic risk and allowing optimal well paths and spacing. Finally, we form drilling units and utilize sophisticated horizontal drilling, multi-stage simultaneous hydraulic fracturing programs and micro-seismic techniques designed to maximize the production rate and recoverable reserves from a unit area. Primarily due to the continuing depressed levels of natural gas prices, we sometimes seek to reduce costs by deferring drilling or drilling more wells on units where we hold a lower working interest than our historic average. In addition, we seek to enter into joint ventures with well-funded partners that will pay a disproportionate share of the drilling and completion costs of wells that we drill. For example, in 2012, we sold 30% of our interests in certain of our Niobrara Formation properties to the OIL JV Partners, with the OIL JV Partners agreeing to pay 50% of certain of our drilling and completion costs up to approximately $41.25 million, which we currently expect to fully utilize or receive by the end of the first quarter of 2014. In 2011, we sold 20% of our interests in certain of our Eagle Ford Shale properties to GAIL who agreed to pay 50% of certain of our drilling and completion costs up to approximately $31.3 million, which was fully utilized in 2012. In 2010, we sold 20% of our interests in our Pennsylvania properties to Reliance who agreed to pay 75% of certain of our drilling and completion costs up to approximately $52.0 million, which was fully utilized by the end of the fourth quarter of 2012. In certain instances we also seek to maximize the acreage that we can hold by drilling and producing by temporarily drilling fewer wells on each drilling unit in order to permit us to develop more drilling units with comparatively fewer rigs. Where possible, we also seek to maximize our liquidity, while increasing profitability of our projects through timing the completion and pipeline connection costs of our horizontal wells to coincide with periods of lower services costs.
We strive to achieve a balance between acquiring acreage, seismic data (2-D and 3-D) and timely project evaluation through the drillbit to ensure that we minimize the costs to test for commercial reserves while building a significant acreage position. Our first exploration wells in these trends are frequently vertical wells, or a limited number of horizontal wells, because they allow us to evaluate thermal maturity and rock property data, while also permitting us to test various completion techniques without incurring the cost of drilling a substantial number of horizontal wells. As discussed above, we have also shifted our focus toward crude oil and liquids-rich plays to take advantage of the attractive economics associated with those commodities.
We maintain a flexible and diversified approach to project identification by focusing on the estimated financial results of a project area rather than limiting our focus to any one method or source for obtaining leads for new project areas. Additionally, we monitor competitor activity and review outside prospect generation by small, independent "prospect generators." We complement our exploratory drilling portfolio through the use of these outside sources of project generation and typically retain operator rights.
11
Specific drill-sites are typically chosen by our own geoscientists or, in highly populated or environmentally sensitive areas, are dictated by available leases.
Operating Approach
Our management team has extensive experience in the development and management of exploration and development projects in the Barnett Shale, onshore Gulf Coast and, more recently, the Marcellus Shale, Eagle Ford Shale and Niobrara Formation. We believe that the experience we have gained in the Barnett, Eagle Ford and Marcellus Shales, along with our extensive experience in hydraulic fracturing and horizontal drilling technologies and the experience of our management in the development, processing and analysis of 3-D projects and data will play a significant part in our future success.
We generally seek to obtain lease operator status and control over field operations, and in particular seek to control decisions regarding 3-D survey design parameters and drilling and completion methods. As of December 31, 2012 , we operated 300 gross ( 218.4 net) producing oil and gas wells. We generally seek to control operations for most new exploration and development taking advantage of our technical staff experience in horizontal drilling and hydraulic fracturing. During 2012 , we operated all 59 of the gross wells drilled in the Eagle Ford Shale, 38 of the 39 gross wells drilled in the Marcellus Shale, 23 of the 26 gross wells drilled in the Niobrara, and 1 of the 6 gross wells drilled in the Barnett Shale.
Working Interest and Drilling in Project Areas
The actual working interest we will ultimately own in a well will vary based upon several factors, including the depth, cost and risk of each well relative to our strategic goals, activity levels and capital availability. From time to time some fraction of these wells may be sold to industry partners either on a prospect by prospect basis or a program basis. In addition, we may also contribute acreage to larger drilling units thereby reducing prospect working interest. We have, in the past, retained less than 100% working interest in our drilling prospects. References to our interests are not intended to imply that we have or will maintain any particular level of working interest.
Additional Oil and Gas Disclosures
Proved Oil and Gas Reserves
The following table sets forth our estimated net proved oil and gas reserves and the PV-10 value of such reserves as of December 31, 2012 . Over 99% of the reserve data and the present value as of December 31, 2012 were prepared by LaRoche Petroleum Consultants, Ltd. and Ryder Scott Company Petroleum Engineers. For further information concerning these independent third party engineers' estimates of our proved reserves at December 31, 2012 , see the reserve reports included as exhibits to this Annual Report on Form 10-K. The PV-10 value was prepared using an unweighted arithmetic average of the first day of the month oil and gas prices for each month in the prior twelve-month period ended December 31, 2012 , discounted at 10% per annum on a pre-tax basis, and is not intended to represent the current market value of the estimated oil and gas reserves owned by us. For further information concerning the present value of future net revenues from these proved reserves, see "Note 2. Summary of Significant Accounting Policies" and "Note 15. Supplemental Disclosures About Oil and Gas Producing Activities (Unaudited)" of the Notes to our Consolidated Financial Statements.
12
Summary of Proved Oil and Gas Reserves as of December 31, 2012
Based on Average 2012 Prices
(Dollars in thousands)
|
| Oil, Condensate and Natural Gas Liquids (MBoe) |
| Natural Gas (MMcf) |
| Total (MBoe) (1) |
| PV-10 Value (2) (3) | |||||
U.S. |
|
|
|
|
|
|
|
| |||||
Developed |
| 14,295 | |
| 229,539 | |
| 52,552 | |
| $ | 739,480 | |
Undeveloped |
| 30,163 | |
| 194,134 | |
| 62,519 | |
| 672,813 | | |
Total Proved |
| 44,458 | |
| 423,673 | |
| 115,071 | |
| 1,412,293 | | |
U.K. North Sea (discontinued operations) |
| |
| |
| |
| | |||||
Developed |
| 5,241 | |
| 4,664 | |
| 6,018 | |
| 441,597 | | |
Undeveloped |
| - | |
| - | |
| - | |
| - | | |
Total Proved |
| 5,241 | |
| 4,664 | |
| 6,018 | |
| 441,597 | | |
Worldwide |
| |
| |
| |
| | |||||
Developed |
| 19,536 | |
| 234,203 | |
| 58,570 | |
| 1,181,077 | | |
Undeveloped |
| 30,163 | |
| 194,134 | |
| 62,519 | |
| 672,813 | | |
Total Proved |
| 49,699 | |
| 428,337 | |
| 121,089 | |
| $ | 1,853,890 | |
|
(1) | Barrel of oil equivalents are determined using the ratio of 6 Mcf of natural gas to 1 Bbl of crude oil or 1 Boe of natural gas liquids which represents their approximate energy content. Despite holding this ratio constant at six Mcf to one Bbl, current prices are substantially higher for oil than natural gas on an energy equivalent basis, although there have been periods in which they have been lower or substantially lower. |
(2) | The PV-10 value as of December 31, 2012 is pre-tax and was determined by using the average of oil and gas prices at the beginning of each month in the twelve-month period prior to December 31, 2012 , which averaged $101.35 per Bbl of oil, $32.12 per Bbl of natural gas liquids and $1.95 per Mcf of natural gas in the United States and $111.21 per Bbl of oil and $13.32 per Mcf of natural gas for the U.K. North Sea. Management believes that the presentation of PV-10 value is considered a non-U.S. GAAP financial measure as defined in Item 10(e) of Regulation S-K. Therefore, we have included a reconciliation of the measure to the most directly comparable U.S. GAAP financial measure (standardized measure of discounted future net cash flows in footnote (3) below). Management believes that the presentation of PV-10 value provides useful information to investors because it is widely used by analysts and investors in evaluating oil and gas companies. Because many factors that are unique to each individual company may impact the amount of future income taxes to be paid, the use of the pre-tax measure provides greater comparability when evaluating companies. It is relevant and useful to investors for evaluating the relative monetary significance of our oil and gas properties. Further, investors may utilize the measure as a basis for comparison of the relative size and value of our reserves to other oil and gas companies. Management also uses this pre-tax measure when assessing the potential return on investment related to its oil and gas properties and in evaluating acquisitions. The PV-10 value is not a measure of financial or operating performance under U.S. GAAP, nor is it intended to represent the current market value of the estimated oil and gas reserves owned by us. PV-10 value should not be considered in isolation or as a substitute for the standardized measure of discounted future net cash flows as defined under U.S. GAAP. |
(3) | Future income taxes and present value discounted (10%) future income taxes were $764.3 million and $435.5 million , respectively. Accordingly, the after-tax PV-10 value of Total Proved Reserves (or standardized measure of discounted future net cash flows) is $1,418.4 million . |
Proved Undeveloped Reserves
United States. At December 31, 2012 and 2011 , we had 62.5 MMBoe and 76.7 MMBoe of proved undeveloped reserves, respectively. In 2012 , we (a) added 17.2 MMBoe , which included 24.1 MMBoe , 12.3 MMBoe , and 0.8 MMBoe of proved undeveloped reserves as a result of drilling and additional offset locations in the Marcellus Shale, Eagle Ford Shale and Niobrara Formation, respectively, (b) converted a net of 9.5 MMBoe of reserves from proved undeveloped to proved developed, primarily in the Eagle Ford Shale and Marcellus Shale and (c) sold 22.6 MMBoe of proved undeveloped reserves in the Barnett Shale.
Costs incurred relating to the development of proved undeveloped reserves were approximately $227.0 million in 2012 , as compared to $57.0 million in 2011 . Costs incurred relating to the development of proved undeveloped reserves are currently projected to be approximately $356.3 million in 2013, $313.8 million in 2014, and $196.1 million in 2015. All proved undeveloped reserves drilling locations are scheduled to be drilled within five years.
U.K. North Sea . In 2012 , we converted 2.9 MMBoe of reserves from proved undeveloped to proved developed.
Costs incurred relating to the development of proved undeveloped reserves were approximately $35.2 million in 2012 , as compared to $38.8 in 2011 . As a result of the sale on February 22, 2013 of Carrizo UK, and its interest in the Huntington Field, we no longer own any proved reserves in the U.K. North Sea.
13
Other
Reserve Matters. No estimates of proved reserves comparable to those included herein have been included in reports to any federal agency other than the Securities and Exchange Commission ("SEC"). The reserves data set forth in this Annual Report on Form 10-K represents only estimates. See "Item 1A. Risk Factors - Our reserve data and estimated discounted future net cash flows are estimates based on assumptions that may be inaccurate and are based on existing economic and operating conditions that may change in the future." Over 99% of our proved reserves are determined by independent third party engineers.
Our future oil and gas production is highly dependent upon our level of success in finding or acquiring additional reserves. See "Item 1A. Risk Factors-We depend on successful exploration, development and acquisitions to maintain reserves and revenue in the future." Also, the failure of an operator of our wells to adequately perform operations, or such operator's breach of the applicable agreements, could adversely impact us. See "Item 1A. Risk Factors-We cannot control the activities on properties we do not operate and are unable to ensure their proper operation and profitability."
In accordance with SEC regulations, LaRoche Petroleum Consultants, Ltd., Ryder Scott Company Petroleum Engineers and our internal reserve engineers each used the price based on the unweighted average of oil and gas prices at the beginning of each month in the twelve-month period ended December 31, 2012 , adjusted for basis and quality differentials. The prices used in calculating the estimated future net revenue attributable to proved reserves do not necessarily reflect market prices for oil and gas production subsequent to December 31, 2012 . There can be no assurance that all of the proved reserves will be produced and sold within the periods indicated, that the assumed prices will actually be realized for such production or that existing contracts will be honored or judicially enforced.
LaRoche Petroleum Consultants, Ltd. determined 50.6 MMBoe , or 42% of our proved reserves (all of which were located in the Barnett Shale), for the year ended December 31, 2012 . Ryder Scott Company Petroleum Engineers determined 69.5 MMBoe , or 57% of our proved reserves, for the year ended December 31, 2012 .
Qualifications of Third Party Engineers
As discussed above, we engaged LaRoche Petroleum Consultants, Ltd. and Ryder Scott Company Petroleum Engineers, independent third party reserve engineers, to perform independent estimates of over 99% of our proved reserves. The technical person responsible for review of our reserve estimates at each of these firms meets the requirements regarding qualifications, independence, objectivity and confidentiality set forth in the Standards Pertaining to Estimating and Auditing of Oil and Gas Reserves Information promulgated by the Society of Petroleum Engineers. None of these firms own an interest in our properties or is employed on a contingent fee basis.
Internal Controls
A significant component of our internal controls in our reserve estimation effort is our practice of using independent third-party reserve engineering firms to determine over 99% of our year-end reserves. The qualifications of each of these firms are discussed above under "Qualifications of Third Party Engineers."
Our internal reserve engineers are three individuals at the Company who are primarily responsible for reviewing the reserves estimates prepared by our third party engineering firms and for the portion of reserves estimates not prepared by third party engineers. Each of these individuals has over 26 years of experience in the petroleum industry and extensive experience in the estimation of reserves and the review of reserve reports prepared by third party engineering firms.
These three individuals along with other Company personnel, review the inputs and assumptions made in the reserve estimates prepared by the third party engineer firms and assess them for reasonableness. The reserve reports are also reviewed by senior management, including the Chief Executive Officer, who is a registered petroleum engineer and holds a B.S. in Mechanical Engineering from the University of Colorado, and the Chief Operating Officer, who holds a B.S. in Petroleum Engineering from Texas A&M University.
Oil and Gas Reserve Replacement
Finding and developing sufficient amounts of oil and gas reserves at economical costs are critical to our long-term success. Given the inherent decline of hydrocarbon reserves resulting from production, it is important for an exploration and production company to demonstrate a long-term trend of more than offsetting produced volumes with new reserves that will provide for future production. Management uses the reserve replacement ratio, as defined below, as an indicator of our ability to replenish annual production volumes and grow our reserves, thereby providing some information on the sources of future production. We believe reserve replacement information is frequently used by analysts, investors and others in the industry to evaluate the performance of companies like ours. The reserve replacement ratio is calculated by dividing the sum of reserve additions from all sources (revisions, extensions, discoveries, other additions, acquisitions and sales of reserves in place) by the actual production for the corresponding period. We do not use unproved reserve quantities in calculating our reserve replacement ratio. It should be noted th
14
at the reserve replacement ratio is a statistical indicator that has limitations. As an annual measure, the ratio is limited because it typically varies widely based on the extent and timing of new discoveries and property acquisitions. Its predictive and comparative value is also limited for the same reasons. In addition, since the ratio does not take into consideration the cost or timing of future production of new reserves, it cannot be used as a measure of value creation. The ratio does not distinguish between changes in reserve quantities that are producing and those that will require additional time and funding to begin producing. Our reserve replacement ratio may be calculated differently from the comparable measure of other oil and gas companies. It is relevant to note the percentage of our reserves that were producing in the United States was 45% in 2012 , 41% in 2011 and 45% in 2010 . Set forth below is our reserve replacement ratio for the years ended December 31, 2012, 2011 and 2010 . We also present the reserve replacement ratio, as adjusted for U.S. property sales, primarily the sale of natural gas reserves to Atlas in 2012 and KKR in 2011. We have no reserves that are producing in the U.K. North Sea.
|
| Year Ended December 31, | |||||||
|
| 2012 |
| 2011 |
| 2010 | |||
U.S. |
|
|
|
|
|
| |||
Reserve replacement |
| (267 | )% |
| 308 | % |
| 650 | % |
Reserve replacement adjusted for property sales |
| 303 | % |
| 628 | % |
| 650 | % |
|
|
|
|
|
|
| |||
Worldwide |
|
|
|
|
|
| |||
Reserve replacement |
| (269 | )% |
| 311 | % |
| 749 | % |
Reserve replacement adjusted for property sales |
| 301 | % |
| 631 | % |
| 749 | % |
Oil and Gas Volumes, Prices and Production Expense
The following table sets forth certain information regarding the production volumes of, average sales prices received for and average production costs associated with our sales of oil and gas for the periods indicated.
|
| Year Ended December 31, | ||||||||||
|
| 2012 |
| 2011 |
| 2010 | ||||||
Production volumes - |
|
|
| |
|
| ||||||
Oil and condensate (MBbls) |
| 2,862 | |
| 802 | |
| 176 | | |||
NGLs (MBoe) |
| 305 | |
| 210 | |
| 277 | | |||
Natural gas (MMcf) |
| 37,612 | |
| 38,991 | |
| 34,092 | | |||
Total Natural gas and NGLs (MMcfe) |
| 39,442 | |
| 40,251 | |
| 35,754 | | |||
Total barrels of oil equivalent (MBoe) |
| 9,436 | |
| 7,511 | |
| 6,135 | | |||
|
|
|
|
|
|
| ||||||
Production volumes per day - |
|
|
|
|
|
| ||||||
Oil and condensate per day (Bbls/d) |
| 7,820 | |
| 2,197 | |
| 482 | | |||
NGLs per day (Boe/d) |
| 833 | |
| 575 | |
| 759 | | |||
Natural gas per day (Mcf/d) |
| 102,765 | |
| 106,825 | |
| 93,403 | | |||
Total Natural gas and NGLs per day (Mcfe/d) |
| 107,765 | |
| 110,277 | |
| 97,956 | | |||
Total barrels of oil equivalent per day (MBoe) |
| 25,781 | |
| 20,578 | |
| 16,808 | | |||
|
|
|
|
|
|
| ||||||
Average realized prices - |
|
|
| |
|
| ||||||
Oil and condensate ($ per Bbl) |
| $ | 99.97 | |
| $ | 94.14 | |
| $ | 78.74 | |
NGLs ($ per Boe) |
| 34.86 | |
| 50.30 | |
| 38.51 | | |||
Natural gas ($ per Mcf) |
| 1.90 | |
| 2.98 | |
| 3.33 | | |||
|
|
|
|
|
|
| ||||||
Average costs ($ per Boe)(1) |
| $ | 3.33 | |
| $ | 2.76 | |
| $ | 3.12 | |
|
(1) | Includes direct lifting costs (labor, repairs and maintenance, materials and supplies), workover costs, transportation costs and the administrative costs of production offices, and insurance and property. |
15
Acquisition, Exploration and Development Capital Expenditures and Finding and Development Costs
Our finding and development costs ($ per Boe) as adjusted for property sales for the years ended December 31, 2012, 2011 and 2010 are reflected in the table below.
|
| Year Ended December 31, | ||||||||||
|
| 2012 |
| 2011 |
| 2010 | ||||||
|
| (In thousands, except per Boe amounts) | ||||||||||
U.S. |
|
|
|
|
|
| ||||||
Unproved property acquisition costs |
| $ | 139,344 | |
| $ | 108,212 | |
| $ | 126,783 | |
Exploration costs |
| 557,523 | |
| 374,366 | |
| 134,487 | | |||
Development costs |
| 25,756 | |
| 19,769 | |
| 62,952 | | |||
Asset retirement obligations |
| 2,401 | |
| 3,369 | |
| 1,031 | | |||
Total costs incurred (1) |
| $ | 725,024 | |
| $ | 505,716 | |
| $ | 325,253 | |
|
|
|
|
|
|
| ||||||
Average all-sources finding cost |
| $ | 23.35 | |
| $ | 9.62 | |
| $ | 9.64 | |
Average finding and development cost (2) |
| 20.78 | |
| 9.37 | |
| 10.72 | | |||
Average drilling finding cost |
| 17.04 | |
| 7.32 | |
| 5.89 | | |||
|
|
|
|
|
|
| ||||||
Worldwide |
|
|
|
|
|
| ||||||
Unproved property acquisition costs |
| $ | 150,479 | |
| $ | 109,216 | |
| $ | 127,589 | |
Exploration costs |
| 557,523 | |
| 374,366 | |
| 134,487 | | |||
Development costs |
| 60,981 | |
| 58,544 | |
| 68,327 | | |||
Asset retirement obligations |
| 3,437 | |
| 6,018 | |
| 1,031 | | |||
Total costs incurred (1) |
| $ | 772,420 | |
| $ | 548,144 | |
| $ | 331,434 | |
|
|
|
|
|
|
| ||||||
Average all-sources finding cost |
| $ | 24.84 | |
| $ | 10.47 | |
| $ | 8.33 | |
Average finding and development cost (2) |
| 22.32 | |
| 10.26 | |
| 9.32 | | |||
Average drilling finding cost |
| 18.45 | |
| 8.17 | |
| 5.12 | | |||
|
(1) | Total costs incurred include capitalized overhead of $11.8 million , $9.6 million and $5.3 million and exclude capitalized interest on unproved properties of $24.8 million , $23.4 million and $20.7 million for the years ended December 31, 2012, 2011 and 2010 , respectively. |
(2) | Comprised of all exploration and development costs incurred in the year plus the leasehold and seismic costs attributable to all proved drilling locations additions in the year. |
For the three-year period ended December 31, 2012 , our total cost for exploration, development and acquisition activities was approximately $1,652.0 million. Total exploration, development and acquisition activities for the three-year period ended December 31, 2012 have added approximately 115.6 MMBoe of net proved reserves, as adjusted for property sales, at an all-sources finding cost of $14.29 per Boe.
Our finding and development cost computation excludes net additions (reductions) to total future development costs with respect to proved undeveloped properties necessary to convert those properties into proved producing properties of $214.0 million, $531.3 million and $379.0 million at December 31, 2012 , 2011 and 2010 , respectively, and includes net additions to proved undeveloped reserves of 22.0 MMBoe , 14.4 MMBoe and 22.1 MMBoe for the years ended December 31, 2012, 2011 and 2010 , respectively. Accordingly, had we included future development costs in our computations, the average all-sources finding costs would have been $16.98, $21.50 and $14.64 per Boe for the years ended December 31, 2012, 2011 and 2010 , respectively. Year on year, U.S. future development costs decreased in 2012 by approximately $181.3 million net, largely comprised of (1) a $19.4 million increase in the Eagle Ford Shale comprised of (a) a $288.4 million increase for the development costs attributable to additions of 17.3 MMBoe ($16.67/Boe) of proved undeveloped reserves and (b) a net $268.9 million decrease due to development costs incurred in 2012 and revisions of previous estimates and (2) a $201.3 million net decrease in the Barnett Shale primarily due to a net $190.4 million reduction associated with a decrease of 194.6 Bcfe ($0.98/Mcfe), primarily from wells sold during
16
the year or that are currently not in the drilling plan as we shift our drilling efforts to crude oil and liquids-rich plays. Our finding and development costs exclude the effect of acquisitions or dispositions.
In order to maintain continued growth, our annual goal is to add new reserves exceeding our yearly production at a finding and development cost that contributes to an acceptable profit margin. Accordingly, we use the finding and development cost in combination with our reserve replacement ratio, as previously defined, to measure our operating and financial performance.
Our all-source finding cost measure is a measure with limitations. Consistent with industry practice, our finding and development costs have historically fluctuated on a year-to-year basis based on a number of factors including the extent and timing of new discoveries and property acquisitions. Due to the timing of proved reserve additions and timing of the related costs incurred to find and develop our reserves, our all-sources finding cost measure often includes quantities of reserves for which a majority of the costs of development have not yet been incurred. Conversely, the measure often includes costs to develop proved reserves that had been added in earlier years. Finding and development costs, as measured annually, may not be indicative of our ability to economically replace oil and gas reserves because the recognition of costs may not necessarily coincide with the addition of proved reserves. Our all-sources finding cost may also be calculated differently than the comparable measure of other oil and gas companies.
Drilling Activity
The following table sets forth our drilling activity for the years ended December 31, 2012, 2011 and 2010 by geographical area. In the table, "gross" refers to the total wells in which we have a working interest and "net" refers to gross wells multiplied by our working interest therein.
|
| Year Ended December 31, | ||||||||||||||||
|
| 2012 |
| 2011 |
| 2010 | ||||||||||||
|
| Gross |
| Net |
| Gross |
| Net |
| Gross |
| Net | ||||||
U.S. |
|
|
|
|
|
|
|
|
|
|
|
| ||||||
Exploratory Wells - Productive |
| 69 | |
| 31.8 | |
| 88 | |
| 38.4 | |
| 57 | |
| 28.9 | |
Exploratory Wells - Nonproductive |
| 1 | |
| 0.5 | |
| 1 | |
| 0.5 | |
| 3 | |
| 2.3 | |
Development Wells - Productive |
| 60 | |
| 37.7 | |
| 33 | |
| 15.0 | |
| 28 | |
| 13.4 | |
Development Wells - Nonproductive |
| - | |
| - | |
| - | |
| - | |
| - | |
| - | |
|
|
|
|
|
|
|
|
|
|
|
|
| ||||||
U.K. North Sea (discontinued operations) |
|
|
|
|
|
|
|
|
|
|
|
| ||||||
Exploratory Wells - Productive |
| - | |
| - | |
| - | |
| - | |
| - | |
| - | |
Exploratory Wells - Nonproductive |
| 1 | |
| 0.2 | |
| - | |
| - | |
| - | |
| - | |
Development Wells - Productive |
| 2 | |
| 0.3 | |
| 2 | |
| 0.3 | |
| - | |
| - | |
Development Wells - Nonproductive |
| - | |
| - | |
| - | |
| - | |
| - | |
| - | |
|
|
|
|
|
|
|
|
|
|
|
|
| ||||||
Worldwide |
|
|
|
|
|
|
|
|
|
|
|
| ||||||
Exploratory Wells - Productive |
| 69 | |
| 31.8 | |
| 88 | |
| 38.4 | |
| 57 | |
| 28.9 | |
Exploratory Wells - Nonproductive |
| 2 | |
| 0.7 | |
| 1 | |
| 0.5 | |
| 3 | |
| 2.3 | |
Development Wells - Productive |
| 62 | |
| 38.0 | |
| 35 | |
| 15.3 | |
| 28 | |
| 13.4 | |
Development Wells - Nonproductive |
| - | |
| - | |
| - | |
| - | |
| - | |
| - | |
The wells are in various stages of development or stages of production.
As of December 31, 2012 , we are in the process of drilling 6 gross ( 4.7 net) wells in the United States that are not included in the table above. We have no current plans to drill a well outside of the United States in 2013.
17
Productive Wells
The following table sets forth the number of productive oil and gas wells in which we owned an interest as of December 31, 2012 .
|
| Company Operated |
| Non-Operated |
| Total | ||||||||||||
|
| Gross |
| Net |
| Gross |
| Net |
| Gross |
| Net | ||||||
Oil |
| 186 | |
| 151.3 | |
| 7 | |
| 1.2 | |
| 194 | |
| 161.3 | |
Natural gas |
| 114 | |
| 67.1 | |
| 65 | |
| 8.3 | |
| 179 | |
| 75.4 | |
Total |
| 300 | |
| 218.4 | |
| 72 | |
| 9.5 | |
| 372 | |
| 227.9 | |
As of December 31, 2012 , we did not have any producing wells in the U.K. North Sea. For further information concerning the sale of the U.K. North Sea assets see "Note 3. Assets Held for Sale" and "-Discontinued Operations" of the Notes to our Consolidated Financial Statements.
Acreage Data
The following table sets forth certain information regarding our developed and undeveloped lease acreage as of December 31, 2012 . Developed acreage refers to acreage on which wells have been drilled or completed to a point that would permit production of oil and gas in commercial quantities. Undeveloped acreage refers to acreage on which wells have not been drilled or completed to a point that would permit production of oil and gas in commercial quantities whether or not the acreage contains proved reserves.
|
| Developed Acreage |
| Undeveloped Acreage |
| Total | ||||||||||||
|
| Gross |
| Net |
| Gross |
| Net |
| Gross |
| Net | ||||||
U.S. |
|
|
|
|
|
|
|
|
|
|
|
| ||||||
Eagle Ford Shale - Texas |
| 28,763 | |
| 21,281 | |
| 66,836 | |
| 27,722 | |
| 95,599 | |
| 49,003 | |
Niobrara Formation - Colorado |
| 16,774 | |
| 6,975 | |
| 96,172 | |
| 29,238 | |
| 112,946 | |
| 36,213 | |
Barnett Shale - Texas |
| 10,641 | |
| 8,839 | |
| 1,147 | |
| 776 | |
| 11,788 | |
| 9,615 | |
Marcellus Shale |
|
|
|
|
|
|
|
|
|
|
|
| ||||||
New York |
| 2,117 | |
| 158 | |
| 29,407 | |
| 6,392 | |
| 31,524 | |
| 6,550 | |
Pennsylvania |
| 4,694 | |
| 1,589 | |
| 121,365 | |
| 42,906 | |
| 126,059 | |
| 44,495 | |
West Virginia |
| 893 | |
| 435 | |
| 61,875 | |
| 27,250 | |
| 62,768 | |
| 27,685 | |
Virginia |
| 53 | |
| 27 | |
| 3,495 | |
| 1,748 | |
| 3,548 | |
| 1,775 | |
Marcellus Shale Total |
| 7,757 | |
| 2,209 | |
| 216,142 | |
| 78,296 | |
| 223,899 | |
| 80,505 | |
Other (1) |
| 8,362 | |
| 6,805 | |
| 197,732 | |
| 122,653 | |
| 206,094 | |
| 129,458 | |
Total U.S. |
| 72,297 | |
| 46,109 | |
| 578,029 | |
| 258,685 | |
| 650,326 | |
| 304,794 | |
U.K. North Sea (discontinued operations) |
| 1,767 | |
| 265 | |
| 121,179 | |
| 55,769 | |
| 122,946 | |
| 56,034 | |
Worldwide |
| 74,064 | |
| 46,374 | |
| 699,208 | |
| 314,454 | |
| 773,272 | |
| 360,828 | |
|
(1) | "Other" includes other non-resource plays in Texas and Louisiana; Utica Shale in Ohio and Pennsylvania; Fayetteville Shale in Arkansas; the New Albany Shale in Kentucky and Illinois; the Floyd/Neal Shale in Mississippi; the Barnett/Woodford in West Texas and New Mexico; and the Bakken in North Dakota. |
Our lease agreements generally terminate if producing wells have not been drilled on the acreage within their primary term or an extension thereof (a period that can be from three to 10 years depending on the area). If no production is established on our leases that are in their primary term, approximately 30% of our acreage will expire in 2013, 6% will expire in 2014 and 32% will expire in 2015.
Marketing
Our production is marketed to third parties consistent with industry practices. Typically, our oil and gas is sold at the wellhead to unaffiliated third parties. Oil is sold at field-posted prices plus or minus a bonus and natural gas is sold under contract at a negotiated price which is based on published prices for specified locations or pipelines, such as WAHA, Houston Ship Channel, Dominion Transmission and Tx. Eastern, Zone M-3, and then discounted by the purchaser back to the wellhead based upon a
18
number of factors normally considered in the industry, such as distance from the well to the central sales point, well pressure, quality of natural gas and prevailing supply and demand conditions. We have made the strategic decision to sell as much of our natural gas production at the wellhead as possible, so that we can concentrate our efforts and resources on exploration and production which we believe are more consistent with our competitive expertise, rather than in natural gas pipeline operation, natural gas marketing and sales. In each case we sell at competitive market prices based on a differential to several sales points. We do not believe the loss of any one of our purchasers would materially affect our ability to sell the oil and gas we produce. We believe other purchasers are available in all our areas of operations.
Our marketing objective is to receive competitive wellhead prices for our product. We are aided by the presence of multiple outlets near our production in the Eagle Ford and Barnett Shale areas and, beginning in late fourth quarter 2012, a second outlet for our production in the Marcellus Shale.
There are a variety of factors that affect the market for oil and gas generally, including:
• | demand for oil and gas; |
• | the extent of production of oil and gas and, in particular, domestic production and imports; |
• | the proximity and capacity of natural gas pipelines and other transportation facilities; |
• | the marketing of competitive fuels; and |
• | the effects of state and federal regulations on oil and gas production and sales. |
See "Item 1A. Risk Factors-Oil and gas prices are highly volatile, and lower oil and gas prices will negatively affect our financial position, planned capital expenditures and results of operations," "-We are subject to various environmental risks and governmental regulations, including those relating to benzene emissions, hydraulic fracturing and global climate changes, and future regulations may be more stringent resulting in increase operating costs and decreased demand for oil and gas that we produce," and "-If our access to markets is restricted, it could negatively impact our production, our income and ultimately our ability to retain our leases. Our ability to sell oil and natural gas and receive market prices for our oil and natural gas may be adversely affected by pipeline and gathering system capacity constraints."
In addition to selling our oil and gas at the wellhead, we work with various pipeline companies to procure and to assure capacity for our natural gas. We also conduct an active hedging program at a corporate level in order to ensure stable cash flow to fund our exploration and production activities. All of these hedging transactions provide for financial rather than physical settlement. For a discussion of these matters, our hedging policy and recent hedging positions, see "Item 7. Management's Discussion and Analysis of Financial Condition and Results of Operations -Summary of Critical Accounting Policies -Derivative Instruments," "Item 7A. Qualitative and Quantitative Disclosures About Market Risk-Commodity Risk," and "Item 1A. Risk Factors - We may continue to enter into derivative transactions to manage the price risks associated with our production, which may expose us to risk of financial loss and limit the benefit to us of increases in prices for oil and gas" and "-If our access to markets is restricted, it could negatively impact our production, our income and ultimately our ability to retain our leases. Our ability to sell oil and natural gas and receive market prices for our oil and natural gas may be adversely affected by pipeline and gathering system capacity constraints."
Competition and Technological Changes
We encounter competition from other oil and gas companies in all areas of our operations, including the acquisition of exploratory prospects and proven properties. Many of our competitors are large, well-established companies that have been engaged in the oil and gas business for much longer than we have and possess substantially larger operating staffs and greater capital resources than we do. We may not be able to conduct our operations, evaluate and select suitable properties and consummate transactions successfully in this highly competitive environment.
The oil and gas industry is characterized by rapid and significant technological advancements and introductions of new products and services using new technologies. If one or more of the technologies we use now or in the future were to become obsolete or if we are unable to use the most advanced commercially available technology, our business, financial condition and results of operations could be materially adversely affected.
Regulation
Oil and gas operations are subject to various federal, state, local and international environmental regulations that may change from time to time, including regulations governing oil and gas production and transportation, federal and state regulations governing environmental quality and pollution control and state limits on allowable rates of production by well or proration unit. These regulations may affect the amount of oil and gas available for sale, the availability of adequate pipeline and other regulated transportation and processing facilities and the marketing of competitive fuels. For example, a productive natural gas well may
19
be "shut-in" because of an oversupply of natural gas or lack of an available natural gas pipeline in the areas in which we may conduct operations. State and federal regulations generally are intended to prevent waste of oil and gas, protect rights to produce oil and gas between owners in a common reservoir, control the amount of oil and gas produced by assigning allowable rates of production, provide nondiscriminatory access to common carrier pipelines and control contamination of the environment. Pipelines are subject to the jurisdiction of various federal, state and local agencies. We are also subject to changing and extensive tax laws, the effects of which cannot be predicted.
The following discussion summarizes the regulation of the United States oil and gas industry. We believe we are in substantial compliance with the various statutes, rules, regulations and governmental orders to which our operations may be subject, although we cannot assure you that this is or will remain the case. Moreover, those statutes, rules, regulations and government orders may be changed or reinterpreted from time to time in response to economic or political conditions, and any such changes or reinterpretations could materially adversely affect our results of operations and financial condition. The following discussion is not intended to constitute a complete discussion of the various statutes, rules, regulations and governmental orders to which our operations may be subject.
Regulation of Natural Gas and Oil Exploration and Production
Our operations are subject to various types of regulation at the federal, state and local levels that:
• | require permits for the drilling of wells; |
• | mandate that we maintain bonding requirements in order to drill or operate wells; and |
▪ | regulate the location of wells, the method of drilling and casing wells, the surface use and restoration of properties upon which wells are drilled, the plugging and abandoning of wells and the disposal of fluids used in connection with operations. |
Our operations are also subject to various conservation laws and regulations. These regulations govern the size of drilling and spacing units or proration units, the density of wells that may be drilled in oil and gas properties and the unitization or pooling of oil and gas properties. In this regard, some states (including Colorado) allow the forced pooling or integration of tracts to facilitate exploration while other states (including Texas) rely primarily or exclusively on voluntary pooling of lands and leases. In areas where pooling is primarily or exclusively voluntary, it may be more difficult to form units and therefore more difficult to develop a project if the operator owns less than 100% of the leasehold. In addition, state conservation laws establish maximum rates of production from oil and gas wells generally prohibit the venting or flaring of natural gas and impose specified requirements regarding the ratability of production. The effect of these regulations may limit the amount of oil and gas we can produce from our wells and may limit the number of wells or the locations at which we can drill. The regulatory burden on the oil and gas industry increases our costs of doing business and, consequently, affects our profitability. Because these laws and regulations are frequently expanded, amended and reinterpreted, we are unable to predict the future cost or impact of complying with such regulations.
Regulation of Sales and Transportation of Natural Gas
Federal legislation and regulatory controls have historically affected the price of natural gas we produce and the manner in which our production is transported and marketed. Under the Natural Gas Act of 1938 ("NGA"), the Federal Energy Regulatory Commission ("FERC") regulates the interstate transportation and the sale in interstate commerce for resale of natural gas. Effective January 1, 1993, the Natural Gas Wellhead Decontrol Act (the "Decontrol Act") deregulated natural gas prices for all "first sales" of natural gas, including all of our sales of our own production. As a result, all of our domestically produced natural gas is sold at market prices, subject to the terms of any private contracts that may be in effect. The FERC's jurisdiction over interstate natural gas transportation, however, was not affected by the Decontrol Act.
Under the NGA, facilities used in the production or gathering of natural gas are exempt from the FERC's jurisdiction. We own certain natural gas pipelines that we believe satisfy the FERC's criteria for establishing that these are all gathering facilities not subject to FERC jurisdiction under the NGA. State regulation of gathering facilities generally includes various safety, environmental, and in some circumstances, nondiscriminatory take requirements but does not generally entail rate regulation. Some of the delay in bringing our natural gas to market has been the lack of available pipeline systems in the Barnett Shale, particularly those that would take natural gas production from the lease to existing infrastructure. In order to partly alleviate this issue, commencing in 2009, certain of our wholly owned subsidiaries have constructed non-jurisdictional gathering facilities in cases where we have determined that we can construct those facilities more quickly or more efficiently than waiting on an unrelated third-party pipeline company.
One of our pipeline subsidiaries, Hondo Pipeline Inc., exercises the power of eminent domain and transports gas for third parties and is a regulated public utility within the meaning of Section 101.003 ("GURA") and Section 121.001 (the "Cox Act") of the Texas Utilities Code. Both GURA and the Cox Act prohibit unreasonable discrimination in the transportation of natural gas and authorize the Texas Railroad Commission to regulate gas transportation rates. However, GURA provides for negotiated rates
20
with transportation, industrial or similar large-volume contract customers so long as neither party has an unfair negotiating advantage, the negotiated rate is substantially the same as that negotiated with at least two other customers under similar conditions, or sufficient competition existed when the rate was negotiated.
Although we do not own or operate any pipelines or facilities that are directly regulated by the FERC, its regulations of third-party pipelines and facilities could indirectly affect our ability to market our production. Beginning in the 1980s the FERC initiated a series of major restructuring orders that required pipelines, among other things, to perform open access transportation, "unbundle" their sales and transportation functions, and allow shippers to release their pipeline capacity to other shippers. As a result of these changes, sellers and buyers of natural gas have gained direct access to the particular pipeline services they need and are better able to conduct business with a larger number of counterparties. We believe these changes generally have improved our access to markets while, at the same time, substantially increasing competition in the natural gas marketplace. It remains to be seen, however, what effect the FERC's other activities will have on access to markets, the fostering of competition and the cost of doing business. We cannot predict what new or different regulations the FERC and other regulatory agencies may adopt, or what effect subsequent regulations may have on our activities.
In the past, Congress has been very active in the area of natural gas regulation. However, the more recent trend has been in favor of deregulation or "lighter handed" regulation and the promotion of competition in the gas industry. In light of this increased reliance on competition, the Energy Policy Act of 2005 amended the NGA to prohibit any forms of market manipulation in connection with the transportation, purchase or sale of natural gas. In addition to the regulations implementing these prohibitions, the FERC has established new regulations that are intended to increase natural gas pricing transparency through, among other things, expanded dissemination of information about the availability and prices of gas sold and new regulations that require both interstate pipelines and certain non-interstate pipelines to post daily information regarding their design capacity and daily scheduled flow volumes at certain points on their systems. The Energy Policy Act of 2005 also significantly increased the penalties for violations of the NGA and the FERC's regulations to up to $1.0 million per day for each violation.
Oil Price Controls and Transportation Rates
Our sales of crude oil, condensate and natural gas liquids are not currently regulated and are made at market prices. The price we receive from the sale of these products may be affected by the cost of transporting the products to market. Much of that transportation is through interstate common carrier pipelines. Effective as of January 1, 1995, the FERC implemented regulations generally grandfathering all previously approved interstate transportation rates and establishing an indexing system for those rates by which adjustments are made annually based on the rate of inflation, subject to specified conditions and limitations. These regulations may tend to increase the cost of transporting crude oil and natural gas liquids by interstate pipeline, although the annual adjustments may result in decreased rates in a given year. Every five years, the FERC must examine the relationship between the annual change in the applicable index and the actual cost changes experienced in the oil pipeline industry. In December 2010, to implement the third of the required five-yearly re-determinations, the FERC established an upward adjustment in the index to track oil pipeline cost changes. The FERC determined that the Producer Price Index for Finished Goods plus 2.65 percent (PPI plus 2.65 percent) should be the oil pricing index for the five-year period beginning July 1, 2011. We are not able at this time to predict the effects of this indexing system or any new FERC regulations on the transportation costs associated with oil production from our oil producing operations.
There regularly are legislative proposals pending in the federal and state legislatures which, if enacted, would significantly affect the petroleum industry. At the present time, it is impossible to predict what proposals, if any, might actually be enacted by Congress or the various state legislatures and what effect, if any, such proposals might have on us. Similarly, we cannot predict whether or to what extent the trend toward federal deregulation of the petroleum industry will continue, or what the ultimate effect on our sales of oil, gas and other petroleum products will be.
Environmental Regulations
Our operations are subject to numerous international, federal, state and local laws and regulations governing the discharge of materials into the environment or otherwise relating to environmental protection. These laws and regulations may require the acquisition of a permit before drilling commences, restrict the types, quantities and concentration of various substances that can be released into the environment in connection with drilling and production activities, limit or prohibit drilling activities on specified lands within wilderness, wetlands and other protected areas, require remedial measures to mitigate pollution from former operations, such as pit closure and plugging abandoned wells, and impose substantial liabilities for pollution resulting from production and drilling operations. The failure to comply with these laws and regulations may result in the assessment of administrative, civil and criminal penalties, imposition of investigatory or remedial obligations or the issuance of injunctions prohibiting or limiting the extent of our operations. Public interest in the protection of the environment has increased dramatically in recent years. The trend of applying more expansive and stricter environmental legislation and regulations to the oil and gas industry could continue, resulting in increased costs of doing business and consequently affecting our profitability. To the extent laws are enacted or other
21
governmental action is taken that restricts drilling or imposes more stringent and costly waste handling, disposal and cleanup requirements, our business and prospects could be adversely affected.
We generate waste that may be subject to the federal Resource Conservation and Recovery Act ("RCRA") and comparable state statutes. The U.S. Environmental Protection Agency ("EPA"), and various state agencies have limited the approved methods of disposal for certain hazardous and nonhazardous waste. Furthermore, certain waste generated by our oil and gas operations that are currently exempt from treatment as "hazardous waste" may in the future be designated as "hazardous waste" and therefore become subject to more rigorous and costly operating and disposal requirements.
We currently own or lease numerous properties that for many years have been used for the exploration and production of oil and gas. Although we believe that we have generally implemented appropriate operating and waste disposal practices, prior owners and operators of these properties may not have used similar practices, and hydrocarbons or other waste may have been disposed of or released on or under the properties we own or lease or on or under locations where such waste has been taken for disposal. In addition, many of these properties have been operated by third parties whose treatment and disposal or release of hydrocarbons or other waste was not under our control. These properties and the waste disposed thereon may be subject to the Comprehensive Environmental Response, Compensation and Liability Act ("CERCLA"), RCRA and analogous state laws as well as state laws governing the management of oil and gas waste. Under these laws, we could be required to remove or remediate previously disposed waste (including waste disposed of or released by prior owners or operators) or property contamination (including groundwater contamination) or to perform remedial plugging operations to prevent future contamination.
CERCLA, also known as the "Superfund" law, and analogous state laws impose liability, without regard to fault or the legality of the original conduct, on specified classes of persons that are considered to have contributed to the release of a "hazardous substance" into the environment. These classes of persons include the owner or operator of the disposal site or sites where the release occurred and companies that disposed or arranged for the disposal of the hazardous substances found at the site. Persons who are or were responsible for releases of hazardous substances under CERCLA may be subject to joint and several liability for the costs of cleaning up the hazardous substances that have been released into the environment, for damages to natural resources and for the costs of certain health studies, and it is not uncommon for neighboring landowners and other third parties to file claims for personal injury and property damage allegedly caused by the hazardous substances released into the environment.
Our operations may be subject to the Clean Air Act and comparable state and local requirements. In 1990 Congress adopted amendments to the Clean Air Act containing provisions that have resulted in the gradual imposition of certain pollution control requirements with respect to air emissions from our operations. The EPA and states have developed and continue to develop regulations to implement these requirements. We may be required to incur certain capital expenditures in the next several years for air pollution control equipment in connection with maintaining or obtaining operating permits and approvals addressing other air emission-related issues. Moreover, changes in environmental laws and regulations occur frequently, and stricter laws, regulations or enforcement policies could significantly increase our compliance costs. Further, stricter requirements could negatively impact our production and operations. For example, the Texas Commission on Environmental Quality has finalized revisions to certain air permit programs that significantly increase the air permitting requirements for new and certain existing oil and gas production and gathering sites for 23 counties in the Barnett Shale production area. These initiatives could lead to more stringent air permitting, increased regulation and possible enforcement actions at the local, state, and federal levels. Additionally, the EPA has finalized rules that establish new air emission control requirements for natural gas and natural gas liquids production, processing and transportation activities, including New Source Performance Standards to address emissions of sulfur dioxide and volatile organic compounds, and National Emission Standards for Hazardous Air Pollutants to address hazardous air pollutants frequently associated with gas production and processing activities.
Federal regulations require certain owners or operators of facilities that store or otherwise handle oil, such as us, to prepare and implement spill prevention, control, countermeasure and response plans relating to the possible discharge of oil into surface waters. The Oil Pollution Act of 1990 ("OPA") contains numerous requirements relating to the prevention of and response to oil spills into waters of the United States. The OPA subjects owners of facilities to strict joint and several liability for all containment and cleanup costs and certain other damages arising from a spill, including, but not limited to, the costs of responding to a release of oil to surface waters. The OPA also requires owners and operators of offshore facilities that could be the source of an oil spill into federal or state waters, including wetlands, to post a bond, letter of credit or other form of financial assurance in amounts ranging from $10.0 million in specified state waters to $35.0 million in federal outer continental shelf waters to cover costs that could be incurred by governmental authorities in responding to an oil spill. These financial assurances may be increased by as much as $150.0 million if a formal risk assessment indicates that the increase is warranted. Noncompliance with OPA may result in varying civil and criminal penalties and liabilities. Our operations are also subject to the federal Clean Water Act ("CWA") and analogous state laws. In accordance with the CWA, the State of Louisiana issued regulations prohibiting discharges of produced water in state coastal waters effective July 1, 1997. Pursuant to other requirements of the CWA, the EPA has adopted regulations concerning discharges of storm water runoff. This program requires covered facilities to obtain individual permits or seek coverage under an EPA general permit. Like OPA, the CWA and analogous state laws relating to the control of water pollution provide
22
varying civil and criminal penalties and liabilities for releases of petroleum or its derivatives into surface waters or into the ground. Similarly, the U.S. Congress has considered legislation to subject hydraulic fracturing operations to federal regulation and to require the disclosure of chemicals used by us and others in the oil and gas industry in the hydraulic fracturing process. Please read "Item 1A. Risk Factors - We are subject to various environmental risks and governmental regulations, including those relating to benzene emissions and hydraulic fracturing, and new regulations may be more stringent."
We also are subject to a variety of federal, state, local and foreign permitting and registration requirements relating to protection of the environment. We believe we are in substantial compliance with current applicable environmental laws and regulations and that continued compliance with existing requirements will not have a material adverse effect on our financial position or results of operations.
Our offshore operations in the U.K. North Sea and onshore operations in the U.S. are subject to similar regulations covering permit requirements and the discharge of oil and other contaminants in connection with drilling operations.
Global Climate Change
There is increasing attention in the United States and worldwide being paid to the issue of climate change and the contributing effect of greenhouse gas ("GHG") emissions. On December 15, 2009, the EPA published a Final Rule, also known as the EPA's Endangerment Finding, finding that current and projected concentrations of six key GHGs in the atmosphere threaten the environment and public health and the welfare of current and future generations. Based on these findings, the EPA adopted two sets of regulations that restrict emissions of GHGs under existing provisions of the federal Clean Air Act, including one that requires a reduction in emissions of GHGs from motor vehicles and another that regulates GHG emissions from certain large stationary sources under the Clean Air Act Prevention of Significant Deterioration ("PSD") and Title V permitting programs. The stationary source rule "tailors" the PSD and Title V programs to apply to certain stationary sources of GHG emissions, to be phased in through a multistep process, with the largest sources being the first subject to permitting. Facilities required to obtain PSD permits for their GHG emissions also will be required to meet "best available control technology" standards, which will be established by the states or, in some instances, by the EPA on a case-by-case basis. The EPA also expanded its existing GHG emissions reporting rule to apply to the oil and gas source category, including oil and natural gas production facilities and natural gas processing, transmission, distribution and storage facilities. In addition, the U.S. Congress has considered a number of legislative proposals to restrict GHG emissions and more than 20 states, either individually or as part of regional initiatives, have begun taking actions to control or reduce GHG emissions. Moreover, in 2005, the Kyoto Protocol to the 1992 United Nations Framework Convention on Climate Change, which establishes a binding set of emission targets for GHGs, became binding on all those countries that had ratified it. Ongoing international discussions following the United Nations Climate Change Conference in Doha, Qatar in December 2012 are exploring options to replace the Kyoto Protocol. While it is not possible at this time to predict how regulation that may be enacted to address GHG emissions would impact our business, the modification of existing laws or regulations or the adoption of new laws or regulations curtailing oil and gas exploration in the areas of the United States or the North Sea in which we operate could materially and adversely affect our operations by limiting drilling opportunities or imposing materially increased costs. In addition, existing or new laws, regulations or treaties (including incentives to conserve energy or use alternative energy sources) could have a negative impact on our business if such incentives reduce demand for oil and gas.
In addition to the effects of future regulation, the meteorological effects of global climate change could pose additional risks to our onshore and offshore operations in the form of more frequent and/or more intense storms and flooding, which could in turn adversely affect our cost of doing business.
Title to Properties; Acquisition Risks
We believe we currently have satisfactory title to all of our producing properties in the specific areas in which we operate, except where failure to do so would not have a material adverse effect on our business and operations in such area, taken as a whole. For additional information, please see "Item 1A. Risk Factors-We may incur losses as a result of title deficiencies."
Customers
For the year ended December 31, 2012, Flint Hills Resources, LP and Enterprise Products Operating, L.L.C. accounted for approximately 53% and 10% , respectively, of our oil and gas revenues. For the years ended December 31, 2011 and 2010, DTE Energy Trading, Inc. accounted for approximately 43% and 63% , respectively of our oil and gas revenues. We do not believe the loss of any one of our purchasers would materially affect our ability to sell the oil and gas we produce. We believe other purchasers are available in our areas of operations. See "Additional Oil and Gas Disclosures-Marketing."
Employees
At December 31, 2012 , we had 208 full-time employees. We believe that our relationships with our employees are good.
23
In order to optimize prospect generation and development, we utilize the services of independent consultants and contractors to perform various professional services, particularly in the areas of 3-D seismic data mapping, acquisition of leases and lease options, construction, design, well site surveillance, permitting and environmental assessment. Independent contractors generally provide field and on-site production operation services, such as pumping, maintenance, dispatching, inspection and testing. We believe that this use of third-party service providers has enhanced our ability to manage general and administrative expenses.
Available Information
Our website address is www.crzo.net. We make our website content available for informational purposes only. It should not be relied upon for investment purposes, nor is it incorporated by reference in this Form 10-K. We make available on our website, through a direct link to the SEC's website at www.sec.gov, free of charge, our annual report on Form 10-K, quarterly reports on Form 10-Q, current reports on Form 8-K and amendments to those reports as soon as reasonably practicable after we electronically file such materials with, or furnish them to, the SEC. You may read and copy any materials we file with the SEC at the SEC's Public Reference Room at 100 F Street NE, Washington, D.C. 20549. You may obtain information regarding the Public Reference Room by calling the SEC at 1-800-SEC-0330.
You may also find information related to our corporate governance, board committees and company code of ethics at our website. Among the information you can find there is the following:
• | Audit Committee Charter; |
• | Compensation Committee Charter; |
• | Nominating and Corporate Governance Committee Charter; |
• | Code of Ethics and Business Conduct; and |
• | Compliance Employee Report Line. |
We intend to satisfy the requirement under Item 5.05 of Form 8-K to disclose any amendments to our Code of Ethics and Business Conduct and any waiver from a provision of our Code of Ethics by posting such information on our website at www.crzo.net under "About Carrizo-Governance."
Glossary of Certain Industry Terms
The definitions set forth below shall apply to the indicated terms as used herein. All volumes of natural gas referred to herein are stated at the legal pressure base of the state or area where the reserves exist and at 60 degrees Fahrenheit and in most instances are rounded to the nearest multiple or power of ten.
Bbl. One stock tank barrel, or 42 U.S. gallons liquid volume, used herein in reference to oil or other liquid hydrocarbons.
Bbls/d. Stock tank barrels per day.
Bcf. Billion cubic feet.
Bcfe. Billion cubic feet equivalent, determined using the ratio of six Mcf of natural gas to one Bbl of oil, condensate or natural gas liquids.
Boe . One barrel of oil equivalent. A Boe is determined using the ratio of six Mcf of natural gas to one Bbl of oil, condensate or natural gas liquids, which approximates the relative energy content of oil, condensate and natural gas liquids as compared to natural gas. Despite holding this ratio constant at six Mcf to one Bbl, prices have historically often been higher or substantially higher for oil than natural gas on an energy equivalent basis, although there have been periods in which they have been lower or substantially lower.
Boe/d. Barrels of oil equivalent per day.
Btu or British Thermal Unit. The quantity of heat required to raise the temperature of one pound of water by one degree Fahrenheit.
Carried interest. An agreement under which one party (carrying party) agrees to pay for a specified portion or for all of the drilling and completion and operating costs of another party (carried party) on a property for a specified time in which both own a portion of the working interest. The carrying party may be able to recover a specified amount of costs from the carried party's share of the revenue from the production of reserves from the property.
24
Completion. The process of treating a drilled well followed by the installation of permanent equipment for the production of oil or gas, or in the case of a dry well, the reporting to the appropriate authority that the well has been abandoned.
Condensate. Condensate is a mixture of hydrocarbons that exists in the gaseous phase at original reservoir temperature and pressure, but that, when produced, is in the liquid phase at surface pressure and temperature.
Developed acreage. The number of acres assignable to productive wells.
Developed oil and gas reserves. Developed oil and gas reserves are reserves of any category that can be expected to be recovered (i) through existing wells with existing equipment and operating methods or in which the cost of the required equipment is relatively minor compared to the cost of a new well; and (ii) through installed extraction equipment and infrastructure operational at the time of the reserves estimate if the extraction is by means not involving a well.
Development Costs. Costs incurred to obtain access to proved reserves and to provide facilities for extracting, treating, gathering and storing the oil and gas. Development costs, including depreciation and applicable operating costs of support equipment and facilities and other costs of development activities, are costs incurred to (i) gain access to and prepare well locations for drilling, including surveying well locations for the purpose of determining specific development drilling sites, clearing ground, draining, road building and relocating public roads, gas lines and power lines, to the extent necessary in developing the proved reserves, (ii) drill and equip development wells, development-type stratigraphic test wells and service wells, including the costs of platforms and of well equipment such as casing, tubing, pumping equipment, and the wellhead assembly, (iii) acquire, construct and install, production facilities such as lease flow lines, separators, treaters, heaters, manifolds, measuring devices and production storage tanks, natural gas cycling and processing plants, and central utility and waste disposal systems, and (iv) provide improved recovery systems.
Development well. A well drilled within the proved area of an oil or natural gas reservoir to the depth of a stratigraphic horizon known to be productive.
Dry well. An exploratory, development or extension well that proves to be incapable of producing either oil or gas in sufficient quantities to justify completion as an oil or gas well.
Economically producible. The term economically producible, as it relates to a resource, means a resource which generates revenue that exceeds, or is reasonably expected to exceed, the costs of the operation. The value of the products that generate revenue shall be determined at the terminal point of "oil and gas producing activities" as defined in Rule 4-10(a)(16) of Regulation S-X promulgated under the Securities Exchange Act of 1934, as amended.
Exploratory well . A well drilled to find a new field or to find a new reservoir in a field previously found to be productive of oil or gas in another reservoir.
Field. An area consisting of a single reservoir or multiple reservoirs all grouped on or related to the same individual geological structural feature or stratigraphic condition, or both. The geological terms "structural feature" and "stratigraphic condition" are intended to identify localized geological features as opposed to the broader terms of basins, trends, provinces, plays, areas of interest, etc.
Finding costs. Costs associated with acquiring and developing proved oil and gas reserves which are capitalized by us pursuant to U.S. generally accepted accounting principles, including all costs involved in acquiring acreage, geological and geophysical work and the cost of drilling and completing wells.
Finding and development costs. Expressed in dollars per Boe or Mcfe. Finding and development cost metrics provide information as to the cost of adding proved reserves from various activities. Calculated as capital costs incurred in the acquisition, exploration, development and revisions of proved oil and natural gas reserves divided by proved reserve additions.
Finding and development cost - drilling . Calculated by dividing the amount of costs incurred for exploration and development activities, by the amount of proved reserve additions.
Gross acres or gross wells. The total acres or wells, as the case may be, in which a working interest is owned.
Hydraulic fracturing. Hydraulic fracturing is a well stimulation process using a liquid (usually water with an amount of chemicals mixed in) that is forced into an underground formation under high pressure to open or enlarge fractures in reservoirs with low permeability to stimulate and improve the flow of hydrocarbons from these reservoirs. As the formation is fractured, a proppant (usually sand or ceramics) is pumped into the fractures to "prop" or keep them from closing after they are opened by the liquid. Hydraulic fracturing is an essential technology in shale reservoirs and other unconventional resource plays where nearly all wells are fractured in order to enable commercial hydrocarbon production.
25
MBbls . One thousand barrels of oil or other liquid hydrocarbons.
MBbls/d. One thousand barrels of oil or other liquid hydrocarbons per day.
MBoe . One thousand barrels of oil equivalent.
MBoe/d. One thousand barrels of oil equivalent per day.
Mcf. One thousand cubic feet of natural gas.
Mcf/d. One thousand cubic feet of natural gas per day.
Mcfe. One thousand cubic feet equivalent, determined using the ratio of six Mcf of natural gas to one Bbl of oil, or condensate or one Boe of natural gas liquids, which represents the approximate energy content of oil, condensate and natural gas liquids as compared to natural gas. Despite holding this ratio constant at six Mcf to one Bbl, prices have historically often been higher or substantially higher for oil than natural gas on an energy equivalent basis, although there have been periods in which they have been lower or substantially lower.
Mcfe/d. One thousand cubic feet equivalent per day.
MMBbls. One million barrels of oil or other liquid hydrocarbons.
MMBoe . One million barrels of oil equivalent.
MMBtu. One million British Thermal Units.
MMcf. One million cubic feet.
MMcf/d. One million cubic feet per day.
MMcfe. One million cubic feet equivalent, determined using the ratio of six Mcf of natural gas to one Bbl of oil, condensate or natural gas liquids, which represents the approximate energy content of oil, condensate and natural gas liquids as compared to natural gas. Despite holding this ratio constant at six Mcf to one Bbl, prices have historically often been higher or substantially higher for oil than natural gas on an energy equivalent basis, although there have been periods in which they have been lower or substantially lower.
MMcfe/d. One million cubic feet equivalent per day.
Net acres or net wells. The sum of the fractional working interests owned in gross acres or gross wells.
Production costs. Costs incurred to operate and maintain wells and related equipment and facilities, including depreciation and applicable operating costs of support equipment and facilities and other costs of operating and maintaining those wells and related equipment and facilities.
Productive well. A well that is found to be capable of producing oil or gas in sufficient quantities to justify completion as an oil or gas well.
Proved developed reserves. Reserves that are both proved and developed.
Proved reserves. Has the meaning given to such term in Rule 4-10(a)(22) of Regulation S-X, which defines proved reserves as:
The quantities of oil and gas which, by analysis of geoscience and engineering data, can be estimated with reasonable certainty to be economically producible from a given date forward, from known reservoirs, and under existing economic conditions, operating methods, and government regulations, prior to the time at which contracts providing the right to operate expire, unless evidence indicates that renewal is reasonably certain, regardless of whether deterministic or probabilistic methods are used for estimation. The project to extract the hydrocarbons must have commenced or the operator must be reasonably certain that it will commence the project within a reasonable time.
The area of a reservoir considered proved includes (i) the area identified by drilling and limited by fluid contacts, if any, and (ii) adjacent undrilled portions of the reservoir that can, with reasonable certainty, be judged to be continuous with it and to contain economically producible oil or gas on the basis of available geoscience and engineering data.
26
In the absence of data on fluid contacts, proved quantities in a reservoir are limited by the lowest known hydrocarbons as seen in a well penetration unless geoscience, engineering or performance data and reliable technology establish a lower contact with reasonable certainty.
Where direct observation from well penetrations has defined a highest known oil elevation and the potential exists for an associated gas cap, proved oil reserves may be assigned in the structurally higher portions of the reservoir only if geoscience, engineering or performance data and reliable technology establish the higher contact with reasonable certainty.
Reserves that can be produced economically, based on prices used to estimate reserves, through application of improved recovery techniques (including, but not limited to, fluid injection) are included in the proved classification when (i) successful testing by a pilot project in an area of the reservoir with properties no more favorable than in the reservoir as a whole, the operation of an installed program in the reservoir, or an analogous reservoir, or other evidence using reliable technology establishes the reasonable certainty of the engineering analysis on which the project or program was based and (ii) the project has been approved for development by all necessary parties and entities, including governmental entities.
Existing economic conditions include prices and costs at which economic producibility from a reservoir is to be determined. The price shall be the average price during the 12-month period prior to the ending date of the period covered by the report, determined as an unweighted arithmetic average of the first-day-of-the-month price for each month within such period, unless prices are defined by contractual arrangements, excluding escalations based upon future conditions.
Proved undeveloped reserves. Reserves that are both proved and undeveloped.
PV-10 Value. When used with respect to oil and gas reserves, present value, or PV-10 means the estimated future gross revenue to be generated from the production of proved reserves, net of estimated production and future development costs, using prices calculated as the average oil and gas price during the preceding 12-month period prior to the end of the current reporting period, (determined as the unweighted arithmetic average of prices on the first day of each month within the 12-month period) and costs in effect at the determination date, without giving effect to non-property related expenses such as general and administrative expenses, debt service and future income tax expense or to depreciation, depletion and amortization, discounted using an annual discount rate of 10%.
Reasonable certainty. If deterministic methods are used, reasonable certainty means a high degree of confidence that the quantities will be recovered. If probabilistic methods are used, there should be at least a 90% probability that the quantities actually recovered will equal or exceed the estimate. A high degree of confidence exists if the quantity is much more likely to be achieved than not, and, as changes due to increased availability of geoscience (geological, geophysical, and geochemical), engineering, and economic data are made to estimated ultimate recovery ("EUR") with time, reasonably certain EUR is much more likely to increase or remain constant than to decrease.
Recompletion. The completion for production of an existing well bore in another formation from that in which the well has been previously completed.
Reserves. Reserves are estimated remaining quantities of oil and gas and related substances anticipated to be economically producible, as of a given date, by application of development projects to known accumulations. In addition, there must exist, or there must be a reasonable expectation that there will exist, the legal right to produce or a revenue interest in the production, installed means of delivering oil and gas or related substances to market, and all permits and financing required to implement the project.
Reservoir. A porous and permeable underground formation containing a natural accumulation of producible oil or gas, or both, that is confined by impermeable rock or water barriers and is individual and separate from other reservoirs.
Standardized measure. The present value, discounted at 10%, of future net cash flows from estimated proved reserves after income taxes, calculated holding prices and costs constant at amounts in effect on the date of the report (unless such prices or costs are subject to change pursuant to contractual provisions) and otherwise in accordance with the U.S. Securities Exchange Commission's rules for inclusion of oil and gas reserve information in financial statements filed with the U.S. Securities Exchange Commission.
" Tag along " rights. An agreement may provide that if one or more persons owning a majority (or some other specified portion) of certain interests desires to sell all (or some specified portion) of their interests in one or more related transactions, other owners of the same or similar interests have the "tag along" right to join in the sale.
3-D seismic data. Three-dimensional pictures of the subsurface created by collecting and measuring the intensity and timing of sound waves transmitted into the earth as they reflect back to the surface.
27
Undeveloped acreage. Lease acreage on which wells have not been drilled or completed to a point that would permit the production of economic quantities of oil or gas regardless of whether such acreage contains proved reserves.
Undeveloped oil and gas reserves. Reserves of any category that are expected to be recovered from new wells on undrilled acreage, or from existing wells where a relatively major expenditure is required for recompletion.
(i) Reserves on undrilled acreage are limited to those directly offsetting development spacing areas that are reasonably certain of production when drilled, unless evidence using reliable technology exists that establishes reasonable certainty of economic producibility, based on pricing used to estimate reserves, at greater distances.
(ii) Undrilled locations are classified as having undeveloped reserves only if a development plan has been adopted indicating that they are scheduled to be drilled within five years, unless the specific circumstances justify a longer time.
(iii) Under no circumstances are estimates for undeveloped reserves attributable to any acreage for which an application of fluid injection or other improved recovery technique is contemplated, unless such techniques have been proved effective by actual projects in the same reservoir or an analogous reservoir or by other evidence using reliable technology establishing reasonable certainty.
Working interest. The operating interest that gives the owner the right to drill, produce and conduct operating activities on the property and a share of production.
Workover. Operations on a producing well to restore or increase production.
Item 1A. Risk Factors
Oil and gas prices are highly volatile, and lower oil and gas prices will negatively affect our financial position, planned capital expenditures and results of operations.
Our revenue, profitability, cash flow, future growth and ability to borrow funds or obtain additional capital, as well as the carrying value of our properties, are substantially dependent on prevailing prices of oil and gas. Historically, the markets for oil and gas have been volatile, and those markets are likely to continue to be volatile in the future. In the past, we have reduced or curtailed production to mitigate the impact of low oil and gas prices. Particularly in recent years, decreases in natural gas prices led us to suspend or curtail drilling and other exploration activities for natural gas. The decrease in natural gas prices has had a significant impact on our financial position, planned capital expenditures and results of operations. Further volatility in oil and gas prices or a prolonged period of low oil or gas prices may materially adversely affect our financial position, liquidity (including our borrowing capacity under our revolving credit facility), ability to finance planned capital expenditures and results of operations.
It is impossible to predict future oil and gas price movements with certainty. Prices for oil and gas are subject to wide fluctuation in response to relatively minor changes in the supply of and demand for oil and gas, market uncertainty and a variety of additional factors beyond our control. These factors include:
• | the level of consumer product demand; |
• | the levels and location of oil and gas supply and demand and expectations regarding supply and demand, including the supply of natural gas due to increased natural gas production from resource plays; |
• | overall economic conditions; |
• | weather conditions; |
• | domestic and foreign governmental relations, regulations and taxes; |
• | the price and availability of alternative fuels; |
• | political conditions or hostilities and unrest in oil producing regions; |
• | the level and price of foreign imports of oil and liquefied natural gas; |
• | the ability of the members of the Organization of Petroleum Exporting Countries and other exporting nations to agree upon and maintain production constraints and oil price controls; |
• | technological advances affecting energy consumption; |
• | speculation by investors in oil and gas; and |
• | variations between product prices at sales points and applicable index prices. |
28
Oil and gas drilling is a speculative activity and involves numerous risks and substantial and uncertain costs that could adversely affect us.
Our success will be largely dependent upon the success of our drilling program. Drilling for oil and gas involves numerous risks, including the risk that no commercially productive oil or gas reservoirs will be discovered. The cost of drilling, completing and operating wells is substantial and uncertain, and drilling operations may be curtailed, delayed or canceled as a result of a variety of factors beyond our control, including:
• | unexpected or adverse drilling conditions; |
• | elevated pressure or irregularities in geologic formations; |
• | equipment failures or accidents; |
• | adverse weather conditions; |
• | fluctuations in the price of oil and gas; |
• | surface access restrictions; |
• | loss of title or other title related issues; |
• | compliance with governmental requirements; and |
• | shortages or delays in the availability of drilling rigs, crews and equipment. |
Because we identify the areas desirable for drilling in certain areas from 3-D seismic data covering large areas, we may not seek to acquire an option or lease rights until after the seismic data is analyzed or until the drilling locations are also identified; in those cases, we may not be permitted to lease, drill or produce natural gas or oil from those locations.
Even if drilled, our completed wells may not produce reserves of oil or gas that are economically viable or that meet our earlier estimates of economically recoverable reserves. Our overall drilling success rate or our drilling success rate for activity within a particular project area may decline. Unsuccessful drilling activities could result in a significant decline in our production and revenues and materially harm our operations and financial position by reducing our available cash and resources. The potential for production decline rates for our wells could be greater than we expect. Because of the risks and uncertainties of our business, our future performance in exploration and drilling may not be comparable to our historical performance described herein.
We may not adhere to our proposed drilling schedule.
Our final determination of whether to drill any scheduled or budgeted wells will be dependent on a number of factors, including:
• | the results of our exploration efforts and the acquisition, review and analysis of the seismic data; |
• | the availability of sufficient capital resources to us and the other participants for the drilling of the prospects; |
• | the approval of the prospects by the other participants after additional data has been compiled; |
• | economic and industry conditions at the time of drilling, including prevailing and anticipated prices for oil and gas and the availability and prices of drilling rigs and crews; and |
• | the availability of leases and permits on reasonable terms for the prospects. |
Although we have identified or budgeted for numerous drilling prospects, we may not be able to lease or drill those prospects within our expected time frame or at all. Wells that are currently part of our capital plan may be based on statistical results of drilling activities in other 3-D project areas that we believe are geologically similar rather than on analysis of seismic or other data in the prospect area, in which case actual drilling and results are likely to vary, possibly materially, from those statistical results. In addition, our drilling schedule may vary from our expectations because of future uncertainties. In addition, our ability to produce oil and gas may be significantly affected by the availability and prices of hydraulic fracturing equipment and crews.There can be no assurance that these projects can be successfully developed or that any identified drill sites or budgeted wells will, if drilled, encounter reservoirs of commercially productive oil or gas. We may seek to sell or reduce all or a portion of our interest in a project area or with respect to prospects or budgeted wells within such project area.
Our reserve data and estimated discounted future net cash flows are estimates based on assumptions that may be inaccurate and are based on existing economic and operating conditions that may change in the future.
There are uncertainties inherent in estimating oil and gas reserves and their estimated value, including many factors beyond the control of the producer. The reserve data included herein represents only estimates. Reservoir engineering is a subjective and
29
inexact process of estimating underground accumulations of oil and gas that cannot be measured in an exact manner and is based on assumptions that may vary considerably from actual results. Furthermore, different reserve engineers may make different estimates of reserves and cash flows based on the same data. Reserve estimates may be subject to upward or downward adjustment, and actual production, revenue and expenditures with respect to our reserves likely will vary, possibly materially, from estimates. Additionally, in recent years, there has been increased debate and disagreement over the classification of reserves, with particular focus on proved undeveloped reserves. The interpretation of SEC rules regarding the classification of reserves and their applicability in different situations remain unclear in many respects. Changing interpretations of the classification standards of reserves or disagreements with our interpretations could cause us to write-down reserves.
As of December 31, 2012 , approximately 55% of our United States proved reserves were proved undeveloped and proved nonproducing. Moreover, some of the producing wells included in our reserve reports as of December 31, 2012 had produced for a relatively short period of time as of that date. Because most of our reserve estimates are calculated using volumetric analysis, those estimates are less reliable than estimates based on a lengthy production history. Volumetric analysis involves estimating the volume of a reservoir based on the net feet of pay of the structure and an estimation of the area covered by the structure based on seismic analysis. In addition, realization or recognition of our proved undeveloped reserves will depend on our development schedule and plans. Lack of reasonable certainty with respect to development plans for proved undeveloped reserves could cause the discontinuation of the classification of these reserves as proved.
The discounted future net cash flows included herein are not necessarily the same as the current market value of our estimated oil and gas reserves. As required by the current requirements for oil and gas reserve estimation and disclosures, the estimated discounted future net cash flows from proved reserves are based on the average of the sales price on the first day of each month in the applicable year, with costs determined as of the date of the estimate. Actual future net cash flows also will be affected by factors such as:
• | the actual prices we receive for oil and gas; |
• | our actual operating costs in producing oil and gas; |
• | the amount and timing of actual production; |
• | supply and demand for oil and gas; |
• | increases or decreases in consumption of oil and gas; and |
• | changes in governmental regulations or taxation. |
In addition, the 10% discount factor we use when calculating discounted future net cash flows for reporting requirements in compliance with the Financial Accounting Standards Board Accounting Standards Codification Topic 932, "Extractive Activities-Oil and Gas" may not be the most appropriate discount factor based on interest rates in effect from time to time and risks associated with us or the oil and gas industry in general.
We depend on successful exploration, development and acquisitions to maintain reserves and revenue in the future.
In general, the volume of production from oil and gas properties declines as reserves are depleted, with the rate of decline depending on reservoir characteristics. Except to the extent we conduct successful exploration and development activities or acquire properties containing proved reserves, or both, our proved reserves will decline as reserves are produced. Our future oil and gas production is, therefore, highly dependent on our level of success in finding or acquiring additional reserves. In addition, we are dependent on finding partners for our exploratory activity. To the extent that others in the industry do not have the financial resources or choose not to participate in our exploration activities, we will be adversely affected.
We participate in oil and gas leases with third parties and these third parties may not be able to fulfill their commitments to our projects.
We frequently own less than 100% of the working interest in the oil and gas leases on which we conduct operations, and other parties will own the remaining portion of the working interest. Financial risks are inherent in any operation where the cost of drilling, equipping, completing and operating wells is shared by more than one person. We could be held liable for joint activity obligations of the other working interest owners such as nonpayment of costs and liabilities arising from the actions of the other working interest owners. In addition, the current economic downturn, the credit crisis and the volatility in oil and gas prices may increase the likelihood that some of these working interest owners, particularly those that are smaller and less established, are not able to fulfill their joint activity obligations. Some of these working interest owners have experienced liquidity and cash flow problems. These problems may lead these parties to attempt to delay the pace of drilling or project development in order to preserve cash. A working interest owner may be unable or unwilling to pay its share of project costs. In some cases, a working interest owner may declare bankruptcy. In the event any of these third party working interest owners do not pay their share of such costs,
30
we would likely have to pay those costs, and we may be unsuccessful in any efforts to recover these costs from such parties, which could materially adversely affect our financial position.
We have substantial capital requirements that, if not met, may hinder operations.
We have experienced and expect to continue to experience substantial capital needs as a result of our active exploration, development and acquisition programs. We expect that additional external financing will be required in the future to fund our growth. We may not be able to obtain additional financing, and financing under our existing revolving credit facility or new credit facilities may not be available in the future. Even if additional capital becomes available, it may not be on terms acceptable to us. As in the past, without additional capital resources, we may be forced to limit or defer our planned oil and gas exploration and development drilling program by releasing rigs or deferring fracturing, completion and hookup of the wells to pipelines and thereby adversely affect our production, cash flow, and the recoverability and ultimate value of our oil and gas properties, in turn negatively affecting our business, financial position and results of operations.
Instability in the global financial system may have impacts on our liquidity and financial condition that we currently cannot predict.
Instability in the global financial system may have a material impact on our liquidity and our financial condition. We rely upon access to both our revolving credit facility and longer-term capital markets as sources of liquidity for any capital requirements not satisfied by the cash flow from operations or other sources. Our ability to access the capital markets or borrow money may be restricted or made more expensive at a time when we would like, or need, to raise capital, which could have an adverse impact on our flexibility to react to changing economic and business conditions and on our ability to fund our operations and capital expenditures in the future. The economic situation could have an impact on our lenders or customers, causing them to fail to meet their obligations to us, and on the liquidity of our operating partners, resulting in delays in operations or their failure to make required payments. Also, market conditions could have an impact on our oil and gas derivative instruments if our counterparties are unable to perform their obligations or seek bankruptcy protection. Additionally, challenges in the economy could lead to reductions in the demand for oil and gas, or further reductions in the prices of oil and gas, or both, which could have a negative impact on our financial position, results of operations and cash flows.
The risks associated with our debt and the provisions of our debt agreements could adversely affect our business, financial position and results of operations.
We have demands on our cash resources, including interest expense, operating expenses and funding of our capital expenditures. Our level of long-term debt, the demands on our cash resources and the provisions of the credit agreement governing our revolving credit facility and the indentures governing our 4.375% Convertible Senior Notes due 2028, our 8.625% Senior Notes due 2018, and our 7.50% Senior Notes due 2020 may have adverse consequences on our operations and financial results, including:
• | placing us at a competitive disadvantage compared to our competitors that have lower debt service obligations and significantly greater operating and financial flexibility than we do; |
• | limiting our financial flexibility, including our ability to borrow additional funds, pay dividends, make certain investments and issue equity on favorable terms or at all; |
• | limiting our flexibility in planning for, and reacting to, changes in business conditions; |
• | increasing our interest expense on our variable rate borrowings if interest rates increase; |
• | requiring us to use a substantial portion of our cash flow to make debt service payments, which will reduce the funds that would otherwise be available for operations and future business opportunities; |
• | requiring us to modify our operations, including by curtailing portions of our drilling program, selling assets, reducing our capital expenditures, refinancing all or a portion of our existing debt or obtaining additional financing, which may be on unfavorable terms; and |
• | making us more vulnerable to downturns in our business or the economy. |
In addition, the provisions of our revolving credit facility and our 8.625% Senior Notes and 7.50% Senior Notes place restrictions on us and certain of our subsidiaries with respect to incurring additional indebtedness and liens, making dividends and other payments to shareholders, repurchasing or redeeming our common stock, redeeming our convertible senior notes, 8.625% Senior Notes and 7.50% Senior Notes, making investments, acquisitions, mergers and asset dispositions, entering into hedging transactions and other matters. Our revolving credit facility also requires compliance with covenants to maintain specified financial ratios. Our business plan and our compliance with these covenants are based on a number of assumptions, the most important of which is relatively stable oil and natural gas prices at economically sustainable levels. If the price that we receive for our oil and
31
natural gas production deteriorates significantly from current levels it could lead to lower revenues, cash flow and earnings, which in turn could lead to a default under certain financial covenants contained in our revolving credit facility, including the covenants related to working capital and the ratios described above. Because the calculations of the financial ratios are made as of certain dates, the financial ratios can fluctuate significantly from period to period as the amounts outstanding under our revolving credit facility are dependent on the timing of cash flows related to operations, capital expenditures, sales of oil and gas properties and securities offerings. Additionally, these ratios may have the effect of restricting us from borrowing the full amount available under the borrowing base for our revolving credit facility. In order to provide a margin of comfort with regard to these financial covenants, we may seek to further reduce our capital expenditure plan, sell additional non-strategic assets or opportunistically modify or increase our derivative instruments to the extent permitted under our revolving credit facility. We cannot assure you that we will be able to successfully execute any of these strategies, or if executed, that they will be sufficient to avoid a default under our revolving credit facility if a precipitous decline in oil or natural gas prices were to occur in the future.
The borrowing base under our revolving credit facility may be reduced below the amount of borrowings outstanding under those facilities.
Under the terms of our revolving credit facility, our borrowing base is subject to redeterminations at least semi-annually based in part on prevailing oil and gas prices. A negative adjustment could occur if the estimates of future prices used by the banks in calculating the borrowing base are significantly lower than those used in the last redetermination. The next redetermination of our borrowing base is scheduled to occur in May 2013. In addition, the portion of our borrowing base made available to us is subject to the terms and covenants of the revolving credit facility including, without limitation, compliance with the ratios and other financial covenants of such facility. In the event the amount outstanding under our revolving credit facility exceeds the redetermined borrowing base, we could be forced to repay a portion of our borrowings. We may not have sufficient funds to make any required repayment. If we do not have sufficient funds and are otherwise unable to negotiate renewals of our borrowings or arrange new financing, we may have to sell a portion of our assets.
We have in the past identified material weaknesses in our internal controls over financial reporting, and the identification of any material weaknesses in the future could affect our ability to ensure timely and accurate financial statements.
In the past our management has identified material weaknesses in our internal controls over financial reporting. The Public Company Accounting Oversight Board has defined a material weakness as a control deficiency, or combination of control deficiencies, that results in a reasonable possibility that a material misstatement of the annual or interim statements will not be prevented or detected on a timely basis. Accordingly, a material weakness increases the risk that the financial information we report contains material errors.
Although we have taken actions to remediate the past material weaknesses in our internal controls over financial reporting, these measures may not be sufficient to ensure that our internal controls are effective in the future. In addition, our history of material weaknesses, any future material weaknesses, or any failure to effectively address a material weakness or other control deficiency or implement required new or improved controls, or difficulties encountered in their implementation, could limit our ability to obtain financing, harm our reputation, disrupt our ability to process key components of our results of operations and financial position timely and accurately and cause us to fail to meet our reporting obligations under rules of the SEC, NASDAQ and our various debt arrangements.
We may face difficulties in securing and operating under authorizations and permits to drill or operate our wells.
The recent growth in oil and gas exploration in the United States has drawn intense scrutiny from environmental and community interest groups, regulatory agencies and other governmental entities. As a result, we may face significant opposition to, or increased regulation of, our operations that may make it difficult or impossible to obtain permits and other needed authorizations to operate, result in operational delays, or otherwise make operating more costly or difficult than operating elsewhere.
We have no experience drilling wells in the Utica Shale and less information regarding reserves and decline rates in this shale formation than in some other areas of our operations.
We have no exploration experience and no development experience in the Utica Shale. We have not participated in the drilling of any wells in this area. Other operators in this area have significantly more experience in the drilling of wells, including the drilling of horizontal wells. As a result, we have less information with respect to the ultimate recoverable reserves, the production decline rate and other matters relating to the exploration, drilling and development of the Utica Shale than we have in some other areas in which we operate.
32
If we are unable to acquire adequate supplies of water for our drilling operations or are unable to dispose of the water we use at a reasonable cost and within applicable environmental rules, our ability to produce gas commercially and in commercial quantities could be impaired.
We use a substantial amount of water in our drilling operations. Our inability to locate sufficient amounts of water, or treat and dispose of water after drilling, could adversely impact our operations. Moreover, the imposition of new environmental initiatives and regulations could include restrictions on our ability to conduct certain operations such as hydraulic fracturing or disposal of waste, including, but not limited to, produced water, drilling fluids and other wastes associated with the exploration, development or production of natural gas. Furthermore, future environmental regulations and permit requirements governing the withdrawal, storage and use of surface water or groundwater necessary for hydraulic fracturing of wells could increase operating costs and cause delays, interruptions or termination of operations, the extent of which cannot be predicted, all of which could have an adverse effect on our operations and financial performance.
We may not increase our acreage positions in areas with exposure to oil, condensate and natural gas liquids.
If we are unable to increase our acreage positions in the Eagle Ford Shale, the Niobrara Formation or the Utica Shale, this may detract from our efforts to realize our growth strategy in crude oil and liquids-rich plays. Additionally, we may be unable to find or consummate other opportunities in these areas or in other areas with similar exposure to oil, condensate and natural gas liquids on similar terms or at all.
A substantial portion of our reserves is located in an urban area, which could increase our costs of development and delay production.
One of our current primary core gas producing areas is located in largely urban portions of the Barnett Shale, which could disproportionately expose us to operational and regulatory risk in that area. At December 31, 2012 , approximately 44% of our United States proved reserves and approximately 45% of our then current production were located in the Barnett Shale. The core of the Barnett Shale is located in and around the greater Dallas-Fort Worth, Texas metropolitan area and much of our operations are within the city limits of various municipalities in that region, such as Arlington and Mansfield, Texas. In such urban or other populated areas, we may incur additional expenses, including expenses relating to mitigation of noise, odor and light that may be emitted in our operations, expenses related to the appearance of our facilities and limitations regarding when and how we can operate. The process of obtaining permits for drilling or for gathering lines to move our natural gas to market in such areas may be more time consuming and costly than in more rural areas. In addition, we may experience a higher rate of litigation or increased insurance and other costs related to our operations or facilities in such highly populated areas.
We face strong competition from other oil and gas companies.
We encounter competition from other oil and gas companies in all areas of our operations, including the acquisition of exploratory prospects and proven properties. Our competitors include major integrated oil and gas companies and numerous independent oil and gas companies, individuals and drilling and income programs. Many of our competitors are large, well-established companies that have been engaged in the oil and gas business much longer than we have and possess substantially larger operating staffs and greater capital resources than we do. These companies may be able to pay more for exploratory projects and productive oil and gas properties and may be able to define, evaluate, bid for and purchase a greater number of properties and prospects than our financial or human resources permit. In addition, these companies may be able to expend greater resources on the existing and changing technologies that we believe are and will be increasingly important to attaining success in the industry. Such competitors may also be in a better position to secure oilfield services and equipment on a timely basis or on favorable terms. These companies may also have a greater ability to continue drilling activities during periods of low oil and gas prices and to absorb the burden of current and future governmental regulations and taxation. We may not be able to conduct our operations, evaluate and select suitable properties and consummate transactions successfully in this highly competitive environment.
We may not be able to keep pace with technological developments in our industry.
The oil and gas industry is characterized by rapid and significant technological advancements and introductions of new products and services using new technologies. As others use or develop new technologies, we may be placed at a competitive disadvantage, and competitive pressures may force us to implement those new technologies at substantial cost. In addition, other oil and gas companies may have greater financial, technical and personnel resources that allow them to enjoy technological advantages and may in the future allow them to implement new technologies before we can. We may not be able to respond to these competitive pressures and implement new technologies on a timely basis or at an acceptable cost. If one or more of the technologies we use now or in the future were to become obsolete or if we are unable to use the most advanced commercially available technology, our business, financial condition and results of operations could be materially adversely affected.
Part of our strategy involves drilling existing or emerging shale plays using some of the latest available horizontal drilling and completion techniques. The results of our planned exploratory and delineation drilling in these plays are subject to
33
drilling and completion technique risks, and drilling results may not meet our expectations for reserves or production. As a result, the value of our undeveloped acreage could decline if drilling results are unsuccessful.
Many of our operations involve drilling and completion techniques developed by us or our service providers in order to maximize cumulative recoveries. Risks that we face while drilling include, but are not limited to, landing our well bore in the desired drilling zone, staying in the desired drilling zone while drilling horizontally through the formation, running our casing the entire length of the well bore, and being able to run tools and recover equipment consistently through the horizontal well bore. Risks that we face while completing our wells include, but are not limited to, being able to fracture stimulate the planned number of stages, being able to run tools and other equipment the entire length of the well bore during completion operations, being able to recover such tools and other equipment, and successfully cleaning out the well bore after completion of the final fracture stimulation.
Ultimately, the success of these drilling and completion techniques can only be evaluated over time as more wells are drilled and production profiles are established over a sufficiently long time period. If our drilling results are less than anticipated or we are unable to execute our drilling program because of capital constraints, lease expirations, limited access to gathering systems and takeaway capacity, and/or commodity price decline, or other reasons, then the return on our investment for a particular project may not be as attractive as we anticipated and the value of our undeveloped acreage could decline in the future.
We are subject to various environmental risks and governmental regulations, including those relating to benzene emissions, hydraulic fracturing and global climate change, and future regulations may be more stringent resulting in increased operating costs and decreased demand for the oil and gas that we produce.
Oil and gas operations are subject to various federal, state, local and foreign laws and government regulations that may change from time to time. Matters subject to regulation include discharge permits for drilling operations, plug and abandonment bonds, reports concerning operations, the spacing of wells, unitization and pooling of properties and taxation. From time to time, regulatory agencies have imposed price controls and limitations on production by restricting the rate of flow of oil and gas wells below actual production capacity in order to conserve supplies of oil and gas. Other federal, state, local and foreign laws and regulations relating primarily to the protection of human health and the environment apply to the development, production, handling, storage, transportation and disposal of oil and gas, by-products thereof and other substances and materials produced or used in connection with oil and gas operations, including drilling fluids and wastewater. In addition, we may incur costs arising out of property damage, including environmental damage caused by previous owners or operators of property we purchase or lease or relating to third party sites, or injuries to employees and other persons. As a result, we may incur substantial liabilities to third parties or governmental entities and may be required to incur substantial remediation costs. We also are subject to changing and extensive tax laws, the effects of which cannot be predicted. Compliance with existing, new or modified laws and regulations could result in substantial costs, delay our operations or otherwise have a material adverse effect on our business, financial position and results of operations.
Moreover, changes in environmental laws and regulations occur frequently and such laws and regulations tend to become more stringent over time. Stricter laws, regulations or enforcement policies could significantly increase our compliance costs and negatively impact our production and operations, which could have a material adverse effect on our results of operations and cash flows. See "Item 1. Business-Additional Oil and Gas Disclosures-Regulation-Environmental Regulations" for additional information.
There is increasing attention in the United States and worldwide being paid to the issue of climate change and the contributing effect of GHG emissions. The modification of existing laws or regulations or the adoption of new laws or regulations curtailing oil and gas exploration in the areas in which we operate could materially and adversely affect our operations by limiting drilling opportunities or imposing materially increased costs. See "Item 1. Business-Additional Oil and Gas Disclosures-Regulation; Global Climate Change" for additional information.
Hydraulic fracturing is an important and commonly used process in the completion of oil and gas wells, particularly in unconventional resource plays. Hydraulic fracturing involves the injection of water, sand and chemicals under pressure into rock formations to stimulate gas production. The U.S. Congress has considered legislation to subject hydraulic fracturing operations to federal regulation and to require the disclosure of chemicals used by us and others in the oil and gas industry in the hydraulic fracturing process. The EPA has asserted federal regulatory authority over hydraulic fracturing involving diesel under the federal Safe Drinking Water Act and has released draft permitting guidance for hydraulic fracturing operations that use diesel fuel in fracturing fluids in those states where EPA is the permitting authority. A number of federal agencies are also analyzing, or have been requested to review, a variety of environmental issues associated with hydraulic fracturing. For example, the EPA is conducting a comprehensive research study to investigate the potential adverse environmental impacts of hydraulic fracturing, including on water quality and public health. The EPA released a progress report outlining work currently underway on December 21, 2012 and is expected to release results of the study in 2014. These on-going or proposed studies, depending on their course and any meaningful results obtained, could spur initiatives to further regulate hydraulic fracturing under the Safe Drinking Water Act, the
34
Toxic Substances Control Act, or other regulatory mechanisms. President Obama has created the Interagency Working Group on Unconventional Natural Gas and Oil by Executive Order, which is charged with coordinating and aligning federal agency research and scientific studies on unconventional natural gas and oil resources.
At the state level, the New York legislature has approved a temporary moratorium on drilling involving hydraulic fracturing and the New York State Department of Environmental Conservation has ceased issuing exploration and production drilling permits, pending completion of an environmental impact statement regarding hydraulic fracturing. Pennsylvania has adopted a variety of regulations since 2010 limiting how and where hydraulic fracturing can be performed in the state, including the adoption of upgraded well construction and casing standards, upgraded cement standards and new recordkeeping requirements. Additionally, the Governor of Pennsylvania has instituted a moratorium on leasing state forest land for new gas drilling. Further, in February 2012, Pennsylvania passed Act 13 of 2012, a comprehensive oil and gas bill that, among other things, strengthens permit requirements, extends well setbacks, establishes standards for containment on well sites, requires annual inventory of air emissions, enhances disclosure requirements, and increases the maximum amount of civil penalties. Act 13 is currently being challenged in various lawsuits. The adoption of these new laws and regulations governing shale gas development in the Marcellus Shale in Pennsylvania could result in substantial changes in the way natural gas activities are conducted in the area.
Several other states, including states where we operate such as Colorado, Ohio, and Texas, have proposed or adopted legislative or regulatory restrictions on hydraulic fracturing through additional permit requirements, public disclosure of fracturing fluid contents, water sampling requirements, and operational restrictions. Further, some cities and municipalities have adopted or are considering adopting bans on drilling, including in Colorado, West Virginia, and Pennsylvania.
At the international level, the U.K. and EU Parliaments have each in the past discussed implementing a drilling moratorium in the U.K. North Sea. We use hydraulic fracturing extensively and any increased federal, state, local, foreign or international regulation of hydraulic fracturing or offshore drilling, including legislation and regulation in the states of Colorado, New York, Ohio, Texas and Pennsylvania, could reduce the volumes of oil and gas that we can economically recover, which could materially and adversely affect our revenues and results of operations.
From time to time legislation is introduced in the U.S. Congress that, if enacted into law, would make significant changes to United States tax laws, including the elimination of certain key U.S. federal income tax incentives currently available to oil and gas exploration and production companies. These or any other similar changes in U.S. federal income tax laws could defer or eliminate certain tax deductions that are currently available with respect to oil and gas exploration and development, and any such change could negatively affect our financial position and results of operations.
Our onshore and offshore operations are subject to various operating and other casualty risks that could result in liability exposure or the loss of production and revenues.
The oil and gas business involves operating hazards such as:
• | well blowouts; |
• | mechanical failures; |
• | explosions; |
• | pipe or cement failures and casing collapses, which could release oil, natural gas, drilling fluids or hydraulic fracturing fluids; |
• | uncontrollable flows of oil, natural gas or well fluids; |
• | fires; |
• | geologic formations with abnormal pressures; |
• | spillage handling and disposing of materials, including drilling fluids and hydraulic fracturing fluids and other pollutants; |
• | pipeline ruptures or spills; |
• | releases of toxic gases; |
• | adverse weather conditions, including drought, flooding, winter storms, snow, hurricanes or other severe weather events; and |
• | other environmental hazards and risks including conditions caused by previous owners and lessors of our properties. |
Any of these hazards and risks can result in substantial losses to us from, among other things, injury or loss or life,
severe damage to or destruction of property, natural resources and equipment, pollution or other environmental damage, cleanup responsibilities, regulatory investigation and penalties and suspension of operations. As a result we could incur
35
substantial liabilities or experience reductions in revenue that could reduce or eliminate the funds available for our exploration and development programs and acquisitions.
Offshore operations are subject to a variety of operating risks in addition to the hazards described above, such as capsizing and collisions.The occurrence of other events such as blowouts and oil spills in marine environments can make containment and remediation more difficult and costly than on land. These conditions can and have caused substantial damage to facilities and interrupted production in the past. Additionally, offshore operations generally involve increased costs and more expansive regulatory requirements as compared to onshore operations.
Interruption to crude oil and natural gas gathering systems, pipelines and processing facilities we do not own could result in the loss of production and revenues.
Our operations are dependent upon the availability, proximity and capacity of pipelines, natural gas gathering systems and processing facilities we do not own. Any significant change affecting these infrastructure facilities could materially harm our business. The lack of available capacity of gathering systems and pipelines could reduce the price offered for our production or result in the shut-in of producing wells or the delay or discontinuance of development plans for properties. These facilities may be temporarily unavailable due to adverse weather conditions or operational issues or may not be available to us in the future. See "-Our onshore and offshore operations are subject to various operating and other casualty risks that could result in liability exposure or the loss of production and revenues." Additionally, activists or other efforts may delay or halt the construction of additional pipelines or facilities. To the extent these services are unavailable, we would be unable to realize revenue from wells served by such facilities until suitable arrangements are made to market our production. As a result, we could experience reductions in revenue that could reduce or eliminate the funds available for our exploration and development programs and acquisitions, or result in the loss of property.
We may not have enough insurance to cover all of the risks we face.
We maintain insurance against losses and liabilities in accordance with customary industry practices and in amounts that management believes to be prudent; however, insurance against all operational risks is not available to us. We do not carry business interruption insurance. We may elect not to carry insurance if management believes that the cost of available insurance is excessive relative to the risks presented. In addition, losses could occur for uninsured risks or in amounts in excess of existing insurance coverage. We cannot insure fully against pollution and environmental risks. We cannot assure you that we will be able to maintain adequate insurance in the future at rates we consider reasonable or that any particular types of coverage will be available. The occurrence of an event not fully covered by insurance could have a material adverse effect on our financial position and results of operations.
We conduct a substantial portion of our operations through joint ventures, which subject us to additional risks that could have a material adverse effect on the success of these operations, our financial position and our results of operations.
We conduct a substantial portion of our operations through joint ventures with third parties, including Avista and its affiliates, GAIL, Haimo, the OIL JV Partners, Reliance and an affiliate of Sumitomo Corporation. We may also enter into other joint venture arrangements in the future. These third parties may have obligations that are important to the success of the joint venture, such as the obligation to pay substantial carried costs pertaining to the joint venture and to pay their share of capital and other costs of the joint venture. The performance of these third party obligations, including the ability of the third parties to satisfy their obligations under these arrangements, is outside our control. If these parties do not satisfy their obligations under these arrangements, our business may be adversely affected.
Our joint venture arrangements may involve risks not otherwise present when exploring and developing properties directly, including, for example:
• | our joint venture partners may share certain approval rights over major decisions; |
• | our joint venture partners may not pay their share of the joint venture's obligations, leaving us liable for their shares of joint venture liabilities; |
• | we may incur liabilities as a result of an action taken by our joint venture partners; |
• | we may be required to devote significant management time to the requirements of and matters relating to the joint ventures; |
• | our joint venture partners may be in a position to take actions contrary to our instructions or requests or contrary to our policies or objectives; and |
• | disputes between us and our joint venture partners may result in delays, litigation or operational impasses. |
36
The risks described above or the failure to continue our joint ventures or to resolve disagreements with our joint venture partners could adversely affect our ability to transact the business that is the subject of such joint venture, which would in turn negatively affect our financial condition and results of operations. The risks described above or the failure to continue our joint ventures or to resolve disagreements with our joint venture partners could adversely affect our ability to transact the business that is the subject of such joint venture, which would in turn negatively affect our financial condition and results of operations. The agreements under which we formed certain joint ventures may subject us to various risks, limit the actions we may take with respect to the properties subject to the joint venture and require us to grant rights to our joint venture partners that could limit our ability to benefit fully from future positive developments. Some joint ventures requires us to make significant capital expenditures. If we do not timely meet our financial commitments or otherwise do not comply with our joint venture agreements, our rights to participate, exercise operator rights or otherwise influence or benefit from the joint venture may be adversely affected. Certain of our joint venture partners may have substantially greater financial resources than we have and we may not be able to secure the funding necessary to participate in operations our joint venture partners propose, thereby reducing our ability to benefit from the joint venture.
We cannot control the activities on properties we do not operate.
We do not operate all of the properties in which we have an interest. As a result, we have limited ability to exercise influence over, and control the risks associated with, operations of these properties. The failure of an operator of our wells to adequately perform operations, an operator's breach of the applicable agreements or an operator's failure to act in ways that are in our best interests could reduce our production and revenues or could create liability for us for the operator's failure to properly maintain the well and facilities and to adhere to applicable safety and environmental standards. With respect to properties that we do not operate:
• | the operator could refuse to initiate exploration or development projects; |
• | if we proceed with any of those projects the operator has refused to initiate, we may not receive any funding from the operator with respect to that project; |
• | the operator may initiate exploration or development projects on a different schedule than we would prefer; |
• | the operator may propose greater capital expenditures than we wish, including expenditures to drill more wells or build more facilities on a project than we have funds for, which may mean that we cannot participate in those projects or participate in a substantial amount of the revenues from those projects; and |
• | the operator may not have sufficient expertise or resources. |
Any of these events could significantly and adversely affect our anticipated exploration and development activities.
If our access to markets is restricted, it could negatively impact our production, our income and ultimately our ability to retain our leases. Our ability to sell oil and natural gas and receive market prices for our oil and natural gas may be adversely affected by pipeline and gathering system capacity constraints.
Market conditions or the unavailability of satisfactory oil and gas transportation arrangements may hinder our access to oil and gas markets or delay our production. The availability of a ready market for our oil and gas production depends on a number of factors, including the demand for and supply of oil and gas and the proximity of reserves to pipelines and terminal facilities. Our ability to market our production depends in substantial part on the availability and capacity of gathering systems, pipelines and processing facilities owned and operated by third parties. Our failure to obtain such services on acceptable terms could materially harm our business. Our productive properties may be located in areas with limited or no access to pipelines, thereby necessitating delivery by other means, such as trucking, or requiring compression facilities. Such restrictions on our ability to sell our oil or gas may have several adverse effects, including higher transportation costs, fewer potential purchasers (thereby potentially resulting in a lower selling price) or, in the event we were unable to market and sustain production from a particular lease for an extended time, possibly causing us to lose a lease due to lack of production. There is currently limited pipeline and gathering system capacity in areas of the Marcellus Shale where we operate. See "-Interruption to crude oil and natural gas gathering systems, pipelines and processing facilities we do not own could result in the loss of production and revenues."
Historically, we have generally delivered our oil and gas production through gathering systems and pipelines that we do not own under interruptible or short-term transportation agreements. Under the interruptible transportation agreements, the transportation of our oil and gas production may be interrupted due to capacity constraints on the applicable system, for maintenance or repair of the system, or for other reasons as dictated by the particular agreements. Due to the lack of available pipeline capacity in the Eagle Ford Shale and the Marcellus Shale, we have entered into firm transportation agreements for a portion of our production in the Eagle Ford Shale and Marcellus Shale in order to assure our ability, and that of our purchasers, to successfully market the oil and gas that we produce. We may also enter into firm transportation arrangements for additional production in the future. These firm transportation agreements may be more costly than interruptible or short-term transportation agreements.
37
If production in the Marcellus Shale by oil and gas companies continues to expand, the amount of natural gas being produced by us and others could exceed the capacity of the various gathering and intrastate or interstate transportation pipelines currently available in these areas. If this occurs, it will be necessary for new pipelines and gathering systems to be built. Because of the current economic climate, certain pipeline projects that are planned for the Marcellus Shale may not occur for lack of financing. In addition, capital constraints could limit our ability to build intrastate gathering systems necessary to transport our gas to interstate pipelines. In such event, we might have to shut in our wells awaiting a pipeline connection or capacity or sell natural gas production at significantly lower prices than those we currently project, which could materially and adversely affect our results of operations.
A portion of our oil and gas production in any region may be interrupted, or shut in, from time to time for numerous reasons, including as a result of weather conditions, accidents, loss of pipeline or gathering system access, field labor issues or strikes, or we might voluntarily curtail production in response to market conditions. If a substantial amount of our production is interrupted at the same time, it could temporarily adversely affect our cash flow.
Our future acquisitions may yield revenues or production that varies significantly from our projections.
In acquiring producing properties, we assess the recoverable reserves, future oil and gas prices, development and operating costs, potential environmental and other liabilities and other factors relating to the properties. Our assessments are necessarily inexact and their accuracy is inherently uncertain. Our review of a subject property in connection with our acquisition assessment will not reveal all existing or potential problems or permit us to become sufficiently familiar with the property to assess fully its deficiencies and capabilities. We may not inspect every well, and we may not be able to observe structural and environmental problems even when we do inspect a well. If problems are identified, the seller may be unwilling or unable to provide effective contractual protection against all or part of those problems. Any acquisition of property interests may not be economically successful, and unsuccessful acquisitions may have a material adverse effect on our financial position and future results of operations.
Our business may suffer if we lose key personnel.
We depend to a large extent on the services of certain key management personnel, including our executive officers and other key employees, the loss of any of whom could have a material adverse effect on our operations. We have entered into employment agreements with many of our key employees as a way to assist in retaining their services and motivating their performance. We do not maintain key-man life insurance with respect to any of our employees. Our success will also be dependent on our ability to continue to employ and retain skilled technical personnel.
We may experience difficulty in achieving and managing future growth.
We have experienced growth in the past primarily through the expansion of our drilling program. Future growth may place strains on our financial, technical, operational and administrative resources and cause us to rely more on project partners and independent contractors, possibly negatively affecting our financial position and results of operations. Our ability to grow will depend on a number of factors, including:
• | our ability to obtain leases or options on properties, including those for which we have 3-D seismic data; |
• | our ability to acquire additional 3-D seismic data; |
• | our ability to identify and acquire new exploratory prospects; |
• | our ability to develop existing prospects; |
• | our ability to continue to retain and attract skilled personnel; |
• | our ability to maintain or enter into new relationships with project partners and independent contractors; |
• | the results of our drilling program; |
• | hydrocarbon prices; and |
• | our access to capital. |
We may not be successful in upgrading our technical, operations and administrative resources or in increasing our ability to internally provide certain of the services currently provided by outside sources, and we may not be able to maintain or enter into new relationships with project partners and independent contractors. Our inability to achieve or manage growth may adversely affect our financial position and results of operations.
38
We may continue to enter into derivative transactions to manage the price risks associated with our production, which may expose us to risk of financial loss and limit the benefit to us of increases in prices for oil and gas.
Because oil and gas prices are unstable, we periodically enter into price-risk-management transactions such as fixed-rate swaps, costless collars, puts, calls and basis differential swaps to reduce our exposure to price declines associated with a portion of our oil and gas production and thereby to achieve a more predictable cash flow. The use of these arrangements limits our ability to benefit from increases in the prices of oil and gas. Our derivative arrangements may apply to only a portion of our production, thereby providing only partial protection against declines in oil and gas prices. These arrangements may expose us to the risk of financial loss in certain circumstances, including instances in which production is less than expected, our customers fail to purchase contracted quantities of oil and gas or a sudden, unexpected event materially impacts oil or gas prices. In addition, the counterparties under our derivatives contracts may fail to fulfill their contractual obligations to us.
Periods of high demand for field services and equipment and the ability of suppliers to meet that demand may limit our ability to drill and produce our oil and gas properties.
During periods when oil and gas prices are relatively high, well service providers and related equipment and personnel may be in short supply. These shortages can cause escalating prices, delays in drilling and other exploration activities and the possibility of poor services coupled with potential damage to downhole reservoirs and personnel injuries. Such pressures may increase the actual cost of services, extend the time to secure such services and add costs for damages due to any accidents sustained from the overuse of equipment and inexperienced personnel.
We may record impairments of oil and gas properties that would reduce our shareholders' equity.
We use the full cost method of accounting for our oil and gas properties. Accordingly, we capitalize all productive and nonproductive costs directly associated with property acquisition, exploration and development activities to cost centers established on a country-by-country basis. Under the full cost method, the capitalized cost of oil and gas properties, less accumulated amortization and related deferred income taxes may not exceed the "cost center ceiling" which is equal to the sum of the present value of estimated future net revenues from proved reserves, less estimated future expenditures to be incurred in developing and producing the proved reserves computed using a discount factor of 10% , plus the costs of properties not subject to amortization, plus the lower of the cost or estimated fair value of unproved properties included in the costs being amortized, less related income tax effects. If the net capitalized costs exceed the cost center ceiling, we recognize the excess as an impairment of oil and gas properties. This impairment does not impact cash flows from operating activities but does reduce earnings and our shareholders' equity. The risk that we will be required to recognize impairments of our oil and gas properties increases during periods of low oil or gas prices. In addition, impairments would occur if we were to experience sufficient downward adjustments to our estimated proved reserves or the present value of estimated future net revenues, as further discussed under "-Our reserve data and estimated discounted future net cash flows are estimates based on assumptions that may be inaccurate and are based on existing economic and operating conditions that may change in the future." An impairment recognized in one period may not be reversed in a subsequent period even if higher oil and gas prices increase the cost center ceiling applicable to the subsequent period. We have in the past and could in the future incur additional impairments of oil and gas properties, particularly as a result of a decline in oil or gas prices.
We could lose our ability to use net operating loss carryforwards that we have accumulated over the years.
Our ability to utilize U.S. net operating loss carryforwards to reduce future taxable income is subject to various limitations under the Internal Revenue Code of 1986, as amended (the "Code"). The utilization of such carryforwards may be limited upon the occurrence of certain ownership changes, including the purchase or sale of our stock by 5% shareholders and our offering of stock during any three-year period resulting in an aggregate change of more than 50% in our beneficial ownership. In the event of an ownership change, Section 382 of the Code imposes an annual limitation on the amount of our taxable income that can be offset by these carryforwards. The limitation is generally equal to the product of (a) the fair market value of our equity multiplied by (b) a percentage approximately equivalent to the yield on long-term tax exempt bonds during the month in which an ownership change occurs. In addition, the limitation is increased if there are recognized built-in gains during any post-change year, but only to the extent of any net unrealized built-in gains inherent in the assets sold. As of December 31, 2012 , we believe an ownership change occurred in February 2005, which imposed an annual limitation of approximately $12.6 million of the Company's taxable income that can be offset by the pre-change carryforwards. Subsequent equity transactions involving us or our 5% shareholders (including, potentially, relatively small transactions and transactions beyond our control) could cause further ownership changes and therefore a limitation on the annual utilization of our U.S. loss carryforwards.
Enactment of proposed impact fees on natural gas wells could adversely impact our results of operations and the economic viability of exploiting natural gas drilling and production opportunities in Pennsylvania.
Legislation has been enacted in Pennsylvania, that authorizes counties to impose fees on certain natural gas wells in Pennsylvania. If a county elects to impose a fee, the fee will apply to any "unconventional gas well," which is generally defined
39
as a well using hydraulic fracture treatments or multilateral well bores. Any county that elects not to impose the fee can be overruled by the municipalities within that county. The fee would be imposed over a fifteen year period, starting with the year the well is actually drilled and declining thereafter, and is based on natural gas prices and the Consumer Price Index. Unconventional gas wells drilled before the fee is imposed would still be subject to the fee and, for purposes of calculating the amount of the fee, will be considered to have been drilled in the calendar year prior to the imposition of the fee. A substantial portion of our Marcellus Shale acreage and a portion of our Utica Shale acreage is located in the Commonwealth of Pennsylvania. To the extent such fees are ultimately enacted by counties in which we now or may in the future operate, or if Pennsylvania adopts severance taxes or additional fees, such actions could adversely impact our results of operations and the economic viability of exploiting natural gas drilling and production opportunities in Pennsylvania.
We may incur losses as a result of title deficiencies.
We purchase working and revenue interests in the oil and gas leasehold interests upon which we will perform our exploration activities from third parties or directly from the mineral fee owners. The existence of a material title deficiency can render a lease worthless and can adversely affect our results of operations and financial condition. Title insurance covering mineral leaseholds is not generally available and, in all instances, we forego the expense of retaining lawyers to examine the title to the mineral interest to be placed under lease or already placed under lease until the drilling block is assembled and ready to be drilled. Even then, particularly in urban settings, the cost of performing detailed title work can be expensive. We may choose to forgo detailed title examination by title lawyers on a portion of the mineral leases that we place in a drilling unit or conduct less title work than we have traditionally performed. As is customary in our industry, we generally rely upon the judgment of oil and gas lease brokers or independent landmen who perform the field work in examining records in the appropriate governmental offices and abstract facilities before attempting to acquire or place under lease a specific mineral interest and before drilling a well on a leased tract. We, in some cases, perform curative work to correct deficiencies in the marketability or adequacy of the title to us. The work might include obtaining affidavits of heirship or causing an estate to be administered. In cases involving more serious title problems, the amount paid for affected oil and gas leases can be generally lost and the target area can become undrillable. The failure of title may not be discovered until after a well is drilled, in which case we may lose the lease and the right to produce all or a portion of the minerals under the property.
We have risks associated with our foreign operations.
We currently have international activities and we continue to evaluate and pursue new opportunities for international expansion in select areas. Ownership of property interests and production operations in areas outside the United States is subject to the various risks inherent in foreign operations. These risks may include:
• | currency restrictions and exchange rate fluctuations; |
• | loss of revenue, property and equipment as a result of expropriation, nationalization, war or insurrection; |
• | increases in taxes and governmental royalties; |
• | renegotiation of contracts with governmental entities and quasi-governmental agencies; |
• | changes in laws and policies governing operations of foreign-based companies; |
• | labor problems; and |
• | other uncertainties arising out of foreign government sovereignty over our international operations. |
Our international operations also may be adversely affected by the laws and policies of the United States affecting foreign trade, taxation and investment. In addition, if a dispute arises with respect to our foreign operations, we may be subject to the exclusive jurisdiction of foreign courts or may not be successful in subjecting foreign persons to the jurisdiction of the courts of the United States.
The threat and impact of terrorist attacks, cyber attacks or similar hostilities may adversely impact our operations.
We cannot assess the extent of either the threat or the potential impact of future terrorist attacks on the energy industry in general, and on us in particular, either in the short-term or in the long-term. Uncertainty surrounding such hostilities may affect our operations in unpredictable ways, including the possibility that infrastructure facilities, including pipelines and gathering systems, production facilities, processing plants and refineries, could be targets of, or indirect casualties of, an act of terror, a cyber attack or electronic security breach, or an act of war.
Item 1B. Unresolved Staff Comments
None.
40
Item 2. Properties
Information regarding our properties is included in "Item 1. Business" above and in "Note 5. Property and Equipment, Net" of the Notes to our Consolidated Financial Statements included in "Item 8. Financial Statements and Supplementary Data," which information is incorporated herein by reference.
Item 3. Legal Proceedings
From time to time, we are party to certain legal actions and claims arising in the ordinary course of business. While the outcome of these events cannot be predicted with certainty, management does not expect these matters to have a materially adverse effect on our financial position or results of operations.
Item 4. Mine Safety Disclosures
Not applicable.
41
PART II
Item 5. Market for Registrant's Common Stock, Related Shareholder Matters and Issuer Purchases of Equity Securities
Our common stock, par value $0.01 per share, trades on the NASDAQ Global Select Market under the symbol "CRZO." The following table sets forth the high and low sales prices per share of our common stock on the NASDAQ Global Select Market for the periods indicated.
|
| High |
| Low | ||||
2011 |
|
|
|
| ||||
First Quarter |
| $ | 39.34 | |
| $ | 28.71 | |
Second Quarter |
| 42.72 | |
| 32.47 | | ||
Third Quarter |
| 44.17 | |
| 20.95 | | ||
Fourth Quarter |
| 30.00 | |
| 18.02 | | ||
2012 |
|
|
|
| ||||
First Quarter |
| $ | 31.62 | |
| $ | 22.79 | |
Second Quarter |
| 31.32 | |
| 19.04 | | ||
Third Quarter |
| 29.50 | |
| 22.09 | | ||
Fourth Quarter |
| 27.30 | |
| 19.47 | | ||
The closing market price of our common stock on February 25, 2013 was $21.29 per share. As of February 25, 2013 , there were an estimated 185 owners of record of our common stock.
We have not paid any dividends on our common stock in the past and do not intend to pay such dividends in the foreseeable future. We currently intend to retain any earnings for the future operation and development of our business, including exploration, development and acquisition activities. Our revolving credit facility restricts our ability to pay dividends. See "Item 7. Management's Discussion and Analysis of Financial Condition and Results of Operations-Liquidity and Capital Resources."
The following graph presents a comparison of the yearly percentage change in the cumulative total return on our Common Stock over the period from December 31, 2007 to December 31, 2012 , with the cumulative total return of the S&P 500 Index and the American Stock Exchange ("AMEX") Natural Resources Industry Index of publicly traded companies over the same period. The graph assumes that $100 was invested on December 31, 2007 in our common stock at the closing market price at the beginning of this period and in each of the other two indices and the reinvestment of all dividends, if any.
The graph is presented in accordance with requirements of the SEC. Shareholders are cautioned against drawing any conclusions from the data contained therein, as past results are not necessarily indicative of future financial performance.
|
| S&P |
| AMEX |
| CRZO | |||
December 31, 2007 |
| 100 | |
| 100 | |
| 100 | |
December 31, 2008 |
| 62 | |
| 51 | |
| 29 | |
December 31, 2009 |
| 76 | |
| 71 | |
| 48 | |
December 31, 2010 |
| 86 | |
| 91 | |
| 63 | |
December 31, 2011 |
| 86 | |
| 80 | |
| 48 | |
December 31, 2012 |
| 97 | |
| 76 | |
| 38 | |
Pursuant to SEC rules, the foregoing graph is not deemed "filed" with the SEC.
We made no repurchases of our common stock in the fourth quarter of 2012.
On November 24, 2009 , we entered into a land agreement with an unrelated third party and its affiliate. This land agreement expired by its terms on May 31, 2011 . Under the land agreement, we issued warrants to purchase 31,983 , 28,576 and 57,641 shares of common stock in 2012 , 2011 and 2010 , respectively. The warrants have an expiration date of August 21, 2017, an exercise price of $22.09, which may be exercised on a "cashless" basis and are subject to antidilution adjustments . The final issuance of warrants under the land agreement was effected in April 2012 . The warrants were issued pursuant to an exemption from registration under §4(2) of the Securities Act of 1933, as amended. Please see "Item 7. Management's Discussion and Analysis of Financial Condition and Results of Operations-Liquidity and Capital Resources-Lease Option Arrangements" for more information about this land agreement and other lease option arrangements.
42
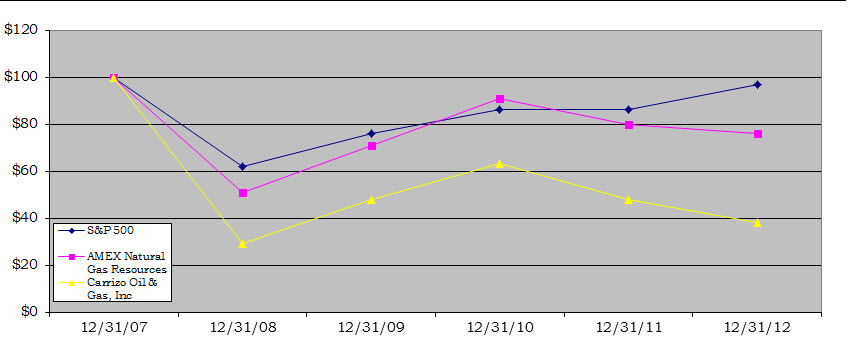
During second and fourth quarters of 2012, we issued 45,327 and 47,962 newly issued shares, respectively, of our common stock to the University of Texas at Arlington at par value ($0.01 per share) of $453 and $480 . These issuances were related to our five-year conditional and revocable pledge to donate $1.0 million per year to the University of Texas at Arlington, where we are producing natural gas from a number of wells in the Barnett Shale play. Following the issuance in the first quarter of 2013, two donations remain. The shares were issued pursuant to an exemption from registration under §4(2) of the Securities Act of 1933, as amended, for transactions not involving a public offering.
See "Item 12. Security Ownership of Certain Beneficial Owners and Management and Related Stockholder Matters" for information regarding shares of common stock authorized for issuance under our stock incentive plans.
43
Item 6. Selected Financial Data
Our financial information set forth below for each of the five years in the period ended December 31, 2012 , has been derived from continuing operations information included in our audited consolidated financial statements. This information should be read in conjunction with "Item 7. Management's Discussion and Analysis of Financial Condition and Results of Operations" and our Consolidated Financial Statements and related Notes included in "Item 8. Financial Statements and Supplementary Data."
| | Year Ended December 31, | ||||||||||||||||||
| | 2012 |
| 2011 |
| 2010 |
| 2009 |
| 2008 | ||||||||||
| | (In thousands, except per share data) | ||||||||||||||||||
Statements of Operations from Continuing Operations Data: | | | | | | | | | | | ||||||||||
Oil and gas revenues | | $ | 368,180 | | | $ | 202,167 | | | $ | 138,123 | | | $ | 112,699 | | | $ | 209,829 | |
Costs and expenses: | |
|
|
|
|
|
|
|
|
| ||||||||||
Oil and gas operating expenses | | 54,826 | | | 37,636 | | | 31,014 | | | 30,321 | | | 37,607 | | |||||
Impairment of oil and gas properties | | - | | | - | | | - | | | 338,914 | | | 178,470 | | |||||
Depreciation, depletion and amortization | | 165,621 | | | 84,606 | | | 47,030 | | | 52,005 | | | 58,311 | | |||||
General and administrative | | 48,708 | | | 41,539 | | | 35,906 | | | 30,136 | | | 23,425 | | |||||
Accretion expense related to asset retirement obligations | | 372 | | | 235 | | | 216 | | | 308 | | | 154 | | |||||
Total costs and expenses | | 269,527 | | | 164,016 | | | 114,166 | | | 451,684 | | | 297,967 | | |||||
Operating income (loss) | | 98,653 | | | 38,151 | | | 23,957 | | | (338,985 | ) | | (88,138 | ) | |||||
Gain (loss) on derivative instruments, net | | 31,371 | | | 48,423 | | | 47,782 | | | 41,465 | | | 37,499 | | |||||
Loss on extinguishment of debt | | - | | | (897 | ) | | (31,023 | ) | | - | | | (5,689 | ) | |||||
Interest expense, net of amounts capitalized | | (48,158 | ) | | (27,629 | ) | | (22,518 | ) | | (18,590 | ) | | (9,730 | ) | |||||
Other income (loss), net | | 267 | | | 97 | | | 212 | | | (2,042 | ) | | 286 | | |||||
Income (loss) from continuing operations before income taxes | | 82,133 | | | 58,145 | | | 18,410 | | | (318,152 | ) | | (65,772 | ) | |||||
Income tax (expense) benefit | | (30,956 | ) | | (25,611 | ) | | (6,685 | ) | | 113,307 | | | 20,725 | | |||||
Net income (loss) from continuing operations | | $ | 51,177 | | | $ | 32,534 | | | $ | 11,725 | | | $ | (204,845 | ) | | $ | (45,047 | ) |
Basic net income (loss) from continuing operations per common share | | $ | 1.29 | | | $ | 0.83 | | | $ | 0.34 | | | $ | (6.61 | ) | | $ | (1.49 | ) |
Diluted net income (loss) from continuing operations per common share | | $ | 1.28 | | | $ | 0.82 | | | $ | 0.34 | | | $ | (6.61 | ) | | $ | (1.49 | ) |
Basic weighted average common shares outstanding | | 39,591 | | | 39,077 | | | 33,861 | | | 31,006 | | | 30,326 | | |||||
Diluted weighted average common shares outstanding | | 40,026 | | | 39,668 | | | 34,305 | | | 31,006 | | | 30,326 | | |||||
Statements of Cash Flows from Continuing Operations Data: | | | | | | | | | | | ||||||||||
Net cash provided by operating activities - continuing operations | | $ | 253,071 | | | $ | 155,511 | |
| $ | 94,416 | | | $ | 133,372 | | | $ | 148,754 | |
Net cash used in investing activities - continuing operations | | (465,151 | ) | | (250,068 | ) |
| (264,115 | ) | | (160,675 | ) | | (549,794 | ) | |||||
Net cash provided by financing activities - continuing operations | | 237,778 | | | 116,826 | |
| 169,990 | | | 25,956 | | | 398,198 | | |||||
Other Cash Flows from Continuing Operations Data: | | | | | | | | | | | ||||||||||
Capital expenditures - oil and gas properties | | $ | (735,711 | ) | | $ | (516,004 | ) | | $ | (340,784 | ) | | $ | (179,891 | ) | | $ | (565,555 | ) |
Proceeds from sales of oil and gas properties, net |
| 341,597 | |
| 167,265 | |
| 54,217 | |
| 48,524 | |
| 3,259 | | |||||
Proceeds from (repayments of) debt (1) | | 244,772 | | | 126,401 | | | (7,021 | ) | | 31,652 | | | 279,259 | | |||||
Proceeds from common stock offerings, net of offering costs | | - | | | - | | | 188,534 | | | - | | | 135,075 | | |||||
Balance Sheet from Continuing Operations Data: | | | | | | | | | | | ||||||||||
Working capital (deficit) | | $ | (43,432 | ) | | $ | (150,559 | ) | | $ | (58,672 | ) | | $ | (47,328 | ) | | $ | (57,602 | ) |
Property and equipment, net | | 1,487,674 | | | 1,240,917 | | | 960,393 | | | 712,364 | | | 966,471 | | |||||
Total assets | | 1,749,488 | | | 1,445,075 | | | 1,121,470 | | | 841,771 | | | 1,051,544 | | |||||
Total long-term debt, net of debt discount | | 967,808 | | | 711,486 | | | 558,254 | | | 520,336 | | | 475,961 | | |||||
Total shareholders' equity | | 585,016 | | | 509,855 | | | 456,636 | | | 247,609 | | | 440,085 | | |||||
(1) | Repayments include amounts refinanced. |
44
Item 7. Management's Discussion and Analysis of Financial Condition and Results of Operations
General Overview
In 2012 , we recognized record oil and gas revenues of $368.2 million , record production of 9.4 MMBoe and U.S. proved oil and gas reserves of 115.1 MMBoe at December 31, 2012 . The key drivers to our success in 2012 included the following:
Drilling program. Our success is largely dependent on the results of our drilling program. For the year ended December 31, 2012 , we drilled 133 gross ( 70.8 net) wells a success rate of 99% that was comprised of: (a) 59 of 59 gross ( 46.7 net) wells in the Eagle Ford Shale, (b) 26 of 26 gross ( 9.1 net) wells in the Niobrara Formation, (c) 38 of 39 gross ( 12.5 net) wells in the Marcellus Shale, (d) 6 of 6 gross ( 1.7 net) wells in the Barnett Shale, and (e) 2 of 3 gross (0.4 net) wells in other project areas. At December 31, 2012 , 61 of these gross ( 28.7 net) wells were awaiting completion or pipeline connections.
Production and reserve growth. Our production for the year ended December 31, 2012 was a record 9.4 MMBoe , or 25,781 Boe /d, and reflects an increase of 26% from 2011 production of 7.5 MMBoe . The increase in production was primarily due to increased production from new wells, partially offset by normal production decline, the Atlas sale, and the sale of substantially all of our non-core area Barnett Shale properties to KKR Natural Resources ("KKR") in May 2011. Due to divestitures during 2012, our U.S. proved oil and gas reserves decreased 23% to 115.1 MMBoe at December 31, 2012 , as compared to 149.7 MMBoe at December 31, 2011 . Adjusted for the divestitures of 53.8 MMBoe in 2012, we replaced 303% of 2012 's record production.
Commodity prices. Our average gas price during 2012 was $1.90 per Mcf, $1.08 per Mcf less than the 2011 price of $2.98 . Our average oil price in 2012 was $99.97 per Bbl, or $5.83 greater than the price of $94.14 in 2011 . Commodity prices are affected by changes in market demand, overall economic activity, weather, pipeline capacity constraints, inventory storage levels, basis differentials and other factors. Our financial results are largely dependent on commodity prices, which are beyond our control and have been and are expected to remain volatile.
Financial flexibility. During 2012 , we took steps to continue to strengthen our financial flexibility and to provide funding to accelerate the development of our crude oil and liquids-rich plays in the Eagle Ford Shale and the Niobrara Formation. In September 2012, we issued in a public offering $300.0 million aggregate principal amount of our 7.50% Senior Notes due 2020 at a price to the public of 100% of the principal amount. The net proceeds of approximately $294.2 million (after deducting underwriters' discounts and our expenses) were used to repay a substantial portion of the borrowings outstanding under our revolving credit facility.
Outlook for 2013
While the market for natural gas remains challenging due to low spot and future prices, we are insulated from a portion of their effect by our hedging of 18,250,000 MMBtus of natural gas (approximately 57% of currently forecasted 2013 production) for 2013 . We are rapidly growing our oil production, part of the effect of which will serve to further reduce our exposure to the weak natural gas market. The current market and outlook for crude oil sales is much more attractive and we are aggressively locking in these prices by increasing our hedge positions as our oil production grows. At December 31, 2012 , we had hedges in place for 2,774,000 Bbls of oil (approximately 84% of forecasted 2013 production) and 2,555,000 Bbls of oil for 2013 and 2014 , respectively. Production growth and commodity prices that permit us to drill, develop and produce at a profit are key to our future success, and we believe the following measures will continue to have a positive impact on our results in 2013 .
On February 22, 2013 , we completed the sale of Carrizo UK, and all of its interest in the Huntington Field discovery, to Iona Energy. The U.K. North Sea assets and associated liabilities have been classified as current and long-term assets held for sale and current and long-term liabilities associated with assets held for sale in the consolidated balance sheets. The related results of operations and cash flows have been classified as discontinued operations, net of income taxes, in the consolidated statements of income and cash flows.
Control capital costs and maintain financial flexibility. Our Board of Directors has approved a U.S. capital expenditure plan for 2013 of $624.0 million, and we are striving to maintain our financial flexibility and a positive production growth profile. A weakening in commodity prices during 2013 could cause us to reduce our U.S. capital expenditure plan accordingly.
2013 capital expenditure plan . In 2013 , we plan to focus on the development of our key U.S. oil and gas resource plays. Our capital expenditures could vary from our current plan depending upon various factors, including the availability and cost of drilling rigs, land and industry partner issues, our available cash flow and financing, success of drilling programs, weather delays, commodity prices, market conditions, the acquisition of leases with drilling commitments and other factors. For additional
45
information on our 2013 capital expenditure plan, please see "Liquidity and Capital Resources-2013 Capital Expenditure Plan and Funding Strategy."
Results of Operations
Year Ended December 31, 2012 Compared to the Year Ended December 31, 2011
Revenues from oil and gas production for 2012 increased 82% to $368.2 million compared to $202.2 million in 2011 . Production volumes in 2012 were 9.4 MMBoe , an increase of 26% , compared to production of 7.5 MMBoe in 2011 . The increase in production was primarily due to increased production from new wells, partially offset by normal production decline, and the Atlas and KKR sales. See "Item 1. Business-Natural Gas Plays-Barnett Shale" for additional information. Average oil prices increased 6% to $99.97 per Bbl in 2012 from $94.14 per Bbl in 2011 . Average natural gas prices decreased 36% to $1.90 per Mcf in 2012 from $2.98 per Mcf in 2011 . Average NGL prices decreased 31% to $34.86 per Bbl in 2012 from $50.30 per Bbl in 2011 .
The following table summarizes production volumes, production volumes per day, average realized prices and oil and gas revenues for the years ended December 31, 2012 and 2011 :
|
|
|
|
|
| 2012 Period Compared to 2011 Period | |||||||||
|
| December 31, |
| Increase |
| % Increase | |||||||||
|
| 2012 |
| 2011 |
| (Decrease) |
| (Decrease) | |||||||
Production volumes - |
|
|
|
|
|
|
|
| |||||||
Oil and condensate (MBbls) |
| 2,862 | |
| 802 | |
| 2,060 | |
| 257 | % | |||
NGLs (MBoe) |
| 305 | |
| 210 | |
| 95 | |
| 45 | % | |||
Natural gas (MMcf) |
| 37,612 | |
| 38,991 | |
| (1,379 | ) |
| (4 | )% | |||
Total Natural gas and NGLs (MMcfe) |
| 39,442 | |
| 40,251 | |
| (809 | ) |
| (2 | )% | |||
Total barrels of oil equivalent (MBoe) |
| 9,436 | |
| 7,511 | |
| 1,925 | |
| 26 | % | |||
|
|
|
|
|
|
|
|
| |||||||
Production volumes per day - |
|
|
|
|
|
|
|
| |||||||
Oil and condensate per day (Bbls/d) |
| 7,820 | |
| 2,197 | |
| 5,623 | |
| 256 | % | |||
NGLs per day (Boe/d) |
| 833 | |
| 575 | |
| 258 | |
| 45 | % | |||
Natural gas per day (Mcf/d) |
| 102,765 | |
| 106,825 | |
| (4,060 | ) |
| (4 | )% | |||
Total Natural gas and NGLs per day (Mcfe/d) |
| 107,765 | |
| 110,277 | |
| (2,512 | ) |
| (2 | )% | |||
Total barrels of oil equivalent per day (Boe/d) |
| 25,781 | |
| 20,578 | |
| 5,203 | |
| 25 | % | |||
|
|
|
|
|
|
|
|
| |||||||
Average realized prices - |
|
|
|
|
|
|
|
| |||||||
Oil and condensate ($ per Bbl) |
| $ | 99.97 | |
| $ | 94.14 | |
| $ | 5.83 | |
| 6 | % |
NGLs ($ per Boe) |
| 34.86 | |
| 50.30 | |
| (15.44 | ) |
| (31 | )% | |||
Natural gas ($ per Mcf) |
| 1.90 | |
| 2.98 | |
| (1.08 | ) |
| (36 | )% | |||
Total average realized price ($ per Boe) |
| $ | 39.02 | |
| $ | 26.92 | |
| $ | 12.10 | |
| 45 | % |
|
|
|
|
|
|
|
|
| |||||||
Oil and gas revenues (In thousands) - |
|
|
|
|
|
|
|
| |||||||
Oil and condensate |
| $ | 286,119 | |
| $ | 75,502 | |
| $ | 210,617 | |
| 279 | % |
NGLs |
| 10,631 | |
| 10,562 | |
| 69 | |
| 1 | % | |||
Natural gas |
| 71,430 | |
| 116,103 | |
| (44,673 | ) |
| (38 | )% | |||
Total oil and gas revenues |
| $ | 368,180 | |
| $ | 202,167 | |
| $ | 166,013 | |
| 82 | % |
Lease operating expenses for 2012 increased to $31.5 million ( $3.34 per Boe ) from $28.3 million ( $3.77 per Boe ) in 2011 . Lease operating expenses increased $3.2 million primarily due to increased production from new wells partially offset by the Atlas and KKR sales. The decrease in operating cost per Boe is due to the Atlas and KKR sales (which were higher operating cost per Boe properties as compared to our remaining Barnett Shale properties) partially offset by the higher operating cost per Boe associated with oil production.
Production taxes increased to $13.5 million (or 3.7% of oil and gas revenues) in 2012 from $5.7 million (or 2.8% of oil and gas revenues) in 2011 as a result of increased oil production in 2012 . The increase in production taxes as a percentage of oil and gas revenues was primarily due to increased oil production, which has a higher effective production tax rate as compared to our natural gas production.
46
Ad valorem taxes increased to $9.8 million ( $1.04 per Boe ) in 2012 from $3.6 million ( $0.48 per Boe ) in 2011 . The increase in ad valorem taxes is due primarily to new oil wells drilled in 2011 and the Commonwealth of Pennsylvania's February 2012 enactment of an "impact fee" on the drilling of unconventional natural gas wells. Because of the retroactive nature of the impact fee, approximately $1.0 million of ad valorem taxes recognized during 2012 is attributable to wells drilled prior to 2012. The increase in ad valorem taxes per Boe is due primarily to new oil wells drilled in 2011, which have higher property tax valuations as compared to our natural gas wells, as well as the recognition of the impact fee in 2012.
Depreciation, depletion and amortization ("DD&A") expense for 2012 increased to $165.6 million ( $17.55 per Boe ) from $84.6 million ( $11.26 per Boe ) in 2011 . The increase in DD&A is attributable to both the increase in production and an increase in the DD&A rate per Boe . The increase in the DD&A rate per Boe is largely due to the impact of the significant decrease in natural gas reserves in the Barnett Shale as a result of the Atlas and KKR sales as well as the increase in crude oil reserves in the Eagle Ford Shale that have been added during 2011 and 2012, which have a higher finding cost per Boe than our natural gas reserves.
General and administration ("G&A") expense for 2012 increased to $48.7 million from $41.5 million in 2011 . The increase was primarily due to increased compensation costs related to an increase in personnel in 2012 as compared to 2011 . This was partially offset by decreased stock-based compensation expense due to a decrease in the fair value of stock appreciation rights resulting from a decrease in stock price during 2012 as compared to an increase in stock price during 2011, partially offset by higher stock-based compensation expense due to a higher number of restricted units outstanding during 2012 as compared to 2011.
The net gain on derivative instruments of $31.4 million in 2012 consisted of a $9.7 million unrealized loss on derivatives and a $41.1 million realized gain on derivatives. The net gain on derivative instruments of $48.4 million in 2011 consisted of a $13.0 million unrealized gain on derivatives and a $35.4 million realized gain on derivatives. The net decrease was due to the change in fair value of our open derivative positions during those periods.
Interest expense and capitalized interest in 2012 were $73.0 million and $24.8 million, respectively, as compared to $51.0 million and $23.4 million in 2011 , respectively. The net increase was primarily attributable to interest on the $200.0 million aggregate principal amount of our 8.625% Senior Notes issued in the fourth quarter of 2011 as well as interest on the $300.0 million aggregate principal amount of our 7.50% Senior Notes issued in the third quarter of 2012.
Our effective income tax rate was 37.7% for 2012 and 44% for 2011 . The decrease in the effective income tax rate is primarily due to the adjustments to prior state income tax provisions recorded during fourth quarter of 2011 and the income tax benefit of a capital loss associated with a prior investment.
Net income from discontinued operations, net of income taxes for 2012 increased to $4.3 million from $4.1 million in 2011. The increase is primarily related to income tax benefits associated with Carrizo UK.
Year Ended December 31, 2011 Compared to the Year Ended December 31, 2010
Revenues from oil and gas production for 2011 increased 46% to $202.2 million from $138.1 million in 2010. Production volumes for oil and gas in 2011 increased 22% to 7.5 MMBoe from 6.1 MMBoe in 2010. The increase in production for the year ended December 31, 2011 as compared to the year ended December 31, 2010 was primarily due to increased production from new wells, partially offset by normal production decline, the Atlas sale, and the KKR sale. Average oil prices increased 20% to $94.14 per Bbl from $78.74 per Bbl in 2010. Average natural gas prices decreased 11% to $2.98 per Mcf in 2011 from $3.33 per Mcf in 2010. Average NGL prices increased 31% to $50.30 per Boe in 2011 from $38.51 per Boe in 2010.
47
The following table summarizes production volumes, production volumes per day, average realized prices and oil and gas revenues for the years ended December 31, 2011 and 2010 :
|
|
|
|
|
| 2011 Period Compared to 2010 Period | |||||||||
|
| December 31, |
| Increase |
| % Increase | |||||||||
|
| 2011 |
| 2010 |
| (Decrease) |
| (Decrease) | |||||||
Production volumes - |
|
|
|
|
|
|
|
| |||||||
Oil and condensate (MBbls) |
| 802 | |
| 176 | |
| 626 | |
| 356 | % | |||
NGLs (MBoe) |
| 210 | |
| 277 | |
| (67 | ) |
| (24 | )% | |||
Natural gas (MMcf) |
| 38,991 | |
| 34,092 | |
| 4,899 | |
| 14 | % | |||
Total Natural gas and NGLs (MMcfe) |
| 40,251 | |
| 35,754 | |
| 4,497 | |
| 13 | % | |||
Total barrels of oil equivalent (MBoe) |
| 7,511 | |
| 6,135 | |
| 1,376 | |
| 22 | % | |||
|
|
|
|
|
|
|
|
| |||||||
Production volumes per day - |
|
|
|
|
|
|
|
| |||||||
Oil and condensate per day (Bbls/d) |
| 2,197 | |
| 482 | |
| 1,715 | |
| 356 | % | |||
NGLs per day (Boe/d) |
| 575 | |
| 759 | |
| (184 | ) |
| (24 | )% | |||
Natural gas per day (Mcf/d) |
| 106,825 | |
| 93,403 | |
| 13,422 | |
| 14 | % | |||
Total Natural gas and NGLs per day (Mcfe/d) |
| 110,277 | |
| 97,956 | |
| 12,321 | |
| 13 | % | |||
Total barrels of oil equivalent per day (MBoe) |
| 20,578 | |
| 16,808 | |
| 3,770 | |
| 22 | % | |||
|
|
|
|
|
|
|
|
| |||||||
Average realized prices - |
|
|
|
|
|
|
|
| |||||||
Oil and condensate ($ per Bbl) |
| $ | 94.14 | |
| $ | 78.74 | |
| $ | 15.40 | |
| 20 | % |
NGLs ($ per Boe) |
| 50.30 | |
| 38.51 | |
| 11.79 | |
| 31 | % | |||
Natural gas ($ per Mcf) |
| 2.98 | |
| 3.33 | |
| (0.35 | ) |
| (11 | )% | |||
Total average realized price ($ per Boe) |
| $ | 26.92 | |
| $ | 22.51 | |
| $ | 4.41 | |
| 20 | % |
|
|
|
|
|
|
|
|
| |||||||
Oil and gas revenues (In thousands) - |
|
|
|
|
|
|
|
| |||||||
Oil and condensate |
| $ | 75,502 | |
| $ | 13,859 | |
| $ | 61,643 | |
| 445 | % |
NGLs |
| 10,562 | |
| 10,667 | |
| (105 | ) |
| (1 | )% | |||
Natural gas |
| 116,103 | |
| 113,597 | |
| 2,506 | |
| 2 | % | |||
Total oil and gas revenues |
| $ | 202,167 | |
| $ | 138,123 | |
| $ | 64,044 | |
| 46 | % |
Lease operating expenses for 2011 increased to $28.3 million ($3.77 per Boe ) from $23.7 million ($3.86 per Boe ) in 2010. Lease operating expenses increased due to increased production. We continue to experience a decrease in the operating cost per Boe of our Barnett Shale production as a result of the Atlas and KKR sales, which was partially offset by increased operating cost per Boe associated with oil production.
Production taxes increased to $5.7 million (2.8% of oil and gas revenues) in 2011 from $3.6 million (2.6% of oil and gas revenues) in 2010 as a result of higher oil prices and increased production in 2011. The increase in production taxes as a percentage of oil and gas revenues is due to increased oil production, which has a higher effective production tax rate as compared to natural gas production.
Ad valorem taxes decreased to $3.6 million ($0.48 per Boe ) in 2011 from $3.7 million ($0.60 per Boe ) in 2010 due to the sale of substantially all of our non-core area Barnett Shale properties in May 2011, partially offset by new oil and gas wells drilled in 2010.
DD&A expense for 2011 increased to $84.6 million ($11.26 per Boe ) from $47.0 million ($7.68 per Boe ) in 2010. The increases in DD&A and the related per Boe amounts were primarily due to the increase in crude oil reserves in the Eagle Ford that were added in 2011 which have a higher finding cost per equivalent unit than our natural gas reserves.
In June 2010, we concluded that it was uneconomical to pursue development on the license covering the Monterey field in the U.K. North Sea and terminated further development efforts resulting in a full-cost ceiling test impairment of $2.7 million ($1.7 million net of income taxes) for the year ended December 31, 2010 with respect to the U.K. cost center.
48
G&A expense for 2011 increased to $41.5 million from $35.9 million in 2010. The increase was due primarily to (a) increased compensation costs related to an increase in personnel in 2011 as compared to 2010, (b) the expense associated with contributions to University of Texas at Arlington, (c) increased office costs related to relocating our corporate headquarters in the fourth quarter of 2011 partially offset by (d) decreased stock-based compensation expense driven by a significant decrease in the fair value of SARs that we expect to be settled in cash due to a decrease in stock price during the second half of 2011, partially offset by higher stock-based compensation expense due to a higher number of stock-based compensation awards outstanding during 2011.
The net gain on derivative instruments of $48.4 million in 2011 consisted of a $13.0 million unrealized gain on derivatives and a $35.4 million realized gain on derivatives. The net gain on derivative instruments of $47.8 million in 2010 consisted of a $14.6 million unrealized gain on derivatives and a $33.2 million realized gain on derivatives.
In January 2011, in connection with our entrance into our current revolving credit facility, we terminated our prior credit facility. As a result, we recognized a non-cash, pre-tax loss on extinguishment of debt of $0.9 million representing the deferred financing costs attributable to the commitments of two banks in the prior credit facility who did not participate in the new revolving credit facility.
In November 2010, we completed a tender offer for $300.0 million aggregate principal amount outstanding of our convertible senior notes for an aggregate consideration of approximately $306.3 million, including accrued and unpaid interest on the convertible senior notes. We recognized a $31.0 million pre-tax loss on extinguishment of debt as a result of the purchase of the convertible senior notes in the tender offer, substantially all of which was non-cash representing the associated unamortized discount and deferred financing costs.
Interest expense and capitalized interest in 2011 were $51.0 million and $23.4 million, respectively, as compared to $43.3 million and $20.7 million in 2010, respectively. The net increase was primarily due to interest on the $400.0 million aggregate principal amount of 8.625% Senior Notes issued in the fourth quarter of 2010 and the $200.0 million aggregate principal amount of 8.625% Senior Notes issued in the fourth quarter of 2011 partially offset by decreased interest attributable to the $300.0 million aggregate principal amount of our convertible senior notes purchased in the tender offer during the fourth quarter of 2010. This increase was partially offset by increased capitalized interest due to higher levels of unproved properties during 2011.
Our effective income tax rate was 44.0% for 2011 and 36.3% for 2010. The increase in the effective income tax rate is primarily due to prior period adjustments to state income tax provisions recorded during the fourth quarter of 2011 and the income tax benefit of a capital loss associated with a prior investment.
Net income (loss) from discontinued operations, net of income taxes for 2011 increased to $4.1 million from a loss of $1.8 million in 2010. The increase is primarily related to income tax benefits recognized in 2011 while in 2010 we had a full-cost ceiling test impairment of $2.7 million.
Liquidity and Capital Resources
2013 Capital Expenditure Plan and Funding Strategy. For 2013 , our Board has approved a U.S. capital expenditure plan of $624.0 million which includes $500.0 million for drilling and completion (approximately $385.0 million for the Eagle Ford Shale, $70.0 million for the Marcellus Shale, $35.0 million for the Niobrara Formation, and $10.0 million in other areas) and $124.0 million for leasehold and seismic, after giving effect to carried interests. All 2013 capital expenditures for the Huntington Field development project in the U.K. North Sea were funded by our Huntington Facility and additional capital contributions by us, all of which were reimbursed by Iona Energy in connection with the sale and purchase transaction of Carrizo UK, which closed in February 2013. We intend to finance the remainder of our 2013 U.S. capital expenditure plan primarily from the sources described below under "-Sources and Uses of Cash." Our capital program could vary depending upon various factors, including the availability and cost of drilling rigs, land and industry partner issues, our available cash flow and financing, success of drilling programs, weather delays, commodity prices, market conditions, the acquisition of leases with drilling commitments and other factors.
Sources and Uses of Cash. Our primary use of cash is capital expenditures related to our drilling and development programs and, to a lesser extent, our lease and seismic data acquisition programs. For the year ended December 31, 2012 , capital expenditures, net of proceeds from asset sales exceeded our net cash provided by operations for continuing operations. During 2012 , we funded our capital expenditures with cash provided by operations, payments relating to our joint ventures with Reliance in the Marcellus Shale, Avista in the Utica Shale, GAIL in the Eagle Ford Shale, and the OIL JV Partners in the Niobrara Formation, net proceeds from the sale of assets, including the Atlas, Gulf Coast and Avista Utica divestures, the Haimo joint venture, net proceeds from the offering of our 7.50% Senior Notes, and borrowings under our revolving credit facility and the Huntington Facility. Potential sources of future liquidity include the following:
49
• | Cash on hand and cash generated by operations. Cash flows from operations are highly dependent on commodity prices and market conditions for oilfield services. We hedge a portion of our forecasted production to mitigate the risk of a decline in oil and gas prices. |
• | Borrowings under our revolving credit facility . At February 25, 2013 , we had no borrowings outstanding and $0.9 million in letters of credit outstanding under the revolving credit facility, which reduce the amounts available under our revolving credit facility. The amount we are able to borrow with respect to the borrowing base of the revolving credit facility, which borrowing base is currently $365.0 million, is subject to compliance with the financial covenants and other provisions of the credit agreement governing our revolving credit facility. |
• | Asset sales . In order to fund our U.S. capital expenditure plan, we may consider the sale of certain properties or assets that are not part of our core business or are no longer deemed essential to our future growth, provided we are able to sell such assets on terms that are acceptable to us. On April 30, 2012, we completed the sale of a significant portion of our Barnett Shale properties to Atlas for net proceeds of approximately $187.4 million. We used substantially all of the net proceeds from this sale to reduce the outstanding borrowings under our revolving credit facility. During the third quarter of 2012, we completed the sale of substantially all of our legacy producing properties along the onshore Gulf of Mexico located primarily in Texas and Louisiana for net proceeds of approximately $17.6 million. In October 2012, we sold substantially all of our interests in oil and gas properties dedicated to the Avista Utica joint venture that were located in the northern portion of the play to a third party for net cash proceeds of approximately $51.7 million, after final post-closing adjustments. The proceeds from all the sales described above were recognized as a reduction of proved oil and gas properties. On February 22, 2013 , we sold Carrizo UK, and all of its interest in the Huntington Field discovery, to Iona Energy for net proceeds of approximately $116.5 million, subject to final post-closing adjustments, which represents an agreed upon price of $184.0 million, including the assumption of $55.0 million in debt and net purchase price adjustments. |
• | Securities offerings . In September 2012, we issued $300.0 million in aggregate principal amount of our 7.50% Senior Notes in an underwritten public offering and received net proceeds of approximately $294.2 million. As situations or conditions arise, we may choose to issue debt, equity or other instruments to supplement our cash flows. However, we may not be able to obtain such financing on terms that are acceptable to us, or at all. |
• | Joint ventures . Joint ventures with third parties through which such third parties fund a portion of our exploration activities to earn an interest in our exploration acreage or purchase a portion of interests, or both, such as our joint ventures with Reliance in the Marcellus Shale in Pennsylvania, with Avista in the Utica Shale and other parts of the Marcellus Shale, with GAIL in the Eagle Ford Shale, and with an affiliate of Sumitomo Corporation in the Barnett Shale. Effective October 1, 2012, we completed the sale of 30% of substantially all of our interest in oil and gas properties in the Niobrara Formation to the OIL JV Partners. We received cash proceeds of approximately $41.25 million, subject to final post closing adjustments, and the OIL JV Partners committed to pay a "development carry" of 50% of certain of our future exploration and development costs up to an aggregate of approximately $41.25 million. We expect the development carry to be fully utilized by early 2014. In December 2012, we completed the sale of a portion of our remaining interest in the same oil and gas properties previously sold to the OIL JV Partners in the transaction described above to Haimo, effective October 1, 2012, for cash proceeds of approximately $27.5 million, subject to final post closing adjustments. The cash proceeds from such sales were recognized as a reduction of proved oil and gas properties. Following the close of the Haimo transaction late in the fourth quarter of 2012, we, the OIL JV Partners, and Haimo own 60%, 30% and 10% of the joint venture acreage, respectively.'' |
• | Lease purchase option arrangements . Lease option agreements and land banking arrangements, such as those we have entered into in the Barnett Shale and other plays. Please read "-Lease Purchase Option Arrangements". |
• | Other sources . We may consider sale/leaseback transactions of certain capital assets, such as our remaining pipelines and compressors, which are not part of our core oil and gas exploration and production business. |
Overview of Cash Flow Activities. Net cash provided by operating activities from continuing operations were $253.1 million and $155.5 million and $94.4 million for the years ended December 31, 2012, 2011 and 2010 , respectively. The increase was primarily due to increased crude oil production and oil prices, partially offset by lower gas prices in 2012 as compared to 2011. Net cash provided by operating activities from continuing operations increased in 2011 from 2010 due to increased production, particularly higher crude oil and condensate production in the Eagle Ford Shale and increased oil prices, partially offset by lower gas prices in 2011 as compared to 2010.
Net cash used in investing activities from continuing operations were $465.2 million, $250.1 million and $264.1 million for the years ended December 31, 2012, 2011 and 2010 , respectively. Net cash used in investing activities from continuing operations in 2012 related primarily to increased capital expenditures in our Eagle Ford Shale and Niobrara Formation as well as utilization of advances received for joint operations in 2011, partially offset by an increase in proceeds from the sale of oil and gas properties.
50
Net cash used in investing activities from continuing operations in 2011 related primarily to capital expenditures, partially offset by proceeds from the sale of our non-core area Barnett Shale properties to KKR, proceeds from the sale of an interest in certain of our Eagle Ford Shale properties to GAIL and cash distributions on our "B Units" interest in ACP II of $3.3 million. The decrease in investing activities from continuing operations in 2011 as compared to 2010 was due to higher proceeds from the sales of oil and gas properties and increase in advances for joint ventures, partially offset by increased capital expenditures during 2011.
Net cash provided by financing activities from continuing operations for the years ended December 31, 2012, 2011 and 2010 were $237.8 million, $116.8 million and $170.0 million, respectively. Net cash provided by financing activities from continuing operations for 2012 related primarily to net proceeds of $294.2 million from the issuance of $300.0 million aggregate principal amount of 7.50% Senior Notes in September 2012, partially offset by a decrease in net borrowings under the revolving credit facility during 2012 as compared to 2011. Net cash provided by financing activities from continuing operations in 2011 related primarily to net proceeds of $194.5 million from the issuance of an additional $200.0 million aggregate principal amount of 8.625% Senior Notes in November 2011, partially offset by repayment of borrowings outstanding under our revolving credit facility. The decrease in financing activities from continuing operations in 2011 as compared to 2010 was due the absence of common stock offerings and less debt issuance and borrowing during 2011.
Liquidity/Cash Flow Outlook
Economic downturns may adversely affect our ability to access capital markets in the future. We currently believe that cash provided by operating activities from continuing operations, the sale of assets (including our sale of the Huntington Field in the North Sea, which closed on February 22, 2013 ), carry resulting from our Niobrara joint venture transactions, borrowings under our revolving credit facility and our cash on hand will be sufficient to fund our immediate cash flow requirements. Cash provided by operating activities from continuing operations is primarily driven by production and commodity prices. While we have steadily increased production over the last few years, spot and futures prices of natural gas continue to remain depressed. To manage our exposure to commodity price risk and to provide a level of certainty in the cash flows that will support our capital expenditures program, we hedge a portion of our forecasted production and, as of February 25, 2013 , we had hedged approximately 18,250,000 MMBtu (50,000 MMBtu per day for the remainder of 2013 , which is approximately 57% of forecasted 2013 production) of our estimated March through December 2013 natural gas production at a weighted average floor or swap price of $4.63 per MMBtu relative to NYMEX prices. Additionally, we had hedged approximately 2,941,000 Bbls (8,058 Bbls per day for the remainder of 2013 , which is approximately 90% of forecasted 2013 production) of our estimated March through December 2013 crude oil production at a weighted average floor or swap price of $89.21 per Bbl relative to NYMEX prices. Our borrowing base under our revolving credit facility is currently $365.0 million. As of February 25, 2013 , we had no borrowings outstanding under our revolving credit facility and had issued $0.9 million in letters of credit, which reduce the amounts available under our revolving credit facility. As of February 25, 2013 , we had no borrowings outstanding under the Huntington Facility, which was repaid by Iona Energy upon consummation of the sale of the U.K. North Sea assets. Additionally, as described under "Sources and Uses of Cash" above, the amount we are able to borrow with respect to the borrowing base is subject to compliance with the financial covenants and other provisions of the credit agreement governing the revolving credit facility. The borrowing base under our revolving credit facility is affected by our lenders' assumptions with respect to future oil and gas prices. Our borrowing base may decrease if our lenders reduce their expectations with respect to future oil and gas prices from those assumptions used to determine our existing borrowing base. The next borrowing base redetermination is scheduled to occur during the second quarter of 2013.
If cash provided by operating activities from continuing operations, net proceeds from asset sales, funds available under our revolving credit facility and the other sources of cash described under "Sources and Uses of Cash" are insufficient to fund our 2013 capital expenditure plan, we may need to reduce our capital expenditure plan or seek other financing alternatives. We may not be able to obtain financing needed in the future on terms that would be acceptable to us, or at all. If we cannot obtain adequate financing, we may be required to limit or defer our planned 2013 capital expenditure plan, thereby adversely affecting the recoverability and ultimate value of our oil and gas properties. Subject in each case to then existing market conditions and to our then expected liquidity needs, among other factors, we may use a portion of our internally generated cash flows, proceeds from asset sales or borrowings or cash on hand to reduce debt prior to scheduled maturities through debt repurchases, either in the open market or in privately negotiated transactions, through debt redemptions or tender offers, or through repayments of bank borrowings.
51
Contractual Obligations
The following table sets forth estimates of our contractual obligations as of December 31, 2012 :
U.S. Contractual Obligations |
|
|
|
|
|
|
|
|
|
|
|
|
|
| ||||||||||||||
|
| Total |
| 2013 |
| 2014 |
| 2015 |
| 2016 |
| 2017 |
| 2018 and Beyond | ||||||||||||||
Long-term debt (1) |
| $ | 973,750 | |
| $ | - | |
| $ | - | |
| $ | - | |
| $ | 73,750 | |
| $ | - | |
| $ | 900,000 | |
Interest on long-term debt (2) |
| 510,561 | |
| 80,328 | |
| 80,328 | |
| 80,328 | |
| 76,077 | |
| 74,250 | |
| 119,250 | | |||||||
Operating leases |
| 12,969 | |
| 1,255 | |
| 1,419 | |
| 1,392 | |
| 1,370 | |
| 1,370 | |
| 6,163 | | |||||||
Drilling contracts |
| 103,056 | |
| 62,228 | |
| 30,532 | |
| 9,490 | |
| 806 | |
| - | |
| - | | |||||||
Pipeline volume commitments |
| 74,022 | |
| 17,429 | |
| 16,876 | |
| 16,333 | |
| 9,994 | |
| 4,041 | |
| 9,349 | | |||||||
Asset retirement obligations |
| 6,764 | |
| 1,670 | |
| 22 | |
| 8 | |
| - | |
| - | |
| 5,064 | | |||||||
Seismic commitments |
| 636 | |
| 636 | |
| - | |
| - | |
| - | |
| - | |
| - | | |||||||
Total U.S. Contractual Obligations |
| $ | 1,681,758 | |
| $ | 163,546 | |
| $ | 129,177 | |
| $ | 107,551 | |
| $ | 161,997 | |
| $ | 79,661 | |
| $ | 1,039,826 | |
U.K. Contractual Obligations - Discontinued Operations |
|
|
|
|
|
|
|
|
|
| ||||||||||||||||||
|
| Total |
| 2013 |
| 2014 |
| 2015 |
| 2016 |
| 2017 |
| 2018 and Beyond | ||||||||||||||
Debt (3) |
| $ | 52,000 | |
| $ | 33,800 | |
| $ | 18,200 | |
| $ | - | |
| $ | - | |
| $ | - | |
| $ | - | |
Interest on debt (4) |
| 1,675 | |
| 1,330 | |
| 345 | |
| - | |
| - | |
| - | |
| - | | |||||||
Asset retirement obligations |
| 5,243 | |
| - | |
| - | |
| - | |
| - | |
| - | |
| 5,243 | | |||||||
Other |
| 764 | |
| 660 | |
| 104 | |
| - | |
| - | |
| - | |
| - | | |||||||
Total U.K. Contractual Obligations |
| $ | 59,682 | |
| $ | 35,790 | |
| $ | 18,649 | |
| $ | - | |
| $ | - | |
| $ | - | |
| $ | 5,243 | |
(1) | Noteholders may require us to repurchase our convertible senior notes in June 2013, June 2018, or June 2023. We have the intent and ability to refinance our convertible senior notes on a long-term basis with the available capacity of our revolving credit facility, which matures in 2016, and accordingly, our convertible senior notes have been presented as a 2016 contractual obligation. |
(2) | Interest on long-term debt is based on the 8.625% Senior Notes, the 7.50% Senior Notes and the convertible senior notes until June 1, 2013 and our revolving credit facility rate of 3.87% thereafter (reflecting our intent and ability to refinance the convertible senior notes with the available capacity under our revolving credit facility). There were no borrowings under our revolving credit facility as of December 31, 2012 , therefore no interest was computed for our revolving credit facility as it relates to the table above. |
(3) | The Huntington Facility was repaid in full in connection with the sale to Iona Energy in February 2013. |
(4) | The December 31, 2012 average interest rate is 3.79% for the amounts outstanding under the Huntington Facility. |
Off Balance Sheet Arrangements
We currently do not have any off balance sheet arrangements.
Financing Arrangements
8.625% Senior Notes and 7.50% Senior Notes
As of December 31, 2012 , we had $600.0 million aggregate principal amount of 8.625% Senior Notes due 2018 issued and outstanding. The 8.625% Senior Notes are guaranteed by all of the our existing subsidiaries (other than Carrizo UK Huntington Ltd, Monument Exploration LLC, and Carrizo UK Bardolph Ltd).
The 8.625% Senior Notes mature on October 15, 2018, with interest payable semi-annually. Except in certain circumstances described below, we may not redeem the 8.625% Senior Notes prior to October 15, 2014. On and after October 15, 2014, we may redeem all or a part of the 8.625% Senior Notes, at redemption prices decreasing from 104.313% of the principal amount to 100% of the principal amount on October 15, 2017, plus accrued and unpaid interest. In connection with certain equity offerings by the Company, we may at any time prior to October 15, 2013, subject to certain conditions, on one or more occasions, redeem up to 35% of the aggregate principal amount of the 8.625% Senior Notes at a redemption price of 108.625% , of the principal amount, plus accrued and unpaid interest, if any, to the redemption date using the net cash proceeds of such equity offerings. Prior to October 15, 2014, we may redeem all or part of the 8.625% Senior Notes at 100% of the principal amount thereof, plus accrued and unpaid interest and a make whole premium (as defined in the Indenture governing the 8.625% Senior Notes). If a Change of Control (as defined in the indenture governing the 8.625% Senior Notes) occurs, we may be required by holders to repurchase the 8.625% Senior Notes for cash at a price equal to 101% of the aggregate principal amount, plus any accrued but unpaid interest.
52
On September 10, 2012, the Company issued in a public offering $300.0 million aggregate principal amount of 7.50% Senior Notes due 2020 that were issued and outstanding as of December 31, 2012 . The 7.50% Senior Notes are guaranteed by are guaranteed by the same subsidiaries that guarantee our 8.625% Senior Notes.
The 7.50% Senior Notes mature on September 15, 2020, with interest payable semi-annually. Except in certain circumstances described below, we may not redeem the 7.50% Senior Notes prior to September 15, 2016. On and after September 15, 2016, we may redeem all or a part of the 7.50% Senior Notes, at redemption prices decreasing from 103.750% of the principal amount to 100% of the principal amount on September 15, 2018, plus accrued and unpaid interest. In connection with certain equity offerings by the Company, we may at any time prior to September 15, 2015, subject to certain conditions, on one or more occasions, redeem up to 35% of the aggregate principal amount of the 7.50% Senior Notes at a redemption price of 107.500% , of the principal amount, plus accrued and unpaid interest, if any, to the redemption date using the net cash proceeds of such equity offerings. Prior to September 15, 2016, we may redeem all or part of the 7.50% Senior Notes at 100% of the principal amount thereof, plus accrued and unpaid interest and a make whole premium (as defined in the Indenture governing the 7.50% Senior Notes). If a Change of Control (as defined in the indenture governing the 7.50% Senior Notes) occurs, we may be required by holders to repurchase the 7.50% Senior Notes for cash at a price equal to 101% of the aggregate principal amount, plus any accrued but unpaid interest.
The indentures governing the 8.625% Senior Notes and the 7.50% Senior Notes contain covenants that, among other things, limit our ability and the ability of our restricted subsidiaries to: pay distributions on, purchase or redeem our common stock or other capital stock or redeem our subordinated debt; make investments; incur or guarantee additional indebtedness or issue certain types of equity securities; create certain liens; sell assets; consolidate, merge or transfer all or substantially all of our assets; enter into agreements that restrict distributions or other payments from our restricted subsidiaries to us; engage in transactions with affiliates; and create unrestricted subsidiaries.
The indentures governing the 8.625% Senior Notes and the 7.50% Senior Notes are subject to customary events of default, including those relating to failures to comply with the terms of the notes and the indentures, certain failures to file reports with the SEC, certain cross defaults of other indebtedness and mortgages and certain failures to pay final judgments.
Convertible Senior Notes
In May 2008, we issued $373.8 million aggregate principal amount of 4.375% Convertible Senior Notes due 2028. These notes are convertible, using a net share settlement process, into a combination of cash and common stock that entitles holders of our convertible senior notes to receive cash up to the principal amount ($1,000 per note) and common stock in respect of the remainder, if any, of our conversion obligation in excess of such principal amount. As of December 31, 2012 , $73.8 million aggregate principal amount of convertible senior notes was outstanding.The holders of our convertible senior notes may require us to repurchase the notes on June 1, 2013, 2018 and 2023, or upon a fundamental corporate change at a repurchase price in cash equal to 100% of the principal amount of the notes to be repurchased plus accrued and unpaid interest, if any. We may redeem notes at any time on or after June 1, 2013 at a redemption price equal to 100% of the principal amount of the notes to be redeemed plus accrued and unpaid interest, if any.
While the holders of the convertible senior notes may require us to repurchase such notes in June 2013, we have the intent and ability to refinance the convertible senior notes on a long-term basis with the available capacity of our revolving credit facility, and accordingly, the convertible senior notes have been classified as long-term debt in the consolidated balance sheets as of December 31, 2012.
For additional information on our convertible senior notes, please see "Note 7. Long-term Debt" of the Notes to our Consolidated Financial Statements included in "Item 8. Financial Statements and Supplementary Data," which information is incorporated herein by reference.
Senior Secured Revolving Credit Facility
We have a senior secured revolving credit facility that permits us to borrow up to the lesser of (i) the borrowing base (as defined in the credit agreement governing the revolving credit facility) and (ii) $750.0 million. The revolving credit facility matures on January 27, 2016. The revolving credit facility is secured by substantially all of our U.S. assets and is guaranteed by the same subsidiaries that guarantee our 8.625% Senior Notes, 7.50% Senior Notes and convertible senior notes. Any subsidiary of ours that does not currently guarantee our obligations under our revolving credit facility that subsequently becomes a material domestic subsidiary (as defined under our revolving credit facility) will be required to guarantee our obligations under our revolving credit facility.
The current borrowing base under the revolving credit facility is $365.0 million. The borrowing base will be redetermined by the lenders at least semi-annually on each May 1 and November 1, with the next redetermination expected on or about May 1, 2013 . The amount we are able to borrow with respect to the borrowing base is subject to compliance with the financial covenants and other provisions of the credit agreement governing the revolving credit facility.
53
If the outstanding principal balance of the revolving loans and the aggregate face amount of all letters of credit under the revolving credit facility exceeds the borrowing base at any time as a result of a redetermination of the borrowing base, we have the option within 30 days to take any of the following actions, either individually or in combination: make a lump sum payment curing the deficiency, deliver reserve engineering reports and mortgages covering additional oil and gas properties sufficient in the lenders' opinion to increase the borrowing base and cure the deficiency or begin making equal monthly principal payments that will cure the deficiency within the next six-month period. Upon certain adjustments to the borrowing base, we are required to make a lump sum payment in an amount equal to the amount by which the outstanding principal balance of the revolving loans and the aggregate face amount of all letters of credit under the revolving credit facility exceeds the borrowing base. Otherwise, any unpaid principal will be due at maturity.
The annual interest rate on each base rate borrowing is (a) the greatest of the Agent's Prime Rate, the Federal Funds Effective Rate plus 0.5% and the adjusted LIBO rate for a three-month interest period on such day plus 1.00%, plus (b) a margin between 1.00% and 2.00% (depending on the then-current level of borrowing base usage). The interest rate on each Eurodollar loan will be the adjusted LIBO rate for the applicable interest period plus a margin between 2.00% to 3.00% (depending on the then-current level of borrowing base usage).
We and our lenders amended the revolving credit facility three times in 2012. On March 26, 2012, the revolving credit facility was amended to, among other things, (1) extend by two quarters the dates on which the maximum ratio of Total Debt to EBITDA (each as defined in the credit agreement governing the revolving credit facility) steps down and (2) increase the basket available for redemptions of our convertible senior notes. On September 4, 2012 the revolving credit facility was amended to increase the basket available for issuances of additional senior notes, including those issued in the September 2012 notes offering. On September 27, 2012, the revolving credit facility was amended to, among other things, extend the maximum permitted duration of hedge agreements entered into by the Company and its restricted subsidiaries and to reflect the Fall 2012 borrowing base redetermination
We are subject to certain covenants under the terms of the revolving credit facility, as amended, which include, but are not limited to, the maintenance of the following financial covenants: (1) a ratio Total Debt to EBITDA of not more than (a) 4.25 to 1.00 for fiscal quarter ending December 31, 2012 and (b) 4.00 to 1.00 for fiscal quarters ending March 31, 2013 and thereafter; (2) a Current Ratio of not less than 1.00 to 1.00; (3) a ratio of Senior Debt to EBITDA of not more than 2.50 to 1.00; and (4) a ratio of EBITDA to Interest Expense of not less than 2.50 to 1.00 (each of the capitalized terms used in the foregoing clauses (1) through (4) being as defined in the credit agreement governing the revolving credit facility). At December 31, 2012 , the ratio of Total Debt to EBITDA was 2.97 to 1.00, the Current Ratio was 2.23 to 1.00, the ratio of Senior Debt to EBITDA was 0.00 to 1.00 and the EBITDA to Interest Expense ratio was 5.19 to 1.00. Total Debt and Senior Debt, as defined in the credit agreement governing the revolving credit facility, are net of cash and cash equivalents.
Our revolving credit facility also places restrictions on us and certain of our subsidiaries with respect to additional indebtedness, liens, dividends and other payments to shareholders, repurchases or redemptions of our common stock, redemptions of our senior notes, investments, acquisitions, mergers, asset dispositions, transactions with affiliates, hedging transactions and other matters.
Our revolving credit facility is subject to customary events of default, including a change in control (as defined in the credit agreement governing our revolving credit facility). If an event of default occurs and is continuing, the Majority Lenders (as defined in the credit agreement governing the revolving credit facility) may accelerate amounts due under the revolving credit facility (except for a bankruptcy event of default, in which case such amounts will automatically become due and payable).
At December 31, 2012 , we had no borrowings outstanding under the revolving credit facility. At December 31, 2012 , we had $0.9 million in letters of credit outstanding which reduced the amounts available under the revolving credit facility. Future availability under the $365.0 million borrowing base is subject to the terms and covenants of the revolving credit facility. The revolving credit facility is used to fund ongoing working capital needs and the remainder of our capital expenditure plan to the extent such amounts exceed the cash flow from operations, proceeds from the sale of oil and gas properties and securities offerings. The revolving credit facility may also be used to repurchase our convertible senior notes.
Huntington Field Development Project Credit Facility
On January 28, 2011, we and Carrizo UK, as borrower, entered into the Huntington Facility. The Huntington Facility was secured by substantially all of Carrizo UK's assets and was limited recourse to us. The Huntington Facility provided financing for a substantial portion of Carrizo UK's share of costs associated with the Huntington Field development project in the U.K. North Sea.
54
The sale of Carrizo UK, and all of its interest in the Huntington Field discovery, closed on February 22, 2013 .. The Huntington facility that was secured b y substantially all of Carrizo UK's assets with limited recourse to us was repaid by Iona Energy in connection with the close of the sales transaction. As of December 31, 2012 and February 22, 2013 , borrowings outstanding under the Huntington Facility were $52.0 million and $55.0 million, respectively. As of December 31, 2012 , $33.8 million of the borrowings outstanding were classified as current, with a weighted average interest rate of 3.79% and no letters of credit had been issued.
Securities Offerings in 2012 , 2011 and 2010
In September 2012, we issued in a public offering $300.0 million aggregate principal amount of 7.50% Senior Notes. We used the net proceeds of approximately $294.2 million after deducting the underwriters' discount and our estimated expenses to repay borrowings outstanding under our revolving credit facility. Holders of all $300.0 million aggregate principal amount of 7.50% Senior Notes will vote as one series under the indenture governing the 7.50% Senior Notes.
In November 2011, we issued $200.0 million aggregate principal amount of 8.625% Senior Notes in a private placement exempt from the registration requirements of the Securities Act of 1933, as amended. We used the net proceeds of approximately $194.5 million after deducting initial purchasers' discounts and our estimated expenses, to repay a substantial portion of the borrowings then outstanding under our revolving credit facility. In February 2012, we completed an exchange offer and issued new notes and guarantees having substantially identical terms, but registered with the SEC, in exchange for all such privately issued 8.625% Senior Notes. The $200.0 million of 8.625% Senior Notes issued in November 2011 have substantially identical terms as, and are treated as a single series with, the $400.0 million of 8.625% Senior Notes described below.
In November 2010, we issued $400.0 million aggregate principal amount of 8.625% Senior Notes in a private placement exempt from the registration requirements of the Securities Act. We used the net proceeds of approximately $387.5 million after deducting initial purchasers' discounts and our estimated expenses, to repay initially in full borrowings outstanding under our prior credit facility and held the remaining net proceeds in short-term investments. We subsequently purchased the $300.0 million of convertible senior notes in the tender offer with a combination of cash on hand and borrowings under our prior credit facility. In June 2011, we completed an exchange offer and issued new notes and guarantees having substantially identical terms, but registered with the SEC, in exchange for all such privately issued 8.625% Senior Notes.
In December 2010, we sold 3.975 million shares of our common stock in an underwritten public offering at a price to the underwriter of $28.90 per share. We used the net proceeds of approximately $114.9 million to repay a portion of the outstanding borrowings under our prior credit facility.
In April 2010, we sold 3.22 million shares of our common stock in an underwritten public offering at a price to the underwriter of $23.00 per share. We used the net proceeds of approximately $73.8 million to repay a portion of the then-outstanding borrowings under a prior credit facility.
Lease Purchase Option Arrangements
From time to time, we have entered into lease purchase option arrangements with third parties. In 2011, we utilized one lease purchase option arrangement described below with an unrelated third party. Strategically, such leasing arrangements have allowed us to temporarily control important acreage positions during periods that we have lacked sufficient capital to directly acquire such oil and gas leases. We may continue to use these arrangements as a strategic alternative in the future.
On November 24, 2009 , we entered into a land agreement pursuant to which the Company was able to acquire up to $20.0 million of oil, gas and mineral interests or leases in certain specified areas in the Barnett Shale from an unrelated third party and its affiliate. The land agreement expired by its terms on May 31, 2011 . In consideration of our receipt of an option to purchase the leases acquired by the third party (as described below), we issued to the third party's affiliate warrants to purchase a certain number of shares of our common. See "Item 5. Market for Registrant's Common Stock, Related Shareholder Matters and Issuer Purchases of Equity Securities" for additional information about these warrants, including their conversion price.
Effects of Inflation and Changes in Price
Our results of operations and cash flows are affected by changing oil and gas prices. Although natural gas prices have significantly declined since mid-2008 and the price of natural gas remains depressed, our revenue per unit of production increased in 2012 as a result of increased crude oil production and oil prices. Historically, inflation has had a minimal effect on us. However, with interest rates at historic lows and the government attempting to stimulate the economy through rapid expansion of the money supply in recent years, inflation could become a significant issue in the future.
55
Summary of Critical Accounting Policies
The following summarizes our critical accounting policies. See a complete list of significant accounting policies in "Note 2. Summary of Significant Accounting Policies" of the Notes to our Consolidated Financial Statements.
Use of Estimates
The preparation of financial statements in conformity with U.S. generally accepted accounting principles requires management to make estimates and assumptions that affect the reported amounts of assets and liabilities and disclosures of contingent assets and liabilities at the date of the financial statements and the reported amounts of revenues and expenses during the periods reported. Actual results could differ from these estimates. We evaluate subsequent events through the date the financial statements are issued.
Significant estimates include volumes of proved oil and gas reserves which are used in calculating the amortization of proved oil and gas property costs, the present value of future net revenues included in the full cost ceiling test, estimates of future taxable income used in assessing the realizability of deferred tax assets, and asset retirement obligations. Other significant estimates include the, impairment of unproved properties, fair values of derivative instruments, stock-based compensation, the collectability of outstanding receivables, and contingencies. Proved oil and gas reserve estimates have numerous inherent uncertainties. The accuracy of any reserve estimate is a function of the quality and quantity of available data and the application of engineering and geological interpretation and judgment to available data. Subsequent drilling results, testing and production may justify revisions of such estimates. Accordingly, proved oil and gas reserve estimates are often different from the quantities of oil and gas that are ultimately recovered. In addition, proved oil and gas reserve estimates are vulnerable to changes in market prices of oil and gas. Such prices have been volatile in the past and can be expected to be volatile in the future.
Estimates are based on current assumptions that may be materially affected by changes to future economic conditions such as the market prices of oil and gas, the credit worthiness of counterparties, interest rates and the market value and volatility of our common stock. Future changes in these assumptions may affect these significant estimates materially in the near term.
Discontinued Operations
On December 27, 2012, we agreed to sell Carrizo UK, a wholly owned subsidiary of the Company, and all of its interest in the Huntington Field discovery, where Carrizo UK owned a 15% non-operated working interest and certain overriding royalty interests. The sale closed on February 22, 2013. We classified all our U.K. North Sea assets and associated liabilities as current and long-term assets held for sale and current and long-term liabilities associated with assets held for sale in our consolidated balance sheets along with the related results of the operations and cash flows as discontinued operations, net of income taxes, in our consolidated statements of income, statements of cash flows and condensed consolidating financial information. Unless otherwise indicated, the information included relates to our continuing operations. Information related to assets held for sale and discontinued operations is included in "Note 3. Assets Held for Sale and Discontinued Operations", "Note 14. Condensed Consolidating Financial Information" and "Note 15. Supplemental Disclosures about Oil and Gas Producing Activities (Unaudited)" of the Notes to our Consolidated Financial Statements.
Oil and Gas Properties
Oil and gas properties are accounted for using the full cost method of accounting under which all productive and nonproductive costs directly associated with property acquisition, exploration and development activities are capitalized to costs centers established on a country-by-country basis. Internal costs directly identified with acquisition, exploration and development activities are capitalized and totaled $11.8 million , $9.6 million and $5.3 million for the years ended December 31, 2012, 2011 and 2010 , respectively. Costs related to production, general corporate overhead or similar activities are expensed as incurred.
Capitalized oil and gas property costs within a cost center are amortized on an equivalent unit-of-production method, converting oil and natural gas liquids to gas equivalents at the ratio of one barrel of oil or natural gas liquids to six thousand cubic feet of gas, which represents their approximate relative energy content. The equivalent unit-of-production rate is computed on a quarterly basis by dividing production by proved oil and gas reserves at the beginning of the quarter which is applied to capitalized oil and gas property costs, which includes estimated asset retirement costs, less accumulated amortization, plus the estimated future expenditures (based on current costs) to be incurred in developing proved reserves, net of estimated salvage values. Average DD&A per Boe was $17.55 , $11.26 and $7.67 for the years ended December 31, 2012, 2011 and 2010 , respectively.
Costs not subject to amortization include unevaluated leasehold and seismic costs associated with specific unevaluated properties, the cost of exploratory wells in progress, and related capitalized interest. Significant costs are assessed individually on a quarterly basis to determine whether or not and to what extent proved reserves have been assigned to the properties or if an impairment has occurred, in which case the related costs are added to the oil and gas property costs subject to amortization. Factors
56
we consider in our impairment assessment include drilling results by us and other operators, the terms of oil and gas leases not held by production and drilling capital expenditure plans. We expect to complete the evaluation of the majority of our unproved properties within the next two to five years. Insignificant costs are grouped by major area and added to the oil and gas property costs subject to amortization based on the average primary lease terms of the properties. We capitalized interest costs associated with our unevaluated leasehold and seismic costs and exploratory wells in progress of $24.8 million , $23.4 million and $20.7 million for the years ended December 31, 2012, 2011 and 2010 , respectively. Interest is capitalized using a weighted-average interest rate based on outstanding borrowings.
Proceeds from the sale of oil and gas properties are accounted for as reductions of capitalized costs with no gain or loss recognized, unless the sale significantly alters the relationship between capitalized costs and proved reserves of oil and gas attributable to a cost center. Through December 31, 2012, we have not had any sales of oil and gas properties that significantly alter that relationship.
Capitalized costs, less accumulated amortization and related deferred income taxes, are limited to the "cost center ceiling" equal to (1) the sum of (A) the present value of estimated future net revenues from proved oil and gas reserves, less estimated future expenditures to be incurred in developing and producing the proved reserves computed using a discount factor of 10%, (B) the costs of properties not subject to amortization, and (C) the lower of cost or estimated fair value of unproved properties included in the costs being amortized; less (2) related income tax effects. If the net capitalized costs exceed the cost center ceiling, the excess is recognized as an impairment of oil and gas properties. An impairment recognized in one period may not be reversed in a subsequent period even if higher oil and gas prices increase the cost center ceiling applicable to the subsequent period.
The table below presents results of the U.S. full cost ceiling test along with various pricing scenarios to demonstrate the sensitivity of our U.S. cost center ceiling to changes in 12 month average oil and gas prices. The prices included represent the unweighted average realized market prices on the first calendar day of each month during the 12-month period ended December 31, 2012 . This sensitivity analysis is as of December 31, 2012 and, accordingly, does not consider drilling results, production and prices subsequent to December 31, 2012 that may require revisions to our proved reserve estimates.
| 12 Month Average | Cushion/(Impairment) | |
U.S. Full Cost Pool Scenarios | Oil Price ($/Bbl) | Gas Price ($/Mcf) | (in millions) |
December 31, 2012 Actual | $101.35 | $1.95 | $191 |
|
|
|
|
Oil and Gas Price Sensitivity |
|
|
|
Oil and Gas +10% | $110.81 | $2.23 | $344 |
Oil and Gas -10% | $91.90 | $1.68 | $14 |
|
|
|
|
Oil Price Sensitivity |
|
|
|
Oil +10% | $110.81 | $1.95 | $313 |
Oil -10% | $91.90 | $1.95 | $64 |
|
|
|
|
Gas Price Sensitivity |
|
|
|
Gas +10% | $101.35 | $2.23 | $222 |
Gas -10% | $101.35 | $1.68 | $160 |
The cost center ceiling exceeded our net capitalized costs for the U.K. cost center at December 31, 2012 by approximately $135.8 million and was based on crude oil and condensate prices of $111.21 per barrel and natural gas prices of $13.32 per Mcf, representing the unweighted average realized market prices on the first calendar day of each month during the 12-month period ended December 31, 2012 . A ten percent increase in average market prices at December 31, 2012 would have increased the cost center ceiling by approximately $20.4 million and a ten percent decrease in average market prices would have decreased the cost center ceiling by approximately $18.5 million. This sensitivity analysis is as of December 31, 2012 and, accordingly, does not consider drilling results, production and prices subsequent to December 31, 2012 that may require revisions of proved reserve estimates.
57
The cost center ceiling exceeded our net capitalized costs for the U.S. cost center at December 31, 2011 by approximately $202.6 million and was based on crude oil and condensate prices of $92.76 per barrel, natural gas liquids prices of $44.90 per barrel and natural gas prices of $3.21 per Mcf, representing the unweighted average realized market prices on the first calendar day of each month during the 12-month period ended December 31, 2011. A ten percent increase in average market prices at December 31, 2011 would have increased the cost center ceiling by approximately $163.4 million and a ten percent decrease in average market prices would have caused an impairment of approximately $24.4 million. This sensitivity analysis is as of December 31, 2011 and, accordingly, does not consider drilling results, production and prices subsequent to December 31, 2011 that may require revisions of proved reserve estimates.
The cost center ceiling exceeded our net capitalized costs for the U.K. cost center at December 31, 2011 by approximately $124.5 million and was based on crude oil and condensate prices of $106.90 per barrel and natural gas prices of $7.54 per Mcf, representing the unweighted average realized market prices on the first calendar day of each month during the 12-month period ended December 31, 2011. A ten percent increase in average market prices at December 31, 2011 would have increased the cost center ceiling by approximately $19.0 million and a ten percent decrease in average market prices would have decreased the cost center ceiling by approximately $19.0 million. This sensitivity analysis is as of December 31, 2011 and, accordingly, does not consider drilling results, production and prices subsequent to December 31, 2011 that may require revisions of proved reserve estimates.
We have a significant amount of proved undeveloped reserves. We had 62.5 MMBoe , 79.9 MMBoe and 73.0 MMBoe of proved undeveloped reserves, representing 52% , 51% and 52% of our total proved reserves at December 31, 2012 , 2011 and 2010 , respectively. Approximately 34.5 MMBoe , or 55%, and 22.5 MMBoe , or 36%, of our proved undeveloped reserves at December 31, 2012 , are attributable to the Eagle Ford Shale and Barnett Shale, respectively. We currently expect to drill wells associated with these undeveloped reserves within the next five years.
Because our depletion rate is based on the ratio of production to total proved reserves, we expect our relatively low historical depletion rate to continue until the level of undeveloped reserves in relation to total proved reserves is reduced through the development of existing undeveloped reserves or the significant addition of proved developed reserves through acquisition or exploration. If our level of total proved reserves and future development costs were to remain constant and average market prices were to decline, a lower depletion rate would result in an impairment of oil and gas properties earlier or to a larger extent than would a higher depletion rate.
Oil and Gas Reserve Estimates
Over 99% of the proved oil and gas reserve estimates as of December 31, 2012 included in this document have been prepared by Ryder Scott Company Petroleum Engineers and LaRoche Petroleum Consultants, Ltd., independent third party reserve engineers. Reserve engineering is a subjective process of estimating underground accumulations of hydrocarbons that cannot be measured in an exact manner. The process relies on judgment and the interpretation of available geologic, geophysical, engineering and production data. The extent, quality and reliability of this data can vary. The process also requires assumptions regarding drilling and operating costs, taxes and availability of funds. The oil and gas reserve estimation and disclosure requirements mandate certain of these assumptions such as existing economic and operating conditions, average oil and gas prices and the discount rate.
Proved oil and gas reserve estimates prepared by others may be substantially higher or lower than our estimates. Significant assumptions used by the independent third party reserve engineers are assessed by our internal reserve team. All reserve reports prepared by the independent third party reserve engineers are reviewed by our senior management team, including the Chief Executive Officer and Chief Operating Officer. Because these estimates depend on many assumptions, all of which may differ from actual results, reserve quantities actually recovered may be significantly different than estimated. Material revisions to reserve estimates may be made depending on the results of drilling, testing, and production.
You should not assume that the present value of future net cash flows is the current market value of our estimated proved oil and gas reserves. In accordance with the oil and gas reserve estimation and disclosure requirements, the discounted future net cash flows from proved reserves are based on the unweighted average of the first day of the month price for each month in the previous twelve-month period, using current costs and a 10% discount rate.
Our depletion rate depends on our estimate of total proved reserves. If our estimates of total proved reserves increased or decreased, the depletion rate and therefore DD&A expense would decrease or increase, respectively. A 10% increase or decrease in our estimates of total proved reserves at December 31, 2012 , would have decreased or increased our DD&A expense by approximately 8.9% or 10.9%, respectively, for the fourth quarter of 2012 .
Derivative Instruments
We use derivative instruments, typically fixed-rate swaps, costless collars, puts, calls and basis differential swaps, to manage commodity price risk associated with a portion of our forecasted oil and gas production. Derivative instruments are recognized at
58
their current fair value as assets or liabilities in the consolidated balance sheets. Although the derivative instruments provide an economic hedge of our exposure to commodity price risk associated with oil and gas production, because we elect not to meet the criteria to qualify our derivative instruments for hedge accounting treatment, unrealized gains and losses as a result of changes in the fair value of derivative instruments are recognized as gain (loss) on derivative instruments, net in the consolidated statements of income. Realized gains and losses as a result of cash settlements with counterparties to our derivative instruments are also recorded as gain (loss) on derivative instruments, net in the consolidated statements of income. We offset fair value amounts recognized for derivative instruments executed with the same counterparty and subject to master netting agreements.
Our Board of Directors establishes risk management policies and reviews derivative instruments, including volumes, types of instruments and counterparties, on a quarterly basis. These policies require that derivative instruments be executed only by the President or Chief Financial Officer after consultation with and concurrence by the President, Chief Financial Officer and Chairman of the Board. The master contracts with approved counterparties identify the President and Chief Financial Officer as the only Company representatives authorized to execute trades.
Income Taxes
Deferred income taxes are recognized at each reporting period for the future tax consequences of differences between the tax bases of assets and liabilities and their financial reporting amounts based on tax laws and statutory tax rates applicable to the periods in which the differences are expected to affect taxable income. We routinely assess the realizability of our deferred tax assets and consider our estimate of future taxable income based on production of proved reserves at estimated future pricing in making such assessments. If we conclude that it is more likely than not that some portion or all of the deferred tax assets will not be realized, the deferred tax assets are reduced by a valuation allowance. We classify interest and penalties associated with income taxes as interest expense.
Commitments and Contingencies
Liabilities are recognized for contingencies when (i) it is both probable that an asset has been impaired or that a liability has been incurred and (ii) that the amount of such loss is reasonably estimable.
Volatility of Oil and Gas Prices
Our revenues, future rate of growth, results of operations, financial position and ability to borrow funds or obtain additional capital are substantially dependent upon prevailing prices of oil and gas.
We review the carrying value of our oil and gas properties on a quarterly basis using the full cost method of accounting. See " -Summary of Critical Accounting Policies-Oil and Gas Properties."
We use various types of derivative instruments to manage our exposure to commodity price risk and to provide a level of certainty in our forward cash flows supporting our capital expenditure program. The derivative instruments typically used are fixed-rate swaps, costless collars, puts, calls and basis differential swaps. Under these derivative instruments, payments are received or made based on the differential between a fixed and a variable product price. These agreements are settled in cash at termination, expiration or exchanged for physical delivery contracts. Our current long-term strategy is to manage exposure for a substantial, but varying, portion of forecasted production up to 60 months. The derivative instruments are carried at fair value in the consolidated balance sheets, with changes in fair value recognized as gain (loss) on derivative instruments, net in the consolidated statements of income for the period in which the changes occur.
The fair value of derivative instruments at December 31, 2012 and 2011 was a net asset of $29.2 million and $37.5 million , respectively. The following sets forth a summary of the net fair value of our derivative instruments by counterparty:
Counterparty |
| December 31, 2012 |
| December 31, 2011 | ||
Credit Suisse |
| 40 | % |
| 68 | % |
BNP Paribas |
| 33 | % |
| 19 | % |
Societe Generale |
| 22 | % |
| 2 | % |
BBVA Compass |
| 3 | % |
| - | % |
Wells Fargo |
| 2 | % |
| - | % |
Shell Energy North America (US) LP |
| - | % |
| 6 | % |
Credit Agricole |
| - | % |
| 5 | % |
Total |
| 100 | % |
| 100 | % |
59
Master netting agreements are in place with each of these counterparties. Because the counterparties are either investment grade financial institutions or an investment grade international oil and gas company, we believe we have minimal credit risk and accordingly do not currently require our counterparties to post collateral to support the asset positions of our derivative instruments. As such, we are exposed to credit risk to the extent of nonperformance by the counterparties to our derivative instruments. Although we do not currently anticipate such nonperformance, we continue to monitor the financial viability of our counterparties. Because Credit Suisse, Credit Agricole, BBVA Compass, Wells Fargo, and Societe Generale are lenders under our revolving credit facility, we are not required to post collateral with respect to derivative instruments in a net liability position with these counterparties, as the contracts are secured by our revolving credit facility.
The following sets forth a summary of our U.S. natural gas derivative positions at average NYMEX prices as of December 31, 2012 .
Period |
| Volume (in MMBtu) |
| Weighted Average Floor Price ($/MMBtu) |
| Weighted Average Ceiling Price ($/MMBtu) | ||||
2013 |
| 18,250,000 |
| $ | 4.63 | |
| $ | 4.63 | |
2014 |
| 3,650,000 |
| $ | - | |
| $ | 5.50 | |
The following sets forth a summary of our U.S. crude oil derivative positions at average NYMEX prices as of December 31, 2012 .
Period |
| Volume (in Bbls) |
| Weighted Average Floor Price ($/Bbls) |
| Weighted Average Ceiling Price ($/Bbls) | |||||
2013 |
| 2,774,000 | |
| $ | 88.91 | |
| $ | 102.43 | |
2014 |
| 2,555,000 | |
| $ | 90.06 | |
| $ | 98.51 | |
2015 |
| 1,441,750 | |
| $ | 89.54 | |
| $ | 96.49 | |
2016 |
| 244,000 | |
| $ | 85.00 | |
| $ | 104.00 | |
In connection with the crude oil derivative instruments above, we entered into protective put spreads. For 2014 , at market prices below the short put price of $65.00 , the floor price becomes the market price plus the put spread of $20.00 on 182,500 of the 2,555,000 Bbls and the remaining 2,372,500 Bbls would have a floor price of $90.06 .
Period |
| Volume (in Bbls) |
| Weighted Average Short Put Price ($/Bbls) |
| Weighted Average Put Spread ($/Bbls) | |||||
2014 |
| 182,500 | |
| $ | 65.00 | |
| $ | 20.00 | |
2015 |
| 365,000 | |
| $ | 65.00 | |
| $ | 20.00 | |
2016 |
| 244,000 | |
| $ | 65.00 | |
| $ | 20.00 | |
For the years ended December 31, 2012 , 2011 and 2010 , we recorded the following related to our oil and gas derivative instruments:
|
| Year Ended December 31, | ||||||||||
|
| 2012 |
| 2011 |
| 2010 | ||||||
|
| (In thousands) | ||||||||||
Realized gain (loss) on derivative instruments, net |
| $ | 41,122 | |
| $ | 35,452 | |
| $ | 33,218 | |
Unrealized gain (loss) on derivative instruments, net |
| (9,751 | ) |
| 12,971 | |
| 14,564 | | |||
Gain (loss) on derivative instruments, net |
| $ | 31,371 | |
| $ | 48,423 | |
| $ | 47,782 | |
Item 7A. Qualitative and Quantitative Disclosures about Market Risk
Commodity Risk
Our primary market risk exposure is the commodity pricing applicable to our oil and gas production. The prices we realize on the sale of such production are primarily driven by the prevailing worldwide price for oil and spot prices of natural gas. The effects of such pricing volatility have been discussed above, and such volatility is expected to continue. A 10% fluctuation in the
60
price received for oil and gas production would have an approximate $35.8 million impact on our revenues for the year ended December 31, 2012 .
We use various types of derivative instruments to manage our exposure to commodity price risk and to provide a level of certainty in our forward cash flows supporting our capital expenditure program. The derivative instruments we typically use include fixed-rate swaps, costless collars, puts, calls and basis differential swaps. Our current long-term strategy is to manage exposure for a substantial, but varying, portion of forecasted production up to 60 months. We do not hold or issue derivative instruments for trading purposes. We recorded gains on derivative instruments, net of $31.4 million , $48.4 million and $47.8 million for the years ended December 31, 2012 , 2011 , and 2010 , respectively.
Financial Instruments and Debt Maturities
In addition to our derivative instruments, our other financial instruments include cash and cash equivalents, receivables, payables and long-term debt. The carrying amounts of cash and cash equivalents, receivables, and payables approximate fair value due to the highly liquid or short-term nature of these instruments. The fair values of borrowings under our revolving credit facility approximate the carrying amounts as of December 31, 2012 , and were based upon interest rates currently available to us for borrowings with similar terms. The fair values of our convertible senior notes, 8.625% Senior Notes, and 7.50% Senior Notes at December 31, 2012 were estimated at approximately $73.8 million , $645.0 million , and $308.3 million , respectively, and were based on quoted market prices. As of December 31, 2012 , scheduled maturities of long-term debt are $595.2 million in 2018 and $300.0 million in 2020.
Item 8. Financial Statements and Supplementary Data
The financial statements and information required by this Item appears on pages F-1 through F-40 of this Annual Report on Form 10-K.
Item 9. Changes In and Disagreements With Accountants on Accounting and Financial Disclosures
None.
Item 9A. Controls and Procedures
(a) Disclosure Controls and Procedures
We maintain disclosure controls and procedures that are designed to provide reasonable assurance that information required to be disclosed by us in the reports that we file or submit to the Securities and Exchange Commission (the "SEC") under the Securities Exchange Act of 1934, as amended (the "Exchange Act"), is recorded, processed, summarized and reported within the time periods specified by the SEC's rules and forms, and that information is accumulated and communicated to our management, including our Chief Executive Officer and Chief Financial Officer, as appropriate to allow timely decisions regarding required disclosure.
In accordance with Rules 13a-15(b) and 15d-15(b) under the Exchange Act, we carried out an evaluation, under the supervision and with the participation of management, including our Chief Executive Officer and Chief Financial Officer, of the effectiveness of our disclosure controls and procedures (as defined by Rules 13a-15(e) and 15d-15(e) under the Exchange Act) as of the end of the period covered by this Annual Report on Form 10-K. As described below under paragraph (b) within Management's Annual Report on Internal Control over Financial Reporting, our Chief Executive Officer and Chief Financial Officer have concluded that, as of the end of the period covered by this Annual Report on Form 10-K, our disclosure controls and procedures were effective to provide reasonable assurance that information required to be disclosed by us in the reports that we file or submit to the SEC under the Exchange Act is recorded, processed, summarized and reported within the time periods specified by the SEC's rules and forms and that such information is accumulated and communicated to our management, including our Chief Executive Officer and Chief Financial Officer, as appropriate to allow timely decisions regarding required disclosure.
The audit report of KPMG, LLP, which is included in this Annual Report on Form 10-K, expressed an unqualified opinion on our consolidated financial statements.
(b) Management's Annual Report on Internal Control over Financial Reporting
Our management is responsible for establishing and maintaining adequate internal control over financial reporting as defined in Rules 13a-15(f) and 15d-15(f) under the Exchange Act. Our internal control over financial reporting is designed to provide reasonable assurance regarding the reliability of financial reporting and the preparation of financial statements for external purposes in accordance with generally accepted accounting principles. Our internal control over financial reporting includes those policies and procedures that:
61
• | pertain to the maintenance of records that, in reasonable detail, accurately and fairly reflect our transactions and dispositions of our assets; |
• | provide reasonable assurance that transactions are recorded as necessary to permit preparation of financial statements in accordance with generally accepted accounting principles, and that our receipts and expenditures are being made only in accordance with authorizations of our management and directors; and |
• | provide reasonable assurance regarding prevention or timely detection of unauthorized acquisition, use, or disposition of our assets that could have a material effect on the financial statements. |
While "reasonable assurance" is a high level of assurance, it does not mean absolute assurance. Because of its inherent limitations, internal control over financial reporting may not prevent or detect every misstatement and instance of fraud. Controls are susceptible to manipulation, especially in instances of fraud caused by collusion of two or more people, including our senior management. Also, projections of any evaluation of effectiveness to future periods are subject to the risk that controls may become inadequate because of changes in conditions, or that the degree of compliance with the policies or procedures may deteriorate.
Under the supervision and with the participation of our Chief Executive Officer and Chief Financial Officer, our management conducted an evaluation of the effectiveness of our internal control over financial reporting as of December 31, 2012 . In making this evaluation, management used the Internal Control – Integrated Framework issued by the Committee of Sponsoring Organizations of the Treadway Commission ("COSO"). Based on the results of our evaluation, our management concluded that our internal control over financial reporting was effective as of December 31, 2012 .
KPMG LLP, our independent registered public accounting firm that audited our consolidated financial statements, has also issued its own attestation report on the effectiveness of our internal control over financial reporting as of December 31, 2012 , which is filed with this Annual Report on Form 10-K.
(c) Changes in Internal Control over Financial Reporting
There have not been any changes in our internal control over financial reporting during the fiscal quarter ended December 31, 2012 that have materially affected, or are reasonably likely to materially affect, our internal control over financial reporting.
Item 9B. Other Information
None.
62
PART III
Item 10. Directors, Executive Officers and Corporate Governance
The information required by this item is incorporated herein by reference to our definitive Proxy Statement (the "2013 Proxy Statement") for our 2013 annual meeting of shareholders. The 2013 Proxy Statement will be filed with the SEC not later than 120 days subsequent to December 31, 2012 .
Item 11. Executive Compensation
The information required by this item is incorporated herein by reference to the 2013 Proxy Statement, which will be filed with the SEC not later than 120 days subsequent to December 31, 2012 .
Item 12. Security Ownership of Certain Beneficial Owners and Management and Related Shareholder Matters
The information required by this item is incorporated herein by reference to the 2013 Proxy Statement, which will be filed with the SEC not later than 120 days subsequent to December 31, 2012 .
Item 13. Certain Relationships and Related Transactions, and Director Independence
The information required by this item is incorporated herein by reference to the 2013 Proxy Statement, which will be filed with the SEC not later than 120 days subsequent to December 31, 2012 .
Item 14. Principal Accountant Fees and Services
The information required by this item is incorporated herein by reference to the 2013 Proxy Statement, which will be filed with the SEC not later than 120 days subsequent to December 31, 2012 .
63
PART IV
Item 15. Exhibits and Financial Statement Schedules
(a)(1) Financial Statements
The response to this item is submitted in a separate section of this Annual Report on Form 10-K.
(a)(2) Financial Statement Schedules
None.
(a)(3) Exhibits
EXHIBIT INDEX
Exhibit Number |
| Description |
†2.1 | - | Purchase and Sale Agreement, dated as of March 15, 2012, among ARP Barnett, LLC and Carrizo Oil & Gas, Inc., CLLR, Inc., Hondo Pipeline, Inc. and Mescalero Pipeline, Inc. (incorporated herein by reference to Exhibit 2.1 to the Company's Current Report on Form 8-K filed on May 2, 2012). |
†3.1 | - | Amended and Restated Articles of Incorporation of the Company (incorporated herein by reference to Exhibit 3.1 to the Company's Annual Report on Form 10-K for the year ended December 31, 1997). |
†3.2 | - | Articles of Amendment to Amended and Restated Articles of Incorporation (incorporated herein by reference to Exhibit 3.1 to the Company's Current Report on Form 8-K filed on June 25, 2008). |
†3.3 | - | Amended and Restated Bylaws of the Company (incorporated herein by reference to Exhibit 3.1 to the Company's Current Report on Form 8-K filed on January 3, 2008). |
†4.1 | - | Indenture among Carrizo Oil & Gas, Inc., the subsidiaries named therein and Wells Fargo Bank, National Association, as trustee, dated May 28, 2008 (incorporated herein by reference to Exhibit 4.1 to the Company's Current Report on Form 8-K filed on May 28, 2008). |
†4.2 | - | First Supplemental Indenture dated May 28, 2008 between Carrizo Oil & Gas, Inc. and Wells Fargo Bank, National Association, as trustee (incorporated herein by reference to Exhibit 4.2 to the Company's Current Report on Form 8-K filed on May 28, 2008). |
†4.3 | - | Second Supplemental Indenture dated May 14, 2009 among Carrizo Oil & Gas, Inc., the subsidiaries named therein and Wells Fargo Bank, National Association, as trustee (incorporated herein by reference to Exhibit 4.21 to the Company's Registration Statement on Form S-3 (Registration No. 333-159237)). |
†4.4 | - | Fourth Supplemental Indenture dated November 2, 2010 among Carrizo Oil & Gas, Inc. the subsidiary guarantors named therein and Wells Fargo Bank, National Association, as trustee (incorporated herein by reference to Exhibit 4.2 to the Company's Current Report on Form 8-K filed on November 2, 2010). |
†4.5 | - | Fifth Supplemental Indenture dated November 2, 2010 among Carrizo Oil & Gas, Inc. the subsidiary guarantors named therein and Wells Fargo Bank, National Association, as trustee (incorporated herein by reference to Exhibit 4.3 to the Company's Current Report on Form 8-K filed on November 2, 2010). |
†4.6 | - | Sixth Supplemental Indenture dated May 4, 2011 among Carrizo Oil & Gas, Inc. the subsidiary guarantors named therein and Wells Fargo Bank, National Association, as trustee (incorporated herein by reference to Exhibit 4.1 to the Company's Quarterly Report on Form 10-Q for the quarter ended March 31, 2011). |
†4.7 | - | Seventh Supplemental Indenture dated May 4, 2011 among Carrizo Oil & Gas, Inc. the subsidiary guarantors named therein and Wells Fargo Bank, National Association, as trustee (incorporated herein by reference to Exhibit 4.2 to the Company's Quarterly Report on Form 10-Q for the quarter ended March 31, 2011). |
†4.8 | - | Eighth Supplemental Indenture dated August 5, 2011 among Carrizo Oil & Gas, Inc. the subsidiary guarantors named therein and Wells Fargo Bank, National Association, as trustee (incorporated herein by reference to Exhibit 4.3 to the Company's Quarterly Report on Form 10-Q for the quarter ended June 30, 2011). |
†4.9 | - | Ninth Supplemental Indenture dated August 5, 2011 among Carrizo Oil & Gas, Inc. the subsidiary guarantors named therein and Wells Fargo Bank, National Association, as trustee (incorporated herein by reference to Exhibit 4.4 to the Company's Quarterly Report on Form 10-Q for the quarter ended June 30, 2011). |
64
†4.10 | - | Tenth Supplemental Indenture among Carrizo Oil & Gas, Inc., the Subsidiary Guarantors named therein and Wells Fargo Bank, National Association, as trustee, dated as of September 10, 2012 (incorporated herein by reference to Exhibit 4.2 to the Company Current Report on Form 8-K filed on September 13, 2012). |
†4.11 | - | Eleventh Supplemental Indenture dated November 6, 2012 among Carrizo Oil & Gas, Inc., the subsidiary guarantors named therein and Wells Fargo Bank, National Association, as trustee (incorporated herein by reference to Exhibit 4.1 to the Company's Quarterly Report on Form 10-Q for the quarter ended September 30, 2012). |
†4.12 | - | Twelfth Supplemental Indenture dated November 6, 2012 among Carrizo Oil & Gas, Inc., the subsidiary guarantors named therein and Wells Fargo Bank, National Association, as trustee (incorporated herein by reference to Exhibit 4.2 to the Company's Quarterly Report on Form 10-Q for the quarter ended September 30, 2012). |
†4.13 | - | Thirteenth Supplemental Indenture dated November 6, 2012 among Carrizo Oil & Gas, Inc., the subsidiary guarantors named therein and Wells Fargo Bank, National Association, as trustee (incorporated herein by reference to Exhibit 4.3 to the Company's Quarterly Report on Form 10-Q for the quarter ended September 30, 2012). |
†4.14 | - | Fourteenth Supplemental Indenture dated November 6, 2012 among Carrizo Oil & Gas, Inc., the subsidiary guarantors named therein and Wells Fargo Bank, National Association, as trustee (incorporated herein by reference to Exhibit 4.4 to the Company's Quarterly Report on Form 10-Q for the quarter ended September 30, 2012). |
†4.15 | - | Officers' Certificate of the Company dated as of November 17, 2011 (incorporated herein by reference to Exhibit 4.5 to the Company's Current Report on Form 8-K filed on November 17, 2011). |
†4.16 | - | Form of Warrant issued pursuant to Land Agreement dated November 24, 2009 (incorporated herein by reference to Exhibit 4.3 to the Company's Quarterly Report on Form 10-Q for the quarter ended March 31, 2011) |
*†10.1 | - | Amended and Restated Incentive Plan of the Company effective as of April 30, 2009 (incorporated herein by reference to Exhibit 10.2 to the Company's Current Report on Form 8-K filed on May 6, 2009). |
*†10.2 | - | First Amendment dated May 16, 2012 to Amended and Restated Incentive Plan of Carrizo Oil & Gas, Inc. (incorporated herein by reference to Exhibit 10.1 to the Company's Current Report on Form 8-K filed on May 22, 2012). |
*†10.3 | - | Amended and Restated Employment Agreement between the Company and S.P. Johnson IV (incorporated herein by reference to Exhibit 10.2 to the Company's Current Report on Form 8-K filed on June 9, 2009). |
*†10.4 | - | Amended and Restated Employment Agreement between the Company and Paul F. Boling (incorporated herein by reference to Exhibit 10.3 to the Company's Current Report on Form 8-K filed on June 9, 2009). |
*†10.5 | - | Amended and Restated Employment Agreement between the Company and J. Bradley Fisher (incorporated herein by reference to Exhibit 10.4 to the Company's Current Report on Form 8-K filed on June 9, 2009). |
*†10.6 | - | Amended and Restated Employment Agreement between the Company and Gregory E. Evans (incorporated herein by reference to Exhibit 10.5 to the Company's Current Report on Form 8-K filed on June 9, 2009). |
*†10.7 | - | Amended and Restated Employment Agreement between the Company and Richard H. Smith (incorporated herein by reference to Exhibit 10.6 to the Company's Current Report on Form 8-K filed on June 9, 2009). |
*†10.8 | - | Employment Agreement between the Company and David L. Pitts (incorporated herein by reference to Exhibit 10.1 to the Company's Current Report on Form 8-K filed on January 20, 2010). |
*†10.9 | - | Form of Stock Option Award Agreement (incorporated herein by reference to Exhibit 10.43 to the Company's Annual Report on Form 10-K for the year ended December 31, 2004). |
*†10.10 | - | Form of Director Restricted Stock Award Agreement under the Incentive Plan of Carrizo Oil & Gas, Inc. (incorporated herein by reference to Exhibit 10.1 to the Company's Current Report on Form 8-K filed on April 22, 2005). |
65
*†10.11 | - | Form of Director Restricted Stock Award Agreement under the Incentive Plan of Carrizo Oil & Gas, Inc. (incorporated herein by reference to Exhibit 10.2 to the Company's Current Report on Form 8-K filed on April 22, 2005). |
*†10.12 | - | Form of Employee Restricted Stock Award Agreement under the Incentive Plan of Carrizo Oil & Gas, Inc. (incorporated herein by reference to Exhibit 10.3 to the Company's Current Report on Form 8-K filed on April 22, 2005). |
*†10.13 | - | Form of 2010 Employee Restricted Stock Unit Award Agreement (with performance-based vesting and time-based vesting) (incorporated herein by reference to Exhibit 10.12 to the Company's Annual Report on Form 10-K for the year ended December 31, 2010). |
*†10.14 | - | Form of 2009 Employee Restricted Stock Unit Award Agreement (with performance-based vesting only) (incorporated herein by reference to Exhibit 10.8 to the Company's Current Report on Form 8-K filed on June 9, 2009). |
*†10.15 | - | Form of 2010 Employee Cash Settled Stock Appreciation Rights Award Agreement under the Carrizo Oil & Gas, Inc. Incentive Plan (incorporated herein by reference to Exhibit 10.14 to the Company's Annual Report on Form 10-K for the year ended December 31, 2010). |
*†10.16 | - | Form of 2009 Employee Cash or Stock Settled Stock Appreciation Rights Award Agreement under the Carrizo Oil & Gas, Inc. Incentive Plan (incorporated herein by reference to Exhibit 10.9 to the Company's Current Report on Form 8-K filed on June 9, 2009). |
*†10.17 | - | Carrizo Oil & Gas, Inc. Cash-Settled Stock Appreciation Rights Plan (incorporated herein by reference to Exhibit 10.10 to the Company's Current Report on Form 8-K filed on June 9, 2009). |
*†10.18 | - | Form of 2009 Employee Cash-Settled Stock Appreciation Rights Award Agreement pursuant to the Carrizo Oil & Gas, Inc. Cash-Settled Stock Appreciation Rights Plan (incorporated herein by reference to Exhibit 10.11 to the Company's Current Report on Form 8-K filed on June 9, 2009). |
*†10.19 | - | Form of Independent Contractor Restricted Stock Award Agreement (incorporated herein by reference to Exhibit 10.4 to the Company's Current Report on Form 8-K filed on May 30, 2006). |
*†10.20 | - | Form of Employee Restricted Stock Award Agreement (with performance-based vesting) (incorporated herein by reference to Exhibit 10.6 to the Company's Current Report on Form 8-K filed on December 23, 2008). |
†10.21 | - | S Corporation Tax Allocation, Payment and Indemnification Agreement among the Company and Messrs. Loyd, Webster, Johnson, Hamilton and Wojtek (incorporated herein by reference to Exhibit 10.8 to the Company's Registration Statement on Form S-1 (Registration No. 333-29187)). |
†10.22 | - | S Corporation Tax Allocation, Payment and Indemnification Agreement among Carrizo Production, Inc. and Messrs. Loyd, Webster, Johnson, Hamilton and Wojtek (incorporated herein by reference to Exhibit 10.9 to the Company's Registration Statement on Form S-1 (Registration No. 333-29187)). |
†10.23 | - | Amended and Restated Registration Rights Agreement dated December 15, 1999 among the Company, Paul B. Loyd Jr., Douglas A. P. Hamilton, Steven A. Webster, S.P. Johnson IV, Frank A. Wojtek and DAPHAM Partnership, L.P. (incorporated herein by reference to Exhibit 99.5 to the Company's Current Report on Form 8-K filed December 22, 1999). |
†10.24 | - | Registration Rights Agreement dated February 20, 2002 among the Company, Mellon Ventures, L.P. and Steven A. Webster (incorporated herein by reference to Exhibit 99.5 to the Company's Current Report on Form 8-K filed February 27, 2002). |
†10.25 | - | Credit Agreement dated as of January 27, 2011 among Carrizo Oil & Gas, Inc., as Borrower, BNP Paribas, as Administrative Agent, Credit Agricole Corporate and Investment Bank and Royal Bank of Canada, as Co-Syndication Agents, Capital One, N.A. and Compass Bank, as Co-Documentation Agents, BNP Paribas Securities Corp. as Sole Lead Arranger and Sole Bookrunner, and the Lenders party thereto (incorporated herein by reference to Exhibit 10.1 to the Company's Current Report on Form 8-K filed on February 2, 2011). |
†10.26 | - | First Amendment, dated as of March 26, 2012, to Credit Agreement dated as of January 27, 2011, among Carrizo Oil & Gas, Inc., BNP Paribas as administrative agent, and the Lenders party thereto (incorporated herein by reference to Exhibit 10.1 to the Company's Quarterly Report on Form 10-Q for the quarter ended March 31, 2012). |
66
†10.27 | - | Second Amendment to Credit Agreement, dated as of September 4, 2012, among Carrizo Oil & Gas, Inc., as borrower, Wells Fargo Bank, National Association, as administrative agent, and the lender parties thereto (incorporated herein by reference to Exhibit 10.1 to the Company's Current Report on Form 8-K filed on September 5, 2012). |
†10.28 | - | Third Amendment to Credit Agreement, dated as of September 27, 2012, among Carrizo Oil & Gas, Inc., as borrower, Wells Fargo Bank, National Association, as administrative agent, and the lender parties thereto (incorporated by reference to Exhibit 10.2 to the Company's Quarterly Report on Form 10-Q for the quarter ended September 30, 2012). |
†10.29 | - | Senior Secured Multicurrency Credit Facility Agreement dated as of January 28, 2011 among Carrizo UK Huntington Ltd., as Borrower, Carrizo Oil & Gas, Inc., as Parent, and BNP Paribas and Societe Generale as Lead Arrangers, Bookrunners and Original Lenders (incorporated herein by reference to Exhibit 10.2 to the Company's Current Report on Form 8-K filed on February 2, 2011). |
†10.30 | - | First Amendment, entered into as of April 17, 2012, to Senior Secured Multicurrency Credit Facility Agreement dated as of January 28, 2011, among Carrizo U.K. Huntington Ltd., as Borrower, Carrizo Oil & Gas, Inc., as Parent, and BNP Paribas and Societe Generale as Lead Arrangers, Bookrunners and Original Lenders (incorporated herein by reference to Exhibit 10.2 to the Company's Quarterly Report on Form 10-Q for the quarter ended March 31, 2012). |
†10.31 | - | Form of Indemnification Agreement between the Company and each of its directors and executive officers (incorporated herein by reference to Exhibit 10.6 to the Company's Annual Report on Form 10-K for the year ended December 31, 1997). |
†10.32 | - | Form of Amendment to Director Indemnification Agreement (incorporated herein by reference to Exhibit 99.8 to the Company's Current Report a Form 8-K filed February 27, 2002). |
†10.33 | - | Omnibus Amendment among Carrizo (Marcellus) LLC, Carrizo Oil & Gas, Inc., Avista Capital Partners II, L.P. and ACP II Marcellus LLC, dated as of September 10, 2010 (incorporated herein by reference to Exhibit 10.3 to the Company's Current Report on Form 8-K filed on September 16, 2010). |
†10.34 | - | Amended and Restated Participation Agreement, dated as of November 16, 2010, and effective as of October 1, 2010, among Carrizo (Marcellus) WV LLC, Carrizo Oil & Gas, Inc., Avista Capital Partners II, L.P. and ACP II Marcellus LLC (incorporated herein by reference to Exhibit 10.1 to the Company's Current Report on Form 8-K filed on November 19, 2010). |
21.1 | - | Subsidiaries of the Company. |
23.1 | - | Consent of KPMG LLP. |
23.2 | - | Consent of LaRoche Petroleum Consultants, Ltd. |
23.3 | - | Consent of Ryder Scott Company, L.P. (U.S.). |
23.4 | - | Consent of Ryder Scott Company, L.P. (U.K.). |
31.1 | - | CEO Certification Pursuant to Section 302 of the Sarbanes-Oxley Act of 2002. |
31.2 | - | CFO Certification Pursuant to Section 302 of the Sarbanes-Oxley Act of 2002. |
32.1 | - | CEO Certification Pursuant to Section 906 of the Sarbanes-Oxley Act of 2002. |
32.2 | - | CFO Certification Pursuant to Section 906 of the Sarbanes-Oxley Act of 2002. |
99.1 | - | Summary of Reserve Report and Report of LaRoche Petroleum Consultants, Ltd. as of December 31, 2012. |
99.2 | - | Summary of Reserve Report and Report of Ryder Scott Company, L.P. as of December 31, 2012 (U.S.). |
99.3 | - | Summary of Reserve Report and Report of Ryder Scott Company, L.P. as of December 31, 2012 (U.K.). |
|
† Incorporated by reference as indicated.
* Management contract or compensatory plan or arrangement.
67
INDEX TO CONSOLIDATED FINANCIAL STATEMENTS
| PAGE |
Reports of Independent Registered Public Accounting Firm | F-2 |
Consolidated Balance Sheets, December 31, 2012 and 2011 | F-4 |
Consolidated Statements of Income for the Years Ended December 31, 2012, 2011 and 2010 | F-5 |
Consolidated Statements of Shareholders' Equity for the Years Ended December 31, 2012, 2011 and 2010 | F-6 |
Consolidated Statements of Cash Flows for the Years Ended December 31, 2012, 2011 and 2010 | F-8 |
Notes to Consolidated Financial Statements | F-10 |
F-1
Report of Independent Registered Public Accounting Firm
The Board of Directors and Shareholders
Carrizo Oil & Gas, Inc.:
We have audited the accompanying consolidated balance sheets of Carrizo Oil & Gas, Inc. and subsidiaries (the Company) as of December 31, 2012 and 2011, and the related consolidated statements of income, shareholders' equity, and cash flows for each of the years in the three-year period ended December 31, 2012. These consolidated financial statements are the responsibility of the Company's management. Our responsibility is to express an opinion on these consolidated financial statements based on our audits.
We conducted our audits in accordance with the standards of the Public Company Accounting Oversight Board (United States). Those standards require that we plan and perform the audit to obtain reasonable assurance about whether the financial statements are free of material misstatement. An audit includes examining, on a test basis, evidence supporting the amounts and disclosures in the financial statements. An audit also includes assessing the accounting principles used and significant estimates made by management, as well as evaluating the overall financial statement presentation. We believe that our audits provide a reasonable basis for our opinion.
In our opinion, the consolidated financial statements referred to above present fairly, in all material respects, the financial position of Carrizo Oil & Gas, Inc. and subsidiaries as of December 31, 2012 and 2011, and the results of their operations and their cash flows for each of the years in the three-year period ended December 31, 2012, in conformity with generally accepted accounting principles.
We also have audited, in accordance with the standards of the Public Company Accounting Oversight Board (United States), Carrizo Oil & Gas, Inc.'s internal control over financial reporting as of December 31, 2012, based on criteria established in Internal Control – Integrated Framework issued by the Committee of Sponsoring Organizations of the Treadway Commission (COSO), and our report dated February 27, 2013 expressed an unqualified opinion on the effectiveness of the Company's internal control over financial reporting.
/s/ KPMG LLP
Houston, Texas
February 27, 2013
F-2
Report of Independent Registered Public Accounting Firm
The Board of Directors and Shareholders
Carrizo Oil & Gas, Inc.:
We have audited Carrizo Oil & Gas Inc.'s internal control over financial reporting as of December 31, 2012, based on criteria established in Internal Control – Integrated Framework issued by the Committee of Sponsoring Organizations of the Treadway Commission (COSO). Carrizo Oil & Gas Inc.'s management is responsible for maintaining effective internal control over financial reporting and for its assessment of the effectiveness of internal control over financial reporting, included in the accompanying Management's Report on Internal Control over Financial Reporting as presented within Item 9A. Controls and Procedures . Our responsibility is to express an opinion on Carrizo Oil & Gas, Inc.'s internal control over financial reporting based on our audit.
We conducted our audit in accordance with the standards of the Public Company Accounting Oversight Board (United States). Those standards require that we plan and perform the audit to obtain reasonable assurance about whether effective internal control over financial reporting was maintained in all material respects. Our audit included obtaining an understanding of internal control over financial reporting, assessing the risk that a material weakness exists, and testing and evaluating the design and operating effectiveness of internal control based on the assessed risk. Our audit also included performing such other procedures as we considered necessary in the circumstances. We believe that our audit provides a reasonable basis for our opinion.
A company's internal control over financial reporting is a process designed to provide reasonable assurance regarding the reliability of financial reporting and the preparation of financial statements for external purposes in accordance with generally accepted accounting principles. A company's internal control over financial reporting includes those policies and procedures that (1) pertain to the maintenance of records that, in reasonable detail, accurately and fairly reflect the transactions and dispositions of the assets of the company; (2) provide reasonable assurance that transactions are recorded as necessary to permit preparation of financial statements in accordance with generally accepted accounting principles, and that receipts and expenditures of the company are being made only in accordance with authorizations of management and directors of the company; and (3) provide reasonable assurance regarding prevention or timely detection of unauthorized acquisition, use, or disposition of the company's assets that could have a material effect on the financial statements.
Because of its inherent limitations, internal control over financial reporting may not prevent or detect misstatements. Also, projections of any evaluation of effectiveness to future periods are subject to the risk that controls may become inadequate because of changes in conditions, or that the degree of compliance with the policies or procedures may deteriorate.
In our opinion, Carrizo Oil & Gas, Inc. maintained, in all material respects, effective internal control over financial reporting as of December 31, 2012, based on criteria established in Internal Control – Integrated Framework issued by the COSO.
We also have audited, in accordance with the standards of the Public Company Accounting Oversight Board (United States), the consolidated balance sheets of Carrizo Oil & Gas, Inc. and subsidiaries as of December 31, 2012 and 2011, and the related consolidated statements of income, shareholders' equity, and cash flows for each of the years in the three-year period ended December 31, 2012, and our report dated February 27, 2013 expressed an unqualified opinion on those consolidated financial statements.
/s/ KPMG LLP
Houston, Texas
February 27, 2013
F-3
CARRIZO OIL & GAS, INC.
CONSOLIDATED BALANCE SHEETS
|
| December 31, | ||||||
|
| 2012 |
| 2011 | ||||
|
| (In thousands, except per share amounts) | ||||||
ASSETS |
|
|
|
| ||||
CURRENT ASSETS |
|
|
|
| ||||
Cash and cash equivalents |
| $ | 52,095 | |
| $ | 26,397 | |
Accounts receivable, net |
|
|
|
| ||||
Oil and gas sales |
| 48,754 | |
| 21,988 | | ||
Joint interest billing |
| 60,561 | |
| 31,050 | | ||
Related party |
| 9,815 | |
| - | | ||
Other |
| 3,506 | |
| 1,740 | | ||
Current assets held for sale |
| 1,882 | |
| 3,874 | | ||
Advances to operators |
| 3,784 | |
| 97 | | ||
Fair value of derivative instruments |
| 23,981 | |
| 27,877 | | ||
Prepaids and other current assets |
| 4,327 | |
| 7,374 | | ||
Total current assets |
| 208,705 | |
| 120,397 | | ||
PROPERTY AND EQUIPMENT, NET |
|
|
|
| ||||
Oil and gas properties using the full cost method of accounting |
|
|
|
| ||||
Proved oil and gas properties, net |
| 1,152,548 | |
| 837,750 | | ||
Unproved properties, not being amortized |
| 323,688 | |
| 394,429 | | ||
Other property and equipment, net |
| 11,438 | |
| 8,738 | | ||
TOTAL PROPERTY AND EQUIPMENT, NET |
| 1,487,674 | |
| 1,240,917 | | ||
LONG-TERM ASSETS HELD FOR SALE |
| 132,626 | |
| 78,731 | | ||
DEFERRED FINANCING COSTS, NET |
| 23,914 | |
| 20,321 | | ||
INVESTMENT |
| 2,523 | |
| 2,523 | | ||
FAIR VALUE OF DERIVATIVE INSTRUMENTS |
| 5,180 | |
| 9,617 | | ||
DEFERRED INCOME TAXES |
| 21,272 | |
| 53,517 | | ||
OTHER ASSETS |
| 2,102 | |
| 1,657 | | ||
TOTAL ASSETS |
| $ | 1,883,996 | |
| $ | 1,527,680 | |
LIABILITIES AND SHAREHOLDERS' EQUITY |
|
|
|
| ||||
CURRENT LIABILITIES |
|
|
|
| ||||
Accounts payable, trade |
| $ | 44,775 | |
| $ | 25,672 | |
Revenue and royalties payable |
| 82,300 | |
| 54,600 | | ||
Current taxes payable |
| 765 | |
| 1,048 | | ||
Accrued drilling costs |
| 60,729 | |
| 89,152 | | ||
Accrued interest |
| 18,012 | |
| 11,607 | | ||
Other accrued liabilities |
| 27,680 | |
| 21,139 | | ||
Advances for joint operations |
| 8,069 | |
| 54,179 | | ||
Deferred income taxes |
| 7,925 | |
| 9,685 | | ||
Current liabilities associated with assets held for sale |
| 48,663 | |
| 4,238 | | ||
Total current liabilities |
| 298,918 | |
| 271,320 | | ||
LONG-TERM DEBT, NET OF DEBT DISCOUNT |
| 967,808 | |
| 711,486 | | ||
LONG-TERM LIABILITIES ASSOCIATED WITH ASSETS HELD FOR SALE |
| 23,547 | |
| 22,429 | | ||
ASSET RETIREMENT OBLIGATIONS |
| 4,489 | |
| 7,399 | | ||
OTHER LIABILITIES |
| 4,218 | |
| 5,191 | | ||
COMMITMENTS AND CONTINGENCIES |
| | |
| | | ||
SHAREHOLDERS' EQUITY |
|
|
|
| ||||
Common stock, $0.01 par value (90,000 shares authorized, 40,165 and 39,563 shares issued and outstanding at December 31, 2012 and 2011, respectively) |
| 402 | |
| 395 | | ||
Additional paid-in capital |
| 667,096 | |
| 647,429 | | ||
Accumulated deficit |
| (82,482 | ) |
| (137,969 | ) | ||
Total shareholders' equity |
| 585,016 | |
| 509,855 | | ||
TOTAL LIABILITIES AND SHAREHOLDERS' EQUITY |
| $ | 1,883,996 | |
| $ | 1,527,680 | |
The accompanying notes are an integral part of these consolidated financial statements.
F-4
CARRIZO OIL & GAS, INC.
CONSOLIDATED STATEMENTS OF INCOME
|
| For the Years Ended December 31, | ||||||||||
|
| 2012 |
| 2011 |
| 2010 | ||||||
|
| (In thousands, except per share amounts) | ||||||||||
OIL AND GAS REVENUES |
| $ | 368,180 | |
| $ | 202,167 | |
| $ | 138,123 | |
COSTS AND EXPENSES |
|
|
|
|
|
| ||||||
Lease operating |
| 31,471 | |
| 28,314 | |
| 23,659 | | |||
Production tax |
| 13,542 | |
| 5,697 | |
| 3,648 | | |||
Ad valorem tax |
| 9,813 | |
| 3,625 | |
| 3,707 | | |||
Depreciation, depletion and amortization |
| 165,621 | |
| 84,606 | |
| 47,030 | | |||
General and administrative (inclusive of stock-based compensation expense of $11,689, 11,864 and $16,608 for the years ended December 31, 2012, 2011 and 2010, respectively) |
| 48,708 | |
| 41,539 | |
| 35,906 | | |||
Accretion related to asset retirement obligations |
| 372 | |
| 235 | |
| 216 | | |||
TOTAL COSTS AND EXPENSES |
| 269,527 | |
| 164,016 | |
| 114,166 | | |||
OPERATING INCOME |
| 98,653 | |
| 38,151 | |
| 23,957 | | |||
OTHER INCOME AND EXPENSES |
|
|
|
|
|
| ||||||
Gain (loss) on derivative instruments, net |
| 31,371 | |
| 48,423 | |
| 47,782 | | |||
Loss on extinguishment of debt |
| - | |
| (897 | ) |
| (31,023 | ) | |||
Interest expense |
| (73,006 | ) |
| (50,998 | ) |
| (43,264 | ) | |||
Capitalized interest |
| 24,848 | |
| 23,369 | |
| 20,746 | | |||
Other income (expense), net |
| 267 | |
| 97 | |
| 212 | | |||
INCOME FROM CONTINUING OPERATIONS BEFORE INCOME TAXES |
| 82,133 | |
| 58,145 | |
| 18,410 | | |||
INCOME TAX EXPENSE |
| (30,956 | ) |
| (25,611 | ) |
| (6,685 | ) | |||
NET INCOME FROM CONTINUING OPERATIONS |
| $ | 51,177 | |
| $ | 32,534 | |
| $ | 11,725 | |
NET INCOME (LOSS) FROM DISCONTINUED OPERATIONS, NET OF INCOME TAXES |
| 4,310 | |
| 4,095 | |
| (1,775 | ) | |||
NET INCOME |
| $ | 55,487 | |
| $ | 36,629 | |
| $ | 9,950 | |
|
|
|
|
|
|
| ||||||
NET INCOME PER COMMON SHARE - BASIC |
|
|
|
|
|
| ||||||
Net income from continuing operations |
| $ | 1.29 | |
| $ | 0.83 | |
| $ | 0.34 | |
Net income (loss) from discontinued operations |
| 0.11 | |
| 0.11 | |
| (0.05 | ) | |||
Net income |
| $ | 1.40 | |
| $ | 0.94 | |
| $ | 0.29 | |
|
|
|
|
|
|
| ||||||
NET INCOME PER COMMON SHARE - DILUTED |
|
|
|
|
|
| ||||||
Net income from continuing operations |
| $ | 1.28 | |
| $ | 0.82 | |
| $ | 0.34 | |
Net income (loss) from discontinued operations |
| 0.11 | |
| 0.10 | |
| (0.05 | ) | |||
Net income |
| $ | 1.39 | |
| $ | 0.92 | |
| $ | 0.29 | |
|
|
|
|
|
|
| ||||||
WEIGHTED AVERAGE COMMON SHARES OUTSTANDING |
|
|
|
|
|
| ||||||
Basic |
| 39,591 | |
| 39,077 | |
| 33,861 | | |||
Diluted |
| 40,026 | |
| 39,668 | |
| 34,305 | | |||
The accompanying notes are an integral part of these consolidated financial statements.
F-5
CARRIZO OIL & GAS, INC.
CONSOLIDATED STATEMENTS OF SHAREHOLDERS' EQUITY
F-6
|
| Common Stock |
| Additional |
|
|
| Total | |||||||||||
|
| Shares |
| Amount |
|
|
| ||||||||||||
|
|
|
| (In thousands, except share amounts) | |||||||||||||||
BALANCE, January 1, 2010 |
| 31,100,433 | |
| $ | 311 | |
| $ | 431,846 | |
| $ | (184,548 | ) |
| $ | 247,609 | |
Stock options exercised for cash |
| 266,433 | |
| 3 | |
| 687 | |
| - | |
| 690 | | ||||
Stock-based compensation |
| - | |
| - | |
| 10,290 | |
| - | |
| 10,290 | | ||||
Restricted stock awards and units issued, net of forfeitures |
| 344,311 | |
| 3 | |
| (1,101 | ) |
| - | |
| (1,098 | ) | ||||
Common stock offerings, net of offering costs |
| 7,195,000 | |
| 72 | |
| 188,462 | |
| - | |
| 188,534 | | ||||
Other |
| - | |
| - | |
| 661 | |
| - | |
| 661 | | ||||
Net income |
| - | |
| - | |
| - | |
| 9,950 | |
| 9,950 | | ||||
BALANCE, December 31, 2010 |
| 38,906,177 | |
| $ | 389 | |
| $ | 630,845 | |
| $ | (174,598 | ) |
| $ | 456,636 | |
Stock options exercised for cash |
| 151,500 | |
| 1 | |
| 47 | |
| - | |
| 48 | | ||||
Stock-based compensation |
| - | |
| - | |
| 14,444 | |
| - | |
| 14,444 | | ||||
Restricted stock awards and units issued, net of forfeitures |
| 439,237 | |
| 4 | |
| (483 | ) |
| - | |
| (479 | ) | ||||
Other |
| 65,762 | |
| 1 | |
| 2,576 | |
| - | |
| 2,577 | | ||||
Net income |
| - | |
| - | |
| - | |
| 36,629 | |
| 36,629 | | ||||
BALANCE, December 31, 2011 |
| 39,562,676 | |
| $ | 395 | |
| $ | 647,429 | |
| $ | (137,969 | ) |
| $ | 509,855 | |
Stock options exercised for cash |
| 20,500 | |
| 1 | |
| 106 | |
| - | |
| 107 | | ||||
Stock-based compensation |
| - | |
| - | |
| 17,396 | |
| - | |
| 17,396 | | ||||
Restricted stock awards and units issued, net of forfeitures |
| 488,052 | |
| 5 | |
| (85 | ) |
| - | |
| (80 | ) | ||||
Other |
| 93,289 | |
| 1 | |
| 2,250 | |
| - | |
| 2,251 | | ||||
Net income |
| - | |
| - | |
| - | |
| 55,487 | |
| 55,487 | | ||||
BALANCE, December 31, 2012 |
| 40,164,517 | |
| $ | 402 | |
| $ | 667,096 | |
| $ | (82,482 | ) |
| $ | 585,016 | |
The accompanying notes are an integral part of these consolidated financial statements.
F-7
CARRIZO OIL & GAS, INC.
|
| For the Years Ended December 31, | ||||||||||
|
| 2012 |
| 2011 |
| 2010 | ||||||
|
| (In thousands) | ||||||||||
CASH FLOWS FROM OPERATING ACTIVITIES |
|
|
|
|
|
| ||||||
Net income from continuing operations |
| $ | 51,177 | |
| $ | 32,534 | |
| $ | 11,725 | |
Adjustments to reconcile net income from continuing operations to net cash provided by operating activities-continuing operations- |
|
|
|
|
|
| ||||||
Depreciation, depletion and amortization |
| 165,621 | |
| 84,606 | |
| 47,030 | | |||
Unrealized (gain) loss on derivative instruments, net |
| 9,751 | |
| (12,971 | ) |
| (14,564 | ) | |||
Accretion related to asset retirement obligations |
| 372 | |
| 235 | |
| 216 | | |||
Loss on extinguishment of debt |
| - | |
| 897 | |
| 31,023 | | |||
Stock-based compensation, net of amounts capitalized |
| 11,689 | |
| 11,864 | |
| 16,608 | | |||
Allowance for doubtful accounts |
| (337 | ) |
| 31 | |
| 485 | | |||
Deferred income taxes |
| 30,142 | |
| 24,546 | |
| 2,449 | | |||
Amortization of debt discount and deferred financing costs, net of amounts capitalized |
| 4,584 | |
| 3,061 | |
| 7,716 | | |||
Other, net |
| 4,175 | |
| 3,105 | |
| 3,097 | | |||
Changes in operating assets and liabilities- |
|
|
|
|
|
| ||||||
Accounts receivable |
| (67,120 | ) |
| (23,910 | ) |
| (10,040 | ) | |||
Accounts payable |
| 26,942 | |
| 33,457 | |
| 913 | | |||
Accrued liabilities |
| 21,832 | |
| 9,354 | |
| (69 | ) | |||
Other, net |
| (5,757 | ) |
| (11,298 | ) |
| (2,173 | ) | |||
Net cash provided by operating activities - continuing operations |
| 253,071 | |
| 155,511 | |
| 94,416 | | |||
Net cash used in operating activities - discontinued operations |
| (845 | ) |
| (1,173 | ) |
| - | | |||
Net cash provided by operating activities |
| 252,226 | |
| 154,338 | |
| 94,416 | | |||
CASH FLOWS FROM INVESTING ACTIVITIES |
|
|
|
|
|
| ||||||
Capital expenditures - oil and gas properties |
| (735,711 | ) |
| (516,004 | ) |
| (340,784 | ) | |||
Capital expenditures - other property and equipment |
| (4,176 | ) |
| (1,363 | ) |
| (843 | ) | |||
Increase (decrease) in capital expenditure payables and accruals |
| (9,880 | ) |
| 49,346 | |
| 22,540 | | |||
Proceeds from sales of oil and gas properties, net |
| 341,597 | |
| 167,265 | |
| 54,217 | | |||
Advances to operators |
| (3,687 | ) |
| 390 | |
| 53 | | |||
Advances for joint operations |
| (46,110 | ) |
| 50,772 | |
| 1,668 | | |||
Other, net |
| (7,184 | ) |
| (474 | ) |
| (966 | ) | |||
Net cash used in investing activities - continuing operations |
| (465,151 | ) |
| (250,068 | ) |
| (264,115 | ) | |||
Net cash used in investing activities - discontinued operations |
| (42,265 | ) |
| (35,930 | ) |
| (6,181 | ) | |||
Net cash used in investing activities |
| (507,416 | ) |
| (285,998 | ) |
| (270,296 | ) | |||
CASH FLOWS FROM FINANCING ACTIVITIES |
|
|
|
|
|
| ||||||
Proceeds from borrowings and issuances |
| 1,040,772 | |
| 879,061 | |
| 910,127 | | |||
Debt repayments |
| (796,000 | ) |
| (752,660 | ) |
| (917,148 | ) | |||
Payments of debt issuance and retirement costs |
| (7,101 | ) |
| (9,622 | ) |
| (12,213 | ) | |||
Proceeds from common stock offerings, net of offering costs |
| - | |
| - | |
| 188,534 | | |||
Proceeds from stock options exercised |
| 107 | |
| 47 | |
| 690 | | |||
Net cash provided by financing activities - continuing operations |
| 237,778 | |
| 116,826 | |
| 169,990 | | |||
Net cash provided by financing activities - discontinued operations |
| 41,914 | |
| 38,818 | |
| 6,181 | | |||
Net cash provided by financing activities |
| 279,692 | |
| 155,644 | |
| 176,171 | | |||
NET INCREASE IN CASH AND CASH EQUIVALENTS FROM CONTINUING OPERATIONS |
| 25,698 | |
| 22,269 | |
| 291 | | |||
NET INCREASE (DECREASE) IN CASH AND CASH EQUIVALENTS FROM DISCONTINUED OPERATIONS |
| (1,196 | ) |
| 1,715 | |
| - | | |||
CASH AND CASH EQUIVALENTS, beginning of year - continuing operations |
| 26,397 | |
| 4,128 | |
| 3,837 | | |||
CASH AND CASH EQUIVALENTS, end of year - continuing operations |
| $ | 52,095 | |
| $ | 26,397 | |
| $ | 4,128 | |
|
|
|
|
|
|
| ||||||
CASH AND CASH EQUIVALENTS, beginning of year - discontinued operations |
| 1,715 | |
| - | |
| - | | |||
CASH AND CASH EQUIVALENTS, end of year - discontinued operations |
| $ | 519 | |
| $ | 1,715 | |
| $ | - | |
F-8
SUPPLEMENTAL CASH FLOW DISCLOSURES |
|
|
|
|
|
| ||||||
Cash paid for interest, net of amounts capitalized |
| $ | 43,629 | |
| $ | 26,077 | |
| $ | 24,218 | |
Cash paid for income taxes |
| $ | 587 | |
| $ | 4,156 | |
| $ | 95 | |
The accompanying notes are an integral part of these consolidated financial statements.
F-9
CARRIZO OIL & GAS, INC.
NOTES TO CONSOLIDATED FINANCIAL STATEMENTS
1. Nature of Operations
Carrizo Oil & Gas, Inc. is a Houston-based energy company which, together with its subsidiaries (collectively, the "Company"), is actively engaged in the exploration, development, and production of oil and gas primarily from resource plays located in the United States. The Company's current operations are principally focused in proven, producing oil and gas plays primarily in the Eagle Ford Shale in South Texas, the Niobrara Formation in Colorado, the Marcellus Shale in Pennsylvania, the Barnett Shale in North Texas, and the Utica Shale in Ohio.
2. Summary of Significant Accounting Policies
Basis of Presentation and Principles of Consolidation
The consolidated financial statements include the accounts of the Company after elimination of all significant intercompany transactions and balances and are presented in accordance with U.S. generally accepted accounting principles ("GAAP"). The Company proportionately consolidates its undivided interests in oil and gas properties as well as investments in unincorporated entities, such as partnerships and limited liability companies where the Company, as a partner or member, has undivided interests in the oil and gas properties.
Reclassifications
Certain reclassifications have been made to prior period amounts to conform to the current period presentation. These reclassifications had no effect on total assets, total liabilities, total shareholders' equity, net income or net cash provided by or used in operating, investing or financing activities.
Discontinued Operations
On December 27, 2012, the Company agreed to sell Carrizo UK Huntington Ltd, a wholly owned subsidiary of the Company ("Carrizo UK"), and all of its interest in the Huntington Field discovery, where Carrizo UK owned a 15% non-operated working interest and certain overriding royalty interests. The sale closed on February 22, 2013. Accordingly, the Company classified the U.K. North Sea assets and associated liabilities as current and long-term assets held for sale and current and long-term liabilities associated with assets held for sale in the consolidated balance sheets. The related results of operations and cash flows have been classified as discontinued operations, net of income taxes, in the consolidated statements of income, statements of cash flows and condensed consolidating financial information. Unless otherwise indicated, the information in these notes relate to the Company's continuing operations. Information related to assets held for sale and discontinued operations is included in "Note 3. Assets Held for Sale and Discontinued Operations", "Note 14. Condensed Consolidating Financial Information" and "Note 15. Supplemental Disclosures about Oil and Gas Producing Activities (Unaudited)."
Use of Estimates
The preparation of financial statements in conformity with GAAP requires management to make estimates and assumptions that affect the reported amounts of assets and liabilities and disclosures of contingent assets and liabilities at the date of the financial statements and the reported amounts of revenues and expenses during the periods reported. Actual results could differ from these estimates. The Company evaluates subsequent events through the date the financial statements are issued.
Volumes of proved oil and gas reserves, which include significant estimates, are used in calculating the amortization of proved oil and gas property costs, the present value of future net revenues included in the full cost ceiling test, estimates of future taxable income used in assessing the realizability of deferred tax assets, and asset retirement obligations. Other significant estimates include the impairment of unproved properties, fair values of derivative instruments, stock-based compensation, the collectability of outstanding receivables, and contingencies. Proved oil and gas reserve estimates have numerous inherent uncertainties. The accuracy of any reserve estimate is a function of the quality and quantity of available data and the application of engineering and geological interpretation and judgment to available data. Subsequent drilling results, testing and production may justify revisions of such estimates. Accordingly, proved oil and gas reserve estimates are often different from the quantities of oil and gas that are ultimately recovered. In addition, proved oil and gas reserve estimates are vulnerable to changes in average market prices of oil and gas. Such prices have been volatile in the past and can be expected to be volatile in the future.
Estimates are based on current assumptions that may be materially affected by changes to future economic conditions such as the market prices of oil and gas, the creditworthiness of counterparties, interest rates and the market value and volatility of the Company's common stock. Future changes in these assumptions may affect these significant estimates materially in the near term.
F-10
Cash and Cash Equivalents
Cash and cash equivalents include highly liquid investments with original maturities of three months or less.
Accounts Receivable and Allowance for Doubtful Accounts
The Company establishes an allowance for doubtful accounts when it determines that it will not collect all or a part of an accounts receivable balance. The Company assesses the collectability of its accounts receivable on a quarterly basis and adjusts the allowance as necessary using the specific identification method. A roll forward of the allowance for doubtful accounts is as follows:
| Amount | ||
| (In thousands) | ||
January 1, 2010 | $ | 2,036 | |
Charged to general and administrative | 485 | | |
Amounts written off | (51 | ) | |
December 31, 2010 | 2,470 | | |
Charged to general and administrative | 31 | | |
Amounts written off | (197 | ) | |
December 31, 2011 | 2,304 | | |
Recoveries included in general and administrative | (737 | ) | |
Amounts written off | (208 | ) | |
December 31, 2012 | $ | 1,359 | |
Concentration of Credit Risk
Substantially all of the Company's accounts receivable result from oil and gas sales, joint interest billings to third-party working interest owners in the oil and gas industry or development advances to third-party operators for drilling and completion costs of wells in progress. This concentration of customers and joint interest owners may impact the Company's overall credit risk in that these entities may be similarly affected by changes in economic and other industry conditions. The Company does not require collateral from its customers. The Company generally has the right to offset revenue against related billings to joint interest owners.
Derivative instruments subject the Company to a concentration of credit risk. See "Note 12. Derivative Instruments" for further discussion of concentration of credit risk related to the Company's derivative instruments.
Major Customers
For the year ended December 31, 2012, two customers accounted for approximately 53% and 10% of the Company's oil and gas revenues. For the years ended December 31, 2011 and 2010, one customer accounted for approximately 43% and 63% , respectively, of the Company's oil and gas revenues.
Oil and Gas Properties
Oil and gas properties are accounted for using the full cost method of accounting under which all productive and nonproductive costs directly associated with property acquisition, exploration and development activities are capitalized to costs centers established on a country-by-country basis. Internal costs, including payroll and stock-based compensation, directly associated with acquisition, exploration and development activities are capitalized and totaled $11.8 million , $9.6 million , and $5.3 million for the years ended December 31, 2012, 2011 and 2010 , respectively. Internal costs related to production, general corporate overhead and similar activities are expensed as incurred.
Capitalized oil and gas property costs within a cost center are amortized on an equivalent unit-of-production method, converting oil and natural gas liquids to gas equivalents at the ratio of one barrel of oil or natural gas liquids to six thousand cubic feet of gas, which represents their approximate relative energy content. The equivalent unit-of-production rate is computed on a quarterly basis by dividing production by proved oil and gas reserves at the beginning of the quarter then applying such amount to capitalized oil and gas property costs, which includes estimated asset retirement costs, less accumulated amortization, plus the estimated future expenditures (based on current costs) to be incurred in developing proved reserves, net of estimated salvage values. Average depreciation, depletion and amortization ("DD&A") per Boe was $17.55 , $11.26 , and $7.67 for the years ended December 31, 2012, 2011 and 2010 , respectively.
F-11
Unproved properties, which are not amortized, include unevaluated leasehold and seismic costs associated with specific unevaluated properties, the cost of exploratory wells in progress, and related capitalized interest. Significant costs of unevaluated properties and exploratory wells in progress are assessed individually on a quarterly basis to determine whether or not and to what extent proved reserves have been assigned to the properties or if an impairment has occurred, in which case the related costs are added to the oil and gas property costs subject to amortization. Factors the Company considers in its impairment assessment include drilling results by the Company and other operators, the terms of oil and gas leases not held by production and drilling capital expenditure plans. The Company expects to complete its evaluation of the majority of its unproved leasehold and seismic costs within the next two to five years and exploratory wells in progress within the next year. Individually insignificant costs of unevaluated properties are grouped by major area and added to the oil and gas property costs subject to amortization based on the average primary lease term of the properties. The Company capitalized interest costs associated with its unevaluated leasehold and seismic costs and exploratory wells in progress of $24.8 million , $23.4 million , and $20.7 million for the years ended December 31, 2012, 2011 and 2010 , respectively. Interest is capitalized on the average balance of unevaluated leasehold and seismic costs and the average balance of exploratory wells in progress using a weighted-average interest rate based on outstanding borrowings.
Proceeds from the sale of oil and gas properties are recognized as a reduction of capitalized oil and gas property costs with no gain or loss recognized, unless the sale significantly alters the relationship between capitalized costs and proved reserves of oil and gas attributable to a cost center. Through December 31, 2012, the Company has not had any sales of oil and gas properties that significantly alter that relationship.
Capitalized costs, less accumulated amortization and related deferred income taxes, are limited to the "cost center ceiling" equal to (i) the sum of (A) the present value of estimated future net revenues from proved oil and gas reserves, less estimated future expenditures to be incurred in developing and producing the proved reserves computed using a discount factor of 10% , (B) the costs of properties not subject to amortization, and (C) the lower of cost or estimated fair value of unproved properties included in the costs being amortized; less (ii) related income tax effects. If the net capitalized costs exceed the cost center ceiling, the excess is recognized as an impairment of oil and gas properties. An impairment recognized in one period may not be reversed in a subsequent period even if higher oil and gas prices increase the cost center ceiling applicable to the subsequent period.
The estimated future net revenues used in the ceiling test are calculated using average quoted market prices for sales of oil and gas on the first calendar day of each month during the preceding 12-month period prior to the end of the current reporting period. Prices are held constant indefinitely and are not changed except where different prices are fixed and determinable from applicable contracts for the remaining term of those contracts. Prices used in the ceiling test computation do not include the impact of derivative instruments because the Company elected not to meet the criteria to qualify its derivative instruments for hedge accounting treatment.
Depreciation of other property and equipment is recognized using the straight-line method based on estimated useful lives ranging from five to ten years.
Deferred Financing Costs
Deferred financing costs were $23.9 million (net of $3.5 million of accumulated amortization) and $20.3 million (net of $2.8 million of accumulated amortization) as of December 31, 2012 and 2011 , respectively and include legal fees, accounting fees, underwriting fees, printing costs, and other direct costs associated with the issuance of the debt securities and costs associated with revolving credit facilities. The capitalized costs are amortized to interest expense, net of amounts capitalized using the effective interest method over the terms of the debt securities or credit facilities.
Investment
The Company accounts for its investment in Oxane Materials, Inc. ("Oxane") using the cost method of accounting and adjusts the carrying amount of its investment for contributions to and distributions from Oxane.
Financial Instruments
The Company's financial instruments consist of cash and cash equivalents, receivables, payables, derivative instruments and long-term debt. The carrying amounts of cash and cash equivalents, receivables and payables approximate fair value due to the highly liquid or short-term nature of these instruments. The fair values of derivative instruments are based on a third-party pricing model which utilizes inputs that include (a) quoted forward prices for oil and gas, (b) discount rates, (c) volatility factors and (d) current market and contractual prices, as well as other relevant economic measures. The carrying amounts of long-term debt under the Company's revolving credit facility approximate fair value as the borrowings bear interest at variable rates of interest. The carrying amounts of the Company's senior notes and convertible senior notes may not approximate fair value because the notes bear interest at fixed rates of interest. See "Note 7. Long-Term Debt" and "Note 13. Fair Value Measurements."
F-12
Asset Retirement Obligations
The Company's oil and gas properties require expenditures to plug and abandon wells after the reserves have been depleted. The asset retirement obligation is recognized as a liability at its fair value when the well is drilled with an associated increase in oil and gas property costs. Asset retirement obligations require estimates of the costs to plug and abandon wells, the costs to restore the surface, the remaining lives of wells based on oil and gas reserve estimates and future inflation rates. The obligations are discounted using a credit-adjusted risk-free interest rate which is accreted over the estimated productive lives of the oil and gas properties to their expected settlement values. Estimated costs consider historical experience, third party estimates and state regulatory requirements and do not consider salvage values. At least annually, the Company reassesses its asset retirement obligations to determine whether a change in the estimated obligation is necessary. Revisions in estimated liabilities can result from changes in estimated inflation rates, changes in estimated costs to plug and abandon wells and changes in estimated timing of oil and gas property retirement. Upon settlement of the liability, the Company either settles the obligation for its recorded amount or incurs a gain or loss upon settlement, which is included in oil and gas property costs. On an interim basis, the Company reassesses the estimated cash flows underlying the obligation when indicators suggest the estimated cash flows underlying the obligation have materially changed and updates its estimated obligation if necessary.
Commitments and Contingencies
Liabilities are recognized for contingencies when (i) it is both probable that an asset has been impaired or that a liability has been incurred and (ii) the amount of such loss is reasonably estimable.
Revenue Recognition
Oil and gas revenues are recognized when the products are sold to a purchaser at a fixed or determinable price, delivery has occurred, title has transferred and collectability is reasonably assured. The Company follows the sales method of accounting for oil and gas revenues whereby revenue is recognized for all oil and gas sold to purchasers, regardless of whether the sales are proportionate to the Company's ownership interest in the property. Production imbalances are recognized as an asset or liability to the extent that the Company has an imbalance on a specific property that is in excess of its remaining proved oil and gas reserves. Oil and gas sales volumes are not significantly different from the Company's share of production and as of December 31, 2012 and 2011 , the Company did not have any material production imbalances.
Derivative Instruments
The Company uses derivative instruments, typically fixed-rate swaps, costless collars, puts, calls and basis differential swaps, to manage commodity price risk associated with a portion of its forecasted oil and gas production. Derivative instruments are recognized at their balance sheet date fair value as assets or liabilities in the consolidated balance sheets. Although the derivative instruments provide an economic hedge of the Company's exposure to commodity price risk associated with a portion of its forecasted oil and gas production, because the Company elected not to meet the criteria to qualify its derivative instruments for hedge accounting treatment, unrealized gains and losses as a result of changes in the fair value of derivative instruments are recognized as gain (loss) on derivative instruments, net in the consolidated statements of income. Realized gains and losses as a result of cash settlements with counterparties to the Company's derivative instruments are also recorded as gain (loss) on derivative instruments, net in the consolidated statements of income. The Company offsets fair value amounts recognized for derivative instruments executed with the same counterparty and subject to master netting agreements.
The Company's Board of Directors establishes risk management policies and reviews derivative instruments, including volumes, types of instruments and counterparties, on a quarterly basis. These policies require that derivative instruments be executed only by the President or Chief Financial Officer after consultation with and concurrence by the President, Chief Financial Officer and Chairman of the Board. The master contracts with approved counterparties identify the President and Chief Financial Officer as the only Company representatives authorized to execute trades. See "Note 12. Derivative Instruments" for further discussion of the Company's derivative instruments.
F-13
Stock-Based Compensation
The Company grants stock options, stock appreciation rights ("SARs") that may be settled in cash or common stock at the option of the Company, SARs that may only be settled in cash, restricted stock awards and units to directors, employees and independent contractors. The Company recognized the following stock-based compensation expense for the periods indicated which is reflected as general and administrative expense in the consolidated statements of income:
|
| Year Ended December 31, | ||||||||||
|
| 2012 |
| 2011 |
| 2010 | ||||||
|
|
|
| (In thousands) |
|
| ||||||
Stock Appreciation Rights |
| $ | (2,116 | ) |
| $ | 1,546 | |
| $ | 6,649 | |
Restricted Stock Awards and Units |
| 17,049 | |
| 13,965 | |
| 9,959 | | |||
|
| 14,933 | |
| 15,511 | |
| 16,608 | | |||
Less: amounts capitalized |
| (3,244 | ) |
| (3,647 | ) |
| - | | |||
Total Stock-Based Compensation Expense |
| $ | 11,689 | |
| $ | 11,864 | |
| $ | 16,608 | |
Income Tax Expense |
| $ | 4,449 | |
| $ | 4,342 | |
| $ | 6,152 | |
Stock Options and SARs. For stock options and SARs that the Company expects to settle in common stock, stock-based compensation expense is based on the grant-date fair value and recognized over the vesting period (generally three years). For SARs that the Company expects to settle in cash, stock-based compensation expense is based on the fair value remeasured at each reporting period, recognized over the vesting period (generally three years) and classified as other accrued liabilities for the portion of the awards that are vested or are expected to vest within the next 12 months, with the remainder classified as other long-term liabilities. Subsequent to vesting, the liability for any SARs that the Company expects to settle in cash is remeasured in earnings at each reporting period based fair value until the awards are settled. The Company recognizes stock-based compensation expense over the vesting period for stock options and SARs using the straight-line method, except for awards with performance conditions, in which case the Company uses the graded vesting method. Stock options typically expire ten years after the date of grant. SARs typically expire between four and seven years after the date of grant.
The Company uses the Black-Scholes-Merton option pricing model to compute the fair value of stock options and SARs, which requires the Company to make the following assumptions:
• | The risk-free interest rate is based on the zero-coupon United States Treasury yield for the expected term at date of grant. |
• | The dividend yield on the Company's common stock is assumed to be zero since the Company does not pay dividends and has no current plans to do so in the future. |
• | The volatility of the Company's common stock is based on daily, historical volatility of the market price of the Company's common stock over a period of time equal to the expected term and ending on the grant date. |
• | The expected term is based on historical exercises for various groups of directors, employees and independent contractors. |
Restricted Stock Awards and Units . For restricted stock awards and units, stock-based compensation expense is based on the grant-date fair value and recognized over the vesting period (generally one to three years) using the straight-line method, except for award or units with performance conditions, in which case the Company uses the graded vesting method. The fair value of restricted stock awards and units is based on the price of the Company's common stock on the grant date. For restricted stock awards and units granted to independent contractors, stock-based compensation expense is based on fair value remeasured at each reporting period and recognized over the vesting period (generally three years) using the straight-line method.
Income Taxes
Deferred income taxes are recognized at each reporting period for the future tax consequences of differences between the tax bases of assets and liabilities and their financial reporting amounts based on tax laws and statutory tax rates applicable to the periods in which the differences are expected to affect taxable income. The Company routinely assesses the realizability of its deferred tax assets and considers its estimate of future taxable income based on production of proved reserves at estimated future pricing in making such assessments by taxing jurisdiction. If the Company concludes that it is more likely than not that some portion or all of the deferred tax assets will not be realized, the deferred tax assets are reduced by a valuation allowance. The Company classifies interest and penalties associated with income taxes as interest expense.
F-14
Net Income From Continuing Operations Per Common Share
Supplemental net income from continuing operations per common share information is provided below:
|
| Year Ended December 31, | ||||||||||
|
| 2012 |
| 2011 |
| 2010 | ||||||
|
| (In thousands, except per share amounts) | ||||||||||
Net income from continuing operations |
| $ | 51,177 | |
| $ | 32,534 | |
| $ | 11,725 | |
Basic weighted average common shares outstanding |
| 39,591 | |
| 39,077 | |
| 33,861 | | |||
Effect of dilutive instruments |
| 435 | |
| 591 | |
| 444 | | |||
Diluted weighted average shares outstanding |
| 40,026 | |
| 39,668 | |
| 34,305 | | |||
Net income from continuing operations per common share |
|
|
|
|
|
| ||||||
Basic |
| $ | 1.29 | |
| $ | 0.83 | |
| $ | 0.34 | |
Diluted |
| $ | 1.28 | |
| $ | 0.82 | |
| $ | 0.34 | |
Basic net income per common share is based on the weighted average number of shares of common stock outstanding during the period. Diluted net income per common share is based on the weighted average number of common shares and all potentially dilutive common shares outstanding during the period which include restricted stock awards and units, stock options, SARs expected to be settled in common stock, warrants and convertible debt. The Company excludes shares related to restricted stock awards, units and stock options from the calculation of diluted weighted average shares outstanding when the grant prices are greater than the average market prices of the common shares for the period as the effect would be antidilutive to the computation. The shares excluded for the years ended December 31, 2012, 2011 and 2010 were not significant. Shares of common stock subject to issuance upon the conversion of the Company's convertible senior notes did not have an effect on the calculation of dilutive shares for the years ended December 31, 2012, 2011 and 2010 because the conversion price was in excess of the market price of the common stock for those periods.
3. Assets Held for Sale and Discontinued Operations
On December 27, 2012, the Company agreed to sell Carrizo UK, and all of its interest in the Huntington Field discovery, including a 15% non-operated working interest and certain overriding royalty interests, to a subsidiary of Iona Energy Inc. ("Iona Energy") for net proceeds of approximately $116.5 million, subject to final post-closing adjustments, which represents an agreed upon price of $184.0 million , including the assumption of $55.0 million in debt and net purchase price adjustments. Purchase price adjustments primarily relate to working capital and other adjustments, transaction costs and accrual of other obligations related to the transaction. The sale closed on February 22, 2013 . Carrizo UK's senior secured multicurrency credit facility agreement that was secured by substantially all of Carrizo UK's assets with limited recourse to the Company (the "Huntington Facility") was repaid by Iona Energy in connection with the sale transaction described above. As of December 31, 2012 and February 22, 2013, borrowings outstanding under the Huntington Facility were $52.0 million and $55.0 million , respectively. Additionally, the net proceeds include non-refundable deposits of $8.0 million received by the Company, in accordance with the sale and purchase agreement, as amended, and approximately $18.5 million in deferred consideration that the Company expects to receive as of the earlier of six months from the agreement closing date or when Iona Energy receives payment for its first lifting of production from the Huntington Field.
The U.K. North Sea assets and associated liabilities have been classified as current and long-term assets held for sale and current and long-term liabilities associated with assets held for sale in the consolidated balance sheets. The related results of operations and cash flows have been classified as discontinued operations, net of income taxes, in the consolidated statements of income and cash flows. For the years ended December 31, 2012, 2011 and 2010, the Company's U.K. North Sea assets had no production or revenues.
F-15
The following table summarizes the amounts included in current and long-term assets held for sale and liabilities associated with assets held for sale in the consolidated balance sheets as of December 31, 2012 and 2011:
|
| December 31, | ||||||
|
| 2012 |
| 2011 | ||||
|
| (In thousands) | ||||||
ASSETS HELD FOR SALE |
|
|
|
| ||||
CURRENT ASSETS |
|
|
|
| ||||
Cash and cash equivalents |
| $ | 519 | |
| $ | 1,715 | |
Prepaids and other current assets |
| 1,363 | |
| 2,159 | | ||
Total current assets held for sale |
| 1,882 | |
| 3,874 | | ||
LONG-TERM ASSETS |
|
|
|
| ||||
Property and equipment, net |
| 120,732 | |
| 69,597 | | ||
Deferred income taxes |
| 11,245 | |
| 6,238 | | ||
Other assets |
| 649 | |
| 2,896 | | ||
Total long-term assets held for sale |
| $ | 132,626 | |
| $ | 78,731 | |
|
|
|
|
| ||||
LIABILITIES ASSOCIATED WITH ASSETS HELD FOR SALE |
|
|
|
| ||||
CURRENT LIABILITIES |
|
|
|
| ||||
Accrued drilling costs |
| $ | 3,800 | |
| $ | 3,027 | |
Current maturities of long-term debt |
| 33,800 | |
| - | | ||
Other accrued liabilities |
| 11,063 | |
| 1,211 | | ||
Total current liabilities associated with assets held for sale |
| 48,663 | |
| 4,238 | | ||
LONG-TERM LIABILITIES |
|
|
|
| ||||
Long-term debt, net of current maturities |
| 18,200 | |
| 17,814 | | ||
Asset retirement obligations |
| 5,243 | |
| 3,843 | | ||
Other liabilities |
| 104 | |
| 772 | | ||
Total long-term liabilities associated with assets held for sale |
| $ | 23,547 | |
| $ | 22,429 | |
F-16
The following table summarizes the amounts included in net income (loss) from discontinued operations, net of income taxes presented in the consolidated statements of income for the years ended December 31, 2012, 2011 and 2010:
|
| For the Years Ended December 31, | ||||||||||
|
| 2012 |
| 2011 |
| 2010 | ||||||
|
| (In thousands) | ||||||||||
OIL AND GAS REVENUES |
| $ | - | |
| $ | - | |
| $ | - | |
COSTS AND EXPENSES |
|
|
|
|
|
| ||||||
Impairment of oil and gas properties |
| - | |
| - | |
| 2,731 | | |||
General and administrative |
| 62 | |
| 242 | |
| - | | |||
Accretion related to asset retirement obligations |
| 363 | |
| 76 | |
| - | | |||
TOTAL COST AND EXPENSES |
| 425 | |
| 318 | |
| 2,731 | | |||
OPERATING LOSS |
| (425 | ) |
| (318 | ) |
| (2,731 | ) | |||
OTHER INCOME AND EXPENSES |
|
|
|
|
|
| ||||||
Gain (loss) on derivative instruments, net |
| 258 | |
| (1,432 | ) |
| - | | |||
Interest expense |
| (3,556 | ) |
| (1,805 | ) |
| - | | |||
Capitalized interest |
| 3,556 | |
| - | |
| - | | |||
Other income (expense), net |
| (591 | ) |
| 259 | |
| - | | |||
LOSS BEFORE INCOME TAXES |
| (758 | ) |
| (3,296 | ) |
| (2,731 | ) | |||
DEFERRED INCOME TAX BENEFIT |
| 5,068 | |
| 7,391 | |
| 956 | | |||
NET INCOME (LOSS) FROM DISCONTINUED OPERATIONS, NET OF INCOME TAXES |
| $ | 4,310 | |
| $ | 4,095 | |
| $ | (1,775 | ) |
U.K. Huntington Field Development Project Credit Facility
On January 28, 2011, the Company and Carrizo UK, as borrower, entered into the Huntington Facility. The Huntington Facility was secured by substantially all of Carrizo UK's assets and was limited recourse to the Company. The Huntington Facility provided financing for a substantial portion of Carrizo UK's share of costs associated with the Huntington Field development project in the U.K. North Sea.
As of December 31, 2012 , borrowings outstanding under the Huntington Facility were $52.0 million, of which $33.8 million was classified as current, with a weighted average interest rate of 3.79% and no letters of credit had been issued. In connection with the sale of Carrizo UK, which closed on February 22, 2013 , the $55.0 million of borrowings then outstanding under the Huntington Facility was repaid.
Deferred Income Taxes
Carrizo UK is a disregarded entity for U.S. income tax purposes. Accordingly, included in the deferred income tax benefit for the U.K. North Sea is the Company's U.S. deferred income tax benefits of $0.1 million , $1.2 million , and $1.0 million for the years ended December 31, 2012, 2011 and 2010 respectively. The related U.S. deferred tax assets have been classified as deferred income taxes of continuing operations in the consolidated balance sheet.
Foreign Currency
The U.S. dollar is the functional currency for the Company's operations in the U.K. North Sea. Transaction gains or losses that occur due to the realization of assets and the settlement of liabilities denominated in a currency other than the functional currency are recorded as Other income (expense), net.
4. Investment
In May 2008, the Company entered into a strategic alliance agreement with Oxane in connection with the development of a proppant product to be used in the Company's exploration and production program. The Company contributed approximately $2.0 million to Oxane in exchange for warrants to purchase Oxane common stock and for certain exclusive use and preferential purchase rights with respect to the proppant. The Company simultaneously invested an additional $500,000 in a convertible promissory note from Oxane. The convertible promissory note accrued interest at a rate of 6% per annum. During the fourth quarter of 2008, the Company converted the promissory note into 630,371 shares of Oxane preferred stock. As of December 31, 2012 and 2011 , the carrying amount of the investment in Oxane was $2.5 million .
F-17
5. Property and Equipment, Net
At December 31, 2012 and 2011 , property and equipment, net consisted of the following:
|
| December 31, | ||||||
|
| 2012 |
| 2011 | ||||
|
| (In thousands) | ||||||
Proved oil and gas properties |
| $ | 1,713,827 | |
| $ | 1,235,487 | |
Accumulated depreciation, depletion and amortization |
| (561,279 | ) |
| (397,737 | ) | ||
Proved oil and gas properties, net |
| 1,152,548 | |
| 837,750 | | ||
Unproved properties, not being amortized |
|
|
|
| ||||
Unevaluated leasehold and seismic costs |
| 238,833 | |
| 277,425 | | ||
Exploratory wells in progress |
| 43,803 | |
| 70,533 | | ||
Capitalized interest |
| 41,052 | |
| 46,471 | | ||
Total costs not subject to amortization |
| 323,688 | |
| 394,429 | | ||
Other property and equipment |
| 17,079 | |
| 12,835 | | ||
Accumulated depreciation |
| (5,641 | ) |
| (4,097 | ) | ||
Other property and equipment, net |
| 11,438 | |
| 8,738 | | ||
Total property and equipment, net |
| $ | 1,487,674 | |
| $ | 1,240,917 | |
Costs not subject to amortization totaling $323.7 million at December 31, 2012 were incurred in the following periods: $177.0 million in 2012 , $110.0 million in 2011 , $34.7 million in 2010 and $2.0 million in 2009 and prior years.
Sale of Barnett Shale Properties
During the second quarter of 2011, the Company sold a substantial portion of its non-core area Barnett Shale properties to KKR Natural Resources ("KKR"), a partnership formed between an affiliate of Kohlberg Kravis Roberts & Co. L.P. and Premier Natural Resources. Net proceeds received from the sale were approximately $98.0 million , which represents an agreed upon price of approximately $104.0 million less net purchase price adjustments. Purchase price adjustments primarily relate to proceeds received by the Company for sales of hydrocarbons from such properties between the effective date of January 1, 2011 and the closing date of May 17, 2011. The proceeds from such sale were recognized as a reduction of proved oil and gas properties.
During the second quarter of 2012, the Company sold a significant portion of its Barnett Shale properties to an affiliate of Atlas
Resource Partners, L.P. ("Atlas"). Net proceeds received from the sale were approximately $187.4 million , which represents an agreed upon price of $190.0 million less net purchase price adjustments. Purchase price adjustments primarily relate to proceeds received by the Company for sales of hydrocarbons from such properties between the effective date of January 1, 2012 and the closing date of April 30, 2012. The proceeds from such sale were recognized as a reduction of proved oil and gas properties.
Sale of Gulf Coast Properties
During the third quarter of 2012, the Company completed the sale of substantially all of its legacy producing properties along the onshore Gulf of Mexico located primarily in Texas and Louisiana. Net proceeds received from the sale were approximately $17.6 million , which represents an agreed upon price of $19.3 million less net purchase price adjustments. Purchase price adjustments primarily relate to proceeds received by the Company for sales of hydrocarbons from such properties between the effective date of July 1, 2012 and the closing date of September 27, 2012. The proceeds from such sale were recognized as a reduction of proved oil and gas properties.
Sale of Utica Properties
In October 2012, the Company sold substantially all of its interests in oil and gas properties dedicated to its Utica joint venture in the northern portion of the Utica Shale play to a third party and received net cash proceeds of $51.7 million , after final post-closing adjustments. The proceeds from such sale were recognized as a reduction of proved oil and gas properties, net. Other assets included in the sale were an existing drilling pad and approved well drilling permits associated with the properties. The properties sold are located in Mercer and Crawford counties in Pennsylvania and Trumbull county in Ohio.
F-18
In connection with and prior to the Utica sale transactions described above, the Company elected to exercise its option to increase its participating interest from 10% to 50% in the same oil and gas properties on a "net proceeds basis" so that the Company received net proceeds with respect to 50% of the properties subject to the sale rather than the 10% for which it held record title. For additional information see "Note 11. Related Party Transactions."
Marcellus Shale Joint Venture
In connection with the formation of ACP II Marcellus LLC ("ACP II"), the Company's partner in one of its two joint ventures in the Marcellus Shale, the Company was issued a class of interests ("B Units") in ACP II. The B Units entitle the Company to certain percentages of cash distributions to affiliates of Avista Capital Partners, LP (together with its affiliates, "Avista"), if, when and only to the extent that those cash distributions exceed certain internal rates-of-return and return-on-investment thresholds with respect to Avista's investment in ACP II. During the second quarter of 2011, ACP II declared and paid cash distributions to Avista that exceeded Avista's internal rates-of-return and return-on-investment thresholds. Therefore, the Company received cash distributions of approximately $3.3 million in the second quarter of 2011on its B Units, which were recognized as reductions of proved oil and gas properties.
In June 2011, in accordance with the title and post-closing adjustment provisions of the sale and purchase agreements of the September 2010 sale by the Company of certain oil and gas properties to Reliance Marcellus II, LLC ("Reliance"), the Company provided additional interests in oil and gas properties in parts of Pennsylvania in the Marcellus Shale to Reliance in substitution of properties included in the sale that were affected by certain alleged title defects. In exchange for such substitute properties, the Company received $0.3 million in cash from Reliance relating to the sale of 20% of its interest.
Eagle Ford Joint Venture
On September 28, 2011, the Company completed the sale of 20% of its interests in oil and gas properties in parts of the Eagle Ford Shale to GAIL GLOBAL (USA) INC. ("GAIL"), a wholly owned subsidiary of GAIL (India) Limited, effective September 1, 2011. Under the purchase and participation agreement for this transaction, the Company received $63.7 million in cash which was recognized as a reduction of proved oil and gas properties. As part of the consideration for the purchase, GAIL committed to pay a "development carry" of 50% of certain of the Company's future development costs up to approximately $31.3 million , which was fully utilized in 2012 . The agreement provides for an ongoing joint venture between the Company and GAIL with respect to the interests purchased by GAIL. The Company serves as operator for the joint venture properties. The joint venture agreement also provides for an area of mutual interest including the purchased interests and specified areas adjacent to such interests. GAIL will have the right to purchase certain interests acquired by the Company in the area of mutual interest at a specified premium to the price paid by the Company.
Niobrara Joint Ventures
OIL India (USA) Inc. and IOCL (USA) Inc. In October 2012, the Company completed the sale of 30% of substantially all of its interests in oil and gas properties in the Niobrara Formation to OIL India (USA) Inc. and IOCL (USA) Inc., subsidiaries of OIL India Ltd. and Indian Oil Corporation Ltd., respectively, effective October 1, 2012. For convenience, in these Notes to Consolidated Financial Statements the term "OIL JV Partners" is used to refer collectively to OIL India (USA) Inc. and IOCL (USA) Inc. Under the purchase and participation agreement for this transaction, the Company received approximately $41.25 million in cash and the OIL JV Partners have committed to pay a "development carry" of 50% of certain of the Company's future development costs up to an aggregate of approximately $41.25 million , as further described below. The proceeds from such sale was recognized as a reduction of proved oil and gas properties.
The agreement also provides for an ongoing joint venture between the Company and the OIL JV Partners with respect to the interests purchased. The development carry obligation extends until the full utilization of the approximately $41.25 million development carry. The Company operates the joint venture properties, and currently expects the development carry to be fully utilized by early 2014. The Niobrara Formation assets conveyed to the OIL JV Partners under the terms of the agreement are located primarily in Weld and Adams counties, Colorado.
Haimo Oil & Gas LLC. In December 2012, the Company completed the sale of a portion of its remaining interest in the same oil and gas properties sold to the OIL JV Partners in the transaction described above to Haimo Oil & Gas LLC ("Haimo"), a subsidiary of Lanzhou Haimo Technologies Co. Ltd., effective October 1, 2012, for a cash payment of $27.5 million . The proceeds from such sale were recognized as a reduction of proved oil and gas properties. The purchase and participation agreement for this transaction provides for an ongoing joint venture between the Company and Haimo, with respect to the interests purchased. The Company will operate the joint venture properties. Following the closing of the Haimo transaction late in the fourth quarter of 2012, the Company, the OIL JV Partners , and Haimo own 60% , 30% and 10% of the joint venture acreage, respectively.
F-19
6. Income Taxes
The components of income tax expense from continuing operations were as follows:
|
| Year Ended December 31, | ||||||||||
|
| 2012 |
| 2011 |
| 2010 | ||||||
|
|
|
| (In thousands) |
|
| ||||||
Current income tax expense |
|
|
|
|
|
| ||||||
U.S. Federal |
| $ | (411 | ) |
| $ | (404 | ) |
| $ | - | |
State |
| (403 | ) |
| (661 | ) |
| (4,236 | ) | |||
Total current income tax expense |
| (814 | ) |
| (1,065 | ) |
| (4,236 | ) | |||
Deferred income tax (expense) benefit |
|
|
|
|
|
| ||||||
U.S. Federal |
| (28,723 | ) |
| (23,254 | ) |
| (5,893 | ) | |||
State |
| (1,419 | ) |
| (1,292 | ) |
| 3,444 | | |||
Total deferred income tax expense |
| (30,142 | ) |
| (24,546 | ) |
| (2,449 | ) | |||
Total income tax expense from continuing operations |
| $ | (30,956 | ) |
| $ | (25,611 | ) |
| $ | (6,685 | ) |
The Company's income tax expense from continuing operations differs from the income tax expense computed by applying the U.S. federal statutory corporate income tax rate of 35% to income from continuing operations before income taxes as follows:
|
| Year Ended December 31, | ||||||||||
|
| 2012 |
| 2011 |
| 2010 | ||||||
|
|
|
| (In thousands) |
|
| ||||||
Income from continuing operations before income taxes |
| $ | 82,133 | |
| $ | 58,145 | |
| $ | 18,410 | |
Income tax expense at the statutory rate |
| (28,747 | ) |
| (20,350 | ) |
| (6,444 | ) | |||
State income taxes, net of U.S. federal income tax benefit |
| (1,681 | ) |
| (1,722 | ) |
| (792 | ) | |||
Adjustment to prior period state income taxes, net of U.S. federal income tax benefit |
| - | |
| (4,735 | ) |
| - | | |||
Previously unbenefitted capital loss associated with investment |
|
|
| 1,171 | |
|
| |||||
Nondeductible expenses |
| (93 | ) |
| 25 | |
| (46 | ) | |||
Other |
| (435 | ) |
| - | |
| 597 | | |||
Total income tax expense from continuing operations |
| $ | (30,956 | ) |
| $ | (25,611 | ) |
| $ | (6,685 | ) |
F-20
Deferred income taxes reflect the impact of temporary differences between the amount of assets and liabilities recognized for financial reporting purposes and such amounts recognized for tax purposes. At December 31, 2012 and 2011 , deferred tax assets and liabilities are comprised of the following:
|
| December 31, | ||||||
|
| 2012 |
| 2011 | ||||
|
| (In thousands) | ||||||
Deferred income tax assets |
|
|
|
| ||||
Net operating loss carryforward - Federal and State |
| $ | 53,648 | |
| $ | 42,442 | |
Property and equipment |
| 20,425 | |
| 55,307 | | ||
Stock-based compensation |
| 4,245 | |
| 4,469 | | ||
Allowance for doubtful accounts |
| 476 | |
| 806 | | ||
Fair value of derivative instruments |
| - | |
| 75 | | ||
Valuation allowance |
| (1,188 | ) |
| (681 | ) | ||
Other |
| 1,755 | |
| 1,335 | | ||
|
| 79,361 | |
| 103,753 | | ||
Deferred income tax liabilities |
|
|
|
| ||||
Unamortized discount on 4.375% Convertible Senior Notes |
| (382 | ) |
| (1,329 | ) | ||
Capitalized interest |
| (55,410 | ) |
| (45,469 | ) | ||
Fair value of derivative instruments |
| (10,222 | ) |
| (13,123 | ) | ||
|
| (66,014 | ) |
| (59,921 | ) | ||
Net deferred income tax asset |
| $ | 13,347 | |
| $ | 43,832 | |
Deferred income tax assets and liabilities are classified as current or long term consistent with the classification of the related temporary difference. At December 31, 2012 and 2011 , the net deferred income tax asset is classified as follows:
|
| December 31, | ||||||
|
| 2012 |
| 2011 | ||||
|
| (In thousands) | ||||||
Noncurrent deferred income tax asset |
| $ | 21,272 | |
| $ | 53,517 | |
Current deferred income tax liability |
| (7,925 | ) |
| (9,685 | ) | ||
Net deferred income tax asset |
| $ | 13,347 | |
| $ | 43,832 | |
As of December 31, 2012 , the Company had U.S. income tax loss carryforwards of approximately $176.9 million . The U.S. loss carryforwards expire between 2019 and 2032 if not utilized in earlier periods. The realization of the deferred tax assets related to the U.S. loss carryforwards is dependent on the Company's ability to generate sufficient future taxable income in the U.S. within the applicable carryforward periods. As of December 31, 2011, the Company determined it was more likely than not that some of its state loss carryforwards would not be realized and accordingly, established a valuation allowance for which this totaled $1.2 million at December 31, 2012. The Company believes it will be able to generate sufficient future taxable income in the U.S. within the carryforward periods. As such, the Company believes that it is more likely than not that its net deferred income tax assets will be fully realized except for those state loss carryforwards for which valuation allowance has been established.
The ability of the Company to utilize its U.S. loss carryforwards to reduce future taxable income is subject to various limitations under the Internal Revenue Code of 1986, as amended (the "Code"). The utilization of such carryforwards may be limited upon the occurrence of certain ownership changes, including the purchase or sale of stock by 5% shareholders and the offering of stock by the Company during any three-year period resulting in an aggregate change of more than 50% in the beneficial ownership of the Company. In the event of an ownership change, Section 382 of the Code imposes an annual limitation on the amount of the Company's taxable income that can be offset by these carryforwards. The limitation is generally equal to the product of (a) the fair market value of the equity of the Company multiplied by (b) a percentage approximately equivalent to the yield on long-term tax exempt bonds during the month in which an ownership change occurs. In addition, the limitation is increased if there are recognized built-in gains during any post-change year, but only to the extent of any net unrealized built-in gains inherent in the assets sold. As of December 31, 2012, the Company believes an ownership change occurred in February 2005, which imposed an annual limitation of $12.6 million of the Company's taxable income that can be offset by the pre-change carryforwards. Because the Company's aggregate pre-change loss carryforward is $9.8 million , the Company does not believe it has a Section 382 limitation on the ability to utilize its U.S. loss carryforwards as of December 31, 2012. Future equity transactions involving the Company or 5% shareholders of the Company (including, potentially, relatively small transactions and transactions beyond the Company's control) could cause further ownership changes and therefore a limitation on the annual utilization of the U.S. loss carryforwards.
F-21
The Company receives a tax deduction during the period stock options are exercised, generally for the excess of the exercise date stock price over the exercise price of the option. The Company also receives a tax deduction during the period restricted stock awards and units vest, generally equal to the fair value on the date that the awards or units vest. Because these stock-based compensation tax deductions did not reduce current taxes payable as a result of U.S. loss carryforwards, the benefit of these tax deductions has not been reflected in the U.S. loss carryforward deferred tax asset. Stock-based compensation deductions included in the U.S. loss carryforwards of $176.9 million but not reflected in deferred tax assets were $29.2 million at December 31, 2012. The Company plans to recognize the $10.2 million deferred tax asset associated with these stock-based compensation tax deductions when all other components of the U.S. loss carryforward deferred tax asset have been fully utilized. If and when the stock-based compensation deduction related U.S. loss carryforward deferred tax asset is realized, the tax benefit of reducing current taxes payable will be credited directly to additional paid-in capital.
At December 31, 2012 , the Company had no material uncertain tax positions and the tax years since 1999 remain open to review by federal and various state tax jurisdictions.
7. Long-Term Debt
At December 31, 2012 and 2011 , long-term debt consisted of the following:
|
| December 31, | ||||||
|
| 2012 |
| 2011 | ||||
|
| (In thousands) | ||||||
8.625% Senior Notes |
| $ | 600,000 | |
| $ | 600,000 | |
Unamortized discount for 8.625% Senior Notes |
| (4,849 | ) |
| (5,465 | ) | ||
7.50% Senior Notes |
| 300,000 | |
| - | | ||
4.375% Convertible Senior Notes |
| 73,750 | |
| 73,750 | | ||
Unamortized discount for 4.375% Convertible Senior Notes |
| (1,093 | ) |
| (3,799 | ) | ||
Senior Secured Revolving Credit Facility |
| - | |
| 47,000 | | ||
|
| $ | 967,808 | |
| $ | 711,486 | |
8.625% Senior Notes and 7.50% Senior Notes
On November 2, 2010, the Company issued $400.0 million aggregate principal amount of 8.625% Senior Notes due 2018 in a private placement. On November 17, 2011, the Company issued an additional $200.0 million aggregate principal amount of 8.625% Senior Notes in a private placement. These notes were issued as "additional notes" under the indenture governing the 8.625% Senior Notes pursuant to which the Company had previously issued $400.0 million aggregate principal amount of 8.625% Senior Notes in November 2010, and under the indenture are treated as a single series with substantially identical terms as the 8.625% Senior Notes previously issued in November 2010. In June 2011 and February 2012, the Company completed the exchange of registered 8.625% Senior Notes for any and all of its then unregistered $400.0 million and $200.0 million aggregate principal amount of 8.625% Senior Notes, respectively.
Except in certain circumstances described below, the Company may not redeem the 8.625% Senior Notes prior to October 15, 2014. On and after October 15, 2014, the Company may redeem all or a part of the 8.625% Senior Notes, at redemption prices decreasing from 104.313% of the principal amount to 100% of the principal amount on October 15, 2017, plus accrued and unpaid interest. In connection with certain equity offerings by the Company, the Company may at any time prior to October 15, 2013, subject to certain conditions, on one or more occasions, redeem up to 35% of the aggregate principal amount of the 8.625% Senior Notes at a redemption price of 108.625% of the principal amount, plus accrued and unpaid interest, if any, to the redemption date using the net cash proceeds of such equity offerings. Prior to October 15, 2014, the Company may redeem all or part of the 8.625% Senior Notes at 100% of the principal amount thereof, plus accrued and unpaid interest and a make whole premium (as defined in the indenture governing the 8.625% Senior Notes). If a Change of Control (as defined in the indenture governing the 8.625% Senior Notes) occurs, the Company may be required by holders to repurchase the 8.625% Senior Notes for cash at a price equal to 101% of the aggregate principal amount, plus any accrued but unpaid interest.
On September 10, 2012, the Company issued in a public offering $300.0 million aggregate principal amount of 7.50% Senior Notes due 2020. Except in certain circumstances described below, the Company may not redeem the 7.50% Senior Notes prior to September 15, 2016. On and after September 15, 2016, the Company may redeem all or a part of the 7.50% Senior Notes, at redemption prices decreasing from 103.750% of the principal amount to 100% of the principal amount on September 15, 2018, plus accrued and unpaid interest. In connection with certain equity offerings by the Company, the Company may at any time prior to September 15, 2015, subject to certain conditions, on one or more occasions, redeem up to 35% of the aggregate principal amount of the 7.50% Senior Notes at a redemption price of 107.500% of the principal amount, plus accrued and unpaid interest,
F-22
if any, to the redemption date using the net cash proceeds of such equity offerings. Prior to September 15, 2016, the Company may redeem all or part of the 7.50% Senior Notes at 100% of the principal amount thereof, plus accrued and unpaid interest and a make whole premium (as defined in the indenture governing the 7.50% Senior Notes). If a Change of Control (as defined in the indenture governing the 7.50% Senior Notes) occurs, the Company may be required by holders to repurchase the 7.50% Senior Notes for cash at a price equal to 101% of the aggregate principal amount, plus any accrued but unpaid interest.
The indentures governing the 8.625% Senior Notes and the 7.50% Senior Notes contain covenants that, among other things, limit the Company's ability and the ability of its restricted subsidiaries to: pay distributions on, purchase or redeem the Company's common stock or other capital stock or redeem the Company's subordinated debt; make investments; incur or guarantee additional indebtedness or issue certain types of equity securities; create certain liens; sell assets; consolidate, merge or transfer all or substantially all of the Company's assets; enter into agreements that restrict distributions or other payments from the Company's restricted subsidiaries to the Company; engage in transactions with affiliates; and create unrestricted subsidiaries. At December 31, 2012 , the 8.625% Senior Notes and the 7.50% Senior Notes were guaranteed by all of the Company's existing subsidiaries (other than Carrizo UK Huntington Ltd, Monument Exploration LLC, and Carrizo UK Bardolph Ltd).
Convertible Senior Notes
In May 2008, the Company issued $373.8 million aggregate principal amount of 4.375% Convertible Senior Notes due 2028. The notes are convertible, using a net share settlement process, into a combination of cash and Company common stock that entitles holders of the convertible senior notes to receive cash up to the principal amount ( $1,000 per note) and common stock in respect of the remainder, if any, of the Company's conversion obligation in excess of such principal amount.
In November 2010, the Company completed a tender offer for $300.0 million aggregate principal amount outstanding of its convertible senior notes. Each holder received $1,000 for each $1,000 principal amount of convertible senior notes purchased in the tender offer, plus accrued and unpaid interest. The Company recognized a $31.0 million pre-tax loss on extinguishment of debt as a result of the purchase of the convertible senior notes in the tender offer, substantially all of which was non-cash representing the associated unamortized discount and deferred financing costs. After the Company's purchase of $300.0 million aggregate principal amount of convertible senior notes, $73.8 million aggregate principal amount of convertible senior notes was outstanding as of December 31, 2012 and 2011 .
The convertible senior notes are subject to customary non-financial covenants and events of default, including certain cross defaults of other indebtedness and mortgages, the occurrence and continuation of which could result in the acceleration of amounts due under the convertible senior notes. The convertible senior notes are unsecured obligations of the Company and rank equal to the Company's senior notes and all future senior unsecured debt of the Company but rank second in priority to the senior secured revolving credit facility.
The notes are convertible into the Company's common stock at a ratio of 9.9936 shares per $1,000 principal amount of notes, equivalent to a conversion price of approximately $100.06 . This conversion rate is subject to adjustment upon certain corporate events. In addition, if certain fundamental changes occur on or before June 1, 2013, the Company will in some cases increase the conversion rate for a holder electing to convert notes in connection with such fundamental change; provided, that in no event will the total number of shares issuable upon conversion of a note exceed 14.7406 per $1,000 principal amount of notes (subject to adjustment in the same manner as the conversion rate).
Holders may convert the notes only under the following conditions: (a) during any calendar quarter if the last reported sale price of the Company's common stock exceeds 130% of the conversion price for at least 20 trading days in a period of 30 consecutive trading days ending on the last trading day of the immediately preceding calendar quarter, (b) during the five business days after any five consecutive trading day period in which the trading price per $1,000 principal amount of the notes is equal to or less than 97% of the conversion value of such notes, (c) during specified periods if specified distributions to holders of the Company's common stock are made or specified corporate transactions occur, (d) prior to the close of business on the business day preceding the redemption date if the notes are called for redemption or (e) on or after March 31, 2028 and prior to the close of business on the business day prior to the maturity date of June 1, 2028.
The holders of the convertible senior notes may require the Company to repurchase the notes on June 1, 2013, 2018 and 2023, or upon a fundamental corporate change at a repurchase price in cash equal to 100% of the principal amount of the notes to be repurchased plus accrued and unpaid interest, if any. The Company may redeem notes at any time on or after June 1, 2013 at a redemption price equal to 100% of the principal amount of the notes to be redeemed plus accrued and unpaid interest, if any.
The Company valued the convertible senior notes at May 21, 2008, as $309.6 million of debt and $64.2 million of equity representing the fair value of the conversion premium. The resulting debt discount is being amortized to interest expense through June 1, 2013, the first date on which the holders may require the Company to repurchase the convertible senior notes, resulting in an effective interest rate of approximately 8% for the convertible senior notes. Approximately $27.1 million of the remaining debt discount
F-23
associated with the convertible senior notes purchased in the tender offer discussed above was recognized as a component of the loss on the extinguishment of debt in 2010. Amortization of the debt discount amounted to $2.7 million , $2.6 million and $11.6 million for the years ended December 31, 2012 , 2011 and 2010 , respectively.
While the holders of the convertible senior notes may require the Company to repurchase the convertible senior notes in June 2013, the Company has the intent and ability to refinance the convertible senior notes on a long-term basis with the available capacity of its senior secured revolving credit facility, and accordingly, the convertible senior notes have been classified as long-term debt in the consolidated balance sheets as of December 31, 2012.
Senior Secured Revolving Credit Facility
The Company is party to a senior secured revolving credit facility with Wells Fargo Bank, National Association as the administrative agent. The revolving credit facility provides for a borrowing capacity up to the lesser of (i) the borrowing base (as defined in the senior credit agreement governing the revolving credit facility) and (ii) $750.0 million . The revolving credit facility matures on January 27, 2016. The revolving credit facility is secured by substantially all of the Company's U.S. assets and is guaranteed by the same subsidiaries that guarantee the Company's 8.625% Senior Notes, 7.50% Senior Notes and convertible senior notes.
The current borrowing base is $365.0 million . The borrowing base will be redetermined by the lenders at least semi-annually on each May 1 and November 1, with the next redetermination expected on or about May 1, 2013. The amount the Company is able to borrow with respect to the borrowing base is subject to compliance with the financial covenants and other provisions of the credit agreement governing the revolving credit facility.
The annual interest rate on each base rate borrowing is (a) the greatest of the Agent's Prime Rate, the Federal Funds Effective Rate plus 0.5% and the adjusted LIBO rate for a three-month interest period on such day plus 1.00% , plus (b) a margin between 1.00% and 2.00% (depending on the then-current level of borrowing base usage). The interest rate on each Eurodollar loan will be the adjusted LIBO rate for the applicable interest period plus a margin between 2.00% to 3.00% (depending on the then-current level of borrowing base usage).
On March 26, 2012, the revolving credit facility was amended to, among other things, (1) extend by two quarters the dates on which the maximum ratio of Total Debt to EBITDA (each as defined in the credit agreement governing the revolving credit facility) steps down and (2) increase the basket available for redemptions of the Company's convertible senior notes. On September 4, 2012 the revolving credit facility was further amended to increase the basket available for issuances of additional senior notes, including those issued in the September 2012 notes offering. On September 27, 2012, the revolving credit facility was again amended to, among other things, extend the maximum permitted duration of hedge agreements entered into by the Company and its restricted subsidiaries and to reflect the Fall 2012 borrowing base redetermination.
The Company is subject to certain covenants under the terms of the revolving credit facility which include the maintenance of the following financial covenants: (1) a ratio of Total Debt to EBITDA of not more than (a) 4.25 to 1.00 for the fiscal quarter ending December 31, 2012 and (b) 4.00 to 1.00 for fiscal quarters ending March 31, 2013 and thereafter; (2) a Current Ratio of not less than 1.00 to 1.00; (3) a ratio of Senior Debt to EBITDA of not more than 2.50 to 1.00; and (4) a ratio of EBITDA to Interest Expense of not less than 2.50 to 1.00 (each of the capitalized terms used in the foregoing clauses (1) through (4) being as defined in the credit agreement governing the revolving credit facility). At December 31, 2012 , the ratio of Total Debt to EBITDA was 2.97 to 1.00, the Current Ratio was 2.23 to 1.00, the ratio of Senior Debt to EBITDA was 0.00 to 1.00 and the ratio of EBITDA to Interest Expense was 5.19 to 1.00. Total Debt and Senior Debt, as defined in the credit agreement governing the revolving credit facility, are net of cash and cash equivalents of the Company. Because the calculation of the financial ratios are made as of a certain date, the financial ratios can fluctuate significantly period to period as the amounts outstanding under the revolving credit facility are dependent on the timing of cash flows related to operations, capital expenditures, sales of oil and gas properties and securities offerings.
The revolving credit facility also places restrictions on the Company and certain of its subsidiaries with respect to additional indebtedness, liens, dividends and other payments to shareholders, repurchases or redemptions of the Company's common stock, redemptions of senior notes, investments, acquisitions, mergers, asset dispositions, transactions with affiliates, hedging transactions and other matters.
The revolving credit facility is subject to customary events of default, including a change in control (as defined in the credit agreement governing the revolving credit facility). If an event of default occurs and is continuing, the Majority Lenders (as defined in the credit agreement governing the revolving credit facility) may accelerate amounts due under the revolving credit facility (except for a bankruptcy event of default, in which case such amounts will automatically become due and payable).
At December 31, 2012 , the Company had no borrowings outstanding under the revolving credit facility. At December 31, 2012 , the Company also had $0.9 million in letters of credit outstanding which reduced the amounts available under the revolving credit f
F-24
acility. The revolving credit facility is generally used to fund ongoing working capital needs and the remainder of the Company's capital expenditure plan to the extent such amounts exceed the cash flow from operations, proceeds from the sale of oil and gas properties and securities offerings. The revolving credit facility may also be used to repurchase the convertible senior notes.
8. Asset Retirement Obligations
|
| Year Ended December 31, | ||||||
|
| 2012 |
| 2011 | ||||
|
| (In thousands) | ||||||
Asset retirement obligations at beginning of period |
| $ | 8,324 | |
| $ | 5,250 | |
Liabilities incurred |
| 1,573 | |
| 757 | | ||
Liabilities settled |
| (1,666 | ) |
| (162 | ) | ||
Reduction due to property sales |
| (3,272 | ) |
| (368 | ) | ||
Accretion expense |
| 372 | |
| 235 | | ||
Revisions of previous estimates |
| 828 | |
| 2,612 | | ||
Asset retirement obligations at end of period |
| 6,159 | |
| 8,324 | | ||
Asset retirement obligations due within one year included in "Other accrued liabilities" |
| (1,670 | ) |
| (925 | ) | ||
Long-term asset retirement obligations |
| $ | 4,489 | |
| $ | 7,399 | |
9. Commitments and Contingencies
From time to time, the Company is party to certain legal actions and claims arising in the ordinary course of business. While the outcome of these events cannot be predicted with certainty, management does not expect these matters to have a materially adverse effect on the financial position or results of operations of the Company.
The results of operations and financial position of the Company continue to be affected from time to time in varying degrees by domestic and foreign political developments as well as legislation and regulations pertaining to restrictions on oil and natural gas production, imports and exports, natural gas regulation, tax increases, environmental regulations and cancellation of contract rights. Both the likelihood and overall effect of such occurrences on the Company vary greatly and are not predictable.
Rent expense included in general and administrative expense for the years ended December 31, 2012 , 2011 and 2010 was $1.8 million , $1.7 million , and $1.0 million , respectively, and includes rent expense primarily for the Company's corporate office and field offices.
At December 31, 2012 , total minimum commitments from long-term, non-cancelable operating leases, drilling rig, seismic and pipeline volume commitments are as follows:
| Amount | ||
| (In thousands) | ||
2013 | $ | 81,548 | |
2014 | 48,827 | | |
2015 | 27,215 | | |
2016 | 12,170 | | |
2017 | 5,411 | | |
2018 and thereafter | 15,512 | | |
| $ | 190,683 | |
F-25
10. Shareholders' Equity and Stock Incentive Plans
Shareholders' Equity
Common Stock . In December 2010 , the Company sold 3.975 million shares of its common stock in an underwritten public offering at a price to the underwriter of $ 28.90 per share. The Company used the net proceeds of approximately $ 114.9 million to repay a portion of the outstanding borrowings under the Prior Credit Facility.
In April 2010 , the Company sold 3.22 million shares of its common stock in an underwritten public offering at a price to the underwriter of $23.00 per share. The Company used the net proceeds of approximately $73.8 million to repay a portion of the outstanding borrowings under the Prior Credit Facility.
Warrants . On November 24, 2009 , the Company entered into a land agreement with an unrelated third party and its affiliate. The land agreement expired pursuant to its terms on May 31, 2011 . Under the land agreement, the Company issued warrants to purchase 31,983 , 28,576 and 57,641 shares of common stock in 2012 , 2011 and 2010 , respectively. The final issuance of warrants under the land agreement was granted in April 2012 . The warrants have an expiration date of August 21, 2017 , an exercise price of $22.09 , which may be exercised on a "cashless" basis, and are subject to antidilution adjustments.
Stock Incentive Plans
The Company has established the Incentive Plan of Carrizo Oil & Gas, Inc., as amended (the "Incentive Plan"), which authorizes the granting of stock options, SARs that may be settled in cash or common stock at the option of the Company, restricted stock awards and restricted stock units to directors, employees and independent contractors. The Company may grant awards of up to 7,245,000 shares (subject to certain limitations on restricted stock and restricted stock units) under the Incentive Plan and through December 31, 2012 , has issued stock options, restricted stock awards and restricted stock units covering 5,070,325 shares, net of forfeitures and excluding SARs the Company has elected to settle in cash.
F-26
Stock Options and Stock SARs. The table below summarizes the activity for stock options and SARs the Company has elected to settle in common stock for the three years ended December 31, 2012 , 2011 and 2010 :
|
| Shares |
| Weighted- Average Exercise Prices |
| Weighted- Average Remaining Life (In years) |
| Aggregate Intrinsic Value (In millions) | |||||
For the Year Ended December 31, 2010 |
|
|
|
|
|
|
|
| |||||
Outstanding, beginning of period |
| 895,463 | |
| $ | 8.43 | |
|
|
|
| ||
Granted |
| - | |
| - | |
|
|
|
| |||
Exercised |
| (266,433 | ) |
| 2.59 | |
|
|
|
| |||
Forfeited |
| (2,493 | ) |
| 18.56 | |
|
|
|
| |||
Other |
| (211,683 | ) |
| 20.22 | |
|
|
|
| |||
Outstanding, end of period |
| 414,854 | |
| $ | 6.10 | |
|
|
|
| ||
Exercisable, end of period |
| 414,854 | |
| $ | 6.10 | |
|
|
|
| ||
For the Year Ended December 31, 2011 |
|
|
|
|
|
|
|
| |||||
Outstanding, beginning of period |
| 414,854 | |
| $ | 6.10 | |
|
|
|
| ||
Granted |
| - | |
| - | |
|
|
|
| |||
Exercised |
| (151,500 | ) |
| 4.36 | |
|
|
|
| |||
Forfeited |
| - | |
| - | |
|
|
|
| |||
Outstanding, end of period |
| 263,354 | |
| $ | 7.11 | |
|
|
|
| ||
Exercisable, end of period |
| 263,354 | |
| $ | 7.11 | |
|
|
|
| ||
For the Year Ended December 31, 2012 |
|
|
|
|
|
|
|
| |||||
Outstanding, beginning of period |
| 263,354 | |
| $ | 7.11 | |
|
|
|
| ||
Granted |
| - | |
| - | |
|
|
|
| |||
Exercised |
| (20,500 | ) |
| 5.50 | |
|
|
|
| |||
Forfeited |
| - | |
| - | |
|
|
|
| |||
Outstanding, end of period |
| 242,854 | |
| $ | 7.24 | |
| 0.87 |
| $ | 3.21 | |
Exercisable, end of period |
| 242,854 | |
| $ | 7.24 | |
| 0.87 |
| $ | 3.21 | |
No stock options or SARs were granted under the Incentive Plan during 2010 , 2011 or 2012 . All SARs issued by the Company contain performance and service conditions. The performance conditions have been met for all awards.
At December 31, 2012 , the liability for SARs issued under the Incentive Plan that the Company has elected to be settled in cash was $2.3 million , all of which are vested and are classified as other accrued liabilities. As these awards are fully vested and accounted for as liability awards, the liability is remeasured in earnings at each reporting period fair value until the awards are settled.
At December 31, 2012 , all stock options were vested and accordingly, the Company had no unrecognized compensation costs related to outstanding stock options. The total intrinsic value (market price at date of exercise less the exercise price) of stock options exercised during the years ended December 31, 2012 , 2011 and 2010 was $0.4 million , $3.6 million , and $6.0 million , respectively, and the Company received $0.1 million, $47,000 , and $0.7 million in cash in connection with stock option exercises for the years ended December 31, 2012 , 2011 and 2010 , respectively.
F-27
Restricted Stock Awards and Units. The Company began issuing restricted stock awards in 2005 and restricted stock units in 2009. Although shares of common stock are not released to the employee until vesting, restricted stock awards have the right to vote and accordingly, restricted stock awards are considered issued and outstanding at the date of grant. Restricted stock units, which may be settled in cash or common stock at the Company's option, do not have the right to vote and are not considered issued and outstanding until converted into common shares and released to the employee upon vesting. The table below summarizes restricted stock award and unit activity for the years ended December 31, 2012 , 2011 and 2010 :
|
| Shares/ Units |
| Grant-date Fair Value | |||
Unvested restricted stock awards and units at January 1, 2010 |
| 471,243 | |
| $ | 25.01 | |
Granted |
| 640,207 | |
| 18.60 | | |
Vested |
| (380,668 | ) |
| 23.42 | | |
Forfeited |
| (19,827 | ) |
| 25.23 | | |
Unvested restricted stock awards and units at December 31, 2010 |
| 710,955 | |
| 20.26 | | |
Granted |
| 567,901 | |
| 35.27 | | |
Vested |
| (452,585 | ) |
| 25.29 | | |
Forfeited |
| (25,773 | ) |
| 23.30 | | |
Unvested restricted stock awards and units at December 31, 2011 |
| 800,498 | |
| 27.96 | | |
Granted |
| 854,292 | |
| 25.25 | | |
Vested |
| (488,992 | ) |
| 25.63 | | |
Forfeited |
| (19,524 | ) |
| 27.61 | | |
Unvested restricted stock awards and units at December 31, 2012 |
| 1,146,274 | |
| $ | 26.95 | |
As of December 31, 2012 , unrecognized compensation costs related to unvested restricted stock awards and units was $18.6 million and will be recognized as stock-based compensation expense over a weighted-average period of two years. The 2010 , 2011 and 2012 grants of certain restricted stock units contained performance and service conditions. The performance conditions have been met for all awards.
Cash-Settled Stock Appreciation Rights Plan
The Company has also established the Carrizo Oil & Gas, Inc. Cash-Settled Stock Appreciation Rights Plan ("Cash SARs Plan"). The Cash SARs Plan enables employees and independent contractors to share in the appreciation of Carrizo's common stock, but does not require the issuance of shares. During 2012 and 2011 , the Company issued 193,336 and 153,801 SARs under the Cash SARs Plan, respectively. At December 31, 2012 and 2011 , the liability for such SARs was $4.9 million and $6.5 million , of which, $4.2 million and $5.2 million are classified as other accrued liabilities representing the portion of the awards that are vested or are expected to vest within the next 12 months, with the remainder of $0.7 million and $1.3 million classified as other long-term liabilities, respectively.The following table summarizes the weighted-average assumptions used in the Black-Scholes-Merton option pricing model to calculate the fair value of the SARs issued under the Cash SARs Plan at December 31, 2012 and 2011 , respectively:
|
| 2012 |
| 2011 | ||||
Grant date fair value |
| $ | 12.23 | |
| $ | 18.50 | |
Volatility factor |
| 48.2 | % |
| 61.6 | % | ||
Dividend yield |
| - | |
| - | | ||
Risk-free interest rate |
| 0.4 | % |
| 0.4 | % | ||
Expected term (in years) |
| 3.0 | |
| 2.9 | | ||
As of December 31, 2012 , unrecognized compensation costs related to unvested SARs issued under the Cash SARs Plan was $0.9 million and will be recognized as stock-based compensation expense over a weighted-average period of 1.9 years. The 2012 grants of SARs under the Cash SARs Plan contained performance and service conditions. The performance conditions have been met for all awards.
11. Related Party Transactions
Transactions with Avista and affiliates
Utica Shale Joint Venture. In September 2011, the Company entered into a joint venture with affiliates of Avista to acquire and develop acreage in the liquids rich region of the Utica Shale. The Company serves as operator of the joint venture properties under joint operating agreements with ACP II and ACP III. The Company has also agreed to a management services agreement under
F-28
which it will perform specified management services for ACP III on the same cost and reimbursement bases provided for in the joint operating agreements. Avista or its designee has the right to become a co-operator of the joint venture properties if (i) Avista sells substantially all of its interests in the Avista Utica joint venture or (ii) the Company defaults under the terms of any pledge of its interest in the properties. In addition to the Company's share in the production and sale proceeds from joint venture properties, the Company also acquired B Units in ACP III at the formation of the Avista Utica joint venture.
In the fourth quarter of 2012, the Company sold substantially all of its interests in oil and gas properties dedicated to its Utica joint venture in the northern portion of the Utica Shale play to an unrelated third party. Simultaneously with the closing of this transaction, ACP II sold substantially all of its interests in the same oil and gas properties.
In connection with these sale transactions, the Company elected to exercise its first option granted by Avista to increase its participating interest in the same oil and gas properties on a "net proceeds basis" so that the Company received net proceeds with respect to 50% of the properties subject to the sale rather than the 10% for which it held record title. Pursuant to the joint venture agreements, as amended, the Company paid $24.0 million for the 40% additional interest in the acreage subject to the sale and certain other Avista Utica joint venture properties. Subsequently, on October 24, 2012, the Company and Avista amended their Utica Shale joint venture agreements to provide that the expiration date of the Company's remaining option to increase its participating interest in the Avista Utica joint venture properties was accelerated from March 2013 to January 15, 2013. The Company exercised this option on January 15, 2013 by paying $63.1 million for an additional 40% in the remaining Avista Utica joint venture properties. The Company and Avista also agreed that after the option was exercised, the Company's participating interest in subsequently acquired properties within an area of mutual interest continued to be 10% , and Avista's participating interest is 90% , and the Company was granted an additional option to increase its 10% ownership in such subsequently acquired properties to 50% at 8.625% above Avista's acreage cost and associated improvements (compounded monthly following Avista's contribution of purchase proceeds). This additional option will expire May 31, 2013. Additionally, the Company and Avista agreed to increase the cap on ACP III's contribution right to an aggregate of $170.0 million from an initial $130.0 million . The Company's right to receive distributions associated with the properties owned by ACP II in the Avista Utica joint venture through its B Units in ACP II was terminated upon the consummation of the Company's exercise of its option with respect to 50% of the properties subject to the sale described above. The Company's right to receive distributions associated with the properties owned by ACP III through its B Units in ACP III terminated upon the consummation of the Company's January 15, 2013 option to increase its interest in the Avista Utica joint venture properties.
Steven A. Webster, Chairman of the Company's Board of Directors, serves as Co-Managing Partner and President of Avista Capital Holdings, LP, which has the ability to control Avista and its affiliates. ACP II's and III's Boards of Managers have the sole authority for determining whether, when and to what extent any cash distributions will be declared and paid to members of ACP II or ACP III, respectively. Mr. Webster is not a member of either entity's Board of Managers.
Marcellus Shale Joint Ventures. Effective August 1, 2008, Carrizo (Marcellus) LLC, a wholly owned subsidiary of the Company, entered into a joint venture arrangement with ACP II, an affiliate of Avista. In September 2010, the Company completed the sale of 20% of its interests in substantially all of its oil and gas properties in Pennsylvania that had been subject to the Avista joint venture to Reliance. Simultaneously with the closing of this transaction, ACP II closed the sale of its entire interest in the same properties to Reliance for a purchase price of approximately $327.0 million . At the time of entering into the agreements for these transactions, the Company and Avista agreed that B Unit distributions to the Company with respect to Avista's sale of properties to Reliance would be principally based upon Avista's internal rates-of-return and return-on-investment thresholds associated with such properties, subject to amounts withheld from distribution by ACP II's board. In connection with these sales transactions, the Company and Avista amended the participation agreement and other joint venture agreements with Avista to provide that the properties that the Company and Avista sold to Reliance, as well as the properties the Company committed to the new joint venture with Reliance, are not subject to the terms of the Avista Marcellus joint venture, and that the Avista Marcellus joint venture's area of mutual interest will generally not include Pennsylvania, the state in which those properties are located. The Company's joint venture with Avista continues and now covers approximately 71,774 net acres, primarily in West Virginia and New York. Pursuant to the terms of the Avista area of mutual interest, effective December 31, 2010, the initial area of mutual interest was reduced to specified halos in which the Avista Marcellus joint venture was active.
In December 2010, the Company entered into a settlement agreement with Reliance providing for the resolution of defects in title that Reliance alleged with respect to the properties it acquired from the Company and Avista in September 2010. In the agreement, the Company agreed to undertake specified curative measures with respect to the properties it and Avista sold to Reliance, and to indemnify Reliance on its own behalf and on behalf of Avista with respect to specified third party claims (in addition to existing customary indemnification obligations under the purchase agreement). In connection with entering into the settlement agreement, the Company entered into an agreement with Avista by which Avista agreed to indemnify the Company for amounts paid on Avista's behalf by the Company under the settlement agreement, if any.
F-29
On November 16, 2010, Carrizo Marcellus assigned, via distribution and subsequent contribution, its interests in the Avista Marcellus joint venture to Carrizo (Marcellus) WV LLC ("Carrizo WV"), also a wholly owned subsidiary of the Company. In connection with the assignment, Carrizo Marcellus assigned to Carrizo WV its rights and obligations under the participation agreement, as well as the related joint operating agreement, pursuant to which operatorship of the Avista Marcellus joint venture was assumed by Carrizo WV. In addition, Carrizo WV and the other parties thereto amended and restated the participation agreement on November 16, 2010, effective as of October 1, 2010. This amended and restated participation agreement amends the participation agreement by, among other things, (i) providing fixed percentages and thresholds for sharing net cash flow from hydrocarbon production and proceeds from the sales of underlying joint venture properties and (ii) eliminating provisions that have been performed and are inapplicable going forward.
The Company serves as operator of the properties covered by the Avista Marcellus joint venture under a joint operating agreement with Avista and also performs specified management services for ACP II. An operating committee composed of one representative of each party provides overall supervision and direction of joint operations. Avista or its designee has the right to become a co-operator of the properties if all of its membership interests or substantially all of its assets are sold to an unaffiliated third party or if the Company defaults under the terms of any pledge of its interest in the properties.
The Company has agreed to jointly market Avista's share of the production from the properties with its own until the cash flows and sale proceeds are allocated in accordance with the parties' participating interests under the joint operating agreement.
Each party now has ability to transfer its interest in the Avista Marcellus joint venture to third parties subject in most instances to preferential purchase rights for transfers of less than 10% of its interest in joint venture properties, or to "tag along" rights for most other transfers.
Steven A. Webster, Chairman of the Company's Board of Directors, serves as Co-Managing Partner and President of Avista Capital Holdings, LP, which has the ability to control Avista. ACP II's Board of Managers have the sole authority for determining whether, when and to what extent any cash distributions will be declared and paid to members of ACP II. Mr. Webster is not a member of ACP II's Board of Managers. As disclosed elsewhere, the Company has been and is a party to prior arrangements with affiliates of Avista Capital Holdings, LP in respect of the Company's joint venture with affiliates of Avista in the Utica Shale.
ACP II Distribution. During the third and fourth quarters of 2010 the Company received cash distributions aggregating approximately $38.8 million and during the second quarter of 2011 received an additional $3.3 million on its B Unit investment in ACP II, which were recognized as a reduction of capitalized oil and gas property costs. As described in "Utica Shale Joint Venture" above, the Company's right to receive distributions associated with the properties owned by ACP II in the Avista Utica joint venture through its B Units in ACP II was terminated upon the consummation of the Company's exercise of its option with respect to certain Avista Utica joint venture properties in October 2012.
Advances to and from Avista and Affiliates . At December 31, 2012 , related party receivables on the consolidated balance sheets included $9.8 million , representing the net amounts Avista owes the company related to activity within the Utica and Marcellus Shale joint ventures. At December 31, 2011 , advances for joint operations on the consolidated balance sheets included $9.5 million , representing the net amount Avista had advanced the Company related to activity within the Utica and Marcellus Shale joint ventures.
12. Derivative Instruments
The Company uses various types of derivative instruments to manage its exposure to commodity price risk and to provide a level of certainty in its forward cash flows supporting its capital expenditure program. The derivative instruments typically used are fixed-rate swaps, costless collars, puts, calls and basis differential swaps. Under these derivative instruments, payments are received or made based on the differential between a fixed and a variable product price. These agreements are settled in cash at termination, expiration or exchanged for physical delivery contracts. The Company's current long-term strategy is to manage exposure for a substantial, but varying, portion of forecasted production up to 60 months. The derivative instruments are carried at fair value in the consolidated balance sheets, with changes in fair value recognized as gain (loss) on derivative instruments, net in the consolidated statements of income for the period in which the changes occur.
F-30
The fair value of derivative instruments at December 31, 2012 and 2011 was a net asset of $29.2 million and $37.5 million , respectively. The following sets forth a summary of the distribution of the net fair value of the Company's derivative instruments by counterparty:
Counterparty |
| December 31, 2012 |
| December 31, 2011 | ||
Credit Suisse |
| 40 | % |
| 68 | % |
BNP Paribas |
| 33 | % |
| 19 | % |
Societe Generale |
| 22 | % |
| 2 | % |
BBVA Compass |
| 3 | % |
| - | % |
Wells Fargo |
| 2 | % |
| - | % |
Shell Energy North America (US) LP |
| - | % |
| 6 | % |
Credit Agricole |
| - | % |
| 5 | % |
Total |
| 100 | % |
| 100 | % |
Master netting agreements are in place with each of these counterparties. Because the counterparties are either investment grade financial institutions or an investment grade international oil and gas company, the Company believes it has minimal credit risk and accordingly does not currently require its counterparties to post collateral to support the asset positions of its derivative instruments. As such, the Company is exposed to credit risk to the extent of nonperformance by the counterparties to its derivative instruments. Although the Company does not currently anticipate such nonperformance, it continues to monitor the financial viability of its counterparties. Because Credit Suisse, Credit Agricole, BBVA Compass, Wells Fargo and Societe Generale are lenders in the Company's revolving credit facility, the Company is not required to post collateral with respect to derivative instruments in a net liability position with these counterparties as the contracts are secured by the revolving credit facility.
The following sets forth a summary of the Company's natural gas derivative positions at average NYMEX prices as of December 31, 2012 .
Period |
| Volume (in MMBtu) |
| Weighted Average Floor Price ($/MMBtu) |
| Weighted Average Ceiling Price ($/MMBtu) | |||||
2013 |
| 18,250,000 | |
| $ | 4.63 | |
| $ | 4.63 | |
2014 |
| 3,650,000 | |
| $ | - | |
| $ | 5.50 | |
The following sets forth a summary of the Company's crude oil derivative positions at average NYMEX prices as of December 31, 2012 .
Period |
| Volume (in Bbls) |
| Weighted Average Floor Price ($/Bbls) |
| Weighted Average Ceiling Price ($/Bbls) | |||||
2013 |
| 2,774,000 | |
| $ | 88.91 | |
| $ | 102.43 | |
2014 |
| 2,555,000 | |
| $ | 90.06 | |
| $ | 98.51 | |
2015 |
| 1,441,750 | |
| $ | 89.54 | |
| $ | 96.49 | |
2016 |
| 244,000 | |
| $ | 85.00 | |
| $ | 104.00 | |
In connection with the crude oil derivative instruments above, the Company has entered into protective put spreads. For 2014 , at market prices below the short put price of $65.00 , the floor price becomes the market price plus the put spread of $20.00 on 182,500 of the 2,555,000 Bbls and the remaining 2,372,500 Bbls would have a floor price of $90.06 .
Period |
| Volumes (in Bbls) |
| Weighted Average Short Put Price ($/Bbl) |
| Weighted Average Put Spread ($/Bbl) | |||||
2014 |
| 182,500 | |
| $ | 65.00 | |
| $ | 20.00 | |
2015 |
| 365,000 | |
| $ | 65.00 | |
| $ | 20.00 | |
2016 |
| 244,000 | |
| $ | 65.00 | |
| $ | 20.00 | |
F-31
For the years ended December 31, 2012 , 2011 and 2010 , the Company recorded the following related to its oil and gas derivative instruments:
|
| Year Ended December 31, | ||||||||||
|
| 2012 |
| 2011 |
| 2010 | ||||||
|
| (In thousands) | ||||||||||
Realized gain (loss) on derivative instruments, net |
| $ | 41,122 | |
| $ | 35,452 | |
| $ | 33,218 | |
Unrealized gain (loss) on derivative instruments, net |
| (9,751 | ) |
| 12,971 | |
| 14,564 | | |||
Gain (loss) on derivative instruments, net |
| $ | 31,371 | |
| $ | 48,423 | |
| $ | 47,782 | |
13. Fair Value Measurements
Accounting guidelines for measuring fair value establish a three-level valuation hierarchy for disclosure of fair value measurements. The valuation hierarchy categorizes assets and liabilities measured at fair value into one of three different levels depending on the observability of the inputs employed in the measurement. The three levels are defined as follows:
Level 1 - Observable inputs such as quoted prices in active markets at the measurement date for identical, unrestricted assets or liabilities.
Level 2 - Other inputs that are observable directly or indirectly such as quoted prices in markets that are not active, or inputs which are observable, either directly or indirectly, for substantially the full term of the asset or liability.
Level 3 - Unobservable inputs for which there is little or no market data and which the Company makes its own assumptions about how market participants would price the assets and liabilities.
Assets and Liabilities Measured at Fair Value on a Recurring Basis
The following tables present the Company's assets and liabilities measured at fair value on a recurring basis as of December 31, 2012 and 2011 , and indicate the fair value hierarchy of the valuation techniques utilized by the Company to determine such fair value:
|
| December 31, 2012 |
| December 31, 2011 | ||||||||||||||||||||||||||||
|
| Level 1 |
| Level 2 |
| Level 3 |
| Total |
| Level 1 |
| Level 2 |
| Level 3 |
| Total | ||||||||||||||||
|
| (In thousands) | ||||||||||||||||||||||||||||||
Assets: |
|
|
|
|
|
|
|
|
|
|
|
|
|
|
|
| ||||||||||||||||
Derivative instruments |
| $ | - | |
| $ | 36,452 | |
| $ | - | |
| $ | 36,452 | |
| $ | - | |
| $ | 61,063 | |
| $ | - | |
| $ | 61,063 | |
Liabilities: |
|
|
|
|
|
|
|
|
|
|
|
|
|
|
|
| ||||||||||||||||
Derivative instruments |
| - | |
| (7,291 | ) |
| - | |
| (7,291 | ) |
| - | |
| (23,569 | ) |
| - | |
| (23,569 | ) | ||||||||
Total |
| $ | - | |
| $ | 29,161 | |
| $ | - | |
| $ | 29,161 | |
| $ | - | |
| $ | 37,494 | |
| $ | - | |
| $ | 37,494 | |
The fair values of the Company's derivative instruments are based on a pricing model that uses market data obtained from reputable independent sources and are considered Level 2 inputs, including (a) quoted forward prices for oil and gas, (b) discount rates, (c) volatility factors and (d) current market and contractual prices, as well as other relevant economic measures. The estimates of fair value are also compared to the values provided by the counterparty for reasonableness and are adjusted for the counterparties' credit quality for derivative assets and the Company's credit quality for derivative liabilities. To date, adjustments for credit quality have not had a material impact on the fair values.
The fair values reported in the consolidated balance sheets are as of a particular point in time and subsequently change as these estimates are revised to reflect actual results, changes in market conditions and other factors. The assets and liabilities for derivative instruments included in the tables above are presented on a gross basis. The assets and liabilities for derivative instruments included in the consolidated balance sheets are presented on a net basis when such amounts are with the same counterparty and subject to master netting agreements. The Company had no transfers in or out of Levels 1 or 2 for the years ended December 31, 2012 and 2011 .
F-32
Fair Value of Other Financial Instruments
The Company's other financial instruments consist of cash and cash equivalents, receivables, payables and long-term debt which are classified as Level 1 under the fair value hierarchy. The carrying amounts of cash and cash equivalents, receivables, and payables approximate fair value due to the highly liquid or short-term nature of these instruments. The carrying amounts of long-term debt under the Company's revolving credit facility approximate fair value as these borrowings bear interest at variable rates of interest. The following table presents the carrying amounts and fair values of the Company's senior notes and convertible senior notes, based on quoted market prices, as of December 31, 2012 and 2011 .
|
| December 31, 2012 |
| December 31, 2011 | ||||||||||||
|
| Carrying Amount |
| Fair Value |
| Carrying Amount |
| Fair Value | ||||||||
|
| (In thousands) | ||||||||||||||
8.625% Senior Notes |
| $ | 595,151 | |
| $ | 645,000 | |
| $ | 594,535 | |
| $ | 606,000 | |
7.50% Senior Notes |
| 300,000 | |
| 308,250 | |
| - | |
| - | | ||||
4.375% Convertible Senior Notes |
| 72,657 | |
| 73,842 | |
| 69,951 | |
| 73,013 | | ||||
14. Condensed Consolidating Financial Information
In November 2010 and November 2011, the Company and certain of the Company's wholly owned subsidiaries (such subsidiaries collectively, the "Subsidiary Guarantors") issued in private placements $400.0 million and $200.0 million , respectively, aggregate principal amount of the Company's 8.625% Senior Notes. Certain, but not all, of the Company's wholly owned subsidiaries have issued full, unconditional and joint and several guarantees of the 8.625% Senior Notes and may guarantee future issuances of debt securities. In June 2011 and February 2012, the Company completed the exchange of registered 8.625% Senior Notes for any and all of its unregistered $400.0 million and $200.0 million aggregate principal amount of 8.625% Senior Notes, respectively. In September 2012, the Company and certain of the Company's wholly owned subsidiaries issued in a public offering $300.0 million aggregate principal amount of the Company's 7.50% Senior Notes.
The rules of the SEC require that condensed consolidating financial information be provided for a subsidiary that has guaranteed the debt of a registrant issued in a public offering, where the guarantee is full, unconditional and joint and several and where the voting interest of the subsidiary is 100% owned by the registrant. The Company is, therefore, presenting condensed consolidating financial information as of December 31, 2012 and December 31, 2011 , and for each of the three years ended December 31, 2012 , 2011 and 2010 on a parent company, combined guarantor subsidiaries, combined non-guarantor subsidiaries, and consolidated basis and should be read in conjunction with the consolidated financial statements. The financial information may not necessarily be indicative of results of operations, cash flows, or financial position had the Subsidiary Guarantors operated as independent entities.
Investments in subsidiaries are accounted for by the respective parent company using the equity method for purposes of this presentation. Results of operations of subsidiaries are therefore reflected in the parent company's investment accounts and earnings. The principal elimination entries set forth below eliminate investments in subsidiaries and intercompany balances and transactions. Typically in a condensed consolidating financial statement, the net income and equity of the parent company equals the net income and equity of the consolidated entity. The Company's oil and gas properties are accounted for using the full cost method of accounting whereby impairments and DD&A are calculated and recorded on a country by country basis. However, when calculated separately on a legal entity basis, the combined totals of parent company and subsidiary impairments and DD&A can be more or less than the consolidated total as a result of differences in the properties each entity owns including amounts of costs incurred, production rates, reserve mix, future development costs, etc. Accordingly, elimination entries are required to eliminate any differences between consolidated and parent company and subsidiary company combined impairments and DD&A.
F-33
CARRIZO OIL & GAS, INC.
CONDENSED CONSOLIDATING BALANCE SHEETS
|
| December 31, 2012 | ||||||||||||||||||
|
| Parent Company |
| Combined Guarantor Subsidiaries |
| Combined Non- Guarantor Subsidiaries |
| Eliminations |
| Consolidated | ||||||||||
|
| (In thousands) | ||||||||||||||||||
ASSETS |
|
|
|
|
|
|
|
|
|
| ||||||||||
Current assets |
| $ | 1,689,430 | |
| $ | 130,487 | |
| $ | - | |
| $ | (1,613,094 | ) |
| $ | 206,823 | |
Current assets held for sale |
| - | |
| - | |
| 1,882 | |
| - | |
| 1,882 | | |||||
Property and equipment, net |
| 23,041 | |
| 1,443,064 | |
| - | |
| 21,569 | |
| 1,487,674 | | |||||
Investment in subsidiaries |
| 14,588 | |
| - | |
| - | |
| (14,588 | ) |
| - | | |||||
Long-term assets held for sale |
| 24,488 | |
| - | |
| 108,138 | |
| - | |
| 132,626 | | |||||
Other assets |
| 35,095 | |
| 16,928 | |
| 11,818 | |
| (8,850 | ) |
| 54,991 | | |||||
Total assets |
| $ | 1,786,642 | |
| $ | 1,590,479 | |
| $ | 121,838 | |
| $ | (1,614,963 | ) |
| $ | 1,883,996 | |
|
|
|
|
|
|
|
|
|
|
| ||||||||||
LIABILITIES AND SHAREHOLDERS' EQUITY |
|
|
|
|
|
|
|
|
|
| ||||||||||
Current liabilities |
| $ | 179,221 | |
| $ | 1,631,887 | |
| $ | - | |
| $ | (1,560,853 | ) |
| $ | 250,255 | |
Current liabilities associated with assets held for sale |
| 9,880 | |
| - | |
| 38,783 | |
| - | |
| 48,663 | | |||||
Long-term liabilities |
| 973,003 | |
| 3,512 | |
| - | |
| - | |
| 976,515 | | |||||
Long-term liabilities associated with assets held for sale |
| - | |
| - | |
| 23,547 | |
| - | |
| 23,547 | | |||||
Shareholders' equity |
| 624,538 | |
| (44,920 | ) |
| 59,508 | |
| (54,110 | ) |
| 585,016 | | |||||
Total liabilities and shareholders' equity |
| $ | 1,786,642 | |
| $ | 1,590,479 | |
| $ | 121,838 | |
| $ | (1,614,963 | ) |
| $ | 1,883,996 | |
|
| December 31, 2011 | ||||||||||||||||||
|
| Parent Company |
| Combined Guarantor Subsidiaries |
| Combined Non- Guarantor Subsidiaries |
| Eliminations |
| Consolidated | ||||||||||
|
| (In thousands) | ||||||||||||||||||
ASSETS |
|
|
|
|
|
|
|
|
|
| ||||||||||
Current assets |
| $ | 1,349,841 | |
| $ | 71,018 | |
| $ | - | |
| $ | (1,304,336 | ) |
| $ | 116,523 | |
Current assets held for sale |
| - | |
| - | |
| 3,874 | |
| - | |
| 3,874 | | |||||
Property and equipment, net |
| 100,329 | |
| 1,131,672 | |
| - | |
| 8,916 | |
| 1,240,917 | | |||||
Investment in subsidiaries |
| (58,764 | ) |
| - | |
| - | |
| 58,764 | |
| - | | |||||
Long-term assets held for sale |
| 687 | |
| - | |
| 78,044 | |
| - | |
| 78,731 | | |||||
Other assets |
| 38,852 | |
| 54,062 | |
| - | |
| (5,279 | ) |
| 87,635 | | |||||
Total assets |
| $ | 1,430,945 | |
| $ | 1,256,752 | |
| $ | 81,918 | |
| $ | (1,241,935 | ) |
| $ | 1,527,680 | |
|
|
|
|
|
|
|
|
|
|
| ||||||||||
LIABILITIES AND SHAREHOLDERS' EQUITY |
|
|
|
|
|
|
|
|
|
| ||||||||||
Current liabilities |
| $ | 150,793 | |
| $ | 1,368,456 | |
| $ | 128 | |
| $ | (1,252,295 | ) |
| $ | 267,082 | |
Current liabilities associated with assets held for sale |
| - | |
| - | |
| 4,238 | |
| - | |
| 4,238 | | |||||
Long-term liabilities |
| 724,801 | |
| 2,183 | |
| - | |
| (2,908 | ) |
| 724,076 | | |||||
Long-term liabilities associated with assets held for sale |
| - | |
| - | |
| 22,429 | |
| - | |
| 22,429 | | |||||
Shareholders' equity |
| 555,351 | |
| (113,887 | ) |
| 55,123 | |
| 13,268 | |
| 509,855 | | |||||
Total liabilities and shareholders' equity |
| $ | 1,430,945 | |
| $ | 1,256,752 | |
| $ | 81,918 | |
| $ | (1,241,935 | ) |
| $ | 1,527,680 | |
F-34
CARRIZO OIL & GAS, INC.
CONDENSED CONSOLIDATING STATEMENTS OF INCOME
|
| For The Year Ended December 31, 2012 | ||||||||||||||||||
|
| Parent Company |
| Combined Guarantor Subsidiaries |
| Combined Non- Guarantor Subsidiaries |
| Eliminations |
| Consolidated | ||||||||||
|
| (In thousands) | ||||||||||||||||||
Oil and gas revenues |
| $ | 20,195 | |
| $ | 347,985 | |
| $ | - | |
| $ | - | |
| $ | 368,180 | |
Costs and expenses |
| 76,839 | |
| 205,341 | |
| - | |
| (12,653 | ) |
| 269,527 | | |||||
Operating income (loss) |
| (56,644 | ) |
| 142,644 | |
| - | |
| 12,653 | |
| 98,653 | | |||||
Other income (expense), net |
| 20,022 | |
| (36,542 | ) |
| - | |
| - | |
| (16,520 | ) | |||||
Income (loss) from continuing operations before income taxes |
| (36,622 | ) |
| 106,102 | |
| - | |
| 12,653 | |
| 82,133 | | |||||
Income tax (expense) benefit |
| 12,658 | |
| (37,136 | ) |
| - | |
| (6,478 | ) |
| (30,956 | ) | |||||
Equity in income (loss) of subsidiaries |
| 73,150 | |
| - | |
| - | |
| (73,150 | ) |
| - | | |||||
Net income (loss) from continuing operations |
| 49,186 | |
| 68,966 | |
| - | |
| (66,975 | ) |
| 51,177 | | |||||
Net income from discontinued operations, net of income taxes |
| 126 | |
| - | |
| 4,184 | |
| - | |
| 4,310 | | |||||
Net income (loss) |
| $ | 49,312 | |
| $ | 68,966 | |
| $ | 4,184 | |
| $ | (66,975 | ) |
| $ | 55,487 | |
|
| For The Year Ended December 31, 2011 | ||||||||||||||||||
|
| Parent Company |
| Combined Guarantor Subsidiaries |
| Combined Non- Guarantor Subsidiaries |
| Eliminations |
| Consolidated | ||||||||||
|
| (In thousands) | ||||||||||||||||||
Oil and gas revenues |
| $ | 31,875 | |
| $ | 170,292 | |
| $ | - | |
| $ | - | |
| $ | 202,167 | |
Costs and expenses |
| 68,652 | |
| 100,255 | |
| - | |
| (4,891 | ) |
| 164,016 | | |||||
Operating income (loss) |
| (36,777 | ) |
| 70,037 | |
| - | |
| 4,891 | |
| 38,151 | | |||||
Other income (expense), net |
| 41,182 | |
| (21,188 | ) |
| - | |
| - | |
| 19,994 | | |||||
Income from continuing operations before income taxes |
| 4,405 | |
| 48,849 | |
| - | |
| 4,891 | |
| 58,145 | | |||||
Income tax (expense) benefit |
| (1,209 | ) |
| (22,612 | ) |
| - | |
| (1,790 | ) |
| (25,611 | ) | |||||
Equity in income (loss) of subsidiaries |
| 29,319 | |
| - | |
| - | |
| (29,319 | ) |
| - | | |||||
Net income (loss) from continuing operations |
| 32,515 | |
| 26,237 | |
| - | |
| (26,218 | ) |
| 32,534 | | |||||
Net income from discontinued operations, net of income taxes |
| 1,013 | |
|
|
| 3,082 | |
|
|
| 4,095 | | |||||||
Net income (loss) |
| $ | 33,528 | |
| $ | 26,237 | |
| $ | 3,082 | |
| $ | (26,218 | ) |
| $ | 36,629 | |
F-35
|
| For The Year Ended December 31, 2010 | ||||||||||||||||||
|
| Parent Company |
| Combined Guarantor Subsidiaries |
| Combined Non- Guarantor Subsidiaries |
| Eliminations |
| Consolidated | ||||||||||
|
| (In thousands) | ||||||||||||||||||
Oil and gas revenues |
| $ | 33,203 | |
| $ | 104,920 | |
| $ | - | |
| $ | - | |
| $ | 138,123 | |
Costs and expenses |
| 62,375 | |
| 55,815 | |
| - | |
| (4,024 | ) |
| 114,166 | | |||||
Operating income (loss) |
| (29,172 | ) |
| 49,105 | |
| - | |
| 4,024 | |
| 23,957 | | |||||
Other income (expense), net |
| 4,974 | |
| (10,521 | ) |
| - | |
| - | |
| (5,547 | ) | |||||
Income (loss) from continuing operations before income taxes |
| (24,198 | ) |
| 38,584 | |
| - | |
| 4,024 | |
| 18,410 | | |||||
Income tax (expense) benefit |
| 8,308 | |
| (13,542 | ) |
| - | |
| (1,451 | ) |
| (6,685 | ) | |||||
Equity in income (loss) of subsidiaries |
| 25,042 | |
| - | |
| - | |
| (25,042 | ) |
| - | | |||||
Net income (loss) from continuing operations |
| 9,152 | |
| 25,042 | |
| - | |
| (22,469 | ) |
| 11,725 | | |||||
Net loss from discontinued operations, net of income taxes |
| (1,775 | ) |
| - | |
| - | |
| - | |
| (1,775 | ) | |||||
Net income (loss) |
| $ | 7,377 | |
| $ | 25,042 | |
| $ | - | |
| $ | (22,469 | ) |
| $ | 9,950 | |
F-36
CARRIZO OIL & GAS, INC.
CONDENSED CONSOLIDATING STATEMENTS OF CASH FLOWS
|
| For The Year Ended December 31, 2012 | ||||||||||||||||||
|
| Parent Company |
| Combined Guarantor Subsidiaries |
| Combined Non- Guarantor Subsidiaries |
| Eliminations |
| Consolidated | ||||||||||
|
| (In thousands) | ||||||||||||||||||
Net cash provided by operating activities - continuing operations |
| $ | 75,546 | |
| $ | 177,525 | |
| $ | - | |
| $ | - | |
| $ | 253,071 | |
Net cash used in investing activities - continuing operations |
| (280,564 | ) |
| (493,145 | ) |
| - | |
| 308,558 | |
| (465,151 | ) | |||||
Net cash provided by financing activities - continuing operations |
| 237,778 | |
| 308,558 | |
| - | |
| (308,558 | ) |
| 237,778 | | |||||
Net increase (decrease) in cash and cash equivalents from continuing operations |
| 32,760 | |
| (7,062 | ) |
| - | |
| - | |
| 25,698 | | |||||
Net increase (decrease) in cash and cash equivalents from discontinued operations |
| - | |
| - | |
| (1,196 | ) |
| - | |
| (1,196 | ) | |||||
Cash and cash equivalents, beginning of year - continuing operations |
| 19,134 | |
| 7,263 | |
| - | |
| - | |
| 26,397 | | |||||
Cash and cash equivalents, end of year - continuing operations |
| $ | 51,894 | |
| $ | 201 | |
| $ | - | |
| $ | - | |
| $ | 52,095 | |
Cash and cash equivalents, beginning of year - discontinued operations |
| - | |
| - | |
| 1,715 | |
| - | |
| 1,715 | | |||||
Cash and cash equivalents, end of year - discontinued operations |
| $ | - | |
| $ | - | |
| $ | 519 | |
| $ | - | |
| $ | 519 | |
|
| For The Year Ended December 31, 2011 | ||||||||||||||||||
|
| Parent Company |
| Combined Guarantor Subsidiaries |
| Combined Non- Guarantor Subsidiaries |
| Eliminations |
| Consolidated | ||||||||||
|
| (In thousands) | ||||||||||||||||||
Net cash provided by operating activities - continuing operations |
| $ | 56,563 | |
| $ | 98,948 | |
| $ | - | |
| $ | - | |
| $ | 155,511 | |
Net cash used in investing activities - continuing operations |
| (194,689 | ) |
| (356,168 | ) |
| - | |
| 300,789 | |
| (250,068 | ) | |||||
Net cash provided by financing activities - continuing operations |
| 155,842 | |
| 261,773 | |
| - | |
| (300,789 | ) |
| 116,826 | | |||||
Net increase (decrease) in cash and cash equivalents from continuing operations |
| 17,716 | |
| 4,553 | |
| - | |
| - | |
| 22,269 | | |||||
Net increase (decrease) in cash and cash equivalents from discontinued operations |
|
|
|
|
| 1,715 | |
|
|
| 1,715 | | ||||||||
Cash and cash equivalents, beginning of year - continuing operations |
| 1,418 | |
| 2,710 | |
| - | |
| - | |
| 4,128 | | |||||
Cash and cash equivalents, end of year - continuing operations |
| $ | 19,134 | |
| $ | 7,263 | |
| $ | - | |
| $ | - | |
| $ | 26,397 | |
Cash and cash equivalents, beginning of year - discontinued operations |
| - | |
| - | |
| - | |
| - | |
| - | | |||||
Cash and cash equivalents, end of year - discontinued operations |
| $ | - | |
| $ | - | |
| $ | 1,715 | |
| $ | - | |
| $ | 1,715 | |
|
| For The Year Ended December 31, 2010 | ||||||||||||||||||
|
| Parent Company |
| Combined Guarantor Subsidiaries |
| Combined Non- Guarantor Subsidiaries |
| Eliminations |
| Consolidated | ||||||||||
|
| (In thousands) | ||||||||||||||||||
Net cash provided by operating activities - continuing operations |
| $ | 24,781 | |
| $ | 69,635 | |
| $ | - | |
| $ | - | |
| $ | 94,416 | |
Net cash used in investing activities - continuing operations |
| (194,690 | ) |
| (268,069 | ) |
| - | |
| 198,644 | |
| (264,115 | ) | |||||
Net cash provided by financing activities - continuing operations |
| 169,990 | |
| 198,644 | |
| - | |
| (198,644 | ) |
| 169,990 | | |||||
Net increase (decrease) in cash and cash equivalents from continuing operations |
| 81 | |
| 210 | |
| - | |
| - | |
| 291 | | |||||
Net increase (decrease) in cash and cash equivalents from discontinued operations |
| - | |
| - | |
| - | |
| - | |
| - | | |||||
Cash and cash equivalents, beginning of year - continuing operations |
| 1,337 | |
| 2,500 | |
| - | |
| - | |
| 3,837 | | |||||
Cash and cash equivalents, end of year - continuing operations |
| $ | 1,418 | |
| $ | 2,710 | |
| $ | - | |
| $ | - | |
| $ | 4,128 | |
Cash and cash equivalents, beginning of year - discontinued operations |
| - | |
| - | |
| - | |
| - | |
| - | | |||||
Cash and cash equivalents, end of year - discontinued operations |
| $ | - | |
| $ | - | |
| $ | - | |
| $ | - | |
| $ | - | |
F-37
15. Supplemental Disclosures about Oil and Gas Producing Activities (Unaudited)
At December 31, 2012, the Company's oil and gas properties are located in the U.S. and U.K. North Sea. All information presented as "U.K." in this footnote relates to the U.K. North Sea discontinued operations. For additional information see "Note 3. Assets Held for Sale and Discontinued Operations."
Costs Incurred
Costs incurred in oil and gas property acquisition, exploration and development activities are summarized below:
|
| Year Ended December 31, | ||||||||||
|
| 2012 |
| 2011 |
| 2010 | ||||||
|
| (In thousands) | ||||||||||
U.S. |
|
|
|
|
|
| ||||||
Unproved property acquisition costs |
| $ | 139,344 | |
| $ | 108,212 | |
| $ | 126,783 | |
Exploration costs |
| 557,523 | |
| 374,366 | |
| 134,487 | | |||
Development costs |
| 25,756 | |
| 19,769 | |
| 62,952 | | |||
Asset retirement obligations |
| 2,401 | |
| 3,369 | |
| 1,031 | | |||
Total costs incurred |
| $ | 725,024 | |
| $ | 505,716 | |
| $ | 325,253 | |
U.K. |
|
|
|
|
|
| ||||||
Unproved property acquisition costs |
| $ | 11,135 | |
| $ | 1,004 | |
| $ | 806 | |
Exploration costs |
| - | |
| - | |
| - | | |||
Development costs |
| 35,225 | |
| 38,775 | |
| 5,375 | | |||
Asset retirement obligations |
| 1,036 | |
| 2,649 | |
| - | | |||
Total costs incurred |
| $ | 47,396 | |
| $ | 42,428 | |
| $ | 6,181 | |
Total Worldwide |
|
|
|
|
|
| ||||||
Unproved property acquisition costs |
| $ | 150,479 | |
| $ | 109,216 | |
| $ | 127,589 | |
Exploration costs |
| 557,523 | |
| 374,366 | |
| 134,487 | | |||
Development costs |
| 60,981 | |
| 58,544 | |
| 68,327 | | |||
Asset retirement obligations |
| 3,437 | |
| 6,018 | |
| 1,031 | | |||
Total costs incurred |
| $ | 772,420 | |
| $ | 548,144 | |
| $ | 331,434 | |
Costs incurred excludes capitalized interest on U.S. unproved properties of $24.8 million , $23.4 million , and $20.7 million for the years ended December 31, 2012 , 2011 and 2010 , respectively.
Proved Oil and Gas Reserve Quantities
Proved reserves are generally those quantities of oil and gas, which by analysis of geoscience and engineering data, can be estimated with reasonable certainty to be economically producible in future years from known reservoirs under existing economic conditions, operating methods and government regulations. Proved developed reserves include proved reserves that can be expected to be produced through existing wells with existing equipment and operating methods or in which the cost of the required equipment is relatively minor compared to the cost of a new well. Proved undeveloped reserves are generally proved reserves that are expected to be recovered from new wells on undrilled acreage or from existing wells where a relatively major expenditure is required for recompletion.
Proved oil and gas reserve quantities at December 31, 2012 , 2011 and 2010 , and the related discounted future net cash flows before income taxes are based on estimates prepared by LaRoche Petroleum Consultants, Ltd. and Ryder Scott Company Petroleum Engineers. Such estimates have been prepared in accordance with guidelines established by the SEC.
F-38
The Company's net proved oil and gas reserves and changes in net proved oil and gas reserves, which are located in the U.S. and U.K., are summarized below:
|
| Crude Oil, Condensate and Natural Gas Liquids (MBoe) | |||||||
|
| U.S. |
| U.K. |
| Worldwide | |||
Proved reserves: |
|
|
|
|
|
| |||
January 1, 2010 |
| 14,803 | |
| - | |
| 14,803 | |
Extensions and discoveries |
| 10,961 | |
| 5,263 | |
| 16,224 | |
Revisions of previous estimates |
| (2,102 | ) |
| - | |
| (2,102 | ) |
Production |
| (452 | ) |
| - | |
| (452 | ) |
December 31, 2010 |
| 23,210 | |
| 5,263 | |
| 28,473 | |
Extensions and discoveries |
| 17,404 | |
| - | |
| 17,404 | |
Revisions of previous estimates |
| (71 | ) |
| 174 | |
| 103 | |
Sales of reserves in place |
| (10,310 | ) |
| - | |
| (10,310 | ) |
Production |
| (1,011 | ) |
| - | |
| (1,011 | ) |
December 31, 2011 |
| 29,222 | |
| 5,437 | |
| 34,659 | |
Extensions and discoveries |
| 17,153 | |
| - | |
| 17,153 | |
Revisions of previous estimates |
| 2,500 | |
| (196 | ) |
| 2,304 | |
Sales of reserves in place |
| (1,250 | ) |
| - | |
| (1,250 | ) |
Production |
| (3,167 | ) |
| - | |
| (3,167 | ) |
December 31, 2012 |
| 44,458 | |
| 5,241 | |
| 49,699 | |
|
|
|
|
|
|
| |||
Proved developed reserves: |
|
|
|
|
|
| |||
December 31, 2010 |
| 7,387 | |
| - | |
| 7,387 | |
December 31, 2011 |
| 7,989 | |
| 2,719 | |
| 10,708 | |
December 31, 2012 |
| 14,295 | |
| 5,241 | |
| 19,536 | |
|
|
|
|
|
|
| |||
Proved undeveloped reserves: |
|
|
|
|
|
| |||
December 31, 2010 |
| 15,823 | |
| 5,263 | |
| 21,086 | |
December 31, 2011 |
| 21,233 | |
| 2,718 | |
| 23,951 | |
December 31, 2012 |
| 30,163 | |
| - | |
| 30,163 | |
Crude oil, condensate and natural gas liquids extensions and discoveries are primarily attributable to the following:
2012 | Additions of U.S. proved developed and undeveloped reserves as a result of drilling and offset locations in the Eagle Ford Shale and the Niobrara Formation. |
2011 | Additions of U.S. proved developed and undeveloped reserves as a result of drilling and offset locations in the Eagle Ford Shale and the Niobrara Formation; Transfer of U.K. proved undeveloped reserves to proved developed reserves as a result of drilling. |
2010 | Additions of U.S. proved developed and undeveloped reserves as a result of drilling and offset locations in the Eagle Ford Shale; Additions of U.K. proved undeveloped reserves as a result of the approval of the Huntington Field Development Plan by the Company and its joint venture partners and the U.K. Department of Energy and Climate Change in November 2010. |
Crude oil, condensate and natural gas liquids sales of reserves in place are primarily attributable to the following:
2011 | Sales of properties to KKR during the second quarter and GAIL during the third quarter. |
F-39
|
| Natural Gas (MMcf) | |||||||
|
| U.S. |
| U.K. |
| Worldwide | |||
Proved reserves: |
|
|
|
|
|
| |||
January 1, 2010 |
| 513,047 | |
| - | |
| 513,047 | |
Extensions and discoveries |
| 240,347 | |
| 4,684 | |
| 245,031 | |
Revisions of previous estimates |
| (54,132 | ) |
| - | |
| (54,132 | ) |
Production |
| (34,095 | ) |
| - | |
| (34,095 | ) |
December 31, 2010 |
| 665,167 | |
| 4,684 | |
| 669,851 | |
Extensions and discoveries |
| 221,544 | |
| - | |
| 221,544 | |
Revisions of previous estimates |
| (41,990 | ) |
| 154 | |
| (41,836 | ) |
Sales of reserves in place |
| (82,884 | ) |
| - | |
| (82,884 | ) |
Production |
| (38,990 | ) |
| - | |
| (38,990 | ) |
December 31, 2011 |
| 722,847 | |
| 4,838 | |
| 727,685 | |
Extensions and discoveries |
| 72,916 | |
| - | |
| 72,916 | |
Revisions of previous estimates |
| (20,996 | ) |
| (174 | ) |
| (21,170 | ) |
Sales of reserves in place |
| (313,483 | ) |
| - | |
| (313,483 | ) |
Production |
| (37,612 | ) |
| - | |
| (37,612 | ) |
December 31, 2012 |
| 423,672 | |
| 4,664 | |
| 428,336 | |
|
|
|
|
|
|
| |||
Proved developed reserves: |
|
|
|
|
|
| |||
December 31, 2010 |
| 358,543 | |
| - | |
| 358,543 | |
December 31, 2011 |
| 389,795 | |
| 2,419 | |
| 392,214 | |
December 31, 2012 |
| 229,539 | |
| 4,664 | |
| 234,203 | |
|
|
|
|
|
|
| |||
Proved undeveloped reserves: |
|
|
|
|
|
| |||
December 31, 2010 |
| 306,624 | |
| 4,684 | |
| 311,308 | |
December 31, 2011 |
| 333,052 | |
| 2,419 | |
| 335,471 | |
December 31, 2012 |
| 194,134 | |
| - | |
| 194,134 | |
Natural gas extensions and discoveries are primarily attributable to the following:
2012 | Additions of U.S. proved developed and undeveloped reserves as a result of drilling and offset locations in the Barnett Shale, Marcellus Shale, and Eagle Ford Shale. |
2011 | Additions of U.S. proved developed and undeveloped reserves as a result of drilling and offset locations in the Barnett Shale, Marcellus Shale, and Eagle Ford Shale. Transfer of U.K. proved undeveloped reserves to proved developed reserves as a result of drilling. |
2010 | Additions of U.S. proved developed and undeveloped reserves as a result of drilling and offset locations in the Barnett Shale and Eagle Ford Shale, as well as an increase in previously estimated proved undeveloped reserves based on operational performance; Additions of U.K. proved undeveloped reserves as a result of the approval of the Huntington Field Development Plan by the Company and its joint venture partners and the U.K. Department of Energy and Climate Change in November 2010. |
Natural gas revisions of previous estimates are primarily attributable to the following:
2012 | Negative price revisions primarily in the Barnett Shale. |
2011 | Negative price revisions primarily in the Barnett Shale. |
2010 | Positive price revisions offset by negative quantity revisions due to a planned shift in future drilling priorities focusing more on drilling in the core of the Barnett Shale, which resulted in removing natural gas reserves previously classified as proved undeveloped in the Barnett Shale. |
Natural gas sales of reserves in place are primarily attributable to the following:
2012 | Sales of properties to Atlas during the second quarter and sale of Gulf Coast properties during the third quarter. |
2011 | Sales of properties to KKR during the second quarter and GAIL during the third quarter. |
F-40
Standardized Measure
The standardized measure of discounted future net cash flows relating to proved oil and gas reserves is as follows:
|
| U.S. |
| U.K. |
| Worldwide | ||||||
|
| (In thousands) | ||||||||||
2010 |
|
|
|
|
|
| ||||||
Future cash inflows |
| $ | 3,514,978 | |
| $ | 432,230 | |
| $ | 3,947,208 | |
Future production costs |
| (952,148 | ) |
| (96,782 | ) |
| (1,048,930 | ) | |||
Future development costs |
| (597,444 | ) |
| (78,439 | ) |
| (675,883 | ) | |||
Future income taxes |
| (415,021 | ) |
| (128,618 | ) |
| (543,639 | ) | |||
Future net cash flows |
| 1,550,365 | |
| 128,391 | |
| 1,678,756 | | |||
Less 10% annual discount to reflect timing of cash flows |
| (895,681 | ) |
| (34,289 | ) |
| (929,970 | ) | |||
Standard measure of discounted future net cash flows |
| $ | 654,684 | |
| $ | 94,102 | |
| $ | 748,786 | |
2011 |
|
|
|
|
|
| ||||||
Future cash inflows |
| $ | 4,834,725 | |
| $ | 617,667 | |
| $ | 5,452,392 | |
Future production costs |
| (1,212,722 | ) |
| (95,229 | ) |
| (1,307,951 | ) | |||
Future development costs |
| (1,163,377 | ) |
| (43,954 | ) |
| (1,207,331 | ) | |||
Future income taxes |
| (477,824 | ) |
| (246,273 | ) |
| (724,097 | ) | |||
Future net cash flows |
| 1,980,802 | |
| 232,211 | |
| 2,213,013 | | |||
Less 10% annual discount to reflect timing of cash flows |
| (1,124,339 | ) |
| (47,638 | ) |
| (1,171,977 | ) | |||
Standard measure of discounted future net cash flows |
| $ | 856,463 | |
| $ | 184,573 | |
| $ | 1,041,036 | |
2012 |
|
|
|
|
|
| ||||||
Future cash inflows |
| $ | 4,960,687 | |
| $ | 623,678 | |
| $ | 5,584,365 | |
Future production costs |
| (1,009,850 | ) |
| (87,727 | ) |
| (1,097,577 | ) | |||
Future development costs |
| (982,101 | ) |
| (11,194 | ) |
| (993,295 | ) | |||
Future income taxes |
| (511,790 | ) |
| (252,493 | ) |
| (764,283 | ) | |||
Future net cash flows |
| 2,456,946 | |
| 272,264 | |
| 2,729,210 | | |||
Less 10% annual discount to reflect timing of cash flows |
| (1,277,463 | ) |
| (33,352 | ) |
| (1,310,815 | ) | |||
Standard measure of discounted future net cash flows |
| $ | 1,179,483 | |
| $ | 238,912 | |
| $ | 1,418,395 | |
Reserve estimates and future cash flows are based on the average market prices for sales of oil and gas on the first calendar day of each month during the year. The average prices used for 2012 , 2011 and 2010 were $102.03 , $95.28 , and $74.39 per barrel, respectively, for crude oil and condensate, $32.12 , $44.90 and $35.18 per barrel, respectively, for natural gas liquids, and $2.08 , $3.24 and $3.50 per Mcf, respectively, for natural gas.
Future operating expenses and development costs are computed primarily by the Company's petroleum engineers by estimating the expenditures to be incurred in developing and producing the Company's proved oil and gas reserves at the end of the year, based on year end costs and assuming continuation of existing economic conditions. Future income taxes are based on year-end statutory rates, adjusted for the tax basis of oil and gas properties and available applicable tax assets. A discount factor of 10% was used to reflect the timing of future net cash flows. The standardized measure of discounted future net cash flows is not intended to represent the replacement cost or fair value of the Company's oil and gas properties. An estimate of fair value would also take into account, among other things, the recovery of reserves not presently classified as proved, anticipated future changes in prices and costs, and a discount factor more representative of the time value of money and the risks inherent in oil and gas reserve estimates.
F-41
Changes in Standardized Measure
Changes in the standardized measure of discounted future net cash flows relating to proved oil and gas reserves are summarized below:
|
| U.S. |
| U.K. |
| Worldwide | ||||||
|
| (In thousands) | ||||||||||
Standardized measure - January 1, 2010 |
| $ | 382,093 | |
| $ | - | |
| $ | 382,093 | |
Revisions to reserves proved in prior years: |
|
|
|
|
|
| ||||||
Net change in sales prices and production costs related to future production |
| 263,663 | |
| - | |
| 263,663 | | |||
Net change in estimated future development costs |
| 83 | |
| - | |
| 83 | | |||
Net change due to revisions in quantity estimates |
| (25,451 | ) |
| - | |
| (25,451 | ) | |||
Accretion of discount |
| 39,833 | |
| - | |
| 39,833 | | |||
Changes in production rates (timing) and other |
| 49,806 | |
| - | |
| 49,806 | | |||
Total revisions |
| 327,934 | |
| - | |
| 327,934 | | |||
Net change due to extensions and discoveries, net of estimated future development and production costs |
| 157,846 | |
| 193,985 | |
| 351,831 | | |||
Net change due to sales of minerals in place |
| - | |
| - | |
| - | | |||
Sales of oil and gas produced, net of production costs |
| (115,800 | ) |
| - | |
| (115,800 | ) | |||
Previously estimated development costs incurred |
| 43,940 | |
| - | |
| 43,940 | | |||
Net change in income taxes |
| (141,329 | ) |
| (99,883 | ) |
| (241,212 | ) | |||
Net change in standardized measure of discounted future net cash flows |
| 272,591 | |
| 94,102 | |
| 366,693 | | |||
Standardized measure - December 31, 2010 |
| $ | 654,684 | |
| $ | 94,102 | |
| $ | 748,786 | |
Revisions to reserves proved in prior years: |
|
|
|
|
|
| ||||||
Net change in sales prices and production costs related to future production |
| 134,952 | |
| 128,525 | |
| 263,477 | | |||
Net change in estimated future development costs |
| (509 | ) |
| (4,144 | ) |
| (4,653 | ) | |||
Net change due to revisions in quantity estimates |
| (64,860 | ) |
| 13,078 | |
| (51,782 | ) | |||
Accretion of discount |
| 81,225 | |
| 19,399 | |
| 100,624 | | |||
Changes in production rates (timing) and other |
| (78,199 | ) |
| (16,094 | ) |
| (94,293 | ) | |||
Total revisions |
| 72,609 | |
| 140,764 | |
| 213,373 | | |||
Net change due to extensions and discoveries, net of estimated future development and production costs |
| 508,558 | |
| - | |
| 508,558 | | |||
Net change due to sales of minerals in place |
| (150,437 | ) |
| - | |
| (150,437 | ) | |||
Sales of oil and gas produced, net of production costs |
| (173,853 | ) |
| - | |
| (173,853 | ) | |||
Previously estimated development costs incurred |
| 5,381 | |
| 39,779 | |
| 45,160 | | |||
Net change in income taxes |
| (60,479 | ) |
| (90,072 | ) |
| (150,551 | ) | |||
Net change in standardized measure of discounted future net cash flows |
| 201,779 | |
| 90,471 | |
| 292,250 | | |||
Standardized measure - December 31, 2011 |
| $ | 856,463 | |
| $ | 184,573 | |
| $ | 1,041,036 | |
Revisions to reserves proved in prior years: |
|
|
|
|
|
| ||||||
Net change in sales prices and production costs related to future production |
| (55,249 | ) |
| 49,719 | |
| (5,530 | ) | |||
Net change in estimated future development costs |
| 91,404 | |
| - | |
| 91,404 | | |||
Net change due to revisions in quantity estimates |
| (77,919 | ) |
| (46,803 | ) |
| (124,722 | ) | |||
Accretion of discount |
| 107,451 | |
| 37,453 | |
| 144,904 | | |||
Changes in production rates (timing) and other |
| (3,369 | ) |
| (6,061 | ) |
| (9,430 | ) | |||
Total revisions |
| 62,318 | |
| 34,308 | |
| 96,626 | | |||
Net change due to extensions and discoveries, net of estimated future development and production costs |
| 599,544 | |
| - | |
| 599,544 | | |||
Net change due to sales of minerals in place |
| (212,910 | ) |
| - | |
| (212,910 | ) | |||
Sales of oil and gas produced, net of production costs |
| (313,354 | ) |
| - | |
| (313,354 | ) | |||
Previously estimated development costs incurred |
| 202,187 | |
| 32,760 | |
| 234,947 | | |||
Net change in income taxes |
| (14,765 | ) |
| (12,729 | ) |
| (27,494 | ) | |||
Net change in standardized measure of discounted future net cash flows |
| 323,020 | |
| 54,339 | |
| 377,359 | | |||
Standardized measure - December 31, 2012 |
| $ | 1,179,483 | |
| $ | 238,912 | |
| $ | 1,418,395 | |
F-42
16. Selected Quarterly Financial Data (Unaudited)
The following table presents selected quarterly financial data for the years ended December 31, 2012 and 2011 :
2012 | First |
| Second |
| Third |
| Fourth | ||||||||
| (In thousands, except per share amounts) | ||||||||||||||
Oil and gas revenues | $ | 80,715 | |
| $ | 83,818 | |
| $ | 96,197 | |
| $ | 107,450 | |
Operating income | 22,379 | |
| 14,808 | |
| 24,315 | |
| 37,151 | | ||||
Net income (loss) from continuing operations | $ | 10,676 | |
| $ | 25,900 | |
| $ | (1,860 | ) |
| $ | 16,461 | |
Net income (loss) | $ | 9,423 | |
| $ | 28,504 | |
| $ | (930 | ) |
| $ | 18,490 | |
|
|
|
|
|
|
|
| ||||||||
Net income (loss) per share - basic |
|
|
|
|
|
|
| ||||||||
Net income (loss) from continuing operations | $ | 0.27 | |
| $ | 0.65 | |
| $ | (0.05 | ) |
| $ | 0.41 | |
Net income (loss) per share | $ | 0.24 | |
| $ | 0.72 | |
| $ | (0.02 | ) |
| $ | 0.47 | |
|
|
|
|
|
|
|
| ||||||||
Net income (loss) per share - diluted |
|
|
|
|
|
|
| ||||||||
Net income (loss) from continuing operations | $ | 0.27 | |
| $ | 0.65 | |
| $ | (0.05 | ) |
| $ | 0.41 | |
Net income (loss) per share | $ | 0.24 | |
| $ | 0.71 | |
| $ | (0.02 | ) |
| $ | 0.46 | |
2011 | First |
| Second |
| Third |
| Fourth | ||||||||
| (In thousands, except per share amounts) | ||||||||||||||
Oil and gas revenues | $ | 44,058 | |
| $ | 50,672 | |
| $ | 51,668 | |
| $ | 55,769 | |
Operating income | 9,765 | |
| 6,281 | |
| 16,941 | |
| 5,164 | | ||||
Net income from continuing operations | $ | 735 | |
| $ | 5,607 | |
| $ | 21,491 | |
| $ | 4,702 | |
Net income | $ | 735 | |
| $ | 7,742 | |
| $ | 21,643 | |
| $ | 6,510 | |
|
|
|
|
|
|
|
| ||||||||
Net income per share - basic |
|
|
|
|
|
|
| ||||||||
Net income from continuing operations | $ | 0.02 | |
| $ | 0.14 | |
| $ | 0.55 | |
| $ | 0.12 | |
Net income per share | $ | 0.02 | |
| $ | 0.20 | |
| $ | 0.56 | |
| $ | 0.17 | |
|
|
|
|
|
|
|
| ||||||||
Net income per share - diluted |
|
|
|
|
|
|
| ||||||||
Net income from continuing operations | $ | 0.02 | |
| $ | 0.14 | |
| $ | 0.55 | |
| $ | 0.12 | |
Net income per share | $ | 0.02 | |
| $ | 0.20 | |
| $ | 0.55 | |
| $ | 0.16 | |
The sum of the quarterly net income per common share may not agree with the total year net income per common share as each quarterly computation is based on the weighted average common shares outstanding during that period. Previously reported amounts have been reclassified to reflect the U.K. North Sea as discontinued operations.
F-43
SIGNATURES
Pursuant to the requirements of Section 13 or 15(d) of the Securities Exchange Act of 1934, the registrant has caused this report to be signed on its behalf by the undersigned, thereunto duly authorized.
|
|
|
| CARRIZO OIL & GAS, INC. | |
|
|
|
| By: | /s/ Paul F. Boling |
|
| Paul F. Boling |
|
| Chief Financial Officer, Vice President, |
|
| Secretary and Treasurer |
Date: February 27, 2013
Pursuant to the requirements of the Securities Exchange Act of 1934, this report has been signed below by the following persons on behalf of the registrant and in the capacities and on the dates indicated.
S-1
|
|
|
|
Name |
| Capacity | Date |
|
|
|
|
/s/ S.P. Johnson IV |
| President, Chief Executive Officer and Director | February 27, 2013 |
S. P. Johnson IV |
| (Principal Executive Officer) |
|
|
|
|
|
/s/ Paul F. Boling |
| Chief Financial Officer, Vice President, | February 27, 2013 |
Paul F. Boling |
| Secretary and Treasurer |
|
|
| (Principal Financial Officer) |
|
|
|
|
|
/s/ David L. Pitts |
| Vice President and Chief Accounting Officer | February 27, 2013 |
David L. Pitts |
| (Principal Accounting Officer) |
|
|
|
|
|
/s/ Steven A. Webster |
| Chairman of the Board | February 27, 2013 |
Steven A. Webster |
|
|
|
|
|
|
|
/s/ Thomas L. Carter, Jr. |
| Director | February 27, 2013 |
Thomas L. Carter, Jr. |
|
|
|
|
|
|
|
/s/ Robert F. Fulton |
| Director | February 27, 2013 |
Robert F. Fulton |
|
|
|
|
|
|
|
/s/ F. Gardner Parker |
| Director | February 27, 2013 |
F. Gardner Parker |
|
|
|
|
|
|
|
/s/ Roger A. Ramsey |
| Director | February 27, 2013 |
Roger A. Ramsey |
|
|
|
|
|
|
|
/s/ Frank A. Wojtek |
| Director | February 27, 2013 |
Frank A. Wojtek |
|
|
|
S-2