2014
UNITED STATES
SECURITIES AND EXCHANGE COMMISSION
Washington, D.C. 20549
Form 10-K
(Mark One)
| [x] | ANNUAL REPORT PURSUANT TO SECTION 13 OR 15(d) OF THE SECURITIES EXCHANGE ACT OF 1934 | |||||
| For the fiscal year ended | December 31, 2014 |
OR
| [ ] | TRANSITION REPORT PURSUANT TO SECTION 13 OR 15(d) OF THE SECURITIES EXCHANGE ACT OF 1934 | |||
| For the transition period from |
| to |
|
Commission file number: 001-32395
ConocoPhillips
(Exact name of registrant as specified in its charter)
| Delaware | 01-0562944 | |
(State or other jurisdiction of incorporation or organization) | (I.R.S. Employer Identification No.) |
600 North Dairy Ashford
Houston, TX 77079
(Address of principal executive offices) (Zip Code)
Registrant's telephone number, including area code: 281-293-1000
Securities registered pursuant to Section 12(b) of the Act:
Title of each class | Name of each exchange on | |
Common Stock, $.01 Par Value | New York Stock Exchange | |
6.65% Debentures due July 15, 2018 | New York Stock Exchange | |
7% Debentures due 2029 | New York Stock Exchange |
Securities registered pursuant to Section 12(g) of the Act: None
Indicate by check mark if the registrant is a well-known seasoned issuer, as defined in Rule 405 of the Securities Act.
[x] Yes [ ] No
Indicate by check mark if the registrant is not required to file reports pursuant to Section 13 or Section 15(d) of the Act.
[ ] Yes [x] No
Indicate by check mark whether the registrant (1) has filed all reports required to be filed by Section 13 or 15(d) of the Securities Exchange Act of 1934 during the preceding 12 months (or for such shorter period that the registrant was required to file such reports), and (2) has been subject to such filing requirements for the past 90 days. [x] Yes [ ] No
Indicate by check mark whether the registrant has submitted electronically and posted on its corporate Web site, if any, every Interactive Data File required to be submitted and posted pursuant to Rule 405 of Regulation S-T during the preceding 12 months (or for such shorter period that the registrant was required to submit and post such files).
[x] Yes [ ] No
Indicate by check mark if disclosure of delinquent filers pursuant to Item 405 of Regulation S-K is not contained herein, and will not be contained, to the best of the registrant's knowledge, in definitive proxy or information statements incorporated by reference in Part III of this Form 10-K or any amendment to this Form 10-K. [ ]
Indicate by check mark whether the registrant is a large accelerated filer, an accelerated filer, a non-accelerated filer, or a smaller reporting company. See the definitions of "large accelerated filer," "accelerated filer" and "smaller reporting company" in Rule 12b-2 of the Exchange Act.
Large accelerated filer [x] Accelerated filer [ ] Non-accelerated filer [ ] Smaller reporting company [ ]
Indicate by check mark whether the registrant is a shell company (as defined in Rule 12b-2 of the Act). [ ] Yes [x] No
The aggregate market value of common stock held by non-affiliates of the registrant on June 30, 2014, the last business day of the registrant's most recently completed second fiscal quarter, based on the closing price on that date of $85.73, was $105.4 billion.
The registrant had 1,231,461,668 shares of common stock outstanding at January 31, 2015.
Documents incorporated by reference:
Portions of the Proxy Statement for the Annual Meeting of Stockholders to be held on May 12, 2015 (Part III)
TABLE OF CONTENTS
| Item | Page | |||||
| PART I | ||||||
| 1 and 2. | Business and Properties | 1 | ||||
Corporate Structure | 1 | |||||
Segment and Geographic Information | 2 | |||||
Alaska | 4 | |||||
Lower 48 | 6 | |||||
Canada | 10 | |||||
Europe | 12 | |||||
Asia Pacific and Middle East | 14 | |||||
Other International | 19 | |||||
Competition | 22 | |||||
General | 23 | |||||
| 1A. | Risk Factors | 24 | ||||
| 1B. | Unresolved Staff Comments | 26 | ||||
| 3. | Legal Proceedings | 26 | ||||
| 4. | Mine Safety Disclosures | 27 | ||||
| Executive Officers of the Registrant | 28 | |||||
| PART II | ||||||
| 5. | Market for Registrant's Common Equity, Related Stockholder Matters and Issuer Purchases of Equity Securities | 30 | ||||
| 6. | Selected Financial Data | 31 | ||||
| 7. | Management's Discussion and Analysis of Financial Condition and Results of Operations | 32 | ||||
| 7A. | Quantitative and Qualitative Disclosures About Market Risk | 71 | ||||
| 8. | Financial Statements and Supplementary Data | 74 | ||||
| 9. | Changes in and Disagreements with Accountants on Accounting and Financial Disclosure | 170 | ||||
| 9A. | Controls and Procedures | 170 | ||||
| 9B. | Other Information | 170 | ||||
| PART III | ||||||
| 10. | Directors, Executive Officers and Corporate Governance | 171 | ||||
| 11. | Executive Compensation | 171 | ||||
| 12. | Security Ownership of Certain Beneficial Owners and Management and Related Stockholder Matters | 171 | ||||
| 13. | Certain Relationships and Related Transactions, and Director Independence | 171 | ||||
| 14. | Principal Accounting Fees and Services | 171 | ||||
| PART IV | ||||||
| 15. | Exhibits, Financial Statement Schedules | 172 | ||||
| Signatures | 180 | |||||
PART I
Unless otherwise indicated, "the Company," "we," "our," "us" and "ConocoPhillips" are used in this report to refer to the businesses of ConocoPhillips and its consolidated subsidiaries. Items 1 and 2-Business and Properties, contain forward-looking statements including, without limitation, statements relating to our plans, strategies, objectives, expectations and intentions that are made pursuant to the "safe harbor" provisions of the Private Securities Litigation Reform Act of 1995. The words "anticipate," "estimate," "believe," "budget," "continue," "could," "intend," "may," "plan," "potential," "predict," "seek," "should," "will," "would," "expect," "objective," "projection," "forecast," "goal," "guidance," "outlook," "effort," "target" and similar expressions identify forward-looking statements. The company does not undertake to update, revise or correct any forward-looking information unless required to do so under the federal securities laws. Readers are cautioned that such forward-looking statements should be read in conjunction with the Company's disclosures under the heading "CAUTIONARY STATEMENT FOR THE PURPOSES OF THE ‘SAFE HARBOR' PROVISIONS OF THE PRIVATE SECURITIES LITIGATION REFORM ACT OF 1995," beginning on page 70.
Items 1 and 2. BUSINESS AND PROPERTIES
CORPORATE STRUCTURE
ConocoPhillips is the world's largest independent exploration and production (E&P) company, based on proved reserves and production of liquids and natural gas. ConocoPhillips was incorporated in the state of Delaware on November 16, 2001, in connection with, and in anticipation of, the merger between Conoco Inc. and Phillips Petroleum Company. The merger between Conoco and Phillips was consummated on August 30, 2002.
In April 2012 the ConocoPhillips Board of Directors approved the separation of our downstream business into an independent, publicly traded energy company, Phillips 66. Each ConocoPhillips stockholder received one share of Phillips 66 stock for every two shares of ConocoPhillips stock held at the close of business on the record date of April 16, 2012. The separation was completed on April 30, 2012, and activities related to Phillips 66 have been treated as discontinued operations for all periods prior to the separation.
In 2012 we agreed to sell our interest in the North Caspian Sea Production Sharing Agreement (Kashagan) and our Nigeria and Algeria businesses (collectively, the "Disposition Group"). We sold our Nigeria business in the third quarter of 2014, and we sold Kashagan and our Algeria business in the fourth quarter of 2013. Results for the Disposition Group have been reported as discontinued operations in all periods presented. For additional information on all discontinued operations, see Note 2-Discontinued Operations, in the Notes to Consolidated Financial Statements.
Headquartered in Houston, Texas, we have operations and activities in 27 countries. Our key focus areas include safely operating producing assets, executing major developments and exploring for new resources in promising areas. Our portfolio includes resource-rich North American shale and oil sands assets; lower-risk legacy assets in North America, Europe, Asia and Australia; several major international developments; and a growing inventory of global conventional and unconventional exploration prospects.
At December 31, 2014, ConocoPhillips employed approximately 19,100 people worldwide.
1
SEGMENT AND GEOGRAPHIC INFORMATION
For operating segment and geographic information, see Note 23-Segment Disclosures and Related Information, in the Notes to Consolidated Financial Statements, which is incorporated herein by reference.
We explore for, produce, transport and market crude oil, bitumen, natural gas, liquefied natural gas (LNG) and natural gas liquids on a worldwide basis. At December 31, 2014, our continuing operations were producing in the United States, Norway, the United Kingdom, Canada, Australia, Timor-Leste, Indonesia, China, Malaysia, Qatar, Libya and Russia.
The information listed below appears in the "Oil and Gas Operations" disclosures following the Notes to Consolidated Financial Statements and is incorporated herein by reference:
| • | Proved worldwide crude oil, natural gas liquids, natural gas and bitumen reserves. |
| • | Net production of crude oil, natural gas liquids, natural gas and bitumen. |
| • | Average sales prices of crude oil, natural gas liquids, natural gas and bitumen. |
| • | Average production costs per barrel of oil equivalent (BOE). |
| • | Net wells completed, wells in progress and productive wells. |
| • | Developed and undeveloped acreage. |
The following table is a summary of the proved reserves information included in the "Oil and Gas Operations" disclosures following the Notes to Consolidated Financial Statements. Approximately 84 percent of our proved reserves are located in politically stable countries that belong to the Organization for Economic Cooperation and Development. Natural gas reserves are converted to BOE based on a 6:1 ratio: six thousand cubic feet of natural gas converts to one BOE. See Management's Discussion and Analysis of Financial Condition and Results of Operations for a discussion of factors that will enhance the understanding of the following summary reserves table.
2
| Millions of Barrels of Oil Equivalent | ||||||||||||
| Net Proved Reserves at December 31 | 2014 | 2013 | 2012 | |||||||||
|
| |||||||||||
Crude oil | ||||||||||||
Consolidated operations | 2,605 | 2,659 | 2,684 | |||||||||
Equity affiliates | 103 | 90 | 95 | |||||||||
| ||||||||||||
Total Crude Oil | 2,708 | 2,749 | 2,779 | |||||||||
| ||||||||||||
Natural gas liquids | ||||||||||||
Consolidated operations | 662 | 699 | 646 | |||||||||
Equity affiliates | 53 | 45 | 48 | |||||||||
| ||||||||||||
Total Natural Gas Liquids | 715 | 744 | 694 | |||||||||
| ||||||||||||
Natural gas | ||||||||||||
Consolidated operations | 2,543 | 2,710 | 2,726 | |||||||||
Equity affiliates | 874 | 688 | 543 | |||||||||
| ||||||||||||
Total Natural Gas | 3,417 | 3,398 | 3,269 | |||||||||
| ||||||||||||
Bitumen | ||||||||||||
Consolidated operations | 598 | 579 | 506 | |||||||||
Equity affiliates | 1,468 | 1,451 | 1,394 | |||||||||
| ||||||||||||
Total Bitumen | 2,066 | 2,030 | 1,900 | |||||||||
| ||||||||||||
Total consolidated operations | 6,408 | 6,647 | 6,562 | |||||||||
Total equity affiliates | 2,498 | 2,274 | 2,080 | |||||||||
| ||||||||||||
Total company | 8,906 | 8,921 | 8,642 | |||||||||
| ||||||||||||
Total production from continuing operations, including Libya, was 1,540 thousand barrels of oil equivalent per day (MBOED) in 2014, compared with 1,502 MBOED in 2013, an increase of 3 percent. Average liquids production increased 4 percent over the same period. The increase in total average production in 2014 primarily resulted from additional production from major developments, mainly from shale plays in the Lower 48 and the ramp up of production from Jasmine in the United Kingdom and Christina Lake in Canada, and increased drilling programs, mostly in the Lower 48, western Canada and Norway. These increases were largely offset by normal field decline, higher planned downtime, shut-in Libya production due to the closure of the Es Sider crude oil export terminal, and unfavorable market impacts. Excluding Libya, production from continuing operations was 1,532 MBOED in 2014, compared with 1,472 MBOED in 2013, an increase of 60 MBOED, or 4 percent.
Our total average realized price from continuing operations was $64.59 per BOE in 2014, a decrease of 4 percent compared with $67.62 per BOE in 2013, which reflected lower average realized prices for crude oil and natural gas liquids, partly offset by higher bitumen and natural gas prices. Our worldwide annual average crude oil sales price from continuing operations decreased 10 percent in 2014, from $103.32 per barrel in 2013 to $92.80 per barrel in 2014. Additionally, our worldwide average annual natural gas liquids prices from continuing operations decreased 6 percent, from $41.42 per barrel in 2013 to $38.99 per barrel in 2014. Our average annual worldwide natural gas sales price from continuing operations increased 8 percent, from $6.11 per thousand cubic feet in 2013 to $6.57 per thousand cubic feet in 2014. Average annual bitumen prices increased 3 percent, from $53.27 per barrel in 2013 to $55.13 per barrel in 2014.
3
ALASKA
The Alaska segment primarily explores for, produces, transports and markets crude oil, natural gas liquids, natural gas and LNG. We are the largest crude oil and natural gas producer in Alaska and have major ownership interests in two of North America's largest oil fields located on Alaska's North Slope: Prudhoe Bay and Kuparuk. We also have a significant operating interest in the Alpine Field, located on the Western North Slope. Additionally, we are one of Alaska's largest owners of state and federal exploration leases, with approximately 0.9 million net undeveloped acres at year-end 2014. Approximately 0.4 million of these acres are located in the National Petroleum Reserve-Alaska (NPRA) and 0.3 million are located in the Chukchi Sea. In 2014 Alaska operations contributed 20 percent of our worldwide liquids production and 1 percent of our natural gas production.
| 2014 | ||||||||||||||||||||
| Interest | Operator | Liquids MBD | * | Natural Gas MMCFD | ** | Total MBOED | ||||||||||||||
|
|
|
|
|
| |||||||||||||||
Average Daily Net Production | ||||||||||||||||||||
Greater Prudhoe Area | 36.1 | % | BP | 91 | 6 | 92 | ||||||||||||||
Greater Kuparuk Area | 52.2–55.5 | ConocoPhillips | 52 | - | 52 | |||||||||||||||
Western North Slope | 78.0 | ConocoPhillips | 32 | 1 | 32 | |||||||||||||||
Cook Inlet Area | 33.3–100.0 | ConocoPhillips | - | 42 | 7 | |||||||||||||||
| ||||||||||||||||||||
Total Alaska | 175 | 49 | 183 | |||||||||||||||||
| ||||||||||||||||||||
| *Thousands | of barrels per day. |
| **Millions | of cubic feet per day. |
Greater Prudhoe Area
The Greater Prudhoe Area includes the Prudhoe Bay Field and five satellite fields, as well as the Greater Point McIntyre Area fields. Prudhoe Bay, the largest oil field on Alaska's North Slope, is the site of a large waterflood and enhanced oil recovery operation, as well as a gas plant which processes natural gas for reinjection into the reservoir. Prudhoe Bay's satellites are Aurora, Borealis, Polaris, Midnight Sun and Orion, while the Point McIntyre, Niakuk, Raven and Lisburne fields are part of the Greater Point McIntyre Area.
Greater Kuparuk Area
We operate the Greater Kuparuk Area, which consists of the Kuparuk Field and four satellite fields: Tarn, Tabasco, Meltwater and West Sak. Kuparuk is located 40 miles west of Prudhoe Bay. Field installations include three central production facilities which separate oil, natural gas and water, as well as a separate seawater treatment plant. Development drilling at Kuparuk consists of rotary-drilled wells and horizontal multi-laterals from existing well bores utilizing coiled-tubing drilling.
The successful Shark Tooth delineation well extended the known Kuparuk accumulation to the southwestern area of the Kuparuk Field where construction of Drill Site 2S is progressing. The project was sanctioned in October 2014. First production is estimated in late 2015, with net peak production estimated at 5 MBOED in 2017.
In 2014 we received regulatory approvals to advance oil development targeting the West Sak reservoir in the Kuparuk River Unit. Pending a final investment decision, the development, 1H Northeast West Sak (NEWS), will include a nine-acre extension to an existing drill site allowing for new wells and associated facilities. We anticipate first production in 2017.
Western North Slope
On the Western North Slope, we operate the Colville River Unit, which includes the Alpine Field and three satellite fields: Nanuq, Fiord and Qannik. Alpine is located 34 miles west of Kuparuk. Construction is progressing on Alpine West CD5, a new drill site which will extend the Alpine reservoir west into the NPRA. Initial production is anticipated in late 2015, with net peak production estimated at 10 MBOED in 2016.
4
The Greater Mooses Tooth Unit, the first unit established entirely within the NPRA, was formed in 2008. In 2014 we progressed development planning for the Greater Mooses Tooth #1 (GMT1) drill site. Delays in federal permitting and requirements, in addition to the current low commodity price environment, have resulted in deferral of the final investment decision. We plan to shoot seismic and continue engineering in 2015. GMT1 is planned to be connected by road to the CD5 drill site, and production will be transported by pipeline to the existing Alpine facilities for processing. We are evaluating further exploration and development potential in the NPRA.
Cook Inlet Area
We operate the North Cook Inlet Unit, the Beluga River Unit, and the Kenai LNG Facility in the Cook Inlet Area. We have a 100 percent interest in the North Cook Inlet Unit and the Kenai LNG Facility, while we own 33.3 percent of the Beluga River Unit. Our share of production from the units is primarily sold to local utilities and is also used to supply feedstock to the Kenai LNG Plant.
The Kenai LNG Facility includes a 1.6 million-tons-per-year capacity plant, as well as docking and loading facilities for LNG tankers. LNG from the plant has historically been transported and sold to utility companies in Japan. The plant was idled in late-2012; however, due to a change in market conditions, including additional gas supplies, we were granted a two-year export license from the U.S. Department of Energy (DOE) in April 2014 to export up to 40 billion cubic feet of LNG from the facility. As a result, we shipped 5 cargoes of LNG from the Kenai Facility to Asia in 2014.
Point Thomson
We own a 5 percent interest in the Point Thomson Unit, which is located approximately 60 miles east of Prudhoe Bay. An initial production system is anticipated to be online by 2016, which is estimated to send 400 net BOED of condensate through the Trans-Alaska Pipeline System (TAPS).
Alaska LNG (AKLNG)
During 2012 we, along with affiliates of Exxon Mobil Corporation, BP p.l.c. and TransCanada Corporation (collectively, the "AKLNG co-venturers"), began evaluating a potential LNG project which would liquefy and export natural gas from Alaska's North Slope and deliver it to market. The AKLNG Project concept is an integrated LNG project consisting of a liquefaction plant, including marine terminal facilities and auxiliary marine vessels, located in south-central Alaska; a natural gas treatment plant, located on the North Slope; and an estimated 800-mile natural gas pipeline, which would connect the two plants.
The proposed AKLNG natural gas liquefaction plant and terminal would be located in the Nikiski area on the Kenai Peninsula, approximately 60 miles southwest of Anchorage, along the Cook Inlet. In January 2014 the AKLNG co-venturers, the Commissioners of the Alaska Departments of Revenue and Natural Resources, and the Alaska Gasline Development Corporation, a state-owned corporation, signed a Heads of Agreement (HOA) for the AKLNG Project. The HOA provides a roadmap of how the parties intend to progress the project, including proposed terms for participation by the State of Alaska as an equity owner, proposed fiscal and regulatory terms, and proposed terms for expansion of project components. During 2014 general legislation was enacted by the State of Alaska, and a joint venture agreement for the preliminary front-end engineering and design phase of the project was executed. The AKLNG Project will require many major federal permits, and in July 2014 an application for an LNG export license was filed with the U.S. DOE to export up to 20 million metric tons a year of LNG for 30 years. In November 2014 the U.S. DOE authorized the export of LNG to free trade agreement (FTA) countries, and authorization to export to non-FTA countries remains pending. In September 2014 the Federal Energy Regulatory Commission (FERC) accepted the project into pre-file status, which initiates the lengthy environmental and safety reviews required to design, permit, construct and operate the plants and pipeline.
Significant engineering, technical, regulatory, fiscal, commercial and permitting issues would need to be resolved prior to a final investment decision on the potential $45 billion to $65 billion (gross) project.
5
Exploration
In 2014 we drilled two exploration wells within the Greater Mooses Tooth Unit: the Rendezvous 3 and Flattop-1. Potential development of the Rendezvous 3 area is under evaluation. Flattop-1 encountered hydrocarbons but was expensed. The well is temporarily abandoned and available for testing in the future. In 2013 we drilled in the Cassin Prospect, located in the Bear Tooth Unit in the northeast NPRA, and we are continuing to evaluate development options. The Moraine Prospect, located on the western flank of the Kuparuk Field, was tested in 2013 and began producing in 2014.
Transportation
We transport the petroleum liquids produced on the North Slope to south-central Alaska through an 800-mile pipeline that is part of TAPS. We have a 29.1 percent ownership interest in TAPS, and we also have ownership interests in the Alpine, Kuparuk and Oliktok pipelines on the North Slope.
Our wholly owned subsidiary, Polar Tankers, Inc., manages the marine transportation of our North Slope production, using five company-owned, double-hulled tankers, and charters third-party vessels as necessary. The tankers primarily deliver oil from Valdez, Alaska, to refineries on the west coast of the United States.
LOWER 48
The Lower 48 segment consists of operations located in the U.S. Lower 48 states and exploration activities in the Gulf of Mexico. The Lower 48 business is organized within four regions covering the Gulf Coast, Mid-Continent, Rockies and San Juan. As a result of increasing shale opportunities, we have directed our investments toward certain higher-margin, liquids-rich plays. We hold 15 million net onshore and offshore acres in the Lower 48. In 2014 the Lower 48 contributed 32 percent of our worldwide liquids production and 38 percent of our natural gas production.
| 2014 | ||||||||||||||||||||
| Interest | Operator | Liquids MBD | Natural Gas MMCFD | Total MBOED | ||||||||||||||||
|
|
|
|
|
| |||||||||||||||
Average Daily Net Production | ||||||||||||||||||||
Eagle Ford | Various | % | Various | 122 | 199 | 155 | ||||||||||||||
Gulf of Mexico | Various | Various | 14 | 14 | 16 | |||||||||||||||
Gulf Coast-Other | Various | Various | 9 | 213 | 45 | |||||||||||||||
| ||||||||||||||||||||
Total Gulf Coast | 145 | 426 | 216 | |||||||||||||||||
| ||||||||||||||||||||
Permian | Various | Various | 38 | 119 | 58 | |||||||||||||||
Barnett | Various | Various | 6 | 45 | 13 | |||||||||||||||
Anadarko Basin | Various | Various | 7 | 119 | 27 | |||||||||||||||
| ||||||||||||||||||||
Total Mid-Continent | 51 | 283 | 98 | |||||||||||||||||
| ||||||||||||||||||||
Bakken | Various | Various | 45 | 32 | 50 | |||||||||||||||
Wyoming/Uinta | Various | Various | 1 | 96 | 17 | |||||||||||||||
Niobrara | Various | Various | 2 | 1 | 2 | |||||||||||||||
| ||||||||||||||||||||
Total Rockies | 48 | 129 | 69 | |||||||||||||||||
| ||||||||||||||||||||
San Juan | Various | Various | 41 | 653 | 150 | |||||||||||||||
| ||||||||||||||||||||
Total U.S. Lower 48 | 285 | 1,491 | 533 | |||||||||||||||||
| ||||||||||||||||||||
6
Onshore
We hold 13 million net acres of onshore conventional and unconventional acreage in the Lower 48, the majority of which is either held by production or owned by the Company. Our unconventional holdings total approximately 2.7 million net acres in the following areas:
| • | 900,000 net acres in the San Juan Basin, located in northwestern New Mexico and southwestern Colorado; |
| • | 619,000 net acres in the Bakken, located in North Dakota and Eastern Montana; |
| • | 216,000 net acres in the Eagle Ford, located in South Texas; |
| • | 186,000 net acres in the Permian, located in West Texas and southeastern New Mexico; |
| • | 123,000 net acres in the Niobrara, located in northeastern Colorado; |
| • | 65,000 net acres in the Barnett, located in north central Texas; and |
| • | 578,000 net acres in other unconventional exploration plays. |
The majority of our 2014 onshore production originated from the Eagle Ford, San Juan, Permian and Bakken. Onshore activities in 2014 were centered mostly on continued development and optimization of emerging and existing assets, with an emphasis on areas with higher-margin, liquids-rich production, particularly in growing unconventional plays. Our major focus areas in 2014 included the following:
| • | Eagle Ford-The Eagle Ford transitioned into full field development in 2014, with the majority of the development program being drilled on multi-well pads. We operated 12 rigs throughout the majority of 2014, resulting in 196 operated wells drilled and 199 operated wells connected. In 2014 we also increased production by 30 percent compared with 2013, and we achieved net peak production of 179 MBOED, compared with 141 MBOED in 2013. |
| • | Bakken-The Bakken continued to experience a significant increase in activity in 2014, as we drilled 129 operated wells during the year and brought 137 operated wells online. We also operated 10 or more drilling rigs throughout the year and improved our efficiency with pad drilling. As a result, we achieved net peak production of more than 63 MBOED in 2014, compared with 43 MBOED in 2013. |
| • | San Juan Basin-The San Juan Basin includes significant conventional gas production, which yields approximately 30 percent natural gas liquids, as well as the majority of our U.S. coalbed methane (CBM) production. We hold approximately 1.3 million net acres of oil and gas leases by production in San Juan, where we continue to pursue select conventional development opportunities. This also includes approximately 900,000 net unconventional acres of lease rights. |
| • | Permian Basin-The Permian Basin is another area where we are leveraging our conventional legacy position by utilizing new technology to improve the ultimate recovery and value from these fields. This technology should also identify new, unconventional plays across the region. We hold approximately 1.1 million net acres in the Permian, which includes 186,000 net unconventional acres. |
Gulf of Mexico
At year-end 2014, our portfolio of producing properties in the Gulf of Mexico primarily consisted of one operated field and three fields operated by co-venturers, including:
| • | 75 percent operated working interest in the Magnolia Field in Garden Banks Blocks 783 and 784. |
| • | 15.9 percent nonoperated working interest in the unitized Ursa Field located in the Mississippi Canyon Area. |
| • | 15.9 percent nonoperated working interest in the Princess Field, a northern, subsalt extension of the Ursa Field. |
| • | 12.4 percent nonoperated working interest in the unitized K2 Field, comprised of seven blocks in the Green Canyon Area. |
7
Exploration
| • | Conventional Exploration |
At December 31, 2014, we held approximately 2.1 million net acres in the deepwater Gulf of Mexico.
We own a 30 percent nonoperated working interest in the Shenandoah discovery. The results of the first Shenandoah appraisal well were announced in 2013 and confirmed Shenandoah as a significant oil discovery. The second Shenandoah down dip appraisal well was spud in 2014 and expensed as a dry hole. Planning is underway for the next appraisal well, which is expected to spud in the second quarter of 2015.
As of December 2014, we owned a 35 percent nonoperated interest in the Gila Prospect and a 100 percent interest in one Gibson Prospect block, both located in the Keathley Canyon area of the Gulf of Mexico. In January 2015 we entered into an exchange agreement with Chevron Corporation and BP p.l.c. to align working interests in order to progress a hub development. As a result, our interests in both the Gila and the Gibson prospects were adjusted to 30 percent. The Gila exploration well was announced as a discovery in 2013 and is currently being appraised.
Other ongoing drilling activities at the end of 2014 included a Tiber appraisal well, in which we own an 18 percent working interest.
The nonoperated Coronado wildcat and appraisal wells and the Deep Nansen wildcat well were declared dry holes in 2014.
In support of our Gulf of Mexico exploration program, we secured access to two new-build deepwater drillships. The first drillship commenced drilling on our operated Harrier Prospect in February 2015, and we anticipate delivery of the second drillship during 2015. Both will provide rig availability for our operated drilling program. We expect to drill two wells in 2015 utilizing the first drillship.
| • | Unconventional Exploration |
In 2014 we actively pursued the exploration and appraisal of our existing unconventional resource plays, including the Niobrara play in the Denver-Julesburg Basin, and the Wolfcamp and Bone Springs plays in the Delaware Basin. During 2014 we acquired approximately 13,000 net additional acres in various resource plays across the Lower 48, which included the Permian, Niobrara and Eagle Ford plays, maintaining our significant acreage position in Lower 48 shale plays of approximately 2.7 million net acres. During 2014 we drilled a total of 36 unconventional exploration wells in the Niobrara play and the Delaware Basin.
In 2015 we plan to continue to explore and appraise certain unconventional plays and assess new unconventional opportunities, but at a slower pace in anticipation of weak 2015 commodity prices.
Facilities
Freeport LNG Terminal
In July 2013 we agreed with Freeport LNG Development, L.P. to terminate our long-term agreement to use 0.9 billion cubic feet per day of regasification capacity at Freeport's 1.5-billion-cubic-feet-per-day LNG receiving terminal in Quintana, Texas. The termination agreement was subject to Freeport LNG obtaining regulatory approval and project financing for an LNG liquefaction and export facility in Texas, in which we are not a participant. These conditions were satisfied in the fourth quarter of 2014, and we paid Freeport LNG a termination fee of $522 million. Freeport LNG repaid the outstanding ConocoPhillips loan used by Freeport LNG to partially fund the original construction of the terminal. These transactions, plus miscellaneous items, resulted in a one-time net cash outflow of $63 million for us. In addition, we recognized an after-tax charge to earnings of $540 million in the fourth quarter of 2014, and our terminal regasification capacity has been reduced from 0.9 billion cubic feet per day to 0.4 billion cubic feet per day, until July 1, 2016, at which time it
8
will be reduced to zero. As a result of this transaction, we anticipate saving approximately $50 to $60 million per year in costs over the next 18 years. For additional information, see Note 3-Variable Interest Entities (VIEs), in the Notes to Consolidated Financial Statements.
Golden Pass LNG Terminal
We have a 12.4 percent ownership interest in the Golden Pass LNG Terminal and affiliated Golden Pass Pipeline, with a combined net book value of approximately $290 million at December 31, 2014. It is located adjacent to the Sabine-Neches Industrial Ship Channel northwest of Sabine Pass, Texas. The terminal became commercially operational in May 2011. We hold terminal and pipeline capacity for the receipt, storage and regasification of the LNG purchased from Qatargas 3 and the transportation of regasified LNG to interconnect with major interstate natural gas pipelines. Utilization of the terminal has been and is expected to be limited, as market conditions currently favor the flow of LNG to European and Asian markets. As a result, we are evaluating opportunities to optimize the value of the terminal facilities.
Great Northern Iron Ore Properties Trust
ConocoPhillips holds the reversionary interest in the Great Northern Iron Ore Properties trust (the Trust), a grantor trust that owns mineral interests in the Mesabi Iron Range in northeastern Minnesota and certain other personal property. Pursuant to the terms of the Trust Agreement, the Trust terminates on April 6, 2015. At the end of the wind-down period, documents memorializing ConocoPhillips' ownership of certain Trust property, including all of the Trust's mineral properties and active leases, will be delivered to ConocoPhillips. The Trustees currently anticipate the wind-down process, final distribution and dissolution of the Trust will be completed by the end of 2016. At that time, we expect to recognize the fair value of the Trust's net assets transferred to us.
Other
| • | San Juan Gas Plant-We operate and own a 50 percent interest in the San Juan Gas Plant, a 550 million cubic-feet-per-day capacity natural gas processing plant in Bloomfield, New Mexico. |
| • | Lost Cabin Gas Plant-We operate and own a 46 percent interest in the Lost Cabin Gas Plant, a 313 million cubic-feet-per-day capacity natural gas processing facility in Lysite, Wyoming. |
| • | Helena Condensate Processing Facility-We operate and own the Helena Condensate Processing Facility, a 90,000 barrel-per-day condensate processing plant located in Kenedy, Texas. |
| • | Sugarloaf Condensate Processing Facility-We operate and own an 87.5 percent interest in the Sugarloaf Condensate Processing Facility, a 30,000 barrel-per-day condensate processing plant located near Pawnee, Texas. |
| • | Bordovsky Condensate Processing Facility-We operate and own the Bordovsky Condensate Processing Facility, a 15,000 barrel-per-day condensate processing plant located in Kenedy, Texas. |
| • | Wingate Fractionator-We sold the Wingate Fractionator in 2014. |
9
CANADA
Our Canadian operations mainly consist of natural gas fields in western Canada and oil sands developments in the Athabasca Region of northeastern Alberta. In 2014 operations in Canada contributed 19 percent of our worldwide liquids production and 18 percent of our natural gas production.
| 2014 | ||||||||||||||||||||||||
| Interest | Operator | Liquids MBD | Natural Gas MMCFD | Bitumen MBD | Total MBOED | |||||||||||||||||||
|
|
|
|
|
| |||||||||||||||||||
Average Daily Net Production | ||||||||||||||||||||||||
Western Canada | Various | % | Various | 36 | 711 | - | 155 | |||||||||||||||||
Surmont | 50.0 | ConocoPhillips | - | - | 12 | 12 | ||||||||||||||||||
Foster Creek | 50.0 | Cenovus | - | - | 53 | 53 | ||||||||||||||||||
Christina Lake | 50.0 | Cenovus | - | - | 64 | 64 | ||||||||||||||||||
| ||||||||||||||||||||||||
Total Canada | 36 | 711 | 129 | 284 | ||||||||||||||||||||
| ||||||||||||||||||||||||
Western Canada
Our operations in western Canada extend across Alberta, British Columbia and Saskatchewan. We operate or have ownership interests in approximately 80 natural gas processing plants in the region, and, as of December 31, 2014, held leasehold rights in 5.7 million net acres in western Canada. Our investments in 2014 were focused mainly on higher-margin, liquids-rich opportunities in the following three core development areas:
| • | Deep Basin-We hold leasehold rights in 1.4 million net acres in the Deep Basin, located in northwest Alberta and northeast British Columbia. In 2014 Deep Basin achieved average net production of 44 MBOED, and we drilled 12 horizontal wells. |
| • | Kaybob-Edson-We hold leasehold rights in 0.9 million net acres in the Kaybob-Edson Area, located south of the Deep Basin in west-central Alberta. Net production for Kaybob-Edson averaged 41 MBOED in 2014, and we drilled 36 horizontal wells. |
| • | Clearwater-Located in west-central Alberta, south of Kaybob-Edson, we hold 0.8 million net acres of leasehold rights. In 2014 average net production for Clearwater was 41 MBOED, and we drilled 39 horizontal wells. |
Assets located outside the three core development areas are focused on production optimization and consist of 2.6 million net acres of leasehold rights. These assets averaged 29 MBOED of net production in 2014.
Oil Sands
We hold approximately 0.9 million net acres of land in the Athabasca Region of northeastern Alberta. Our bitumen resources in Canada are produced via an enhanced thermal oil recovery method called steam-assisted gravity drainage (SAGD), whereby steam is injected into the reservoir, effectively liquefying the heavy bitumen, which is recovered and pumped to the surface for further processing.
| • | Surmont-The Surmont oil sands leases are located approximately 35 miles south of Fort McMurray, Alberta. Surmont is a 50/50 joint venture with Total S.A. Surmont 2 construction began in 2010, with first steam targeted for mid-2015. Following startup, Surmont's gross production capacity is estimated to be 150 MBOED, with peak production anticipated by 2017. |
| • | FCCL- FCCL Partnership, a Canadian upstream general partnership, is a 50/50 heavy oil business venture with Cenovus Energy Inc. FCCL's assets are operated by Cenovus and include the Foster Creek, Christina Lake and Narrows Lake SAGD bitumen developments. FCCL continues to progress |
10
expansion plans which would potentially increase total gross production capacity to approximately 750 MBOED. In light of current market conditions for oil prices, FCCL plans to spread the capital investment in its oil sands projects over a longer period of time, which will slow the pace of certain developments. |
| o | Foster Creek |
Foster Creek is located approximately 200 miles northeast of Edmonton, Alberta. There are six producing phases at Foster Creek, Phases A through F, with one more under construction, Phase G. First production for Phase F was achieved in the third quarter of 2014, and first production for Phase G is anticipated in 2016. Due to the substantial decline in crude oil prices, construction on Phase H has been deferred in order to preserve cash. Phases G and H are each expected to add 30 MBOED of gross production capacity, with an additional 50 MBOED from potential optimization. In the fourth quarter of 2014, regulatory approval was received for Phase J, which should add approximately 50 MBOED of gross production capacity. With the additional phases and potential optimization, Foster Creek has the potential to reach approximately 310 MBOED of total gross production capacity.
| o | Christina Lake |
Christina Lake is located approximately 75 miles south of Fort McMurray, Alberta. There are five producing phases at Christina Lake, Phases A through E, with plans underway for Phase F. Gross production at Christina Lake increased approximately 40 percent in 2014, mostly as a result of Phase E reaching full capacity in the second quarter of 2014, in addition to strong facility uptime and strong well performance. During 2014 construction continued on Phases F and G. Phase F is expected to commence production in the second half of 2016 and add another 50 MBOED of gross production capacity. Further construction on Phase G has been deferred to preserve cash. An application for Phase H was submitted for regulatory review in 2013. With the additional expansion phases and optimization work, total gross production capacity from Christina Lake has the potential to reach approximately 310 MBOED.
| o | Narrows Lake |
Narrows Lake is located near Christina Lake. Plant construction on Phase A continued in 2014; however, further work at Narrows Lake has been deferred to preserve cash. Narrows Lake is estimated to reach 130 MBOED of total gross production capacity.
Amauligak
We have a 55 percent operating interest in the Amauligak discovery, which lies approximately 30 miles offshore in shallow water in the Beaufort Sea. In 2014 we decided not to pursue future development of the Amauligak discovery. Accordingly, we recorded a $109 million after-tax impairment of undeveloped leasehold costs associated with the offshore Amauligak discovery, Arctic Islands and other Beaufort properties. We, however, remain committed to the potential of the area, should technology and commodity prices improve.
Exploration
We hold exploration acreage in four areas of Canada: onshore western Canada, offshore eastern Canada, the Mackenzie Delta/Beaufort Sea Region and the Arctic Islands. Our primary exploration focus is on liquids-rich unconventional plays in western Canada and conventional exploration offshore eastern Canada.
| • | Conventional Exploration |
During 2014 we entered into a farm-in agreement to acquire a 30 percent nonoperated interest in six exploration licenses covering approximately five million gross acres in the deepwater Shelburne Basin, offshore Nova Scotia. Pending regulatory approval, we anticipate drilling will begin in the second half of 2015. In December 2014 we participated in a successful bid for one exploration license covering 0.7 million gross acres located in the Flemish Pass Basin, offshore Newfoundland. In January 2015 we were awarded the license, in which we hold a 30 percent nonoperated interest.
11
| • | Unconventional Exploration |
We hold approximately 0.7 million net acres in the emerging Montney, Muskwa, Duvernay and Canol unconventional plays in Alberta, northeastern British Columbia and the Northwest Territories. During 2014 we continued to drill unconventional test wells in the Duvernay, located in Alberta; the Canol shale, located in the Northwest Territories; and the Montney play, which extends from British Columbia into Alberta.
EUROPE
The Europe segment consists of operations principally located in the Norwegian and U.K. sectors of the North Sea, as well as exploration activities in the Barents Sea, offshore Norway; Central North Sea and west of Shetland, offshore United Kingdom; and Baffin Bay and Greenland Sea, offshore Greenland. In 2014 operations in Europe contributed 15 percent of our worldwide liquids production and 12 percent of natural gas production.
Norway
| 2014 | ||||||||||||||||||||
| Interest | Operator | Liquids MBD | Natural Gas MMCFD | Total MBOED | ||||||||||||||||
|
|
|
|
|
| |||||||||||||||
Average Daily Net Production | ||||||||||||||||||||
Greater Ekofisk Area | 35.1 | % | ConocoPhillips | 57 | 47 | 65 | ||||||||||||||
Alvheim | 20.0 | Det norske | 11 | 13 | 13 | |||||||||||||||
Heidrun | 24.0 | Statoil | 12 | 12 | 14 | |||||||||||||||
Other | Various | Various | 14 | 66 | 25 | |||||||||||||||
| ||||||||||||||||||||
Total Norway | 94 | 138 | 117 | |||||||||||||||||
| ||||||||||||||||||||
The Greater Ekofisk Area is located approximately 200 miles offshore Stavanger, Norway in the North Sea, and comprises four producing fields: Ekofisk, Eldfisk, Embla and Tor. Crude oil is exported to Teesside, England, and the natural gas is exported to Emden, Germany. Ekofisk South achieved first production in 2013 and continued to ramp up during 2014, while Eldfisk II achieved startup in January 2015. Ekofisk South, along with Eldfisk II and other developments offshore Norway, will contribute additional production over the coming years, as additional wells come online.
The Alvheim development is located in the northern part of the North Sea and consists of a floating production, storage and offloading (FPSO) vessel and subsea installations. Produced crude oil is exported via shuttle tankers, and natural gas is transported to the United Kingdom via a pipeline to the Beryl-Sage system.
The Heidrun Field is located in the Norwegian Sea. Produced crude oil is transported to Mongstad in Norway and Tetney in the United Kingdom by double-hulled shuttle tankers. Part of the natural gas is currently injected into the reservoir for optimization of crude oil production, while the remainder is used as feedstock in a methanol plant in Norway, in which we own an 18.3 percent interest.
We also have varying ownership interests in five other producing fields in the Norway sector of the North Sea and in the Norwegian Sea, as well as the Aasta Hansteen development. The operator is targeting first gas for Aasta Hansteen by late 2017.
Exploration
During 2014 we participated in two nonoperated wildcat wells in the Barents Sea; both were declared dry holes. In the Visund area of the North Sea, we participated in the Helene/Methone nonoperated exploration well, which was a gas discovery and is currently being evaluated for development. We also participated in the
12
Barents Sea 3-D seismic group study over the recently opened southeast Barents area. In 2014 we were awarded two new North Sea licenses from the 2013 Awards in Pre-defined Areas licensing round: PL044B and PL736S, in which we will own a 41.88 percent operating interest and a 20 percent nonoperated interest, respectively.
Transportation
We own a 35.1 percent interest in the Norpipe Oil Pipeline System, a 220-mile pipeline which carries crude oil from Ekofisk to a crude oil stabilization and natural gas liquids processing facility in Teesside, England. In addition, we own a 1.9 percent interest in Norwegian Continental Shelf Gas Transportation (Gassled), which owns most of the Norwegian gas transportation infrastructure.
United Kingdom
| 2014 | ||||||||||||||||||||
| Interest | Operator | Liquids MBD | Natural Gas MMCFD | Total MBOED | ||||||||||||||||
|
|
|
|
|
| |||||||||||||||
Average Daily Net Production | ||||||||||||||||||||
Britannia | 58.7 | % | Britannia | 4 | 86 | 18 | ||||||||||||||
| Operator Ltd. | ||||||||||||||||||||
Britannia Satellites | 75.0–83.5 | ConocoPhillips | 6 | 18 | 9 | |||||||||||||||
J-Area | 32.5–36.5 | ConocoPhillips | 24 | 105 | 42 | |||||||||||||||
Southern North Sea | Various | Various | - | 77 | 13 | |||||||||||||||
East Irish Sea | 100.0 | HRL | - | 37 | 6 | |||||||||||||||
Other | Various | Various | 6 | - | 6 | |||||||||||||||
| ||||||||||||||||||||
Total United Kingdom | 40 | 323 | 94 | |||||||||||||||||
| ||||||||||||||||||||
Britannia is one of the largest natural gas and condensate fields in the North Sea. In addition to our interest in the Britannia Field, we own 50 percent of Britannia Operator Limited, the operator of the field. Condensate is delivered through the Forties Pipeline to an oil stabilization and processing plant near the Grangemouth Refinery in Scotland, while natural gas is transported through Britannia's line to St. Fergus, Scotland. The Britannia satellite fields, Callanish and Brodgar, produce via subsea manifolds and pipelines linked to the Britannia platform. The Britannia Long-Term Compression Project, which consisted of a new mono-column design compression facility for the Britannia Platform, achieved startup in the third quarter of 2014 and has increased Britannia's natural gas production by approximately 90 MMCFD gross.
The J-Area consists of the Judy/Joanne, Jade and Jasmine fields, located in the U.K. Central North Sea. The Jasmine Field is a high-pressure, high-temperature gas condensate reservoir located approximately six miles west of the Judy Platform. The development includes a 24-slot wellhead platform with a bridge-linked accommodation and utilities platform, a six-mile, 16-inch multi-phase pipeline bundle, and a riser and processing platform bridge-linked to the existing Judy Platform. First production from Jasmine commenced in late-2013 and continued to ramp up during 2014.
We have various ownership interests in 19 producing gas fields in the Rotliegendes and Carboniferous areas of the Southern North Sea. Our interests in the East Irish Sea include the Millom, Dalton and Calder fields, which are operated on our behalf by a third party.
We own a 24 percent interest in the Clair Field, located in the Atlantic Margin. Clair Ridge is the second phase of development for the Clair Field and is comprised of a 36-slot drilling and production facility with a bridge-linked accommodation and utilities platform. The new facilities will tie into existing oil and gas export pipelines to the Shetland Islands. Initial production for Clair Ridge is targeted for 2017.
13
Exploration
During 2014 the drilling and testing of three successful near-field prospects in the Greater Clair area was completed, and a fourth prospect is currently being tested. In the J-Area, well operations on the Jade South discovery, previously called the Romeo Prospect, were completed, and production was tied-in to the Jade Field during the second quarter of 2014. Additionally, a Jasmine exploration well was drilled and expensed as a dry hole in 2014, and a second well was spud in early 2015. We were also awarded three new licenses in the U.K. Continental Shelf 28 th Licensing Round, all of which are in proximity to existing acreage.
Transportation
We operate the Teesside oil and Theddlethorpe gas terminals in which we have 29.3 percent and 50 percent ownership interests, respectively. We also have a 100 percent ownership interest in the Rivers Gas Terminal, operated by a third party, in the United Kingdom. A project to replace the Acid Gas Plant at the Rivers Gas Terminal was completed in early 2014.
Greenland
Exploration
In 2014 we conducted field-based, metocean studies in Baffin Bay in Block 2011/11 of our operated Qamut license. Additionally, we participated in a 2-D seismic acquisition program in Northeast Greenland, as part of our work program obligation in our nonoperated Avinngaq license.
ASIA PACIFIC AND MIDDLE EAST
The Asia Pacific and Middle East segment has exploration and production operations in China, Indonesia, Malaysia, Australia and Timor Leste; producing operations in Qatar; and exploration activities in Bangladesh, Brunei and Myanmar. In 2014 operations in the Asia Pacific and Middle East segment contributed 13 percent of our worldwide liquids production and 31 percent of natural gas production.
Australia and Timor Sea
| 2014 | ||||||||||||||||||||
| Interest | Operator | Liquids MBD | Natural Gas MMCFD | Total MBOED | ||||||||||||||||
|
|
|
|
|
| |||||||||||||||
Average Daily Net Production | ||||||||||||||||||||
Australia Pacific LNG | 37.5 | % | Origin Energy | - | 131 | 22 | ||||||||||||||
Bayu-Undan | 56.9 | ConocoPhillips | 15 | 221 | 52 | |||||||||||||||
Athena/Perseus | 50.0 | ExxonMobil | - | 34 | 5 | |||||||||||||||
| ||||||||||||||||||||
Total Australia and Timor Sea |
| 15 | 386 | 79 | ||||||||||||||||
| ||||||||||||||||||||
Australia Pacific LNG
Australia Pacific LNG Pty Ltd (APLNG), our joint venture with Origin Energy Limited and China Petrochemical Corporation (Sinopec), is focused on producing CBM from the Bowen and Surat basins in Queensland, Australia, and converting the CBM into LNG. Natural gas is currently sold to domestic customers, while progress continues on the development of the LNG processing and export sales business. Origin operates APLNG's upstream production and pipeline system, and we will operate the downstream LNG facility, located on Curtis Island near Gladstone, Queensland.
Two fully subscribed 4.5-million-tonnes-per-year LNG trains have been sanctioned. Approximately 3,900 net wells are ultimately envisioned to supply both the domestic gas market and the LNG sales contracts. The wells will be supported by gathering systems, central gas processing and compression stations, water treatment facilities, and a new export pipeline connecting the gas fields to the LNG facilities. First LNG is expected in mid-2015 from Train 1. Following commissioning, the LNG will be sold to Sinopec under a 20-year sales agreement for up to 4.3 million metric tonnes of LNG per year. Startup of the second LNG train is expected to
14
occur six-to-nine months following the startup of Train 1. The resulting LNG exports from Train 2 will commence shortly thereafter. Sinopec has agreed to purchase an additional 3.3 million metric tonnes of LNG per year through 2035, and Japan-based Kansai Electric Power Co., Inc. has agreed to purchase approximately 1 million metric tonnes of LNG per year for 20 years.
APLNG has an $8.5 billion project finance facility, of which $8.1 billion had been drawn from the facility at December 31, 2014. In connection with the execution of the project financing, we provided a completion guarantee for our pro-rata share of the project finance facility until the project achieves financial completion. For additional information, see Note 3-Variable Interest Entities (VIEs), Note 6-Investments, Loans and Long-Term Receivables, and Note 11-Guarantees, in the Notes to Consolidated Financial Statements.
Bayu-Undan
The Bayu-Undan gas condensate field is located in the Timor Sea Joint Petroleum Development Area between Timor-Leste and Australia. We also operate and own a 56.9 percent interest in the associated Darwin LNG Facility, located at Wickham Point, Darwin.
The Bayu-Undan natural gas recycle facility processes wet gas; separates, stores and offloads condensate, propane and butane; and re-injects dry gas back into the reservoir. In addition, a 500-kilometer natural gas pipeline connects the facility to the 3.5-million-tonnes-per-year capacity Darwin LNG Facility. Produced natural gas is piped to the Darwin LNG Plant, where it is converted into LNG before being transported to international markets. In 2014 we sold 154 billion gross cubic feet of LNG to utility customers in Japan.
The Bayu-Undan Phase Three Development consists of two standalone, subsea horizontal wells tied back to the existing drilling, production and processing platform. In 2014 we completed the fabrication and installation of platform risers, topsides piping, wellheads and trees. Development drilling commenced in the second half of 2014, with initial production estimated in the first quarter of 2015. The development is expected to average an additional 100 MMCFD gross over two years.
ConocoPhillips served a Notice of Arbitration on the Timor-Leste Minister of Finance in October 2012 for outstanding disputes related to a series of tax assessments. The arbitration hearing was conducted in June 2014, and we are currently awaiting the Tribunal's decision. For additional information, see Note 12-Contingencies and Commitments, in the Notes to Consolidated Financial Statements.
Athena/Perseus
The Athena production license (WA-17-L) is located offshore Western Australia and contains part of the Perseus Field which straddles the boundary with WA-1-L, an adjoining license area. Natural gas is produced from these licenses.
Greater Sunrise
We have a 30 percent interest in the Greater Sunrise gas and condensate field located in the Timor Sea. In May 2013 the Timor-Leste Government referred a dispute with the Australian Government relating to the treaty on Certain Maritime Arrangements in the Timor Sea (CMATS) to international arbitration. Following agreement between the governments in September 2014, this arbitration is currently suspended until March 2015. The CMATS arbitration does not directly impact our underlying interests in Sunrise; however, we and the Sunrise co-venturers are unable to commit to further commercial and technical work activities due to the uncertainty created by the lack of government alignment. Accordingly, current activities are restricted to compliance and social investment, as well as maintaining relationships and development options for Sunrise.
Exploration
| • | Conventional Exploration |
We operate two exploration permits in the Browse Basin, offshore northwest Australia, in which we own a 40 percent interest in permits WA-315-P and WA-398-P, of the Greater Poseidon Area. Phase I of the Browse Basin drilling campaign in 2009/2010 resulted in three discoveries in the Greater Poseidon Area: Poseidon-1, Poseidon-2 and Kronos-1. Phase II of the drilling campaign resulted in
15
five additional discoveries: Boreas-1, Zephyros-1, Proteus-1 SD2, Poseidon-North-1 and Pharos-1. All wells have been completed, plugged and abandoned. The Grace-1 well, drilled in permit WA-314-P, was declared a dry hole in early 2014, and the permit was subsequently relinquished in June 2014.
We operate two retention leases in the Bonaparte Basin, offshore northern Australia, where we own a 37.5 percent interest in leases NT/RL5 and NT/RL6. A three-well drilling campaign commenced in 2014 to further evaluate the field's potential. The first two wells, Barossa-2 and Barossa-3, encountered hydrocarbons. The third well, Barossa-4, was spud in January 2015.
| • | Unconventional Exploration |
We own a 46 percent working interest in four exploration permits within the Canning Basin of Western Australia, which covers approximately 10 million gross acres. In October 2014 we exercised our right of withdrawal from the four permits, which is pending regulatory approval. The leases will expire in 2015.
Indonesia
| 2014 | ||||||||||||||||||||
| Interest | Operator | Liquids MBD | Natural Gas MMCFD | Total MBOED | ||||||||||||||||
|
|
|
|
|
| |||||||||||||||
Average Daily Net Production |
| |||||||||||||||||||
South Natuna Sea Block B | 40.0 | % | ConocoPhillips | 9 | 117 | 29 | ||||||||||||||
South Sumatra | 45.0–54.0 | ConocoPhillips | 2 | 344 | 59 | |||||||||||||||
| ||||||||||||||||||||
Total Indonesia | 11 | 461 | 88 | |||||||||||||||||
| ||||||||||||||||||||
We operate five production sharing contracts (PSCs) in Indonesia: the offshore South Natuna Sea Block B and four onshore PSCs, the Corridor Block and South Jambi "B", both located in South Sumatra, Warim in Papua and Palangkaraya in central Kalimantan. Our producing assets are primarily concentrated in two core areas: South Natuna Sea and onshore South Sumatra.
South Natuna Sea Block B
The offshore South Natuna Sea Block B PSC has 3 producing oil fields and 16 natural gas fields in various stages of development. Natural gas production is sold under international sales agreements to Malaysia and Singapore, and liquefied petroleum gas is sold locally for domestic consumption.
South Sumatra
The Corridor PSC consists of five oil fields and seven natural gas fields in various stages of development. Natural gas is supplied from the Grissik and Suban gas processing plants to the Duri steamflood in central Sumatra and to markets in Singapore, Batam and West Java. Production from the South Jambi "B" PSC has reached depletion and field development has been suspended. We are evaluating options related to the future of this PSC.
Exploration
We own a 100 percent interest in the Palangkaraya PSC in central Kalimantan. Exploration drilling is scheduled to begin in the first quarter of 2015.
Transportation
We are a 35 percent owner of a consortium company that has a 40 percent ownership in PT Transportasi Gas Indonesia, which owns and operates the Grissik to Duri and Grissik to Singapore natural gas pipelines.
16
China
| 2014 | ||||||||||||||||||||
|
| |||||||||||||||||||
| Interest | Operator | Liquids MBD | Natural Gas MMCFD | Total MBOED | ||||||||||||||||
|
|
|
|
|
| |||||||||||||||
Average Daily Net Production | ||||||||||||||||||||
Peng Lai | 49.0 | % | CNOOC | 37 | 4 | 38 | ||||||||||||||
Panyu | 24.5 | CNOOC | 13 | - | 13 | |||||||||||||||
| ||||||||||||||||||||
Total China | 50 | 4 | 51 | |||||||||||||||||
| ||||||||||||||||||||
The Peng Lai 19-3, 19-9 and 25-6 fields are located in Bohai Bay Block 11/05. Production from the Phase I development of the PL 19-3 Field began in 2002. The Phase II development includes six drilling and production platforms and an FPSO vessel used to accommodate production from all the fields.
Effective July 1, 2014, operatorship of the Peng Lai fields transferred to China National Offshore Oil Corporation (CNOOC), in accordance with terms of the PSC. We retain a 49 percent nonoperated interest.
The Panyu development, located in Block 15/34 in the South China Sea, is comprised of three oil fields: Panyu 4-2, Panyu 5-1 and Panyu 11-6. The PSC for the block is scheduled to expire in September 2018, at which time we will relinquish all of our working interest in the block.
Exploration
| • | Conventional Exploration |
In 2014 we participated in four successful appraisal wells in the Peng Lai fields, which will be used to optimize our growth program.
| • | Unconventional Exploration |
In 2012 we entered into a joint study agreement (JSA) with Sinopec Southern Exploration Company over the Qijiang shale gas block, located in the Sichuan Basin. The Qijiang Block covers approximately one million acres. In February 2014 we were informed the majority of this area had been declared a military exclusion zone and would not be open for foreign cooperation. As a result, we are in the process of terminating the JSA.
In February 2013 we entered into a JSA with PetroChina over the 500,000-acre Neijiang-Dazu shale block, also located in the Sichuan Basin. In 2014 we decided not to pursue a PSC over the area.
Malaysia
| 2014 | ||||||||||||||||||||
|
| |||||||||||||||||||
| Interest | Operator | Liquids MBD | Natural Gas MMCFD | Total MBOED | ||||||||||||||||
|
|
|
|
|
| |||||||||||||||
Average Daily Net Production | ||||||||||||||||||||
Gumusut | 29.0 | % | Shell | 9 | 3 | 10 | ||||||||||||||
Siakap North-Petai | 21.0 | Murphy | 4 | - | 4 | |||||||||||||||
| ||||||||||||||||||||
Total Malaysia | 13 | 3 | 14 | |||||||||||||||||
| ||||||||||||||||||||
We own interests in five deepwater PSCs in Malaysia. Four are located off the eastern Malaysian state of Sabah: Block G, Block J, the Kebabangan Cluster (KBBC) and SB-311. Our fifth PSC, deepwater Block 3E, is located off the Malaysian state of Sarawak.
17
Block G
We have a 21 percent interest in the unitized Siakap North-Petai oil field, which began producing in the first quarter of 2014. Estimated net annual peak production of 6 MBOED is anticipated in 2015. Development of the Malikai oil field is underway with first production anticipated in 2017. Estimated net annual peak production of 19 MBOED is expected in 2018. We own a 35 percent interest in the Malikai, Pisagan, Ubah and Limbayong oil discoveries. The Limbayong-2 appraisal well, located approximately seven miles from Gumusut, was drilled in 2013 and resulted in an oil discovery. Development options are being evaluated.
Block J
First production for Gumusut occurred from an early production system in 2012. Production from a permanent, semi-submersible floating production vessel was achieved in October 2014, with estimated net annual peak production of 26 MBOED anticipated in 2016. Unitization of the Gumusut Field with Brunei was recorded in 2014 and reduced our ownership interest from 33 percent to 29 percent.
KBBC
We own a 30 percent interest in the KBBC PSC. Development of the KBB gas field commenced in 2011, and first production was achieved in November 2014; however, gas sales have not yet commenced due to ongoing repairs on a third-party pipeline. We anticipate the repairs will be completed in the second half of 2015. Estimated net annual peak production of 28 MBOED is expected in 2016. Kamunsu East is being evaluated for development options.
Exploration
We own a 40 percent operating interest in SB-311, an exploration block encompassing 259,000 gross acres offshore Sabah. We plan to commence drilling in 2015 under a two-well commitment program.
We own an 85 percent operating interest in deepwater Block 3E, which encompasses approximately 480,000 gross acres offshore Sarawak. Seismic acquisition and reprocessing occurred in 2014, and drilling is planned for 2016-2017.
Bangladesh
Exploration
In 2014 we relinquished the PSC for two deepwater blocks in the Bay of Bengal, Blocks 10 and 11. We were the high bidder on adjoining Deepwater Blocks 12, 16 and 21 in 2014 and are awaiting finalization of the PSC.
Brunei
Exploration
We have a 6.25 percent working interest in the deepwater Block CA-2 PSC, which has an exploration period through December 2018. Exploration has been ongoing since September 2011. The Kempas-1 well was declared a dry hole in January 2014.
Myanmar
Exploration
In 2014 we were awarded deepwater Block AD-10 in the 2013 Myanmar offshore oil and gas bidding round. Finalization of the PSC is anticipated to occur in early 2015.
18
Qatar
| 2014 | ||||||||||||||||||||
|
| |||||||||||||||||||
| Interest | Operator | Liquids MBD | Natural Gas MMCFD | Total MBOED | ||||||||||||||||
|
|
|
|
|
| |||||||||||||||
Average Daily Net Production | ||||||||||||||||||||
Qatargas 3 | 30.0 | % | Qatargas Operating Co. | 23 | 374 | 85 | ||||||||||||||
| ||||||||||||||||||||
Total Qatar | 23 | 374 | 85 | |||||||||||||||||
| ||||||||||||||||||||
Qatargas 3 (QG3) is an integrated development jointly owned by Qatar Petroleum (68.5 percent), ConocoPhillips (30 percent) and Mitsui & Co., Ltd. (1.5 percent). QG3 consists of upstream natural gas production facilities, which produce approximately 1.4 billion gross cubic feet per day of natural gas from Qatar's North Field over a 25 year life, in addition to a 7.8-million-gross-tonnes-per-year LNG facility. LNG is shipped in leased LNG carriers destined for sale globally.
QG3 executed the development of the onshore and offshore assets as a single integrated development with Qatargas 4 (QG4), a joint venture between Qatar Petroleum and Royal Dutch Shell plc. This included the joint development of offshore facilities situated in a common offshore block in the North Field, as well as the construction of two identical LNG process trains and associated gas treating facilities for both the QG3 and QG4 joint ventures. Production from the LNG trains and associated facilities are combined and shared.
OTHER INTERNATIONAL
The Other International segment includes exploration and producing operations in Libya and Russia, as well as exploration activities in Colombia, Poland, Angola, Senegal and Azerbaijan. During 2014 operations in Other International contributed 1 percent of our worldwide liquids production.
In 2014 we completed the sale of our Nigeria business. Results of operations for Nigeria have been reported as discontinued operations for all periods presented. For additional information, see Note 2-Discontinued Operations, in the Notes to Consolidated Financial Statements.
Libya
| 2014 | ||||||||||||||||||||
|
| |||||||||||||||||||
| Interest | Operator | Liquids MBD | Natural Gas MMCFD | Total MBOED | ||||||||||||||||
|
|
|
|
|
| |||||||||||||||
Average Daily Net Production | ||||||||||||||||||||
Waha Concession | 16.3 | % | Waha Oil Co. | 8 | 3 | 8 | ||||||||||||||
| ||||||||||||||||||||
Total Libya | 8 | 3 | 8 | |||||||||||||||||
| ||||||||||||||||||||
The Waha Concession consists of multiple concessions and encompasses nearly 13 million gross acres in the Sirte Basin. Our production operations in Libya and related oil exports were interrupted in mid-2013, as a result of the shutdown of the Es Sider crude oil export terminal at the end of July 2013. The Es Sider Terminal briefly reopened in the third quarter of 2014 and production and liftings resumed temporarily; however, further disruptions occurred in December 2014, and production is shut in again. The 2015 drilling program remains uncertain as a result of the ongoing civil unrest.
Exploration
During 2014 we completed drilling four appraisal wells. No decision has been made regarding the 2015 drilling program.
19
Russia
| 2014 | ||||||||||||||||||||
|
| |||||||||||||||||||
| Interest | Operator | Liquids MBD | Natural Gas MMCFD | Total MBOED | ||||||||||||||||
|
|
|
|
|
| |||||||||||||||
Average Daily Net Production | ||||||||||||||||||||
Polar Lights | 50.0 | % | Polar Lights Co. | 4 | - | 4 | ||||||||||||||
| ||||||||||||||||||||
Total Russia | 4 | - | 4 | |||||||||||||||||
| ||||||||||||||||||||
Polar Lights
Polar Lights Company is an entity which has developed several fields in the Timan-Pechora Basin in northern Russia.
Angola
Exploration
We have a 50 percent operating interest in Block 36 and a 30 percent operating interest in Block 37, both of which are located in Angola's subsalt play trend. The two blocks total approximately 2.5 million gross acres. We have secured a rig for a four-well commitment program and commenced drilling in the second quarter of 2014. In November 2014 we plugged and abandoned the Kamoxi-1 exploration well as a dry hole. Kamoxi-1 is located in Block 36 offshore Angola. We subsequently spud the Omosi-1 well in adjacent Block 37, which is the second wildcat in our planned four-well exploration program in the Kwanza Basin.
Senegal
Exploration
We have a 35 percent working interest in three exploration blocks offshore Senegal. In October 2014 we discovered a working petroleum system at the FAN-1 exploration well. In addition, in November 2014 we confirmed oil was discovered in the SNE-1 well, the second of the two-well program. Further evaluation of both wells is required to determine commerciality. We have the option to become operator of the project if it advances to development.
Azerbaijan
Transportation
The Baku-Tbilisi-Ceyhan (BTC) Pipeline transports crude oil from the Caspian Region through Azerbaijan, Georgia and Turkey for tanker loadings at the port of Ceyhan. We have a 2.5 percent interest in BTC.
Poland
Exploration
We are participating in a shale gas venture in Poland and own a 100 percent interest in Lane Energy Poland. We operate three western Baltic Basin concessions, which encompass approximately 500,000 gross acres. A horizontal well was drilled and completed in 2014, and further evaluation continues.
Colombia
Unconventional Exploration
We have a 70 percent nonoperated working interest for deep rights in the Santa Isabel Block in the Middle Magdalena Basin, which covers approximately 71,000 net acres. During 2014 work continued on the environmental impact assessment for an area of the Santa Isabel block in preparation for future drilling.
We also hold 30 percent nonoperated working interests in three blocks in the Middle Magdalena Basin, which cover approximately 116,000 net acres. Exploration drilling commenced in October 2014 at the Picoplata-1 well, located on the VMM3 Block, with completion targeted during the first quarter of 2015.
20
Venezuela
In October 2014 we filed for arbitration under the rules of the International Chamber of Commerce (ICC) against Petroleos de Venezuela (PDVSA), the Venezuela state oil company, for contractual compensation related to the Petrozuata and Hamaca heavy crude oil projects. The ICC arbitration is a separate and independent legal action from the investment treaty arbitration against the government of Venezuela, which is currently proceeding before an arbitral tribunal under the World Bank's International Centre for Settlement for Investment Disputes (ICSID). ICSID is determining the damages owed to ConocoPhillips as a result of Venezuela's unlawful expropriation of ConocoPhillips' significant oil investments in the Petrozuata and Hamaca heavy crude oil projects and the offshore Corocoro development project in June 2007. For additional information, see Note 12-Contingencies and Commitments, in the Notes to Consolidated Financial Statements.
Ecuador
In December 2012 an ICSID tribunal issued a decision on liability in favor of Burlington Resources, Inc., a wholly owned subsidiary of ConocoPhillips, finding that Ecuador's seizure of Blocks 7 and 21 was an unlawful expropriation in violation of the Ecuador-U.S. Bilateral Investment Treaty. An additional arbitration phase is currently proceeding to determine the damages owed to ConocoPhillips for Ecuador's actions and to address Ecuador's counterclaims. For additional information, see Note 12-Contingencies and Commitments, in the Notes to Consolidated Financial Statements.
Discontinued Operations
Nigeria
In July 2014 we sold our Nigeria business. Production from discontinued operations for Nigeria averaged 21 MBOED in 2014.
OTHER
Marketing Activities
Our Commercial organization manages our worldwide commodity portfolio, which mainly includes natural gas, crude oil, bitumen, natural gas liquids and LNG. Marketing activities are performed through offices in the United States, Canada, Europe and Asia. In marketing our production, we attempt to minimize flow disruptions, maximize realized prices and manage credit-risk exposure. Commodity sales are generally made at prevailing market prices at the time of sale. We also purchase third-party volumes to better position the Company to fully utilize transportation and storage capacity and satisfy customer demand.
Natural Gas
Our natural gas production, along with third-party purchased gas, is primarily marketed in the United States, Canada, Europe and Asia. Our natural gas is sold to a diverse client portfolio which includes local distribution companies; gas and power utilities; large industrials; independent, integrated or state-owned oil and gas companies; as well as marketing companies. To reduce our market exposure and credit risk, we also transport natural gas via firm and interruptible transportation agreements to major market hubs.
Crude Oil, Bitumen and Natural Gas Liquids
Our crude oil, bitumen and natural gas liquids revenues are derived from production in the United States, Canada, Australia, Asia, Africa and Europe. These commodities are primarily sold under contracts with prices based on market indices, adjusted for location, quality and transportation.
Energy Partnerships
Marine Well Containment Company
We are a founding member of the Marine Well Containment Company (MWCC), a non-profit organization formed in 2010, which provides well containment equipment and technology in the deepwater U.S. Gulf of Mexico. In January 2015 MWCC announced acceptance of its expanded containment system (ECS). The ECS complements the capabilities and capacities put into place with its interim containment system, which the
21
industry has been relying on since 2011. Equipment from both systems have been combined to form MWCC's containment system, which meet the U.S. Bureau of Safety and Environmental Enforcement requirements for a subsea well containment system that can respond to a deepwater well control incident in the U.S. Gulf of Mexico.
Subsea Well Response Project
In 2011 we, along with several leading oil and gas companies, launched the Subsea Well Response Project (SWRP), a non-profit organization based in Stavanger, Norway, which was created to enhance the industry's capability to respond to international subsea well control incidents. Through collaboration with Oil Spill Response Limited, a non-profit organization in the United Kingdom, subsea well intervention equipment is available for the industry to use in the event of a subsea well incident. This complements the work being undertaken in the United States by MWCC.
Technology
Our Technology organization has several technology programs, which focus on areas to support our business growth plans: developing unconventional reservoirs, producing oil sands and heavy oil economically with fewer emissions, advancing our competitiveness in deepwater development capabilities, improving the economic efficiency of our LNG and other gas solutions technologies, increasing recoveries from our legacy fields, and implementing sustainability measures.
Our Optimized Cascade ® LNG liquefaction technology business continues to grow with the demand for new LNG plants. The technology has been applied in 10 LNG trains around the world, with 12 more under construction and feasibility studies ongoing.
RESERVES
We have not filed any information with any other federal authority or agency with respect to our estimated total proved reserves at December 31, 2014. No difference exists between our estimated total proved reserves for year-end 2013 and year-end 2012, which are shown in this filing, and estimates of these reserves shown in a filing with another federal agency in 2014.
DELIVERY COMMITMENTS
We sell crude oil and natural gas from our producing operations under a variety of contractual arrangements, some of which specify the delivery of a fixed and determinable quantity. Our Commercial organization also enters into natural gas sales contracts where the source of the natural gas used to fulfill the contract can be the spot market or a combination of our reserves and the spot market. Worldwide, we are contractually committed to deliver approximately 3 trillion cubic feet of natural gas, including approximately 500 billion cubic feet related to the noncontrolling interests of consolidated subsidiaries, and 200 million barrels of crude oil in the future. These contracts have various expiration dates through the year 2028. We expect to fulfill the majority of these delivery commitments with proved developed reserves. In addition, we anticipate using proved undeveloped reserves and spot market purchases to fulfill any remaining commitments. See the disclosure on "Proved Undeveloped Reserves" in the "Oil and Gas Operations" section following the Notes to Consolidated Financial Statements, for information on the development of proved undeveloped reserves.
COMPETITION
We compete with private, public and state-owned companies in all facets of the E&P business. Some of our competitors are larger and have greater resources. Each of our segments is highly competitive, with no single competitor, or small group of competitors, dominating.
22
We compete with numerous other companies in the industry, including state-owned companies, to locate and obtain new sources of supply and to produce oil, bitumen, natural gas liquids and natural gas in an efficient, cost-effective manner. Based on statistics published in the September 1, 2014, issue of the Oil and Gas Journal , we were the third-largest U.S.-based oil and gas company in worldwide liquids and natural gas production and reserves in 2013. We deliver our production into the worldwide commodity markets. Principal methods of competing include geological, geophysical and engineering research and technology; experience and expertise; economic analysis in connection with portfolio management; and safely operating oil and gas producing properties.
GENERAL
At the end of 2014, we held a total of 912 active patents in 56 countries worldwide, including 367 active U.S. patents. During 2014 we received 51 patents in the United States and 74 foreign patents. Our products and processes generated licensing revenues of $46 million in 2014. The overall profitability of any business segment is not dependent on any single patent, trademark, license, franchise or concession.
Company-sponsored research and development activities charged against earnings were $263 million, $258 million and $221 million in 2014, 2013 and 2012, respectively.
Health, Safety and Environment
Our Health, Safety and Environment (HSE) organization provides tools and support to our business units and staff groups to help them ensure world class health, safety and environmental performance. The framework through which we safely manage our operations, the HSE Management System Standard, emphasizes process safety, risk management, emergency preparedness and environmental performance, with an intense focus on occupational safety. In support of the goal of zero incidents, our HSE Excellence Process requires the business units to measure performance and drive continuous improvement. Assessments are conducted annually to capture progress and set new targets. We also have detailed processes in place to address sustainable development in our economic, environmental and social performance. Our processes, related tools and requirements focus on water, biodiversity and climate change, as well as social and stakeholder issues.
The environmental information contained in Management's Discussion and Analysis of Financial Condition and Results of Operations on pages 59 through 62 under the captions "Environmental" and "Climate Change" is incorporated herein by reference. It includes information on expensed and capitalized environmental costs for 2014 and those expected for 2015 and 2016.
Website Access to SEC Reports
Our internet website address is www.conocophillips.com . Information contained on our internet website is not part of this report on Form 10-K.
Our Annual Reports on Form 10-K, Quarterly Reports on Form 10-Q, Current Reports on Form 8-K and any amendments to these reports filed or furnished pursuant to Section 13(a) or 15(d) of the Securities Exchange Act of 1934 are available on our website, free of charge, as soon as reasonably practicable after such reports are filed with, or furnished to, the U.S. Securities and Exchange Commission (SEC). Alternatively, you may access these reports at the SEC's website at www.sec.gov .
23
Item 1A. RISK FACTORS
You should carefully consider the following risk factors in addition to the other information included in this Annual Report on Form 10-K. Each of these risk factors could adversely affect our business, operating results and financial condition, as well as adversely affect the value of an investment in our common stock.
Our operating results, our future rate of growth and the carrying value of our assets are exposed to the effects of changing commodity prices.
Prices for crude oil, bitumen, natural gas, natural gas liquids and LNG can fluctuate widely. Our revenues, operating results and future rate of growth are highly dependent on the prices we receive for our crude oil, bitumen, natural gas, natural gas liquids and LNG. The factors influencing these prices are beyond our control. Lower crude oil, bitumen, natural gas, natural gas liquids and LNG prices may have a material adverse effect on our revenues, operating income, cash flows and liquidity and may reduce the amount of our reserves we can produce economically. Significant reductions in crude oil, bitumen, natural gas, natural gas liquids and LNG prices could require us to reduce our capital expenditures or impair the carrying value of our assets.
Unless we successfully add to our existing proved reserves, our future crude oil, bitumen, natural gas and natural gas liquids production will decline, resulting in an adverse impact to our business.
The rate of production from upstream fields generally declines as reserves are depleted. Except to the extent that we conduct successful exploration and development activities, or, through engineering studies, optimize production performance or identify additional or secondary recovery reserves, our proved reserves will decline materially as we produce crude oil, bitumen, natural gas and natural gas liquids. Accordingly, to the extent we are unsuccessful in replacing the crude oil, bitumen, natural gas and natural gas liquids we produce with good prospects for future production, our business will experience reduced cash flows and results of operations.
Any material change in the factors and assumptions underlying our estimates of crude oil, bitumen, natural gas and natural gas liquids reserves could impair the quantity and value of those reserves.
Our proved reserve information included in this annual report has been derived from engineering estimates prepared by our personnel. Reserve estimation is a process that involves estimating volumes to be recovered from underground accumulations of crude oil, bitumen, natural gas and natural gas liquids that cannot be directly measured. As a result, different petroleum engineers, each using industry-accepted geologic and engineering practices and scientific methods, may produce different estimates of reserves and future net cash flows based on the same available data. Any significant future price changes could have a material effect on the quantity and present value of our proved reserves. Any material changes in the factors and assumptions underlying our estimates of these items could result in a material negative impact to the volume of reserves reported. Future reserve revisions could also result from changes in, among other things, governmental regulation.
We expect to continue to incur substantial capital expenditures and operating costs as a result of our compliance with existing and future environmental laws and regulations. Likewise, future environmental laws and regulations may impact or limit our current business plans and reduce demand for our products.
Our businesses are subject to numerous laws and regulations relating to the protection of the environment. These laws and regulations continue to increase in both number and complexity and affect our operations with respect to, among other things:
| • | The discharge of pollutants into the environment. |
| • | Emissions into the atmosphere, such as nitrogen oxides, sulfur dioxide, mercury and greenhouse gas emissions. |
| • | Carbon taxes. |
24
| • | The handling, use, storage, transportation, disposal and cleanup of hazardous materials and hazardous and nonhazardous wastes. |
| • | The dismantlement, abandonment and restoration of our properties and facilities at the end of their useful lives. |
| • | Exploration and production activities in certain areas, such as offshore environments, arctic fields, oil sands reservoirs and shale plays. |
We have incurred and will continue to incur substantial capital, operating and maintenance, and remediation expenditures as a result of these laws and regulations. To the extent these expenditures, as with all costs, are not ultimately reflected in the prices of our products and services, our business, financial condition, results of operations and cash flows in future periods could be materially adversely affected.
Although our business operations are designed and operated to accommodate expected climatic conditions, to the extent there are significant changes in the Earth's climate, such as more severe or frequent weather conditions in the markets we serve or the areas where our assets reside, we could incur increased expenses, our operations could be materially impacted, and demand for our products could fall.
Domestic and worldwide political and economic developments could damage our operations and materially reduce our profitability and cash flows.
Actions of the U.S., state, local and foreign governments, through tax and other legislation, executive order and commercial restrictions, could reduce our operating profitability both in the United States and abroad. In certain locations, governments have imposed or proposed restrictions on our operations; special taxes or tax assessments; and payment transparency regulations that could require us to disclose competitively sensitive information or might cause us to violate non-disclosure laws of other countries. U.S. federal, state and local legislative and regulatory agencies' initiatives regarding the hydraulic fracturing process could result in operating restrictions or delays in the completion of our oil and gas wells.
The U.S. government can also prevent or restrict us from doing business in foreign countries. These restrictions and those of foreign governments have in the past limited our ability to operate in, or gain access to, opportunities in various countries. Actions by host governments have affected operations significantly in the past, such as the expropriation of our oil assets by the Venezuelan government, and may continue to do so in the future. Changes in domestic and international regulations may affect our ability to obtain or maintain permits, including those necessary for drilling and development of wells or for construction of LNG terminals or regasification facilities in various locations.
Local political and economic factors in international markets could have a material adverse effect on us. Approximately 54 percent of our hydrocarbon production from continuing operations was derived from production outside the United States in 2014, and 56 percent of our proved reserves, as of December 31, 2014, was located outside the United States. We are subject to risks associated with operations in international markets, including changes in foreign governmental policies relating to crude oil, natural gas, bitumen, natural gas liquids or LNG pricing and taxation, other political, economic or diplomatic developments, changing political conditions and international monetary fluctuations.
Changes in governmental regulations may impose price controls and limitations on production of crude oil, bitumen, natural gas and natural gas liquids.
Our operations are subject to extensive governmental regulations. From time to time, regulatory agencies have imposed price controls and limitations on production by restricting the rate of flow of crude oil, bitumen, natural gas and natural gas liquids wells below actual production capacity. Because legal requirements are frequently changed and subject to interpretation, we cannot predict the effect of these requirements.
25
Our investments in joint ventures decrease our ability to manage risk.
We conduct many of our operations through joint ventures in which we may share control with our joint venture partners. There is a risk our joint venture participants may at any time have economic, business or legal interests or goals that are inconsistent with those of the joint venture or us, or our joint venture partners may be unable to meet their economic or other obligations and we may be required to fulfill those obligations alone. Failure by us, or an entity in which we have a joint venture interest, to adequately manage the risks associated with any acquisitions or joint ventures could have a material adverse effect on the financial condition or results of operations of our joint ventures and, in turn, our business and operations.
We do not insure against all potential losses; therefore, we could be harmed by unexpected liabilities and increased costs.
We maintain insurance against many, but not all, potential losses or liabilities arising from operating risks. As such, our insurance coverage may not be sufficient to fully cover us against potential losses arising from such risks. Uninsured losses and liabilities arising from operating risks could reduce the funds available to us for capital, exploration and investment spending and could have a material adverse effect on our business, financial condition, results of operations and cash flows.
Our operations present hazards and risks that require significant and continuous oversight.
The scope and nature of our operations present a variety of significant hazards and risks, including operational hazards and risks such as explosions, fires, crude oil spills, severe weather, geological events, labor disputes, civil unrest or cyber attacks. Our operations may be adversely affected by unavailability, interruptions or accidents involving services or infrastructure required to develop, produce, process or transport our production, such as contract labor, drilling rigs, pipelines, railcars, tankers, barges or other infrastructure. Our operations are also subject to the additional hazards of pollution, releases of toxic gas and other environmental hazards and risks. Activities in deepwater areas may pose incrementally greater risks because of complex subsurface conditions such as higher reservoir pressures, water depths and metocean conditions. All such hazards could result in loss of human life, significant property and equipment damage, environmental pollution, impairment of operations, substantial losses to us and damage to our reputation.
Our technologies, systems and networks may be subject to cybersecurity breaches. Although we have experienced occasional, actual or attempted breaches of our cybersecurity, none of these breaches has had a material effect on our business, operations or reputation. If our systems for protecting against cybersecurity risks prove to be insufficient, we could be adversely affected by having our business systems compromised, our proprietary information altered, lost or stolen, or our business operations disrupted. As cyber attacks continue to evolve, we may be required to expend significant additional resources to continue to modify or enhance our protective measures or to investigate and remediate any information systems and related infrastructure security vulnerabilities.
Item 1B. UNRESOLVED STAFF COMMENTS
None.
Item 3. LEGAL PROCEEDINGS
The following is a description of reportable legal proceedings, including those involving governmental authorities under federal, state and local laws regulating the discharge of materials into the environment for this reporting period. The following proceedings include those matters that arose during the fourth quarter of 2014, as well as matters previously reported in our 2013 Form 10-K and our first-, second- and third-quarter 2014 Form 10-Qs that were not resolved prior to the fourth quarter of 2014. Material developments to the previously reported matters have been included in the descriptions below. While it is not possible to
26
accurately predict the final outcome of these pending proceedings, if any one or more of such proceedings were to be decided adversely to ConocoPhillips, we expect there would be no material effect on our consolidated financial position. Nevertheless, such proceedings are reported pursuant to SEC regulations.
On April 30, 2012, the separation of our downstream business was completed, creating two independent energy companies: ConocoPhillips and Phillips 66. In connection with the separation, we entered into an Indemnification and Release Agreement, which provides for cross-indemnities between Phillips 66 and us and established procedures for handling claims subject to indemnification and related matters, such as legal proceedings. We have included matters where we remain a party to a proceeding relating to Phillips 66, in accordance with SEC regulations. We do not expect any of those matters to result in a net claim against us.
Matters Previously Reported-ConocoPhillips
The New Mexico Environment Department has issued a Notice of Violation (NOV) to ConocoPhillips alleging failure to comply with two air emission monitoring requirements at the East Vacuum Liquid Recovery/CO2 Plant in southeastern New Mexico. The Plant has corrected these issues and has resolved this NOV by paying a penalty of $34,003.
Matters Previously Reported-Phillips 66
In October 2007 ConocoPhillips received a Complaint from the EPA alleging violations of the Clean Water Act related to a 2006 oil spill at the Phillips 66 Bayway Refinery and proposing a penalty of $156,000.
On May 19, 2010, the Phillips 66 Lake Charles Refinery received a Consolidated Compliance Order and Notice of Potential Penalty from the Louisiana Department of Environmental Quality (LDEQ) alleging various violations of applicable air emission regulations, as well as certain provisions of the consent decree in Civil Action No. H-01-4430. In July 2014 Phillips 66 resolved the consent decree issues and is working with the LDEQ to resolve the remaining allegations.
In October 2011 ConocoPhillips was notified by the Attorney General of the State of California that it was conducting an investigation into possible violations of the regulations relating to the operation of underground storage tanks at gas stations in California. On January 3, 2013, the California Attorney General filed a lawsuit notice that alleges such violations.
On October 15, 2012, the Bay Area Air Quality Management District (Bay Area AQMD) issued a $313,000 demand to settle 13 other NOVs issued in 2010 and 2011 with respect to alleged violations of regulatory and/or permit requirements at the Phillips 66 Rodeo Refinery.
In May 2012 the Illinois Attorney General's office filed and notified ConocoPhillips of a complaint with respect to operations at the Phillips 66 WRB Wood River Refinery alleging violations of the Illinois groundwater standards and a third-party's hazardous waste permit. The complaint seeks as relief remediation of area groundwater; compliance with the hazardous waste permit; enhanced pipeline and tank integrity measures; additional spill reporting; and yet-to-be specified amounts for fines and penalties.
On July 7, 2014, the Phillips 66 WRB Wood River Refinery received a NOV from the U.S. EPA alleging various flaring-related violations between 2009 and 2013.
On July 8, 2014, the Bay Area AQMD issued a $175,000 demand to settle 18 NOVs issued in 2010 with respect to alleged violations of regulatory and/or permit requirements at the Phillips 66 Rodeo Refinery.
On July 8, 2014, the Bay Area AQMD issued a $259,000 demand to settle 20 NOVs issued in 2011 with respect to alleged violations of regulatory and/or permit requirements at the Phillips 66 Rodeo Refinery.
Item 4. MINE SAFETY DISCLOSURES
Not applicable.
27
EXECUTIVE OFFICERS OF THE REGISTRANT
| Name | Position Held | Age * | ||
| Ellen R. DeSanctis | Vice President, Investor Relations and Communications | 58 | ||
| Sheila Feldman | Vice President, Human Resources, Real Estate and Facilities Services | 60 | ||
| Matt J. Fox | Executive Vice President, Exploration and Production | 54 | ||
| Alan J. Hirshberg | Executive Vice President, Technology and Projects | 53 | ||
| Janet L. Kelly | Senior Vice President, Legal, General Counsel and Corporate Secretary | 57 | ||
| Ryan M. Lance | Chairman of the Board of Directors and Chief Executive Officer | 52 | ||
| Andrew D. Lundquist | Senior Vice President, Government Affairs | 54 | ||
| Glenda M. Schwarz | Vice President and Controller | 49 | ||
| Jeff W. Sheets | Executive Vice President, Finance and Chief Financial Officer | 57 | ||
| Don E. Wallette, Jr. | Executive Vice President, Commercial, Business Development and Corporate Planning | 56 | ||
*On February 15, 2015.
There are no family relationships among any of the officers named above. Each officer of the Company is elected by the Board of Directors at its first meeting after the Annual Meeting of Stockholders and thereafter as appropriate. Each officer of the Company holds office from the date of election until the first meeting of the directors held after the next Annual Meeting of Stockholders or until a successor is elected. The date of the next annual meeting is May 12, 2015. Set forth below is information about the executive officers.
Ellen R. DeSanctis was appointed Vice President, Investor Relations and Communications in May 2012. She was previously employed by Petrohawk Energy Corp. and served as Senior Vice President, Corporate Communications since 2010. Prior to that she was employed by Rosetta Resources Inc. and served as Executive Vice President of Strategy and Development from 2008 to 2010.
Sheila Feldman was appointed Vice President, Human Resources, Real Estate and Facilities Services in May 2014. Prior to that, she served as Vice President, Human Resources since May 2012. She was previously employed by Arch Coal, Inc. and served as Vice President, Human Resources since 2003.
Matt J. Fox was appointed Executive Vice President, Exploration and Production in May 2012. Prior to that, he was employed by Nexen, Inc. and served as Executive Vice President, International since 2010. He was previously employed by ConocoPhillips and served as President, ConocoPhillips Canada from 2009 to 2010.
Alan J. Hirshberg was appointed Executive Vice President, Technology and Projects in May 2012. Prior to that, he served as Senior Vice President, Planning and Strategy since 2010.
Janet L. Kelly was appointed Senior Vice President, Legal, General Counsel and Corporate Secretary in 2007.
Ryan M. Lance was appointed Chairman of the Board of Directors and Chief Executive Officer in May 2012, having previously served as Senior Vice President, Exploration and Production-International since May 2009.
Andrew D. Lundquist was appointed Senior Vice President, Government Affairs in 2013. Prior to that, he served as managing partner of BlueWater Strategies LLC, since 2002.
Glenda M. Schwarz was appointed Vice President and Controller in 2009.
28
Jeff W. Sheets was appointed Executive Vice President, Finance and Chief Financial Officer in May 2012, having previously served as Senior Vice President, Finance and Chief Financial Officer since 2010.
Don E. Wallette, Jr. was appointed Executive Vice President, Commercial, Business Development and Corporate Planning in May 2012. Prior to that, he served as President, Asia Pacific since 2010 and President, Russia/Caspian from 2006 to 2010.
29
PART II
| Item 5. | MARKET FOR REGISTRANT'S COMMON EQUITY, RELATED STOCKHOLDER MATTERS AND ISSUER PURCHASES OF EQUITY SECURITIES |
Quarterly Common Stock Prices and Cash Dividends Per Share
ConocoPhillips' common stock is traded on the New York Stock Exchange, under the symbol "COP."
| Stock Price | ||||||||||||
| High | Low | Dividends | ||||||||||
|
|
|
| |||||||||
2014 | ||||||||||||
First | $ | 70.99 | 62.74 | 0.69 | ||||||||
Second | 86.43 | 69.33 | 0.69 | |||||||||
Third | 87.09 | 75.92 | 0.73 | |||||||||
Fourth | 76.52 | 60.84 | 0.73 | |||||||||
| ||||||||||||
2013 | ||||||||||||
First | $ | 62.05 | 56.78 | 0.66 | ||||||||
Second | 64.77 | 56.38 | 0.66 | |||||||||
Third | 71.09 | 60.73 | 0.69 | |||||||||
Fourth | 74.59 | 68.23 | 0.69 | |||||||||
| ||||||||||||
Closing Stock Price at December 31, 2014 | $ | 69.06 | ||||||||||
Closing Stock Price at January 31, 2015 | $ | 62.98 | ||||||||||
Number of Stockholders of Record at January 31, 2015* | 53,653 | |||||||||||
| ||||||||||||
*In determining the number of stockholders, we consider clearing agencies and security position listings as one stockholder for each agency listing.
Issuer Purchases of Equity Securities
| Millions of Dollars | ||||||||||||||||
Period | Total Number of Shares Purchased | * | Average Price Paid Per Share | Shares Purchased as Part of Publicly Announced Plans or Programs | Approximate Dollar Value of Shares that May Yet
Be Purchased Under the Plans or Programs | |||||||||||
| ||||||||||||||||
December 1-31, 2014 | 318 | $ | 70.10 | - | $ | - | ||||||||||
| ||||||||||||||||
Total fourth-quarter 2014 | 318 | $ | 70.10 | - | $ | - | ||||||||||
| ||||||||||||||||
*Includes the repurchase of common stock from Company employees in connection with the Company's broad-based employee incentive plans.
30
| Item 6. | SELECTED FINANCIAL DATA |
| Millions of Dollars Except Per Share Amounts | ||||||||||||||||||||
| 2014 | 2013 | 2012 | 2011 | 2010 | ||||||||||||||||
|
| |||||||||||||||||||
Sales and other operating revenues | $ | 52,524 | 54,413 | 57,967 | 64,196 | 56,215 | ||||||||||||||
Income from continuing operations | 5,807 | 8,037 | 7,481 | 7,188 | 10,305 | |||||||||||||||
Per common share | ||||||||||||||||||||
Basic | 4.63 | 6.47 | 5.95 | 5.18 | 6.93 | |||||||||||||||
Diluted | 4.60 | 6.43 | 5.91 | 5.14 | 6.88 | |||||||||||||||
Income from discontinued operations | 1,131 | 1,178 | 1,017 | 5,314 | 1,112 | |||||||||||||||
Net income | 6,938 | 9,215 | 8,498 | 12,502 | 11,417 | |||||||||||||||
Net income attributable to ConocoPhillips | 6,869 | 9,156 | 8,428 | 12,436 | 11,358 | |||||||||||||||
Per common share | ||||||||||||||||||||
Basic | 5.54 | 7.43 | 6.77 | 9.04 | 7.68 | |||||||||||||||
Diluted | 5.51 | 7.38 | 6.72 | 8.97 | 7.62 | |||||||||||||||
Total assets | 116,539 | 118,057 | 117,144 | 153,230 | 156,314 | |||||||||||||||
Long-term debt | 22,383 | 21,073 | 20,770 | 21,610 | 22,656 | |||||||||||||||
Joint venture acquisition obligation-long-term | - | - | 2,810 | 3,582 | 4,314 | |||||||||||||||
Cash dividends declared per common share | 2.84 | 2.70 | 2.64 | 2.64 | 2.15 | |||||||||||||||
| ||||||||||||||||||||
Many factors can impact the comparability of this information, such as:
| • | Net income and Net income attributable to ConocoPhillips for all periods presented includes income from discontinued operations as a result of the separation of the downstream business, the sale of our interest in Kashagan, and the sales of our Algeria and Nigeria businesses. Total assets for 2011 and prior years includes assets for the downstream business. For additional information, see Note 2-Discontinued Operations, in the Notes to Consolidated Financial Statements. |
| • | The financial data for 2010 includes the impact of $5,563 million before-tax ($4,463 million after-tax) related to gains from asset dispositions and LUKOIL share sales. |
See Management's Discussion and Analysis of Financial Condition and Results of Operations and the Notes to Consolidated Financial Statements for a discussion of factors that will enhance an understanding of this data.
31
| Item 7. | MANAGEMENT'S DISCUSSION AND ANALYSIS OF FINANCIAL CONDITION AND RESULTS OF OPERATIONS |
Management's Discussion and Analysis is the Company's analysis of its financial performance and of significant trends that may affect future performance. It should be read in conjunction with the financial statements and notes, and supplemental oil and gas disclosures included elsewhere in this report. It contains forward-looking statements including, without limitation, statements relating to the Company's plans, strategies, objectives, expectations and intentions that are made pursuant to the "safe harbor" provisions of the Private Securities Litigation Reform Act of 1995. The words "anticipate," "estimate," "believe," "budget," "continue," "could," "intend," "may," "plan," "potential," "predict," "seek," "should," "will," "would," "expect," "objective," "projection," "forecast," "goal," "guidance," "outlook," "effort," "target" and similar expressions identify forward-looking statements. The Company does not undertake to update, revise or correct any of the forward-looking information unless required to do so under the federal securities laws. Readers are cautioned that such forward-looking statements should be read in conjunction with the Company's disclosures under the heading: "CAUTIONARY STATEMENT FOR THE PURPOSES OF THE ‘SAFE HARBOR' PROVISIONS OF THE PRIVATE SECURITIES LITIGATION REFORM ACT OF 1995," beginning on page 70.
Due to discontinued operations reporting, income (loss) from continuing operations is more representative of ConocoPhillips' earnings. The terms "earnings" and "loss" as used in Management's Discussion and Analysis refer to income (loss) from continuing operations. For additional information, see Note 2 -Discontinued Operations, in the Notes to Consolidated Financial Statements.
BUSINESS ENVIRONMENT AND EXECUTIVE OVERVIEW
ConocoPhillips is the world's largest independent exploration and production (E&P) company, based on proved reserves and production of liquids and natural gas. Headquartered in Houston, Texas, we have operations and activities in 27 countries. At December 31, 2014, we employed approximately 19,100 people worldwide and had total assets of $117 billion. Our stock is listed on the New York Stock Exchange under the symbol "COP."
Basis of Presentation
Effective April 1, 2014, the Other International segment was restructured to focus on enhancing our capability to operate in emerging and new country business units. As a result, we moved the Latin America and Poland businesses from the historically presented Lower 48 and Latin America segment and the Europe segment to the Other International segment. Results of operations for the Lower 48, Europe and Other International segments have been revised for all periods presented. There was no impact on our consolidated financial results, and the impact on our segment presentation was immaterial. For additional information, see Note 23-Segment Disclosures and Related Information, in the Notes to Consolidated Financial Statements.
Overview
We are an independent E&P company focused on exploring for, developing and producing crude oil and natural gas globally. Our asset base reflects our legacy as a major company with a strategic focus on higher-margin developments. Our diverse portfolio primarily includes resource-rich North American shale and oil sands assets; lower-risk legacy assets in North America, Europe, Asia and Australia; several major international developments; and a growing inventory of global conventional and unconventional exploration prospects. Since the separation of the downstream business in 2012, our value proposition to our shareholders has been to deliver 3 to 5 percent production and 3 to 5 percent cash margin growth, normalized for changes in commodity prices, pay a competitive dividend, improve financial returns, and maintain our fundamental commitment to safety, operating excellence and environmental stewardship. This value proposition was predicated on capital expenditures of approximately $16 billion annually.
32
We achieved our value proposition in 2014 and met our strategic objectives; however, in response to a significant downturn in commodity prices beginning in the second half of 2014, we have elected to reduce our 2015 capital program to $11.5 billion. At this level of capital, we expect to achieve 2 to 3 percent production growth in 2015. The dividend remains our top priority, and we anticipate cash flow neutrality (cash from continuing operations sufficient to fund our dividend and capital program) in 2017. We continue to monitor the environment and will exercise additional capital reductions or balance sheet flexibility, as appropriate, to withstand this cycle.
Key Operating and Financial Highlights
Significant highlights during 2014 included the following:
| • | Achieved 4 percent full-year production growth from continuing operations, excluding Libya. |
| • | Realized 8 percent price-normalized cash margin per BOE growth. |
| • | Achieved annual organic reserve replacement of 124 percent from reserve additions of approximately 0.7 billion BOE. |
| • | Completed the asset disposition program with sale of Nigerian business for $1.4 billion. |
| • | Achieved a combined 35 percent year-over-year production increase in the Eagle Ford and Bakken. |
| • | Commenced production from five major projects at Siakap North-Petai, Foster Creek Phase F, Britannia Long-Term Compression, Gumusut and Kebabangan, as well as first production from Eldfisk II in January 2015. |
| • | Discovered oil in two new plays offshore Senegal. |
| • | Ended the year with $5.1 billion of cash and cash equivalents. |
We accomplished several strategic milestones in 2014. Through major project startups, development drilling and increased investment in higher-margin areas, we achieved 4 percent production growth from continuing operations, excluding Libya. Our net income attributable to ConocoPhillips per barrel of oil equivalent (BOE) decreased 27 percent in 2014 compared with 2013. This reduction mainly resulted from lower gains from dispositions and higher impairments. Our cash margin per BOE, normalized based on 2013 prices, increased 8 percent over the same period, which reflects an underlying portfolio shift to liquids and more favorable fiscal regimes. For additional information on the calculations for Net Income Attributable to ConocoPhillips per BOE and Price Normalized Cash Margin per BOE, see "Non-GAAP Reconciliation: Price Normalized Cash Margin per BOE," beginning on page 63.
In 2014 we achieved production of 1,561 thousand barrels of oil equivalent per day (MBOED), including production from discontinued operations of 21 MBOED. Excluding Libya, our production from continuing operations was 1,532 MBOED, compared with 1,472 MBOED in 2013. The startup of several major projects in 2014 and continued success in shale plays enabled us to achieve our volume growth target. With the startup of Eldfisk II in early 2015, anticipated startups at Australia Pacific LNG (APLNG) and Surmont 2 in 2015, and ongoing development program activity, we believe we can achieve production growth of 2 to 3 percent in 2015.
Consistent with our commitment to offer our shareholders a competitive dividend, in July 2014 our Board of Directors increased our quarterly dividend by 5.8 percent to $0.73 per share. During 2014 we generated $16.6 billion in cash from continuing operations, which included a one-time $1.3 billion distribution from our 50 percent owned FCCL Partnership, and we generated $1.6 billion in proceeds from dispositions of non-core assets. We also paid dividends on our common stock of $3.5 billion and ended the year with $5.1 billion in cash and cash equivalents.
We funded a $17.1 billion capital program in 2014, which yielded a strong, annual organic reserve replacement ratio of 124 percent. The organic reserve additions represent a continuing portfolio shift to higher-value liquids and reflect increased levels of activity in our development programs and major projects.
33
In December 2014 we announced a capital budget of $13.5 billion for 2015, a reduction of 21 percent compared with actual capital spending of $17.1 billion in 2014. In January 2015 we further reduced the capital budget by $2.0 billion, due to the ongoing decline in commodity prices. The $5.6 billion reduction primarily reflects the deferral of spending on certain North American unconventional plays, lower spending on major projects, several of which are nearing completion, and the deferral of some exploration programs. Capital spending on several major projects has peaked, such as APLNG, Surmont 2 and Eldfisk II, and we will realize the benefit of production growth from these projects over the next few years. This lower level of investment associated with major projects allows us to have increasing flexibility with our capital program.
Our 2015 capital budget of $11.5 billion will target our diverse portfolio of global opportunities and will be directed predominantly toward high-quality developments already underway in the United States, Canada, Europe and Asia; the completion of major projects, such as APLNG and Surmont 2; as well as exploration opportunities in the Gulf of Mexico and offshore West Africa which will continue to build our inventory for the future.
Business Environment
In the first half of 2014, the energy industry experienced strong prices for crude oil, driven by geopolitical tensions impacting supplies, as well as global oil demand growth. This was followed by an abrupt decline in prices during the fourth quarter of 2014 to near five-year lows, as surging production growth from U.S. shale and the decision by the Organization of Petroleum Exporting Countries (OPEC) to maintain current production outweighed fears of supply disruptions. This, combined with lower forecasts for global oil demand growth, caused crude oil prices to plummet to the $60-per-barrel-range at the end of 2014. More recently, prices for WTI and Brent have continued to decrease to the mid-$40-per-barrel-range, less than half of June 2014 prices.
The energy industry has periodically experienced this type of extreme volatility due to fluctuating supply-and-demand conditions, which have impacted our operations and profitability and are largely due to factors beyond our control. Commodity prices are the most significant factor impacting our profitability and related reinvestment of operating cash flows into our business. Other dynamics which have influenced world energy markets and commodity prices included the global financial crisis and recession which began in 2008, supply disruptions or fears thereof caused by civil unrest or military conflicts, environmental laws, tax regulations, governmental policies and weather-related disruptions. Additionally, North America's energy landscape has been transformed from resource scarcity to an abundance of supply, as a result of advances in technology responsible for the rapid growth of shale production, successful exploration and development in the deepwater Gulf of Mexico and rising production from the Canadian oil sands. In order to navigate through a volatile market, our strategy is to maintain a strong balance sheet with a diverse and flexible portfolio of assets which will provide the financial flexibility to withstand challenging business cycles.
Operating and Financial Priorities
Other important factors we must continue to manage well in order to be successful include:
| • | Maintaining a relentless focus on safety and environmental stewardship. Safety and environmental stewardship, including the operating integrity of our assets, remain our highest priorities, and we are committed to protecting the health and safety of everyone who has a role in our operations and the communities in which we operate. We strive to conduct our business with respect and care for both the local and global environment and systematically manage risk to drive sustainable business growth. Our sustainability efforts in 2014 focused on updating action plans for climate change, biodiversity, water and human rights, as well as revamping public reporting to be more informative, searchable and responsive to common questions. |
We are a founding member of the Marine Well Containment Company LLC (MWCC), a non-profit organization formed in 2010 to improve industry spill response in the U.S. Gulf of Mexico. MWCC developed a containment system, which meets the U.S. Bureau of Safety and Environmental Enforcement requirements for a subsea well containment system that can respond to a deepwater well control incident in the U.S. Gulf of Mexico. To complement this work internationally, we and several leading oil and gas companies established the Subsea Well Response Project in Norway, which enhances the oil industry's ability to respond to subsea well-control incidents in international waters.
34
| • | Adding to our proved reserve base. We primarily add to our proved reserve base in three ways: |
| o | Successful exploration, exploitation and development of new and existing fields. |
| o | Application of new technologies and processes to improve recovery from existing fields. |
| o | Acquisition of existing fields. |
Through a combination of the methods listed above, we have been successful in adding to our proved reserve base, and we anticipate being able to do so in the future. In the five years ended December 31, 2014, our organic reserve replacement was 143 percent, excluding LUKOIL and the impact of sales and purchases.
Access to additional resources has become increasingly difficult as direct investment is prohibited in some nations, while fiscal and other terms in other countries can make projects uneconomic or unattractive. In addition, political instability, competition from national oil companies, and lack of access to high-potential areas due to environmental or other regulation may negatively impact our ability to increase our reserve base. As such, the timing and level at which we add to our reserve base may, or may not, allow us to replace our production over subsequent years.
| • | Disciplined investment approach. We participate in a capital-intensive industry, which often experiences long lead times from the time an investment decision is made to the time an asset is operational and generates cash flow. As a result, we must invest significant capital dollars to explore for new oil and gas fields, develop newly discovered fields, maintain existing fields, and construct pipelines and liquefied natural gas (LNG) facilities. We use a disciplined approach to select the appropriate projects which will provide the most attractive investment opportunities, with a continued focus on organic growth in volumes and margins through higher-margin oil, condensate and LNG projects and limited investment in North American natural gas. As investments bring more liquids production online, we have experienced a corresponding shift in our production mix. In 2014 our average liquids production from continuing operations, excluding Libya, increased 7 percent compared with 2013. In 2013 our average liquids production from continuing operations, excluding Libya, increased 2 percent compared with 2012. |
Our 2015 capital budget is $11.5 billion, a reduction of 33 percent compared with our actual 2014 capital spend of $17.1 billion. The decrease mainly reflects a slower pace of development on North American unconventional plays, the elimination of peak spending on major capital projects due to their anticipated startup in 2015, and the deferral of certain exploration programs. Our capital budget will be allocated toward maintenance of our legacy base portfolio; higher-margin development drilling programs, primarily in the Eagle Ford and Bakken; sanctioned major developments, specifically the completion of APLNG and Surmont 2; and our worldwide exploration and appraisal program, which will target conventional activity in the U.S. Gulf of Mexico, offshore West Africa and Nova Scotia, as well as unconventional activity in North America.
In response to weakening commodity prices, we plan to slow the pace of certain investments, such as in the Eagle Ford and the Bakken, as well as emerging unconventional plays in the Permian, Niobrara, Montney and Duvernay. We retain the flexibility to increase or decrease investment activity and may reassess our near-term investment decisions as necessary.
| • | Portfolio optimization. We continue to optimize our asset portfolio by focusing on assets which offer the highest returns and growth potential, while selling nonstrategic assets. In 2012 we announced plans to sell $8–$10 billion of noncore assets through the end of 2013. We completed this disposition program with the July 2014 sale of our Nigeria upstream affiliates. As part of this program, we generated $14.0 billion in proceeds from asset dispositions through December 31, 2014. |
35
Although we have completed the asset disposition program, we will continue to evaluate our assets to determine whether they fit our strategic direction. We will optimize the portfolio as necessary and direct our capital investments to areas we expect will achieve our strategic objectives.
| • | Controlling costs and expenses. Controlling operating and overhead costs, without compromising safety and environmental stewardship, is a high priority. We monitor these costs using various methodologies that are reported to senior management monthly, on both an absolute-dollar basis and a per-unit basis. Managing operating and overhead costs is critical to maintaining a competitive position in our industry. |
| • | Applying technical capability. We leverage our knowledge and technology to create value and safely deliver on our plans. Technical strength is part of our heritage, and we are evolving our technical approach to optimally apply best practices. In 2014 we tested new technology as a means to provide remote monitoring capability, as well as new methods that could increase production and reduce water usage and emissions from assets, such as the oil sands and unconventional reservoirs. Companywide, we continue to evaluate potential solutions to leverage knowledge of technological successes across all of our operations. Such innovations enable us to economically convert additional resources to reserves, achieve greater operating efficiencies and reduce our environmental impact. |
| • | Developing and retaining a talented work force. We strive to attract, train, develop and retain individuals with the knowledge and skills to implement our business strategy and who support our values and ethics. As part of our future workforce planning, we are committed to increasing student interest in energy industry professions by awarding scholarships in science, technology, engineering, mathematics, accounting and finance, as well as providing university internships to attract the best talent. We also recruit experienced hires to maintain a broad range of skills and experience. We offer continued learning, development and technical training through structured development programs designed to accelerate technical and functional skills of our employees. |
Other significant factors that can affect our profitability include:
| • | Commodity prices. Our earnings generally correlate with industry price levels for crude oil and natural gas. These are commodity products, the prices of which are subject to factors external to our company and over which we have no control. The following graph depicts the average benchmark prices for West Texas Intermediate (WTI) crude oil, Dated Brent crude oil and U.S. Henry Hub natural gas: |
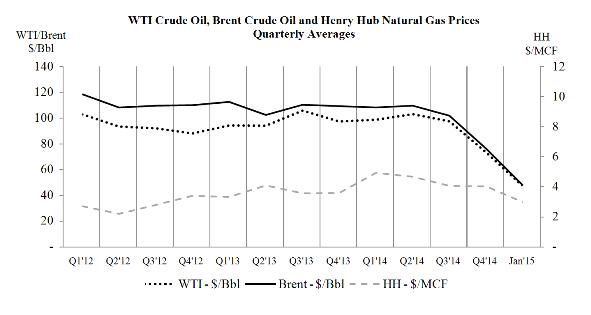
36
Brent crude oil prices averaged $76.27 per barrel in the fourth quarter of 2014, a decrease of 30 percent compared with $109.27 per barrel in the fourth quarter of 2013. December 2014 prices for Brent crude oil averaged $62.53 per barrel, a decline of 44 percent compared with June 2014 average prices of $111.65 per barrel. Industry crude prices for WTI averaged $73.41 per barrel in the fourth quarter of 2014, a decrease of 25 percent compared with $97.38 in the same quarter of 2013. WTI prices in December 2014 averaged $59.50 per barrel, a 43 percent decrease compared with June 2014 average prices of $105.24 per barrel. Crude oil prices have continued to rapidly decline in the first quarter of 2015 to their lowest levels in the past six years to the mid-$40-per-barrel-range, driven downward by rising production, particularly from U.S. shale oil and reduced disruptions from Middle East production, OPEC's decision to maintain current production and weaker-than-expected demand in Europe and Asia.
Henry Hub natural gas prices averaged $4.04 per thousand cubic feet (MCF) in the fourth quarter of 2014, an increase of 12 percent compared with the same period in 2013. Average Henry Hub prices were relatively strong in 2014, as prices averaged $4.43 per MCF in 2014 compared with $3.65 in 2013. This was the result of a cold start to 2014; however, natural gas prices softened later in the year due to very strong production growth, particularly from the northeast United States, and a mild start to the 2014/2015 heating season.
Domestic natural gas liquids prices experienced a similar decline to crude oil prices in the fourth quarter of 2014, as our domestic realized natural gas liquids prices averaged $24.93 per barrel in the fourth quarter of 2014, a decrease of 27 percent compared with $34.33 per barrel in the same quarter of 2013. The expansion in shale production has also helped boost supplies of natural gas liquids, resulting in downward pressure on natural gas liquids prices in the United States.
Declining global crude oil prices have resulted in the Western Canada Select benchmark price experiencing a 50 percent decline from June 2014 to December 2014, from $86.55 per barrel to $43.24 per barrel. Consequently, our realized bitumen price experienced a significant decrease in the second half of 2014.
Our total average realized price from continuing operations was $64.59 per BOE in 2014, a decrease of 4 percent compared with $67.62 per BOE in 2013, which reflected lower average realized prices for crude oil and natural gas liquids, partly offset by higher bitumen and natural gas prices. Our total average realized prices for the fourth quarter of 2014 was $52.88 per BOE, a reduction of 19 percent compared with $65.41 per BOE in the same period of 2013. The reduction in the fourth quarter of 2014 mainly reflected lower average realized prices across all commodities.
In recent years, the use of hydraulic fracturing and horizontal drilling in shale natural gas formations has led to increased industry actual and forecasted crude oil and natural gas production in the United States. Although providing significant short- and long-term growth opportunities for our Company, the increased abundance of crude oil and natural gas due to development of shale plays could also have adverse financial implications to us, including: an extended period of low commodity prices; production curtailments; delay of plans to develop areas such as unconventional fields or Alaska North Slope natural gas fields; and underutilization of LNG regasification facilities. Should one or more of these events occur, our revenues would be reduced and additional impairments might be possible.
37
| • | Impairments. As mentioned above, we participate in capital-intensive industries. At times, our properties, plants and equipment and investments become impaired when, for example, our reserve estimates are revised downward, commodity prices decline significantly for long periods of time, or a decision to dispose of an asset leads to a write-down to its fair value. We may also invest large amounts of money in exploration which, if exploratory drilling proves unsuccessful, could lead to a material impairment of leasehold values. For additional information on our impairments in 2014, 2013 and 2012, see Note 8-Impairments, in the Notes to Consolidated Financial Statements. |
| • | Effective tax rate. Our operations are located in countries with different tax rates and fiscal structures. Accordingly, even in a stable commodity price and fiscal/regulatory environment, our overall effective tax rate can vary significantly between periods based on the "mix" of pretax earnings within our global operations. |
| • | Fiscal and regulatory environment. Our operations can be affected by changing economic, regulatory and political environments in the various countries in which we operate, including the United States. Civil unrest or strained relationships with governments may impact our operations or investments. These changing environments have generally negatively impacted our results of operations, and further changes to government fiscal take could have a negative impact on future operations. Our production operations in Libya and related oil exports have been suspended or significantly curtailed since July 2013 due to the closure of the Es Sider crude oil export terminal, and they were also suspended in 2011 during Libya's period of civil unrest. In the United Kingdom, the government enacted tax legislation in both 2012 and 2011, which increased our U.K. corporate tax rate. Our assets in Venezuela and Ecuador were expropriated in 2007 and 2009, respectively. Our management carefully considers these events when evaluating projects or determining the level of activity in such countries. |
Outlook
The company expects to deliver 2 to 3 percent production growth in 2015 from continuing operations, excluding Libya. First-quarter 2015 production from continuing operations is expected to be 1,570 MBOED to 1,610 MBOED, excluding Libya.
Operating Segments
We manage our operations through six operating segments, which are primarily defined by geographic region: Alaska, Lower 48, Canada, Europe, Asia Pacific and Middle East, and Other International.
Corporate and Other represents costs not directly associated with an operating segment, such as most interest expense, corporate overhead, costs related to the separation of Phillips 66 and certain technology activities, as well as licensing revenues received.
Our key performance indicators, shown in the statistical tables provided at the beginning of the operating segment sections that follow, reflect results from our continuing operations, including commodity prices and production.
38
RESULTS OF OPERATIONS
Consolidated Results
A summary of the Company's income (loss) from continuing operations by business segment follows:
| Millions of Dollars | ||||||||||||
| Years Ended December 31 | 2014 | 2013 | 2012 | |||||||||
|
| |||||||||||
Alaska | $ | 2,041 | 2,274 | 2,276 | ||||||||
Lower 48 | (22 | ) | 754 | 745 | ||||||||
Canada | 940 | 718 | (684 | ) | ||||||||
Europe | 804 | 1,229 | 1,517 | |||||||||
Asia Pacific and Middle East | 3,008 | 3,591 | 3,996 | |||||||||
Other International | (90 | ) | 291 | 624 | ||||||||
Corporate and Other | (874 | ) | (820 | ) | (993 | ) | ||||||
| ||||||||||||
Income from continuing operations | $ | 5,807 | 8,037 | 7,481 | ||||||||
| ||||||||||||
2014 vs. 2013
Earnings for ConocoPhillips decreased 28 percent in 2014. The decrease was mainly due to:
| • | Lower crude oil prices. |
| • | Lower gains from asset sales. Gains realized in 2014 were approximately $70 million after-tax, compared with gains realized in 2013 of $1,132 million after-tax. |
| • | Higher operating expenses, which included the 2014 recognition of a $540 million after-tax loss resulting from the Freeport LNG termination agreement. |
| • | Higher impairments. Non-cash impairments in 2014 totaled $662 million after-tax, compared with $289 million after-tax in 2013. |
| • | Higher depreciation, depletion and amortization (DD&A) expenses, mainly due to higher volumes in the Lower 48 and the United Kingdom, partly offset by lower unit-of-production rates in Canada related to reserve bookings. |
| • | Higher exploration expenses. |
These reductions to earnings were partially offset by higher volumes; lower production taxes, which mainly resulted from higher capital spending, lower prices and lower production volumes in Alaska; and higher natural gas and LNG prices.
2013 vs. 2012
Earnings for ConocoPhillips increased 7 percent in 2013. The increase was mainly due to:
| • | Lower impairments. Non-cash impairments in 2013 totaled $289 million after-tax, compared with $900 million after-tax in 2012. |
| • | Higher natural gas prices. |
| • | A higher proportion of production in higher-margin areas and a continued portfolio shift toward liquids. |
| • | Lower production taxes, primarily as a result of lower production volumes and prices, and higher capital spending in Alaska. |
39
These items were partially offset by:
| • | Higher DD&A expenses, mainly due to higher volumes in the Lower 48 and China. |
| • | Lower gains from asset sales. In 2013, gains from asset dispositions were $1,132 million after-tax, compared with gains of $1,567 million after-tax in 2012. |
| • | Higher operating expenses. |
| • | Lower crude oil and natural gas liquids prices. |
Income Statement Analysis
2014 vs. 2013
Sales and other operating revenues decreased 3 percent in 2014, mainly as a result of lower crude oil prices, partly offset by higher crude oil and bitumen volumes and higher natural gas prices.
Equity in earnings of affiliates increased 14 percent in 2014, primarily as a result of higher earnings from FCCL Partnership due to higher bitumen volumes and prices. This increase was partially offset by lower earnings from APLNG, mostly as a result of higher operating expenses and DD&A.
Gain on dispositions decreased $1,144 million in 2014. Gains realized in 2014 mostly resulted from the disposition of certain properties in western Canada. For additional information on gains realized in prior years, see Note 5-Assets Held for Sale or Sold, in the Notes to Consolidated Financial Statements.
Production and operating expenses increased 23 percent in 2014, largely due to the $849 million charge resulting from the Freeport LNG termination agreement. Higher drilling and maintenance activity, mostly in the Lower 48, Australia, Alaska and Europe, in addition to the absence of the 2013 benefit of a $142 million accrual reduction related to the Federal Energy Regulatory Commission (FERC) approval of cost allocation (pooling) agreements with the remaining owners of the Trans-Alaska Pipeline System (TAPS), also contributed to the increase. These increases were partly offset by the absence of a $155 million charge in 2013 related to Bohai Bay. For additional information on the Freeport LNG transaction, see Note 3-Variable Interest Entities (VIEs), in the Notes to Consolidated Financial Statements.
Selling, general and administrative (SG&A) expenses decreased 14 percent in 2014, mainly due to the absence of pension settlement expenses.
Exploration expenses increased 66 percent in 2014, mainly as a result of higher impairments of undeveloped leasehold costs, primarily in the Lower 48 and Canada, and higher dry hole costs, mostly associated with the Gulf of Mexico and Angola. For additional information on the leasehold impairments, see Note 8-Impairments, in the Notes to Consolidated Financial Statements.
DD&A increased 12 percent in 2014. This increase was mostly associated with higher production volumes in the United Kingdom and the Lower 48, partly offset by lower unit-of-production rates in Canada associated with year-end 2013 price-related reserve revisions and lower natural gas production volumes.
Impairments increased 62 percent in 2014. For additional information, see Note 8-Impairments, in the Notes to Consolidated Financial Statements.
Taxes other than income taxes decreased 28 percent in 2014, mainly due to lower production taxes, which resulted from higher capital spending, lower crude oil prices and lower production volumes in Alaska.
Interest and debt expense increased 6 percent in 2014, primarily due to lower capitalized interest on projects, partly offset by lower interest expense from lower average debt levels and a $28 million benefit associated with interest on a favorable tax settlement.
40
See Note 18-Income Taxes, in the Notes to Consolidated Financial Statements, for information regarding our provision for income taxes and effective tax rate.
2013 vs. 2012
Sales and other operating revenues decreased 6 percent in 2013, mainly due to lower natural gas volumes and lower crude oil prices, partly offset by higher natural gas prices.
Equity in earnings of affiliates increased 16 percent in 2013. The increase primarily resulted from higher earnings from FCCL Partnership, mainly as a result of higher bitumen volumes.
Gain on dispositions decreased 25 percent in 2013. For additional information, see Note 5-Assets Held for Sale or Sold, in the Notes to Consolidated Financial Statements.
Other income decreased 20 percent in 2013, primarily due to the absence of the 2012 benefit which resulted from the favorable resolution of the Petróleos de Venezuela S.A. (PDVSA) International Chamber of Commerce (ICC) arbitration. The decrease was partly offset by a $150 million insurance settlement in 2013 associated with the Bohai Bay seepage incidents. For information on a separate PDVSA arbitration with the World Bank's International Centre for Settlement of Investment Disputes (ICSID), see Note 12-Contingencies and Commitments, in the Notes to Consolidated Financial Statements.
Purchased commodities decreased 10 percent in 2013, largely as a result of lower purchased natural gas volumes, partly offset by higher natural gas prices.
Production and operating expenses increased 7 percent in 2013, primarily due to increased drilling activity and production volumes, mostly in the Lower 48, in addition to a charge related to a settlement in Asia Pacific and Middle East. These increases were partly offset by the $142 million accrual reduction associated with FERC approval of pooling agreements with the TAPS owners.
SG&A expenses decreased 23 percent in 2013, primarily due to the absence of separation costs, lower pension settlement expense and lower costs related to compensation and benefit plans. For additional information on pension settlement expense, see Note 17-Employee Benefit Plans, in the Notes to Consolidated Financial Statements.
Exploration expenses decreased 18 percent in 2013, largely due to lower leasehold impairment costs. Exploration costs in 2012 included the $481 million impairment of undeveloped leasehold costs associated with the Mackenzie Gas Project, as a result of the indefinite suspension of the project. Increased 2013 exploration activity and higher dry hole costs, mostly in the Lower 48, partly offset the reduction.
DD&A increased 13 percent in 2013. The increase was mostly associated with higher production volumes in the Lower 48. Higher production volumes in China partly contributed to the increase.
Impairments decreased 22 percent in 2013 and mainly consisted of increases in the asset retirement obligation for properties located in the United Kingdom, which have ceased production or are nearing the end of their useful lives, and mature natural gas properties in Canada.
Taxes other than income taxes decreased 19 percent in 2013, mainly due to lower production taxes as a result of lower crude oil production volumes and prices, and higher capital spending in Alaska.
Interest and debt expense decreased 14 percent in 2013, mostly as a result of lower interest expense from lower average debt levels.
See Note 18-Income Taxes, in the Notes to Consolidated Financial Statements, for information regarding our provision for income taxes and effective tax rate.
41
Summary Operating Statistics
| 2014 | 2013 | 2012 | ||||||||||
|
| |||||||||||
Average Net Production | ||||||||||||
Crude oil (MBD)* | 595 | 581 | 595 | |||||||||
Natural gas liquids (MBD) | 159 | 156 | 156 | |||||||||
Bitumen (MBD) | 129 | 109 | 93 | |||||||||
Natural gas (MMCFD)** | 3,943 | 3,939 | 4,096 | |||||||||
| ||||||||||||
Total Production (MBOED)*** | 1,540 | 1,502 | 1,527 | |||||||||
| ||||||||||||
| Dollars Per Unit | ||||||||||||
|
| |||||||||||
Average Sales Prices | ||||||||||||
Crude oil (per barrel) | $ | 92.80 | 103.32 | 105.72 | ||||||||
Natural gas liquids (per barrel) | 38.99 | 41.42 | 46.36 | |||||||||
Bitumen (per barrel) | 55.13 | 53.27 | 53.91 | |||||||||
Natural gas (per thousand cubic feet) | 6.57 | 6.11 | 5.48 | |||||||||
| ||||||||||||
| Millions of Dollars | ||||||||||||
|
| |||||||||||
Worldwide Exploration Expenses | ||||||||||||
General and administrative; geological and geophysical; and lease rentals | $ | 879 | 789 | 626 | ||||||||
Leasehold impairment | 562 | 175 | 719 | |||||||||
Dry holes | 604 | 268 | 155 | |||||||||
| ||||||||||||
| $ | 2,045 | 1,232 | 1,500 | |||||||||
| ||||||||||||
Excludes discontinued operations.
| *Thousands | of barrels per day. |
| **Millions | of cubic feet per day. Represents quantities available for sale and excludes gas equivalent of natural gas liquids included above. |
| ***Thousands | of barrels of oil equivalent per day. |
We explore for, produce, transport and market crude oil, bitumen, natural gas, LNG and natural gas liquids on a worldwide basis. At December 31, 2014, our continuing operations were producing in the United States, Norway, the United Kingdom, Canada, Australia, Timor-Leste, Indonesia, China, Malaysia, Qatar, Libya and Russia.
Total production from continuing operations, including Libya, increased 3 percent in 2014, while average liquids production increased 4 percent. The increase in total average production in 2014 primarily resulted from additional production from major developments, mainly from shale plays in the Lower 48 and the ramp up of production from Jasmine in the United Kingdom and Christina Lake in Canada, and increased drilling programs, mostly in the Lower 48, western Canada and Norway. These increases were largely offset by normal field decline, higher planned downtime, shut-in Libya production due to the closure of the Es Sider crude oil export terminal, and unfavorable market impacts. Adjusted for Libya, production from continuing operations increased by 60 MBOED, or 4 percent, compared with 2013.
In 2013 average production from continuing operations decreased 2 percent compared with 2012, mainly due to normal field decline, asset dispositions, shut-in Libya production and higher unplanned downtime. These decreases were partially offset by new production from major developments, mainly from shale plays in the Lower 48, the ramp-up of production from new phases at Christina Lake in Canada, and early production in Malaysia; higher production in China; and increased conventional drilling and well performance, mostly in the Lower 48, western Canada and Norway. Adjusted for dispositions, downtime and Libya, production grew by 30 MBOED, or 2 percent, compared with 2012.
42
Alaska
| 2014 | 2013 | 2012 | ||||||||||
|
| |||||||||||
Income from Continuing Operations (millions of dollars) | $ | 2,041 | 2,274 | 2,276 | ||||||||
| ||||||||||||
Average Net Production | ||||||||||||
Crude oil (MBD) | 162 | 178 | 188 | |||||||||
Natural gas liquids (MBD) | 13 | 15 | 16 | |||||||||
Natural gas (MMCFD) | 49 | 43 | 55 | |||||||||
| ||||||||||||
Total Production (MBOED) | 183 | 200 | 213 | |||||||||
| ||||||||||||
Average Sales Prices | ||||||||||||
Crude oil (per barrel) | $ | 97.68 | 107.83 | 109.62 | ||||||||
Natural gas (per thousand cubic feet) | 5.42 | 4.35 | 4.22 | |||||||||
| ||||||||||||
The Alaska segment primarily explores for, produces, transports and markets crude oil, natural gas liquids, natural gas and LNG. In 2014 Alaska contributed 20 percent of our worldwide liquids production and 1 percent of our natural gas production.
2014 vs. 2013
Alaska earnings decreased 10 percent in 2014 compared with 2013 earnings. The decrease was largely due to lower crude oil prices and volumes; the absence of a $97 million after-tax benefit associated with a FERC ruling in 2013, more fully described below; higher operating expenses; and a $36 million after-tax impairment related to a cancelled project. These reductions to earnings were partly offset by lower production taxes, which resulted from higher 2014 capital spending and lower crude oil prices and volumes. Higher LNG sales volumes and prices also partially offset the decrease in 2014 earnings.
In 2012 the major owners of TAPS filed a proposed settlement with FERC to resolve pooling disputes prior to August 2012 and establish a voluntary pooling agreement to pool costs prospectively from August 2012. In July 2013 FERC approved the proposed settlement and pooling agreement without modification. As a result, we reduced a related accrual in the second quarter of 2013, which decreased our production and operating expenses by $97 million after-tax.
Average production decreased 9 percent in 2014 compared with 2013, mainly as a result of normal field decline and higher planned maintenance, partly offset by lower unplanned downtime.
2013 vs. 2012
Alaska earnings in 2013 were flat compared with 2012 earnings. Earnings in 2013 were mainly impacted by lower crude oil volumes and lower crude oil prices. These decreases to earnings were mostly offset by lower production taxes, which resulted from lower prices, higher 2013 capital spending and lower crude oil production volumes. Additionally, 2013 earnings benefitted from the FERC ruling discussed above.
Average production decreased 6 percent in 2013 compared with 2012, primarily due to normal field decline, partially offset by lower planned downtime.
43
Lower 48
| 2014 | 2013 | 2012 | ||||||||||
|
| |||||||||||
Income (Loss) from Continuing Operations (millions of dollars) | $ | (22 | ) | 754 | 745 | |||||||
| ||||||||||||
Average Net Production | ||||||||||||
Crude oil (MBD) | 188 | 152 | 123 | |||||||||
Natural gas liquids (MBD) | 97 | 91 | 85 | |||||||||
Natural gas (MMCFD) | 1,491 | 1,490 | 1,493 | |||||||||
| ||||||||||||
Total Production (MBOED) | 533 | 491 | 457 | |||||||||
| ||||||||||||
Average Sales Prices | ||||||||||||
Crude oil (per barrel) | $ | 84.18 | 93.79 | 91.67 | ||||||||
Natural gas liquids (per barrel) | 30.74 | 31.48 | 35.45 | |||||||||
Natural gas (per thousand cubic feet) | 4.29 | 3.50 | 2.67 | |||||||||
| ||||||||||||
The Lower 48 segment consists of operations located in the U.S. Lower 48 states and exploration activities in the Gulf of Mexico. During 2014 the Lower 48 contributed 32 percent of our worldwide liquids production and 38 percent of our natural gas production.
2014 vs. 2013
The Lower 48 reported a loss of $22 million after-tax in 2014, compared with earnings of $754 million after-tax in 2013. The decrease in earnings was primarily attributable to:
| • | Higher operating expenses, which included the $545 million after-tax charge to earnings due to the Freeport LNG termination agreement. |
| • | Lower crude oil prices. |
| • | Higher DD&A, mostly due to higher crude oil production. |
| • | Higher impairments. Earnings in 2014 were impacted by impairments of approximately $290 million after-tax. Property impairments were not material in 2013. For additional information, see Note 8-Impairments, in the Notes to Consolidated Financial Statements. |
| • | Higher dry hole costs. Dry hole costs in 2014 were approximately $180 million after-tax, primarily for the nonoperated Coronado wildcat and appraisal wells, the Shenandoah appraisal well and the Deep Nansen wildcat well, all located in the Gulf of Mexico. Dry hole costs in 2013 were approximately $130 million after-tax and mainly consisted of the Ardennes and Thorn wells, also located in the Gulf of Mexico. |
| • | An $83 million after-tax loss recognized upon the release of underutilized transportation and storage capacity at rates below our contractual rates. |
These reductions to earnings were partially offset by higher crude oil and natural gas liquids volumes, higher natural gas prices and a benefit to earnings of approximately $150 million after-tax from marketing third-party natural gas volumes.
Rising U.S. production and an increase in pipeline capacity to the Gulf Coast have put downward pressure on Gulf Coast crude oil prices. Prices for Permian Basin crude oil production have been impacted by production increases exceeding pipeline offtake additions. Our average realized prices in the Lower 48 have historically correlated with WTI prices; however, beginning in the second half of 2013, our Lower 48 crude differential versus WTI began to widen. In 2014 our average realized crude oil price of $84.18 per barrel was 10 percent below the WTI price of $93.17 per barrel.
44
Total average production in the Lower 48 increased 9 percent in 2014, while average crude oil production increased 24 percent. The increase was mainly attributable to new production, primarily from the Eagle Ford and Bakken, and improved drilling and well performance, partially offset by normal field decline.
2013 vs. 2012
Lower 48 earnings increased 1 percent in 2013 compared with 2012. Earnings in 2013 largely benefitted from higher crude oil and natural gas liquids volumes, higher natural gas and crude oil prices and lower impairments. These increases were partially offset by higher DD&A, as a result of higher crude oil production, higher operating expenses, higher exploration expenses, which mainly resulted from the Thorn and Ardennes dry holes, and lower natural gas liquids prices.
Average production in the Lower 48 increased 7 percent in 2013, while average crude oil production increased 24 percent in the same period. New production, primarily from the Eagle Ford and Bakken areas, and improved drilling and well performance more than offset normal field decline and the impact from dispositions.
Canada
| 2014 | 2013 | 2012 | ||||||||||
|
| |||||||||||
Income (Loss) from Continuing Operations (millions of dollars) | $ | 940 | 718 | (684) | ||||||||
| ||||||||||||
Average Net Production | ||||||||||||
Crude oil (MBD) | 13 | 13 | 13 | |||||||||
Natural gas liquids (MBD) | 23 | 25 | 24 | |||||||||
Bitumen (MBD) | ||||||||||||
Consolidated operations | 12 | 13 | 12 | |||||||||
Equity affiliates | 117 | 96 | 81 | |||||||||
| ||||||||||||
Total bitumen | 129 | 109 | 93 | |||||||||
| ||||||||||||
Natural gas (MMCFD) | 711 | 775 | 857 | |||||||||
| ||||||||||||
Total Production (MBOED) | 284 | 276 | 273 | |||||||||
| ||||||||||||
Average Sales Prices | ||||||||||||
Crude oil (per barrel) | $ | 77.87 | 79.73 | 78.26 | ||||||||
Natural gas liquids (per barrel) | 46.23 | 47.19 | 48.64 | |||||||||
Bitumen (dollars per barrel) | ||||||||||||
Consolidated operations | 60.03 | 55.25 | 57.58 | |||||||||
Equity affiliates | 54.62 | 53.00 | 53.39 | |||||||||
Total bitumen | 55.13 | 53.27 | 53.91 | |||||||||
Natural gas (per thousand cubic feet) | 4.13 | 2.92 | 2.13 | |||||||||
| ||||||||||||
Our Canadian operations mainly consist of natural gas fields in western Canada and oil sands developments in the Athabasca Region of northeastern Alberta. In 2014 Canada contributed 19 percent of our worldwide liquids production and 18 percent of our natural gas production.
2014 vs. 2013
Canada earnings increased 31 percent in 2014 compared with 2013, primarily as a result of higher natural gas and bitumen prices, lower DD&A from western Canada and higher bitumen volumes. The lower DD&A mainly resulted from lower unit-of-production rates related to year-end 2013 price-related reserve revisions
45
and lower natural gas production volumes. Earnings in 2014 also included a $47 million tax benefit resulting from a favorable tax settlement. These increases were partly offset by lower gains from asset sales, mainly as a result of the $461 million after-tax gain from the disposition of our Clyden undeveloped oil sands leasehold in 2013, as well as the 2013 recognition of a $224 million tax benefit, related to the favorable tax resolution associated with the sale of certain western Canada properties in a prior year. Lower natural gas volumes also partially offset the increase in 2014 earnings.
In addition, earnings in 2014 benefitted from lower impairments. Impairments in 2014 were $138 million after-tax and consisted primarily of the $109 million after-tax impairment of undeveloped leasehold costs associated with the offshore Amauligak discovery, Arctic Islands and other Beaufort properties. Impairments in 2013 consisted of the $162 million after-tax impairment of mature natural gas assets in western Canada.
For additional information on prior year asset sales, see Note 5-Assets Held for Sale or Sold, and for additional information on impairments, see Note 8-Impairments, in the Notes to Consolidated Financial Statements.
Total average production increased 3 percent in 2014 compared with 2013, while bitumen production increased 18 percent over the same period. The continued ramp-up of production from Christina Lake Phase E in FCCL and improved drilling and well performance were partly offset by normal field decline and higher royalty impacts.
2013 vs. 2012
Canada operations reported earnings of $718 million in 2013, an increase of $1,402 million, compared with a loss of $684 million in 2012. The increase in 2013 earnings was largely due to the Clyden gain on disposition and lower impairments. Impairments in 2013 consisted of the $162 million after-tax impairment of mature natural gas assets in western Canada, and impairments in 2012 mainly resulted from the $520 million after-tax impairment of the Mackenzie Gas Project and associated undeveloped leaseholds. Higher bitumen volumes, primarily at Christina Lake, and the $224 million favorable tax resolution also benefitted 2013 earnings.
Average production in Canada increased 1 percent in 2013, while bitumen production increased 17 percent over the same period. Normal field decline was more than offset by the ramp-up of production from Christina Lake Phases D and E in FCCL and improved drilling and well performance from western Canada.
46
Europe
| 2014 | 2013 | 2012 | ||||||||||
|
| |||||||||||
Income from Continuing Operations (millions of dollars) | $ | 804 | 1,229 | 1,517 | ||||||||
| ||||||||||||
Average Net Production | ||||||||||||
Crude oil (MBD) | 126 | 113 | 135 | |||||||||
Natural gas liquids (MBD) | 8 | 6 | 7 | |||||||||
Natural gas (MMCFD) | 461 | 416 | 516 | |||||||||
| ||||||||||||
Total Production (MBOED) | 211 | 189 | 228 | |||||||||
| ||||||||||||
Average Sales Prices | ||||||||||||
Crude oil (dollars per barrel) | $ | 99.56 | 110.56 | 113.08 | ||||||||
Natural gas liquids (per barrel) | 52.65 | 58.36 | 61.53 | |||||||||
Natural gas (per thousand cubic feet) | 9.29 | 10.68 | 9.76 | |||||||||
| ||||||||||||
The Europe segment consists of operations principally located in the Norwegian and U.K. sectors of the North Sea, as well as exploration activities in Greenland. In 2014 our Europe operations contributed 15 percent of our worldwide liquids production and 12 percent of our natural gas production.
2014 vs. 2013
Earnings for Europe decreased 35 percent in 2014 compared with 2013. The reduction in earnings was primarily due to higher DD&A, which mainly resulted from increased production volumes from Jasmine, lower crude oil and natural gas prices, higher taxes and higher impairments. Impairments in 2014 were $192 million after-tax, compared with impairments in 2013 of $118 million after-tax. Lower gains from asset dispositions, mostly due to the absence of the $83 million after-tax gain on the disposition of our interest in the Interconnector Pipeline in 2013, also contributed to the decrease in 2014 earnings. These decreases were partly offset by higher volumes and a $48 million after-tax benefit from a pension-related settlement.
For additional information on the impairments, see Note 8-Impairments, in the Notes to Consolidated Financial Statements.
Average production increased 12 percent in 2014, mostly due to the continued ramp-up of production from Jasmine, the Rivers Acid Plant in the East Irish Sea and Ekofisk South, improved drilling and well performance in Norway and lower planned downtime. These increases were partly offset by normal field decline and higher unplanned downtime.
2013 vs. 2012
Europe earnings decreased 19 percent in 2013 compared with 2012, primarily due to lower volumes and lower gains from asset dispositions. Gains realized in 2012 included the $287 million after-tax gain on sale of our interests in the Statfjord and Alba fields, compared with the $83 million after-tax Interconnector Pipeline gain in 2013. These decreases were partly offset by the absence of the recognition of $192 million in additional income tax expense in 2012, as a result of legislation enacted in the United Kingdom, which restricted corporate tax relief on decommissioning costs to 50 percent. The additional tax expense resulted from the revaluation of deferred tax balances.
Average production decreased 17 percent in 2013, primarily due to normal field decline. Additionally, major planned maintenance at Greater Ekofisk, higher unplanned downtime, mostly in the East Irish Sea, and asset dispositions contributed to the decrease. These decreases were partially offset by improved drilling and well performance in Norway and new production from Jasmine and Ekofisk South.
47
Asia Pacific and Middle East
| 2014 | 2013 | 2012 | ||||||||||
|
| |||||||||||
Income from Continuing Operations (millions of dollars) | $ | 3,008 | 3,591 | 3,996 | ||||||||
| ||||||||||||
Average Net Production | ||||||||||||
Crude oil (MBD) | ||||||||||||
Consolidated operations | 79 | 80 | 68 | |||||||||
Equity affiliates | 15 | 15 | 15 | |||||||||
| ||||||||||||
Total crude oil | 94 | 95 | 83 | |||||||||
| ||||||||||||
Natural gas liquids (MBD) | ||||||||||||
Consolidated operations | 10 | 12 | 16 | |||||||||
Equity affiliates | 8 | 7 | 8 | |||||||||
| ||||||||||||
Total natural gas liquids | 18 | 19 | 24 | |||||||||
| ||||||||||||
Natural gas (MMCFD) | ||||||||||||
Consolidated operations | 723 | 709 | 672 | |||||||||
Equity affiliates | 505 | 481 | 485 | |||||||||
| ||||||||||||
Total natural gas | 1,228 | 1,190 | 1,157 | |||||||||
| ||||||||||||
Total Production (MBOED) | 317 | 312 | 300 | |||||||||
| ||||||||||||
Average Sales Prices | ||||||||||||
Crude oil (dollars per barrel) | ||||||||||||
Consolidated operations | $ | 95.32 | 104.78 | 108.20 | ||||||||
Equity affiliates | 99.01 | 105.44 | 108.07 | |||||||||
Total crude oil | 95.92 | 104.88 | 108.18 | |||||||||
Natural gas liquids (dollars per barrel) | ||||||||||||
Consolidated operations | 69.36 | 73.82 | 79.26 | |||||||||
Equity affiliates | 67.20 | 73.31 | 77.30 | |||||||||
Total natural gas liquids | 68.46 | 73.63 | 78.64 | |||||||||
Natural gas (dollars per thousand cubic feet) | ||||||||||||
Consolidated operations | 9.80 | 10.61 | 10.63 | |||||||||
Equity affiliates | 9.79 | 8.98 | 8.54 | |||||||||
Total natural gas | 9.80 | 9.95 | 9.75 | |||||||||
| ||||||||||||
The Asia Pacific and Middle East segment has operations in China, Indonesia, Malaysia, Australia, Timor-Leste and Qatar, as well as exploration activities in Bangladesh, Brunei and Myanmar. During 2014 Asia Pacific and Middle East contributed 13 percent of our worldwide liquids production and 31 percent of our natural gas production.
48
2014 vs. 2013
Asia Pacific and Middle East earnings decreased 16 percent in 2014 compared with 2013. The reduction in earnings was largely due to lower crude oil and natural gas prices; higher operating expenses, mostly as a result of major planned maintenance at our Bayu-Undan Field and Darwin LNG facility in Australia; lower equity earnings, mainly due to increased activity at APLNG in preparation for startup in mid-2015; and lower sales volumes, primarily crude oil and LNG. These decreases were partially offset by higher LNG prices, higher natural gas volumes and lower taxes. The 2014 benefits from the absence of the $116 million after-tax charge in 2013 related to Bohai Bay and a $30 million after-tax legal settlement in 2014 were offset by the absence of a $146 million after-tax insurance settlement received in 2013, also associated with the Bohai Bay seepage incidents.
Average production increased 2 percent in 2014 compared with 2013. Increased production, mainly from Indonesia, China and Malaysia, was largely offset by normal field decline and major planned maintenance at Bayu-Undan and Darwin LNG.
2013 vs. 2012
Asia Pacific and Middle East earnings decreased 10 percent in 2013 compared with 2012. The decrease in earnings was largely due to:
| • | Lower gains from asset dispositions. Amounts realized from dispositions in 2012 included the $937 million after-tax gain on sale of our Vietnam business, in addition to the $133 million after-tax loss on further dilution of our equity interest in APLNG from 42.5 percent to 37.5 percent. |
| • | Higher DD&A, mostly due to increased production in China. |
| • | A $116 million after-tax charge associated with Bohai Bay. |
| • | Lower crude oil prices. |
| • | Higher operating expenses and production taxes. |
| • | The absence of a $72 million tax-related charge in 2012. |
These decreases to earnings were partially offset by:
| • | Higher crude oil and LNG volumes. |
| • | A $146 million after-tax insurance settlement associated with the Bohai Bay seepage incidents. |
| • | The absence of an $89 million after-tax charge related to the Bohai Bay settlement with the China State Oceanic Administration in 2012. |
| • | Higher equity earnings, mainly due to an $85 million tax benefit from foreign currency exchange rate movements. |
Average production increased 4 percent in 2013. The improvement was largely due to increased production in Bohai Bay, China, new production from Panyu in the South China Sea, the continued ramp-up of production in Malaysia and lower planned downtime, mainly from our Bayu-Undan Field and Darwin LNG Facility. These increases were partly offset by normal field decline and the Vietnam disposition.
49
Other International
| 2014 | 2013 | 2012 | ||||||||||
|
| |||||||||||
Income (Loss) from Continuing Operations (millions of dollars) | $ | (90 | ) | 291 | 624 | |||||||
| ||||||||||||
Average Net Production | ||||||||||||
Crude oil (MBD) | ||||||||||||
Consolidated operations | 8 | 26 | 40 | |||||||||
Equity affiliates | 4 | 4 | 13 | |||||||||
| ||||||||||||
Total crude oil | 12 | 30 | 53 | |||||||||
| ||||||||||||
Natural gas (MMCFD) | 3 | 25 | 18 | |||||||||
| ||||||||||||
Total Production (MBOED) | 12 | 34 | 56 | |||||||||
| ||||||||||||
Average Sales Prices | ||||||||||||
Crude oil (dollars per barrel) | ||||||||||||
Consolidated operations | $ | 86.71 | 107.21 | 110.75 | ||||||||
Equity affiliates | 64.14 | 72.43 | 96.50 | |||||||||
Total crude oil | 77.36 | 101.91 | 107.56 | |||||||||
Natural gas (dollars per thousand cubic feet) | 3.40 | 5.38 | 5.55 | |||||||||
| ||||||||||||
The Other International segment includes operations in Libya and Russia, as well as exploration activities in Colombia, Poland, Angola, Senegal and Azerbaijan. In 2014 Other International contributed 1 percent of our worldwide liquids production.
2014 vs. 2013
Other International operations reported a loss of $90 million in 2014, compared with earnings of $291 million in 2013. The decrease was primarily due to the lower gains from asset dispositions, mainly from the absence of the $288 million after-tax gain recognized on the 2013 disposition of our equity investment in Phoenix Park Processors Limited, located in Trinidad and Tobago; higher dry hole expenses, mostly due to the $136 million after-tax charge for the Kamoxi-1 exploration well, located offshore Angola; and lower volumes from Libya. These reductions were partially offset by the recognition of other income of $154 million after-tax associated with the favorable resolution of a contingent liability.
Average production decreased 65 percent in 2014 compared with 2013, primarily due to the shutdown of the Es Sider crude oil export terminal in Libya, which began at the end of July 2013. The Es Sider Terminal briefly reopened in the third quarter of 2014 and production and liftings resumed temporarily; however, further disruptions occurred in December 2014, and production is shut in again. The 2015 drilling program remains uncertain as a result of the ongoing civil unrest.
2013 vs. 2012
Earnings from Other International decreased 53 percent in 2013 compared with 2012 earnings. The reduction was mainly due to the absence of the 2012 favorable resolution of the PDVSA ICC arbitration, more fully described, below, and lower gains from asset dispositions. Gains realized in 2013 primarily included the $288 million after-tax Phoenix Park disposition, and gains realized in 2012 mostly consisted of the $443 million after-tax gain on disposition of our interest in Naryanmarneftegaz (NMNG) in Russia. Additionally, lower volumes from Libya contributed to the reduction in earnings. These decreases were partially offset by lower impairments. Earnings in 2012 included a $108 million after-tax impairment associated with the N Block in the Caspian Sea.
50
In November 2012, based on an ICC arbitration tribunal ruling, PDVSA paid ConocoPhillips $68 million for pre-expropriation breaches of the Petrozuata project agreements, which resulted in a $61 million after-tax earnings increase. The Company also recognized additional income of $173 million after-tax associated with the reversal of a related contingent liability accrual. These amounts included interest of $33 million after-tax, which was reflected in the Corporate and Other segment.
Average production decreased 39 percent in 2013, largely as a result of the shutdown of the Es Sider crude oil export terminal in Libya at the end of July 2013 and the disposition of our interest in NMNG in 2012. These decreases were partially offset by higher production from Libya during the first six months of 2013, compared with the ramp-up of production in 2012 following their period of civil unrest.
Venezuela Arbitration
In October 2014 we filed for arbitration under the rules of the ICC against PDVSA, the Venezuela state oil company, for contractual compensation related to the Petrozuata and Hamaca heavy crude oil projects. The ICC arbitration is a separate and independent legal action from the investment treaty arbitration against the government of Venezuela, which is pending before an arbitral tribunal under ICSID. For additional information, see Note 12-Contingencies and Commitments, in the Notes to Consolidated Financial Statements.
Asset Dispositions
In July 2014 we sold our Nigeria upstream affiliates, and we transferred our 17 percent interest in the Brass LNG Project to the remaining shareholders in Brass LNG Limited. In 2013 we sold our Algeria business and our interest in the North Caspian Sea Production Sharing Agreement (Kashagan). Results of operations related to Nigeria, Algeria and Kashagan have been classified as discontinued operations in all periods presented in this Form 10-K. For additional information, see Note 2-Discontinued Operations, in the Notes to Consolidated Financial Statements.
51
Corporate and Other
| Millions of Dollars | ||||||||||||
| 2014 | 2013 | 2012 | ||||||||||
|
| |||||||||||
Income (Loss) from Continuing Operations | ||||||||||||
Net interest | $ | (502) | (530) | (648) | ||||||||
Corporate general and administrative expenses | (194) | (213) | (313) | |||||||||
Technology | (93) | (6) | (4) | |||||||||
Separation costs | - | - | (84) | |||||||||
Other | (85) | (71) | 56 | |||||||||
| ||||||||||||
| $ | (874) | (820) | (993) | |||||||||
| ||||||||||||
2014 vs. 2013
Net interest consists of interest and financing expense, net of interest income and capitalized interest, as well as premiums incurred on the early retirement of debt. Net interest decreased 5 percent in 2014 compared with 2013, primarily as a result of a $93 million tax benefit associated with the election of the fair market value method of apportioning interest expense in the United States, as well as a $28 million after-tax benefit associated with interest on a favorable tax settlement. These improvements were largely offset by lower capitalized interest on projects sold or completed.
Corporate general and administrative expenses decreased 9 percent in 2014, mainly due to lower pension settlement expense, partly offset by higher benefit-related expenses. Pension settlement expense incurred in 2013 was $41 million after-tax. We did not incur pension settlement expense in 2014.
Technology includes our investment in new technologies or businesses, as well as licensing revenues received. Activities are focused on heavy oil and oil sands, unconventional reservoirs, LNG, and subsurface, arctic and deepwater technologies, with an underlying commitment to environmental responsibility. Losses from Technology were $93 million in 2014, compared with losses of $6 million in 2013. The reduction in earnings primarily resulted from lower licensing revenues and higher research and development expenses.
The category "Other" includes certain foreign currency transaction gains and losses, environmental costs associated with sites no longer in operation, and other costs not directly associated with an operating segment.
2013 vs. 2012
Net interest decreased 18 percent in 2013 compared with 2012, primarily due to the absence of a $68 million after-tax premium on early debt retirement in 2012 and lower interest expense on lower average debt levels. These improvements were partially offset by the absence of the $33 million after-tax interest benefit from the 2012 favorable resolution of the PDVSA ICC arbitration. For additional information on the arbitration, see Note 12-Contingencies and Commitments, in the Notes to Consolidated Financial Statements.
Corporate general and administrative expenses decreased 32 percent in 2013, mainly due to lower pension settlement expense and lower costs related to compensation and benefit plans. Pension settlement expense incurred in 2013 was $41 million after-tax, compared with $87 million after-tax in 2012.
Separation costs consist of expenses related to the separation of our downstream business into a stand-alone, publicly traded company, Phillips 66.
"Other" expenses increased $127 million in 2013, primarily as a result of higher tax-related adjustments, the absence of a $39 million after-tax settlement which benefitted 2012 and higher foreign currency transaction losses.
52
CAPITAL RESOURCES AND LIQUIDITY
Financial Indicators
| Millions of Dollars | ||||||||||||
| Except as Indicated | ||||||||||||
| 2014 | 2013 | 2012 | ||||||||||
|
| |||||||||||
Net cash provided by continuing operating activities | $ | 16,592 | 15,801 | 13,458 | ||||||||
Net cash provided by discontinued operations | 143 | 286 | 464 | |||||||||
Cash and cash equivalents | 5,062 | 6,246 | 3,618 | |||||||||
Short-term debt | 182 | 589 | 955 | |||||||||
Total debt | 22,565 | 21,662 | 21,725 | |||||||||
Total equity | 52,273 | 52,492 | 48,427 | |||||||||
Percent of total debt to capital* | 30 | % | 29 | 31 | ||||||||
Percent of floating-rate debt to total debt** | 5 | % | 8 | 9 | ||||||||
| ||||||||||||
*Capital includes total debt and total equity.
**Includes effect of interest rate swaps in 2013 and 2012.
To meet our short- and long-term liquidity requirements, we look to a variety of funding sources. Cash generated from continuing operating activities is the primary source of funding. In addition, during 2014 we received $1,603 million in proceeds from asset sales and issued $2,994 million of new low-interest notes. The primary uses of our available cash were $17,085 million to support our ongoing capital expenditures and investments; $3,525 million to pay dividends on our common stock; and $2,014 million to repay debt. During 2014 cash and cash equivalents decreased by $1,184 million, to $5,062 million.
In addition to cash flows from continuing operating activities and proceeds from asset sales, we rely on our commercial paper and credit facility programs and our shelf registration statement to support our short- and long-term liquidity requirements. We believe our current cash balance and cash generated by operations, together with access to external sources of funds as described below in the "Significant Sources of Capital" section, will be sufficient to meet our funding requirements in the near and long term, including our capital expenditures and investments, dividend payments and required debt payments.
Significant Sources of Capital
Operating Activities
During 2014 cash provided by continuing operating activities was $16,592 million, a 5 percent increase from 2013. Cash flows from operating activities benefited from the $1.3 billion distribution from FCCL in the first quarter of 2014. The distribution from FCCL resulted from our $2.8 billion prepayment of the remaining joint venture acquisition obligation in 2013, which substantially increased the financial flexibility of our 50 percent owned FCCL Partnership. We do not expect this individually significant distribution to recur in the future under current economic conditions. Cash flows from investing activities were also impacted by the $0.5 billion payment of the fee resulting from our termination agreement with Freeport LNG, which was largely offset by the receipt of the Freeport LNG loan repayment. During 2013 cash provided by continuing operations was $15,801 million, compared with $13,458 million in 2012.
While the stability of our cash flows from operating activities benefits from geographic diversity, our short- and long-term operating cash flows are highly dependent upon prices for crude oil, bitumen, natural gas, LNG and natural gas liquids. During 2014 and 2013 we benefited from favorable crude oil and natural gas prices, although these prices deteriorated significantly in the fourth quarter of 2014. Prices and margins in our industry are typically volatile and are driven by market conditions over which we have no control. Absent other mitigating factors, as these prices and margins fluctuate, we would expect a corresponding change in our operating cash flows.
53
The level of absolute production volumes, as well as product and location mix, impacts our cash flows. Our 2014 production from continuing operations, excluding Libya, averaged 1,532 MBOED. We expect 2015 production to grow 2 to 3 percent, excluding Libya. Future production is subject to numerous uncertainties, including, among others, the volatile crude oil and natural gas price environment, which may impact investment decisions; the effects of price changes on production sharing and variable-royalty contracts; acquisition and disposition of fields; field production decline rates; new technologies; operating efficiencies; timing of startups and major turnarounds; political instability; weather-related disruptions; and the addition of proved reserves through exploratory success and their timely and cost-effective development. While we actively manage these factors, production levels can cause variability in cash flows, although generally this variability has not been as significant as that caused by commodity prices.
To maintain or grow our production volumes, we must continue to add to our proved reserve base. Our total reserve replacement in 2014 was 97 percent. Excluding the impact of sales and purchases, the organic reserve replacement was 124 percent of 2014 production. Over the five-year period ended December 31, 2014, our reserve replacement was 55 percent (including 78 percent from consolidated operations) reflecting the disposition of our interest in LUKOIL and the impact of asset dispositions. Excluding these items and purchases, our five-year organic reserve replacement was 138 percent. The total reserve replacement amount above is based on the sum of our net additions (revisions, improved recovery, purchases, extensions and discoveries, and sales) divided by our production, as shown in our reserve table disclosures. For additional information about our proved reserves, including both developed and undeveloped reserves, see the "Oil and Gas Operations" section of this report.
As discussed in the "Critical Accounting Estimates" section, engineering estimates of proved reserves are imprecise; therefore, each year reserves may be revised upward or downward due to the impact of changes in commodity prices or as more technical data becomes available on reservoirs. In 2014, 2013 and 2012, revisions increased reserves. It is not possible to reliably predict how revisions will impact reserve quantities in the future.
Asset Sales
Proceeds from asset sales in 2014 were $1.6 billion, primarily from the sale of our Nigeria upstream affiliates for net proceeds of $1.4 billion, after customary adjustments, inclusive of deposits previously received. This compares with proceeds of $10.2 billion in 2013, primarily from the sale of our 8.4 percent equity interest in Kashagan, the sale of our Algeria business, the sale of the majority of our producing zones in the Cedar Creek Anticline, the sale of our interest in the Clyden undeveloped oil sands leasehold, the sale of our 39 percent equity interest in Phoenix Park and the sale of a portion of our working interest in Browse and Canning basins. For additional information, see Note 2-Discontinued Operations and Note 5-Assets Held for Sale or Sold, in the Notes to Consolidated Financial Statements. We continue to evaluate opportunities to further optimize the portfolio.
Commercial Paper and Credit Facilities
In June 2014 we refinanced our revolving credit facility from a total of $7.5 billion to $7.0 billion, with a new expiration date of June 2019. Our revolving credit facility may be used for direct bank borrowings, for the issuance of letters of credit totaling up to $500 million, or as support for our commercial paper programs. The revolving credit facility is broadly syndicated among financial institutions and does not contain any material adverse change provisions or any covenants requiring maintenance of specified financial ratios or credit ratings. The facility agreement contains a cross-default provision relating to the failure to pay principal or interest on other debt obligations of $200 million or more by ConocoPhillips or any of its consolidated subsidiaries.
Credit facility borrowings may bear interest at a margin above rates offered by certain designated banks in the London interbank market as administered by ICE Benchmark Administration or at a margin above the overnight federal funds rate or prime rates offered by certain designated banks in the United States. The agreement calls for commitment fees on available, but unused, amounts. The agreement also contains early termination rights if our current directors or their approved successors cease to be a majority of the Board of Directors.
54
Our primary funding source for short-term working capital needs is the ConocoPhillips $6.1 billion commercial paper program. Commercial paper maturities are generally limited to 90 days. We also have the ConocoPhillips Qatar Funding Ltd. $900 million commercial paper program, which is used to fund commitments relating to QG3. At both December 31, 2014 and 2013, we had no direct outstanding borrowings or letters of credit issued under the revolving credit facility. In addition, under the ConocoPhillips Qatar Funding Ltd. commercial paper program, there was $860 million of commercial paper outstanding at December 31, 2014, compared with $961 million at December 31, 2013. Since we had $860 million of commercial paper outstanding and had issued no letters of credit, we had access to $6.1 billion in borrowing capacity under our revolving credit facility at December 31, 2014.
Our senior long-term debt is rated "A1" by Moody's Investors Service and "A" by both Standard and Poor's Rating Service and Fitch. We do not have any ratings triggers on any of our corporate debt that would cause an automatic default, and thereby impact our access to liquidity, in the event of a downgrade of our credit rating. If our credit rating were to deteriorate to a level prohibiting us from accessing the commercial paper market, we would still be able to access funds under our $7.0 billion revolving credit facility.
Certain of our project-related contracts and derivative instruments contain provisions requiring us to post collateral. Many of these contracts and instruments permit us to post either cash or letters of credit as collateral. At December 31, 2014 and December 31, 2013, we had direct bank letters of credit of $802 million and $827 million, respectively, which secured performance obligations related to various purchase commitments incident to the ordinary conduct of business.
Shelf Registration
We have a universal shelf registration statement on file with the U.S. Securities and Exchange Commission under which we, as a well-known seasoned issuer, have the ability to issue and sell an indeterminate amount of various types of debt and equity securities.
Off-Balance Sheet Arrangements
As part of our normal ongoing business operations and consistent with normal industry practice, we enter into numerous agreements with other parties to pursue business opportunities, which share costs and apportion risks among the parties as governed by the agreements.
For information about guarantees, see Note 11-Guarantees, in the Notes to Consolidated Financial Statements, which is incorporated herein by reference.
Capital Requirements
For information about our capital expenditures and investments, see the "Capital Spending" section.
Our debt balance at December 31, 2014, was $22.6 billion, an increase of $903 million from the balance at December 31, 2013. Our short-term debt balance at December 31, 2014, decreased $407 million compared with December 31, 2013, primarily as a result of the timing of scheduled maturities. During 2014 we repaid notes at maturity totaling $400 million. In November 2014 we redeemed the outstanding $1.5 billion of 4.60% Notes due January 2015 and issued $3.0 billion of new low-interest notes. For more information, see Note 10-Debt, in the Notes to Consolidated Financial Statements.
We were obligated to contribute $7.5 billion, plus interest, over a 10-year period that began in 2007, to our 50 percent owned FCCL Partnership. In December 2013 we paid the remaining balance of the obligation, which totaled $2,810 million and is included in the "Other" line in the financing activities section of our consolidated statement of cash flows.
55
In October 2014 we announced a dividend of 73 cents per share. The dividend was paid December 1, 2014, to stockholders of record at the close of business on October 14, 2014. Additionally, on February 4, 2015, we announced a dividend of 73 cents per share. The dividend will be paid March 2, 2015, to stockholders of record at the close of business on February 17, 2015.
Contractual Obligations
The following table summarizes our aggregate contractual fixed and variable obligations of our continuing operations as of December 31, 2014:
| Millions of Dollars | ||||||||||||||||||||
|
| |||||||||||||||||||
| Payments Due by Period | ||||||||||||||||||||
|
| |||||||||||||||||||
| Up to 1 | Years | Years | After | |||||||||||||||||
| Total | Year | 2–3 | 4–5 | 5 Years | ||||||||||||||||
|
| |||||||||||||||||||
Debt obligations (a) | $ | 21,707 | 123 | 2,309 | 3,843 | 15,432 | ||||||||||||||
Capital lease obligations (b) | 858 | 59 | 95 | 102 | 602 | |||||||||||||||
| ||||||||||||||||||||
Total debt | 22,565 | 182 | 2,404 | 3,945 | 16,034 | |||||||||||||||
| ||||||||||||||||||||
Interest on debt and other obligations | 16,007 | 1,169 | 2,216 | 1,943 | 10,679 | |||||||||||||||
Operating lease obligations (c) | 2,949 | 568 | 1,235 | 515 | 631 | |||||||||||||||
Purchase obligations (d) | 17,450 | 7,099 | 3,119 | 1,878 | 5,354 | |||||||||||||||
Other long-term liabilities | ||||||||||||||||||||
Pension and postretirement benefit contributions (e) | 1,690 | 294 | 558 | 838 | - | |||||||||||||||
Asset retirement obligations (f) | 10,939 | 592 | 1,506 | 1,529 | 7,312 | |||||||||||||||
Accrued environmental costs (g) | 344 | 48 | 59 | 34 | 203 | |||||||||||||||
Unrecognized tax benefits (h) | 53 | 53 | (h | ) | (h | ) | (h) | |||||||||||||
| ||||||||||||||||||||
Total | $ | 71,997 | 10,005 | 11,097 | 10,682 | 40,213 | ||||||||||||||
| ||||||||||||||||||||
| (a) | Includes $372 million of net unamortized premiums and discounts. See Note 10-Debt, in the Notes to Consolidated Financial Statements, for additional information. |
| (b) | Capital lease obligations are presented on a discounted basis. |
| (c) | Operating lease obligations are presented on an undiscounted basis. |
| (d) | Represents any agreement to purchase goods or services that is enforceable and legally binding and that specifies all significant terms, presented on an undiscounted basis. Does not include purchase commitments for jointly owned fields and facilities where we are not the operator. |
The majority of the purchase obligations are market-based contracts related to our commodity business. Product purchase commitments with third parties totaled $6,573 million.
Purchase obligations of $7,778 million are related to agreements to access and utilize the capacity of third-party equipment and facilities, including pipelines and LNG and product terminals, to transport, process, treat and store commodities. The remainder is primarily our net share of purchase commitments for materials and services for jointly owned fields and facilities where we are the operator.
| (e) | Represents contributions to qualified and nonqualified pension and postretirement benefit plans for the years 2015 through 2019. For additional information related to expected benefit payments subsequent to 2019, see Note 17-Employee Benefit Plans, in the Notes to Consolidated Financial Statements. |
56
| (f) | Represents estimated discounted costs to retire and remove long-lived assets at the end of their operations. |
| (g) | Represents estimated costs for accrued environmental expenditures presented on a discounted basis for costs acquired in various business combinations and an undiscounted basis for all other accrued environmental costs. |
| (h) | Excludes unrecognized tax benefits of $389 million because the ultimate disposition and timing of any payments to be made with regard to such amounts are not reasonably estimable. Although unrecognized tax benefits are not a contractual obligation, they are presented in this table because they represent potential demands on our liquidity. |
Capital Spending
| Millions of Dollars | ||||||||||||
| 2014 | 2013 | 2012 | ||||||||||
|
| |||||||||||
Alaska | $ | 1,564 | 1,140 | 828 | ||||||||
Lower 48 | 6,054 | 5,210 | 5,249 | |||||||||
Canada | 2,340 | 2,232 | 2,184 | |||||||||
Europe | 2,521 | 3,078 | 2,844 | |||||||||
Asia Pacific and Middle East | 3,877 | 3,382 | 2,430 | |||||||||
Other International | 539 | 313 | 433 | |||||||||
Corporate and Other | 190 | 182 | 204 | |||||||||
| ||||||||||||
Capital expenditures and investments from continuing operations | 17,085 | 15,537 | 14,172 | |||||||||
| ||||||||||||
Discontinued operations in Kashagan, Nigeria and Algeria | 59 | 609 | 817 | |||||||||
Joint venture acquisition obligation (principal)-Canada* | - | 772 | 733 | |||||||||
| ||||||||||||
Capital Program | $ | 17,144 | 16,918 | 15,722 | ||||||||
| ||||||||||||
*Excludes $2,810 million prepayment in the fourth quarter of 2013.
Our capital expenditures and investments from continuing operations for the three-year period ended December 31, 2014, totaled $46.8 billion. The 2014 expenditures supported key exploration and developments, primarily:
| • | Oil and natural gas development and exploration activities in the Lower 48, including the Eagle Ford, Bakken and Niobrara shale plays, and the Permian Basin. |
| • | Development of coalbed methane projects associated with the APLNG joint venture in Australia. |
| • | Oil sands development and ongoing liquids-rich plays in Canada. |
| • | In Europe, development activities in the Greater Ekofisk, Aasta Hansteen, Clair Ridge and Jasmine areas, and appraisal activities in the Greater Clair Area. |
| • | Alaska activities related to development in the Greater Kuparuk Area and the Greater Prudhoe Area, as well as exploration and development activities in the Western North Slope. |
| • | Exploration and appraisal drilling in deepwater Gulf of Mexico. |
| • | Continued development in Malaysia and Indonesia and ongoing exploration, appraisal and development activity offshore Australia and China. |
| • | Exploration activities in Angola and Senegal. |
57
2015 CAPITAL BUDGET
In anticipation of weak commodity prices in 2015, our capital budget was further reduced in January 2015 from the previously announced $13.5 billion to $11.5 billion, a decrease of 33 percent, compared with our actual 2014 capital spend of $17.1 billion. The reduction in capital relative to 2014 primarily reflects deferral of spending on North American unconventional plays, as well as lower spending on major projects, several of which are nearing completion.
We are planning to allocate approximately:
| • | 30 percent of our 2015 capital expenditures budget to development drilling programs. The 2015 Lower 48 development program capital will continue to target the Eagle Ford and Bakken, with investments being deferred in emerging plays like the Permian and Niobrara. We retain the flexibility to ramp up or down activity in the unconventionals. |
| • | 40 percent of our 2015 capital expenditures budget to major projects. These funds will focus on completion of APLNG and Surmont 2, as well as multiple projects in Alaska, Europe and Malaysia. |
| • | 15 percent of our 2015 capital expenditures budget to exploration and appraisal. This spending will focus on conventional activity in the U.S. Gulf of Mexico, offshore West Africa and Nova Scotia, as well as unconventional activity in North America. |
| • | 15 percent of our 2015 capital expenditures budget to maintain base production. |
For information on proved undeveloped reserves and the associated costs to develop these reserves, see the "Oil and Gas Operations" section.
Contingencies
A number of lawsuits involving a variety of claims arising in the ordinary course of business have been made against ConocoPhillips. We also may be required to remove or mitigate the effects on the environment of the placement, storage, disposal or release of certain chemical, mineral and petroleum substances at various active and inactive sites. We regularly assess the need for accounting recognition or disclosure of these contingencies. In the case of all known contingencies (other than those related to income taxes), we accrue a liability when the loss is probable and the amount is reasonably estimable. If a range of amounts can be reasonably estimated and no amount within the range is a better estimate than any other amount, then the minimum of the range is accrued. We do not reduce these liabilities for potential insurance or third-party recoveries. If applicable, we accrue receivables for probable insurance or other third-party recoveries. With respect to income-tax-related contingencies, we use a cumulative probability-weighted loss accrual in cases where sustaining a tax position is less than certain.
Based on currently available information, we believe it is remote that future costs related to known contingent liability exposures will exceed current accruals by an amount that would have a material adverse impact on our consolidated financial statements. As we learn new facts concerning contingencies, we reassess our position both with respect to accrued liabilities and other potential exposures. Estimates particularly sensitive to future changes include contingent liabilities recorded for environmental remediation, tax and legal matters. Estimated future environmental remediation costs are subject to change due to such factors as the uncertain magnitude of cleanup costs, the unknown time and extent of such remedial actions that may be required, and the determination of our liability in proportion to that of other responsible parties. Estimated future costs related to tax and legal matters are subject to change as events evolve and as additional information becomes available during the administrative and litigation processes. For information on other contingencies, see Note 12-Contingencies and Commitments, in the Notes to Consolidated Financial Statements.
Legal and Tax Matters
We are subject to various lawsuits and claims including but not limited to matters involving oil and gas royalty and severance tax payments, gas measurement and valuation methods, contract disputes, environmental damages, personal injury, and property damage. Our primary exposures for such matters relate to alleged royalty underpayments on certain federal, state and privately owned properties and claims of alleged environmental contamination from historic operations. We will continue to defend ourselves vigorously in these matters.
58
Our legal organization applies its knowledge, experience and professional judgment to the specific characteristics of our cases, employing a litigation management process to manage and monitor the legal proceedings against us. Our process facilitates the early evaluation and quantification of potential exposures in individual cases. This process also enables us to track those cases that have been scheduled for trial and/or mediation. Based on professional judgment and experience in using these litigation management tools and available information about current developments in all our cases, our legal organization regularly assesses the adequacy of current accruals and determines if adjustment of existing accruals, or establishment of new accruals, is required. See Note 18-Income Taxes, in the Notes to Consolidated Financial Statements, for additional information about income-tax-related contingencies.
Environmental
We are subject to the same numerous international, federal, state and local environmental laws and regulations as other companies in our industry. The most significant of these environmental laws and regulations include, among others, the:
| • | U.S. Federal Clean Air Act, which governs air emissions. |
| • | U.S. Federal Clean Water Act, which governs discharges to water bodies. |
| • | European Union Regulation for Registration, Evaluation, Authorization and Restriction of Chemicals (REACH). |
| • | U.S. Federal Comprehensive Environmental Response, Compensation and Liability Act (CERCLA), which imposes liability on generators, transporters and arrangers of hazardous substances at sites where hazardous substance releases have occurred or are threatening to occur. |
| • | U.S. Federal Resource Conservation and Recovery Act (RCRA), which governs the treatment, storage and disposal of solid waste. |
| • | U.S. Federal Oil Pollution Act of 1990 (OPA90), under which owners and operators of onshore facilities and pipelines, lessees or permittees of an area in which an offshore facility is located, and owners and operators of vessels are liable for removal costs and damages that result from a discharge of oil into navigable waters of the United States. |
| • | U.S. Federal Emergency Planning and Community Right-to-Know Act (EPCRA), which requires facilities to report toxic chemical inventories with local emergency planning committees and response departments. |
| • | U.S. Federal Safe Drinking Water Act, which governs the disposal of wastewater in underground injection wells. |
| • | U.S. Department of the Interior regulations, which relate to offshore oil and gas operations in U.S. waters and impose liability for the cost of pollution cleanup resulting from operations, as well as potential liability for pollution damages. |
| • | European Union Trading Directive resulting in European Emissions Trading Scheme. |
These laws and their implementing regulations set limits on emissions and, in the case of discharges to water, establish water quality limits. They also, in most cases, require permits in association with new or modified operations. These permits can require an applicant to collect substantial information in connection with the application process, which can be expensive and time consuming. In addition, there can be delays associated with notice and comment periods and the agency's processing of the application. Many of the delays associated with the permitting process are beyond the control of the applicant.
Many states and foreign countries where we operate also have, or are developing, similar environmental laws and regulations governing these same types of activities. While similar, in some cases these regulations may impose additional, or more stringent, requirements that can add to the cost and difficulty of marketing or transporting products across state and international borders.
59
The ultimate financial impact arising from environmental laws and regulations is neither clearly known nor easily determinable as new standards, such as air emission standards, water quality standards and stricter fuel regulations, continue to evolve. However, environmental laws and regulations, including those that may arise to address concerns about global climate change, are expected to continue to have an increasing impact on our operations in the United States and in other countries in which we operate. Notable areas of potential impacts include air emission compliance and remediation obligations in the United States and Canada.
An example is the use of hydraulic fracturing, an essential completion technique that facilitates production of oil and natural gas otherwise trapped in lower permeability rock formations. A range of local, state, federal or national laws and regulations currently govern hydraulic fracturing operations, with hydraulic fracturing currently prohibited in some jurisdictions. Although hydraulic fracturing has been conducted for many decades, a number of new laws, regulations and permitting requirements are under consideration by the U.S. Environmental Protection Agency (EPA), the U.S. Department of the Interior, and others which could result in increased costs, operating restrictions, operational delays and/or limit the ability to develop oil and natural gas resources. Governmental restrictions on hydraulic fracturing could impact the overall profitability or viability of certain of our oil and natural gas investments. We have adopted operating principles that incorporate established industry standards designed to meet or exceed government requirements. Our practices continually evolve as technology improves and regulations change.
We also are subject to certain laws and regulations relating to environmental remediation obligations associated with current and past operations. Such laws and regulations include CERCLA and RCRA and their state equivalents. Longer-term expenditures are subject to considerable uncertainty and may fluctuate significantly.
We occasionally receive requests for information or notices of potential liability from the EPA and state environmental agencies alleging we are a potentially responsible party under CERCLA or an equivalent state statute. On occasion, we also have been made a party to cost recovery litigation by those agencies or by private parties. These requests, notices and lawsuits assert potential liability for remediation costs at various sites that typically are not owned by us, but allegedly contain wastes attributable to our past operations. As of December 31, 2013, we reported we had been notified of potential liability under CERCLA and comparable state laws at 15 sites around the United States. At December 31, 2014, there was no change in the number of sites.
For most Superfund sites, our potential liability will be significantly less than the total site remediation costs because the percentage of waste attributable to us, versus that attributable to all other potentially responsible parties, is relatively low. Although liability of those potentially responsible is generally joint and several for federal sites and frequently so for state sites, other potentially responsible parties at sites where we are a party typically have had the financial strength to meet their obligations, and where they have not, or where potentially responsible parties could not be located, our share of liability has not increased materially. Many of the sites at which we are potentially responsible are still under investigation by the EPA or the state agencies concerned. Prior to actual cleanup, those potentially responsible normally assess site conditions, apportion responsibility and determine the appropriate remediation. In some instances, we may have no liability or attain a settlement of liability. Actual cleanup costs generally occur after the parties obtain EPA or equivalent state agency approval. There are relatively few sites where we are a major participant, and given the timing and amounts of anticipated expenditures, neither the cost of remediation at those sites nor such costs at all CERCLA sites, in the aggregate, is expected to have a material adverse effect on our competitive or financial condition.
Expensed environmental costs were $573 million in 2014 and are expected to be about $560 million per year in 2015 and 2016. Capitalized environmental costs were $497 million in 2014 and are expected to be about $450 million per year in 2015 and 2016.
Accrued liabilities for remediation activities are not reduced for potential recoveries from insurers or other third parties and are not discounted (except those assumed in a purchase business combination, which we do record on a discounted basis).
60
Many of these liabilities result from CERCLA, RCRA and similar state or international laws that require us to undertake certain investigative and remedial activities at sites where we conduct, or once conducted, operations or at sites where ConocoPhillips-generated waste was disposed. The accrual also includes a number of sites we identified that may require environmental remediation, but which are not currently the subject of CERCLA, RCRA or other agency enforcement activities. If applicable, we accrue receivables for probable insurance or other third-party recoveries. In the future, we may incur significant costs under both CERCLA and RCRA.
Remediation activities vary substantially in duration and cost from site to site, depending on the mix of unique site characteristics, evolving remediation technologies, diverse regulatory agencies and enforcement policies, and the presence or absence of potentially liable third parties. Therefore, it is difficult to develop reasonable estimates of future site remediation costs.
At December 31, 2014, our balance sheet included total accrued environmental costs of $344 million, compared with $348 million at December 31, 2013, for remediation activities in the U.S. and Canada. We expect to incur a substantial amount of these expenditures within the next 30 years.
Notwithstanding any of the foregoing, and as with other companies engaged in similar businesses, environmental costs and liabilities are inherent concerns in our operations and products, and there can be no assurance that material costs and liabilities will not be incurred. However, we currently do not expect any material adverse effect upon our results of operations or financial position as a result of compliance with current environmental laws and regulations.
Climate Change
There has been a broad range of proposed or promulgated state, national and international laws focusing on greenhouse gas (GHG) reduction. These proposed or promulgated laws apply or could apply in countries where we have interests or may have interests in the future. Laws in this field continue to evolve, and while it is not possible to accurately estimate either a timetable for implementation or our future compliance costs relating to implementation, such laws, if enacted, could have a material impact on our results of operations and financial condition. Examples of legislation or precursors for possible regulation that do or could affect our operations include:
| • | European Emissions Trading Scheme (ETS), the program through which many of the European Union (EU) member states are implementing the Kyoto Protocol. Our cost of compliance with the EU ETS in 2014 was approximately $3 million (net share pre-tax). |
| • | A regulation issued by the Alberta government in 2007 under the Climate Change and Emissions Act. The regulation requires any existing facility with emissions equal to or greater than 100,000 metric tonnes of carbon dioxide or equivalent per year to reduce the net emissions intensity beginning July 1, 2007 by 12 percent. New facilities must reduce 2 percent per year until they reach the maximum target of 12 percent. We also incur a carbon tax for emissions from fossil fuel combustion in our British Columbia operations. The total cost of compliance with these Canadian regulations in 2014 was approximately $6 million. |
| • | The U.S. Supreme Court decision in Massachusetts v. EPA , 549 U.S. 497, 127 S.Ct. 1438 (2007), confirming that the EPA has the authority to regulate carbon dioxide as an "air pollutant" under the Federal Clean Air Act. |
| • | The U.S. EPA's announcement on March 29, 2010 (published as "Interpretation of Regulations that Determine Pollutants Covered by Clean Air Act Permitting Programs," 75 Fed. Reg. 17004 (April 2, 2010)), and the EPA's and U.S. Department of Transportation's joint promulgation of a Final Rule on April 1, 2010, that triggers regulation of GHGs under the Clean Air Act, may trigger more climate-based claims for damages, and may result in longer agency review time for development projects. |
61
| • | The U.S. EPA's announcement on January 14, 2015, outlining a series of steps it plans to take to address methane and smog-forming volatile organic compound emissions from the oil and gas industry. The current U.S. administration has established a goal of reducing the 2012 levels in methane emissions from the oil and gas industry by 40 to 45 percent by 2025. |
| • | Carbon taxes in certain jurisdictions. Our cost of compliance with Norwegian carbon tax legislation in 2014 was approximately $41 million (net share pre-tax). Our cost of compliance with the Australian Clean Energy Legislation carbon tax (repealed in July 2014) in 2014 was approximately $3 million (net share pre-tax). |
In the United States, some additional form of regulation may be forthcoming in the future at the federal and state levels with respect to GHG emissions. Such regulation could take any of several forms that may result in the creation of additional costs in the form of taxes, the restriction of output, investments of capital to maintain compliance with laws and regulations, or required acquisition or trading of emission allowances. We are working to continuously improve operational and energy efficiency through resource and energy conservation throughout our operations.
Compliance with changes in laws and regulations that create a GHG emission trading scheme or GHG reduction policies could significantly increase our costs, reduce demand for fossil energy derived products, impact the cost and availability of capital and increase our exposure to litigation. Such laws and regulations could also increase demand for less carbon intensive energy sources, including natural gas. The ultimate impact on our financial performance, either positive or negative, will depend on a number of factors, including but not limited to:
| • | Whether and to what extent legislation is enacted. |
| • | The nature of the legislation (such as a cap and trade system or a tax on emissions). |
| • | The price placed on GHG emissions (either by the market or through a tax). |
| • | The GHG reductions required. |
| • | The price and availability of offsets. |
| • | The amount and allocation of allowances. |
| • | Technological and scientific developments leading to new products or services. |
| • | Any potential significant physical effects of climate change (such as increased severe weather events, changes in sea levels and changes in temperature). |
| • | Whether, and the extent to which, increased compliance costs are ultimately reflected in the prices of our products and services. |
The Company has responded by putting in place a corporate Climate Change Action Plan, together with individual business unit climate change management plans in order to undertake actions in four major areas:
| • | Equipping the Company for a low emission world, for example by integrating GHG forecasting and reporting into company procedures; utilizing GHG pricing in planning economics; developing systems to handle GHG market transactions. |
| • | Reducing GHG emissions-In 2013 the Company reduced or avoided GHG emissions by approximately 1,200,000 metric tonnes by carrying out a range of programs across a number of business units. |
| • | Evaluating business opportunities such as the creation of offsets and allowances; carbon capture and storage; the use of low carbon energy and the development of low carbon technologies. |
| • | Engaging externally-The Company is a sponsor of MIT's Joint Program on the Science and Policy of Global Change; constructively engages in the development of climate change legislation and regulation; and discloses our progress and performance through the Carbon Disclosure Project and the Dow Jones Sustainability Index. |
The Company uses an estimated market cost of GHG emissions in the range of $7 to $47 per tonne depending on the timing and country or region to evaluate future opportunities.
62
Other
We have deferred tax assets related to certain accrued liabilities, loss carryforwards and credit carryforwards. Valuation allowances have been established to reduce these deferred tax assets to an amount that will, more likely than not, be realized. Based on our historical taxable income, our expectations for the future, and available tax-planning strategies, management expects the net deferred tax assets will be realized as offsets to reversing deferred tax liabilities and as offsets to the tax consequences of future taxable income.
NON-GAAP RECONCILIATION: PRICE NORMALIZED CASH MARGIN PER BOE
Our financial information includes information prepared in conformity with U.S. generally accepted accounting principles (GAAP), as well as non-GAAP information. Management believes this non-GAAP measure is useful to investors because it enhances understanding of our consolidated financial information by facilitating comparisons of Company operating performance across time periods. This non-GAAP measure should be considered by the reader in addition to, but not instead of, the financial statements prepared in accordance with GAAP. The non-GAAP measure is presented along with the corresponding GAAP measure in order not to imply more emphasis should be placed on the non-GAAP measure. The non-GAAP financial information presented may be determined or calculated differently by other companies.
Cash margin is a performance measure we calculate as a ratio, the numerator of which is net income adjusted for the special items included in the following reconciliation; depreciation, depletion and amortization; dry hole costs; impairments; and corporate and other segment earnings. The denominator is production for the stated time period. This performance measure represents the amount of cash generated per BOE of production. Normalized for changes in commodity prices across time periods, changes in this performance measure demonstrate an underlying portfolio shift to liquids and more favorable fiscal regimes.
Non-GAAP Price Normalized Cash Margin Reconciliation
| Millions of Dollars Except as Indicated | ||||||||
| 2014 | 2013 | |||||||
|
| |||||||
Net Income Attributable to ConocoPhillips | $ | 6,869 | 9,156 | |||||
Adjustment to exclude special items (1) | (260 | ) | (2,095) | |||||
| ||||||||
Adjusted earnings | 6,609 | 7,061 | ||||||
Adjusted loss for Corporate and Other (non-GAAP) (2) | 963 | 781 | ||||||
Operating segment depreciation, depletion and amortization (non-GAAP) (3) | 8,225 | 7,338 | ||||||
Operating segment impairments (non-GAAP) (4) | 29 | 27 | ||||||
Adjusted dry hole costs and leasehold impairments (non-GAAP) (5) | 782 | 443 | ||||||
Price adjustment (6) | 755 | - | ||||||
| ||||||||
Price Normalized Cash Margin | $ | 17,363 | 15,650 | |||||
| ||||||||
Per BOE Calculation | ||||||||
Production from continuing operations (MBOED) | 1,540 | 1,502 | ||||||
Production from continuing operations (MMBOE) | 562 | 548 | ||||||
| ||||||||
Net Income Attributable to ConocoPhillips per BOE | $ | 12.22 | 16.70 | |||||
Percentage decrease | (27 | )% | ||||||
| ||||||||
Price Normalized Cash Margin per BOE | $ | 30.89 | 28.55 | |||||
Percentage increase | 8 | % | ||||||
| ||||||||
63
| Millions of Dollars Except as Indicated | ||||||||||
| 2014 | 2013 | |||||||||
|
| |||||||||
(1) | Adjustment to Exclude Special Items* | |||||||||
| Special items, pre-tax | ||||||||||
Net gain on asset sales | $ | (51 | ) | (1,142) | ||||||
Special items impairments (including leasehold impairment)** | 1,214 | 498 | ||||||||
Loss on capacity agreements | 130 | - | ||||||||
Qatar depreciation adjustment | 28 | - | ||||||||
Freeport LNG termination | 846 | - | ||||||||
Pension settlement expense | - | 66 | ||||||||
Pending claims and settlements | (208 | ) | (137) | |||||||
FCCL international financial reporting standards depreciation adjustment | - | (44) | ||||||||
Income from discontinued operations | (1,147 | ) | (1,461) | |||||||
| ||||||||||
| Special items, pre-tax | $ | 812 | (2,220) | |||||||
| ||||||||||
| Special items, after-tax | ||||||||||
Net gain on asset sales | $ | (38 | ) | (1,075) | ||||||
Special items impairments (including leasehold impairment)** | 641 | 269 | ||||||||
Loss on capacity agreements | 83 | - | ||||||||
Deferred tax adjustment | (59 | ) | - | |||||||
Qatar depreciation adjustment | 28 | - | ||||||||
Tax benefit on interest expense | (61 | ) | - | |||||||
Pension settlement expense | - | 41 | ||||||||
Freeport LNG termination | 545 | - | ||||||||
Pending claims and settlements | (268 | ) | (118) | |||||||
Tax loss carryforward realization | - | (1) | ||||||||
FCCL international financial reporting standards depreciation adjustment | - | (33) | ||||||||
Income from discontinued operations | (1,131 | ) | (1,178) | |||||||
| ||||||||||
| Special items, after-tax | $ | (260 | ) | (2,095) | ||||||
| ||||||||||
*Generally, the threshold for special items is $25 million
after-tax per event. The special items tax impacts were primarily calculated using the statutory |
| |||||||||
**Includes 2014 impairment related exploration expense of $6 million pre-tax and $4 million after-tax. |
| |||||||||
(2) | Adjusted loss for Corporate and Other |
| ||||||||
| Corporate and Other loss | $ | 874 | 820 | |||||||
Exclude Corporate and Other special items | 89 | (39) | ||||||||
| ||||||||||
| Adjusted loss for Corporate and Other (non-GAAP) | $ | 963 | 781 | |||||||
| ||||||||||
(3) | Operating Segment Depreciation, Depletion and Amortization (non-GAAP) |
| ||||||||
| Depreciation, depletion and amortization | $ | 8,329 | 7,434 | |||||||
Exclude Corporate and Other depreciation, depletion and amortization | (104 | ) | (96) | |||||||
| ||||||||||
| Operating segment depreciation, depletion and amortization (non-GAAP) | $ | 8,225 | 7,338 | |||||||
| ||||||||||
(4) | Operating Segment Impairments (non-GAAP) |
| ||||||||
| Impairments | $ | 856 | 529 | |||||||
Exclude impairments special items | (824 | ) | (498) | |||||||
Exclude Corporate and Other impairments | (3 | ) | (4) | |||||||
| ||||||||||
| Operating segment impairments (non-GAAP) | $ | 29 | 27 | |||||||
| ||||||||||
64
| Millions of Dollars Except as Indicated | ||||||||||
| 2014 | 2013 | |||||||||
|
| |||||||||
(5) | Adjusted Dry Hole Costs and Leasehold Impairments (non-GAAP) |
| ||||||||
Dry hole costs and leasehold impairments | $ | 1,166 | 443 | |||||||
Exclude leasehold impairment special items | (384 | ) | - | |||||||
| ||||||||||
Adjusted dry hole costs and leasehold impairments (non-GAAP) | $ | 782 | 443 | |||||||
| ||||||||||
(6) | Price Adjustment* | |||||||||
Average Industry prices | ||||||||||
Dated Brent (dollars per barrel) | $ | 98.99 | 108.65 | |||||||
WTI (dollars per barrel) | 93.17 | 97.90 | ||||||||
Western Canada Select (dollars per barrel) | 73.60 | 72.77 | ||||||||
Weighted Average Mt Belvieu natural gas liquids (dollars per barrel) | 37.51 | 38.85 | ||||||||
U.S. Henry Hub - first of month (dollars per thousand cubic feet) | 4.43 | 3.65 | ||||||||
UK Gas - National Balancing Point (dollars per thousand cubic feet) | 8.51 | 10.45 | ||||||||
| ||||||||||
Net income adjustment** | ||||||||||
Dated Brent | $ | 821 | - | |||||||
WTI | 177 | - | ||||||||
Western Canada Select | (29 | ) | - | |||||||
Weighted Average Mt Belvieu natural gas liquids | 17 | - | ||||||||
U.S. Henry Hub - first of month | (328 | ) | - | |||||||
UK Gas - National Balancing Point | 97 | - | ||||||||
| ||||||||||
Price adjustments* | $ | 755 | - | |||||||
| ||||||||||
*Based on published sensitivities. |
| |||||||||
**Represents the difference in industry prices multiplied by the midpoint of the Annualized Net Income Sensitivities, below. |
| |||||||||
Annualized Net Income Sensitivities
The following sensitivities were published during the 2014 ConocoPhillips Analyst Meeting:
| • | Crude oil |
| o | Brent/Alaska North Slope: $80–90 million change for $1 per barrel change ($85 million midpoint). |
| o | West Texas Intermediate: $35–40 million change for $1 per barrel change ($37.5 million midpoint). |
| o | Western Canada Select: $30–40 million change for $1 per barrel change ($35 million midpoint). Western Canada Select price represents a volumetric weighted average of Shorcan and Net Energy indices. |
| • | North American natural gas liquids |
| o | Representative blend: $10–15 million change for $1 per barrel change ($13.5 million midpoint). |
| • | Natural gas |
| o | Henry Hub: $100–110 million change for $0.25 per thousand cubic feet change ($105 million midpoint). |
| o | International gas: $10–15 million change for $0.25 per thousand cubic feet change ($12.5 million midpoint). |
65
CRITICAL ACCOUNTING ESTIMATES
The preparation of financial statements in conformity with generally accepted accounting principles requires management to select appropriate accounting policies and to make estimates and assumptions that affect the reported amounts of assets, liabilities, revenues and expenses. See Note 1-Accounting Policies, in the Notes to Consolidated Financial Statements, for descriptions of our major accounting policies. Certain of these accounting policies involve judgments and uncertainties to such an extent there is a reasonable likelihood materially different amounts would have been reported under different conditions, or if different assumptions had been used. These critical accounting estimates are discussed with the Audit and Finance Committee of the Board of Directors at least annually. We believe the following discussions of critical accounting estimates, along with the discussions of contingencies and of deferred tax asset valuation allowances in this report, address all important accounting areas where the nature of accounting estimates or assumptions is material due to the levels of subjectivity and judgment necessary to account for highly uncertain matters or the susceptibility of such matters to change.
Oil and Gas Accounting
Accounting for oil and gas exploratory activity is subject to special accounting rules unique to the oil and gas industry. The acquisition of geological and geophysical seismic information, prior to the discovery of proved reserves, is expensed as incurred, similar to accounting for research and development costs. However, leasehold acquisition costs and exploratory well costs are capitalized on the balance sheet pending determination of whether proved oil and gas reserves have been discovered on the prospect.
Property Acquisition Costs
For individually significant leaseholds, management periodically assesses for impairment based on exploration and drilling efforts to date. For relatively small individual leasehold acquisition costs, management exercises judgment and determines a percentage probability that the prospect ultimately will fail to find proved oil and gas reserves and pools that leasehold information with others in the geographic area. For prospects in areas with limited, or no, previous exploratory drilling, the percentage probability of ultimate failure is normally judged to be quite high. This judgmental percentage is multiplied by the leasehold acquisition cost, and that product is divided by the contractual period of the leasehold to determine a periodic leasehold impairment charge that is reported in exploration expense.
This judgmental probability percentage is reassessed and adjusted throughout the contractual period of the leasehold based on favorable or unfavorable exploratory activity on the leasehold or on adjacent leaseholds, and leasehold impairment amortization expense is adjusted prospectively. At year-end 2014, the book value of the pools of property acquisition costs, that individually are relatively small and thus subject to the above-described periodic leasehold impairment calculation, was $1,275 million and the accumulated impairment reserve was $433 million. The weighted-average judgmental percentage probability of ultimate failure was approximately 69 percent, and the weighted-average amortization period was approximately three years. If that judgmental percentage were to be raised by 5 percent across all calculations, pre-tax leasehold impairment expense in 2015 would increase by approximately $22 million. At year-end 2014, the remaining $6,612 million of net capitalized unproved property costs consisted primarily of individually significant leaseholds, mineral rights held in perpetuity by title ownership, exploratory wells currently being drilled, suspended exploratory wells, and capitalized interest. Management periodically assesses individually significant leaseholds for impairment based on the results of exploration and drilling efforts and the outlook for commercialization. Of this amount, approximately $4 billion is concentrated in 10 major development areas, the majority of which are not expected to move to proved properties in 2015.
Exploratory Costs
For exploratory wells, drilling costs are temporarily capitalized, or "suspended," on the balance sheet, pending a determination of whether potentially economic oil and gas reserves have been discovered by the drilling effort to justify completion of the find as a producing well.
66
If exploratory wells encounter potentially economic quantities of oil and gas, the well costs remain capitalized on the balance sheet as long as sufficient progress assessing the reserves and the economic and operating viability of the project is being made. The accounting notion of "sufficient progress" is a judgmental area, but the accounting rules do prohibit continued capitalization of suspended well costs on the expectation future market conditions will improve or new technologies will be found that would make the development economically profitable. Often, the ability to move into the development phase and record proved reserves is dependent on obtaining permits and government or co-venturer approvals, the timing of which is ultimately beyond our control. Exploratory well costs remain suspended as long as we are actively pursuing such approvals and permits, and believe they will be obtained. Once all required approvals and permits have been obtained, the projects are moved into the development phase, and the oil and gas reserves are designated as proved reserves. For complex exploratory discoveries, it is not unusual to have exploratory wells remain suspended on the balance sheet for several years while we perform additional appraisal drilling and seismic work on the potential oil and gas field or while we seek government or co-venturer approval of development plans or seek environmental permitting. Once a determination is made the well did not encounter potentially economic oil and gas quantities, the well costs are expensed as a dry hole and reported in exploration expense.
Management reviews suspended well balances quarterly, continuously monitors the results of the additional appraisal drilling and seismic work, and expenses the suspended well costs as a dry hole when it determines the potential field does not warrant further investment in the near term. Criteria utilized in making this determination include evaluation of the reservoir characteristics and hydrocarbon properties, expected development costs, ability to apply existing technology to produce the reserves, fiscal terms, regulations or contract negotiations, and our expected return on investment.
At year-end 2014, total suspended well costs were $1,299 million, compared with $994 million at year-end 2013. For additional information on suspended wells, including an aging analysis, see Note 7-Suspended Wells, in the Notes to Consolidated Financial Statements.
Proved Reserves
Engineering estimates of the quantities of proved reserves are inherently imprecise and represent only approximate amounts because of the judgments involved in developing such information. Reserve estimates are based on geological and engineering assessments of in-place hydrocarbon volumes, the production plan, historical extraction recovery and processing yield factors, installed plant operating capacity and approved operating limits. The reliability of these estimates at any point in time depends on both the quality and quantity of the technical and economic data and the efficiency of extracting and processing the hydrocarbons.
Despite the inherent imprecision in these engineering estimates, accounting rules require disclosure of "proved" reserve estimates due to the importance of these estimates to better understand the perceived value and future cash flows of a company's operations. There are several authoritative guidelines regarding the engineering criteria that must be met before estimated reserves can be designated as "proved." Our geosciences and reservoir engineering organization has policies and procedures in place consistent with these authoritative guidelines. We have trained and experienced internal engineering personnel who estimate our proved reserves held by consolidated companies, as well as our share of equity affiliates.
Proved reserve estimates are adjusted annually in the fourth quarter and during the year if significant changes occur, and take into account recent production and subsurface information about each field. Also, as required by current authoritative guidelines, the estimated future date when an asset will be permanently shut down for economic reasons is based on 12-month average prices and current costs. This estimated date when production will end affects the amount of estimated reserves. Therefore, as prices and cost levels change from year to year, the estimate of proved reserves also changes. Generally, our proved reserves decrease as prices decline and increase as prices rise.
Our proved reserves include estimated quantities related to production sharing contracts, reported under the "economic interest" method, as well as variable-royalty regimes, and are subject to fluctuations in commodity prices; recoverable operating expenses; and capital costs. If costs remain stable, reserve quantities attributable to recovery of costs will change inversely to changes in commodity prices. We would expect reserves from these contracts to decrease when product prices rise and increase when prices decline.
67
The estimation of proved developed reserves also is important to the income statement because the proved developed reserve estimate for a field serves as the denominator in the unit-of-production calculation of the DD&A of the capitalized costs for that asset. At year-end 2014, the net book value of productive properties, plants and equipment (PP&E) subject to a unit-of-production calculation was approximately $64 billion and the DD&A recorded on these assets in 2014 was approximately $7.9 billion. The estimated proved developed reserves for our consolidated operations were 4.9 billion BOE at the end of 2013 and 4.6 billion BOE at the end of 2014. If the estimates of proved reserves used in the unit-of-production calculations had been lower by 5 percent across all calculations, pre-tax DD&A in 2014 would have increased by an estimated $420 million.
Impairments
Long-lived assets used in operations are assessed for impairment whenever changes in facts and circumstances indicate a possible significant deterioration in future cash flows expected to be generated by an asset group and annually in the fourth quarter following updates to corporate planning assumptions. If there is an indication the carrying amount of an asset may not be recovered, the asset is monitored by management through an established process where changes to significant assumptions such as prices, volumes and future development plans are reviewed. If, upon review, the sum of the undiscounted pre-tax cash flows is less than the carrying value of the asset group, the carrying value is written down to estimated fair value. Individual assets are grouped for impairment purposes based on a judgmental assessment of the lowest level for which there are identifiable cash flows that are largely independent of the cash flows of other groups of assets-generally on a field-by-field basis for exploration and production assets. Because there usually is a lack of quoted market prices for long-lived assets, the fair value of impaired assets is typically determined based on the present values of expected future cash flows using discount rates believed to be consistent with those used by principal market participants, or based on a multiple of operating cash flow validated with historical market transactions of similar assets where possible. The expected future cash flows used for impairment reviews and related fair value calculations are based on judgmental assessments of future production volumes, commodity prices, operating costs and capital decisions, considering all available information at the date of review. See Note 8-Impairments, in the Notes to Consolidated Financial Statements, for additional information.
Investments in nonconsolidated entities accounted for under the equity method are reviewed for impairment when there is evidence of a loss in value and annually following updates to corporate planning assumptions. Such evidence of a loss in value might include our inability to recover the carrying amount, the lack of sustained earnings capacity which would justify the current investment amount, or a current fair value less than the investment's carrying amount. When it is determined such a loss in value is other than temporary, an impairment charge is recognized for the difference between the investment's carrying value and its estimated fair value. When determining whether a decline in value is other than temporary, management considers factors such as the length of time and extent of the decline, the investee's financial condition and near-term prospects, and our ability and intention to retain our investment for a period that will be sufficient to allow for any anticipated recovery in the market value of the investment. Since quoted market prices are usually not available, the fair value is typically based on the present value of expected future cash flows using discount rates believed to be consistent with those used by principal market participants, plus market analysis of comparable assets owned by the investee, if appropriate. Differing assumptions could affect the timing and the amount of an impairment of an investment in any period.
Asset Retirement Obligations and Environmental Costs
Under various contracts, permits and regulations, we have material legal obligations to remove tangible equipment and restore the land or seabed at the end of operations at operational sites. Our largest asset removal obligations involve plugging and abandonment of wells, removal and disposal of offshore oil and gas platforms around the world, as well as oil and gas production facilities and pipelines in Alaska. The fair values of obligations for dismantling and removing these facilities are recorded as a liability and an increase to PP&E at the time of installation of the asset based on estimated discounted costs. Estimating future asset removal
68
costs is difficult. Most of these removal obligations are many years, or decades, in the future and the contracts and regulations often have vague descriptions of what removal practices and criteria must be met when the removal event actually occurs. Asset removal technologies and costs, regulatory and other compliance considerations, expenditure timing, and other inputs into valuation of the obligation, including discount and inflation rates, are also subject to change.
Normally, changes in asset removal obligations are reflected in the income statement as increases or decreases to DD&A over the remaining life of the assets. However, for assets at or nearing the end of their operations, as well as previously sold assets for which we retained the asset removal obligation, an increase in the asset removal obligation can result in an immediate charge to earnings, because any increase in PP&E due to the increased obligation would immediately be subject to impairment, due to the low fair value of these properties.
In addition to asset removal obligations, under the above or similar contracts, permits and regulations, we have certain environmental-related projects. These are primarily related to remediation activities required by Canada and various states within the United States at exploration and production sites. Future environmental remediation costs are difficult to estimate because they are subject to change due to such factors as the uncertain magnitude of cleanup costs, the unknown time and extent of such remedial actions that may be required, and the determination of our liability in proportion to that of other responsible parties.
Projected Benefit Obligations
Determination of the projected benefit obligations for our defined benefit pension and postretirement plans are important to the recorded amounts for such obligations on the balance sheet and to the amount of benefit expense in the income statement. The actuarial determination of projected benefit obligations and company contribution requirements involves judgment about uncertain future events, including estimated retirement dates, salary levels at retirement, mortality rates, lump-sum election rates, rates of return on plan assets, future health care cost-trend rates, and rates of utilization of health care services by retirees. Due to the specialized nature of these calculations, we engage outside actuarial firms to assist in the determination of these projected benefit obligations and company contribution requirements. For Employee Retirement Income Security Act-governed pension plans, the actuary exercises fiduciary care on behalf of plan participants in the determination of the judgmental assumptions used in determining required company contributions into the plan. Due to differing objectives and requirements between financial accounting rules and the pension plan funding regulations promulgated by governmental agencies, the actuarial methods and assumptions for the two purposes differ in certain important respects. Ultimately, we will be required to fund all promised benefits under pension and postretirement benefit plans not funded by plan assets or investment returns, but the judgmental assumptions used in the actuarial calculations significantly affect periodic financial statements and funding patterns over time. Projected benefit obligations are particularly sensitive to the discount rate assumption. A 1 percent decrease in the discount rate assumption would increase projected benefit obligations by $1,400 million. Benefit expense is particularly sensitive to the discount rate and return on plan assets assumptions. A 1 percent decrease in the discount rate assumption would increase annual benefit expense by $130 million, while a 1 percent decrease in the return on plan assets assumption would increase annual benefit expense by $60 million. In determining the discount rate, we use yields on high-quality fixed income investments matched to the estimated benefit cash flows of our plans. We are also exposed to the possibility that lump sum retirement benefits taken from pension plans during the year could exceed the total of service and interest components of annual pension expense and trigger accelerated recognition of a portion of unrecognized net actuarial losses and gains. These benefit payments are based on decisions by plan participants and are therefore difficult to predict. See Note 17-Employee Benefit Plans, in the Notes to Consolidated Financial Statements, for additional information.
69
CAUTIONARY STATEMENT FOR THE PURPOSES OF THE "SAFE HARBOR" PROVISIONS OF THE PRIVATE SECURITIES LITIGATION REFORM ACT OF 1995
This report includes forward-looking statements within the meaning of Section 27A of the Securities Act of 1933 and Section 21E of the Securities Exchange Act of 1934. You can identify our forward-looking statements by the words "anticipate," "estimate," "believe," "budget," "continue," "could," "intend," "may," "plan," "potential," "predict," "seek," "should," "will," "would," "expect," "objective," "projection," "forecast," "goal," "guidance," "outlook," "effort," "target" and similar expressions.
We based the forward-looking statements on our current expectations, estimates and projections about ourselves and the industries in which we operate in general. We caution you these statements are not guarantees of future performance as they involve assumptions that, while made in good faith, may prove to be incorrect, and involve risks and uncertainties we cannot predict. In addition, we based many of these forward-looking statements on assumptions about future events that may prove to be inaccurate. Accordingly, our actual outcomes and results may differ materially from what we have expressed or forecast in the forward-looking statements. Any differences could result from a variety of factors, including the following:
| • | Fluctuations in crude oil, bitumen, natural gas, LNG and natural gas liquids prices. |
| • | Potential failures or delays in achieving expected reserve or production levels from existing and future oil and gas developments due to operating hazards, drilling risks and the inherent uncertainties in predicting reserves and reservoir performance. |
| • | Unsuccessful exploratory drilling activities or the inability to obtain access to exploratory acreage. |
| • | Unexpected changes in costs or technical requirements for constructing, modifying or operating exploration and production facilities. |
| • | Lack of, or disruptions in, adequate and reliable transportation for our crude oil, bitumen, natural gas, LNG and natural gas liquids. |
| • | Inability to timely obtain or maintain permits, including those necessary for drilling and/or development, construction of LNG terminals or regasification facilities; comply with government regulations; or make capital expenditures required to maintain compliance. |
| • | Failure to complete definitive agreements and feasibility studies for, and to timely complete construction of, announced and future exploration and production and LNG development. |
| • | Potential disruption or interruption of our operations due to accidents, extraordinary weather events, civil unrest, political events, terrorism, cyber attacks or infrastructure constraints or disruptions. |
| • | International monetary conditions and exchange controls. |
| • | Substantial investment or reduced demand for products as a result of existing or future environmental rules and regulations, use of competing energy sources or the development of alternative energy sources. |
| • | Liability for remedial actions, including removal and reclamation obligations, under environmental regulations. |
| • | Liability resulting from litigation. |
| • | General domestic and international economic and political developments, including armed hostilities; expropriation of assets; changes in governmental policies relating to crude oil, bitumen, natural gas, LNG and natural gas liquids pricing, regulation or taxation; other political, economic or diplomatic developments; and international monetary fluctuations. |
| • | Changes in tax and other laws, regulations (including alternative energy mandates), or royalty rules applicable to our business. |
| • | Limited access to capital or significantly higher cost of capital related to illiquidity or uncertainty in the domestic or international financial markets. |
| • | Inability to obtain economical financing for development, construction or modification of facilities and general corporate purposes. |
| • | The operation and financing of our joint ventures. |
| • | The factors generally described in Item 1A-Risk Factors in this report. |
70
Item 7A. QUANTITATIVE AND QUALITATIVE DISCLOSURES ABOUT MARKET RISK
Financial Instrument Market Risk
We and certain of our subsidiaries hold and issue derivative contracts and financial instruments that expose our cash flows or earnings to changes in commodity prices, foreign currency exchange rates or interest rates. We may use financial and commodity-based derivative contracts to manage the risks produced by changes in the prices of natural gas, crude oil and related products; fluctuations in interest rates and foreign currency exchange rates; or to capture market opportunities.
Our use of derivative instruments is governed by an "Authority Limitations" document approved by our Board of Directors that prohibits the use of highly leveraged derivatives or derivative instruments without sufficient liquidity. The Authority Limitations document also establishes the Value at Risk (VaR) limits for the company, and compliance with these limits is monitored daily. The Chief Financial Officer monitors risks resulting from foreign currency exchange rates and interest rates and reports to the Chief Executive Officer. The Executive Vice President of Commercial, Business Development and Corporate Planning monitors commodity price risk and also reports to the Chief Executive Officer. The Commercial organization manages our commercial marketing, optimizes our commodity flows and positions, and monitors risks.
Commodity Price Risk
Our Commercial organization uses futures, forwards, swaps and options in various markets to accomplish the following objectives:
| • | Meet customer needs. Consistent with our policy to generally remain exposed to market prices, we use swap contracts to convert fixed-price sales contracts, which are often requested by natural gas consumers, to floating market prices. |
| • | Enable us to use market knowledge to capture opportunities such as moving physical commodities to more profitable locations and storing commodities to capture seasonal or time premiums. We may use derivatives to optimize these activities. |
We use a VaR model to estimate the loss in fair value that could potentially result on a single day from the effect of adverse changes in market conditions on the derivative financial instruments and derivative commodity instruments we hold or issue, including commodity purchases and sales contracts recorded on the balance sheet at December 31, 2014, as derivative instruments. Using Monte Carlo simulation, a 95 percent confidence level and a one-day holding period, the VaR for those instruments issued or held for trading purposes at December 31, 2014 and 2013, was immaterial to our consolidated cash flows and net income attributable to ConocoPhillips. The VaR for instruments held for purposes other than trading at December 31, 2014 and 2013, was also immaterial to our consolidated cash flows and net income attributable to ConocoPhillips.
Interest Rate Risk
The following table provides information about our financial instruments that are sensitive to changes in U.S. interest rates. The debt portion of the table presents principal cash flows and related weighted-average interest rates by expected maturity dates. Weighted-average variable rates are based on effective rates at the reporting date. The carrying amount of our floating-rate debt approximates its fair value. The fair value of the fixed-rate financial instruments is estimated based on quoted market prices.
71
| Millions of Dollars Except as Indicated | ||||||||||||||||
| Debt | ||||||||||||||||
| Expected Maturity Date | Fixed Rate Maturity | Average Interest Rate | Floating Rate Maturity | Average Interest Rate | ||||||||||||
| ||||||||||||||||
Year-End 2014 | ||||||||||||||||
2015 | $ | - | - | % | $ | 107 | 0.18 | % | ||||||||
2016 | 1,273 | 5.52 | - | - | ||||||||||||
2017 | 1,001 | 1.06 | - | - | ||||||||||||
2018 | 797 | 5.74 | - | - | ||||||||||||
2019 | 2,250 | 5.75 | 753 | 0.18 | ||||||||||||
Remaining years | 14,871 | 5.81 | 283 | 0.04 | ||||||||||||
| ||||||||||||||||
Total | $ | 20,192 | $ | 1,143 | ||||||||||||
| ||||||||||||||||
Fair value | $ | 24,048 | $ | 1,143 | ||||||||||||
| ||||||||||||||||
Year-End 2013 | ||||||||||||||||
2014 | $ | 400 | 4.75 | % | $ | 100 | 0.21 | % | ||||||||
2015 | 1,500 | 4.60 | - | - | ||||||||||||
2016 | 1,273 | 5.52 | 861 | 0.02 | ||||||||||||
2017 | 1,001 | 1.06 | - | - | ||||||||||||
2018 | 797 | 5.74 | - | - | ||||||||||||
Remaining years | 14,121 | 6.27 | 283 | 0.05 | ||||||||||||
| ||||||||||||||||
Total | $ | 19,092 | $ | 1,244 | ||||||||||||
| ||||||||||||||||
Fair value | $ | 22,309 | $ | 1,244 | ||||||||||||
| ||||||||||||||||
Foreign Currency Exchange Risk
We have foreign currency exchange rate risk resulting from international operations. We do not comprehensively hedge the exposure to currency exchange rate changes although we may choose to selectively hedge certain foreign currency exchange rate exposures, such as firm commitments for capital projects or local currency tax payments, dividends and cash returns from net investments in foreign affiliates to be remitted within the coming year.
At December 31, 2014 and 2013, we held foreign currency exchange forwards hedging cross-border commercial activity and foreign currency exchange swaps for purposes of mitigating our cash-related exposures. Although these forwards and swaps hedge exposures to fluctuations in exchange rates, we elected not to utilize hedge accounting. As a result, the change in the fair value of these foreign currency exchange derivatives is recorded directly in earnings. Since the gain or loss on the swaps is offset by the gain or loss from remeasuring the related cash balances, and since our aggregate position in the forwards was not material, there would be no material impact to our income from an adverse hypothetical 10 percent change in the December 31, 2014, or 2013, exchange rates. The notional and fair market values of these positions at December 31, 2014 and 2013, were as follows:
72
| In Millions | ||||||||||||||||||
| Foreign Currency Exchange Derivatives | Notional* | Fair Market Value** | ||||||||||||||||
|
|
| ||||||||||||||||
| 2014 | 2013 | 2014 | 2013 | |||||||||||||||
|
|
| ||||||||||||||||
Sell U.S. dollar, buy Canadian dollar | USD | 7 | - | (1 | ) | - | ||||||||||||
Buy U.S. dollar, sell Norwegian krone | USD | 44 | - | - | - | |||||||||||||
Buy U.S. dollar, sell Canadian dollar | USD | - | 6 | - | - | |||||||||||||
Buy British pound, sell euro | GBP | 20 | 17 | 1 | - | |||||||||||||
| ||||||||||||||||||
*Denominated in U.S. dollars (USD) and British pound (GBP).
**Denominated in U.S. dollars.
For additional information about our use of derivative instruments, see Note 13-Derivative and Financial Instruments, in the Notes to Consolidated Financial Statements.
73
| Item 8. | FINANCIAL STATEMENTS AND SUPPLEMENTARY DATA |
CONOCOPHILLIPS
INDEX TO FINANCIAL STATEMENTS
| Page | ||
Report of Management | 75 | |
Reports of Independent Registered Public Accounting Firm | 76 | |
Consolidated Income Statement for the years ended December 31, 2014, 2013 and 2012 | 78 | |
Consolidated Statement of Comprehensive Income for the years ended December 31, 2014, 2013 and 2012 | 79 | |
Consolidated Balance Sheet at December 31, 2014 and 2013 | 80 | |
Consolidated Statement of Cash Flows for the years ended December 31, 2014, 2013 and 2012 | 81 | |
Consolidated Statement of Changes in Equity for the years ended December 31, 2014, 2013 and 2012 | 82 | |
Notes to Consolidated Financial Statements | 83 | |
Supplementary Information | ||
Oil and Gas Operations | 136 | |
Selected Quarterly Financial Data | 163 | |
Condensed Consolidating Financial Information | 164 | |
74
Report of Management
Management prepared, and is responsible for, the consolidated financial statements and the other information appearing in this annual report. The consolidated financial statements present fairly the company's financial position, results of operations and cash flows in conformity with accounting principles generally accepted in the United States. In preparing its consolidated financial statements, the company includes amounts that are based on estimates and judgments management believes are reasonable under the circumstances. The company's financial statements have been audited by Ernst & Young LLP, an independent registered public accounting firm appointed by the Audit and Finance Committee of the Board of Directors and ratified by stockholders. Management has made available to Ernst & Young LLP all of the company's financial records and related data, as well as the minutes of stockholders' and directors' meetings.
Assessment of Internal Control Over Financial Reporting
Management is also responsible for establishing and maintaining adequate internal control over financial reporting. ConocoPhillips' internal control system was designed to provide reasonable assurance to the company's management and directors regarding the preparation and fair presentation of published financial statements.
All internal control systems, no matter how well designed, have inherent limitations. Therefore, even those systems determined to be effective can provide only reasonable assurance with respect to financial statement preparation and presentation.
Management assessed the effectiveness of the company's internal control over financial reporting as of December 31, 2014. In making this assessment, it used the criteria set forth by the Committee of Sponsoring Organizations of the Treadway Commission in Internal Control-Integrated Framework (2013) . Based on our assessment, we believe the company's internal control over financial reporting was effective as of December 31, 2014.
Ernst & Young LLP has issued an audit report on the company's internal control over financial reporting as of December 31, 2014, and their report is included herein.
| /s/ Ryan M. Lance | /s/ Jeff W. Sheets | |
| Ryan M. Lance | Jeff W. Sheets | |
| Chairman and | Executive Vice President, Finance | |
| Chief Executive Officer | and Chief Financial Officer | |
February 24, 2015
75
Report of Independent Registered Public Accounting Firm
The Board of Directors and Stockholders
ConocoPhillips
We have audited the accompanying consolidated balance sheets of ConocoPhillips as of December 31, 2014 and 2013, and the related consolidated statements of income, comprehensive income, changes in equity, and cash flows for each of the three years in the period ended December 31, 2014. Our audits also included the related condensed consolidating financial information listed in the Index at Item 8 and financial statement schedule listed in Item 15(a). These financial statements, condensed consolidating financial information, and schedule are the responsibility of the Company's management. Our responsibility is to express an opinion on these financial statements, condensed consolidating financial information, and schedule based on our audits.
We conducted our audits in accordance with the standards of the Public Company Accounting Oversight Board (United States). Those standards require that we plan and perform the audit to obtain reasonable assurance about whether the financial statements are free of material misstatement. An audit includes examining, on a test basis, evidence supporting the amounts and disclosures in the financial statements. An audit also includes assessing the accounting principles used and significant estimates made by management, as well as evaluating the overall financial statement presentation. We believe that our audits provide a reasonable basis for our opinion.
In our opinion, the financial statements referred to above present fairly, in all material respects, the consolidated financial position of ConocoPhillips at December 31, 2014 and 2013, and the consolidated results of its operations and its cash flows for each of the three years in the period ended December 31, 2014, in conformity with U.S. generally accepted accounting principles. Also, in our opinion, the related condensed consolidating financial information and financial statement schedule, when considered in relation to the basic financial statements taken as a whole, present fairly in all material respects the information set forth therein.
We also have audited, in accordance with the standards of the Public Company Accounting Oversight Board (United States), ConocoPhillips' internal control over financial reporting as of December 31, 2014, based on criteria established in Internal Control-Integrated Framework issued by the Committee of Sponsoring Organizations of the Treadway Commission (2013 framework) and our report dated February 24, 2015, expressed an unqualified opinion thereon.
/s/ ERNST & YOUNG LLP
Houston, Texas
February 24, 2015
76
Report of Independent Registered Public Accounting Firm
The Board of Directors and Stockholders
ConocoPhillips
We have audited ConocoPhillips' internal control over financial reporting as of December 31, 2014, based on criteria established in Internal Control-Integrated Framework issued by the Committee of Sponsoring Organizations of the Treadway Commission (2013 framework) (the COSO criteria). ConocoPhillips' management is responsible for maintaining effective internal control over financial reporting, and for its assessment of the effectiveness of internal control over financial reporting included under the heading "Assessment of Internal Control Over Financial Reporting" in the accompanying "Report of Management." Our responsibility is to express an opinion on the Company's internal control over financial reporting based on our audit.
We conducted our audit in accordance with the standards of the Public Company Accounting Oversight Board (United States). Those standards require that we plan and perform the audit to obtain reasonable assurance about whether effective internal control over financial reporting was maintained in all material respects. Our audit included obtaining an understanding of internal control over financial reporting, assessing the risk that a material weakness exists, testing and evaluating the design and operating effectiveness of internal control based on the assessed risk, and performing such other procedures as we considered necessary in the circumstances. We believe our audit provides a reasonable basis for our opinion.
A company's internal control over financial reporting is a process designed to provide reasonable assurance regarding the reliability of financial reporting and the preparation of financial statements for external purposes in accordance with generally accepted accounting principles. A company's internal control over financial reporting includes those policies and procedures that (1) pertain to the maintenance of records that, in reasonable detail, accurately and fairly reflect the transactions and dispositions of the assets of the company; (2) provide reasonable assurance that transactions are recorded as necessary to permit preparation of financial statements in accordance with generally accepted accounting principles, and that receipts and expenditures of the company are being made only in accordance with authorizations of management and directors of the company; and (3) provide reasonable assurance regarding prevention or timely detection of unauthorized acquisition, use, or disposition of the company's assets that could have a material effect on the financial statements.
Because of its inherent limitations, internal control over financial reporting may not prevent or detect misstatements. Also, projections of any evaluation of effectiveness to future periods are subject to the risk that controls may become inadequate because of changes in conditions, or that the degree of compliance with the policies or procedures may deteriorate.
In our opinion, ConocoPhillips maintained, in all material respects, effective internal control over financial reporting as of December 31, 2014, based on the COSO criteria.
We also have audited, in accordance with the standards of the Public Company Accounting Oversight Board (United States), the 2014 consolidated financial statements of ConocoPhillips and our report dated February 24, 2015, expressed an unqualified opinion thereon.
/s/ ERNST & YOUNG LLP
Houston, Texas
February 24, 2015
77
| ||||||||||||
| Consolidated Income Statement | ConocoPhillips | |||||||||||
| Years Ended December 31 | ||||||||||||
| Millions of Dollars | ||||||||||||
|
| |||||||||||
| 2014 | 2013 | 2012 | ||||||||||
|
| |||||||||||
Revenues and Other Income | ||||||||||||
Sales and other operating revenues | $ | 52,524 | 54,413 | 57,967 | ||||||||
Equity in earnings of affiliates | 2,529 | 2,219 | 1,911 | |||||||||
Gain on dispositions | 98 | 1,242 | 1,657 | |||||||||
Other income | 366 | 374 | 469 | |||||||||
| ||||||||||||
Total Revenues and Other Income | 55,517 | 58,248 | 62,004 | |||||||||
| ||||||||||||
Costs and Expenses | ||||||||||||
Purchased commodities | 22,099 | 22,643 | 25,232 | |||||||||
Production and operating expenses | 8,909 | 7,238 | 6,793 | |||||||||
Selling, general and administrative expenses | 735 | 854 | 1,106 | |||||||||
Exploration expenses | 2,045 | 1,232 | 1,500 | |||||||||
Depreciation, depletion and amortization | 8,329 | 7,434 | 6,580 | |||||||||
Impairments | 856 | 529 | 680 | |||||||||
Taxes other than income taxes | 2,088 | 2,884 | 3,546 | |||||||||
Accretion on discounted liabilities | 484 | 434 | 394 | |||||||||
Interest and debt expense | 648 | 612 | 709 | |||||||||
Foreign currency transaction (gains) losses | (66) | (58) | 41 | |||||||||
| ||||||||||||
Total Costs and Expenses | 46,127 | 43,802 | 46,581 | |||||||||
| ||||||||||||
Income from continuing operations before income taxes | 9,390 | 14,446 | 15,423 | |||||||||
Provision for income taxes | 3,583 | 6,409 | 7,942 | |||||||||
| ||||||||||||
Income From Continuing Operations | 5,807 | 8,037 | 7,481 | |||||||||
Income from discontinued operations* | 1,131 | 1,178 | 1,017 | |||||||||
| ||||||||||||
Net income | 6,938 | 9,215 | 8,498 | |||||||||
Less: net income attributable to noncontrolling interests | (69) | (59) | (70) | |||||||||
| ||||||||||||
Net Income Attributable to ConocoPhillips | $ | 6,869 | 9,156 | 8,428 | ||||||||
| ||||||||||||
Amounts Attributable to ConocoPhillips Common Shareholders: | ||||||||||||
Income from continuing operations | $ | 5,738 | 7,978 | 7,413 | ||||||||
Income from discontinued operations | 1,131 | 1,178 | 1,015 | |||||||||
| ||||||||||||
Net Income | $ | 6,869 | 9,156 | 8,428 | ||||||||
| ||||||||||||
Net Income Attributable to ConocoPhillips Per Share of Common Stock (dollars) | ||||||||||||
Basic | ||||||||||||
Continuing operations | $ | 4.63 | 6.47 | 5.95 | ||||||||
Discontinued operations | 0.91 | 0.96 | 0.82 | |||||||||
| ||||||||||||
Net Income Attributable to ConocoPhillips Per Share of Common Stock | $ | 5.54 | 7.43 | 6.77 | ||||||||
| ||||||||||||
Diluted | ||||||||||||
Continuing operations | $ | 4.60 | 6.43 | 5.91 | ||||||||
Discontinued operations | 0.91 | 0.95 | 0.81 | |||||||||
| ||||||||||||
Net Income Attributable to ConocoPhillips Per Share of Common Stock | $ | 5.51 | 7.38 | 6.72 | ||||||||
| ||||||||||||
Dividends Paid Per Share of Common Stock (dollars) | $ | 2.84 | 2.70 | 2.64 | ||||||||
| ||||||||||||
Average Common Shares Outstanding (in thousands) | ||||||||||||
Basic | 1,237,325 | 1,230,963 | 1,243,799 | |||||||||
Diluted | 1,245,863 | 1,239,803 | 1,253,093 | |||||||||
| ||||||||||||
*Net of provision for income taxes on discontinued operations of: | $ | 16 | 283 | 745 | ||||||||
See Notes to Consolidated Financial Statements.
78
| ||||||||||||
| Consolidated Statement of Comprehensive Income | ConocoPhillips | |||||||||||
| Years Ended December 31 | Millions of Dollars | |||||||||||
|
| |||||||||||
| 2014 | 2013 | 2012 | ||||||||||
|
| |||||||||||
Net Income | $ | 6,938 | 9,215 | 8,498 | ||||||||
Other comprehensive income (loss) | ||||||||||||
Defined benefit plans | ||||||||||||
Prior service credit (cost) arising during the period | (3) | 1 | 2 | |||||||||
Reclassification adjustment for amortization of prior service credit included in net income | (6) | (5) | (5) | |||||||||
| ||||||||||||
Net change | (9) | (4) | (3) | |||||||||
| ||||||||||||
Net actuarial gain (loss) arising during the period | (840) | 688 | (704) | |||||||||
Reclassification adjustment for amortization of net actuarial losses included in net income | 131 | 294 | 430 | |||||||||
| ||||||||||||
Net change | (709) | 982 | (274) | |||||||||
Nonsponsored plans* | - | 10 | 8 | |||||||||
Income taxes on defined benefit plans | 281 | (387) | 132 | |||||||||
| ||||||||||||
Defined benefit plans, net of tax | (437) | 601 | (137) | |||||||||
| ||||||||||||
Foreign currency translation adjustments | (3,539) | (2,705) | 929 | |||||||||
Reclassification adjustment for gain included in net income | - | (4) | (155) | |||||||||
Income taxes on foreign currency translation adjustments | 72 | 23 | (16) | |||||||||
| ||||||||||||
Foreign currency translation adjustments, net of tax | (3,467) | (2,686) | 758 | |||||||||
| ||||||||||||
Hedging activities | - | - | 6 | |||||||||
Income taxes on hedging activities | - | - | - | |||||||||
| ||||||||||||
Hedging activities, net of tax | - | - | 6 | |||||||||
| ||||||||||||
Other Comprehensive Income (Loss), Net of Tax | (3,904) | (2,085) | 627 | |||||||||
| ||||||||||||
Comprehensive Income | 3,034 | 7,130 | 9,125 | |||||||||
Less: comprehensive income attributable to noncontrolling interests | (69) | (59) | (70) | |||||||||
| ||||||||||||
Comprehensive Income Attributable to ConocoPhillips | $ | 2,965 | 7,071 | 9,055 | ||||||||
| ||||||||||||
*Plans for which ConocoPhillips is not the primary obligor-primarily those administered by equity affiliates.
See Notes to Consolidated Financial Statements.
79
| ||||||||
| Consolidated Balance Sheet | ConocoPhillips | |||||||
| At December 31 | Millions of Dollars | |||||||
|
| |||||||
| 2014 | 2013 | |||||||
|
| |||||||
Assets | ||||||||
Cash and cash equivalents | $ | 5,062 | 6,246 | |||||
Short-term investments* | - | 272 | ||||||
Accounts and notes receivable (net of allowance of $5 million in 2014 and $8 million in 2013) | 6,675 | 8,273 | ||||||
Accounts and notes receivable-related parties | 132 | 214 | ||||||
Inventories | 1,331 | 1,194 | ||||||
Prepaid expenses and other current assets | 1,868 | 2,824 | ||||||
| ||||||||
Total Current Assets | 15,068 | 19,023 | ||||||
Investments and long-term receivables | 24,335 | 23,907 | ||||||
Loans and advances-related parties | 804 | 1,357 | ||||||
Net properties, plants and equipment (net of accumulated depreciation, depletion and amortization of $70,786 million in 2014 and $65,321 million in 2013) | 75,444 | 72,827 | ||||||
Other assets | 888 | 943 | ||||||
| ||||||||
Total Assets | $ | 116,539 | 118,057 | |||||
| ||||||||
Liabilities | ||||||||
Accounts payable | $ | 7,982 | 9,250 | |||||
Accounts payable-related parties | 44 | 64 | ||||||
Short-term debt | 182 | 589 | ||||||
Accrued income and other taxes | 1,051 | 2,713 | ||||||
Employee benefit obligations | 878 | 842 | ||||||
Other accruals | 1,400 | 1,671 | ||||||
| ||||||||
Total Current Liabilities | 11,537 | 15,129 | ||||||
Long-term debt | 22,383 | 21,073 | ||||||
Asset retirement obligations and accrued environmental costs | 10,647 | 9,883 | ||||||
Deferred income taxes | 15,070 | 15,220 | ||||||
Employee benefit obligations | 2,964 | 2,459 | ||||||
Other liabilities and deferred credits | 1,665 | 1,801 | ||||||
| ||||||||
Total Liabilities | 64,266 | 65,565 | ||||||
| ||||||||
Equity | ||||||||
Common stock (2,500,000,000 shares authorized at $.01 par value) | ||||||||
Issued (2014-1,773,583,368 shares; 2013-1,768,169,906) | ||||||||
Par value | 18 | 18 | ||||||
Capital in excess of par | 46,071 | 45,690 | ||||||
Treasury stock (at cost: 2014-542,230,673; 2013-542,230,673) | (36,780) | (36,780) | ||||||
Accumulated other comprehensive income (loss) | (1,902) | 2,002 | ||||||
Retained earnings | 44,504 | 41,160 | ||||||
| ||||||||
Total Common Stockholders' Equity | 51,911 | 52,090 | ||||||
Noncontrolling interests | 362 | 402 | ||||||
| ||||||||
Total Equity | 52,273 | 52,492 | ||||||
| ||||||||
Total Liabilities and Equity | $ | 116,539 | 118,057 | |||||
| ||||||||
*Includes marketable securities of: | $ | - | 135 | |||||
See Notes to Consolidated Financial Statements.
80
| ||||||||||||
| Consolidated Statement of Cash Flows | ConocoPhillips | |||||||||||
| Years Ended December 31 | Millions of Dollars | |||||||||||
|
| |||||||||||
| 2014 | 2013 | 2012 | ||||||||||
|
| |||||||||||
Cash Flows From Operating Activities | ||||||||||||
Net income | $ | 6,938 | 9,215 | 8,498 | ||||||||
Adjustments to reconcile net income to net cash provided by operating activities | ||||||||||||
Depreciation, depletion and amortization | 8,329 | 7,434 | 6,580 | |||||||||
Impairments | 856 | 529 | 680 | |||||||||
Dry hole costs and leasehold impairments | 1,166 | 443 | 874 | |||||||||
Accretion on discounted liabilities | 484 | 434 | 394 | |||||||||
Deferred taxes | 709 | 1,311 | 1,397 | |||||||||
Undistributed equity earnings | 77 | (822) | (596) | |||||||||
Gain on dispositions | (98) | (1,242) | (1,657) | |||||||||
Income from discontinued operations | (1,131) | (1,178) | (1,017) | |||||||||
Other | (233) | (371) | (456) | |||||||||
Working capital adjustments | ||||||||||||
Decrease (increase) in accounts and notes receivable | 1,227 | 744 | (1,866) | |||||||||
Decrease (increase) in inventories | (193) | (278) | 210 | |||||||||
Decrease (increase) in prepaid expenses and other current assets | (190) | (83) | 513 | |||||||||
Increase (decrease) in accounts payable | (783) | 183 | 1,103 | |||||||||
Decrease in taxes and other accruals | (566) | (518) | (1,199) | |||||||||
| ||||||||||||
Net cash provided by continuing operating activities | 16,592 | 15,801 | 13,458 | |||||||||
Net cash provided by discontinued operations | 143 | 286 | 464 | |||||||||
| ||||||||||||
Net Cash Provided by Operating Activities | 16,735 | 16,087 | 13,922 | |||||||||
| ||||||||||||
Cash Flows From Investing Activities | ||||||||||||
Capital expenditures and investments | (17,085) | (15,537) | (14,172) | |||||||||
Proceeds from asset dispositions | 1,603 | 10,220 | 2,132 | |||||||||
Net sales (purchases) of short-term investments | 253 | (263) | 597 | |||||||||
Collection of advances/loans-related parties | 603 | 145 | 114 | |||||||||
Other | (446) | (212) | 821 | |||||||||
| ||||||||||||
Net cash used in continuing investing activities | (15,072) | (5,647) | (10,508) | |||||||||
Net cash used in discontinued operations | (59) | (604) | (1,119) | |||||||||
| ||||||||||||
Net Cash Used in Investing Activities | (15,131) | (6,251) | (11,627) | |||||||||
| ||||||||||||
Cash Flows From Financing Activities | ||||||||||||
Issuance of debt | 2,994 | - | 1,996 | |||||||||
Repayment of debt | (2,014) | (946) | (2,565) | |||||||||
Special cash distribution from Phillips 66 | - | - | 7,818 | |||||||||
Change in restricted cash | - | 748 | (748) | |||||||||
Issuance of company common stock | 35 | 20 | 138 | |||||||||
Repurchase of company common stock | - | - | (5,098) | |||||||||
Dividends paid | (3,525) | (3,334) | (3,278) | |||||||||
Other | (64) | (3,621) | (725) | |||||||||
| ||||||||||||
Net cash used in continuing financing activities | (2,574) | (7,133) | (2,462) | |||||||||
Net cash used in discontinued operations | - | - | (2,019) | |||||||||
| ||||||||||||
Net Cash Used in Financing Activities | (2,574) | (7,133) | (4,481) | |||||||||
| ||||||||||||
Effect of Exchange Rate Changes on Cash and Cash Equivalents | (214) | (75) | 24 | |||||||||
| ||||||||||||
Net Change in Cash and Cash Equivalents | (1,184) | 2,628 | (2,162) | |||||||||
Cash and cash equivalents at beginning of period | 6,246 | 3,618 | 5,780 | |||||||||
| ||||||||||||
Cash and Cash Equivalents at End of Period | $ | 5,062 | 6,246 | 3,618 | ||||||||
| ||||||||||||
See Notes to Consolidated Financial Statements.
81
| Consolidated Statement of Changes in Equity | ConocoPhillips | |||||||||||||
| Millions of Dollars | ||||||||||||||||||||||||||||||||
|
| |||||||||||||||||||||||||||||||
| Attributable to ConocoPhillips | ||||||||||||||||||||||||||||||||
|
| |||||||||||||||||||||||||||||||
| Common Stock | ||||||||||||||||||||||||||||||||
|
| |||||||||||||||||||||||||||||||
| Par Value | Capital in Excess of Par | Treasury Stock | Accum. Other Comprehensive Income (Loss) | Unearned Employee Compensation | Retained Earnings | Non- Controlling Interests | Total | |||||||||||||||||||||||||
|
| |||||||||||||||||||||||||||||||
December 31, 2011 | $ | 17 | 44,725 | (31,787 | ) | 3,246 | (11 | ) | 49,049 | 510 | 65,749 | |||||||||||||||||||||
Net income | 8,428 | 70 | 8,498 | |||||||||||||||||||||||||||||
Other comprehensive income | 627 | 627 | ||||||||||||||||||||||||||||||
Dividends paid | (3,278 | ) | (3,278) | |||||||||||||||||||||||||||||
Repurchase of company common stock | (5,098 | ) | (5,098) | |||||||||||||||||||||||||||||
Distributions to noncontrolling interests and other | (109 | ) | (109) | |||||||||||||||||||||||||||||
Distributed under benefit plans | 1 | 599 | 105 | 705 | ||||||||||||||||||||||||||||
Recognition of unearned compensation | 11 | 11 | ||||||||||||||||||||||||||||||
Separation of downstream business | 214 | (18,880 | ) | (31 | ) | (18,697) | ||||||||||||||||||||||||||
Other | 19 | 19 | ||||||||||||||||||||||||||||||
| ||||||||||||||||||||||||||||||||
December 31, 2012 | $ | 18 | 45,324 | (36,780 | ) | 4,087 | - | 35,338 | 440 | 48,427 | ||||||||||||||||||||||
Net income | 9,156 | 59 | 9,215 | |||||||||||||||||||||||||||||
Other comprehensive loss | (2,085 | ) | (2,085) | |||||||||||||||||||||||||||||
Dividends paid | (3,334 | ) | (3,334) | |||||||||||||||||||||||||||||
Distributions to noncontrolling interests and other | (97 | ) | (97) | |||||||||||||||||||||||||||||
Distributed under benefit plans | 366 | 366 | ||||||||||||||||||||||||||||||
| ||||||||||||||||||||||||||||||||
December 31, 2013 | $ | 18 | 45,690 | (36,780 | ) | 2,002 | - | 41,160 | 402 | 52,492 | ||||||||||||||||||||||
Net income | 6,869 | 69 | 6,938 | |||||||||||||||||||||||||||||
Other comprehensive loss | (3,904 | ) | (3,904) | |||||||||||||||||||||||||||||
Dividends paid | (3,525 | ) | (3,525) | |||||||||||||||||||||||||||||
Distributions to noncontrolling interests and other | (109 | ) | (109) | |||||||||||||||||||||||||||||
Distributed under benefit plans | 381 | 381 | ||||||||||||||||||||||||||||||
| ||||||||||||||||||||||||||||||||
December 31, 2014 | $ | 18 | 46,071 | (36,780 | ) | (1,902 | ) | - | 44,504 | 362 | 52,273 | |||||||||||||||||||||
| ||||||||||||||||||||||||||||||||
See Notes to Consolidated Financial Statements.
82
| Notes to Consolidated Financial Statements | ConocoPhillips |
Note 1-Accounting Policies
| n | Consolidation Principles and Investments- Our consolidated financial statements include the accounts of majority-owned, controlled subsidiaries and variable interest entities where we are the primary beneficiary. The equity method is used to account for investments in affiliates in which we have the ability to exert significant influence over the affiliates' operating and financial policies. When we do not have the ability to exert significant influence, the investment is either classified as available-for-sale if fair value is readily determinable, or the cost method is used if fair value is not readily determinable. Undivided interests in oil and gas joint ventures, pipelines, natural gas plants and terminals are consolidated on a proportionate basis. Other securities and investments are generally carried at cost. |
As a result of the separation of Phillips 66 on April 30, 2012, the results of operations for our former refining, marketing and transportation businesses; most of our former Midstream segment; our former Chemicals segment; and our power generation and certain technology operations included in our former Emerging Businesses segment (collectively, our "Downstream business"), have been classified as discontinued operations for all periods presented. In addition, the results of operations for our interest in the North Caspian Sea Production Sharing Agreement (Kashagan) and our Algeria and Nigeria businesses have been classified as discontinued operations for all periods presented. See Note 2-Discontinued Operations, for additional information.
We manage our operations through six operating segments, defined by geographic region: Alaska, Lower 48, Canada, Europe, Asia Pacific and Middle East, and Other International. Effective April 1, 2014, the Other International segment was restructured to focus on enhancing our capability to operate in emerging and new country business units. As a result, we moved the Latin America and Poland businesses from the historically presented Lower 48 and Latin America segment and the Europe segment to the Other International segment. Certain financial information has been revised for all prior periods presented to reflect the change in the composition of our operating segments. For additional information, see Note 23-Segment Disclosures and Related Information. Unless indicated otherwise, the information in the Notes to the Consolidated Financial Statements relates to our continuing operations.
| n | Foreign Currency Translation- Adjustments resulting from the process of translating foreign functional currency financial statements into U.S. dollars are included in accumulated other comprehensive income in common stockholders' equity. Foreign currency transaction gains and losses are included in current earnings. Most of our foreign operations use their local currency as the functional currency. |
| n | Use of Estimates- The preparation of financial statements in conformity with accounting principles generally accepted in the United States requires management to make estimates and assumptions that affect the reported amounts of assets, liabilities, revenues and expenses, and the disclosures of contingent assets and liabilities. Actual results could differ from these estimates. |
| n | Revenue Recognition- Revenues associated with sales of crude oil, bitumen, natural gas, liquefied natural gas (LNG), natural gas liquids and other items are recognized when title passes to the customer, which is when the risk of ownership passes to the purchaser and physical delivery of goods occurs, either immediately or within a fixed delivery schedule that is reasonable and customary in the industry. |
Revenues associated with producing properties in which we have an interest with other producers are recognized based on the actual volumes we sold during the period. Any differences between volumes sold and entitlement volumes, based on our net working interest, which are deemed to be nonrecoverable through remaining production, are recognized as accounts receivable or accounts payable, as appropriate. Cumulative differences between volumes sold and entitlement volumes are generally not significant.
83
Revenues associated with transactions commonly called buy/sell contracts, in which the purchase and sale of inventory with the same counterparty are entered into "in contemplation" of one another, are combined and reported net (i.e., on the same income statement line).
| n | Shipping and Handling Costs- We include shipping and handling costs in production and operating expenses for production activities. Transportation costs related to marketing activities are recorded in purchased commodities. Freight costs billed to customers are recorded as a component of revenue. |
| n | Cash Equivalents- Cash equivalents are highly liquid, short-term investments that are readily convertible to known amounts of cash and have original maturities of 90 days or less from their date of purchase. They are carried at cost plus accrued interest, which approximates fair value. |
| n | Short-Term Investments -Investments in bank time deposits and marketable securities (commercial paper and government obligations) with original maturities of greater than 90 days but less than one year are classified as short-term investments. See Note 13-Derivative and Financial Instruments, for additional information on these held-to-maturity financial instruments. |
| n | Inventories- We have several valuation methods for our various types of inventories and consistently use the following methods for each type of inventory. Commodity-related inventories are valued at the lower of cost or market in the aggregate, primarily on the last-in, first-out (LIFO) basis. Any necessary lower-of-cost-or-market write-downs at year end are recorded as permanent adjustments to the LIFO cost basis. LIFO is used to better match current inventory costs with current revenues. Costs include both direct and indirect expenditures incurred in bringing an item or product to its existing condition and location, but not unusual/nonrecurring costs or research and development costs. Materials, supplies and other miscellaneous inventories, such as tubular goods and well equipment, are valued using various methods, including the weighted-average-cost method, and the first-in, first-out (FIFO) method, consistent with industry practice. |
| n | Fair Value Measurements- We categorize assets and liabilities measured at fair value into one of three different levels depending on the observability of the inputs employed in the measurement. Level 1 inputs are quoted prices in active markets for identical assets or liabilities. Level 2 inputs are observable inputs other than quoted prices included within Level 1 for the asset or liability, either directly or indirectly through market-corroborated inputs. Level 3 inputs are unobservable inputs for the asset or liability reflecting significant modifications to observable related market data or our assumptions about pricing by market participants. |
| n | Derivative Instruments- Derivative instruments are recorded on the balance sheet at fair value. If the right of offset exists and certain other criteria are met, derivative assets and liabilities with the same counterparty are netted on the balance sheet and the collateral payable or receivable is netted against derivative assets and derivative liabilities, respectively. |
Recognition and classification of the gain or loss that results from recording and adjusting a derivative to fair value depends on the purpose for issuing or holding the derivative. Gains and losses from derivatives not accounted for as hedges are recognized immediately in earnings. For derivative instruments that are designated and qualify as a fair value hedge, the gains or losses from adjusting the derivative to its fair value will be immediately recognized in earnings and, to the extent the hedge is effective, offset the concurrent recognition of changes in the fair value of the hedged item. Gains or losses from derivative instruments that are designated and qualify as a cash flow hedge or hedge of a net investment in a foreign entity are recognized in other comprehensive income and appear on the balance sheet in accumulated other comprehensive income until the hedged transaction is recognized in earnings; however, to the extent the change in the value of the derivative exceeds the change in the anticipated cash flows of the hedged transaction, the excess gains or losses will be recognized immediately in earnings.
84
| n | Oil and Gas Exploration and Development- Oil and gas exploration and development costs are accounted for using the successful efforts method of accounting. |
Property Acquisition Costs- Oil and gas leasehold acquisition costs are capitalized and included in the balance sheet caption properties, plants and equipment (PP&E). Leasehold impairment is recognized based on exploratory experience and management's judgment. Upon achievement of all conditions necessary for reserves to be classified as proved, the associated leasehold costs are reclassified to proved properties.
Exploratory Costs- Geological and geophysical costs and the costs of carrying and retaining undeveloped properties are expensed as incurred. Exploratory well costs are capitalized, or "suspended," on the balance sheet pending further evaluation of whether economically recoverable reserves have been found. If economically recoverable reserves are not found, exploratory well costs are expensed as dry holes. If exploratory wells encounter potentially economic quantities of oil and gas, the well costs remain capitalized on the balance sheet as long as sufficient progress assessing the reserves and the economic and operating viability of the project is being made. For complex exploratory discoveries, it is not unusual to have exploratory wells remain suspended on the balance sheet for several years while we perform additional appraisal drilling and seismic work on the potential oil and gas field or while we seek government or co-venturer approval of development plans or seek environmental permitting. Once all required approvals and permits have been obtained, the projects are moved into the development phase, and the oil and gas resources are designated as proved reserves.
Management reviews suspended well balances quarterly, continuously monitors the results of the additional appraisal drilling and seismic work, and expenses the suspended well costs as dry holes when it judges the potential field does not warrant further investment in the near term. See Note 7-Suspended Wells, for additional information on suspended wells.
Development Costs- Costs incurred to drill and equip development wells, including unsuccessful development wells, are capitalized.
Depletion and Amortization- Leasehold costs of producing properties are depleted using the unit-of-production method based on estimated proved oil and gas reserves. Amortization of intangible development costs is based on the unit-of-production method using estimated proved developed oil and gas reserves.
| n | Capitalized Interest- Interest from external borrowings is capitalized on major projects with an expected construction period of one year or longer. Capitalized interest is added to the cost of the underlying asset and is amortized over the useful lives of the assets in the same manner as the underlying assets. |
| n | Depreciation and Amortization- Depreciation and amortization of PP&E on producing hydrocarbon properties and certain pipeline assets (those which are expected to have a declining utilization pattern), are determined by the unit-of-production method. Depreciation and amortization of all other PP&E are determined by either the individual-unit-straight-line method or the group-straight-line method (for those individual units that are highly integrated with other units). |
| n | Impairment of Properties, Plants and Equipment- PP&E used in operations are assessed for impairment whenever changes in facts and circumstances indicate a possible significant deterioration in the future cash flows expected to be generated by an asset group and annually in the fourth quarter following updates to corporate planning assumptions. If there is an indication the carrying amount of an asset may not be recovered, the asset is monitored by management through an established process where changes to significant assumptions such as prices, volumes and future development plans are reviewed. If, upon review, the sum of the undiscounted pre-tax cash flows is less than the carrying value of the asset group, the carrying value is written down to estimated fair value through additional amortization or depreciation provisions and reported as impairments in the periods in which the determination of the |
85
| impairment is made. Individual assets are grouped for impairment purposes at the lowest level for which there are identifiable cash flows that are largely independent of the cash flows of other groups of assets-generally on a field-by-field basis for exploration and production assets. Because there usually is a lack of quoted market prices for long-lived assets, the fair value of impaired assets is typically determined based on the present values of expected future cash flows using discount rates believed to be consistent with those used by principal market participants or based on a multiple of operating cash flow validated with historical market transactions of similar assets where possible. Long-lived assets committed by management for disposal within one year are accounted for at the lower of amortized cost or fair value, less cost to sell, with fair value determined using a binding negotiated price, if available, or present value of expected future cash flows as previously described. |
The expected future cash flows used for impairment reviews and related fair value calculations are based on estimated future production volumes, prices and costs, considering all available evidence at the date of review. The impairment review includes cash flows from proved developed and undeveloped reserves, including any development expenditures necessary to achieve that production. Additionally, when probable and possible reserves exist, an appropriate risk-adjusted amount of these reserves may be included in the impairment calculation.
| n | Impairment of Investments in Nonconsolidated Entities- Investments in nonconsolidated entities are assessed for impairment whenever changes in the facts and circumstances indicate a loss in value has occurred and annually following updates to corporate planning assumptions. When such a condition is judgmentally determined to be other than temporary, the carrying value of the investment is written down to fair value. The fair value of the impaired investment is based on quoted market prices, if available, or upon the present value of expected future cash flows using discount rates believed to be consistent with those used by principal market participants, plus market analysis of comparable assets owned by the investee, if appropriate. |
| n | Maintenance and Repairs- Costs of maintenance and repairs, which are not significant improvements, are expensed when incurred. |
| n | Property Dispositions- When complete units of depreciable property are sold, the asset cost and related accumulated depreciation are eliminated, with any gain or loss reflected in the "Gain on dispositions" line of our consolidated income statement. When less than complete units of depreciable property are disposed of or retired, the difference between asset cost and salvage value is charged or credited to accumulated depreciation. |
| n | Asset Retirement Obligations and Environmental Costs- The fair value of legal obligations to retire and remove long-lived assets are recorded in the period in which the obligation is incurred (typically when the asset is installed at the production location). When the liability is initially recorded, we capitalize this cost by increasing the carrying amount of the related PP&E. If, in subsequent periods, our estimate of this liability changes, we will record an adjustment to both the liability and PP&E. Over time the liability is increased for the change in its present value, and the capitalized cost in PP&E is depreciated over the useful life of the related asset. For additional information, see Note 9-Asset Retirement Obligations and Accrued Environmental Costs. |
Environmental expenditures are expensed or capitalized, depending upon their future economic benefit. Expenditures relating to an existing condition caused by past operations, and those having no future economic benefit, are expensed. Liabilities for environmental expenditures are recorded on an undiscounted basis (unless acquired in a purchase business combination) when environmental assessments or cleanups are probable and the costs can be reasonably estimated. Recoveries of environmental remediation costs from other parties are recorded as assets when their receipt is probable and estimable.
86
| n | Guarantees- The fair value of a guarantee is determined and recorded as a liability at the time the guarantee is given. The initial liability is subsequently reduced as we are released from exposure under the guarantee. We amortize the guarantee liability over the relevant time period, if one exists, based on the facts and circumstances surrounding each type of guarantee. In cases where the guarantee term is indefinite, we reverse the liability when we have information indicating the liability is essentially relieved or amortize it over an appropriate time period as the fair value of our guarantee exposure declines over time. We amortize the guarantee liability to the related income statement line item based on the nature of the guarantee. When it becomes probable that we will have to perform on a guarantee, we accrue a separate liability if it is reasonably estimable, based on the facts and circumstances at that time. We reverse the fair value liability only when there is no further exposure under the guarantee. |
| n | Share-Based Compensation- We recognize share-based compensation expense over the shorter of the service period (i.e., the stated period of time required to earn the award) or the period beginning at the start of the service period and ending when an employee first becomes eligible for retirement. We have elected to recognize expense on a straight-line basis over the service period for the entire award, whether the award was granted with ratable or cliff vesting. |
| n | Income Taxes- Deferred income taxes are computed using the liability method and are provided on all temporary differences between the financial reporting basis and the tax basis of our assets and liabilities, except for deferred taxes on income and temporary differences related to the cumulative translation adjustment considered to be permanently reinvested in certain foreign subsidiaries and foreign corporate joint ventures. Allowable tax credits are applied currently as reductions of the provision for income taxes. Interest related to unrecognized tax benefits is reflected in interest and debt expense, and penalties related to unrecognized tax benefits are reflected in production and operating expenses. |
| n | Taxes Collected from Customers and Remitted to Governmental Authorities -Sales and value-added taxes are recorded net. |
| n | Net Income Per Share of Common Stock- Basic net income per share of common stock is calculated based upon the daily weighted-average number of common shares outstanding during the year, including unallocated shares held by the stock savings feature of the ConocoPhillips Savings Plan. Also, this calculation includes fully vested stock and unit awards that have not yet been issued as common stock, along with an adjustment to net income for dividend equivalents paid on unvested unit awards that are considered participating securities. Diluted net income per share of common stock includes unvested stock, unit or option awards granted under our compensation plans and vested but unexercised stock options, but only to the extent these instruments dilute net income per share, primarily under the treasury-stock method. Treasury stock and shares held by grantor trusts are excluded from the daily weighted-average number of common shares outstanding in both calculations. The earnings per share impact of the participating securities is immaterial. |
Note 2-Discontinued Operations
Separation of Downstream Business
On April 30, 2012, the separation of our Downstream business was completed, creating two independent energy companies: ConocoPhillips and Phillips 66. In connection with the separation, Phillips 66 distributed approximately $7.8 billion to us in a special cash distribution. The principal funds from the special cash distribution were designated solely to pay dividends, repurchase common stock, repay debt, or a combination of the foregoing, within twelve months following the distribution. At December 31, 2014 and 2013, no balance remained from the cash distribution. We also entered into several agreements with Phillips 66 in order to effect the separation and govern our relationship with Phillips 66.
87
Sales and other operating revenues and income from discontinued operations related to Phillips 66 during 2012 were as follows:
| Millions of Dollars | ||||
Sales and other operating revenues from discontinued operations | $ | 62,109 | ||
| ||||
Income from discontinued operations before-tax | $ | 1,768 | ||
Income tax expense | 534 | |||
| ||||
Income from discontinued operations | $ | 1,234 | ||
| ||||
Income from discontinued operations after-tax includes transaction, information systems and other costs incurred to effect the separation of $70 million for the year ended December 31, 2012. No separation costs were incurred in 2014 and 2013.
Prior to the separation, commodity sales to Phillips 66 were $4,973 million for the year ended December 31, 2012. Commodity purchases from Phillips 66 prior to the separation were $166 million for the year ended December 31, 2012. Prior to May 1, 2012, commodity sales and related costs were eliminated in consolidation between ConocoPhillips and Phillips 66. Beginning May 1, 2012, these revenues and costs represent third-party transactions with Phillips 66.
Other Discontinued Operations
As part of our asset disposition program, we agreed to sell our interest in Kashagan and our Algeria and Nigeria businesses (collectively, the "Disposition Group"). The Disposition Group was previously part of the Other International operating segment. We completed the sales of Kashagan and our Algeria business in the fourth quarter of 2013. We sold our Nigeria business in the third quarter of 2014, which completed the asset disposition program.
On November 26, 2012, we notified government authorities in Kazakhstan and co-venturers of our intent to sell the Company's 8.4 percent interest in Kashagan to ONGC Videsh Limited (OVL). On July 2, 2013, we received notification from the government of Kazakhstan indicating it was exercising its right to pre-empt the proposed sale to OVL and designating KazMunayGas (KMG) as the entity to acquire the interest. On October 31, 2013, we completed the transaction with KMG for total proceeds of $5,392 million and recognized a pre-tax gain of $22 million, which is included in the "Income from discontinued operations" line on the consolidated income statement. We recorded pre-tax impairments of $43 million and $606 million in the first quarter of 2013 and the fourth quarter of 2012, respectively. At the time of disposition, the carrying value of the net assets related to our interest in Kashagan was $5,370 million, which included $212 million of other current assets, $239 million of long-term receivables, $5,149 million of PP&E, $144 million of other current liabilities, and $86 million of asset retirement obligations (ARO).
On December 18, 2012, we entered into an agreement with Pertamina to sell our wholly owned subsidiary, ConocoPhillips Algeria Ltd. On November 27, 2013, we completed the transaction with Pertamina, resulting in proceeds of $1,652 million, which included a $175 million deposit received in December 2012. We recognized a pre-tax gain of $938 million, which is included in the "Income from discontinued operations" line on the consolidated income statement. At the time of disposition, the net carrying value of our Algerian assets was $714 million, which included $48 million of other current assets, $883 million of PP&E, $41 million of other current liabilities, $37 million of ARO, and $139 million of deferred taxes.
On December 20, 2012, we entered into agreements with affiliates of Oando PLC to sell our Nigeria business. The transaction originally included our upstream affiliates and Phillips (Brass) Limited, which owned a 17 percent interest in the Brass LNG Project. On July 30, 2014, we completed the sale of the upstream affiliates for $1,359 million, inclusive of $550 million deposits previously received. The deposits had been included in the "Other accruals" line on our consolidated balance sheet and in the "Other" line of cash flows
88
from investing activities on our consolidated statement of cash flows. The deposits received included $435 million in 2012, $15 million in 2013, and $100 million in 2014. At closing we also received a $33 million short-term promissory note. We recognized a before-tax gain of $1,052 million, which is included in the "Income from discontinued operations" line on the consolidated income statement. At the time of disposition, the net carrying value of the upstream assets was $307 million, which included $233 million of other current assets, $1,211 million of PP&E, $298 million of other current liabilities, $14 million of ARO, and $825 million of deferred taxes.
In the first quarter of 2014, we and Oando agreed to terminate the sales agreement for Phillips (Brass) Limited. In July 2014 we transferred our interest in the Brass LNG Project to the remaining shareholders in Brass LNG Limited. The financial impact of the transfer was recorded in the second quarter of 2014 and did not have a material effect on our consolidated financial statements.
At December 31, 2013, we classified $7 million of loans and advances to related parties in the "Accounts and notes receivable-related parties" line and $1,215 million of noncurrent assets in the "Prepaid expenses and other current assets" line of our consolidated balance sheet. In addition, we classified $765 million of noncurrent deferred income taxes in the "Accrued income and other taxes" line and $14 million of ARO in the "Other accruals" line of our consolidated balance sheet. The carrying amounts of the major classes of assets and liabilities associated with the Disposition Group as of December 31, 2013, were as follows:
| Millions of Dollars | ||||
Assets | ||||
Accounts and notes receivable | $ | 376 | ||
Inventories | 9 | |||
Prepaid expenses and other current assets | 72 | |||
| ||||
Total current assets of discontinued operations | 457 | |||
Investments and long-term receivables | 60 | |||
Loans and advances-related parties | 7 | |||
Net properties, plants and equipment | 1,154 | |||
Other assets | 1 | |||
| ||||
Total assets of discontinued operations | $ | 1,679 | ||
| ||||
Liabilities | ||||
Accounts payable | $ | 419 | ||
Accrued income and other taxes | 72 | |||
| ||||
Total current liabilities of discontinued operations | 491 | |||
Asset retirement obligations and accrued environmental costs | 14 | |||
Deferred income taxes | 765 | |||
| ||||
Total liabilities of discontinued operations | $ | 1,270 | ||
| ||||
Sales and other operating revenues and income (loss) from discontinued operations related to the Disposition Group during 2014, 2013 and 2012 were as follows:
| Millions of Dollars | ||||||||||||
| 2014 | 2013 | 2012 | ||||||||||
|
| |||||||||||
Sales and other operating revenues from discontinued operations | $ | 480 | 1,185 | 1,369 | ||||||||
| ||||||||||||
Income (loss) from discontinued operations before-tax | $ | 1,147 | 1,461 | (6) | ||||||||
Income tax expense | 16 | 283 | 211 | |||||||||
| ||||||||||||
Income (loss) from discontinued operations | $ | 1,131 | 1,178 | (217) | ||||||||
| ||||||||||||
89
Note 3-Variable Interest Entities (VIEs)
We hold variable interests in VIEs that have not been consolidated because we are not considered the primary beneficiary. Information on our significant VIEs follows:
Freeport LNG Development, L.P. (Freeport LNG)
Through November 2014 we had an agreement with Freeport LNG to participate in a liquefied natural gas (LNG) receiving terminal in Quintana, Texas. We have no ownership in Freeport LNG; however, we own a 50 percent interest in Freeport LNG GP, Inc. (Freeport GP), which serves as the general partner managing the venture. We entered into a credit agreement with Freeport LNG, whereby we agreed to provide loan financing for the construction of the terminal. We also entered into a long-term agreement with Freeport LNG to use 0.9 billion cubic feet per day of regasification capacity, which expires in 2033. When the terminal became operational in June 2008, we began making payments under the terminal use agreement. Freeport LNG began making loan repayments in September 2008.
In July 2013 we reached an agreement with Freeport LNG to terminate our long-term agreement at the Freeport LNG Terminal, subject to Freeport LNG obtaining regulatory approval and project financing for an LNG liquefaction and export facility in Texas, in which we are not a participant. These conditions were satisfied in the fourth quarter of 2014 and we paid Freeport LNG a termination fee of $522 million. Freeport LNG repaid the outstanding $454 million ConocoPhillips loan used by Freeport LNG to partially fund the original construction of the terminal. The payment made to Freeport LNG to terminate our long-term agreement is included in cash flows from operating activities on our consolidated statement of cash flows, while the receipt of the funds from Freeport LNG to repay the outstanding loan is included in cash flows from investing activities. These transactions, plus miscellaneous items, including the disposal of our 50 percent interest in Freeport GP, resulted in a one-time net cash outflow of $63 million for us. In addition, we recognized an after-tax charge to earnings of $540 million in the fourth quarter of 2014, and our terminal regasification capacity has been reduced from 0.9 billion cubic feet per day to 0.4 billion cubic feet per day, until July 1, 2016, at which time it will be reduced to zero.
Freeport LNG is a VIE because the limited partners of Freeport LNG do not have any substantive decision making ability. Since we do not have the unilateral power to direct the key activities which most significantly impact its economic performance, we are not the primary beneficiary of Freeport LNG. These key activities primarily involve or relate to operating and maintaining the terminal.
Australia Pacific LNG Pty Ltd (APLNG)
APLNG is considered a VIE, as it has entered into certain contractual arrangements that provide it with additional forms of subordinated financial support. We are not the primary beneficiary of APLNG because we share with Origin Energy and China Petrochemical Corporation (Sinopec) the power to direct the key activities of APLNG that most significantly impact its economic performance, which involve activities related to the production and commercialization of coalbed methane, as well as LNG processing and export marketing. As a result, we do not consolidate APLNG, and it is accounted for as an equity method investment.
As of December 31, 2014, we have not provided any financial support to APLNG other than amounts previously contractually required. Unless we elect otherwise, we have no requirement to provide liquidity or purchase the assets of APLNG. See Note 6-Investments, Loans and Long-Term Receivables, and Note 11-Guarantees, for additional information.
90
Note 4-Inventories
Inventories at December 31 were:
| Millions of Dollars | ||||||||
| 2014 | 2013 | |||||||
|
| |||||||
Crude oil and natural gas | $ | 538 | 452 | |||||
Materials, supplies and other | 793 | 742 | ||||||
| ||||||||
| $ | 1,331 | 1,194 | ||||||
| ||||||||
Inventories valued on the LIFO basis totaled $440 million and $343 million at December 31, 2014 and 2013, respectively. The estimated excess of current replacement cost over LIFO cost of inventories was approximately $6 million at December 31, 2014, and $160 million at December 31, 2013. In 2014 liquidation of LIFO inventory values decreased net income from continuing operations by $2 million.
Note 5-Assets Held for Sale or Sold
Assets Sold
All gains or losses are reported before-tax and are included net in the "Gain on dispositions" line on the consolidated income statement.
2014
For information on the sale of our Nigeria business, which is included in the "Income from discontinued operations" line on the consolidated income statement, see Note 2-Discontinued Operations.
2013
In March 2013 we sold the majority of our producing zones in the Cedar Creek Anticline for $994 million and recognized a loss on disposition of $43 million. At the time of the disposition, the carrying value of our interest, which was included in the Lower 48 segment, was $1,037 million, which included primarily $1,066 million of PP&E and $28 million of ARO.
In June 2013 we sold a portion of our working interests in the Browse and Canning basins for $402 million. Because we retain a working interest in the unproved properties, proceeds were treated as a reduction of the carrying value of PP&E with no gain or loss on disposition recognized. Prior to the partial disposition, the carrying value of the PP&E associated with our interests, included in our Asia Pacific and Middle East segment, was $486 million.
In August 2013 we sold our interest in the Clyden undeveloped oil sands leasehold for $724 million and recognized a gain on disposition of $614 million. At the time of the disposition, the carrying value of our interest in Clyden, which was included in the Canada segment, was $110 million and was primarily classified as PP&E.
In August 2013 we also sold our 39 percent interest in Phoenix Park Gas Processors Limited for $593 million and recognized a gain on disposition of $417 million. At the time of the disposition, the carrying value of our equity investment in Phoenix Park, which was included in our Other International segment, was $176 million.
For information on the Kashagan and Algeria sales, which are included in the "Income from discontinued operations" line on the consolidated income statement, see Note 2-Discontinued Operations.
2012
In March 2012 we sold our Vietnam business for $1,095 million and recognized a gain on disposition of $931 million. At the time of the disposition, the net carrying value of the business, which was included in the Asia Pacific and Middle East segment, was approximately $164 million, which included $352 million of PP&E, $69 million of ARO and $145 million of deferred income taxes.
91
In April 2012 we sold our interest in the Statfjord Field and associated satellites, all of which are located in the North Sea, for $228 million and recognized a gain of $429 million. At the time of disposition, the carrying value of our interest, which was included in the Europe segment, was negative $201 million, which included $205 million of PP&E and $445 million of ARO.
In May 2012 we sold our interest in the North Sea Alba Field for $220 million, and recognized a gain of $155 million. At the time of disposition, the carrying value of our interest, which was included in the Europe segment, was $65 million, which included $160 million of PP&E and $86 million of ARO.
In August 2012 we sold our 30 percent interest in Naryanmarneftegaz (NMNG) and certain related assets for $450 million, and recognized a gain of $206 million. At the time of the disposition, the carrying value of our equity investment in NMNG, which was included in the Other International segment, was $244 million.
Note 6-Investments, Loans and Long-Term Receivables
Components of investments, loans and long-term receivables at December 31 were:
| Millions of Dollars | ||||||||
| 2014 | 2013 | |||||||
|
| |||||||
Equity investments | $ | 23,426 | 22,980 | |||||
Loans and advances-related parties | 804 | 1,357 | ||||||
Long-term receivables | 444 | 470 | ||||||
Other investments | 465 | 457 | ||||||
| ||||||||
| $ | 25,139 | 25,264 | ||||||
| ||||||||
Equity Investments
Affiliated companies in which we had a significant equity investment at December 31, 2014, included:
| • | APLNG-37.5 percent owned joint venture with Origin Energy (37.5 percent) and Sinopec (25 percent)-to develop coalbed methane production from the Bowen and Surat basins in Queensland, Australia, as well as process and export LNG. |
| • | FCCL Partnership-50 percent owned business venture with Cenovus Energy Inc.-produces bitumen in the Athabasca oil sands in northeastern Alberta and sells the bitumen blend. |
| • | Qatar Liquefied Gas Company Limited (3) (QG3)-30 percent owned joint venture with affiliates of Qatar Petroleum (68.5 percent) and Mitsui & Co., Ltd. (1.5 percent)-produces and liquefies natural gas from Qatar's North Field, as well as exports LNG. |
Summarized 100 percent earnings information for equity method investments in affiliated companies, combined, was as follows (information includes equity investments disposed of in connection with the separation of the Downstream business until the date of the separation):
| Millions of Dollars | ||||||||||||
| 2014 | 2013 | 2012 | ||||||||||
|
| |||||||||||
Revenues | $ | 19,243 | 18,035 | 17,903 | ||||||||
Income before income taxes | 6,746 | 6,384 | 5,986 | |||||||||
Net income | 6,630 | 6,125 | 5,767 | |||||||||
| ||||||||||||
92
Summarized 100 percent balance sheet information for equity method investments in affiliated companies, combined, was as follows:
| Millions of Dollars | ||||||||
| 2014 | 2013 | |||||||
|
| |||||||
Current assets | $ | 4,512 | 9,073 | |||||
Noncurrent assets | 58,570 | 51,674 | ||||||
Current liabilities | 3,346 | 3,416 | ||||||
Noncurrent liabilities | 20,210 | 13,850 | ||||||
| ||||||||
Our share of income taxes incurred directly by an equity company is reported in equity in earnings of affiliates, and as such is not included in income taxes in our consolidated financial statements.
At December 31, 2014, retained earnings included $1,377 million related to the undistributed earnings of affiliated companies. Dividends received from affiliates were $2,648 million, $1,425 million and $1,351 million in 2014, 2013 and 2012, respectively.
APLNG
APLNG is focused on coalbed methane production from the Bowen and Surat basins in Queensland, Australia, and LNG processing and export sales. Our investment in APLNG gives us access to coalbed methane resources in Australia and enhances our LNG position with the expected creation of an additional LNG hub targeting the Asia Pacific markets. Origin Energy, an integrated Australian energy company, is the operator of APLNG's production and pipeline system, while we will operate the LNG facility.
In 2011 Sinopec subscribed for a 15 percent equity interest in APLNG, which diluted both our ownership interest and Origin's ownership interest to 42.5 percent. In July 2012 Sinopec subscribed to additional shares in APLNG, which increased its equity interest from 15 percent to 25 percent. As a result, on July 12, 2012, both our ownership interest and Origin's ownership interest diluted from 42.5 percent to 37.5 percent. We recorded a before- and after-tax loss of $133 million from the dilution in the third quarter of 2012. The book value of our investment in APLNG was reduced by $453 million, and we reduced the foreign currency translation adjustment associated with our investment by $320 million.
In addition, APLNG executed project financing agreements for an $8.5 billion project finance facility during the third quarter of 2012. The $8.5 billion project finance facility is composed of financing agreements executed by APLNG with the Export-Import Bank of the United States for approximately $2.9 billion, the Export-Import Bank of China for approximately $2.7 billion, and a syndicate of Australian and international commercial banks for approximately $2.9 billion. At December 31, 2014, $8.1 billion had been drawn from the facility. In connection with the execution of the project financing, we provided a completion guarantee for our pro-rata share of the project finance facility which will be released upon meeting certain completion milestones. See Note 11-Guarantees, for additional information.
APLNG is considered a VIE, as it has entered into certain contractual arrangements that provide it with additional forms of subordinated financial support. See Note 3-Variable Interest Entities (VIEs) for additional information.
At December 31, 2014, the book value of our equity method investment in APLNG was $12,159 million, which includes $121 million of cumulative translation effects due to a strengthening Australian dollar relative to the U.S. dollar over time. The historical cost basis of our 37.5 percent share of net assets on the books of APLNG under U.S. generally accepted accounting principles was $7,101 million, resulting in a basis difference of $5,058 million on our books. The amortizable portion of the basis difference, $3,662 million associated with PP&E, has been allocated on a relative fair value basis to individual exploration and production license areas owned by APLNG, most of which are not currently in production. Any future additional payments are expected to be allocated in a similar manner. Each exploration license area will periodically be reviewed for any indicators of potential impairment, which, if required, would result in
93
acceleration of basis difference amortization. As the joint venture produces natural gas from each license, we amortize the basis difference allocated to that license using the unit-of-production method. Included in net income attributable to ConocoPhillips for 2014, 2013 and 2012 was after-tax expense of $24 million, $16 million and $19 million, respectively, representing the amortization of this basis difference on currently producing licenses.
FCCL
FCCL Partnership, a Canadian upstream 50/50 general partnership with Cenovus Energy Inc., produces bitumen in the Athabasca oil sands in northeastern Alberta and sells the bitumen blend. We account for our investment in FCCL under the equity method of accounting, with the operating results of our investment in FCCL converted to reflect the use of the successful efforts method of accounting for oil and gas exploration and development activities.
At December 31, 2014, the book value of our investment in FCCL was $9,484 million. FCCL's operating assets consist of the Foster Creek and Christina Lake steam-assisted gravity drainage bitumen projects, both located in the eastern flank of the Athabasca oil sands in northeastern Alberta. Cenovus is the operator and managing partner of FCCL.
We were obligated to contribute $7.5 billion, plus accrued interest, to FCCL over a 10-year period that began in 2007. In December 2013 we repaid the remaining balance of the obligation, which totaled $2,810 million and is included in the "Other" line in the financing activities section of our consolidated statement of cash flows. Interest accrued at a fixed annual rate of 5.3 percent on the unpaid principal balance. Fifty percent of the quarterly interest payment is reflected as a capital contribution and is included in the "Capital expenditures and investments" line on our consolidated statement of cash flows. In the first quarter of 2014, we received a $1.3 billion distribution from FCCL, which is included in the "Undistributed equity earnings" line on our consolidated statement of cash flows.
QG3
QG3 is a joint venture that owns an integrated large-scale LNG project located in Qatar. We provided project financing, with a current outstanding balance of $909 million as described below under "Loans and Long-Term Receivables." At December 31, 2014, the book value of our equity method investment in QG3, excluding the project financing, was $966 million. We have terminal and pipeline use agreements with Golden Pass LNG Terminal and affiliated Golden Pass Pipeline near Sabine Pass, Texas, in which we have a 12.4 percent interest, intended to provide us with terminal and pipeline capacity for the receipt, storage and regasification of LNG purchased from QG3. However, currently the LNG from QG3 is being sold to markets outside of the United States.
Loans and Long-Term Receivables
As part of our normal ongoing business operations and consistent with industry practice, we enter into numerous agreements with other parties to pursue business opportunities. Included in such activity are loans and long-term receivables to certain affiliated and non-affiliated companies. Loans are recorded when cash is transferred or seller financing is provided to the affiliated or non-affiliated company pursuant to a loan agreement. The loan balance will increase as interest is earned on the outstanding loan balance and will decrease as interest and principal payments are received. Interest is earned at the loan agreement's stated interest rate. Loans and long-term receivables are assessed for impairment when events indicate the loan balance may not be fully recovered.
At December 31, 2014, significant loans to affiliated companies include $909 million in project financing to QG3. We own a 30 percent interest in QG3, for which we use the equity method of accounting. The other participants in the project are affiliates of Qatar Petroleum and Mitsui. QG3 secured project financing of $4.0 billion in December 2005, consisting of $1.3 billion of loans from export credit agencies (ECA), $1.5 billion from commercial banks, and $1.2 billion from ConocoPhillips. The ConocoPhillips loan facilities have substantially the same terms as the ECA and commercial bank facilities. On December 15, 2011, QG3 achieved financial completion and all project loan facilities became nonrecourse to the project participants. Semi-annual repayments began in January 2011 and will extend through July 2022.
94
In November 2014 we terminated our long-term agreement at the Freeport LNG Terminal. As a result, Freeport LNG repaid the outstanding ConocoPhillips loan. See Note 3-Variable Interest Entities (VIEs), for additional information.
The long-term portion of these loans is included in the "Loans and advances-related parties" line on our consolidated balance sheet, while the short-term portion is in "Accounts and notes receivable-related parties."
Note 7-Suspended Wells
The following table reflects the net changes in suspended exploratory well costs during 2014, 2013 and 2012:
| Millions of Dollars | ||||||||||||
| 2014 | 2013 | 2012 | ||||||||||
|
| |||||||||||
Beginning balance at January 1 | $ | 994 | 1,038 | 1,037 | ||||||||
Additions pending the determination of proved reserves | 478 | 466 | 185 | |||||||||
Reclassifications to proved properties | (9) | (29) | (144) | |||||||||
Sales of suspended well investment | (57) | (481) | (18) | |||||||||
Charged to dry hole expense | (107) | - | (22) | |||||||||
| ||||||||||||
Ending balance at December 31 | $ | 1,299 | 994 | * | 1,038 | ** | ||||||
| ||||||||||||
*Includes $57 million of assets held for sale in Nigeria.
**Includes $190 million of assets held for sale-$133 million in Kazakhstan and $57 million in Nigeria.
The following table provides an aging of suspended well balances at December 31:
| Millions of Dollars | ||||||||||||
| 2014 | 2013 | 2012 | ||||||||||
|
| |||||||||||
Exploratory well costs capitalized for a period of one year or less | $ | 466 | 437 | 186 | ||||||||
Exploratory well costs capitalized for a period greater than one year | 833 | 557 | 852 | |||||||||
| ||||||||||||
Ending balance | $ | 1,299 | 994 | * | 1,038 | ** | ||||||
| ||||||||||||
Number of projects with exploratory well costs capitalized for a period greater than one year | 30 | 29 | 35 | |||||||||
| ||||||||||||
*Includes $57 million of assets held for sale in Nigeria.
**Includes $190 million of assets held for sale-$133 million in Kazakhstan and $57 million in Nigeria.
95
The following table provides a further aging of those exploratory well costs that have been capitalized for more than one year since the completion of drilling as of December 31, 2014:
| Millions of Dollars | ||||||||||||||||
| Suspended Since | ||||||||||||||||
| Total | 2011–2013 | 2008–2010 | 2002–2007 | |||||||||||||
|
| |||||||||||||||
Alpine Satellite-Alaska (2) | $ | 23 | - | - | 23 | |||||||||||
Browse Basin-Australia (2) | 112 | 100 | 12 | - | ||||||||||||
Caldita/Barossa-Australia (1) | 77 | - | - | 77 | ||||||||||||
Greater Clair-UK (1) | 51 | 51 | - | - | ||||||||||||
Fiord West-Alaska (2) | 16 | - | 16 | - | ||||||||||||
Gila-Lower 48 (1) | 51 | 51 | - | - | ||||||||||||
Kamunsu East-Malaysia (2) | 19 | 19 | - | - | ||||||||||||
Limbayong-Malaysia (1) | 24 | 24 | - | - | ||||||||||||
Muskwa-Canada (1) | 49 | 49 | - | - | ||||||||||||
NPR-A-Alaska (2) | 65 | 42 | 23 | - | ||||||||||||
Pisagan-Malaysia (2) | 10 | - | - | 10 | ||||||||||||
Saleski-Canada | 15 | - | 15 | - | ||||||||||||
Shenandoah-Lower 48 (1) | 94 | 51 | 43 | - | ||||||||||||
Sunrise 3-Australia (2) | 13 | - | 13 | - | ||||||||||||
Surmont 3 and beyond-Canada (1) | 89 | 64 | 7 | 18 | ||||||||||||
Thornbury-Canada (1) | 18 | - | 18 | - | ||||||||||||
Tiber-Lower 48 (1) | 40 | - | 40 | - | ||||||||||||
Ubah-Malaysia (2) | 35 | - | 35 | - | ||||||||||||
Other of $10 million or less each (1)(2) | 32 | 9 | 4 | 19 | ||||||||||||
| ||||||||||||||||
Total | $ | 833 | 460 | 226 | 147 | |||||||||||
| ||||||||||||||||
| (1) | Additional appraisal wells planned. |
| (2) | Appraisal drilling complete; costs being incurred to assess development. |
Note 8-Impairments
During 2014, 2013 and 2012, we recognized the following before-tax impairment charges:
| Millions of Dollars | ||||||||||||
| 2014 | 2013 | 2012 | ||||||||||
|
| |||||||||||
Alaska | $ | 59 | 3 | 3 | ||||||||
Lower 48 | 208 | 2 | 192 | |||||||||
Canada | 38 | 216 | 262 | |||||||||
Europe | 541 | 301 | 211 | |||||||||
Asia Pacific and Middle East | 7 | 3 | 4 | |||||||||
Corporate | 3 | 4 | 8 | |||||||||
| ||||||||||||
| $ | 856 | 529 | 680 | |||||||||
| ||||||||||||
2014
In Alaska we recorded impairments of $59 million, primarily due to a cancelled project.
In our Lower 48 segment, we recorded impairments of $208 million, primarily as a result of reduced volume forecasts for an onshore field, as well as an LNG-related pipeline. We also recorded unproved property impairments of $239 million, primarily due to decisions to discontinue further testing of the undeveloped leaseholds, which were included in the "Exploration Expenses" line on our consolidated income statement.
96
We recorded impairments of $38 million in our Canada segment, primarily due to reduced volume forecasts and lower natural gas prices. Additionally, we decided not to pursue future development of the Amauligak discovery at this time. Accordingly, we recorded a $145 million property impairment for the carrying value of capitalized undeveloped leasehold costs associated with our Amauligak, Arctic Islands and other Beaufort properties located offshore Canada, which is included in the "Exploration Expenses" line on our consolidated income statement.
In Europe we recorded impairments of $541 million, mainly due to reduced volume forecasts, increases in the ARO and lower natural gas prices for properties in the United Kingdom which are nearing the end of their useful lives.
2013
We recorded property impairments of $216 million in our Canada segment, mainly as a result of lower natural gas price assumptions, reduced volume forecasts and higher costs.
In Europe we recorded impairments of $301 million, primarily due to ARO revisions for properties in the United Kingdom which are nearing the end of their useful lives or have ceased production.
2012
We recorded a $192 million property impairment in the Lower 48 segment related to the planned disposition of the majority of our producing zones in the Cedar Creek Anticline, located in southwestern North Dakota and eastern Montana.
The Canada segment included a $213 million property impairment for the carrying value of capitalized project development costs associated with our Mackenzie Gas Project. Advancement of the project was suspended indefinitely in the first quarter of 2012 due to a continued decline in market conditions and the lack of acceptable commercial terms. We also recorded a $481 million impairment for the undeveloped leasehold costs associated with the project, which was included in the "Exploration expenses" line on our consolidated income statement. Additionally, we recorded impairments on various producing and non-producing properties.
In Europe we recorded impairments of $211 million, mainly related to ARO revisions for properties which have ceased production or are nearing the end of their useful lives.
Note 9-Asset Retirement Obligations and Accrued Environmental Costs
Asset retirement obligations and accrued environmental costs at December 31 were:
| Millions of Dollars | ||||||||
| 2014 | 2013 | |||||||
|
| |||||||
Asset retirement obligations | $ | 10,939 | 10,076 | |||||
Accrued environmental costs | 344 | 348 | ||||||
| ||||||||
Total asset retirement obligations and accrued environmental costs | 11,283 | 10,424 | ||||||
Asset retirement obligations and accrued environmental costs due within one year* | (636 | ) | (541) | |||||
| ||||||||
Long-term asset retirement obligations and accrued environmental costs | $ | 10,647 | 9,883 | |||||
| ||||||||
| * | Classified as a current liability on the balance sheet under "Other accruals" and includes $14 million of liabilities associated with assets held for sale at December 31, 2013. |
97
Asset Retirement Obligations
We record the fair value of a liability for an asset retirement obligation when it is incurred (typically when the asset is installed at the production location). When the liability is initially recorded, we capitalize the associated asset retirement cost by increasing the carrying amount of the related PP&E. If, in subsequent periods, our estimate of this liability changes, we will record an adjustment to both the liability and PP&E. Over time, the liability increases for the change in its present value, while the capitalized cost depreciates over the useful life of the related asset.
We have numerous asset retirement obligations we are required to perform under law or contract once an asset is permanently taken out of service. Most of these obligations are not expected to be paid until several years, or decades, in the future and will be funded from general company resources at the time of removal. Our largest individual obligations involve plugging and abandonment of wells and removal and disposal of offshore oil and gas platforms around the world, as well as oil and gas production facilities and pipelines in Alaska.
During 2014 and 2013, our overall asset retirement obligation changed as follows:
| Millions of Dollars | ||||||||
| 2014 | 2013 | |||||||
|
| |||||||
Balance at January 1 | $ | 10,076 | 9,164 | |||||
Accretion of discount | 479 | 434 | ||||||
New obligations | 368 | 410 | ||||||
Changes in estimates of existing obligations | 1,175 | 707 | ||||||
Spending on existing obligations | (365) | (298) | ||||||
Property dispositions | (20) | (163) | ||||||
Foreign currency translation | (774) | (178) | ||||||
| ||||||||
Balance at December 31 | $ | 10,939 | 10,076 | |||||
| ||||||||
Accrued Environmental Costs
Total accrued environmental costs at December 31, 2014 and 2013, were $344 million and $348 million, respectively.
We had accrued environmental costs of $250 million and $271 million at December 31, 2014 and 2013, respectively, related to remediation activities in the United States and Canada. We had also accrued in Corporate and Other $79 million and $60 million of environmental costs associated with sites no longer in operation at December 31, 2014 and 2013, respectively. In addition, $15 million and $17 million were included at both December 31, 2014 and 2013, respectively, where the Company has been named a potentially responsible party under the Federal Comprehensive Environmental Response, Compensation and Liability Act, or similar state laws. Accrued environmental liabilities are expected to be paid over periods extending up to 30 years.
Expected expenditures for environmental obligations acquired in various business combinations are discounted using a weighted-average 5 percent discount factor, resulting in an accrued balance for acquired environmental liabilities of $141 million at December 31, 2014. The expected future undiscounted payments related to the portion of the accrued environmental costs that have been discounted are: $20 million in 2015, $16 million in 2016, $12 million in 2017, $3 million in 2018, $2 million in 2019, and $117 million for all future years after 2019.
98
Note 10-Debt
Long-term debt at December 31 was:
| Millions of Dollars | ||||||||
| 2014 | 2013 | |||||||
|
| |||||||
9.125% Debentures due 2021 | $ | 150 | 150 | |||||
8.20% Debentures due 2025 | 150 | 150 | ||||||
8.125% Notes due 2030 | 600 | 600 | ||||||
7.9% Debentures due 2047 | 100 | 100 | ||||||
7.8% Debentures due 2027 | 300 | 300 | ||||||
7.65% Debentures due 2023 | 88 | 88 | ||||||
7.40% Notes due 2031 | 500 | 500 | ||||||
7.375% Debentures due 2029 | 92 | 92 | ||||||
7.25% Notes due 2031 | 500 | 500 | ||||||
7.20% Notes due 2031 | 575 | 575 | ||||||
7% Debentures due 2029 | 200 | 200 | ||||||
6.95% Notes due 2029 | 1,549 | 1,549 | ||||||
6.875% Debentures due 2026 | 67 | 67 | ||||||
6.65% Debentures due 2018 | 297 | 297 | ||||||
6.50% Notes due 2039 | 2,250 | 2,250 | ||||||
6.50% Notes due 2039 | 500 | 500 | ||||||
6.00% Notes due 2020 | 1,000 | 1,000 | ||||||
5.951% Notes due 2037 | 645 | 645 | ||||||
5.95% Notes due 2036 | 500 | 500 | ||||||
5.90% Notes due 2032 | 505 | 505 | ||||||
5.90% Notes due 2038 | 600 | 600 | ||||||
5.75% Notes due 2019 | 2,250 | 2,250 | ||||||
5.625% Notes due 2016 | 1,250 | 1,250 | ||||||
5.20% Notes due 2018 | 500 | 500 | ||||||
4.75% Notes due 2014 | - | 400 | ||||||
4.60% Notes due 2015 | - | 1,500 | ||||||
4.30% Notes due 2044 | 750 | - | ||||||
4.15% Notes due 2034 | 500 | - | ||||||
3.35% Notes due 2024 | 1,000 | - | ||||||
2.875% Notes due 2021 | 750 | - | ||||||
2.4% Notes due 2022 | 1,000 | 1,000 | ||||||
1.05% Notes due 2017 | 1,000 | 1,000 | ||||||
Commercial paper at 0.14% – 0.21% during 2014 and 0.20% – 0.25% during 2013 | 860 | 961 | ||||||
Industrial Development Bonds due 2014 through 2038 at 0.02% – 0.13% during 2014 and 0.04% – 0.25% during 2013 | 18 | 18 | ||||||
Marine Terminal Revenue Refunding Bonds due 2031 at 0.02% – 0.15% during 2014 and 0.04% – 0.26% during 2013 | 265 | 265 | ||||||
Other | 24 | 24 | ||||||
| ||||||||
Debt at face value | 21,335 | 20,336 | ||||||
Capitalized leases | 858 | 922 | ||||||
Unamortized hedge – 4.6% Notes due 2015 | - | 11 | ||||||
Net unamortized premiums and discounts | 372 | 393 | ||||||
| ||||||||
Total debt | 22,565 | 21,662 | ||||||
Short-term debt | (182) | (589) | ||||||
| ||||||||
Long-term debt | $ | 22,383 | 21,073 | |||||
| ||||||||
99
Maturities of long-term borrowings, inclusive of net unamortized premiums and discounts, in 2015 through 2019 are: $182 million, $1,337 million, $1,067 million, $867 million and $3,078 million, respectively. At December 31, 2014, we classified $753 million of short-term debt as long-term debt, based on our ability and intent to refinance the obligation on a long-term basis under our revolving credit facility.
During 2014 we repaid the $400 million 4.75% Notes due 2014, and in November 2014 we redeemed the outstanding $1.5 billion of 4.60% Notes due January 2015.
In November 2014 we issued notes for general corporate purposes consisting of:
| • | The $750 million of 2.875% Notes due 2021. |
| • | The $1,000 million of 3.35% Notes due 2024. |
| • | The $500 million of 4.15% Notes due 2034. |
| • | The $750 million of 4.30% Notes due 2044. |
In June 2014 we refinanced our revolving credit facility from a total of $7.5 billion to $7.0 billion, with a new expiration date of June 2019. Our revolving credit facility may be used for direct bank borrowings, for the issuance of letters of credit totaling up to $500 million, or as support for our commercial paper programs. The revolving credit facility is broadly syndicated among financial institutions and does not contain any material adverse change provisions or any covenants requiring maintenance of specified financial ratios or credit ratings. The facility agreement contains a cross-default provision relating to the failure to pay principal or interest on other debt obligations of $200 million or more by ConocoPhillips, or any of its consolidated subsidiaries.
Credit facility borrowings may bear interest at a margin above rates offered by certain designated banks in the London interbank market as administered by ICE Benchmark Administration or at a margin above the overnight federal funds rate or prime rates offered by certain designated banks in the United States. The agreement calls for commitment fees on available, but unused, amounts. The agreement also contains early termination rights if our current directors or their approved successors cease to be a majority of the Board of Directors.
We have two commercial paper programs supported by our $7.0 billion revolving credit facility: the ConocoPhillips $6.1 billion program, primarily a funding source for short-term working capital needs, and the ConocoPhillips Qatar Funding Ltd. $900 million program, which is used to fund commitments relating to QG3. Commercial paper maturities are generally limited to 90 days.
At both December 31, 2014 and 2013, we had no direct outstanding borrowings under the revolving credit facility, with no letters of credit as of December 31, 2014. In addition, under the ConocoPhillips Qatar Funding Ltd. commercial paper program, there was $860 million of commercial paper outstanding at December 31, 2014, compared with $961 million at December 31, 2013. Since we had $860 million of commercial paper outstanding and had issued no letters of credit, we had access to $6.1 billion in borrowing capacity under our revolving credit facility at December 31, 2014.
During 2013 a lease of a semi-submersible floating production system (FPS) commenced for the Gumusut development, located in Malaysia, in which we are a co-venturer. The FPS lease provides for an initial noncancelable term of 15 years, a subsequent 5-year cancelable term with no required lease payments, and an additional 5-year term with terms and conditions to be agreed at a later date. The lease has no ongoing purchase options or escalation clauses. Adjustments to provisional contingent rental payments may occur due to the finalization of actual commissioning costs. The lease does not impose any significant restrictions concerning dividends, debt or further leasing activities.
A capital lease asset and capital lease obligation were recognized for our proportionate interest in the FPS of $906 million, based on the present value of the future minimum lease payments using our pre-tax incremental borrowing rate of 3.58 percent for debt with similar terms. Unitization of the Gumusut development with
100
Brunei was recorded during the fourth quarter of 2014 and reduced our proportionate interest in the FPS from 33 percent to 29 percent. The net carrying value of the capital lease asset was approximately $802 million and $906 million as of December 31, 2014, and December 31, 2013 respectively. Following the startup of the FPS, which occurred in October 2014, the capital lease asset is being depreciated over a period consistent with the estimated proved reserves of Gumusut using the unit-of-production method with the associated depreciation included in the "Depreciation, depletion and amortization" line on our consolidated income statement. As of December 31, 2014, accumulated depreciation of the capital lease asset amounted to approximately $20 million.
At December 31, 2014, future minimum payments due under capital leases were:
| Millions of Dollars | ||||
|
| |||
2015 | $ | 106 | ||
2016 | 76 | |||
2017 | 76 | |||
2018 | 76 | |||
2019 | 76 | |||
Remaining years | 722 | |||
| ||||
Total | 1,132 | |||
Less: portion representing imputed interest | (274) | |||
| ||||
Capital lease obligations | $ | 858 | ||
| ||||
Note 11-Guarantees
At December 31, 2014, we were liable for certain contingent obligations under various contractual arrangements as described below. We recognize a liability at inception for the fair value of our obligation as a guarantor for newly issued or modified guarantees. Unless the carrying amount of the liability is noted below, we have not recognized a liability either because the guarantees were issued prior to December 31, 2002, or because the fair value of the obligation is immaterial. In addition, unless otherwise stated, we are not currently performing with any significance under the guarantee and expect future performance to be either immaterial or have only a remote chance of occurrence.
APLNG Guarantees
At December 31, 2014, we have outstanding multiple guarantees in connection with our 37.5 percent ownership interest in APLNG. The following is a description of the guarantees with values calculated utilizing December 2014 exchange rates:
| • | We have guaranteed APLNG's performance with regard to a construction contract executed in connection with APLNG's issuance of the Train 1 and Train 2 Notices to Proceed. We estimate the remaining term of this guarantee is two years. Our maximum potential amount of future payments related to this guarantee is approximately $90 million and would become payable if APLNG cancels the applicable construction contract and does not perform with respect to the amounts owed to the contractor. |
| • | We have issued a construction completion guarantee related to the third-party project financing secured by APLNG. Our maximum potential amount of future payments under the guarantee is estimated to be $3.2 billion, which could be payable if the full debt financing capacity is utilized and completion of the project is not achieved. Our guarantee of the project financing will be released upon meeting certain completion tests with milestones, which we estimate should occur beginning in 2016. Our maximum exposure at December 31, 2014, is $3.1 billion based upon our pro-rata share of the facility used at that date. At December 31, 2014, the carrying value of this guarantee is approximately $114 million. |
101
| • | In conjunction with our original purchase of an ownership interest in APLNG from Origin Energy in October 2008, we agreed to guarantee an existing obligation of APLNG to deliver natural gas under several sales agreements with remaining terms of 1 to 27 years. Our maximum potential amount of future payments, or cost of volume delivery, under these guarantees is estimated to be $1.2 billion ($2.2 billion in the event of intentional or reckless breach) and would become payable if APLNG fails to meet its obligations under these agreements and the obligations cannot otherwise be mitigated. Future payments are considered unlikely, as the payments, or cost of volume delivery, would only be triggered if APLNG does not have enough natural gas to meet these sales commitments and if the co-venturers do not make necessary equity contributions into APLNG. |
| • | We have guaranteed the performance of APLNG with regard to certain other contracts executed in connection with the project's continued development. The guarantees have remaining terms of up to 31 years or the life of the venture. Our maximum potential amount of future payments related to these guarantees is approximately $190 million and would become payable if APLNG does not perform. |
Other Guarantees
We have other guarantees with maximum future potential payment amounts totaling approximately $300 million, which consist primarily of guarantees of the residual value of leased corporate aircraft, guarantees to fund the short-term cash liquidity deficit of two joint ventures, a guarantee for our portion of a joint venture's debt obligations and a guarantee of minimum charter revenue for an LNG vessel. These guarantees have remaining terms of up to 9 years or the life of the venture and would become payable if, upon sale, certain asset values are lower than guaranteed amounts, business conditions decline at guaranteed entities, or as a result of non-performance of contractual terms by guaranteed parties.
Indemnifications
Over the years, we have entered into agreements to sell ownership interests in certain corporations, joint ventures and assets that gave rise to qualifying indemnifications. These agreements include indemnifications for taxes, environmental liabilities, employee claims, and litigation. The terms of these indemnifications vary greatly. The majority of these indemnifications are related to environmental issues, the term is generally indefinite and the maximum amount of future payments is generally unlimited. The carrying amount recorded for these indemnifications at December 31, 2014, was approximately $100 million. We amortize the indemnification liability over the relevant time period, if one exists, based on the facts and circumstances surrounding each type of indemnity. In cases where the indemnification term is indefinite, we will reverse the liability when we have information the liability is essentially relieved or amortize the liability over an appropriate time period as the fair value of our indemnification exposure declines. Although it is reasonably possible future payments may exceed amounts recorded, due to the nature of the indemnifications, it is not possible to make a reasonable estimate of the maximum potential amount of future payments. Included in the recorded carrying amount at December 31, 2014 were approximately $50 million of environmental accruals for known contamination that are included in the "Asset retirement obligations and accrued environmental costs" line on our consolidated balance sheet. For additional information about environmental liabilities, see Note 12-Contingencies and Commitments.
On April 30, 2012, the separation of our Downstream business was completed, creating two independent energy companies: ConocoPhillips and Phillips 66. In connection with the separation, we entered into an Indemnification and Release Agreement, which provides for cross-indemnities between Phillips 66 and us and established procedures for handling claims subject to indemnification and related matters. We evaluated the impact of the indemnifications given and the Phillips 66 indemnifications received as of the separation date and concluded those fair values were immaterial.
102
Note 12-Contingencies and Commitments
A number of lawsuits involving a variety of claims arising in the ordinary course of business have been made against ConocoPhillips. We also may be required to remove or mitigate the effects on the environment of the placement, storage, disposal or release of certain chemical, mineral and petroleum substances at various active and inactive sites. We regularly assess the need for accounting recognition or disclosure of these contingencies. In the case of all known contingencies (other than those related to income taxes), we accrue a liability when the loss is probable and the amount is reasonably estimable. If a range of amounts can be reasonably estimated and no amount within the range is a better estimate than any other amount, then the minimum of the range is accrued. We do not reduce these liabilities for potential insurance or third-party recoveries. If applicable, we accrue receivables for probable insurance or other third-party recoveries. With respect to income tax-related contingencies, we use a cumulative probability-weighted loss accrual in cases where sustaining a tax position is less than certain. See Note 18-Income Taxes, for additional information about income tax-related contingencies.
Based on currently available information, we believe it is remote that future costs related to known contingent liability exposures will exceed current accruals by an amount that would have a material adverse impact on our consolidated financial statements. As we learn new facts concerning contingencies, we reassess our position both with respect to accrued liabilities and other potential exposures. Estimates particularly sensitive to future changes include contingent liabilities recorded for environmental remediation, tax and legal matters. Estimated future environmental remediation costs are subject to change due to such factors as the uncertain magnitude of cleanup costs, the unknown time and extent of such remedial actions that may be required, and the determination of our liability in proportion to that of other responsible parties. Estimated future costs related to tax and legal matters are subject to change as events evolve and as additional information becomes available during the administrative and litigation processes.
Environmental
We are subject to international, federal, state and local environmental laws and regulations. When we prepare our consolidated financial statements, we record accruals for environmental liabilities based on management's best estimates, using all information that is available at the time. We measure estimates and base liabilities on currently available facts, existing technology, and presently enacted laws and regulations, taking into account stakeholder and business considerations. When measuring environmental liabilities, we also consider our prior experience in remediation of contaminated sites, other companies' cleanup experience, and data released by the U.S. Environmental Protection Agency (EPA) or other organizations. We consider unasserted claims in our determination of environmental liabilities, and we accrue them in the period they are both probable and reasonably estimable.
Although liability of those potentially responsible for environmental remediation costs is generally joint and several for federal sites and frequently so for other sites, we are usually only one of many companies cited at a particular site. Due to the joint and several liabilities, we could be responsible for all cleanup costs related to any site at which we have been designated as a potentially responsible party. We have been successful to date in sharing cleanup costs with other financially sound companies. Many of the sites at which we are potentially responsible are still under investigation by the EPA or the agency concerned. Prior to actual cleanup, those potentially responsible normally assess the site conditions, apportion responsibility and determine the appropriate remediation. In some instances, we may have no liability or may attain a settlement of liability. Where it appears that other potentially responsible parties may be financially unable to bear their proportional share, we consider this inability in estimating our potential liability, and we adjust our accruals accordingly. As a result of various acquisitions in the past, we assumed certain environmental obligations. Some of these environmental obligations are mitigated by indemnifications made by others for our benefit, and some of the indemnifications are subject to dollar limits and time limits.
We are currently participating in environmental assessments and cleanups at numerous federal Superfund and comparable state and international sites. After an assessment of environmental exposures for cleanup and other costs, we make accruals on an undiscounted basis (except those acquired in a purchase business combination, which we record on a discounted basis) for planned investigation and remediation activities for
103
sites where it is probable future costs will be incurred and these costs can be reasonably estimated. We have not reduced these accruals for possible insurance recoveries. In the future, we may be involved in additional environmental assessments, cleanups and proceedings. See Note 9-Asset Retirement Obligations and Accrued Environmental Costs, for a summary of our accrued environmental liabilities.
Legal Proceedings
Our legal organization applies its knowledge, experience and professional judgment to the specific characteristics of our cases, employing a litigation management process to manage and monitor the legal proceedings against us. Our process facilitates the early evaluation and quantification of potential exposures in individual cases. This process also enables us to track those cases that have been scheduled for trial and/or mediation. Based on professional judgment and experience in using these litigation management tools and available information about current developments in all our cases, our legal organization regularly assesses the adequacy of current accruals and determines if adjustment of existing accruals, or establishment of new accruals, is required.
Other Contingencies
We have contingent liabilities resulting from throughput agreements with pipeline and processing companies not associated with financing arrangements. Under these agreements, we may be required to provide any such company with additional funds through advances and penalties for fees related to throughput capacity not utilized. In addition, at December 31, 2014, we had performance obligations secured by letters of credit of $802 million (issued as direct bank letters of credit) related to various purchase commitments for materials, supplies, commercial activities and services incident to the ordinary conduct of business.
In 2007 we announced we had been unable to reach agreement with respect to our migration to an empresa mixta structure mandated by the Venezuelan government's Nationalization Decree. As a result, Venezuela's national oil company, Petróleos de Venezuela S.A. (PDVSA), or its affiliates, directly assumed control over ConocoPhillips' interests in the Petrozuata and Hamaca heavy oil ventures and the offshore Corocoro development project. In response to this expropriation, we filed a request for international arbitration on November 2, 2007, with the World Bank's International Centre for Settlement of Investment Disputes (ICSID). An arbitration hearing was held before an ICSID tribunal during the summer of 2010. On September 3, 2013, an ICSID arbitration tribunal held that Venezuela unlawfully expropriated ConocoPhillips' significant oil investments in June 2007. A separate arbitration phase is currently proceeding to determine the damages owed to ConocoPhillips for Venezuela's actions. On October 10, 2014, we filed a separate arbitration under the rules of the International Chamber of Commerce against PDVSA for contractual compensation related to the Petrozuata and Hamaca heavy crude oil projects.
In 2008 Burlington Resources, Inc., a wholly owned subsidiary of ConocoPhillips, initiated arbitration before ICSID against The Republic of Ecuador, as a result of the newly enacted Windfall Profits Tax Law and government-mandated renegotiation of our production sharing contracts. Despite a restraining order issued by the ICSID tribunal, Ecuador confiscated the crude oil production of Burlington and its co-venturer and sold the seized crude oil. In 2009 Ecuador took over operations in Blocks 7 and 21, fully expropriating our assets. In June 2010 the ICSID tribunal concluded it has jurisdiction to hear the expropriation claim. On April 24, 2012, Ecuador filed supplemental counterclaims asserting environmental damages, which we believe are not material. The ICSID tribunal issued a decision on liability on December 14, 2012, in favor of Burlington, finding that Ecuador's seizure of Blocks 7 and 21 was an unlawful expropriation in violation of the Ecuador-U.S. Bilateral Investment Treaty. An additional arbitration phase is now proceeding to determine the damages owed to ConocoPhillips for Ecuador's actions and to address Ecuador's counterclaims.
ConocoPhillips served a Notice of Arbitration on the Timor-Leste Minister of Finance in October 2012 for outstanding disputes related to a series of tax assessments. As of December 2014 ConocoPhillips paid, under protest, tax assessments totaling approximately $237 million, which are primarily recorded in the "Investments and long-term receivables" line on our consolidated balance sheet. The arbitration hearing was conducted in Singapore in June 2014 under the United Nations Commission on International Trade Laws (UNCITRAL)
104
arbitration rules, pursuant to the terms of the Tax Stability Agreement with the Timor-Leste government. Post-hearing briefs from both parties were filed in August 2014. We are now awaiting the Tribunal's decision. Future impacts on our business are not known at this time.
Long-Term Throughput Agreements and Take-or-Pay Agreements
We have certain throughput agreements and take-or-pay agreements in support of financing arrangements. The agreements typically provide for natural gas or crude oil transportation to be used in the ordinary course of the Company's business. The aggregate amounts of estimated payments under these various agreements are: 2015-$119 million; 2016-$29 million; 2017-$29 million; 2018-$25 million; 2019-$8 million; and 2020 and after-$103 million. Total payments under the agreements were $127 million in each of 2014 and 2013, and $130 million in 2012.
Note 13-Derivative and Financial Instruments
We use futures, forwards, swaps and options in various markets to meet our customer needs and capture market opportunities. Our commodity business primarily consists of natural gas, crude oil, bitumen, LNG and natural gas liquids.
Our derivative instruments are held at fair value on our consolidated balance sheet. Where these balances have the right of setoff, they are presented on a net basis. Related cash flows are recorded as operating activities on the consolidated statement of cash flows. On our consolidated income statement, realized and unrealized gains and losses are recognized either on a gross basis if directly related to our physical business or a net basis if held for trading. Gains and losses related to contracts that meet and are designated with the normal purchase normal sale exception are recognized upon settlement. We generally apply this exception to eligible crude contracts. We do not use hedge accounting for our commodity derivatives.
The following table presents the gross fair values of our commodity derivatives, excluding collateral, and the line items where they appear on our consolidated balance sheet:
| Millions of Dollars | ||||||||
| 2014 | 2013 | |||||||
|
| |||||||
Assets | ||||||||
Prepaid expenses and other current assets | $ | 4,500 | 871 | |||||
Other assets | 157 | 64 | ||||||
Liabilities | ||||||||
Other accruals | 4,426 | 890 | ||||||
Other liabilities and deferred credits | 144 | 58 | ||||||
| ||||||||
The gains (losses) incurred from commodity derivatives, and the line items where they appear on our consolidated income statement were:
| Millions of Dollars | ||||||||||||
| 2014 | 2013 | 2012 | ||||||||||
|
| |||||||||||
Sales and other operating revenues | $ | 523 | (160 | ) | (291 | ) | ||||||
Other income | 1 | 4 | (1 | ) | ||||||||
Purchased commodities | (458 | ) | 139 | 214 | ||||||||
| ||||||||||||
105
The table below summarizes our material net exposures resulting from outstanding commodity derivative contracts:
| Open Position Long/(Short) | ||||||||
| 2014 | 2013 | |||||||
|
| |||||||
Commodity | ||||||||
Natural gas and power (billions of cubic feet equivalent) | ||||||||
Fixed price | (11 | ) | (18 | ) | ||||
Basis | 18 | (10 | ) | |||||
Foreign Currency Exchange Derivatives
We have foreign currency exchange rate risk resulting from international operations. Our foreign currency exchange derivative activity primarily consists of transactions designed to mitigate our cash-related and foreign currency exchange rate exposures, such as firm commitments for capital programs or local currency tax payments, dividends, and cash returns from net investments in foreign affiliates. We do not elect hedge accounting on our foreign currency exchange derivatives.
The following table presents the gross fair values of our foreign currency exchange derivatives, excluding collateral, and the line items where they appear on our consolidated balance sheet:
| Millions of Dollars | ||||||||
| 2014 | 2013 | |||||||
|
| |||||||
Assets | ||||||||
Prepaid expenses and other current assets | $ | 1 | 1 | |||||
Liabilities | ||||||||
Other accruals | 1 | - | ||||||
| ||||||||
The (gains) losses from foreign currency exchange derivatives incurred, and the line items where they appear on our consolidated income statement were:
| Millions of Dollars | ||||||||||||
| 2014 | 2013 | 2012 | ||||||||||
|
| |||||||||||
Foreign currency transaction (gains) losses | $ | 3 | 4 | (138) | ||||||||
| ||||||||||||
We had the following net notional position of outstanding foreign currency exchange derivatives:
| In Millions Notional Currency | ||||||||||
| 2014 | 2013 | |||||||||
| ||||||||||
Foreign Currency Exchange Derivatives | ||||||||||
Sell U.S. dollar, buy Canadian dollar | USD | 7 | - | |||||||
Buy U.S. dollar, sell other currencies* | USD | 44 | 6 | |||||||
Buy British pound, sell euro | GPB | 20 | 17 | |||||||
| ||||||||||
| *Primarily | Canadian dollar and Norwegian krone. |
106
Financial Instruments
We invest excess cash in financial instruments with maturities based on our cash forecasts for the various currency pools we manage. The maturities of these investments may from time to time extend beyond 90 days. The types of financial instruments include:
| • | Time deposits: Interest bearing deposits placed with approved financial institutions. |
| • | Money market funds: Short-term securities representing high-quality liquid debt and monetary instruments. |
| • | Commercial paper: Unsecured promissory notes issued by a corporation, commercial bank, or government agency purchased at a discount, maturing at par. |
These financial instruments appear in the "Cash and cash equivalents" line of our consolidated balance sheet if the maturities at the time we made the investments were 90 days or less; otherwise, these held-to-maturity investments are included in the "Short-term investments" line. At December 31, we held the following financial instruments:
| Millions of Dollars | ||||||||||||||||
| Carrying Amount | ||||||||||||||||
| Cash and Cash Equivalents | Short-Term Investments | |||||||||||||||
| 2014 | 2013 | 2014 | 2013 | |||||||||||||
|
|
|
| |||||||||||||
Cash | $ | 946 | 636 | - | - | |||||||||||
Money Market Funds | 50 | - | - | - | ||||||||||||
Time Deposits | ||||||||||||||||
Remaining maturities from 1 to 90 days | 3,726 | 5,336 | - | 137 | ||||||||||||
Commercial Paper | ||||||||||||||||
Remaining maturities from 1 to 90 days | 340 | 274 | - | 135 | ||||||||||||
| ||||||||||||||||
| $ | 5,062 | 6,246 | - | 272 | ||||||||||||
| ||||||||||||||||
Credit Risk
Financial instruments potentially exposed to concentrations of credit risk consist primarily of cash equivalents, over-the-counter (OTC) derivative contracts and trade receivables. Our cash equivalents and short-term investments are placed in high-quality commercial paper, money market funds, government debt securities and time deposits with major international banks and financial institutions.
The credit risk from our OTC derivative contracts, such as forwards and swaps, derives from the counterparty to the transaction. Individual counterparty exposure is managed within predetermined credit limits and includes the use of cash-call margins when appropriate, thereby reducing the risk of significant nonperformance. We also use futures, swaps and option contracts that have a negligible credit risk because these trades are cleared with an exchange clearinghouse and subject to mandatory margin requirements until settled; however, we are exposed to the credit risk of those exchange brokers for receivables arising from daily margin cash calls, as well as for cash deposited to meet initial margin requirements.
Our trade receivables result primarily from our petroleum operations and reflect a broad national and international customer base, which limits our exposure to concentrations of credit risk. The majority of these receivables have payment terms of 30 days or less, and we continually monitor this exposure and the creditworthiness of the counterparties. We do not generally require collateral to limit the exposure to loss; however, we will sometimes use letters of credit, prepayments, and master netting arrangements to mitigate credit risk with counterparties that both buy from and sell to us, as these agreements permit the amounts owed by us or owed to others to be offset against amounts due us.
107
Certain of our derivative instruments contain provisions that require us to post collateral if the derivative exposure exceeds a threshold amount. We have contracts with fixed threshold amounts and other contracts with variable threshold amounts that are contingent on our credit rating. The variable threshold amounts typically decline for lower credit ratings, while both the variable and fixed threshold amounts typically revert to zero if we fall below investment grade. Cash is the primary collateral in all contracts; however, many also permit us to post letters of credit as collateral, such as transactions administered through the New York Mercantile Exchange or IntercontinentalExchange.
The aggregate fair value of all derivative instruments with such credit risk-related contingent features that were in a liability position on December 31, 2014 and December 31, 2013, was $150 million and $57 million, respectively. For these instruments, no collateral was posted as of December 31, 2014 or December 31, 2013. If our credit rating had been lowered one level from its "A" rating (per Standard and Poor's) on December 31, 2014, we would be required to post $2 million of additional collateral to our counterparties. If we had been downgraded below investment grade, we would be required to post $150 million of additional collateral, either with cash or letters of credit.
Note 14-Fair Value Measurement
We carry a portion of our assets and liabilities at fair value that are measured at a reporting date using an exit price (i.e., the price that would be received to sell an asset or paid to transfer a liability) and disclosed according to the quality of valuation inputs under the following hierarchy:
| • | Level 1: Quoted prices (unadjusted) in an active market for identical assets or liabilities. |
| • | Level 2: Inputs other than quoted prices that are directly or indirectly observable. |
| • | Level 3: Unobservable inputs that are significant to the fair value of assets or liabilities. |
The classification of an asset or liability is based on the lowest level of input significant to its fair value. Those that are initially classified as Level 3 are subsequently reported as Level 2 when the fair value derived from unobservable inputs is inconsequential to the overall fair value, or if corroborated market data becomes available. Assets and liabilities that are initially reported as Level 2 are subsequently reported as Level 3 if corroborated market data is no longer available. Transfers occur at the end of the reporting period. There were no material transfers in or out of Level 1 during 2014 and 2013.
Recurring Fair Value Measurement
Financial assets and liabilities reported at fair value on a recurring basis primarily include commodity derivatives and certain investments to support nonqualified deferred compensation plans. The deferred compensation investments are measured at fair value using unadjusted prices available from national securities exchanges; therefore, these assets are categorized as Level 1 in the fair value hierarchy. Level 1 derivative assets and liabilities primarily represent exchange-traded futures and options that are valued using unadjusted prices available from the underlying exchange. Level 2 derivative assets and liabilities primarily represent OTC swaps, options and forward purchase and sale contracts that are valued using adjusted exchange prices, prices provided by brokers or pricing service companies that are all corroborated by market data. Level 3 derivative assets and liabilities consist of OTC swaps, options and forward purchase and sale contracts that are long-term in nature and where a significant portion of fair value is calculated from underlying market data that is not readily available. The derived value uses industry standard methodologies that may consider the historical relationships among various commodities, modeled market prices, time value, volatility factors and other relevant economic measures. The use of these inputs results in management's best estimate of fair value. Level 3 activity was not material for all periods presented.
108
The following table summarizes the fair value hierarchy for gross financial assets and liabilities (i.e., unadjusted where the right of setoff exists for commodity derivatives accounted for at fair value on a recurring basis):
| Millions of Dollars | ||||||||||||||||||||||||||||||||
| December 31, 2014 | December 31, 2013 | |||||||||||||||||||||||||||||||
| Level 1 | Level 2 | Level 3 | Total | Level 1 | Level 2 | Level 3 | Total | |||||||||||||||||||||||||
|
|
|
| |||||||||||||||||||||||||||||
Assets | ||||||||||||||||||||||||||||||||
Deferred compensation investments | $ | 297 | - | - | 297 | 306 | - | - | 306 | |||||||||||||||||||||||
Commodity derivatives | 4,221 | 361 | 75 | 4,657 | 744 | 177 | 10 | 931 | ||||||||||||||||||||||||
| ||||||||||||||||||||||||||||||||
Total assets | $ | 4,518 | 361 | 75 | 4,954 | 1,050 | 177 | 10 | 1,237 | |||||||||||||||||||||||
| ||||||||||||||||||||||||||||||||
Liabilities | ||||||||||||||||||||||||||||||||
Commodity derivatives | $ | 4,200 | 354 | 16 | 4,570 | 765 | 172 | 7 | 944 | |||||||||||||||||||||||
| ||||||||||||||||||||||||||||||||
Total liabilities | $ | 4,200 | 354 | 16 | 4,570 | 765 | 172 | 7 | 944 | |||||||||||||||||||||||
| ||||||||||||||||||||||||||||||||
The following table summarizes those commodity derivative balances subject to the right of setoff as presented on our consolidated balance sheet. We have elected to offset the recognized fair value amounts for multiple derivative instruments executed with the same counterparty in our financial statements when a legal right of offset exists.
| Millions of Dollars | ||||||||||||||||||||||||
| Gross Amounts Recognized | Gross Amounts Offset | Net Amounts Presented | Cash Collateral | Gross Amounts without Right of Setoff | Net Amounts | |||||||||||||||||||
|
| |||||||||||||||||||||||
December 31, 2014 | ||||||||||||||||||||||||
Assets | $ | 4,657 | 4,352 | 305 | 8 | 28 | 269 | |||||||||||||||||
Liabilities | 4,570 | 4,352 | 218 | 4 | 22 | 192 | ||||||||||||||||||
| ||||||||||||||||||||||||
December 31, 2013 | ||||||||||||||||||||||||
Assets | $ | 931 | 827 | 104 | 6 | 12 | 86 | |||||||||||||||||
Liabilities | 944 | 827 | 117 | 26 | 9 | 82 | ||||||||||||||||||
| ||||||||||||||||||||||||
At December 31, 2014 and December 31, 2013, we did not present any amounts gross on our consolidated balance sheet where we had the right of setoff.
109
Non-Recurring Fair Value Measurement
The following table summarizes the fair value hierarchy by major category for assets accounted for at fair value on a non-recurring basis:
| Millions of Dollars | ||||||||||||
| Fair Value Measurements Using | ||||||||||||
|
| |||||||||||
| Fair Value* | Level 3 Inputs | Before-Tax Loss | ||||||||||
|
|
|
|
|
| |||||||
Year ended December 31, 2014 | ||||||||||||
Net PP&E (held for use) | $ | 87 | 87 | 756 | ||||||||
Net PP&E (unproved property) | 39 | 39 | 158 | |||||||||
| ||||||||||||
Year ended December 31, 2013 | ||||||||||||
Net PP&E (held for use) | 117 | 117 | 488 | |||||||||
| ||||||||||||
| *Represents | the fair value at the time of the impairment. |
Net PP&E (held for use)
Net PP&E held for use is comprised of various producing properties impaired to their individual fair values less costs to sell. The fair values were determined by either a negotiated selling price or internal discounted cash flow models using estimates of future production, prices from futures exchanges and pricing service companies, costs and a discount rate believed to be consistent with those used by principal market participants.
Net PP&E (unproved property)
Net PP&E unproved property was written down to fair value less costs to sell based on an average of recent mineral leases sold or on a risk-weighted assessment of indicative offers received.
Reported Fair Values of Financial Instruments
We used the following methods and assumptions to estimate the fair value of financial instruments:
| • | Cash and cash equivalents and short-term investments: The carrying amount reported on the balance sheet approximates fair value. |
| • | Accounts and notes receivable (including long-term and related parties): The carrying amount reported on the balance sheet approximates fair value. The valuation technique and methods used to estimate the fair value of the current portion of fixed-rate related party loans is consistent with Loans and advances-related parties. |
| • | Loans and advances-related parties: The carrying amount of floating-rate loans approximates fair value. The fair value of fixed-rate loan activity is measured using market observable data and is categorized as Level 2 in the fair value hierarchy. See Note 6-Investments, Loans and Long-Term Receivables, for additional information. |
| • | Accounts payable (including related parties) and floating-rate debt: The carrying amount of accounts payable and floating-rate debt reported on the balance sheet approximates fair value. |
| • | Fixed-rate debt: The estimated fair value of fixed-rate debt is measured using prices available from a pricing service that is corroborated by market data; therefore, these liabilities are categorized as Level 2 in the fair value hierarchy. |
110
The following table summarizes the net fair value of financial instruments (i.e., adjusted where the right of setoff exists for commodity derivatives):
| Millions of Dollars | ||||||||||||||||
| Carrying Amount | Fair Value | |||||||||||||||
| 2014 | 2013 | 2014 | 2013 | |||||||||||||
|
|
|
| |||||||||||||
Financial assets | ||||||||||||||||
Deferred compensation investments | $ | 297 | 306 | 297 | 306 | |||||||||||
Commodity derivatives | 297 | 99 | 297 | 99 | ||||||||||||
Total loans and advances-related parties | 913 | 1,528 | 913 | 1,680 | ||||||||||||
Financial liabilities | ||||||||||||||||
Total debt, excluding capital leases | 21,707 | 20,740 | 25,191 | 23,553 | ||||||||||||
Commodity derivatives | 214 | 92 | 214 | 92 | ||||||||||||
| ||||||||||||||||
At December 31, 2014, commodity derivative assets and liabilities appear net of $8 million of obligations to return cash collateral and $4 million of rights to reclaim cash collateral, respectively. At December 31, 2013, commodity derivative assets and liabilities appear net of $6 million of obligations to return cash collateral and $26 million of rights to reclaim cash collateral, respectively.
Note 15-Equity
Common Stock
The changes in our shares of common stock, as categorized in the equity section of the balance sheet, were:
| Shares | ||||||||||||
| 2014 | 2013 | 2012 | ||||||||||
|
| |||||||||||
Issued | ||||||||||||
Beginning of year | 1,768,169,906 | 1,762,247,949 | 1,749,550,587 | |||||||||
Distributed under benefit plans | 5,413,462 | 5,921,957 | 12,697,362 | |||||||||
| ||||||||||||
End of year | 1,773,583,368 | 1,768,169,906 | 1,762,247,949 | |||||||||
| ||||||||||||
Held in Treasury | ||||||||||||
Beginning of year | 542,230,673 | 542,230,673 | 463,880,628 | |||||||||
Repurchase of common stock | - | - | 79,904,400 | |||||||||
Distributed under benefit plans | - | - | (1,554,355) | |||||||||
| ||||||||||||
End of year | 542,230,673 | 542,230,673 | 542,230,673 | |||||||||
| ||||||||||||
Preferred Stock
We have authorized 500 million shares of preferred stock, par value $.01 per share, none of which was issued or outstanding at December 31, 2014 or 2013.
Noncontrolling Interests
At December 31, 2014 and 2013, we had $362 million and $402 million outstanding, respectively, of equity in less-than-wholly owned consolidated subsidiaries held by noncontrolling interest owners. For both periods, the amounts were related to the Darwin LNG and Bayu-Darwin Pipeline operating joint ventures we control.
111
Note 16-Non-Mineral Leases
The company primarily leases drilling equipment and office buildings, as well as ocean transport vessels, tugboats, barges, corporate aircraft, computers and other facilities and equipment. Certain leases include escalation clauses for adjusting rental payments to reflect changes in price indices, as well as renewal options and/or options to purchase the leased property for the fair market value at the end of the lease term. There are no significant restrictions imposed on us by the leasing agreements with regard to dividends, asset dispositions or borrowing ability. For additional information on leased assets under capital leases, see Note 10-Debt.
At December 31, 2014, future minimum rental payments due under noncancelable leases were:
| Millions of Dollars | ||||
|
| |||
2015 | $ | 568 | ||
2016 | 712 | |||
2017 | 523 | |||
2018 | 347 | |||
2019 | 168 | |||
Remaining years | 631 | |||
| ||||
Total | 2,949 | |||
Less: income from subleases | (12) | |||
| ||||
Net minimum operating lease payments | $ | 2,937 | ||
| ||||
Operating lease rental expense for the years ended December 31 was:
| Millions of Dollars | ||||||||||||
| 2014 | 2013 | 2012 | ||||||||||
|
| |||||||||||
Total rentals | $ | 474 | 317 | 282 | ||||||||
Less: sublease rentals | (10) | (12) | (15) | |||||||||
| ||||||||||||
| $ | 464 | 305 | 267 | |||||||||
| ||||||||||||
112
Note 17-Employee Benefit Plans
Pension and Postretirement Plans
In connection with the separation of the Downstream business in 2012, ConocoPhillips entered into an Employee Matters Agreement with Phillips 66, which provides that employees of Phillips 66 no longer participate in benefit plans sponsored or maintained by ConocoPhillips as of the separation date. Upon separation, the ConocoPhillips pension and postretirement plans transferred assets and obligations to the Phillips 66 plans resulting in a net decrease in sponsored pension and postretirement plan obligations of $1,127 million. Additionally, as a result of the transfer of unrecognized losses to Phillips 66, deferred income taxes and other comprehensive income decreased $335 million and $570 million, respectively.
An analysis of the projected benefit obligations for our pension plans and accumulated benefit obligations for our postretirement health and life insurance plans follows:
| Millions of Dollars | ||||||||||||||||||||||||
| Pension Benefits | Other Benefits | |||||||||||||||||||||||
| 2014 | 2013 | 2014 | 2013 | |||||||||||||||||||||
|
|
|
|
|
| |||||||||||||||||||
| U.S. | Int'l. | U.S. | Int'l. | |||||||||||||||||||||
|
|
|
| |||||||||||||||||||||
Change in Benefit Obligation | ||||||||||||||||||||||||
Benefit obligation at January 1 | $ | 3,954 | 3,583 | 4,225 | 3,438 | 682 | 765 | |||||||||||||||||
Service cost | 124 | 109 | 138 | 102 | 3 | 3 | ||||||||||||||||||
Interest cost | 165 | 166 | 143 | 145 | 29 | 26 | ||||||||||||||||||
Plan participant contributions | - | 6 | - | 6 | 21 | 22 | ||||||||||||||||||
Actuarial (gain) loss | 477 | 598 | (205) | 72 | 53 | (57) | ||||||||||||||||||
Benefits paid | (333) | (122) | (347) | (110) | (70) | (75) | ||||||||||||||||||
Foreign currency exchange rate change | - | (356) | - | (70) | (2) | (2) | ||||||||||||||||||
| ||||||||||||||||||||||||
Benefit obligation at December 31* | $ | 4,387 | 3,984 | 3,954 | 3,583 | 716 | 682 | |||||||||||||||||
| ||||||||||||||||||||||||
*Accumulated benefit obligation portion of above at December 31: | $ | 3,957 | 3,111 | 3,516 | 2,798 | |||||||||||||||||||
Change in Fair Value of Plan Assets | ||||||||||||||||||||||||
Fair value of plan assets at January 1 | $ | 3,092 | 3,132 | 2,732 | 2,760 | - | - | |||||||||||||||||
Actual return on plan assets | 234 | 410 | 505 | 315 | - | - | ||||||||||||||||||
Company contributions | 273 | 203 | 202 | 198 | 49 | 53 | ||||||||||||||||||
Plan participant contributions | - | 6 | - | 6 | 21 | 22 | ||||||||||||||||||
Benefits paid | (333) | (122) | (347) | (110) | (70) | (75) | ||||||||||||||||||
Foreign currency exchange rate change | - | (351) | - | (37) | - | - | ||||||||||||||||||
| ||||||||||||||||||||||||
Fair value of plan assets at December 31 | $ | 3,266 | 3,278 | 3,092 | 3,132 | - | - | |||||||||||||||||
| ||||||||||||||||||||||||
Funded Status | $ | (1,121) | (706) | (862) | (451) | (716) | (682) | |||||||||||||||||
| ||||||||||||||||||||||||
113
| Millions of Dollars | ||||||||||||||||||||||||
| Pension Benefits | Other Benefits | |||||||||||||||||||||||
| 2014 | 2013 | 2014 | 2013 | |||||||||||||||||||||
|
|
|
|
|
| |||||||||||||||||||
| U.S. | Int'l. | U.S. | Int'l. | |||||||||||||||||||||
|
|
|
| |||||||||||||||||||||
Amounts Recognized in the Consolidated Balance Sheet at December 31 | ||||||||||||||||||||||||
Noncurrent assets | $ | - | 13 | - | 128 | - | - | |||||||||||||||||
Current liabilities | (26) | (9) | (35) | (8) | (49) | (53) | ||||||||||||||||||
Noncurrent liabilities | (1,095) | (710) | (827) | (571) | (667) | (629) | ||||||||||||||||||
| ||||||||||||||||||||||||
Total recognized | $ | (1,121) | (706) | (862) | (451) | (716) | (682) | |||||||||||||||||
| ||||||||||||||||||||||||
Weighted-Average Assumptions Used to Determine Benefit Obligations at December 31 | ||||||||||||||||||||||||
Discount rate | 3.80 | % | 3.55 | 4.40 | 4.75 | 4.15 | 4.45 | |||||||||||||||||
Rate of compensation increase | 4.75 | 4.35 | 4.75 | 4.60 | - | - | ||||||||||||||||||
| ||||||||||||||||||||||||
Weighted-Average Assumptions Used to Determine Net Periodic Benefit Cost for Years Ended December 31 | ||||||||||||||||||||||||
Discount rate | 4.40 | % | 4.75 | 3.55 | 4.50 | 4.45 | 3.55 | |||||||||||||||||
Expected return on plan assets | 7.00 | 5.75 | 7.00 | 6.00 | - | - | ||||||||||||||||||
Rate of compensation increase | 4.75 | 4.60 | 4.75 | 4.45 | - | - | ||||||||||||||||||
| ||||||||||||||||||||||||
For both U.S. and international pensions, the overall expected long-term rate of return is developed from the expected future return of each asset class, weighted by the expected allocation of pension assets to that asset class. We rely on a variety of independent market forecasts in developing the expected rate of return for each class of assets.
Included in accumulated other comprehensive income at December 31 were the following before-tax amounts that had not been recognized in net periodic benefit cost:
| Millions of Dollars | ||||||||||||||||||||||||
| Pension Benefits | Other Benefits | |||||||||||||||||||||||
| 2014 | 2013 | 2014 | 2013 | |||||||||||||||||||||
|
|
|
|
|
| |||||||||||||||||||
| U.S. | Int'l. | U.S. | Int'l. | |||||||||||||||||||||
|
|
|
| |||||||||||||||||||||
Unrecognized net actuarial loss (gain) | $ | 1,146 | 852 | 767 | 578 | 25 | (31) | |||||||||||||||||
Unrecognized prior service cost (credit) | 16 | (43 | ) | 22 | (54 | ) | (4 | ) | (8) | |||||||||||||||
| ||||||||||||||||||||||||
114
| Millions of Dollars | ||||||||||||||||||||||||
| Pension Benefits | Other Benefits | |||||||||||||||||||||||
| 2014 | 2013 | 2014 | 2013 | |||||||||||||||||||||
|
|
|
|
|
| |||||||||||||||||||
| U.S. | Int'l. | U.S. | Int'l. | |||||||||||||||||||||
|
|
|
| |||||||||||||||||||||
Sources of Change in Other Comprehensive Income | ||||||||||||||||||||||||
Net gain (loss) arising during the period | $ | (456) | (331) | 524 | 107 | (53) | 57 | |||||||||||||||||
Amortization of loss included in income* | 77 | 57 | 218 | 73 | (3) | 3 | ||||||||||||||||||
| ||||||||||||||||||||||||
Net change during the period | $ | (379) | (274) | 742 | 180 | (56) | 60 | |||||||||||||||||
| ||||||||||||||||||||||||
Prior service credit (cost) arising during the period | $ | - | (3) | - | 1 | - | - | |||||||||||||||||
Amortization of prior service cost (credit) included in income | 6 | (8) | 6 | (7) | (4) | (4) | ||||||||||||||||||
| ||||||||||||||||||||||||
Net change during the period | $ | 6 | (11) | 6 | (6) | (4) | (4) | |||||||||||||||||
| ||||||||||||||||||||||||
| * | Includes settlement losses recognized in 2013. |
Amounts included in accumulated other comprehensive income at December 31, 2014, that are expected to be amortized into net periodic benefit cost during 2015 are provided below:
| Millions of Dollars | ||||||||||||
| Pension Benefits | Other Benefits | |||||||||||
| U.S. | Int'l. | |||||||||||
|
| |||||||||||
Unrecognized net actuarial loss | $ | 115 | 86 | 3 | ||||||||
Unrecognized prior service cost (credit) | 6 | (7) | (4) | |||||||||
| ||||||||||||
For our tax-qualified pension plans with projected benefit obligations in excess of plan assets, the projected benefit obligation, the accumulated benefit obligation, and the fair value of plan assets were $7,584 million, $6,503 million, and $6,446 million, respectively, at December 31, 2014, and $6,011 million, $5,393 million, and $5,151 million, respectively, at December 31, 2013.
For our unfunded nonqualified key employee supplemental pension plans, the projected benefit obligation and the accumulated benefit obligation were $703 million and $482 million, respectively, at December 31, 2014, and were $581 million and $392 million, respectively, at December 31, 2013.
115
The components of net periodic benefit cost of all defined benefit plans are presented in the following table:
| Millions of Dollars | ||||||||||||||||||||||||||||||||||||
| Pension Benefits | Other Benefits | |||||||||||||||||||||||||||||||||||
| 2014 | 2013 | 2012 | 2014 | 2013 | 2012 | |||||||||||||||||||||||||||||||
|
|
|
|
|
|
|
| |||||||||||||||||||||||||||||
| U.S. | Int'l. | U.S. | Int'l. | U.S. | Int'l. | |||||||||||||||||||||||||||||||
|
|
|
|
|
| |||||||||||||||||||||||||||||||
Components of Net Periodic Benefit Cost | ||||||||||||||||||||||||||||||||||||
Service cost | $ | 124 | 109 | 138 | 102 | 170 | 91 | 3 | 3 | 6 | ||||||||||||||||||||||||||
Interest cost | 165 | 166 | 143 | 145 | 186 | 152 | 29 | 26 | 33 | |||||||||||||||||||||||||||
Expected return on plan assets | (213 | ) | (181 | ) | (186 | ) | (160 | ) | (223 | ) | (158 | ) | - | - | - | |||||||||||||||||||||
Amortization of prior service cost (credit) | 6 | (8 | ) | 6 | (7 | ) | 7 | (8 | ) | (4 | ) | (4 | ) | (4) | ||||||||||||||||||||||
Recognized net actuarial loss (gain) | 77 | 57 | 151 | 73 | 191 | 59 | (3 | ) | 3 | - | ||||||||||||||||||||||||||
Settlements | - | - | 67 | - | 181 | - | - | - | - | |||||||||||||||||||||||||||
| ||||||||||||||||||||||||||||||||||||
Net periodic benefit cost | $ | 159 | 143 | 319 | 153 | 512 | 136 | 25 | 28 | 35 | ||||||||||||||||||||||||||
| ||||||||||||||||||||||||||||||||||||
We recognized pension settlement losses of $67 million in 2013 and $181 million (including $24 million in discontinued operations) in 2012. In 2013 and 2012, lump-sum benefit payments from the U.S. qualified pension plan exceeded the sum of service and interest costs for that plan and led to an increase in settlement losses.
In determining net pension and other postretirement benefit costs, we amortize prior service costs on a straight-line basis over the average remaining service period of employees expected to receive benefits under the plan. For net actuarial gains and losses, we amortize 10 percent of the unamortized balance each year.
We have multiple nonpension postretirement benefit plans for health and life insurance. The health care plans are contributory and subject to various cost sharing features, with participant and company contributions adjusted annually; the life insurance plans are noncontributory. The measurement of the accumulated postretirement benefit obligation assumes a health care cost trend rate of 7 percent in 2015 that declines to 5 percent by 2023. A one-percentage-point change in the assumed health care cost trend rate would be immaterial to ConocoPhillips.
Plan Assets -We follow a policy of broadly diversifying pension plan assets across asset classes, investment managers, and individual holdings. As a result, our plan assets have no significant concentrations of credit risk. Asset classes that are considered appropriate include U.S. equities, non-U.S. equities, U.S. fixed income, non-U.S. fixed income, real estate and private equity investments. Plan fiduciaries may consider and add other asset classes to the investment program from time to time. The target allocations for plan assets are 59 percent equity securities, 36 percent debt securities and 5 percent real estate. Generally, the plan investments are publicly traded, therefore minimizing liquidity risk in the portfolio.
116
The following is a description of the valuation methodologies used for the pension plan assets. There have been no changes in the methodologies used at December 31, 2014 and 2013.
| • | Fair values of equity securities and government debt securities categorized in Level 1 are primarily based on quoted market prices in active markets for identical assets and liabilities. |
| • | Fair values of corporate debt securities, agency and mortgage-backed securities and government debt securities categorized in Level 2 are estimated using recently executed transactions and quoted market prices for similar assets and liabilities in active markets and for identical assets and liabilities in markets that are not active. If there have been no market transactions in a particular fixed income security, its fair value is calculated by pricing models that benchmark the security against other securities with actual market prices. When observable quoted market prices are not available, fair value is based on pricing models that use something other than actual market prices (e.g., observable inputs such as benchmark yields, reported trades and issuer spreads for similar securities), and these securities are categorized in Level 3 of the fair value hierarchy. |
| • | Fair values of investments in common/collective trusts are determined by the issuer of each fund based on the fair value of the underlying assets. |
| • | Fair values of mutual funds are based on quoted market prices, which represent the net asset value of shares held. |
| • | Cash is valued at cost, which approximates fair value. Fair values of international cash equivalents categorized in Level 2 are valued using observable yield curves, discounting and interest rates. U.S. cash balances held in the form of short-term fund units that are redeemable at the measurement date are categorized as Level 2. |
| • | Fair values of exchange-traded derivatives classified in Level 1 are based on quoted market prices. For other derivatives classified in Level 2, the values are generally calculated from pricing models with market input parameters from third-party sources. |
| • | Private equity funds are valued at net asset value as determined by the issuer based on the fair value of the underlying assets. |
| • | Fair values of insurance contracts are valued at the present value of the future benefit payments owed by the insurance company to the plans' participants. |
| • | Fair values of real estate investments are valued using real estate valuation techniques and other methods that include reference to third-party sources and sales comparables where available. |
| • | A portion of U.S. pension plan assets is held as a participating interest in an insurance annuity contract, which is calculated as the market value of investments held under this contract, less the accumulated benefit obligation covered by the contract. The participating interest is classified as Level 3 in the fair value hierarchy as the fair value is determined via a combination of quoted market prices, recently executed transactions, and an actuarial present value computation for contract obligations. At December 31, 2014, the participating interest in the annuity contract was valued at $116 million and consisted of $328 million in debt securities, less $212 million for the accumulated benefit obligation covered by the contract. At December 31, 2013, the participating interest in the annuity contract was valued at $110 million and consisted of $312 million in debt securities, less $202 million for the accumulated benefit obligation covered by the contract. The net change from 2013 to 2014 is due to an increase in the fair value of the underlying investments of $16 million and an increase in the present value of the contract obligation of $10 million. The participating interest is not available for meeting general pension benefit obligations in the near term. No future Company contributions are required and no new benefits are being accrued under this insurance annuity contract. |
117
The fair values of our pension plan assets at December 31, by asset class were as follows:
| Millions of Dollars | ||||||||||||||||||||||||||||||||
| U.S. | International | |||||||||||||||||||||||||||||||
| Level 1 | Level 2 | Level 3 | Total | Level 1 | Level 2 | Level 3 | Total | |||||||||||||||||||||||||
|
|
|
| |||||||||||||||||||||||||||||
2014 | ||||||||||||||||||||||||||||||||
Equity Securities | ||||||||||||||||||||||||||||||||
U.S. | $ | 1,039 | 2 | 8 | 1,049 | 628 | - | - | 628 | |||||||||||||||||||||||
International | 671 | - | - | 671 | 445 | - | - | 445 | ||||||||||||||||||||||||
Common/collective trusts | - | 542 | - | 542 | - | 227 | - | 227 | ||||||||||||||||||||||||
Mutual funds | - | - | - | - | 241 | 97 | - | 338 | ||||||||||||||||||||||||
Debt Securities | ||||||||||||||||||||||||||||||||
Government | 132 | 75 | - | 207 | 624 | - | - | 624 | ||||||||||||||||||||||||
Corporate | - | 426 | 4 | 430 | - | 166 | - | 166 | ||||||||||||||||||||||||
Agency and mortgage-backed securities | - | 115 | - | 115 | - | 46 | 1 | 47 | ||||||||||||||||||||||||
Common/collective trusts | - | - | - | - | - | 396 | - | 396 | ||||||||||||||||||||||||
Mutual funds | - | - | - | - | 167 | - | - | 167 | ||||||||||||||||||||||||
Cash and cash equivalents | - | 67 | - | 67 | 50 | 18 | - | 68 | ||||||||||||||||||||||||
Private equity funds | - | - | - | - | - | - | 1 | 1 | ||||||||||||||||||||||||
Derivatives | 5 | (3 | ) | - | 2 | (4 | ) | - | - | (4) | ||||||||||||||||||||||
Real estate | - | - | 55 | 55 | - | - | 166 | 166 | ||||||||||||||||||||||||
| ||||||||||||||||||||||||||||||||
Total* | $ | 1,847 | 1,224 | 67 | 3,138 | 2,151 | 950 | 168 | 3,269 | |||||||||||||||||||||||
| ||||||||||||||||||||||||||||||||
*Excludes the participating interest in the insurance annuity contract with a net asset value of $116 million and net receivables related to security transactions of $21 million. |
| |||||||||||||||||||||||||||||||
2013 | ||||||||||||||||||||||||||||||||
Equity Securities | ||||||||||||||||||||||||||||||||
U.S. | $ | 1,018 | - | - | 1,018 | 531 | - | - | 531 | |||||||||||||||||||||||
International | 702 | - | - | 702 | 437 | - | - | 437 | ||||||||||||||||||||||||
Common/collective trusts | - | 529 | - | 529 | - | 217 | - | 217 | ||||||||||||||||||||||||
Mutual funds | - | - | - | - | 373 | - | - | 373 | ||||||||||||||||||||||||
Debt Securities | ||||||||||||||||||||||||||||||||
Government | 106 | 69 | - | 175 | 557 | - | - | 557 | ||||||||||||||||||||||||
Corporate | - | 333 | 3 | 336 | - | 150 | - | 150 | ||||||||||||||||||||||||
Agency and mortgage-backed securities | - | 97 | - | 97 | - | 25 | 1 | 26 | ||||||||||||||||||||||||
Common/collective trusts | - | - | - | - | - | 356 | - | 356 | ||||||||||||||||||||||||
Mutual funds | - | - | - | - | 191 | - | - | 191 | ||||||||||||||||||||||||
Cash and cash equivalents | - | 123 | - | 123 | 30 | 17 | - | 47 | ||||||||||||||||||||||||
Private equity funds | - | - | 1 | 1 | - | - | 21 | 21 | ||||||||||||||||||||||||
Derivatives | (1 | ) | 2 | - | 1 | 19 | 12 | - | 31 | |||||||||||||||||||||||
Real estate | - | - | - | - | - | - | 190 | 190 | ||||||||||||||||||||||||
| ||||||||||||||||||||||||||||||||
Total* | $ | 1,825 | 1,153 | 4 | 2,982 | 2,138 | 777 | 212 | 3,127 | |||||||||||||||||||||||
| ||||||||||||||||||||||||||||||||
| * | Excludes the participating interest in the insurance annuity contract with a net asset value of $110 million and net receivables related to security transactions of $5 million. |
Level 3 activity was not material for all periods.
Our funding policy for U.S. plans is to contribute at least the minimum required by the Employee Retirement Income Security Act of 1974 and the Internal Revenue Code of 1986, as amended. Contributions to foreign plans are dependent upon local laws and tax regulations. In 2015, we expect to contribute approximately $110 million to our domestic qualified and nonqualified pension and postretirement benefit plans and $190 million to our international qualified and nonqualified pension and postretirement benefit plans.
118
The following benefit payments, which are exclusive of amounts to be paid from the insurance annuity contract and which reflect expected future service, as appropriate, are expected to be paid:
| Millions of Dollars | ||||||||
Pension Benefits | Other Benefits | |||||||
|
|
| ||||||
| U.S. | Int'l. | |||||||
| ||||||||
2015 | $ 438 | 113 | 51 | |||||
2016 | 423 | 113 | 50 | |||||
2017 | 423 | 119 | 50 | |||||
2018 | 417 | 126 | 49 | |||||
2019 | 441 | 133 | 48 | |||||
2020–2024 | 1,957 | 782 | 218 | |||||
Defined Contribution Plans
Most U.S. employees are eligible to participate in the ConocoPhillips Savings Plan (CPSP). Employees can deposit up to 75 percent of their eligible pay, subject to statutory limits, in the thrift feature of the CPSP to a choice of approximately 37 investment funds. Starting in 2013, employees who participate in the CPSP and contribute 1 percent of their eligible pay receive a 9 percent Company cash match, subject to certain limitations. Prior to 2013, ConocoPhillips matched contribution deposits up to 1.25 percent of eligible pay. Company contributions charged to expense related to continuing and discontinued operations for the CPSP and predecessor plans, excluding the stock savings feature (discussed below), were $116 million in 2014, $101 million in 2013, and $16 million in 2012.
The stock savings feature of the CPSP was a leveraged employee stock ownership plan; however, beginning in 2013, the CPSP no longer has a stock savings feature. Prior to 2013, employees could elect to participate in the stock savings feature by contributing 1 percent of eligible pay and receiving an allocation of shares of common stock proportionate to the amount of contribution.
In 1990, the Long-Term Stock Savings Plan of Phillips Petroleum Company (subsequently the stock savings feature of the CPSP) borrowed funds that were used to purchase previously unissued shares of Company common stock. Since the Company guaranteed the CPSP's borrowings, the unpaid balance was reported as a liability of the Company and unearned compensation was shown as a reduction of common stockholders' equity. Dividends on all shares were charged against retained earnings. The debt was serviced by the CPSP from Company contributions and dividends received on certain shares of common stock held by the plan, including all unallocated shares. The shares held by the stock savings feature of the CPSP were released for allocation to participant accounts based on debt service payments on CPSP borrowings. In 2012, the final debt service payment was made and all remaining unallocated shares were released for allocation to participant accounts. The total number of allocated CPSP stock savings feature shares as of December 31, 2014 and 2013, were 8,198,873 and 9,280,837, respectively.
With the stock savings feature, we recognized interest expense as incurred and compensation expense based on the fair value of the stock contributed or on the cost of the unallocated shares released, using the shares-allocated method. We recognized total CPSP expense related to continuing and discontinued operations for the stock savings feature of $104 million in 2012, all of which was compensation expense. In 2012, we made cash contributions to the CPSP of $5 million and contributed 1,554,355 shares of Company common stock from treasury stock. Dividends used to service debt were $10 million in 2012. These dividends reduced the amount of compensation expense recognized in each period. Interest incurred on the CPSP debt in 2012 was $0.1 million.
119
We have several defined contribution plans for our international employees, each with its own terms and eligibility depending on location. Total compensation expense related to continuing and discontinued operations recognized for these international plans was approximately $66 million in 2014, $60 million in 2013 and $56 million in 2012.
Share-Based Compensation Plans
The 2014 Omnibus Stock and Performance Incentive Plan of ConocoPhillips (the Plan) was approved by shareholders in May 2014. Over its 10-year life, the Plan allows the issuance of up to 79 million shares of our common stock for compensation to our employees and directors; however, as of the effective date of the Plan, (i) any shares of common stock available for future awards under the prior plans and (ii) any shares of common stock represented by awards granted under the prior plans that are forfeited, expire or are cancelled without delivery of shares of common stock or which result in the forfeiture of shares of common stock back to the Company shall be available for awards under the Plan, and no new awards shall be granted under the prior plans. Of the 79 million shares available for issuance under the Plan, no more than 40 million shares of common stock are available for incentive stock options. The Human Resources and Compensation Committee of our Board of Directors is authorized to determine the types, terms, conditions, and limitations of awards granted. Awards may be granted in the form of, but not limited to, stock options, restricted stock units, and performance share units to employees and nonemployee directors who contribute to the Company's continued success and profitability.
Total share-based compensation expense is measured using the grant date fair value for our equity-classified awards and the settlement date fair value for our liability-classified awards. We recognize share-based compensation expense over the shorter of the service period (i.e., the stated period of time required to earn the award); or the period beginning at the start of the service period and ending when an employee first becomes eligible for retirement, but not less than six months, as this is the minimum period of time required for an award to not be subject to forfeiture. Our share-based compensation programs generally provide accelerated vesting (i.e., a waiver of the remaining period of service required to earn an award) for awards held by employees at the time of their retirement. Some of our share-based awards vest ratably (i.e., portions of the award vest at different times) while some of our awards cliff vest (i.e., all of the award vests at the same time). We recognize expense on a straight-line basis over the service period for the entire award, whether the award was granted with ratable or cliff vesting.
Separation-Related Adjustments -In connection with the separation of the Downstream business on April 30, 2012, ConocoPhillips entered into an Employee Matters Agreement with Phillips 66, which provided that employees of Phillips 66 no longer participate in benefit plans sponsored or maintained by ConocoPhillips. Pursuant to the Employee Matters Agreement, we made certain adjustments, using volumetric weighted-average prices for the four-day period immediately prior to and immediately following the separation, to the exercise price and number of our share-based compensation awards, with the intention of preserving the intrinsic value of the awards immediately prior to the separation. These adjustments are summarized as follows:
| • | Outstanding options to purchase common shares of ConocoPhillips stock that were exercisable prior to the separation were adjusted so that the holders of the options would then hold one option to purchase common shares of Phillips 66 stock for every two adjusted stock options to purchase common shares of ConocoPhillips stock following the separation. |
| • | Nonexercisable stock options and restricted stock units were converted to those of the entity where the employee holding them was working immediately post-separation. Therefore, nonexercisable stock options to purchase shares of ConocoPhillips common stock and ConocoPhillips restricted stock units held by an employee who separated with the Downstream business were surrendered as a result of the separation. |
120
| • | In addition, former employee holders and a specified group of holders of stock options and restricted stock units who retired or terminated employment upon or shortly after the separation received both adjusted ConocoPhillips awards and Phillips 66 awards. |
| • | ConocoPhillips restricted stock and performance share units awarded for completed performance periods under the Performance Share Program, as well as vested restricted stock units held by current or former directors, were adjusted to provide holders one restricted share or restricted stock unit of Phillips 66 stock for every two restricted shares or restricted stock units of ConocoPhillips stock. |
The separation-related adjustments did not have a material impact on either compensation expense for the year ended December 31, 2012, or the number of potentially dilutive securities as of December 31, 2012, considered in the calculation of diluted earnings per share of common stock.
Stock Options -Stock options granted under the provisions of the Plan and prior plans permit purchase of our common stock at exercise prices equivalent to the average market price of ConocoPhillips common stock on the date the options were granted. The options have terms of 10 years and generally vest ratably, with one-third of the options awarded vesting and becoming exercisable on each anniversary date following the date of grant. Options awarded to certain employees already eligible for retirement vest within six months of the grant date, but those options do not become exercisable until the end of the normal vesting period.
Compensation Expense -Total share-based compensation expense recognized in income related to continuing and discontinued operations and the associated tax benefit for the years ended December 31 were as follows:
| Millions of Dollars | ||||||||||||
| 2014 | 2013 | 2012 | ||||||||||
|
| |||||||||||
Compensation cost | $ | 358 | 308 | 321 | ||||||||
Tax benefit | 125 | 109 | 118 | |||||||||
| ||||||||||||
The fair market values of the options granted over the past three years were measured on the date of grant using the Black-Scholes-Merton option-pricing model. The weighted-average assumptions used were as follows:
| 2014 | 2013 | 2012 | ||||||||||
|
| |||||||||||
Assumptions used | ||||||||||||
Risk-free interest rate | 1.86 | % | 1.09 | 1.62 | ||||||||
Dividend yield | 4.00 | % | 4.00 | 4.00 | ||||||||
Volatility factor | 25.31 | % | 28.95 | 33.30 | ||||||||
Expected life (years) | 6.12 | 5.95 | 7.42 | |||||||||
There were no ranges in the assumptions used to determine the fair market values of our options granted over the past three years.
For 2012 expected volatility was based on historical volatility of the Company's stock using ConocoPhillips' end-of-week closing stock prices over a period commensurate with the expected life of the options granted. Due to the separation of our Downstream business in 2012, expected volatility for grants of options in 2014 and 2013 was based on a three-year average historical stock price volatility of a group of peer companies. We believe our historical volatility for periods prior to the separation of our Downstream business is no longer relevant in estimating expected volatility.
121
The following summarizes our stock option activity for the year ended December 31, 2014:
| Options | Weighted- Average Exercise Price | Weighted- Average Grant Date Fair Value | Millions of Dollars Aggregate Intrinsic Value | |||||||||||||
Outstanding at December 31, 2013 | 16,315,090 | $ | 48.33 | $ | 358 | |||||||||||
Granted | 3,541,900 | 65.46 | $ | 10.17 | ||||||||||||
Exercised | (2,686,258 | ) | 43.34 | $ | 89 | |||||||||||
Forfeited | (52,856 | ) | 61.62 | |||||||||||||
Expired or cancelled | (5 | ) | 25.02 | |||||||||||||
|
|
| ||||||||||||||
Outstanding at December 31, 2014 | 17,117,871 | $ | 52.61 | $ | 284 | |||||||||||
|
|
| ||||||||||||||
Vested at December 31, 2014 | 13,380,549 | $ | 49.93 | $ | 258 | |||||||||||
|
|
| ||||||||||||||
Exercisable at December 31, 2014 | 11,025,888 | $ | 47.40 | $ | 241 | |||||||||||
|
|
| ||||||||||||||
The weighted-average remaining contractual term of outstanding options, vested options and exercisable options at December 31, 2014, was 5.95 years, 5.20 years and 4.48 years, respectively. The weighted-average grant date fair value of stock option awards granted during 2013 and 2012 was $9.90 and $15.69, respectively. The aggregate intrinsic value of options exercised during 2013 and 2012 was $95 million and $469 million, respectively.
During 2014 we received $116 million in cash and realized a tax benefit related to both continuing and discontinued operations of $49 million from the exercise of options. At December 31, 2014, the remaining unrecognized compensation expense from unvested options was $22 million, which will be recognized over a weighted-average period of 1.60 years, the longest period being 2.13 years.
Stock Unit Program- Generally, restricted stock units are granted annually under the provisions of the Plan. Restricted stock units granted prior to 2013 generally vest ratably in three equal annual installments beginning on the third anniversary of the grant date. Beginning in 2013, restricted stock units granted will vest in an aggregate installment on the third anniversary of the grant date. In addition, beginning in 2012, restricted stock units granted under the Plan for a variable long-term incentive program vest ratably in three equal annual installments beginning on the first anniversary of the grant date. Restricted stock units are also granted ad hoc to attract or retain key personnel, and the terms and conditions under which these restricted stock units vest vary by award. Upon vesting, the restricted stock units are settled by issuing one share of ConocoPhillips common stock per unit. Units awarded to retirement eligible employees vest six months from the grant date; however, those units are not issued as common stock until the earlier of separation from the Company or the end of the regularly scheduled vesting period. Until issued as stock, most recipients of the restricted stock units receive a quarterly cash payment of a dividend equivalent that is charged to retained earnings. The grant date fair market value of these restricted stock units is deemed equal to the average ConocoPhillips stock price on the grant date. The grant date fair market value of units that do not receive a dividend equivalent while unvested is deemed equal to the average ConocoPhillips stock price on the grant date, less the net present value of the dividends that will not be received.
122
The following summarizes our stock unit activity for the year ended December 31, 2014:
| Weighted-Average | Millions of Dollars | |||||||||||
| Stock Units | Grant Date Fair Value | Total Fair Value | ||||||||||
Outstanding at December 31, 2013 | 12,161,152 | $ | 51.37 | |||||||||
Granted | 3,427,654 | 62.72 | ||||||||||
Forfeited | (241,435) | 59.31 | ||||||||||
Issued | (3,564,515) | $ | 256 | |||||||||
|
|
| ||||||||||
Outstanding at December 31, 2014 | 11,782,856 | $ | 55.75 | |||||||||
|
|
| ||||||||||
Not Vested at December 31, 2014 | 7,736,132 | $ | 56.33 | |||||||||
|
|
| ||||||||||
At December 31, 2014, the remaining unrecognized compensation cost from the unvested units was $242 million, which will be recognized over a weighted-average period of 1.62 years, the longest period being 5.33 years. The weighted-average grant date fair value of stock unit awards granted during 2013 and 2012 was $57.99 and $60.62, respectively. The total fair value of stock units issued during 2013 and 2012 was $245 million and $187 million, respectively.
Performance Share Program -Under the Plan, we also annually grant restricted performance share units (PSUs) to senior management. These PSUs are authorized three years prior to their effective grant date (the performance period). Compensation expense is initially measured using the average fair market value of ConocoPhillips common stock and is subsequently adjusted, based on changes in the ConocoPhillips stock price through the end of each subsequent reporting period, through the grant date for stock-settled awards and the settlement date for cash-settled awards.
Stock-Settled
For performance periods beginning before 2009, PSUs do not vest until the employee becomes eligible for retirement by reaching age 55 with five years of service, and restrictions do not lapse until the employee separates from the Company. With respect to awards for performance periods beginning in 2009 through 2012, PSUs do not vest until the earlier of the date the employee becomes eligible for retirement by reaching age 55 with five years of service or five years after the grant date of the award, and restrictions do not lapse until the earlier of the employee's separation from the Company or five years after the grant date (although recipients can elect to defer the lapsing of restrictions until separation). We recognize compensation expense for these awards beginning on the grant date and ending on the date the PSUs are scheduled to vest. Since these awards are authorized three years prior to the grant date, for employees eligible for retirement by or shortly after the grant date, we recognize compensation expense over the period beginning on the date of authorization and ending on the date of grant. Until issued as stock, recipients of the PSUs receive a quarterly cash payment of a dividend equivalent that is charged to retained earnings. Beginning in 2013, PSUs authorized for future grants will vest, absent employee election to defer, upon settlement following the conclusion of the three-year performance period. We recognize compensation expense over the period beginning on the date of authorization and ending on the conclusion of the performance period. PSUs are settled by issuing one share of ConocoPhillips common stock per unit.
123
The following summarizes our stock-settled Performance Share Program activity for the year ended December 31, 2014:
| Weighted-Average | Millions of Dollars | |||||||||||
| Stock Units | Grant Date Fair Value | Total Fair Value | ||||||||||
Outstanding at December 31, 2013 | 4,901,186 | $ | 51.60 | |||||||||
Granted | 35,052 | 65.46 | ||||||||||
Forfeited | (16,651) | 55.51 | ||||||||||
Issued | (268,343) | $ | 18 | |||||||||
|
|
| ||||||||||
Outstanding at December 31, 2014 | 4,651,244 | $ | 51.75 | |||||||||
|
|
| ||||||||||
Not Vested at December 31, 2014 | 931,935 | $ | 52.95 | |||||||||
|
|
| ||||||||||
At December 31, 2014, the remaining unrecognized compensation cost from unvested stock-settled performance share awards was $19 million, which includes $5 million related to unvested stock-settled performance share awards tied to Phillips 66 stock held by ConocoPhillips employees, which will be recognized over a weighted-average period of 2.54 years, the longest period being 5.98 years. The weighted-average grant date fair value of stock-settled PSUs granted during 2013 and 2012 was $60.00 and $74.16, respectively. The total fair value of stock-settled PSUs issued during 2013 and 2012 was $18 million and $71 million, respectively.
Cash-Settled
In connection with and immediately following the separation of our Downstream business in 2012, grants of new PSUs, subject to a shortened performance period, were authorized. Once granted, these PSUs vest, absent employee election to defer, on the earlier of five years after the grant date of the award or the date the employee becomes eligible for retirement. For employees eligible for retirement by or shortly after the grant date, we recognize compensation expense over the period beginning on the date of authorization and ending on the date of grant. Otherwise, we recognize compensation expense beginning on the grant date and ending on the date the PSUs are scheduled to vest. These PSUs are settled in cash equal to the fair market value of a share of ConocoPhillips common stock per unit on the settlement date and thus are classified as liabilities on the balance sheet. Until settlement occurs, recipients of the PSUs receive a quarterly cash payment of a dividend equivalent that is charged to compensation expense.
Beginning in 2013, PSUs authorized for future grants will vest upon settlement following the conclusion of the three-year performance period. We recognize compensation expense over the period beginning on the date of authorization and ending on the conclusion of the performance period. These PSUs will be settled in cash equal to the fair market value of a share of ConocoPhillips common stock per unit on the settlement date and are classified as liabilities on the balance sheet.
The following summarizes our cash-settled Performance Share Program activity for the year ended December 31, 2014:
| Weighted-Average | Millions of Dollars | |||||||||||
| Stock Units | Grant Date Fair Value | Total Fair Value | ||||||||||
Outstanding at December 31, 2013 | 124,776 | $ | 58.08 | |||||||||
Granted | 561,287 | 69.23 | ||||||||||
Forfeited | (10,476) | 64.58 | ||||||||||
Settled | - | $ | - | |||||||||
|
|
| ||||||||||
Outstanding at December 31, 2014 | 675,587 | $ | 69.23 | |||||||||
|
|
| ||||||||||
Not Vested at December 31, 2014 | 438,069 | $ | 69.23 | |||||||||
|
|
| ||||||||||
124
At December 31, 2014, the remaining unrecognized compensation cost from unvested cash-settled performance share awards was $21 million, which will be recognized over a weighted-average period of 2.50 years, the longest period being 4.13 years. The weighted-average grant date fair value of cash-settled PSUs granted during 2013 was $58.08. The total fair value of cash-settled performance share awards settled during 2013 was zero. There were no cash-settled performance share awards granted, issued or outstanding as of December 31, 2012.
From inception of the Performance Share Program through 2013, approved PSU awards were granted after the conclusion of performance periods. Beginning in February 2014, initial target PSU awards are issued near the beginning of new performance periods. These initial target PSU awards will terminate at the end of the performance periods and will be settled after the performance periods have ended. Also in 2014, initial target PSU awards were issued for open performance periods that began in prior years. For the open performance period beginning in 2012, the initial target PSU awards will terminate at the end of the three-year performance period and will be replaced with approved PSU awards. For the open performance period beginning in 2013, the initial target PSU awards will terminate at the end of the three-year performance period and will be settled after the performance period has ended. There is no effect on recognition of compensation expense.
Other -In addition to the above active programs, we have outstanding shares of restricted stock and restricted stock units that were either issued to replace awards held by employees of companies we acquired or issued as part of a compensation program that has been discontinued. Generally, the recipients of the restricted shares or units receive a quarterly dividend or dividend equivalent.
The following summarizes the aggregate activity of these restricted shares and units for the year ended December 31, 2014:
| Weighted-Average | Millions of Dollars | |||||||||||
| Stock Units | Grant Date Fair Value | Total Fair Value | ||||||||||
Outstanding at December 31, 2013 | 1,172,601 | $ | 29.31 | |||||||||
Granted | 73,742 | 71.23 | ||||||||||
Forfeited | - | |||||||||||
Issued | (39,308) | $ | 3 | |||||||||
|
|
| ||||||||||
Outstanding at December 31, 2014 | 1,207,035 | $ | 31.48 | |||||||||
|
|
| ||||||||||
Not Vested at December 31, 2014 | - | |||||||||||
| ||||||||||||
At December 31, 2014, all outstanding restricted stock and restricted stock units were fully vested and there was no remaining compensation cost to be recorded. The weighted-average grant date fair value of awards granted during 2013 and 2012 was $62.52 and $63.54, respectively. The total fair value of awards issued during 2013 and 2012 was $2 million and $73 million, respectively.
125
Note 18-Income Taxes
Income taxes charged to income from continuing operations were:
| Millions of Dollars | ||||||||||||
| 2014 | 2013 | 2012 | ||||||||||
|
| |||||||||||
Income Taxes | ||||||||||||
Federal | ||||||||||||
Current | $ | 188 | 724 | 63 | ||||||||
Deferred | 365 | 811 | 624 | |||||||||
Foreign | ||||||||||||
Current | 2,846 | 4,249 | 6,255 | |||||||||
Deferred | 252 | 504 | 744 | |||||||||
State and local | ||||||||||||
Current | 46 | 220 | 231 | |||||||||
Deferred | (114 | ) | (99 | ) | 25 | |||||||
| ||||||||||||
| $ | 3,583 | 6,409 | 7,942 | |||||||||
| ||||||||||||
Deferred income taxes reflect the net tax effect of temporary differences between the carrying amounts of assets and liabilities for financial reporting purposes and the amounts used for tax purposes. Major components of deferred tax liabilities and assets at December 31 were:
| Millions of Dollars | ||||||||
| 2014 | 2013 | |||||||
|
| |||||||
Deferred Tax Liabilities | ||||||||
PP&E and intangibles | $ | 20,054 | 20,079 | |||||
Investment in joint ventures | 1,013 | 943 | ||||||
Inventory | 51 | 86 | ||||||
Deferred state income tax | 63 | - | ||||||
Partnership income deferral | 155 | 168 | ||||||
Other | 509 | 724 | ||||||
| ||||||||
Total deferred tax liabilities | 21,845 | 22,000 | ||||||
| ||||||||
Deferred Tax Assets | ||||||||
Benefit plan accruals | 1,552 | 1,274 | ||||||
Asset retirement obligations and accrued environmental costs | 4,971 | 4,483 | ||||||
Deferred state income tax | - | 49 | ||||||
Other financial accruals and deferrals | 552 | 297 | ||||||
Loss and credit carryforwards | 1,568 | 1,487 | ||||||
Other | 329 | 267 | ||||||
| ||||||||
Total deferred tax assets | 8,972 | 7,857 | ||||||
Less: valuation allowance | (970 | ) | (969) | |||||
| ||||||||
Net deferred tax assets | 8,002 | 6,888 | ||||||
| ||||||||
Net deferred tax liabilities | $ | 13,843 | 15,112 | |||||
| ||||||||
Current assets, long-term assets, current liabilities and long-term liabilities included deferred taxes of $865 million, $370 million, $8 million and $15,070 million, respectively, at December 31, 2014, and $703 million, $171 million, $766 million and $15,220 million, respectively, at December 31, 2013.
We have loss and credit carryovers in multiple taxing jurisdictions. These attributes generally expire between 2015 and 2035 with some carryovers having indefinite carryforward periods.
126
Valuation allowances have been established to reduce deferred tax assets to an amount that will, more likely than not, be realized. Based on our historical taxable income, expectations for the future, and available tax-planning strategies, management expects remaining net deferred tax assets will be realized as offsets to reversing deferred tax liabilities and as offsets to the tax consequences of future taxable income.
At December 31, 2014, unremitted income considered to be permanently reinvested in certain foreign subsidiaries and foreign corporate joint ventures totaled approximately $293 million. Deferred income taxes have not been provided on this amount, as we do not plan to initiate any action that would require the payment of income taxes. Due to the nature of our structures within the jurisdictions in which we operate as well as the complex nature of the relevant tax laws, it is not practicable to estimate the amount of additional tax, if any, that might be payable on this income if distributed.
The following table shows a reconciliation of the beginning and ending unrecognized tax benefits for 2014, 2013 and 2012:
| Millions of Dollars | ||||||||||||
| 2014 | 2013 | 2012 | ||||||||||
|
| |||||||||||
Balance at January 1 | $ | 655 | 872 | 1,071 | ||||||||
Additions based on tax positions related to the current year | 46 | 52 | 98 | |||||||||
Additions for tax positions of prior years | 7 | 30 | 48 | |||||||||
Reductions for tax positions of prior years | (228 | ) | (251 | ) | (206) | |||||||
Settlements | (28 | ) | (48 | ) | (108) | |||||||
Lapse of statute | (10 | ) | - | (31) | ||||||||
| ||||||||||||
Balance at December 31 | $ | 442 | 655 | 872 | ||||||||
| ||||||||||||
Included in the balance of unrecognized tax benefits for 2014, 2013 and 2012 were $348 million, $440 million and $650 million, respectively, which, if recognized, would impact our effective tax rate.
At December 31, 2014, 2013 and 2012, accrued liabilities for interest and penalties totaled $65 million, $120 million and $129 million, respectively, net of accrued income taxes. Interest and penalties resulted in a benefit to earnings of $43 million, $9 million and $9 million in 2014, 2013 and 2012, respectively.
We and our subsidiaries file tax returns in the U.S. federal jurisdiction and in many foreign and state jurisdictions. Audits in major jurisdictions are generally complete as follows: United Kingdom (2011), Canada (2007), United States (2010) and Norway (2013). Issues in dispute for audited years and audits for subsequent years are ongoing and in various stages of completion in the many jurisdictions in which we operate around the world. As a consequence, the balance in unrecognized tax benefits can be expected to fluctuate from period to period. It is reasonably possible such changes could be significant when compared with our total unrecognized tax benefits, but the amount of change is not estimable.
127
The amounts of U.S. and foreign income from continuing operations before income taxes, with a reconciliation of tax at the federal statutory rate with the provision for income taxes, were:
| Percent of | ||||||||||||||||||||||||
| Millions of Dollars | Pre-Tax Income | |||||||||||||||||||||||
| 2014 | 2013 | 2012 | 2014 | 2013 | 2012 | |||||||||||||||||||
|
|
|
| |||||||||||||||||||||
Income before income taxes from continuing operations | ||||||||||||||||||||||||
United States | $ | 2,310 | 5,046 | 4,070 | 24.6 | % | 34.9 | 26.4 | ||||||||||||||||
Foreign | 7,080 | 9,400 | 11,353 | 75.4 | 65.1 | 73.6 | ||||||||||||||||||
| ||||||||||||||||||||||||
| $ | 9,390 | 14,446 | 15,423 | 100.0 | % | 100.0 | 100.0 | |||||||||||||||||
| ||||||||||||||||||||||||
Federal statutory income tax | $ | 3,287 | 5,056 | 5,398 | 35.0 | % | 35.0 | 35.0 | ||||||||||||||||
Foreign taxes in excess of federal statutory rate | 376 | 1,389 | 2,878 | 4.0 | 9.6 | 18.6 | ||||||||||||||||||
Capital loss benefit | - | (79 | ) | (461 | ) | - | (0.5 | ) | (3.0 | ) | ||||||||||||||
Federal manufacturing deduction | (15 | ) | (35 | ) | (52 | ) | (0.2 | ) | (0.2 | ) | (0.3 | ) | ||||||||||||
State income tax | (44 | ) | 79 | 166 | (0.5 | ) | 0.5 | 1.1 | ||||||||||||||||
Other | (21 | ) | (1 | ) | 13 | (0.2 | ) | - | 0.1 | |||||||||||||||
| ||||||||||||||||||||||||
| $ | 3,583 | 6,409 | 7,942 | 38.1 | % | 44.4 | 51.5 | |||||||||||||||||
| ||||||||||||||||||||||||
The change in the effective tax rate from 2013 to 2014, as well as from 2012 to 2013, was primarily due to lower income in high tax jurisdictions.
Statutory tax rate changes did not have a significant impact on our income tax expense in 2014.
In the United Kingdom, legislation was enacted on July 17, 2012, restricting corporate tax relief on decommissioning costs to 50 percent, retroactively effective from March 21, 2012. Our 2012 earnings were reduced by $192 million due to remeasurement of deferred tax balances as of the effective date.
Note 19-Accumulated Other Comprehensive Income
Accumulated other comprehensive income (loss) in the equity section of the balance sheet included:
| Millions of Dollars | ||||||||||||||||
| Defined Benefit Plans | Foreign Currency Translation | Hedging | Accumulated Other Comprehensive Income (Loss) | |||||||||||||
|
| |||||||||||||||
December 31, 2011 | $ | (1,971 | ) | 5,223 | (6 | ) | 3,246 | |||||||||
Other comprehensive income (loss) | (137 | ) | 758 | 6 | 627 | |||||||||||
Separation of Downstream business | 683 | (469 | ) | - | 214 | |||||||||||
| ||||||||||||||||
December 31, 2012 | (1,425 | ) | 5,512 | - | 4,087 | |||||||||||
Other comprehensive income (loss) | 601 | (2,686 | ) | - | (2,085) | |||||||||||
| ||||||||||||||||
December 31, 2013 | (824 | ) | 2,826 | - | 2,002 | |||||||||||
Other comprehensive loss | (437 | ) | (3,467 | ) | - | (3,904) | ||||||||||
| ||||||||||||||||
December 31, 2014 | $ | (1,261 | ) | (641 | ) | - | (1,902) | |||||||||
| ||||||||||||||||
128
The following table summarizes reclassifications out of accumulated other comprehensive income during the year-ended December 31:
| Millions of Dollars | ||||||||
| 2014 | 2013 | |||||||
|
| |||||||
Defined Benefit Plans | $ | 81 | 184 | |||||
| ||||||||
| Above amounts are included in the computation of net periodic benefit cost and are presented net of tax expense of: | $ | 44 | 105 | |||||
See Note 17-Employee Benefit Plans, for additional information.
There were no items within accumulated other comprehensive income related to noncontrolling interests.
Note 20-Cash Flow Information
Amounts included in continuing operations for the years ended December 31 were:
| Millions of Dollars | ||||||||||||
| 2014 | 2013 | 2012 | ||||||||||
|
| |||||||||||
Noncash Investing and Financing Activities | ||||||||||||
Increase in PP&E related to an increase in asset retirement obligations* | $ | 1,611 | 1,329 | 1,010 | ||||||||
Increase (decrease) in PP&E and debt related to a capital lease asset and obligation | (84 | ) | 906 | - | ||||||||
| ||||||||||||
Cash Payments | ||||||||||||
Interest | $ | 669 | 566 | 724 | ||||||||
Income taxes** | 4,203 | 4,910 | 8,100 | |||||||||
| ||||||||||||
Net Sales (Purchases) of Short-Term Investments | ||||||||||||
Short-term investments purchased | $ | (876 | ) | (361 | ) | (497) | ||||||
Short-term investments sold | 1,129 | 98 | 1,094 | |||||||||
| ||||||||||||
| $ | 253 | (263 | ) | 597 | ||||||||
| ||||||||||||
| * | Includes $68 million, $212 million and $152 million in 2014, 2013 and 2012, respectively, primarily related to the impact of U.K. tax law deductibility of decommissioning costs. |
| ** | 2012 has been revised to conform to current-year presentation to include only income tax payments related to continuing operations. |
129
Note 21-Other Financial Information
Amounts included in continuing operations for the years ended December 31 were:
| Millions of Dollars | ||||||||||||
| 2014 | 2013 | 2012 | ||||||||||
|
| |||||||||||
Interest and Debt Expense | ||||||||||||
Incurred | ||||||||||||
Debt | $ | 1,063 | 1,087 | 1,170 | ||||||||
Other | 73 | 192 | 154 | |||||||||
| ||||||||||||
| 1,136 | 1,279 | 1,324 | ||||||||||
Capitalized | (488 | ) | (667 | ) | (615) | |||||||
| ||||||||||||
Expensed | $ | 648 | 612 | 709 | ||||||||
| ||||||||||||
Other Income | ||||||||||||
Interest income | $ | 83 | 113 | 163 | ||||||||
Other, net | 283 | 261 | 306 | |||||||||
| ||||||||||||
| $ | 366 | 374 | 469 | |||||||||
| ||||||||||||
Research and Development Expenditures -expensed | $ | 263 | 258 | 221 | ||||||||
| ||||||||||||
Shipping and Handling Costs* | $ | 1,360 | 1,137 | 1,338 | ||||||||
| ||||||||||||
*Amounts included in production and operating expenses. | ||||||||||||
Foreign Currency Transaction (Gains) Losses -after-tax | ||||||||||||
Alaska | $ | - | - | - | ||||||||
Lower 48 | - | - | - | |||||||||
Canada | (4 | ) | (6 | ) | 5 | |||||||
Europe | (55 | ) | (31 | ) | 21 | |||||||
Asia Pacific and Middle East | - | (29 | ) | 29 | ||||||||
Other International | (1 | ) | 2 | 1 | ||||||||
Corporate and Other | 16 | 31 | 2 | |||||||||
| ||||||||||||
| $ | (44 | ) | (33 | ) | 58 | |||||||
| ||||||||||||
| Millions of Dollars | ||||||||
| 2014 | 2013 | |||||||
|
|
|
| |||||
Properties, Plants and Equipment | ||||||||
Proved properties* | $ | 130,448 | 123,012 | |||||
Unproved properties* | 8,951 | 8,465 | ||||||
Other | 6,831 | 6,671 | ||||||
| ||||||||
Gross properties, plants and equipment | 146,230 | 138,148 | ||||||
Less: Accumulated depreciation, depletion and amortization | (70,786 | ) | (65,321) | |||||
| ||||||||
Net properties, plants and equipment | $ | 75,444 | 72,827 | |||||
| ||||||||
| * | Excludes assets held for sale reclassified to prepaid expenses and other current assets, including proved and unproved properties of $1,773 million and $73 million, respectively, at December 31, 2013. |
130
Note 22-Related Party Transactions
We consider our equity method investments to be related parties. Significant transactions with related parties were:
| Millions of Dollars | ||||||||||||
| 2014 | 2013 | 2012 | ||||||||||
|
| |||||||||||
Operating revenues and other income | $ | 119 | 102 | 59 | ||||||||
Purchases | 190 | 184 | 261 | |||||||||
Operating expenses and selling, general and administrative expenses* | 70 | 35 | 28 | |||||||||
Net interest (income) expense** | (44 | ) | 31 | 38 | ||||||||
| ||||||||||||
| * | 2013 and 2012 have been restated to eliminate certain non-related party transactions. |
| ** | We paid interest to, or received interest from, various affiliates. See Note 6-Investments, Loans and Long-Term Receivables for additional information on loans to affiliated companies. |
The table above includes transactions with Freeport LNG through the date of the termination agreement and excludes the termination fee. See Note 3-Variable Interest Entities (VIEs), for additional information.
Note 23-Segment Disclosures and Related Information
We explore for, produce, transport and market crude oil, bitumen, natural gas, LNG and natural gas liquids on a worldwide basis. We manage our operations through six operating segments, which are primarily defined by geographic region: Alaska, Lower 48, Canada, Europe, Asia Pacific and Middle East, and Other International.
Effective April 1, 2014, the Other International segment was restructured to focus on enhancing our capability to operate in emerging and new country business units. As a result, we moved the Latin America and Poland businesses from the historically presented Lower 48 and Latin America segment and the Europe segment to the Other International segment. Results of operations for the Lower 48, Europe and Other International segments have been revised for all periods presented. There was no impact on our consolidated financial statements, and the impact on our segment presentation was immaterial.
On April 30, 2012, our Downstream business was separated into a stand-alone, publicly traded corporation, Phillips 66. In 2012, we also agreed to sell our Nigeria and Algeria businesses and our interest in Kashagan. Accordingly, results for these operations have been reported as discontinued operations in all periods presented. Commodity sales to Phillips 66, which were previously eliminated in consolidation prior to the separation, are now reported as third-party sales. For additional information, see Note 2-Discontinued Operations.
Corporate and Other represents costs not directly associated with an operating segment, such as most interest expense, corporate overhead, costs associated with the separation and certain technology activities, including licensing revenues. Corporate assets include all cash and cash equivalents and short-term investments.
We evaluate performance and allocate resources based on net income attributable to ConocoPhillips. Segment accounting policies are the same as those in Note 1-Accounting Policies. Intersegment sales are at prices that approximate market.
131
Analysis of Results by Operating Segment
| Millions of Dollars | ||||||||||||
| 2014 | 2013 | 2012 | ||||||||||
|
| |||||||||||
Sales and Other Operating Revenues | ||||||||||||
Alaska | $ | 8,382 | 8,553 | 9,502 | ||||||||
| ||||||||||||
Lower 48 | 21,721 | 19,480 | 19,600 | |||||||||
Intersegment eliminations | (107 | ) | (104 | ) | (230) | |||||||
| ||||||||||||
Lower 48 | 21,614 | 19,376 | 19,370 | |||||||||
| ||||||||||||
Canada | 5,162 | 5,254 | 5,028 | |||||||||
Intersegment eliminations | (753 | ) | (607 | ) | (475) | |||||||
| ||||||||||||
Canada | 4,409 | 4,647 | 4,553 | |||||||||
| ||||||||||||
Europe | 10,437 | 12,040 | 14,709 | |||||||||
Intersegment eliminations | (49 | ) | - | (72) | ||||||||
| ||||||||||||
Europe | 10,388 | 12,040 | 14,637 | |||||||||
| ||||||||||||
Asia Pacific and Middle East | 7,425 | 8,426 | 7,705 | |||||||||
Intersegment eliminations | (1 | ) | - | (41) | ||||||||
| ||||||||||||
Asia Pacific and Middle East | 7,424 | 8,426 | 7,664 | |||||||||
| ||||||||||||
Other International | 228 | 1,208 | 2,088 | |||||||||
Corporate and Other | 79 | 163 | 153 | |||||||||
| ||||||||||||
Consolidated sales and other operating revenues | $ | 52,524 | 54,413 | 57,967 | ||||||||
| ||||||||||||
Depreciation, Depletion, Amortization and Impairments | ||||||||||||
Alaska | $ | 584 | 533 | 520 | ||||||||
Lower 48 | 3,911 | 3,247 | 2,796 | |||||||||
Canada | 962 | 1,531 | 1,600 | |||||||||
Europe | 2,339 | 1,334 | 1,203 | |||||||||
Asia Pacific and Middle East | 1,275 | 1,188 | 1,002 | |||||||||
Other International | 7 | 30 | 45 | |||||||||
Corporate and Other | 107 | 100 | 94 | |||||||||
| ||||||||||||
Consolidated depreciation, depletion, amortization and impairments | $ | 9,185 | 7,963 | 7,260 | ||||||||
| ||||||||||||
132
| Millions of Dollars | ||||||||||||
| 2014 | 2013 | 2012 | ||||||||||
|
| |||||||||||
Equity in Earnings of Affiliates | ||||||||||||
Alaska | $ | 9 | 7 | 10 | ||||||||
Lower 48 | 1 | (2 | ) | 3 | ||||||||
Canada | 1,385 | 984 | 726 | |||||||||
Europe | 37 | 27 | 31 | |||||||||
Asia Pacific and Middle East | 1,089 | 1,162 | 1,057 | |||||||||
Other International | 9 | 43 | 87 | |||||||||
Corporate and Other | (1 | ) | (2 | ) | (3) | |||||||
| ||||||||||||
Consolidated equity in earnings of affiliates | $ | 2,529 | 2,219 | 1,911 | ||||||||
| ||||||||||||
Income Taxes | ||||||||||||
Alaska | $ | 1,081 | 1,275 | 1,266 | ||||||||
Lower 48 | (92 | ) | 398 | 126 | ||||||||
Canada | 236 | (44 | ) | (252) | ||||||||
Europe | 1,488 | 2,323 | 4,012 | |||||||||
Asia Pacific and Middle East | 1,194 | 1,512 | 1,578 | |||||||||
Other International | - | 1,069 | 1,492 | |||||||||
Corporate and Other | (324 | ) | (124 | ) | (280) | |||||||
| ||||||||||||
Consolidated income taxes | $ | 3,583 | 6,409 | 7,942 | ||||||||
| ||||||||||||
Net Income Attributable to ConocoPhillips | ||||||||||||
Alaska | $ | 2,041 | 2,274 | 2,276 | ||||||||
Lower 48 | (22 | ) | 754 | 744 | ||||||||
Canada | 940 | 718 | (684) | |||||||||
Europe | 804 | 1,229 | 1,518 | |||||||||
Asia Pacific and Middle East | 2,939 | 3,532 | 3,928 | |||||||||
Other International | (90 | ) | 291 | 624 | ||||||||
Corporate and Other | (874 | ) | (820 | ) | (993) | |||||||
Discontinued operations | 1,131 | 1,178 | 1,015 | |||||||||
| ||||||||||||
Consolidated net income attributable to ConocoPhillips | $ | 6,869 | 9,156 | 8,428 | ||||||||
| ||||||||||||
Investments In and Advances To Affiliates | ||||||||||||
Alaska | $ | 53 | 53 | 56 | ||||||||
Lower 48 | 471 | 905 | 950 | |||||||||
Canada | 9,484 | 10,273 | 9,973 | |||||||||
Europe | 126 | 143 | 179 | |||||||||
Asia Pacific and Middle East | 14,022 | 12,806 | 12,468 | |||||||||
Other International | 59 | 141 | 307 | |||||||||
Corporate and Other | 15 | 16 | 15 | |||||||||
| ||||||||||||
Consolidated investments in and advances to affiliates | $ | 24,230 | 24,337 | 23,948 | ||||||||
| ||||||||||||
133
| Millions of Dollars | ||||||||||||
| 2014 | 2013 | 2012 | ||||||||||
|
| |||||||||||
Total Assets | ||||||||||||
Alaska | $ | 12,655 | 11,662 | 10,950 | ||||||||
Lower 48 | 30,185 | 29,552 | 28,708 | |||||||||
Canada | 21,764 | 22,394 | 22,308 | |||||||||
Europe | 16,125 | 17,223 | 15,496 | |||||||||
Asia Pacific and Middle East | 25,976 | 25,473 | 23,721 | |||||||||
Other International | 1,961 | 1,705 | 1,671 | |||||||||
Corporate and Other | 7,815 | 8,367 | 6,823 | |||||||||
Discontinued operations | 58 | 1,681 | 7,467 | |||||||||
| ||||||||||||
Consolidated total assets | $ | 116,539 | 118,057 | 117,144 | ||||||||
| ||||||||||||
Capital Expenditures and Investments | ||||||||||||
Alaska | $ | 1,564 | 1,140 | 828 | ||||||||
Lower 48 | 6,054 | 5,210 | 5,249 | |||||||||
Canada | 2,340 | 2,232 | 2,184 | |||||||||
Europe | 2,521 | 3,078 | 2,844 | |||||||||
Asia Pacific and Middle East | 3,877 | 3,382 | 2,430 | |||||||||
Other International | 539 | 313 | 433 | |||||||||
Corporate and Other | 190 | 182 | 204 | |||||||||
| ||||||||||||
Consolidated capital expenditures and investments | $ | 17,085 | 15,537 | 14,172 | ||||||||
| ||||||||||||
Interest Income and Expense | ||||||||||||
Interest income | ||||||||||||
Corporate | $ | 40 | 60 | 96 | ||||||||
Lower 48 | 35 | 43 | 47 | |||||||||
Europe | 2 | 1 | - | |||||||||
Asia Pacific and Middle East | 6 | 8 | 11 | |||||||||
Other International | - | 1 | 9 | |||||||||
| ||||||||||||
Interest and debt expense | ||||||||||||
Corporate | $ | 648 | 532 | 606 | ||||||||
Canada | - | 80 | 103 | |||||||||
| ||||||||||||
Sales and Other Operating Revenues by Product | ||||||||||||
Crude oil | $ | 23,784 | 24,899 | 26,302 | ||||||||
Natural gas | 20,717 | 22,539 | 25,163 | |||||||||
Natural gas liquids | 2,245 | 2,111 | 2,416 | |||||||||
Other* | 5,778 | 4,864 | 4,086 | |||||||||
| ||||||||||||
Consolidated sales and other operating revenues by product | $ | 52,524 | 54,413 | 57,967 | ||||||||
| ||||||||||||
| *Includes | LNG and bitumen. |
134
Geographic Information
| Millions of Dollars | ||||||||||||||||||||||||
| Sales and Other Operating Revenues (1) | Long-Lived Assets (2) | |||||||||||||||||||||||
| 2014 | 2013 | 2012 | 2014 | 2013 | 2012 | |||||||||||||||||||
|
|
|
| |||||||||||||||||||||
United States | $ | 30,019 | 27,954 | 28,901 | 39,641 | 37,593 | 35,443 | |||||||||||||||||
Australia (3) | 3,258 | 3,571 | 3,371 | 14,969 | 13,450 | 13,483 | ||||||||||||||||||
Canada | 4,409 | 4,647 | 4,553 | 20,874 | 21,380 | 21,304 | ||||||||||||||||||
China | 1,701 | 2,120 | 1,499 | 1,913 | 2,143 | 2,408 | ||||||||||||||||||
Indonesia | 1,963 | 2,083 | 2,198 | 1,526 | 1,780 | 1,662 | ||||||||||||||||||
Malaysia | 403 | 281 | - | 3,811 | 3,406 | 1,832 | ||||||||||||||||||
Norway | 3,794 | 4,323 | 5,059 | 8,142 | 8,089 | 7,288 | ||||||||||||||||||
United Kingdom | 6,594 | 7,717 | 9,578 | 5,327 | 5,959 | 4,480 | ||||||||||||||||||
Other foreign countries | 383 | 1,717 | 2,808 | 3,471 | 3,364 | 3,311 | ||||||||||||||||||
| ||||||||||||||||||||||||
Worldwide consolidated | $ | 52,524 | 54,413 | 57,967 | 99,674 | 97,164 | 91,211 | |||||||||||||||||
| ||||||||||||||||||||||||
(1)Sales and other operating revenues are attributable to countries based on the location of the operations generating the revenues.
(2)Defined as net PP&E plus investments in and advances to affiliated companies.
(3)Includes amounts related to the joint petroleum development area with shared ownership held by Australia and Timor-Leste.
Note 24-New Accounting Standards
In May 2014 the Financial Accounting Standards Board (FASB) issued Accounting Standards Update (ASU) No. 2014-09, "Revenue from Contracts with Customers," which outlines a single comprehensive model for entities to use in accounting for revenue arising from contracts with customers. This ASU supersedes the revenue recognition requirements in FASB Accounting Standards Codification (ASC) Topic 605, "Revenue Recognition," and most industry-specific guidance. This ASU sets forth a five-step model for determining when and how revenue is recognized. Under the model, an entity will be required to recognize revenue to depict the transfer of goods or services to a customer at an amount reflecting the consideration it expects to receive in exchange for those goods or services. Additional disclosures will be required to describe the nature, amount, timing and uncertainty of revenue and cash flows arising from customer contracts. The ASU is effective for interim and annual periods beginning after December 15, 2016. Early adoption is not permitted. Entities may choose to adopt the standard using either a full retrospective approach or a modified retrospective approach. We are currently evaluating the impact of the adoption of this ASU.
On February 18, 2015, the FASB issued ASU No. 2015-02, "Amendments to the Consolidation Analysis," which amends existing requirements applicable to reporting entities that are required to evaluate whether certain legal entities should be consolidated. The ASU is effective for interim and annual periods beginning after December 15, 2015.
135
Oil and Gas Operations (Unaudited)
In accordance with Financial Accounting Standards Board (FASB) Accounting Standards Codification Topic 932, "Extractive Activities-Oil and Gas," and regulations of the U.S. Securities and Exchange Commission (SEC), we are making certain supplemental disclosures about our oil and gas exploration and production operations.
These disclosures include information about our consolidated oil and gas activities and our proportionate share of our equity affiliates' oil and gas activities in our operating segments. As a result, amounts reported as equity affiliates in Oil and Gas Operations may differ from those shown in the individual segment disclosures reported elsewhere in this report.
As required by current authoritative guidelines, the estimated future date when an asset will be permanently shut down for economic reasons is based on historical 12-month first-of-month average prices and current costs. This estimated date when production will end affects the amount of estimated reserves. Therefore, as prices and cost levels change from year to year, the estimate of proved reserves also changes. Generally, our proved reserves decrease as prices decline and increase as prices rise.
Our proved reserves include estimated quantities related to production sharing contracts (PSCs), which are reported under the "economic interest" method, as well as variable-royalty regimes, and are subject to fluctuations in commodity prices, recoverable operating expenses and capital costs. If costs remain stable, reserve quantities attributable to recovery of costs will change inversely to changes in commodity prices. For example, if prices increase, then our applicable reserve quantities would decline. At December 31, 2014, approximately 6 percent of our total proved reserves were under PSCs, located in our Asia Pacific/Middle East geographic reporting area, and 28 percent of our total proved reserves were under a variable-royalty regime, located in our Canada geographic reporting area.
Our reserves disclosures by geographic area include the United States, Canada, Europe (Norway and the United Kingdom), Asia Pacific/Middle East, Africa and Other Areas. Other Areas primarily consists of the Russia and Caspian regions.
As part of our asset disposition program, we sold our interest in Kashagan, and the Algeria and Nigeria businesses. These businesses were considered held for sale since the fourth quarter of 2012 and have been reported as discontinued operations for all periods presented. Accordingly, the Results of Operations, Average Sales Prices and Net Production tables included within the supplemental oil and gas disclosures reflect the associated earnings and production as discontinued operations.
Kashagan and Algeria were both sold in the fourth quarter of 2013. In July 2014 we sold our Nigeria business. See Note 2-Discontinued Operations, for additional information.
Reserves Governance
The recording and reporting of proved reserves are governed by criteria established by regulations of the SEC and FASB. Proved reserves are those quantities of oil and gas, which, by analysis of geoscience and engineering data, can be estimated with reasonable certainty to be economically producible-from a given date forward, from known reservoirs, and under existing economic conditions, operating methods, and government regulations-prior to the time at which contracts providing the right to operate expire, unless evidence indicates renewal is reasonably certain, regardless of whether deterministic or probabilistic methods are used for the estimation. The project to extract the hydrocarbons must have commenced or the operator must be reasonably certain it will commence the project within a reasonable time.
136
Proved reserves are further classified as either developed or undeveloped. Proved developed reserves are proved reserves that can be expected to be recovered through existing wells with existing equipment and operating methods, or in which the cost of the required equipment is relatively minor compared to the cost of a new well, and through installed extraction equipment and infrastructure operational at the time of the reserves estimate if the extraction is by means not involving a well. Proved undeveloped reserves are proved reserves expected to be recovered from new wells on undrilled acreage, or from existing wells where a relatively major expenditure is required for recompletion.
We have a companywide, comprehensive, SEC-compliant internal policy that governs the determination and reporting of proved reserves. This policy is applied by the geologists and reservoir engineers in our business units around the world. As part of our internal control process, each business unit's reserve processes and controls are reviewed annually by an internal team which is headed by the Company's Manager of Reserves Compliance and Reporting. This team, composed of internal reservoir engineers, geologists, finance personnel and a senior representative from DeGolyer and MacNaughton (D&M), a third-party petroleum engineering consulting firm, reviews the business units' reserves for adherence to SEC guidelines and Company policy through on-site visits, teleconferences and review of documentation. In addition to providing independent reviews, this internal team also ensures reserves are calculated using consistent and appropriate standards and procedures. This team is independent of business unit line management and is responsible for reporting its findings to senior management and our internal audit group. The team is responsible for communicating our reserves policy and procedures and is available for internal peer reviews and consultation on major projects or technical issues throughout the year. All of our proved reserves held by consolidated companies and our share of equity affiliates have been estimated by ConocoPhillips.
During 2014 our processes and controls used to assess over 90 percent of proved reserves as of December 31, 2014, were reviewed by D&M. The purpose of their review was to assess whether the adequacy and effectiveness of our internal processes and controls used to determine estimates of proved reserves are in accordance with SEC regulations. In such review, ConocoPhillips' technical staff presented D&M with an overview of the reserves data, as well as the methods and assumptions used in estimating reserves. The data presented included pertinent seismic information, geologic maps, well logs, production tests, material balance calculations, reservoir simulation models, well performance data, operating procedures and relevant economic criteria. Management's intent in retaining D&M to review its processes and controls was to provide objective third-party input on these processes and controls. D&M's opinion was the general processes and controls employed by ConocoPhillips in estimating its December 31, 2014, proved reserves for the properties reviewed are in accordance with the SEC reserves definitions. D&M's report is included as Exhibit 99 of this Annual Report on Form 10-K.
The technical person primarily responsible for overseeing the processes and internal controls used in the preparation of the Company's reserve estimates is the Manager of Reserves Compliance and Reporting. This individual is a petroleum engineer with a bachelor's degree in civil engineering. He is a member of the Society of Petroleum Engineers with over 30 years of oil and gas industry experience, including drilling and production engineering assignments in several field locations. He has held positions of increasing responsibility in reservoir engineering, reserves reporting and compliance, and business management.
Engineering estimates of the quantities of proved reserves are inherently imprecise. See the "Critical Accounting Estimates" section of Management's Discussion and Analysis of Financial Condition and Results of Operations for additional discussion of the sensitivities surrounding these estimates.
137
Proved Reserves
Years Ended December 31 | Crude Oil | |||||||||||||||||||||||||||||||||||
| Millions of Barrels | ||||||||||||||||||||||||||||||||||||
| Alaska | Lower 48 | Total U.S. | Canada | Europe | Asia Pacific/ Middle East | Africa | Other Areas | Total | ||||||||||||||||||||||||||||
|
| |||||||||||||||||||||||||||||||||||
Developed and Undeveloped | ||||||||||||||||||||||||||||||||||||
Consolidated operations | ||||||||||||||||||||||||||||||||||||
End of 2011 | 1,184 | 296 | 1,480 | 24 | 520 | 242 | 243 | 108 | 2,617 | |||||||||||||||||||||||||||
Revisions | (2 | ) | 11 | 9 | 2 | 28 | 13 | 2 | - | 54 | ||||||||||||||||||||||||||
Improved recovery | 12 | 4 | 16 | - | - | - | - | - | 16 | |||||||||||||||||||||||||||
Purchases | - | - | - | - | - | - | - | - | - | |||||||||||||||||||||||||||
Extensions and discoveries | 22 | 183 | 205 | 3 | 3 | 32 | 7 | - | 250 | |||||||||||||||||||||||||||
Production | (68 | ) | (47 | ) | (115 | ) | (5 | ) | (49 | ) | (25 | ) | (23 | ) | - | (217) | ||||||||||||||||||||
Sales | - | - | - | - | (15 | ) | (21 | ) | - | - | (36) | |||||||||||||||||||||||||
| ||||||||||||||||||||||||||||||||||||
End of 2012 | 1,148 | 447 | 1,595 | 24 | 487 | 241 | 229 | 108 | 2,684 | |||||||||||||||||||||||||||
Revisions | (7 | ) | 20 | 13 | 1 | (5 | ) | 11 | 23 | - | 43 | |||||||||||||||||||||||||
Improved recovery | 20 | - | 20 | 1 | - | - | - | - | 21 | |||||||||||||||||||||||||||
Purchases | - | - | - | - | - | - | - | - | - | |||||||||||||||||||||||||||
Extensions and discoveries | 9 | 235 | 244 | 1 | 19 | 9 | 22 | - | 295 | |||||||||||||||||||||||||||
Production | (64 | ) | (56 | ) | (120 | ) | (5 | ) | (42 | ) | (29 | ) | (16 | ) | - | (212) | ||||||||||||||||||||
Sales | - | (40 | ) | (40 | ) | - | (3 | ) | - | (21 | ) | (108 | ) | (172) | ||||||||||||||||||||||
| ||||||||||||||||||||||||||||||||||||
End of 2013 | 1,106 | 606 | 1,712 | 22 | 456 | 232 | 237 | - | 2,659 | |||||||||||||||||||||||||||
Revisions | (6 | ) | 25 | 19 | 3 | (1 | ) | 5 | - | - | 26 | |||||||||||||||||||||||||
Improved recovery | 8 | - | 8 | 2 | - | 3 | - | - | 13 | |||||||||||||||||||||||||||
Purchases | - | - | - | - | - | - | - | - | - | |||||||||||||||||||||||||||
Extensions and discoveries | 16 | 116 | 132 | 2 | - | 16 | - | - | 150 | |||||||||||||||||||||||||||
Production | (61 | ) | (71 | ) | (132 | ) | (5 | ) | (44 | ) | (29 | ) | (5 | ) | - | (215) | ||||||||||||||||||||
Sales | - | - | - | - | - | - | (28 | ) | - | (28) | ||||||||||||||||||||||||||
| ||||||||||||||||||||||||||||||||||||
End of 2014 | 1,063 | 676 | 1,739 | 24 | 411 | 227 | 204 | - | 2,605 | |||||||||||||||||||||||||||
| ||||||||||||||||||||||||||||||||||||
| ||||||||||||||||||||||||||||||||||||
Equity affiliates | ||||||||||||||||||||||||||||||||||||
End of 2011 | - | - | - | - | - | 97 | - | 27 | 124 | |||||||||||||||||||||||||||
Revisions | - | - | - | - | - | - | - | 1 | 1 | |||||||||||||||||||||||||||
Improved recovery | - | - | - | - | - | - | - | - | - | |||||||||||||||||||||||||||
Purchases | - | - | - | - | - | - | - | - | - | |||||||||||||||||||||||||||
Extensions and discoveries | - | - | - | - | - | - | - | - | - | |||||||||||||||||||||||||||
Production | - | - | - | - | - | (6 | ) | - | (5 | ) | (11) | |||||||||||||||||||||||||
Sales | - | - | - | - | - | - | - | (19 | ) | (19) | ||||||||||||||||||||||||||
| ||||||||||||||||||||||||||||||||||||
End of 2012 | - | - | - | - | - | 91 | - | 4 | 95 | |||||||||||||||||||||||||||
Revisions | - | - | - | - | - | - | - | 1 | 1 | |||||||||||||||||||||||||||
Improved recovery | - | - | - | - | - | - | - | - | - | |||||||||||||||||||||||||||
Purchases | - | - | - | - | - | - | - | - | - | |||||||||||||||||||||||||||
Extensions and discoveries | - | - | - | - | - | - | - | - | - | |||||||||||||||||||||||||||
Production | - | - | - | - | - | (5 | ) | - | (1 | ) | (6) | |||||||||||||||||||||||||
Sales | - | - | - | - | - | - | - | - | - | |||||||||||||||||||||||||||
| ||||||||||||||||||||||||||||||||||||
End of 2013 | - | - | - | - | - | 86 | - | 4 | 90 | |||||||||||||||||||||||||||
Revisions | - | - | - | - | - | 17 | - | 3 | 20 | |||||||||||||||||||||||||||
Improved recovery | - | - | - | - | - | - | - | - | - | |||||||||||||||||||||||||||
Purchases | - | - | - | - | - | - | - | - | - | |||||||||||||||||||||||||||
Extensions and discoveries | - | - | - | - | - | - | - | - | - | |||||||||||||||||||||||||||
Production | - | - | - | - | - | (5 | ) | - | (2 | ) | (7) | |||||||||||||||||||||||||
Sales | - | - | - | - | - | - | - | - | - | |||||||||||||||||||||||||||
| ||||||||||||||||||||||||||||||||||||
End of 2014 | - | - | - | - | - | 98 | - | 5 | 103 | |||||||||||||||||||||||||||
| ||||||||||||||||||||||||||||||||||||
| ||||||||||||||||||||||||||||||||||||
Total company | ||||||||||||||||||||||||||||||||||||
End of 2011 | 1,184 | 296 | 1,480 | 24 | 520 | 339 | 243 | 135 | 2,741 | |||||||||||||||||||||||||||
End of 2012 | 1,148 | 447 | 1,595 | 24 | 487 | 332 | 229 | 112 | 2,779 | |||||||||||||||||||||||||||
End of 2013 | 1,106 | 606 | 1,712 | 22 | 456 | 318 | 237 | 4 | 2,749 | |||||||||||||||||||||||||||
End of 2014 | 1,063 | 676 | 1,739 | 24 | 411 | 325 | 204 | 5 | 2,708 | |||||||||||||||||||||||||||
| ||||||||||||||||||||||||||||||||||||
138
Years Ended December 31 | Crude Oil | |||||||||||||||||||||||||||||||||||
| Millions of Barrels | ||||||||||||||||||||||||||||||||||||
| Alaska | Lower 48 | Total U.S. | Canada | Europe | Asia Pacific/ Middle East | Africa | Other Areas | Total | ||||||||||||||||||||||||||||
|
| |||||||||||||||||||||||||||||||||||
Developed | ||||||||||||||||||||||||||||||||||||
Consolidated operations | ||||||||||||||||||||||||||||||||||||
End of 2011 | 1,056 | 234 | 1,290 | 22 | 296 | 156 | 232 | - | 1,996 | |||||||||||||||||||||||||||
End of 2012 | 1,017 | 271 | 1,288 | 23 | 267 | 136 | 217 | - | 1,931 | |||||||||||||||||||||||||||
End of 2013 | 1,003 | 268 | 1,271 | 22 | 247 | 126 | 230 | - | 1,896 | |||||||||||||||||||||||||||
End of 2014 | 950 | 313 | 1,263 | 23 | 237 | 142 | 199 | - | 1,864 | |||||||||||||||||||||||||||
| ||||||||||||||||||||||||||||||||||||
Equity affiliates | ||||||||||||||||||||||||||||||||||||
End of 2011 | - | - | - | - | - | 97 | - | 27 | 124 | |||||||||||||||||||||||||||
End of 2012 | - | - | - | - | - | 91 | - | 4 | 95 | |||||||||||||||||||||||||||
End of 2013 | - | - | - | - | - | 86 | - | 4 | 90 | |||||||||||||||||||||||||||
End of 2014 | - | - | - | - | - | 98 | - | 5 | 103 | |||||||||||||||||||||||||||
| ||||||||||||||||||||||||||||||||||||
Undeveloped | ||||||||||||||||||||||||||||||||||||
Consolidated operations | ||||||||||||||||||||||||||||||||||||
End of 2011 | 128 | 62 | 190 | 2 | 224 | 86 | 11 | 108 | 621 | |||||||||||||||||||||||||||
End of 2012 | 131 | 176 | 307 | 1 | 220 | 105 | 12 | 108 | 753 | |||||||||||||||||||||||||||
End of 2013 | 103 | 338 | 441 | - | 209 | 106 | 7 | - | 763 | |||||||||||||||||||||||||||
End of 2014 | 113 | 363 | 476 | 1 | 174 | 85 | 5 | - | 741 | |||||||||||||||||||||||||||
| ||||||||||||||||||||||||||||||||||||
Equity affiliates | ||||||||||||||||||||||||||||||||||||
End of 2011 | - | - | - | - | - | - | - | - | - | |||||||||||||||||||||||||||
End of 2012 | - | - | - | - | - | - | - | - | - | |||||||||||||||||||||||||||
End of 2013 | - | - | - | - | - | - | - | - | - | |||||||||||||||||||||||||||
End of 2014 | - | - | - | - | - | - | - | - | - | |||||||||||||||||||||||||||
| ||||||||||||||||||||||||||||||||||||
Notable changes in proved crude oil reserves in the three years ended December 31, 2014, included:
| • | Extensions and discoveries : In 2014, 2013 and 2012 extensions and discoveries in Lower 48 were primarily due to continued drilling success in Eagle Ford and Bakken. |
| • | Sales : In 2014 sales in Africa reflect the sale of the Nigeria business. In 2013 sales in Lower 48 primarily reflect the majority of our producing zones in the Cedar Creek Anticline, sales in Africa reflect the sale of the Algeria business and sales in Other Areas reflect the sale of our interest in Kashagan. |
139
| Years Ended | Natural Gas Liquids | |||||||||||||||||||||||||||||||||||
| December 31 | Millions of Barrels | |||||||||||||||||||||||||||||||||||
| Alaska | Lower 48 | Total U.S. | Canada | Europe | Asia Pacific/ Middle East | Africa | Other Areas | Total | ||||||||||||||||||||||||||||
|
| |||||||||||||||||||||||||||||||||||
Developed and Undeveloped | ||||||||||||||||||||||||||||||||||||
Consolidated operations | ||||||||||||||||||||||||||||||||||||
End of 2011 | 127 | 402 | 529 | 57 | 35 | 31 | 18 | - | 670 | |||||||||||||||||||||||||||
Revisions | 1 | (10 | ) | (9 | ) | 1 | (2 | ) | (3 | ) | - | - | (13) | |||||||||||||||||||||||
Improved recovery | - | - | - | - | - | - | - | - | - | |||||||||||||||||||||||||||
Purchases | - | 1 | 1 | - | - | - | - | - | 1 | |||||||||||||||||||||||||||
Extensions and discoveries | - | 40 | 40 | 3 | - | - | - | - | 43 | |||||||||||||||||||||||||||
Production | (6 | ) | (30 | ) | (36 | ) | (9 | ) | (2 | ) | (6 | ) | (1 | ) | - | (54) | ||||||||||||||||||||
Sales | - | - | - | - | (1 | ) | - | - | - | (1) | ||||||||||||||||||||||||||
| ||||||||||||||||||||||||||||||||||||
End of 2012 | 122 | 403 | 525 | 52 | 30 | 22 | 17 | - | 646 | |||||||||||||||||||||||||||
Revisions | 9 | 36 | 45 | 10 | - | (5 | ) | - | - | 50 | ||||||||||||||||||||||||||
Improved recovery | - | - | - | - | - | - | - | - | - | |||||||||||||||||||||||||||
Purchases | - | - | - | - | - | - | - | - | - | |||||||||||||||||||||||||||
Extensions and discoveries | - | 58 | 58 | 2 | - | 2 | - | - | 62 | |||||||||||||||||||||||||||
Production | (6 | ) | (34 | ) | (40 | ) | (8 | ) | (2 | ) | (5 | ) | (1 | ) | - | (56) | ||||||||||||||||||||
Sales | - | (1 | ) | (1 | ) | - | - | - | (2 | ) | - | (3) | ||||||||||||||||||||||||
| ||||||||||||||||||||||||||||||||||||
End of 2013 | 125 | 462 | 587 | 56 | 28 | 14 | 14 | - | 699 | |||||||||||||||||||||||||||
Revisions | - | (13 | ) | (13 | ) | 15 | (1 | ) | 2 | - | - | 3 | ||||||||||||||||||||||||
Improved recovery | - | - | - | - | - | - | - | - | - | |||||||||||||||||||||||||||
Purchases | - | - | - | - | - | - | - | - | - | |||||||||||||||||||||||||||
Extensions and discoveries | - | 26 | 26 | 3 | - | - | - | - | 29 | |||||||||||||||||||||||||||
Production | (5 | ) | (35 | ) | (40 | ) | (8 | ) | (3 | ) | (3 | ) | (1 | ) | - | (55) | ||||||||||||||||||||
Sales | - | - | - | (1 | ) | - | - | (13 | ) | - | (14) | |||||||||||||||||||||||||
| ||||||||||||||||||||||||||||||||||||
End of 2014 | 120 | 440 | 560 | 65 | 24 | 13 | - | - | 662 | |||||||||||||||||||||||||||
| ||||||||||||||||||||||||||||||||||||
Equity affiliates | ||||||||||||||||||||||||||||||||||||
End of 2011 | - | - | - | - | - | 51 | - | - | 51 | |||||||||||||||||||||||||||
Revisions | - | - | - | - | - | - | - | - | - | |||||||||||||||||||||||||||
Improved recovery | - | - | - | - | - | - | - | - | - | |||||||||||||||||||||||||||
Purchases | - | - | - | - | - | - | - | - | - | |||||||||||||||||||||||||||
Extensions and discoveries | - | - | - | - | - | - | - | - | - | |||||||||||||||||||||||||||
Production | - | - | - | - | - | (3 | ) | - | - | (3) | ||||||||||||||||||||||||||
Sales | - | - | - | - | - | - | - | - | - | |||||||||||||||||||||||||||
| ||||||||||||||||||||||||||||||||||||
End of 2012 | - | - | - | - | - | 48 | - | - | 48 | |||||||||||||||||||||||||||
Revisions | - | - | - | - | - | - | - | - | - | |||||||||||||||||||||||||||
Improved recovery | - | - | - | - | - | - | - | - | - | |||||||||||||||||||||||||||
Purchases | - | - | - | - | - | - | - | - | - | |||||||||||||||||||||||||||
Extensions and discoveries | - | - | - | - | - | - | - | - | - | |||||||||||||||||||||||||||
Production | - | - | - | - | - | (3 | ) | - | - | (3) | ||||||||||||||||||||||||||
Sales | - | - | - | - | - | - | - | - | - | |||||||||||||||||||||||||||
| ||||||||||||||||||||||||||||||||||||
End of 2013 | - | - | - | - | - | 45 | - | - | 45 | |||||||||||||||||||||||||||
Revisions | - | - | - | - | - | 10 | - | - | 10 | |||||||||||||||||||||||||||
Improved recovery | - | - | - | - | - | - | - | - | - | |||||||||||||||||||||||||||
Purchases | - | - | - | - | - | - | - | - | - | |||||||||||||||||||||||||||
Extensions and discoveries | - | - | - | - | - | - | - | - | - | |||||||||||||||||||||||||||
Production | - | - | - | - | - | (2 | ) | - | - | (2) | ||||||||||||||||||||||||||
Sales | - | - | - | - | - | - | - | - | - | |||||||||||||||||||||||||||
| ||||||||||||||||||||||||||||||||||||
End of 2014 | - | - | - | - | - | 53 | - | - | 53 | |||||||||||||||||||||||||||
| ||||||||||||||||||||||||||||||||||||
Total company | ||||||||||||||||||||||||||||||||||||
End of 2011 | 127 | 402 | 529 | 57 | 35 | 82 | 18 | - | 721 | |||||||||||||||||||||||||||
End of 2012 | 122 | 403 | 525 | 52 | 30 | 70 | 17 | - | 694 | |||||||||||||||||||||||||||
End of 2013 | 125 | 462 | 587 | 56 | 28 | 59 | 14 | - | 744 | |||||||||||||||||||||||||||
End of 2014 | 120 | 440 | 560 | 65 | 24 | 66 | - | - | 715 | |||||||||||||||||||||||||||
| ||||||||||||||||||||||||||||||||||||
140
| Years Ended | Natural Gas Liquids | |||||||||||||||||||||||||||||||||||
| December 31 | Millions of Barrels | |||||||||||||||||||||||||||||||||||
| Alaska | Lower 48 | Total U.S. | Canada | Europe | Asia Pacific/ Middle East | Africa | Other Areas | Total | ||||||||||||||||||||||||||||
|
| |||||||||||||||||||||||||||||||||||
Developed | ||||||||||||||||||||||||||||||||||||
Consolidated operations | ||||||||||||||||||||||||||||||||||||
End of 2011 | 126 | 330 | 456 | 52 | 21 | 31 | 16 | - | 576 | |||||||||||||||||||||||||||
End of 2012 | 121 | 335 | 456 | 49 | 17 | 22 | 15 | - | 559 | |||||||||||||||||||||||||||
End of 2013 | 125 | 362 | 487 | 50 | 19 | 13 | 14 | - | 583 | |||||||||||||||||||||||||||
End of 2014 | 120 | 337 | 457 | 57 | 18 | 11 | - | - | 543 | |||||||||||||||||||||||||||
| ||||||||||||||||||||||||||||||||||||
Equity affiliates | ||||||||||||||||||||||||||||||||||||
End of 2011 | - | - | - | - | - | 51 | - | - | 51 | |||||||||||||||||||||||||||
End of 2012 | - | - | - | - | - | 48 | - | - | 48 | |||||||||||||||||||||||||||
End of 2013 | - | - | - | - | - | 45 | - | - | 45 | |||||||||||||||||||||||||||
End of 2014 | - | - | - | - | - | 53 | - | - | 53 | |||||||||||||||||||||||||||
| ||||||||||||||||||||||||||||||||||||
Undeveloped | ||||||||||||||||||||||||||||||||||||
Consolidated operations | ||||||||||||||||||||||||||||||||||||
End of 2011 | 1 | 72 | 73 | 5 | 14 | - | 2 | - | 94 | |||||||||||||||||||||||||||
End of 2012 | 1 | 68 | 69 | 3 | 13 | - | 2 | - | 87 | |||||||||||||||||||||||||||
End of 2013 | - | 100 | 100 | 6 | 9 | 1 | - | - | 116 | |||||||||||||||||||||||||||
End of 2014 | - | 103 | 103 | 8 | 6 | 2 | - | - | 119 | |||||||||||||||||||||||||||
| ||||||||||||||||||||||||||||||||||||
Equity affiliates | ||||||||||||||||||||||||||||||||||||
End of 2011 | - | - | - | - | - | - | - | - | - | |||||||||||||||||||||||||||
End of 2012 | - | - | - | - | - | - | - | - | - | |||||||||||||||||||||||||||
End of 2013 | - | - | - | - | - | - | - | - | - | |||||||||||||||||||||||||||
End of 2014 | - | - | - | - | - | - | - | - | - | |||||||||||||||||||||||||||
| ||||||||||||||||||||||||||||||||||||
Notable changes in proved natural gas liquids reserves in the three years ended December 31, 2014, included:
| • | Revisions : In 2013 revisions in Lower 48 were due to higher prices in 2013 versus 2012, as well as improved well performance. |
| • | Extensions and discoveries : In 2014 extensions and discoveries in Lower 48 were primarily due to continued drilling success in Eagle Ford and Bakken. In 2013 and 2012, extensions and discoveries in Lower 48 were primarily due to continued drilling success in Eagle Ford, Barnett and Bakken. |
141
| Years Ended | Natural Gas | |||||||||||||||||||||||||||||||||||
| December 31 | Billions of Cubic Feet | |||||||||||||||||||||||||||||||||||
| Alaska | Lower 48 | Total U.S. | Canada | Europe | Asia Pacific/ Middle East | Africa | Other Areas | Total | ||||||||||||||||||||||||||||
|
| |||||||||||||||||||||||||||||||||||
Developed and Undeveloped | ||||||||||||||||||||||||||||||||||||
Consolidated operations | ||||||||||||||||||||||||||||||||||||
End of 2011 | 2,960 | 7,188 | 10,148 | 2,113 | 1,896 | 2,515 | 872 | 56 | 17,600 | |||||||||||||||||||||||||||
Revisions | (24 | ) | (459 | ) | (483 | ) | (111 | ) | 96 | 113 | 109 | 2 | (274) | |||||||||||||||||||||||
Improved recovery | 20 | 7 | 27 | - | - | - | - | - | 27 | |||||||||||||||||||||||||||
Purchases | - | 9 | 9 | 2 | - | - | - | - | 11 | |||||||||||||||||||||||||||
Extensions and discoveries | 4 | 447 | 451 | 75 | 36 | 14 | 2 | - | 578 | |||||||||||||||||||||||||||
Production | (90 | ) | (595 | ) | (685 | ) | (313 | ) | (208 | ) | (263 | ) | (70 | ) | - | (1,539) | ||||||||||||||||||||
Sales | - | - | - | (2 | ) | (14 | ) | (31 | ) | - | - | (47) | ||||||||||||||||||||||||
| ||||||||||||||||||||||||||||||||||||
End of 2012 | 2,870 | 6,597 | 9,467 | 1,764 | 1,806 | 2,348 | 913 | 58 | 16,356 | |||||||||||||||||||||||||||
Revisions | 73 | 214 | 287 | 344 | 16 | (53 | ) | 94 | - | 688 | ||||||||||||||||||||||||||
Improved recovery | 6 | - | 6 | - | - | - | - | - | 6 | |||||||||||||||||||||||||||
Purchases | - | - | - | 1 | - | - | - | - | 1 | |||||||||||||||||||||||||||
Extensions and discoveries | 2 | 508 | 510 | 55 | 159 | 35 | 6 | - | 765 | |||||||||||||||||||||||||||
Production | (86 | ) | (592 | ) | (678 | ) | (283 | ) | (171 | ) | (284 | ) | (63 | ) | - | (1,479) | ||||||||||||||||||||
Sales | - | (16 | ) | (16 | ) | (3 | ) | (1 | ) | - | - | (58 | ) | (78) | ||||||||||||||||||||||
| ||||||||||||||||||||||||||||||||||||
End of 2013 | 2,865 | 6,711 | 9,576 | 1,878 | 1,809 | 2,046 | 950 | - | 16,259 | |||||||||||||||||||||||||||
Revisions | (75 | ) | 581 | 506 | 225 | (54 | ) | 115 | - | - | 792 | |||||||||||||||||||||||||
Improved recovery | - | - | - | - | - | 3 | - | - | 3 | |||||||||||||||||||||||||||
Purchases | - | - | - | - | - | - | - | - | - | |||||||||||||||||||||||||||
Extensions and discoveries | 7 | 256 | 263 | 85 | - | 3 | - | - | 351 | |||||||||||||||||||||||||||
Production | (78 | ) | (601 | ) | (679 | ) | (259 | ) | (182 | ) | (289 | ) | (34 | ) | - | (1,443) | ||||||||||||||||||||
Sales | - | (2 | ) | (2 | ) | (13 | ) | - | - | (689 | ) | - | (704) | |||||||||||||||||||||||
| ||||||||||||||||||||||||||||||||||||
End of 2014 | 2,719 | 6,945 | 9,664 | 1,916 | 1,573 | 1,878 | 227 | - | 15,258 | |||||||||||||||||||||||||||
| ||||||||||||||||||||||||||||||||||||
Equity affiliates | ||||||||||||||||||||||||||||||||||||
End of 2011 | - | - | - | - | - | 3,312 | - | 4 | 3,316 | |||||||||||||||||||||||||||
Revisions | - | - | - | - | - | (75 | ) | - | - | (75) | ||||||||||||||||||||||||||
Improved recovery | - | - | - | - | - | - | - | - | - | |||||||||||||||||||||||||||
Purchases | - | - | - | - | - | - | - | - | - | |||||||||||||||||||||||||||
Extensions and discoveries | - | - | - | - | - | 330 | - | - | 330 | |||||||||||||||||||||||||||
Production | - | - | - | - | - | (182 | ) | - | (1 | ) | (183) | |||||||||||||||||||||||||
Sales | - | - | - | - | - | (127 | ) | - | (3 | ) | (130) | |||||||||||||||||||||||||
| ||||||||||||||||||||||||||||||||||||
End of 2012 | - | - | - | - | - | 3,258 | - | - | 3,258 | |||||||||||||||||||||||||||
Revisions | - | - | - | - | - | 65 | - | - | 65 | |||||||||||||||||||||||||||
Improved recovery | - | - | - | - | - | - | - | - | - | |||||||||||||||||||||||||||
Purchases | - | - | - | - | - | - | - | - | - | |||||||||||||||||||||||||||
Extensions and discoveries | - | - | - | - | - | 982 | - | - | 982 | |||||||||||||||||||||||||||
Production | - | - | - | - | - | (176 | ) | - | - | (176) | ||||||||||||||||||||||||||
Sales | - | - | - | - | - | - | - | - | - | |||||||||||||||||||||||||||
| ||||||||||||||||||||||||||||||||||||
End of 2013 | - | - | - | - | - | 4,129 | - | - | 4,129 | |||||||||||||||||||||||||||
Revisions | - | - | - | - | - | 768 | - | - | 768 | |||||||||||||||||||||||||||
Improved recovery | - | - | - | - | - | - | - | - | - | |||||||||||||||||||||||||||
Purchases | - | - | - | - | - | - | - | - | - | |||||||||||||||||||||||||||
Extensions and discoveries | - | - | - | - | - | 531 | - | - | 531 | |||||||||||||||||||||||||||
Production | - | - | - | - | - | (186 | ) | - | - | (186) | ||||||||||||||||||||||||||
Sales | - | - | - | - | - | - | - | - | - | |||||||||||||||||||||||||||
| ||||||||||||||||||||||||||||||||||||
End of 2014 | - | - | - | - | - | 5,242 | - | - | 5,242 | |||||||||||||||||||||||||||
| ||||||||||||||||||||||||||||||||||||
Total company | ||||||||||||||||||||||||||||||||||||
End of 2011 | 2,960 | 7,188 | 10,148 | 2,113 | 1,896 | 5,827 | 872 | 60 | 20,916 | |||||||||||||||||||||||||||
End of 2012 | 2,870 | 6,597 | 9,467 | 1,764 | 1,806 | 5,606 | 913 | 58 | 19,614 | |||||||||||||||||||||||||||
End of 2013 | 2,865 | 6,711 | 9,576 | 1,878 | 1,809 | 6,175 | 950 | - | 20,388 | |||||||||||||||||||||||||||
End of 2014 | 2,719 | 6,945 | 9,664 | 1,916 | 1,573 | 7,120 | 227 | - | 20,500 | |||||||||||||||||||||||||||
| ||||||||||||||||||||||||||||||||||||
142
| Years Ended | Natural Gas | |||||||||||||||||||||||||||||||||||
| December 31 | Billions of Cubic Feet | |||||||||||||||||||||||||||||||||||
| Alaska | Lower 48 | Total U.S. | Canada | Europe | Asia Pacific/ Middle East | Africa | Other Areas | Total | ||||||||||||||||||||||||||||
|
| |||||||||||||||||||||||||||||||||||
Developed | ||||||||||||||||||||||||||||||||||||
Consolidated operations | ||||||||||||||||||||||||||||||||||||
End of 2011 | 2,907 | 6,194 | 9,101 | 1,932 | 1,439 | 1,932 | 738 | - | 15,142 | |||||||||||||||||||||||||||
End of 2012 | 2,805 | 5,737 | 8,542 | 1,684 | 1,290 | 1,696 | 846 | - | 14,058 | |||||||||||||||||||||||||||
End of 2013 | 2,815 | 5,822 | 8,637 | 1,786 | 1,276 | 1,593 | 881 | - | 14,173 | |||||||||||||||||||||||||||
End of 2014 | 2,663 | 5,922 | 8,585 | 1,801 | 1,182 | 1,553 | 226 | - | 13,347 | |||||||||||||||||||||||||||
| ||||||||||||||||||||||||||||||||||||
Equity affiliates | ||||||||||||||||||||||||||||||||||||
End of 2011 | - | - | - | - | - | 2,943 | - | 4 | 2,947 | |||||||||||||||||||||||||||
End of 2012 | - | - | - | - | - | 2,723 | - | - | 2,723 | |||||||||||||||||||||||||||
End of 2013 | - | - | - | - | - | 2,606 | - | - | 2,606 | |||||||||||||||||||||||||||
End of 2014 | - | - | - | - | - | 3,954 | - | - | 3,954 | |||||||||||||||||||||||||||
| ||||||||||||||||||||||||||||||||||||
Undeveloped | ||||||||||||||||||||||||||||||||||||
Consolidated operations | ||||||||||||||||||||||||||||||||||||
End of 2011 | 53 | 994 | 1,047 | 181 | 457 | 583 | 134 | 56 | 2,458 | |||||||||||||||||||||||||||
End of 2012 | 65 | 860 | 925 | 80 | 516 | 652 | 67 | 58 | 2,298 | |||||||||||||||||||||||||||
End of 2013 | 50 | 889 | 939 | 92 | 533 | 453 | 69 | - | 2,086 | |||||||||||||||||||||||||||
End of 2014 | 56 | 1,023 | 1,079 | 115 | 391 | 325 | 1 | - | 1,911 | |||||||||||||||||||||||||||
| ||||||||||||||||||||||||||||||||||||
Equity affiliates | ||||||||||||||||||||||||||||||||||||
End of 2011 | - | - | - | - | - | 369 | - | - | 369 | |||||||||||||||||||||||||||
End of 2012 | - | - | - | - | - | 535 | - | - | 535 | |||||||||||||||||||||||||||
End of 2013 | - | - | - | - | - | 1,523 | - | - | 1,523 | |||||||||||||||||||||||||||
End of 2014 | - | - | - | - | - | 1,288 | - | - | 1,288 | |||||||||||||||||||||||||||
| ||||||||||||||||||||||||||||||||||||
Natural gas production in the reserves table may differ from gas production (delivered for sale) in our statistics disclosure, primarily because the quantities above include gas consumed in production operations.
Natural gas reserves are computed at 14.65 pounds per square inch absolute and 60 degrees Fahrenheit.
Notable changes in proved natural gas reserves in the three years ended December 31, 2014, included:
| • | Revisions : In 2014 revisions were primarily due to higher prices, increased development activity and strong well performance in Lower 48 and higher prices and improved well performance in Canada and our consolidated operations in Asia Pacific/Middle East, partially offset by lower prices and higher costs in Alaska. For our equity affiliates in Asia Pacific/Middle East, 2014 revisions were primarily due to strong field performance. In 2013 revisions were primarily due to higher prices in 2013 versus 2012, and improved well performance in Lower 48 and Canada. In 2012 revisions in Lower 48 were primarily due to lower prices in 2012 versus 2011. In 2012 revisions in Canada were primarily due to lower prices in 2012 versus 2011, partially offset by improved well performance. In our consolidated operations in Asia Pacific/Middle East, revisions in 2012 were primarily due to development activities in various fields. Revisions in Africa in 2012 were primarily due to the execution of a gas sales agreement. |
| • | Extensions and discoveries : In 2014 extensions and discoveries in Lower 48 and Canada were primarily due to continued drilling success in Eagle Ford and Bakken and ongoing development activity in Western Canada. In 2013 and 2012, extensions and discoveries in Lower 48 were primarily due to continued drilling success in Eagle Ford, Bakken and Barnett. In 2014, 2013 and 2012 for our equity affiliates in Asia Pacific/Middle East, extensions and discoveries were due to APLNG's ongoing development drilling onshore Australia. |
| • | Sales : In 2014 for our consolidated operations in Africa, sales were due to the sale of the Nigeria business. In 2012 for our equity affiliates in Asia Pacific/Middle East, sales were primarily due to the dilution of our interest in APLNG. |
143
| Years Ended | Bitumen | |||
| December 31 | Millions of Barrels | |||
| Canada | ||||
Developed and Undeveloped | ||||
Consolidated operations | ||||
End of 2011 | 530 | |||
Revisions | (20) | |||
Improved recovery | - | |||
Purchases | - | |||
Extensions and discoveries | - | |||
Production | (4) | |||
Sales | - | |||
| ||||
End of 2012 | 506 | |||
Revisions | 56 | |||
Improved recovery | - | |||
Purchases | - | |||
Extensions and discoveries | 22 | |||
Production | (5) | |||
Sales | - | |||
| ||||
End of 2013 | 579 | |||
Revisions | (8) | |||
Improved recovery | - | |||
Purchases | - | |||
Extensions and discoveries | 31 | |||
Production | (4) | |||
Sales | - | |||
| ||||
End of 2014 | 598 | |||
| ||||
Equity affiliates | ||||
End of 2011 | 909 | |||
Revisions | 207 | |||
Improved recovery | - | |||
Purchases | - | |||
Extensions and discoveries | 307 | |||
Production | (29) | |||
Sales | - | |||
| ||||
End of 2012 | 1,394 | |||
Revisions | 46 | |||
Improved recovery | - | |||
Purchases | - | |||
Extensions and discoveries | 46 | |||
Production | (35) | |||
Sales | - | |||
| ||||
End of 2013 | 1,451 | |||
Revisions | (14) | |||
Improved recovery | - | |||
Purchases | - | |||
Extensions and discoveries | 74 | |||
Production | (43) | |||
Sales | - | |||
| ||||
End of 2014 | 1,468 | |||
| ||||
Total company | ||||
End of 2011 | 1,439 | |||
End of 2012 | 1,900 | |||
End of 2013 | 2,030 | |||
End of 2014 | 2,066 | |||
| ||||
144
| Years Ended | Bitumen | |||
| December 31 | Millions of Barrels | |||
| Canada | ||||
Developed | ||||
Consolidated operations | ||||
End of 2011 | 29 | |||
End of 2012 | 25 | |||
End of 2013 | 16 | |||
End of 2014 | 13 | |||
| ||||
Equity affiliates | ||||
End of 2011 | 131 | |||
End of 2012 | 170 | |||
End of 2013 | 181 | |||
End of 2014 | 187 | |||
| ||||
Undeveloped | ||||
Consolidated operations | ||||
End of 2011 | 501 | |||
End of 2012 | 481 | |||
End of 2013 | 563 | |||
End of 2014 | 585 | |||
| ||||
Equity affiliates | ||||
End of 2011 | 778 | |||
End of 2012 | 1,224 | |||
End of 2013 | 1,270 | |||
End of 2014 | 1,281 | |||
| ||||
Notable changes in proved bitumen reserves in the three years ended December 31, 2014, included:
| • | Revisions : In 2013 for our consolidated operations, revisions were primarily related to ongoing project development at Surmont and improved well performance. In 2012 for our equity affiliates, revisions were primarily due to well performance and denser well spacing at Foster Creek and Christina Lake. |
| • | Extensions and discoveries : In 2014 for our consolidated operations, extensions and discoveries were primarily related to delineation activity at Surmont. In 2014 for our equity affiliates, extensions and discoveries were primarily related to delineation activity at Foster Creek and Christina Lake, as well as regulatory approval of a development area at Foster Creek. In 2012 for our equity affiliates, extensions and discoveries were primarily related to the ongoing project development of Christina Lake and sanctioning of Narrows Lake. |
145
| Years Ended | Total Proved Reserves | |||||||||||||||||||||||||||||||||||
| December 31 | Millions of Barrels of Oil Equivalent | |||||||||||||||||||||||||||||||||||
| Alaska | Lower 48 | Total U.S. | Canada | Europe | Asia Pacific/ Middle East | Africa | Other Areas | Total | ||||||||||||||||||||||||||||
|
| |||||||||||||||||||||||||||||||||||
Developed and Undeveloped | ||||||||||||||||||||||||||||||||||||
Consolidated operations | ||||||||||||||||||||||||||||||||||||
End of 2011 | 1,804 | 1,896 | 3,700 | 964 | 870 | 693 | 406 | 117 | 6,750 | |||||||||||||||||||||||||||
Revisions | (5 | ) | (75 | ) | (80 | ) | (36 | ) | 42 | 29 | 20 | - | (25) | |||||||||||||||||||||||
Improved recovery | 16 | 5 | 21 | - | - | - | - | - | 21 | |||||||||||||||||||||||||||
Purchases | - | 3 | 3 | - | - | - | - | - | 3 | |||||||||||||||||||||||||||
Extensions and discoveries | 22 | 297 | 319 | 19 | 10 | 34 | 7 | - | 389 | |||||||||||||||||||||||||||
Production | (89 | ) | (176 | ) | (265 | ) | (71 | ) | (86 | ) | (74 | ) | (35 | ) | - | (531) | ||||||||||||||||||||
Sales | - | - | - | - | (18 | ) | (27 | ) | - | - | (45) | |||||||||||||||||||||||||
| ||||||||||||||||||||||||||||||||||||
End of 2012 | 1,748 | 1,950 | 3,698 | 876 | 818 | 655 | 398 | 117 | 6,562 | |||||||||||||||||||||||||||
Revisions | 14 | 92 | 106 | 124 | (3 | ) | (2 | ) | 38 | - | 263 | |||||||||||||||||||||||||
Improved recovery | 21 | - | 21 | 1 | - | - | - | - | 22 | |||||||||||||||||||||||||||
Purchases | - | - | - | - | - | - | - | - | - | |||||||||||||||||||||||||||
Extensions and discoveries | 9 | 378 | 387 | 35 | 46 | 16 | 23 | - | 507 | |||||||||||||||||||||||||||
Production | (84 | ) | (189 | ) | (273 | ) | (65 | ) | (73 | ) | (81 | ) | (27 | ) | - | (519) | ||||||||||||||||||||
Sales | - | (44 | ) | (44 | ) | (1 | ) | (3 | ) | - | (23 | ) | (117 | ) | (188) | |||||||||||||||||||||
| ||||||||||||||||||||||||||||||||||||
End of 2013 | 1,708 | 2,187 | 3,895 | 970 | 785 | 588 | 409 | - | 6,647 | |||||||||||||||||||||||||||
Revisions | (19 | ) | 109 | 90 | 48 | (10 | ) | 26 | - | - | 154 | |||||||||||||||||||||||||
Improved recovery | 8 | - | 8 | 2 | - | 3 | - | - | 13 | |||||||||||||||||||||||||||
Purchases | - | - | - | - | - | - | - | - | - | |||||||||||||||||||||||||||
Extensions and discoveries | 17 | 184 | 201 | 50 | - | 17 | - | - | 268 | |||||||||||||||||||||||||||
Production | (78 | ) | (206 | ) | (284 | ) | (61 | ) | (78 | ) | (81 | ) | (11 | ) | - | (515) | ||||||||||||||||||||
Sales | - | - | - | (3 | ) | - | - | (156 | ) | - | (159) | |||||||||||||||||||||||||
| ||||||||||||||||||||||||||||||||||||
End of 2014 | 1,636 | 2,274 | 3,910 | 1,006 | 697 | 553 | 242 | - | 6,408 | |||||||||||||||||||||||||||
| ||||||||||||||||||||||||||||||||||||
Equity affiliates | ||||||||||||||||||||||||||||||||||||
End of 2011 | - | - | - | 909 | - | 700 | - | 28 | 1,637 | |||||||||||||||||||||||||||
Revisions | - | - | - | 207 | - | (13 | ) | - | 1 | 195 | ||||||||||||||||||||||||||
Improved recovery | - | - | - | - | - | - | - | - | - | |||||||||||||||||||||||||||
Purchases | - | - | - | - | - | - | - | - | - | |||||||||||||||||||||||||||
Extensions and discoveries | - | - | - | 307 | - | 55 | - | - | 362 | |||||||||||||||||||||||||||
Production | - | - | - | (29 | ) | - | (39 | ) | - | (5 | ) | (73) | ||||||||||||||||||||||||
Sales | - | - | - | - | - | (21 | ) | - | (20 | ) | (41) | |||||||||||||||||||||||||
| ||||||||||||||||||||||||||||||||||||
End of 2012 | - | - | - | 1,394 | - | 682 | - | 4 | 2,080 | |||||||||||||||||||||||||||
Revisions | - | - | - | 46 | - | 11 | - | 1 | 58 | |||||||||||||||||||||||||||
Improved recovery | - | - | - | - | - | - | - | - | - | |||||||||||||||||||||||||||
Purchases | - | - | - | - | - | - | - | - | - | |||||||||||||||||||||||||||
Extensions and discoveries | - | - | - | 46 | - | 164 | - | - | 210 | |||||||||||||||||||||||||||
Production | - | - | - | (35 | ) | - | (38 | ) | - | (1 | ) | (74) | ||||||||||||||||||||||||
Sales | - | - | - | - | - | - | - | - | - | |||||||||||||||||||||||||||
| ||||||||||||||||||||||||||||||||||||
End of 2013 | - | - | - | 1,451 | - | 819 | - | 4 | 2,274 | |||||||||||||||||||||||||||
Revisions | - | - | - | (14 | ) | - | 155 | - | 3 | 144 | ||||||||||||||||||||||||||
Improved recovery | - | - | - | - | - | - | - | - | - | |||||||||||||||||||||||||||
Purchases | - | - | - | - | - | - | - | - | - | |||||||||||||||||||||||||||
Extensions and discoveries | - | - | - | 74 | - | 89 | - | - | 163 | |||||||||||||||||||||||||||
Production | - | - | - | (43 | ) | - | (38 | ) | - | (2 | ) | (83) | ||||||||||||||||||||||||
Sales | - | - | - | - | - | - | - | - | - | |||||||||||||||||||||||||||
| ||||||||||||||||||||||||||||||||||||
End of 2014 | - | - | - | 1,468 | - | 1,025 | - | 5 | 2,498 | |||||||||||||||||||||||||||
| ||||||||||||||||||||||||||||||||||||
Total company | ||||||||||||||||||||||||||||||||||||
End of 2011 | 1,804 | 1,896 | 3,700 | 1,873 | 870 | 1,393 | 406 | 145 | 8,387 | |||||||||||||||||||||||||||
End of 2012 | 1,748 | 1,950 | 3,698 | 2,270 | 818 | 1,337 | 398 | 121 | 8,642 | |||||||||||||||||||||||||||
End of 2013 | 1,708 | 2,187 | 3,895 | 2,421 | 785 | 1,407 | 409 | 4 | 8,921 | |||||||||||||||||||||||||||
End of 2014 | 1,636 | 2,274 | 3,910 | 2,474 | 697 | 1,578 | 242 | 5 | 8,906 | |||||||||||||||||||||||||||
| ||||||||||||||||||||||||||||||||||||
146
| Years Ended | Total Proved Reserves | |||||||||||||||||||||||||||||||||||
| December 31 | Millions of Barrels of Oil Equivalent | |||||||||||||||||||||||||||||||||||
| Alaska | Lower 48 | Total U.S. | Canada | Europe | Asia Pacific/ Middle East | Africa | Other Areas | Total | ||||||||||||||||||||||||||||
|
| |||||||||||||||||||||||||||||||||||
Developed | ||||||||||||||||||||||||||||||||||||
Consolidated operations | ||||||||||||||||||||||||||||||||||||
End of 2011 | 1,666 | 1,597 | 3,263 | 425 | 556 | 510 | 371 | - | 5,125 | |||||||||||||||||||||||||||
End of 2012 | 1,606 | 1,562 | 3,168 | 377 | 499 | 441 | 373 | - | 4,858 | |||||||||||||||||||||||||||
End of 2013 | 1,597 | 1,600 | 3,197 | 386 | 478 | 405 | 391 | - | 4,857 | |||||||||||||||||||||||||||
End of 2014 | 1,514 | 1,637 | 3,151 | 393 | 452 | 412 | 237 | - | 4,645 | |||||||||||||||||||||||||||
| ||||||||||||||||||||||||||||||||||||
Equity affiliates | ||||||||||||||||||||||||||||||||||||
End of 2011 | - | - | - | 131 | - | 638 | - | 28 | 797 | |||||||||||||||||||||||||||
End of 2012 | - | - | - | 170 | - | 593 | - | 4 | 767 | |||||||||||||||||||||||||||
End of 2013 | - | - | - | 181 | - | 565 | - | 4 | 750 | |||||||||||||||||||||||||||
End of 2014 | - | - | - | 187 | - | 810 | - | 5 | 1,002 | |||||||||||||||||||||||||||
| ||||||||||||||||||||||||||||||||||||
Undeveloped | ||||||||||||||||||||||||||||||||||||
Consolidated operations | ||||||||||||||||||||||||||||||||||||
End of 2011 | 138 | 299 | 437 | 539 | 314 | 183 | 35 | 117 | 1,625 | |||||||||||||||||||||||||||
End of 2012 | 142 | 388 | 530 | 499 | 319 | 214 | 25 | 117 | 1,704 | |||||||||||||||||||||||||||
End of 2013 | 111 | 587 | 698 | 584 | 307 | 183 | 18 | - | 1,790 | |||||||||||||||||||||||||||
End of 2014 | 122 | 637 | 759 | 613 | 245 | 141 | 5 | - | 1,763 | |||||||||||||||||||||||||||
| ||||||||||||||||||||||||||||||||||||
Equity affiliates | ||||||||||||||||||||||||||||||||||||
End of 2011 | - | - | - | 778 | - | 62 | - | - | 840 | |||||||||||||||||||||||||||
End of 2012 | - | - | - | 1,224 | - | 89 | - | - | 1,313 | |||||||||||||||||||||||||||
End of 2013 | - | - | - | 1,270 | - | 254 | - | - | 1,524 | |||||||||||||||||||||||||||
End of 2014 | - | - | - | 1,281 | - | 215 | - | - | 1,496 | |||||||||||||||||||||||||||
| ||||||||||||||||||||||||||||||||||||
Natural gas reserves are converted to barrels of oil equivalent (BOE) based on a 6:1 ratio: six thousand cubic feet of natural gas converts to one BOE.
Proved Undeveloped Reserves
We had 3,259 million BOE of proved undeveloped reserves at year-end 2014, compared with 3,314 million BOE at year-end 2013. During 2014 we converted 496 million BOE of undeveloped reserves to developed, primarily through ongoing development activities, as well as from the startup of major development projects. In addition, we added 441 million BOE of undeveloped reserves in 2014, mainly through extensions and discoveries from ongoing development progress. These additions were offset by the sale of our interest in Nigeria in 2014, which represented a decrease of 15 million BOE of undeveloped reserves. As a result, at December 31, 2014, our proved undeveloped reserves represented 37 percent of total proved reserves, which was unchanged from December 31, 2013. Costs incurred for the year ended December 31, 2014, relating to the development of proved undeveloped reserves were $11.5 billion. A portion of our costs incurred each year relate to development projects where the proved undeveloped reserves will be converted to proved developed reserves in future years.
Approximately 75 percent of our proved undeveloped reserves at year-end 2014 were associated with six major development areas. Five of the major development areas are currently producing and are expected to have proved undeveloped reserves convert to proved developed over time, as development activities continue and/or production facilities are expanded or upgraded, and include:
| • | The Surmont oil sands project in Canada. |
| • | FCCL oil sands-Foster Creek and Christina Lake in Canada. |
| • | The Eagle Ford area in the Lower 48. |
| • | The APLNG project onshore Australia. |
147
The remaining major development area, Narrows Lake in our FCCL oil sands in Canada, was sanctioned for development in 2012.
At the end of 2014, approximately 20 percent of our total proved undeveloped reserves, located in the Athabasca oil sands in Canada, have remained undeveloped for five years or more. The oil sands in Canada consist of the FCCL and Surmont steam-assisted gravity drainage (SAGD) projects. The majority of our remaining proved undeveloped reserves in this area were recorded beginning in 2007. Our SAGD projects are large, multi-year projects with steady, long-term production at consistent levels. The associated undeveloped reserves are expected to be developed over the life of the project, as additional well pairs are drilled to maintain throughput at the central processing facilities.
Results of Operations
The Company's results of operations from oil and gas activities for the years 2014, 2013 and 2012 are shown in the following tables. Non-oil and gas activities, such as pipeline and marine operations, liquefied natural gas operations, and crude oil and gas marketing activities are excluded. Additional information about selected line items within the results of operations tables is shown below:
| • | Other revenues include gains and losses from asset sales, certain amounts resulting from the purchase and sale of hydrocarbons, and other miscellaneous income. |
| • | Taxes other than income taxes include production, property and other non-income taxes. |
| • | Depreciation of support equipment is reclassified as applicable. |
| • | Production costs include costs incurred to operate and maintain wells, related equipment and facilities used in the production of petroleum liquids and natural gas. |
| • | Transportation costs reflect fees to transport our produced hydrocarbons beyond the production function to a final delivery point using transportation operations in which we have an ownership interest. The profit element of transportation operations in which we have an ownership interest is deemed to be outside oil and gas producing activities. |
| • | Other related expenses include foreign currency transaction gains and losses and other miscellaneous expenses. |
148
Results of Operations
| Year Ended | Millions of Dollars | |||||||||||||||||||||||||||||||||||||||
| December 31, 2014 | Alaska | Lower 48 | Total U.S. | Canada | Europe | Asia Pacific/ Middle East | Africa | Other Areas | Disc Ops | Total | ||||||||||||||||||||||||||||||
|
| |||||||||||||||||||||||||||||||||||||||
Consolidated operations | ||||||||||||||||||||||||||||||||||||||||
Sales | $ | 6,202 | 9,098 | 15,300 | 2,091 | 6,160 | 4,550 | 185 | - | 278 | 28,564 | |||||||||||||||||||||||||||||
Transfers | 47 | 94 | 141 | - | - | 938 | - | - | - | 1,079 | ||||||||||||||||||||||||||||||
Transportation costs | (659) | - | (659) | - | - | (43) | - | - | - | (702) | ||||||||||||||||||||||||||||||
Other revenues | 13 | 29 | 42 | 185 | (25) | 46 | 26 | 154 | 1,052 | 1,480 | ||||||||||||||||||||||||||||||
| ||||||||||||||||||||||||||||||||||||||||
Total revenues | 5,603 | 9,221 | 14,824 | 2,276 | 6,135 | 5,491 | 211 | 154 | 1,330 | 30,421 | ||||||||||||||||||||||||||||||
Production costs excluding taxes | 1,205 | 2,482 | 3,687 | 1,106 | 1,410 | 994 | 83 | 1 | 128 | 7,409 | ||||||||||||||||||||||||||||||
Taxes other than income taxes | 842 | 700 | 1,542 | 62 | 44 | 299 | 5 | 1 | 8 | 1,961 | ||||||||||||||||||||||||||||||
Exploration expenses | 46 | 1,042 | 1,088 | 317 | 148 | 123 | 303 | 40 | 4 | 2,023 | ||||||||||||||||||||||||||||||
Depreciation, depletion and amortization | 423 | 3,662 | 4,085 | 919 | 1,777 | 1,125 | 6 | - | - | 7,912 | ||||||||||||||||||||||||||||||
Impairments | 56 | 107 | 163 | 38 | 529 | 7 | - | - | - | 737 | ||||||||||||||||||||||||||||||
Other related expenses | 2 | 96 | 98 | 7 | (233) | (6) | (1) | 9 | (9) | (135) | ||||||||||||||||||||||||||||||
Accretion | 52 | 80 | 132 | 57 | 245 | 26 | - | - | - | 460 | ||||||||||||||||||||||||||||||
| ||||||||||||||||||||||||||||||||||||||||
| 2,977 | 1,052 | 4,029 | (230) | 2,215 | 2,923 | (185) | 103 | 1,199 | 10,054 | |||||||||||||||||||||||||||||||
Provision for income taxes | 1,043 | 322 | 1,365 | (101) | 1,452 | 1,216 | 4 | (13) | 79 | 4,002 | ||||||||||||||||||||||||||||||
| ||||||||||||||||||||||||||||||||||||||||
Results of operations | $ | 1,934 | 730 | 2,664 | (129) | 763 | 1,707 | (189) | 116 | 1,120 | 6,052 | |||||||||||||||||||||||||||||
| ||||||||||||||||||||||||||||||||||||||||
Equity affiliates | ||||||||||||||||||||||||||||||||||||||||
Sales | $ | - | - | - | 2,307 | - | 851 | - | 96 | - | 3,254 | |||||||||||||||||||||||||||||
Transfers | - | - | - | - | - | 1,663 | - | - | - | 1,663 | ||||||||||||||||||||||||||||||
Transportation costs | - | - | - | - | - | - | - | - | - | - | ||||||||||||||||||||||||||||||
Other revenues | - | - | - | 33 | - | 3 | - | - | - | 36 | ||||||||||||||||||||||||||||||
| ||||||||||||||||||||||||||||||||||||||||
Total revenues | - | - | - | 2,340 | - | 2,517 | - | 96 | - | 4,953 | ||||||||||||||||||||||||||||||
Production costs excluding taxes | - | - | - | 651 | - | 221 | - | 18 | - | 890 | ||||||||||||||||||||||||||||||
Taxes other than income taxes | - | - | - | 14 | - | 1,214 | - | 51 | - | 1,279 | ||||||||||||||||||||||||||||||
Exploration expenses | - | - | - | 13 | 7 | 8 | - | - | - | 28 | ||||||||||||||||||||||||||||||
Depreciation, depletion and amortization | - | - | - | 337 | - | 171 | - | 7 | - | 515 | ||||||||||||||||||||||||||||||
Impairments | - | - | - | - | - | 27 | - | - | - | 27 | ||||||||||||||||||||||||||||||
Other related expenses | - | - | - | (65) | 1 | (2) | - | 27 | - | (39) | ||||||||||||||||||||||||||||||
Accretion | - | - | - | 6 | - | 8 | - | 1 | - | 15 | ||||||||||||||||||||||||||||||
| ||||||||||||||||||||||||||||||||||||||||
| - | - | - | 1,384 | (8) | 870 | - | (8) | - | 2,238 | |||||||||||||||||||||||||||||||
Provision for income taxes | - | - | - | 331 | - | (62) | - | 2 | - | 271 | ||||||||||||||||||||||||||||||
| ||||||||||||||||||||||||||||||||||||||||
Results of operations | $ | - | - | - | 1,053 | (8) | 932 | - | (10) | - | 1,967 | |||||||||||||||||||||||||||||
| ||||||||||||||||||||||||||||||||||||||||
149
| Year Ended | Millions of Dollars | |||||||||||||||||||||||||||||||||||||||
| December 31, 2013 | Alaska | Lower 48 | Total U.S. | Canada | Europe | Asia Pacific/ Middle East | Africa | Other Areas | Disc Ops | Total | ||||||||||||||||||||||||||||||
|
| |||||||||||||||||||||||||||||||||||||||
Consolidated operations | ||||||||||||||||||||||||||||||||||||||||
Sales | $ | 7,235 | 7,954 | 15,189 | 1,890 | 6,319 | 5,261 | 1,001 | - | 855 | 30,515 | |||||||||||||||||||||||||||||
Transfers | 15 | 183 | 198 | - | - | 981 | - | - | - | 1,179 | ||||||||||||||||||||||||||||||
Transportation costs* | (703) | - | (703) | - | - | (39) | - | - | - | (742) | ||||||||||||||||||||||||||||||
Other revenues | (5) | 57 | 52 | 775 | (21) | 149 | 141 | 29 | 960 | 2,085 | ||||||||||||||||||||||||||||||
| ||||||||||||||||||||||||||||||||||||||||
Total revenues | 6,542 | 8,194 | 14,736 | 2,665 | 6,298 | 6,352 | 1,142 | 29 | 1,815 | 33,037 | ||||||||||||||||||||||||||||||
Production costs excluding taxes** | 1,162 | 2,203 | 3,365 | 1,049 | 1,334 | 845 | 88 | 2 | 266 | 6,949 | ||||||||||||||||||||||||||||||
Taxes other than income taxes | 1,681 | 580 | 2,261 | 54 | 41 | 386 | 4 | 2 | 5 | 2,753 | ||||||||||||||||||||||||||||||
Exploration expenses | 62 | 614 | 676 | 172 | 128 | 107 | 77 | 46 | 10 | 1,216 | ||||||||||||||||||||||||||||||
Depreciation, depletion and amortization | 428 | 3,200 | 3,628 | 1,312 | 1,006 | 1,051 | 29 | 1 | - | 7,027 | ||||||||||||||||||||||||||||||
Impairments | - | 2 | 2 | 216 | 301 | 3 | - | - | 43 | 565 | ||||||||||||||||||||||||||||||
Other related expenses | (121) | 72 | (49) | 41 | (83) | 209 | 7 | 20 | 76 | 221 | ||||||||||||||||||||||||||||||
Accretion | 54 | 74 | 128 | 59 | 200 | 24 | - | - | 5 | 416 | ||||||||||||||||||||||||||||||
| ||||||||||||||||||||||||||||||||||||||||
| 3,276 | 1,449 | 4,725 | (238) | 3,371 | 3,727 | 937 | (42) | 1,410 | 13,890 | |||||||||||||||||||||||||||||||
Provision for income taxes | 1,168 | 491 | 1,659 | (270) | 2,262 | 1,509 | 924 | 13 | 251 | 6,348 | ||||||||||||||||||||||||||||||
| ||||||||||||||||||||||||||||||||||||||||
Results of operations | $ | 2,108 | 958 | 3,066 | 32 | 1,109 | 2,218 | 13 | (55) | 1,159 | 7,542 | |||||||||||||||||||||||||||||
| ||||||||||||||||||||||||||||||||||||||||
Equity affiliates | ||||||||||||||||||||||||||||||||||||||||
Sales | $ | - | - | - | 1,848 | - | 903 | - | 117 | - | 2,868 | |||||||||||||||||||||||||||||
Transfers | - | - | - | - | - | 1,443 | - | - | - | 1,443 | ||||||||||||||||||||||||||||||
Transportation costs* | - | - | - | - | - | - | - | - | - | - | ||||||||||||||||||||||||||||||
Other revenues | - | - | - | 6 | - | 22 | - | - | - | 28 | ||||||||||||||||||||||||||||||
| ||||||||||||||||||||||||||||||||||||||||
Total revenues | - | - | - | 1,854 | - | 2,368 | - | 117 | - | 4,339 | ||||||||||||||||||||||||||||||
Production costs excluding taxes** | - | - | - | 593 | - | 150 | - | 21 | - | 764 | ||||||||||||||||||||||||||||||
Taxes other than income taxes | - | - | - | 12 | - | 1,169 | - | 59 | - | 1,240 | ||||||||||||||||||||||||||||||
Exploration expenses | - | - | - | 22 | 30 | 8 | - | - | - | 60 | ||||||||||||||||||||||||||||||
Depreciation, depletion and amortization | - | - | - | 231 | - | 137 | - | 11 | - | 379 | ||||||||||||||||||||||||||||||
Impairments | - | - | - | - | - | - | - | - | - | - | ||||||||||||||||||||||||||||||
Other related expenses | - | - | - | 7 | - | (3) | - | 14 | - | 18 | ||||||||||||||||||||||||||||||
Accretion | - | - | - | 5 | - | 4 | - | 1 | - | 10 | ||||||||||||||||||||||||||||||
| ||||||||||||||||||||||||||||||||||||||||
| - | - | - | 984 | (30) | 903 | - | 11 | - | 1,868 | |||||||||||||||||||||||||||||||
Provision for income taxes | - | - | - | 248 | - | (17) | - | 1 | - | 232 | ||||||||||||||||||||||||||||||
| ||||||||||||||||||||||||||||||||||||||||
Results of operations | $ | - | - | - | 736 | (30) | 920 | - | 10 | - | 1,636 | |||||||||||||||||||||||||||||
| ||||||||||||||||||||||||||||||||||||||||
*Certain transportation costs incurred subsequent to the terminal point of the production function have been reclassified to appropriately reflect total revenue from
oil and gas producing activities. Total results of operations is unchanged.
**Certain gathering and processing fees have been reclassified from "Transportation costs" to "Production costs excluding taxes." Total results of operations is
unchanged.
150
| Year Ended | Millions of Dollars | |||||||||||||||||||||||||||||||||||||||
| December 31, 2012 | Alaska | Lower 48 | Total U.S. | Canada | Europe | Asia Pacific/ Middle East | Africa | Other Areas | Disc Ops | Total | ||||||||||||||||||||||||||||||
|
| |||||||||||||||||||||||||||||||||||||||
Consolidated operations | ||||||||||||||||||||||||||||||||||||||||
Sales | $ | 8,306 | 6,386 | 14,692 | 1,722 | 7,630 | 4,802 | 1,739 | - | 1,124 | 31,709 | |||||||||||||||||||||||||||||
Transfers | 38 | 309 | 347 | - | - | 867 | - | - | - | 1,214 | ||||||||||||||||||||||||||||||
Transportation costs* | (680 | ) | - | (680 | ) | - | - | (37 | ) | - | - | - | (717) | |||||||||||||||||||||||||||
Other revenues | (1 | ) | 70 | 69 | 107 | 568 | 930 | 258 | 27 | 1 | 1,960 | |||||||||||||||||||||||||||||
| ||||||||||||||||||||||||||||||||||||||||
Total revenues | 7,663 | 6,765 | 14,428 | 1,829 | 8,198 | 6,562 | 1,997 | 27 | 1,125 | 34,166 | ||||||||||||||||||||||||||||||
Production costs excluding taxes** | 1,068 | 1,828 | 2,896 | 901 | 1,211 | 700 | 59 | - | 262 | 6,029 | ||||||||||||||||||||||||||||||
Taxes other than income taxes | 2,477 | 513 | 2,990 | 65 | 24 | 321 | 2 | 6 | 21 | 3,429 | ||||||||||||||||||||||||||||||
Exploration expenses | 34 | 343 | 377 | 633 | 102 | 70 | 55 | 211 | 20 | 1,468 | ||||||||||||||||||||||||||||||
Depreciation, depletion and amortization | 421 | 2,561 | 2,982 | 1,335 | 958 | 883 | 44 | 1 | 181 | 6,384 | ||||||||||||||||||||||||||||||
Impairments | - | 192 | 192 | 162 | 211 | 4 | - | - | 606 | 1,175 | ||||||||||||||||||||||||||||||
Other related expenses | 173 | 136 | 309 | 79 | (14 | ) | 237 | 8 | 24 | 58 | 701 | |||||||||||||||||||||||||||||
Accretion | 55 | 66 | 121 | 57 | 186 | 21 | - | - | 8 | 393 | ||||||||||||||||||||||||||||||
| ||||||||||||||||||||||||||||||||||||||||
| 3,435 | 1,126 | 4,561 | (1,403 | ) | 5,520 | 4,326 | 1,829 | (215 | ) | (31 | ) | 14,587 | ||||||||||||||||||||||||||||
Provision for income taxes | 1,229 | 209 | 1,438 | (391 | ) | 3,980 | 1,514 | 1,728 | (17 | ) | 183 | 8,435 | ||||||||||||||||||||||||||||
| ||||||||||||||||||||||||||||||||||||||||
Results of operations | $ | 2,206 | 917 | 3,123 | (1,012 | ) | 1,540 | 2,812 | 101 | (198 | ) | (214 | ) | 6,152 | ||||||||||||||||||||||||||
| ||||||||||||||||||||||||||||||||||||||||
Equity affiliates | ||||||||||||||||||||||||||||||||||||||||
Sales | $ | - | - | - | 1,566 | - | 930 | - | 443 | - | 2,939 | |||||||||||||||||||||||||||||
Transfers | - | - | - | - | - | 1,387 | - | - | - | 1,387 | ||||||||||||||||||||||||||||||
Transportation costs* | - | - | - | - | - | - | - | - | - | - | ||||||||||||||||||||||||||||||
Other revenues | - | - | - | 16 | - | (117 | ) | - | 407 | - | 306 | |||||||||||||||||||||||||||||
| ||||||||||||||||||||||||||||||||||||||||
Total revenues | - | - | - | 1,582 | - | 2,200 | - | 850 | - | 4,632 | ||||||||||||||||||||||||||||||
Production costs excluding taxes** | - | - | - | 470 | - | 156 | - | 119 | - | 745 | ||||||||||||||||||||||||||||||
Taxes other than income taxes | - | - | - | 9 | - | 1,153 | - | 293 | - | 1,455 | ||||||||||||||||||||||||||||||
Exploration expenses | - | - | - | 36 | 2 | 1 | - | 4 | - | 43 | ||||||||||||||||||||||||||||||
Depreciation, depletion and amortization | - | - | - | 325 | - | 109 | - | 15 | - | 449 | ||||||||||||||||||||||||||||||
Impairments | - | - | - | - | - | - | - | - | - | - | ||||||||||||||||||||||||||||||
Other related expenses | - | - | - | 11 | - | 16 | - | 1 | - | 28 | ||||||||||||||||||||||||||||||
Accretion | - | - | - | 6 | - | 4 | - | 1 | - | 11 | ||||||||||||||||||||||||||||||
| ||||||||||||||||||||||||||||||||||||||||
| - | - | - | 725 | (2 | ) | 761 | - | 417 | - | 1,901 | ||||||||||||||||||||||||||||||
Provision for income taxes | - | - | - | 181 | - | (29 | ) | - | (233 | ) | - | (81) | ||||||||||||||||||||||||||||
| ||||||||||||||||||||||||||||||||||||||||
Results of operations | $ | - | - | - | 544 | (2 | ) | 790 | - | 650 | - | 1,982 | ||||||||||||||||||||||||||||
| ||||||||||||||||||||||||||||||||||||||||
*Certain transportation costs incurred subsequent to the terminal point of the production function have been reclassified to appropriately reflect total revenue from
oil and gas producing activities. Total results of operations is unchanged.
**Certain gathering and processing fees have been reclassified from "Transportation costs" to "Production costs excluding taxes." Total results of operations is
unchanged.
151
Statistics
| Net Production | 2014 | 2013 | 2012 | |||||||||
|
| |||||||||||
| Thousands of Barrels Daily | ||||||||||||
Crude Oil | ||||||||||||
Consolidated operations | ||||||||||||
Alaska | 162 | 178 | 188 | |||||||||
Lower 48 | 188 | 152 | 123 | |||||||||
| ||||||||||||
United States | 350 | 330 | 311 | |||||||||
Canada | 13 | 13 | 13 | |||||||||
Europe | 126 | 113 | 135 | |||||||||
Asia Pacific/Middle East | 79 | 80 | 68 | |||||||||
Africa | 8 | 26 | 40 | |||||||||
| ||||||||||||
Total consolidated operations | 576 | 562 | 567 | |||||||||
| ||||||||||||
Equity affiliates | ||||||||||||
Asia Pacific/Middle East | 15 | 15 | 15 | |||||||||
Other areas | 4 | 4 | 13 | |||||||||
| ||||||||||||
Total equity affiliates | 19 | 19 | 28 | |||||||||
| ||||||||||||
Total continuing operations | 595 | 581 | 595 | |||||||||
Discontinued operations | 5 | 18 | 23 | |||||||||
| ||||||||||||
Total company | 600 | 599 | 618 | |||||||||
| ||||||||||||
Natural Gas Liquids | ||||||||||||
Consolidated operations | ||||||||||||
Alaska | 13 | 15 | 16 | |||||||||
Lower 48 | 97 | 91 | 85 | |||||||||
| ||||||||||||
United States | 110 | 106 | 101 | |||||||||
Canada | 23 | 25 | 24 | |||||||||
Europe | 8 | 6 | 7 | |||||||||
Asia Pacific/Middle East | 10 | 12 | 16 | |||||||||
| ||||||||||||
Total consolidated operations | 151 | 149 | 148 | |||||||||
| ||||||||||||
Equity affiliates -Asia Pacific/Middle East | 8 | 7 | 8 | |||||||||
| ||||||||||||
Total continuing operations | 159 | 156 | 156 | |||||||||
Discontinued operations | 1 | 3 | 4 | |||||||||
| ||||||||||||
Total company | 160 | 159 | 160 | |||||||||
| ||||||||||||
Bitumen | ||||||||||||
Consolidated operations -Canada | 12 | 13 | 12 | |||||||||
Equity affiliates -Canada | 117 | 96 | 81 | |||||||||
| ||||||||||||
Total company | 129 | 109 | 93 | |||||||||
| ||||||||||||
| Natural Gas | Millions of Cubic Feet Daily | |||||||||||
Consolidated operations | ||||||||||||
Alaska | 49 | 43 | 55 | |||||||||
Lower 48 | 1,491 | 1,490 | 1,493 | |||||||||
| ||||||||||||
United States | 1,540 | 1,533 | 1,548 | |||||||||
Canada | 711 | 775 | 857 | |||||||||
Europe | 461 | 416 | 516 | |||||||||
Asia Pacific/Middle East | 723 | 709 | 672 | |||||||||
Africa | 3 | 25 | 18 | |||||||||
| ||||||||||||
Total consolidated operations | 3,438 | 3,458 | 3,611 | |||||||||
| ||||||||||||
Equity affiliates -Asia Pacific/Middle East | 505 | 481 | 485 | |||||||||
| ||||||||||||
Total continuing operations | 3,943 | 3,939 | 4,096 | |||||||||
Discontinued operations | 88 | 129 | 149 | |||||||||
| ||||||||||||
Total company | 4,031 | 4,068 | 4,245 | |||||||||
| ||||||||||||
152
| Average Sales Prices | 2014 | 2013 | 2012 | |||||||||
|
| |||||||||||
Crude Oil Per Barrel | ||||||||||||
Consolidated operations | ||||||||||||
Alaska* | $ | 87.21 | 97.27 | 100.60 | ||||||||
Lower 48 | 84.18 | 93.79 | 91.67 | |||||||||
United States* | 85.63 | 95.69 | 97.26 | |||||||||
Canada | 77.87 | 79.73 | 78.26 | |||||||||
Europe | 99.56 | 110.56 | 113.08 | |||||||||
Asia Pacific/Middle East | 95.32 | 104.78 | 108.20 | |||||||||
Africa | 86.71 | 107.21 | 110.75 | |||||||||
Total international | 96.48 | 106.43 | 109.64 | |||||||||
Total consolidated operations* | 89.72 | 100.11 | 102.69 | |||||||||
| ||||||||||||
Equity affiliates | ||||||||||||
Asia Pacific/Middle East | 99.01 | 105.44 | 108.07 | |||||||||
Other areas | 64.14 | 72.43 | 96.50 | |||||||||
Total equity affiliates | 91.48 | 97.92 | 102.80 | |||||||||
| ||||||||||||
Total continuing operations* | 89.77 | 100.04 | 102.69 | |||||||||
| ||||||||||||
Discontinued operations | 110.61 | 109.72 | 112.90 | |||||||||
| ||||||||||||
Natural Gas Liquids Per Barrel | ||||||||||||
Consolidated operations | ||||||||||||
Lower 48 | $ | 30.74 | 31.48 | 35.45 | ||||||||
United States | 30.74 | 31.48 | 35.45 | |||||||||
Canada | 46.23 | 47.19 | 48.64 | |||||||||
Europe | 52.65 | 58.36 | 61.53 | |||||||||
Asia Pacific/Middle East | 69.36 | 73.82 | 79.26 | |||||||||
Total international | 53.26 | 56.52 | 61.01 | |||||||||
Total consolidated operations | 37.45 | 39.60 | 44.62 | |||||||||
| ||||||||||||
Equity affiliates -Asia Pacific/Middle East | 67.20 | 73.31 | 77.30 | |||||||||
| ||||||||||||
Total continuing operations | 38.99 | 41.42 | 46.36 | |||||||||
| ||||||||||||
Discontinued operations | 13.41 | 14.58 | 13.30 | |||||||||
| ||||||||||||
Bitumen Per Barrel | ||||||||||||
Consolidated operations -Canada | $ | 60.03 | 55.25 | 57.58 | ||||||||
Equity affiliates -Canada | 54.62 | 53.00 | 53.39 | |||||||||
| ||||||||||||
Natural Gas Per Thousand Cubic Feet | ||||||||||||
Consolidated operations | ||||||||||||
Alaska | $ | 5.42 | 4.35 | 4.22 | ||||||||
Lower 48 | 4.29 | 3.50 | 2.67 | |||||||||
United States | 4.32 | 3.52 | 2.72 | |||||||||
Canada | 4.13 | 2.92 | 2.13 | |||||||||
Europe | 9.29 | 10.68 | 9.76 | |||||||||
Asia Pacific/Middle East* | 9.64 | 10.46 | 10.48 | |||||||||
Africa | 3.40 | 5.38 | 5.55 | |||||||||
Total international* | 7.48 | 7.40 | 6.79 | |||||||||
Total consolidated operations* | 6.07 | 5.68 | 5.05 | |||||||||
| ||||||||||||
Equity affiliates -Asia Pacific/Middle East | 9.79 | 8.98 | 8.54 | |||||||||
| ||||||||||||
Total continuing operations* | 6.54 | 6.09 | 5.46 | |||||||||
| ||||||||||||
Discontinued operations | 2.53 | 2.60 | 2.57 | |||||||||
| ||||||||||||
*Certain amounts have been restated to reflect the reclassification of transportation costs within Results of Operations. Average sales prices for Alaska crude oil and
Asia Pacific/Middle East natural gas above reflect a reduction for transportation costs in which we have an ownership interest that are incurred subsequent to the
terminal point of the production function. Accordingly, the average sales prices differ from those discussed in Item 7 of Management's Discussion and Analysis of
Financial Condition and Results of Operations.
153
| 2014 | 2013 | 2012 | ||||||||||
|
| |||||||||||
Average Production Costs Per Barrel of Oil Equivalent (1) (2) | ||||||||||||
Consolidated operations | ||||||||||||
Alaska | $ | 18.04 | 15.92 | 13.69 | ||||||||
Lower 48 | 12.76 | 12.29 | 10.93 | |||||||||
United States | 14.11 | 13.34 | 11.81 | |||||||||
Canada | 18.14 | 15.97 | 12.83 | |||||||||
Europe | 18.31 | 19.34 | 14.51 | |||||||||
Asia Pacific/Middle East | 12.97 | 11.02 | 9.71 | |||||||||
Africa | 28.42 | 8.04 | 3.75 | |||||||||
Total international | 16.52 | 14.93 | 11.89 | |||||||||
Total consolidated continuing operations | 15.20 | 14.08 | 11.85 | |||||||||
| ||||||||||||
Equity affiliates | ||||||||||||
Canada | 15.24 | 16.92 | 15.85 | |||||||||
Asia Pacific/Middle East | 5.66 | 4.03 | 4.14 | |||||||||
Other areas | 12.33 | 14.38 | 25.01 | |||||||||
Total equity affiliates | 10.69 | 10.36 | 10.34 | |||||||||
| ||||||||||||
Discontinued operations | 16.70 | 16.95 | 14.08 | |||||||||
| ||||||||||||
Average Production Costs Per Barrel-Bitumen (2) | ||||||||||||
Consolidated operations- Canada | $ | 66.89 | 43.84 | 29.60 | ||||||||
Equity affiliates- Canada | 15.24 | 16.92 | 15.85 | |||||||||
| ||||||||||||
Taxes Other Than Income Taxes Per Barrel of Oil Equivalent | ||||||||||||
Consolidated operations | ||||||||||||
Alaska | $ | 12.61 | 23.03 | 31.75 | ||||||||
Lower 48 | 3.60 | 3.24 | 3.07 | |||||||||
United States | 5.90 | 8.96 | 12.19 | |||||||||
Canada | 1.02 | 0.82 | 0.93 | |||||||||
Europe | 0.57 | 0.59 | 0.29 | |||||||||
Asia Pacific/Middle East | 3.90 | 5.04 | 4.45 | |||||||||
Africa | 1.71 | 0.37 | 0.13 | |||||||||
Total international | 1.89 | 2.19 | 1.73 | |||||||||
Total consolidated continuing operations | 4.08 | 5.79 | 7.00 | |||||||||
| ||||||||||||
Equity affiliates | ||||||||||||
Canada | 0.33 | 0.34 | 0.30 | |||||||||
Asia Pacific/Middle East | 31.08 | 31.40 | 30.63 | |||||||||
Other areas | 34.93 | 40.41 | 61.75 | |||||||||
Total equity affiliates | 15.37 | 16.82 | 20.20 | |||||||||
| ||||||||||||
Discontinued operations | 1.04 | 0.32 | 1.13 | |||||||||
| ||||||||||||
Depreciation, Depletion and Amortization Per Barrel of Oil Equivalent | ||||||||||||
Consolidated operations | ||||||||||||
Alaska | $ | 6.33 | 5.86 | 5.40 | ||||||||
Lower 48 | 18.82 | 17.86 | 15.32 | |||||||||
United States | 15.63 | 14.38 | 12.16 | |||||||||
Canada | 15.08 | 19.97 | 19.01 | |||||||||
Europe | 23.07 | 14.58 | 11.47 | |||||||||
Asia Pacific/Middle East | 14.68 | 13.71 | 12.25 | |||||||||
Africa | 2.05 | 2.65 | 2.80 | |||||||||
Total international | 17.59 | 15.29 | 13.33 | |||||||||
Total consolidated continuing operations | 16.52 | 14.81 | 12.74 | |||||||||
| ||||||||||||
Equity affiliates | ||||||||||||
Canada | 7.89 | 6.59 | 10.96 | |||||||||
Asia Pacific/Middle East | 4.38 | 3.68 | 2.90 | |||||||||
Other areas | 4.79 | 7.53 | 3.16 | |||||||||
Total equity affiliates | 6.19 | 5.14 | 6.23 | |||||||||
| ||||||||||||
Discontinued operations | - | - | 9.73 | |||||||||
| ||||||||||||
| (1) | Includes bitumen. |
| (2) | Certain amounts have been restated to reflect the reclassification of transportation costs within Results of Operations. |
154
Development and Exploration Activities
The following two tables summarize our net interest in productive and dry exploratory and development wells in the years ended December 31, 2014, 2013 and 2012. A "development well" is a well drilled within the proved area of a reservoir to the depth of a stratigraphic horizon known to be productive. An "exploratory well" is a well drilled to find and produce crude oil or natural gas in an unknown field or a new reservoir within a proven field. Excluded from the exploratory well count are stratigraphic-type exploratory wells, primarily relating to oil sands delineation wells located in Canada and coalbed methane test wells located in Asia Pacific/Middle East.
| Net Wells Completed | Productive | Dry | ||||||||||||||||||||||
| 2014 | 2013 | 2012 | 2014 | 2013 | 2012 | |||||||||||||||||||
|
|
|
| |||||||||||||||||||||
Exploratory (1) (2) | ||||||||||||||||||||||||
Consolidated operations | ||||||||||||||||||||||||
Alaska | * | 2 | * | * | - | - | ||||||||||||||||||
Lower 48 | 30 | 67 | 92 | 3 | 4 | 2 | ||||||||||||||||||
| ||||||||||||||||||||||||
United States | 30 | 69 | 92 | 3 | 4 | 2 | ||||||||||||||||||
Canada | 9 | 5 | 5 | * | - | - | ||||||||||||||||||
Europe | 1 | * | * | 1 | * | * | ||||||||||||||||||
Asia Pacific/Middle East | 2 | 3 | * | * | * | - | ||||||||||||||||||
Africa | * | - | * | * | * | - | ||||||||||||||||||
Other areas | - | - | * | - | * | * | ||||||||||||||||||
| ||||||||||||||||||||||||
Total consolidated operations | 42 | 77 | 97 | 4 | 4 | 2 | ||||||||||||||||||
| ||||||||||||||||||||||||
| ||||||||||||||||||||||||
Equity affiliates | ||||||||||||||||||||||||
Asia Pacific/Middle East | 36 | 2 | 3 | 2 | - | - | ||||||||||||||||||
Other areas | - | - | - | - | - | * | ||||||||||||||||||
| ||||||||||||||||||||||||
Total equity affiliates | 36 | 2 | 3 | 2 | - | - | ||||||||||||||||||
| ||||||||||||||||||||||||
| ||||||||||||||||||||||||
Development | ||||||||||||||||||||||||
Consolidated operations | ||||||||||||||||||||||||
Alaska | 8 | 6 | 3 | - | - | - | ||||||||||||||||||
Lower 48 | 450 | 441 | 377 | 1 | - | * | ||||||||||||||||||
| ||||||||||||||||||||||||
United States | 458 | 447 | 380 | 1 | - | - | ||||||||||||||||||
Canada | 98 | 61 | 119 | - | - | 3 | ||||||||||||||||||
Europe | 7 | 5 | 4 | - | * | - | ||||||||||||||||||
Asia Pacific/Middle East | 14 | 29 | 11 | - | - | - | ||||||||||||||||||
Africa | 1 | 4 | 4 | - | - | - | ||||||||||||||||||
Other areas | - | * | - | - | - | - | ||||||||||||||||||
| ||||||||||||||||||||||||
Total consolidated operations | 578 | 546 | 518 | 1 | - | 3 | ||||||||||||||||||
| ||||||||||||||||||||||||
| ||||||||||||||||||||||||
Equity affiliates | ||||||||||||||||||||||||
Canada | 65 | 46 | 30 | - | - | - | ||||||||||||||||||
Asia Pacific/Middle East | 294 | 24 | 9 | 1 | * | - | ||||||||||||||||||
Other areas | 1 | - | 1 | - | - | - | ||||||||||||||||||
| ||||||||||||||||||||||||
Total equity affiliates | 360 | 70 | 40 | 1 | - | - | ||||||||||||||||||
| ||||||||||||||||||||||||
| ||||||||||||||||||||||||
| (1) | Excludes net stratigraphic-type exploratory wells of 87, 149 and 135 for the years ended December 31, 2014, 2013 and 2012, respectively. |
| (2) | This also includes net extension wells of 49, 55 and 85 for the years ended December 31, 2014, 2013 and 2012, respectively. |
Extension wells are wells drilled in areas near or offsetting current production, or in areas where well density or production history have not achieved statistical certainty of results, primarily located in Asia Pacific/Middle East and the United States.
| * | Our total proportionate interest was less than one. |
155
The table below represents the status of our wells drilling at December 31, 2014, and includes wells in the process of drilling or in active completion. It also represents gross and net productive wells, including producing wells and wells capable of production at December 31, 2014.
| Wells at December 31, 2014 | Productive * | |||||||||||||||||||||||
| In Progress | Oil | Gas | ||||||||||||||||||||||
| Gross | Net | Gross | Net | Gross | Net | |||||||||||||||||||
|
|
|
|
|
| |||||||||||||||||||
Consolidated operations | ||||||||||||||||||||||||
Alaska | 5 | 3 | 1,759 | 778 | 30 | 19 | ||||||||||||||||||
Lower 48 | 465 | 216 | 9,338 | 4,815 | 23,597 | 15,578 | ||||||||||||||||||
| ||||||||||||||||||||||||
United States | 470 | 219 | 11,097 | 5,593 | 23,627 | 15,597 | ||||||||||||||||||
Canada | 185 | 105 | 1,662 | 945 | 12,322 | 7,212 | ||||||||||||||||||
Europe | 23 | 4 | 470 | 84 | 232 | 91 | ||||||||||||||||||
Asia Pacific/Middle East | 21 | 8 | 433 | 178 | 129 | 57 | ||||||||||||||||||
Africa | 11 | 2 | 825 | 134 | 9 | 2 | ||||||||||||||||||
Other areas | 1 | - | - | - | - | - | ||||||||||||||||||
| ||||||||||||||||||||||||
Total consolidated operations | 711 | 338 | 14,487 | 6,934 | 36,319 | 22,959 | ||||||||||||||||||
| ||||||||||||||||||||||||
| ||||||||||||||||||||||||
Equity affiliates | ||||||||||||||||||||||||
Canada | 46 | 23 | 401 | 201 | - | - | ||||||||||||||||||
Asia Pacific/Middle East | 932 | 189 | - | - | 2,183 | 512 | ||||||||||||||||||
Other areas | - | - | 32 | 16 | - | - | ||||||||||||||||||
| ||||||||||||||||||||||||
Total equity affiliates | 978 | 212 | 433 | 217 | 2,183 | 512 | ||||||||||||||||||
| ||||||||||||||||||||||||
| ||||||||||||||||||||||||
* Includes 183 gross and 147 net multiple completion wells.
| Acreage at December 31, 2014 | Thousands of Acres | |||||||||||||||
| Developed | Undeveloped | |||||||||||||||
| Gross | Net | Gross | Net | |||||||||||||
|
|
|
| |||||||||||||
Consolidated operations | ||||||||||||||||
Alaska | 638 | 323 | 1,285 | 906 | ||||||||||||
Lower 48 | 5,728 | 4,310 | 12,820 | 10,765 | ||||||||||||
| ||||||||||||||||
United States | 6,366 | 4,633 | 14,105 | 11,671 | ||||||||||||
Canada | 5,657 | 3,970 | 11,387 | 5,465 | ||||||||||||
Europe | 882 | 283 | 2,696 | 1,152 | ||||||||||||
Asia Pacific/Middle East* | 4,258 | 1,811 | 25,920 | 14,599 | ||||||||||||
Africa | 358 | 59 | 16,834 | 3,666 | ||||||||||||
Other areas | - | - | 3,437 | 1,829 | ||||||||||||
| ||||||||||||||||
Total consolidated operations | 17,521 | 10,756 | 74,379 | 38,382 | ||||||||||||
| ||||||||||||||||
| ||||||||||||||||
Equity affiliates | ||||||||||||||||
Canada | 50 | 20 | 659 | 275 | ||||||||||||
Asia Pacific/Middle East | 583 | 132 | 6,618 | 1,848 | ||||||||||||
Other areas | 16 | 8 | 620 | 310 | ||||||||||||
| ||||||||||||||||
Total equity affiliates | 649 | 160 | 7,897 | 2,433 | ||||||||||||
| ||||||||||||||||
| ||||||||||||||||
* Includes 10,232 thousand gross and 4,707 thousand net undeveloped acres with a minimum remaining lease term of less than one year.
156
Costs Incurred
| Year Ended | Millions of Dollars | |||||||||||||||||||||||||||||||||||
| December 31 | Lower | Total | Asia Pacific/ | Other | ||||||||||||||||||||||||||||||||
| Alaska | 48 | U.S. | Canada | Europe | Middle East | Africa | Areas | Total | ||||||||||||||||||||||||||||
|
| |||||||||||||||||||||||||||||||||||
2014 | ||||||||||||||||||||||||||||||||||||
Consolidated operations | ||||||||||||||||||||||||||||||||||||
Unproved property acquisition | $ | - | 159 | 159 | 61 | 90 | - | 6 | - | 316 | ||||||||||||||||||||||||||
Proved property acquisition | - | 10 | 10 | - | - | - | - | - | 10 | |||||||||||||||||||||||||||
| ||||||||||||||||||||||||||||||||||||
| - | 169 | 169 | 61 | 90 | - | 6 | - | 326 | ||||||||||||||||||||||||||||
Exploration | 130 | 1,347 | 1,477 | 332 | 243 | 166 | 556 | 58 | 2,832 | |||||||||||||||||||||||||||
Development | 1,263 | 4,881 | 6,144 | 2,185 | 3,618 | 1,353 | 71 | - | 13,371 | |||||||||||||||||||||||||||
| ||||||||||||||||||||||||||||||||||||
| $ | 1,393 | 6,397 | 7,790 | 2,578 | 3,951 | 1,519 | 633 | 58 | 16,529 | |||||||||||||||||||||||||||
| ||||||||||||||||||||||||||||||||||||
| ||||||||||||||||||||||||||||||||||||
Equity affiliates | ||||||||||||||||||||||||||||||||||||
Unproved property acquisition | $ | - | - | - | - | - | 2 | - | - | 2 | ||||||||||||||||||||||||||
Proved property acquisition | - | - | - | - | - | - | - | - | - | |||||||||||||||||||||||||||
| ||||||||||||||||||||||||||||||||||||
| - | - | - | - | - | 2 | - | - | 2 | ||||||||||||||||||||||||||||
Exploration | - | - | - | 23 | 36 | 89 | - | - | 148 | |||||||||||||||||||||||||||
Development | - | - | - | 1,627 | - | 2,258 | - | 9 | 3,894 | |||||||||||||||||||||||||||
| ||||||||||||||||||||||||||||||||||||
| $ | - | - | - | 1,650 | 36 | 2,349 | - | 9 | 4,044 | |||||||||||||||||||||||||||
| ||||||||||||||||||||||||||||||||||||
| ||||||||||||||||||||||||||||||||||||
2013 | ||||||||||||||||||||||||||||||||||||
Consolidated operations | ||||||||||||||||||||||||||||||||||||
Unproved property acquisition | $ | 3 | 311 | 314 | 90 | - | 111 | 177 | 15 | 707 | ||||||||||||||||||||||||||
Proved property acquisition | - | 4 | 4 | 10 | - | - | - | - | 14 | |||||||||||||||||||||||||||
| ||||||||||||||||||||||||||||||||||||
| 3 | 315 | 318 | 100 | - | 111 | 177 | 15 | 721 | ||||||||||||||||||||||||||||
Exploration | 159 | 1,156 | 1,315 | 294 | 240 | 321 | 136 | 49 | 2,355 | |||||||||||||||||||||||||||
Development | 925 | 4,067 | 4,992 | 1,952 | 3,999 | 2,256 | 216 | 409 | 13,824 | |||||||||||||||||||||||||||
| ||||||||||||||||||||||||||||||||||||
| $ | 1,087 | 5,538 | 6,625 | 2,346 | 4,239 | 2,688 | 529 | 473 | 16,900 | |||||||||||||||||||||||||||
| ||||||||||||||||||||||||||||||||||||
| ||||||||||||||||||||||||||||||||||||
Equity affiliates | ||||||||||||||||||||||||||||||||||||
Unproved property acquisition | $ | - | - | - | 1 | - | 51 | - | - | 52 | ||||||||||||||||||||||||||
Proved property acquisition | - | - | - | - | - | - | - | - | - | |||||||||||||||||||||||||||
| ||||||||||||||||||||||||||||||||||||
| - | - | - | 1 | - | 51 | - | - | 52 | ||||||||||||||||||||||||||||
Exploration | - | - | - | 59 | 31 | 101 | - | - | 191 | |||||||||||||||||||||||||||
Development | - | - | - | 1,532 | - | 2,141 | - | 3 | 3,676 | |||||||||||||||||||||||||||
| ||||||||||||||||||||||||||||||||||||
| $
| -
|
| - | - | 1,592 | 31 | 2,293 | - | 3 | 3,919 | ||||||||||||||||||||||||||
| ||||||||||||||||||||||||||||||||||||
| ||||||||||||||||||||||||||||||||||||
2012 | ||||||||||||||||||||||||||||||||||||
Consolidated operations | ||||||||||||||||||||||||||||||||||||
Unproved property acquisition | $ | 2 | 562 | 564 | 14 | 2 | - | 333 | - | 913 | ||||||||||||||||||||||||||
Proved property acquisition | - | 33 | 33 | 3 | - | - | - | - | 36 | |||||||||||||||||||||||||||
| ||||||||||||||||||||||||||||||||||||
| 2 | 595 | 597 | 17 | 2 | - | 333 | - | 949 | ||||||||||||||||||||||||||||
Exploration | 104 | 1,272 | 1,376 | 218 | 91 | 248 | 94 | 142 | 2,169 | |||||||||||||||||||||||||||
Development | 644 | 3,917 | 4,561 | 2,062 | 3,515 | 1,113 | 208 | 585 | 12,044 | |||||||||||||||||||||||||||
| ||||||||||||||||||||||||||||||||||||
| $ | 750 | 5,784 | 6,534 | 2,297 | 3,608 | 1,361 | 635 | 727 | 15,162 | |||||||||||||||||||||||||||
| ||||||||||||||||||||||||||||||||||||
| ||||||||||||||||||||||||||||||||||||
Equity affiliates | ||||||||||||||||||||||||||||||||||||
Unproved property acquisition | $ | - | - | - | 12 | - | - | - | - | 12 | ||||||||||||||||||||||||||
Proved property acquisition | - | - | - | - | - | - | - | - | - | |||||||||||||||||||||||||||
| ||||||||||||||||||||||||||||||||||||
| - | - | - | 12 | - | - | - | - | 12 | ||||||||||||||||||||||||||||
Exploration | - | - | - | 77 | 11 | 52 | - | - | 140 | |||||||||||||||||||||||||||
Development | - | - | - | 1,332 | - | 1,163 | - | 13 | 2,508 | |||||||||||||||||||||||||||
| ||||||||||||||||||||||||||||||||||||
| $ | - | - | - | 1,421 | 11 | 1,215 | - | 13 | 2,660 | |||||||||||||||||||||||||||
| ||||||||||||||||||||||||||||||||||||
| ||||||||||||||||||||||||||||||||||||
157
Capitalized Costs
| At December 31 | Millions of Dollars | |||||||||||||||||||||||||||||||||||
| Lower | Total | Asia Pacific/ | Other | |||||||||||||||||||||||||||||||||
| Alaska | 48 | U.S. | Canada | Europe | Middle East | Africa | Areas | Total | ||||||||||||||||||||||||||||
|
| |||||||||||||||||||||||||||||||||||
2014 | ||||||||||||||||||||||||||||||||||||
Consolidated operations | ||||||||||||||||||||||||||||||||||||
Proved property | $ | 15,686 | 47,390 | 63,076 | 22,831 | 27,933 | 15,730 | 870 | 8 | 130,448 | ||||||||||||||||||||||||||
Unproved property | 1,724 | 2,938 | 4,662 | 1,975 | 432 | 927 | 923 | 32 | 8,951 | |||||||||||||||||||||||||||
| ||||||||||||||||||||||||||||||||||||
| 17,410 | 50,328 | 67,738 | 24,806 | 28,365 | 16,657 | 1,793 | 40 | 139,399 | ||||||||||||||||||||||||||||
Accumulated depreciation, depletion and amortization | 7,545 | 23,484 | 31,029 | 13,419 | 15,134 | 7,594 | 294 | 9 | 67,479 | |||||||||||||||||||||||||||
| ||||||||||||||||||||||||||||||||||||
| $ | 9,865 | 26,844 | 36,709 | 11,387 | 13,231 | 9,063 | 1,499 | 31 | 71,920 | |||||||||||||||||||||||||||
| ||||||||||||||||||||||||||||||||||||
| ||||||||||||||||||||||||||||||||||||
Equity affiliates | ||||||||||||||||||||||||||||||||||||
Proved property | $ | - | - | - | 9,506 | - | 8,855 | - | 220 | 18,581 | ||||||||||||||||||||||||||
Unproved property | - | - | - | 1,150 | - | 3,474 | - | - | 4,624 | |||||||||||||||||||||||||||
| ||||||||||||||||||||||||||||||||||||
| - | - | - | 10,656 | - | 12,329 | - | 220 | 23,205 | ||||||||||||||||||||||||||||
Accumulated depreciation, depletion and amortization | - | - | - | 1,422 | - | 566 | - | 198 | 2,186 | |||||||||||||||||||||||||||
| ||||||||||||||||||||||||||||||||||||
| $ | - | - | - | 9,234 | - | 11,763 | - | 22 | 21,019 | |||||||||||||||||||||||||||
| ||||||||||||||||||||||||||||||||||||
| ||||||||||||||||||||||||||||||||||||
2013 | ||||||||||||||||||||||||||||||||||||
Consolidated operations | ||||||||||||||||||||||||||||||||||||
Proved property | $ | 14,382 | 42,118 | 56,500 | 22,612 | 28,523 | 14,513 | 2,628 | 9 | 124,785 | ||||||||||||||||||||||||||
Unproved property | 1,644 | 2,931 | 4,575 | 1,966 | 308 | 931 | 742 | 16 | 8,538 | |||||||||||||||||||||||||||
| ||||||||||||||||||||||||||||||||||||
| 16,026 | 45,049 | 61,075 | 24,578 | 28,831 | 15,444 | 3,370 | 25 | 133,323 | ||||||||||||||||||||||||||||
Accumulated depreciation, depletion and amortization | 7,107 | 19,840 | 26,947 | 13,473 | 15,131 | 6,504 | 1,043 | 9 | 63,107 | |||||||||||||||||||||||||||
| ||||||||||||||||||||||||||||||||||||
| $ | 8,919 | 25,209 | 34,128 | 11,105 | 13,700 | 8,940 | 2,327 | 16 | 70,216 | |||||||||||||||||||||||||||
| ||||||||||||||||||||||||||||||||||||
| ||||||||||||||||||||||||||||||||||||
Equity affiliates | ||||||||||||||||||||||||||||||||||||
Proved property | $ | - | - | - | 8,525 | - | 6,994 | - | 211 | 15,730 | ||||||||||||||||||||||||||
Unproved property | - | - | - | 1,379 | 57 | 4,097 | - | - | 5,533 | |||||||||||||||||||||||||||
| ||||||||||||||||||||||||||||||||||||
| - | - | - | 9,904 | 57 | 11,091 | - | 211 | 21,263 | ||||||||||||||||||||||||||||
Accumulated depreciation, depletion and amortization | - | - | - | 1,199 | - | 446 | - | 191 | 1,836 | |||||||||||||||||||||||||||
| ||||||||||||||||||||||||||||||||||||
| $ | - | - | - | 8,705 | 57 | 10,645 | - | 20 | 19,427 | |||||||||||||||||||||||||||
| ||||||||||||||||||||||||||||||||||||
| ||||||||||||||||||||||||||||||||||||
158
Standardized Measure of Discounted Future Net Cash Flows Relating to Proved Oil and Gas Reserve Quantities
In accordance with SEC and FASB requirements, amounts were computed using 12-month average prices (adjusted only for existing contractual terms) and end-of-year costs, appropriate statutory tax rates and a prescribed 10 percent discount factor. Twelve-month average prices are calculated as the unweighted arithmetic average of the first-day-of-the-month price for each month within the 12-month period prior to the end of the reporting period. For all years, continuation of year-end economic conditions was assumed. The calculations were based on estimates of proved reserves, which are revised over time as new data becomes available. Probable or possible reserves, which may become proved in the future, were not considered. The calculations also require assumptions as to the timing of future production of proved reserves and the timing and amount of future development costs, including dismantlement, and future production costs, including taxes other than income taxes.
While due care was taken in its preparation, we do not represent that this data is the fair value of our oil and gas properties, or a fair estimate of the present value of cash flows to be obtained from their development and production.
Discounted Future Net Cash Flows
| Millions of Dollars | ||||||||||||||||||||||||||||||||||||
| Lower | Total | Asia Pacific/ | Other | |||||||||||||||||||||||||||||||||
| Alaska | 48 | U.S. | Canada | Europe | Middle East | Africa | Areas | Total | ||||||||||||||||||||||||||||
|
| |||||||||||||||||||||||||||||||||||
2014 | ||||||||||||||||||||||||||||||||||||
Consolidated operations | ||||||||||||||||||||||||||||||||||||
Future cash inflows | $ | 106,506 | 100,322 | 206,828 | 50,209 | 55,878 | 39,492 | 25,997 | - | 378,404 | ||||||||||||||||||||||||||
Less: | ||||||||||||||||||||||||||||||||||||
Future production costs | 57,924 | 37,872 | 95,796 | 21,342 | 16,372 | 12,555 | 1,338 | - | 147,403 | |||||||||||||||||||||||||||
Future development costs | 10,815 | 19,666 | 30,481 | 10,400 | 14,194 | 2,985 | 437 | - | 58,497 | |||||||||||||||||||||||||||
Future income tax provisions | 12,483 | 14,800 | 27,283 | 3,159 | 15,757 | 7,728 | 22,526 | - | 76,453 | |||||||||||||||||||||||||||
| ||||||||||||||||||||||||||||||||||||
Future net cash flows | 25,284 | 27,984 | 53,268 | 15,308 | 9,555 | 16,224 | 1,696 | - | 96,051 | |||||||||||||||||||||||||||
10 percent annual discount | 12,499 | 10,150 | 22,649 | 8,915 | 2,741 | 4,607 | 791 | - | 39,703 | |||||||||||||||||||||||||||
| ||||||||||||||||||||||||||||||||||||
Discounted future net cash flows | $ | 12,785 | 17,834 | 30,619 | 6,393 | 6,814 | 11,617 | 905 | - | 56,348 | ||||||||||||||||||||||||||
| ||||||||||||||||||||||||||||||||||||
| ||||||||||||||||||||||||||||||||||||
Equity affiliates | ||||||||||||||||||||||||||||||||||||
Future cash inflows | $ | - | - | - | 88,716 | - | 61,480 | - | 357 | 150,553 | ||||||||||||||||||||||||||
Less: | ||||||||||||||||||||||||||||||||||||
Future production costs | - | - | - | 25,455 | - | 27,274 | - | 276 | 53,005 | |||||||||||||||||||||||||||
Future development costs | - | - | - | 11,595 | - | 3,007 | - | 16 | 14,618 | |||||||||||||||||||||||||||
Future income tax provisions | - | - | - | 12,322 | - | 7,225 | - | 10 | 19,557 | |||||||||||||||||||||||||||
| ||||||||||||||||||||||||||||||||||||
Future net cash flows | - | - | - | 39,344 | - | 23,974 | - | 55 | 63,373 | |||||||||||||||||||||||||||
10 percent annual discount | - | - | - | 25,601 | - | 10,897 | - | 6 | 36,504 | |||||||||||||||||||||||||||
| ||||||||||||||||||||||||||||||||||||
Discounted future net cash flows | $ | - | - | - | 13,743 | - | 13,077 | - | 49 | 26,869 | ||||||||||||||||||||||||||
| ||||||||||||||||||||||||||||||||||||
Total company | ||||||||||||||||||||||||||||||||||||
Discounted future net cash flows | $ | 12,785 | 17,834 | 30,619 | 20,136 | 6,814 | 24,694 | 905 | 49 | 83,217 | ||||||||||||||||||||||||||
| ||||||||||||||||||||||||||||||||||||
| ||||||||||||||||||||||||||||||||||||
159
| Millions of Dollars | ||||||||||||||||||||||||||||||||||||
| Lower | Total | Asia Pacific/ | Other | |||||||||||||||||||||||||||||||||
| Alaska* | 48 | U.S. | Canada | Europe | Middle East | Africa | Areas | Total | ||||||||||||||||||||||||||||
|
| |||||||||||||||||||||||||||||||||||
2013 | ||||||||||||||||||||||||||||||||||||
Consolidated operations | ||||||||||||||||||||||||||||||||||||
Future cash inflows | $ | 120,384 | 93,276 | 213,660 | 39,695 | 69,654 | 43,827 | 33,055 | - | 399,891 | ||||||||||||||||||||||||||
Less: | ||||||||||||||||||||||||||||||||||||
Future production costs | 61,636 | 34,344 | 95,980 | 22,435 | 16,902 | 14,567 | 4,148 | - | 154,032 | |||||||||||||||||||||||||||
Future development costs | 12,282 | 15,833 | 28,115 | 12,228 | 14,821 | 3,250 | 695 | - | 59,109 | |||||||||||||||||||||||||||
Future income tax provisions | 16,356 | 14,810 | 31,166 | 401 | 24,706 | 8,388 | 25,371 | - | 90,032 | |||||||||||||||||||||||||||
| ||||||||||||||||||||||||||||||||||||
Future net cash flows | 30,110 | 28,289 | 58,399 | 4,631 | 13,225 | 17,622 | 2,841 | - | 96,718 | |||||||||||||||||||||||||||
10 percent annual discount | 16,187 | 11,217 | 27,404 | 2,881 | 4,298 | 5,046 | 1,086 | - | 40,715 | |||||||||||||||||||||||||||
| ||||||||||||||||||||||||||||||||||||
Discounted future net cash flows | $ | 13,923 | 17,072 | 30,995 | 1,750 | 8,927 | 12,576 | 1,755 | - | 56,003 | ||||||||||||||||||||||||||
| ||||||||||||||||||||||||||||||||||||
| ||||||||||||||||||||||||||||||||||||
Equity affiliates | ||||||||||||||||||||||||||||||||||||
Future cash inflows | $ | - | - | - | 72,327 | - | 55,327 | - | 296 | 127,950 | ||||||||||||||||||||||||||
Less: | ||||||||||||||||||||||||||||||||||||
Future production costs | - | - | - | 24,953 | - | 26,356 | - | 233 | 51,542 | |||||||||||||||||||||||||||
Future development costs | - | - | - | 10,673 | - | 2,616 | - | 13 | 13,302 | |||||||||||||||||||||||||||
Future income tax provisions | - | - | - | 8,776 | - | 5,471 | - | 6 | 14,253 | |||||||||||||||||||||||||||
| ||||||||||||||||||||||||||||||||||||
Future net cash flows | - | - | - | 27,925 | - | 20,884 | - | 44 | 48,853 | |||||||||||||||||||||||||||
10 percent annual discount | - | - | - | 17,643 | - | 9,697 | - | 4 | 27,344 | |||||||||||||||||||||||||||
| ||||||||||||||||||||||||||||||||||||
Discounted future net cash flows | $ | - | - | - | 10,282 | - | 11,187 | - | 40 | 21,509 | ||||||||||||||||||||||||||
| ||||||||||||||||||||||||||||||||||||
| ||||||||||||||||||||||||||||||||||||
Total company | ||||||||||||||||||||||||||||||||||||
Discounted future net cash flows | $ | 13,923 | 17,072 | 30,995 | 12,032 | 8,927 | 23,763 | 1,755 | 40 | 77,512 | ||||||||||||||||||||||||||
| ||||||||||||||||||||||||||||||||||||
| ||||||||||||||||||||||||||||||||||||
| * | Future cash inflows and future production costs for Alaska have been restated to reflect the reclassification of transportation costs within Results of Operations. |
There was no impact to total discounted future net cash flows.
160
| Millions of Dollars | ||||||||||||||||||||||||||||||||||||
|
| |||||||||||||||||||||||||||||||||||
| Alaska* | Lower 48 | Total U.S. | Canada | Europe | Asia Pacific/ Middle East | Africa | Other Areas | Total | ||||||||||||||||||||||||||||
|
| |||||||||||||||||||||||||||||||||||
2012 | ||||||||||||||||||||||||||||||||||||
Consolidated operations | ||||||||||||||||||||||||||||||||||||
Future cash inflows | $ | 129,622 | 71,556 | 201,178 | 37,814 | 73,379 | 49,234 | 32,009 | 12,012 | 405,626 | ||||||||||||||||||||||||||
Less: | ||||||||||||||||||||||||||||||||||||
Future production costs | 70,617 | 28,447 | 99,064 | 20,995 | 16,180 | 15,202 | 4,342 | 3,653 | 159,436 | |||||||||||||||||||||||||||
Future development costs | 12,683 | 10,604 | 23,287 | 12,564 | 15,273 | 3,851 | 944 | 1,158 | 57,077 | |||||||||||||||||||||||||||
Future income tax provisions | 16,370 | 10,840 | 27,210 | - | 28,187 | 10,424 | 22,595 | 1,331 | 89,747 | |||||||||||||||||||||||||||
| ||||||||||||||||||||||||||||||||||||
Future net cash flows | 29,952 | 21,665 | 51,617 | 4,255 | 13,739 | 19,757 | 4,128 | 5,870 | 99,366 | |||||||||||||||||||||||||||
10 percent annual discount | 16,511 | 9,461 | 25,972 | 2,963 | 4,936 | 6,393 | 1,442 | 3,711 | 45,417 | |||||||||||||||||||||||||||
| ||||||||||||||||||||||||||||||||||||
Discounted future net cash flows | $ | 13,441 | 12,204 | 25,645 | 1,292 | 8,803 | 13,364 | 2,686 | 2,159 | 53,949 | ||||||||||||||||||||||||||
| ||||||||||||||||||||||||||||||||||||
Equity affiliates | ||||||||||||||||||||||||||||||||||||
Future cash inflows | $ | - | - | - | 72,587 | - | 47,394 | - | 323 | 120,304 | ||||||||||||||||||||||||||
Less: | ||||||||||||||||||||||||||||||||||||
Future production costs | - | - | - | 23,967 | - | 23,689 | - | 245 | 47,901 | |||||||||||||||||||||||||||
Future development costs | - | - | - | 11,109 | - | 1,221 | - | 10 | 12,340 | |||||||||||||||||||||||||||
Future income tax provisions | - | - | - | 9,126 | - | 4,335 | - | 3 | 13,464 | |||||||||||||||||||||||||||
| ||||||||||||||||||||||||||||||||||||
Future net cash flows | - | - | - | 28,385 | - | 18,149 | - | 65 | 46,599 | |||||||||||||||||||||||||||
10 percent annual discount | - | - | - | 18,669 | - | 8,677 | - | 9 | 27,355 | |||||||||||||||||||||||||||
| ||||||||||||||||||||||||||||||||||||
Discounted future net cash flows | $ | - | - | - | 9,716 | - | 9,472 | - | 56 | 19,244 | ||||||||||||||||||||||||||
| ||||||||||||||||||||||||||||||||||||
Total company | ||||||||||||||||||||||||||||||||||||
Discounted future net cash flows | $ | 13,441 | 12,204 | 25,645 | 11,008 | 8,803 | 22,836 | 2,686 | 2,215 | 73,193 | ||||||||||||||||||||||||||
| ||||||||||||||||||||||||||||||||||||
*Future cash inflows and future production costs for Alaska have been restated to reflect the reclassification of transportation costs within Results of Operations.
There was no impact to total discounted future net cash flows.
161
Sources of Change in Discounted Future Net Cash Flows
| Millions of Dollars | ||||||||||||||||||||||||||||||||||||
| Consolidated Operations | Equity Affiliates | Total Company | ||||||||||||||||||||||||||||||||||
| 2014 | 2013 | 2012 | 2014 | 2013 | 2012 | 2014 | 2013 | 2012 | ||||||||||||||||||||||||||||
|
| |||||||||||||||||||||||||||||||||||
Discounted future net cash flows at the beginning of the year | $ | 56,003 | 53,949 | 55,813 | 21,509 | 19,244 | 15,209 | 77,512 | 73,193 | 71,022 | ||||||||||||||||||||||||||
| ||||||||||||||||||||||||||||||||||||
Changes during the year | ||||||||||||||||||||||||||||||||||||
Revenues less production costs for the year | (19,571 | ) | (21,250 | ) | (22,748 | ) | (2,748 | ) | (2,307 | ) | (2,126 | ) | (22,319 | ) | (23,557 | ) | (24,874) | |||||||||||||||||||
Net change in prices and production costs | (9,243 | ) | (611 | ) | (5,451 | ) | 4,517 | (1,645 | ) | 114 | (4,726 | ) | (2,256 | ) | (5,337) | |||||||||||||||||||||
Extensions, discoveries and improved recovery, less estimated future costs | 7,033 | 15,796 | 11,192 | 1,822 | 1,804 | 1,963 | 8,855 | 17,600 | 13,155 | |||||||||||||||||||||||||||
Development costs for the year | 11,785 | 11,640 | 10,944 | 3,669 | 3,675 | 2,438 | 15,454 | 15,315 | 13,382 | |||||||||||||||||||||||||||
Changes in estimated future development costs | (7,771 | ) | (9,760 | ) | (9,832 | ) | (1,829 | ) | (3,167 | ) | (3,285 | ) | (9,600 | ) | (12,927 | ) | (13,117) | |||||||||||||||||||
Purchases of reserves in place, less estimated future costs | - | 2 | 16 | 5 | - | - | 5 | 2 | 16 | |||||||||||||||||||||||||||
Sales of reserves in place, less estimated future costs | (1,280 | ) | (5,997 | ) | (913 | ) | - | - | (139 | ) | (1,280 | ) | (5,997 | ) | (1,052) | |||||||||||||||||||||
Revisions of previous quantity estimates | 1,348 | 4,317 | 2,042 | (1,166 | ) | 2,357 | 3,952 | 182 | 6,674 | 5,994 | ||||||||||||||||||||||||||
Accretion of discount | 10,045 | 9,732 | 10,095 | 2,648 | 2,331 | 1,858 | 12,693 | 12,063 | 11,953 | |||||||||||||||||||||||||||
Net change in income taxes | 7,999 | (1,815 | ) | 2,791 | (1,558 | ) | (783 | ) | (740 | ) | 6,441 | (2,598 | ) | 2,051 | ||||||||||||||||||||||
| ||||||||||||||||||||||||||||||||||||
Total changes | 345 | 2,054 | (1,864 | ) | 5,360 | 2,265 | 4,035 | 5,705 | 4,319 | 2,171 | ||||||||||||||||||||||||||
| ||||||||||||||||||||||||||||||||||||
Discounted future net cash flows at year end | $ | 56,348 | 56,003 | 53,949 | 26,869 | 21,509 | 19,244 | 83,217 | 77,512 | 73,193 | ||||||||||||||||||||||||||
| ||||||||||||||||||||||||||||||||||||
| • | The net change in prices and production costs is the beginning-of-year reserve-production forecast multiplied by the net annual change in the per-unit sales price and production cost, discounted at 10 percent. |
| • | Purchases and sales of reserves in place, along with extensions, discoveries and improved recovery, are calculated using production forecasts of the applicable reserve quantities for the year multiplied by the 12-month average sales prices, less future estimated costs, discounted at 10 percent. |
| • | Revisions of previous quantity estimates are calculated using production forecast changes for the year, including changes in the timing of production, multiplied by the 12-month average sales prices, less future estimated costs, discounted at 10 percent. |
| • | The accretion of discount is 10 percent of the prior year's discounted future cash inflows, less future production and development costs. |
| • | The net change in income taxes is the annual change in the discounted future income tax provisions. |
162
Selected Quarterly Financial Data (Unaudited)
| Millions of Dollars | Per Share of Common Stock | |||||||||||||||||||||||
| Sales and Other Operating | Income (Loss) From Continuing Operations Before | Net Income | Net Income (Loss) Attributable to | Net Income (Loss) Attributable to ConocoPhillips | ||||||||||||||||||||
| Revenues | Income Taxes | (Loss) | ConocoPhillips | Basic | Diluted | |||||||||||||||||||
|
|
|
| |||||||||||||||||||||
2014 | ||||||||||||||||||||||||
First | $ | 15,415 | 3,698 | 2,137 | 2,123 | 1.72 | 1.71 | |||||||||||||||||
Second | 13,821 | 3,460 | 2,098 | 2,081 | 1.68 | 1.67 | ||||||||||||||||||
Third | 12,080 | 2,553 | 2,727 | 2,704 | 2.18 | 2.17 | ||||||||||||||||||
Fourth* | 11,208 | (321 | ) | (24 | ) | (39 | ) | (0.03 | ) | (0.03) | ||||||||||||||
| ||||||||||||||||||||||||
2013 | ||||||||||||||||||||||||
First | $ | 14,166 | 3,787 | 2,153 | 2,139 | 1.74 | 1.73 | |||||||||||||||||
Second | 13,350 | 3,696 | 2,063 | 2,050 | 1.66 | 1.65 | ||||||||||||||||||
Third | 13,643 | 4,405 | 2,496 | 2,480 | 2.01 | 2.00 | ||||||||||||||||||
Fourth | 13,254 | 2,558 | 2,503 | 2,487 | 2.01 | 2.00 | ||||||||||||||||||
| * | For additional information on the commodity price environment in the fourth quarter of 2014, see the Business Environment and Executive Overview section of Management's Discussion and Analysis of Financial Condition and Results of Operations. |
163
Supplementary Information-Condensed Consolidating Financial Information
We have various cross guarantees among ConocoPhillips, ConocoPhillips Company and ConocoPhillips Canada Funding Company I, with respect to publicly held debt securities. ConocoPhillips Company is 100 percent owned by ConocoPhillips. ConocoPhillips Australia Funding Company and ConocoPhillips Canada Funding Company I are indirect, 100 percent owned subsidiaries of ConocoPhillips Company. ConocoPhillips and ConocoPhillips Company have fully and unconditionally guaranteed the payment obligations of ConocoPhillips Australia Funding Company and ConocoPhillips Canada Funding Company I, with respect to their publicly held debt securities. Similarly, ConocoPhillips has fully and unconditionally guaranteed the payment obligations of ConocoPhillips Company with respect to its publicly held debt securities. In addition, ConocoPhillips Company has fully and unconditionally guaranteed the payment obligations of ConocoPhillips with respect to its publicly held debt securities. All guarantees are joint and several. The following condensed consolidating financial information presents the results of operations, financial position and cash flows for:
| • | ConocoPhillips, ConocoPhillips Company and ConocoPhillips Canada Funding Company I (in each case, reflecting investments in subsidiaries utilizing the equity method of accounting). |
| • | All other nonguarantor subsidiaries of ConocoPhillips. |
| • | The consolidating adjustments necessary to present ConocoPhillips' results on a consolidated basis. |
In May 2014 we filed a universal shelf registration statement with the SEC under which ConocoPhillips, as a well-known seasoned issuer, has the ability to issue and sell an indeterminate amount of various types of debt and equity securities, with certain debt securities guaranteed by ConocoPhillips Company. Also as part of that registration statement, ConocoPhillips Trust I and ConocoPhillips Trust II have the ability to issue and sell preferred trust securities, guaranteed by ConocoPhillips. ConocoPhillips Trust I and ConocoPhillips Trust II have not issued any trust-preferred securities under this registration statement, and thus have no assets or liabilities. Accordingly, columns for these two trusts are not included in the condensed consolidating financial information.
During 2013 ConocoPhillips Australia Funding Company's guaranteed, publicly held debt was repaid. Beginning in 2014, financial information for ConocoPhillips Australia Funding Company is presented in the "All Other Subsidiaries" column of our condensed consolidating financial information.
In 2014 ConocoPhillips received $34.5 billion in dividends from ConocoPhillips Company to settle certain accumulated intercompany balances. This consisted of a $17.5 billion distribution of earnings and a $17 billion return of capital. These transactions had no impact on our consolidated financial statements.
This condensed consolidating financial information should be read in conjunction with the accompanying consolidated financial statements and notes.
164
| Millions of Dollars | ||||||||||||||||||||||||||||
| Year Ended December 31, 2014 | ||||||||||||||||||||||||||||
| Income Statement | ConocoPhillips | ConocoPhillips Company | ConocoPhillips Canada Funding Company I | All Other Subsidiaries | Consolidating Adjustments | Total Consolidated | ||||||||||||||||||||||
Revenues and Other Income | ||||||||||||||||||||||||||||
Sales and other operating revenues | $ | - | 20,083 | - | 32,441 | - | 52,524 | |||||||||||||||||||||
Equity in earnings of affiliates | 6,108 | 8,090 | - | 2,932 | (14,601 | ) | 2,529 | |||||||||||||||||||||
Gain on dispositions | - | 9 | - | 89 | - | 98 | ||||||||||||||||||||||
Other income (loss) | (6 | ) | 67 | - | 305 | - | 366 | |||||||||||||||||||||
Intercompany revenues | 79 | 465 | 283 | 5,883 | (6,710 | ) | - | |||||||||||||||||||||
| ||||||||||||||||||||||||||||
Total Revenues and Other Income | 6,181 | 28,714 | 283 | 41,650 | (21,311 | ) | 55,517 | |||||||||||||||||||||
| ||||||||||||||||||||||||||||
Costs and Expenses | ||||||||||||||||||||||||||||
Purchased commodities | - | 17,591 | - | 10,415 | (5,907 | ) | 22,099 | |||||||||||||||||||||
Production and operating expenses | - | 2,600 | - | 6,368 | (59 | ) | 8,909 | |||||||||||||||||||||
Selling, general and administrative expenses | 9 | 575 | 1 | 166 | (16 | ) | 735 | |||||||||||||||||||||
Exploration expenses | - | 1,036 | - | 1,009 | - | 2,045 | ||||||||||||||||||||||
Depreciation, depletion and amortization | - | 1,059 | - | 7,270 | - | 8,329 | ||||||||||||||||||||||
Impairments | - | 127 | - | 729 | - | 856 | ||||||||||||||||||||||
Taxes other than income taxes | - | 285 | - | 1,803 | - | 2,088 | ||||||||||||||||||||||
Accretion on discounted liabilities | - | 58 | - | 426 | - | 484 | ||||||||||||||||||||||
Interest and debt expense | 571 | 299 | 231 | 275 | (728 | ) | 648 | |||||||||||||||||||||
Foreign currency transaction (gains) losses | 62 | 10 | (372 | ) | 234 | - | (66) | |||||||||||||||||||||
| ||||||||||||||||||||||||||||
Total Costs and Expenses | 642 | 23,640 | (140 | ) | 28,695 | (6,710 | ) | 46,127 | ||||||||||||||||||||
| ||||||||||||||||||||||||||||
Income from continuing operations before income taxes | 5,539 | 5,074 | 423 | 12,955 | (14,601 | ) | 9,390 | |||||||||||||||||||||
Provision (benefit) for income taxes | (199 | ) | (1,034 | ) | 19 | 4,797 | - | 3,583 | ||||||||||||||||||||
| ||||||||||||||||||||||||||||
Income From Continuing Operations | 5,738 | 6,108 | 404 | 8,158 | (14,601 | ) | 5,807 | |||||||||||||||||||||
Income from discontinued operations | 1,131 | 1,131 | - | 113 | (1,244 | ) | 1,131 | |||||||||||||||||||||
| ||||||||||||||||||||||||||||
Net income | 6,869 | 7,239 | 404 | 8,271 | (15,845 | ) | 6,938 | |||||||||||||||||||||
Less: net income attributable to noncontrolling interests | - | - | - | (69 | ) | - | (69) | |||||||||||||||||||||
| ||||||||||||||||||||||||||||
Net Income Attributable to ConocoPhillips | $ | 6,869 | 7,239 | 404 | 8,202 | (15,845 | ) | 6,869 | ||||||||||||||||||||
| ||||||||||||||||||||||||||||
Comprehensive Income Attributable to ConocoPhillips | $ | 2,965 | 3,335 | 58 | 4,589 | (7,982 | ) | 2,965 | ||||||||||||||||||||
| ||||||||||||||||||||||||||||
| Millions of Dollars | ||||||||||||||||||||||||||||
| Year Ended December 31, 2013 | ||||||||||||||||||||||||||||
| Income Statement | ConocoPhillips | ConocoPhillips Company | ConocoPhillips Australia Funding Company | ConocoPhillips Canada Funding Company I | All Other Subsidiaries | Consolidating Adjustments | Total Consolidated | |||||||||||||||||||||
Revenues and Other Income | ||||||||||||||||||||||||||||
Sales and other operating revenues | $ | - | 18,186 | - | - | 36,227 | - | 54,413 | ||||||||||||||||||||
Equity in earnings of affiliates | 8,374 | 9,200 | - | - | 2,611 | (17,966 | ) | 2,219 | ||||||||||||||||||||
Gain on dispositions | - | 364 | - | - | 878 | - | 1,242 | |||||||||||||||||||||
Other income | 2 | 271 | - | - | 101 | - | 374 | |||||||||||||||||||||
Intercompany revenues | 82 | 458 | 13 | 305 | 4,948 | (5,806 | ) | - | ||||||||||||||||||||
| ||||||||||||||||||||||||||||
Total Revenues and Other Income | 8,458 | 28,479 | 13 | 305 | 44,765 | (23,772 | ) | 58,248 | ||||||||||||||||||||
| ||||||||||||||||||||||||||||
Costs and Expenses | ||||||||||||||||||||||||||||
Purchased commodities | - | 15,779 | - | - | 11,812 | (4,948 | ) | 22,643 | ||||||||||||||||||||
Production and operating expenses | - | 1,492 | - | - | 5,756 | (10 | ) | 7,238 | ||||||||||||||||||||
Selling, general and administrative expenses | 11 | 623 | - | 1 | 238 | (19 | ) | 854 | ||||||||||||||||||||
Exploration expenses | - | 659 | - | - | 573 | - | 1,232 | |||||||||||||||||||||
Depreciation, depletion and amortization | - | 907 | - | - | 6,527 | - | 7,434 | |||||||||||||||||||||
Impairments | - | 4 | - | - | 525 | - | 529 | |||||||||||||||||||||
Taxes other than income taxes | - | 236 | - | - | 2,648 | - | 2,884 | |||||||||||||||||||||
Accretion on discounted liabilities | - | 56 | - | - | 378 | - | 434 | |||||||||||||||||||||
Interest and debt expense | 630 | 327 | 12 | 235 | 237 | (829 | ) | 612 | ||||||||||||||||||||
Foreign currency transaction (gains) losses | 52 | 3 | - | (349 | ) | 236 | - | (58) | ||||||||||||||||||||
| ||||||||||||||||||||||||||||
Total Costs and Expenses | 693 | 20,086 | 12 | (113 | ) | 28,930 | (5,806 | ) | 43,802 | |||||||||||||||||||
| ||||||||||||||||||||||||||||
Income from continuing operations before income taxes | 7,765 | 8,393 | 1 | 418 | 15,835 | (17,966 | ) | 14,446 | ||||||||||||||||||||
Provision (benefit) for income taxes | (213 | ) | 19 | - | 31 | 6,572 | - | 6,409 | ||||||||||||||||||||
| ||||||||||||||||||||||||||||
Income From Continuing Operations | 7,978 | 8,374 | 1 | 387 | 9,263 | (17,966 | ) | 8,037 | ||||||||||||||||||||
Income from discontinued operations | 1,178 | 1,178 | - | - | 1,178 | (2,356 | ) | 1,178 | ||||||||||||||||||||
| ||||||||||||||||||||||||||||
Net income | 9,156 | 9,552 | 1 | 387 | 10,441 | (20,322 | ) | 9,215 | ||||||||||||||||||||
Less: net income attributable to noncontrolling interests | - | - | - | - | (59 | ) | - | (59) | ||||||||||||||||||||
| ||||||||||||||||||||||||||||
Net Income Attributable to ConocoPhillips | $ | 9,156 | 9,552 | 1 | 387 | 10,382 | (20,322 | ) | 9,156 | |||||||||||||||||||
| ||||||||||||||||||||||||||||
Comprehensive Income Attributable to ConocoPhillips | $ | 7,071 | 7,467 | 1 | 99 | 7,782 | (15,349 | ) | 7,071 | |||||||||||||||||||
| ||||||||||||||||||||||||||||
165
| Millions of Dollars | ||||||||||||||||||||||||||||
| Year Ended December 31, 2012 | ||||||||||||||||||||||||||||
| Income Statement | ConocoPhillips | ConocoPhillips Company | ConocoPhillips Australia Funding Company | ConocoPhillips Canada Funding Company I | All Other Subsidiaries | Consolidating Adjustments | Total Consolidated | |||||||||||||||||||||
Revenues and Other Income | ||||||||||||||||||||||||||||
Sales and other operating revenues | $ | - | 17,768 | - | - | 40,199 | - | 57,967 | ||||||||||||||||||||
Equity in earnings of affiliates | 7,871 | 8,545 | - | - | 1,832 | (16,337 | ) | 1,911 | ||||||||||||||||||||
Gain on dispositions | - | 2 | - | - | 1,655 | - | 1,657 | |||||||||||||||||||||
Other income (loss) | (76 | ) | 177 | - | - | 368 | - | 469 | ||||||||||||||||||||
Intercompany revenues | 61 | 1,077 | 46 | 313 | 2,997 | (4,494 | ) | - | ||||||||||||||||||||
| ||||||||||||||||||||||||||||
Total Revenues and Other Income | 7,856 | 27,569 | 46 | 313 | 47,051 | (20,831 | ) | 62,004 | ||||||||||||||||||||
| ||||||||||||||||||||||||||||
Costs and Expenses | ||||||||||||||||||||||||||||
Purchased commodities | - | 15,680 | - | - | 13,000 | (3,448 | ) | 25,232 | ||||||||||||||||||||
Production and operating expenses | - | 1,304 | - | - | 5,512 | (23 | ) | 6,793 | ||||||||||||||||||||
Selling, general and administrative expenses | 12 | 845 | - | 1 | 258 | (10 | ) | 1,106 | ||||||||||||||||||||
Exploration expenses | - | 402 | - | - | 1,098 | - | 1,500 | |||||||||||||||||||||
Depreciation, depletion and amortization | - | 807 | - | - | 5,773 | - | 6,580 | |||||||||||||||||||||
Impairments | - | 8 | - | - | 672 | - | 680 | |||||||||||||||||||||
Taxes other than income taxes | - | 264 | - | - | 3,282 | - | 3,546 | |||||||||||||||||||||
Accretion on discounted liabilities | - | 53 | - | - | 341 | - | 394 | |||||||||||||||||||||
Interest and debt expense | 700 | 316 | 42 | 237 | 427 | (1,013 | ) | 709 | ||||||||||||||||||||
Foreign currency transaction (gains) losses | (19 | ) | 19 | - | 152 | (111 | ) | - | 41 | |||||||||||||||||||
| ||||||||||||||||||||||||||||
Total Costs and Expenses | 693 | 19,698 | 42 | 390 | 30,252 | (4,494 | ) | 46,581 | ||||||||||||||||||||
| ||||||||||||||||||||||||||||
Income (loss) from continuing operations before income taxes | 7,163 | 7,871 | 4 | (77 | ) | 16,799 | (16,337 | ) | 15,423 | |||||||||||||||||||
Provision (benefit) for income taxes | (248 | ) | (1 | ) | 1 | 9 | 8,181 | - | 7,942 | |||||||||||||||||||
| ||||||||||||||||||||||||||||
Income (Loss) From Continuing Operations | 7,411 | 7,872 | 3 | (86 | ) | 8,618 | (16,337 | ) | 7,481 | |||||||||||||||||||
Income from discontinued operations | 1,017 | 1,017 | - | - | 777 | (1,794 | ) | 1,017 | ||||||||||||||||||||
| ||||||||||||||||||||||||||||
Net income (loss) | 8,428 | 8,889 | 3 | (86 | ) | 9,395 | (18,131 | ) | 8,498 | |||||||||||||||||||
Less: net income attributable to noncontrolling interests | - | - | - | - | (70 | ) | - | (70) | ||||||||||||||||||||
| ||||||||||||||||||||||||||||
Net Income (Loss) Attributable to ConocoPhillips | $ | 8,428 | 8,889 | 3 | (86 | ) | 9,325 | (18,131 | ) | 8,428 | ||||||||||||||||||
| ||||||||||||||||||||||||||||
Comprehensive Income Attributable to ConocoPhillips | $ | 9,055 | 9,516 | 3 | 24 | 9,560 | (19,103 | ) | 9,055 | |||||||||||||||||||
| ||||||||||||||||||||||||||||
166
| Millions of Dollars | ||||||||||||||||||||||||||||
| At December 31, 2014 | ||||||||||||||||||||||||||||
| Balance Sheet | ConocoPhillips | ConocoPhillips Company | ConocoPhillips Canada Funding Company I | All Other Subsidiaries | Consolidating Adjustments | Total Consolidated | ||||||||||||||||||||||
Assets | ||||||||||||||||||||||||||||
Cash and cash equivalents | $ | - | 770 | 7 | 4,285 | - | 5,062 | |||||||||||||||||||||
Accounts and notes receivable | 20 | 2,813 | 22 | 6,671 | (2,719 | ) | 6,807 | |||||||||||||||||||||
Inventories | - | 281 | - | 1,050 | - | 1,331 | ||||||||||||||||||||||
Prepaid expenses and other current assets | 6 | 754 | 15 | 1,138 | (45 | ) | 1,868 | |||||||||||||||||||||
| ||||||||||||||||||||||||||||
Total Current Assets | 26 | 4,618 | 44 | 13,144 | (2,764 | ) | 15,068 | |||||||||||||||||||||
Investments, loans and long-term receivables* | 55,568 | 70,732 | 3,965 | 32,467 | (137,593 | ) | 25,139 | |||||||||||||||||||||
Net properties, plants and equipment | - | 9,730 | - | 65,714 | - | 75,444 | ||||||||||||||||||||||
Other assets | 40 | 67 | 208 | 1,338 | (765 | ) | 888 | |||||||||||||||||||||
| ||||||||||||||||||||||||||||
Total Assets | $ | 55,634 | 85,147 | 4,217 | 112,663 | (141,122 | ) | 116,539 | ||||||||||||||||||||
| ||||||||||||||||||||||||||||
Liabilities and Stockholders' Equity | ||||||||||||||||||||||||||||
Accounts payable | $ | 1 | 4,149 | 14 | 6,581 | (2,719 | ) | 8,026 | ||||||||||||||||||||
Short-term debt | (5 | ) | 6 | 5 | 176 | - | 182 | |||||||||||||||||||||
Accrued income and other taxes | - | 117 | - | 934 | - | 1,051 | ||||||||||||||||||||||
Employee benefit obligations | - | 595 | - | 283 | - | 878 | ||||||||||||||||||||||
Other accruals | 170 | 337 | 71 | 868 | (46 | ) | 1,400 | |||||||||||||||||||||
| ||||||||||||||||||||||||||||
Total Current Liabilities | 166 | 5,204 | 90 | 8,842 | (2,765 | ) | 11,537 | |||||||||||||||||||||
Long-term debt | 7,541 | 8,197 | 2,974 | 3,671 | - | 22,383 | ||||||||||||||||||||||
Asset retirement obligations and accrued environmental costs | - | 1,328 | - | 9,319 | - | 10,647 | ||||||||||||||||||||||
Deferred income taxes | - | 265 | - | 14,811 | (6 | ) | 15,070 | |||||||||||||||||||||
Employee benefit obligations | - | 2,162 | - | 802 | - | 2,964 | ||||||||||||||||||||||
Other liabilities and deferred credits* | 2,577 | 7,391 | 1,142 | 17,218 | (26,663 | ) | 1,665 | |||||||||||||||||||||
| ||||||||||||||||||||||||||||
Total Liabilities | 10,284 | 24,547 | 4,206 | 54,663 | (29,434 | ) | 64,266 | |||||||||||||||||||||
Retained earnings | 37,983 | 21,448 | (1,096 | ) | 17,355 | (31,186 | ) | 44,504 | ||||||||||||||||||||
Other common stockholders' equity | 7,367 | 39,152 | 1,107 | 40,283 | (80,502 | ) | 7,407 | |||||||||||||||||||||
Noncontrolling interests | - | - | - | 362 | - | 362 | ||||||||||||||||||||||
| ||||||||||||||||||||||||||||
Total Liabilities and Stockholders' Equity | $ | 55,634 | 85,147 | 4,217 | 112,663 | (141,122 | ) | 116,539 | ||||||||||||||||||||
| ||||||||||||||||||||||||||||
| Millions of Dollars | ||||||||||||||||||||||||||||
| At December 31, 2013 | ||||||||||||||||||||||||||||
| Balance Sheet | ConocoPhillips | ConocoPhillips Company | ConocoPhillips Australia Funding Company | ConocoPhillips Canada Funding Company I | All Other Subsidiaries | Consolidating Adjustments | Total Consolidated | |||||||||||||||||||||
Assets | ||||||||||||||||||||||||||||
Cash and cash equivalents | $ | - | 2,434 | - | 229 | 3,583 | - | 6,246 | ||||||||||||||||||||
Short-term investments | - | - | - | - | 272 | - | 272 | |||||||||||||||||||||
Accounts and notes receivable | 73 | 2,122 | 2 | - | 9,267 | (2,977 | ) | 8,487 | ||||||||||||||||||||
Inventories | - | 174 | - | - | 1,020 | - | 1,194 | |||||||||||||||||||||
Prepaid expenses and other current assets | 20 | 535 | - | 35 | 2,311 | (77 | ) | 2,824 | ||||||||||||||||||||
| ||||||||||||||||||||||||||||
Total Current Assets | 93 | 5,265 | 2 | 264 | 16,453 | (3,054 | ) | 19,023 | ||||||||||||||||||||
Investments, loans and long-term receivables* | 86,836 | 100,052 | - | 4,259 | 34,795 | (200,678 | ) | 25,264 | ||||||||||||||||||||
Net properties, plants and equipment | - | 9,313 | - | - | 63,514 | - | 72,827 | |||||||||||||||||||||
Other assets | 38 | 260 | - | 103 | 1,394 | (852 | ) | 943 | ||||||||||||||||||||
| ||||||||||||||||||||||||||||
Total Assets | $ | 86,967 | 114,890 | 2 | 4,626 | 116,156 | (204,584 | ) | 118,057 | |||||||||||||||||||
| ||||||||||||||||||||||||||||
Liabilities and Stockholders' Equity | ||||||||||||||||||||||||||||
Accounts payable | $ | - | 3,388 | - | 4 | 8,899 | (2,977 | ) | 9,314 | |||||||||||||||||||
Short-term debt | 395 | 4 | - | 5 | 185 | - | 589 | |||||||||||||||||||||
Accrued income and other taxes | - | 223 | - | - | 2,517 | (27 | ) | 2,713 | ||||||||||||||||||||
Employee benefit obligations | - | 566 | - | - | 276 | - | 842 | |||||||||||||||||||||
Other accruals | 210 | 639 | - | 81 | 790 | (49 | ) | 1,671 | ||||||||||||||||||||
| ||||||||||||||||||||||||||||
Total Current Liabilities | 605 | 4,820 | - | 90 | 12,667 | (3,053 | ) | 15,129 | ||||||||||||||||||||
Long-term debt | 9,047 | 5,208 | - | 2,980 | 3,838 | - | 21,073 | |||||||||||||||||||||
Asset retirement obligations and accrued environmental costs | - | 1,289 | - | - | 8,594 | - | 9,883 | |||||||||||||||||||||
Deferred income taxes | 94 | 557 | - | - | 14,569 | - | 15,220 | |||||||||||||||||||||
Employee benefit obligations | - | 1,791 | - | - | 668 | - | 2,459 | |||||||||||||||||||||
Other liabilities and deferred credits* | 31,693 | 9,422 | - | 1,603 | 22,204 | (63,121 | ) | 1,801 | ||||||||||||||||||||
| ||||||||||||||||||||||||||||
Total Liabilities | 41,439 | 23,087 | - | 4,673 | 62,540 | (66,174 | ) | 65,565 | ||||||||||||||||||||
Retained earnings | 34,636 | 31,835 | - | (1,500 | ) | 12,848 | (36,659 | ) | 41,160 | |||||||||||||||||||
Other common stockholders' equity | 10,892 | 59,968 | 2 | 1,453 | 40,366 | (101,751 | ) | 10,930 | ||||||||||||||||||||
Noncontrolling interests | - | - | - | - | 402 | - | 402 | |||||||||||||||||||||
| ||||||||||||||||||||||||||||
Total Liabilities and Stockholders' Equity | $ | 86,967 | 114,890 | 2 | 4,626 | 116,156 | (204,584 | ) | 118,057 | |||||||||||||||||||
| ||||||||||||||||||||||||||||
| *Includes | intercompany loans. |
167
| Millions of Dollars | ||||||||||||||||||||||||||||
| Statement of Cash Flows | Year Ended December 31, 2014 | |||||||||||||||||||||||||||
| ConocoPhillips | ConocoPhillips Company | ConocoPhillips Canada Funding Company I | All Other Subsidiaries | Consolidating Adjustments | Total Consolidated | |||||||||||||||||||||||
Cash Flows From Operating Activities | ||||||||||||||||||||||||||||
Net cash provided by continuing operating activities | $ | 17,259 | 2,965 | 27 | 17,104 | (20,763 | ) | 16,592 | ||||||||||||||||||||
Net cash provided by discontinued operations | - | 202 | - | 394 | (453 | ) | 143 | |||||||||||||||||||||
| ||||||||||||||||||||||||||||
Net Cash Provided by Operating Activities | 17,259 | 3,167 | 27 | 17,498 | (21,216 | ) | 16,735 | |||||||||||||||||||||
| ||||||||||||||||||||||||||||
Cash Flows From Investing Activities | ||||||||||||||||||||||||||||
Capital expenditures and investments | - | (6,507 | ) | - | (14,840 | ) | 4,262 | (17,085) | ||||||||||||||||||||
Proceeds from asset dispositions | 16,912 | 1,588 | - | 253 | (17,150 | ) | 1,603 | |||||||||||||||||||||
Net sales of short-term investments | - | - | - | 253 | - | 253 | ||||||||||||||||||||||
Long-term advances/loans-related parties | - | (736 | ) | (241 | ) | (7 | ) | 984 | - | |||||||||||||||||||
Collection of advances/loans-related parties | - | 593 | - | 112 | (102 | ) | 603 | |||||||||||||||||||||
Intercompany cash management | (29,113 | ) | 31,993 | - | (2,880 | ) | - | - | ||||||||||||||||||||
Other | - | (415 | ) | - | (31 | ) | - | (446) | ||||||||||||||||||||
| ||||||||||||||||||||||||||||
Net cash provided by (used in) continuing investing activities | (12,201 | ) | 26,516 | (241 | ) | (17,140 | ) | (12,006 | ) | (15,072) | ||||||||||||||||||
Net cash provided by (used in) discontinued operations | - | 133 | - | (59 | ) | (133 | ) | (59) | ||||||||||||||||||||
| ||||||||||||||||||||||||||||
Net Cash Provided by (Used in) Investing Activities | (12,201 | ) | 26,649 | (241 | ) | (17,199 | ) | (12,139 | ) | (15,131) | ||||||||||||||||||
| ||||||||||||||||||||||||||||
Cash Flows From Financing Activities | ||||||||||||||||||||||||||||
Issuance of debt | - | 2,994 | - | 984 | (984 | ) | 2,994 | |||||||||||||||||||||
Repayment of debt | (1,909 | ) | (16 | ) | - | (191 | ) | 102 | (2,014) | |||||||||||||||||||
Issuance of company common stock | 377 | - | - | - | (342 | ) | 35 | |||||||||||||||||||||
Dividends paid | (3,525 | ) | (17,588 | ) | - | (3,768 | ) | 21,356 | (3,525) | |||||||||||||||||||
Other | (1 | ) | (16,870 | ) | - | 3,919 | 12,888 | (64) | ||||||||||||||||||||
| ||||||||||||||||||||||||||||
Net cash provided by (used in) continuing financing activities | (5,058 | ) | (31,480 | ) | - | 944 | 33,020 | (2,574) | ||||||||||||||||||||
Net cash used in discontinued operations | - | - | - | (335 | ) | 335 | - | |||||||||||||||||||||
| ||||||||||||||||||||||||||||
Net Cash Provided by (Used in) Financing Activities | (5,058 | ) | (31,480 | ) | - | 609 | 33,355 | (2,574) | ||||||||||||||||||||
| ||||||||||||||||||||||||||||
Effect of Exchange Rate Changes on Cash and Cash Equivalents | - | - | (8 | ) | (206 | ) | - | (214) | ||||||||||||||||||||
| ||||||||||||||||||||||||||||
Net Change in Cash and Cash Equivalents | - | (1,664 | ) | (222 | ) | 702 | - | (1,184) | ||||||||||||||||||||
Cash and cash equivalents at beginning of period | - | 2,434 | 229 | 3,583 | - | 6,246 | ||||||||||||||||||||||
| ||||||||||||||||||||||||||||
Cash and Cash Equivalents at End of Period | $ | - | 770 | 7 | 4,285 | - | 5,062 | |||||||||||||||||||||
| ||||||||||||||||||||||||||||
| Millions of Dollars | ||||||||||||||||||||||||||||
| Statement of Cash Flows | Year Ended December 31, 2013 | |||||||||||||||||||||||||||
| ConocoPhillips | ConocoPhillips Company | ConocoPhillips Australia Funding Company | ConocoPhillips Canada Funding Company I | All Other Subsidiaries | Consolidating Adjustments | Total Consolidated | ||||||||||||||||||||||
Cash Flows From Operating Activities | ||||||||||||||||||||||||||||
Net cash provided by (used in) continuing operating activities | $ | (295 | ) | 22,996 | (2 | ) | 1 | 14,387 | (21,286 | ) | 15,801 | |||||||||||||||||
Net cash provided by discontinued operations | - | 91 | - | - | 643 | (448 | ) | 286 | ||||||||||||||||||||
| ||||||||||||||||||||||||||||
Net Cash Provided by (Used in) Operating Activities | (295 | ) | 23,087 | (2 | ) | 1 | 15,030 | (21,734 | ) | 16,087 | ||||||||||||||||||
| ||||||||||||||||||||||||||||
Cash Flows From Investing Activities | ||||||||||||||||||||||||||||
Capital expenditures and investments | - | (4,821 | ) | - | - | (13,566 | ) | 2,850 | (15,537) | |||||||||||||||||||
Proceeds from asset dispositions | - | 2,633 | - | - | 9,745 | (2,158 | ) | 10,220 | ||||||||||||||||||||
Net purchases of short-term investments | - | - | - | - | (263 | ) | - | (263) | ||||||||||||||||||||
Long-term advances/loans-related parties | - | (342 | ) | - | - | (545 | ) | 887 | - | |||||||||||||||||||
Collection of advances/loans-related parties | - | 174 | 750 | 169 | 3,010 | (3,958 | ) | 145 | ||||||||||||||||||||
Intercompany cash management | 2,511 | (15,919 | ) | - | - | 13,408 | - | - | ||||||||||||||||||||
Other | - | 21 | - | - | (233 | ) | - | (212) | ||||||||||||||||||||
| ||||||||||||||||||||||||||||
Net cash provided by (used in) continuing investing activities | 2,511 | (18,254 | ) | 750 | 169 | 11,556 | (2,379 | ) | (5,647) | |||||||||||||||||||
Net cash used in discontinued operations | - | (52 | ) | - | - | (604 | ) | 52 | (604) | |||||||||||||||||||
| ||||||||||||||||||||||||||||
Net Cash Provided by (Used in) Investing Activities | 2,511 | (18,306 | ) | 750 | 169 | 10,952 | (2,327 | ) | (6,251) | |||||||||||||||||||
| ||||||||||||||||||||||||||||
Cash Flows From Financing Activities | ||||||||||||||||||||||||||||
Issuance of debt | - | 522 | - | - | 365 | (887 | ) | - | ||||||||||||||||||||
Repayment of debt | - | (2,924 | ) | (750 | ) | - | (1,230 | ) | 3,958 | (946) | ||||||||||||||||||
Change in restricted cash | 748 | - | - | - | - | - | 748 | |||||||||||||||||||||
Issuance of company common stock | 365 | - | - | - | - | (345 | ) | 20 | ||||||||||||||||||||
Dividends paid | (3,334 | ) | - | (4 | ) | - | (21,984 | ) | 21,988 | (3,334) | ||||||||||||||||||
Other | 3 | 52 | - | - | (2,984 | ) | (692 | ) | (3,621) | |||||||||||||||||||
| ||||||||||||||||||||||||||||
Net cash used in continuing financing activities | (2,218 | ) | (2,350 | ) | (754 | ) | - | (25,833 | ) | 24,022 | (7,133) | |||||||||||||||||
Net cash used in discontinued operations | - | - | - | - | (39 | ) | 39 | - | ||||||||||||||||||||
| ||||||||||||||||||||||||||||
Net Cash Used in Financing Activities | (2,218 | ) | (2,350 | ) | (754 | ) | - | (25,872 | ) | 24,061 | (7,133) | |||||||||||||||||
| ||||||||||||||||||||||||||||
Effect of Exchange Rate Changes on Cash and Cash Equivalents | - | (9 | ) | - | - | (66 | ) | - | (75) | |||||||||||||||||||
| ||||||||||||||||||||||||||||
Net Change in Cash and Cash Equivalents | (2 | ) | 2,422 | (6 | ) | 170 | 44 | - | 2,628 | |||||||||||||||||||
Cash and cash equivalents at beginning of period | 2 | 12 | 6 | 59 | 3,539 | - | 3,618 | |||||||||||||||||||||
| ||||||||||||||||||||||||||||
Cash and Cash Equivalents at End of Period | $ | - | 2,434 | - | 229 | 3,583 | - | 6,246 | ||||||||||||||||||||
| ||||||||||||||||||||||||||||
168
| Millions of Dollars | ||||||||||||||||||||||||||||
| Statement of Cash Flows | Year Ended December 31, 2012 | |||||||||||||||||||||||||||
| ConocoPhillips | ConocoPhillips Company | ConocoPhillips Australia Funding Company | ConocoPhillips Canada Funding Company I | All Other Subsidiaries | Consolidating Adjustments | Total Consolidated | ||||||||||||||||||||||
Cash Flows From Operating Activities | ||||||||||||||||||||||||||||
Net cash provided by (used in) continuing operating activities | $ | (456 | ) | 6,470 | 5 | (2 | ) | 15,748 | (8,307 | ) | 13,458 | |||||||||||||||||
Net cash provided by (used in) discontinued operations | - | 6,201 | - | - | (1,355 | ) | (4,382 | ) | 464 | |||||||||||||||||||
| ||||||||||||||||||||||||||||
Net Cash Provided by (Used in) Operating Activities | (456 | ) | 12,671 | 5 | (2 | ) | 14,393 | (12,689 | ) | 13,922 | ||||||||||||||||||
| ||||||||||||||||||||||||||||
Cash Flows From Investing Activities | ||||||||||||||||||||||||||||
Capital expenditures and investments | - | (1,323 | ) | - | - | (12,433 | ) | (416 | ) | (14,172) | ||||||||||||||||||
Proceeds from asset dispositions | - | 16,505 | - | - | 2,126 | (16,499 | ) | 2,132 | ||||||||||||||||||||
Net sales of short-term investments | - | - | - | - | 597 | - | 597 | |||||||||||||||||||||
Long-term advances/loans-related parties | - | (378 | ) | - | - | (8,272 | ) | 8,650 | - | |||||||||||||||||||
Collection of advances/loans-related parties | - | 1,193 | - | 6 | 5,884 | (6,969 | ) | 114 | ||||||||||||||||||||
Intercompany cash management | 3,840 | (16,040 | ) | - | - | 12,200 | - | - | ||||||||||||||||||||
Other | - | 442 | - | - | 379 | - | 821 | |||||||||||||||||||||
| ||||||||||||||||||||||||||||
Net cash provided by continuing investing activities | 3,840 | 399 | - | 6 | 481 | (15,234 | ) | (10,508) | ||||||||||||||||||||
Net cash provided by (used in) discontinued operations | (303 | ) | (11,292 | ) | - | - | 14,241 | (3,765 | ) | (1,119) | ||||||||||||||||||
| ||||||||||||||||||||||||||||
Net Cash Provided by (Used in) Investing Activities | 3,537 | (10,893 | ) | - | 6 | 14,722 | (18,999 | ) | (11,627) | |||||||||||||||||||
| ||||||||||||||||||||||||||||
Cash Flows From Financing Activities | ||||||||||||||||||||||||||||
Issuance of debt | - | 10,285 | - | - | 361 | (8,650 | ) | 1,996 | ||||||||||||||||||||
Repayment of debt | (2,474 | ) | (5,833 | ) | - | - | (1,227 | ) | 6,969 | (2,565) | ||||||||||||||||||
Special cash distribution from Phillips 66 | 7,818 | - | - | - | - | - | 7,818 | |||||||||||||||||||||
Change in restricted cash | (748 | ) | - | - | - | - | - | (748) | ||||||||||||||||||||
Issuance of company common stock | 701 | - | - | - | - | (563 | ) | 138 | ||||||||||||||||||||
Repurchase of company common stock | (5,098 | ) | - | - | - | - | - | (5,098) | ||||||||||||||||||||
Dividends paid | (3,278 | ) | - | - | - | (7,645 | ) | 7,645 | (3,278) | |||||||||||||||||||
Other | - | 118 | - | - | (17,339 | ) | 16,496 | (725) | ||||||||||||||||||||
| ||||||||||||||||||||||||||||
Net cash provided by (used in) continuing financing activities | (3,079 | ) | 4,570 | - | - | (25,850 | ) | 21,897 | (2,462) | |||||||||||||||||||
Net cash used in discontinued operations | - | (8,327 | ) | - | - | (3,483 | ) | 9,791 | (2,019) | |||||||||||||||||||
| ||||||||||||||||||||||||||||
Net Cash Used in Financing Activities | (3,079 | ) | (3,757 | ) | - | - | (29,333 | ) | 31,688 | (4,481) | ||||||||||||||||||
| ||||||||||||||||||||||||||||
Effect of Exchange Rate Changes on Cash and Cash Equivalents | - | (37 | ) | - | - | 61 | - | 24 | ||||||||||||||||||||
| ||||||||||||||||||||||||||||
Net Change in Cash and Cash Equivalents | 2 | (2,016 | ) | 5 | 4 | (157 | ) | - | (2,162) | |||||||||||||||||||
Cash and cash equivalents at beginning of period | - | 2,028 | 1 | 55 | 3,696 | - | 5,780 | |||||||||||||||||||||
| ||||||||||||||||||||||||||||
Cash and Cash Equivalents at End of Period | $ | 2 | 12 | 6 | 59 | 3,539 | - | 3,618 | ||||||||||||||||||||
| ||||||||||||||||||||||||||||
169
| Item 9. | CHANGES IN AND DISAGREEMENTS WITH ACCOUNTANTS ON ACCOUNTING AND FINANCIAL DISCLOSURE |
None.
| Item 9A. | CONTROLS AND PROCEDURES |
We maintain disclosure controls and procedures designed to ensure information required to be disclosed in reports we file or submit under the Securities Exchange Act of 1934, as amended (the Act), is recorded, processed, summarized and reported within the time periods specified in Securities and Exchange Commission rules and forms, and that such information is accumulated and communicated to management, including our principal executive and principal financial officers, as appropriate, to allow timely decisions regarding required disclosure. As of December 31, 2014, with the participation of our management, our Chairman and Chief Executive Officer (principal executive officer) and our Executive Vice President, Finance and Chief Financial Officer (principal financial officer) carried out an evaluation, pursuant to Rule 13a-15(b) of the Act, of ConocoPhillips' disclosure controls and procedures (as defined in Rule 13a-15(e) of the Act). Based upon that evaluation, our Chairman and Chief Executive Officer and our Executive Vice President, Finance and Chief Financial Officer concluded our disclosure controls and procedures were operating effectively as of December 31, 2014.
There have been no changes in our internal control over financial reporting, as defined in Rule 13a-15(f) of the Act, in the period covered by this report that have materially affected, or are reasonably likely to materially affect, our internal control over financial reporting.
Management's Annual Report on Internal Control Over Financial Reporting
This report is included in Item 8 on page 75 and is incorporated herein by reference.
Report of Independent Registered Public Accounting Firm
This report is included in Item 8 on page 76 and is incorporated herein by reference.
| Item 9B. | OTHER INFORMATION |
None.
170
PART III
| Item 10. | DIRECTORS, EXECUTIVE OFFICERS AND CORPORATE GOVERNANCE |
Information regarding our executive officers appears in Part I of this report on pages 28 and 29.
Code of Business Ethics and Conduct for Directors and Employees
We have a Code of Business Ethics and Conduct for Directors and Employees (Code of Ethics), including our principal executive officer, principal financial officer, principal accounting officer and persons performing similar functions. We have posted a copy of our Code of Ethics on the "Corporate Governance" section of our internet website at www.conocophillips.com (within the Investors>Corporate Governance section) . Any waivers of the Code of Ethics must be approved, in advance, by our full Board of Directors. Any amendments to, or waivers from, the Code of Ethics that apply to our executive officers and directors will be posted on the "Corporate Governance" section of our internet website.
All other information required by Item 10 of Part III will be included in our Proxy Statement relating to our 2015 Annual Meeting of Stockholders, to be filed pursuant to Regulation 14A on or before April 30, 2015, and is incorporated herein by reference.*
| Item 11. | EXECUTIVE COMPENSATION |
Information required by Item 11 of Part III will be included in our Proxy Statement relating to our 2015 Annual Meeting of Stockholders, to be filed pursuant to Regulation 14A on or before April 30, 2015, and is incorporated herein by reference.*
| Item 12. | SECURITY OWNERSHIP OF CERTAIN BENEFICIAL OWNERS AND MANAGEMENT AND RELATED STOCKHOLDER MATTERS |
Information required by Item 12 of Part III will be included in our Proxy Statement relating to our 2015 Annual Meeting of Stockholders, to be filed pursuant to Regulation 14A on or before April 30, 2015, and is incorporated herein by reference.*
| Item 13. | CERTAIN RELATIONSHIPS AND RELATED TRANSACTIONS, AND DIRECTOR INDEPENDENCE |
Information required by Item 13 of Part III will be included in our Proxy Statement relating to our 2015 Annual Meeting of Stockholders, to be filed pursuant to Regulation 14A on or before April 30, 2015, and is incorporated herein by reference.*
| Item 14. | PRINCIPAL ACCOUNTING FEES AND SERVICES |
Information required by Item 14 of Part III will be included in our Proxy Statement relating to our 2015 Annual Meeting of Stockholders, to be filed pursuant to Regulation 14A on or before April 30, 2015, and is incorporated herein by reference.*
| *Except | for information or data specifically incorporated herein by reference under Items 10 through 14, other information and data appearing in our 2015 Proxy |
| Statement | are not deemed to be a part of this Annual Report on Form 10-K or deemed to be filed with the Commission as a part of this report. |
171
PART IV
| Item 15. | EXHIBITS, FINANCIAL STATEMENT SCHEDULES |
| (a) | 1. Financial Statements and Supplementary Data |
The financial statements and supplementary information listed in the Index to Financial Statements, which appears on page 74, are filed as part of this annual report.
| 2. | Financial Statement Schedules |
Schedule II-Valuation and Qualifying Accounts, appears below. All other schedules are omitted because they are not required, not significant, not applicable or the information is shown in another schedule, the financial statements or the notes to consolidated financial statements.
| 3. | Exhibits |
The exhibits listed in the Index to Exhibits, which appears on pages 173 through 179, are filed as part of this annual report.
SCHEDULE II-VALUATION AND QUALIFYING ACCOUNTS (Consolidated)
ConocoPhillips
| Millions of Dollars | ||||||||||||||||||||
| Description | Balance at January 1 | Charged to Expense | Other(a) | Deductions | Balance at December 31 | |||||||||||||||
| ||||||||||||||||||||
2014 | ||||||||||||||||||||
Deducted from asset accounts: | ||||||||||||||||||||
Allowance for doubtful accounts and notes receivable | $ | 8 | - | (2 | ) | (1 | )(b) | 5 | ||||||||||||
Deferred tax asset valuation allowance | 969 | 127 | (26 | ) | (100 | ) | 970 | |||||||||||||
Included in other liabilities: | ||||||||||||||||||||
Restructuring accruals | 19 | 71 | (6 | ) | (23 | )(c) | 61 | |||||||||||||
| ||||||||||||||||||||
2013 | ||||||||||||||||||||
Deducted from asset accounts: | ||||||||||||||||||||
Allowance for doubtful accounts and notes receivable | $ | 10 | - | - | (2 | )(b) | 8 | |||||||||||||
Deferred tax asset valuation allowance | 1,345 | (357 | ) | 3 | (22 | ) | 969 | |||||||||||||
Included in other liabilities: | ||||||||||||||||||||
Restructuring accruals | 17 | 10 | (1 | ) | (7 | )(c) | 19 | |||||||||||||
| ||||||||||||||||||||
2012 | ||||||||||||||||||||
Deducted from asset accounts: | ||||||||||||||||||||
Allowance for doubtful accounts and notes receivable | $ | 30 | (4 | ) | (13 | ) | (3 | )(b) | 10 | |||||||||||
Deferred tax asset valuation allowance | 1,487 | 369 | (447 | ) | (64 | ) | 1,345 | |||||||||||||
Included in other liabilities: | ||||||||||||||||||||
Restructuring accruals | 48 | 9 | (5 | ) | (35 | )(c) | 17 | |||||||||||||
| ||||||||||||||||||||
(a)Represents acquisitions/dispositions/revisions and the effect of translating foreign financial statements.
(b)Amounts charged off less recoveries of amounts previously charged off.
(c)Benefit payments.
172
CONOCOPHILLIPS
INDEX TO EXHIBITS
Exhibit Number | Description | |
| 2.1 | Separation and Distribution Agreement Between ConocoPhillips and Phillips 66, dated April 26, 2012 (incorporated by reference to Exhibit 2.1 to the Current Report of ConocoPhillips on Form 8-K filed on May 1, 2012; File No. 001-32395). | |
| 3.1 | Amended and Restated Certificate of Incorporation (incorporated by reference to Exhibit 3.1 to the Quarterly Report of ConocoPhillips on Form 10-Q for the quarterly period ended June 30, 2008; File No. 001-32395). | |
| 3.2 | Certificate of Designations of Series A Junior Participating Preferred Stock of ConocoPhillips (incorporated by reference to Exhibit 3.2 to the Current Report of ConocoPhillips on Form 8-K filed on August 30, 2002; File No. 000-49987). | |
| 3.3 | Amended and Restated By-Laws of ConocoPhillips, as amended and restated as of December 6, 2013 (incorporated by reference to Exhibit 3.1 to the Current Report of ConocoPhillips on Form 8-K filed December 10, 2013; File No. 001-32395). | |
| ConocoPhillips and its subsidiaries are parties to several debt instruments under which the total amount of securities authorized does not exceed 10 percent of the total assets of ConocoPhillips and its subsidiaries on a consolidated basis. Pursuant to paragraph 4(iii)(A) of Item 601(b) of Regulation S-K, ConocoPhillips agrees to furnish a copy of such instruments to the SEC upon request. | ||
| 10.1 | 1986 Stock Plan of Phillips Petroleum Company (incorporated by reference to Exhibit 10.11 to the Annual Report of ConocoPhillips on Form 10-K for the year ended December 31, 2002; File No. 000-49987). | |
| 10.2 | 1990 Stock Plan of Phillips Petroleum Company (incorporated by reference to Exhibit 10.12 to the Annual Report of ConocoPhillips on Form 10-K for the year ended December 31, 2002; File No. 000-49987). | |
| 10.3 | Annual Incentive Compensation Plan of Phillips Petroleum Company (incorporated by reference to Exhibit 10.13 to the Annual Report of ConocoPhillips on Form 10-K for the year ended December 31, 2002; File No. 000-49987). | |
| 10.4 | Incentive Compensation Plan of Phillips Petroleum Company (incorporated by reference to Exhibit 10(g) to the Annual Report of ConocoPhillips Company on Form 10-K for the year ended December 31, 1999; File No. 001-00720). | |
| 10.5 | Amendment and Restatement of ConocoPhillips Supplemental Executive Retirement Plan, dated April 19, 2012 (incorporated by reference to Exhibit 10.14 to the Quarterly Report of ConocoPhillips on Form 10-Q for the quarter ended June 30, 2012; File No. 001-32395). | |
| 10.6 | Non-Employee Director Retirement Plan of Phillips Petroleum Company (incorporated by reference to Exhibit 10.18 to the Annual Report of ConocoPhillips on Form 10-K for the year ended December 31, 2002; File No. 000-49987). | |
173
Exhibit Number | Description | |
| 10.7 | Omnibus Securities Plan of Phillips Petroleum Company (incorporated by reference to Exhibit 10.19 to the Annual Report of ConocoPhillips on Form 10-K for the year ended December 31, 2002; File No. 000-49987). | |
| 10.8 | Key Employee Missed Credited Service Retirement Plan of ConocoPhillips (incorporated by reference to Exhibit 10.10 to the Annual Report of ConocoPhillips on Form 10-K for the year ended December 31, 2005; File No. 001-32395). | |
| 10.9 | Phillips Petroleum Company Stock Plan for Non-Employee Directors (incorporated by reference to Exhibit 10.22 to the Annual Report of ConocoPhillips on Form 10-K for the year ended December 31, 2002; File No. 000-49987). | |
| 10.10 | Amendment and Restatement of ConocoPhillips Key Employee Supplemental Retirement Plan, dated April 19, 2012 (incorporated by reference to Exhibit 10.13 to the Quarterly Report of ConocoPhillips on Form 10-Q for the quarter ended June 30, 2012; File No. 001-32395). | |
| 10.11.1 | Amendment and Restatement of Defined Contribution Make-Up Plan of ConocoPhillips-Title I, dated April 19, 2012 (incorporated by reference to Exhibit 10.11.1 to the Quarterly Report of ConocoPhillips on Form 10-Q for the quarter ended June 30, 2012; File No. 001-32395). | |
| 10.11.2 | Amendment and Restatement of Defined Contribution Make-Up Plan of ConocoPhillips-Title II, dated April 19, 2012 (incorporated by reference to Exhibit 10.11.2 to the Quarterly Report of ConocoPhillips on Form 10-Q for the quarter ended June 30, 2012; File No. 001-32395). | |
| 10.11.3 | First Amendment to the Defined Contribution Make-Up Plan of ConocoPhillips-Title II, dated October 11, 2012 (incorporated by reference to Exhibit 10.2 to the Quarterly Report of ConocoPhillips on Form 10-Q for the quarter ended September 30, 2012; File No. 001-32395). | |
| 10.12 | 2002 Omnibus Securities Plan of Phillips Petroleum Company (incorporated by reference to Exhibit 10.26 to the Annual Report of ConocoPhillips on Form 10-K for the year ended December 31, 2002; File No. 000-49987). | |
| 10.13 | Amendment and Restatement of 1998 Stock and Performance Incentive Plan of ConocoPhillips (incorporated by reference to Exhibit 10.27 to the Annual Report of ConocoPhillips on Form 10-K for the year ended December 31, 2002; File No. 000-49987). | |
| 10.14 | Amendment and Restatement of 1998 Key Employee Stock Performance Plan of ConocoPhillips (incorporated by reference to Exhibit 10.28 to the Annual Report of ConocoPhillips on Form 10-K for the year ended December 31, 2002; File No. 000-49987). | |
| 10.15 | Deferred Compensation Plan for Non-Employee Directors of ConocoPhillips (incorporated by reference to Exhibit 10.17 to the Annual Report of ConocoPhillips on Form 10-K for the year ended December 31, 2005; File No. 001-32395). | |
| 10.16 | ConocoPhillips Form Indemnity Agreement with Directors (incorporated by reference to Exhibit 10.34 to the Annual Report of ConocoPhillips on Form 10-K for the year ended December 31, 2002; File No. 000-49987). | |
| 10.17.1 | Rabbi Trust Agreement dated December 17, 1999 (incorporated by reference to Exhibit 10.11 of the Annual Report of ConocoPhillips Holding Company on Form 10-K for the year ended December 31, 1999; File No. 001-14521). | |
174
Exhibit Number | Description | |
| 10.17.2 | Amendment to Rabbi Trust Agreement dated February 25, 2002 (incorporated by reference to Exhibit 10.39.1 to the Annual Report of ConocoPhillips on Form 10-K for the year ended December 31, 2002; File No. 000-49987). | |
| 10.18.1 | ConocoPhillips Directors' Charitable Gift Program (incorporated by reference to Exhibit 10.40 to the Annual Report of ConocoPhillips on Form 10-K for the year ended December 31, 2003; File No. 000-49987). | |
| 10.18.2 | First and Second Amendments to the ConocoPhillips Directors' Charitable Gift Program (incorporated by reference to Exhibit 10 to the Quarterly Report of ConocoPhillips on Form 10-Q for the quarterly period ended June 30, 2008; File No. 001-32395). | |
| 10.19 | ConocoPhillips Matching Gift Plan for Directors and Executives (incorporated by reference to Exhibit 10.41 to the Annual Report of ConocoPhillips on Form 10-K for the year ended December 31, 2003; File No. 000-49987). | |
| 10.20.1 | Amendment and Restatement of Key Employee Deferred Compensation Plan of ConocoPhillips-Title I, dated April 19, 2012 (incorporated by reference to Exhibit 10.12.1 to the Quarterly Report of ConocoPhillips on Form 10-Q for the quarter ended June 30, 2012; File No. 001-32395). | |
| 10.20.2 | Amendment and Restatement of Key Employee Deferred Compensation Plan of ConocoPhillips-Title II, dated April 19, 2012 (incorporated by reference to Exhibit 10.12.2 to the Quarterly Report of ConocoPhillips on Form 10-Q for the quarter ended June 30, 2012; File No. 001-32395). | |
| 10.20.3 | First Amendment to the Key Employee Deferred Compensation Plan of ConocoPhillips-Title II (incorporated by reference to Exhibit 10.20.3 to the Annual Report of ConocoPhillips on Form 10-K for the year ended December 31, 2010; File No. 001-32395). | |
| 10.20.4 | Second Amendment to the Key Employee Deferred Compensation Plan of ConocoPhillips-Title II (incorporated by reference to Exhibit 10.20.4 to the Annual Report of ConocoPhillips on Form 10-K for the year ended December 31, 2010; File No. 001-32395). | |
| 10.20.5* | Amendment and Restatement of Key Employee Deferred Compensation Plan of ConocoPhillips-Title II, 2013 Restatement dated November 17, 2014 (Amended and Restated effective as of January 1, 2013). | |
| 10.21 | Amendment and Restatement of ConocoPhillips Key Employee Change in Control Severance Plan, effective January 1, 2014 (incorporated by reference to Exhibit 10.21 to the Annual Report of ConocoPhillips on Form 10-K for the year ended December 31, 2013; File No. 001-32395). | |
| 10.22 | ConocoPhillips Executive Severance Plan (incorporated by reference to Exhibit 10.23 to the Annual Report of ConocoPhillips on Form 10-K for the year ended December 31, 2008; File No. 001-32395). | |
| 10.23.1 | 2004 Omnibus Stock and Performance Incentive Plan of ConocoPhillips (incorporated by reference to Appendix C of ConocoPhillips' Proxy Statement on Schedule 14A relating to the 2004 Annual Meeting of Shareholders; File No. 000-49987). | |
| 10.23.2 | Form of Stock Option Award Agreement under the Stock Option and Stock Appreciation Rights Program under the 2004 Omnibus Stock and Performance Incentive Plan of ConocoPhillips (incorporated by reference to Exhibit 10.26 to the Annual Report of ConocoPhillips on Form 10-K for the year ended December 31, 2008; File No. 001-32395). | |
175
Exhibit Number | Description | |
| 10.23.3 | Form of Performance Share Unit Award Agreement under the Performance Share Program under the 2004 Omnibus Stock and Performance Incentive Plan of ConocoPhillips (incorporated by reference to Exhibit 10.27 to the Annual Report of ConocoPhillips on Form 10-K for the year ended December 31, 2008; File No. 001-32395). | |
| 10.24 | Omnibus Amendments to certain ConocoPhillips employee benefit plans, adopted December 7, 2007 (incorporated by reference to Exhibit 10.30 to the Annual Report of ConocoPhillips on Form 10-K for the year ended December 31, 2007; File No. 001-32395). | |
| 10.25 | 2009 Omnibus Stock and Performance Incentive Plan of ConocoPhillips (incorporated by reference to Appendix A of ConocoPhillips' Proxy Statement on Schedule 14A relating to the 2009 Annual Meeting of Shareholders; File No. 001-32395). | |
| 10.26.1 | 2011 Omnibus Stock and Performance Incentive Plan of ConocoPhillips (incorporated by reference to Appendix A of ConocoPhillips' Proxy Statement on Schedule 14A relating to the 2011 Annual Meeting of Shareholders; File No. 001-32395). | |
| 10.26.2 | Form of Stock Option Award Agreement under the Stock Option and Stock Appreciation Rights Program under the 2011 Omnibus Stock and Performance Incentive Plan of ConocoPhillips, effective February 9, 2012 (incorporated by reference to Exhibit 10 to the Quarterly Report of ConocoPhillips on Form 10-Q for the quarter ended March 31, 2012; File No. 001-32395). | |
| 10.26.3 | Form of Restricted Stock Units Agreement under the Restricted Stock Program under the 2011 Omnibus Stock and Performance Incentive Plan of ConocoPhillips, effective April 4, 2012 (incorporated by reference to Exhibit 10.6 to the Quarterly Report of ConocoPhillips on Form 10-Q for the quarter ended June 30, 2012; File No. 001-32395). | |
| 10.26.4 | Form of Restricted Stock Award Agreement under the Restricted Stock Program under the 2011 Omnibus Stock and Performance Incentive Plan of ConocoPhillips, effective May 8, 2012 (incorporated by reference to Exhibit 10.7 to the Quarterly Report of ConocoPhillips on Form 10-Q for the quarter ended June 30, 2012; File No. 001-32395). | |
| 10.26.5 | Form of Restricted Stock Award Agreement under the Restricted Stock Program under the 2011 Omnibus Stock and Performance Incentive Plan of ConocoPhillips, dated September 18, 2012 (incorporated by reference to Exhibit 10.26.5 to the Annual Report of ConocoPhillips on Form 10-K for the year ended December 31, 2012; File No. 001-32395). | |
| 10.26.6 | Form of Performance Share Unit Agreement under the Restricted Stock Program under the 2011 Omnibus Stock and Performance Incentive Plan of ConocoPhillips, dated February 5, 2013 (incorporated by reference to Exhibit 10.26.6 to the Annual Report of ConocoPhillips on Form 10-K for the year ended December 31, 2012; File No. 001-32395). | |
| 10.26.7 | Form of Performance Share Unit Agreement-Canada under the Restricted Stock Program under the 2011 Omnibus Stock and Performance Incentive Plan of ConocoPhillips, dated February 5, 2013 (incorporated by reference to Exhibit 10.26.7 to the Annual Report of ConocoPhillips on Form 10-K for the year ended December 31, 2012; File No. 001-32395). | |
| 10.26.8 | Form of Restricted Stock Award Agreement under the Restricted Stock Program under the 2011 Omnibus Stock and Performance Incentive Plan of ConocoPhillips, dated February 5, 2013 (incorporated by reference to Exhibit 10.26.8 to the Annual Report of ConocoPhillips on Form 10-K for the year ended December 31, 2012; File No. 001-32395). | |
176
Exhibit Number | Description | |
| 10.26.9 | Form of Stock Option Award Agreement under the Stock Option and Stock Appreciation Rights Program under the 2011 Omnibus Stock and Performance Incentive Plan of ConocoPhillips, dated February 5, 2013 (incorporated by reference to Exhibit 10.26.9 to the Annual Report of ConocoPhillips on Form 10-K for the year ended December 31, 2012; File No. 001-32395). | |
| 10.26.10 | Form of Make-up Grant Award Agreement under the 2011 Omnibus Stock and Performance Incentive Plan of ConocoPhillips, dated January 1, 2012 (incorporated by reference to Exhibit 10.1 to the Quarterly Report of ConocoPhillips on Form 10-Q for the quarter ended March 31, 2013; File No. 001-32395). | |
| 10.26.11 | Form of Key Employee Award Agreement, as part of the ConocoPhillips Stock Option Program granted under the 2011 Omnibus Stock and Performance Incentive Plan of ConocoPhillips, dated February 18, 2014 (incorporated by reference to Exhibit 10.1 to the Quarterly Report of ConocoPhillips on Form 10-Q for the quarter ended March 31, 2014; File No. 001-32395). | |
| 10.26.12 | Form of Key Employee Award Agreement, as part of the ConocoPhillips Restricted Stock Program granted under the 2011 Omnibus Stock and Performance Incentive Plan of ConocoPhillips, dated February 18, 2014 (incorporated by reference to Exhibit 10.2 to the Quarterly Report of ConocoPhillips on Form 10-Q for the quarter ended March 31, 2014; File No. 001-32395). | |
| 10.26.13 | Form of Performance Period IX Award Agreement, as part of the ConocoPhillips Performance Share Program granted under the 2011 Omnibus Stock and Performance Incentive Plan of ConocoPhillips, dated February 18, 2014 (incorporated by reference to Exhibit 10.3 to the Quarterly Report of ConocoPhillips on Form 10-Q for the quarter ended March 31, 2014; File No. 001-32395). | |
| 10.26.14 | Form of Performance Period IX Award Agreement-Canada, as part of the ConocoPhillips Performance Share Program granted under the 2011 Omnibus Stock and Performance Incentive Plan of ConocoPhillips, dated February 18, 2014 (incorporated by reference to Exhibit 10.4 to the Quarterly Report of ConocoPhillips on Form 10-Q for the quarter ended March 31, 2014; File No. 001-32395). | |
| 10.26.15 | Form of Performance Period X Award Agreement, as part of the ConocoPhillips Performance Share Program granted under the 2011 Omnibus Stock and Performance Incentive Plan of ConocoPhillips, dated February 18, 2014 (incorporated by reference to Exhibit 10.5 to the Quarterly Report of ConocoPhillips on Form 10-Q for the quarter ended March 31, 2014; File No. 001-32395). | |
| 10.26.16 | Form of Performance Period X Award Agreement-Canada, as part of the ConocoPhillips Performance Share Program granted under the 2011 Omnibus Stock and Performance Incentive Plan of ConocoPhillips, dated February 18, 2014 (incorporated by reference to Exhibit 10.6 to the Quarterly Report of ConocoPhillips on Form 10-Q for the quarter ended March 31, 2014; File No. 001-32395). | |
| 10.26.17 | Form of Performance Period XI Award Agreement, as part of the ConocoPhillips Performance Share Program granted under the 2011 Omnibus Stock and Performance Incentive Plan of ConocoPhillips, dated February 18, 2014 (incorporated by reference to Exhibit 10.7 to the Quarterly Report of ConocoPhillips on Form 10-Q for the quarter ended March 31, 2014; File No. 001-32395). | |
177
Exhibit Number | Description | |
| 10.26.18 | Form of Performance Period XI Award Agreement-Canada, as part of the ConocoPhillips Performance Share Program granted under the 2011 Omnibus Stock and Performance Incentive Plan of ConocoPhillips, dated February 18, 2014 (incorporated by reference to Exhibit 10.8 to the Quarterly Report of ConocoPhillips on Form 10-Q for the quarter ended March 31, 2014; File No. 001-32395). | |
| 10.26.19 | Form of Performance Period XII Award Agreement, as part of the ConocoPhillips Performance Share Program granted under the 2011 Omnibus Stock and Performance Incentive Plan of ConocoPhillips, dated February 18, 2014 (incorporated by reference to Exhibit 10.9 to the Quarterly Report of ConocoPhillips on Form 10-Q for the quarter ended March 31, 2014; File No. 001-32395). | |
| 10.26.20 | Form of Performance Period XII Award Agreement-Canada, as part of the ConocoPhillips Performance Share Program granted under the 2011 Omnibus Stock and Performance Incentive Plan of ConocoPhillips, dated February 18, 2014 (incorporated by reference to Exhibit 10.10 to the Quarterly Report of ConocoPhillips on Form 10-Q for the quarter ended March 31, 2014; File No. 001-32395). | |
| 10.26.21 | Form of Inducement Grant Award Agreement under the 2011 Omnibus Stock and Performance Incentive Plan of ConocoPhillips, dated March 31, 2014 (incorporated by reference to Exhibit 10.11 to the Quarterly Report of ConocoPhillips on Form 10-Q for the quarter ended March 31, 2014; File No. 001-32395). | |
| 10.27.1 | 2014 Omnibus Stock and Performance Incentive Plan of ConocoPhillips (incorporated by reference to Exhibit 10.1 to the Current Report of ConocoPhillips on Form 8-K filed on May 14, 2014; File No. 001-32395). | |
| 10.27.2 | Form of Key Employee Award Terms and Conditions, as part of the ConocoPhillips Targeted Variable Long Term Incentive Program of ConocoPhillips, granted under the 2014 Omnibus Stock and Performance Incentive Plan of ConocoPhillips, dated September 15, 2014 (incorporated by reference to Exhibit 10.1 to the Quarterly Report of ConocoPhillips on Form 10-Q for the quarter ended September 30, 2014; File No. 001-32395). | |
| 10.28 | Amendment and Restatement of Annex to Nonqualified Deferred Compensation Arrangements of ConocoPhillips, dated April 19, 2012 (incorporated by reference to Exhibit 10.8 to the Quarterly Report of ConocoPhillips on Form 10-Q for the quarter ended June 30, 2012; File No. 001-32395). | |
| 10.29 | Amendment, Change of Sponsorship, and Restatement of Certain Nonqualified Deferred Compensation Plans of ConocoPhillips, dated April 19, 2012 (incorporated by reference to Exhibit 10.10 to the Quarterly Report of ConocoPhillips on Form 10-Q for the quarter ended June 30, 2012; File No. 001-32395). | |
| 10.30 | Amendment and Restatement of the Burlington Resources Inc. Management Supplemental Benefits Plan, dated April 19, 2012 (incorporated by reference to Exhibit 10.9 to the Quarterly Report of ConocoPhillips on Form 10-Q for the quarter ended June 30, 2012; File No. 001-32395). | |
| 10.31 | Indemnification and Release Agreement between ConocoPhillips and Phillips 66, dated April 26, 2012 (incorporated by reference to Exhibit 10.1 to the Current Report of ConocoPhillips on Form 8-K filed on May 1, 2012; File No. 001-32395). | |
| 10.32 | Intellectual Property Assignment and License Agreement between ConocoPhillips and Phillips 66, dated April 26, 2012 (incorporated by reference to Exhibit 10.2 to the Current Report of ConocoPhillips on Form 8-K filed on May 1, 2012; File No. 001-32395). | |
178
Exhibit Number | Description | |
| 10.33 | Tax Sharing Agreement between ConocoPhillips and Phillips 66, dated April 26, 2012 (incorporated by reference to Exhibit 10.3 to the Current Report of ConocoPhillips on Form 8-K filed on May 1, 2012; File No. 001-32395). | |
| 10.34 | Employee Matters Agreement between ConocoPhillips and Phillips 66, dated April 12, 2012 (incorporated by reference to Exhibit 10.4 to the Current Report of ConocoPhillips on Form 8-K filed on May 1, 2012; File No. 001-32395). | |
| 10.35 | Transition Services Agreement between ConocoPhillips and Phillips 66, dated April 26, 2012 (incorporated by reference to Exhibit 10.5 to the Current Report of ConocoPhillips on Form 8-K filed on May 1, 2012; File No. 001-32395). | |
| 10.36 | ConocoPhillips Clawback Policy dated October 3, 2012 (incorporated by reference to Exhibit 10.3 to the Quarterly Report of ConocoPhillips on Form 10-Q for the quarter ended September 30, 2012; File No. 001-32395). | |
| 12* | Computation of Ratio of Earnings to Fixed Charges. | |
| 21* | List of Subsidiaries of ConocoPhillips. | |
| 23.1* | Consent of Ernst & Young LLP. | |
| 23.2* | Consent of DeGolyer and MacNaughton. | |
| 31.1* | Certification of Chief Executive Officer pursuant to Rule 13a-14(a) under the Securities Exchange Act of 1934. | |
| 31.2* | Certification of Chief Financial Officer pursuant to Rule 13a-14(a) under the Securities Exchange Act of 1934. | |
| 32* | Certifications pursuant to 18 U.S.C. Section 1350. | |
| 99* | Report of DeGolyer and MacNaughton. | |
| 101.INS* | XBRL Instance Document. | |
| 101.SCH* | XBRL Schema Document. | |
| 101.CAL* | XBRL Calculation Linkbase Document. | |
| 101.DEF* | XBRL Definition Linkbase Document. | |
| 101.LAB* | XBRL Labels Linkbase Document. | |
| 101.PRE* | XBRL Presentation Linkbase Document. | |
| * | Filed herewith. |
179
SIGNATURES
Pursuant to the requirements of Section 13 or 15(d) of the Securities Exchange Act of 1934, the registrant has duly caused this report to be signed on its behalf by the undersigned, thereunto duly authorized.
| CONOCOPHILLIPS | ||
| February 24, 2015 | /s/ Ryan M. Lance | |
Ryan M. Lance Chairman of the Board of Directors and Chief Executive Officer | ||
Pursuant to the requirements of the Securities Exchange Act of 1934, this report has been signed, as of February 24, 2015, on behalf of the registrant by the following officers in the capacity indicated and by a majority of directors.
Signature | Title | |||
/s/ Ryan M. Lance | Chairman of the Board of Directors | |||
| Ryan M. Lance | and Chief Executive Officer (Principal executive officer) | |||
/s/ Jeff W. Sheets | Executive Vice President, Finance | |||
| Jeff W. Sheets | and Chief Financial Officer (Principal financial officer) | |||
/s/ Glenda M. Schwarz | Vice President and Controller | |||
| Glenda M. Schwarz | (Principal accounting officer) | |||
180
/s/ Richard L. Armitage | Director | |||
| Richard L. Armitage | ||||
/s/ Richard H. Auchinleck | Director | |||
| Richard H. Auchinleck | ||||
/s/ Charles E. Bunch | Director | |||
| Charles E. Bunch | ||||
/s/ James E. Copeland, Jr. | Director | |||
| James E. Copeland, Jr. | ||||
/s/ Gay Huey Evans | Director | |||
| Gay Huey Evans | ||||
/s/ John V. Faraci | Director | |||
| John V. Faraci | ||||
/s/ Jody Freeman | Director | |||
| Jody Freeman | ||||
/s/ Arjun N. Murti | Director | |||
| Arjun N. Murti | ||||
/s/ Robert A. Niblock | Director | |||
| Robert A. Niblock | ||||
/s/ Harald J. Norvik | Director | |||
| Harald J. Norvik | ||||
/s/ William E. Wade, Jr. | Director | |||
| William E. Wade, Jr. | ||||
181