Table of Contents
| ||||
UNITED STATES SECURITIES AND EXCHANGE COMMISSION
Washington, D.C. 20549
________________________________________
Form 10-Q
________________________________________
☑ |
| Quarterly Report pursuant to Section 13 or 15(d) of the Securities Exchange Act of 1934 for the quarterly period ended May 31, 2018. | |
or | |||
o |
| Transition Report pursuant to Section 13 or 15(d) of the Securities Exchange Act of 1934 for the transition period from to | |
Commission file number: 001-36079
________________________________________
CHS Inc.
(Exact name of registrant as specified in its charter)
Minnesota (State or other jurisdiction of incorporation or organization) |
| 41-0251095 (I.R.S. Employer Identification Number) |
|
|
|
5500 Cenex Drive Inver Grove Heights, Minnesota 55077 (Address of principal executive offices, including zip code) |
| (651) 355-6000 (Registrant's telephone number, including area code) |
________________________________________
Indicate by check mark whether the Registrant (1) has filed all reports required to be filed by Section 13 or 15(d) of the Securities Exchange Act of 1934 during the preceding 12 months (or for such shorter period that the registrant was required to file such reports), and (2) has been subject to such filing requirements for the past 90 days.
YES ☑ NO o
Indicate by check mark whether the Registrant has submitted electronically and posted on its corporate website, if any, every Interactive Data File required to be submitted and posted pursuant to Rule 405 of Regulation S-T (§232.405 of this chapter) during the preceding 12 months (or for such shorter period that the Registrant was required to submit and post such files).
YES ☑ NO o
Indicate by check mark whether the Registrant is a large accelerated filer, an accelerated filer, a non-accelerated filer, smaller reporting company, or an emerging growth company. See the definitions of "large accelerated filer," "accelerated filer," "smaller reporting company," and "emerging growth company" in Rule 12b-2 of the Exchange Act.
Large accelerated filer o | Accelerated filer o | Non-accelerated filer ☑ | Smaller reporting company o | Emerging growth company o |
|
| (Do not check if a smaller reporting company) |
|
|
If an emerging growth company, indicate by check mark if the Registrant has elected not to use the extended transition period for complying with any new or revised financial accounting standards provided pursuant to Section 13(a) of the Exchange Act. o
Indicate by check mark whether the Registrant is a shell company (as defined in Rule 12b-2 of the Exchange Act).
YES o NO ☑
Indicate the number of shares outstanding of each of the Registrant's classes of common stock, as of the latest practicable date: The Registrant has no common stock outstanding.
| ||||
INDEX
|
|
|
| PART I. FINANCIAL INFORMATION | Page No. |
Item 1. | Financial Statements (unaudited) | 2 |
| Consolidated Balance Sheets as of May 31, 2018, and August 31, 2017 | 2 |
| Consolidated Statements of Operations for the three and nine months ended May 31, 2018, and 2017 | 3 |
| Consolidated Statements of Comprehensive Income for the three and nine months ended May 31, 2018, and 2017 | 4 |
| Consolidated Statements of Cash Flows for the nine months ended May 31, 2018, and 2017 | 5 |
| Notes to Consolidated Financial Statements | 6 |
Item 2. | Management's Discussion and Analysis of Financial Condition and Results of Operations | 26 |
Item 3. | Quantitative and Qualitative Disclosures about Market Risk | 45 |
Item 4. | Controls and Procedures | 46 |
| PART II. OTHER INFORMATION | 47 |
Item 1. | Legal Proceedings | 47 |
Item 1A. | Risk Factors | 47 |
Item 6. | Exhibits | 47 |
|
|
|
SIGNATURE PAGE | 48 | |
| ||
Unless the context otherwise requires, for purposes of this Quarterly Report on Form 10-Q, the words "we," "us," "our," the "Company" and "CHS" refer to CHS Inc., a Minnesota cooperative corporation, and its subsidiaries as of May 31, 2018 .
FORWARD-LOOKING STATEMENTS
This Quarterly Report on Form 10-Q contains and our other publicly available documents may contain, and our officers, directors and other representatives may from time to time make, "forward-looking statements" within the meaning of the safe harbor provisions of the U.S. Private Securities Litigation Reform Act of 1995. Forward-looking statements can be identified by words such as "anticipate," "intend," "plan," "goal," "seek," "believe," "project," "estimate," "expect," "strategy," "future," "likely," "may," "should," "will" and similar references to future periods. Forward-looking statements are neither historical facts nor assurances of future performance. Instead, they are based only on our current beliefs, expectations and assumptions regarding the future of our businesses, financial condition and results of operations, future plans and strategies, projections, anticipated events and trends, the economy and other future conditions. Because forward-looking statements relate to the future, they are subject to inherent uncertainties, risks and changes in circumstances that are difficult to predict and many of which are outside of our control. Our actual results and financial condition may differ materially from those indicated in the forward-looking statements. Therefore, you should not place undue reliance on any of these forward-looking statements. Important factors that could cause our actual results and financial condition to differ materially from those indicated in the forward-looking statements are discussed or identified in our public filings made with the U.S. Securities and Exchange Commission, including in the "Risk Factors" discussion in Item 1A of our Annual Report on Form 10-K for the year ended August 31, 2017 . Any forward-looking statements made by us in this Quarterly Report on Form 10-Q are based only on information currently available to us and speak only as of the date on which the statement is made. We undertake no obligation to publicly update any forward-looking statement, whether written or oral, that may be made from time to time, whether as a result of new information, future developments or otherwise, except as required by applicable law.
1
Table of Contents
PART I. FINANCIAL INFORMATION
ITEM 1. FINANCIAL STATEMENTS
CHS INC. AND SUBSIDIARIES
CONSOLIDATED BALANCE SHEETS
(Unaudited)
| May 31, |
| August 31, | ||||
| (Dollars in thousands) | ||||||
ASSETS |
|
|
| ||||
Current assets: |
| |
| | | ||
Cash and cash equivalents | $ | 533,887 | |
| $ | 181,379 | |
Receivables | 2,198,211 | |
| 1,869,632 | | ||
Inventories | 2,940,907 | |
| 2,576,585 | | ||
Derivative assets | 483,794 | |
| 232,017 | | ||
Margin and related deposits | 253,141 | |
| 206,062 | | ||
Supplier advance payments | 426,607 | |
| 249,234 | | ||
Other current assets | 198,078 | |
| 299,618 | | ||
Total current assets | 7,034,625 | |
| 5,614,527 | | ||
Investments | 3,787,163 | |
| 3,750,993 | | ||
Property, plant and equipment | 5,140,106 | |
| 5,356,434 | | ||
Other assets | 973,885 | |
| 1,251,802 | | ||
Total assets | $ | 16,935,779 | |
| $ | 15,973,756 | |
LIABILITIES AND EQUITIES |
|
|
| ||||
Current liabilities: |
| |
|
| | ||
Notes payable | $ | 2,819,086 | |
| $ | 1,988,215 | |
Current portion of long-term debt | 53,056 | |
| 156,345 | | ||
Customer margin deposits and credit balances | 137,999 | |
| 157,914 | | ||
Customer advance payments | 372,616 | |
| 413,163 | | ||
Accounts payable | 1,904,819 | |
| 1,951,292 | | ||
Derivative liabilities | 344,973 | |
| 316,018 | | ||
Accrued expenses | 538,249 | |
| 437,527 | | ||
Dividends and equities payable | 209,718 | |
| 12,121 | | ||
Total current liabilities | 6,380,516 | |
| 5,432,595 | | ||
Long-term debt | 1,905,515 | |
| 2,023,448 | | ||
Long-term deferred tax liabilities | 207,912 | |
| 333,221 | | ||
Other liabilities | 279,303 | |
| 278,667 | | ||
Commitments and contingencies (Note 13) | | |
| | | ||
Equities: |
| |
|
| | ||
Preferred stock | 2,264,038 | |
| 2,264,038 | | ||
Equity certificates | 4,253,414 | |
| 4,341,649 | | ||
Accumulated other comprehensive loss | (169,726 | ) |
| (183,670 | ) | ||
Capital reserves | 1,803,078 | |
| 1,471,217 | | ||
Total CHS Inc. equities | 8,150,804 | |
| 7,893,234 | | ||
Noncontrolling interests | 11,729 | |
| 12,591 | | ||
Total equities | 8,162,533 | |
| 7,905,825 | | ||
Total liabilities and equities | $ | 16,935,779 | |
| $ | 15,973,756 | |
The accompanying notes are an integral part of the consolidated financial statements (unaudited).
2
Table of Contents
CHS INC. AND SUBSIDIARIES
CONSOLIDATED STATEMENTS OF OPERATIONS
(Unaudited)
| For the Three Months Ended |
| For the Nine Months Ended | ||||||||||||
| 2018 |
| 2017 |
| 2018 |
| 2017 | ||||||||
| (Dollars in thousands) | ||||||||||||||
Revenues | $ | 9,027,525 | |
| $ | 8,614,090 | |
| $ | 23,927,508 | |
| $ | 23,982,746 | |
Cost of goods sold | 8,728,914 | |
| 8,366,988 | |
| 23,173,151 | |
| 23,142,205 | | ||||
Gross profit | 298,611 | |
| 247,102 | |
| 754,357 | |
| 840,541 | | ||||
Marketing, general and administrative | 161,578 | |
| 153,498 | |
| 488,459 | |
| 459,831 | | ||||
Reserve and impairment charges (recoveries), net | (3,811 | ) |
| 323,901 | |
| (18,944 | ) |
| 414,009 | | ||||
Operating earnings (loss) | 140,844 | |
| (230,297 | ) |
| 284,842 | |
| (33,299 | ) | ||||
(Gain) loss on disposal of business | (124,050 | ) |
| - | |
| (131,755 | ) |
| - | | ||||
Interest expense | 49,340 | |
| 39,201 | |
| 130,218 | |
| 117,411 | | ||||
Other (income) loss | (14,622 | ) |
| (11,947 | ) |
| (51,000 | ) |
| (66,183 | ) | ||||
Equity (income) loss from investments | (59,308 | ) |
| (48,393 | ) |
| (137,111 | ) |
| (124,521 | ) | ||||
Income (loss) before income taxes | 289,484 | |
| (209,158 | ) |
| 474,490 | |
| 39,994 | | ||||
Income tax expense (benefit) | 60,338 | |
| (163,018 | ) |
| (100,901 | ) |
| (137,781 | ) | ||||
Net income (loss) | 229,146 | |
| (46,140 | ) |
| 575,391 | |
| 177,775 | | ||||
Net income (loss) attributable to noncontrolling interests | (187 | ) |
| (955 | ) |
| (699 | ) |
| (757 | ) | ||||
Net income (loss) attributable to CHS Inc. | $ | 229,333 | |
| $ | (45,185 | ) |
| $ | 576,090 | |
| $ | 178,532 | |
The accompanying notes are an integral part of the consolidated financial statements (unaudited).
3
Table of Contents
CHS INC. AND SUBSIDIARIES
CONSOLIDATED STATEMENTS OF COMPREHENSIVE INCOME
(Unaudited)
| For the Three Months Ended |
| For the Nine Months Ended | ||||||||||||
| 2018 |
| 2017 |
| 2018 |
| 2017 | ||||||||
| (Dollars in thousands) | ||||||||||||||
Net income (loss) | $ | 229,146 | |
| $ | (46,140 | ) |
| $ | 575,391 | |
| $ | 177,775 | |
Other comprehensive income (loss), net of tax: |
|
|
|
|
|
|
| ||||||||
Postretirement benefit plan activity, net of tax expense (benefit) of $1,424, $2,257, $5,353 and $6,580, respectively | 3,417 | |
| 3,635 | |
| 10,755 | |
| 10,599 | | ||||
Unrealized net gain (loss) on available for sale investments, net of tax expense (benefit) of $2,620, $(72), $4,505 and $1,010, respectively | 6,286 | |
| (117 | ) |
| 13,480 | |
| 1,627 | | ||||
Cash flow hedges, net of tax expense (benefit) of $172, $233, $613 and $1,238, respectively | 413 | |
| 375 | |
| 1,472 | |
| 1,993 | | ||||
Foreign currency translation adjustment, net of tax expense (benefit) of $(254), $(334), $(275) and $(329), respectively | (11,617 | ) |
| (2,151 | ) |
| (11,763 | ) |
| (12,193 | ) | ||||
Other comprehensive income (loss), net of tax | (1,501 | ) |
| 1,742 | |
| 13,944 | |
| 2,026 | | ||||
Comprehensive income (loss) | 227,645 | |
| (44,398 | ) |
| 589,335 | |
| 179,801 | | ||||
Less: comprehensive income (loss) attributable to noncontrolling interests | (187 | ) |
| (955 | ) |
| (699 | ) |
| (757 | ) | ||||
Comprehensive income (loss) attributable to CHS Inc. | $ | 227,832 | |
| $ | (43,443 | ) |
| $ | 590,034 | |
| $ | 180,558 | |
The accompanying notes are an integral part of the consolidated financial statements (unaudited).
4
Table of Contents
CHS INC. AND SUBSIDIARIES
CONSOLIDATED STATEMENTS OF CASH FLOWS
(Unaudited)
| For the Nine Months Ended May 31, | ||||||
| 2018 |
| 2017 | ||||
| (Dollars in thousands) | ||||||
Cash flows from operating activities: |
| |
|
| | ||
Net income (loss) | $ | 575,391 | |
| $ | 177,775 | |
Adjustments to reconcile net income to net cash provided by (used in) operating activities: |
| |
|
| | ||
Depreciation and amortization | 358,134 | |
| 362,118 | | ||
Amortization of deferred major repair costs | 43,908 | |
| 50,565 | | ||
Equity (income) loss from investments | (137,111 | ) |
| (124,521 | ) | ||
Distributions from equity investments | 97,665 | |
| 105,558 | | ||
Provision for doubtful accounts | (4,145 | ) |
| 198,304 | | ||
Gain on disposal of business | (131,755 | ) |
| - | | ||
Unrealized (gain) loss on crack spread contingent liability | - | |
| (13,273 | ) | ||
Long-lived asset impairment, net of recoveries | (12,368 | ) |
| 85,431 | | ||
Reserve against supplier advance payments | - | |
| 130,705 | | ||
Deferred taxes | (135,560 | ) |
| (145,357 | ) | ||
Other, net | 30,640 | |
| 25,559 | | ||
Changes in operating assets and liabilities, net of acquisitions: |
| |
|
| | ||
Receivables | (216,501 | ) |
| (55,498 | ) | ||
Inventories | (366,858 | ) |
| (344,914 | ) | ||
Derivative assets | (86,910 | ) |
| 120,294 | | ||
Margin and related deposits | (47,079 | ) |
| 58,581 | | ||
Supplier advance payments | (177,373 | ) |
| (214,538 | ) | ||
Other current assets and other assets | 75,191 | |
| 19,289 | | ||
Customer margin deposits and credit balances | (19,914 | ) |
| (76,355 | ) | ||
Customer advance payments | (40,547 | ) |
| (23,700 | ) | ||
Accounts payable and accrued expenses | 73,745 | |
| 152,094 | | ||
Derivative liabilities | 23,758 | |
| (229,881 | ) | ||
Other liabilities | (49,842 | ) |
| (53,471 | ) | ||
Net cash provided by (used in) operating activities | (147,531 | ) |
| 204,765 | | ||
Cash flows from investing activities: |
| |
|
| | ||
Acquisition of property, plant and equipment | (249,078 | ) |
| (298,015 | ) | ||
Proceeds from disposition of property, plant and equipment | 80,045 | |
| 17,702 | | ||
Proceeds from sale of business | 234,914 | |
| - | | ||
Expenditures for major repairs | (39,363 | ) |
| (1,146 | ) | ||
Investments in joint ventures and other | (20,606 | ) |
| (13,853 | ) | ||
Investments redeemed | 6,607 | |
| 7,698 | | ||
Proceeds from sale of investments | 25,444 | |
| 6,170 | | ||
Changes in CHS Capital notes receivable, net | (83,908 | ) |
| (104,773 | ) | ||
Financing extended to customers | (72,106 | ) |
| (57,783 | ) | ||
Payments from customer financing | 38,725 | |
| 67,126 | | ||
Other investing activities, net | 7,539 | |
| 2,722 | | ||
Net cash provided by (used in) investing activities | (71,787 | ) |
| (374,152 | ) | ||
Cash flows from financing activities: |
| |
|
| | ||
Proceeds from lines of credit and long-term borrowings | 29,802,708 | |
| 29,890,570 | | ||
Payments on lines of credit, long term-debt and capital lease obligations | (29,028,104 | ) |
| (29,362,970 | ) | ||
Changes in checks and drafts outstanding | (59,358 | ) |
| (118,844 | ) | ||
Preferred stock dividends paid | (126,501 | ) |
| (125,475 | ) | ||
Retirements of equities | (6,391 | ) |
| (25,503 | ) | ||
Cash patronage dividends paid | - | |
| (103,879 | ) | ||
Other financing activities, net | (11,558 | ) |
| 1,539 | | ||
Net cash provided by (used in) financing activities | 570,796 | |
| 155,438 | | ||
Effect of exchange rate changes on cash and cash equivalents | 1,030 | |
| 1,865 | | ||
Net increase (decrease) in cash and cash equivalents | 352,508 | |
| (12,084 | ) | ||
Cash and cash equivalents at beginning of period | 181,379 | |
| 279,313 | | ||
Cash and cash equivalents at end of period | $ | 533,887 | |
| $ | 267,229 | |
The accompanying notes are an integral part of the consolidated financial statements (unaudited).
5
Table of Contents
CHS INC. AND SUBSIDIARIES
NOTES TO CONSOLIDATED FINANCIAL STATEMENTS (Unaudited)
Note 1 Organization, Basis of Presentation and Significant Accounting Policies
Basis of Presentation
The unaudited Consolidated Balance Sheet as of May 31, 2018 , the Consolidated Statements of Operations for the three and nine months ended May 31, 2018 , and 2017 , the Consolidated Statements of Comprehensive Income for the three and nine months ended May 31, 2018 , and 2017 , and the Consolidated Statements of Cash Flows for the nine months ended May 31, 2018 , and 2017 , reflect in the opinion of our management, all normal recurring adjustments necessary for a fair statement of the financial position, results of operations and cash flows for the interim periods presented. The results of operations and cash flows for interim periods are not necessarily indicative of results for a full fiscal year because of, among other things, the seasonal nature of our businesses. Our Consolidated Balance Sheet data as of August 31, 2017 , has been derived from our audited consolidated financial statements, but does not include all disclosures required by accounting principles generally accepted in the United States of America ("U.S. GAAP").
Over the course of fiscal 2017, we incurred charges related to a trading partner of ours in Brazil, which entered into bankruptcy-like proceedings under Brazilian law; intangible and fixed asset impairment charges associated with certain assets meeting the criteria to be classified as held for sale; fixed asset impairment charges due to the cancellation of a capital project at one of our refineries; and bad debt/loan loss reserve charges relating to a single large producer borrower. Charges and impairments of this nature, as well as any recoveries related to amounts previously reserved, are included in the Consolidated Statements of Operations in the line item, "Reserve and impairment charges (recoveries), net" for the three and nine months ended May 31, 2018 , and 2017 . The timing and amounts of these charges and impairments, and any recoveries were determined utilizing facts and circumstances that were present in the respective quarters in which the charges, impairments or recoveries were recorded. Prior year information has been revised to conform to the current year presentation.
The notes to our consolidated financial statements reference our Energy, Ag and Nitrogen Production reportable segments, as well as our Corporate and Other category, which represents an aggregation of individually immaterial operating segments. Our equity method investment in Ventura Foods, LLC ("Ventura Foods"), which previously represented our Foods reportable segment, was determined to represent an individually immaterial operating segment during the second quarter of fiscal 2018 and has been aggregated within the Corporate and Other category. See Note 10, Segment Reporting , for more information related to our reportable segments.
Our consolidated financial statements include the accounts of CHS and all of our wholly owned and majority owned subsidiaries. The effects of all significant intercompany transactions have been eliminated.
These unaudited consolidated financial statements should be read in conjunction with the consolidated financial statements and notes thereto for the year ended August 31, 2017 , included in our Annual Report on Form 10-K, filed with the Securities and Exchange Commission (the "SEC").
Recent Accounting Pronouncements
Adopted
In October 2016, the Financial Accounting Standards Board ("FASB") issued Accounting Standards Update ("ASU") No. 2016-16, Income Taxes - Intra-Entity Transfers of Assets Other Than Inventory (Topic 740). This ASU is intended to improve the accounting for the income tax consequences of intra-entity transfers of assets other than inventory by requiring an entity to recognize the income tax consequences when a transfer occurs, instead of when an asset is sold to an outside party. This ASU is effective for periods beginning after December 15, 2017; however, early adoption of this ASU is permitted during the first interim period if an entity issues interim financial statements and the amendments in this ASU should be applied on a modified retrospective basis through a cumulative-effect adjustment directly to retained earnings as of the beginning of the period of adoption. We elected to early adopt ASU No. 2016-16 during the first quarter of fiscal 2018. The adoption did not have a material impact on our consolidated financial statements.
6
Table of Contents
Not Yet Adopted
In February 2018, the FASB issued ASU 2018-02, Income Statement - Reporting Comprehensive Income (Topic 220). Under existing U.S. GAAP the effects of changes in tax rates and laws on deferred tax balances are recorded as a component of income tax expense in the period in which the law was enacted. When deferred tax balances related to items originally recorded in accumulated other comprehensive income are adjusted, certain tax effects become stranded in accumulated other comprehensive income. The amendments in ASU 2018-02 allow a reclassification from accumulated other comprehensive income to retained earnings for stranded tax effects resulting from the Tax Cuts and Jobs Act of 2017 (the "Tax Act"). The amendments in this ASU also require certain disclosures about stranded tax effects. This ASU is effective for us beginning September 1, 2019, for our fiscal year 2020 and for interim periods within that fiscal year. Early adoption in any period is permitted. The Company's provisional adjustments recorded to account for the impact of the Tax Cuts and Jobs Act resulted in stranded tax effects. We are currently evaluating the timing and impact of adopting ASU 2018-02.
In August 2017, the FASB issued ASU No. 2017-12 , Derivatives and Hedging (Topic 815): Targeted Improvements to Accounting for Hedging Activities . This ASU is intended to improve the financial reporting of hedging relationships to better represent the economic results of an entity's risk management activities in its financial statements and make certain improvements to simplify the application of the hedge accounting guidance. The amendments in this ASU will make more financial and nonfinancial hedging strategies eligible for hedge accounting, amend the presentation and disclosure requirements and change how entities assess effectiveness. Entities are required to apply this ASU's provisions as a cumulative-effect adjustment to retained earnings as of the beginning of the first reporting period in which the guidance is adopted. This ASU is effective for us beginning September 1, 2019, for our fiscal year 2020 and for interim periods within that fiscal year. We are currently evaluating the impact the adoption will have on our consolidated financial statements.
In March 2017, the FASB issued ASU No. 2017-07, Compensation - Retirement Benefits (Topic 715): Improving the Presentation of Net Periodic Pension Costs and Net Postretirement Benefit Cost. This ASU changes the presentation of net periodic pension cost and net periodic postretirement benefit cost in the Consolidated Statements of Operations. This ASU requires that the service cost component be included in the same line item as other compensation costs arising from services rendered by the employees during the period. The other components of net periodic benefit cost should be presented in the Consolidated Statements of Operations separately outside of operating income if that subtotal is presented. Additionally, only service cost may be capitalized in assets. This ASU is effective for us beginning September 1, 2018, for our fiscal year 2019 and for interim periods within that fiscal year. The guidance on the presentation of the components of net periodic benefit cost in the Consolidated Statements of Operations should be applied retrospectively and the guidance regarding the capitalization of the service cost component in assets should be applied prospectively. The adoption of this amended guidance is not expected to have a material impact on our consolidated financial statements.
In January 2017, the FASB issued ASU No. 2017-01, Business Combinations (Topic 805) : Clarifying the Definition of a Business . The amendments within this ASU narrow the existing definition of a business and provide a more robust framework for evaluating whether a transaction should be accounted for as an acquisition (or disposal) of assets or a business. The definition of a business impacts various areas of accounting, including acquisitions, disposals and goodwill. Under the new guidance, fewer acquisitions are expected to be considered businesses. This ASU is effective for us beginning September 1, 2018, for our fiscal year 2019 and for interim periods within that fiscal year. Early adoption is permitted and the guidance should be applied prospectively to transactions following the adoption date. The adoption of this amended guidance is not expected to have a material impact on our consolidated financial statements.
In November 2016, the FASB issued ASU No. 2016-18, Statement of Cash Flows (Topic 230): Restricted Cash . This ASU is intended to reduce diversity in practice by adding or clarifying guidance on classification and presentation of changes in restricted cash on the Consolidated Statements of Cash Flows. This ASU is effective for us beginning September 1, 2018, for our fiscal year 2019 and for interim periods within that fiscal year. Early adoption is permitted, including in an interim period. The amendments in this ASU should be applied retrospectively to all periods presented. The adoption of this amended guidance is not expected to have a material impact on our Consolidated Statements of Cash Flows.
In August 2016, the FASB issued ASU No. 2016-15, Statement of Cash Flows (Topic 230): Classification of Certain Cash Receipts and Cash Payments. This ASU is intended to reduce existing diversity in practice in how certain cash receipts and payments are presented and classified in the Consolidated Statements of Cash Flows. This ASU is effective for us beginning September 1, 2018, for our fiscal year 2019 and for interim periods within that fiscal year. We are currently evaluating the impact the adoption will have on our Consolidated Statement of Cash Flows.
In June 2016, the FASB issued ASU No. 2016-13, Financial Instruments - Credit Losses (Topic 326) : Measurement of Credit Losses on Financial Instruments . The amendments in this ASU introduce a new approach, based on expected losses, to
7
Table of Contents
estimate credit losses on certain types of financial instruments. This ASU is intended to provide financial statement users with more decision-useful information about the expected credit losses associated with most financial assets measured at amortized cost and certain other instruments, including trade and other receivables, loans, held-to-maturity debt securities, net investments in leases, and off-balance-sheet credit exposures. Entities are required to apply this ASU's provisions as a cumulative-effect adjustment to retained earnings as of the beginning of the first reporting period in which the guidance is adopted. This ASU is effective for us beginning September 1, 2020, for our fiscal year 2021 and for interim periods within that fiscal year. We are currently evaluating the impact the adoption will have on our consolidated financial statements.
In February 2016, the FASB issued ASU No. 2016-02, Leases (Topic 842), which replaces the existing guidance in Accounting Standards Codification ("ASC") 840 - Leases . The amendments within this ASU introduce a lessee model requiring entities to recognize assets and liabilities for most leases, but continue recognizing the associated expenses in a manner similar to existing accounting guidance. This ASU is effective for us beginning September 1, 2019, for our fiscal year 2020 and for interim periods within that fiscal year. We have initiated our assessment of the new lease standard, including the utilization of surveys to gather more information about existing leases and the implementation of a new lease software to improve the collection, maintenance, and aggregation of lease data necessary for the expanded reporting and disclosure requirements under the new lease standard. It is expected that the primary impact upon adoption will be the recognition, on a discounted basis, of our minimum commitments under noncancelable operating leases as right of use assets and obligations on our Consolidated Balance Sheets. This will result in a significant increase in assets and liabilities recorded on our Consolidated Balance Sheets. Although we expect the new lease guidance to have a material impact on our Consolidated Balance Sheets, we are continuing to evaluate the method of adoption and the extent of potential impacts on our consolidated financial statements, processes, and internal controls.
In May 2014, the FASB issued ASU No. 2014-09, Revenue from Contracts with Customers (Topic 606). The amendments within this ASU, as well as within additional clarifying ASUs issued by the FASB, provide a single comprehensive model to be used in the accounting for revenue arising from contracts with customers and supersedes most current revenue recognition guidance, including industry-specific guidance. The new revenue recognition guidance includes a five-step model for the recognition of revenue, including (1) identifying the contract with a customer, (2) identifying the performance obligations in the contract, (3) determining the transaction price, (4) allocating the transaction price to the performance obligations, and (5) recognizing revenue when (or as) an entity satisfies a performance obligation. The adoption of the new revenue recognition guidance will require expanded disclosures in our consolidated financial statements including quantitative disclosure of revenues that fall within and outside the scope of the new revenue recognition guidance. Certain revenue streams are expected to fall within the scope of the new revenue recognition guidance; however, a substantial portion of our revenue falls outside the scope of the new revenue recognition guidance and will continue to follow existing guidance, primarily ASC 815, Derivatives and Hedging . We have completed an initial assessment of our revenue streams and do not believe that the new revenue recognition guidance will have a material impact on our consolidated financial statements. We will complete the final phase of our revenue recognition implementation project during the fourth quarter of fiscal 2018, including the finalization of our revenue recognition accounting policies, expanded disclosures, and position papers. We will adopt ASU No. 2014-09 and the related ASUs using the modified retrospective method on September 1, 2018, in the first quarter of fiscal 2019.
Note 2 Receivables
| May 31, 2018 |
| August 31, 2017 | ||||
| (Dollars in thousands) | ||||||
Trade accounts receivable | $ | 1,505,273 | |
| $ | 1,234,500 | |
CHS Capital notes receivable | 143,038 | |
| 164,807 | | ||
Deferred purchase price receivable | 177,827 | |
| 202,947 | | ||
Other | 589,637 | |
| 493,104 | | ||
| 2,415,775 | |
| 2,095,358 | | ||
Less allowances and reserves | 217,564 | |
| 225,726 | | ||
Total receivables | $ | 2,198,211 | |
| $ | 1,869,632 | |
Trade Accounts
Trade accounts receivable are initially recorded at a selling price, which approximates fair value, upon the sale of goods or services to customers. Subsequently, trade accounts receivable are carried at net realizable value, which includes an
8
Table of Contents
allowance for estimated uncollectible amounts. We calculate this allowance based on our history of write-offs, level of past due accounts, and our relationships with, and the economic status of, our customers.
CHS Capital
Notes Receivable
CHS Capital, LLC ("CHS Capital"), our wholly-owned subsidiary, has short-term notes receivable from commercial and producer borrowers. The short-term notes receivable have maturity terms of 12 months or less and are reported at their outstanding unpaid principal balances, adjusted for the allowance of loan losses, as CHS Capital has the intent and ability to hold the applicable loans for the foreseeable future or until maturity or pay-off. The carrying value of CHS Capital short-term notes receivable approximates fair value, given the notes' short duration and the use of market pricing adjusted for risk.
The notes receivable from commercial borrowers are collateralized by various combinations of mortgages, personal property, accounts and notes receivable, inventories and assignments of certain regional cooperative's capital stock. These loans are primarily originated in the states of Minnesota, Wisconsin and North Dakota. CHS Capital also has loans receivable from producer borrowers which are collateralized by various combinations of growing crops, livestock, inventories, accounts receivable, personal property and supplemental mortgages and are originated in the same states as the commercial notes as well as in Michigan.
In addition to the short-term balances included in the table above, CHS Capital had long-term notes receivable, with durations of generally not more than 10 years , totaling $0.2 million and $17.0 million at May 31, 2018 , and August 31, 2017 , respectively. The long-term notes receivable are included in Other assets on our Consolidated Balance Sheets. As of May 31, 2018 , and August 31, 2017 , the commercial notes represented 6% and 17% , respectively, and the producer notes represented 94% and 83% , respectively, of the total CHS Capital notes receivable.
CHS Capital has commitments to extend credit to customers if there are no violations of any contractually established conditions. As of May 31, 2018 , CHS Capital's customers had additional available credit of $490.0 million .
Allowance for Loan Losses and Impairments
CHS Capital maintains an allowance for loan losses which is the estimate of potential incurred losses inherent in the loans receivable portfolio. In accordance with FASB ASC 450-20, Accounting for Loss Contingencies, and ASC 310-10, Accounting by Creditors for Impairment of a Loan , the allowance for loan losses consists of general and specific components. The general component is based on historical loss experience and qualitative factors addressing operational risks and industry trends. The specific component relates to loans receivable that are classified as impaired. Additions to the allowance for loan losses are reflected within reserve and impairment charges (recoveries), net in the Consolidated Statements of Operations. The portion of loans receivable deemed uncollectible is charged off against the allowance. Recoveries of previously charged off amounts increase the allowance for loan losses. The amount of CHS Capital notes that were past due was not significant at any reporting date presented.
Interest Income
Interest income is recognized on the accrual basis using a method that computes simple interest daily. The accrual of interest on commercial loans receivable is discontinued at the time the commercial loan receivable is 90 days past due unless the credit is well-collateralized and in process of collection. Past due status is based on contractual terms of the loan. Producer loans receivable are placed in non-accrual status based on estimates and analysis due to the annual debt service terms inherent to CHS Capital's producer loans. In all cases, loans are placed in nonaccrual status or charged off at an earlier date if collection of principal or interest is considered doubtful.
Sale of Receivables
Receivables Securitization Facility
On July 18, 2017, we amended an existing receivables and loans securitization facility ("Securitization Facility") with certain unaffiliated financial institutions (the "Purchasers"). Under the Securitization Facility, we and certain of our subsidiaries sell trade accounts and notes receivable (the "Receivables") to Cofina Funding, LLC ("Cofina"), a wholly-owned bankruptcy-remote indirect subsidiary of CHS. Cofina in turn sells the purchased Receivables in their entirety to the Purchasers. Prior to amending the Securitization Facility in July 2017, the transfer of Receivables was accounted for as a secured borrowing. Under
9
Table of Contents
the terms of the amended Securitization Facility CHS accounts for Receivables sold under the Securitization Facility as a sale of financial assets pursuant to ASC 860, Transfers and Servicing and derecognizes the sold Receivables from its Consolidated Balance Sheets.
Sales of Receivables by Cofina occur continuously and are settled with the Purchasers on a monthly basis. The proceeds from the sale of these Receivables comprise a combination of cash and a deferred purchase price ("DPP") receivable. The DPP receivable is ultimately realized by CHS following the collection of the underlying Receivables sold to the Purchasers. The amount available under the Securitization Facility fluctuates over time based on the total amount of eligible Receivables generated during the normal course of business, with maximum availability of $700.0 million . As of May 31, 2018 , the total availability under the Securitization Facility was $592.0 million , of which all was utilized. We use the proceeds from the sale of Receivables under the Securitization Facility for general corporate purposes.
We have no retained interests in the transferred Receivables, other than our right to the DPP receivable and collection and administrative services. The DPP receivable is recorded at fair value within the Consolidated Balance Sheets, including a current portion within receivables and a long-term portion within other assets. Subsequent cash receipts related to the DPP receivable have been reflected as investing activities and additional sales of Receivables under the Securitization Facility are reflected in operating or investing activities, based on the underlying Receivable, in our Consolidated Statements of Cash Flows. Losses incurred on the sale of Receivables are recorded in interest expense and fees received related to the servicing of the Receivables are recorded in other income (loss) in the Consolidated Statements of Operations. We consider the fees received adequate compensation for services rendered, and accordingly have recorded no servicing asset or liability.
The fair value of the DPP receivable is determined by discounting the expected cash flows to be received based on unobservable inputs consisting of the face amount of the Receivables adjusted for anticipated credit losses. The DPP receivable is being measured like an investment in debt securities classified as available for sale, with changes to the fair value being recorded in other comprehensive income in accordance with ASC 320 , Investments - Debt and Equity Securities . Our risk of loss following the transfer of Receivables under the Securitization Facility is limited to the DPP receivable outstanding and any short-falls in collections for specified non-credit related reasons after sale. Payment of the DPP receivable is not subject to significant risks other than delinquencies and credit losses on accounts receivable sold under the Securitization Facility.
The Securitization Facility was set to expire on July 17, 2018; however, we amended the Securitization Facility on June 28, 2018, and the transfer of Receivables will once again be accounted for as a secured borrowing. See Note 14, Subsequent Events , to our unaudited consolidated financial statements for additional information on the June 28, 2018, amendment.
The following table is a reconciliation of the beginning and ending balances of the DPP receivable for the nine months ended May 31, 2018 :
|
| (Dollars in thousands) | ||
Balance - as of August 31, 2017 |
| $ | 548,602 | |
Monthly settlements, net |
| (89,160 | ) | |
Cash collections on DPP |
| (9,612 | ) | |
Fair value adjustment |
| 14,686 | | |
Balance - as of May 31, 2018 |
| $ | 464,516 | |
There was no DPP receivable as of May 31, 2017, and therefore, no comparative period is included in the table above.
Other Receivables
Other receivables are comprised of certain other amounts recorded in the normal course of business, including receivables related to value added taxes and pre-crop financing, primarily to Brazilian farmers, to finance a portion of supplier production costs. We do not bear any of the costs or operational risks associated with the related growing crops. The financing is collateralized by future crops, land and physical assets of the suppliers, carries a local market interest rate and settles when the farmer's crop is harvested and sold.
10
Table of Contents
| May 31, 2018 |
| August 31, 2017 | ||||
| (Dollars in thousands) | ||||||
Grain and oilseed | $ | 1,436,568 | |
| $ | 1,145,285 | |
Energy | 663,111 | |
| 755,886 | | ||
Crop nutrients | 199,246 | |
| 248,699 | | ||
Feed and farm supplies | 479,621 | |
| 353,130 | | ||
Processed grain and oilseed | 152,465 | |
| 49,723 | | ||
Other | 9,896 | |
| 23,862 | | ||
Total inventories | $ | 2,940,907 | |
| $ | 2,576,585 | |
As of May 31, 2018 , we valued approximately 15% of inventories, primarily related to our Energy segment, using the lower of cost, determined on the LIFO method, or net realizable value ( 19% as of August 31, 2017 ). If the FIFO method of accounting had been used, inventories would have been higher than the reported amount by $370.4 million and $ 186.2 million as of May 31, 2018 , and August 31, 2017 , respectively. An actual valuation of inventory under the LIFO method can be made only at the end of each year based on the inventory levels and costs at that time. Interim LIFO calculations are based on management's estimates of expected year-end inventory levels, and are subject to the final year-end LIFO inventory valuation.
Note 4 Investments
| May 31, 2018 |
| August 31, 2017 | ||||
| (Dollars in thousands) | ||||||
Equity method investments: |
|
|
| ||||
CF Industries Nitrogen, LLC | $ | 2,786,806 | |
| $ | 2,756,076 | |
Ventura Foods, LLC | 354,588 | |
| 347,016 | | ||
Ardent Mills, LLC | 205,805 | |
| 206,529 | | ||
TEMCO, LLC | 37,769 | |
| 41,323 | | ||
Other equity method investments | 271,229 | |
| 268,444 | | ||
Cost method investments | 130,966 | |
| 131,605 | | ||
Total investments | $ | 3,787,163 | |
| $ | 3,750,993 | |
Equity Method Investments
Joint ventures and other investments, in which we have significant ownership and influence, but not control, are accounted for in our consolidated financial statements using the equity method of accounting. Our primary equity method investments are described below.
On February 1, 2016, we invested $2.8 billion in CF Industries Nitrogen, LLC ("CF Nitrogen"), commencing our strategic venture with CF Industries Holdings, Inc. ("CF Industries"). The investment consists of an approximate 11% membership interest (based on product tons) in CF Nitrogen. We account for this investment using the hypothetical liquidation at book value method, recognizing our share of the earnings and losses of CF Nitrogen based upon our contractual claims on the entity's net assets pursuant to the liquidation provisions of CF Nitrogen's limited liability company agreement, adjusted for the semi-annual cash distributions we receive as a result of our membership interest in CF Nitrogen. For the three months ended May 31, 2018 , and 2017 , this amount was $35.6 million and $24.5 million , respectively. For the nine months ended May 31, 2018, and 2017, this amount was $80.0 million and $60.8 million , respectively. These amounts are included as equity income from investments in our Nitrogen Production segment.
We have a 50% interest in Ventura Foods, a joint venture which produces and distributes primarily vegetable oil-based products. We account for Ventura Foods as an equity method investment, and as of May 31, 2018 , our carrying value of Ventura Foods exceeded our share of its equity by $12.9 million , which represents equity method goodwill. The earnings are reported as equity income from investments in Corporate and Other.
11
Table of Contents
We have a 12% interest in Ardent Mills, LLC ("Ardent Mills"), a joint venture with Cargill Incorporated ("Cargill") and ConAgra Foods, Inc., which combines the North American flour milling operations of the three parent companies. We account for Ardent Mills as an equity method investment included in Corporate and Other.
TEMCO, LLC ("TEMCO") is owned and governed by Cargill ( 50% ) and CHS ( 50% ). Both owners have committed to sell all of their feedgrains, wheat, oilseeds and by-product origination that are tributary to the Pacific Northwest, United States ("Pacific Northwest") to TEMCO and to use TEMCO as their exclusive export-marketing vehicle for such grains exported through the Pacific Northwest through January 2037. We account for TEMCO as an equity method investment included in our Ag segment.
The following table provides aggregate summarized unaudited financial information for our equity method investments in CF Nitrogen, Ventura Foods and Ardent Mills for the nine months ended May 31, 2018, and 2017:
| For the Nine Months Ended | ||||||
| 2018 |
| 2017 | ||||
| (Dollars in thousands) | ||||||
Net sales | $ | 6,238,495 | |
| $ | 5,807,777 | |
Gross profit | 719,555 | |
| 651,705 | | ||
Net earnings | 435,192 | |
| 317,674 | | ||
Earnings attributable to CHS Inc. | 109,266 | |
| 104,568 | | ||
Note 5 Goodwill and Other Intangible Assets
Goodwill of $152.3 million and $154.1 million as of May 31, 2018 , and August 31, 2017 , respectively, is included in other assets on our Consolidated Balance Sheets. Changes in the net carrying amount of goodwill for the nine months ended May 31, 2018 , by segment, are as follows:
| Energy |
| Ag |
| Corporate |
| Total | ||||||||
| (Dollars in thousands) | ||||||||||||||
Balances, August 31, 2017 | $ | 552 | |
| $ | 142,929 | |
| $ | 10,574 | |
| $ | 154,055 | |
Effect of foreign currency translation adjustments | - | |
| (1,709 | ) |
| - | |
| (1,709 | ) | ||||
Balances, May 31, 2018 | $ | 552 | |
| $ | 141,220 | |
| $ | 10,574 | |
| $ | 152,346 | |
No goodwill has been allocated to our Nitrogen Production segment, which consists solely of our CF Nitrogen investment accounted for using the equity method of accounting.
Intangible assets subject to amortization primarily include customer lists, trademarks and non-compete agreements, and are amortized over their respective useful lives (ranging from 2 to 30 years). Information regarding intangible assets that are included in other assets on our Consolidated Balance Sheets is as follows:
| May 31, |
| August 31, | ||||||||||||||||||||
| Gross Carrying Amount |
| Accumulated Amortization |
| Net |
| Gross Carrying Amount |
| Accumulated Amortization |
| Net | ||||||||||||
| (Dollars in thousands) | ||||||||||||||||||||||
Customer lists | $ | 41,077 | |
| $ | (12,328 | ) |
| $ | 28,749 | |
| $ | 46,180 | |
| $ | (14,695 | ) |
| $ | 31,485 | |
Trademarks and other intangible assets | 6,536 | |
| (4,871 | ) |
| 1,665 | |
| 23,623 | |
| (21,778 | ) |
| 1,845 | | ||||||
Total intangible assets | $ | 47,613 | |
| $ | (17,199 | ) |
| $ | 30,414 | |
| $ | 69,803 | |
| $ | (36,473 | ) |
| $ | 33,330 | |
12
Table of Contents
Total amortization expense for intangible assets during the three and nine months ended May 31, 2018 , was $0.8 million and $2.5 million , respectively. Total amortization expense for intangible assets during the three and nine months ended May 31, 2017, was $1.0 million and $3.3 million , respectively. The estimated annual amortization expense related to intangible assets subject to amortization for the next five years is as follows:
| (Dollars in thousands) | ||
Year 1 | $ | 3,290 | |
Year 2 | 3,125 | | |
Year 3 | 2,981 | | |
Year 4 | 2,856 | | |
Year 5 | 2,671 | | |
Note 6 Notes Payable and Long-Term Debt
Our notes payable and long-term debt are subject to various restrictive requirements for maintenance of minimum consolidated net worth and other financial ratios. We were in compliance with our debt covenants as of May 31, 2018 . The table below summarizes our notes payable as of May 31, 2018 , and 2017.
| May 31, 2018 | | August 31, 2017 | ||||
| (Dollars in thousands) | ||||||
Notes payable | $ | 2,650,859 | | | $ | 1,695,423 | |
CHS Capital notes payable | 168,227 | | | 292,792 | | ||
Total notes payable | $ | 2,819,086 | | | $ | 1,988,215 | |
On May 31, 2018 , our primary line of credit was a five -year, unsecured revolving credit facility with a committed amount of $3.0 billion which expires in September 2020. The outstanding balance on this facility increased to $1.1 billion at May 31, 2018 , from $480.0 million at August 31, 2017 , due to the seasonal nature of our business operations.
Interest expense for the three months ended May 31, 2018 , and 2017, was $49.3 million and $39.2 million , respectively, net of capitalized interest of $1.7 million and $1.6 million , respectively. Interest expense for the nine months ended May 31, 2018 , and 2017, was $130.2 million and $117.4 million , respectively, net of capitalized interest of $4.8 million and $4.7 million , respectively.
13
Table of Contents
Note 7 Equities
Changes in Equities
Changes in equities for the nine months ended May 31, 2018 , are as follows:
| Equity Certificates |
|
|
| Accumulated |
|
|
|
|
|
| ||||||||||||||||||||
| Capital |
| Nonpatronage |
| Nonqualified Equity Certificates |
| Preferred |
|
| Capital |
| Noncontrolling |
| Total | |||||||||||||||||
| (Dollars in thousands) | ||||||||||||||||||||||||||||||
Balance, August 31, 2017 | $ | 3,906,426 | |
| $ | 29,836 | |
| $ | 405,387 | |
| $ | 2,264,038 | |
| $ | (183,670 | ) |
| $ | 1,471,217 | |
| $ | 12,591 | |
| $ | 7,905,825 | |
Reversal of prior year patronage and redemption estimates | 4,270 | |
| - | |
| (126,333 | ) |
| - | |
| - | |
| 126,333 | |
| - | |
| 4,270 | | ||||||||
Distribution of 2017 patronage refunds | - | |
| - | |
| 128,831 | |
| - | |
| - | |
| (128,831 | ) |
| - | |
| - | | ||||||||
Redemptions of equities | (3,814 | ) |
| (86 | ) |
| (369 | ) |
| - | |
| - | |
| - | |
| - | |
| (4,269 | ) | ||||||||
Preferred stock dividends | - | |
| - | |
| - | |
| - | |
| - | |
| (126,501 | ) |
| - | |
| (126,501 | ) | ||||||||
Other, net | (5,999 | ) |
| (113 | ) |
| (381 | ) |
| - | |
| - | |
| 4,517 | |
| (163 | ) |
| (2,139 | ) | ||||||||
Net income (loss) | - | |
| - | |
| - | |
| - | |
| - | |
| 576,090 | |
| (699 | ) |
| 575,391 | | ||||||||
Other comprehensive income (loss), net of tax | - | |
| - | |
| - | |
| - | |
| 13,944 | |
| - | |
| - | |
| 13,944 | | ||||||||
Estimated 2018 cash patronage refunds | - | |
| - | |
| - | |
| - | |
| - | |
| (119,747 | ) |
| - | |
| (119,747 | ) | ||||||||
Estimated 2018 equity redemptions | (84,241 | ) |
| - | |
| - | |
| - | |
| - | |
| - | |
| - | |
| (84,241 | ) | ||||||||
Balance, May 31, 2018 | $ | 3,816,642 | |
| $ | 29,637 | |
| $ | 407,135 | |
| $ | 2,264,038 | |
| $ | (169,726 | ) |
| $ | 1,803,078 | |
| $ | 11,729 | |
| $ | 8,162,533 | |
Accumulated Other Comprehensive Loss
Changes in accumulated other comprehensive income (loss) by component, net of tax, are as follows for the nine months ended May 31, 2018 , and 2017 :
| Pension and Other Postretirement Benefits |
| Unrealized Net Gain on Available for Sale Investments |
| Cash Flow Hedges |
| Foreign Currency Translation Adjustment |
| Total | ||||||||||
| (Dollars in thousands) | ||||||||||||||||||
Balance as of August 31, 2017, net of tax | $ | (135,046 | ) |
| $ | 10,041 | |
| $ | (6,954 | ) |
| $ | (51,711 | ) |
| $ | (183,670 | ) |
Other comprehensive income (loss), before tax: |
|
|
|
|
|
|
|
|
| ||||||||||
Amounts before reclassifications | - | |
| 19,512 | |
| 806 | |
| (9,996 | ) |
| 10,322 | | |||||
Amounts reclassified out | 16,108 | |
| (1,527 | ) |
| 1,279 | |
| (2,042 | ) |
| 13,818 | | |||||
Total other comprehensive income (loss), before tax | 16,108 | |
| 17,985 | |
| 2,085 | |
| (12,038 | ) |
| 24,140 | | |||||
Tax effect | (5,353 | ) |
| (4,505 | ) |
| (613 | ) |
| 275 | |
| (10,196 | ) | |||||
Other comprehensive income (loss), net of tax | 10,755 | |
| 13,480 | |
| 1,472 | |
| (11,763 | ) |
| 13,944 | | |||||
Balance as of May 31, 2018, net of tax | $ | (124,291 | ) |
| $ | 23,521 | |
| $ | (5,482 | ) |
| $ | (63,474 | ) |
| $ | (169,726 | ) |
14
Table of Contents
| Pension and Other Postretirement Benefits |
| Unrealized Net Gain on Available for Sale Investments |
| Cash Flow Hedges |
| Foreign Currency Translation Adjustment |
| Total | ||||||||||
| (Dollars in thousands) | ||||||||||||||||||
Balance as of August 31, 2016, net of tax | $ | (165,146 | ) |
| $ | 5,656 | |
| $ | (9,196 | ) |
| $ | (43,040 | ) |
| $ | (211,726 | ) |
Other comprehensive income (loss), before tax: |
|
|
|
|
|
|
|
|
| ||||||||||
Amounts before reclassifications | (500 | ) |
| 2,637 | |
| 1,920 | |
| (12,537 | ) |
| (8,480 | ) | |||||
Amounts reclassified out | 17,679 | |
| - | |
| 1,311 | |
| 15 | |
| 19,005 | | |||||
Total other comprehensive income (loss), before tax | 17,179 | |
| 2,637 | |
| 3,231 | |
| (12,522 | ) |
| 10,525 | | |||||
Tax effect | (6,580 | ) |
| (1,010 | ) |
| (1,238 | ) |
| 329 | |
| (8,499 | ) | |||||
Other comprehensive income (loss), net of tax | 10,599 | |
| 1,627 | |
| 1,993 | |
| (12,193 | ) |
| 2,026 | | |||||
Balance as of May 31, 2017, net of tax | $ | (154,547 | ) |
| $ | 7,283 | |
| $ | (7,203 | ) |
| $ | (55,233 | ) |
| $ | (209,700 | ) |
Amounts reclassified from accumulated other comprehensive income (loss) were primarily related to pension and other post-retirement benefits. Pension and other post-retirement reclassifications include amortization of net actuarial loss, prior service credit and transition amounts and are recorded as marketing, general and administrative expenses (see Note 9, Benefit Plans for further information).
Note 8 Income Taxes
During the third quarter of fiscal 2018, we recorded a $15.5 million impairment of income tax receivables related to Brazilian tax legislation enacted on May 30, 2018, which restricts our ability to utilize our Brazilian income tax credits. We also recorded current tax expense of $21.3 million related to the sale of certain assets, and $10.0 million stemming from CHS Inc.'s performance of guarantees to its Brazilian subsidiary for a fiscal 2017 loss.
The third quarter of fiscal 2018 tax costs described above were more than offset by the deferred tax benefit from the revaluation of our U.S. net deferred tax liability as a result of the Tax Act recognized in the second quarter of fiscal 2018, which is the primary contributor to our tax benefit position for the nine months ended May 31, 2018, within the Consolidated Statements of Operations.
On December 22, 2017, the Tax Act was enacted into law. The Tax Act provides for significant U.S. tax law changes and reduces the federal corporate statutory tax rate from 35% to 21% as of January 1, 2018. As a fiscal year-end taxpayer, our annual statutory federal corporate tax rate applicable to fiscal 2018 is a blended rate of 25.7% . Beginning in fiscal 2019, the annual statutory federal corporate tax rate will be 21% .
The Tax Act also requires companies to pay a one-time repatriation tax on certain unrepatriated earnings of foreign subsidiaries that were previously tax deferred ("transition tax"), and creates new taxes on certain foreign sourced earnings. Foreign taxes historically have not had a material impact on our consolidated financial statements, and the foreign impacts of the Tax Act are discussed below.
The Tax Act initially repealed the Domestic Production Activities Deduction ("DPAD") and enacted the Deduction for Qualified Business Income of Pass-Thru Entities ("QBI Deduction"); however, the Consolidated Appropriations Act, 2018 (the "Appropriations Act") enacted into law on March 23, 2018, impacted these deductions. The Appropriations Act modifies the QBI deduction under Sec. 199A of the Tax Act to reenact DPAD for agricultural and horticultural cooperatives as it existed prior to the enactment of the Tax Act, and it also modifies the QBI deduction available to cooperative patrons as enacted by the Tax Act. All references to the Tax Act below include the modifications introduced by the Appropriations Act.
On December 22, 2017, the SEC issued Staff Accounting Bulletin 118 ("SAB 118") which provides guidance on accounting for the effects of the Tax Act. SAB 118 provides for a measurement period of up to one year from the Tax Act's enactment date for companies to complete their accounting under ASC 740, Income Taxes . In accordance with SAB 118, to the extent that a company's accounting for certain income tax effects of the Tax Act is incomplete but it is able to determine a reasonable estimate, it must record a provisional estimate in its financial statements. If a company cannot determine a provisional estimate to be included in its financial statements, it should continue to apply ASC 740 on the basis of the provisions of the tax laws that were in effect immediately before the enactment of the Tax Act.
15
Table of Contents
As of May 31, 2018, we have not finalized our work associated with the income tax effects of the enactment of the Tax Act; however, we have made a reasonable estimate of the effects on our existing deferred tax balances, and believe there will be no significant additional tax expense as a result of the one-time transition tax.
Our income tax provision for the nine months ended May 31, 2018, reflects the current year impacts of the Tax Act on the estimated annual effective tax rate and a discrete provisional net benefit of $133.6 million from the revaluation of our U.S. net deferred tax liability resulting directly from the enactment of the Tax Act based on information available, prepared, or analyzed as of the date of this report.
Deferred Tax Assets and Liabilities
We remeasured our existing U.S. deferred tax assets and liabilities based on the rates at which they are expected to reverse in the future, of which the federal component is approximately 25.7% for reversals expected in fiscal 2018 and 21.0% thereafter. The calculation cannot be completed until all of the underlying timing differences as of August 31, 2018, are known and we are still analyzing certain aspects of the Tax Act and refining our calculations. As we complete our work and refine our calculations, any changes may give rise to new or additional deferred tax amounts. Specifically, we are now subject to the employee compensation deduction limitations under Internal Revenue Code Section 162(m), and we are evaluating whether our written binding employment contacts are exempted under the Tax Act's Section 162(m) transition rule. Additional guidance from the IRS is necessary to ascertain the scope of the transition rule.
Foreign Tax Effects
To determine the amount of the transition tax, we must determine, in addition to other factors, the amount of post-1986 accumulated and current earnings and profits of our relevant subsidiaries as well as the amount of non-U.S. income taxes paid on such earnings. We are able to make a reasonable estimate of the transition tax and recorded no provisional tax liability. However, we continue to gather additional information and will refine the amount if necessary.
We continue to review the anticipated impacts of global intangible low-taxed income ("GILTI"), including whether we should account for its tax effects as an in-period or deferred tax expense. Due to the complexity of the GILTI tax rules and the dependency upon future results of our global operations and our global structure, we are unable to make a reasonable estimate of this provision and consequently we haven't decided how to treat the deferred taxes associated with GILTI. Accordingly, we have not recorded any impact associated with GILTI in the tax rate during the three months ended May 31, 2018.
16
Table of Contents
Note 9 Benefit Plans
We have various pension and other defined benefit and defined contribution plans, in which substantially all employees may participate. We also have non-qualified supplemental executive and Board retirement plans.
Components of net periodic benefit costs for the three and nine months ended May 31, 2018 , and 2017 , are as follows:
| Qualified Pension Benefits |
| Non-Qualified Pension Benefits |
| Other Benefits | ||||||||||||||||||
| 2018 |
| 2017 |
| 2018 |
| 2017 |
| 2018 |
| 2017 | ||||||||||||
Components of net periodic benefit costs for the three months ended May 31 are as follows: | (Dollars in thousands) | ||||||||||||||||||||||
Service cost | $ | 9,920 | |
| $ | 10,537 | |
| $ | 137 | |
| $ | 302 | |
| $ | 236 | |
| $ | 290 | |
Interest cost | 5,997 | |
| 5,753 | |
| 177 | |
| 210 | |
| 227 | |
| 232 | | ||||||
Expected return on assets | (12,044 | ) |
| (12,058 | ) |
| - | |
| - | |
| - | |
| - | | ||||||
Prior service cost (credit) amortization | 360 | |
| 385 | |
| 7 | |
| 4 | |
| (142 | ) |
| (141 | ) | ||||||
Actuarial (gain) loss amortization | 4,905 | |
| 5,708 | |
| 16 | |
| 136 | |
| (306 | ) |
| (199 | ) | ||||||
Net periodic benefit cost | $ | 9,138 | |
| $ | 10,325 | |
| $ | 337 | |
| $ | 652 | |
| $ | 15 | |
| $ | 182 | |
Components of net periodic benefit costs for the nine months ended May 31 are as follows: |
| ||||||||||||||||||||||
Service cost | $ | 29,758 | |
| $ | 31,612 | |
| $ | 411 | |
| $ | 905 | |
| $ | 707 | |
| $ | 870 | |
Interest cost | 17,988 | |
| 17,257 | |
| 533 | |
| 632 | |
| 681 | |
| 698 | | ||||||
Expected return on assets | (36,133 | ) |
| (36,173 | ) |
| - | |
| - | |
| - | |
| - | | ||||||
Prior service cost (credit) amortization | 1,078 | |
| 1,155 | |
| 23 | |
| 14 | |
| (424 | ) |
| (424 | ) | ||||||
Actuarial (gain) loss amortization | 16,304 | |
| 17,123 | |
| 46 | |
| 409 | |
| (918 | ) |
| (598 | ) | ||||||
Net periodic benefit cost | $ | 28,995 | |
| $ | 30,974 | |
| $ | 1,013 | |
| $ | 1,960 | |
| $ | 46 | |
| $ | 546 | |
Employer Contributions
Total contributions to be made during fiscal 2018 will depend primarily on market returns on the pension plan assets and minimum funding level requirements. During the nine months ended May 31, 2018 , we made no contributions to the pension plans. At this time, we do not anticipate being required to make a contribution for our benefit plans in fiscal 2018.
Note 10 Segment Reporting
We define our operating segments in accordance with ASC Topic 280, Segment Reporting , to reflect the manner in which our chief operating decision maker, our Chief Executive Officer, evaluates performance and allocates resources in managing our business. We have aggregated those operating segments into three reportable segments: Energy, Ag and Nitrogen Production.
Our Energy segment produces and provides primarily for the wholesale distribution of petroleum products and transportation of those products. Our Ag segment purchases and further processes or resells grains and oilseeds originated by our country operations business, by our member cooperatives and by third parties; serves as a wholesaler and retailer of crop inputs; and produces and markets ethanol. Our Nitrogen Production segment consists solely of our equity method investment in CF Nitrogen, which entitles us, pursuant to a supply agreement that we entered into with CF Nitrogen, to purchase up to a specified annual quantity of granular urea and urea ammonium nitrate annually from CF Nitrogen. Insignificant operating segments, including our equity method investment in Ventura Foods have been aggregated within Corporate and Other. Prior to becoming an insignificant operating segment, our investment in Ventura Foods previously constituted our Foods segment. Reported segment results and balances for prior periods have been revised to reflect the aggregation of our equity method investment in Ventura Foods within Corporate and Other. No changes were made to the Ag, Energy, or Nitrogen Production segments as a result of the aggregation of our Foods segment.
17
Table of Contents
Corporate administrative expenses and interest are allocated to each business segment, and Corporate and Other, based on direct usage for services, such as information technology and legal, and other factors or considerations relevant to the costs incurred.
Many of our business activities are highly seasonal and operating results vary throughout the year. For example, in our Ag segment, our crop nutrients and country operations businesses generally experience higher volumes and income during the spring planting season and in the fall, which corresponds to harvest. Our grain marketing operations are also subject to fluctuations in volume and earnings based on producer harvests, world grain prices and demand. Our Energy segment generally experiences higher volumes and profitability in certain operating areas, such as refined products, in the summer and early fall when gasoline and diesel fuel usage is highest and is subject to global supply and demand forces. Other energy products, such as propane, may experience higher volumes and profitability during the winter heating and fall crop drying seasons.
Our revenues, assets and cash flows can be significantly affected by global trade and associated market prices for commodities such as petroleum products, natural gas, ethanol, grains, oilseeds, crop nutrients and flour. Changes in market prices for commodities that we purchase without a corresponding change in the selling prices of those products can affect revenues and operating earnings. Commodity prices are affected by a wide range of factors beyond our control, including the weather, crop damage due to disease or insects, drought, the availability and adequacy of supply, government regulations and policies, world events, and general political and economic conditions.
While our revenues and operating results are derived from businesses and operations which are wholly owned and majority owned, a portion of our business operations are conducted through companies in which we hold ownership interests of 50% or less and do not control the operations. See Note 4, Investments for more information on these entities.
Reconciling Amounts represent the elimination of revenues and interest between segments. Such transactions are executed at market prices to more accurately evaluate the profitability of the individual business segments.
| Energy |
| Ag |
| Nitrogen Production |
| Corporate |
| Reconciling |
| Total | ||||||||||||
For the Three Months Ended May 31, 2018: | (Dollars in thousands) | ||||||||||||||||||||||
Revenues | $ | 2,009,907 | | | $ | 7,125,024 | | | $ | - | |
| $ | 14,074 | | | $ | (121,480 | ) | | $ | 9,027,525 | |
Operating earnings (loss) | 31,525 | | | 115,052 | | | (4,153 | ) |
| (1,580 | ) | | - | | | 140,844 | | ||||||
(Gain) loss on disposal of business | (65,903 | ) |
| 5 | |
| - | |
| (58,152 | ) |
| - | |
| (124,050 | ) | ||||||
Interest expense | 3,496 | | | 28,854 | | | 13,119 | |
| 4,324 | | | (453 | ) | | 49,340 | | ||||||
Other (income) loss | (472 | ) |
| (13,891 | ) |
| (441 | ) |
| (271 | ) |
| 453 | |
| (14,622 | ) | ||||||
Equity (income) loss from investments | (967 | ) | | (11,359 | ) | | (35,639 | ) |
| (11,343 | ) | | - | | | (59,308 | ) | ||||||
Income (loss) before income taxes | $ | 95,371 | | | $ | 111,443 | | | $ | 18,808 | |
| $ | 63,862 | | | $ | - | | | $ | 289,484 | |
Intersegment revenues | $ | (116,286 | ) | | $ | (3,784 | ) | | $ | - | |
| $ | (1,410 | ) | | $ | 121,480 | | | $ | - | |
|
|
|
|
|
|
|
|
|
|
|
| ||||||||||||
| Energy |
| Ag |
| Nitrogen Production |
| Corporate |
| Reconciling |
| Total | ||||||||||||
For the Three Months Ended May 31, 2017: | (Dollars in thousands) | ||||||||||||||||||||||
Revenues | $ | 1,638,107 | |
| $ | 7,053,991 | |
| $ | - | |
| $ | 26,820 | |
| $ | (104,828 | ) |
| $ | 8,614,090 | |
Operating earnings (loss) | (5,723 | ) |
| (226,668 | ) |
| (5,619 | ) |
| 7,713 | |
| - | |
| (230,297 | ) | ||||||
Interest expense | 4,343 | |
| 16,609 | |
| 10,708 | |
| 8,127 | |
| (586 | ) |
| 39,201 | | ||||||
Other (income) loss | (332 | ) |
| (12,886 | ) |
| (477 | ) |
| 1,162 | |
| 586 | |
| (11,947 | ) | ||||||
Equity (income) loss from investments | (391 | ) |
| (9,199 | ) |
| (24,534 | ) |
| (14,269 | ) |
| - | |
| (48,393 | ) | ||||||
Income (loss) before income taxes | $ | (9,343 | ) |
| $ | (221,192 | ) |
| $ | 8,684 | |
| $ | 12,693 | |
| $ | - | |
| $ | (209,158 | ) |
Intersegment revenues | $ | (97,876 | ) |
| $ | (7,545 | ) |
| $ | - | |
| $ | 593 | |
| $ | 104,828 | |
| $ | - | |
|
|
|
|
|
|
|
|
|
|
|
| ||||||||||||
18
Table of Contents
| Energy |
| Ag |
| Nitrogen Production |
| Corporate |
| Reconciling |
| Total | ||||||||||||
For the Nine Months Ended May 31, 2018: | (Dollars in thousands) | ||||||||||||||||||||||
Revenues | $ | 5,878,657 | |
| $ | 18,375,507 | |
| $ | - | |
| $ | 46,018 | |
| $ | (372,674 | ) |
| $ | 23,927,508 | |
Operating earnings (loss) | 159,070 | |
| 145,907 | |
| (14,527 | ) |
| (5,608 | ) |
| - | |
| 284,842 | | ||||||
(Gain) loss on disposal of business | (65,903 | ) |
| (7,700 | ) |
| - | |
| (58,152 | ) |
| - | |
| (131,755 | ) | ||||||
Interest expense | 11,760 | |
| 69,242 | |
| 39,067 | |
| 11,569 | |
| (1,420 | ) |
| 130,218 | | ||||||
Other (income) loss | (1,492 | ) |
| (45,511 | ) |
| (2,612 | ) |
| (2,805 | ) |
| 1,420 | |
| (51,000 | ) | ||||||
Equity (income) loss from investments | (2,779 | ) |
| (25,180 | ) |
| (79,986 | ) |
| (29,166 | ) |
| - | |
| (137,111 | ) | ||||||
Income (loss) before income taxes | $ | 217,484 | |
| $ | 155,056 | |
| $ | 29,004 | |
| $ | 72,946 | |
| $ | - | |
| $ | 474,490 | |
Intersegment revenues | $ | (355,099 | ) |
| $ | (11,391 | ) |
| $ | - | |
| $ | (6,184 | ) |
| $ | 372,674 | |
| $ | - | |
Total assets at May 31, 2018 | $ | 4,208,214 | |
| $ | 7,510,962 | |
| $ | 2,810,256 | |
| $ | 2,406,347 | |
| $ | - | |
| $ | 16,935,779 | |
|
|
|
|
|
|
|
|
|
|
|
| ||||||||||||
| Energy |
| Ag |
| Nitrogen Production |
| Corporate |
| Reconciling |
| Total | ||||||||||||
For the Nine Months Ended May 31, 2017: | (Dollars in thousands) | ||||||||||||||||||||||
Revenues | $ | 4,867,321 | |
| $ | 19,345,316 | |
| $ | - | |
| $ | 85,691 | |
| $ | (315,582 | ) |
| $ | 23,982,746 | |
Operating earnings (loss) | 86,563 | |
| (131,363 | ) |
| (14,033 | ) |
| 25,534 | |
| - | |
| (33,299 | ) | ||||||
Interest expense | 12,176 | |
| 49,798 | |
| 35,626 | |
| 27,512 | |
| (7,701 | ) |
| 117,411 | | ||||||
Other (income) loss | (828 | ) |
| (41,801 | ) |
| (30,047 | ) |
| (1,208 | ) |
| 7,701 | |
| (66,183 | ) | ||||||
Equity (income) loss from investments | (2,039 | ) |
| (18,071 | ) |
| (60,787 | ) |
| (43,624 | ) |
| - | |
| (124,521 | ) | ||||||
Income (loss) before income taxes | $ | 77,254 | |
| $ | (121,289 | ) |
| $ | 41,175 | |
| $ | 42,854 | |
| $ | - | |
| $ | 39,994 | |
Intersegment revenues | $ | (297,057 | ) |
| $ | (16,068 | ) |
| $ | - | |
| $ | (2,457 | ) |
| $ | 315,582 | |
| $ | - | |
Note 11 Derivative Financial Instruments and Hedging Activities
Our derivative instruments primarily consist of commodity and freight futures and forward contracts and, to a lesser degree, may include foreign currency and interest rate swap contracts. These contracts are economic hedges of price risk, but we do not apply hedge accounting under ASC Topic 815, Derivatives and Hedging , except with respect to certain interest rate swap contracts which are accounted for as fair value hedges. Derivative instruments are recorded on our Consolidated Balance Sheets at fair value as described in Note 12, Fair Value Measurements .
19
Table of Contents
Derivatives Not Designated as Hedging Instruments
The following tables present the gross fair values of derivative assets, derivative liabilities, and margin deposits (cash collateral) for derivatives not accounted for as hedging instruments, recorded on our Consolidated Balance Sheets along with the related amounts permitted to be offset in accordance with U.S. GAAP. We have elected not to offset derivative assets and liabilities when we have the right of offset under ASC Topic 210-20, Balance Sheet - Offsetting ; or when the instruments are subject to master netting arrangements under ASC Topic 815-10-45, Derivatives and Hedging - Overall .
| May 31, 2018 | ||||||||||||||
|
|
| Amounts Not Offset on the Consolidated Balance Sheet but Eligible for Offsetting |
|
| ||||||||||
| Gross Amounts Recognized |
| Cash Collateral |
| Derivative Instruments |
| Net Amounts | ||||||||
| (Dollars in thousands) | ||||||||||||||
Derivative Assets: |
|
|
|
|
|
|
| ||||||||
Commodity and freight derivatives | $ | 473,418 | |
| $ | - | |
| $ | 33,979 | |
| $ | 439,439 | |
Foreign exchange derivatives | 9,298 | |
| - | |
| 5,814 | |
| 3,484 | | ||||
Embedded derivative asset | 23,145 | |
| - | |
| - | |
| 23,145 | | ||||
Total | $ | 505,861 | |
| $ | - | |
| $ | 39,793 | |
| $ | 466,068 | |
Derivative Liabilities: |
|
|
|
|
|
|
| ||||||||
Commodity and freight derivatives | $ | 330,364 | |
| $ | 4,063 | |
| $ | 33,979 | |
| $ | 292,322 | |
Foreign exchange derivatives | 23,084 | |
| - | |
| 5,814 | |
| 17,270 | | ||||
Interest rate derivatives - non-hedge | 3 | |
| - | |
| - | |
| 3 | | ||||
Total | $ | 353,451 | |
| $ | 4,063 | |
| $ | 39,793 | |
| $ | 309,595 | |
| August 31, 2017 | ||||||||||||||
|
|
| Amounts Not Offset on the Consolidated Balance Sheet but Eligible for Offsetting |
|
| ||||||||||
| Gross Amounts Recognized |
| Cash Collateral |
| Derivative Instruments |
| Net Amounts | ||||||||
| (Dollars in thousands) | ||||||||||||||
Derivative Assets: |
|
|
|
|
|
|
| ||||||||
Commodity and freight derivatives | $ | 384,648 | |
| $ | - | |
| $ | 35,080 | |
| $ | 349,568 | |
Foreign exchange derivatives | 8,771 | |
| - | |
| 3,636 | |
| 5,135 | | ||||
Embedded derivative asset | 25,533 | |
| - | |
| - | |
| 25,533 | | ||||
Total | $ | 418,952 | |
| $ | - | |
| $ | 38,716 | |
| $ | 380,236 | |
Derivative Liabilities: |
|
|
|
|
|
|
| ||||||||
Commodity and freight derivatives | $ | 309,762 | |
| $ | 3,898 | |
| $ | 35,080 | |
| $ | 270,784 | |
Foreign exchange derivatives | 19,931 | |
| - | |
| 3,636 | |
| 16,295 | | ||||
Total | $ | 329,693 | |
| $ | 3,898 | |
| $ | 38,716 | |
| $ | 287,079 | |
Derivative assets and liabilities with maturities of 12 months or less are recorded in derivative assets and derivative liabilities, respectively, on the Consolidated Balance Sheets. Derivative assets and liabilities with maturities greater than 12 months are recorded in other assets and other liabilities, respectively, on the Consolidated Balance Sheets. The amount of long-term derivative assets and liabilities recorded on the Consolidated Balance Sheet at May 31, 2018 , were $22.1 million and $17.3 million , respectively. The amount of long-term derivative assets and liabilities recorded on the Consolidated Balance Sheet at August 31, 2017, were $186.9 million and $13.7 million , respectively.
20
Table of Contents
The following table sets forth the pretax gains (losses) on derivatives not accounted for as hedging instruments that have been included in our Consolidated Statements of Operations for the three and nine months ended May 31, 2018 , and 2017 .
|
|
| For the Three Months Ended |
| For the Nine Months Ended | ||||||||||||
| Location of Gain (Loss) |
| 2018 |
| 2017 |
| 2018 |
| 2017 | ||||||||
|
|
| (Dollars in thousands) | ||||||||||||||
Commodity and freight derivatives | Cost of goods sold |
| $ | 68,813 | |
| $ | 102,327 | |
| $ | 254 | |
| $ | 177,633 | |
Foreign exchange derivatives | Cost of goods sold |
| (16,549 | ) |
| (7,168 | ) |
| (15,600 | ) |
| (4,573 | ) | ||||
Foreign exchange derivatives | Marketing, general and administrative |
| (1,109 | ) |
| 22 | |
| (1,260 | ) |
| (784 | ) | ||||
Interest rate derivatives | Interest expense |
| (2 | ) |
| - | |
| (3 | ) |
| 4 | | ||||
Embedded derivative | Other income |
| 441 | |
| 477 | |
| 2,612 | |
| 30,051 | | ||||
Total |
| $ | 51,594 | |
| $ | 95,658 | |
| $ | (13,997 | ) |
| $ | 202,331 | | |
Commodity and Freight Contracts
As of May 31, 2018 , and August 31, 2017 , we had outstanding commodity futures, options and freight contracts that were used as economic hedges, as well as fixed-price forward contracts related to physical purchases and sales of commodities. The table below presents the notional volumes for all outstanding commodity and freight contracts accounted for as derivative instruments.
| May 31, 2018 |
| August 31, 2017 | ||||||||
| Long |
| Short |
| Long |
| Short | ||||
| (Units in thousands) | ||||||||||
Grain and oilseed - bushels | 852,993 | |
| 1,097,748 | |
| 570,673 | |
| 768,540 | |
Energy products - barrels | 18,425 | |
| 12,383 | |
| 15,072 | |
| 18,252 | |
Processed grain and oilseed - tons | 426 | |
| 2,403 | |
| 299 | |
| 2,347 | |
Crop nutrients - tons | 26 | |
| 42 | |
| 9 | |
| 15 | |
Ocean and barge freight - metric tons | 5,531 | |
| 2,883 | |
| 2,777 | |
| 1,766 | |
Rail freight - rail cars | 166 | |
| 52 | |
| 176 | |
| 75 | |
Natural gas - MMBtu | 1,220 | |
| - | |
| 500 | |
| - | |
Foreign Exchange Contracts
We are exposed to risk regarding foreign currency fluctuations even though a substantial amount of our international sales are denominated in U.S. dollars. In addition to specific transactional exposure, foreign currency fluctuations can impact the ability of foreign buyers to purchase U.S. agricultural products and the competitiveness of U.S. agricultural products compared to the same products offered by alternative sources of world supply. From time to time, we enter into foreign currency hedge contracts to minimize the impact of currency fluctuations on our transactional exposures. The notional amounts of our foreign exchange derivative contracts were $934.5 million and $776.7 million as of May 31, 2018 , and August 31, 2017 , respectively.
Embedded Derivative Asset
Under the terms of our strategic investment in CF Nitrogen, if CF Industries' credit rating is reduced below certain levels by two of three specified credit ratings agencies, we are entitled to receive a non-refundable annual payment of $5.0 million from CF Industries in November of each year until the date that CF Industries' credit rating is upgraded to or above certain levels by two of the three specified credit ratings agencies or February 1, 2026, whichever is earlier.
During the first quarter of fiscal 2017, CF Industries' credit rating was reduced below the specified levels and we received a $5.0 million payment from CF Industries, which was recorded as a gain in our Consolidated Statement of Operations. We also recorded an embedded derivative asset of $24.1 million on our Consolidated Balance Sheet and a corresponding gain in our Consolidated Statement of Operations for the fair value of the embedded derivative asset during the three months ended November 30, 2016. During the first quarter of fiscal 2018, we received a second $5.0 million payment
21
Table of Contents
from CF Industries. The fair value of the embedded derivative asset recorded on our Consolidated Balance Sheet as of May 31, 2018 , was equal to $23.1 million . The current and long-term portions of the embedded derivative asset are included in derivative assets and other assets on our Consolidated Balance Sheets, respectively. See Note 12, Fair Value Measurements for more information on the valuation of the embedded derivative asset.
Derivatives Designated as Fair Value Hedging Strategies
As of May 31, 2018 , and August 31, 2017 , we had outstanding interest rate swaps with an aggregate notional amount of $495.0 million designated as fair value hedges of portions of our fixed-rate debt that is due between fiscal 2019 and fiscal 2025. Our objective in entering into these transactions is to offset changes in the fair value of the debt associated with the risk of variability in the three-month U.S. dollar LIBOR interest rate ("LIBOR"), in essence converting the fixed-rate debt to variable-rate debt. Under these interest rate swaps, we receive fixed-rate interest payments and make interest payments based on the three-month LIBOR. Offsetting changes in the fair values of both the swap instruments and the hedged debt are recorded contemporaneously each period and only create an impact to earnings to the extent that the hedge is ineffective.
The following table presents the fair value of our derivative instruments designated as fair value hedges and the line items on our Consolidated Balance Sheets in which they are recorded.
|
|
|
| Derivative Assets |
|
|
| Derivative Liabilities | ||||||||||||
Fair Value Hedges |
| Balance Sheet Location |
| May 31, 2018 |
| August 31, 2017 |
| Balance Sheet Location |
| May 31, 2018 |
| August 31, 2017 | ||||||||
|
|
|
| (Dollars in thousands) |
|
|
| (Dollars in thousands) | ||||||||||||
Interest rate swaps |
| Other assets |
| $ | - | |
| $ | 9,978 | |
| Other liabilities |
| $ | 8,847 | |
| $ | 707 | |
The following table sets forth the pretax gains (losses) on derivatives accounted for as hedging instruments that have been included in our Consolidated Statements of Operations for the three and nine months ended May 31, 2018 , and 2017 .
|
|
|
| For the Three Months Ended May 31, |
| For the Nine Months Ended May 31, | ||||||||||||
Gain (Loss) on Fair Value Hedging Relationships: |
| Location of Gain (Loss) |
| 2018 |
| 2017 |
| 2018 |
| 2017 | ||||||||
|
|
|
| (Dollars in thousands) | ||||||||||||||
Interest rate swaps |
| Interest expense |
| $ | (231 | ) |
| $ | 3,750 | |
| $ | (18,118 | ) |
| $ | (13,764 | ) |
Hedged item |
| Interest expense |
| 231 | |
| (3,750 | ) |
| 18,118 | |
| 13,764 | | ||||
Total |
| $ | - | |
| $ | - | |
| $ | - | |
| $ | - | | ||
The following table provides the location and carrying amount of hedged liabilities in our Consolidated Balance Sheets as of May 31, 2018 , and August 31, 2017 .
|
| May 31, 2018 |
| August 31, 2017 | ||||||||||||
Balance Sheet Location |
| Carrying Amount of Hedged Liabilities |
| Cumulative Amount of Fair Value Hedging Adjustments Included in the Carrying Amount of Hedged Liabilities |
| Carrying Amount of Hedged Liabilities |
| Cumulative Amount of Fair Value Hedging Adjustments Included in the Carrying Amount of Hedged Liabilities | ||||||||
|
| (Dollars in thousands) | ||||||||||||||
Long-term debt |
| $ | 486,153 | |
| $ | 8,847 | |
| $ | 504,271 | |
| $ | (9,271 | ) |
22
Table of Contents
Note 12 Fair Value Measurements
ASC Topic 820, Fair Value Measurements and Disclosures defines fair value as the price that would be received for an asset or paid to transfer a liability (an exit price) in the principal or most advantageous market for the asset or liability in an orderly transaction between market participants on the measurement date. The standard also establishes a hierarchy for inputs used in measuring fair value, which requires an entity to maximize the use of observable inputs and minimize the use of unobservable inputs when measuring fair value. Observable inputs are inputs or market data that a market participant would obtain from independent sources to value the asset or liability. Unobservable inputs are inputs that reflect our assumptions about the factors market participants would use in valuing the asset or liability developed based upon the best information available in the circumstances. The fair value hierarchy consists of three levels. Level 1 inputs are quoted prices (unadjusted) in active markets for identical assets or liabilities. Level 2 inputs include quoted prices for similar assets or liabilities in active markets, quoted prices for identical or similar assets or liabilities in markets that are not active, and inputs (other than quoted prices) that are observable for the asset or liability, either directly or indirectly. Level 3 inputs are unobservable inputs for the asset or liability. Categorization within the valuation hierarchy is based upon the lowest level of input that is significant to the fair value measurement.
Recurring fair value measurements at May 31, 2018 , and August 31, 2017 , are as follows:
| May 31, 2018 | ||||||||||||||
| Quoted Prices in Active Markets for Identical Assets (Level 1) |
| Significant Other Observable Inputs (Level 2) |
| Significant Unobservable Inputs (Level 3) |
| Total | ||||||||
| (Dollars in thousands) | ||||||||||||||
Assets: |
| |
|
| |
|
| |
|
| | ||||
Commodity and freight derivatives | $ | 44,456 | |
| $ | 428,962 | |
| $ | - | |
| $ | 473,418 | |
Foreign currency derivatives | - | |
| 9,298 | |
| - | |
| 9,298 | | ||||
Deferred compensation assets | 38,765 | |
| - | |
| - | |
| 38,765 | | ||||
Deferred purchase price receivable | - | |
| - | |
| 464,516 | |
| 464,516 | | ||||
Embedded derivative asset | - | |
| 23,145 | |
| - | |
| 23,145 | | ||||
Other assets | 16,783 | |
| - | |
| - | |
| 16,783 | | ||||
Total | $ | 100,004 | |
| $ | 461,405 | |
| $ | 464,516 | |
| $ | 1,025,925 | |
Liabilities: |
| |
|
| |
|
|
|
| | |||||
Commodity and freight derivatives | $ | 37,294 | |
| $ | 293,070 | |
| $ | - | |
| $ | 330,364 | |
Foreign currency derivatives | - | |
| 23,084 | |
| - | |
| 23,084 | | ||||
Interest rate swap derivatives | 3 | |
| 8,847 | |
| - | |
| 8,850 | | ||||
Total | $ | 37,297 | |
| $ | 325,001 | |
| $ | - | |
| $ | 362,298 | |
23
Table of Contents
| August 31, 2017 | ||||||||||||||
| Quoted Prices in Active Markets for Identical Assets (Level 1) |
| Significant Other Observable Inputs (Level 2) |
| Significant Unobservable Inputs (Level 3) |
| Total | ||||||||
| (Dollars in thousands) | ||||||||||||||
Assets: |
|
|
|
|
|
|
| ||||||||
Commodity and freight derivatives | $ | 48,491 | |
| $ | 336,157 | |
| $ | - | |
| $ | 384,648 | |
Foreign currency derivatives | - | |
| 8,771 | |
| - | |
| 8,771 | | ||||
Interest rate swap derivatives | - | |
| 9,978 | |
| - | |
| 9,978 | | ||||
Deferred compensation assets | 52,414 | |
| - | |
| - | |
| 52,414 | | ||||
Deferred purchase price receivable | - | |
| - | |
| 548,602 | |
| 548,602 | | ||||
Embedded derivative asset | - | |
| 25,533 | |
| - | |
| 25,533 | | ||||
Other assets | 14,846 | |
| - | |
| - | |
| 14,846 | | ||||
Total | $ | 115,751 | |
| $ | 380,439 | |
| $ | 548,602 | |
| $ | 1,044,792 | |
Liabilities: |
|
|
|
|
|
|
| ||||||||
Commodity and freight derivatives | $ | 31,189 | |
| $ | 278,573 | |
| $ | - | |
| $ | 309,762 | |
Foreign currency derivatives | - | |
| 19,931 | |
| - | |
| 19,931 | | ||||
Interest rate swap derivatives | - | |
| 707 | |
| - | |
| 707 | | ||||
Total | $ | 31,189 | |
| $ | 299,211 | |
| $ | - | |
| $ | 330,400 | |
Commodity, freight and foreign currency derivatives - Exchange-traded futures and options contracts are valued based on unadjusted quoted prices in active markets and are classified within Level 1. Our forward commodity purchase and sales contracts with fixed-price components, ocean freight contracts and other over-the-counter ("OTC") derivatives are determined using inputs that are generally based on exchange traded prices and/or recent market bids and offers, adjusted for location specific inputs, and are classified within Level 2. The location specific inputs are generally broker or dealer quotations, or market transactions in either the listed or OTC markets. Changes in the fair values of these contracts are recognized in our Consolidated Statements of Operations as a component of cost of goods sold.
Interest rate swap derivatives - Fair values of our interest rate swap derivatives are determined utilizing valuation models that are widely accepted in the market to value these OTC derivative contracts. The specific terms of the contracts, as well as market observable inputs, such as interest rates and credit risk assumptions, are factored into the models. As all significant inputs are market observable, all interest rate swaps are classified within Level 2. Changes in the fair values of contracts not designated as hedging instruments for accounting purposes are recognized in our Consolidated Statements of Operations as a component of interest expense. See Note 11, Derivative Financial Instruments and Hedging Activities for additional information about interest rates swaps designated as fair value and cash flow hedges.
Deferred compensation and other assets - Our deferred compensation investments, Rabbi Trust assets and available-for-sale investments in common stock of other companies are valued based on unadjusted quoted prices on active exchanges and are classified within Level 1. Changes in the fair values of these other assets are primarily recognized in our Consolidated Statements of Operations as a component of marketing, general and administrative expenses.
Deferred purchase price receivable - The fair value of the DPP receivable included in receivables, net and other assets, is determined by discounting the expected cash flows to be received. The expected cash flows are primarily based on unobservable inputs consisting of the face amount of the Receivables adjusted for anticipated credit losses. Significant changes in the anticipated credit losses could result in a significantly higher (or lower) fair value measurement. Due to the use of significant unobservable inputs in the pricing model, including management's assumptions related to anticipated credit losses, the DPP receivable is classified as a Level 3 fair value measurement. The reconciliation of the DPP receivable for the period ended May 31, 2018 , is included in Note 2, Receivables .
Embedded derivative asset - The embedded derivative asset relates to contingent payments inherent in our investment in CF Nitrogen. The inputs into the fair value measurement include the probability of future upgrades and downgrades of CF Industries' credit rating based on historical credit rating movements of other public companies and the discount rates to be applied to potential annual payments based on applicable historical and current yield coupon rates. Based
24
Table of Contents
on these observable inputs, our fair value measurement is classified within Level 2. See Note 11, Derivative Financial Instruments and Hedging Activities for additional information.
There were no material transfers between Level 1, Level 2 and Level 3 assets and liabilities during the three months and nine months ended May 31, 2018, and 2017.
Note 13 Commitments and Contingencies
Environmental
We are required to comply with various environmental laws and regulations incidental to our normal business operations. In order to meet our compliance requirements, we establish reserves for the probable future costs of remediation of identified issues, which are included in cost of goods sold and marketing, general and administrative in our Consolidated Statements of Operations. The resolution of any such matters may affect consolidated net income for any fiscal period; however, we believe any resulting liabilities, individually or in the aggregate, will not have a material effect on our consolidated financial position, results of operations or cash flows during any fiscal year.
Other Litigation and Claims
We are involved as a defendant in various lawsuits, claims and disputes, which are in the normal course of our business. The resolution of any such matters may affect consolidated net income for any fiscal period; however, we believe any resulting liabilities, individually or in the aggregate, will not have a material effect on our consolidated financial position, results of operations or cash flows during any fiscal year.
Guarantees
We are a guarantor for lines of credit and performance obligations of related, non-consolidated companies. As of May 31, 2018 , our bank covenants allowed maximum guarantees of $1.0 billion , of which $107.9 million were outstanding. We have collateral for a portion of these contingent obligations. We have not recorded a liability related to the contingent obligations as we do not expect to pay out any cash related to them, and the fair values are considered immaterial. The underlying loans to the counterparties for which we provide these guarantees were current as of May 31, 2018 .
Lease Commitments
On November 30, 2017, we completed a sale-leaseback transaction for our primary corporate office building located in Inver Grove Heights, Minnesota. Simultaneous with the closing of the sale, we entered into a 20 -year operating lease arrangement with base annual rent of approximately $3.4 million during the first year, followed by annual increases of 2% through the remainder of the lease period.
Gain Contingency
As of May 31, 2018, a gain contingency resulted from applying ASC Topic 450-30, Gain Contingencies , to the facts and circumstances surrounding the potential for certain excise tax credits associated with manufacturing changes within our Energy business. The resulting gain, if recognized, will likely have a material impact on our consolidated financial statements.
Note 14 Subsequent Events
Securitization Facility
On June 28, 2018, we amended our existing Securitization Facility discussed in Note 2, Receivables . Prior to the amendment, we accounted for the Receivables sold under the Securitization as a sale of financial assets pursuant to ASC 860, Transfers and Servicing , resulting in the derecognition of the sold Receivables from our Consolidated Balance Sheets. Under the terms of the amended Securitization Facility, the transfer of Receivables will be accounted for as a secured borrowing whereby the sold Receivables and corresponding secured debt will remain on our Consolidated Balance Sheets. The amount available under the amended Securitization Facility will continue to fluctuate over time based on the total amount of eligible Receivables generated during the normal course of business; however, the maximum availability of $700.0 million remains unchanged.
25
Table of Contents
ITEM 2. MANAGEMENT'S DISCUSSION AND ANALYSIS OF FINANCIAL CONDITION AND RESULTS OF OPERATIONS
This Management's Discussion and Analysis of Financial Condition and Results of Operations ("MD&A") is intended to provide a reader of our financial statements with a narrative from the perspective of our management on our financial condition and results of operations, liquidity and certain other factors that may affect our future results. Our MD&A is presented in the following sections:
• | Overview |
• | Business Strategy |
• | Fiscal 2018 Third Quarter Highlights |
• | Fiscal 2018 Priorities Update |
• | Fiscal 2018 Trends Update |
• | Results of Operations |
• | Liquidity and Capital Resources |
• | Off Balance Sheet Financing Arrangements |
• | Contractual Obligations |
• | Critical Accounting Policies |
• | Effect of Inflation and Foreign Currency Transactions |
• | Recent Accounting Pronouncements |
Our MD&A should be read in conjunction with our Annual Report on Form 10-K for the fiscal year ended August 31, 2017 (including the information presented therein under Risk Factors), as well as the consolidated financial statements and the related notes included in Item 1 of Part I of this Quarterly Report on Form 10-Q.
Overview
CHS Inc. is a diversified company that provides grain, foods and energy resources to businesses and consumers on a global scale. As a cooperative, we are owned by farmers, ranchers and member cooperatives across the United States. We also have preferred shareholders that own our five series of preferred stock, all of which are listed and traded on the Nasdaq Global Select Market. We operate in the following three reportable segments:
• | Energy - produces and provides primarily for the wholesale distribution and transportation of petroleum products. |
• | Ag - purchases and further processes or resells grains and oilseeds originated by our country operations business, by our member cooperatives and by third parties and also serves as a wholesaler and retailer of crop inputs. |
• | Nitrogen Production - consists solely of our equity method investment in CF Nitrogen and produces and distributes nitrogen fertilizer, a commodity chemical. |
In addition, our financing and hedging operations along with our non-consolidated wheat milling and food production and distribution joint ventures, have been aggregated within Corporate and Other. Prior to its sale on May 4, 2018, our insurance operations were also included within Corporate and Other.
The consolidated financial statements include the accounts of CHS and all of our wholly-owned and majority-owned subsidiaries and limited liability companies. The effects of all significant intercompany transactions have been eliminated.
Corporate administrative expenses and interest are allocated to each reporting segment, along with Corporate and Other, based on direct usage for services, such as information technology and legal, and other factors or considerations relevant to the costs incurred.
Management's Focus . When evaluating our operating performance, management focuses on gross profit and income before income taxes. As a company that operates heavily in global commodities, there is significant unpredictability and volatility in pricing, costs and global trade. As such, we focus on managing the margin we can earn and the resulting income before income taxes. Management also focuses on ensuring the strength of the balance sheet through the appropriate management of financial liquidity, leverage, capital allocation and cash flow optimization.
Seasonality . Many of our business activities are highly seasonal and our operating results vary throughout the year. Our revenues and income are generally lowest during the second and fourth fiscal quarters and highest during the first and third fiscal quarters. For example, in our Ag segment, our crop nutrients and country operations businesses generally experience higher volumes and income during the spring planting season and in the fall, which corresponds to harvest. Our grain
26
Table of Contents
marketing operations are also subject to fluctuations in volume and earnings based on producer harvests, world grain prices, demand and global trade. Our Energy segment generally experiences higher volumes and profitability in certain operating areas, such as refined products, in the summer and early fall when gasoline and diesel fuel usage by our agricultural producers is highest and is subject to global supply and demand forces. Other energy products, such as propane, may experience higher volumes and profitability during the fall crop drying and winter heating seasons. The graphs below depict the seasonality inherent in our business.
* It should be noted the third quarter of fiscal 2017 was impacted by material charges that caused income (loss) before income taxes for that period to deviate from historical trends.
Pricing . Our revenues, assets and cash flows can be significantly affected by global market prices for commodities such as petroleum products, natural gas, grains, oilseed products and crop nutrients. Changes in market prices for commodities that we purchase without a corresponding change in the selling prices of those products can affect revenues and operating earnings. Commodity prices are affected by a wide range of factors beyond our control, including the weather, crop damage due to disease or insects, drought, availability/adequacy of supply of the related commodity, government regulations/policies, world events, global trade disputes and general political/economic conditions.
Business Strategy
Our business strategy is to help our owners grow by maximizing returns and optimizing our various operations to ensure that our core businesses are strategically positioned today and for the future. We are focusing on improving efficiency and, when necessary, disposing of assets that are not strategic and/or do not meet our internal measurement expectations. We
27
Table of Contents
are also focused on maintaining financial flexibility by optimizing debt levels and ensuring adequate financial liquidity so we can effectively operate throughout the agriculture and energy economic cycles.
Fiscal 2018 Third Quarter Highlights
• | Margins were higher in our Ag and Energy segments compared to prior year results due to higher margins for feed and farm supplies, crop nutrients, processing and food ingredients and refined fuels. |
• | Higher volumes in our Ag segment compared to prior year results driven by increased volumes of feed and farm supplies and processing and food ingredients. |
• | We completed the disposal of certain assets within our Energy segment and Corporate and Other resulting in cash proceeds of approximately $181.4 million and a gain of approximately $124.1 million . The cash proceeds were used to optimize our debt levels by reducing our need for incremental debt and minimizing existing funded debt. |
Fiscal 2018 Priorities Update
We have maintained our focus on restoring financial flexibility by successfully optimizing our debt levels through the first nine months of fiscal 2018. We also continue to focus on leveraging our assets across the enterprise to generate higher returns and make improvements in our management of risk and the granting of credit through enhancements in the related policies, practices and operations.
Fiscal 2018 Trends Update
Our Ag and Energy businesses operate in cyclical environments. The Energy industry has partially recovered throughout fiscal 2018 with higher crack spreads that have led to higher margins, but it continues to be a challenging environment putting pressure on our liquidity. The Ag industry is also operating in a challenging environment characterized by lower margins, reduced liquidity and increased leverage that have resulted from reduced commodity prices. In addition, trade relations between the United States and foreign trade partners, particularly those that purchase large quantities of agricultural commodities, are strained resulting in unpredictable impacts to commodity prices within the Ag industry. We are unable to predict how long the current environment will last or how severe it will ultimately be at this time. Although there was an aggregate increase in Ag margins during the third quarter of fiscal 2018 compared to the third quarter of fiscal 2017, margins for grain and oilseed declined during the same period and we do not foresee significant changes to the core Ag operating environment during the remainder of fiscal 2018. As a result, we expect our revenues, margins and cash flows from our core operations to continue to be under pressure.
28
Table of Contents
Results of Operations
Consolidated Statements of Operations
| For the Three Months Ended May 31, |
| For the Nine Months Ended May 31, | ||||||||||||
| 2018 |
| 2017 |
| 2018 |
| 2017 | ||||||||
| (Dollars in thousands) | ||||||||||||||
Revenues | $ | 9,027,525 | |
| $ | 8,614,090 | |
| $ | 23,927,508 | |
| $ | 23,982,746 | |
Cost of goods sold | 8,728,914 | |
| 8,366,988 | |
| 23,173,151 | |
| 23,142,205 | | ||||
Gross profit | 298,611 | |
| 247,102 | |
| 754,357 | |
| 840,541 | | ||||
Marketing, general and administrative | 161,578 | |
| 153,498 | |
| 488,459 | |
| 459,831 | | ||||
Reserve and impairment charges (recoveries), net | (3,811 | ) |
| 323,901 | |
| (18,944 | ) |
| 414,009 | | ||||
Operating earnings (loss) | 140,844 | |
| (230,297 | ) |
| 284,842 | |
| (33,299 | ) | ||||
(Gain) loss on disposal of business | (124,050 | ) |
| - | |
| (131,755 | ) |
| - | | ||||
Interest expense | 49,340 | |
| 39,201 | |
| 130,218 | |
| 117,411 | | ||||
Other (income) loss | (14,622 | ) |
| (11,947 | ) |
| (51,000 | ) |
| (66,183 | ) | ||||
Equity (income) loss from investments | (59,308 | ) |
| (48,393 | ) |
| (137,111 | ) |
| (124,521 | ) | ||||
Income (loss) before income taxes | 289,484 | |
| (209,158 | ) |
| 474,490 | |
| 39,994 | | ||||
Income tax expense (benefit) | 60,338 | |
| (163,018 | ) |
| (100,901 | ) |
| (137,781 | ) | ||||
Net income (loss) | 229,146 | |
| (46,140 | ) |
| 575,391 | |
| 177,775 | | ||||
Net income (loss) attributable to noncontrolling interests | (187 | ) |
| (955 | ) |
| (699 | ) |
| (757 | ) | ||||
Net income (loss) attributable to CHS Inc. | $ | 229,333 | |
| $ | (45,185 | ) |
| $ | 576,090 | |
| $ | 178,532 | |
29
Table of Contents
The charts below detail revenues, net of intersegment revenues, and income (loss) before income taxes by reportable segment for the three and nine months ended May 31, 2018. Our Nitrogen Production reportable segment represents an equity method investment, and as such records earnings and allocated expenses but not revenue.
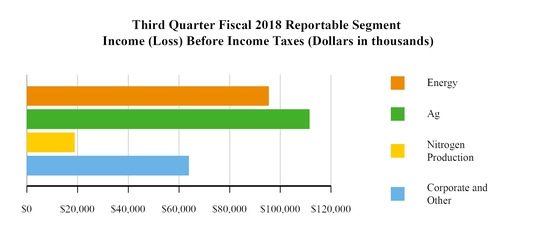
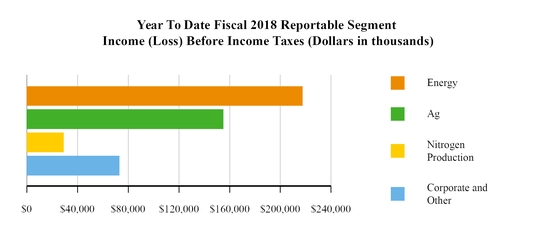
30
Table of Contents
Income (Loss) Before Income Taxes by Segment
Energy
| For the Three Months Ended May 31, |
| Change |
| For the Nine Months Ended May 31, |
| Change | ||||||||||||||||||||||
| 2018 |
| 2017 |
| Dollars |
| Percent |
| 2018 |
| 2017 |
| Dollars |
| Percent | ||||||||||||||
| (Dollars in thousands) | ||||||||||||||||||||||||||||
Income (loss) before income taxes | $ | 95,371 | |
| $ | (9,343 | ) |
| $ | 104,714 | |
| 1,120.8 | % |
| $ | 217,484 | |
| $ | 77,254 | |
| $ | 140,230 | |
| 181.5 | % |
The following table and commentary present the primary reasons for the changes in income (loss) before income taxes ("IBIT") for the Energy segment for the three and nine months ended May 31, 2018 , compared to the prior year:
|
| Year-Over-Year Change | ||||||
|
| Three Months Ended May 31, |
| Nine Months Ended May 31, | ||||
|
| (Dollars in millions) | ||||||
Volume |
| $ | - | |
| $ | (4 | ) |
Price |
| 12 | |
| 55 | | ||
Other* |
| (3 | ) |
| (1 | ) | ||
Change in reserves and impairments (recoveries), net + |
| 33 | |
| 33 | | ||
Non-gross profit related activity + |
| 63 | |
| 57 | | ||
Total change in Energy IBIT |
| $ | 105 | |
| $ | 140 | |
* Other includes retail and non-commodity type activities.
+ See commentary related to these changes in the marketing, general and administrative expenses; reserve and impairment charges (recoveries), net; gain (loss) on disposal of business; interest expense; other income (loss); and equity (income) loss from investments sections of this Results of Operations.
Comparison of Energy segment IBIT for the three and nine months ended May 31, 2018 , and 2017
The $104.7 million and $140.2 million increase s in the Energy segment IBIT, respectively, reflect the following:
• | Improved market conditions in our refined fuels business, primarily driven by higher crack spreads and the associated higher margins. |
• | Gains totaling $65.9 million recorded in other income in connection with the sale of certain assets, including the sale of 34 Zip Trip stores located in the Pacific Northwest, United States ("Pacific Northwest") and the sale of the Council Bluffs pipeline and refined fuels terminal in Council Bluffs, Iowa. |
• | During the third quarter of fiscal 2017, an impairment charge of $32.7 million was recorded related to the cancellation of a capital project which did not reoccur in the current fiscal year. |
Ag
| For the Three Months Ended May 31, |
| Change |
| For the Nine Months Ended May 31, |
| Change | ||||||||||||||||||||||
| 2018 |
| 2017 |
| Dollars |
| Percent |
| 2018 |
| 2017 |
| Dollars |
| Percent | ||||||||||||||
| (Dollars in thousands) | ||||||||||||||||||||||||||||
Income (loss) before income taxes | $ | 111,443 | |
| $ | (221,192 | ) |
| $ | 332,635 | |
| 150.4 | % |
| $ | 155,056 | |
| $ | (121,289 | ) |
| $ | 276,345 | |
| 227.8 | % |
31
Table of Contents
The following table and commentary present the primary reasons for the changes in IBIT for the Ag segment for the three and nine months ended May 31, 2018 , compared to the prior year:
|
| Year-Over-Year Change | ||||||
|
| Three Months Ended May 31, |
| Nine Months Ended May 31, | ||||
|
| (Dollars in millions) | ||||||
Volume |
| $ | 14 | |
| $ | 1 | |
Price |
| 39 | |
| (91 | ) | ||
Other* |
| (4 | ) |
| (7 | ) | ||
Change in reserves and impairments (recoveries), net + |
| 295 | |
| 400 | | ||
Non-gross profit related activity + |
| (11 | ) |
| (27 | ) | ||
Total change in Ag IBIT |
| $ | 333 | |
| $ | 276 | |
* Other includes retail and non-commodity type activities.
+ See commentary related to these changes in the marketing, general and administrative expenses; reserve and impairment charges (recoveries), net; gain (loss) on disposal of business; interest expense; other income (loss); and equity (income) loss from investments sections of this Results of Operations.
Comparison of Ag segment IBIT for the three months ended May 31, 2018 , and 2017
The $332.6 million increase in Ag segment IBIT reflects the following:
• | Increased volumes driven by market related volume increases for feed and farm supplies and processing and food ingredients which were partially offset by reduced volumes of crop nutrients that resulted from the late spring and compressed planting season across much of the Midwest United States ("Midwest"). |
• | Increased price/margin due to market related margin increases for feed and farm supplies, crop nutrients and processing and food ingredients which was partially offset by market related decreases in grain and oilseed margins. |
• | The impact of reserve and impairment charges recorded in the third quarter of fiscal 2017 that did not reoccur in the current fiscal year, as well as the recovery of certain reserve and impairment charges during fiscal 2018. |
Comparison of Ag segment IBIT for the nine months ended May 31, 2018 , and 2017
The $276.3 million increase in Ag segment IBIT reflects the following:
• | Flat volumes as a result of higher market related volumes in feed and farm supplies and processing and food ingredients being almost entirely offset by lower market related volumes of grain and oilseed. |
• | Lower price/margin due to a market related reduction of grain and oilseed margins which was partially offset by market related margin increases for feed and farm supplies. |
• | Net gains totaling $7.7 million recorded in other income in connection with the sale of non-strategic North American locations. |
• | The impact of reserve and impairment charges recorded during fiscal 2017 that did not reoccur in the current fiscal year, as well as the recovery of certain reserve and impairment charges during fiscal 2018. |
All Other Segments
| For the Three Months Ended May 31, |
| Change |
| For the Nine Months Ended May 31, |
| Change | ||||||||||||||||||||||
| 2018 |
| 2017 |
| Dollars |
| Percent |
| 2018 |
| 2017 |
| Dollars |
| Percent | ||||||||||||||
| (Dollars in thousands) | ||||||||||||||||||||||||||||
Nitrogen Production IBIT* | $ | 18,808 | |
| $ | 8,684 | |
| $ | 10,124 | |
| 116.6 | % |
| $ | 29,004 | |
| $ | 41,175 | |
| $ | (12,171 | ) |
| (29.6 | )% |
Corporate and Other IBIT | $ | 63,862 | |
| $ | 12,693 | |
| $ | 51,169 | |
| 403.1 | % |
| $ | 72,946 | |
| $ | 42,854 | |
| $ | 30,092 | |
| 70.2 | % |
* See Note 4, Investments, of the notes to the consolidated financial statements that are included in this Quarterly Report on Form 10-Q for additional information.
Comparison of All Other Segments IBIT for the three months ended May 31, 2018 , and 2017
Our Nitrogen Production segment IBIT increased due to higher equity method income in the third quarter of fiscal 2018 due to improved prices on urea leading to higher margins. Corporate and Other IBIT increased as a result of the $58.2 million gain recognized on the sale of CHS Insurance during the third quarter of fiscal 2018 which was partially offset by lower
32
Table of Contents
earnings from our investment in Ventura Foods and reduced interest revenue from our financing business resulting from the sale of loans receivable.
Comparison of All Other Segments IBIT for the nine months ended May 31, 2018 , and 2017
Our Nitrogen Production segment IBIT decreased due to a gain in the prior year of $29.1 million associated with an embedded derivative asset inherent in the agreement relating to our investment in CF Nitrogen for which there was no comparable gain in the current fiscal year. This decrease was partially offset by higher equity method income in the current year resulting from improved prices on urea leading to higher margins. Corporate and Other IBIT increased as a result of the $58.2 million gain recognized on the sale of CHS Insurance during the third quarter of fiscal 2018 which was partially offset by lower earnings from our investment in Ventura Foods and reduced interest revenue from our financing business resulting from the sale of loans receivable.
Revenues by Segment
Energy
| For the Three Months Ended May 31, |
| Change |
| For the Nine Months Ended May 31, |
| Change | ||||||||||||||||||||||
| 2018 |
| 2017 |
| Dollars |
| Percent |
| 2018 |
| 2017 |
| Dollars |
| Percent | ||||||||||||||
| (Dollars in thousands) | ||||||||||||||||||||||||||||
Revenue | $ | 1,893,621 | |
| $ | 1,540,231 | |
| $ | 353,390 | |
| 22.9 | % |
| $ | 5,523,558 | |
| $ | 4,570,264 | |
| $ | 953,294 | |
| 20.9 | % |
The following table and commentary present the primary reasons for the changes in revenue for the Energy segment for the three and nine months ended May 31, 2018, compared to the prior year:
|
| Year-Over-Year Change | ||||||
|
| Three Months Ended May 31, |
| Nine Months Ended May 31, | ||||
|
| (Dollars in millions) | ||||||
Volume |
| $ | (11 | ) |
| $ | (46 | ) |
Price |
| 387 | |
| 1,001 | | ||
Other* |
| (23 | ) |
| (2 | ) | ||
Total change in Energy revenue |
| $ | 353 | |
| $ | 953 | |
* Other includes retail and non-commodity type activities.
Comparison of Energy segment revenue for the three months ended May 31, 2018 , and 2017
The $353.4 million increase in Energy segment revenue reflects market related price increases across all Energy sub-segments, including refined fuels, lubricants and propane which were partially offset by decreased volumes of lubricants and propane. Refined fuels pricing increased $0.46 (28%) per gallon, lubricants pricing increased $0.29 (5%) per unit, and propane pricing increased $0.17 (25%) per gallon.
Comparison of Energy segment revenue for the nine months ended May 31, 2018 , and 2017
The $953.3 million increase in Energy segment revenue reflects market related price increases across all Energy sub-segments, including refined fuels, lubricants and propane which were partially offset by decreased volumes of refined fuels and lubricants. Refined fuels pricing increased $0.37 (23%) per gallon, lubricants pricing increased $0.35 (6%) per unit, and propane pricing increased $0.22 (31%) per gallon.
33
Table of Contents
Ag
| For the Three Months Ended May 31, |
| Change |
| For the Nine Months Ended May 31, |
| Change | ||||||||||||||||||||||
| 2018 |
| 2017 |
| Dollars |
| Percent |
| 2018 |
| 2017 |
| Dollars |
| Percent | ||||||||||||||
| (Dollars in thousands) | ||||||||||||||||||||||||||||
Revenue | $ | 7,121,240 | |
| $ | 7,046,446 | |
| $ | 74,794 | |
| 1.1 | % |
| $ | 18,364,116 | |
| $ | 19,329,248 | |
| $ | (965,132 | ) |
| (5.0 | )% |
The following table and commentary present the primary reasons for the changes in revenue for the Ag segment for the three and nine months ended May 31, 2018, compared to the prior year:
|
| Year-Over-Year Change | ||||||
|
| Three Months Ended May 31, |
| Nine Months Ended May 31, | ||||
|
| (Dollars in millions) | ||||||
Volume |
| $ | 320 | |
| $ | (674 | ) |
Price |
| (182 | ) |
| (197 | ) | ||
Other* |
| (63 | ) |
| (94 | ) | ||
Total change in Ag revenue |
| $ | 75 | |
| $ | (965 | ) |
* Other includes retail and non-commodity type activities.
Comparison of Ag segment revenue for the three months ended May 31, 2018 , and 2017
The $74.8 million increase in Ag segment revenue reflects the following:
• | Increased volumes driven by market related volume increases for feed and farm supplies and processing and food ingredients which were partially offset by reduced volumes of crop nutrients that resulted from the late spring and compressed planting season across much of the Midwest. |
• | Decreased pricing that resulted from market related pricing reductions for feed and farm supplies and processing and food ingredients which was partially offset by market related pricing increases for crop nutrients. |
• | Other revenue decreased primarily due to a reduction in export terminal activities and lower financing fees within grain marketing. |
Comparison of Ag segment revenue for the nine months ended May 31, 2018 , and 2017
The $965.1 million decrease in Ag segment revenue reflects the following:
• | Decreased volumes driven by reduced grain and oilseed sales attributed to lower U.S. export activity. The lower U.S. export activity is the result of increased global competition, strained U.S. trade relations (most notably with China), and the slower movement of grain domestically that has resulted from depressed pricing. The decreased grain and oilseed volumes were partially offset by market related volume increases for feed and farm supplies and processing and food ingredients. |
• | Decreased pricing that resulted from market related pricing reductions for feed and farm supplies, renewable fuels, and processing and food ingredients which were partially offset by market related pricing increases for crop nutrients. |
• | Other revenue decreased primarily due to a reduction in export terminal activities and lower financing fees within grain marketing. |
All Other Segments
| For the Three Months Ended May 31, |
| Change |
| For the Nine Months Ended May 31, |
| Change | ||||||||||||||||||||||
| 2018 |
| 2017 |
| Dollars |
| Percent |
| 2018 |
| 2017 |
| Dollars |
| Percent | ||||||||||||||
| (Dollars in thousands) | ||||||||||||||||||||||||||||
Corporate and Other revenue | $ | 12,664 | |
| $ | 27,413 | |
| $ | (14,749 | ) |
| (53.8 | )% |
| $ | 39,834 | |
| $ | 83,234 | |
| $ | (43,400 | ) |
| (52.1 | )% |
34
Table of Contents
Comparison of All Other Segments revenue for the three and nine months ended May 31, 2018 , and 2017
Corporate and Other revenue decreased primarily due to the sale of loans receivable upon which interest was previously being recognized. Our Nitrogen Production reportable segment represents an equity method investment, and as such records earnings and allocated expenses but not revenue.
Cost of Goods Sold by Segment
Energy
| For the Three Months Ended May 31, |
| Change |
| For the Nine Months Ended May 31, |
| Change | ||||||||||||||||||||||
| 2018 |
| 2017 |
| Dollars |
| Percent |
| 2018 |
| 2017 |
| Dollars |
| Percent | ||||||||||||||
| (Dollars in thousands) | ||||||||||||||||||||||||||||
Cost of goods sold | $ | 1,821,562 | |
| $ | 1,476,819 | |
| $ | 344,743 | |
| 23.3 | % |
| $ | 5,241,669 | |
| $ | 4,338,146 | |
| $ | 903,523 | |
| 20.8 | % |
The following table and commentary present the primary reasons for the changes in cost of goods sold ("COGS") for the Energy segment for the three and nine months ended May 31, 2018, compared to the prior year:
|
| Year-Over-Year Change | ||||||
|
| Three Months Ended May 31, |
| Nine Months Ended May 31, | ||||
|
| (Dollars in millions) | ||||||
Volume |
| $ | (10 | ) |
| $ | (42 | ) |
Price |
| 375 | |
| 947 | | ||
Other* |
| (20 | ) |
| (1 | ) | ||
Total change in Energy cost of goods sold |
| $ | 345 | |
| $ | 904 | |
* Other includes retail and non-commodity type activities.
Comparison of Energy segment COGS for the three months ended May 31, 2018 , and 2017
The $344.7 million increase in Energy segment COGS reflects market related increases in costs across all Energy sub-segments, including refined fuels, lubricants, and propane. Costs for refined fuels increased $0.44 (28%) per gallon, costs for lubricants increased $0.15 (3%) per unit and costs for propane increased $0.18 (25%) per gallon. The increase in COGS related to refined fuels was partially due to planned major maintenance (to overhaul, repair, inspect and replace process materials and equipment - referred to in the industry as "turnaround") at our Laurel, Montana refinery during May 2018. Because a turnaround necessitates an extended shutdown of the refinery, we must purchase refined products from third parties (at market prices) to offset the decrease in production and meet customer demand. The higher COGS were partially offset by decreased volumes and an approximate $19.1 million benefit recognized during the third quarter of fiscal 2018 as a reduction of COGS associated with the "small refinery exemption". Refer to further details related to the "small refinery exemption" in the nine month comparison of Energy segment COGS below.
Comparison of Energy segment COGS for the nine months ended May 31, 2018 , and 2017
The $903.5 million increase in Energy segment COGS reflects market related increases in costs across all Energy sub-segments, including refined fuels, lubricants, and propane. Costs for refined fuels increased $0.32 (21%) per gallon, costs for lubricants increased $0.15 (3%) per unit and costs for propane increased $0.30 (48%) per gallon. There were also certain manufacturing changes within our propane business that reduced COGS by $46.0 million during the nine months ended May 31, 2017, that did not reoccur in fiscal 2018. The increase in COGS related to refined fuels was partially due to a turnaround at our Laurel, Montana refinery during May 2018. Because a turnaround necessitates an extended shutdown of the refinery, we must purchase refined products from third parties (at market prices) to offset the decrease in production and meet customer demand. The higher COGS were partially offset by decreased volumes and an approximate $19.1 million benefit recognized during the third quarter of fiscal 2018 as a reduction of COGS associated with the "small refinery exemption".
The refining industry is subject to compliance costs under the Renewable Fuel Standard ("RFS"). Under the regulation of the U.S. Environmental Protection Agency ("EPA"), the RFS provides annual requirements for the total volume of
35
Table of Contents
renewable fuels which are mandated to be blended into finished transportation fuels. If a refiner does not meet its required annual renewable volume obligation, the refiner can obtain blending credits in the open market, referred to as RINs.
During the three months ended May 31, 2018, the EPA granted our Laurel, Montana refinery an extension of the small refinery exemption under the RFS as provided for under the Clean Air Act for compliance year 2017. This exemption provides our Laurel, Montana refinery an exemption from its renewable fuel volume obligations under the RFS program for compliance year 2017. In granting this exemption the EPA considered a number of factors and concluded that the Laurel, Montana refinery qualified for the exemption as prescribed under the standard. As with other competitors who received the exemption in the same geographic market as our Laurel, Montana refinery, the small refinery exemption lowers our cost to operate and has a positive impact on our earnings. Since the small refinery exemption is granted on a year-to-year basis, we are unable to predict whether we will receive this exemption again in the future.
Ag
| For the Three Months Ended May 31, |
| Change |
| For the Nine Months Ended May 31, |
| Change | ||||||||||||||||||||||
| 2018 |
| 2017 |
| Dollars |
| Percent |
| 2018 |
| 2017 |
| Dollars |
| Percent | ||||||||||||||
| (Dollars in thousands) | ||||||||||||||||||||||||||||
Cost of goods sold | $ | 6,907,666 | |
| $ | 6,881,425 | |
| $ | 26,241 | |
| 0.4 | % |
| $ | 17,933,306 | |
| $ | 18,801,127 | |
| $ | (867,821 | ) |
| (4.6 | )% |
The following table and commentary present the primary reasons for the changes in COGS for the Ag segment for the three and nine months ended May 31, 2018 , compared to the prior year:
|
| Year-Over-Year Change | ||||||
|
| Three Months Ended May 31, |
| Nine Months Ended May 31, | ||||
|
| (Dollars in millions) | ||||||
Volume |
| $ | 306 | |
| $ | (674 | ) |
Price |
| (221 | ) |
| (107 | ) | ||
Other* |
| (59 | ) |
| (87 | ) | ||
Total change in Ag cost of goods sold |
| $ | 26 | |
| $ | (868 | ) |
* Other includes retail and non-commodity type activities.
Comparison of Ag segment COGS for the three months ended May 31, 2018 , and 2017
The $26.2 million increase in Ag segment COGS reflects the following:
• | Increased volumes driven by market related volume increases for feed and farm supplies and processing and food ingredients which were partially offset by decreased volumes of crop nutrients that resulted from the late spring and compressed planting season across much of the Midwest. |
• | Decreased costs that resulted from market related cost reductions for feed and farm supplies and processing and food ingredients which were partially offset by increased costs for crop nutrients and grain and oilseed. |
• | Decreased COGS associated with the reduced export terminal activities and financing activities within grain marketing. |
Comparison of Ag segment COGS for the nine months ended May 31, 2018 , and 2017
The $867.8 million decrease in Ag segment COGS reflects the following:
• | Decreased volumes driven by reduced grain and oilseed volumes attributed to lower U.S. export activity. The lower U.S. export activity is the result of increased global competition, strained U.S. trade relations (most notably with China), and the slower movement of grain domestically that has resulted from depressed pricing. The decreased grain and oilseed volumes were partially offset by market related volume increases for feed and farm supplies and processing and food ingredients. |
• | Decreased costs that resulted from reduced costs for feed and farm supplies and processing and food ingredients which were partially offset by increased costs for crop nutrients and grain and oilseed. |
• | Decreased COGS associated with the reduced export terminal activities and financing activities within grain marketing. |
36
Table of Contents
All Other Segments
| For the Three Months Ended May 31, |
| Change |
| For the Nine Months Ended May 31, |
| Change | ||||||||||||||||||||||
| 2018 |
| 2017 |
| Dollars |
| Percent |
| 2018 |
| 2017 |
| Dollars |
| Percent | ||||||||||||||
| (Dollars in thousands) | ||||||||||||||||||||||||||||
Nitrogen Production COGS | $ | (251 | ) |
| $ | 174 | |
| $ | (425 | ) |
| (244.3 | )% |
| $ | 1,101 | |
| $ | (695 | ) |
| $ | 1,796 | |
| 258.4 | % |
Corporate and Other COGS | $ | (63 | ) |
| $ | 8,570 | |
| $ | (8,633 | ) |
| (100.7 | )% |
| $ | (2,925 | ) |
| $ | 3,627 | |
| $ | (6,552 | ) |
| (180.6 | )% |
Comparison of All Other Segments COGS for the three and nine months ended May 31, 2018 , and 2017
The $0.4 million decrease in COGS for our Nitrogen Production segment during the third quarter of fiscal 2018 was due to a favorable variance on our natural gas hedges. The year-to-date $1.8 million increase in COGS for our Nitrogen Production segment is the result of unfavorable variances on natural gas hedges during the first and second quarters of fiscal 2018. The decrease in COGS for Corporate and Other was primarily due to decreased commission expense as a result of lower volumes of transactions and commission mix in our hedging and insurance operations and lower cost allocations to our financing operations.
Marketing, General and Administrative Expenses
| For the Three Months Ended May 31, |
| Change |
| For the Nine Months Ended May 31, |
| Change | ||||||||||||||||||||||
| 2018 |
| 2017 |
| Dollars |
| Percent |
| 2018 |
| 2017 |
| Dollars |
| Percent | ||||||||||||||
| (Dollars in thousands) | ||||||||||||||||||||||||||||
Marketing, general and administrative expenses | $ | 161,578 | |
| $ | 153,498 | |
| $ | 8,080 | |
| 5.3 | % |
| $ | 488,459 | |
| $ | 459,831 | |
| $ | 28,628 | |
| 6.2 | % |
Comparison of marketing, general and administrative expenses for the three and nine months ended May 31, 2018 , and 2017
The increase in marketing, general and administrative expenses is primarily due to compensation expense related to higher annual incentive compensation. The increased expense reflects accruals that have been recorded for estimated company performance against targets for the full year.
Reserve and Impairment Charges (Recoveries), net
| For the Three Months Ended May 31, |
| Change |
| For the Nine Months Ended May 31, |
| Change | ||||||||||||||||||||||
| 2018 |
| 2017 |
| Dollars |
| Percent |
| 2018 |
| 2017 |
| Dollars |
| Percent | ||||||||||||||
| (Dollars in thousands) | ||||||||||||||||||||||||||||
Reserve and impairment charges (recoveries), net | $ | (3,811 | ) |
| $ | 323,901 | |
| $ | (327,712 | ) |
| (101.2 | )% |
| $ | (18,944 | ) |
| $ | 414,009 | |
| $ | (432,953 | ) |
| (104.6 | )% |
Comparison of reserve and impairment charges (recoveries), net for the three months ended May 31, 2018 , and 2017
The $327.7 million decrease in reserve and impairment charges (recoveries), net primarily reflects the following:
• | Reserves of approximately $229.4 million related to a Brazil trading partner in our Ag segment entering bankruptcy-like proceedings under Brazilian law that were recorded during the third quarter of fiscal 2017 and did not reoccur in the current fiscal year. |
• | Impairment charges of $32.7 million associated with the cancellation of a capital project in our Energy segment and $51.8 million associated with the impairment of long-lived assets and goodwill in our Ag segment that were recorded during the third quarter of fiscal 2017 and did not reoccur in the current fiscal year. |
37
Table of Contents
Comparison of reserve and impairment charges (recoveries), net for the nine months ended May 31, 2018 , and 2017
The $433.0 million decrease in reserve and impairment charges (recoveries), net primarily reflects the following:
• | Reserves of approximately $229.4 million related to a Brazil trading partner in our Ag segment entering bankruptcy-like proceedings under Brazilian law that were recorded during the third quarter of fiscal 2017 and did not reoccur in the current fiscal year. |
• | Impairment charges of $32.7 million associated with the cancellation of a capital project in our Energy segment and $51.8 million associated with the impairment of long-lived assets and goodwill in our Ag segment that were recorded during the third quarter of fiscal 2017 and did not reoccur in the current fiscal year. |
• | Recoveries of approximately $21.7 million associated with the sale of assets and loans that were previously impaired. |
• | Recovery of $8.3 million in our allowance for doubtful accounts during fiscal 2017 related to an international business that did not reoccur in the current year. |
• | The remaining decrease is mostly attributed to loan loss and accounts receivable reserve expense primarily related to a single producer borrower recorded during the third quarter of fiscal 2017 which did not reoccur in the current fiscal year. |
Gain (Loss) on Disposal of Business
| For the Three Months Ended May 31, |
| Change |
| For the Nine Months Ended May 31, |
| Change | ||||||||||||||||||||
| 2018 |
| 2017 |
| Dollars |
| Percent |
| 2018 |
| 2017 |
| Dollars |
| Percent | ||||||||||||
| (Dollars in thousands) | ||||||||||||||||||||||||||
Gain (loss) on disposal of business | $ | 124,050 | |
| $ | - | |
| $ | 124,050 | |
| NM |
| $ | 131,755 | |
| $ | - | |
| $ | 131,755 | |
| NM |
NM - Not meaningful
Comparison of gain (loss) on disposal of business for the three and nine months ended May 31, 2018 , and 2017
The increase in gain (loss) on disposal of business is primarily attributable to gains recognized on the sale of certain assets during the third quarter of fiscal 2018, including a $65.9 million gain in our Energy segment associated with the sale of 34 Zip Trip stores located in the Pacific Northwest and the sale of the Council Bluffs pipeline and refined fuels terminal in Council Bluffs, Iowa, and a $58.2 million gain in Corporate and Other associated with the sale of CHS Insurance.
Interest Expense
| For the Three Months Ended May 31, |
| Change |
| For the Nine Months Ended May 31, |
| Change | ||||||||||||||||||||||
| 2018 |
| 2017 |
| Dollars |
| Percent |
| 2018 |
| 2017 |
| Dollars |
| Percent | ||||||||||||||
| (Dollars in thousands) | ||||||||||||||||||||||||||||
Interest expense | $ | 49,340 | |
| $ | 39,201 | |
| $ | 10,139 | |
| 25.9 | % |
| $ | 130,218 | |
| $ | 117,411 | |
| $ | 12,807 | |
| 10.9 | % |
Comparison of interest expense for the three and nine months ended May 31, 2018 , and 2017
The increase in interest expense was primarily due to higher interest expense associated with higher interest rates.
Other Income (Loss)
| For the Three Months Ended May 31, |
| Change |
| For the Nine Months Ended May 31, |
| Change | ||||||||||||||||||||||
| 2018 |
| 2017 |
| Dollars |
| Percent |
| 2018 |
| 2017 |
| Dollars |
| Percent | ||||||||||||||
| (Dollars in thousands) | ||||||||||||||||||||||||||||
Other income (loss) | $ | 14,622 | |
| $ | 11,947 | |
| $ | 2,675 | |
| 22.4 | % |
| $ | 51,000 | |
| $ | 66,183 | |
| $ | (15,183 | ) |
| (22.9 | )% |
38
Table of Contents
Comparison of other income (loss) for the three months ended May 31, 2018 , and 2017
The $2.7 million increase in other income (loss) for the three months ended May 31, 2018, related primarily to increased interest income due to higher interest rates.
Comparison of other income (loss) for the nine months ended May 31, 2018 , and 2017
The $15.2 million decrease in other income (loss) reflects the following:
• | During the first quarter of fiscal 2017, we recorded a gain of $29.1 million associated with an embedded derivative within the contract relating to our strategic investment in CF Nitrogen that did not reoccur during fiscal 2018. See Note 11, Derivative Financial Instruments and Hedging Activities , of the notes to the consolidated financial statements that are included in this Quarterly Report on Form 10-Q for additional information. |
• | The decrease associated with the embedded derivative was partially offset by increased interest income due to higher interest rates and other non-operating activity. |
Equity Income (Loss) from Investments
| For the Three Months Ended May 31, |
| Change |
| For the Nine Months Ended May 31, |
| Change | ||||||||||||||||||||||
| 2018 |
| 2017 |
| Dollars |
| Percent |
| 2018 |
| 2017 |
| Dollars |
| Percent | ||||||||||||||
| (Dollars in thousands) | ||||||||||||||||||||||||||||
Equity income (loss) from investments* | $ | 59,308 | |
| $ | 48,393 | |
| $ | 10,915 | |
| 22.6 | % |
| $ | 137,111 | |
| $ | 124,521 | |
| $ | 12,590 | |
| 10.1 | % |
* See Note 4, Investments, of the notes to the consolidated financial statements that are included in this Quarterly Report on Form 10-Q for additional information.
Comparison of equity income (loss) from investments for the three and nine months ended May 31, 2018 , and 2017
We record equity income or loss for investments in which we have an ownership interest of 50% or less and have significant influence, but not control, for our proportionate share of income or loss reported by the entity, without consolidating the revenues and expenses of the entity in our Consolidated Statements of Operations. Equity income (loss) from investments increased due to higher equity income associated with our equity method investment in CF Nitrogen due to improved urea pricing and an equity method investment within our Ag segment in the animal nutrition space that experienced improved results. These increases were partially offset by a decrease in Ventura Foods equity income that resulted from a combination of lower margins and volumes.
Income Tax Benefit (Expense)
| For the Three Months Ended May 31, |
| Change |
| For the Nine Months Ended May 31, |
| Change | ||||||||||||||||||||
| 2018 |
| 2017 |
| Dollars |
| Percent |
| 2018 |
| 2017 |
| Dollars |
| Percent | ||||||||||||
| (Dollars in thousands) | ||||||||||||||||||||||||||
Income tax benefit (expense) | $ | (60,338 | ) |
| $ | 163,018 | |
| $ | (223,356 | ) |
| (137.0)% |
| $ | 100,901 | |
| $ | 137,781 | |
| $ | (36,880 | ) |
| (26.8)% |
Comparison of income tax benefit (expense) for the three months ended May 31, 2018 , and 2017
During the three months ended May 31, 2018, we had increased income tax expense when compared to the same period of the prior fiscal year, resulting in effective tax rates of 20.8% and (77.9)% , respectively. The increased income tax expense during the third quarter of fiscal 2018 is primarily the result of significant income tax benefits that were recognized during the prior year that did not reoccur during the current year. The significant income tax benefit during the third quarter of fiscal 2017 resulted primarily from the recognition of deferred tax benefits related to the issuance of non-qualified equity certificates during fiscal years 2013 and 2014 and the deduction of bad debt expense in our U.S. tax returns related to the performance guarantees resulting from the approximate $229.4 million loss related to a Brazilian trading partner of ours entering bankruptcy-like proceedings under Brazilian law. In addition, we recorded incremental income tax expenses during the third quarter of fiscal 2018, including a $15.5 million impairment of income tax receivables related to Brazilian tax legislation enacted on May 30, 2018, that restricts our ability to utilize our Brazilian income tax credits, $21.3 million of income tax expense related to the sale of certain assets, and $10.0 million of income tax expense related to the performance guarantees
39
Table of Contents
associated with our Brazilian subsidiary's fiscal 2017 loss. The federal and state statutory rates applied to nonpatronage business activity were 29.4% and 38.3% for the three-month periods ended May 31, 2018, and 2017, respectively. The income taxes and effective tax rate vary each year based upon profitability and nonpatronage business activity during each of the comparable years.
Comparison of income tax benefit (expense) for the nine months ended May 31, 2018 , and 2017
During the nine months ended May 31, 2018, we had a lower income tax benefit when compared to the same period of the prior fiscal year, resulting in effective tax rates of (21.3)% and (344.5)% , respectively. The decreased tax benefit during fiscal 2018 is primarily the result of incremental income tax benefits that were recognized during the prior year that did not reoccur during the current year. The significant income tax benefit during fiscal 2017 resulted primarily from the recognition of deferred tax benefits related to the issuance of non-qualified equity certificates during fiscal years 2013 and 2014 and the deduction of bad debt expense in our U.S. tax returns related to the performance guarantees resulting from the approximate $229.4 million loss related to a Brazilian trading partner of ours entering bankruptcy-like proceedings under Brazilian law. The income tax benefit during fiscal 2018 is primarily derived from a $133.6 million revaluation of our net deferred tax liability resulting from the Tax Cuts and Jobs Act enacted on December 22, 2017, as well as a decrease in income tax expense of $41.3 million associated with deferred benefits from the intercompany transfer of business assets on December 1, 2017. The revaluation performed related to the Tax Act is considered a provisional estimate and could be subject to change. The income tax benefits recognized during fiscal 2018 are partially offset by a $15.5 million impairment of income tax receivables related to Brazilian tax legislation enacted on May 30, 2018, that restricts our ability to utilize our Brazilian income tax credits, $21.3 million of income tax expense related to the sale of certain assets, and $10.0 million of income tax expense related to the performance guarantees associated with our Brazilian subsidiary's fiscal 2017 loss. The federal and state statutory rates applied to nonpatronage business activity were 29.4% and 38.3%, for the nine-month periods ended May 31, 2018, and 2017, respectively. The income taxes and effective tax rate vary each year based upon profitability and nonpatronage business activity during each of the comparable years.
Liquidity and Capital Resources
Summary
In assessing our financial condition, we consider factors such as working capital and internal benchmarking related to our applicable covenants and other financial criteria. We fund our current operations primarily through a combination of cash flows from operations supplemented with borrowings under our revolving credit facilities. We fund our capital expenditures and growth primarily through cash, operating cash flow and long-term debt financing.
On May 31, 2018 , we had working capital, defined as current assets less current liabilities, of $654.1 million and a current ratio, defined as current assets divided by current liabilities, of 1.1 compared to working capital of $181.9 million and a current ratio of 1.0 on August 31, 2017. On May 31, 2017, we had working capital of $311.1 million and a current ratio of 1.0 compared to working capital of $414.4 million and a current ratio of 1.1 on August 31, 2016.
As of May 31, 2018 , we had cash and cash equivalents of $533.9 million , total equities of $8.2 billion , long-term debt of $2.0 billion and notes payable of $2.8 billion . Our capital allocation priorities include paying our dividends, maintaining the safety and compliance of our operations, reducing funded debt and taking advantage of strategic opportunities that benefit our owners. We expect the down cycle in the Ag and Energy industries to continue and to ensure that we maintain appropriate levels of liquidity, we will continue to consider opportunities to further diversify and enhance our sources and amounts of liquidity. These opportunities include reducing operating expenses, deploying and/or financing working capital more efficiently and identifying and disposing of assets that are not strategic and/or do not meet our internal measurement expectations. We believe that cash generated by operating activities, along with available borrowing capacity under our credit facilities, will be sufficient to support our operations for the foreseeable future and we expect to remain in compliance with our loan covenants.
40
Table of Contents
Fiscal 2018 and 2017 Activity
On July 18, 2017, we amended an existing receivables and loans securitization facility ("Securitization Facility" or the "Facility") with certain unaffiliated financial institutions (the "Purchasers"). Under the Securitization Facility, CHS Capital and CHS both sell eligible trade accounts and notes receivable ("Receivables") they have originated to Cofina Funding, LLC ("Cofina Funding"), a wholly-owned bankruptcy-remote indirect subsidiary of CHS. Cofina Funding in turn sells the purchased Receivables in their entirety to the Purchasers. Prior to amending the Securitization Facility in July 2017, the transfer of Receivables was accounted for as a secured borrowing. Under the terms of the Securitization Facility, as amended in July 2017, CHS accounts for Receivables sold under the Facility as a sale of financial assets and derecognizes the sold Receivables from its Consolidated Balance Sheets. The amount available under the Facility fluctuates over time based on the total amount of eligible Receivables generated during the normal course of business, with maximum availability of $700.0 million. As of May 31, 2018 , the total availability under the Securitization Facility was $592.0 million , all of which had been utilized.
The Facility agreement contains certain customary representations and warranties and affirmative covenants, including criteria governing eligibility of the Receivables being sold, and contains customary program termination events and non-reinvestment events. We were in compliance with all covenants associated with our Securitization Facility as of May 31, 2018 .
See Note 14, Subsequent Events , of the notes to the consolidated financial statements that are included in this Quarterly Report on Form 10-Q for details related to our further amendment of the Facility during June 2018.
Cash Flows
The following table presents summarized cash flow data for the nine months ended May 31, 2018 , and 2017 :
|
|
| Change | |||||||||||
| 2018 |
| 2017 |
| Dollars |
| Percent | |||||||
| (Dollars in thousands) | |||||||||||||
Net cash provided by (used in) operating activities | $ | (147,531 | ) |
| $ | 204,765 | |
| $ | (352,296 | ) |
| (172.0 | )% |
Net cash provided by (used in) investing activities | (71,787 | ) |
| (374,152 | ) |
| 302,365 | |
| 80.8 | % | |||
Net cash provided by (used in) financing activities | 570,796 | |
| 155,438 | |
| 415,358 | |
| 267.2 | % | |||
Effect of exchange rate changes on cash and cash equivalents | 1,030 | |
| 1,865 | |
| (835 | ) |
| (44.8 | )% | |||
Net increase (decrease) in cash and cash equivalents | $ | 352,508 | |
| $ | (12,084 | ) |
| $ | 364,592 | |
| 3,017.1 | % |
Comparison of cash flows for the nine months ended May 31, 2018, and 2017
The $352.3 million decrease in cash from operating activities reflects increased receivables as a result of the timing of sales and cash collections due to the delayed spring planting season in most of our operating region.
The $302.4 million increase in cash from investing activities reflects the following:
• | Proceeds of $260.3 million from the sale of certain North American businesses/assets primarily during the three months ended May 31, 2018, in our Ag and Energy segments and our insurance business reported in Corporate and Other. The proceeds received were partially used to reduce long-term debt. |
• | Proceeds of $54.7 million due to the sale of our primary corporate office building in Inver Grove Heights, Minnesota in the first quarter of fiscal 2018 which was subsequently leased back to us. The proceeds received were used to reduce our long-term debt. |
• | Reduced acquisitions of property, plant and equipment and other business acquisitions. |
The $415.4 million increase in cash from financing activities reflects the following:
• | Increased net proceeds from our lines of credit and long term-debt facilities. |
• | No cash patronage distributed in fiscal 2018 for fiscal 2017 earnings compared to $103.9 million distributed in the prior fiscal year. |
41
Table of Contents
Future Uses of Cash
We expect to utilize cash and cash equivalents, along with cash generated by operating activities to fund capital expenditures and payments for debt, interest, dividends and guarantees. The following is a summary of our primary cash requirements for fiscal 2018 :
• | Capital expenditures. We expect total capital expenditures for fiscal 2018 to be approximately $488.0 million, compared to capital expenditures of $446.7 million in fiscal 2017 . Included in that amount for fiscal 2018 is approximately $231.0 million for the acquisition of property, plant and equipment at our Laurel, Montana and McPherson, Kansas refineries. During the nine months ended May 31, 2018 , we acquired property, plant and equipment of $ 249.1 million . |
• | Major repairs . Refineries have planned major maintenance to overhaul, repair, inspect and replace process materials and equipment (referred to as a "turnaround") which typically occur for a five- to six-week period every 2-5 years. Our Laurel, Montana refinery has substantially completed its planned major maintenance of approximately $89.0 million scheduled for fiscal 2018. As of May 31, 2018, $76.7 million of the planned major maintenance was capitalized. |
• | Debt. During the nine months ended May 31, 2018 , we repaid $194 million of long-term debt consisting of scheduled debt maturities and optional prepayments. We do not have any scheduled payments of long-term debt for the remainder of fiscal 2018. |
• | Preferred stock dividends. We had approximately $2.3 billion of preferred stock outstanding at May 31, 2018 . We expect to pay dividends on our preferred stock of approximately $168.7 million during fiscal 2018 . |
• | Guarantees . We are required to eventually fund a total of approximately $170.0 million in guarantees to our Brazilian operations in fiscal 2018 as a result of losses in the prior fiscal year caused by a trading partner of ours in Brazil entering into bankruptcy-like proceedings under Brazilian law. As of May 31, 2018 , there were $15.0 million in guarantees which remained to be paid during the fourth quarter of fiscal 2018. |
Future Sources of Cash
We fund our current operations primarily through a combination of cash flows from operations and committed and uncommitted revolving credit facilities, including our Securitization Facility. We believe these sources will provide adequate liquidity to meet our working capital needs. We fund certain of our long-term capital needs, primarily those related to acquisitions of property, plant and equipment from cash flows from operations and by issuing privately placed long-term debt and term loans. In addition, our wholly-owned subsidiary, CHS Capital, makes loans to member cooperatives, businesses and individual producers of agricultural products included in our cash flows from investing activities, and has financing sources as detailed below in CHS Capital Financing .
Working Capital Financing
We finance our working capital needs through committed and uncommitted lines of credit with domestic and international banks. We believe our current cash balances and our available capacity on our committed lines of credit will provide adequate liquidity to meet our working capital needs. The following table summarizes our primary lines of credit as of May 31, 2018 :
Revolving Credit Facilities |
| Maturities |
| Total Capacity |
| Borrowings Outstanding |
| Interest Rates | ||||
|
| Fiscal Year |
| (Dollars in thousands) |
| |||||||
Committed Five-Year Unsecured Facility |
| 2021 |
| $ | 3,000,000 | |
| $ | 1,090,000 | |
| LIBOR or Base Rate + 0.00% to 1.45% |
Uncommitted Bilateral Facilities |
| 2019 |
| 515,000 | |
| 515,000 | |
| LIBOR or Base Rate + 0.00% to 1.20% | ||
In addition to our primary revolving lines of credit, we have a three-year $325.0 million committed revolving pre-export credit facility for CHS Agronegocio Industria e Comercio Ltda ("CHS Agronegocio"), our wholly-owned subsidiary in Brazil. CHS Agronegocio uses the facility, which expires in April 2019, to finance its working capital needs related to its purchases and sales of grains, fertilizers and other agricultural products. As of May 31, 2018 , the outstanding balance under the facility was $325.0 million.
In addition to our uncommitted bilateral facilities above, as of May 31, 2018 , our wholly-owned subsidiaries, CHS Europe S.a.r.l and CHS Agronegocio, had uncommitted lines of credit with $435.7 million outstanding. In addition, our other
42
Table of Contents
international subsidiaries had lines of credit with a total of $283.1 million outstanding as of May 31, 2018 , of which $10.6 million was collateralized.
On May 31, 2018 , and August 31, 2017 , we had total short-term indebtedness outstanding on these various primary and other facilities, as well as other miscellaneous short-term notes payable, totaling $2.7 billion and $1.7 billion, respectively.
Long-term Debt Financing
The following table presents summarized long-term debt data as of May 31, 2018 , and August 31, 2017 :
| May 31, |
| August 31, | ||||
| (Dollars in thousands) | ||||||
Private placement debt | $ | 1,511,153 | |
| $ | 1,643,886 | |
Bank financing | 366,000 | |
| 445,000 | | ||
Capital lease obligations | 27,176 | |
| 33,075 | | ||
Other notes and contract payable | 58,577 | |
| 62,652 | | ||
Deferred financing costs | (4,335 | ) |
| (4,820 | ) | ||
| $ | 1,958,571 | |
| $ | 2,179,793 | |
CHS Capital Financing
For a description of the Securitization Facility, see above in Fiscal 2018 and 2017 Activity and Note 14, Subsequent Events , of the notes to the consolidated financial statements that are included in this Quarterly Report on Form 10-Q.
CHS Capital has available credit under master participation agreements with numerous counterparties. Prior to the fourth quarter of fiscal 2017, all borrowings under these agreements were accounted for as secured borrowings. During the fourth quarter of fiscal 2017, certain of these agreements were amended resulting in the Company accounting for the participations as the sale of financial assets. In the second quarter of 2018, the remaining agreements were amended to account for the participations as the sale of financial assets. With the amendment, the notes receivable were removed from the Consolidated Balance Sheets.
CHS Capital sells loan commitments it has originated to ProPartners Financial on a recourse basis. The total outstanding commitments under the primary program totaled $312.0 million as of May 31, 2018 , of which $118.9 million was borrowed under these commitments with an interest rate of 3.03%.
CHS Capital borrows funds under short-term notes issued as part of a surplus funds program. Borrowings under this program are unsecured and bear interest at variable rates ranging from 0.10% to 0.90% as of May 31, 2018 , and are due upon demand. Borrowings under these notes totaled $45.9 million as of May 31, 2018 .
Covenants
Our long-term debt is unsecured; however, restrictive covenants under various debt agreements have requirements for maintenance of minimum consolidated net worth and other financial ratios. We were in compliance with all debt covenants and restrictions as of May 31, 2018 . Based on our current 2018 projections, we expect continued covenant compliance in the near term.
In September 2015, we amended all outstanding notes to conform the financial covenants applicable thereto to those of our amended and restated five-year, unsecured, revolving credit facility. The amended notes provide that if our ratio of consolidated funded debt to consolidated cash flow is greater than a ratio of 3.0 to 1.0, the interest rate on all outstanding notes will be increased by 0.25% until the ratio becomes 3.0 or less. During the nine months ended May 31, 2018 , and 2017 , our ratio of funded debt to consolidated cash flow remained below 3.0 to 1.0.
43
Table of Contents
Patronage and Equity Redemptions
In accordance with our bylaws and upon approval of our Board of Directors, annual net earnings from patronage sources are distributed to consenting patrons following the close of each fiscal year. For the year ended August 31, 2017, our Board of Directors authorized only non-qualified equity distributions in fiscal 2018, with no cash patronage. During the nine months ended May 31, 2017, we distributed cash patronage of $103.9 million .
As authorized by our Board of Directors in September 2017, we intend to redeem individual member owned equity in fiscal 2018, in an amount not to exceed $10 million. During the nine months ended May 31, 2018 , $3.7 million of that amount was redeemed in cash, compared to $25.5 million redeemed in cash during the nine months ended May 31, 2017. In addition, $2.1 million of equities related to the Board of Director authorized fiscal 2017 redemption were redeemed during the nine months ended May 31, 2018 , due to the administrative timing of the payments.
Preferred Stock
The following is a summary of our outstanding preferred stock as of May 31, 2018 , all shares of which are listed on the Global Select Market of Nasdaq:
|
| Nasdaq symbol |
| Issuance date |
| Shares outstanding |
| Redemption value |
| Net proceeds (a) |
| Dividend rate (b) (c) |
| Dividend payment frequency |
| Redeemable beginning (d) | ||||||
|
|
|
|
|
|
|
| (Dollars in millions) |
|
|
|
|
|
| ||||||||
8% Cumulative Redeemable |
| CHSCP |
| (e) |
| 12,272,003 | |
| $ | 306.8 | |
| $ | 311.2 | |
| 8.00 | % |
| Quarterly |
| 7/18/2023 |
Class B Cumulative Redeemable, Series 1 |
| CHSCO |
| (f) |
| 21,459,066 | |
| $ | 536.5 | |
| $ | 569.3 | |
| 7.875 | % |
| Quarterly |
| 9/26/2023 |
Class B Reset Rate Cumulative Redeemable, Series 2 |
| CHSCN |
| 3/11/2014 |
| 16,800,000 | |
| $ | 420.0 | |
| $ | 406.2 | |
| 7.10 | % |
| Quarterly |
| 3/31/2024 |
Class B Reset Rate Cumulative Redeemable, Series 3 |
| CHSCM |
| 9/15/2014 |
| 19,700,000 | |
| $ | 492.5 | |
| $ | 476.7 | |
| 6.75 | % |
| Quarterly |
| 9/30/2024 |
Class B Cumulative Redeemable, Series 4 |
| CHSCL |
| 1/21/2015 |
| 20,700,000 | |
| $ | 517.5 | |
| $ | 501.0 | |
| 7.50 | % |
| Quarterly |
| 1/21/2025 |
(a) | Includes patrons' equities redeemed with preferred stock. |
(b) | The Class B Reset Rate Cumulative Redeemable Preferred Stock, Series 2 accumulates dividends at a rate of 7.10% per year until March 31, 2024, and then at a rate equal to the three-month LIBOR plus 4.298%, not to exceed 8.00% per annum, subsequent to March 31, 2024. |
(c) | The Class B Reset Rate Cumulative Redeemable Preferred Stock, Series 3 accumulates dividends at a rate of 6.75% per year until September 30, 2024, and then at a rate equal to the three-month LIBOR plus 4.155%, not to exceed 8.00% per annum, subsequent to September 30, 2024. |
(d) | Preferred stock is redeemable for cash at our option, in whole or in part, at a per share price equal to the per share liquidation preference of $25.00 per share, plus all dividends accumulated and unpaid on that share to and including the date of redemption, beginning on the dates set forth in this column. |
(e) | The 8% Cumulative Redeemable Preferred Stock was issued at various times from 2003 through 2010. |
(f) | Shares of Class B Cumulative Redeemable Preferred Stock, Series 1 were issued on September 26, 2013, August 25, 2014, March 31, 2016, and March 30, 2017. |
Dividends paid on our preferred stock during the nine months ended May 31, 2018, and 2017 , were $ 126.5 million and $ 125.5 million , respectively.
44
Table of Contents
Off Balance Sheet Financing Arrangements
Operating Leases
Minimum future lease payments required under noncancelable operating leases as of May 31, 2018 , were $292.5 million.
Guarantees
We are a guarantor for lines of credit and performance obligations of related companies. As of May 31, 2018 , our bank covenants allowed maximum guarantees of $1.0 billion, of which $107.9 million were outstanding. We have collateral for a portion of these contingent obligations. We have not recorded a liability related to the contingent obligations as we do not expect to pay out any cash related to them, and the fair values are considered immaterial. The underlying loans to the counterparties for which we provide guarantees were current as of May 31, 2018 .
Debt
We have no material off balance sheet debt.
Receivables Securitization Facility and Loan Participations
In fiscal 2017, we engaged in off-balance sheet arrangements through our Securitization Facility and certain loan participation agreements. Refer to further details about these arrangements in Note 2, Receivables, and Note 14 , Subsequent Events, of the notes to the consolidated financial statements that are included in this Quarterly Report on Form 10-Q and our Annual Report on Form 10-K for the year ended August 31, 2017, for additional information.
Contractual Obligations
Our contractual obligations presented in Management's Discussion and Analysis of Financial Condition and Results of Operations in our Annual Report on Form 10-K for the year ended August 31, 2017 , have not materially changed during the nine months ended May 31, 2018 .
Critical Accounting Policies
Our critical accounting policies presented in Management's Discussion and Analysis of Financial Condition and Results of Operations in our Annual Report on Form 10-K for the year ended August 31, 2017 , have not materially changed during the nine months ended May 31, 2018 .
Effect of Inflation and Foreign Currency Transactions
We believe that inflation and foreign currency fluctuations have not had a material effect on our operations since we conduct an insignificant portion of our business in foreign currencies.
Recent Accounting Pronouncements
See Note 1, Organization, Basis of Presentation and Significant Accounting Policies , to our unaudited consolidated financial statements included in this Quarterly Report on Form 10-Q for a description of the recent accounting pronouncements that are applicable to us.
ITEM 3. QUANTITATIVE AND QUALITATIVE DISCLOSURES ABOUT MARKET RISK
We did not experience any material changes in market risk exposures for the period ended May 31, 2018 , that affect the quantitative and qualitative disclosures presented in our Annual Report on Form 10-K for the year ended August 31, 2017 .
45
Table of Contents
ITEM 4. CONTROLS AND PROCEDURES
Under the supervision and with the participation of our management, including our Chief Executive Officer and Chief Financial Officer, we evaluated the effectiveness of our disclosure controls and procedures (as defined in Rule 13a-15(e)) under the Securities Exchange Act of 1934 (the "Exchange Act") as of May 31, 2018 . Based on that evaluation, our Chief Executive Officer and Chief Financial Officer concluded that, as of that date, our disclosure controls and procedures were effective.
On December 1, 2015, we began implementation of a new enterprise resource planning ("ERP") system. The new ERP system is expected to take several years to fully implement, and has and will continue to require significant capital and human resources to deploy. The implementation of the new ERP system will affect the processes that constitute our internal control over financial reporting (as defined in Rule 13a-15(f) under the Exchange Act), and our management has taken steps to ensure that appropriate controls are designed and implemented as each functional area of the new ERP system is enacted.
Other than as described above, there were no changes in our internal control over financial reporting during the quarter ended May 31, 2018 , that have materially affected, or are reasonably likely to materially affect, our internal control over financial reporting.
46
Table of Contents
PART II. OTHER INFORMATION
ITEM 1. LEGAL PROCEEDINGS
We are involved as a defendant in various lawsuits, claims and disputes, which are in the normal course of our business. The resolution of any such matters may affect consolidated net income for any fiscal period; however, our management believes any resulting liabilities, individually or in the aggregate, will not have a material effect on our consolidated financial position, results of operations or cash flows during any fiscal year.
Laurel
On May 17, 2016, and October 12, 2016, the Montana Department of Environmental Quality ("MDEQ") issued violation letters to us, alleging that certain specified air emissions at our Laurel, Montana refinery exceeded amounts allowable under the refinery's permits and applicable law. On June 1, 2016, and November 3, 2016, we responded to MDEQ and described the actions that we had taken in connection with those allegations. On August 30, 2017, MDEQ sent us a letter requesting that we execute an administrative order on consent, and pay an administrative penalty of $184,550. On September 27, 2017, we sent MDEQ a letter providing additional information and requesting that MDEQ reconsider the alleged violations and reduce the proposed penalty with respect to four of the alleged violations described in the violation letters. We also requested changes to the administrative order on consent to remove references to the Administrative Rules of the State of Montana. MDEQ responded to our request on January 4, 2018, revising some findings and reducing the proposed penalty to $177,950. On January 27, 2018, we sent MDEQ a response providing further explanation regarding certain items and requesting an additional reduction in the proposed penalty. MDEQ did not agree to further reductions in the penalty. As a result, on April 1, 2018, we paid a $177,950 cash penalty to MDEQ. MDEQ acknowledged receipt of the payment and closed its file on this matter on May 1, 2018.
For information regarding our other reportable legal proceedings, see Item 3 of our Annual Report on Form 10-K for the year ended August 31, 2017 .
ITEM 1A. RISK FACTORS
There were no material changes to our risk factors during the period covered by this report. See the discussion of risk factors in Item 1A of our Annual Report on Form 10-K for the year ended August 31, 2017 .
ITEM 6. EXHIBITS
Exhibit | Description |
10.1 | Letter Agreement, dated as of March 15, 2018, between Shirley Cunningham and CHS Inc. (incorporated by reference to our Current Report on Form 8-K, filed March 15, 2018) |
31.1 | Certification of the Chief Executive Officer Pursuant to Section 302 of the Sarbanes-Oxley Act of 2002 |
31.2 | Certification of the Chief Financial Officer Pursuant to Section 302 of the Sarbanes-Oxley Act of 2002 |
32.1 | Certification of the Chief Executive Officer Pursuant to 18 U.S.C. Section 1350, as Adopted Pursuant to Section 906 of the Sarbanes-Oxley Act of 2002 |
32.2 | Certification of the Chief Financial Officer Pursuant to 18 U.S.C. Section 1350, as Adopted Pursuant to Section 906 of the Sarbanes-Oxley Act of 2002 |
101 | The following financial information from CHS Inc.'s Quarterly Report on Form 10-Q for the quarterly period ended May 31, 2018, formatted in Extensible Business Reporting Language (XBRL): (i) the Consolidated Balance Sheets, (ii) the Consolidated Statements of Operations, (iii) the Consolidated Statements of Comprehensive Income, (iv) the Consolidated Statements of Cash Flows, and (v) the Notes to the Consolidated Financial Statements. |
______________________________________
47
Table of Contents
SIGNATURES
Pursuant to the requirements of the Securities Exchange Act of 1934, as amended, the registrant has duly caused this report to be signed on its behalf by the undersigned, thereunto duly authorized.
CHS Inc.
(Registrant)
Date: | July 11, 2018 |
| By: |
| /s/ Timothy Skidmore |
|
|
|
|
| Timothy Skidmore |
|
|
|
|
| Executive Vice President and Chief Financial Officer |
48