Table of Contents
UNITED STATES
SECURITIES AND EXCHANGE COMMISSION
Washington, D.C. 20549
|
FORM 10-K |
|
ý | ANNUAL REPORT PURSUANT TO SECTION 13 OR 15(d) OF THE SECURITIES EXCHANGE ACT OF 1934 |
For the fiscal year ended February 3, 2018
¨ | TRANSITION REPORT PURSUANT TO SECTION 13 OR 15(d) OF THE SECURITIES EXCHANGE ACT OF 1934 |
Commission file number: 001-16435
|
Chico's FAS, Inc.(Exact name of registrant as specified in charter) |
|
Florida |
| 59-2389435 |
(State or other jurisdiction of incorporation) |
| (IRS Employer Identification No.) |
|
|
|
11215 Metro Parkway, Fort Myers, Florida |
| 33966 |
(Address of principal executive offices) |
| (Zip code) |
(239) 277-6200
(Registrant's telephone number)
Securities registered pursuant to Section 12(b) of the Act:
Title of Class |
| Name of Exchange on Which Registered |
Common Stock, Par Value $0.01 Per Share |
| New York Stock Exchange |
Securities registered pursuant to Section 12(g) of the Act: None
|
Indicate by check mark if the registrant is a well-known seasoned issuer, as defined in Rule 405 of the Securities Act. Yes ý No ¨
Indicate by check mark if the registrant is not required to file reports pursuant to Section 13 or Section 15(d) of the Act. Yes ¨ No ý
Indicate by check mark whether the registrant (1) has filed all reports required to be filed by Section 13 or 15(d) of the Securities Exchange Act of 1934 during the preceding 12 months (or for such shorter period that the registrant was required to file such reports), and (2) has been subject to such filing requirements for the past 90 days. Yes ý No ¨
Indicate by check mark whether the registrant has submitted electronically and posted on its corporate Website, if any, every Interactive Data File required to be submitted and posted pursuant to Rule 405 of Regulation S-T (§232.405 of this chapter) during the preceding 12 months (or for such shorter period that the registrant was required to submit and post such files). Yes ý No ¨
Indicate by check mark if disclosure of delinquent filers pursuant to Item 405 of Regulation S-K (§229.406 of this chapter) is not contained herein, and will not be contained, to the best of registrant's knowledge, in definitive proxy or information statements incorporated by reference in Part III of this Form 10-K or any amendment to this Form 10-K ý .
Indicate by check mark whether the registrant is a large accelerated filer, an accelerated filer, a non-accelerated filer, a smaller reporting company, or emerging growth company. See the definitions of "large accelerated filer," "accelerated filer", "smaller reporting company", "and "emerging growth company" in Rule 12b-2 of the Exchange Act. (Check one):
Large accelerated filer |
| ý |
| Accelerated filer |
| ¨ |
Non-accelerated filer |
| ¨ (do not check if a smaller reporting company) |
| Smaller reporting company |
| ¨ |
|
|
|
| Emerging growth company |
| ¨ |
If an emerging growth company, indicate by check mark if the registrant has elected not to use the extended transition period for complying with any new or revised financial accounting standards provided pursuant to Section 13(a) of the Exchange Act. ¨
Indicate by check mark whether the registrant is a shell company (as defined in Rule 12b-2 of the Act). Yes ¨ No ý
State the aggregate market value of the voting and non-voting common equity held by non-affiliates of the registrant:
Approximately $1,142,000,000 as of July 29, 2017, based upon the closing stock price on July 28, 2017 as reported by the NYSE.
Indicate the number of shares outstanding of each of the registrant's classes of common stock, as of the latest practicable date:
Common Stock, par value $0.01 per share – 127,468,432 shares as of February 26, 2018 .
Documents incorporated by reference:
Portions of the Definitive Proxy Statement for the Company's Annual Meeting of Shareholders presently scheduled for June 21, 2018 are incorporated by reference into Part III of this Annual Report on Form 10-K.
Table of Contents
CHICO'S FAS, INC.
ANNUAL REPORT ON FORM 10-K
FOR THE
FISCAL YEAR ENDED FEBRUARY 3, 2018
TABLE OF CONTENTS
PART I |
| 2 | |
| Item 1. | Business | 2 |
| Item 1A. | Risk Factors | 8 |
| Item 1B. | Unresolved Staff Comments | 15 |
| Item 2. | Properties | 15 |
| Item 3. | Legal Proceedings | 15 |
| Item 4. | Mine Safety Disclosures | 15 |
|
|
| |
PART II |
| 16 | |
| Item 5. | Market for Registrant's Common Equity, Related Stockholder Matters and Issuer Purchases of Equity Securities | 16 |
| Item 6. | Selected Financial Data | 18 |
| Item 7. | Management's Discussion and Analysis of Financial Condition and Results of Operations | 19 |
| Item 7A. | Quantitative and Qualitative Disclosures About Market Risk | 30 |
| Item 8. | Financial Statements and Supplementary Data | 31 |
| Item 9. | Changes in and Disagreements with Accountants on Accounting and Financial Disclosure | 57 |
| Item 9A. | Controls and Procedures | 57 |
| Item 9B. | Other Information | 59 |
|
|
|
|
PART III |
|
| 59 |
| Item 10. | Directors, Executive Officers and Corporate Governance | 59 |
| Item 11. | Executive Compensation | 59 |
| Item 12. | Security Ownership of Certain Beneficial Owners and Management and Related Stockholder Matters | 59 |
| Item 13. | Certain Relationships and Related Transactions, and Director Independence | 60 |
| Item 14. | Principal Accounting Fees and Services | 60 |
|
|
|
|
PART IV |
|
| 61 |
| Item 15. | Exhibits and Financial Statement Schedules | 61 |
| Item 16. | Form 10-K Summary | 65 |
Table of Contents
PART I
This Annual Report on Form 10-K contains forward-looking statements within the meaning of Section 27A of the Securities Act of 1933 and Section 21E of the Securities Exchange Act of 1934, and are subject to risks, uncertainties, and other factors which could cause actual results to differ materially from those expressed or implied by such forward-looking statements. See "Item 1A. Risk Factors."
ITEM 1. | BUSINESS |
Overview
Chico's FAS, Inc. 1 , is a leading omni-channel specialty retailer of women's private branded, sophisticated, casual-to-dressy apparel, intimates and complementary accessories. We operate under the Chico's, White House Black Market ("WHBM") and Soma brand names in the United States, Puerto Rico, the U.S. Virgin Islands and Canada. Our distinct lifestyle brands serve the needs of fashion-savvy women 35 years and older. We earn revenues and generate cash through the sale of merchandise in our domestic and international retail stores, our various e-commerce websites and our call center, which takes orders for all of our brands, and through an unaffiliated franchise partner in Mexico. We view our stores and Company-operated e-commerce websites as a single, integrated sales function rather than as separate sales channels operating independently. As of February 3, 2018 , we operated 1,460 stores across 46 states, Puerto Rico, the U.S. Virgin Islands and Canada, and sold merchandise through 94 franchise locations in Mexico.
Since 1983, we have grown by offering high quality and unique merchandise, supported by compelling marketing and outstanding personalized customer service. While each of our brands has a distinct customer base, the overall portfolio caters to a broad age and economic demographic, with household incomes in the moderate to high income level.
Our Brands
Chico's
The Chico's brand, which began operations in 1983, primarily sells exclusively designed, private branded clothing focusing on women 45 and older. The style sensibility is unique with an individual expression created to illuminate the women wearing the brand. Chico's apparel, including the Black Label, Zenergy and Travelers collections, emphasizes problem solving styles, comfort and relaxed fit. Accessories and jewelry are original and designed to elevate the clothing assortment, allowing our customer to individualize her personal style. Chico's is vertically integrated, controlling almost all aspects of the apparel design process, including choices of pattern, print, construction, design specifications, fabric, finishes and color through in-house designers, purchased designs and independent suppliers.
The distinctive nature of Chico's clothing is also reflected in its sizing, which is comprised of sizes 000, 00 (size 0-2), 0 (size 4-6), 1 (size 8-10), 2 (size 12-14), 3 (size 16-18) and 4 (size 20-22). Chico's will occasionally offer half-sizes (up to 4.5), one-size-fits-all, petite sizes, short and tall inseams, and small, medium and large sizing for some items. The relaxed fit allows us to utilize this kind of sizing and thus offer a wide selection of clothing without investing in a large number of sizes within a single style.
White House Black Market
The WHBM brand, which began operations in 1985 and was acquired in September 2003, is dedicated to being a go-to style destination and authority on wardrobe building. WHBM primarily sells exclusively designed, private branded clothing focusing on women 35 and older. WHBM offers a modern collection for the way women live now, selling stylish and versatile clothing and accessory items, including everyday basics, polished workwear, black and white pieces, and feminine, all-occasion dresses. The accessories at WHBM, such as shoes, belts, scarves, handbags and jewelry, are specifically designed to coordinate with each collection, allowing customers to easily individualize their wardrobe selections. WHBM is vertically integrated, controlling almost all aspects of the apparel design process, including choices of patterns, prints, construction, design specifications, fabric, finishes and color through in-house designers, purchased designs and independent suppliers.
___________________________
1 | As used in this report, all references to "we," "us," "our" and "the Company," refer to Chico's FAS, Inc., a Florida corporation, and all of its wholly-owned subsidiaries. |
2
Table of Contents
WHBM uses American sizes in the 00-14 range (with online sizes up to 16), including petite sizing, as well as short and long inseams, and small, medium and large sizing for some items. The fit of the WHBM clothing is tailored to complement the figure of a body-conscious woman, while still remaining comfortable.
Soma
The Soma brand, which began operations in 2004, primarily sells exclusively designed, private branded lingerie, sleepwear, loungewear, activewear, swimwear and beauty products focusing on women 35 and older. The Soma brand's core franchise emphasizes solutions, including vanishing back bras, vanishing edge panties, slimming leggings and cool nights sleepwear. Bras range in size from 32A-46HH. The sleepwear and loungewear offerings range from extra small to extra-extra large sizing. The beauty category consists of the Memorable, Enticing and Oh My Gorgeous lines of fine fragrance. The Soma team develops product offerings by working closely with a small number of independent suppliers to design proprietary products in-house and, in some cases, designs provided by its independent suppliers under labels other than the Soma brand.
Our Business Strategy
Our overall business strategy is focused on building a collection of distinct high-performing retail brands serving the fashion needs of women 35 and older. We seek to accomplish this strategy through our five focus areas: (1) evolving the customer experience, (2) strengthening our brands' positions, (3) leveraging actionable retail science, (4) building growth platforms and (5) achieving operational excellence. Over the long term, we may build our brand portfolio by organic development or acquisition of other specialty retail concepts if research indicates that the opportunity complements our current brands and is appropriate and in the best interest of the shareholders.
We pursue improving the performance of our brands by building our omni-channel capabilities, which includes managing our store base and growing our online presence, by executing marketing plans, by effectively leveraging expenses, by considering additional sales channels and markets, and by optimizing the merchandise offerings of each of our brands. We continue to invest heavily in our omni-channel capabilities in order to allow customers to fully experience our brands in the manner they choose.
We view our stores and Company-operated e-commerce websites as a single, integrated sales function rather than as separate sales channels operating independently. To that end, we often refer to our brands' respective websites as the brand's "largest store". Customers may shop in one place and consummate the purchase somewhere else. Our domestic customers can return merchandise to a store or to our distribution center, regardless of where they purchased it. As a result, we maintain a shared inventory platform for our operations, allowing us to fulfill orders for all channels from our distribution center ("DC") in Winder, Georgia. We also fulfill in-store orders directly from other stores.
We seek to acquire and retain customers by leveraging existing customer-specific data and through targeted marketing, including e-marketing, television, catalogs and mailers. We seek to optimize the potential of our brands with improved product offerings, potential new merchandise opportunities, and brand extensions that enhance the current offerings, as well as through our continued emphasis on our "Most Amazing Personal Service" standard. We also will continue to consider potential alternative sales channels for our brands, including international franchising and licensing, wholesale opportunities and others.
In fiscal 2016, we began implementing cost reduction and operating efficiency initiatives, including realigning marketing and digital commerce, improving supply chain efficiency and reducing non-merchandise expenses. In fiscal 2017, we strengthened our brand positioning and began preparing for future growth. We are now intently focused on evolving the customer experience and leveraging actionable retail science to drive profitable retail sales. Additionally, we have launched multiple initiatives that utilize technology and new platforms to drive growth.
3
Table of Contents
Our Customer Service Model
Our customers deserve outstanding and personalized customer service, which we strive to achieve through our trademark "Most Amazing Personal Service" standard. We believe this service model is one of our competitive advantages and a key to our continued success. An important aspect of our successful implementation of this model involves the specialized training we give sales associates to help meet their customers' fashion and wardrobe needs, including clothing and accessory style, color selection, coordination of complete outfits and suggestions on different ways in which to wear the clothing and accessories. Our sales associates are encouraged to develop long-term relationships with their customers, to know their customers' preferences and to assist those customers in selecting merchandise best suited to their tastes and wardrobe needs. Our brands utilize tablets in stores to access customer purchase history and style preferences as a clienteling tool that enhances the shopping experience in a personalized and efficient manner.
We also serve our customers' needs and build customer loyalty through our customer rewards programs. Our programs are designed to reward our loyal customers by leveraging the rich data our customers share with us to deliver a relevant and engaging experience with our brands. The benefits provided are routinely evaluated in conjunction with our overall customer relationship management and marketing activities to ensure they remain a compelling reason for customers to shop at our brands.
• | Chico's . A Chico's customer can join the "Passport" program at no cost and receive additional benefits after spending a fixed amount. Features of the program include a 5% discount, exclusive offers, special promotions, free shipping, invitations to private sale events and advance notice regarding new arrivals. |
• | WHBM . With "WHBM Rewards", a customer can join at no cost for tier-based discounts, a 5% discount after spending a fixed amount, free shipping, special promotions and invitations to private sales based on annual spend. |
• | Soma . A Soma customer can join "Love Soma Rewards" at no cost and earns points based on purchases. Features of the program include reward coupons at specified loyalty point levels, exclusive promotions and free shipping. |
Our Boutiques and Outlet Stores
Our boutiques are located in upscale indoor shopping malls, outdoor shopping areas and standalone street-front locations in the United States, Puerto Rico, the U.S. Virgin Islands and Canada. Boutique locations are determined on the basis of various factors, including, but not limited to: geographic and demographic characteristics of the market, nearby competitors, our own network of existing boutiques, the location of the shopping venue, including the site within the shopping center, proposed lease terms, anchor or other co-tenants, parking accommodations and convenience. Our merchandise is also sold through franchise locations in Mexico, including boutique locations as well as shop-in-shop formats within a department store environment.
Our outlet stores are primarily located in quality outlet centers. The Chico's and WHBM brand outlets, including our hybrid Chico's Off the Rack format, contain a mixture of made-for-outlet and clearance merchandise. The made-for-outlet product carries a higher margin than the clearance items from our boutique stores. Soma outlets contain a mix of boutique and clearance merchandise. We also sell clearance merchandise on our websites. We regularly review the appropriate ratio of made-for-outlet and clearance merchandise sold at our outlets and adjust that ratio as appropriate.
4
Table of Contents
As of February 3, 2018 , we operated 1,460 retail stores in 46 states, Puerto Rico, the U.S. Virgin Islands and Canada. As of February 3, 2018 , our merchandise was also sold through 94 franchise locations in Mexico. The following tables set forth information concerning our retail stores during the past five fiscal years:
| Fiscal Year 1 | |||||||||||||
Stores | 2017 |
| 2016 |
| 2015 |
| 2014 |
| 2013 | |||||
Stores at beginning of year | 1,501 | |
| 1,518 | |
| 1,547 | |
| 1,472 | |
| 1,357 | |
Opened | 7 | |
| 17 | |
| 40 | |
| 109 | |
| 135 | |
Closed | (48 | ) |
| (34 | ) |
| (69 | ) |
| (34 | ) |
| (20 | ) |
Total Stores | 1,460 | |
| 1,501 | |
| 1,518 | |
| 1,547 | |
| 1,472 | |
|
|
|
|
|
|
|
|
|
| |||||
| Fiscal Year End | |||||||||||||
Stores by Brand | 2017 |
| 2016 |
| 2015 |
| 2014 |
| 2013 | |||||
Chico's frontline boutiques | 568 | |
| 587 | |
| 604 | |
| 613 | |
| 611 | |
Chico's outlets | 120 | |
| 116 | |
| 117 | |
| 118 | |
| 110 | |
Chico's Canada | 4 | |
| 4 | |
| 4 | |
| 3 | |
| - | |
Chico's total | 692 | |
| 707 | |
| 725 | |
| 734 | |
| 721 | |
WHBM frontline boutiques | 404 | |
| 423 | |
| 429 | |
| 441 | |
| 436 | |
WHBM outlets | 69 | |
| 71 | |
| 71 | |
| 68 | |
| 59 | |
WHBM Canada | 6 | |
| 6 | |
| 6 | |
| 5 | |
| 3 | |
WHBM total | 479 | |
| 500 | |
| 506 | |
| 514 | |
| 498 | |
Soma frontline boutiques | 270 | |
| 275 | |
| 269 | |
| 263 | |
| 232 | |
Soma outlets | 19 | |
| 19 | |
| 18 | |
| 17 | |
| 17 | |
Soma total | 289 | |
| 294 | |
| 287 | |
| 280 | |
| 249 | |
Boston Proper boutiques | - | |
| - | |
| - | |
| 19 | |
| 4 | |
Total Stores | 1,460 | |
| 1,501 | |
| 1,518 | |
| 1,547 | |
| 1,472 | |
________________________
1 Our fiscal years end on the Saturday closest to January 31 and are designated by the calendar year in which the fiscal year commences. The periods presented in these financial statements are the fiscal years ended February 3, 2018 ("fiscal 2017 ", " 2017 " or "current period"), January 28, 2017 ("fiscal 2016 ", " 2016 " or "prior period"), January 30, 2016 ("fiscal 2015 " or " 2015 "), January 31, 2015 ("fiscal 2014 " or " 2014 ") and February 1, 2014 ("fiscal 2013 " or " 2013 "). Each of these periods had 52 weeks, except for fiscal 2017, which consisted of 53 weeks.
In fiscal 2018 , we anticipate approximately 50 net store closures. We continuously evaluate the appropriate new store growth rate and closures in light of economic conditions and may adjust the growth rate and closures as conditions require or as opportunities arise. Our unaffiliated franchisee expects to continue opening franchise locations in Mexico.
Digital Commerce
Each of our brands has a digital flagship: www.chicos.com , www.whbm.com and www.soma.com , which provide customers the ability to browse and order merchandise, locate our stores and engage with content to enhance the shopping experience. Additionally, in fiscal 2017 , we launched www.chicosofftherack.com , a new e-commerce site that gives customers 24/7 access to the same exclusive styles available at our Chico's Outlet locations. Our websites are designed to complement the in-store experience and play a vital role in both our omni-channel strategy and the customer experience. Some products are available exclusively online including extended sizes, additional style and color choices, premier partner brands and clearance items. Online merchandise is also available for order through our call centers and in our stores through our clienteling applications. Domestic customers may return product directly to our DC or in our store locations regardless of the channel in which the merchandise was purchased.
5
Table of Contents
We remain focused on our efforts to better align with shifts in customer traffic and consumers' consumption of media and content. As a result of significant increases in mobile traffic, in 2016 we implemented a responsive website design for Chico's and WHBM to ensure a consistent and seamless customer experience across devices. In fiscal 2017, we completed the responsive website design conversion for Soma. We will maintain focus on our omni-channel approach by enhancing all brand websites through new features, functionality, search engine optimization and content designed to improve and evolve the customer's experience.
Marketing and Advertising
Driven by our industry-leading transactional data, our brands continue to develop targeted and effective marketing strategies. We continue to optimize and shift advertising from traditional to digital media with a focus on attracting new customers and using predictive modeling and advanced segmentation to drive retention and reactivation.
Our marketing programs currently consists of the following media mix to engage current and prospective customers:
• | Loyalty and rewards programs; |
• | Direct marketing: catalogs, postcards, email and calling campaigns; |
• | Digital marketing: mobile paid search, product listing ads, display banner advertising and remarketing, affiliate programs; |
• | Social marketing: organic and paid efforts across social platforms; |
• | National and local print and broadcast advertising; |
• | Editorial content; |
• | Public relations; and |
• | Charitable giving and outreach programs. |
In 2018 , our marketing efforts will remain focused on attracting customers to our iconic brands' differentiated positioning by leveraging retail science and introducing alternative sales channels.
Information Technology/Data Analytics
We are committed to having information systems that enable us to obtain, analyze and act upon information on a timely basis and to maintain effective financial and operational controls. This effort includes testing of new products and applications so that we are able to take advantage of technological developments to support and enhance our processes across all areas of our business. We use a proprietary customer database, together with data analytics, to customize our communications and make targeted offers to customers in an effort to increase traffic in-store and online and to increase conversion.
Merchandise Distribution
The distribution functions for all brands are handled from our DC in Winder, Georgia. New merchandise is generally received daily at the DC. Imported merchandise is shipped from the country of export by sea, air, truck or rail, as circumstances require. Domestic merchandise is primarily shipped by truck or rail. Upon arrival at the DC, merchandise is sorted and packaged for shipment to individual stores or is held for future store replenishment or direct shipment to customers. Merchandise is generally pre-ticketed with price and related informational tags at the point of manufacture.
Our DC has been granted Foreign Trade Zone status from the Department of Commerce and U.S. Customs and Border Protection. This status facilitates international expansion and allows us to move certain merchandise to the DC without paying U.S. Customs duty until the merchandise is shipped to domestic stores or online customers.
Product Sourcing
Our product sourcing activities are performed by a centralized shared service team focused on identifying cost-effective opportunities to improve production speed and flexibility while maintaining our quality standards. In fiscal 2017 , China sources accounted for approximately 52% of our merchandise cost. We take ownership in the foreign country, at a designated point of entry into the United States, or at our DC, depending on the specific terms of sale.
We purchase the majority of our merchandise through key suppliers with whom we have established strategic collaborations; these key suppliers represented 61% of our purchases in fiscal 2017 with our largest supplier accounting for 23% of the total. Currently, we believe our product sourcing is appropriately distributed among suppliers and across countries of manufacture taking into consideration product quality execution, flexibility and speed at an acceptable cost and level of risk.
6
Table of Contents
Competition
The women's retail apparel and intimate apparel business is highly competitive and includes local, national and international department stores, specialty stores, boutique stores, catalog companies and online retailers. We believe that our distinctively designed merchandise offerings and emphasis on customer service distinguish us from our competitors.
Trademarks and Service Marks
We are the owner of certain registered and common law trademarks and service marks (collectively referred to as "Marks").
Our Marks include, but are not limited to: CHICO'S, CHICO'S PASSPORT, ZENERGY, SO SLIMMING, WHITE HOUSE BLACK MARKET, WHBM REWARDS, WORK KIT, SOMA, SOMA INTIMATES, ENTICING, COOL NIGHTS, EMBRACEABLE, VANISHING BACK, VANISHING EDGE, LOVE SOMA REWARDS and CHICO'S OFF THE RACK. We have registered or are seeking to register a number of these Marks in the United States, Canada, Mexico and other foreign countries.
In the opinion of management, our rights in the Marks are important to our business. Accordingly, we intend to maintain our Marks and the related registrations and applications. We are not aware of any material claims of infringement or other challenges to our rights to use any registered Marks in the United States.
Available Information
Through our investor relations website, www.chicosfas.com , we make available free of charge our Securities and Exchange Commission ("SEC") filings, including our Annual Report on Form 10-K, quarterly reports on Form 10-Q, current reports on Form 8-K, and amendments to those reports, as soon as reasonably practicable after those reports are electronically filed with the SEC and are available at www.sec.gov . This website also includes recent press releases, corporate governance information, beneficial ownership reports, institutional presentations, quarterly and institutional conference calls and other financial data, including historical store square footage.
Our Code of Ethics, which is applicable to all of our employees, including the principal executive officer, the principal financial officer and the Board of Directors ("Board"), is posted on our investor relations website. Any amendments to or waivers from our Code of Ethics are also available on this website. Charters of each of the Audit Committee, Human Resources, Compensation and Benefits Committee, Corporate Governance and Nominating Committee and Executive Committee as well as the Corporate Governance Guidelines, Insider Trading Policy, Terms of Commitment to Ethical Sourcing and Stock Ownership Guidelines are available on this website or upon written request by any shareholder.
Employees
As of February 3, 2018 , we employed approximately 19,000 people, approximately 30% of whom were full-time employees and the balance of whom were part-time employees. The number of part-time employees fluctuates during peak selling periods. As of the above date, approximately 90% of our employees worked in our boutique and outlet stores. We have no collective bargaining agreements covering any of our employees, have never experienced any material labor disruption and are unaware of any efforts or plans to organize our employees. We consider the overall relations with our employees to be good.
7
Table of Contents
ITEM 1A. | RISK FACTORS |
An investment in our common stock involves certain risks. The risks and uncertainties described below are not the only risks that may have a material adverse effect on the Company, and the risks described herein are not listed in order of the potential occurrence or severity . There is no assurance that we have identified, assessed and appropriately addressed all risks affecting our business operations . Additional risks and uncertainties could adversely affect our business and our results. If any of the following risks actually occur, our business, consolidated financial condition or results of operations could be negatively affected, and the market price for our shares could decline. Further, to the extent that any of the information contained in this Annual Report on Form 10-K constitutes forward-looking statements, the risk factors set forth below are cautionary statements, identifying important factors that could cause the Company's actual results to differ materially from those expressed in or implied by any forward-looking statements made by or on behalf of the Company. There can also be no assurance that the actual future results, performance, benefits or achievements that we expect from our strategies, systems, initiatives or products will occur.
Business Strategy
If we cannot successfully execute our business strategy, our consolidated financial condition and results of operations could be materially adversely impacted. There are numerous risks associated with this strategy including, but not limited to, the following:
Risk | Description | |
|
| |
1. Failure to implement and manage our business strategy | Our long-term omni-channel business strategy is dependent upon a number of factors, including anticipating and quickly responding to changing customer preferences, shopping habits (such as online versus in-store) and fashion trends, identifying and developing new brand extensions, markets and channels of distribution, effectively using our marketing resources to communicate with existing and potential customers, effectively managing our store base, including management of store productivity and negotiating acceptable lease terms, effectively managing our wholesale licensing and franchising relationships to optimize sales and margin and to protect our brands, having the appropriate corporate resources to support our business strategies, sourcing levels of inventory in line with expected sales and then managing its disposition, hiring, training and retaining qualified employees, generating sufficient operating cash flows to fund our business strategies, maintaining brand-specific websites that offer the system functionality, service and security customers expect, and correctly identifying, implementing and maintaining appropriate technology to support our business strategies. | |
2. Competition | The women's specialty retail industry is highly competitive. We compete with local, national and international department stores, specialty and discount stores, catalogs and internet businesses offering similar categories of merchandise. Many of our competitors have advantages over us, including substantially greater financial, marketing, distribution and other resources. Increased levels of promotional activity by our competitors, some of whom may be able to adopt more aggressive pricing policies than we can, both online and in stores, may negatively impact our sales and profitability. There is no assurance that we can compete successfully with these companies in the future. In addition to competing for sales, we compete for store and online traffic, for favorable store locations and lease terms and for qualified associates. The growth of fast fashion, value fashion retailers and expansion of off-price retailers has shifted shopper expectations to more affordable pricing of well-known brands and has contributed to continued promotional pressure as well as a shift in customers' expectations with regard to the timing and costs of product deliveries and returns. If we do not identify and respond to these emerging trends in consumer spending as well as the growing preference of many customers for online e-commerce options, we may harm our ability to retain our existing customers or attract new customers. Increased competition in any of these areas may result in higher costs or otherwise reduce our sales or operating margins. |
8
Table of Contents
3. Risks of expanding internationally | Our current growth strategy includes potential expansion of our operations and presence internationally. As part of that strategy, we may face unanticipated and significant costs and challenges in setting up foreign offices, hiring experienced management or franchising partners, negotiating profitable licensing or franchising agreements, obtaining prime locations for stores, introducing and marketing our brands, and others. We may be unable to successfully grow our international business, or we may face operational issues or resource constraints that delay our intended pace of international growth, such as an inability to identify suitable franchising partners, to identify profitable markets for our brands and sites for store locations, to anticipate and address the different operational or cultural challenges presented in a new country, to find vendors that can meet our international merchandise needs, to provide adequate resource and system support through our shared service model, to achieve acceptable operating margins, compete with local competitors or adapt to different consumer demand and behavior. Any challenges that we encounter may divert financial, operational and managerial resources from our existing operations. In addition, we are subject to certain U.S. laws that may impact our international operations or expansion, including the Foreign Corrupt Practices Act, as well as the laws of the foreign countries in which we operate. Violations of these laws could subject us to sanctions or other penalties that could negatively affect our reputation, business and operating results. |
General Economic Conditions
Numerous economic conditions, all of which are outside of our control, could negatively affect the level of our customers' spending or our costs of operations. If these economic conditions persist for a sustained period, our consolidated financial condition and results of operations could be materially adversely impacted. These economic conditions include, but are not limited to, the following:
Risk | Description |
|
|
4. Declines in consumer spending | Consumer spending in our sector may decline as a result of: threatened or actual government shut downs, higher unemployment levels, low levels of consumer credit, declines in consumer confidence, inflation, changes in interest rates, recessionary pressures, increasing gas and other energy costs, increased taxes, changes in housing prices, higher durable goods or other consumer spending, volatility in the financial markets and changes in the political climate or conditions. |
5. Fluctuating costs | Fluctuations in the price, availability and quality of fabrics and other raw materials used to manufacture our products, as well as the price for labor and transportation, may contribute to ongoing pricing pressures throughout our supply chain. The price and availability of such inputs to the manufacturing process may fluctuate significantly, depending on several factors, including commodity costs (such as higher cotton prices), energy costs (such as fuel), shipping costs, inflationary pressures from emerging markets, increased labor costs, weather conditions and currency fluctuations. |
6. Impairment charges | Significant negative industry or general economic trends, changes in customer demand for our product, disruptions to our business and unexpected significant changes or planned changes in our operating results or use of long-lived assets (such as boutique relocations or discontinuing use of certain boutique fixtures) may result in impairments to goodwill, intangible assets and other long-lived assets. |
9
Table of Contents
7. Fluctuating comparable sales and operating results | Our comparable sales and overall operating results have fluctuated in the past and are expected to continue to fluctuate in the future. In addition to other factors discussed in this Item 1A., a variety of factors affect comparable sales and operating results, including changes in fashion trends, changes in our merchandise mix, customer acceptance of merchandise offerings, the timing of marketing activities, calendar shifts of holiday periods, the periodic impact of a fifty-three week fiscal year, weather conditions and general economic conditions. In addition, our ability to address the current challenges of sustained declining store traffic combined with a highly promotional retail environment may impact our comparable sales, operating results and ability to maintain or gain market share. Past comparable sales or operating results are not an indicator of future results. |
Omni-Channel Operations
Our omni-channel operations (including our websites and catalogs) are a critical part of our customers' overall experience with our brands and will be a significant contributor to our future business growth and profitability. Our inability or failure to successfully manage and maintain those operations could materially and adversely impact our results of operations. Specific risks include, but are not limited to, the following:
Risk | Description |
|
|
8. Reliance on technology | Our brands' websites and select systems are heavily dependent on technology, which creates numerous risks including unanticipated operating problems, system failures, rapid technological change, failure of technology to operate the websites and systems as anticipated, reliance on third party computer hardware and software providers, computer viruses, telecommunication failures, liability for online content, systems and data breaches, denial of service attacks, spamming, phishing attacks, computer hackers and other similar disruptions. Our failure to successfully assess and respond to these risks could negatively impact sales, increase costs, inhibit our ability to acquire new customers and damage the reputation of our brands. |
9. Reliance on the U.S. Postal Service and other shipping vendors | Postal rate increases or a reduction or delay in service could affect the cost of our order fulfillment and catalog and promotional mailings. We use the Postal Service to mail millions of catalogs each year to educate our customers about our products, acquire new customers, drive customers to our boutiques and websites and promote catalog sales. We rely on discounts from the basic postal rate structure, such as discounts for bulk mailings and sorting. We utilize additional shipping vendors to support our online operations. Any significant and unanticipated increase in shipping costs, reduction in service, or slow-down in delivery could impair our ability to deliver merchandise in a timely or economically efficient manner. |
10. Inability to successfully launch other channels of sales, marketing and distribution | Our strategic plans include additional channels for the marketing and sale of our product and brands, including through licensing, wholesaling, franchising and alternative distribution models. Each of these methods presents new operational, reputational and financial challenges for us. Our inability to find the right markets, partners or business models, our inability to negotiate agreements that protect our profit and brand quality and reputation, or our inability to accurately anticipate the resources, systems and operational needs that go along with these new ventures could result in lower than expected returns and adversely impact other areas of our business. |
10
Table of Contents
Information Technology Systems
In addition to the dependence of our retail websites on technology as discussed above, we also rely on various information technology systems to manage our overall operations, and failure of those systems to operate as expected or a significant interruption in service could materially adversely impact our consolidated financial condition and results of operations. Risks include, but are not limited to, the following:
Risk | Description |
|
|
11. Disruptions in current systems or difficulties in integrating new systems | We regularly maintain, upgrade, enhance or replace our information technology systems to support our business strategies and provide business continuity. Replacing legacy systems with successor systems, making changes to existing systems or acquiring new systems with new functionality have inherent risks including disruptions, delays, gaps in functionality, user acceptance, adequate user training or other difficulties that may impair the effectiveness of our information technology systems. |
12. Cybersecurity/ Data Privacy | We are subject to cybersecurity risks. Cybersecurity refers to the combination of technologies, processes and procedures established to protect information technology systems and data from unauthorized access, attack, exfiltration, loss or damage. Our business involves the storage and/or transmission of customers' personal information, shipping preferences and credit card information, as well as confidential information regarding our business, employees and third parties. In addition, as part of our acceptance of customers' debit and credit cards as forms of payment, we are required to comply with the Payment Card Industry Data Security Standards ("PCI") as well as other laws and regulations, both foreign and in the United States. While we have implemented measures reasonably designed to prevent security breaches and cyber incidents, and while we have taken steps to comply with PCI and other laws, those measures may not be effective. A breach or cyber incident could result in the loss or misuse of data and could result in fines, penalties, damages, loss of business, legal expenses, remediation costs, reputational damage or loss of our ability to accept debit and credit cards as forms for payment. In addition, changes in laws or regulations, or in the PCI standards, could result in cost increases due to system or administrative charges. |
11
Table of Contents
Sourcing and Distribution Strategies
Our sourcing and distribution strategies are subject to numerous risks that could materially adversely impact our consolidated financial condition and results of operations. These risks include, but are not limited to, the following:
Risk | Description |
|
|
13. Reliance on foreign sources of production | The majority of the merchandise we sell is produced outside the United States. As a result, our business remains subject to the various risks of doing business in foreign markets and importing merchandise from abroad, such as: geo-political instability, non-compliance with the Foreign Corrupt Practices Act and other anti-corruption laws and regulations, potential changes to the North American Free Trade Agreement and other trade agreements, imposition of new legislation relating to import quotas, imposition of new or increased duties, taxes, or other charges on imports, foreign exchange rate challenges and pressures presented by implementation of U.S. monetary policy, challenges from local business practices or political issues, transportation disruptions, our shift to a predominantly FOB (free on board) shipping structure rather than predominantly DDP (delivered duty paid), natural disasters, delays in the delivery of cargo due to port security considerations or government funding; seizure or detention of goods by U.S. Customs authorities, or a reduction in the availability of shipping sources caused by industry consolidation or other reasons. We continue to source a substantial portion of our merchandise from Asia, including China. A change in exchange rates, labor laws or policies affecting the costs of goods in Asia could negatively impact our merchandise costs. Furthermore, delays in production or shipping product, whether due to work slow-downs, work stoppages, strikes, port congestion, labor disputes, product regulations and customs inspections or other factors, could have a negative impact. We cannot predict whether or not any of the foreign countries in which our clothing and accessories are produced will be subject to import restrictions or taxes by the United States government. Trade restrictions, including increased tariffs, or more restrictive quotas, including safeguard quotas, or anything similar, applicable to apparel items could affect the importation of apparel generally and, in that event, could increase the cost, or reduce the supply, of apparel available to us. |
14. Our suppliers' inability to provide quality goods in a timely manner | We are subject to risk because we do not own or operate any manufacturing facilities and depend on independent third parties to manufacture our merchandise. A key supplier may become unable to address our merchandising needs for a variety of reasons. If we were unexpectedly required to change suppliers or if a key supplier were unable to supply acceptable merchandise in sufficient quantities on acceptable terms, we could experience a significant impact to the supply or cost of merchandise. |
15. Reliance upon one supplier | Approximately 23% of total purchases in fiscal 2017 and fiscal 2016 were made from one supplier, and we cannot guarantee that this relationship will be maintained in the future or that the supplier will continue to be available to supply merchandise. However, we have no material long-term or exclusive contract with any apparel or accessory manufacturer or supplier. Our business depends on our network of suppliers and our continued good relations with them. |
16. Our suppliers' failure to implement acceptable labor practices | Although we have adopted our Terms of Commitment to Ethical Sourcing and use the services of third party audit firms to monitor compliance with these terms, some of our independent suppliers may not be in complete compliance with our guidelines at all times. The violation of labor or other laws by any of our key independent suppliers or the divergence of an independent supplier's labor practices from those generally accepted by us as ethical could interrupt or otherwise disrupt the shipment of finished merchandise or damage our reputation. |
17. Reliance on one location to distribute goods for our brands | With minor exceptions, the distribution functions for all of our brands are handled from our DC in Winder, Georgia and a significant interruption in the operation of that facility due to natural disasters, severe weather, accidents, system failures, capacity constraints or other unforeseen causes could delay or impair our ability to distribute merchandise to our stores and/or fulfill online or catalog orders. |
12
Table of Contents
Other Risks Factors
Our business is subject to numerous other risks that could materially adversely impact our consolidated financial condition and results of operations. These risks include, but are not limited to, the following:
Risk | Description |
|
|
18. Failure to comply with applicable laws and regulations | Our policies, procedures and internal controls are designed to help us comply with all applicable foreign and domestic laws, accounting and reporting requirements, regulations and tax requirements, including those imposed by the Sarbanes-Oxley Act of 2002, the Dodd-Frank Wall Street Reform and Consumer Protection Act, the Foreign Corrupt Practices Act, The Patient Protection and Affordable Care Act, the SEC and the New York Stock Exchange ("NYSE"), as well as applicable employment and data security laws and various applicable laws in foreign jurisdictions. We could be subject to legal or regulatory action in the event of our failure to comply, which could be expensive to defend and resolve and be disruptive to our business. Any changes in regulations, the imposition of additional regulations or the enactment of any new legislation that affects us may increase the complexity of the legal and regulatory environment in which we operate and the related costs of compliance. |
19. Adverse outcomes of litigation matters | We are involved in litigation and other claims against our business. These matters arise primarily in the ordinary course of business but could raise complex factual and legal issues, presenting multiple risks and uncertainties and requiring significant management time. Our assessment could change in light of the discovery of facts with respect to pending or potential legal actions against us, not presently known to us, or determinations by judges, juries or other finders of fact which are inconsistent with our evaluation of the possible liability or outcome of such litigation. In addition, we may be subject to litigation which has not yet been filed. |
20. Our inability to retain or recruit key personnel | Our success and ability to properly manage our business depends to a significant extent upon our ability to attract, develop and retain qualified employees, including executive and senior management and talented merchants. Competition for talented employees within our industry is intense. Failure to recruit and retain such personnel and implement appropriate succession planning, including the transition of new executives, particularly at the senior executive level, could jeopardize our continued and sustained success. |
21. Our inability to achieve the results of our strategic initiatives | Over the last two years, we have launched significant initiatives designed to reposition our brands, drive sales, acquire new customers, establish new channels of distribution and further align the organizational structure for long-term growth. These initiatives require substantial internal change and effort, including reductions and changes in personnel and significant adjustments in how we design and source product and how we ultimately present and sell it to our customers. These initiatives may not deliver all of the results we expect. Moreover, the process of implementing them places significant stress on the Company and could result in unexpected short-term interruptions or negative impacts to our business, such as disruptions to our current business processes as we migrate to the new processes, or failure to successfully migrate to those new processes, which could negatively impact product flow, product quality or inventory levels. In addition, there is no assurance that we can complete the implementation of all of these initiatives in the manner or in the time-frame planned, or that, once implemented, they will result in the expected increases in the efficiency or productivity of our business. |
13
Table of Contents
22. Our inability to operate our business within our financial covenants or to replace our credit facility | Our revolving credit agreement and term loan contains various affirmative and negative covenants that may restrict the ability of the Company to incur indebtedness, grant liens, engage in mergers, make certain investments, pay dividends or distributions on our common stock or enter into sales-leaseback transactions. The agreement also contains financial covenants that require the Company to maintain certain financial ratios. The ability of the Company to comply with these provisions may be affected by events beyond our control. Failure to comply with these covenants could result in an event of default which, if not cured or waived, could accelerate the Company's repayment obligations. Also, the inability to obtain credit on commercially reasonable terms in the future when this facility expires could adversely impact our liquidity and results of operations. In addition, market conditions could potentially impact the size and terms of a replacement facility or facilities. |
23. War, terrorism or other catastrophes | In the event of war, acts of terrorism or the threat of terrorist attacks, public health crises or weather catastrophes, consumer spending could significantly decrease for a sustained period. In addition, local authorities or shopping center management could close stores in response to any immediate security concern, public health concern or weather catastrophe such as hurricanes, earthquakes or tornadoes. Similarly, war, acts of terrorism, threats of terrorist attacks or a weather catastrophe could severely and adversely affect our National Store Support Center ("NSSC") campus, our DC, or our entire supply chain. |
24. Our inability to protect our brands' reputation | Our ability to protect our brands' reputations is an integral part of our general success strategy and is critical to the overall value of the brands. If we fail to maintain high standards for merchandise quality and integrity in our business conduct or fail to address other risk factors, such failures could jeopardize our brands' reputations. Consumers value readily available information from social media and other sources concerning retailers and their goods and services and many times act on such information without further investigation in regards to its accuracy. Any negative publicity, whether true or not, may affect our reputation and brand and, consequently, reduce demand for our merchandise, decrease customer and investor loyalty and affect our vendor relationships. |
25. Our inability to protect our intellectual property | While we devote significant resources to the protection of our intellectual property, others may still attempt to imitate our products or infringe upon our intellectual property rights. Other parties may also claim that some of our products infringe on their trademarks, copyrights or other intellectual property rights. In addition, the intellectual property laws and enforcement practices in many foreign countries can be substantially different from those in the United States. There are also inherent challenges with enforcing intellectual property rights on third party e-commerce websites, especially those based in foreign jurisdictions. We cannot guarantee that such rights are not infringed. |
26. Stock price volatility | The market price of our common stock has fluctuated substantially in the past and may continue to do so in the future. Future announcements or management discussions concerning us or our competitors, sales and profitability results, quarterly variations in operating results or comparable sales, changes in earnings estimates by analysts or the failure of investors or analysts to understand our business strategies or fundamental changes in our business or sector, among other factors, could cause the market price of our common stock to fluctuate substantially. In addition, stock market have experienced periods of extreme price or volume volatility in recent years. This volatility has had a substantial effect on the market prices of securities of many public companies for reasons frequently unrelated to the operating performance of the specific companies. |
27. Our business could be impacted as a result of actions by activist shareholders or others | From time to time, we may be subject to legal and business challenges in the operation of our Company due to proxy contests, shareholder proposals, media campaigns and other such actions instituted by activist shareholders or others. Responding to such actions is costly and time-consuming, disrupts our operations, may not align with our business strategies and may divert the attention of our Board of Directors and management from the pursuit of current business strategies. Perceived uncertainties as to our future direction or changes to the composition of our Board of Directors as a result of shareholder activism may lead to the perception of instability in the organization and its future and may make it more difficult to attract and retain qualified personnel and business partners. |
14
Table of Contents
28. Disadvantageous lease obligations and commercial retail consolidation | We have, and will continue to have, significant lease obligations. If an existing or future store is not profitable, and we decide to close it, we may nonetheless be committed to fulfill our obligations under the applicable lease including paying the base rent for the balance of the lease term. Additionally, continued consolidation in the commercial retail real estate market could affect our ability to successfully negotiate favorable rental terms for our stores in the future and could concentrate our leases with fewer landlords who may then be in a position to dictate unfavorable terms to us due to their significant negotiating leverage. If we are unable to enter into new leases or renew existing leases on terms acceptable to us or be released from our obligations under leases for stores that we close this could affect our ability to profitably operate our stores. |
ITEM 1B. | UNRESOLVED STAFF COMMENTS |
None.
ITEM 2. | PROPERTIES |
Stores
At fiscal year-end for 2017 , 2016 and 2015 our total consolidated selling square feet was 3.5 million , 3.6 million and 3.7 million , respectively. For a general description of our leases, see Note 1 to our financial statements under the heading "Operating Leases." As of February 3, 2018 , our 1,460 stores were located in 46 states, Puerto Rico, the U.S. Virgin Islands and Canada, as follows:
Alabama | 20 | |
| Maryland | 39 | |
| Oregon | 16 | |
Arizona | 34 | |
| Massachusetts | 30 | |
| Pennsylvania | 68 | |
Arkansas | 12 | |
| Michigan | 36 | |
| Rhode Island | 4 | |
California | 147 | |
| Minnesota | 28 | |
| South Carolina | 35 | |
Colorado | 24 | |
| Mississippi | 12 | |
| South Dakota | 4 | |
Connecticut | 21 | |
| Missouri | 29 | |
| Tennessee | 33 | |
Delaware | 8 | |
| Montana | 6 | |
| Texas | 136 | |
Florida | 124 | |
| Nebraska | 10 | |
| Utah | 10 | |
Georgia | 56 | |
| Nevada | 19 | |
| Virginia | 46 | |
Idaho | 5 | |
| New Hampshire | 6 | |
| Washington | 29 | |
Illinois | 62 | |
| New Jersey | 51 | |
| West Virginia | 4 | |
Indiana | 23 | |
| New Mexico | 7 | |
| Wisconsin | 17 | |
Iowa | 7 | |
| New York | 58 | |
| U.S. Virgin Islands | 1 | |
Kansas | 13 | |
| North Carolina | 47 | |
| Puerto Rico | 8 | |
Kentucky | 16 | |
| North Dakota | 5 | |
| Ontario, Canada | 10 | |
Louisiana | 19 | |
| Ohio | 47 | |
| | | |
Maine | 3 | |
| Oklahoma | 15 | |
| | | |
NSSC and Distribution Centers
Our NSSC is located on approximately 65 acres in Fort Myers, Florida and consists of approximately 504,000 square feet of office space. Our distribution center is located on approximately 110 acres in Winder, Georgia and consists of approximately 583,000 square feet of distribution, fulfillment, call center and office space.
ITEM 3. | LEGAL PROCEEDINGS |
In July 2015, White House Black Market, Inc. (WHBM) was named as a defendant in Altman v. White House Black Market, Inc., a putative class action filed in the United States District Court for the Northern District of Georgia. The complaint alleges that WHBM, in violation of federal law, willfully published more than the last five digits of a credit or debit card number on customers' point-of-sale receipts. Plaintiff seeks an award of statutory damages of $100 to $1,000 for each alleged willful violation of the law, as well as attorneys' fees, costs and punitive damages. The Company denies the material allegations of the complaint and believes the case is without merit. On October 25, 2017, the magistrate in the matter recommended that the class be certified. On November 8, 2017, WHBM filed objections to such recommendation. On February 12, 2018, the District Court issued an order certifying the class. On February 26, 2018, the Company filed a petition with the District Court for permission to appeal its decision to the Eleventh Circuit Court of Appeals. The Company will continue to vigorously defend the matter, including a planned motion for summary judgment to dismiss all claims. At this time, the Company is unable to reasonably estimate the potential loss or range of loss, if any, related to the lawsuit because there are a number of unknown facts and unresolved legal issues that may impact the amount of any potential liability, including, without limitation, (a) whether the action will ultimately be permitted to proceed as a class, (b) if the action proceeds as a class, the resolution of certain disputed statutory interpretation issues that may impact the size of the putative class and (c) whether or not the plaintiff is entitled to statutory damages. No assurance can be given that these issues will be resolved in the Company's favor or that the Company will be successful in its defense on the merits or otherwise. If the case were to proceed as a class action and the Company were to be unsuccessful in its defense on the merits, the ultimate resolution of the case could have a material adverse effect on the Company's consolidated financial condition or results of operations.
Other than as noted above, we are not currently a party to any material legal proceedings other than claims and lawsuits arising in the normal course of business. All such matters are subject to uncertainties, and outcomes may not be predictable. Consequently, the ultimate aggregate amounts of monetary liability or financial impact with respect to these matters as of February 3, 2018 are not estimable. However, while such matters could affect our consolidated operating results when resolved in future periods, management believes that upon final disposition, any monetary liability or financial impact to us would not be material to our annual consolidated financial statements.
ITEM 4. | MINE SAFETY DISCLOSURES |
Not applicable.
15
Table of Contents
PART II
ITEM 5. | MARKET FOR REGISTRANT'S COMMON EQUITY, RELATED STOCKHOLDER MATTERS AND ISSUER PURCHASES OF EQUITY SECURITIES |
Our Common Stock trades on the NYSE under the symbol "CHS". On February 26, 2018 , the last reported sale price of the Common Stock on the NYSE was $9.09 per share. The number of holders of record of common stock on February 26, 2018 was 1,138 .
The following table sets forth, for the periods indicated, the range of high and low sale prices for the Common Stock, as reported on the NYSE:
For the Fiscal Year Ended February 3, 2018 |
|
|
| ||||
| High |
| Low | ||||
Fourth Quarter (October 29, 2017 – February 3, 2018) | $ | 10.21 | |
| $ | 7.37 | |
Third Quarter (July 30, 2017 – October 28, 2017) | 9.26 | |
| 7.15 | | ||
Second Quarter (April 30, 2017 – July 29, 2017) | 14.36 | |
| 8.47 | | ||
First Quarter (January 29, 2017 - April 29, 2017) | 14.96 | |
| 12.86 | | ||
|
|
|
| ||||
For the Fiscal Year Ended January 28, 2017 |
|
|
| ||||
| High |
| Low | ||||
Fourth Quarter (October 30, 2016 – January 28, 2017) | $ | 16.70 | |
| $ | 11.28 | |
Third Quarter (July 31, 2016 – October 29, 2016) | 12.68 | |
| 11.23 | | ||
Second Quarter (May 1, 2016 – July 30, 2016) | 12.72 | |
| 10.15 | | ||
First Quarter (January 31, 2016 - April 30, 2016) | 13.27 | |
| 9.73 | | ||
In fiscal 2017 , we declared four quarterly dividends of $0.0825 per share, resulting in an annualized dividend of $0.33 per share. In fiscal 2016 , we declared four quarterly dividends of $0.08 per share, resulting in an annualized dividend of $0.32 per share.
On February 21, 2018, we announced that our Board of Directors declared a quarterly dividend of $0.085 per share on our common stock. The dividend will be payable on April 2, 2018 to shareholders of record at the close of business on March 19, 2018.
In fiscal 2015, we executed accelerated share repurchase agreements (the "ASR Agreements") and purchased $250 million of the Company's common stock under our $300 million share repurchase authorization announced in December 2013. In November 2015, we announced a new $300 million share repurchase authorization for the Company's common stock and canceled the remainder of the December 2013 authorization, which had $40 million remaining. In fiscal 2016 , we repurchased 8.1 million shares of the Company's common stock at approximately $96.4 million. During the fourth quarter of fiscal 2017 , we repurchased 0.2 million shares of the Company's common stock, for a total fiscal 2017 repurchase of 2.7 million shares at approximately $27.4 million . There was approximately $136.2 million remaining under the program at the end of fiscal 2017 . The repurchase program has no specific termination date and will expire when we have repurchased all securities authorized for repurchase thereunder, unless terminated earlier by our Board of Directors.
16
Table of Contents
In fiscal 2017 , we repurchased 516,092 restricted shares in connection with employee tax withholding obligations under employee compensation plans, of which 78,562 were repurchased in the fourth quarter and are included in the following chart (amounts in thousands except share and per share amounts):
Period | Total |
| Average Price |
| Total Number |
| Approximate | ||||||
October 29, 2017 – November 25, 2017 | 11,460 | |
| $ | 7.87 | |
| - | |
| $ | 137,945 | |
November 26, 2017 – December 30, 2017 | 227,840 | |
| 8.68 | |
| 196,449 | |
| 136,243 | | ||
December 31, 2017 – February 3, 2018 | 35,711 | |
| 9.51 | |
| - | |
| 136,243 | | ||
Total | 275,011 | |
| 8.75 | |
| 196,449 | |
| | | ||
Five Year Performance Graph
The following graph compares the cumulative total return on our common stock with the cumulative total return of the companies in the Standard & Poor's ("S&P") 500 Index and the Standard & Poor's 500 Apparel Retail Index. Cumulative total return for each of the periods shown in the Performance Graph is measured assuming an initial investment of $100 on February 2, 2013 and the reinvestment of dividends.
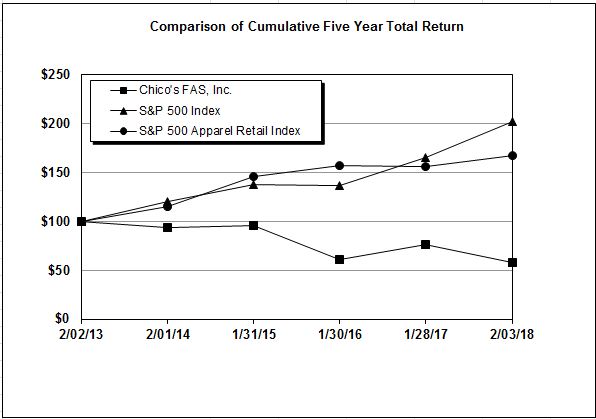
| 02/02/13 |
| 02/01/14 |
| 01/31/15 |
| 01/30/16 |
| 01/28/17 |
| 02/03/18 | ||||||||||||
Chico's FAS, Inc. | $ | 100 | |
| $ | 94 | |
| $ | 96 | |
| $ | 61 | |
| $ | 76 | |
| $ | 58 | |
S&P 500 Index | 100 | |
| 120 | |
| 137 | |
| 137 | |
| 165 | |
| 203 | | ||||||
S&P 500 Apparel Retail Index | 100 | |
| 116 | |
| 146 | |
| 157 | |
| 157 | |
| 167 | | ||||||
17
Table of Contents
ITEM 6. | SELECTED FINANCIAL DATA |
Selected Financial Data at the dates and for the periods indicated should be read in conjunction with, and is qualified in its entirety by reference to the consolidated financial statements and the notes thereto referenced in this Annual Report on Form 10-K. Amounts in the following tables are in thousands, except per share data, and number of stores data.
| Fiscal Year | ||||||||||||||||||
| 2017 (53 weeks) |
| 2016 (52 weeks) |
| 2015 (52 weeks) |
| 2014 (52 weeks) |
| 2013 (52 weeks) | ||||||||||
|
|
|
|
|
|
|
|
|
| ||||||||||
| (dollars in thousands, except per share amounts) | ||||||||||||||||||
Summary of Operations: 1 | |||||||||||||||||||
Net sales | $ | 2,282,379 | |
| $ | 2,476,410 | |
| $ | 2,660,635 | |
| $ | 2,693,929 | |
| $ | 2,604,411 | |
Gross margin | 864,777 | |
| 946,836 | |
| 1,026,871 | |
| 1,034,238 | |
| 1,049,353 | | |||||
Gross margin as a percent of net sales | 37.9 | % |
| 38.2 | % |
| 38.6 | % |
| 38.4 | % |
| 40.3 | % | |||||
Income (loss) from operations | 145,170 | |
| 140,702 | |
| (13,084 | ) |
| 116,343 | |
| 141,183 | | |||||
Income (loss) from operations as a percent of net sales | 6.4 | % |
| 5.7 | % |
| (0.5 | )% |
| 4.3 | % |
| 5.5 | % | |||||
Net income | 101,000 | |
| 91,229 | |
| 1,946 | |
| 64,641 | |
| 65,883 | | |||||
Net income as a percent of net sales | 4.4 | % |
| 3.7 | % |
| 0.1 | % |
| 2.4 | % |
| 2.5 | % | |||||
|
|
|
|
|
|
|
|
|
| ||||||||||
Per Share Data: |
|
|
|
|
|
|
|
|
| ||||||||||
Net income per common share-basic | $ | 0.79 | |
| $ | 0.69 | |
| $ | 0.01 | |
| $ | 0.42 | |
| $ | 0.41 | |
|
|
|
|
|
|
|
|
|
| ||||||||||
Net income per common and common equivalent share–diluted | $ | 0.79 | |
| $ | 0.69 | |
| $ | 0.01 | |
| $ | 0.42 | |
| $ | 0.41 | |
|
|
|
|
|
|
|
|
|
| ||||||||||
Weighted average common shares outstanding–basic | 125,341 | |
| 128,995 | |
| 138,366 | |
| 148,622 | |
| 155,048 | | |||||
|
|
|
|
|
|
|
|
|
| ||||||||||
Weighted average common and common equivalent shares outstanding–diluted | 125,403 | |
| 129,237 | |
| 138,741 | |
| 149,126 | |
| 155,995 | | |||||
|
|
|
|
|
|
|
|
|
| ||||||||||
Cash dividends per share | $ | 0.33 | |
| $ | 0.32 | |
| $ | 0.31 | |
| $ | 0.30 | |
| $ | 0.24 | |
|
|
|
|
|
|
|
|
|
| ||||||||||
Balance Sheet Data (at year-end): | |||||||||||||||||||
Cash and marketable securities | $ | 220,131 | |
| $ | 192,505 | |
| $ | 140,145 | |
| $ | 259,912 | |
| $ | 152,446 | |
Total assets | 1,087,605 | |
| 1,108,994 | |
| 1,166,052 | |
| 1,438,581 | |
| 1,371,191 | | |||||
Working capital | 247,557 | |
| 174,766 | |
| 167,190 | |
| 255,405 | |
| 167,568 | | |||||
Long-term debt | 53,601 | |
| 68,535 | |
| 82,219 | |
| - | |
| - | | |||||
Shareholders' equity | 656,382 | |
| 609,173 | |
| 639,788 | |
| 943,621 | |
| 909,103 | | |||||
| |||||||||||||||||||
Other Selected Operating Data: | |||||||||||||||||||
Percentage (decrease) increase in comparable sales | (7.7 | )% |
| (3.7 | )% |
| (1.5 | )% |
| 0.0 | % |
| (1.8 | )% | |||||
Purchases of property and equipment, net | $ | 48,530 | |
| $ | 47,836 | |
| $ | 84,841 | |
| $ | 119,817 | |
| $ | 138,510 | |
Total depreciation and amortization | $ | 96,310 | |
| $ | 109,251 | |
| $ | 118,800 | |
| $ | 122,269 | |
| $ | 118,303 | |
Goodwill and trade name impairment, pre-tax charges | $ | - | |
| $ | - | |
| $ | 112,455 | |
| $ | 30,100 | |
| $ | 72,466 | |
Restructuring and strategic charges, pre-tax | $ | - | |
| $ | 31,027 | |
| $ | 48,801 | |
| $ | 16,745 | |
| $ | - | |
Total stores at year end | 1,460 | |
| 1,501 | |
| 1,518 | |
| 1,547 | |
| 1,472 | | |||||
Total selling square feet (in thousands) | 3,513 | |
| 3,612 | |
| 3,652 | |
| 3,706 | |
| 3,547 | | |||||
____________________________
1 | Five-year table includes the operating results of Boston Proper through fiscal 2015. |
18
Table of Contents
ITEM 7. | MANAGEMENT'S DISCUSSION AND ANALYSIS OF FINANCIAL CONDITION AND RESULTS OF OPERATIONS |
The following discussion and analysis should be read in conjunction with the consolidated financial statements and notes thereto. References herein to "Notes" refer to the Notes to our consolidated financial statements. The periods presented had fifty-two weeks, except for the fiscal year ended February 3, 2018 ("fiscal 2017"), which consisted of fifty-three weeks.
EXECUTIVE OVERVIEW
We are a leading omni-channel specialty retailer of women's private branded, sophisticated, casual-to-dressy apparel, intimates and complementary accessories, operating under the Chico's, White House Black Market ("WHBM") and Soma brand names in the United States , Puerto Rico, the U.S. Virgin Islands and Canada. Our distinct lifestyle brands serve the needs of fashion-savvy women 35 years and older. We earn revenues and generate cash through the sale of merchandise in our domestic and international retail stores, our various e-commerce websites and our call center, which takes orders for all of our brands, and through an unaffiliated franchise partner in Mexico.
We utilize an integrated, omni-channel approach to managing our business. We want our customers to experience our brands holistically and to view the various retail channels we operate as a single, integrated experience rather than as separate sales channels operating independently. This approach allows our customers to browse, purchase, return or exchange our merchandise through whatever sales channel and at whatever time is most convenient. As a result, we track total sales and comparable sales on a combined basis.
2017 Financial Highlights |
• Earnings per share of $0.79 compared to $0.69 last year |
• $70 million returned to shareholders, consisting of $27 million in share repurchases and $43 million in dividends |
• Maintained healthy balance sheet and strong cash position |
Income from Operations and Select Charges
The following table depicts income from operations and select charges for fiscal 2017 , 2016 and 2015 :
| Fiscal 2017 |
| Fiscal 2016 |
| Fiscal 2015 | ||||||
|
|
|
|
|
| ||||||
| (dollars in millions) | ||||||||||
Income from operations | $ | 145 | |
| $ | 141 | |
| $ | (13 | ) |
Restructuring and strategic charges | - | |
| 31 | |
| 49 | | |||
Goodwill and intangible impairment charges | - | |
| - | |
| 112 | | |||
Earnings per diluted share for fiscal 2017 was $0.79 compared to $0.69 in fiscal 2016 . The change in earnings per share primarily reflects the impact of the Tax Cuts and Jobs Act ("the Tax Act") as well as the benefit of the fifty-third week, partially offset by the unfavorable impact of hurricanes Harvey, Irma and Maria (collectively, the "Hurricanes") as detailed below.
Tax Cuts and Jobs Act of 2017, Fifty-Third Week and Hurricane Impact on Financial Results
Results for fiscal 2017 include the favorable impact of the Tax Act of approximately $10 million after-tax as well as the benefit of the fifty-third week of approximately $4 million after-tax, partially offset by the unfavorable impact of the Hurricanes recorded in the third quarter of fiscal 2017 of approximately $5 million after-tax.
19
Table of Contents
Key Initiatives |
Fiscal 2017 key initiatives included: |
• evolving the customer experience |
• strengthening our brands' positions |
• leveraging actionable retail science |
• building growth platforms |
• achieving operational excellence |
Future Outlook |
For the full year of fiscal 2018, the Company is anticipating: |
• a low single-digit percentage decline in comparable sales |
• gross margin expansion driven by decreased average unit costs and planned improvement in promotions |
• selling, general and administrative expenses approximately flat compared to fiscal 2017 |
• fiscal 2018 tax rate in the range of 26% and 28% |
• capital expenditures to be $70 million to $80 million, primarily driven by store reinvestments and technology enhancements |
• approximately 50 closures, net |
RESULTS OF OPERATIONS
Net Sales
The following table depicts net sales by Chico's, WHBM, Soma and Boston Proper in dollars and as a percentage of total net sales for fiscal 2017 , 2016 and 2015 :
| Fiscal 2017 |
| % |
| Fiscal 2016 |
| % |
| Fiscal 2015 |
| % | |||||||||
|
|
|
|
|
|
|
|
|
|
|
| |||||||||
| (dollars in millions) | |||||||||||||||||||
Chico's | $ | 1,188 | |
| 52.0 | % |
| $ | 1,286 | |
| 51.9 | % |
| $ | 1,364 | |
| 51.3 | % |
WHBM | 751 | |
| 32.9 | |
| 846 | |
| 34.2 | |
| 875 | |
| 32.9 | | |||
Soma | 344 | |
| 15.1 | |
| 344 | |
| 13.9 | |
| 335 | |
| 12.6 | | |||
Boston Proper 1 | - | |
| - | |
| - | |
| - | |
| 87 | |
| 3.2 | | |||
Total net sales | $ | 2,282 | |
| 100.0 | % |
| $ | 2,476 | |
| 100.0 | % |
| $ | 2,661 | |
| 100.0 | % |
1 The Company exited Boston Proper in fiscal 2015.
For fiscal 2017 , net sales were $2.3 billion compared to $2.5 billion in fiscal 2016 . This decrease of 7.8% primarily reflects a comparable sales decline of 7.7% as well as a 2.7% net decrease in selling square footage in 2017 , partially offset by the $29 million benefit of the fifty-third week. The comparable sales decline consisted of lower average dollar sale and a decline in transaction count. Comparable sales is defined as sales from stores open for the preceding twelve months, including stores that have been expanded, remodeled or relocated within the same general market and includes online and catalog sales. The comparable sales calculation excludes the negative impact of stores closed four or more days, International and Boston Proper and sales attributable to the fifty-third week.
For fiscal 2016, net sales were $2.5 billion compared to $2.7 billion in fiscal 2015. This decrease of 6.9% included $87.0 million related to Boston Proper in fiscal 2015. When excluding Boston Proper from fiscal 2015, net sales decreased 3.8%, primarily reflecting a decline in comparable sales of 3.7%, comprised of reduced transaction count and lower average dollar sale.
20
Table of Contents
The following table depicts comparable sales percentages for Chico's, WHBM and Soma for fiscal 2017 , 2016 and 2015 :
| Fiscal 2017 1 |
| Fiscal 2016 |
| Fiscal 2015 | |||
Chico's | (7.2 | )% |
| (5.3 | )% |
| (2.0 | )% |
WHBM | (10.9 | )% |
| (2.8 | )% |
| (2.5 | )% |
Soma | (1.5 | )% |
| 0.5 | % |
| 3.1 | % |
Total Company | (7.7 | )% |
| (3.7 | )% |
| (1.5 | )% |
1 The 53 rd week is excluded from comparable sales calculations.
Cost of Goods Sold/Gross Margin
The following table depicts cost of goods sold and gross margin in dollars and gross margin as a percentage of net sales for fiscal 2017 , 2016 and 2015 :
| Fiscal 2017 |
| Fiscal 2016 |
| Fiscal 2015 | ||||||
|
|
|
|
|
| ||||||
| (dollars in millions) | ||||||||||
Cost of goods sold | $ | 1,418 | |
| $ | 1,530 | |
| $ | 1,634 | |
Gross margin | $ | 865 | |
| $ | 947 | |
| $ | 1,027 | |
Gross margin percentage | 37.9 | % |
| 38.2 | % |
| 38.6 | % | |||
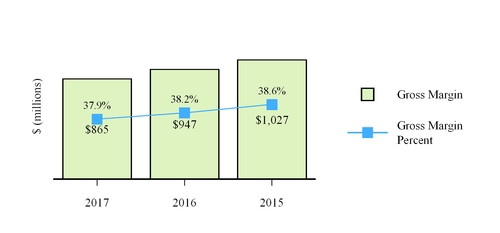
For fiscal 2017 , gross margin was $865 million , or 37.9% , compared to $947 million , or 38.2% , in fiscal 2016 . This 30 basis point decrease from fiscal 2016 primarily reflects a deleverage of occupancy costs as a percent of sales, partially offset by an improvement in merchandise margin and a decrease in incentive compensation.
For fiscal 2016, gross margin was $947 million, or 38.2%, compared to $1,027 million, or 38.6%, in fiscal 2015. When excluding Boston Proper from fiscal 2015, gross margin decreased 60 basis points in fiscal 2016 compared to gross margin of $1,000 million, or 38.8%, in fiscal 2015. This 60 basis point decrease from the fiscal 2015 adjusted gross margin rate primarily reflects deleverage of occupancy costs and incentive compensation, partially offset by an improvement in merchandise margin.
21
Table of Contents
Selling, General and Administrative Expenses
The following table depicts selling, general and administrative expenses ("SG&A"), which includes store and direct operating expenses, marketing expenses and NSSC expenses, in dollars and as a percentage of net sales for fiscal 2017 , 2016 and 2015 :
| Fiscal 2017 |
| Fiscal 2016 |
| Fiscal 2015 | ||||||
|
|
|
|
|
| ||||||
| (dollars in millions) | ||||||||||
Selling, general and administrative expenses | $ | 720 | |
| $ | 775 | |
| $ | 879 | |
Percentage of total net sales | 31.5 | % |
| 31.2 | % |
| 33.0 | % | |||
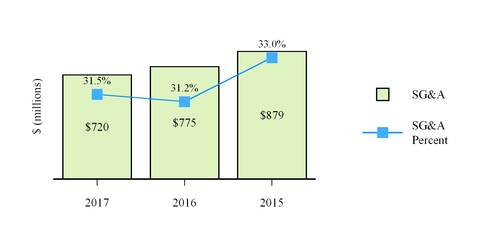
For fiscal 2017 , SG&A were $720 million , or 31.5% , compared to $775 million , or 31.2% , in fiscal 2016 . This $56 million decrease, or 7.2% decline, primarily reflects a reduction in store-related costs and marketing spend, partially offset by the impact of the fifty-third week.
For fiscal 2016, SG&A were $775 million, or 31.2%, compared to $879 million, or 33.0%, in fiscal 2015. When excluding Boston Proper from fiscal 2015, SG&A decreased $56 million, or 110 basis points, compared to $831 million, or 32.3%, in fiscal 2015. This decrease is primarily due to a reduction in unproductive marketing spend and improvements in store labor productivity, partially offset by an increase in incentive compensation.
Goodwill and Intangible Impairment Charges
In fiscal 2015, primarily based on declining market indications of value, the Company determined that certain Boston Proper intangibles were impaired and recorded $112.5 million in pre-tax, non-cash intangible impairment charges. The $112.5 million Boston Proper impairment charges included $48.9 million related to goodwill, $39.4 million related to the trade name and $24.2 million related to customer relationship intangible assets. The fiscal 2015 after-tax impact of the Boston Proper impairment charges totaled $88.4 million, or $0.63 per diluted share. The remaining value of the Boston Proper intangible assets was included in the sale of the assets and liabilities of the Boston Proper business in January 2016.
Restructuring and Strategic Charges
In the fourth quarter of fiscal 2014, we initiated a restructuring program, including the acceleration of domestic store closures and an organizational realignment, to ensure that resources align with long-term growth initiatives, including omni-channel. Restructuring and strategic charges for fiscal 2015 were $49 million , primarily consisting of $22 million in non-cash property and equipment impairment charges, $10 million in lease termination charges, $8 million in continuing employee-related costs and $7 million in severance charges and termination benefits. The fiscal 2015 after-tax impact of the restructuring and other charges totaled $30 million , or $0.21 per diluted share. Restructuring and strategic charges for fiscal 2016 were $31 million , primarily consisting of $12 million in outside services, $9 million in severance costs and $6 million in proxy solicitation costs. The fiscal 2016 after-tax impact of the restructuring and other charges totaled $19 million , or $0.15 per diluted share. In fiscal 2016 , we substantially completed our restructuring program. As of the end of fiscal 2017, we have closed a majority of the stores identified for closure in connection with our restructuring and strategic activities and did not incur any material additional expenses related to lease terminations or restructuring and strategic charges.
22
Table of Contents
Provision for Income Taxes
Our effective tax rate was 29.7% , 34.2% and 113.3% , for fiscal 2017 , 2016 and 2015 , respectively. The fiscal 2017 effective tax rate reflects an approximate $10 million benefit related to the Tax Act, partially offset by the recognition of the tax impact of deficiencies resulting from our adoption of the new accounting guidance related to employee share-based payment transactions. The fiscal 2016 and 2015 effective tax rates reflect the impact of the disposition of Boston Proper's stock and goodwill impairment charges, partially offset by an outside basis difference realized upon the sale and subsequent liquidation of the Boston Proper business. Excluding the tax impacts of the Tax Act, the Boston Proper stock disposition, goodwill impairment charges, outside basis difference and subsequent liquidation, the fiscal 2017 , 2016 and 2015 effective tax rates would have been 36.4%, 37.2% and 36.6%, respectively.
Net Income and Earnings Per Diluted Share
Net income for fiscal 2017 was $101 million , or $0.79 per diluted share, compared to net income for fiscal 2016 of $91 million , or $0.69 per diluted share. The change in earnings per share primarily reflects the increase in fiscal 2017 net income. Fiscal 2017 net income includes the favorable impact of the Tax Act of approximately $10 million after-tax and the benefit of the fifty-third week of approximately $4 million after-tax, partially offset by the unfavorable impact of the Hurricanes of approximately $5 million after-tax.
Net income for fiscal 2016 was $91 million, or $0.69 per diluted share, compared to net income for fiscal 2015 of $2 million, or $0.01 per diluted share. The change in earnings per share reflects the increase in fiscal 2016 net income and the impact of share repurchases. Fiscal 2016 results included the impact of restructuring and strategic charges primarily related to outside services, severance costs and proxy solicitation costs of $19 million after-tax, or $0.15 per diluted share, partially offset by a $0.03 tax benefit related to the disposition of the Boston Proper DTC business.
Liquidity and Capital Resources
Overview
We believe that our existing cash and marketable securities balances, cash generated from operations, available credit facilities and potential future borrowings will be sufficient to fund capital expenditures, working capital needs, dividend payments, potential share repurchases, commitments and other liquidity requirements associated with our operations for the foreseeable future. Furthermore, while it is our intention to repurchase our stock and pay a quarterly cash dividend in the future, any determination to repurchase additional shares of our stock or pay future dividends will be made by the Board of Directors and will depend on our stock price, future earnings, financial condition and other factors considered by the Board.
Our ongoing capital requirements will continue to be primarily for enhancing and expanding our omni-channel capabilities, including expanded, relocated and remodeled stores; and information technology.
Operating Activities
Net cash provided by operating activities in fiscal 2017 was $167 million , a decrease of approximately $64 million from fiscal 2016 . This decrease primarily results from the settlement of prior year accruals for outside services and severance, the timing of tax payments and the impact of a decrease in the incentive compensation accrual, partially offset by the timing of vendor payments.
Net cash provided by operating activities in fiscal 2016 was $231 million, an increase of approximately $34 million from fiscal 2015. This increase primarily reflected the change in working capital and an increase in net income compared to prior year when adjusted for non-cash impairment charges and the deferred tax benefit related to the exit of Boston Proper. The change in working capital is primarily due to a decrease in income tax receivable.
Investing Activities
Net cash used in investing activities for fiscal 2017 was $58 million compared to $32 million for fiscal 2016 . The change in net cash used in investing activities primarily reflects a $10 million net increase in marketable securities related to the investment of cash from operations in fiscal 2017 and the impact of $16 million in proceeds from the sale of land in fiscal 2016 .
23
Table of Contents
Net cash used in investing activities for fiscal 2016 was $32 million compared to $0.5 million provided by investing activities for fiscal 2015. The fiscal 2016 results reflect net purchases of property and equipment totaling $48 million, offset by proceeds from the sale of land of $16 million. Fiscal 2015 results included net purchases of property and equipment totaling $85 million, offset by a $76 million net decrease in marketable securities related to share repurchases and proceeds from the sale of Boston Proper.
Financing Activities
Net cash used in financing activities for fiscal 2017 was $91 million compared to $147 million in fiscal 2016 . The decrease in net cash used in financing activities primarily reflects a $69 million decline in share repurchases in fiscal 2017 compared to fiscal 2016 , partially offset by higher payments on borrowings under our Credit Agreement in fiscal 2017 . In fiscal 2017 , we paid four cash dividends at $0.0825 per share on our common stock, totaling $ 43 million , and received approximately $2 million in proceeds from issuing approximately 2 million shares related to employee stock ownership plans and stock option exercises.
Net cash used in financing activities for fiscal 2016 was $147 million compared to $240 million in fiscal 2015. The fiscal 2016 decrease in net cash used in financing activities primarily reflects a decrease of $201 million in share repurchases in fiscal 2016 compared to fiscal 2015, partially offset by net borrowings of $93 million under our Credit Agreement in fiscal 2015. In fiscal 2016, we paid four cash dividends at $0.08 per share on our common stock, totaling $42 million and received $4 million in proceeds from issuing approximately 2 million shares related to employee stock ownership plans and stock option exercises.
Store and Franchise Activity
During fiscal 2017 , we had 41 net store closures, consisting of 15 Chico's stores, 21 WHBM stores and 5 Soma stores. In fiscal 2018 , we anticipate approximately 50 net store closures. We continuously evaluate the appropriate new store growth rate and closures in light of economic conditions and may adjust the growth rate and closures as conditions require or as opportunities arise. As of February 3, 2018 , the Company's franchise operations consisted of 94 retail locations in Mexico.
Contractual Obligations
The following table summarizes our contractual obligations at February 3, 2018 :
| Total |
| One year or |
| 2-3 years |
| 4-5 years |
| After 5 | ||||||||||
|
|
|
|
|
|
|
|
|
| ||||||||||
| (in millions) | ||||||||||||||||||
Operating leases | $ | 931 | |
| $ | 191 | |
| $ | 329 | |
| $ | 243 | |
| $ | 168 | |
Purchase orders | 326 | |
| 325 | |
| 1 | |
| - | |
| - | | |||||
Capital expenditures | 5 | |
| 4 | |
| 1 | |
| - | |
| - | | |||||
Long-term debt obligations | 69 | |
| 15 | |
| 54 | |
| - | |
| - | | |||||
Total | $ | 1,331 | |
| $ | 535 | |
| $ | 385 | |
| $ | 243 | |
| $ | 168 | |
As of February 3, 2018 , our contractual obligations consisted of: 1) amounts outstanding under operating leases, 2) open purchase orders for inventory and other operating expenses, in the normal course of business, 3) contractual commitments for fiscal 2018 capital expenditures and 4) long-term debt obligations.
Until formal resolutions are reached between us and the relevant taxing authorities, we are unable to estimate a final determination related to our uncertain tax positions and therefore, we have excluded the uncertain tax positions, totaling approximately $2 million at February 3, 2018 from the above table.
24
Table of Contents
Credit Facility
On May 4, 2015, we entered into a credit agreement (the "Credit Agreement") among the Company, JPMorgan Chase Bank, N.A. as Administrative Agent, Bank of America, N.A., as Syndication Agent and other lenders. Our obligations under the Credit Agreement are guaranteed by certain of our material U.S. subsidiaries. The Credit Agreement provides for a term loan commitment in the amount of $100.0 million, of which $100.0 million was drawn at closing, and matures on May 4, 2020. The Credit Agreement also provides for a $100.0 million revolving credit facility, of which $24.0 million was drawn at closing and was repaid in the second quarter of 2015. The Credit Agreement has borrowing options which accrue interest by reference, at our election, at either an adjusted eurodollar rate tied to LIBOR or an Alternate Base Rate plus an interest rate margin, as defined in the Credit Agreement. The Credit Agreement also requires us to maintain certain maximum leverage ratio (as defined in the Credit Agreement) of no more than 3.50 to 1.00 until July 31, 2018, and 3.25 to 1.00 after July 31, 2018, and a minimum fixed coverage charge of not less than 1.20 to 1.00. As of February 3, 2018 , the Company was in compliance with all financial covenant requirements of the Credit Agreement. For a more detailed description of the interest rate options and the financial covenants, please see Note 8.
On May 4, 2015, in connection with our entry into the Credit Agreement, we repaid and terminated, with no prepayment penalties, the $124.0 million outstanding obligation under our 2011 revolving credit facility. We used the proceeds from the initial draw of the term loan and revolving credit facility of the Credit Agreement to repay such obligations.
As of February 3, 2018 , $68.6 million in net borrowings under the term loan were outstanding under the Credit Agreement, and are reflected as $15.0 million in current debt and $53.6 million in long-term debt in the accompanying consolidated balance sheet.
Off-Balance Sheet Arrangements
At February 3, 2018 and January 28, 2017 , we did not have any relationship with unconsolidated entities or financial partnerships for the purpose of facilitating off-balance sheet arrangements or for other contractually narrow or limited purposes.
Critical Accounting Policies
The discussion and analysis of our consolidated financial condition and results of operations are based upon the consolidated financial statements, which have been prepared in accordance with accounting principles generally accepted in the United States. The preparation of consolidated financial statements requires us to make estimates and judgments that affect the reported amounts of assets, liabilities, revenue and expenses, and related disclosure of contingent assets and liabilities. We base our estimates on historical experience and on various other assumptions that are believed to be reasonable under the circumstances, the results of which form the basis for making judgments about the carrying values of assets and liabilities that are not readily apparent from other sources. Actual results may differ from these estimates under different assumptions or conditions. Management has discussed the development and selection of these critical accounting policies and estimates with the Audit Committee of our Board of Directors, and believes the following assumptions and estimates are significant to reporting our consolidated results of operations and financial position.
Inventory Valuation and Shrinkage
We identify potentially excess and slow-moving inventories by evaluating inventory aging, turn rates and inventory levels in conjunction with our overall sales trend. Further, inventory realization exposure is identified through analysis of gross margins and markdowns in combination with changes in current business trends. We record excess and slow-moving inventories at net realizable value and may liquidate certain slow-moving inventory through third parties. Historically, the variation of those estimates to actual results is immaterial and material variation is not expected in the future.
We estimate our expected shrinkage of inventories between our physical inventory counts by using average store shrinkage experience rates, which are updated on a regular basis. Historically, the variation of those estimates to actual results is immaterial and material variation is not expected in the future.
25
Table of Contents
Revenue Recognition
Retail sales by our stores are recorded at the point of sale and are net of estimated customer returns, sales discounts under rewards programs and company issued coupons, promotional discounts and employee discounts. For sales from our websites and catalogs, revenue is recognized at the time we estimate the customer receives the product, which is typically within a few days of shipment. Amounts related to shipping and handling costs billed to customers are recorded in net sales and the related shipping and handling costs are recorded in cost of goods sold in the accompanying consolidated statements of income. Amounts paid by customers to cover shipping and handling costs are immaterial.
We sell gift cards in stores, on our e-commerce website and through third parties. Our gift cards do not have expiration dates. We account for gift cards by recognizing a liability at the time the gift card is sold. The liability is relieved and revenue is recognized for gift cards upon redemption. In addition, we recognize revenue for the amount of gift cards expected to go unredeemed (commonly referred to as gift card breakage) under the redemption recognition method. This method records gift card breakage as revenue on a proportional basis over the redemption period based on our historical gift card breakage rate. We determine the gift card breakage rate based on our historical redemption patterns. We recognize revenue on the remaining unredeemed gift cards based on determining that the likelihood of the gift card being redeemed is remote and that there is no legal obligation to remit the unredeemed gift cards to relevant jurisdictions.
Soma offers a points based loyalty program in which customers earn points based on purchases. Attaining specified loyalty point levels results in the issuance of reward coupons to discount future purchases. As program members accumulate points, we accrue the estimated future liability, adjusted for expected redemption rates and expirations. The liability is relieved and revenue is recognized for loyalty point reward coupons upon redemption. In addition, we recognize revenue on unredeemed points when it can be determined that the likelihood of the point being redeemed is remote and there is no legal obligation to remit the point value. We determined the loyalty point breakage rate based on historical and redemption patterns.
As part of the normal sales cycle, we receive customer merchandise returns related to store, website and catalog sales. To account for the financial impact of potential customer merchandise returns, we estimate future returns on previously sold merchandise. Reductions in sales and gross margin are recorded for estimated merchandise returns based on return history, current sales levels and projected future return levels.
Our policy towards taxes assessed by a government authority directly imposed on revenue producing transactions between a seller and a customer is, and has been, to exclude all such taxes from revenue.
Evaluation of Long-Lived Assets, Goodwill and Indefinite-Lived Intangible Assets
Long-lived assets are reviewed periodically for impairment if events or changes in circumstances indicate that the carrying amount may not be recoverable. If future undiscounted cash flows expected to be generated by the asset are less than its carrying amount, an asset is determined to be impaired, and a loss is recorded for the amount by which the carrying value of the asset exceeds its fair value. The fair value of an asset is estimated using estimated future cash flows of the asset discounted by a rate commensurate with the risk involved with such asset while incorporating marketplace assumptions. The estimate of future cash flows requires management to make certain assumptions and to apply judgment, including forecasting future sales and the useful lives of the assets. We exercise our best judgment based on the most current facts and circumstances surrounding our business when applying these impairment rules. We establish our assumptions and arrive at the estimates used in these calculations based upon our historical experience, knowledge of the retail industry and by incorporating third-party data, which we believe results in a reasonably accurate approximation of fair value. Nevertheless, changes in the assumptions used could have an impact on our assessment of recoverability.
We review our goodwill for impairment at the reporting unit level on an annual basis, or when circumstances indicate its carrying value may not be recoverable. We evaluate the appropriateness of performing a qualitative assessment, on a reporting unit level, based on current circumstances. If the results of the qualitative assessment indicate that it is more likely than not that the fair value of a reporting unit is less than its carrying amount, the two-step impairment test will be performed. If we conclude that this is not the case, then the two-step impairment test will not be required. We may elect to skip the qualitative assessment and perform the two-step impairment test. The first step of the impairment test compares the fair value of our reporting units with their carrying amounts, including goodwill. If the carrying amount exceeds the fair value, then the second step of the impairment test is performed to measure the amount of any impairment loss. Fair value is determined based on both an income approach and market approach. The income approach is based on estimated future cash flows, discounted at a rate that approximates the cost of capital of a market participant, while the market approach is based on sales and EBITDA multiples of similar companies and/or transactions, or other available indications of value.
26
Table of Contents
We review our other indefinite-lived intangible assets for impairment on an annual basis, or when circumstances indicate its carrying value may not be recoverable. We evaluate the appropriateness of performing a qualitative assessment based on current circumstances. If the results of the qualitative assessment indicate that it is more likely than not that the fair value of a reporting unit is less than its carrying amount, we calculate the fair value of the indefinite-lived intangible assets using a discounted cash flow method, based on the relief from royalty concept.
Operating Leases
Rent expense under store operating leases is recognized on a straight-line basis over the term of the leases. Landlord incentives, "rent-free" periods, rent escalation clauses and other rental expenses are also amortized on a straight-line basis over the term of the leases, including the construction period. This is generally 60–90 days prior to the store opening date, when we generally begin improvements in preparation for our intended use. Tenant improvement allowances are recorded as a deferred lease credit within deferred liabilities and amortized as a reduction of rent expense over the term of the lease.
Income Taxes
Income taxes are accounted for in accordance with authoritative guidance, which requires the use of the asset and liability method. Deferred tax assets and liabilities are recognized based on the difference between the financial statement carrying amounts of existing assets and liabilities and their respective tax bases. Inherent in the measurement of deferred balances are certain judgments and interpretations of existing tax law and published guidance as applicable to our operations. Deferred tax assets are reduced, if necessary, by a valuation allowance to the extent future realization of those tax benefits are uncertain. Our effective tax rate considers management's judgment of expected tax liabilities within the various taxing jurisdictions in which we are subject to tax.
We record amounts for uncertain tax positions that management believes are supportable, but are potentially subject to successful challenge by the applicable taxing authority. Consequently, changes in our assumptions and judgments could affect amounts recognized related to income tax uncertainties and may affect our consolidated results of operations or financial position. We believe our assumptions for estimates continue to be reasonable, although actual results may have a positive or negative material impact on the balances of such tax positions. Historically, the variation of estimates to actual results is immaterial and material variation is not expected in the future.
Stock-Based Compensation Expense
Stock-based compensation expense for all awards is based on the grant date fair value of the award, net of estimated forfeitures, and is recognized over the requisite service period of the awards. Compensation expense for restricted stock awards and stock options with a service condition is recognized on a straight-line basis over the requisite service period. Compensation expense for performance-based awards with a service condition is recognized ratably for each vesting tranche based on our estimate of the level and likelihood of meeting certain Company-specific performance goals. The calculation of stock-based compensation expense involves estimates that require management's judgment. We have elected to estimate the expected forfeiture rate for all stock-based awards, and only recognize expense for those shares expected to vest. In determining the portion of the stock-based payment award that is ultimately expected to be earned, we derive forfeiture rates based on historical data. In accordance with the authoritative guidance, we revise our forfeiture rates, when necessary, in subsequent periods if actual forfeitures differ from those originally estimated. As a result, in the event that a grant's actual forfeiture rate is materially different from its estimate at the completion of the vesting period, the stock-based compensation expense could be significantly different from what we recorded in current and prior periods.
For performance-based awards, estimates include the probable number of shares that will ultimately be issued based on the likelihood of meeting the respective performance condition. We estimate the probable vesting based on current financial performance forecasts for the relevant performance metrics. The assumptions used in calculating the fair value of stock-based payment awards represent management's best estimates, but these estimates involve inherent uncertainties and the application of management's judgment.
27
Table of Contents
Recent Accounting Pronouncements
In October 2016, the Financial Accounting Standards Board ("FASB") issued ASU No. 2016-16, Accounting for Income Taxes: Intra-Entity Asset Transfers of Assets Other than Inventory. ASU 2016-16 is effective for fiscal years, and interim periods within those years, beginning after December 15, 2017. ASU 2016-16 requires companies to recognize the income tax effects of intercompany sales or transfers of other assets in the income statement as income tax expense (benefit) in the period the sale or transfer occurs. Additionally, companies would evaluate whether the tax effects of the intercompany sales of transfers of non-inventory assets should be included in their estimates of annual effective tax rates by using today's interim guidance on income tax accounting. ASU 2016-16 will require modified retrospective transition with a cumulative catch-up adjustment to opening retained earnings in the period of adoption, which we will implement in the first quarter of fiscal 2018. At February 3, 2018 , the Company had $5.7 million in assets related to the transfer of intra–entity asset transfers.
In February 2016, the FASB issued ASU No. 2016-02, Leases, which replaces the existing guidance in Accounting Standard Codification 840, Leases. ASU 2016-02 is effective for fiscal years, and interim periods within those years, beginning after December 15, 2018 and should be applied on a modified retrospective basis. ASU 2016-02 requires a dual approach for lessee accounting under which a lessee would account for leases as finance leases or operating leases. Both finance leases and operating leases will result in the lessee recognizing a right-of-use asset and corresponding lease liability. For finance leases, the lessee would recognize interest expense and amortization of the right-of-use asset and for operating leases, the lessee would recognize straight-line total rent expense. Upon adoption of the standard in fiscal 2019, we expect to record material right–of– use assets and lease liabilities on the balance sheet approximating the present value of future lease payments.
In January 2016, the FASB issued ASU No. 2016-01, Recognition and Measurement of Financial Assets and Financial Liabilities , under which entities will no longer be able to recognize unrealized holding gains and losses on equity securities they classify as available-for-sale in other comprehensive income but instead recognize the change in fair value in net income. The standard is effective for interim and annual reporting periods beginning after December 15, 2017 and should be applied prospectively with a cumulative adjustment to opening retained earnings. We do not anticipate adoption to have a material impact to our consolidated financial statements.
In May 2014, the FASB issued ASU No. 2014-09, Revenue from Contracts with Customers. The update outlines a single comprehensive model for entities to use in accounting for revenue arising from contracts with customers and supersedes most current revenue recognition guidance, including industry-specific guidance. ASU 2014-09 requires entities to recognize revenue in a way that depicts the transfer of promised goods or services to customers in an amount that reflects the consideration the entity expects to be entitled to in exchange for those goods or services. In August 2015, the FASB approved a one year deferral of the effective date, to make it effective for annual and interim reporting periods beginning after December 15, 2017. The standard allows for either a full retrospective or a modified retrospective transition method. The FASB has issued subsequent ASUs related to ASU No. 2014-09, which detail amendments to the ASU, implementation considerations, narrow-scope improvements and practical expedients. Through our evaluation of the impact of this ASU, we have identified certain changes that are expected to be made to our accounting policies, practices, systems and controls including: revenue related to our online sales will be recognized at the shipping point rather than upon receipt by the customer; the timing of our recognition of advertising expenses, whereby certain expenses that are currently amortized over their expected period of future benefit will be expensed the first time the advertisement appears; and presentation of estimated merchandise returns as both an asset, equal to the inventory value net of processing costs, and a corresponding return liability, compared to the current practice of recording an estimated net return liability. We plan to adopt this ASU under the modified retrospective approach beginning in the first quarter of fiscal 2018 with a cumulative adjustment to opening retained earnings as opposed to retrospectively adjusting prior periods. Based on our progress to date, we do not anticipate adoption to have a material impact to our consolidated financial statements.
Forward-Looking Statements
This Form 10-K may contain certain "forward-looking statements" within the meaning of Section 27A of the Securities Act of 1933, as amended, and Section 21E of the Securities Exchange Act of 1934, as amended, which reflect our current views with respect to certain events that could have an effect on our future financial performance, including but without limitation, statements regarding our plans, objectives, and the future success of our store concepts and our business initiatives. These statements may address items such as future sales and sales initiatives, gross margin expectations, SG&A expectations, including expected savings, operating margin expectations, earnings per share expectations, planned store openings, closings and expansions, proposed business ventures, new channels of sales or distribution, expected impact of ongoing litigation, future stock repurchase plans, future plans to pay dividends, future comparable sales, future product sourcing plans, future inventory levels, planned marketing expenditures, planned capital expenditures and future cash needs.
28
Table of Contents
These statements relate to expectations concerning matters that are not historical fact and may include the words or phrases such as "will," "should," "expects," "believes," "anticipates," "plans," "intends," "estimates," "approximately," "our planning assumptions," "future outlook" and similar expressions. Except for historical information, matters discussed in this Form 10-K are forward-looking statements. These forward-looking statements are based largely on information currently available to our management and on our current expectations, assumptions, plans, estimates, judgments and projections about our business and our industry, and are subject to various risks and uncertainties that could cause actual results to differ materially from historical results or those currently anticipated. Although we believe our expectations are based on reasonable estimates and assumptions, they are not guarantees of performance and there are a number of known and unknown risks, uncertainties, contingencies and other factors (many of which are outside our control) that could cause actual results to differ materially from those expressed or implied by such forward-looking statements. Accordingly, there is no assurance that our expectations will, in fact, occur or that our estimates or assumptions will be correct, and we caution investors and all others not to place undue reliance on such forward-looking statements. Factors that could cause or contribute to such differences include, but are not limited to, those described in Item 1A, "Risk Factors" in this Annual Report on Form 10-K and the following:
The financial strength of retailing in particular and the economy in general; the extent of financial difficulties or economic uncertainty that may be experienced by customers; our ability to secure and maintain customer acceptance of styles and in-store and online concepts; the ability to effectively manage and maintain an appropriate level of inventory; the extent and nature of competition in the markets in which we operate; the ability to remain competitive with customer shipping terms and costs pertaining to product deliveries and returns; the extent of the market demand and overall level of spending for women's private branded clothing and related accessories; the effectiveness of our brand awareness and marketing programs; the ability to coordinate product development with buying and planning; the quality and timeliness of merchandise received from suppliers; the ability to efficiently, timely and successfully manage our business in the face of significant economic, labor, political or other shifts in the countries from which our merchandise is supplied; the changes in the costs of manufacturing, raw materials, transportation, distribution, labor and advertising; the availability of quality store sites; our ability to manage our store fleet and the risk that our investments in merchandise or marketing initiatives may not deliver the results we anticipate; our ability to successfully navigate the increasing use of on-line retailers for fashion purchases and the pressure that puts on traffic and transactions in our physical stores; the ability to operate our own retail websites in a manner that produces profitable sales; the ability to successfully identify and implement additional sales and distribution channels; the ability to successfully execute our business strategies and to achieve the expected results from them; the continuing performance, implementation and integration of management information systems; the impact of any systems failures, cyber security or other data or security breaches, including any security breaches that result in theft, transfer, or unauthorized disclosure of customer, employee, or company information or our compliance with information security and privacy laws and regulations in the event of such an incident; the ability to hire, train, motivate and retain qualified sales associates, managerial employees and other employees; the successful integration of the new members of our senior management team; the ability to respond effectively to actions of activist shareholders and others; the ability to utilize our distribution center and other support facilities in an efficient and effective manner; the ability to secure and protect trademarks and other intellectual property rights and to protect our reputation and brand images; and the risk that natural disasters, public health crises, political uprisings, uncertainty or unrest, or other catastrophic events could adversely affect our operations and financial results; the impact of unanticipated changes in legal, regulatory or tax laws; the potential risks and uncertainties that are related to our reliance on sourcing from foreign suppliers, including the impact of changes in tariffs, taxes or other import regulations; and changes in governmental policies in or towards foreign countries; currency exchange rates and other similar factors.
All forward-looking statements that are made or attributable to us are expressly qualified in their entirety by this cautionary notice. The forward-looking statements included herein are only made as of the date of this Annual Report on Form 10-K. We undertake no obligation to publicly update or revise any forward-looking statements, whether as a result of new information, future events or otherwise.
29
Table of Contents
ITEM 7A. | QUANTITATIVE AND QUALITATIVE DISCLOSURES ABOUT MARKET RISK |
The market risk of our financial instruments as of February 3, 2018 has not significantly changed since January 28, 2017 . We are exposed to market risk from changes in interest rates on any future indebtedness and our marketable securities and from foreign currency exchange rate fluctuations.
Our primary exposure to interest rate risk relates in part to our revolving line of credit with our bank. On May 4, 2015, we entered into a new credit agreement and repaid, with no prepayment penalties, the then outstanding obligation under our 2011 credit facility. The new agreement, which matures on May 4, 2020, has borrowing options which accrue interest by reference, at our election, at either an adjusted eurodollar rate tied to LIBOR or an Alternate Base Rate plus an interest rate margin, as defined in the Credit Agreement. As of February 3, 2018 , $68.6 million in net borrowings under the term loan were outstanding under the Credit Agreement, and are reflected as $15.0 million in current debt and $53.6 million in long-term debt in the accompanying consolidated balance sheet. An increase or decrease in market interest rates of 100 basis points would not have a material effect on annual interest expense. This hypothetical analysis may differ from the actual experience or market developments that could result in a change in interest rates under the Credit Agreement.
Our investment portfolio is maintained in accordance with our investment policy which identifies allowable investments, specifies credit quality standards and limits the credit exposure of any single issuer. Our investment portfolio consists of cash equivalents and marketable securities including corporate bonds, municipal bonds, and U.S. government and agency securities. The marketable securities portfolio as of February 3, 2018 , consisted of $34.0 million of securities with maturity dates within one year or less and $26.1 million with maturity dates over one year and less than or equal to two years. We consider all securities available-for-sale, including those with maturity dates beyond 12 months, and therefore classify these securities as short-term investments within current assets on the consolidated balance sheets as they are available to support current operational liquidity needs. As of February 3, 2018 , an increase or decrease of 100 basis points in interest rates would not have a material effect on the fair value of our marketable securities portfolio.
30
Table of Contents
ITEM 8. | FINANCIAL STATEMENTS AND SUPPLEMENTARY DATA |
Report of Independent Registered Certified Public Accounting Firm
To the Shareholders and the Board of Directors of Chico's FAS, Inc.
Opinion on the Financial Statements
We have audited the accompanying consolidated balance sheets of Chico's FAS, Inc. and subsidiaries as of February 3, 2018 and January 28, 2017 , and the related consolidated statements of income, comprehensive income, stockholders' equity and cash flows for each of the three fiscal years in the period ended February 3, 2018 , and the related notes (collectively referred to as the "consolidated financial statements"). In our opinion, the consolidated financial statements present fairly, in all material respects, the financial position of the Company at February 3, 2018 and January 28, 2017 , and the results of its operations and its cash flows for each of the three fiscal years in the period ended February 3, 2018 , in conformity with U.S. generally accepted accounting principles.
We also have audited, in accordance with the standards of the Public Company Accounting Oversight Board (United States) ("PCAOB"), the Company's internal control over financial reporting as of February 3, 2018 , based on criteria established in Internal Control-Integrated Framework issued by the Committee of Sponsoring Organizations of the Treadway Commission (2013 framework) and our report dated March 13, 2018 expressed an unqualified opinion thereon.
Basis for Opinion
These financial statements are the responsibility of the Company's management. Our responsibility is to express an opinion on the Company's financial statements based on our audits. We are a public accounting firm registered with the PCAOB and are required to be independent with respect to the Company in accordance with the U.S. federal securities laws and the applicable rules and regulations of the Securities and Exchange Commission and the PCAOB.
We conducted our audits in accordance with the standards of the PCAOB. Those standards require that we plan and perform the audit to obtain reasonable assurance about whether the financial statements are free of material misstatement, whether due to error or fraud. Our audits included performing procedures to assess the risks of material misstatement of the financial statements, whether due to error or fraud, and performing procedures that respond to those risks. Such procedures included examining, on a test basis, evidence regarding the amounts and disclosures in the financial statements. Our audits also included evaluating the accounting principles used and significant estimates made by management, as well as evaluating the overall presentation of the financial statements. We believe that our audits provide a reasonable basis for our opinion.
/s/ ERNST & YOUNG LLP |
We have served as the Company's auditor since 2002.
Tampa, Florida
March 13, 2018
31
Table of Contents
CHICO'S FAS, INC. AND SUBSIDIARIES
CONSOLIDATED STATEMENTS OF INCOME
(In thousands, except per share amounts)
| FISCAL YEAR ENDED | |||||||||||||||||||
| February 3, 2018 |
| January 28, 2017 |
| January 30, 2016 | |||||||||||||||
(53 weeks) | (52 weeks) | (52 weeks) | ||||||||||||||||||
| Amount |
| % of |
| Amount |
| % of |
| Amount |
| % of | |||||||||
Net Sales | $ | 2,282,379 | |
| 100.0 | % |
| $ | 2,476,410 | |
| 100.0 | % |
| $ | 2,660,635 | |
| 100.0 | % |
Cost of goods sold | 1,417,602 | |
| 62.1 | |
| 1,529,574 | |
| 61.8 | |
| 1,633,764 | |
| 61.4 | | |||
Gross Margin | 864,777 | |
| 37.9 | |
| 946,836 | |
| 38.2 | |
| 1,026,871 | |
| 38.6 | | |||
Selling, general and administrative expenses | 719,607 | |
| 31.5 | |
| 775,107 | |
| 31.2 | |
| 878,699 | |
| 33.0 | | |||
Goodwill and intangible impairment charges | - | |
| 0.0 | |
| - | |
| 0.0 | |
| 112,455 | |
| 4.3 | | |||
Restructuring and strategic charges | - | |
| 0.0 | |
| 31,027 | |
| 1.3 | |
| 48,801 | |
| 1.8 | | |||
Income from Operations | 145,170 | |
| 6.4 | |
| 140,702 | |
| 5.7 | |
| (13,084 | ) |
| (0.5 | ) | |||
Interest expense, net | (1,570 | ) |
| (0.1 | ) |
| (1,973 | ) |
| (0.1 | ) |
| (1,870 | ) |
| 0.0 | | |||
Income before Income Taxes | 143,600 | |
| 6.3 | |
| 138,729 | |
| 5.6 | |
| (14,954 | ) |
| (0.5 | ) | |||
Income tax provision (benefit) | 42,600 | |
| 1.9 | |
| 47,500 | |
| 1.9 | |
| (16,900 | ) |
| (0.6 | ) | |||
Net Income | $ | 101,000 | |
| 4.4 | % |
| $ | 91,229 | |
| 3.7 | % |
| $ | 1,946 | |
| 0.1 | % |
Per Share Data: |
|
|
|
|
|
|
|
|
|
|
| |||||||||
Net income per common share-basic | $ | 0.79 | |
|
|
| $ | 0.69 | |
|
|
| $ | 0.01 | |
|
| |||
Net income per common and common equivalent share–diluted | $ | 0.79 | |
|
|
| $ | 0.69 | |
|
|
| $ | 0.01 | |
|
| |||
Weighted average common shares outstanding–basic | 125,341 | |
|
|
| 128,995 | |
|
|
| 138,366 | |
|
| ||||||
Weighted average common and common equivalent shares outstanding–diluted | 125,403 | |
|
|
| 129,237 | |
|
|
| 138,741 | |
|
| ||||||
Dividends declared and paid per share | $ | 0.33 | |
|
|
| $ | 0.32 | |
|
|
| $ | 0.31 | |
|
| |||
The accompanying notes are an integral part of these consolidated statements.
32
Table of Contents
CHICO'S FAS, INC. AND SUBSIDIARIES
CONSOLIDATED STATEMENTS OF COMPREHENSIVE INCOME
(In thousands)
| FISCAL YEAR ENDED | ||||||||||
| February 3, 2018 |
| January 28, 2017 |
| January 30, 2016 | ||||||
(53 weeks) | (52 weeks) | (52 weeks) | |||||||||
Net Income | $ | 101,000 | |
| $ | 91,229 | |
| $ | 1,946 | |
Other comprehensive income: |
|
|
|
|
| ||||||
Unrealized losses on marketable securities, net of taxes | (135 | ) |
| (39 | ) |
| (21 | ) | |||
Foreign currency translation gains (losses) | 119 | |
| (29 | ) |
| (501 | ) | |||
Comprehensive Income | $ | 100,984 | |
| $ | 91,161 | |
| $ | 1,424 | |
The accompanying notes are an integral part of these consolidated statements.
33
Table of Contents
CHICO'S FAS, INC. AND SUBSIDIARIES
CONSOLIDATED BALANCE SHEETS
(In thousands)
| February 3, 2018 |
| January 28, 2017 | ||||
ASSETS |
|
|
| ||||
Current Assets: |
|
|
| ||||
Cash and cash equivalents | $ | 160,071 | |
| $ | 142,135 | |
Marketable securities, at fair value | 60,060 | |
| 50,370 | | ||
Inventories | 233,726 | |
| 232,363 | | ||
Prepaid expenses and other current assets | 60,668 | |
| 52,758 | | ||
Total Current Assets | 514,525 | |
| 477,626 | | ||
|
|
|
| ||||
Property and Equipment, net | 421,038 | |
| 477,185 | | ||
|
|
|
| ||||
Other Assets: |
|
|
| ||||
Goodwill | 96,774 | |
| 96,774 | | ||
Other intangible assets, net | 38,930 | |
| 38,930 | | ||
Other assets, net | 16,338 | |
| 18,479 | | ||
Total Other Assets | 152,042 | |
| 154,183 | | ||
| $ | 1,087,605 | |
| $ | 1,108,994 | |
LIABILITIES AND SHAREHOLDERS' EQUITY |
|
|
| ||||
Current Liabilities: |
|
|
| ||||
Accounts payable | $ | 118,253 | |
| $ | 116,378 | |
Current debt | 15,000 | |
| 16,250 | | ||
Other current and deferred liabilities | 133,715 | |
| 170,232 | | ||
Total Current Liabilities | 266,968 | |
| 302,860 | | ||
|
|
|
| ||||
Noncurrent Liabilities: |
|
|
| ||||
Long-term debt | 53,601 | |
| 68,535 | | ||
Deferred liabilities | 103,282 | |
| 118,543 | | ||
Deferred taxes | 7,372 | |
| 9,883 | | ||
Total Noncurrent Liabilities | 164,255 | |
| 196,961 | | ||
Commitments and Contingencies | |
| | ||||
|
|
|
| ||||
Shareholders' Equity: |
|
|
| ||||
Preferred stock, $.01 par value; 2,500 shares authorized; no shares issued and outstanding | - | |
| - | | ||
Common stock, $.01 par value; 400,000 shares authorized; 156,585 and 155,170 shares issued; and 127,471 and 128,753 shares outstanding, respectively | 1,275 | |
| 1,288 | | ||
Additional paid-in capital | 468,806 | |
| 452,756 | | ||
Treasury stock, at cost, 29,114 shares and 26,417 shares, respectively | (413,465 | ) |
| (386,094 | ) | ||
Retained earnings | 599,810 | |
| 541,251 | | ||
Accumulated other comprehensive loss | (44 | ) |
| (28 | ) | ||
Total Shareholders' Equity | 656,382 | |
| 609,173 | | ||
| $ | 1,087,605 | |
| $ | 1,108,994 | |
34
Table of Contents
CHICO'S FAS, INC. AND SUBSIDIARIES
CONSOLIDATED STATEMENTS OF SHAREHOLDERS' EQUITY
(In thousands)
| Common Stock |
| Additional Paid-in |
| Treasury Stock |
|
|
| Accumulated Other Comprehensive |
|
| ||||||||||||||||||
| Shares |
| Par Value |
|
| Shares |
| Amount |
| Retained |
|
| Total | ||||||||||||||||
BALANCE, January 31, 2015 | 152,916 | |
| $ | 1,529 | |
| $ | 407,275 | |
| - | |
| $ | - | |
| $ | 534,255 | |
| $ | 562 | |
| $ | 943,621 | |
Net income | - | |
| - | |
| - | |
| - | |
| - | |
| 1,946 | |
| - | |
| 1,946 | | ||||||
Unrealized loss on marketable securities, net of taxes | - | |
| - | |
| - | |
| - | |
| - | |
| - | |
| (21 | ) |
| (21 | ) | ||||||
Foreign currency translation adjustment | - | |
| - | |
| - | |
| - | |
| - | |
| - | |
| (501 | ) |
| (501 | ) | ||||||
Issuance of common stock | 1,716 | |
| 17 | |
| 10,596 | |
| - | |
| - | |
| - | |
| - | |
| 10,613 | | ||||||
Dividends paid on common stock ($0.31 per share) | - | |
| - | |
| - | |
| - | |
| - | |
| (43,876 | ) |
| - | |
| (43,876 | ) | ||||||
Repurchase of common stock | (19,101 | ) |
| (191 | ) |
| (12,845 | ) |
| 18,307 | |
| (289,813 | ) |
| - | |
| - | |
| (302,849 | ) | ||||||
Stock-based compensation | - | |
| - | |
| 30,062 | |
| - | |
| - | |
| - | |
| - | |
| 30,062 | | ||||||
Excess tax benefit from stock-based compensation | - | |
| - | |
| 793 | |
| - | |
| - | |
| - | |
| - | |
| 793 | | ||||||
BALANCE, January 30, 2016 | 135,531 | |
| 1,355 | |
| 435,881 | |
| 18,307 | |
| (289,813 | ) |
| 492,325 | |
| 40 | |
| 639,788 | | ||||||
Net income | - | |
| - | |
| - | |
| - | |
| - | |
| 91,229 | |
| - | |
| 91,229 | | ||||||
Unrealized loss on marketable securities, net of taxes | - | |
| - | |
| - | |
| - | |
| - | |
| - | |
| (39 | ) |
| (39 | ) | ||||||
Foreign currency translation adjustment | - | |
| - | |
| - | |
| - | |
| - | |
| - | |
| (29 | ) |
| (29 | ) | ||||||
Issuance of common stock | 1,763 | |
| 18 | |
| 4,341 | |
| - | |
| - | |
| - | |
| - | |
| 4,359 | | ||||||
Dividends paid on common stock ($0.32 per share) | - | |
| - | |
| - | |
| - | |
| - | |
| (42,303 | ) |
| - | |
| (42,303 | ) | ||||||
Repurchase of common stock | (8,541 | ) |
| (85 | ) |
| (5,512 | ) |
| 8,110 | |
| (96,281 | ) |
| - | |
| - | |
| (101,878 | ) | ||||||
Stock-based compensation | - | |
| - | |
| 21,249 | |
| - | |
| - | |
| - | |
| - | |
| 21,249 | | ||||||
Excess tax benefit from stock-based compensation | - | |
| - | |
| (3,203 | ) |
| - | |
| - | |
| - | |
| - | |
| (3,203 | ) | ||||||
BALANCE, January 28, 2017 | 128,753 | |
| 1,288 | |
| 452,756 | |
| 26,417 | |
| (386,094 | ) |
| 541,251 | |
| (28 | ) |
| 609,173 | | ||||||
Net income | - | |
| - | |
| - | |
| - | |
| - | |
| 101,000 | |
| - | |
| 101,000 | | ||||||
Unrealized loss on marketable securities, net of taxes | - | |
| - | |
| - | |
| - | |
| - | |
| - | |
| (135 | ) |
| (135 | ) | ||||||
Foreign currency translation adjustment | - | |
| - | |
| - | |
| - | |
| - | |
| - | |
| 119 | |
| 119 | | ||||||
Issuance of common stock | 1,931 | |
| 19 | |
| 2,108 | |
| - | |
| - | |
| - | |
| - | |
| 2,127 | | ||||||
Dividends paid on common stock ($0.33 per share) | - | |
| - | |
| - | |
| - | |
| - | |
| (42,441 | ) |
| - | |
| (42,441 | ) | ||||||
Repurchase of common stock | (3,213 | ) |
| (32 | ) |
| (6,735 | ) |
| 2,697 | |
| (27,371 | ) |
| - | |
| - | |
| (34,138 | ) | ||||||
Stock-based compensation | - | |
| - | |
| 20,677 | |
| - | |
| - | |
| - | |
| - | |
| 20,677 | | ||||||
BALANCE, February 3, 2018 | 127,471 | |
| $ | 1,275 | |
| $ | 468,806 | |
| 29,114 | |
| $ | (413,465 | ) |
| $ | 599,810 | |
| $ | (44 | ) |
| $ | 656,382 | |
The accompanying notes are an integral part of these consolidated statements.
35
Table of Contents
CHICO'S FAS, INC. AND SUBSIDIARIES
CONSOLIDATED STATEMENTS OF CASH FLOWS
(In thousands)
| FISCAL YEAR ENDED | ||||||||||
| February 3, 2018 |
| January 28, 2017 |
| January 30, 2016 | ||||||
| (53 weeks) |
| (52 weeks) |
| (52 weeks) | ||||||
Cash Flows from Operating Activities: |
|
|
|
|
| ||||||
Net income | $ | 101,000 | |
| $ | 91,229 | |
| $ | 1,946 | |
Adjustments to reconcile net income to net cash provided by operating activities: |
|
|
|
|
| ||||||
Goodwill and intangible impairment charges, pre-tax | - | |
| - | |
| 112,455 | | |||
Depreciation and amortization | 96,310 | |
| 109,251 | |
| 118,800 | | |||
Loss on disposal and impairment of property and equipment | 7,042 | |
| 10,523 | |
| 23,744 | | |||
Deferred tax benefit | (2,070 | ) |
| (8,427 | ) |
| (34,415 | ) | |||
Stock-based compensation expense | 20,677 | |
| 21,249 | |
| 30,062 | | |||
Deferred rent and lease credits | (19,692 | ) |
| (18,811 | ) |
| (21,741 | ) | |||
Changes in assets and liabilities: |
|
|
|
|
| ||||||
Inventories | (1,363 | ) |
| 1,472 | |
| (6,719 | ) | |||
Prepaid expenses and other assets | (4,584 | ) |
| (7,565 | ) |
| 358 | | |||
Income tax receivable | (311 | ) |
| 26,749 | |
| (28,562 | ) | |||
Accounts payable | 1,950 | |
| (13,015 | ) |
| (12,101 | ) | |||
Accrued and other liabilities | (32,086 | ) |
| 18,659 | |
| 16,248 | | |||
Net cash provided by operating activities | 166,873 | |
| 231,314 | |
| 200,075 | | |||
|
|
|
|
|
| ||||||
Cash Flows from Investing Activities: |
|
|
|
|
| ||||||
Purchases of marketable securities | (39,794 | ) |
| (50,717 | ) |
| (52,668 | ) | |||
Proceeds from sale of marketable securities | 30,045 | |
| 50,508 | |
| 129,000 | | |||
Purchases of property and equipment, net | (48,530 | ) |
| (47,836 | ) |
| (84,841 | ) | |||
Proceeds from sale of land | - | |
| 16,217 | |
| - | | |||
Proceeds from sale of Boston Proper net assets | - | |
| - | |
| 9,000 | | |||
Net cash (used in) provided by investing activities | (58,279 | ) |
| (31,828 | ) |
| 491 | | |||
|
|
|
|
|
| ||||||
Cash Flows from Financing Activities: |
|
|
|
|
| ||||||
Proceeds from borrowings | - | |
| - | |
| 124,000 | | |||
Payments on borrowings | (16,250 | ) |
| (7,500 | ) |
| (31,500 | ) | |||
Proceeds from issuance of common stock | 2,127 | |
| 4,359 | |
| 10,613 | | |||
Dividends paid | (42,516 | ) |
| (42,254 | ) |
| (43,729 | ) | |||
Repurchase of common stock | (27,398 | ) |
| (96,363 | ) |
| (289,995 | ) | |||
Payments of tax withholdings related to stock-based awards | (6,740 | ) |
| (5,515 | ) |
| (12,854 | ) | |||
Net cash used in financing activities | (90,777 | ) |
| (147,273 | ) |
| (243,465 | ) | |||
Effects of exchange rate changes on cash and cash equivalents | 119 | |
| (29 | ) |
| (501 | ) | |||
Net increase (decrease) in cash and cash equivalents | 17,936 | |
| 52,184 | |
| (43,400 | ) | |||
Cash and Cash Equivalents, Beginning of period | 142,135 | |
| 89,951 | |
| 133,351 | | |||
Cash and Cash Equivalents, End of period | $ | 160,071 | |
| $ | 142,135 | |
| $ | 89,951 | |
|
|
|
|
|
| ||||||
Supplemental Disclosures of Cash Flow Information: |
|
|
|
|
| ||||||
Cash paid for interest | $ | 2,546 | |
| $ | 2,316 | |
| $ | 2,375 | |
Cash paid for income taxes, net | $ | 49,758 | |
| $ | 25,863 | |
| $ | 47,342 | |
36
Table of Contents
CHICO'S FAS, INC. AND SUBSIDIARIES
NOTES TO CONSOLIDATED FINANCIAL STATEMENTS
(In thousands, except share and per share amounts and where otherwise indicated)
1. | BUSINESS ORGANIZATION AND SUMMARY OF SIGNIFICANT ACCOUNTING POLICIES: |
Description of Business
The accompanying consolidated financial statements include the accounts of Chico's FAS, Inc., a Florida corporation, and its wholly-owned subsidiaries ("the Company", "we", "us" and "our"). We operate as an omni-channel specialty retailer of women's private branded, sophisticated, casual-to-dressy clothing, intimates and complementary accessories. We currently sell our products through retail stores, catalogs and via our websites at www.chicos.com , www.chicosofftherack.com, www.whbm.com and www.soma.com . As of February 3, 2018 , we had 1,460 stores located throughout the United States, Puerto Rico, the U.S. Virgin Islands and Canada, and sold merchandise through 94 franchise locations in Mexico.
Fiscal Year
Our fiscal years end on the Saturday closest to January 31 and are designated by the calendar year in which the fiscal year commences. The periods presented in these consolidated financial statements are the fiscal years ended February 3, 2018 ("fiscal 2017 " or "current period"), January 28, 2017 ("fiscal 2016 " or "prior period") and January 30, 2016 ("fiscal 2015 "). Fiscal 2017 contained 53 weeks while fiscal 2016 and 2015 each contained 52 weeks.
Principles of Consolidation
The consolidated financial statements include the accounts of the Company and its wholly-owned subsidiaries. All significant intercompany balances and transactions have been eliminated in consolidation.
Segment Information
Our brands, Chico's, White House Black Market ("WHBM") and Soma have been identified as separate operating segments and aggregated into one reportable segment due to the similarities of the economic and operating characteristics of the brands.
Adoption of New Accounting Pronouncements
In the first quarter of 2017, we adopted the guidance of Accounting Standard Update ("ASU") 2016-09, Improvements to Employee Share-Based Payment Accounting, which simplifies several aspects of the accounting for employee share-based payment transactions, including the accounting for income taxes, forfeitures and statutory tax withholding requirements, as well as classification in the statement of cash flows. The provision of ASU 2016-09 related to the recognition of excess tax benefits and deficiencies in the income statement was adopted on a prospective basis whereas the provision related to the classification in the statement of cash flows was adopted retrospectively, and the prior periods were adjusted accordingly. The Company has elected to continue estimating forfeitures of share-based awards when determining compensation cost to be recognized each period. The adoption of ASU 2016-09 did not have a material impact on the accompanying consolidated financial statements.
Use of Estimates
The preparation of consolidated financial statements in conformity with accounting principles generally accepted in the United States of America requires management to make estimates and assumptions that affect the reported amounts of assets and liabilities and disclosure of contingent assets and liabilities at the date of the financial statements and the reported amounts of revenues and expenses during the reporting period. Actual results could differ from those estimates.
Cash and Cash Equivalents
Cash and cash equivalents include cash on hand and in banks, short-term highly liquid investments with original maturities of three months or less and payments due from banks for third-party credit card and debit transactions for approximately 3 to 5 days of sales.
37
Table of Contents
Marketable Securities
Marketable securities are classified as available-for-sale and are carried at fair value, with the unrealized holding gains and losses, net of income taxes, reflected in accumulated other comprehensive income until realized. For the purposes of computing realized and unrealized gains and losses, cost and fair value are determined on a specific identification basis. We consider all securities available-for-sale, including those with maturity dates beyond 12 months, and therefore classify these securities within current assets on the consolidated balance sheets as they are available to support current operational liquidity needs.
Fair Value of Financial Instruments
Our consolidated financial instruments consist of cash, money market accounts, marketable securities, assets held in our non-qualified deferred compensation plan, accounts receivable, accounts payable and debt. Cash, accounts receivable and accounts payable are carried at cost, which approximates their fair value due to the short-term nature of the instruments.
Inventories
We use the weighted average cost method to determine the cost of merchandise inventories. We identify potentially excess and slow-moving inventories by evaluating inventory aging, turn rates and inventory levels in conjunction with our overall sales trend. Further, inventory realization exposure is identified through analysis of gross margins and markdowns in combination with changes in current business trends. We record excess and slow-moving inventories at net realizable value and may liquidate certain slow-moving inventory through third parties. We estimate our expected shrinkage of inventories between physical inventory counts by using average store shrinkage experience rates, which are updated on a regular basis. Substantially all of our inventories consist of finished goods.
Costs associated with sourcing are generally capitalized while merchandising, distribution and product development costs are generally expensed as incurred, and are included in the accompanying consolidated statements of income as a component of cost of goods sold. Approximately 23% of total purchases in fiscal 2017 and 2016 were made from one supplier. In fiscal 2017 and 2016 , approximately 52% and 55% of our merchandise cost originated in China, respectively.
Property and Equipment
Property and equipment is stated at cost, net of accumulated depreciation and amortization. Depreciation of property and equipment is provided on a straight-line basis over the estimated useful lives of the assets. Leasehold improvements are amortized over the shorter of their estimated useful lives (generally 10 years or less) or the related lease term, plus one anticipated renewal when there is an economic cost associated with non-renewal.
Our property and equipment is generally depreciated using the following estimated useful lives:
|
|
| Estimated Useful Lives |
Land improvements | 15 - 35 years |
Building and building improvements | 20 - 35 years |
Equipment, furniture and fixtures | 2 - 20 years |
Leasehold improvements | 10 years or term of lease, if shorter |
Maintenance and repairs of property and equipment are expensed as incurred, and major improvements are capitalized. Upon retirement, sale or other disposition of property and equipment, the cost and accumulated depreciation or amortization are eliminated from the accounts, and any gain or loss is charged to income.
38
Table of Contents
Operating Leases
We lease retail stores and a limited amount of office space under operating leases. The majority of our lease agreements provide for tenant improvement allowances, rent escalation clauses and/or contingent rent provisions. Tenant improvement allowances are recorded as a deferred lease credit within deferred liabilities and amortized as a reduction of rent expense over the term of the lease. Rent escalation clauses, "rent-free" periods and other rental expenses are amortized on a straight-line basis over the term of the leases, including the construction period. This is generally 60 - 90 days prior to the store opening date, when we generally begin improvements in preparation for our intended use.
Certain leases provide for contingent rents, in addition to a basic fixed rent, which are determined as a percentage of gross sales in excess of specified levels. We record a contingent rent liability in accrued liabilities on the consolidated balance sheets and the corresponding rent expense when specified levels have been achieved or when it is determined that achieving the specified levels during the lease year is probable.
Goodwill and Other Intangible Assets
Goodwill and other indefinite-lived intangible assets are assessed for impairment at least annually. We perform our annual impairment test during the fourth quarter, or more frequently should events or circumstances change that would indicate that impairment may have occurred.
Goodwill represents the excess of the purchase price over the fair value of identifiable tangible and intangible assets acquired and liabilities assumed in a business combination. Impairment testing for goodwill is done at a reporting unit level. Reporting units are defined as an operating segment or one level below an operating segment, called a component. Using these criteria, we identified our reporting units and concluded that the goodwill related to the territorial franchise rights for the state of Minnesota should be allocated to the Chico's reporting unit and the goodwill associated with the WHBM acquisition should be assigned to the WHBM reporting unit.
We evaluate the appropriateness of performing a qualitative assessment, on a reporting unit level, based on current circumstances. A two-step impairment test is performed only if the results of the qualitative assessment indicate that it is more likely than not that the fair value of a reporting unit is less than its carrying amount. We may elect to skip the qualitative assessment and perform the two-step impairment test. The first step of the impairment test compares the fair value of our reporting units with their carrying amounts, including goodwill. If the carrying amount exceeds fair value, then the second step of the impairment test is performed to measure the amount of any impairment loss. Fair value is determined based on both an income approach and market approach. The income approach is based on estimated future cash flows, discounted at a rate that approximates the cost of capital of a market participant, while the market approach is based on sales or EBITDA multiples of similar companies and transactions or other available indications of value. For 2017 and 2016 , we performed a qualitative assessment of the goodwill associated with the Chico's and WHBM reporting units and concluded it was more likely than not that the fair value exceeded the carrying amount as of the annual assessment dates. In fiscal 2015 , we performed a goodwill impairment assessment of the Boston Proper reporting unit and recorded pre-tax, non-cash goodwill impairment charges of $48.9 million . We completed the sale of the Boston Proper direct-to-consumer ("DTC") business in January 2016.
We test indefinite-lived intangible assets for impairment by first assessing qualitative factors to determine whether it is more likely than not that the fair value of the intangible is less than its carrying amount. If the results of the qualitative assessment indicate that it is more likely than not that the fair value of the intangible is less than its carrying amount, we calculate the value of the indefinite-lived intangible assets using a discounted cash flow method, based on the relief from royalty concept, and compare the fair value to the carrying value to determine if the asset is impaired. We may elect to skip the qualitative assessment when appropriate based on current circumstances. For 2017 and 2016 , we performed a qualitative assessment of the WHBM trade name and concluded it was more likely than not that the fair value exceeded the carrying amount as of the annual assessment dates. In fiscal 2015 we performed an impairment assessment of Boston Proper indefinite-lived intangible assets and recorded pre-tax, non-cash impairment charges of $39.4 million on the Boston Proper trade name.
Intangible assets subject to amortization consisted of the value of Boston Proper customer relationships. In fiscal 2015 , we performed an impairment assessment of the Boston Proper customer relationships and recorded pre-tax, non-cash impairment charges of $24.2 million . All remaining Boston Proper intangible assets, including the Boston Proper trade name and customer relationships were included in the sale of the Boston Proper DTC business in fiscal 2015. In fiscal 2017 and 2016 , we did not have any intangible assets subject to amortization.
39
Table of Contents
Accounting for the Impairment of Long-lived Assets
Long-lived assets, including definite-lived intangibles, are reviewed periodically for impairment if events or changes in circumstances indicate that the carrying amount may not be recoverable. If future undiscounted cash flows expected to be generated by the asset are less than its carrying amount, an asset is determined to be impaired. The fair value of an asset is estimated using estimated future cash flows of the asset discounted by a rate commensurate with the risk involved with such asset while incorporating marketplace assumptions. The impairment loss recorded is the amount by which the carrying value of the asset exceeds its fair value. In fiscal 2017 , 2016 and 2015 , we completed an evaluation of long-lived assets at certain underperforming stores for indicators of impairment and, as a result, recorded impairment charges of approximately $6.0 million , $2.5 million and $1.4 million , respectively, which are included in costs of goods sold in the accompanying consolidated statements of income. Impairment charges in fiscal 2017 included $2.9 million resulting from hurricanes Harvey, Irma and Maria (collectively, the "Hurricanes"). Additionally, in connection with the restructuring program initiated in fiscal 2014 as further discussed in Note 2, we identified approximately 150 stores, including the Boston Proper stores, to be closed from fiscal 2015 through fiscal 2017. As a result, in fiscal 2015 , we recorded additional impairment charges of approximately $12.5 million which are included in restructuring and strategic charges in the accompanying consolidated statements of income. As of the end of fiscal 2017, we have closed a majority of the stores identified for closure in connection with our restructuring and strategic activities and did not incur any material additional impairment charges.
Revenue Recognition
Retail sales by our stores are recorded at the point of sale and are net of estimated customer returns, sales discounts under rewards programs and company issued coupons, promotional discounts and employee discounts. For sales from our websites and catalogs, revenue is recognized at the time we estimate the customer receives the product, which is typically within a few days of shipment. Amounts related to shipping and handling costs billed to customers are recorded in net sales and the related shipping and handling costs are recorded in cost of goods sold in the accompanying consolidated statements of income. Amounts paid by customers to cover shipping and handling costs are immaterial.
We sell gift cards in stores, on our e-commerce website and through third parties. Our gift cards do not have expiration dates. We account for gift cards by recognizing a liability at the time the gift card is sold. The liability is relieved and revenue is recognized for gift cards upon redemption. In addition, we recognize revenue for the amount of gift cards expected to go unredeemed (commonly referred to as gift card breakage) under the redemption recognition method. This method records gift card breakage as revenue on a proportional basis over the redemption period based on our historical gift card breakage rate. We determine the gift card breakage rate based on our historical redemption patterns. We recognize revenue on the remaining unredeemed gift cards based on determining that the likelihood of the gift card being redeemed is remote and that there is no legal obligation to remit the unredeemed gift cards to relevant jurisdictions.
Soma offers a points based loyalty program in which customers earn points based on purchases. Attaining specified loyalty point levels results in the issuance of reward coupons to discount future purchases. As program members accumulate points, we accrue the estimated future liability, adjusted for expected redemption rates and expirations. The liability is relieved and revenue is recognized for loyalty point reward coupons upon redemption. In addition, we recognize revenue on unredeemed points when it can be determined that the likelihood of the point being redeemed is remote and there is no legal obligation to remit the point value. We determined the loyalty point breakage rate based on historical and redemption patterns.
As part of the normal sales cycle, we receive customer merchandise returns related to store, website and catalog sales. To account for the financial impact of potential customer merchandise returns, we estimate future returns on previously sold merchandise. Reductions in sales and gross margin are recorded for estimated merchandise returns based on return history, current sales levels and projected future return levels.
Our policy towards taxes assessed by a government authority directly imposed on revenue producing transactions between a seller and a customer is, and has been, to exclude all such taxes from revenue.
Advertising Costs
Costs associated with the production of non-catalog advertising, such as writing, copying, printing and other costs are expensed as incurred. Costs associated with communicating advertising that has been produced, such as television and magazine, are expensed when the advertising event takes place. Catalog expenses consist of the cost to create, print and distribute catalogs. Such costs are amortized over their expected period of future benefit, which is typically less than six weeks. For fiscal 2017 , 2016 and 2015 , advertising expense was approximately $94.5 million , $115.4 million and $159.9 million , respectively, and is included within SG&A in the accompanying consolidated statements of income.
40
Table of Contents
Stock-Based Compensation
Stock-based compensation for all awards is based on the grant date fair value of the award, net of estimated forfeitures, and is recognized over the requisite service period of the awards. The fair value of restricted stock awards and performance-based awards is determined by using the closing price of the Company's common stock on the date of the grant. Compensation expense for performance-based awards is recorded based on the amount of the award ultimately expected to vest, depending on the level and likelihood of the performance condition being met.
Shipping and Handling Costs
Shipping and handling costs to transport goods to customers, amounted to $40.5 million , $35.9 million and $37.3 million in fiscal 2017 , 2016 and 2015 , respectively, and are included within cost of goods sold in the accompanying consolidated statements of income.
Store Occupancy and Pre-Opening Costs
Store occupancy and pre-opening costs (including store-related costs and training expenses) incurred prior to the opening of new stores are expensed as incurred and are included within cost of sales in the accompanying consolidated statements of income.
Income Taxes
Income taxes are accounted for in accordance with authoritative guidance, which requires the use of the asset and liability method. Deferred tax assets and liabilities are recognized based on the difference between the financial statement carrying amounts of existing assets and liabilities and their respective tax bases. Additionally, we follow a comprehensive model to recognize, measure, present and disclose in our consolidated financial statements the estimated aggregate tax liability of uncertain tax positions that we have taken or expect to take on a tax return. This model states that a tax benefit from an uncertain tax position may be recognized if it is "more likely than not" that the position is sustainable, based upon its technical merits. The tax benefit of a qualifying position is the largest amount of tax benefit that has greater than a 50% likelihood of being realized upon the ultimate settlement with a taxing authority having full knowledge of all relevant information.
Foreign Currency
The functional currency of our foreign operations is generally the applicable local currency. Assets and liabilities are translated into U.S. dollars using the current exchange rates in effect as of the balance sheet date, while revenues and expenses are translated at the average exchange rates for the period. The resulting translation adjustments are recorded as a component of comprehensive income in the consolidated statements of comprehensive income. Transaction gains and losses that arise from exchange rate fluctuations on transactions denominated in a currency other than the local functional currency are included in the consolidated statements of income.
Self-Insurance
We are self-insured for certain losses relating to workers' compensation, medical and general liability claims. Self-insurance claims filed and claims incurred but not reported are accrued based upon management's estimates of the aggregate liability for uninsured claims incurred based on historical experience. While we do not expect the amount we will ultimately pay to differ significantly from our estimates, self-insurance accruals could be affected if future claims experience differs significantly from the historical trends and assumptions.
Supplier Allowances
From time to time, we receive allowances and/or credits from certain of our suppliers. The aggregate amount of such allowances and credits, which is included in cost of goods sold, is immaterial to our consolidated results of operations.
41
Table of Contents
Earnings Per Share
In accordance with relevant accounting guidance, unvested share-based payment awards that include non-forfeitable rights to dividends, whether paid or unpaid, are considered participating securities. As a result, such awards are required to be included in the calculation of earnings per common share pursuant to the "two-class" method. For us, participating securities are composed entirely of unvested restricted stock awards and performance-based restricted stock units ("PSU's") that have met their relevant performance criteria.
Under the two-class method, net income is reduced by the amount of dividends declared in the period for common stock and participating securities. The remaining undistributed earnings are then allocated to common stock and participating securities as if all of the net income for the period had been distributed. Basic EPS excludes dilution and is computed by dividing net income available to common shareholders by the weighted-average number of common shares outstanding during the period including the participating securities. Diluted EPS reflects the dilutive effect of potential common shares from non-participating securities such as stock options, PSU's and restricted stock units.
Newly Issued Accounting Pronouncements
In October 2016, the Financial Accounting Standards Board ("FASB") issued ASU No. 2016-16, Accounting for Income Taxes: Intra-Entity Asset Transfers of Assets Other than Inventory. ASU 2016-16 is effective for fiscal years, and interim periods within those years, beginning after December 15, 2017. ASU 2016-16 requires companies to recognize the income tax effects of intercompany sales or transfers of other assets in the income statement as income tax expense (benefit) in the period the sale or transfer occurs. Additionally, companies would evaluate whether the tax effects of the intercompany sales of transfers of non-inventory assets should be included in their estimates of annual effective tax rates by using today's interim guidance on income tax accounting. ASU 2016-16 will require modified retrospective transition with a cumulative catch-up adjustment to opening retained earnings in the period of adoption, which we will implement in the first quarter of fiscal 2018. At February 3, 2018 , the Company had $5.7 million in assets related to the transfer of intra–entity asset transfers.
In February 2016, the FASB issued ASU No. 2016-02, Leases, which replaces the existing guidance in Accounting Standard Codification 840, Leases. ASU 2016-02 is effective for fiscal years, and interim periods within those years, beginning after December 15, 2018 and should be applied on a modified retrospective basis. ASU 2016-02 requires a dual approach for lessee accounting under which a lessee would account for leases as finance leases or operating leases. Both finance leases and operating leases will result in the lessee recognizing a right-of-use asset and corresponding lease liability. For finance leases, the lessee would recognize interest expense and amortization of the right-of-use asset and for operating leases, the lessee would recognize straight-line total rent expense. Upon adoption of the standard in fiscal 2019, we expect to record material right–of– use assets and lease liabilities on the balance sheet approximating the present value of future lease payments.
In January 2016, the FASB issued ASU No. 2016-01, Recognition and Measurement of Financial Assets and Financial Liabilities , under which entities will no longer be able to recognize unrealized holding gains and losses on equity securities they classify as available-for-sale in other comprehensive income but instead recognize the change in fair value in net income. The standard is effective for interim and annual reporting periods beginning after December 15, 2017 and should be applied prospectively with cumulative adjustment to opening retained earnings. We do not anticipate adoption to have a material impact to our consolidated financial statements.
42
Table of Contents
In May 2014, the FASB issued ASU No. 2014-09, Revenue from Contracts with Customers. The update outlines a single comprehensive model for entities to use in accounting for revenue arising from contracts with customers and supersedes most current revenue recognition guidance, including industry-specific guidance. ASU 2014-09 requires entities to recognize revenue in a way that depicts the transfer of promised goods or services to customers in an amount that reflects the consideration the entity expects to be entitled to in exchange for those goods or services. In August 2015, the FASB approved a one year deferral of the effective date, to make it effective for annual and interim reporting periods beginning after December 15, 2017. The standard allows for either a full retrospective or a modified retrospective transition method. The FASB has issued subsequent ASUs related to ASU No. 2014-09, which detail amendments to the ASU, implementation considerations, narrow-scope improvements and practical expedients. Through our evaluation of the impact of this ASU, we have identified certain changes that are expected to be made to our accounting policies, practices, systems and controls including: revenue related to our online sales will be recognized at the shipping point rather than upon receipt by the customer; the timing of our recognition of advertising expenses, whereby certain expenses that are currently amortized over their expected period of future benefit will be expensed the first time the advertisement appears; and presentation of estimated merchandise returns as both an asset, equal to the inventory value net of processing costs, and a corresponding return liability, compared to the current practice of recording an estimated net return liability. We plan to adopt this ASU under the modified retrospective approach beginning in the first quarter of fiscal 2018 with a cumulative adjustment to opening retained earnings as opposed to retrospectively adjusting prior periods. Based on our progress to date, we do not anticipate adoption to have a material impact to our consolidated financial statements.
2. | RESTRUCTURING AND STRATEGIC CHARGES: |
During the fourth quarter of fiscal 2014, we initiated a restructuring program, including the acceleration of domestic store closures and an organizational realignment, to ensure that resources align with long-term growth initiatives, including omni-channel.
In fiscal 2015 , we completed an evaluation of the Boston Proper brand, completed the sale of the Boston Proper DTC business and closed its stores. We assessed the disposal group and determined that the sale of the Boston Proper DTC business did not have a major effect on our consolidated results of operations, financial position or cash flows. Accordingly, the disposal group is not presented in the consolidated financial statements as a discontinued operation. Pretax losses for the Boston Proper DTC business for fiscal 2015 was $11.8 million . The loss recorded in fiscal 2015 upon disposition of the Boston Proper assets held for sale was not material.
During the first quarter of fiscal 2016 , we expanded our restructuring program to include components of our strategic initiatives that further align the organizational structure with long-term growth initiatives and to reduce cost of goods sold ("COGS") and selling, general and administrative expenses ("SG&A") through strategic initiatives. These strategic initiatives include realigning marketing and digital commerce, improving supply chain efficiency, reducing non-merchandise expenses, optimizing marketing spend and transition of executive leadership. We also adjusted the estimated store closures to 150 through fiscal 2017 in connection with the restructuring and strategic activities. In fiscal 2016 , the Company recorded pre-tax restructuring and strategic charges of $31.0 million , primarily related to outside services, severance and proxy solicitation costs. In fiscal 2016 , we substantially completed our restructuring program. As of the end of fiscal 2017, we have closed a majority of the stores identified for closure in connection with our restructuring and strategic activities and did not incur any material additional expenses related to lease terminations or restructuring and strategic charges.
A summary of the restructuring and strategic charges is presented in the table below:
|
| Fiscal 2016 |
| Fiscal 2015 | ||||
|
|
|
|
| ||||
| (in thousands) | |||||||
Impairment charges |
| $ | 1,453 | |
| $ | 22,001 | |
Continuing employee-related costs |
| 1,796 | |
| 8,330 | | ||
Severance charges |
| 9,485 | |
| 6,863 | | ||
Proxy solicitation costs |
| 5,697 | |
| - | | ||
Lease terminations |
| 427 | |
| 9,578 | | ||
Outside services |
| 12,013 | |
| - | | ||
Other charges |
| 156 | |
| 2,029 | | ||
Restructuring and strategic charges, pre-tax |
| $ | 31,027 | |
| $ | 48,801 | |
43
Table of Contents
As of February 3, 2018 , a reserve of $0.5 million related to restructuring and strategic activities was included in other current and deferred liabilities in the accompanying consolidated balance sheets. A roll-forward of the reserve is presented as follows:
| Continuing Employee-Related Costs |
| Severance Charges |
| Lease Termination Charges |
| Outside Services |
| Total | ||||||||||
|
|
|
|
|
|
|
|
|
| ||||||||||
| (in thousands) | ||||||||||||||||||
Ending Balance, January 28, 2017 | $ | 671 | |
| $ | 2,413 | |
| $ | 846 | |
| $ | 7,299 | |
| $ | 11,229 | |
Charges | - | |
| - | |
| - | |
| - | |
| - | | |||||
Payments | (671 | ) |
| (2,413 | ) |
| (332 | ) |
| (7,299 | ) |
| (10,715 | ) | |||||
Ending Balance, February 3, 2018 | $ | - | |
| $ | - | |
| $ | 514 | |
| $ | - | |
| $ | 514 | |
3. | MARKETABLE SECURITIES: |
Marketable securities are classified as available-for-sale and as of February 3, 2018 generally consist of corporate bonds, U.S. government agencies, municipal securities and commercial paper with $34.0 million of securities with maturity dates within one year or less and $26.1 million with maturity dates over one year and less than two years. As of January 28, 2017 , marketable securities generally consisted of U.S. government agencies and corporate bonds.
The following tables summarize our investments in marketable securities at February 3, 2018 and January 28, 2017 :
| February 3, 2018 | ||||||||||||||
|
| ||||||||||||||
| (in thousands) | ||||||||||||||
| Amortized |
| Gross |
| Gross |
| Estimated | ||||||||
Total marketable securities | $ | 60,361 | |
| $ | - | |
| $ | (301 | ) |
| $ | 60,060 | |
|
|
|
|
|
|
|
| ||||||||
| January 28, 2017 | ||||||||||||||
|
| ||||||||||||||
| (in thousands) | ||||||||||||||
| Amortized |
| Gross |
| Gross |
| Estimated | ||||||||
Total marketable securities | $ | 50,460 | |
| $ | 3 | |
| $ | (93 | ) |
| $ | 50,370 | |
4. | FAIR VALUE MEASUREMENTS: |
Fair value is defined as the price that would be received to sell an asset or paid to transfer a liability in the principal or most advantageous market in an orderly transaction between market participants on the measurement date. Entities are required to use a three-level hierarchy, which requires an entity to maximize the use of observable inputs and minimize the use of unobservable inputs when measuring fair value.
The valuation hierarchy is based upon the transparency of inputs to the valuation of an asset or liability on the measurement date. The three levels are defined as follows:
44
Table of Contents
Level 1 – Unadjusted quoted prices in active markets for identical assets or liabilities
Level 2 – Unadjusted quoted prices in active markets for similar assets or liabilities, or; Unadjusted quoted
prices for identical or similar assets or liabilities in markets that are not active, or; Inputs other than quoted
prices that are observable for the asset or liability
Level 3 – Unobservable inputs for the asset or liability.
We measure certain financial assets at fair value on a recurring basis, including our marketable securities, which are classified as available-for-sale securities, certain cash equivalents, specifically our money market accounts and assets held in our non-qualified deferred compensation plan. The money market accounts are valued based on quoted market prices in active markets. Our marketable securities are generally valued based on other observable inputs for those securities (including market corroborated pricing or other models that utilize observable inputs such as interest rates and yield curves) based on information provided by independent third party pricing entities, except for U.S. government securities which are valued based on quoted market prices in active markets. The investments in our non-qualified deferred compensation plan are valued using quoted market prices and are included in other assets on our consolidated balance sheets.
From time to time, we measure certain assets at fair value on a non-recurring basis. This includes the evaluation of long-lived assets, goodwill and other intangible assets for impairment using company-specific assumptions which would fall within Level 3 of the fair value hierarchy.
To assess the fair value of goodwill, we utilize both an income approach and a market approach. Inputs used to calculate the fair value based on the income approach primarily include estimated future cash flows, discounted at a rate that approximates the cost of capital of a market participant. Inputs used to calculate the fair value based on the market approach include identifying sales and EBITDA multiples based on guidelines for similar publicly traded companies and recent transactions.
To assess the fair value of trade names, we utilize a relief from royalty approach. Inputs used to calculate the fair value of the trade names primarily include future sales projections, discounted at a rate that approximates the cost of capital of a market participant and an estimated royalty rate.
To assess the fair value of long-term debt, we utilize a discounted future cash flow model using current borrowing rates for similar types of debt of comparable maturities.
Fair value calculations contain significant judgments and estimates, which may differ from actual results due to, among other things, economic conditions, changes to the business model or changes in operating performance.
During fiscal 2017 , we did not make any transfers between Level 1 and Level 2 financial assets. Furthermore, during fiscal 2017 and fiscal 2016 we did not have any Level 3 financial assets measured on a recurring basis. We conduct reviews on a quarterly basis to verify pricing, assess liquidity and determine if significant inputs have changed that would impact the fair value hierarchy disclosure.
45
Table of Contents
In accordance with the provisions of the guidance, we categorized our financial assets and liabilities which are valued on a recurring basis, based on the priority of the inputs to the valuation technique for the instruments, as follows:
|
|
| Fair Value Measurements at Reporting Date Using | ||||||||||||
| Balance as of February 3, 2018 |
| Quoted Prices |
| Significant Other |
| Significant | ||||||||
|
|
|
|
|
|
|
| ||||||||
| (in thousands) | ||||||||||||||
Financial Assets: |
|
|
|
|
|
|
| ||||||||
Current Assets |
|
|
|
|
|
|
| ||||||||
Cash equivalents: |
|
|
|
|
|
|
| ||||||||
Money market accounts | $ | 1,250 | |
| $ | 1,250 | |
| $ | - | |
| $ | - | |
Marketable securities: |
|
|
|
|
|
|
| ||||||||
Municipal securities | 6,557 | |
| - | |
| 6,557 | |
| - | | ||||
U.S. government agencies | 12,744 | |
| - | |
| 12,744 | |
| - | | ||||
Corporate bonds | 37,030 | |
| - | |
| 37,030 | |
| - | | ||||
Commercial paper | 3,729 | |
| - | |
| 3,729 | |
| - | | ||||
Noncurrent Assets |
|
|
|
|
|
|
| ||||||||
Deferred compensation plan | 7,315 | |
| 7,315 | |
| - | |
| - | | ||||
Total | $ | 68,625 | |
| $ | 8,565 | |
| $ | 60,060 | |
| $ | - | |
|
|
|
|
|
|
|
| ||||||||
Financial Liabilities: |
|
|
|
|
|
|
| ||||||||
Long-term debt 1 | $ | 68,601 | |
| $ | - | |
| 69,036 | |
| $ | - | | |
|
|
|
|
|
|
|
| ||||||||
|
|
| Fair Value Measurements at Reporting Date Using | ||||||||||||
| Balance as of January 28, 2017 |
| Quoted Prices |
| Significant Other |
| Significant | ||||||||
|
|
|
|
|
|
|
| ||||||||
| (in thousands) | ||||||||||||||
Financial Assets: |
|
|
|
|
|
|
| ||||||||
Current Assets |
|
|
|
|
|
|
| ||||||||
Cash equivalents: |
|
|
|
|
|
|
| ||||||||
Money market accounts | $ | 471 | |
| $ | 471 | |
| $ | - | |
| $ | - | |
Marketable securities: |
|
|
|
|
|
|
| ||||||||
Municipal securities | 5,634 | |
| - | |
| 5,634 | |
| - | | ||||
U.S. government agencies | 23,071 | |
| - | |
| 23,071 | |
| - | | ||||
Corporate bonds | 15,799 | |
| - | |
| 15,799 | |
| - | | ||||
Commercial paper | 5,866 | |
| - | |
| 5,866 | |
| - | | ||||
Noncurrent Assets |
|
|
|
|
|
|
| ||||||||
Deferred compensation plan | 7,523 | |
| 7,523 | |
| - | |
| - | | ||||
Total | $ | 58,364 | |
| $ | 7,994 | |
| $ | 50,370 | |
| $ | - | |
|
|
|
|
|
|
|
| ||||||||
Financial Liabilities: |
|
|
|
|
|
|
| ||||||||
Long-term debt 1 | $ | 84,785 | |
| $ | - | |
| 85,139 | |
| $ | - | | |
|
|
|
|
|
|
|
| ||||||||
1 The carrying value of long-term debt includes the current and long-term portions and the remaining unamortized debt issuance costs. | |||||||||||||||
46
Table of Contents
5. | PREPAID EXPENSES AND OTHER CURRENT ASSETS: |
Prepaid expenses and accounts receivable consisted of the following:
| February 3, 2018 |
| January 28, 2017 | ||||
|
|
|
| ||||
| (in thousands) | ||||||
Prepaid expenses | $ | 52,189 | |
| $ | 39,847 | |
Accounts receivable | 8,479 | |
| 12,911 | | ||
Prepaid expenses and other current assets | $ | 60,668 | |
| $ | 52,758 | |
6. | PROPERTY AND EQUIPMENT, NET: |
Property and equipment, net, consisted of the following:
| February 3, 2018 |
| January 28, 2017 | ||||
|
|
|
| ||||
| (in thousands) | ||||||
Land and land improvements | $ | 30,572 | |
| $ | 31,103 | |
Building and building improvements | 125,504 | |
| 127,398 | | ||
Equipment, furniture and fixtures | 636,542 | |
| 617,311 | | ||
Leasehold improvements | 529,835 | |
| 538,735 | | ||
Total property and equipment | 1,322,453 | |
| 1,314,547 | | ||
Less accumulated depreciation and amortization | (901,415 | ) |
| (837,362 | ) | ||
Property and equipment, net | $ | 421,038 | |
| $ | 477,185 | |
Total depreciation expense for fiscal 2017 , 2016 and 2015 was $96.2 million , $109.1 million and $116.6 million , respectively.
7. | OTHER CURRENT AND DEFERRED LIABILITIES: |
Other current and deferred liabilities consisted of the following:
| February 3, 2018 |
| January 28, 2017 | ||||
|
|
|
| ||||
| (in thousands) | ||||||
Allowance for customer returns, gift cards and store credits outstanding | $ | 55,948 | |
| $ | 59,893 | |
Accrued payroll, benefits, bonuses and severance costs and termination benefits | 29,685 | |
| 45,512 | | ||
Current portion of deferred rent and lease credits | 19,158 | |
| 22,451 | | ||
Other | 28,924 | |
| 42,376 | | ||
Other current and deferred liabilities | $ | 133,715 | |
| $ | 170,232 | |
8. | DEBT: |
In fiscal 2015, we entered into a credit agreement (the "Credit Agreement") among the Company, JPMorgan Chase Bank, N.A. as Administrative Agent, Bank of America, N.A., as Syndication Agent and the other lenders. Our obligations under the Credit Agreement are guaranteed by certain of our material U.S. subsidiaries. The Credit Agreement provides for a term loan commitment in the amount of $100.0 million , of which $100.0 million was drawn at closing, and matures on May 4, 2020, payable in quarterly installments, as defined in the Credit Agreement, with the remainder due at maturity.
47
Table of Contents
The Credit Agreement also provides for a $100.0 million revolving credit facility, of which $24.0 million was drawn at closing and repaid in the second quarter of fiscal 2015. There were no amounts outstanding on the revolving credit facility as of February 3, 2018 . The revolving credit facility matures on May 4, 2020.
The Credit Agreement contains various covenants and restrictions, including maximum leverage ratio, as defined, of no more than 3.50 to 1.00 until July 31, 2018, and 3.25 to 1.00 after July 31, 2018, and minimum fixed charge coverage ratio, as defined, of not less than 1.20 to 1.00 . If the Company failed to comply with these financial covenants, a default would trigger and all principal and outstanding interest would be due and payable. At February 3, 2018 , the Company was in compliance with all financial covenant requirements of the Credit Agreement.
The Credit Agreement has borrowing options which accrue interest by reference, at our election, at either an adjusted eurodollar rate tied to LIBOR or an Alternate Base Rate ("ABR") plus an interest rate margin, as defined in the Credit Agreement. The interest rate on borrowings and our commitment fee rate vary based on the maximum leverage ratio as follows:
| Maximum Leverage Ratio: |
| Eurodollar Spread |
| ABR Spread |
| Commitment Fee Rate |
Category 1: | < 2.25 to 1.00 |
| 1.25% |
| 0.25% |
| 0.20% |
Category 2: | ≥ 2.25 to 1.00 but |
| 1.50% |
| 0.50% |
| 0.25% |
Category 3: | ≥ 3.00 to 1.00 |
| 1.75% |
| 0.75% |
| 0.30% |
As of February 3, 2018 , $68.6 million in borrowings were outstanding under the Credit Agreement, and are reflected as $15.0 million in current debt and $53.6 million in long-term debt in the accompanying consolidated balance sheets.
The following table provides details on our debt outstanding as of February 3, 2018 and January 28, 2017 :
| February 3, 2018 |
| January 28, 2017 | ||||
|
|
|
| ||||
| (in thousands) | ||||||
Credit Agreement, net | $ | 68,601 | |
| $ | 84,785 | |
Less: current debt | (15,000 | ) |
| (16,250 | ) | ||
Long-term debt | $ | 53,601 | |
| $ | 68,535 | |
Aggregate future maturities of long-term debt are as follows:
FISCAL YEAR ENDING: |
| ||
(in thousands) |
| ||
February 2, 2019 | $ | 15,000 | |
February 1, 2020 | 15,000 | | |
January 30, 2021 | 38,750 | | |
48
Table of Contents
9. | NONCURRENT DEFERRED LIABILITIES: |
Deferred liabilities consisted of the following:
| February 3, 2018 |
| January 28, 2017 | ||||
|
|
|
| ||||
| (in thousands) | ||||||
Deferred rent | $ | 50,529 | |
| $ | 51,909 | |
Deferred lease credits, net | 63,932 | |
| 80,217 | | ||
Other deferred liabilities | 7,979 | |
| 8,868 | | ||
Deferred liabilities | 122,440 | |
| 140,994 | | ||
Less current portion of deferred rent and lease credits | (19,158 | ) |
| (22,451 | ) | ||
Noncurrent deferred liabilities | $ | 103,282 | |
| $ | 118,543 | |
Deferred rent represents the difference between operating lease obligations currently due and operating lease expense, which is recorded on a straight-line basis over the appropriate respective terms of the leases.
Deferred lease credits represent construction allowances received from landlords and are amortized as a reduction of rent expense over the appropriate respective terms of the related leases.
10. | COMMITMENTS AND CONTINGENCIES: |
Leases
We lease retail stores, a limited amount of office space and certain office equipment under operating leases expiring in various years through the fiscal year ending 2028. Certain operating leases provide for renewal options that generally approximate five years at a pre-determined rental value. In the normal course of business, operating leases are typically renewed or replaced by other leases.
Minimum future rental payments under non-cancelable operating leases (including leases with certain minimum sales cancellation clauses described below and exclusive of common area maintenance charges and/or contingent rental payments based on sales) as of February 3, 2018 , are approximately as follows:
FISCAL YEAR ENDING: |
| ||
(in thousands) |
| ||
February 2, 2019 | $ | 191,075 | |
February 1, 2020 | 172,797 | | |
January 30, 2021 | 156,051 | | |
January 29, 2022 | 136,810 | | |
January 28, 2023 | 106,563 | | |
Thereafter | 168,179 | | |
Total minimum lease payments | $ | 931,475 | |
Certain leases provide that we may cancel the lease if our retail sales at that location fall below an established level. A majority of our store operating leases contain cancellation clauses that allow the leases to be terminated at our discretion, if certain minimum sales levels are not met within the first few years of the lease term. We have not historically met or exercised a significant number of these cancellation clauses and, therefore, have included commitments for the full lease terms of such leases in the above table. For fiscal 2017 , 2016 and 2015 , total rent expense under operating leases was approximately $263.7 million , $268.5 million and $266.2 million , respectively, including common area maintenance charges of approximately $47.9 million , $47.6 million and $46.7 million , respectively, other rental charges of approximately $40.3 million , $41.2 million and $40.1 million , respectively, and contingent rental expense, based on sales, of approximately $4.3 million , $5.2 million and $5.8 million , respectively.
49
Table of Contents
Open Purchase Orders
At February 3, 2018 and January 28, 2017 , we had approximately $316.5 million and $356.7 million , respectively, of open purchase orders for inventory, in the normal course of business.
Legal Proceedings
In July 2015, White House Black Market, Inc. (WHBM) was named as a defendant in Altman v. White House Black Market, Inc., a putative class action filed in the United States District Court for the Northern District of Georgia. The complaint alleges that WHBM, in violation of federal law, willfully published more than the last five digits of a credit or debit card number on customers' point-of-sale receipts. Plaintiff seeks an award of statutory damages of $100 to $1,000 for each alleged willful violation of the law, as well as attorneys' fees, costs and punitive damages. The Company denies the material allegations of the complaint and believes the case is without merit. On October 25, 2017, the magistrate in the matter recommended that the class be certified. On November 8, 2017, WHBM filed objections to such recommendation. On February 12, 2018, the District Court issued an order certifying the class. On February 26, 2018, the Company filed a petition with the District Court for permission to appeal its decision to the Eleventh Circuit Court of Appeals. The Company will continue to vigorously defend the matter, including a planned motion for summary judgment to dismiss all claims. At this time, the Company is unable to reasonably estimate the potential loss or range of loss, if any, related to the lawsuit because there are a number of unknown facts and unresolved legal issues that may impact the amount of any potential liability, including, without limitation, (a) whether the action will ultimately be permitted to proceed as a class, (b) if the action proceeds as a class, the resolution of certain disputed statutory interpretation issues that may impact the size of the putative class and (c) whether or not the plaintiff is entitled to statutory damages. No assurance can be given that these issues will be resolved in the Company's favor or that the Company will be successful in its defense on the merits or otherwise. If the case were to proceed as a class action and the Company were to be unsuccessful in its defense on the merits, the ultimate resolution of the case could have a material adverse effect on the Company's consolidated financial condition or results of operations.
Other than as noted above, we are not currently a party to any material legal proceedings other than claims and lawsuits arising in the normal course of business. All such matters are subject to uncertainties, and outcomes may not be predictable. Consequently, the ultimate aggregate amounts of monetary liability or financial impact with respect to these matters as of February 3, 2018 are not estimable. However, while such matters could affect our consolidated operating results when resolved in future periods, management believes that upon final disposition, any monetary liability or financial impact to us would not be material to our annual consolidated financial statements.
11. | STOCK COMPENSATION PLANS AND CAPITAL STOCK TRANSACTIONS: |
General
In April 2017, the Board approved the Amended and Restated 2012 Omnibus Stock and Incentive Plan (the "Amended Omnibus Plan"), which replaced the Chico's FAS, Inc. 2012 Omnibus Stock and Incentive Plan, effective upon shareholder approval on June 22, 2017. The aggregate number of shares of our common stock that may be issued under the Amended Omnibus Plan (since inception) is 15.5 million shares plus any shares represented by awards granted under prior plans that are forfeited, expired or canceled without delivery of shares. Awards under the Amended Omnibus Plan may be in the form of restricted stock, restricted stock units, performance-based restricted stock, performance-based stock units, stock options and stock appreciation rights, in accordance with the terms and conditions of the Amended Omnibus Plan. The terms of each award will be determined by the Human Resources, Compensation and Benefits Committee of the Board of Directors or by the Board of Directors.
We have historically issued restricted stock, including non-vested restricted stock, performance-based stock units and stock options. Shares of non-vested restricted stock have the same voting rights as common stock, are entitled to receive dividends and other distributions thereon, and are considered to be currently issued and outstanding. Performance-based stock units are entitled to dividend equivalents only to the extent certain Company-specific performance goals are met and are entitled to voting rights only upon the issuance of shares after meeting these Company-specific performance goals. Generally, stock-based awards vest evenly over three years; stock options generally have a 10 -year term. As of February 3, 2018 , approximately 0.4 million nonqualified stock options are outstanding under a predecessor plan and approximately 9.3 million shares remain available for future grants of stock-based awards.
50
Table of Contents
Stock-based compensation expense for all awards is based on the grant date fair value of the award, net of estimated forfeitures, and is recognized over the requisite service period of the awards. Compensation expense for restricted stock awards and stock options with a service condition is recognized on a straight-line basis over the requisite service period. Compensation expense for performance-based awards with a service condition is recognized ratably for each vesting tranche based on our estimate of the level and likelihood of meeting certain Company-specific performance goals. We estimate the expected forfeiture rate for all stock-based awards, and only recognize expense for those shares expected to vest. In determining the portion of the stock-based payment award that is ultimately expected to be earned, we derive forfeiture rates based on historical data. In accordance with the authoritative guidance, we revise our forfeiture rates, when necessary, in subsequent periods if actual forfeitures differ from those originally estimated. Total compensation expense related to stock-based awards in fiscal 2017 , 2016 and 2015 was $20.7 million , $21.2 million and $30.1 million , respectively. The total tax benefit associated with stock-based compensation for fiscal 2017 , 2016 and 2015 was $7.6 million , $8.1 million and $11.5 million , respectively.
Restricted Stock Awards
Restricted stock activity for fiscal 2017 was as follows:
| Number of |
| Weighted | |||
Unvested, beginning of period | 2,463,186 | |
| $ | 13.87 | |
Granted | 1,441,300 | |
| 13.23 | | |
Vested | (1,249,122 | ) |
| 14.46 | | |
Forfeited | (327,105 | ) |
| 14.39 | | |
Unvested, end of period | 2,328,259 | |
| 13.08 | | |
Total fair value of shares of restricted stock that vested during fiscal 2017 , 2016 and 2015 was $15.6 million , $14.7 million and $34.8 million , respectively. The weighted average grant date fair value of restricted stock granted during fiscal 2017 , 2016 and 2015 was $13.23 , $12.38 and $16.97 , respectively. As of February 3, 2018 , there was $17.3 million of unrecognized stock-based compensation expense related to non-vested restricted stock awards. That cost is expected to be recognized over a weighted average remaining period of 1.7 years.
Performance-based Stock Units
Performance-based stock unit activity for fiscal 2017 was as follows:
| Number of |
| Weighted | |||
Unvested, beginning of period | 652,248 | |
| $ | 13.28 | |
Granted | 601,137 | |
| 13.93 | | |
Vested | (310,901 | ) |
| 13.67 | | |
Forfeited | (251,534 | ) |
| 13.33 | | |
Unvested, end of period | 690,950 | |
| 13.65 | | |
Total fair value of performance-based stock units that vested during fiscal 2017 , 2016 and 2015 was $4.2 million , $2.9 million and $3.9 million , respectively. There was $3.6 million of unrecognized stock-based compensation expense related to performance-based stock units expected to vest. That cost is expected to be recognized over a weighted average period of approximately 1.6 years.
Stock Option Awards
We used the Black-Scholes option-pricing model to value our stock options. No stock options have been issued since fiscal 2011 and all have been fully vested since fiscal 2014 . Using this option-pricing model, the fair value of each stock option
51
Table of Contents
award was estimated on the date of grant. The fair value of the stock option awards, which are subject to pro-rata vesting generally over three years, was expensed on a straight-line basis over the vesting period of the stock options.
| Number of |
| Weighted |
| Weighted |
| Aggregate | |||||
Outstanding, beginning of period | 577,246 | |
| $ | 13.58 | |
|
|
|
| ||
Granted | - | |
| - | |
|
|
|
| |||
Exercised | (13,000 | ) |
| 9.07 | |
|
|
|
| |||
Forfeited or expired | (195,501 | ) |
| 16.21 | |
|
|
|
| |||
Outstanding, end of period | 368,745 | |
| 12.36 | |
| 2.50 |
| $ | 253 | | |
Vested at February 3, 2018 | 368,745 | |
| 12.36 | |
| 2.50 |
| 253 | | ||
Exercisable at February 3, 2018 | 368,745 | |
| 12.36 | |
| 2.50 |
| 253 | | ||
The aggregate intrinsic value in the table above represents the total pretax intrinsic value (the excess, if any, of the closing stock price on the last trading day of fiscal 2017 and the exercise price, multiplied by the number of such in-the-money options) that would have been received by the option holders had all option holders exercised their options on February 3, 2018 . This amount changes based on the fair market value of our common stock. Total intrinsic value of options exercised during fiscal 2017 , 2016 and 2015 (based on the difference between our stock price on the respective exercise date and the respective exercise price, multiplied by the number of respective options exercised) was $0.01 million , $0.7 million and $4.6 million , respectively.
Employee Stock Purchase Plan
We sponsor an employee stock purchase plan ("ESPP") under which substantially all full-time employees are given the right to purchase shares of our common stock during each of the two specified offering periods each fiscal year at a price equal to 85 percent of the value of the stock immediately prior to the beginning of each offering period. During fiscal 2017 , 2016 and 2015 , approximately 232,000 , 191,000 and 174,000 shares, respectively, were purchased under the ESPP. Cash received from purchases under the ESPP for fiscal 2017 was $2.0 million .
Share Repurchase Program
In fiscal 2017 and fiscal 2016 , we repurchased 2.7 million and 8.1 million shares at a total cost of $27.4 million and $96.4 million , respectively, under the Company's $300 million share repurchase program announced in November 2015. As of February 3, 2018 , $136.2 million remains under the share repurchase program. However, we have no continuing obligation to repurchase shares under this authorization, and the timing, actual number and value of any additional shares to be purchased will depend on the performance of our stock price, market conditions and other considerations.
12. | RETIREMENT PLANS: |
We have a 401(k) defined contribution employee retirement benefit plan (the "Plan") covering all employees upon the completion of one year of service, working 1000 hours or more, and are at least age 21. Employees' rights to Company contributions vest fully upon completing five years of service, with incremental vesting starting in service year two. Under the Plan, employees may contribute up to 75 percent of their annual compensation, subject to certain statutory limitations. We have elected to match employee contributions at 50 percent on the first 6 percent of the employees' contributions and can elect to make additional contributions over and above the mandatory match. For fiscal 2017 , 2016 and 2015 , our costs under the Plan were approximately $3.3 million , $3.4 million and $3.8 million , respectively.
52
Table of Contents
In April 2002, we adopted the Chico's FAS, Inc. Deferred Compensation Plan (the "Deferred Plan") to provide supplemental retirement income benefits for highly compensated employees. Eligible participants may elect to defer up to 80 percent of their base salary and 100 percent of their bonus earned under an approved bonus plan pursuant to the terms and conditions of the Deferred Plan. The Deferred Plan generally provides for payments upon retirement, death, disability or termination of employment. In addition, we may make employer contributions to participants under the Deferred Plan. To date, no Company contributions have been made under the Deferred Plan. The amount of the deferred compensation liability payable to the participants is included in deferred liabilities in the consolidated balance sheets. These obligations are funded through the purchase of corporate owned life insurance (COLI), cash and other securities held within a rabbi trust established on behalf of the employee participating in the plan. The trust assets are reflected in other assets in the accompanying consolidated balance sheets.
13. | INCOME TAXES: |
The income tax provision consisted of the following:
| Fiscal 2017 |
| Fiscal 2016 |
| Fiscal 2015 | ||||||
|
|
|
|
|
| ||||||
| (in thousands) | ||||||||||
Current: |
|
|
|
|
| ||||||
Federal | $ | 39,376 | |
| $ | 49,994 | |
| $ | 15,622 | |
Foreign | 266 | |
| 260 | |
| 210 | | |||
State | 4,877 | |
| 5,654 | |
| 1,683 | | |||
Deferred: |
|
|
|
|
| ||||||
Federal | (3,669 | ) |
| (8,483 | ) |
| (25,004 | ) | |||
State | 1,750 | |
| 75 | |
| (9,411 | ) | |||
Income tax provision (benefit) | $ | 42,600 | |
| $ | 47,500 | |
| $ | (16,900 | ) |
The foreign component of pre-tax income (loss), arising principally from operating foreign stores and other management and cost sharing charges we are required to allocate under U.S. tax law, for fiscal 2017 , 2016 and 2015 was $0.1 million , $0.1 million and $(0.8) million , respectively.
On December 22, 2017, the Tax Cuts and Jobs Act of 2017 (the "Tax Act") was signed into law making significant changes to the Internal Revenue Code. Changes include, but are not limited to, a corporate tax rate decrease from 35% to 21% effective January 1, 2018. As a result, the Company's blended federal tax rate for fiscal 2017 was 33.8% . In addition, the Company recognized a tax benefit in the fourth quarter related to adjusting its deferred tax balance to reflect the new corporate tax rate. As a result, income tax expense in the fourth quarter reflects a decrease in tax expense of $9.7 million , comprised of a $1.7 million reduction in income tax expense for the fiscal year ended February 3, 2018 and $8.0 million from the application of the newly enacted rates to existing deferred balances. As of February 3, 2018, the Company performed a preliminary analysis of information necessary to estimate the accounting for the impacts of the Tax Act. We will continue to analyze additional information and guidance related to the Tax Act as supplemental legislation, regulatory guidance, or evolving technical interpretations become available. Consequently, reasonable estimates of the impact of the Tax Act on the Company's deferred tax balances and executive compensation deductions have been reported as provisional, as defined in Staff Accounting Bulletin No. 118. We expect to complete our analysis no later than the fourth quarter of fiscal 2018.
53
Table of Contents
A reconciliation between the statutory federal income tax rate and the effective income tax rate follows:
| Fiscal 2017 |
| Fiscal 2016 |
| Fiscal 2015 | |||
Federal income tax rate (blended rate for fiscal 2017 due to the Tax Act) | 33.8 | % |
| 35.0 | % |
| 35.0 | % |
State income tax, net of federal tax benefit | 3.2 | |
| 3.4 | |
| 4.3 | |
Impact of the Tax Act | (5.6 | ) |
| - | |
| - | |
Excess share based compensation | 0.9 | |
| - | |
| - | |
Goodwill impairment | - | |
| - | |
| (124.2 | ) |
Outside basis difference - Boston Proper sale | - | |
| (2.8 | ) |
| 165.2 | |
Other state benefits associated with sale and liquidation of Boston Proper | - | |
| (0.3 | ) |
| 20.1 | |
Enhanced charitable contribution | (1.1 | ) |
| (1.9 | ) |
| 19.3 | |
Executive compensation limitation | 0.7 | |
| 1.2 | |
| (7.3 | ) |
Foreign losses with full valuation allowance | 0.1 | |
| 0.2 | |
| (2.9 | ) |
Federal tax credits | (1.2 | ) |
| (0.5 | ) |
| 3.4 | |
Other items, net | (1.1 | ) |
| (0.1 | ) |
| 0.4 | |
Total | 29.7 | % |
| 34.2 | % |
| 113.3 | % |
Deferred tax assets and liabilities are recorded due to different carrying amounts for financial and income tax reporting purposes arising from cumulative temporary differences. These differences consist of the following as of February 3, 2018 and January 28, 2017 :
| February 3, 2018 |
| January 28, 2017 | ||||
|
|
|
| ||||
| (in thousands) | ||||||
Deferred tax assets: |
|
|
| ||||
Accrued liabilities and allowances | $ | 9,690 | |
| $ | 17,790 | |
Accrued straight-line rent | 13,364 | |
| 20,361 | | ||
Stock-based compensation | 5,606 | |
| 10,329 | | ||
Property related | 2,009 | |
| 1,816 | | ||
Charitable contribution limitation carryforwards | 2,604 | |
| 5,109 | | ||
State tax credits and net operating loss carryforwards | 5,548 | |
| 5,105 | | ||
Other | 1,879 | |
| 3,376 | | ||
Total deferred tax assets | 40,700 | |
| 63,886 | | ||
Valuation allowance | (444 | ) |
| (749 | ) | ||
Net deferred tax assets | 40,256 | |
| 63,137 | | ||
|
|
|
| ||||
Deferred tax liabilities: |
|
|
| ||||
Other | (119 | ) |
| - | | ||
Prepaid expenses | (4,823 | ) |
| (2,976 | ) | ||
Property related | (23,961 | ) |
| (43,271 | ) | ||
Other intangible assets | (16,666 | ) |
| (24,197 | ) | ||
Total deferred tax liabilities | (45,569 | ) |
| (70,444 | ) | ||
Net deferred taxes | $ | (5,313 | ) |
| $ | (7,307 | ) |
As of February 3, 2018 , the Company had available for state income tax purposes net operating loss and tax credit carryovers which expire, if unused, in the years 2020 - 2035 and 2019 - 2026, respectively.
54
Table of Contents
The Tax Act requires a one-time transition tax that is based on total post-1986 earnings and profits ("E & P") previously deferred from U.S. income taxes. As the Company does not have material amounts of post-1986 E & P in its foreign subsidiaries, no one-time transition tax has been recorded in its fourth quarter provision.
No additional income taxes have been provided for any remaining undistributed foreign earnings not subject to the one-time transition tax, or any additional outside basis difference inherent in these entities, as these amounts continue to be indefinitely reinvested in foreign operations. There were no significant undistributed foreign earnings at February 3, 2018 , January 28, 2017 and January 30, 2016 .
The Tax Act also subjects a U.S. shareholder to tax on global intangible low-taxed income ("GILTI") earned by certain foreign subsidiaries. The FASB Staff Q & A, Topic 740, No. 5, Accounting for Global Intangible Low-Taxed Income, states that an entity can make an accounting policy election to either recognize deferred taxes for temporary basis differences expected to reverse as GILTI in future years or provide for the tax expense related to GILTI in the year the tax is incurred. Given the complexity of the GILTI provisions, the Company is still evaluating the effects and has not yet determined its accounting policy. At February 3, 2018, since the Company is still evaluating the GILTI provisions and its analysis of future taxable income that is subject to GILTI, the Company is unable to make a reasonable estimate and has not reflected any adjustments related to GILTI in its financial statements. The Company does not anticipate the impact of GILTI to be material.
Accumulated other comprehensive income is shown net of deferred tax assets and deferred tax liabilities. The amount is not significant at February 3, 2018 or January 28, 2017 .
A reconciliation of the beginning and ending amounts of uncertain tax positions for each of fiscal 2017 , fiscal 2016 and fiscal 2015 is as follows:
| Fiscal 2017 |
| Fiscal 2016 |
| Fiscal 2015 | ||||||
|
|
|
|
|
| ||||||
| (in thousands) | ||||||||||
Balance at beginning of year | $ | 5,158 | |
| $ | 4,840 | |
| $ | 2,532 | |
Additions for tax positions of prior years | - | |
| 1,280 | |
| 2,618 | | |||
Reductions for tax positions of prior years | (105 | ) |
| (1 | ) |
| (56 | ) | |||
Additions for tax positions for the current year | 289 | |
| 246 | |
| 259 | | |||
Settlements/payments with tax authorities | (3,667 | ) |
| (850 | ) |
| - | | |||
Reductions due to lapse of applicable statutes of limitation | (153 | ) |
| (357 | ) |
| (513 | ) | |||
Balance at end of year | $ | 1,522 | |
| $ | 5,158 | |
| $ | 4,840 | |
At February 3, 2018 , January 28, 2017 and January 30, 2016 , balances included $1.2 million , $4.4 million and $4.0 million respectively, of unrecognized tax benefits that, if recognized, would favorably impact the effective tax rate in future periods. We do not expect any events to occur that would cause a change to our unrecognized tax benefits or income tax expense within the next twelve months.
Our continuing practice is to recognize potential accrued interest and penalties relating to unrecognized tax benefits in the income tax provision. For fiscal 2017 , 2016 and 2015 , we accrued $0.1 million , $0.2 million and $0.2 million , respectively for interest and penalties. We had approximately $0.3 million , $0.5 million and $0.4 million , respectively for the payment of interest and penalties accrued at February 3, 2018 , January 28, 2017 and January 30, 2016 , respectively. The amounts included in the reconciliation of uncertain tax positions do not include accruals for interest and penalties.
In fiscal 2006, we began participating in the IRS's real time audit program, Compliance Assurance Process ("CAP"). Under the CAP program, material tax issues and initiatives are disclosed to the IRS throughout the year with the objective of reaching an agreement as to the proper reporting treatment when the federal return is filed. Previous years through fiscal 2015 have been accepted. Fiscal 2016 is in the post-filing review process.
We are no longer subject to state and local examinations for years before fiscal 2011. Various state examinations are currently underway for fiscal periods spanning from 2011 through 2016; however, we do not expect any significant change to our uncertain tax positions within the next year.
55
Table of Contents
14. | NET INCOME PER SHARE: |
The following table sets forth the computation of basic and diluted net income per share shown on the face of the accompanying consolidated statements of income (in thousands, except per share amounts):
| February 3, 2018 |
| January 28, 2017 |
| January 30, 2016 | ||||||
| |
|
|
|
| ||||||
Numerator |
|
|
|
|
| ||||||
Net income | $ | 101,000 | |
| $ | 91,229 | |
| $ | 1,946 | |
Net income and dividends declared allocated to participating securities | (2,300 | ) |
| (1,915 | ) |
| - | | |||
Net income available to common shareholders | $ | 98,700 | |
| $ | 89,314 | |
| $ | 1,946 | |
Denominator |
|
|
|
|
| ||||||
Weighted average common shares outstanding – basic | 125,341 | |
| 128,995 | |
| 138,366 | | |||
Dilutive effect of non-participating securities | 62 | |
| 242 | |
| 375 | | |||
Weighted average common and common equivalent shares outstanding – diluted | 125,403 | |
| 129,237 | |
| 138,741 | | |||
Net income per common share: |
|
|
|
|
| ||||||
Basic | $ | 0.79 | |
| $ | 0.69 | |
| $ | 0.01 | |
Diluted | $ | 0.79 | |
| $ | 0.69 | |
| $ | 0.01 | |
In fiscal 2017 , 2016 and 2015 , 0.7 million , 0.7 million and 0.3 million potential shares of common stock, respectively, were excluded from the diluted per share calculation relating to non-participating securities, because the effect of including these potential shares was antidilutive.
15. | QUARTERLY RESULTS OF OPERATIONS (UNAUDITED): |
| Net Sales |
| Gross |
| Net Income |
| Net Income Per |
| Net Income Per | ||||||||||
|
|
|
|
|
|
|
|
|
| ||||||||||
| (dollars in thousands, except per share amounts) | ||||||||||||||||||
Fiscal year ended February 3, 2018: |
|
|
|
|
|
|
|
|
| ||||||||||
First quarter | $ | 583,728 | |
| $ | 237,413 | |
| $ | 33,619 | |
| $ | 0.26 | |
| $ | 0.26 | |
Second quarter | 578,581 | |
| 209,101 | |
| 22,716 | |
| 0.18 | |
| 0.18 | | |||||
Third quarter | 532,287 | |
| 196,702 | |
| 16,690 | |
| 0.13 | |
| 0.13 | | |||||
Fourth quarter (fourteen weeks) 1 | 587,783 | |
| 221,561 | |
| 27,975 | |
| 0.22 | |
| 0.22 | | |||||
Fiscal year ended January 28, 2017: |
|
|
|
|
|
|
|
|
| ||||||||||
First quarter | $ | 642,977 | |
| $ | 262,335 | |
| $ | 31,084 | |
| $ | 0.23 | |
| $ | 0.23 | |
Second quarter | 635,732 | |
| 240,810 | |
| 23,039 | |
| 0.17 | |
| 0.17 | | |||||
Third quarter | 596,912 | |
| 230,294 | |
| 23,598 | |
| 0.18 | |
| 0.18 | | |||||
Fourth quarter (thirteen weeks) | 600,789 | |
| 213,397 | |
| 13,508 | |
| 0.10 | |
| 0.10 | | |||||
1 Fourth quarter fiscal 2017 results include the favorable impact of the Tax Act of approximately $10 million , after-tax.
16. | SUBSEQUENT EVENTS: |
On February 21, 2018, we announced that our Board of Directors declared a quarterly dividend of $0.085 per share on our common stock. The dividend will be payable on April 2, 2018 to shareholders of record at the close of business on March 19, 2018. Although it is our Company's intention to continue to pay a quarterly cash dividend in the future, any decision to pay future cash dividends will be made by the Board of Directors and will depend on future earnings, financial condition and other factors.
56
Table of Contents
ITEM 9. | CHANGES IN AND DISAGREEMENTS WITH ACCOUNTANTS ON ACCOUNTING AND FINANCIAL DISCLOSURE |
None.
ITEM 9A. | CONTROLS AND PROCEDURES |
Disclosure Controls and Procedures
Our disclosure controls and procedures are designed to provide reasonable assurance that information required to be disclosed in our reports under the Securities Exchange Act of 1934, as amended (the "Exchange Act"), is recorded, processed, summarized and reported within the time periods specified in the SEC's rules and forms. Disclosure controls and procedures include, without limitation, controls and procedures designed to ensure that information required to be disclosed in reports filed under the Exchange Act is accumulated and communicated to management, including the principal executive and principal financial officers, or persons performing similar functions, as appropriate to allow timely decisions regarding required disclosure.
As of the end of the period covered by this report, an evaluation was carried out under the supervision and with the participation of management, including our Chief Executive Officer and Chief Financial Officer, of the effectiveness of the design and operation of our disclosure controls and procedures (as defined in Rule 13a-15(e) under the Exchange Act). Based upon that evaluation, the Chief Executive Officer and Chief Financial Officer concluded that, as of the end of such period, our disclosure controls and procedures were effective in providing reasonable assurance in timely alerting them to material information relating to us (including our consolidated subsidiaries) and that information required to be disclosed in our reports is recorded, processed, summarized and reported as required to be included in our periodic SEC filings.
Changes in Internal Control over Financial Reporting
There was no change in our internal control over financial reporting during the fourth fiscal quarter that has materially affected, or is reasonably likely to materially affect, our internal control over financial reporting.
Management's Report on Internal Control over Financial Reporting
Management is responsible for establishing and maintaining adequate internal control over financial reporting, as such term is defined in Rule 13a-15(f) under the Exchange Act. Under the supervision and with the participation of our management, including our Chief Executive Officer and Chief Financial Officer, we conducted an evaluation of the effectiveness of our internal control over financial reporting as of February 3, 2018 as required by Rule 13a-15(c) under the Exchange Act. In making this assessment, we used the criteria set forth by the Committee of Sponsoring Organizations of the Treadway Commission (COSO) in Internal Control - Integrated Framework (2013 framework). Based on our evaluation, management concluded that our internal control over financial reporting was effective as of February 3, 2018 .
No system of controls, no matter how well designed and operated, can provide absolute assurance that the objectives of the system of controls are met, and no evaluation of controls can provide absolute assurance that the system of controls has operated effectively in all cases. Therefore, even those systems determined to be effective can provide only reasonable assurance with respect to financial statement preparation and presentation. Also, projections of any evaluation of effectiveness to future periods are subject to the risk that controls may become inadequate because of changes in conditions, or that the degree of compliance with the policies and procedures may deteriorate.
The Company's independent registered certified public accounting firm, Ernst & Young LLP, that audited the consolidated financial statements included in this Annual Report on Form 10-K, issued an attestation report on the Company's internal control over financial reporting as of February 3, 2018 , which follows.
57
Table of Contents
Report of Independent Registered Certified Public Accounting Firm
To the Shareholders and the Board of Directors of Chico's FAS, Inc.
Opinion on Internal Control over Financial Reporting
We have audited Chico's FAS, Inc. and subsidiaries' internal control over financial reporting as of February 3, 2018 , based on criteria established in Internal Control-Integrated Framework issued by the Committee of Sponsoring Organizations of the Treadway Commission (2013 framework) (the COSO criteria). In our opinion, Chico's FAS, Inc. and subsidiaries' (the Company) maintained, in all material respects, effective internal control over financial reporting as of February 3, 2018 , based on the COSO criteria.
We also have audited, in accordance with the standards of the Public Company Accounting Oversight Board (United States) (PCAOB), the consolidated balance sheets of Chico's FAS, Inc. and subsidiaries as of February 3, 2018 and January 28, 2017 , and the related consolidated statements of income, comprehensive income, stockholders' equity and cash flows for each of the three fiscal years in the period ended February 3, 2018 and the related notes and our report dated March 13, 2018 expressed an unqualified opinion thereon.
Basis for Opinion
The Company's management is responsible for maintaining effective internal control over financial reporting and for its assessment of the effectiveness of internal control over financial reporting included in the accompanying Management's Report on Internal Control over Financial Reporting. Our responsibility is to express an opinion on the Company's internal control over financial reporting based on our audit. We are a public accounting firm registered with the PCAOB and are required to be independent with respect to the Company in accordance with the U.S. federal securities laws and the applicable rules and regulations of the Securities and Exchange Commission and the PCAOB.
We conducted our audit in accordance with the standards of the PCAOB. Those standards require that we plan and perform the audit to obtain reasonable assurance about whether effective internal control over financial reporting was maintained in all material respects.
Our audit included obtaining an understanding of internal control over financial reporting, assessing the risk that a material weakness exists, testing and evaluating the design and operating effectiveness of internal control based on the assessed risk, and performing such other procedures as we considered necessary in the circumstances. We believe that our audit provides a reasonable basis for our opinion.
Definition and Limitations of Internal Control Over Financial Reporting
A company's internal control over financial reporting is a process designed to provide reasonable assurance regarding the reliability of financial reporting and the preparation of financial statements for external purposes in accordance with generally accepted accounting principles. A company's internal control over financial reporting includes those policies and procedures that (1) pertain to the maintenance of records that, in reasonable detail, accurately and fairly reflect the transactions and dispositions of the assets of the company; (2) provide reasonable assurance that transactions are recorded as necessary to permit preparation of financial statements in accordance with generally accepted accounting principles, and that receipts and expenditures of the company are being made only in accordance with authorizations of management and directors of the company; and (3) provide reasonable assurance regarding prevention or timely detection of unauthorized acquisition, use, or disposition of the company's assets that could have a material effect on the financial statements.
Because of its inherent limitations, internal control over financial reporting may not prevent or detect misstatements. Also, projections of any evaluation of effectiveness to future periods are subject to the risk that controls may become inadequate because of changes in conditions, or that the degree of compliance with the policies or procedures may deteriorate.
/s/ ERNST & YOUNG LLP |
Tampa, Florida
March 13, 2018
58
Table of Contents
ITEM 9B. | OTHER INFORMATION |
None.
PART III
ITEM 10. | DIRECTORS, EXECUTIVE OFFICERS AND CORPORATE GOVERNANCE |
Information about our executive officers, directors and nominees for director, procedures by which security holders may recommend director nominees, the code of ethics, the audit committee, audit committee membership and our audit committee financial expert and Section 16(a) beneficial ownership reporting compliance in our 2018 Annual Meeting proxy statement is incorporated herein by reference.
ITEM 11. | EXECUTIVE COMPENSATION |
Information about executive compensation, compensation committee interlocks and insider participation, and the Human Resources, Compensation and Benefits Committee report in our 2018 Annual Meeting proxy statement is incorporated herein by reference.
ITEM 12. | SECURITY OWNERSHIP OF CERTAIN BENEFICIAL OWNERS AND MANAGEMENT AND RELATED STOCKHOLDER MATTERS |
Except as provided below, the information required by this item is included in our 2018 Annual Meeting proxy statement and is incorporated herein by reference.
Equity Compensation Plan Information
The following table shows information concerning our equity compensation plans as of the end of the fiscal year ended February 3, 2018 :
Plan Category |
| Number of Securities to |
| Weighted-Average |
| Number of Securities Remaining Available for Future Issuance Under Equity Compensation Plans (Excluding Securities Reflected in Column (a)) |
|
| (a) |
| (b) 2 |
| (c) 3 |
Equity compensation plans approved by security holders 1 |
| 1,076,255 |
| $12.36 |
| 10,019,354 |
Equity compensation plans not approved by security holders |
| - |
| - |
| - |
Total |
| 1,076,255 |
| $12.36 |
| 10,019,354 |
1. | Consists of the Amended and Restated 2012 Omnibus Stock and Incentive Plan, the Amended and Restated 2002 Omnibus Stock and Incentive Plan, and the Second Amended and Restated 2002 Employee Stock Purchase Plan. |
2. | The weighted average exercise price is calculated based solely on the outstanding stock options. It does not take into account the shares issuable upon vesting of outstanding restricted stock, restricted stock units or performance stock units, which have no exercise price. |
3. | Consists of (i) 9.3 million shares that were available for future issuance under the Amended and Restated 2012 Omnibus Stock and Incentive Plan as of February 3, 2018 and (ii) 0.7 million shares that were available for future issuance under the Second Amended and Restated 2002 Employee Stock Purchase Plan as of February 3, 2018, including shares subject to purchase during the current offering period. |
59
Table of Contents
ITEM 13. | CERTAIN RELATIONSHIPS AND RELATED TRANSACTIONS, AND DIRECTOR INDEPENDENCE |
The information required by this item is included in our 2018 Annual Meeting proxy statement and is incorporated herein by reference.
ITEM 14. | PRINCIPAL ACCOUNTING FEES AND SERVICES |
The information required by this item is included in our 2018 Annual Meeting proxy statement and is incorporated herein by reference.
60
Table of Contents
PART IV
ITEM 15. | EXHIBITS AND FINANCIAL STATEMENT SCHEDULES |
(a) | Documents filed as part of this Report. |
(1) | The following consolidated financial statements are contained in Item 8: |
Consolidated Financial Statements | Page in this Report |
Report of Ernst & Young LLP, independent registered certified public accounting firm | 31 |
Consolidated Statements of Income | 32 |
Consolidated Statements of Comprehensive Income | 33 |
Consolidated Balance Sheets | 34 |
Consolidated Statements of Shareholders' Equity | 35 |
Consolidated Statements of Cash Flows | 36 |
Notes to Consolidated Financial Statements | 37 |
(2) | The following Financial Statement Schedules are included herein: |
Schedules are not submitted because they are not applicable, not required or because the required information is included in the financial statements or the notes thereto.
(3) | The following exhibits are filed as part of this report: |
| 3.1 | Amended and Restated By-laws of Chico's FAS, Inc. (incorporated by reference to Exhibit 3.1 to the Company's Form 10-Q, as filed with the Commission on November 22, 2016) |
|
|
|
| 3.2 | Amended and Restated Articles of Incorporation of Chico's FAS, Inc. (incorporated by reference to Exhibit 3.2 to the Company's Form 10-Q, as filed with the Commission on November 22, 2016) |
|
|
|
| 4.1* | Form of specimen Common Stock Certificate (incorporated by reference to Exhibit 4.9 to the Company's Form 10-K, as filed with the Commission on March 14, 2014) |
|
|
|
| 10.1* | Amended and Restated 2002 Omnibus Stock and Incentive Plan (incorporated by reference to Exhibit 10.1 to the Company's Form 8-K, as filed with the Commission on July 2, 2008) |
|
|
|
| 10.2* | Form of 2002 Omnibus Stock and Incentive Plan Non-Qualified Stock Option Certificate for Employees (incorporated by reference to Exhibit 10.1 to the Company's Form 8-K, as filed with the Commission on February 3, 2005) |
|
|
|
| 10.3* | Revised Form of 2002 Omnibus Stock and Incentive Plan Non-Qualified Stock Option Certificate for Employees (incorporated by reference to Exhibit 10.22 to the Company's Form 10-K, as filed with the Commission on March 22, 2011) |
|
|
|
| 10.4* | Chico's FAS, Inc. Second Amended and Restated 2002 Employee Stock Purchase Plan (incorporated by reference to Exhibit 10.1 to the Company's Form 10-Q, as filed with the Commission on August 24, 2011 ) |
|
|
|
| 10.5* | Indemnification Agreement with David F. Walker (incorporated by reference to Exhibit 10.1 to the Company's Form 10-Q, as filed with the Commission on November 29, 2005) |
|
|
|
| 10.6* | Indemnification Agreement with Ross E. Roeder (incorporated by reference to Exhibit 10.8 to the Company's Form 8-K as filed with the Commission on December 9, 2005) |
|
|
|
| 10.7* | Indemnification Agreement with John J. Mahoney (incorporated by reference to Exhibit 10.1 to the Company's Form 8-K as filed with the Commission on July 25, 2008) |
|
|
|
| 10.8* | Indemnification Agreement with Andrea M. Weiss (incorporated by reference to Exhibit 10.43 to the Company's Form 10-K, as filed with the Commission on March 22, 2011) |
|
|
|
| 10.9* | Indemnification Agreement with Stephen E. Watson (incorporated by reference to Exhibit 10.44 to the Company's Form 10-K, as filed with the Commission on March 22, 2011) |
|
|
|
| 10.10* | Chico's FAS, Inc. Deferred Compensation Plan effective April 1, 2002 (incorporated by reference to Exhibit 10.53 to the Company's Form 10-K, as filed with the Commission on April 24, 2002) |
|
|
|
61
Table of Contents
| 10.11* | Chico's FAS, Inc. 2005 Deferred Compensation Plan effective January 1, 2005 (amended and restated January 1, 2008) (incorporated by reference to Exhibit 10.1 to the Company's Form 10-Q, as filed with the Commission on December 10, 2008) |
|
|
|
| 10.12 | Lease Agreement between Joint Development Authority of Winder-Barrow County and Chico's Real Estate, LLC dated as of March 25, 2002 (incorporated by reference to Exhibit 10.54 to the Company's Form 10-K, as filed with the Commission on April 24, 2002) |
|
|
|
| 10.13* | Indemnification Agreement with Janice L. Fields (incorporated by reference to Exhibit 10.1 to the Company's Form 8-K, as filed with the Commission on May 7, 2013) |
|
|
|
| 10.14* | Participation Agreement between the Company and Todd E. Vogensen (incorporated by reference to Exhibit 10.2 to the Company's Form 8-K, as filed with the Commission on April 1, 2015) |
|
|
|
| 10.15 | Credit Agreement by and among the Company, JP Morgan Chase Bank, N.A. and the Lenders parties thereto dated as of May 4, 2015 (incorporated by reference to Exhibit 10.1 to the Company's Form 8-K, as filed with the Commission on May 8, 2015) |
|
|
|
| 10.16* | Chico's FAS, Inc. Cash Bonus Incentive Plan (incorporated by reference to Appendix A to the Company's definitive proxy statement, as filed with the Commission on May 8, 2015) |
|
|
|
| 10.17* | Employment letter agreement between the Company and Todd E. Vogensen, dated as of March 3, 2015 (incorporated by reference to Exhibit 10.3 to the Company's Form 10-Q, as filed with the Commission on May 28, 2015) |
|
|
|
| 10.18* | Employment letter agreement between the Company and Shelley Broader (incorporated by reference to Exhibit 10.1 to the Company's Form 8-K, as filed with the Commission on October 30, 2015) |
|
|
|
| 10.19* | Amendment No.1 to Second Amended and Restated 2002 Employee Stock Purchase Plan (incorporated by reference to Exhibit 10.59 to the Company's Form 10-K, as filed with the Commission on March 8, 2016) |
|
|
|
| 10.20* | Participation Agreement between the Company and Shelley Broader (incorporated by reference to Exhibit 10.61 to the Company's Form 10-K, as filed with the Commission on March 8, 2016) |
|
|
|
| 10.21* | Amendment to employment letter agreement between the Company and Shelley Broader dated April 14, 2016 (incorporated by reference to Exhibit 10.1 to the Company's Form 8-K, as filed with the Commission on April 14, 2016) |
|
|
|
| 10.22* | Employment letter agreement between the Company and Diane M. Ellis (incorporated by reference to Exhibit 10.1 to the Company's Form 8-K, as filed with the Commission on October 7, 2016) |
|
|
|
| 10.23* | Restrictive covenant agreement between the Company and Diane M. Ellis (incorporated by reference to Exhibit 10.2 to the Company's Form 8-K, as filed with the Commission on October 7, 2016) |
|
|
|
| 10.24* | Amended Form of 2012 Omnibus Stock and Incentive Plan Restricted Stock Agreement (Non-Soma Officers) (incorporated by reference to Exhibit 10.1 to the Company's Form 10-Q, as filed with the Commission on November 22, 2016) |
|
|
|
| 10.25* | Amended Form of 2012 Omnibus Stock and Incentive Plan Restricted Stock Agreement (Soma Officers) (incorporated by reference to Exhibit 10.2 to the Company's Form 10-Q, as filed with the Commission on November 22, 2016) |
|
|
|
| 10.26* | Indemnification Agreement with Bonnie R. Brooks (incorporated by reference to Exhibit 10.46 to the Company's Form 10-K, as filed with the Commission on March 7, 2017) |
|
|
|
| 10.27* | Indemnification Agreement with William S. Simon (incorporated by reference to Exhibit 10.47 to the Company's Form 10-K, as filed with the Commission on March 7, 2017) |
|
|
|
| 10.28* | Officer Severance Plan (as amended and restated September 1, 2016) (incorporated by reference to Exhibit 10.49 to the Company's Form 10-K, as filed with the Commission on March 7, 2017) |
|
|
|
| 10.29* | Form of 2012 Omnibus Stock and Incentive Plan Restricted Stock Agreement (incorporated by reference to Exhibit 10.50 to the Company's Form 10-K, as filed with the Commission on March 7, 2017) |
|
|
|
| 10.30* | Form of 2012 Omnibus Stock and Incentive Plan Performance Award Agreement for Restricted Stock Units (incorporated by reference to Exhibit 10.51 to the Company's Form 10-K, as filed with the Commission on March 7, 2017) |
|
|
|
| 10.31* | Incentive Compensation Clawback Policy, effective April 6, 2017 (incorporated by reference to Exhibit 10.1 to the Company's Form 10-Q, as filed with the Commission on May 25, 2017) |
|
|
|
62
Table of Contents
| 10.32* | Separation Agreement and Release between the Company and Laurie Van Brunt dated April 7, 2017 (incorporated by reference to Exhibit 99.1 to the Company's Form 8-K, as filed with the Commission on April 10, 2017) |
|
|
|
| 10.33* | Chico's FAS, Inc. Amended and Restated 2012 Omnibus Stock and Incentive Plan (incorporated by reference to Exhibit 10.55 to the Company's Form 8-K as filed with the Commission on June 27, 2017) |
|
|
|
| 10.34* | Form of Amended and Restated 2012 Omnibus Stock and Incentive Plan Restricted Stock Agreement for Employees (for awards on or after June 22, 2017) (incorporated by reference to Exhibit 10.1 to the Company's Form 10-Q, as filed with the Commission on August 31, 2017) |
|
|
|
| 10.35* | Form of Amended and Restated 2012 Omnibus Stock and Incentive Plan Restricted Stock Agreement for Non-Employee Directors (for awards on or after June 22, 2017) (incorporated by reference to Exhibit 10.2 to the Company's Form 10-Q, as filed with the Commission on August 31, 2017) |
|
|
|
| 10.36* | Form of Amended and Restated 2012 Omnibus Stock and Incentive Plan Restricted Stock Unit Agreement for Non-Employee Directors (for awards on or after June 22, 2017) (incorporated by reference to Exhibit 10.3 to the Company's Form 10-Q, as filed with the Commission on August 31, 2017) |
|
|
|
| 10.37* | Amended and Restated Indemnification Agreement with Shelley G. Broader, dated June 19, 2017 (incorporated by reference to Exhibit 10.4 to the Company's Form 10-Q, as filed with the Commission on August 31, 2017) |
|
|
|
| 10.38* | Amended and Restated Indemnification Agreement with Todd E. Vogensen, dated July 6, 2017 (incorporated by reference to Exhibit 10.5 to the Company's Form 10-Q, as filed with the Commission on August 31, 2017) |
|
|
|
| 10.39* | Indemnification Agreement with Susan S. Lanigan, dated June 28, 2017 (incorporated by reference to Exhibit 10.6 to the Company's Form 10-Q, as filed with the Commission on August 31, 2017) |
|
|
|
| 10.40* | Employment Letter Agreement between the Company and Mary van Praag, dated August 1, 2017 (incorporated by reference to Exhibit 10.1 to the Company's Form 10-Q, as filed with the Commission on November 22, 2017) |
|
|
|
| 10.41* | Restrictive Covenant Agreement between the Company and Mary van Praag, dated August 22, 2017 (incorporated by reference to Exhibit 10.2 to the Company's Form 10-Q, as filed with the Commission on November 22, 2017) |
|
|
|
| 10.42* | Indemnification Agreement with Deborah L. Kerr, dated November 15, 2017 (incorporated by reference to Exhibit 10.3 to the Company's Form 10-Q, as filed with the Commission on November 22, 2017) |
|
|
|
| 10.43* | Form of Amended and Restated 2012 Omnibus Stock and Incentive Plan Performance Award Agreement for Performance Share Units for Employees (for awards on or after March 1, 2018) (incorporated by reference to Exhibit 10.1 to the Company's Form 8-K, as filed with the Commission on February 16, 2018) |
|
|
|
| 10.44* | Form of Amended and Restated 2012 Omnibus Stock and Incentive Plan Restricted Stock Agreement for Employees (for awards on or after March 1, 2018) |
|
|
|
| 10.45* | Employment letter agreement between the Company and David Pastrana, dated as of December 11, 2017 |
|
|
|
| 10.46* | Restrictive covenant agreement between the Company and David Pastrana, dated as of December 12, 2017 |
|
|
|
| 10.47* | Separation Agreement and Release between the Company and Donna Colaco, dated as of January 31, 2018 |
|
|
|
| 21 | Subsidiaries of the Registrant |
|
|
|
| 23 | Consent of Ernst & Young LLP |
|
|
|
| 31.1 | Chico's FAS, Inc. and Subsidiaries Certification Pursuant to Section 302 of the Sarbanes-Oxley Act of 2002- Chief Executive Officer |
|
|
|
| 31.2 | Chico's FAS, Inc. and Subsidiaries Certification Pursuant to Section 302 of the Sarbanes-Oxley Act of 2002- Chief Financial Officer |
|
|
|
| 32.1 | Certification of Chief Executive Officer Pursuant to 18 U.S.C. Section 1350, as adopted pursuant to Section 906 of the Sarbanes-Oxley Act of 2002 |
|
|
|
| 32.2 | Certification of Chief Financial Officer Pursuant to 18 U.S.C. Section 1350, as adopted pursuant to Section 906 of the Sarbanes-Oxley Act of 2002 |
|
|
|
| 101.INS | XBRL Instance Document |
63
Table of Contents
|
|
|
| 101.SCH | XBRL Taxonomy Extension Schema Document |
|
|
|
| 101.CAL | XBRL Taxonomy Extension Calculation Linkbase Document |
|
|
|
| 101.DEF | XBRL Taxonomy Definition Linkbase Document |
|
|
|
| 101.LAB | XBRL Taxonomy Extension Label Linkbase Document |
|
|
|
| 101.PRE | XBRL Taxonomy Extension Presentation Linkbase Document |
* Denotes management contract
64
Table of Contents
ITEM 16. | FORM 10-K SUMMARY |
Not applicable.
SIGNATURES
Pursuant to the requirements of Section 13 or 15(d) of the Securities Exchange Act of 1934, the registrant has duly caused this report to be signed on its behalf by the undersigned, thereunto duly authorized.
CHICO'S FAS, INC.
By: | /s/ Shelley G. Broader |
Shelley G. Broader | |
Chief Executive Officer, President and Director | |
Date: March 13, 2018
Pursuant to the requirements of the Securities Exchange Act of 1934, this report has been signed below by the following persons on behalf of the registrant and in the capacities and on the dates indicated.
65
Table of Contents
Signature |
| Title |
| Date |
|
|
| ||
/s/ Shelley G. Broader |
| Chief Executive Officer, President and Director (Principal Executive Officer) |
| March 13, 2018 |
Shelley G. Broader |
|
|
| |
|
|
| ||
/s/ Todd E. Vogensen |
| Executive Vice President, Chief Financial Officer and Assistant Corporate Secretary |
| March 13, 2018 |
Todd E. Vogensen |
|
|
| |
|
|
| ||
/s/ David M. Oliver |
| Senior Vice President-Finance, Controller and Chief Accounting Officer |
| March 13, 2018 |
David M. Oliver |
|
|
| |
|
|
| ||
/s/ David F. Walker |
| Chairman of the Board |
| March 13, 2018 |
David F. Walker |
|
|
|
|
|
|
|
|
|
/s/ Bonnie R. Brooks |
| Director |
| March 13, 2018 |
Bonnie R. Brooks |
|
|
|
|
|
|
| ||
/s/ Janice L. Fields |
| Director |
| March 13, 2018 |
Janice L. Fields |
|
|
|
|
|
|
| ||
/s/ Deborah L. Kerr |
| Director |
| March 13, 2018 |
Deborah L. Kerr |
|
|
|
|
|
|
|
|
|
/s/ John J. Mahoney |
| Director |
| March 13, 2018 |
John J. Mahoney |
|
|
|
|
|
|
| ||
/s/ William S. Simon |
| Director |
| March 13, 2018 |
William S. Simon |
|
|
|
|
|
|
| ||
/s/ Stephen E. Watson |
| Director |
| March 13, 2018 |
Stephen E. Watson |
|
|
|
|
|
|
| ||
/s/ Andrea M. Weiss |
| Director |
| March 13, 2018 |
Andrea M. Weiss |
|
|
|
|
66