|
UNITED STATES
SECURITIES AND EXCHANGE COMMISSION
WASHINGTON, D.C. 20549
FORM
10-Q
QUARTERLY REPORT PURSUANT TO SECTION 13 OR 15(d) OF
THE SECURITIES EXCHANGE ACT OF 1934
For the quarterly period ended June 30, 2015
Commission file number 1-9924
Citigroup Inc.
(Exact name of registrant as specified in its charter)
Delaware (State or other jurisdiction of incorporation or organization) |
| 52-1568099 (I.R.S. Employer Identification No.) |
399 Park Avenue, New York, NY (Address of principal executive offices) |
| 10022 (Zip code) |
(212) 559-1000 (Registrant's telephone number, including area code) | ||
Indicate by check mark whether the registrant (1) has filed all reports required to be filed by Section 13 or 15(d) of the Securities Exchange Act of 1934 during the preceding 12 months (or for such shorter period that the registrant was required to file such reports), and (2) has been subject to such filing requirements for the past 90 days. Yes x No o
Indicate by check mark whether the registrant has submitted electronically and posted on its corporate Web site, if any, every Interactive Data File required to be submitted and posted pursuant to Rule 405 of Regulation S-T (§232.405 of this chapter) during the preceding 12 months (or for such shorter period that the registrant was required to submit and post such files). Yes x No o
Indicate by check mark whether the registrant is a large accelerated filer, an accelerated filer, a non-accelerated filer, or a smaller reporting company. See the definitions of "large accelerated filer," "accelerated filer" and "smaller reporting company" in Rule 12b-2 of the Exchange Act.
Large accelerated filer x |
| Accelerated filer o |
| Non-accelerated filer o (Do not check if a smaller reporting company) |
| Smaller reporting company o |
Indicate by check mark whether the registrant is a shell company (as defined in Rule 12b-2 of the Exchange Act). Yes o No x
Number of shares of Citigroup Inc. common stock outstanding on June 30, 2015: 3,009,845,273
Available on the web at www.citigroup.com
|
CITIGROUP INC SECOND QUARTER 2015-FORM 10-Q
OVERVIEW | 2 |
MANAGEMENT'S DISCUSSION AND ANALYSIS OF FINANCIAL CONDITION AND RESULTS OF OPERATIONS | 4 |
Executive Summary | 4 |
Summary of Selected Financial Data | 7 |
SEGMENT AND BUSINESS-INCOME (LOSS) AND REVENUES | 9 |
CITICORP | 12 |
Global Consumer Banking (GCB) | 13 |
North America GCB | 15 |
Latin America GCB | 17 |
Asia GCB | 19 |
Institutional Clients Group | 21 |
Corporate/Other | 25 |
CITI HOLDINGS | 26 |
BALANCE SHEET REVIEW | 28 |
OFF-BALANCE SHEET ARRANGEMENTS | 31 |
CAPITAL RESOURCES | 32 |
Overview |
|
Capital Management |
|
Current Regulatory Capital Standards |
|
Basel III (Full Implementation) |
|
Regulatory Capital Standards Developments |
|
Tangible Common Equity, Tangible Book Value Per Share and Book Value Per Share |
|
Managing Global Risk Table of Contents - Credit, Market (Including Funding and Liquidity), and Country and Cross-Border Risk Sections | 51 |
MANAGING GLOBAL RISK | 52 |
INCOME TAXES | 95 |
DISCLOSURE CONTROLS AND PROCEDURES | 96 |
DISCLOSURE PURSUANT TO SECTION 219 OF THE IRAN THREAT REDUCTION AND SYRIA HUMAN RIGHTS ACT | 96 |
FORWARD-LOOKING STATEMENTS | 97 |
FINANCIAL STATEMENTS AND NOTES TABLE OF CONTENTS | 100 |
CONSOLIDATED FINANCIAL STATEMENTS | 101 |
NOTES TO CONSOLIDATED FINANCIAL STATEMENTS | 110 |
Legal Proceedings (See Note 25 to the Consolidated Financial Statements) |
|
UNREGISTERED SALES OF EQUITY, PURCHASES OF EQUITY SECURITIES, DIVIDENDS | 231 |
1
OVERVIEW
This Quarterly Report on Form 10-Q should be read in conjunction with Citigroup's Annual Report on Form 10-K for the year ended December 31, 2014 filed with the U.S. Securities and Exchange Commission (SEC) on February 25, 2015, including the historical audited consolidated financial statements of Citigroup reflecting the adoption of an accounting change (See Note 1 to the Consolidated Financial Statements) and certain realignments and reclassifications set forth in Citigroup's Current Report on Form 8-K filed with the SEC on May 27, 2015 (2014 Annual Report on Form 10-K), and Citigroup's Quarterly Report on Form 10-Q for the quarter ended March 31, 2015 filed with the SEC on May 11, 2015 (First Quarter of 2015 Form 10-Q).
Additional information about Citigroup is available on Citi's website at www.citigroup.com . Citigroup's recent annual reports on Form 10-K, quarterly reports on Form 10-Q, proxy statements, as well as other filings with the SEC, are available free of charge through Citi's website by clicking on the "Investors" page and selecting "All SEC Filings." The SEC's website also contains current reports, information statements, and other information regarding Citi at www.sec.gov .
Certain other reclassifications, have been made to the prior periods' presentation.
Throughout this report, "Citigroup," "Citi" and "the Company" refer to Citigroup Inc. and its consolidated subsidiaries.
2
Citigroup is managed pursuant to the following segments:
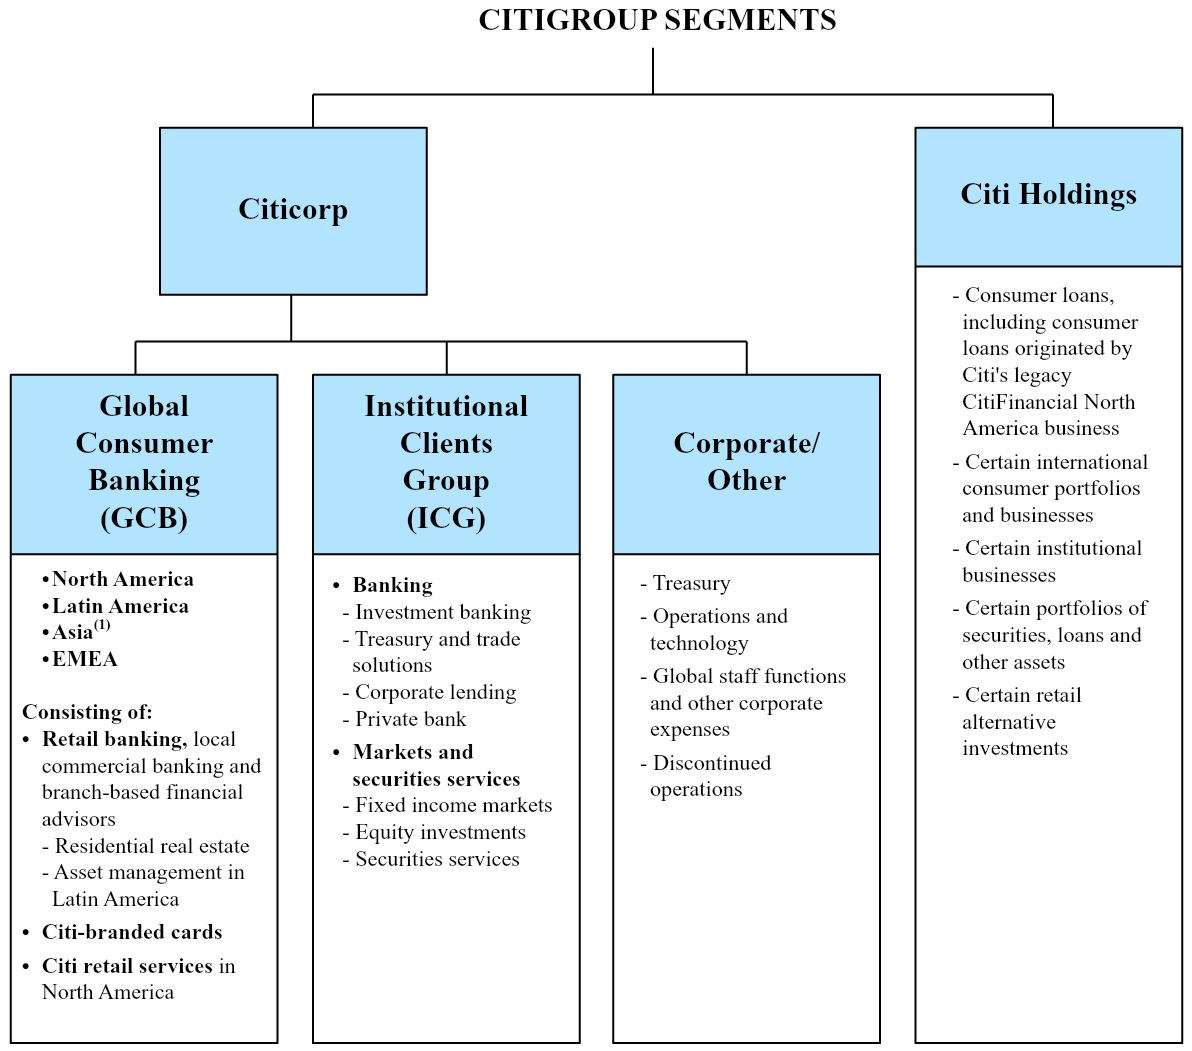
(1) | For reporting purposes, Asia GCB includes the results of operations of EMEA GCB for all periods presented. |
Note: Reflects recent business reclassifications. See "Overview" above for additional information.
The following are the four regions in which Citigroup operates. The regional results are fully reflected in the segment results above.
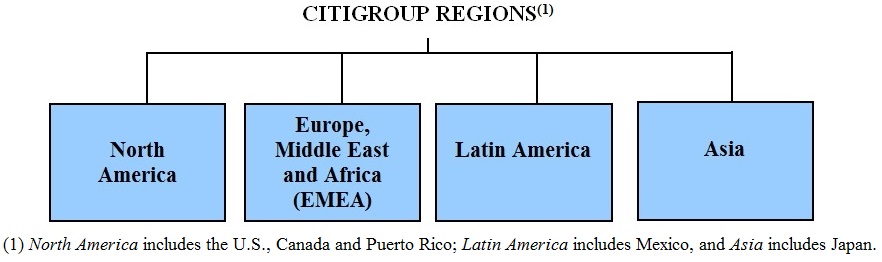
3
MANAGEMENT'S DISCUSSION AND ANALYSIS OF FINANCIAL CONDITION
AND RESULTS OF OPERATIONS
EXECUTIVE SUMMARY
Second Quarter of 2015-Continued Progress on Execution Priorities
Citi's second quarter of 2015 reflected solid overall results and steady progress on its execution priorities, including:
• | Efficient resource allocation and disciplined expense management: Citi maintained disciplined expense management during the second quarter of 2015, even as it absorbed increased regulatory and compliance costs in Citicorp. Citi's expense management in the current quarter was further aided by lower legal and related expenses and lower repositioning expenses in Citicorp as compared to the prior-year period, as discussed further below. |
• | Continued wind down of Citi Holdings, while maintaining profitability: Citi continued to wind down Citi Holdings, including reducing its assets by $32 billion, or 22%, from the prior-year period. In addition, as previously announced, Citi currently has executed agreements to sell approximately $32 billion of the remaining assets in Citi Holdings, including OneMain Financial, the largest business remaining in Citi Holdings, subject to regulatory approvals and other closing conditions. As discussed further below, Citi Holdings also maintained profitability in the second quarter of 2015. |
• | Utilization of deferred tax assets (DTAs): Citi utilized approximately $1.5 billion in DTAs during the first half of 2015, including approximately $300 million during the second quarter of 2015 (for additional information, see "Income Taxes" below). |
While continuing to make progress on these initiatives in the first half of 2015, Citi expects the operating environment during the remainder of 2015 to remain challenging. Overall, economic growth remains uneven across the developed and emerging markets and uncertainty continues as to when interest rates may begin to rise. For more information on these and other trends and risks that could impact Citi's businesses, results of operations and financial condition, see the discussion of each businesses' results of operations, "Forward-Looking Statements" and Note 25 to the Consolidated Financial Statements below, as well as the "Risk Factors" section of Citi's 2014 Annual Report on Form 10-K.
Second Quarter of 2015 Summary Results
Citigroup
Citigroup reported net income of $4.8 billion or $1.51 per diluted share, compared to $181 million or $0.03 per share in the prior-year period. Results in the second quarter of 2015 included $312 million ($196 million after-tax) of CVA/DVA, compared to negative $33 million (negative $20 million after-tax) in the second quarter of 2014. Second quarter of 2014 results also included the impact of a $3.8 billion charge, which
consisted of $3.7 billion of legal expenses and a $55 million loan loss reserve build ($3.7 billion after-tax), to settle legacy RMBS and CDO-related claims, recorded in Citi Holdings.
Excluding these items, Citi reported net income of $4.7 billion in the second quarter of 2015, or $1.45 per diluted share, compared to $3.9 billion, or $1.24 per share, in the prior-year period. The 18% increase from the prior-year period was primarily driven by lower expenses, lower net credit losses and a lower effective tax rate (for additional information, see "Income Taxes" below), partially offset by lower revenues and a reduced net loan loss reserve release. (Citi's results of operations excluding the impacts of CVA/DVA and the mortgage settlement are non-GAAP financial measures.)
Citi's revenues, net of interest expense, were $19.5 billion in the second quarter of 2015, approximately unchanged versus the prior-year period. Excluding CVA/DVA, revenues were $19.2 billion, down 2% from the prior-year period, as Citicorp revenues were approximately unchanged and Citi Holdings revenues decreased 16%. Excluding CVA/DVA and the impact of foreign exchange translation into U.S. dollars for reporting purposes (FX translation), Citigroup revenues increased 3% from the prior-year period, as 5% growth in Citicorp revenues was partially offset by the decrease in Citi Holdings revenues. (Citi's results of operations excluding the impact of FX translation are non-GAAP financial measures.)
Expenses
Citigroup expenses decreased 30% versus the second quarter of 2014 to $10.9 billion. Excluding the impact of the mortgage settlement in the prior-year period, expenses fell 7%, mainly driven by lower legal and related expenses ($360 million compared to $402 million in the prior-year period) and repositioning costs ($61 million compared to $397 million in the prior-year period), as well as the impact of FX translation (which lowered expenses by approximately $681 million in the second quarter of 2015 compared to the prior-year period). Excluding the impact of FX translation, Citigroup's expenses declined 1%, mainly driven by the lower legal and related expenses and repositioning costs.
Excluding the impact of FX translation, which lowered reported expenses by approximately $609 million in the second quarter of 2015 compared to the prior-year period, Citicorp expenses decreased 1%, as ongoing efficiency savings and lower legal and related expenses and repositioning costs were largely offset by higher regulatory and compliance costs. Citicorp expenses in the second quarter of 2015 included legal and related expenses of $297 million, compared to $387 million in the prior-year period, and $34 million of repositioning charges, compared to $354 million in the prior-year period.
Citi Holdings' expenses were $1.1 billion, down 78% from the prior-year period. Excluding the impact of the mortgage settlement, Citi Holdings' expenses decreased 13% from the prior-year period, primarily driven by the ongoing decline in Citi Holdings assets.
4
Credit Costs and Allowance for Loan Losses
Citi's total provisions for credit losses and for benefits and claims of $1.6 billion declined 5% from the prior-year period.
Excluding the impact of the mortgage settlement, Citi's total provisions for credit losses and for benefits and claims declined 2% as a lower net loan loss reserve release was more than offset by lower net credit losses, which declined 12% versus the prior-year period. The decline in net credit losses year-over-year included the impact of classifying OneMain Financial as held-for-sale at the end of the first quarter of 2015. As a result of the held-for-sale accounting treatment, approximately $160 million of OneMain Financial net credit losses were recorded as a reduction in revenue in Citi Holdings during the second quarter of 2015. Excluding the impact of the held-for-sale accounting treatment relating to OneMain Financial, net credit losses of $2.1 billion declined 5% versus the prior-year period.
Consumer net credit losses declined 17% to $1.8 billion, reflecting continued improvements in both North America Citi-branded cards and Citi retail services in Citicorp and the North America mortgage portfolio within Citi Holdings, as well as the impact of the OneMain Financial classification referenced above. Corporate net credit losses increased to $106 million from $11 million in the prior-year period. The increase related to a limited number of corporate loans, with the vast majority of these net credit losses offset by the release of related, previously-established loan loss reserves.
The net release of allowance for loan losses and unfunded lending commitments was $453 million in the second quarter of 2015, compared to a $641 million release in the prior-year period. Excluding the impact of the mortgage settlement, the net release of allowance for loan losses and unfunded lending commitments was $453 million compared to $696 million in the prior-year period. Citicorp's net reserve release declined to $282 million from $426 million in prior-year period due to a lower reserve release in North America Global Consumer Banking (GCB), as credit continued to stabilize, partially offset by a larger net reserve release in Institutional Clients Group ( ICG), driven by previously-mentioned loan loss reserve releases as well as improvement in the overall corporate portfolio. Citi Holdings' net reserve release decreased 20% to $171 million. Excluding the impact of the mortgage settlement, Citi Holdings' net reserve release decreased 37% to $171 million, primarily due to lower releases related to the North America mortgage portfolio, which also had lower net credit losses.
For additional information on Citi's credit costs and allowance for loan losses, including delinquency trends in its credit portfolios, see "Credit Risk" below. Overall, Citi continues to expect its credit costs could increase during the remainder 2015, driven by loan growth as well as lower loan loss reserve releases.
Capital
Citi continued to grow its regulatory capital during the second quarter of 2015, even as it returned approximately $1.7 billion of capital to its shareholders in the form of common stock repurchases and increased dividends. Citigroup's Tier 1 Capital and Common Equity Tier 1 Capital ratios, on a fully
implemented basis, were 12.5% and 11.4% as of June 30, 2015, respectively, compared to 11.3% and 10.6% as of June 30, 2014 (all based on the Basel III Advanced Approaches for determining risk-weighted assets). Citigroup's Supplementary Leverage ratio as of June 30, 2015, on a fully implemented basis, was 6.7%, compared to 5.8% as of June 30, 2014. For additional information on Citi's capital ratios and related components, including the impact of Citi's DTAs on its capital ratios, see "Capital Resources" and "Income Taxes" below.
Citicorp
Citicorp net income increased 27% from the prior-year period to $4.7 billion. CVA/DVA, recorded in ICG , was $303 million ($190 million after-tax) in the second quarter of 2015, compared to negative $32 million (negative $20 million after-tax) in the prior-year period (for a summary of CVA/DVA by business within ICG , see " Institutional Clients Group " below).
Excluding CVA/DVA, Citicorp's net income was $4.5 billion, up 22% from the prior-year period, primarily driven by lower expenses, lower net credit losses and a lower effective tax rate, partially offset by a lower net loan loss reserve release.
Citicorp revenues, net of interest expense, increased 2% from the prior-year period to $17.8 billion. Excluding CVA/DVA, Citicorp revenues were $17.5 billion in the second quarter of 2015, approximately unchanged from the prior-year period. As referenced above, excluding CVA/DVA and the impact of FX translation, Citicorp's revenues grew 5%, mostly driven by growth in ICG .
GCB revenues of $8.5 billion decreased 4% versus the prior-year period. Excluding the impact of FX translation, GCB revenues increased 1%, driven by growth in North America GCB and Latin America GCB . North America GCB revenues increased 1% to $4.8 billion as higher retail banking revenues were largely offset by lower revenues in Citi-branded cards. Retail banking revenues increased 11% to $1.3 billion versus the prior-year period, reflecting continued volume growth, higher mortgage origination activity and improved deposit spreads. Citi-branded cards revenues of $1.9 billion were down 5% versus the prior-year period, as the continued impact of lower average loans was partially offset by the impact of 5% growth in purchase sales and an improvement in spreads. Citi retail services revenues were unchanged at $1.6 billion, as spread improvements were offset by the continued impact of lower fuel prices and higher contractual partner payments. North America GCB average deposits of $171 billion were unchanged year-over-year and average retail loans of $49 billion grew 7%. Average card loans of $106 billion decreased 3%, while purchase sales of $66 billion increased 3% versus the prior-year period. For additional information on the results of operations of North America GCB for the second quarter of 2015, see " Global Consumer Banking-North America GCB " below.
International GCB revenues (consisting of EMEA GCB, Latin America GCB and Asia GCB ) decreased 10% versus the prior-year period to $3.7 billion. Excluding the impact of FX translation, international GCB revenues increased 1% versus the prior-year period, reflecting a 3% increase in revenues in Latin America GCB and relatively unchanged revenues in Asia GCB (for the impact of FX translation on the second quarter of
5
2015 results of operations for each of Latin America GCB and Asia GCB , see the table accompanying the discussion of each respective business' results of operations below). International GCB revenues, excluding the impact of FX translation, mainly reflected modest volume-related growth in Mexico and growth in retail banking (including wealth management) in Asia GCB, partially offset by lower cards revenues and the ongoing impact of regulatory changes in Asia GCB, as well as the impact of the sale of Citi's consumer business in Honduras in Latin America GCB in the prior-year period. For additional information on the results of operations of Latin America GCB and Asia GCB (which includes the results of operations of EMEA GCB for reporting purposes) for the second quarter of 2015, see " Global Consumer Banking " below. Year-over-year, international GCB average deposits of $131 billion increased 4%, average retail loans of $101 billion increased 3%, investment sales of $23 billion increased 13%, average card loans of $27 billion increased 2% and card purchase sales of $26 billion increased 5%, all excluding the impact of FX translation.
ICG revenues were $8.9 billion in the second quarter of 2015, up 6% from the prior-year period. Excluding CVA/DVA, ICG revenues were $8.6 billion, up 2% from the prior-year period. Banking revenues of $4.4 billion, excluding CVA/DVA and the impact of mark-to-market losses on hedges related to accrual loans within corporate lending (see below), were largely unchanged from the prior-year period, as growth in the private bank was offset by lower underwriting activity within investment banking as well as the impact of FX translation. Investment banking revenues decreased 4% versus the prior-year period, as a 34% increase in advisory revenues to $258 million was more than offset by a 3% decrease in debt underwriting revenues to $729 million, and a 25% decrease in equity underwriting revenues to $296 million. Private bank revenues, excluding CVA/DVA, increased 13% to $746 million from the prior-year period, driven by increased loan and deposit balances and growth in investments and capital markets products.
Corporate lending revenues declined 8% to $379 million, including $66 million of mark-to-market losses on hedges related to accrual loans, compared to a $44 million loss in the prior-year period. Excluding the mark-to-market impact on hedges related to accrual loans in both periods, corporate lending revenues declined 2% versus the prior-year period to $445 million. Excluding the impact of FX translation, corporate lending revenues increased 4% year-over-year, as higher volumes were partially offset by lower spreads. Treasury and trade solutions revenues decreased 1% versus the prior-year period to $2.0 billion. Excluding the impact of FX translation, treasury and trade solutions revenues increased 5%, as continued growth in deposit balances and spreads was partially offset by lower trade revenues.
Markets and securities services revenues of $4.2 billion, excluding CVA/DVA, increased 4% from the prior-year period. Fixed income markets revenues of $3.1 billion, excluding CVA/DVA, decreased 1% from the prior-year period, as continued strength in rates and currencies revenues was more than offset by lower revenues in spread products. Equity markets revenues of $653 million, excluding CVA/
DVA, decreased 1% versus the prior year period. The second quarter of 2015 included a charge of $175 million for valuation adjustments related to certain financing transactions. Excluding these adjustments, equity markets revenues would have increased by 26%, mostly reflecting improvement in derivatives. Securities services revenues of $557 million increased 7% versus the prior-year period reflecting increased activity and higher client balances, partially offset by the impact of FX translation. For additional information on the results of operations of ICG for the second quarter of 2015, including the impact of CVA/DVA on the applicable businesses, see " Institutional Clients Group " below.
Corporate/Other revenues were $370 million, a $281 million increase from the prior-year period primarily driven by gains on debt buybacks and real estate sales in the current quarter, partially offset by hedging activities. For additional information on the results of operations of Corporate/Other for the second quarter of 2015, see " Corporate/Other " below.
Citicorp end-of-period loans decreased 1% from the prior-year period to $573 billion, as consumer loans decreased 4% while corporate loans increased 2%. Excluding the impact of FX translation, Citicorp loans grew 4%, with 6% growth in corporate loans and 1% growth in consumer loans.
Citi Holdings
Citi Holdings' net income was $163 million in the second quarter of 2015, compared to a net loss of $3.5 billion in the prior-year period. CVA/DVA was $9 million ($6 million after-tax) in the second quarter of 2015, compared to negative $1 million in the prior-year period. Excluding the impact of CVA/DVA in both periods and the impact of the mortgage settlement in the prior-year period, Citi Holdings' net income was $157 million in the current quarter, compared to $234 million in the prior-year period, primarily reflecting lower revenues, partially offset by the lower expenses and lower credit costs.
Citi Holdings' revenues decreased 16% to $1.7 billion from the prior-year period, primarily driven by the overall wind down of the portfolio as well as the impact of the previously-referenced recording of OneMain Financial net credit losses as a reduction in revenue. For additional information on the results of operations of Citi Holdings in the second quarter of 2015, see "Citi Holdings" below.
At the end of the current quarter, Citi Holdings' assets were $116 billion, 22% below the prior-year period, and represented approximately 6% of Citi's total GAAP assets and 13% of its risk-weighted assets under Basel III (based on the Advanced Approaches for determining risk-weighted assets).
6
RESULTS OF OPERATIONS
SUMMARY OF SELECTED FINANCIAL DATA-PAGE 1
Citigroup Inc. and Consolidated Subsidiaries
| Second Quarter |
| Six Months |
| ||||||||||||
In millions of dollars, except per-share amounts and ratios | 2015 | 2014 | % Change | 2015 | 2014 | % Change | ||||||||||
Net interest revenue | $ | 11,822 | | $ | 11,946 | | (1 | )% | $ | 23,394 | | $ | 23,705 | | (1 | )% |
Non-interest revenue | 7,648 | | 7,479 | | 2 | | 15,812 | | 15,926 | | (1 | )% | ||||
Revenues, net of interest expense | $ | 19,470 | | $ | 19,425 | | - | % | $ | 39,206 | | $ | 39,631 | | (1 | )% |
Operating expenses | 10,928 | | 15,521 | | (30 | ) | 21,812 | | 27,670 | | (21 | )% | ||||
Provisions for credit losses and for benefits and claims | 1,648 | | 1,730 | | (5 | ) | 3,563 | | 3,704 | | (4 | )% | ||||
Income from continuing operations before income taxes | $ | 6,894 | | $ | 2,174 | | NM | | $ | 13,831 | | $ | 8,257 | | 68 | % |
Income taxes | 2,036 | | 1,921 | | 6 | | 4,156 | | 4,052 | | 3 | % | ||||
Income from continuing operations | $ | 4,858 | | $ | 253 | | NM | | $ | 9,675 | | $ | 4,205 | | NM | |
Income (loss) from discontinued operations, net of taxes (1) | 6 | | (22 | ) | NM | | 1 | | 15 | | (93 | )% | ||||
Net income before attribution of noncontrolling interests | $ | 4,864 | | $ | 231 | | NM | | $ | 9,676 | | $ | 4,220 | | NM | |
Net income attributable to noncontrolling interests | 18 | | 50 | | (64 | ) | 60 | | 95 | | (37 | )% | ||||
Citigroup's net income | $ | 4,846 | | $ | 181 | | NM | | $ | 9,616 | | $ | 4,125 | | NM | |
Less: |
|
| | |
|
|
| |||||||||
Preferred dividends-Basic | $ | 202 | | $ | 100 | | NM | | $ | 330 | | $ | 224 | | 47 | % |
Dividends and undistributed earnings allocated to employee restricted and deferred shares that contain nonforfeitable rights to dividends, applicable to basic EPS | 64 | | 1 | | NM | | 126 | | 64 | | 97 | % | ||||
Income allocated to unrestricted common shareholders for basic and diluted EPS | $ | 4,580 | | $ | 80 | | NM | | $ | 9,160 | | $ | 3,837 | | NM | |
Earnings per share |
|
| | |
|
| |
| ||||||||
Basic |
|
| | |
|
| |
| ||||||||
Income from continuing operations | $ | 1.51 | | $ | 0.03 | | NM | | $ | 3.03 | | $ | 1.26 | | NM | |
Net income | 1.52 | | 0.03 | | NM | | 3.03 | | 1.26 | | NM | | ||||
Diluted |
|
| | |
|
|
| |||||||||
Income from continuing operations | $ | 1.51 | | $ | 0.03 | | NM | | $ | 3.02 | | $ | 1.26 | | NM | |
Net income | 1.51 | | 0.03 | | NM | | 3.02 | | 1.26 | | NM | | ||||
Dividends declared per common share | 0.05 | | 0.01 | | NM | | 0.06 | | 0.02 | | NM | | ||||
Statement continues on the next page, including notes to the table.
7
SUMMARY OF SELECTED FINANCIAL DATA-PAGE 2
| Citigroup Inc. and Consolidated Subsidiaries | ||||||||||||
| Second Quarter |
| Six Months |
| |||||||||
In millions of dollars, except per-share amounts, ratios and direct staff | 2015 | 2014 | % Change | 2015 | 2014 | % Change | |||||||
At June 30: |
|
|
|
|
|
| |||||||
Total assets | $ | 1,829,370 | | $ | 1,909,369 | | (4 | )% |
|
|
| ||
Total deposits (2) | 908,037 | | 965,725 | | (6 | ) |
|
|
| ||||
Long-term debt | 211,845 | | 226,984 | | (7 | ) |
|
|
| ||||
Citigroup common stockholders' equity | 205,472 | | 202,048 | | 2 | |
|
|
| ||||
Total Citigroup stockholders' equity | 219,440 | | 211,016 | | 4 | |
|
|
| ||||
Direct staff (in thousands) | 237 | | 244 | | (3 | ) |
|
|
| ||||
Performance metrics |
|
| | |
|
|
| ||||||
Return on average assets | 1.06 | % | 0.04 | % | | | 1.05 | % | 0.44 | % |
| ||
Return on average common stockholders' equity (3) | 9.1 | | 0.2 | | | | 9.2 | | 7.0 | |
| ||
Return on average total stockholders' equity (3) | 8.9 | | 0.3 | | | | 9.0 | | 6.9 | |
| ||
Efficiency ratio (Operating expenses/Total revenues) | 56 | | 80 | | | | 56 | | 70 | |
| ||
Basel III ratios - full implementation |
|
|
|
|
|
| |||||||
Common Equity Tier 1 Capital (4) | 11.37 | % | 10.57 | % |
|
|
|
| |||||
Tier 1 Capital (4) | 12.54 | | 11.35 | |
|
|
|
| |||||
Total Capital (4) | 14.14 | | 12.70 | |
|
|
|
| |||||
Supplementary Leverage ratio (5) | 6.72 | | 5.82 | |
|
|
|
| |||||
Citigroup common stockholders' equity to assets | 11.23 | % | 10.58 | % |
| | |
|
| ||||
Total Citigroup stockholders' equity to assets | 12.00 | | 11.05 | |
| | |
|
| ||||
Dividend payout ratio (6) | 3 | | 33 | |
|
|
|
| |||||
Book value per common share | $ | 68.27 | | $ | 66.64 | | 2 | % | | |
|
| |
Ratio of earnings to fixed charges and preferred stock dividends | 3.05x | | 1.57x | |
| 3.09x | | 2.08x | |
| |||
(1) | Discontinued operations include Credicard, Citi Capital Advisors and Egg Banking credit card business. See Note 2 to the Consolidated Financial Statements for additional information on Citi's discontinued operations. |
(2) | Reflects reclassification of approximately $20 billion of deposits to held-for-sale ( Other liabilities) at June 30, 2015 as a result of the agreement in December 2014 to sell Citi's retail banking business in Japan. See Note 2 to the Consolidated Financial Statements. |
(3) | The return on average common stockholders' equity is calculated using net income less preferred stock dividends divided by average common stockholders' equity. The return on average total Citigroup stockholders' equity is calculated using net income divided by average Citigroup stockholders' equity. |
(4) | Capital ratios based on the U.S. Basel III rules, with full implementation assumed for capital components; risk-weighted assets based on the Advanced Approaches for determining total risk-weighted assets. See "Capital Resources" below. |
(5) | Citi's Supplementary Leverage ratio (SLR) is based on the U.S. Basel III rules, on a fully-implemented basis. Citi's SLR represents the ratio of Tier 1 Capital to Total Leverage Exposure (TLE). TLE is the sum of the daily average of on-balance sheet assets for the quarter and the average of certain off-balance sheet exposures calculated as of the last day of each month in the quarter, less applicable Tier 1 Capital deductions. See "Capital Resources" below. |
(6) Dividends declared per common share as a percentage of net income per diluted share.
NM Not meaningful
8
SEGMENT AND BUSINESS-INCOME (LOSS) AND REVENUES
The following tables show the income (loss) and revenues for Citigroup on a segment and business view:
CITIGROUP INCOME
| Second Quarter | % Change | Six Months | % Change | ||||||||||||
In millions of dollars | 2015 | 2014 | 2015 | 2014 | ||||||||||||
Income (loss) from continuing operations |
|
|
|
|
|
| ||||||||||
CITICORP |
|
|
|
|
|
| ||||||||||
Global Consumer Banking |
|
|
|
|
|
| ||||||||||
North America | $ | 1,067 | | $ | 1,074 | | (1 | )% | $ | 2,207 | | $ | 2,092 | | 5 | % |
Latin America | 225 | | 275 | | (18 | ) | 469 | | 566 | | (17 | ) | ||||
Asia (1) | 338 | | 214 | | 58 | | 679 | | 579 | | 17 | | ||||
Total | $ | 1,630 | | $ | 1,563 | | 4 | % | $ | 3,355 | | $ | 3,237 | | 4 | % |
Institutional Clients Group | | |
| | | | |
| | | ||||||
North America | $ | 978 | | $ | 1,096 | | (11 | )% | $ | 1,993 | | $ | 2,401 | | (17 | )% |
EMEA | 684 | | 570 | | 20 | | $ | 1,541 | | $ | 1,362 | | 13 | % | ||
Latin America | 470 | | 427 | | 10 | | 883 | | 767 | | 15 | | ||||
Asia | 703 | | 473 | | 49 | | 1,382 | | 984 | | 40 | | ||||
Total | $ | 2,835 | | $ | 2,566 | | 10 | % | $ | 5,799 | | $ | 5,514 | | 5 | % |
Corporate/Other | $ | 230 | | $ | (384 | ) | NM | | $ | 211 | | $ | (772 | ) | NM | |
Total Citicorp | $ | 4,695 | | $ | 3,745 | | 25 | % | $ | 9,365 | | $ | 7,979 | | 17 | % |
Citi Holdings | $ | 163 | | $ | (3,492 | ) | NM | | $ | 310 | | $ | (3,774 | ) | NM | |
Income from continuing operations | $ | 4,858 | | $ | 253 | | NM | | $ | 9,675 | | $ | 4,205 | | NM | |
Discontinued operations | $ | 6 | | $ | (22 | ) | NM | | $ | 1 | | $ | 15 | | (93 | )% |
Net income attributable to noncontrolling interests | 18 | | 50 | | (64 | )% | 60 | | 95 | | (37 | )% | ||||
Citigroup's net income | $ | 4,846 | | $ | 181 | | NM | | $ | 9,616 | | $ | 4,125 | | NM | |
(1) | For reporting purposes, Asia GCB includes the results of operations of EMEA GCB for all periods presented. |
NM Not meaningful
9
CITIGROUP REVENUES
| Second Quarter | % Change | Six Months | % Change | ||||||||||||
In millions of dollars | 2015 | 2014 | 2015 | 2014 | ||||||||||||
CITICORP |
|
|
|
|
|
| ||||||||||
Global Consumer Banking |
|
|
|
|
|
| ||||||||||
North America | $ | 4,823 | | $ | 4,787 | | 1 | % | $ | 9,817 | | $ | 9,577 | | 3 | % |
Latin America | 1,848 | | 2,136 | | (13 | ) | 3,683 | | 4,219 | | (13 | ) | ||||
Asia (1) | 1,878 | | 2,021 | | (7 | ) | 3,711 | | 3,992 | | (7 | ) | ||||
Total | $ | 8,549 | | $ | 8,944 | | (4 | )% | $ | 17,211 | | $ | 17,788 | | (3 | )% |
Institutional Clients Group | | |
| | |
|
| | | |||||||
North America | $ | 3,285 | | $ | 3,154 | | 4 | % | $ | 6,588 | | $ | 6,715 | | (2 | )% |
EMEA | 2,543 | | 2,430 | | 5 | | 5,306 | | 5,201 | | 2 | | ||||
Latin America | 1,111 | | 1,149 | | (3 | ) | 2,176 | | 2,250 | | (3 | ) | ||||
Asia | 1,939 | | 1,669 | | 16 | | 3,836 | | 3,390 | | 13 | | ||||
Total | $ | 8,878 | | $ | 8,402 | | 6 | % | $ | 17,906 | | $ | 17,556 | | 2 | % |
Corporate/Other | $ | 370 | | $ | 89 | | NM | | $ | 582 | | $ | 312 | | 87 | % |
Total Citicorp | $ | 17,797 | | $ | 17,435 | | 2 | % | $ | 35,699 | | $ | 35,656 | | - | % |
Citi Holdings | $ | 1,673 | | $ | 1,990 | | (16 | )% | $ | 3,507 | | $ | 3,975 | | (12 | )% |
Total Citigroup net revenues | $ | 19,470 | | $ | 19,425 | | - | % | $ | 39,206 | | $ | 39,631 | | (1 | )% |
(1) | For reporting purposes, Asia GCB includes the results of operations of EMEA GCB for all periods presented. |
NM Not meaningful.
10
This page intentionally left blank.
11
CITICORP
Citicorp is Citigroup's global bank for consumers and businesses and represents Citi's core franchises. Citicorp is focused on providing best-in-class products and services to customers and leveraging Citigroup's unparalleled global network, including many of the world's emerging economies. Citicorp is physically present in approximately 100 countries, many for over 100 years, and offers services in over 160 countries and jurisdictions. Citi believes this global network provides a strong foundation for servicing the broad financial services needs of its large multinational clients and for meeting the needs of retail, private banking, commercial, public sector and institutional clients around the world.
Citicorp consists of the following operating businesses: Global Consumer Banking (which consists of consumer banking in North America, Latin America, EMEA and Asia ) and Institutional Clients Group (which includes Banking and Markets and securities services ). Citicorp also includes Corporate/Other . At June 30, 2015, Citicorp had $1.7 trillion of assets and $900 billion of deposits, representing 94% of Citi's total assets and 99% of Citi's total deposits, respectively.
| Second Quarter |
| Six Months | % Change | ||||||||||||
In millions of dollars except as otherwise noted | 2015 | 2014 | % Change | 2015 | 2014 | |||||||||||
Net interest revenue | $ | 10,821 | | $ | 10,709 | | 1 | % | $ | 21,338 | | $ | 21,292 | | - | % |
Non-interest revenue | 6,976 | | 6,726 | | 4 | | 14,361 | | 14,364 | | - | | ||||
Total revenues, net of interest expense | $ | 17,797 | | $ | 17,435 | | 2 | % | $ | 35,699 | | $ | 35,656 | | - | % |
Provisions for credit losses and for benefits and claims | | |
| | |
|
| | | |||||||
Net credit losses | $ | 1,662 | | $ | 1,747 | | (5 | )% | $ | 3,211 | | $ | 3,613 | | (11 | )% |
Credit reserve build (release) | (235 | ) | (398 | ) | 41 | | (241 | ) | (698 | ) | 65 | | ||||
Provision for loan losses | $ | 1,427 | | $ | 1,349 | | 6 | % | $ | 2,970 | | $ | 2,915 | | 2 | % |
Provision for benefits and claims | 21 | | 26 | | (19 | ) | 49 | | 67 | | (27 | ) | ||||
Provision for unfunded lending commitments | (47 | ) | (28 | ) | (68 | ) | (79 | ) | (51 | ) | (55 | ) | ||||
Total provisions for credit losses and for benefits and claims | $ | 1,401 | | $ | 1,347 | | 4 | % | $ | 2,940 | | $ | 2,931 | | - | % |
Total operating expenses | $ | 9,824 | | $ | 10,499 | | (6 | )% | $ | 19,551 | | $ | 20,630 | | (5 | )% |
Income from continuing operations before taxes | $ | 6,572 | | $ | 5,589 | | 18 | % | $ | 13,208 | | $ | 12,095 | | 9 | % |
Income taxes | 1,877 | | 1,844 | | 2 | | 3,843 | | 4,116 | | (7 | ) | ||||
Income from continuing operations | $ | 4,695 | | $ | 3,745 | | 25 | % | $ | 9,365 | | $ | 7,979 | | 17 | % |
Income (loss) from discontinued operations, net of taxes | 6 | | (22 | ) | NM | | 1 | | 15 | | (93 | ) | ||||
Noncontrolling interests | 18 | | 50 | | (64 | ) | 59 | | 93 | | (37 | ) | ||||
Net income | $ | 4,683 | | $ | 3,673 | | 27 | % | $ | 9,307 | | $ | 7,901 | | 18 | % |
Balance sheet data (in billions of dollars) | | |
| | |
|
| | | |||||||
Total end-of-period (EOP) assets | $ | 1,713 | | $ | 1,761 | | (3 | )% |
| | | | | |||
Average assets | 1,722 | | 1,755 | | (2 | ) | 1,725 | | 1,746 | | (1 | ) | ||||
Return on average assets | 1.09 | % | 0.84 | % | | | 1.09 | % | 0.91 | % | | | ||||
Efficiency ratio | 55 | % | 60 | % | | | 55 | | 58 | | | | ||||
Total EOP loans | $ | 573 | | $ | 578 | | (1 | ) |
| | | | | |||
Total EOP deposits | $ | 900 | | $ | 913 | | (1 | ) |
|
| | | ||||
NM Not meaningful
12
GLOBAL CONSUMER BANKING
Global Consumer Banking (GCB) consists of Citigroup's four geographical consumer banking businesses that provide traditional banking services to retail customers through retail banking, commercial banking, Citi-branded cards and Citi retail services (for additional information on these businesses, see "Citigroup Segments" above). GCB is a globally diversified business with 3,015 branches in 24 countries around the world as of June 30, 2015. At June 30, 2015, GCB had $395 billion of assets and $305 billion of deposits.
GCB 's overall strategy is to leverage Citi's global footprint and seek to be the preeminent bank for the emerging affluent and affluent consumers in large urban centers. In credit cards and in certain retail markets, Citi serves customers in a somewhat broader set of segments and geographies.
| Second Quarter |
| Six Months |
| ||||||||||||
In millions of dollars except as otherwise noted | 2015 | 2014 | % Change | 2015 | 2014 | % Change | ||||||||||
Net interest revenue | $ | 6,692 | | $ | 6,933 | | (3 | )% | $ | 13,393 | | $ | 13,734 | | (2 | )% |
Non-interest revenue | 1,857 | | 2,011 | | (8 | ) | 3,818 | | 4,054 | | (6 | ) | ||||
Total revenues, net of interest expense | $ | 8,549 | | $ | 8,944 | | (4 | )% | $ | 17,211 | | $ | 17,788 | | (3 | )% |
Total operating expenses | $ | 4,618 | | $ | 5,120 | | (10 | )% | $ | 9,170 | | $ | 9,991 | | (8 | )% |
Net credit losses | $ | 1,579 | | $ | 1,738 | | (9 | )% | $ | 3,130 | | $ | 3,470 | | (10 | )% |
Credit reserve build (release) | (103 | ) | (302 | ) | 66 | | (216 | ) | (515 | ) | 58 | | ||||
Provision (release) for unfunded lending commitments | (1 | ) | (3 | ) | 67 | | (2 | ) | (6 | ) | 67 | | ||||
Provision for benefits and claims | 21 | | 26 | | (19 | ) | 49 | | 67 | | (27 | ) | ||||
Provisions for credit losses and for benefits and claims | $ | 1,496 | | $ | 1,459 | | 3 | % | $ | 2,961 | | $ | 3,016 | | (2 | )% |
Income from continuing operations before taxes | $ | 2,435 | | $ | 2,365 | | 3 | % | $ | 5,080 | | $ | 4,781 | | 6 | % |
Income taxes | 805 | | 802 | | - | | 1,725 | | 1,544 | | 12 | | ||||
Income from continuing operations | $ | 1,630 | | $ | 1,563 | | 4 | % | $ | 3,355 | | $ | 3,237 | | 4 | % |
Noncontrolling interests | 5 | | 6 | | (17 | ) | - | | 13 | | (100 | ) | ||||
Net income | $ | 1,625 | | $ | 1,557 | | 4 | % | $ | 3,355 | | $ | 3,224 | | 4 | % |
Balance Sheet data (in billions of dollars) | | |
| | |
|
| | | |||||||
Average assets | $ | 394 | | $ | 409 | | (4 | )% | $ | 394 | | $ | 408 | | (3 | )% |
Return on average assets | 1.65 | % | 1.53 | % | | | 1.72 | % | 1.60 | % | | | ||||
Efficiency ratio | 54 | % | 57 | % | | | 53 | % | 56 | % | | | ||||
Total EOP assets | $ | 395 | | $ | 414 | | (5 | ) |
|
| | | ||||
Average deposits | 302 | | 308 | | (2 | ) | $ | 302 | | $ | 305 | | (1 | ) | ||
Net credit losses as a percentage of average loans | 2.24 | % | 2.39 | % | | | 2.23 | % | 2.42 | % | | | ||||
Revenue by business | | |
| | |
|
| | | |||||||
Retail banking | $ | 3,776 | | $ | 3,845 | | (2 | )% | $ | 7,550 | | $ | 7,634 | | (1 | )% |
Cards (1) | 4,773 | | 5,099 | | (6 | ) | 9,661 | | 10,154 | | (5 | ) | ||||
Total | $ | 8,549 | | $ | 8,944 | | (4 | )% | $ | 17,211 | | $ | 17,788 | | (3 | )% |
Income from continuing operations by business | | |
| | |
|
| | | |||||||
Retail banking | $ | 555 | | $ | 357 | | 55 | % | $ | 1,129 | | $ | 783 | | 44 | % |
Cards (1) | 1,075 | | 1,206 | | (11 | ) | 2,226 | | 2,454 | | (9 | ) | ||||
Total | $ | 1,630 | | $ | 1,563 | | 4 | % | $ | 3,355 | | $ | 3,237 | | 4 | % |
(Table continues on next page.)
13
Foreign currency (FX) translation impact |
|
| | |
|
|
| |||||||||
Total revenue-as reported | $ | 8,549 | | $ | 8,944 | | (4 | )% | $ | 17,211 | | $ | 17,788 | | (3 | )% |
Impact of FX translation (2) | - | | (485 | ) | | | - | | (857 | ) | | | ||||
Total revenues-ex-FX | $ | 8,549 | | $ | 8,459 | | 1 | % | $ | 17,211 | | $ | 16,931 | | 2 | % |
Total operating expenses-as reported | $ | 4,618 | | $ | 5,120 | | (10 | )% | $ | 9,170 | | $ | 9,991 | | (8 | )% |
Impact of FX translation (2) | - | | (296 | ) | | | - | | (509 | ) | | | ||||
Total operating expenses-ex-FX | $ | 4,618 | | $ | 4,824 | | (4 | )% | $ | 9,170 | | $ | 9,482 | | (3 | )% |
Total provisions for LLR & PBC-as reported | $ | 1,496 | | $ | 1,459 | | 3 | % | $ | 2,961 | | $ | 3,016 | | (2 | )% |
Impact of FX translation (2) | - | | (124 | ) | | | - | | (210 | ) | | | ||||
Total provisions for LLR & PBC-ex-FX | $ | 1,496 | | $ | 1,335 | | 12 | % | $ | 2,961 | | $ | 2,806 | | 6 | % |
Net income-as reported | $ | 1,625 | | $ | 1,557 | | 4 | % | $ | 3,355 | | $ | 3,224 | | 4 | % |
Impact of FX translation (2) | - | | (36 | ) | | | - | | (65 | ) | | | ||||
Net income-ex-FX | $ | 1,625 | | $ | 1,521 | | 7 | % | $ | 3,355 | | $ | 3,159 | | 6 | % |
(1) | Includes both Citi-branded cards and Citi retail services. |
(2) | Reflects the impact of foreign exchange (FX) translation into U.S. dollars at the second quarter of 2015 average exchange rates for all periods presented. |
NM Not meaningful
14
NORTH AMERICA GCB
North America GCB provides traditional banking and Citi-branded cards and Citi retail services to retail customers and small to mid-size businesses in the U.S. North America GCB 's 779 retail bank branches as of June 30, 2015 were largely concentrated in the greater metropolitan areas of New York, Chicago, Miami, Washington, D.C., Boston, Los Angeles and San Francisco.
At June 30, 2015, North America GCB had approximately 11.2 million retail banking customer accounts, $48.8 billion of retail banking loans and $173.5 billion of deposits. In addition, North America GCB had approximately 111.3 million Citi-branded and Citi retail services credit card accounts, with $107.7 billion in outstanding card loan balances.
| Second Quarter | % Change | Six Months | % Change | ||||||||||||
In millions of dollars, except as otherwise noted | 2015 | 2014 | 2015 | 2014 | ||||||||||||
Net interest revenue | $ | 4,280 | | $ | 4,211 | | 2 | % | $ | 8,585 | | $ | 8,398 | | 2 | % |
Non-interest revenue | 543 | | 576 | | (6 | ) | 1,232 | | 1,179 | | 4 | | ||||
Total revenues, net of interest expense | $ | 4,823 | | $ | 4,787 | | 1 | % | $ | 9,817 | | $ | 9,577 | | 3 | % |
Total operating expenses | $ | 2,267 | | $ | 2,349 | | (3 | )% | $ | 4,559 | | $ | 4,788 | | (5 | )% |
Net credit losses | $ | 1,000 | | $ | 1,072 | | (7 | )% | $ | 1,961 | | $ | 2,174 | | (10 | )% |
Credit reserve build (release) | (109 | ) | (397 | ) | 73 | | (209 | ) | (668 | ) | 69 | | ||||
Provisions for benefits and claims | 9 | | 11 | | (18 | ) | 19 | | 18 | | 6 | | ||||
Provision for unfunded lending commitments | - | | 1 | | (100 | ) | 1 | | 3 | | (67 | ) | ||||
Provisions for credit losses and for benefits and claims | $ | 900 | | $ | 687 | | 31 | % | $ | 1,772 | | $ | 1,527 | | 16 | % |
Income from continuing operations before taxes | $ | 1,656 | | $ | 1,751 | | (5 | )% | $ | 3,486 | | $ | 3,262 | | 7 | % |
Income taxes | 589 | | 677 | | (13 | ) | 1,279 | | 1,170 | | 9 | | ||||
Income from continuing operations | $ | 1,067 | | $ | 1,074 | | (1 | )% | $ | 2,207 | | $ | 2,092 | | 5 | % |
Noncontrolling interests | (1 | ) | (1 | ) | - | | (1 | ) | (1 | ) | - | | ||||
Net income | $ | 1,068 | | $ | 1,075 | | (1 | )% | $ | 2,208 | | $ | 2,093 | | 5 | % |
Balance Sheet data (in billions of dollars) | | |
| | |
|
| | | | ||||||
Average assets | $ | 206 | | $ | 209 | | (1 | )% | $ | 207 | | $ | 210 | | (1 | )% |
Return on average assets | 2.08 | % | 2.06 | % | | | 2.15 | % | 2.01 | % | | | ||||
Efficiency ratio | 47 | % | 49 | % | | | 46 | % | 50 | % | | | ||||
Average deposits | $ | 170.9 | | $ | 171.0 | | - | | $ | 171.3 | | $ | 170.9 | | - | |
Net credit losses as a percentage of average loans | 2.59 | % | 2.78 | % | | | 2.55 | % | 2.82 | % | | | ||||
Revenue by business | | |
| | |
|
| | | | ||||||
Retail banking | $ | 1,307 | | $ | 1,177 | | 11 | % | $ | 2,655 | | $ | 2,321 | | 14 | % |
Citi-branded cards | 1,933 | | 2,029 | | (5 | ) | 3,942 | | 4,050 | | (3 | ) | ||||
Citi retail services | 1,583 | | 1,581 | | - | | 3,220 | | 3,206 | | - | | ||||
Total | $ | 4,823 | | $ | 4,787 | | 1 | % | $ | 9,817 | | $ | 9,577 | | 3 | % |
Income from continuing operations by business | | |
| | |
|
| | | | ||||||
Retail banking | $ | 189 | | $ | 90 | | NM | | $ | 386 | | $ | 108 | | NM | |
Citi-branded cards | 499 | | 555 | | (10 | ) | 1,038 | | 1,119 | | (7 | ) | ||||
Citi retail services | 379 | | 429 | | (12 | ) | 783 | | 865 | | (9 | ) | ||||
Total | $ | 1,067 | | $ | 1,074 | | (1 | )% | $ | 2,207 | | $ | 2,092 | | 5 | % |
NM Not meaningful
15
2Q15 vs. 2Q14
Net income decreased 1% due to a lower net loan loss reserve release, partially offset by higher revenues, lower expenses and lower net credit losses.
Revenues increased 1%, primarily reflecting higher revenues in retail banking, largely offset by lower revenues in Citi-branded cards. Net interest revenue increased 2%, primarily due to continued volume growth in retail banking and improved deposit spreads, which more than offset continued lower average loans in Citi-branded cards. Non-interest revenue decreased 6%, largely driven by higher customer rewards costs in Citi-branded cards, partially offset by higher mortgage origination revenues due to higher U.S. mortgage refinancing activity. The decrease in non-interest revenues was also due to a continued decline in Citi retail services non-interest revenues, primarily reflecting higher contractual partner payments.
Retail banking revenues increased 11% due to 7% growth in average loans, 7% growth in checking deposits, improved deposit spreads and the higher mortgage origination revenues. This growth occurred despite the fact that, consistent with GCB 's strategy, since the second quarter of 2014, North America GCB closed or sold 133 branches (a 15% decline from the prior-year period). Increasing interest rates could negatively impact mortgage revenues going forward.
Cards revenues declined 3% due to a 3% decrease in average loans, partially offset by a 3% increase in purchase sales. In Citi-branded cards, revenues decreased 5% as the continued impact of lower average loans (down 5%) and the higher customer rewards costs were partially offset by a 5% increase in purchase sales and an improvement in spreads. The decline in average loans was driven primarily by the continued reduction in promotional balances and, to a lesser extent, increased customer payment rates.
Citi retail services revenues were unchanged, as the impact of higher spreads was offset by the continued impact of lower fuel prices on purchase sales and the higher contractual partner payments. Purchase sales in Citi retail services decreased 1% from the prior-year period, largely due to the impact of lower fuel prices.
Expenses decreased 3% as ongoing cost reduction initiatives, including as a result of North America GCB's branch rationalization strategy, were partially offset by increased investment spending. North America GCB expects increased investment spending to continue during the remainder of 2015, primarily in U.S. branded cards.
Provisions increased 31% due to lower net loan loss reserve releases (73%), partially offset by lower net credit losses (7%). Net credit losses declined in Citi-branded cards (down 12% to $503 million) and in Citi retail services (down 2% to $457 million). The lower net loan loss reserve release reflected continued stabilization in the cards portfolios.
2015 YTD vs. 2014 YTD
Year-to-date, North America GCB has experienced similar trends to those described above. Net income increased 5% due to higher revenues, lower expenses and lower net credit losses, partially offset by a lower net loan loss reserve release.
Revenues increased 3%, primarily reflecting higher revenues in retail banking, partially offset by lower revenues in Citi-branded cards. Retail banking revenues increased 14% due to 7% growth in average loans, a gain on sale of approximately $110 million related to the sale of branches in Texas compared to a gain of approximately $70 million related to a sale-leaseback transaction in the prior-year period, the higher mortgage origination revenues and improved deposit spreads. Cards revenues decreased 1%, as Citi-branded cards, revenues decreased 3% and Citi retail services revenues were unchanged, driven by the same factors described above.
Expenses decreased 5%, driven by the same factors described above.
Provisions increased 16% due to the lower net loan loss reserve releases (69%), partially offset by lower net credit losses (10%) driven by cards.
16
LATIN AMERICA GCB
Latin America GCB provides traditional banking and Citi-branded card services to retail customers and small to mid-size businesses, with the largest presence in Mexico and Brazil. Latin America GCB includes branch networks throughout Latin America as well as Banco Nacional de Mexico, or Banamex, Mexico's second-largest bank, with 1,497 branches as of June 30, 2015.
At June 30, 2015, Latin America GCB had 1,699 retail branches, with approximately 30.7 million retail banking customer accounts, $25.7 billion in retail banking loans and $42.1 billion in deposits. In addition, the business had approximately 8.0 million Citi-branded card accounts with $8.3 billion in outstanding loan balances.
| Second Quarter | % Change | Six Months | % Change | ||||||||||||
In millions of dollars, except as otherwise noted | 2015 | 2014 | 2015 | 2014 | ||||||||||||
Net interest revenue | $ | 1,241 | | $ | 1,432 | | (13 | )% | $ | 2,483 | | $ | 2,796 | | (11 | )% |
Non-interest revenue | 607 | | 704 | | (14 | ) | 1,200 | | 1,423 | | (16 | ) | ||||
Total revenues, net of interest expense | $ | 1,848 | | $ | 2,136 | | (13 | )% | $ | 3,683 | | $ | 4,219 | | (13 | )% |
Total operating expenses | $ | 1,162 | | $ | 1,254 | | (7 | )% | $ | 2,242 | | $ | 2,457 | | (9 | )% |
Net credit losses | $ | 392 | | $ | 454 | | (14 | )% | $ | 809 | | $ | 890 | | (9 | )% |
Credit reserve build (release) | 7 | | 109 | | (94 | ) | 29 | | 160 | | (82 | ) | ||||
Provision (release) for unfunded lending commitments | 3 | | 1 | | NM | | - | | - | | (100 | ) | ||||
Provision for benefits and claims | 12 | | 15 | | (20 | ) | 30 | | 49 | | (39 | ) | ||||
Provisions for credit losses and for benefits and claims (LLR & PBC) | $ | 414 | | $ | 579 | | (28 | )% | $ | 868 | | $ | 1,099 | | (21 | )% |
Income from continuing operations before taxes | $ | 272 | | $ | 303 | | (10 | )% | $ | 573 | | $ | 663 | | (14 | )% |
Income taxes | 47 | | 28 | | 68 | | 104 | | 97 | | 7 | | ||||
Income from continuing operations | $ | 225 | | $ | 275 | | (18 | )% | $ | 469 | | $ | 566 | | (17 | )% |
Noncontrolling interests | 2 | | 2 | | - | | 2 | | 4 | | (50 | ) | ||||
Net income | $ | 223 | | $ | 273 | | (18 | )% | $ | 467 | | $ | 562 | | (17 | )% |
Balance Sheet data (in billions of dollars) | | |
| | |
|
| | | | ||||||
Average assets | $ | 66 | | $ | 77 | | (14 | )% | $ | 67 | | $ | 77 | | (13 | )% |
Return on average assets | 1.36 | % | 1.42 | % | | | 1.41 | % | 1.49 | % | | | ||||
Efficiency ratio | 63 | % | 59 | % | | | 61 | % | 58 | % | | | ||||
Average deposits | $ | 41.7 | | $ | 45.2 | | (8 | ) | $ | 42.0 | | $ | 44.5 | | (6 | ) |
Net credit losses as a percentage of average loans | 4.60 | % | 4.63 | % | | | 4.74 | % | 4.71 | % | | | ||||
Revenue by business | | |
| | |
|
| | | |||||||
Retail banking | $ | 1,269 | | $ | 1,431 | | (11 | )% | $ | 2,520 | | $ | 2,851 | | (12 | )% |
Citi-branded cards | 579 | | 705 | | (18 | ) | 1,163 | | 1,368 | | (15 | ) | ||||
Total | $ | 1,848 | | $ | 2,136 | | (13 | )% | $ | 3,683 | | $ | 4,219 | | (13 | )% |
Income from continuing operations by business | | |
| | |
|
| | | | ||||||
Retail banking | $ | 143 | | $ | 206 | | (31 | )% | $ | 297 | | $ | 410 | | (28 | )% |
Citi-branded cards | 82 | | 69 | | 19 | | 172 | | 156 | | 10 | | ||||
Total | $ | 225 | | $ | 275 | | (18 | )% | $ | 469 | | $ | 566 | | (17 | )% |
Foreign currency (FX) translation impact | | |
| | |
|
| | | | ||||||
Total revenues-as reported | $ | 1,848 | | $ | 2,136 | | (13 | )% | $ | 3,683 | | $ | 4,219 | | (13 | )% |
Impact of FX translation (1) | - | | (341 | ) | | | - | | (596 | ) | | | ||||
Total revenues-ex-FX | $ | 1,848 | | $ | 1,795 | | 3 | % | $ | 3,683 | | $ | 3,623 | | 2 | % |
Total operating expenses-as reported | $ | 1,162 | | $ | 1,254 | | (7 | )% | $ | 2,242 | | $ | 2,457 | | (9 | )% |
Impact of FX translation (1) | - | | (180 | ) | | | - | | (312 | ) | | | ||||
Total operating expenses-ex-FX | $ | 1,162 | | $ | 1,074 | | 8 | % | $ | 2,242 | | $ | 2,145 | | 5 | % |
Provisions for LLR & PBC-as reported | $ | 414 | | $ | 579 | | (28 | )% | $ | 868 | | $ | 1,099 | | (21 | )% |
Impact of FX translation (1) | - | | (100 | ) | | | - | | (169 | ) | | | ||||
Provisions for LLR & PBC-ex-FX | $ | 414 | | $ | 479 | | (14 | )% | $ | 868 | | $ | 930 | | (7 | )% |
Net income-as reported | $ | 223 | | $ | 273 | | (18 | )% | $ | 467 | | $ | 562 | | (17 | )% |
Impact of FX translation (1) | - | | (38 | ) | | | - | | (62 | ) | | | ||||
Net income-ex-FX | $ | 223 | | $ | 235 | | (5 | )% | $ | 467 | | $ | 500 | | (7 | )% |
(1) | Reflects the impact of foreign exchange (FX) translation into U.S. dollars at the second quarter of 2015 average exchange rates for all periods presented. |
NM Not Meaningful
17
The discussion of the results of operations for Latin America GCB below excludes the impact of FX translation for all periods presented. Presentations of the results of operations, excluding the impact of FX translation, are non-GAAP financial measures. For a reconciliation of certain of these metrics to the reported results, see the table above.
2Q15 vs. 2Q14
Net income decreased 5%, primarily due to higher expenses, partially offset by higher revenues and lower credit costs.
Revenues increased 3%, primarily due to modest volume growth in Mexico (2% increase in average loans and 5% increase in average deposits), partially offset by the impact of the sale of the Honduras consumer business in the prior-year period. Net interest revenue increased 4% due to loan and deposit growth and stable spreads in Mexico, partially offset by ongoing spread compression in other Latin America markets and the impact of the sale of the Honduras consumer business in the prior-year period. Non-interest revenue increased 1%, primarily driven by investment sales in Mexico, partially offset by the impact of the sale of the Honduras consumer business in the prior-year period.
Retail banking revenues increased 5%, primarily due to the volume growth in Mexico, as increases in average loans, and average deposits were partially offset by the impact of the sale of the Honduras consumer business in the prior-year period. Cards revenues decreased 1%, primarily due to lower growth in Mexico due to declines in average loans resulting from the previously disclosed fiscal reforms, which is expected to continue in the near term.
Slow economic growth in the region, including continued weaker economic growth in Mexico, could continue to negatively impact revenue growth in Latin America GCB during the remainder of 2015.
Expenses increased 8%, primarily due to higher legal and related expenses, mandatory salary increases in certain countries, increased regulatory and compliance spending and technology infrastructure upgrades, partially offset by efficiency savings.
Provisions decreased 14%, primarily due to a lower net loan loss reserve build, partially offset by higher net credit losses. Net credit losses increased 4%, primarily driven by portfolio growth. The net loan loss reserve build declined 92% due to a lower build related to Mexico cards.
Argentina/Venezuela
For additional information on Citi's exposures and risks in Argentina and Venezuela, see "Risk Factors" in Citi's 2014 Annual Report on Form 10-K and "Managing Global Risk-Country and Cross-Border Risk" below.
2015 YTD vs. 2014 YTD
Year-to-date, Latin America GCB has experienced similar trends to those described above. Net income decreased 7%, primarily due to higher expenses, partially offset by higher revenues and lower credit costs.
Revenues increased 2%, primarily due to higher volume growth in Mexico (1% increase in average loans and 7% increase in average deposits), partially offset by the impact of business divestitures in the prior-year period, including the sale of the Honduras consumer business in the second quarter of 2014 and the partial sale of Citi's indirect investment in Banco de Chile in the first quarter of 2014. Net interest revenue increased 4% due to loan and deposit growth and stable spreads in Mexico, partially offset by ongoing spread compression in other Latin America markets and the impact of the business divestitures in the prior-year period. Non-interest revenue decreased 3%, primarily due to the impact of the business divestitures in the prior-year period. Retail banking revenues increased 2%, driven by the same factors described above as well as the partial sale of Citi's indirect investment in Banco de Chile in the prior-year period. Cards revenues were unchanged, as modest growth in Mexico was largely offset by declines in other Latin America markets.
Expenses increased 5%, driven by the factors described above.
Provisions decreased 7%, primarily due to a lower net loan loss reserve build, partially offset by higher net credit losses. Net credit losses increased 7%, primarily driven by portfolio growth and continued seasoning in the Mexico cards portfolio. The net loan loss reserve build declined 79% due to a lower build related to Mexico cards, partially offset by a build in Brazil commercial banking.
18
ASIA GCB
Asia GCB provides traditional banking and Citi-branded card services to retail customers and small to mid-size businesses, with the largest Citi presence in Korea, Singapore, Hong Kong, Australia, Taiwan, India, Thailand, Indonesia, Malaysia and the Philippines as of June 30, 2015. In addition, for reporting purposes, Asia GCB includes the results of operations of EMEA GCB , which provides traditional banking and Citi-branded card services to retail customers and small to mid-size businesses, primarily in Poland, Russia and the United Arab Emirates.
At June 30, 2015, on a combined basis, the businesses had 537 retail branches, approximately 17.5 million retail banking customer accounts, $75.3 billion in retail banking loans and $89.6 billion in deposits. In addition, the businesses had approximately 17.3 million Citi-branded card accounts with $18.1 billion in outstanding loan balances.
| Second Quarter | % Change | Six Months | % Change | ||||||||||||
In millions of dollars, except as otherwise noted (1) | 2015 | 2014 | 2015 | 2014 | ||||||||||||
Net interest revenue | $ | 1,171 | | $ | 1,290 | | (9 | )% | $ | 2,325 | | $ | 2,540 | | (8 | )% |
Non-interest revenue | 707 | | 731 | | (3 | ) | 1,386 | | 1,452 | | (5 | ) | ||||
Total revenues, net of interest expense | $ | 1,878 | | $ | 2,021 | | (7 | )% | $ | 3,711 | | $ | 3,992 | | (7 | )% |
Total operating expenses | $ | 1,189 | | $ | 1,517 | | (22 | )% | $ | 2,369 | | $ | 2,746 | | (14 | )% |
Net credit losses | $ | 187 | | $ | 212 | | (12 | )% | $ | 360 | | $ | 406 | | (11 | )% |
Credit reserve build (release) | (1 | ) | (14 | ) | 93 | | (36 | ) | (7 | ) | NM | | ||||
Provision for unfunded lending commitments | (4 | ) | (5 | ) | 20 | | (3 | ) | (9 | ) | 67 | | ||||
Provisions for credit losses | $ | 182 | | $ | 193 | | (6 | )% | $ | 321 | | $ | 390 | | (18 | )% |
Income from continuing operations before taxes | $ | 507 | | $ | 311 | | 63 | % | $ | 1,021 | | $ | 856 | | 19 | % |
Income taxes | 169 | | 97 | | 74 | | 342 | | 277 | | 23 | | ||||
Income from continuing operations | $ | 338 | | $ | 214 | | 58 | % | $ | 679 | | $ | 579 | | 17 | % |
Noncontrolling interests | 4 | | 5 | | (20 | ) | (1 | ) | 10 | | NM | | ||||
Net income | $ | 334 | | $ | 209 | | 60 | % | $ | 680 | | $ | 569 | | 20 | % |
Balance Sheet data (in billions of dollars) | | | | | | |
|
| | | | |||||
Average assets | $ | 122 | | $ | 123 | | (1 | )% | $ | 120 | | $ | 122 | | (2 | )% |
Return on average assets | 1.10 | % | 0.68 | % | | | 1.14 | % | 0.94 | % | | | ||||
Efficiency ratio | 63 | % | 75 | % |
| 64 | % | 69 | % | | | |||||
Average deposits | $ | 89.5 | | $ | 91.3 | | (2 | ) | $ | 89.0 | | $ | 89.9 | | (1 | ) |
Net credit losses as a percentage of average loans | 0.80 | % | 0.87 | % | | | 0.78 | % | 0.85 | % | | | ||||
Revenue by business |
|
|
|
|
| | | |||||||||
Retail banking | $ | 1,200 | | $ | 1,237 | | (3 | )% | $ | 2,375 | | $ | 2,462 | | (4 | )% |
Citi-branded cards | 678 | | 784 | | (14 | ) | 1,336 | | 1,530 | | (13 | ) | ||||
Total | $ | 1,878 | | $ | 2,021 | | (7 | )% | $ | 3,711 | | $ | 3,992 | | (7 | )% |
Income from continuing operations by business | | | | | | |
|
| | | ||||||
Retail banking | $ | 223 | | $ | 61 | | NM | | $ | 446 | | $ | 265 | | 68 | % |
Citi-branded cards | 115 | | 153 | | (25 | ) | 233 | | 314 | | (26 | ) | ||||
Total | $ | 338 | | $ | 214 | | 58 | % | $ | 679 | | $ | 579 | | 17 | % |
19
Foreign currency (FX) translation impact | | | | | | |
|
| | | ||||||
Total revenues-as reported | $ | 1,878 | | $ | 2,021 | | (7 | )% | $ | 3,711 | | $ | 3,992 | | (7 | )% |
Impact of FX translation (2) | - | | (144 | ) | | | - | | (261 | ) | | | ||||
Total revenues-ex-FX | $ | 1,878 | | $ | 1,877 | | - | % | $ | 3,711 | | $ | 3,731 | | (1 | )% |
Total operating expenses-as reported | $ | 1,189 | | $ | 1,517 | | (22 | )% | $ | 2,369 | | $ | 2,746 | | (14 | )% |
Impact of FX translation (2) | - | | (116 | ) | | | - | | (197 | ) | | | ||||
Total operating expenses-ex-FX | $ | 1,189 | | $ | 1,401 | | (15 | )% | $ | 2,369 | | $ | 2,549 | | (7 | )% |
Provisions for loan losses-as reported | $ | 182 | | $ | 193 | | (6 | )% | $ | 321 | | $ | 390 | | (18 | )% |
Impact of FX translation (2) | - | | (24 | ) | | | - | | (41 | ) | | | ||||
Provisions for loan losses-ex-FX | $ | 182 | | $ | 169 | | 8 | % | $ | 321 | | $ | 349 | | (8 | )% |
Net income-as reported | $ | 334 | | $ | 209 | | 60 | % | $ | 680 | | $ | 569 | | 20 | % |
Impact of FX translation (2) | - | | 2 | | | | - | | (3 | ) | | | ||||
Net income-ex-FX | $ | 334 | | $ | 211 | | 58 | % | $ | 680 | | $ | 566 | | 20 | % |
(1) | For reporting purposes, Asia GCB includes the results of operations of EMEA GCB for all periods presented. |
(2) | Reflects the impact of foreign exchange (FX) translation into U.S. dollars at the second quarter of 2015 average exchange rates for all periods presented. |
NM | Not meaningful |
The discussion of the results of operations for Asia GCB below excludes the impact of FX translation for all periods presented. Presentations of the results of operations, excluding the impact of FX translation, are non-GAAP financial measures. For a reconciliation of certain of these metrics to the reported results, see the table above.
2Q15 vs. 2Q14
Net income increased 58%, primarily due to lower expenses, partially offset by higher credit costs.
Revenues were unchanged. Non-interest revenue increased 2%, primarily driven by higher fee revenues. Net interest revenue declined 1%, driven by the ongoing impact of regulatory changes and continued spread compression.
Retail banking revenues increased 3%, primarily due to higher insurance fee revenues and volumes, as investment sales increased 41% reflecting market trends, average retail deposits increased 5% and average retail loans increased 2%, partially offset by continued spread compression and regulatory changes.
Cards revenues decreased 5% driven by the ongoing impact of spread compression, continued higher payment rates and the impact of regulatory changes, particularly in Singapore, Taiwan, Australia and Poland, partially offset by volume growth (4% increase in average loans and a 5% increase in purchase sales). While Citi could continue to experience a negative impact on Asia cards revenues from spread compression and regulatory changes in several markets, it continues to believe these impacts could abate somewhat in the second half of 2015.
Expenses decreased 15%, largely due to the absence of approximately $270 million of repositioning charges in Korea in the prior year period and efficiency savings, partially offset by higher investment spending, regulatory and compliance costs and volume-related growth.
Provisions increased 8%, primarily due to a lower net loan loss reserve release, partially offset by lower net credit losses.
Russia
For additional information on Citi's exposures and risks in Russia, see " EMEA GCB " and "Risk Factors" in Citi's 2014 Annual Report on Form 10-K and "Managing Global Risk-Country and Cross-Border Risk" below.
2015 YTD vs. 2014 YTD
Year-to-date, Asia GCB has experienced similar trends to those described above. Net income increased 20%, primarily due to lower expenses and lower credit costs, partially offset by lower revenues.
Revenues decreased 1%. Non-interest revenue increased 1%, primarily driven by higher fee revenues. Net interest revenue declined 1%, driven by the ongoing impact of regulatory changes and continued spread compression. Retail banking revenues increased 2%, driven by the same factors described above. Cards revenues decreased 5%, driven by the same factors described above.
Expenses decreased 7%, driven by the same factors described above.
Provisions decreased 8%, primarily due to a higher net loan loss reserve release and lower net credit losses.
20
INSTITUTIONAL CLIENTS GROUP
Institutional Clients Group (ICG) provides corporate, institutional, public sector and high-net-worth clients around the world with a full range of wholesale banking products and services, including fixed income and equity sales and trading, foreign exchange, prime brokerage, derivative services, equity and fixed income research, corporate lending, investment banking and advisory services, private banking, cash management, trade finance and securities services. ICG transacts with clients in both cash instruments and derivatives, including fixed income, foreign currency, equity and commodity products.
ICG revenue is generated primarily from fees and spreads associated with these activities. ICG earns fee income for assisting clients in clearing transactions, providing brokerage and investment banking services and other such activities. Revenue generated from these activities is recorded in Commissions and fees and Investment banking . In addition, as a market maker, ICG facilitates transactions, including holding product inventory to meet client demand, and earns the differential between the price at which it buys and sells the products. These price differentials and the unrealized gains and losses on the inventory are recorded in Principal transactions . Interest income earned on inventory and loans held less interest paid to customers on deposits is recorded as Net interest revenue . Revenue is also generated from transaction processing and assets under custody and administration.
ICG 's international presence is supported by trading floors in approximately 80 countries and a proprietary network in over 95 countries and jurisdictions. At June 30, 2015, ICG had approximately $1.3 trillion of assets and $588 billion of deposits, while two of its businesses, securities services and issuer services, managed approximately $15.5 trillion of assets under custody compared to $15.4 trillion at the end of the prior-year period.
| Second Quarter | % Change | Six Months | % Change | ||||||||||||
In millions of dollars, except as otherwise noted | 2015 | 2014 | 2015 | 2014 | ||||||||||||
Commissions and fees | $ | 986 | | $ | 992 | | (1 | )% | $ | 1,981 | | $ | 2,006 | | (1 | )% |
Administration and other fiduciary fees | 658 | | 651 | | 1 | % | 1,266 | | 1,275 | | (1 | ) | ||||
Investment banking | 1,120 | | 1,257 | | (11 | )% | 2,254 | | 2,214 | | 2 | | ||||
Principal transactions | 1,797 | | 1,577 | | 14 | % | 3,995 | | 4,180 | | (4 | ) | ||||
Other | 166 | | 104 | | 60 | % | 415 | | 243 | | 71 | | ||||
Total non-interest revenue | $ | 4,727 | | $ | 4,581 | | 3 | % | $ | 9,911 | | $ | 9,918 | | - | % |
Net interest revenue (including dividends) | 4,151 | | 3,821 | | 9 | % | 7,995 | | 7,638 | | 5 | | ||||
Total revenues, net of interest expense | $ | 8,878 | | $ | 8,402 | | 6 | % | $ | 17,906 | | $ | 17,556 | | 2 | % |
Total operating expenses | $ | 4,821 | | $ | 4,743 | | 2 | % | $ | 9,453 | | $ | 9,601 | | (2 | )% |
Net credit losses | $ | 83 | | $ | 9 | | NM | | $ | 81 | | $ | 143 | | (43 | )% |
Credit reserve release | (132 | ) | (96 | ) | (38 | )% | (25 | ) | (183 | ) | 86 | | ||||
Provision (release) for unfunded lending commitments | (46 | ) | (25 | ) | (84 | )% | (77 | ) | (45 | ) | (71 | ) | ||||
Provisions for credit losses | $ | (95 | ) | $ | (112 | ) | 15 | % | $ | (21 | ) | $ | (85 | ) | 75 | % |
Income from continuing operations before taxes | $ | 4,152 | | $ | 3,771 | | 10 | % | $ | 8,474 | | $ | 8,040 | | 5 | % |
Income taxes | 1,317 | | 1,205 | | 9 | % | 2,675 | | 2,526 | | 6 | | ||||
Income from continuing operations | $ | 2,835 | | $ | 2,566 | | 10 | % | $ | 5,799 | | $ | 5,514 | | 5 | % |
Noncontrolling interests | 15 | | 19 | | (21 | )% | 51 | | 45 | | 13 | | ||||
Net income | $ | 2,820 | | $ | 2,547 | | 11 | % | $ | 5,748 | | $ | 5,469 | | 5 | % |
Average assets (in billions of dollars) | $ | 1,279 | | $ | 1,290 | | (1 | )% | $ | 1,277 | | $ | 1,286 | | (1 | )% |
Return on average assets | 0.88 | % | 0.79 | % | | | 0.91 | % | 0.86 | % | | | ||||
Efficiency ratio | 54 | % | 56 | % | | | 53 | % | 55 | % | | | ||||
CVA/DVA after-tax | $ | 190 | | $ | (20 | ) | NM | | $ | 146 | | $ | (24 | ) | NM | |
Net income ex-CVA/DVA | $ | 2,630 | | $ | 2,567 | | 2 | % | $ | 5,602 | | $ | 5,493 | | 2 | % |
Revenues by region |
|
| | |
|
| | | ||||||||
North America | $ | 3,285 | | $ | 3,154 | | 4 | % | $ | 6,588 | | $ | 6,715 | | (2 | )% |
EMEA | 2,543 | | 2,430 | | 5 | % | 5,306 | | 5,201 | | 2 | | ||||
Latin America | 1,111 | | 1,149 | | (3 | )% | 2,176 | | 2,250 | | (3 | ) | ||||
Asia | 1,939 | | 1,669 | | 16 | % | 3,836 | | 3,390 | | 13 | | ||||
Total | $ | 8,878 | | $ | 8,402 | | 6 | % | $ | 17,906 | | $ | 17,556 | | 2 | % |
21
Income from continuing operations by region |
|
| | |
|
| | | | |||||||
North America | $ | 978 | | $ | 1,096 | | (11 | )% | $ | 1,993 | | $ | 2,401 | | (17 | )% |
EMEA | 684 | | 570 | | 20 | % | 1,541 | | 1,362 | | 13 | | ||||
Latin America | 470 | | 427 | | 10 | % | 883 | | 767 | | 15 | | ||||
Asia | 703 | | 473 | | 49 | % | 1,382 | | 984 | | 40 | | ||||
Total | $ | 2,835 | | $ | 2,566 | | 10 | % | $ | 5,799 | | $ | 5,514 | | 5 | % |
Average loans by region (in billions of dollars) |
|
| | |
|
| | | | |||||||
North America | $ | 122 | | $ | 109 | | 12 | % | $ | 119 | | $ | 108 | | 10 | % |
EMEA | 60 | | 59 | | 2 | % | 59 | | 58 | | 2 | | ||||
Latin America | 39 | | 41 | | (5 | )% | 39 | | 41 | | (5 | ) | ||||
Asia | 63 | | 70 | | (10 | )% | 63 | | 69 | | (9 | ) | ||||
Total | $ | 284 | | $ | 279 | | 2 | % | $ | 280 | | $ | 276 | | 1 | % |
EOP deposits by business (in billions of dollars) |
|
|
|
|
| | | |||||||||
Treasury and trade solutions | $ | 398 | | $ | 384 | | 4 | % |
|
| | | ||||
All other ICG businesses | 190 | | 188 | | 1 | % | | | | | | | ||||
Total | $ | 588 | | $ | 572 | | 3 | % | | | | | | | ||
ICG Revenue Details-Excluding CVA/DVA and Gain/(Loss) on Loan Hedges
| Second Quarter | % Change | Six Months | % Change | ||||||||||||
In millions of dollars | 2015 | 2014 | 2015 | 2014 | ||||||||||||
Investment banking revenue details |
|
|
|
|
|
| ||||||||||
Advisory | $ | 258 | | $ | 193 | | 34 | % | $ | 556 | | $ | 368 | | 51 | % |
Equity underwriting | 296 | | 397 | | (25 | ) | 527 | | 696 | | (24 | ) | ||||
Debt underwriting | 729 | | 749 | | (3 | ) | 1,398 | | 1,328 | | 5 | | ||||
Total investment banking | $ | 1,283 | | $ | 1,339 | | (4 | )% | $ | 2,481 | | $ | 2,392 | | 4 | % |
Treasury and trade solutions | 1,955 | | 1,980 | | (1 | ) | 3,844 | | 3,901 | | (1 | ) | ||||
Corporate lending - excluding gain/(loss) on loan hedges | 445 | | 456 | | (2 | ) | 890 | | 872 | | 2 | | ||||
Private bank | 746 | | 658 | | 13 | | 1,454 | | 1,328 | | 9 | | ||||
Total banking revenues (ex-CVA/DVA and gain/(loss) on loan hedges) | $ | 4,429 | | $ | 4,433 | | - | % | $ | 8,669 | | $ | 8,493 | | 2 | % |
Corporate lending - gain/(loss) on loan hedges (1) | $ | (66 | ) | $ | (44 | ) | (50 | )% | $ | (14 | ) | $ | (61 | ) | 77 | % |
Total banking revenues (ex-CVA/DVA and including gain/(loss) on loan hedges) | $ | 4,363 | | $ | 4,389 | | (1 | )% | $ | 8,655 | | $ | 8,432 | | 3 | % |
Fixed income markets | $ | 3,062 | | $ | 3,080 | | (1 | )% | $ | 6,545 | | $ | 7,009 | | (7 | )% |
Equity markets | 653 | | 659 | | (1 | ) | 1,526 | | 1,541 | | (1 | ) | ||||
Securities services | 557 | | 521 | | 7 | | 1,100 | | 1,006 | | 9 | | ||||
Other | (60 | ) | (215 | ) | 72 | | (154 | ) | (393 | ) | 61 | | ||||
Total Markets and securities services (ex-CVA/DVA) | $ | 4,212 | | $ | 4,045 | | 4 | % | $ | 9,017 | | $ | 9,163 | | (2 | )% |
Total ICG (ex-CVA/DVA) | $ | 8,575 | | $ | 8,434 | | 2 | % | $ | 17,672 | | $ | 17,595 | | - | % |
CVA/DVA (excluded as applicable in lines above) (2) | 303 | | (32 | ) | NM | | 234 | | (39 | ) | NM | | ||||
Fixed income markets | 283 | | (36 | ) | NM | | 207 | | (62 | ) | NM | | ||||
Equity markets | 21 | | 4 | | NM | | 24 | | 20 | | 20 | | ||||
Private bank | (1 | ) | - | | - | | 3 | | 3 | | - | | ||||
Total revenues, net of interest expense | $ | 8,878 | | $ | 8,402 | | 6 | % | $ | 17,906 | | $ | 17,556 | | 2 | % |
(1) | Hedges on accrual loans reflect the mark-to-market on credit derivatives used to economically hedge the corporate loan accrual portfolio. The fixed premium costs of these hedges are netted against the corporate lending revenues to reflect the cost of credit protection. |
(2) | Funding valuation adjustments (FVA) is included within CVA for presentation purposes. For additional information, see Note 22 to the Consolidated Financial Statements. |
NM Not meaningful
22
The discussion of the results of operations for ICG below excludes the impact of CVA/DVA for all periods presented. Presentations of the results of operations, excluding the impact of CVA/DVA and the impact of gains/(losses) on hedges on accrual loans, are non-GAAP financial measures. For a reconciliation of these metrics to the reported results, see the table above.
2Q15 vs. 2Q14
Net income increased 2%, primarily driven by higher revenues, partially offset by higher expenses and an increase in the cost of credit.
• | Revenues increased 2%, reflecting higher revenues in Markets and securities services (increase of 4%) as Banking revenues were largely unchanged (excluding the gains/(losses) on hedges on accrual loans). |
Within Banking :
• | Investment banking revenues decreased 4% reflecting lower underwriting activity as compared to very strong performance in the prior-year period, consistent with overall market trends. Advisory revenues increased 34%, reflecting increased wallet share and strength in the overall M&A market. Equity underwriting revenues decreased 25% due to the particularly strong market performance in the prior-year period and a decline in wallet share resulting from continued share fragmentation. Debt underwriting revenues decreased 3%, as a decline in overall wallet share and lower market activity in EMEA was partially offset by increased revenues in North America . |
• | Treasury and trade solutions revenues decreased 1%. Excluding the impact of FX translation, revenues increased 5%, as continued growth in deposit balances and improved spreads, particularly in North America , were partially offset by lower activity and the continued impact of spread compression in trade, particularly in Asia . End-of-period deposit balances increased 4%. Excluding the impact of FX translation, end-of-period deposits increased 9%, particularly in North America . Average trade loans decreased 12%. Excluding the impact of FX translation, average trade loans decreased 9%, as the spread compression in trade, particularly in Asia , led to a reduction of on-balance sheet loans while Citi continued to support new originations for its clients. |
• | Corporate lending revenues decreased 8%. Excluding the impact of gains/(losses) on hedges on accrual loans, revenues decreased 2% versus the prior-year period. Excluding the impact of FX translation, corporate lending revenues increased 4%, as continued growth in average loan balances and lower hedge premium costs were partially offset by lower spreads. |
• | Private bank revenues increased 13%, primarily due to growth in client business volumes in both banking and lending, particularly in North America , as well as increased capital markets activity and higher managed investments revenues, partially offset by continued spread compression in lending. |
Within Markets and securities services :
• | Fixed income markets revenues decreased 1%, driven by a decrease in spread products revenues, partially offset by continued growth in rates and currencies revenues. Spread products revenues declined due to lower activity levels, particularly in credit products in North America and as a result of overall weakness in EMEA . Each of distressed credit, structured credit and municipals products experienced lower activity levels in a challenging credit environment due to lower risk appetite across the credit markets. Rates and currencies revenues increased, particularly in G10 rates in North America, due to increased client flows and improved trading performance due to higher market volatility, combined with strong performance in local markets in Asia, partially offset by a slight decline in G10 foreign exchange and weakness in EMEA . |
• | Equity markets revenues decreased 1%, primarily reflecting a charge of $175 million for valuation adjustments related to certain financing transactions. Currently, Citi has remaining exposure with respect to these transactions of less than $100 million. Excluding the adjustments, revenues would have increased by 26%, primarily reflecting growth in derivatives, improved trading performance in EMEA and strong client momentum in Asia . |
• | Securities services revenues increased 7%, particularly in Asia and EMEA , reflecting increased client activity and higher client balances, which drove growth in net interest revenue and custody and clearing fees, partially offset by the impact of FX translation. |
Expenses increased 2%, primarily due to higher regulatory and compliance costs and volume-related costs and investments, partially offset by ongoing efficiency savings and the impact of FX translation.
Provisions increased 15% to a negative $95 million primarily reflecting higher net credit losses, partially offset by a higher net loan loss reserve release. Net credit losses increased $74 million. The increase related to a limited number of corporate loans, with the vast majority of these net credit losses offset by the release of related, previously-established loan loss reserves. The higher net loan loss reserve release was driven by this release of previously-established loan loss reserves as well as improvement in the overall corporate portfolio, partially offset by an approximately $43 million loan loss reserve build for certain energy and energy-related exposures (for additional information, see "Managing Global Risk-Corporate Credit Risk Details" below).
23
Russia/Greece
For additional information on Citi's exposures and risks in Russia, see " Institutional Clients Group-Russia " and "Risk Factors" in Citi's 2014 Annual Report on Form 10-K and "Managing Global Risk-Country and Cross-Border Risk" below. For additional information on Citi's exposures and risks in Greece, see "Risk Factors" in Citi's 2014 Annual Report on Form 10-K and "Managing Global Risk-Country and Cross-Border Risk" below.
2015 YTD vs. 2014 YTD
Net income increased 5%, primarily driven by lower expenses, partially offset by an increase in the cost of credit.
• | Revenues were unchanged, reflecting lower revenues in Markets and securities services (decrease of 2%), offset by higher revenues in Banking (increase of 3%, 2% excluding the gains/(losses) on hedges on accrual loans). |
Within Banking :
• | Investment banking revenues increased 4%, reflecting strength in North America and improved overall wallet share, despite a decline in the overall market environment due to lower underwriting activity. Advisory revenues increased 51%, reflecting increased wallet share and strength in the overall M&A market. Equity underwriting revenues decreased 24% due in part to a decline in wallet share resulting from continued share fragmentation. Debt underwriting revenues increased 5%, as strength in investment grade debt more than offset declines in the loan underwriting market. |
• | Treasury and trade solutions revenues decreased 1%. Excluding the impact of FX translation, revenues increased 4%, as continued growth in deposit balances and improved spreads were partially offset by lower activity and the continued impact of spread compression in trade. End-of-period deposit balances increased 4%. Excluding the impact of FX translation, end-of-period deposits increased 9%, as discussed above. Average trade loans decreased 14%. Excluding the impact of FX translation, average trade loans decreased 9%, as discussed above. |
• | Corporate lending revenues increased 8%. Excluding the impact of gains/(losses) on hedges on accrual loans, revenues increased 2%, as continued growth in average loan balances, lower hedge premium costs and an improvement in mark-to-market adjustments were partially offset by the impact of FX translation and lower spreads. |
• | Private bank revenues increased 9%, primarily due to continued growth in client business volumes in both banking and lending, as well as higher capital markets activity, partially offset by continued spread compression in lending and weakness in Latin America . |
Within Markets and securities services :
• | Fixed income markets revenues decreased 7%, driven by a decrease in spread products revenues, partially offset by growth in rates and currencies revenues. Spread products revenues declined, particularly credit markets in North America , due to lower activity in the period, as well as |
strong performance in the prior-year period. Distressed credit, structured credit, securitized markets and municipals products all experienced lower activity levels due to lower risk appetite across the credit markets, partially offset by increased client activity in investment grade credit. Rates and currencies revenues increased, particularly in EMEA , due to increased client flows in G10 and local markets, driven in part by central bank actions and increased foreign exchange volatility, combined with strength in Asia due to improved performance, partially offset by the previously disclosed modest loss on the Swiss franc revaluation early in the first quarter of 2015.
• | Equity markets revenues decreased 1%, primarily reflecting the charge for valuation adjustments referenced above. Excluding the adjustments, revenues would have increased by 10%, primarily due to growth in derivatives, particularly in Asia and EMEA , partially offset by North America . |
• | Securities services revenues increased 9%, reflecting increased client activity and higher client balances, which drove growth in net interest revenue and custody and clearing fees, partially offset by the impact of FX translation. |
Expenses decreased 2%, primarily due to the impact of FX translation, lower legal and related expenses, lower repositioning charges and ongoing efficiency savings, partially offset by increased regulatory and compliance costs and higher volume-related costs.
Provisions increased 75% to a negative $21 million, primarily reflecting a lower net loan loss reserve release largely due to the impact of an approximately $140 million loan loss reserve build for certain energy and energy-related exposures, partially offset by lower net credit losses largely due to the absence of $165 million of credit costs related to the Pemex supplier program in the prior-year period (for additional information, see Citi's Current Report on Form 8-K filed with the SEC on February 28, 2014).
24
CORPORATE/OTHER
Corporate/Other includes certain unallocated costs of global staff functions (including finance, risk, human resources, legal and compliance), other corporate expenses and unallocated global operations and technology expenses, Corporate Treasury and discontinued operations. At June 30, 2015, Corporate/Other had $52 billion of assets, or 3% of Citigroup's total assets. For additional information, see "Balance Sheet Review" and "Managing Global Risk-Market Risk-Funding and Liquidity" below.
| Second Quarter | % Change | Six Months | % Change | ||||||||||||
In millions of dollars | 2015 | 2014 | 2015 | 2014 | ||||||||||||
Net interest revenue | $ | (22 | ) | $ | (45 | ) | 51 | % | $ | (50 | ) | $ | (80 | ) | 38 | % |
Non-interest revenue | 392 | | 134 | | NM | | 632 | | 392 | | 61 | | ||||
Total revenues, net of interest expense | $ | 370 | | $ | 89 | | NM | | $ | 582 | | $ | 312 | | 87 | % |
Total operating expenses | $ | 385 | | $ | 636 | | (39 | )% | $ | 928 | | $ | 1,038 | | (11 | )% |
Provisions for loan losses and for benefits and claims | - | | - | | - | % | - | | - | | - | % | ||||
Loss from continuing operations before taxes | $ | (15 | ) | $ | (547 | ) | 97 | % | $ | (346 | ) | $ | (726 | ) | 52 | % |
Income taxes (benefits) | (245 | ) | (163 | ) | (50 | )% | (557 | ) | 46 | | NM | | ||||
Income (loss) from continuing operations | $ | 230 | | $ | (384 | ) | NM | | $ | 211 | | $ | (772 | ) | NM | |
Income (loss) from discontinued operations, net of taxes | 6 | | (22 | ) | NM | | 1 | | 15 | | (93 | )% | ||||
Net income (loss) before attribution of noncontrolling interests | $ | 236 | | $ | (406 | ) | NM | | $ | 212 | | $ | (757 | ) | NM | |
Noncontrolling interests | (2 | ) | 25 | | NM | | 8 | | 35 | | (77 | )% | ||||
Net income (loss) | $ | 238 | | $ | (431 | ) | NM | | $ | 204 | | $ | (792 | ) | NM | |
NM Not meaningful
2Q15 vs. 2Q14
Net income was $238 million, compared to a net loss of $431 million in the prior-year period, primarily due to higher revenue, lower expenses and the favorable tax impact reflecting the resolution of certain state and local audits (see "Income Taxes" below).
Revenues increased $281 million to $370 million, primarily due to gains on debt buybacks as well as real estate sales in the current quarter, partially offset by hedging activities.
Expenses decreased 39%, primarily due to lower legal and related expenses ($144 million compared to $296 million in the prior-year period) as well as the benefit of FX translation.
2015 YTD vs. 2014 YTD
Year-to-date, Corporate/Other has experienced similar trends to those described above. Net income was $204 million, compared to a net loss of $792 million, primarily due to higher revenues, the favorable tax impact resulting from the resolution of certain state and local audits referenced above and lower expenses.
Revenues increased 87%, primarily due to the gains on debt buybacks and real estate sales and higher revenues from sales of available-for-sale securities, partially offset by hedging activities.
Expenses decreased 11%, as the benefit of FX translation and lower repositioning charges were partially offset by higher legal and related expenses ($459 million compared to $383 million in the prior-year period).
25
CITI HOLDINGS
Citi Holdings contains businesses and portfolios of assets that Citigroup has determined are not central to its core Citicorp businesses.
As of June 30, 2015, Citi Holdings assets were approximately $116 billion, a decrease of 22% year-over-year and 5% from March 31, 2015. The decline in assets of $6 billion from March 31, 2015 primarily consisted of divestitures and run-off. During the second quarter of 2015, Citi completed the sales of its consumer businesses in Peru and Nicaragua. In addition, as previously announced, Citi currently has executed agreements to sell an additional $32 billion of assets, including the consumer businesses in Japan, Egypt, Costa Rica and Panama as well as OneMain Financial, subject to regulatory approvals and other closing conditions.
As of June 30, 2015, consumer assets in Citi Holdings were approximately $103 billion, or approximately 89% of Citi Holdings assets. Of the consumer assets, approximately $51 billion, or 50%, consisted of North America mortgages (residential first mortgages and home equity loans), including consumer mortgages originated by Citi's legacy CitiFinancial North America business (approximately $9 billion, or 18%, of the $51 billion as of June 30, 2015). As of June 30, 2015, Citi Holdings represented approximately 6% of Citi's GAAP assets and 13% of its risk-weighted assets under Basel III (based on the Advanced Approaches for determining risk-weighted assets).
| Second Quarter | % Change | Six Months | % Change | ||||||||||||
In millions of dollars, except as otherwise noted | 2015 | 2014 | 2015 | 2014 | ||||||||||||
Net interest revenue | $ | 1,001 | | $ | 1,237 | | (19 | )% | $ | 2,056 | | $ | 2,413 | | (15 | )% |
Non-interest revenue | 672 | | 753 | | (11 | ) | 1,451 | | 1,562 | | (7 | ) | ||||
Total revenues, net of interest expense | $ | 1,673 | | $ | 1,990 | | (16 | )% | $ | 3,507 | | $ | 3,975 | | (12 | )% |
Provisions for credit losses and for benefits and claims |
|
| | |
|
| | | ||||||||
Net credit losses | $ | 258 | | $ | 442 | | (42 | )% | $ | 666 | | $ | 1,015 | | (34 | )% |
Credit reserve release | (170 | ) | (212 | ) | 20 | | (366 | ) | (558 | ) | 34 | | ||||
Provision for loan losses | $ | 88 | | $ | 230 | | (62 | )% | $ | 300 | | $ | 457 | | (34 | )% |
Provision for benefits and claims | 160 | | 156 | | 3 | | 329 | | 323 | | 2 | | ||||
Release for unfunded lending commitments | (1 | ) | (3 | ) | 67 | | (6 | ) | (7 | ) | 14 | | ||||
Total provisions for credit losses and for benefits and claims | $ | 247 | | $ | 383 | | (36 | )% | $ | 623 | | $ | 773 | | (19 | )% |
Total operating expenses | $ | 1,104 | | $ | 5,022 | | (78 | )% | $ | 2,261 | | $ | 7,040 | | (68 | )% |
Income (loss) from continuing operations before taxes | $ | 322 | | $ | (3,415 | ) | NM | | $ | 623 | | $ | (3,838 | ) | NM | |
Income taxes (benefits) | 159 | | 77 | | NM | | 313 | | (64 | ) | NM | | ||||
Income (loss) from continuing operations | $ | 163 | | $ | (3,492 | ) | NM | | $ | 310 | | $ | (3,774 | ) | NM | |
Noncontrolling interests | - | | - | | - | % | $ | 1 | | $ | 2 | | (50 | )% | ||
Net Income (loss) | $ | 163 | | $ | (3,492 | ) | NM | | $ | 309 | | $ | (3,776 | ) | NM | |
Total revenues, net of interest expense (excluding CVA/DVA) | | | | | | |
|
| | | ||||||
Total revenues-as reported | $ | 1,673 | | $ | 1,990 | | (16 | )% | $ | 3,507 | | $ | 3,975 | | (12 | )% |
CVA/DVA (1) | 9 | | (1 | ) | NM | | 5 | | 13 | | (62 | )% | ||||
Total revenues-excluding CVA/DVA | $ | 1,664 | | $ | 1,991 | | (16 | )% | $ | 3,502 | | $ | 3,962 | | (12 | )% |
Balance sheet data (in billions of dollars) |
|
|
|
|
| | | |||||||||
Average assets | $ | 118 | | $ | 148 | | (20 | )% | $ | 122 | | $ | 150 | | (19 | )% |
Return on average assets | 0.55 | % | (9.46 | )% |
| 0.51 | % | (5.08 | )% | | | |||||
Efficiency ratio | 66 | % | 252 | % |
| 64 | % | 177 | % | | | |||||
Total EOP assets | $ | 116 | | $ | 148 | | (22 | )% |
|
| | | ||||
Total EOP loans | 59 | | 90 | | (34 | ) |
|
| | | ||||||
Total EOP deposits | 8 | | 52 | | (85 | ) |
|
| | | ||||||
(1) | FVA is included within CVA for presentation purposes. For additional information, see Note 22 to the Consolidated Financial Statements. |
NM Not meaningful
26
The discussion of the results of operations for Citi Holdings below excludes the impact of CVA/DVA for all periods presented. Presentations of the results of operations, excluding the impact of CVA/DVA, are non-GAAP financial measures. For a reconciliation of these metrics to the reported results, see the table above.
2Q15 vs. 2Q14
Net income was $157 million, an improvement from a net loss of $3.5 billion in the prior-year period, largely due to the impact of the mortgage settlement in the prior-year period (see "Executive Summary" above). Excluding the mortgage settlement, net income declined 33%, primarily driven by lower revenues, partially offset by lower expenses and lower credit costs.
Revenues decreased 16%, primarily driven by the overall continued wind-down of the portfolio and the impact of the recording of OneMain Financial net credit losses as a reduction in revenue (see "Executive Summary" above).
Expenses decreased 78%. Excluding the impact of the mortgage settlement, expenses decreased 13%, primarily reflecting the ongoing decline in assets.
Provisions decreased 36%. Excluding the impact of the mortgage settlement, provision decreased 25%, driven by lower net credit losses, partially offset by a lower net loss reserve release. Net credit losses declined 42%, primarily due to the impact of the recording of OneMain Financial net credit losses as a reduction in revenue referenced above. Excluding the impact of the mortgage settlement, the net reserve release decreased 37% to $171 million, primarily due to lower releases related to the North America mortgage portfolio.
2015 YTD vs. 2014 YTD
Year-to-date, Citi Holdings has experienced similar trends to those described above. Net income was $306 million, an improvement from a net loss of $3.8 billion in the prior-year period, largely due to the impact of the mortgage settlement. Excluding the mortgage settlement, net income was $306 million, compared to a net loss of $58 million in the prior-year period, primarily reflecting lower expenses and lower credit costs, partially offset by lower revenues.
Revenues decreased 12%, primarily driven by the overall continued wind-down of the portfolio and the impact of the recording of OneMain Financial net credit losses as a reduction in revenue, partially offset by higher gains on asset sales.
Expenses decreased 68%. Excluding the impact of the mortgage settlement, expenses decreased 31%, primarily reflecting lower legal and related expenses ($143 million compared to $799 million in the prior-year period) and the ongoing decline in assets.
Provisions decreased 19%. Excluding the impact of the mortgage settlement, provision decreased 13%, driven by lower net credit losses, partially offset by a lower net loss reserve release. Net credit losses declined 34%, primarily due to the impact of the recording of OneMain Financial net credit losses as a reduction in revenue, continued improvements in North America mortgages and overall lower asset levels. Excluding the impact of the mortgage settlement, the net reserve release decreased 40% to $372 million, primarily due to lower releases related to the North America mortgage portfolio, partially offset by higher reserve releases related to asset sales.
Payment Protection Insurance (PPI)
As previously disclosed, the alleged mis-selling of PPI by financial institutions in the U.K. has been the subject of intense review and focus by U.K. regulators (for additional information, see Citi's Annual Report on Form 10-K for the year ended December 31, 2013 filed with the SEC on March 3, 2014).
During the fourth quarter of 2014, the U.K. Supreme Court issued a ruling in a case involving PPI pursuant to which the court ruled, independent of the sale of the PPI contract, the PPI contract at issue in the case was "unfair" due to the high sales commissions earned and the lack of disclosure to the customer thereof. As a result of the ruling, on May 27, 2015, the U.K. Financial Conduct Authority (FCA) announced that it was considering the court's ruling, including whether additional rules and/or guidance were necessary with respect to the impact of the decision on PPI customer complaints. It is currently uncertain what impact, if any, this recent court decision, the FCA's review or the renewed market attention on PPI will have on PPI customer complaints or Citi's potential liability with respect thereto.
27
BALANCE SHEET REVIEW
The following sets forth a general discussion of the changes in certain of the more significant line items of Citi's Consolidated Balance Sheet. For a description of and additional information on each of these balance sheet categories, see Notes 10 , 12 , 13 , 14 and 17 to the Consolidated Financial Statements. For additional information on Citigroup's liquidity resources, including its deposits, short-term and long-term debt and secured financing transactions, see "Managing Global Risk-Market Risk-Funding and Liquidity Risk" below.
In billions of dollars | June 30, | March 31, | Dec. 31, 2014 | June 30, | EOP 2Q15 vs. 1Q15 Increase (decrease) | % Change | EOP 2Q15 vs. 4Q14 Increase (decrease) | % Change | EOP | % | |||||||||||||||||
Assets |
|
|
|
|
|
|
|
|
|
| |||||||||||||||||
Cash and deposits with banks | $ | 154 | | $ | 156 | | $ | 160 | | $ | 189 | | $ | (2 | ) | (1 | )% | $ | (6 | ) | (4 | )% | $ | (35 | ) | (19 | )% |
Federal funds sold and securities borrowed or purchased under agreements to resell | 237 | | 239 | | 243 | | 250 | | (2 | ) | (1 | ) | (6 | ) | (2 | ) | (13 | ) | (5 | ) | |||||||
Trading account assets | 279 | | 303 | | 297 | | 291 | | (24 | ) | (8 | ) | (18 | ) | (6 | ) | (12 | ) | (4 | ) | |||||||
Investments | 332 | | 327 | | 333 | | 326 | | 5 | | 2 | | (1 | ) | - | | 6 | | 2 | | |||||||
Loans, net of unearned income | 632 | | 621 | | 645 | | 668 | | 11 | | 2 | | (13 | ) | (2 | ) | (36 | ) | (5 | ) | |||||||
Allowance for loan losses | (14 | ) | (15 | ) | (16 | ) | (18 | ) | 1 | | (7 | ) | 2 | | (13 | ) | 4 | | (22 | ) | |||||||
Loans, net | 618 | | 606 | | 629 | | 650 | | 12 | | 2 | | (11 | ) | (2 | ) | (32 | ) | (5 | ) | |||||||
Other assets | 209 | | 201 | | 180 | | 203 | | 8 | | 4 | | 29 | | 16 | | 6 | | 3 | | |||||||
Total assets | $ | 1,829 | | $ | 1,832 | | $ | 1,842 | | $ | 1,909 | | $ | (3 | ) | - | % | $ | (13 | ) | (1 | )% | $ | (80 | ) | (4 | )% |
Liabilities |
|
|
|
|
|
|
|
| | | |||||||||||||||||
Deposits | $ | 908 | | $ | 900 | | $ | 899 | | $ | 966 | | $ | 8 | | 1 | % | $ | 9 | | 1 | % | $ | (58 | ) | (6 | )% |
Federal funds purchased and securities loaned or sold under agreements to repurchase | 177 | | 175 | | 173 | | 184 | | 2 | | 1 | | 4 | | 2 | | (7 | ) | (4 | ) | |||||||
Trading account liabilities | 136 | | 142 | | 139 | | 123 | | (6 | ) | (4 | ) | (3 | ) | (2 | ) | 13 | | 11 | | |||||||
Short-term borrowings | 26 | | 39 | | 58 | | 60 | | (13 | ) | (33 | ) | (32 | ) | (55 | ) | (34 | ) | (57 | ) | |||||||
Long-term debt | 212 | | 211 | | 223 | | 227 | | 1 | | - | | (11 | ) | (5 | ) | (15 | ) | (7 | ) | |||||||
Other liabilities | 149 | | 149 | | 138 | | 136 | | - | | - | | 11 | | 8 | | 13 | | 10 | | |||||||
Total liabilities | $ | 1,608 | | $ | 1,616 | | $ | 1,630 | | $ | 1,696 | | $ | (8 | ) | - | % | $ | (22 | ) | (1 | )% | $ | (88 | ) | (5 | )% |
Total equity | 221 | | 216 | | 212 | | 213 | | 5 | | 2 | | 9 | | 4 | | 8 | | 4 | | |||||||
Total liabilities and equity | $ | 1,829 | | $ | 1,832 | | $ | 1,842 | | $ | 1,909 | | $ | (3 | ) | - | % | $ | (13 | ) | (1 | )% | $ | (80 | ) | (4 | )% |
ASSETS
Cash and Deposits with Banks
Cash and deposits with banks decreased from the prior-year period as Citi continued to deploy its excess cash by increasing its investment portfolio to manage its interest rate position as well as reduce its short-term and long-term borrowings. Average cash balances were $156 billion in the second quarter of 2015 compared to $192 billion in the second quarter of 2014.
Federal Funds Sold and Securities Borrowed or Purchased Under Agreements to Resell (Reverse Repos)
Reverse repos and securities borrowing transactions declined 5% from the prior-year period primarily due to the impact of FX translation (for additional information, see "Managing Global Risk-Market Risk-Funding and Liquidity Risk" below) .
Trading Account Assets
The decrease in trading account assets from the prior-year period was primarily due to the impact of FX translation, partially offset by an increase in the carrying value of Citi's
28
derivatives positions. Average trading account assets were $296 billion in the second quarter of 2015 compared to $287 billion in the second quarter of 2014.
Investments
The sequential and year-over-year increase in investments reflected Citi's continued deployment of its excess cash (as discussed above) by investing in available-for-sale securities, particularly in U.S. treasuries. For further information on Citi's investments during the current quarter, see Note 13 to the Consolidated Financial Statements.
Loans
The impact of FX translation on Citi's reported loans was negative $27 billion versus the prior-year period and negligible sequentially. Excluding the impact of FX translation, Citigroup end of period loans declined 1% year-over-year to $632 billion as 4% growth in Citicorp was more than offset by the continued wind-down of Citi Holdings.
Citicorp consumer loans grew 1% year-over-year, with broad-based growth driving a 3% increase in international consumer loans. Corporate loans grew 6% year-over-year, as 13% combined growth in corporate lending, markets and private bank volumes, particularly in North America and EMEA , was partially offset by an 11% decline in treasury and trade solutions loans. Spread compression in trade, particularly in Asia , led to a reduction of on-balance sheet loans while Citi continued to support new originations for its clients.
Citi Holdings loans decreased 33% year-over-year driven by an approximately $16 billion reduction in North America mortgages, as well as the previously announced impact of the agreements to sell OneMain Financial and Citi's Japan credit card business.
Sequentially, growth in Citicorp, driven by corporate lending and North America GCB more than offset the continued wind-down of Citi Holdings.
During the second quarter of 2015, average loans of $627 billion yielded an average rate of 6.4%, compared to $635 billion and 6.8% in the first quarter of 2015 and $665 billion and 6.9% in the second quarter of 2014.
For further information on Citi's loan portfolios, see "Managing Global Risk-Credit Risk" and "Country Risk" below.
Other Assets
The year-over-year increase in other assets was largely due to the previously announced reclassification to held-for-sale of OneMain Financial and Citi's Japan credit card businesses. Sequentially, the increase in other assets was primarily due to changes in brokerage receivables driven by normal business fluctuations.
LIABILITIES
Deposits
For a discussion of Citi's deposits, see "Managing Global Risk-Market Risk-Funding and Liquidity Risk" below.
Federal Funds Purchased and Securities Loaned or Sold Under Agreements to Repurchase (Repos)
Repos decreased 4% from the prior-year period, primarily driven by the impact of FX translation. For further information on Citi's secured financing transactions, see "Managing Global Risk-Market Risk-Funding and Liquidity" below.
Trading Account Liabilities
Trading account liabilities increased from the prior-year period due to an increase in the carrying value of Citi's derivatives positions, partially offset by the impact of FX translation. Average trading account liabilities were $138 billion during the second quarter of 2015, compared to $130 billion in the second quarter of 2014.
Debt
For information on Citi's long-term and short-term debt borrowings, see "Managing Global Risk-Market Risk-Funding and Liquidity Risk" below.
Other Liabilities
The increase in other liabilities from the prior-year period was primarily driven by the previously announced reclassification to held-for-sale of Citi's Japan retail banking business, as well as changes in the levels of brokerage payables driven by normal business fluctuations.
29
Segment Balance Sheet (1)
In millions of dollars | Global Consumer Banking | Institutional Clients Group | Corporate/Other and Consolidating Eliminations (2) | Subtotal Citicorp | Citi Holdings | Citigroup Parent Company- Issued Long-Term Debt and Stockholders' Equity (3) | Total Citigroup Consolidated | ||||||||||||||
Assets |
|
|
|
|
|
|
| ||||||||||||||
Cash and deposits with banks | $ | 11,127 | | $ | 76,670 | | $ | 65,668 | | $ | 153,465 | | $ | 633 | | $ | - | | $ | 154,098 | |
Federal funds sold and securities borrowed or purchased under agreements to resell | 432 | | 235,395 | | - | | 235,827 | | 1,227 | | - | | 237,054 | | |||||||
Trading account assets | 5,084 | | 270,179 | | 538 | | 275,801 | | 3,396 | | - | | 279,197 | | |||||||
Investments | 20,248 | | 93,305 | | 210,189 | | 323,742 | | 8,379 | | - | | 332,121 | | |||||||
Loans, net of unearned income and |
|
|
|
|
|
| | ||||||||||||||
allowance for loan losses | 275,447 | | 287,231 | | - | | 562,678 | | 55,365 | | - | | 618,043 | | |||||||
Other assets | 45,700 | | 94,249 | | 44,901 | | 184,850 | | 24,007 | | - | | 208,857 | | |||||||
Liquidity assets (4) | 37,013 | | 209,155 | | (269,033 | ) | (22,865 | ) | 22,865 | | - | | - | | |||||||
Total assets | $ | 395,051 | | $ | 1,266,184 | | $ | 52,263 | | $ | 1,713,498 | | $ | 115,872 | | $ | - | | $ | 1,829,370 | |
Liabilities and equity |
|
|
|
|
|
|
| ||||||||||||||
Total deposits (5) | $ | 305,091 | | $ | 588,104 | | $ | 7,120 | | $ | 900,315 | | $ | 7,722 | | $ | - | | $ | 908,037 | |
Federal funds purchased and securities loaned or sold under agreements to repurchase | 5,078 | | 171,818 | | - | | 176,896 | | 116 | | - | | 177,012 | | |||||||
Trading account liabilities | 12 | | 135,401 | | 32 | | 135,445 | | 850 | | - | | 136,295 | | |||||||
Short-term borrowings | 187 | | 24,719 | | 1,011 | | 25,917 | | (10 | ) | - | | 25,907 | | |||||||
Long-term debt | 1,342 | | 36,044 | | 19,600 | | 56,986 | | 3,754 | | 151,105 | | 211,845 | | |||||||
Other liabilities | 17,431 | | 79,899 | | 16,683 | | 114,013 | | 35,436 | | - | | 149,449 | | |||||||
Net inter-segment funding (lending) (3) | 65,910 | | 230,199 | | 6,432 | | 302,541 | | 68,004 | | (370,545 | ) | - | | |||||||
Total liabilities | $ | 395,051 | | $ | 1,266,184 | | $ | 50,878 | | $ | 1,712,113 | | $ | 115,872 | | $ | (219,440 | ) | $ | 1,608,545 | |
Total equity | - | | - | | 1,385 | | 1,385 | | - | | 219,440 | | 220,825 | | |||||||
Total liabilities and equity | $ | 395,051 | | $ | 1,266,184 | | $ | 52,263 | | $ | 1,713,498 | | $ | 115,872 | | $ | - | | $ | 1,829,370 | |
(1) | The supplemental information presented in the table above reflects Citigroup's consolidated GAAP balance sheet by reporting segment as of June 30, 2015 . The respective segment information depicts the assets and liabilities managed by each segment as of such date. While this presentation is not defined by GAAP, Citi believes that these non-GAAP financial measures enhance investors' understanding of the balance sheet components managed by the underlying business segments, as well as the beneficial inter-relationships of the asset and liability dynamics of the balance sheet components among Citi's business segments. |
(2) | Consolidating eliminations for total Citigroup and Citigroup parent company assets and liabilities are recorded within the Corporate/Other segment. |
(3) | The total stockholders' equity and the majority of long-term debt of Citigroup reside in the Citigroup parent company Consolidated Balance Sheet. Citigroup allocates stockholders' equity and long-term debt to its businesses through inter-segment allocations as shown above. |
(4) | Represents the attribution of Citigroup's liquidity assets (primarily consisting of cash and available-for-sale securities) to the various businesses based on Liquidity Coverage Ratio (LCR) assumptions. |
(5) | Reflects reclassification of approximately $20 billion of deposits to held-for-sale ( Other liabilities) as a result of the agreement in December 2014 to sell Citi's retail banking business in Japan. |
30
OFF-BALANCE SHEET ARRANGEMENTS
The table below shows where a discussion of Citi's various off balance sheet arrangements may be found in this Form 10-Q. For additional information on Citi's off-balance sheet arrangements, see "Off-Balance Sheet Arrangements," "Significant Accounting Policies and Significant Estimates-Securitizations" and Notes 1, 22 and 27 to the Consolidated Financial Statements in Citigroup's 2014 Annual Report on Form 10-K.
Types of Off-Balance Sheet Arrangements Disclosures in this Form 10-Q
Variable interests and other obligations, including contingent obligations, arising from variable interests in nonconsolidated VIEs | See Note 20 to the Consolidated Financial Statements. |
Letters of credit, and lending and other commitments | See Note 24 to the Consolidated Financial Statements. |
Guarantees | See Note 24 to the Consolidated Financial Statements. |
31
CAPITAL RESOURCES
Overview
Capital is used principally to support assets in Citi's businesses and to absorb credit, market and operational losses. Citi primarily generates capital through earnings from its operating businesses. Citi may augment its capital through issuances of common stock, noncumulative perpetual preferred stock and equity issued through awards under employee benefit plans, among other issuances. During the second quarter of 2015, Citi continued to raise capital through a noncumulative perpetual preferred stock issuance amounting to approximately $2 billion, resulting in a total of approximately $14 billion outstanding as of June 30, 2015 . In addition, during the 2015 second quarter, Citi also returned a total of $1.7 billion of capital to common shareholders in the form of share repurchases (approximately 28 million common shares) and dividends.
Further, Citi's capital levels may also be affected by changes in regulatory and accounting standards as well as the impact of future events on Citi's business results, such as corporate and asset dispositions.
Capital Management
Citigroup's capital management framework is designed to ensure that Citigroup and its principal subsidiaries maintain sufficient capital consistent with each entity's respective risk profile and all applicable regulatory standards and guidelines. For additional information regarding Citigroup's capital management, see "Capital Resources-Capital Management" in Citigroup's 2014 Annual Report on Form 10-K.
Current Regulatory Capital Standards
Citi is subject to regulatory capital standards issued by the Federal Reserve Board which, commencing with 2014, constitute the U.S. Basel III rules. These rules establish an integrated capital adequacy framework, encompassing both risk-based capital ratios and leverage ratios.
Risk-Based Capital Ratios
The U.S. Basel III rules set forth the composition of regulatory capital (including the application of regulatory capital adjustments and deductions), as well as two comprehensive methodologies (a Standardized Approach and Advanced Approaches) for measuring total risk-weighted assets. Total risk-weighted assets under the Advanced Approaches, which are primarily models-based, include credit, market, and operational risk-weighted assets. Conversely, the Standardized Approach excludes operational risk-weighted assets and generally applies prescribed supervisory risk weights to broad categories of credit risk exposures. As a result, credit risk-weighted assets calculated under the Advanced Approaches are more risk-sensitive than those calculated under the Standardized Approach. Market risk-weighted assets are derived on a generally consistent basis under both approaches.
The U.S. Basel III rules establish stated minimum Common Equity Tier 1 Capital, Tier 1 Capital and Total Capital ratios for substantially all U.S. banking organizations, including Citi and Citibank, N.A. Moreover, these rules provide for both a fixed Capital Conservation Buffer and a discretionary Countercyclical Capital Buffer, which would be available to absorb losses in advance of any potential impairment of regulatory capital below the stated minimum risk-based capital ratio requirements. Separately, in July 2015 the Federal Reserve Board released a final rule which imposes a risk-based capital surcharge upon U.S. bank holding companies that are identified as global systemically important bank holding companies (GSIBs), including Citi, and which will be an extension of, and introduced in parallel with, the Capital Conservation Buffer. For additional information regarding the Federal Reserve Board's final GSIB surcharge rule, see "Regulatory Capital Standards Developments" below.
The U.S. Basel III rules contain several differing, largely multi-year transition provisions (i.e., "phase-ins" and "phase-outs") with respect to the stated minimum Common Equity Tier 1 Capital and Tier 1 Capital ratio requirements, substantially all regulatory capital adjustments and deductions, non-qualifying Tier 1 and Tier 2 Capital instruments (such as non-grandfathered trust preferred securities and certain subordinated debt issuances), capital buffers and GSIB surcharge. With the exception of the non-grandfathered trust preferred securities which do not fully phase-out until January 1, 2022 and the capital buffers and GSIB surcharge which do not fully phase-in until January 1, 2019, all other transition provisions will be entirely reflected in Citi's regulatory capital ratios by January 1, 2018. Citi considers all of these transition provisions as being fully implemented on January 1, 2019 (full implementation), with the inclusion of the capital buffers and GSIB surcharge.
Further, the U.S. Basel III rules implement the "capital floor provision" of the so-called "Collins Amendment" of the Dodd-Frank Act, which requires Advanced Approaches
banking organizations, such as Citi and Citibank, N.A., to calculate each of the three risk-based capital ratios (Common Equity Tier 1 Capital, Tier 1 Capital and Total Capital) under both the Standardized Approach starting on January 1, 2015 (or, for 2014, prior to the effective date of the Standardized Approach, the Basel I credit risk and Basel II.5 market risk capital rules) and the Advanced Approaches and publicly report (as well as measure compliance against) the lower of each of the resulting risk-based capital ratios.
32
The following chart sets forth the transitional progression to full implementation by January 1, 2019 of the regulatory capital components (i.e., inclusive of the mandatory 2.5% Capital Conservation Buffer and an estimated 3.5% GSIB surcharge, but exclusive of the potential imposition of an additional Countercyclical Capital Buffer) comprising the effective minimum risk-based capital ratios.
Basel III Transition Arrangements: Minimum Risk-Based Capital Ratios |
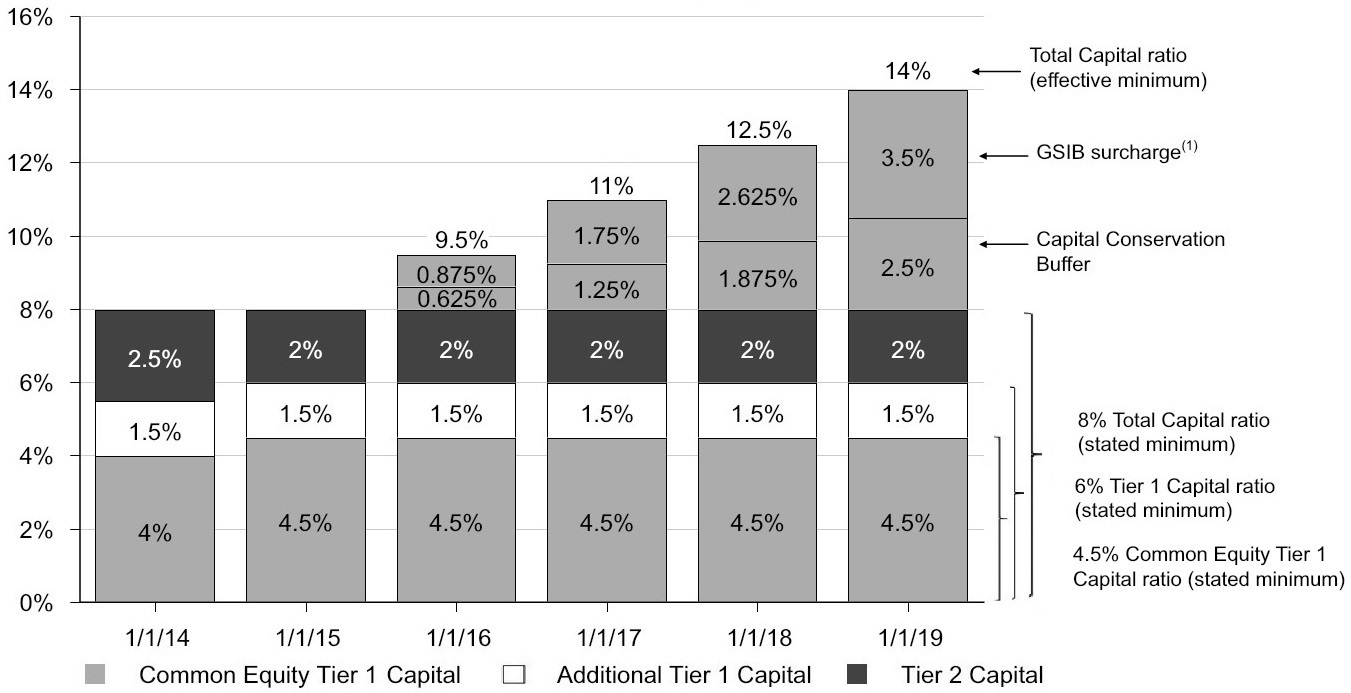
|
(1) Estimated GSIB surcharge based on Citi's current understanding and interpretation of the Federal Reserve Board's final GSIB surcharge rule, released July 2015. For additional information regarding the Federal Reserve Board's final GSIB surcharge rule, see "Regulatory Capital Standards Developments" below.
The following chart presents the transition arrangements (phase-in and phase-out) under the U.S. Basel III rules for significant regulatory capital adjustments and deductions relative to Citi.
Basel III Transition Arrangements: Significant Regulatory Capital Adjustments and Deductions |
| January 1 | |||||||||
| 2014 | 2015 | 2016 | 2017 | 2018 | |||||
Phase-in of Significant Regulatory Capital Adjustments and Deductions |
|
|
|
|
| |||||
|
|
|
|
|
| |||||
Common Equity Tier 1 Capital (1) | 20 | % | 40 | % | 60 | % | 80 | % | 100 | % |
|
|
|
|
|
| |||||
Common Equity Tier 1 Capital (2) | 20 | % | 40 | % | 60 | % | 80 | % | 100 | % |
Additional Tier 1 Capital (2)(3) | 80 | % | 60 | % | 40 | % | 20 | % | 0 | % |
| 100 | % | 100 | % | 100 | % | 100 | % | 100 | % |
|
|
|
|
|
| |||||
Phase-out of Significant AOCI Regulatory Capital Adjustments |
|
|
|
|
| |||||
|
|
|
|
|
| |||||
Common Equity Tier 1 Capital (4) | 80 | % | 60 | % | 40 | % | 20 | % | 0 | % |
33
(1) | Includes the phase-in of Common Equity Tier 1 Capital deductions for all intangible assets other than goodwill and mortgage servicing rights (MSRs); and excess over 10%/15% limitations for deferred tax assets (DTAs) arising from temporary differences, significant common stock investments in unconsolidated financial institutions and MSRs. Goodwill (including goodwill "embedded" in the valuation of significant common stock investments in unconsolidated financial institutions) is fully deducted in arriving at Common Equity Tier 1 Capital commencing January 1, 2014. The amount of other intangible assets, aside from MSRs, not deducted in arriving at Common Equity Tier 1 Capital are risk-weighted at 100%, as are the excess over the 10%/15% limitations for DTAs arising from temporary differences, significant common stock investments in unconsolidated financial institutions and MSRs prior to full implementation of the U.S. Basel III rules. Upon full implementation, the amount of temporary difference DTAs, significant common stock investments in unconsolidated financial institutions and MSRs not deducted in arriving at Common Equity Tier 1 Capital are risk-weighted at 250%. |
(2) | Includes the phase-in of Common Equity Tier 1 Capital deductions related to DTAs arising from net operating loss, foreign tax credit and general business credit carry-forwards and defined benefit pension plan net assets; and the phase-in of the Common Equity Tier 1 Capital adjustment for cumulative unrealized net gains (losses) related to changes in fair value of financial liabilities attributable to Citi's own creditworthiness. |
(3) | To the extent Additional Tier 1 Capital is not sufficient to absorb regulatory capital adjustments and deductions, such excess is to be applied against Common Equity Tier 1 Capital. |
(4) | Includes the phase-out from Common Equity Tier 1 Capital of adjustments related to unrealized gains (losses) on available-for-sale (AFS) debt securities; unrealized gains on AFS equity securities; unrealized gains (losses) on held-to-maturity (HTM) securities included in Accumulated other comprehensive income (loss) (AOCI); and defined benefit plans liability adjustment. |
Tier 1 Leverage Ratio
Under the U.S. Basel III rules, Citi, as with principally all U.S. banking organizations, is also required to maintain a minimum Tier 1 Leverage ratio of 4%. The Tier 1 Leverage ratio, a non-risk-based measure of capital adequacy, is defined as Tier 1 Capital as a percentage of quarterly adjusted average total assets less amounts deducted from Tier 1 Capital.
Supplementary Leverage Ratio
Advanced Approaches banking organizations are additionally required to calculate a Supplementary Leverage ratio, which significantly differs from the Tier 1 Leverage ratio by also including certain off-balance sheet exposures within the denominator of the ratio (Total Leverage Exposure). The Supplementary Leverage ratio represents end of period Tier 1 Capital to Total Leverage Exposure, with the latter defined as the sum of the daily average of on-balance sheet assets for the quarter and the average of certain off-balance sheet exposures calculated as of the last day of each month in the quarter, less applicable Tier 1 Capital deductions. Advanced Approaches banking organizations will be required to maintain a stated minimum Supplementary Leverage ratio of 3% commencing on January 1, 2018, but commenced publicly disclosing this ratio on January 1, 2015.
Further, U.S. GSIBs, and their subsidiary insured depository institutions, including Citi and Citibank, N.A., are subject to enhanced Supplementary Leverage ratio standards. The enhanced Supplementary Leverage ratio standards establish a 2% leverage buffer for U.S. GSIBs in addition to the stated 3% minimum Supplementary Leverage ratio requirement in the U.S. Basel III rules. If a U.S. GSIB fails to exceed the 2% leverage buffer, it will be subject to increasingly onerous restrictions (depending upon the extent of the shortfall) regarding capital distributions and discretionary executive bonus payments. Accordingly, U.S. GSIBs are effectively subject to a 5% minimum Supplementary Leverage ratio requirement. Additionally, insured depository institution subsidiaries of U.S. GSIBs, including Citibank, N.A., are required to maintain a Supplementary Leverage ratio of 6% to be considered "well capitalized" under the revised Prompt Corrective Action (PCA) framework established by the U.S. Basel III rules. Citi and Citibank, N.A. are required to
be compliant with these higher effective minimum ratio requirements on January 1, 2018.
Prompt Corrective Action Framework
The U.S. Basel III rules revised the PCA regulations applicable to insured depository institutions in certain respects.
In general, the PCA regulations direct the U.S. banking agencies to enforce increasingly strict limitations on the activities of insured depository institutions that fail to meet certain regulatory capital thresholds. The PCA framework contains five categories of capital adequacy as measured by risk-based capital and leverage ratios: (i) "well capitalized;" (ii) "adequately capitalized;" (iii) "undercapitalized;" (iv) "significantly undercapitalized;" and (v) "critically undercapitalized."
Accordingly, beginning January 1, 2015, an insured depository institution, such as Citibank, N.A., would need minimum Common Equity Tier 1 Capital, Tier 1 Capital, Total Capital, and Tier 1 Leverage ratios of 6.5%, 8%, 10% and 5%, respectively, to be considered "well capitalized." Additionally, Advanced Approaches insured depository institutions, such as Citibank, N.A., would need a minimum Supplementary Leverage ratio of 6%, effective January 1, 2018, to be considered "well capitalized."
34
Citigroup's Capital Resources Under Current Regulatory Standards
During 2015 and thereafter, Citi is required to maintain stated minimum Common Equity Tier 1 Capital, Tier 1 Capital and Total Capital ratios of 4.5%, 6% and 8%, respectively. The stated minimum Common Equity Tier 1 Capital and Tier 1 Capital ratio requirements in 2014 were 4% and 5.5%, respectively, while the stated minimum Total Capital ratio requirement of 8% remained unchanged.
Furthermore, to be "well capitalized" under current federal bank regulatory agency definitions, a bank holding
company must have a Tier 1 Capital ratio of at least 6%, a Total Capital ratio of at least 10%, and not be subject to a Federal Reserve Board directive to maintain higher capital levels.
The following tables set forth the capital tiers, risk-weighted assets, risk-based capital ratios, quarterly adjusted average total assets, Total Leverage Exposure and leverage ratios under current regulatory standards (reflecting Basel III Transition Arrangements) for Citi as of June 30, 2015 and December 31, 2014 .
Citigroup Capital Components and Ratios Under Current Regulatory Standards (Basel III Transition Arrangements)
| June 30, 2015 |
| December 31, 2014 (1) | ||||||||||
In millions of dollars, except ratios | Advanced Approaches | Standardized Approach |
| Advanced Approaches | Standardized Approach (2) | ||||||||
Common Equity Tier 1 Capital | $ | 172,747 | | $ | 172,747 | |
| $ | 166,663 | | $ | 166,663 | |
Tier 1 Capital | 173,006 | | 173,006 | |
| 166,663 | | 166,663 | | ||||
Total Capital (Tier 1 Capital + Tier 2 Capital) (3) | 193,712 | | 206,374 | |
| 184,959 | | 197,707 | | ||||
Risk-Weighted Assets | 1,253,875 | | 1,188,191 | |
| 1,274,672 | | 1,211,358 | | ||||
Common Equity Tier 1 Capital ratio (4) | 13.78 | % | 14.54 | % |
| 13.07 | % | 13.76 | % | ||||
Tier 1 Capital ratio (4) | 13.80 | | 14.56 | |
| 13.07 | | 13.76 | | ||||
Total Capital ratio (4) | 15.45 | | 17.37 | |
| 14.51 | | 16.32 | | ||||
In millions of dollars, except ratios | June 30, 2015 |
| December 31, 2014 (1) | ||||||
Quarterly Adjusted Average Total Assets (5) |
| $ | 1,787,880 | |
|
| $ | 1,849,325 | |
Total Leverage Exposure (6) |
| 2,395,234 | |
|
| 2,518,115 | | ||
Tier 1 Leverage ratio |
| 9.68 | % |
|
| 9.01 | % | ||
Supplementary Leverage ratio |
| 7.22 | |
|
| 6.62 | | ||
(1) | Restated to reflect the retrospective adoption of ASU 2014-01 for Low Income Housing Tax Credit (LIHTC) investments, consistent with current period presentation. |
(2) | Pro forma presentation to reflect the application of the Basel III 2015 Standardized Approach, consistent with current period presentation. |
(3) | Under the Advanced Approaches framework eligible credit reserves that exceed expected credit losses are eligible for inclusion in Tier 2 Capital to the extent the excess reserves do not exceed 0.6% of credit risk-weighted assets, which differs from the Standardized Approach in which the allowance for credit losses is includable in Tier 2 Capital up to 1.25% of credit risk-weighted assets, with any excess allowance for credit losses being deducted in arriving at credit risk-weighted assets. |
(4) | As of June 30, 2015 and December 31, 2014 , Citi's reportable Common Equity Tier 1 Capital, Tier 1 Capital, and Total Capital ratios were the lower derived under the Basel III Advanced Approaches framework. |
(5) | Tier 1 Leverage ratio denominator. |
(6) | Supplementary Leverage ratio denominator. |
As indicated in the table above, Citigroup's capital ratios at June 30, 2015 were in excess of the stated minimum requirements under the U.S. Basel III rules. In addition, Citi was also "well capitalized" under current
federal bank regulatory agency definitions as of June 30, 2015 .
35
Components of Citigroup Capital Under Current Regulatory Standards
(Basel III Advanced Approaches with Transition Arrangements)
In millions of dollars | June 30, | December 31, 2014 (1) | ||||
Common Equity Tier 1 Capital |
|
| ||||
Citigroup common stockholders' equity (2) | $ | 205,610 | | $ | 199,841 | |
Add: Qualifying noncontrolling interests | 409 | | 539 | | ||
Regulatory Capital Adjustments and Deductions: |
|
| ||||
Less: Net unrealized gains (losses) on securities AFS, net of tax (3)(4) | (172 | ) | 46 | | ||
Less: Defined benefit plans liability adjustment, net of tax (4) | (2,803 | ) | (4,127 | ) | ||
Less: Accumulated net unrealized losses on cash flow hedges, net of tax (5) | (731 | ) | (909 | ) | ||
Less: Cumulative unrealized net gain related to changes in fair value of financial liabilities attributable to own creditworthiness, net of tax (4)(6) | 190 | | 56 | | ||
Less: Intangible assets: |
|
| ||||
Goodwill, net of related deferred tax liabilities (DTLs) (7) | 22,312 | | 22,805 | | ||
Identifiable intangible assets other than mortgage servicing rights (MSRs), net of related DTLs (4) | 1,661 | | 875 | | ||
Less: Defined benefit pension plan net assets (4) | 326 | | 187 | | ||
Less: Deferred tax assets (DTAs) arising from net operating loss, foreign tax credit and general business credit carry-forwards (4)(8) | 9,504 | | 4,725 | | ||
Less: Excess over 10%/15% limitations for other DTAs, certain common stock investments, and MSRs (4)(8)(9) | 2,985 | | 1,977 | | ||
Less: Deductions applied to Common Equity Tier 1 Capital due to insufficient amount of Additional | - | | 8,082 | | ||
Total Common Equity Tier 1 Capital | $ | 172,747 | | $ | 166,663 | |
Additional Tier 1 Capital |
|
| ||||
Qualifying perpetual preferred stock (2) | $ | 13,830 | | $ | 10,344 | |
Qualifying trust preferred securities (10) | 1,717 | | 1,719 | | ||
Qualifying noncontrolling interests | 12 | | 7 | | ||
Regulatory Capital Adjustment and Deductions: |
|
| ||||
Less: Cumulative unrealized net gain related to changes in fair value of financial liabilities attributable to own creditworthiness, net of tax (4)(6) | 284 | | 223 | | ||
Less: Minimum regulatory capital requirements of insurance underwriting subsidiaries (11) | 271 | | 279 | | ||
Less: Defined benefit pension plan net assets (4) | 489 | | 749 | | ||
Less: DTAs arising from net operating loss, foreign tax credit and general business credit carry-forwards (4)(8) | 14,256 | | 18,901 | | ||
Less: Deductions applied to Common Equity Tier 1 Capital due to insufficient amount of Additional Tier 1 Capital to cover deductions (4) | - | | (8,082 | ) | ||
Total Additional Tier 1 Capital | $ | 259 | | $ | - | |
Total Tier 1 Capital (Common Equity Tier 1 Capital + Additional Tier 1 Capital) | $ | 173,006 | | $ | 166,663 | |
Tier 2 Capital |
|
| ||||
Qualifying subordinated debt (12) | $ | 19,721 | | $ | 17,386 | |
Qualifying noncontrolling interests | 17 | | 12 | | ||
Excess of eligible credit reserves over expected credit losses (13) | 1,239 | | 1,177 | | ||
Regulatory Capital Deduction: |
|
| ||||
Less: Minimum regulatory capital requirements of insurance underwriting subsidiaries (11) | 271 | | 279 | | ||
Total Tier 2 Capital | $ | 20,706 | | $ | 18,296 | |
Total Capital (Tier 1 Capital + Tier 2 Capital) | $ | 193,712 | | $ | 184,959 | |
36
Citigroup Risk-Weighted Assets Under Current Regulatory Standards
(Basel III Advanced Approaches with Transition Arrangements)
In millions of dollars | June 30, | December 31, 2014 (1) | ||||
Credit Risk (14) | $ | 833,470 | | $ | 861,691 | |
Market Risk | 95,405 | | 100,481 | | ||
Operational Risk | 325,000 | | 312,500 | | ||
Total Risk-Weighted Assets | $ | 1,253,875 | | $ | 1,274,672 | |
(1) | Restated to reflect the retrospective adoption of ASU 2014-01 for LIHTC investments, consistent with current period presentation. |
(2) | Issuance costs of $138 million and $124 million related to preferred stock outstanding at June 30, 2015 and December 31, 2014 , respectively, are excluded from common stockholders' equity and netted against preferred stock in accordance with Federal Reserve Board regulatory reporting requirements, which differ from those under U.S. GAAP. |
(3) | In addition, includes the net amount of unamortized loss on held-to-maturity (HTM) securities. This amount relates to securities that were previously transferred from AFS to HTM, and non-credit related factors such as changes in interest rates and liquidity spreads for HTM securities with other-than-temporary impairment. |
(4) | The transition arrangements for significant regulatory capital adjustments and deductions impacting Common Equity Tier 1 Capital and/or Additional Tier 1 Capital are set forth above in the table entitled "Basel III Transition Arrangements: Significant Regulatory Capital Adjustments and Deductions." |
(5) | Common Equity Tier 1 Capital is adjusted for accumulated net unrealized gains (losses) on cash flow hedges included in AOCI that relate to the hedging of items not recognized at fair value on the balance sheet. |
(6) | The cumulative impact of changes in Citigroup's own creditworthiness in valuing liabilities for which the fair value option has been elected and own-credit valuation adjustments on derivatives are excluded from Common Equity Tier 1 Capital, in accordance with the U.S. Basel III rules. |
(7) | Includes goodwill "embedded" in the valuation of significant common stock investments in unconsolidated financial institutions. |
(8) | Of Citi's approximately $47.9 billion of net DTAs at June 30, 2015 , approximately $22.9 billion of such assets were includable in regulatory capital pursuant to the U.S. Basel III rules, while approximately $25.0 billion of such assets were excluded in arriving at regulatory capital. Comprising the excluded net DTAs was an aggregate of approximately $26.7 billion of net DTAs arising from net operating loss, foreign tax credit and general business credit carry-forwards as well as temporary differences, of which $12.5 billion were deducted from Common Equity Tier 1 Capital and $14.2 billion were deducted from Additional Tier 1 Capital. In addition, approximately $1.7 billion of net DTLs, primarily consisting of DTLs associated with goodwill and certain other intangible assets, partially offset by DTAs related to cash flow hedges, are permitted to be excluded prior to deriving the amount of net DTAs subject to deduction under these rules. Separately, under the U.S. Basel III rules, goodwill and these other intangible assets are deducted net of associated DTLs in arriving at Common Equity Tier 1 Capital, while Citi's current cash flow hedges and the related deferred tax effects are not required to be reflected in regulatory capital. |
(9) | Assets subject to 10%/15% limitations include MSRs, DTAs arising from temporary differences and significant common stock investments in unconsolidated financial institutions. At June 30, 2015 and December 31, 2014, the deduction related only to DTAs arising from temporary differences that exceeded the 10% limitation. |
(10) | Represents Citigroup Capital XIII trust preferred securities, which are permanently grandfathered as Tier 1 Capital under the U.S. Basel III rules, as well as non-grandfathered trust preferred securities which are eligible for inclusion in an amount up to 25% and 50%, respectively, during 2015 and 2014, of the aggregate outstanding principal amounts of such issuances as of January 1, 2014. The remaining 75% and 50% of non-grandfathered trust preferred securities are eligible for inclusion in Tier 2 Capital during 2015 and 2014, respectively, in accordance with the transition arrangements for non-qualifying capital instruments under the U.S. Basel III rules. As of June 30, 2015 and December 31, 2014, however, the entire amount of non-grandfathered trust preferred securities was included within Tier 1 Capital, as the amounts outstanding did not exceed the respective threshold for exclusion from Tier 1 Capital. |
(11) | 50% of the minimum regulatory capital requirements of insurance underwriting subsidiaries must be deducted from each of Tier 1 Capital and Tier 2 Capital. |
(12) | Under the transition arrangements of the U.S. Basel III rules, non-qualifying subordinated debt issuances which consist of those with a fixed-to-floating rate step-up feature where the call/step-up date has not passed are eligible for inclusion in Tier 2 Capital during 2015 and 2014 up to 25% and 50%, respectively, of the aggregate outstanding principal amounts of such issuances as of January 1, 2014. |
(13) | Advanced Approaches banking organizations are permitted to include in Tier 2 Capital eligible credit reserves that exceed expected credit losses to the extent that the excess reserves do not exceed 0.6% of credit risk-weighted assets. |
(14) | Under the U.S. Basel III rules, credit risk-weighted assets during the transition period reflect the effects of transitional arrangements related to regulatory capital adjustments and deductions and, as a result, will differ from credit risk-weighted assets derived under full implementation of the rules. |
37
Citigroup Capital Rollforward Under Current Regulatory Standards
(Basel III Advanced Approaches with Transition Arrangements)
In millions of dollars | Three Months Ended | Six Months Ended June 30, 2015 | ||||
Common Equity Tier 1 Capital |
|
| ||||
Balance, beginning of period (1) | $ | 168,021 | | $ | 166,663 | |
Net income | 4,846 | | 9,616 | | ||
Dividends declared | (355 | ) | (514 | ) | ||
Net increase in treasury stock | (1,553 | ) | (1,850 | ) | ||
Net increase in additional paid-in capital (2) | 303 | | 405 | | ||
Net increase in foreign currency translation adjustment net of hedges, net of tax | (148 | ) | (2,210 | ) | ||
Net increase in unrealized gains on securities AFS, net of tax (3) | (374 | ) | (126 | ) | ||
Net change in defined benefit plans liability adjustment, net of tax (3) | 232 | | (836 | ) | ||
Net increase in cumulative unrealized net gain related to changes in fair value of financial liabilities attributable to own creditworthiness, net of tax | (57 | ) | (134 | ) | ||
Net decrease in goodwill, net of related deferred tax liabilities (DTLs) | 136 | | 493 | | ||
Net change in identifiable intangible assets other than mortgage servicing rights (MSRs), net of related DTLs | 13 | | (786 | ) | ||
Net change in defined benefit pension plan net assets | 33 | | (139 | ) | ||
Net increase in deferred tax assets (DTAs) arising from net operating loss, foreign tax credit and general business credit carry-forwards | (228 | ) | (4,779 | ) | ||
Net change in excess over 10%/15% limitations for other DTAs, certain common stock investments and MSRs | 510 | | (1,008 | ) | ||
Net decrease in regulatory capital deduction applied to Common Equity Tier 1 Capital due to insufficient Additional Tier 1 Capital to cover deductions | 1,368 | | 8,082 | | ||
Other | - | | (130 | ) | ||
Net increase in Common Equity Tier 1 Capital | $ | 4,726 | | $ | 6,084 | |
Common Equity Tier 1 Capital Balance, end of period | $ | 172,747 | | $ | 172,747 | |
Additional Tier 1 Capital |
|
| ||||
Balance, beginning of period | $ | - | | $ | - | |
Net increase in qualifying perpetual preferred stock (4) | 1,992 | | 3,486 | | ||
Net change in qualifying trust preferred securities | 7 | | (2 | ) | ||
Net increase in cumulative unrealized net gain related to changes in fair value of financial liabilities attributable to own creditworthiness, net of tax | (85 | ) | (61 | ) | ||
Net decrease in defined benefit pension plan net assets | 49 | | 260 | | ||
Net change in DTAs arising from net operating loss, foreign tax credit and general business credit carry-forwards | (342 | ) | 4,645 | | ||
Net decrease in regulatory capital deduction applied to Common Equity Tier 1 Capital due to insufficient Additional Tier 1 Capital to cover deductions | (1,368 | ) | (8,082 | ) | ||
Other | 6 | | 13 | | ||
Net increase in Additional Tier 1 Capital | $ | 259 | | $ | 259 | |
Tier 1 Capital Balance, end of period | $ | 173,006 | | $ | 173,006 | |
Tier 2 Capital |
|
| ||||
Balance, beginning of period | $ | 17,193 | | $ | 18,296 | |
Net increase in qualifying subordinated debt | 3,221 | | 2,335 | | ||
Net increase in excess of eligible credit reserves over expected credit losses | 286 | | 62 | | ||
Other | 6 | | 13 | | ||
Net increase in Tier 2 Capital | $ | 3,513 | | $ | 2,410 | |
Tier 2 Capital Balance, end of period | $ | 20,706 | | $ | 20,706 | |
Total Capital (Tier 1 Capital + Tier 2 Capital) | $ | 193,712 | | $ | 193,712 | |
(1) | The beginning balance of Common Equity Tier 1 Capital for the six months ended June 30, 2015 has been restated to reflect the retrospective adoption of ASU 2014-01 for LIHTC investments, consistent with current period presentation. |
(2) | Primarily represents an increase in additional paid-in capital related to employee benefit plans. |
38
(3) | Presented net of impact of transition arrangements related to unrealized losses on securities AFS and defined benefit plans liability adjustment under the U.S. Basel III rules. |
(4) | Citi issued approximately $2.0 billion and approximately $3.5 billion of qualifying perpetual preferred stock during the three months and six months ended June 30, 2015 , respectively, which were partially offset by the netting of issuance costs of $8 million and $14 million during those respective periods. |
Citigroup Risk-Weighted Assets Rollforward Under Current Regulatory Standards
(Basel III Advanced Approaches with Transition Arrangements)
In millions of dollars | Three Months Ended | Six Months Ended | ||||
Total Risk-Weighted Assets, beginning of period (1) | $ | 1,260,403 | | $ | 1,274,672 | |
Changes in Credit Risk-Weighted Assets |
|
| ||||
Net change in retail exposures (2) | 7,213 | | (4,617 | ) | ||
Net change in wholesale exposures (3) | 6,135 | | (6,689 | ) | ||
Net increase in repo-style transactions | 67 | | 498 | | ||
Net increase in securitization exposures | 347 | | 2,634 | | ||
Net change in equity exposures | 452 | | (456 | ) | ||
Net decrease in over-the-counter (OTC) derivatives | (3,438 | ) | (2,881 | ) | ||
Net decrease in derivatives CVA (4) | (4,038 | ) | (3,549 | ) | ||
Net decrease in other exposures (5) | (10,451 | ) | (11,764 | ) | ||
Net change in supervisory 6% multiplier (6) | 20 | | (1,397 | ) | ||
Net decrease in Credit Risk-Weighted Assets | $ | (3,693 | ) | $ | (28,221 | ) |
Changes in Market Risk-Weighted Assets |
|
| ||||
Net decrease in risk levels | $ | (808 | ) | $ | (5,712 | ) |
Net change due to model and methodology updates | (2,027 | ) | 636 | | ||
Net decrease in Market Risk-Weighted Assets | $ | (2,835 | ) | $ | (5,076 | ) |
Increase in Operational Risk-Weighted Assets (7) | $ | - | | $ | 12,500 | |
Total Risk-Weighted Assets, end of period | $ | 1,253,875 | | $ | 1,253,875 | |
(1) | The beginning balance of Total Risk-Weighted Assets for the six months ended June 30, 2015 has been restated to reflect the retrospective adoption of ASU 2014-01 for LIHTC investments, consistent with current period presentation. |
(2) | Retail exposures increased during the three months ended June 30, 2015 primarily due to the reclassification from other exposures of certain non-material portfolios, partially offset by reductions in loans and commitments. Conversely, retail exposures decreased during the six months ended June 30, 2015 due to reductions in loans and commitments and the impact of FX translation, partially offset by the reclassification from other exposures of certain non-material portfolios. |
(3) | Wholesale exposures increased during the three months ended June 30, 2015 primarily due to an increase in commitments and the reclassification from other exposures of certain non-material portfolios. Conversely, wholesale exposures decreased during the six months ended June 30, 2015 due to reductions in commitments and the impact of FX translation, partially offset by the reclassification from other exposures of certain non-material portfolios. |
(4) | Derivatives CVA decreased during both the three and six months ended June 30, 2015, driven by exposure reduction and credit spread changes related to certain sovereign obligors. |
(5) | Other exposures include cleared transactions, unsettled transactions, assets other than those reportable in specific exposure categories and non-material portfolios. Other exposures decreased during both the three and six months ended June 30, 2015 as a result of the reclassification to retail exposures and wholesale exposures of certain non-material portfolios. |
(6) | Supervisory 6% multiplier does not apply to derivatives CVA. |
(7) | Operational risk-weighted assets increased by $12.5 billion during the first quarter of 2015, reflecting an evaluation of ongoing events in the banking industry as well as continued enhancements to Citi's operational risk model. |
39
Capital Resources of Citigroup's Subsidiary U.S. Depository Institutions Under Current Regulatory Standards
Citigroup's subsidiary U.S. depository institutions are also subject to regulatory capital standards issued by their respective primary federal bank regulatory agencies, which are similar to the standards of the Federal Reserve Board.
The following tables set forth the capital tiers, risk-weighted assets, risk-based capital ratios, quarterly adjusted average total assets, Total Leverage Exposure and leverage ratios under current regulatory standards (reflecting Basel III Transition Arrangements) for Citibank, N.A., Citi's primary subsidiary U.S. depository institution, as of June 30, 2015 and December 31, 2014 .
Citibank, N.A. Capital Components and Ratios Under Current Regulatory Standards (Basel III Transition Arrangements)
| June 30, 2015 |
| December 31, 2014 (1) | ||||||||||
In millions of dollars, except ratios | Advanced Approaches | Standardized Approach |
| Advanced Approaches | Standardized Approach (2) | ||||||||
Common Equity Tier 1 Capital | $ | 129,033 | | $ | 129,033 | |
| $ | 128,262 | | $ | 128,262 | |
Tier 1 Capital | 129,033 | | 129,033 | |
| 128,262 | | 128,262 | | ||||
Total Capital (Tier 1 Capital + Tier 2 Capital) (3) | 140,316 | | 151,595 | |
| 139,246 | | 151,124 | | ||||
Risk-Weighted Assets | 913,651 | | 1,015,880 | |
| 945,407 | | 1,044,768 | | ||||
Common Equity Tier 1 Capital ratio (4) | 14.12 | % | 12.70 | % |
| 13.57 | % | 12.28 | % | ||||
Tier 1 Capital ratio (4) | 14.12 | | 12.70 | |
| 13.57 | | 12.28 | | ||||
Total Capital ratio (4) | 15.36 | | 14.92 | |
| 14.73 | | 14.46 | | ||||
In millions of dollars, except ratios | June 30, 2015 |
| December 31, 2014 (1) | ||||||
Quarterly Adjusted Average Total Assets (5) |
| $ | 1,315,273 | |
|
| $ | 1,366,910 | |
Total Leverage Exposure (6) |
| 1,864,298 | |
|
| 1,954,833 | | ||
Tier 1 Leverage ratio |
| 9.81 | % |
|
| 9.38 | % | ||
Supplementary Leverage ratio |
| 6.92 | |
|
| 6.56 | | ||
(1) | Restated to reflect the retrospective adoption of ASU 2014-01 for LIHTC investments, consistent with current period presentation. |
(2) | Pro forma presentation to reflect the application of the Basel III 2015 Standardized Approach, consistent with current period presentation. |
(3) | Under the Advanced Approaches framework eligible credit reserves that exceed expected credit losses are eligible for inclusion in Tier 2 Capital to the extent the excess reserves do not exceed 0.6% of credit risk-weighted assets, which differs from the Standardized Approach in which the allowance for credit losses is includable in Tier 2 Capital up to 1.25% of credit risk-weighted assets, with any excess allowance for credit losses being deducted in arriving at credit risk-weighted assets. |
(4) | As of June 30, 2015 and December 31, 2014, Citibank, N.A.'s reportable Common Equity Tier 1 Capital, Tier 1 Capital, and Total Capital ratios were the lower derived under the Basel III Standardized Approach. |
(5) | Tier 1 Leverage ratio denominator. |
(6) | Supplementary Leverage ratio denominator. |
As indicated in the table above, Citibank N.A.'s capital ratios at June 30, 2015 were in excess of the stated minimum requirements under the U.S. Basel III rules. In addition, Citibank, N.A. was also "well capitalized" as of June 30, 2015 under the revised PCA regulations which became effective January 1, 2015.
40
Impact of Changes on Citigroup and Citibank, N.A. Capital Ratios Under Current Regulatory Capital Standards
The following tables present the estimated sensitivity of Citigroup's and Citibank, N.A.'s capital ratios to changes of $100 million in Common Equity Tier 1 Capital, Tier 1 Capital and Total Capital (numerator), and changes of $1 billion in Advanced Approaches and Standardized Approach risk-weighted assets, quarterly adjusted average total assets, as well as Total Leverage Exposure (denominator), under current regulatory capital standards (reflecting Basel III Transition Arrangements), as of
June 30, 2015 . This information is provided for the purpose of analyzing the impact that a change in Citigroup's or Citibank, N.A.'s financial position or results of operations could have on these ratios. These sensitivities only consider a single change to either a component of capital, risk-weighted assets, quarterly adjusted average total assets, or Total Leverage Exposure. Accordingly, an event that affects more than one factor may have a larger basis point impact than is reflected in these tables.
Impact of Changes on Citigroup and Citibank, N.A. Risk-Based Capital Ratios (Basel III Transition Arrangements)
| Common Equity Tier 1 Capital ratio | Tier 1 Capital ratio | Total Capital ratio | |||
| Impact of $100 million change in Common Equity Tier 1 Capital | Impact of $1 billion change in risk- weighted assets | Impact of $100 million change in Tier 1 Capital | Impact of $1 billion change in risk- weighted assets | Impact of $100 million change in Total Capital | Impact of $1 billion change in risk- weighted assets |
Citigroup |
|
|
|
|
|
|
Advanced Approaches | 0.8 bps | 1.1 bps | 0.8 bps | 1.1 bps | 0.8 bps | 1.2 bps |
Standardized Approach | 0.8 bps | 1.2 bps | 0.8 bps | 1.2 bps | 0.8 bps | 1.5 bps |
Citibank, N.A. |
|
|
|
|
|
|
Advanced Approaches | 1.1 bps | 1.5 bps | 1.1 bps | 1.5 bps | 1.1 bps | 1.7 bps |
Standardized Approach | 1.0 bps | 1.3 bps | 1.0 bps | 1.3 bps | 1.0 bps | 1.5 bps |
Impact of Changes on Citigroup and Citibank, N.A. Leverage Ratios (Basel III Transition Arrangements)
| Tier 1 Leverage ratio | Supplementary Leverage ratio | ||
| Impact of $100 million change in Tier 1 Capital | Impact of $1 billion change in quarterly adjusted average total assets | Impact of $100 million change in Tier 1 Capital | Impact of $1 billion change in Total Leverage Exposure |
Citigroup | 0.6 bps | 0.5 bps | 0.4 bps | 0.3 bps |
Citibank, N.A. | 0.8 bps | 0.7 bps | 0.5 bps | 0.4 bps |
Citigroup Broker-Dealer Subsidiaries
At June 30, 2015 , Citigroup Global Markets Inc., a U.S. broker-dealer registered with the SEC that is an indirect wholly owned subsidiary of Citigroup, had net capital, computed in accordance with the SEC's net capital rule, of $6.9 billion, which exceeded the minimum requirement by $5.6 billion.
In addition, certain of Citi's other broker-dealer subsidiaries are subject to regulation in the countries in which they do business, including requirements to maintain specified levels of net capital or its equivalent. Citigroup's other broker-dealer subsidiaries were in compliance with
their capital requirements at June 30, 2015 .
41
Basel III (Full Implementation)
Citigroup's Capital Resources Under Basel III
(Full Implementation)
Citi currently estimates that its effective minimum Common Equity Tier 1 Capital, Tier 1 Capital and Total Capital ratio requirements under the U.S. Basel III rules, on a fully implemented basis and assuming a 3.5% GSIB surcharge, may be 10.5%, 12% and 14%, respectively.
Further, under the U.S. Basel III rules, Citi must also comply with a 4% minimum Tier 1 Leverage ratio requirement and an effective 5% minimum Supplementary Leverage ratio requirement.
The following tables set forth the capital tiers, risk-weighted assets, risk-based capital ratios, quarterly adjusted average total assets, Total Leverage Exposure and leverage ratios, assuming full implementation under the U.S. Basel III rules, for Citi as of June 30, 2015 and December 31, 2014 .
Citigroup Capital Components and Ratios Under Basel III (Full Implementation)
| June 30, 2015 |
| December 31, 2014 (1) | ||||||||||
In millions of dollars, except ratios | Advanced Approaches | Standardized Approach |
| Advanced Approaches | Standardized Approach | ||||||||
Common Equity Tier 1 Capital | $ | 145,435 | | $ | 145,435 | |
| $ | 136,597 | | $ | 136,597 | |
Tier 1 Capital | 160,391 | | 160,391 | |
| 148,066 | | 148,066 | | ||||
Total Capital (Tier 1 Capital + Tier 2 Capital) (2) | 180,846 | | 193,693 | |
| 165,454 | | 178,413 | | ||||
Risk-Weighted Assets | 1,278,593 | | 1,211,694 | |
| 1,292,605 | | 1,228,488 | | ||||
Common Equity Tier 1 Capital ratio (3)(4) | 11.37 | % | 12.00 | % |
| 10.57 | % | 11.12 | % | ||||
Tier 1 Capital ratio (3)(4) | 12.54 | | 13.24 | |
| 11.45 | | 12.05 | | ||||
Total Capital ratio (3)(4) | 14.14 | | 15.99 | |
| 12.80 | | 14.52 | | ||||
In millions of dollars, except ratios | June 30, 2015 |
| December 31, 2014 (1) | ||||||
Quarterly Adjusted Average Total Assets (5) |
| $ | 1,778,835 | |
|
| $ | 1,835,637 | |
Total Leverage Exposure (6) |
| 2,386,189 | |
|
| 2,492,636 | | ||
Tier 1 Leverage ratio (4) |
| 9.02 | % |
|
| 8.07 | % | ||
Supplementary Leverage ratio (4) |
| 6.72 | |
|
| 5.94 | | ||
(1) | Restated to reflect the retrospective adoption of ASU 2014-01 for LIHTC investments, consistent with current period presentation. |
(2) | Under the Advanced Approaches framework eligible credit reserves that exceed expected credit losses are eligible for inclusion in Tier 2 Capital to the extent the excess reserves do not exceed 0.6% of credit risk-weighted assets, which differs from the Standardized Approach in which the allowance for credit losses is includable in Tier 2 Capital up to 1.25% of credit risk-weighted assets, with any excess allowance for credit losses being deducted in arriving at credit risk-weighted assets. |
(3) | As of June 30, 2015 and December 31, 2014 , Citi's Common Equity Tier 1 Capital, Tier 1 Capital, and Total Capital ratios were the lower derived under the Basel III Advanced Approaches framework. |
(4) | Citi's Basel III capital ratios, on a fully implemented basis, are non-GAAP financial measures. |
(5) | Tier 1 Leverage ratio denominator. |
(6) | Supplementary Leverage ratio denominator. |
42
Common Equity Tier 1 Capital Ratio
Citi's Common Equity Tier 1 Capital ratio was 11.4% at June 30, 2015 , compared to 11.1% at March 31, 2015 and 10.6% at December 31, 2014 (all based on application of the Advanced Approaches for determining total risk-weighted assets). The quarter-over-quarter increase in the ratio was largely attributable to Common Equity Tier 1 Capital benefits resulting from quarterly net income of $4.8 billion and the favorable effects attributable to DTA utilization of approximately $0.3 billion, offset in part by a $1.7 billion return of capital to common shareholders in the form of share repurchases and dividends. Similarly, the increase in Citi's Common Equity Tier 1 Capital ratio from year-end 2014 reflected continued growth in Common Equity Tier 1 Capital resulting from net income of $9.6 billion as well as the favorable effects attributable to DTA utilization of approximately $1.5 billion, offset in part by the return of capital to common shareholders and a net decline in AOCI.
43
Components of Citigroup Capital Under Basel III (Advanced Approaches with Full Implementation)
In millions of dollars | June 30, | December 31, 2014 (1) | ||||
Common Equity Tier 1 Capital |
|
| ||||
Citigroup common stockholders' equity (2) | $ | 205,610 | | $ | 199,841 | |
Add: Qualifying noncontrolling interests | 146 | | 165 | | ||
Regulatory Capital Adjustments and Deductions: |
|
| ||||
Less: Accumulated net unrealized losses on cash flow hedges, net of tax (3) | (731 | ) | (909 | ) | ||
Less: Cumulative unrealized net gain related to changes in fair value of financial liabilities attributable to own creditworthiness, net of tax (4) | 474 | | 279 | | ||
Less: Intangible assets: |
|
| ||||
Goodwill, net of related deferred tax liabilities (DTLs) (5) | 22,312 | | 22,805 | | ||
Identifiable intangible assets other than mortgage servicing rights (MSRs), net of related DTLs | 4,153 | | 4,373 | | ||
Less: Defined benefit pension plan net assets | 815 | | 936 | | ||
Less: Deferred tax assets (DTAs) arising from net operating loss, foreign tax credit and general business credit carry-forwards (6) | 23,760 | | 23,626 | | ||
Less: Excess over 10%/15% limitations for other DTAs, certain common stock investments, and MSRs (6)(7) | 9,538 | | 12,299 | | ||
Total Common Equity Tier 1 Capital | $ | 145,435 | | $ | 136,597 | |
Additional Tier 1 Capital |
|
| ||||
Qualifying perpetual preferred stock (2) | $ | 13,830 | | $ | 10,344 | |
Qualifying trust preferred securities (8) | 1,366 | | 1,369 | | ||
Qualifying noncontrolling interests | 31 | | 35 | | ||
Regulatory Capital Deduction: |
|
| ||||
Less: Minimum regulatory capital requirements of insurance underwriting subsidiaries (9) | 271 | | 279 | | ||
Total Additional Tier 1 Capital | $ | 14,956 | | $ | 11,469 | |
Total Tier 1 Capital (Common Equity Tier 1 Capital + Additional Tier 1 Capital) | $ | 160,391 | | $ | 148,066 | |
Tier 2 Capital |
|
| ||||
Qualifying subordinated debt (10) | $ | 19,095 | | $ | 16,094 | |
Qualifying trust preferred securities (11) | 351 | | 350 | | ||
Qualifying noncontrolling interests | 41 | | 46 | | ||
Excess of eligible credit reserves over expected credit losses (12) | 1,239 | | 1,177 | | ||
Regulatory Capital Deduction: |
|
| ||||
Less: Minimum regulatory capital requirements of insurance underwriting subsidiaries (9) | 271 | | 279 | | ||
Total Tier 2 Capital | $ | 20,455 | | $ | 17,388 | |
Total Capital (Tier 1 Capital + Tier 2 Capital) (13) | $ | 180,846 | | $ | 165,454 | |
(1) | Restated to reflect the retrospective adoption of ASU 2014-01 for LIHTC investments, consistent with current period presentation. |
(2) | Issuance costs of $138 million and $124 million related to preferred stock outstanding at June 30, 2015 and December 31, 2014 , respectively, are excluded from common stockholders' equity and netted against preferred stock in accordance with Federal Reserve Board regulatory reporting requirements, which differ from those under U.S. GAAP. |
(3) | Common Equity Tier 1 Capital is adjusted for accumulated net unrealized gains (losses) on cash flow hedges included in AOCI that relate to the hedging of items not recognized at fair value on the balance sheet. |
(4) | The cumulative impact of changes in Citigroup's own creditworthiness in valuing liabilities for which the fair value option has been elected and own-credit valuation adjustments on derivatives are excluded from Common Equity Tier 1 Capital, in accordance with the U.S. Basel III rules. |
(5) | Includes goodwill "embedded" in the valuation of significant common stock investments in unconsolidated financial institutions. |
(6) | Of Citi's approximately $47.9 billion of net DTAs at June 30, 2015 , approximately $16.3 billion of such assets were includable in regulatory capital pursuant to the U.S. Basel III rules, while approximately $31.6 billion of such assets were excluded in arriving at Common Equity Tier 1 Capital. Comprising the excluded net DTAs was an aggregate of approximately $33.3 billion of net DTAs arising from net operating loss, foreign tax credit and general business credit carry-forwards as well as temporary differences that were deducted from Common Equity Tier 1 Capital. In addition, approximately $1.7 billion of net DTLs, primarily consisting of DTLs associated with goodwill and certain other intangible assets, partially offset by DTAs related to cash flow hedges, are permitted to be excluded prior to deriving the amount of net DTAs subject to deduction under these rules. Separately, under the U.S. Basel III rules, goodwill and these other intangible assets are deducted net of associated DTLs in arriving at Common Equity Tier 1 Capital, while Citi's current cash flow hedges and the related deferred tax effects are not required to be reflected in regulatory capital. |
(7) | Assets subject to 10%/15% limitations include MSRs, DTAs arising from temporary differences and significant common stock investments in unconsolidated financial institutions. At June 30, 2015 , the deduction related only to DTAs arising from temporary differences that exceeded the 10% limitation, while at December 31, 2014, the deduction related to all three assets which exceeded both the 10% and 15% limitations. |
(8) | Represents Citigroup Capital XIII trust preferred securities, which are permanently grandfathered as Tier 1 Capital under the U.S. Basel III rules. |
44
(9) | 50% of the minimum regulatory capital requirements of insurance underwriting subsidiaries must be deducted from each of Tier 1 Capital and Tier 2 Capital. |
(10) | Non-qualifying subordinated debt issuances which consist of those with a fixed-to-floating rate step-up feature where the call/step-up date has not passed are excluded from Tier 2 Capital. |
(11) | Represents the amount of non-grandfathered trust preferred securities eligible for inclusion in Tier 2 Capital under the U.S. Basel III rules, which will be fully phased-out of Tier 2 Capital by January 1, 2022. |
(12) | Advanced Approaches banking organizations are permitted to include in Tier 2 Capital eligible credit reserves that exceed expected credit losses to the extent that the excess reserves do not exceed 0.6% of credit risk-weighted assets. |
(13) | Total Capital as calculated under Advanced Approaches, which differs from the Standardized Approach in the treatment of the amount of eligible credit reserves includable in Tier 2 Capital. |
In millions of dollars | Three Months Ended | Six Months Ended | ||||
Common Equity Tier 1 Capital |
|
| ||||
Balance, beginning of period (1) | $ | 141,945 | | $ | 136,597 | |
Net income | 4,846 | | 9,616 | | ||
Dividends declared | (355 | ) | (514 | ) | ||
Net increase in treasury stock | (1,553 | ) | (1,850 | ) | ||
Net increase in additional paid-in capital (2) | 303 | | 405 | | ||
Net increase in foreign currency translation adjustment net of hedges, net of tax | (148 | ) | (2,210 | ) | ||
Net increase in unrealized gains on securities AFS, net of tax | (935 | ) | (344 | ) | ||
Net decrease in defined benefit plans liability adjustment, net of tax | 578 | | 488 | | ||
Net increase in cumulative unrealized net gain related to changes in fair value of financial liabilities attributable to own creditworthiness, net of tax | (142 | ) | (195 | ) | ||
Net decrease in goodwill, net of related deferred tax liabilities (DTLs) | 136 | | 493 | | ||
Net decrease in identifiable intangible assets other than mortgage servicing rights (MSRs), net of related DTLs | 31 | | 220 | | ||
Net decrease in defined benefit pension plan net assets | 82 | | 121 | | ||
Net increase in deferred tax assets (DTAs) arising from net operating loss, foreign tax credit and general business credit carry-forwards | (570 | ) | (134 | ) | ||
Net decrease in excess over 10%/15% limitations for other DTAs, certain common stock investments and MSRs | 1,217 | | 2,761 | | ||
Other | - | | (19 | ) | ||
Net increase in Common Equity Tier 1 Capital | $ | 3,490 | | $ | 8,838 | |
Common Equity Tier 1 Capital Balance, end of period | $ | 145,435 | | $ | 145,435 | |
Additional Tier 1 Capital |
|
| ||||
Balance, beginning of period | $ | 12,960 | | $ | 11,469 | |
Net increase in qualifying perpetual preferred stock (3) | 1,992 | | 3,486 | | ||
Net decrease in qualifying trust preferred securities | (2 | ) | (3 | ) | ||
Other | 6 | | 4 | | ||
Net increase in Additional Tier 1 Capital | $ | 1,996 | | $ | 3,487 | |
Tier 1 Capital Balance, end of period | $ | 160,391 | | $ | 160,391 | |
Tier 2 Capital |
|
| ||||
Balance, beginning of period | $ | 16,912 | | $ | 17,388 | |
Net increase in qualifying subordinated debt | 3,241 | | 3,001 | | ||
Net increase in excess of eligible credit reserves over expected credit losses | 286 | | 62 | | ||
Other | 16 | | 4 | | ||
Net increase in Tier 2 Capital | $ | 3,543 | | $ | 3,067 | |
Tier 2 Capital Balance, end of period | $ | 20,455 | | $ | 20,455 | |
Total Capital (Tier 1 Capital + Tier 2 Capital) | $ | 180,846 | | $ | 180,846 | |
(1) | The beginning balance of Common Equity Tier 1 Capital for the six months ended June 30, 2015 has been restated to reflect the retrospective adoption of ASU 2014-01 for LIHTC investments, consistent with current period presentation. |
(2) | Primarily represents an increase in additional paid-in capital related to employee benefit plans. |
45
(3) | Citi issued approximately $2.0 billion and approximately $3.5 billion of qualifying perpetual preferred stock during the three months and six months ended June 30, 2015 , respectively, which were partially offset by the netting of issuance costs of $8 million and $14 million during those respective periods. |
Citigroup Risk-Weighted Assets Under Basel III (Full Implementation) at June 30, 2015
| Advanced Approaches |
| Standardized Approach | ||||||||||||||||
In millions of dollars | Citicorp | Citi Holdings | Total |
| Citicorp | Citi Holdings | Total | ||||||||||||
Credit Risk | $ | 744,958 | | $ | 113,230 | | $ | 858,188 | |
| $ | 1,021,440 | | $ | 94,459 | | $ | 1,115,899 | |
Market Risk | 87,925 | | 7,480 | | 95,405 | |
| 88,315 | | 7,480 | | 95,795 | | ||||||
Operational Risk | 275,921 | | 49,079 | | 325,000 | |
| - | | - | | - | | ||||||
Total Risk-Weighted Assets | $ | 1,108,804 | | $ | 169,789 | | $ | 1,278,593 | |
| $ | 1,109,755 | | $ | 101,939 | | $ | 1,211,694 | |
Citigroup Risk-Weighted Assets Under Basel III (Full Implementation) at December 31, 2014 (1)
| Advanced Approaches |
| Standardized Approach | ||||||||||||||||
In millions of dollars | Citicorp | Citi Holdings | Total |
| Citicorp | Citi Holdings | Total | ||||||||||||
Credit Risk | $ | 752,247 | | $ | 127,377 | | $ | 879,624 | |
| $ | 1,023,961 | | $ | 104,046 | | $ | 1,128,007 | |
Market Risk | 95,824 | | 4,657 | | 100,481 | |
| 95,824 | | 4,657 | | 100,481 | | ||||||
Operational Risk | 255,155 | | 57,345 | | 312,500 | |
| - | | - | | - | | ||||||
Total Risk-Weighted Assets | $ | 1,103,226 | | $ | 189,379 | | $ | 1,292,605 | |
| $ | 1,119,785 | | $ | 108,703 | | $ | 1,228,488 | |
(1) | Restated to reflect the retrospective adoption of ASU 2014-01 for LIHTC investments, consistent with current period presentation. |
Total risk-weighted assets under the Basel III Advanced Approaches declined from year-end 2014, as the decrease in credit risk-weighted assets primarily attributable to the impact of FX translation and the ongoing decline in Citi Holdings assets was partially offset by an increase in operational risk-weighted assets reflecting an evaluation of ongoing events in the banking industry as well as continued enhancements to Citi's operational risk model.
Total risk-weighted assets under the Basel III Standardized Approach decreased during the first six months of 2015 primarily due to a decline in credit risk weighted assets resulting from changes in foreign exchange rates.
46
Citigroup Risk-Weighted Assets Rollforward (Basel III Advanced Approaches with Full Implementation)
In millions of dollars | Three Months Ended | Six Months Ended | ||||
Total Risk-Weighted Assets, beginning of period (1) | $ | 1,283,758 | | $ | 1,292,605 | |
Changes in Credit Risk-Weighted Assets |
|
| ||||
Net change in retail exposures (2) | 7,213 | | (4,617 | ) | ||
Net change in wholesale exposures (3) | 6,135 | | (6,689 | ) | ||
Net increase in repo-style transactions | 67 | | 498 | | ||
Net increase in securitization exposures | 347 | | 2,634 | | ||
Net change in equity exposures | 314 | | (300 | ) | ||
Net decrease in over-the-counter (OTC) derivatives | (3,438 | ) | (2,881 | ) | ||
Net decrease in derivatives CVA (4) | (4,038 | ) | (3,549 | ) | ||
Net decrease in other exposures (5) | (9,027 | ) | (5,519 | ) | ||
Net change in supervisory 6% multiplier (6) | 97 | | (1,013 | ) | ||
Net decrease in Credit Risk-Weighted Assets | $ | (2,330 | ) | $ | (21,436 | ) |
Changes in Market Risk-Weighted Assets |
|
| ||||
Net decrease in risk levels | $ | (808 | ) | $ | (5,712 | ) |
Net change due to model and methodology updates | (2,027 | ) | 636 | | ||
Net decrease in Market Risk-Weighted Assets | $ | (2,835 | ) | $ | (5,076 | ) |
Increase in Operational Risk-Weighted Assets (7) | $ | - | | $ | 12,500 | |
Total Risk-Weighted Assets, end of period | $ | 1,278,593 | | $ | 1,278,593 | |
(1) | The beginning balance of Total Risk-Weighted Assets for the six months ended June 30, 2015 has been restated to reflect the retrospective adoption of ASU 2014-01 for LIHTC investments, consistent with current period presentation. |
(2) | Retail exposures increased during the three months ended June 30, 2015 primarily due to the reclassification from other exposures of certain non-material portfolios, partially offset by reductions in loans and commitments. Conversely, retail exposures decreased during the six months ended June 30, 2015 due to reductions in loans and commitments and the impact of FX translation, partially offset by the reclassification from other exposures of certain non-material portfolios. |
(3) | Wholesale exposures increased during the three months ended June 30, 2015 primarily due to an increase in commitments and the reclassification from other exposures of certain non-material portfolios. Conversely, wholesale exposures decreased during the six months ended June 30, 2015 due to reductions in commitments and the impact of FX translation, partially offset by the reclassification from other exposures of certain non-material portfolios. |
(4) | Derivatives CVA decreased during both the three and six months ended June 30, 2015, driven by exposure reduction and credit spread changes related to certain sovereign obligors. |
(5) | Other exposures include cleared transactions, unsettled transactions, assets other than those reportable in specific exposure categories and non-material portfolios. Other exposures decreased during both the three and six months ended June 30, 2015 as a result of the reclassification to retail exposures and wholesale exposures of certain non-material portfolios. |
(6) | Supervisory 6% multiplier does not apply to derivatives CVA. |
(7) | Operational risk-weighted assets increased by $12.5 billion during the first quarter of 2015, reflecting an evaluation of ongoing events in the banking industry as well as continued enhancements to Citi's operational risk model. |
47
Supplementary Leverage Ratio
Citigroup's Supplementary Leverage ratio under the U.S. Basel III rules was 6.7% for the second quarter of 2015, compared to 6.4% for the first quarter of 2015 and an estimated 5.9% for the fourth quarter of 2014. The growth in the ratio quarter-over-quarter was principally driven by an increase in Tier 1 Capital attributable largely to net income of $4.8 billion, an approximately $2.0 billion noncumulative perpetual preferred stock issuance and the beneficial effects associated with approximately $0.3 billion of DTA utilization, partially offset by a $1.7 billion return of capital to common shareholders in the form of share repurchases and dividends. The growth in the ratio
from the fourth quarter of 2014 was also principally driven by an increase in Tier 1 Capital attributable largely to year-to-date net income, a decrease in Total Leverage Exposure, and approximately $3.5 billion of perpetual preferred stock issuances, offset in part by the return of capital to common shareholders.
The following table sets forth Citi's Supplementary Leverage ratio and related components, assuming full implementation under the U.S. Basel III rules, for the three months ended June 30, 2015 and December 31, 2014.
Citigroup Basel III Supplementary Leverage Ratios and Related Components (Full Implementation) (1)
In millions of dollars, except ratios | June 30, 2015 | December 31, 2014 (2) | ||||
Tier 1 Capital | $ | 160,391 | | $ | 148,066 | |
Total Leverage Exposure (TLE) |
|
| ||||
On-balance sheet assets (3) | $ | 1,839,683 | | $ | 1,899,955 | |
Certain off-balance sheet exposures: (4) |
|
| ||||
Potential future exposure (PFE) on derivative contracts | 214,777 | | 240,712 | | ||
Effective notional of sold credit derivatives, net (5) | 90,273 | | 96,869 | | ||
Counterparty credit risk for repo-style transactions (6) | 26,439 | | 28,073 | | ||
Unconditionally cancellable commitments | 60,853 | | 61,673 | | ||
Other off-balance sheet exposures | 215,013 | | 229,672 | | ||
Total of certain off-balance sheet exposures | $ | 607,355 | | $ | 656,999 | |
Less: Tier 1 Capital deductions | 60,849 | | 64,318 | | ||
Total Leverage Exposure | $ | 2,386,189 | | $ | 2,492,636 | |
Supplementary Leverage ratio | 6.72 | % | 5.94 | % | ||
(1) | Citi's Supplementary Leverage ratio, on a fully implemented basis, is a non-GAAP financial measure. |
(2) | Restated to reflect the retrospective adoption of ASU 2014-01 for LIHTC investments, consistent with current period presentation. |
(3) | Represents the daily average of on-balance sheet assets for the quarter. |
(4) | Represents the average of certain off-balance sheet exposures calculated as of the last day of each month in the quarter. |
(5) | Under the U.S. Basel III rules, banking organizations are required to include in TLE the effective notional amount of sold credit derivatives, with netting of exposures permitted if certain conditions are met. |
(6) | Repo-style transactions include repurchase or reverse repurchase transactions and securities borrowing or securities lending transactions. |
Citibank, N.A.'s Supplementary Leverage ratio, assuming full implementation under the U.S. Basel III rules, was 6.7% for the second quarter of 2015, compared to 6.6% for the first quarter of 2015 and an estimated 6.2% for the fourth quarter of 2014. The growth in the ratio from the first quarter of 2015 and the fourth quarter of 2014 was principally driven by Tier 1 Capital benefits resulting from quarterly net income and DTA utilization, as well as an overall reduction in Total Leverage Exposure, partially offset by cash dividends paid by Citibank, N.A. to its parent, Citicorp, and which were subsequently remitted to Citigroup.
48
Regulatory Capital Standards Developments
GSIB Surcharge
In July 2015, the Federal Reserve Board released a final rule which imposes a risk-based capital surcharge upon U.S. bank holding companies that are identified as GSIBs, including Citi. The final rule modifies the proposed rule issued in December 2014, in part, by adjusting the methodology used to calculate the GSIB surcharge in certain respects.
Under the Federal Reserve Board's final rule, consistent with the Basel Committee's methodology, identification of a GSIB would be based primarily on quantitative measurement indicators underlying five equally weighted broad categories of systemic importance: (i) size, (ii) interconnectedness, (iii) cross-jurisdictional activity, (iv) substitutability, and (v) complexity. With the exception of size, each of the other categories are comprised of multiple indicators also of equal weight, and amounting to 12 indicators in total.
A U.S. banking organization that is designated a GSIB under the established methodology will be required to calculate a surcharge using two methods and will be subject to the higher of the resulting two surcharges. The first method ("method 1"), which was unchanged from the December 2014 proposed rule, is based on the same five broad categories of systemic importance used to identify a GSIB. Under the second method ("method 2"), the substitutability indicator is replaced with a measure intended to assess the extent of a GSIB's reliance on short-term wholesale funding. The final rule, however, reduces the weight assigned to certain unsecured short-term wholesale funding sources as compared to the proposed rule. Further, under the final rule, method 2 was revised to incorporate fixed measures of systemic importance and application of an average foreign exchange rate over a three-year period, whereas the method 2 calculation under the proposed rule was determined using relative measures of systemic importance across certain global banking organizations and a single-day foreign exchange rate. The changes to the method 2 calculation in the final rule generally enhance the predictability and management of a GSIB's surcharge as compared to the proposed rule.
GSIB surcharges under the final rule, which are required to be comprised entirely of Common Equity Tier 1 Capital, initially range from 1.0% to 4.5% of total risk-weighted assets. Moreover, the GSIB surcharge is an extension of the Capital Conservation Buffer and, if invoked, any Countercyclical Capital Buffer, and would result in restrictions on earnings distributions (e.g., dividends, equity repurchases, and discretionary executive bonuses) should the surcharge be drawn upon to absorb losses during periods of financial or economic stress, with the degree of such restrictions based upon the extent to which the surcharge is drawn.
Under the final rule, like that of the Basel Committee's rule, the GSIB surcharge will be introduced in parallel with the Capital Conservation Buffer and, if applicable, any Countercyclical Capital Buffer, commencing phase-in on January 1, 2016 and becoming fully effective on January 1, 2019.
Citi currently estimates its GSIB surcharge under the Federal Reserve Board's final rule as being 3.5%.
49
Tangible Common Equity, Tangible Book Value Per Share and Book Value Per Share
Tangible common equity (TCE), as currently defined by Citi, represents common equity less goodwill and other intangible assets (other than MSRs). Other companies may calculate TCE in a different manner. TCE and tangible book value per share are non-GAAP financial measures.
In millions of dollars or shares, except per share amounts | June 30, | December 31, 2014 (1) | ||||
Total Citigroup stockholders' equity | $ | 219,440 | | $ | 210,185 | |
Less: Preferred stock | 13,968 | | 10,468 | | ||
Common equity | $ | 205,472 | | $ | 199,717 | |
Less: |
|
| ||||
Goodwill | 23,012 | | 23,592 | | ||
Intangible assets (other than MSRs) | 4,071 | | 4,566 | | ||
Goodwill and intangible assets (other than MSRs) related to assets held-for-sale | 274 | | 71 | | ||
Tangible common equity (TCE) | $ | 178,115 | | $ | 171,488 | |
|
|
| ||||
Common shares outstanding (CSO) | 3,009.8 | | 3,023.9 | | ||
Tangible book value per share (TCE/CSO) | $ | 59.18 | | $ | 56.71 | |
Book value per share (common equity/CSO) | $ | 68.27 | | $ | 66.05 | |
(1) | Restated to reflect the retrospective adoption of ASU 2014-01 for LIHTC investments, consistent with current period presentation. |
50
Managing Global Risk Table of Contents
|
|
| |
|
| Page | |
MANAGING GLOBAL RISK |
| 52 | |
CREDIT RISK (1) |
| 53 | |
Loans Outstanding |
| 53 | |
Details of Credit Loss Experience |
| 54 | |
Allowance for Loan Losses |
| 56 | |
Non-Accrual Loans and Assets and Renegotiated Loans |
| 57 | |
North America Consumer Mortgage Lending |
| 61 | |
Consumer Loan Details |
| 66 | |
Corporate Credit Details |
| 68 | |
MARKET RISK (1) |
| 71 | |
Funding and Liquidity Risk |
| 71 | |
High-Quality Liquid Assets |
| 71 | |
Deposits |
| 72 | |
Long-Term Debt |
| 72 | |
Secured Financing Transactions and Short-Term Borrowings |
| 74 | |
Liquidity Coverage Ratio (LCR) |
| 75 | |
Credit Ratings |
| 76 | |
Price Risk |
| 78 | |
Price Risk-Non-Trading Portfolios (including Interest Rate Exposure) |
| 78 | |
Price Risk-Trading Portfolios (including VAR) |
| 89 | |
COUNTRY AND CROSS-BORDER RISK |
| 91 | |
Country Risk |
| 91 | |
Cross-Border Risk |
| 93 | |
(1) | For additional information regarding certain credit risk, market risk and other quantitative and qualitative information, refer to Citi's Pillar 3 Basel III Advanced Approaches Disclosures, as required by the rules of the Federal Reserve Board, on Citi's Investor Relations website. |
51
MANAGING GLOBAL RISK
Citigroup believes that effective risk management is of primary importance to its overall operations. Accordingly, Citi's risk management process has been designed to monitor, evaluate and manage the principal risks it assumes in conducting its activities. These risks are generally categorized as credit risk, market risk, operational risk and country and cross-border risk. Compliance risk can be found in all of these risk types.
Citigroup's risk management framework is designed to balance business ownership and accountability for risks with well defined independent risk management oversight and responsibility. Further, Citi's risk management organization is structured to facilitate the management of risk across three dimensions: businesses, regions and critical products.
For more information on Citi's risk management programs and risk management organization, see "Managing Global Risk" and "Risk Factors" in Citi's 2014 Annual Report on Form 10-K.
52
CREDIT RISK
For additional information on Credit Risk, including Citi's credit risk management, measurement and stress testing, see "Managing Global Risk-Credit Risk" in Citi's 2014 Annual Report on Form 10-K.
Loans Outstanding
| 2nd Qtr. | 1st Qtr. | 4th Qtr. | 3rd Qtr. | 2nd Qtr. | ||||||||||
In millions of dollars | 2015 | 2015 | 2014 | 2014 | 2014 | ||||||||||
Consumer loans | | | | | | ||||||||||
In U.S. offices | | | | | | ||||||||||
Mortgage and real estate (1) | $ | 90,715 | | $ | 92,005 | | $ | 96,533 | | $ | 101,583 | | $ | 103,905 | |
Installment, revolving credit, and other | 4,956 | | 4,861 | | 14,450 | | 13,350 | | 13,192 | | |||||
Cards | 107,096 | | 105,378 | | 112,982 | | 108,314 | | 109,138 | | |||||
Commercial and industrial | 6,493 | | 6,532 | | 5,895 | | 6,870 | | 6,972 | | |||||
Lease financing | - | | - | | - | | - | | - | | |||||
| $ | 209,260 | | $ | 208,776 | | $ | 229,860 | | $ | 230,117 | | $ | 233,207 | |
In offices outside the U.S. |
|
|
|
|
| ||||||||||
Mortgage and real estate (1) | $ | 50,704 | | $ | 50,970 | | $ | 54,462 | | $ | 56,099 | | $ | 57,291 | |
Installment, revolving credit, and other | 30,958 | | 31,396 | | 31,128 | | 34,270 | | 34,560 | | |||||
Cards | 28,662 | | 28,681 | | 32,032 | | 32,410 | | 34,252 | | |||||
Commercial and industrial | 22,953 | | 21,992 | | 22,561 | | 23,393 | | 24,916 | | |||||
Lease financing | 493 | | 546 | | 609 | | 678 | | 735 | | |||||
| $ | 133,770 | | $ | 133,585 | | $ | 140,792 | | $ | 146,850 | | $ | 151,754 | |
Total Consumer loans | $ | 343,030 | | $ | 342,361 | | $ | 370,652 | | $ | 376,967 | | $ | 384,961 | |
Unearned income | (681 | ) | (655 | ) | (682 | ) | (649 | ) | (616 | ) | |||||
Consumer loans, net of unearned income | $ | 342,349 | | $ | 341,706 | | $ | 369,970 | | $ | 376,318 | | $ | 384,345 | |
Corporate loans | | | | | | ||||||||||
In U.S. offices | | | | | | ||||||||||
Commercial and industrial | $ | 40,697 | | $ | 37,537 | | $ | 35,055 | | $ | 36,516 | | $ | 36,293 | |
Loans to financial institutions | 37,360 | | 36,054 | | 36,272 | | 31,916 | | 29,195 | | |||||
Mortgage and real estate (1) | 34,680 | | 33,145 | | 32,537 | | 32,285 | | 31,417 | | |||||
Installment, revolving credit, and other | 31,882 | | 29,267 | | 29,207 | | 30,378 | | 32,646 | | |||||
Lease financing | 1,707 | | 1,755 | | 1,758 | | 1,737 | | 1,668 | | |||||
| $ | 146,326 | | $ | 137,758 | | $ | 134,829 | | $ | 132,832 | | $ | 131,219 | |
In offices outside the U.S. | | | | | | ||||||||||
Commercial and industrial | $ | 83,184 | | $ | 81,426 | | $ | 79,239 | | $ | 80,304 | | $ | 82,945 | |
Loans to financial institutions | 29,675 | | 32,210 | | 33,269 | | 35,854 | | 40,541 | | |||||
Mortgage and real estate (1) | 5,948 | | 6,311 | | 6,031 | | 6,243 | | 6,309 | | |||||
Installment, revolving credit, and other | 20,214 | | 19,687 | | 19,259 | | 20,151 | | 20,095 | | |||||
Lease financing | 309 | | 322 | | 356 | | 396 | | 430 | | |||||
Governments and official institutions | 4,714 | | 2,174 | | 2,236 | | 2,264 | | 2,176 | | |||||
| $ | 144,044 | | $ | 142,130 | | $ | 140,390 | | $ | 145,212 | | $ | 152,496 | |
Total Corporate loans | $ | 290,370 | | $ | 279,888 | | $ | 275,219 | | $ | 278,044 | | $ | 283,715 | |
Unearned income | (601 | ) | (540 | ) | (554 | ) | (536 | ) | (556 | ) | |||||
Corporate loans, net of unearned income | $ | 289,769 | | $ | 279,348 | | $ | 274,665 | | $ | 277,508 | | $ | 283,159 | |
Total loans-net of unearned income | $ | 632,118 | | $ | 621,054 | | $ | 644,635 | | $ | 653,826 | | $ | 667,504 | |
Allowance for loan losses-on drawn exposures | (14,075 | ) | (14,598 | ) | (15,994 | ) | (16,915 | ) | (17,890 | ) | |||||
Total loans-net of unearned income and allowance for credit losses | $ | 618,043 | | $ | 606,456 | | $ | 628,641 | | $ | 636,911 | | $ | 649,614 | |
Allowance for loan losses as a percentage of total loans-net of unearned income (2) | 2.25 | % | 2.38 | % | 2.50 | % | 2.60 | % | 2.70 | % | |||||
Allowance for Consumer loan losses as a percentage of total Consumer loans-net of unearned income (2) | 3.43 | % | 3.55 | % | 3.68 | % | 3.87 | % | 4.04 | % | |||||
Allowance for Corporate loan losses as a percentage of total Corporate loans-net of unearned income (2) | 0.82 | % | 0.91 | % | 0.89 | % | 0.86 | % | 0.85 | % | |||||
(1) | Loans secured primarily by real estate. |
(2) | All periods exclude loans that are carried at fair value. |
53
Details of Credit Loss Experience
| 2nd Qtr. | 1st Qtr. | 4th Qtr. | 3rd Qtr. | 2nd Qtr. | ||||||||||
In millions of dollars | 2015 | 2015 | 2014 | 2014 | 2014 | ||||||||||
Allowance for loan losses at beginning of period | $ | 14,598 | | $ | 15,994 | | $ | 16,915 | | $ | 17,890 | | $ | 18,923 | |
Provision for loan losses |
|
|
|
|
| ||||||||||
Consumer | $ | 1,569 | | $ | 1,661 | | $ | 1,660 | | $ | 1,605 | | $ | 1,669 | |
Corporate | (54 | ) | 94 | | 221 | | (30 | ) | (90 | ) | |||||
| $ | 1,515 | | $ | 1,755 | | $ | 1,881 | | $ | 1,575 | | $ | 1,579 | |
Gross credit losses |
|
|
|
|
| ||||||||||
Consumer |
|
|
|
|
| ||||||||||
In U.S. offices | $ | 1,393 | | $ | 1,596 | | $ | 1,588 | | $ | 1,595 | | $ | 1,756 | |
In offices outside the U.S. | 819 | | 839 | | 976 | | 948 | | 1,009 | | |||||
Corporate |
|
|
|
|
| ||||||||||
In U.S. offices | 41 | | 10 | | 45 | | 9 | | 14 | | |||||
In offices outside the U.S. | 82 | | 13 | | 118 | | 34 | | 33 | | |||||
| $ | 2,335 | | $ | 2,458 | | $ | 2,727 | | $ | 2,586 | | $ | 2,812 | |
Credit recoveries (1) |
|
|
|
|
| ||||||||||
Consumer |
|
|
|
|
| ||||||||||
In U.S. offices | $ | 228 | | $ | 296 | | $ | 242 | | $ | 232 | | $ | 356 | |
In offices outside the U.S. | 170 | | 173 | | 223 | | 196 | | 231 | | |||||
Corporate |
|
|
|
|
| ||||||||||
In U.S offices | 4 | | 12 | | 7 | | 18 | | 22 | | |||||
In offices outside the U.S. | 13 | | 20 | | 7 | | 43 | | 14 | | |||||
| $ | 415 | | $ | 501 | | $ | 479 | | $ | 489 | | $ | 623 | |
Net credit losses |
|
|
|
|
| ||||||||||
In U.S. offices | $ | 1,202 | | $ | 1,298 | | $ | 1,384 | | $ | 1,354 | | $ | 1,392 | |
In offices outside the U.S. | 718 | | 659 | | 864 | | 743 | | 797 | | |||||
Total | $ | 1,920 | | $ | 1,957 | | $ | 2,248 | | $ | 2,097 | | $ | 2,189 | |
Other - net (2)(3)(4)(5)(6)(7) | $ | (118 | ) | $ | (1,194 | ) | $ | (554 | ) | (453 | ) | $ | (423 | ) | |
Allowance for loan losses at end of period | $ | 14,075 | | $ | 14,598 | | $ | 15,994 | | $ | 16,915 | | $ | 17,890 | |
Allowance for loan losses as a % of total loans (8) | 2.25 | % | 2.38 | % | 2.50 | % | 2.60 | % | 2.70 | % | |||||
Allowance for unfunded lending commitments (9) | $ | 973 | | $ | 1,023 | | $ | 1,063 | | $ | 1,140 | | $ | 1,176 | |
Total allowance for loan losses and unfunded lending commitments | $ | 15,048 | | $ | 15,621 | | $ | 17,057 | | $ | 18,055 | | $ | 19,066 | |
Net Consumer credit losses | $ | 1,814 | | $ | 1,966 | | $ | 2,098 | | $ | 2,115 | | $ | 2,178 | |
As a percentage of average Consumer loans | 2.13 | % | 2.22 | % | 2.23 | % | 2.21 | % | 2.27 | % | |||||
Net Corporate credit losses (recoveries) | $ | 106 | | $ | (9 | ) | $ | 150 | | $ | (18 | ) | $ | 11 | |
As a percentage of average Corporate loans | 0.15 | % | (0.01 | )% | 0.21 | % | (0.03 | )% | 0.02 | % | |||||
Allowance for loan losses at end of period (10) |
|
|
|
|
| ||||||||||
Citicorp | $ | 10,672 | | $ | 10,976 | | $ | 11,142 | | $ | 11,582 | | $ | 12,139 | |
Citi Holdings | 3,403 | | 3,622 | | 4,852 | | 5,333 | | 5,751 | | |||||
Total Citigroup | $ | 14,075 | | $ | 14,598 | | $ | 15,994 | | $ | 16,915 | | $ | 17,890 | |
Allowance by type |
|
|
|
|
| ||||||||||
Consumer | $ | 11,749 | | $ | 12,122 | | $ | 13,605 | | $ | 14,575 | | $ | 15,520 | |
Corporate | 2,326 | | 2,476 | | 2,389 | | 2,340 | | 2,370 | | |||||
Total Citigroup | $ | 14,075 | | $ | 14,598 | | $ | 15,994 | | $ | 16,915 | | $ | 17,890 | |
(1) | Recoveries have been reduced by certain collection costs that are incurred only if collection efforts are successful. |
(2) | Includes all adjustments to the allowance for credit losses, such as changes in the allowance from acquisitions, dispositions, securitizations, foreign currency translation, purchase accounting adjustments, etc. |
(3) | The second quarter of 2015 includes a reduction of approximately $88 million related to the sale or transfers to held-for-sale (HFS) of various loan portfolios, including a reduction of $34 million related to a transfer of a real estate loan portfolio to HFS. Additionally, the second quarter of 2015 includes a reduction of approximately $39 million related to FX translation. |
54
(4) | The first quarter of 2015 includes a reduction of approximately $1.0 billion related to the sale or transfers to HFS of various loan portfolios, including a reduction of $281 million related to a transfer of a real estate loan portfolio to HFS. Additionally, the first quarter of 2015 includes a reduction of approximately $145 million related to FX translation. |
(5) | The fourth quarter of 2014 includes a reduction of approximately $250 million related to the sale or transfers to HFS of various loan portfolios, including a reduction of $194 million related to a transfer of a real estate loan portfolio to HFS. Additionally, the fourth quarter of 2014 includes a reduction of approximately $282 million related to FX translation. |
(6) | The third quarter of 2014 includes a reduction of approximately $259 million related to the sale or transfers to HFS of various loan portfolios, including a reduction of $151 million related to a transfer of a real estate loan portfolio to HFS and a reduction of approximately $108 million related to the transfer of various EMEA loan portfolios to HFS. Additionally, the third quarter of 2014 includes a reduction of approximately $181 million related to FX translation. |
(7) | The second quarter of 2014 includes a reduction of approximately $480 million related to the sale or transfers to HFS of various loan portfolios, including a reduction of approximately $204 million , $177 million and $29 million related to the transfers to HFS of businesses in Greece, Spain and Honduras, and $66 million related to a transfer of a real estate loan portfolio to HFS. These amounts are partially offset by FX translation on the entire allowance balance. |
(8) | June 30, 2015 , March 31, 2015 , December 31, 2014, September 30, 2014 and June 30, 2014 exclude $6.5 billion , $6.6 billion , $5.9 billion , $4.4 billion and $4.8 billion , respectively, of loans which are carried at fair value. |
(9) | Represents additional credit loss reserves for unfunded lending commitments and letters of credit recorded in Other liabilities on the Consolidated Balance Sheet. |
(10) | Allowance for loan losses represents management's best estimate of probable losses inherent in the portfolio, as well as probable losses related to large individually evaluated impaired loans and troubled debt restructurings. See "Significant Accounting Policies and Significant Estimates" and Note 1 to the Consolidated Financial Statements in Citi's 2014 Annual Report on Form 10-K. Attribution of the allowance is made for analytical purposes only and the entire allowance is available to absorb probable credit losses inherent in the overall portfolio. |
55
Allowance for Loan Losses
The following tables detail information on Citi's allowance for loan losses, loans and coverage ratios as of June 30, 2015 and December 31, 2014 :
| June 30, 2015 | |||||||
In billions of dollars | Allowance for loan losses | Loans, net of unearned income | Allowance as a percentage of loans (1) | |||||
North America cards (2) | $ | 4.7 | | $ | 107.7 | | 4.4 | % |
North America mortgages (3)(4) | 3.0 | | 90.1 | | 3.4 | | ||
North America other | 0.5 | | 12.9 | | 3.9 | | ||
International cards | 1.6 | | 26.8 | | 6.0 | | ||
International other (5) | 2.0 | | 104.8 | | 1.9 | | ||
Total Consumer | $ | 11.8 | | $ | 342.3 | | 3.4 | % |
Total Corporate | 2.3 | | 289.8 | | 0.8 | | ||
Total Citigroup | $ | 14.1 | | $ | 632.1 | | 2.2 | % |
(1) | Allowance as a percentage of loans excludes loans that are carried at fair value. |
(2) | Includes both Citi-branded cards and Citi retail services. The $4.7 billion of loan loss reserves represented approximately 15 months of coincident net credit loss coverage. |
(3) | Of the $3.0 billion , approximately $2.9 billion was allocated to North America mortgages in Citi Holdings. The $3.0 billion of loan loss reserves represented approximately 52 months of coincident net credit loss coverage (for both total North America mortgages and Citi Holdings North America mortgages). |
(4) | Of the $3.0 billion in loan loss reserves, approximately $1.0 billion and $2.0 billion are determined in accordance with ASC 450-20 and ASC 310-10-35 (troubled debt restructurings), respectively. Of the $90.1 billion in loans, approximately $78.1 billion and $11.7 billion of the loans are evaluated in accordance with ASC 450-20 and ASC 310-10-35 (troubled debt restructurings), respectively. For additional information, see Note 15 to the Consolidated Financial Statements. |
(5) | Includes mortgages and other retail loans. |
| December 31, 2014 | |||||||
In billions of dollars | Allowance for loan losses | Loans, net of unearned income | Allowance as a percentage of loans (1) | |||||
North America cards (2) | $ | 4.9 | | $ | 114.0 | | 4.3 | % |
North America mortgages (3)(4) | 3.7 | | 95.9 | | 3.9 | | ||
North America other | 1.2 | | 21.6 | | 5.6 | | ||
International cards | 1.9 | | 31.5 | | 6.0 | | ||
International other (5) | 1.9 | | 106.9 | | 1.8 | | ||
Total Consumer | $ | 13.6 | | $ | 369.9 | | 3.7 | % |
Total Corporate | 2.4 | | 274.7 | | 0.9 | | ||
Total Citigroup | $ | 16.0 | | $ | 644.6 | | 2.5 | % |
(1) | Allowance as a percentage of loans excludes loans that are carried at fair value. |
(2) | Includes both Citi-branded cards and Citi retail services. The $4.9 billion of loan loss reserves represented approximately 15 months of coincident net credit loss coverage. |
(3) | Of the $3.7 billion, approximately $3.5 billion was allocated to North America mortgages in Citi Holdings. The $3.7 billion of loan loss reserves represented approximately 53 months of coincident net credit loss coverage (for both total North America mortgages and Citi Holdings North America mortgages). |
(4) | Of the $3.7 billion in loan loss reserves, approximately $1.2 billion and $2.5 billion are determined in accordance with ASC 450-20 and ASC 310-10-35 (troubled debt restructurings), respectively. Of the $95.9 billion in loans, approximately $80.4 billion and $15.2 billion of the loans are evaluated in accordance with ASC 450-20 and ASC 310-10-35 (troubled debt restructurings), respectively. For additional information, see Note 15 to the Consolidated Financial Statements. |
(5) | Includes mortgages and other retail loans. |
56
Non-Accrual Loans and Assets and Renegotiated Loans
The following pages include information on Citi's "Non-Accrual Loans and Assets" and "Renegotiated Loans." There is a certain amount of overlap among these categories. The following summary provides a general description of each category:
Non-Accrual Loans and Assets:
• | Corporate and consumer (commercial market) non-accrual status is based on the determination that payment of interest or principal is doubtful. |
• | Consumer non-accrual status is generally based on aging, i.e., the borrower has fallen behind in payments. |
• | Mortgage loans in regulated bank entities discharged through Chapter 7 bankruptcy, other than Federal Housing Administration (FHA) insured loans, are classified as non-accrual. Non-bank mortgage loans discharged through Chapter 7 bankruptcy are classified as non-accrual at 90 days or more past due. In addition, home equity loans in regulated bank entities are classified as non-accrual if the related residential first mortgage loan is 90 days or more past due. |
• | North America Citi-branded cards and Citi retail services are not included because under industry standards, credit card loans accrue interest until such loans are charged off, which typically occurs at 180 days contractual delinquency. |
Renegotiated Loans:
• | Includes both corporate and consumer loans whose terms have been modified in a troubled debt restructuring (TDR). |
• | Includes both accrual and non-accrual TDRs. |
Non-Accrual Loans and Assets
The table below summarizes Citigroup's non-accrual loans as of the periods indicated. Non-accrual loans may still be current on interest payments. In situations where Citi reasonably expects that only a portion of the principal owed will ultimately be collected, all payments received are reflected as a reduction of principal and not as interest income. For all other non-accrual loans, cash interest receipts are generally recorded as revenue.
57
Non-Accrual Loans
| Jun. 30, | Mar. 31, | Dec. 31, | Sept. 30, | Jun. 30, | ||||||||||
In millions of dollars | 2015 | 2015 | 2014 | 2014 | 2014 | ||||||||||
Citicorp | $ | 2,760 | | $ | 2,789 | | $ | 3,011 | | $ | 3,358 | | $ | 3,226 | |
Citi Holdings | 3,677 | | 3,965 | | 4,096 | | 4,264 | | 4,707 | | |||||
Total non-accrual loans | $ | 6,437 | | $ | 6,754 | | $ | 7,107 | | $ | 7,622 | | $ | 7,933 | |
Corporate non-accrual loans (1) | | | | | | ||||||||||
North America | $ | 467 | | $ | 347 | | $ | 321 | | $ | 365 | | $ | 367 | |
EMEA | 322 | | 287 | | 267 | | 322 | | 363 | | |||||
Latin America | 224 | | 376 | | 416 | | 481 | | 288 | | |||||
Asia | 145 | | 151 | | 179 | | 182 | | 200 | | |||||
Total Corporate non-accrual loans | $ | 1,158 | | $ | 1,161 | | $ | 1,183 | | $ | 1,350 | | $ | 1,218 | |
Citicorp | $ | 1,103 | | $ | 1,108 | | $ | 1,126 | | $ | 1,290 | | $ | 1,150 | |
Citi Holdings | 55 | | 53 | | 57 | | 60 | | 67 | | |||||
Total Corporate non-accrual loans | $ | 1,158 | | $ | 1,161 | | $ | 1,183 | | $ | 1,350 | | $ | 1,217 | |
Consumer non-accrual loans (1) |
|
|
|
|
| ||||||||||
North America | $ | 3,934 | | $ | 4,192 | | $ | 4,412 | | $ | 4,546 | | $ | 4,915 | |
Latin America | 1,034 | | 1,086 | | 1,188 | | 1,364 | | 1,386 | | |||||
Asia (2) | 311 | | 315 | | 324 | | 362 | | 415 | | |||||
Total Consumer non-accrual loans | $ | 5,279 | | $ | 5,593 | | $ | 5,924 | | $ | 6,272 | | $ | 6,716 | |
Citicorp | $ | 1,657 | | $ | 1,681 | | $ | 1,885 | | $ | 2,068 | | $ | 2,076 | |
Citi Holdings | 3,622 | | 3,912 | | 4,039 | | 4,204 | | 4,640 | | |||||
Total Consumer non-accrual loans | $ | 5,279 | | $ | 5,593 | | $ | 5,924 | | $ | 6,272 | | $ | 6,716 | |
(1) | Excludes purchased distressed loans, as they are generally accreting interest. The carrying value of these loans was $ 343 million at June 30, 2015 , $ 398 million at March 31, 2015 , $421 million at December 31, 2014 , $493 million at September 30, 2014 , and $575 million at June 30, 2014 . |
(2) For reporting purposes, includes the results of operations of EMEA GCB for all periods presented.
The changes in Citigroup's non-accrual loans for the three months ended June 30, 2015 were as follows:
| Three months ended | ||||||||
| June 30, 2015 | ||||||||
In millions of dollars | Corporate | Consumer | Total | ||||||
Non-accrual loans at beginning of period | $ | 1,161 | | $ | 5,593 | | $ | 6,754 | |
Additions | 292 | | 1,077 | | 1,369 | | |||
Sales and transfers to held-for-sale | (141 | ) | (141 | ) | (282 | ) | |||
Returned to performing | (10 | ) | (281 | ) | (291 | ) | |||
Paydowns/settlements | (103 | ) | (309 | ) | (412 | ) | |||
Charge-offs | (40 | ) | (615 | ) | (655 | ) | |||
Other | (1 | ) | (45 | ) | (46 | ) | |||
Ending balance | $ | 1,158 | | $ | 5,279 | | $ | 6,437 | |
58
The table below summarizes Citigroup's other real estate owned (OREO) assets as of the periods indicated. This represents the carrying value of all real estate property acquired by foreclosure or other legal proceedings when Citi has taken possession of the collateral.
| Jun. 30, | Mar. 31, | Dec. 31, | Sept. 30, | Jun. 30, | ||||||||||
In millions of dollars | 2015 | 2015 | 2014 | 2014 | 2014 | ||||||||||
OREO (1) |
|
|
|
|
| ||||||||||
Citicorp | $ | 87 | | $ | 103 | | $ | 92 | | $ | 86 | | $ | 95 | |
Citi Holdings | 159 | | 172 | | 168 | | 296 | | 306 | | |||||
Total OREO | $ | 246 | | $ | 275 | | $ | 260 | | $ | 382 | | $ | 401 | |
North America | $ | 190 | | $ | 221 | | $ | 195 | | $ | 303 | | $ | 293 | |
EMEA | 1 | | 1 | | 8 | | 18 | | 44 | | |||||
Latin America | 50 | | 48 | | 47 | | 49 | | 49 | | |||||
Asia | 5 | | 5 | | 10 | | 12 | | 15 | | |||||
Total OREO | $ | 246 | | $ | 275 | | $ | 260 | | $ | 382 | | $ | 401 | |
Non-accrual assets-Total Citigroup | | | | | | ||||||||||
Corporate non-accrual loans | $ | 1,158 | | $ | 1,161 | | $ | 1,183 | | $ | 1,350 | | $ | 1,218 | |
Consumer non-accrual loans | 5,279 | | 5,593 | | 5,924 | | 6,272 | | 6,716 | | |||||
Non-accrual loans (NAL) | $ | 6,437 | | $ | 6,754 | | $ | 7,107 | | $ | 7,622 | | $ | 7,934 | |
OREO | $ | 246 | | $ | 275 | | $ | 260 | | $ | 382 | | $ | 401 | |
Non-accrual assets (NAA) | $ | 6,683 | | $ | 7,029 | | $ | 7,367 | | $ | 8,004 | | $ | 8,335 | |
NAL as a percentage of total loans | 1.02 | % | 1.09 | % | 1.10 | % | 1.17 | % | 1.19 | % | |||||
NAA as a percentage of total assets | 0.37 | | 0.38 | | 0.40 | | 0.43 | | 0.44 | | |||||
Allowance for loan losses as a percentage of NAL (2) | 219 | | 216 | | 225 | | 222 | | 225 | | |||||
| Jun. 30, | Mar. 31, | Dec. 31, | Sept. 30, | Jun. 30, | ||||||||||
Non-accrual assets-Total Citicorp | 2015 | 2015 | 2014 | 2014 | 2014 | ||||||||||
Non-accrual loans (NAL) | $ | 2,760 | | $ | 2,789 | | $ | 3,011 | | $ | 3,358 | | $ | 3,226 | |
OREO | 87 | | 103 | | 92 | | 86 | | 95 | | |||||
Non-accrual assets (NAA) | $ | 2,847 | | $ | 2,892 | | $ | 3,103 | | $ | 3,444 | | $ | 3,321 | |
NAA as a percentage of total assets | 0.17 | % | 0.17 | % | 0.18 | % | 0.20 | % | 0.19 | % | |||||
Allowance for loan losses as a percentage of NAL (2) | 387 | | 394 | | 370 | | 345 | | 376 | | |||||
Non-accrual assets-Total Citi Holdings | | | | | | ||||||||||
Non-accrual loans (NAL) | $ | 3,677 | | $ | 3,965 | | $ | 4,096 | | $ | 4,264 | | $ | 4,707 | |
OREO | 159 | | 172 | | 168 | | 296 | | 306 | | |||||
Non-accrual assets (NAA) | $ | 3,836 | | $ | 4,137 | | $ | 4,264 | | $ | 4,560 | | $ | 5,013 | |
NAA as a percentage of total assets | 3.31 | % | 3.39 | % | 3.31 | % | 3.33 | % | 3.39 | % | |||||
Allowance for loan losses as a percentage of NAL (2) | 93 | | 91 | | 118 | | 125 | | 122 | | |||||
(1) | Reflects a decrease of $130 million related to the adoption of ASU 2014-14 in the fourth quarter of 2014, which requires certain government guaranteed mortgage loans to be recognized as separate other receivables upon foreclosure. Prior periods have not been restated. For additional information, see Note 1 of the Consolidated Financial Statements. |
(2) | The allowance for loan losses includes the allowance for Citi's credit card portfolios and purchased distressed loans, while the non-accrual loans exclude credit card balances (with the exception of certain international portfolios) and purchased distressed loans as these continue to accrue interest until charge-off. |
59
Renegotiated Loans
The following table presents Citi's loans modified in TDRs.
In millions of dollars | Jun. 30, 2015 | Dec. 31, 2014 | ||||
Corporate renegotiated loans (1) |
|
| ||||
In U.S. offices |
|
| ||||
Commercial and industrial (2) | $ | 37 | | $ | 12 | |
Mortgage and real estate (3) | 112 | | 106 | | ||
Loans to financial institutions | 1 | | - | | ||
Other | 290 | | 316 | | ||
| $ | 440 | | $ | 434 | |
In offices outside the U.S. |
|
| ||||
Commercial and industrial (2) | $ | 81 | | $ | 105 | |
Mortgage and real estate (3) | 1 | | 1 | | ||
Other | 36 | | 39 | | ||
| $ | 118 | | $ | 145 | |
Total Corporate renegotiated loans | $ | 558 | | $ | 579 | |
Consumer renegotiated loans (4)(5)(6)(7) |
|
| ||||
In U.S. offices |
|
| ||||
Mortgage and real estate (8) | $ | 11,919 | | $ | 15,514 | |
Cards | 1,520 | | 1,751 | | ||
Installment and other | 83 | | 580 | | ||
| $ | 13,522 | | $ | 17,845 | |
In offices outside the U.S. |
|
| ||||
Mortgage and real estate | $ | 664 | | $ | 695 | |
Cards | 598 | | 656 | | ||
Installment and other | 563 | | 586 | | ||
| $ | 1,825 | | $ | 1,937 | |
Total Consumer renegotiated loans | $ | 15,347 | | $ | 19,782 | |
(1) | Includes $201 million and $135 million of non-accrual loans included in the non-accrual assets table above at June 30, 2015 and December 31, 2014, respectively. The remaining loans are accruing interest. |
(2) | In addition to modifications reflected as TDRs at June 30, 2015 , Citi also modified $125 million and $18 million of commercial loans risk rated "Substandard Non-Performing" or worse (asset category defined by banking regulators) in offices inside and outside the U.S., respectively. These modifications were not considered TDRs because the modifications did not involve a concession (a required element of a TDR for accounting purposes). |
(3) | In addition to modifications reflected as TDRs at June 30, 2015 , Citi also modified $22 million of commercial real estate loans risk rated "Substandard Non-Performing" or worse (asset category defined by banking regulators) in offices inside the U.S. These modifications were not considered TDRs because the modifications did not involve a concession (a required element of a TDR for accounting purposes). |
(4) | Includes $3,012 million and $3,132 million of non-accrual loans included in the non-accrual assets table above at June 30, 2015 and December 31, 2014 , respectively. The remaining loans are accruing interest. |
(5) | Includes $151 million and $124 million of commercial real estate loans at June 30, 2015 and December 31, 2014 , respectively. |
(6) | Includes $168 million and $184 million of other commercial loans at June 30, 2015 and December 31, 2014 , respectively. |
(7) | Smaller-balance homogeneous loans were derived from Citi's risk management systems. |
(8) | Reduction in the six months ended June 30, 2015 includes $3,017 million related to TDRs sold or transferred to held-for-sale. |
60
North America Consumer Mortgage Lending
Overview
Citi's North America consumer mortgage portfolio consists of both residential first mortgages and home equity loans. At June 30, 2015 , Citi's North America consumer mortgage portfolio was $90.1 billion (compared to $91.4 billion at March 31, 2015), of which the residential first mortgage portfolio was $64.0 billion (compared to $64.3 billion at March 31, 2015), and the home equity loan portfolio was $26.1 billion (compared to $27.1 billion at March 31, 2015). At June 30, 2015 , $28.6 billion of first mortgages was recorded in Citi Holdings, with the remaining $35.4 billion recorded in Citicorp. At June 30, 2015 , $22.7 billion of home equity loans was recorded in Citi Holdings, with the remaining $3.4 billion recorded in Citicorp. For additional information on Citi's North America consumer mortgage portfolio, including Citi's representations and warranties repurchase reserve, see "Managing Global Risk-Credit Risk- North America Consumer Mortgage Lending" in Citi's 2014 Annual Report on Form 10-K.
Citi's residential first mortgage portfolio included $3.6 billion of loans with FHA insurance or Department of Veterans Affairs (VA) guarantees at June 30, 2015 , compared to $3.7 billion at March 31, 2015.
As of June 30, 2015 , Citi's North America residential first mortgage portfolio contained approximately $3.1 billion of adjustable rate mortgages that are currently required to make a payment consisting of only accrued interest for the payment period, or an interest-only payment, compared to $3.4 billion at March 31, 2015.
61
North America Consumer Mortgage Quarterly Credit Trends-Net Credit Losses and Delinquencies-Residential First Mortgages
North America Residential First Mortgage - EOP Loans In billions of dollars |
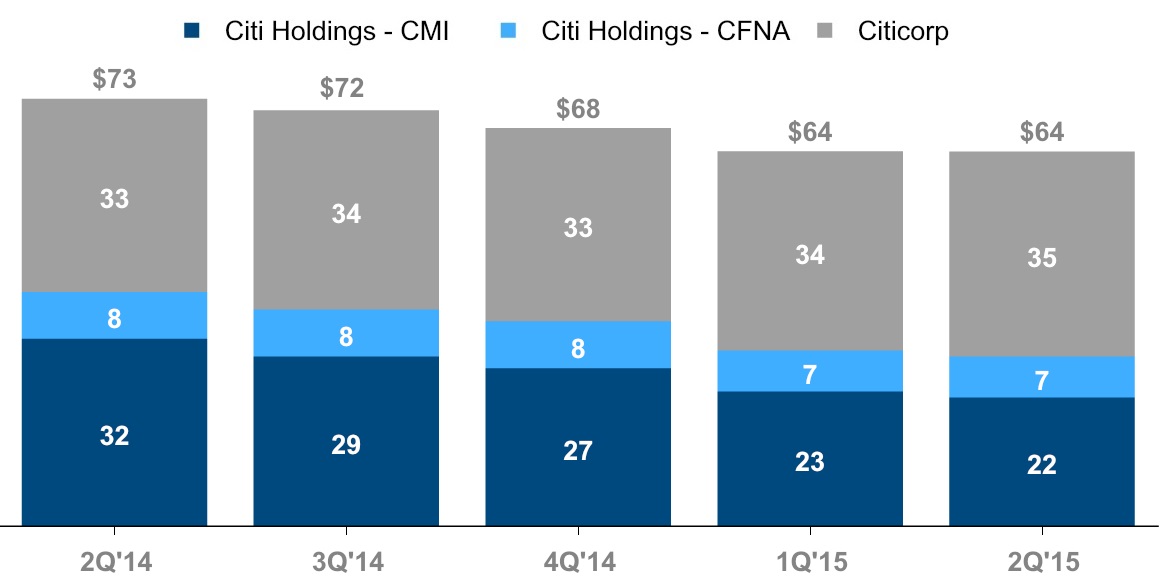
North America Residential First Mortgage - Net Credit Losses In millions of dollars |
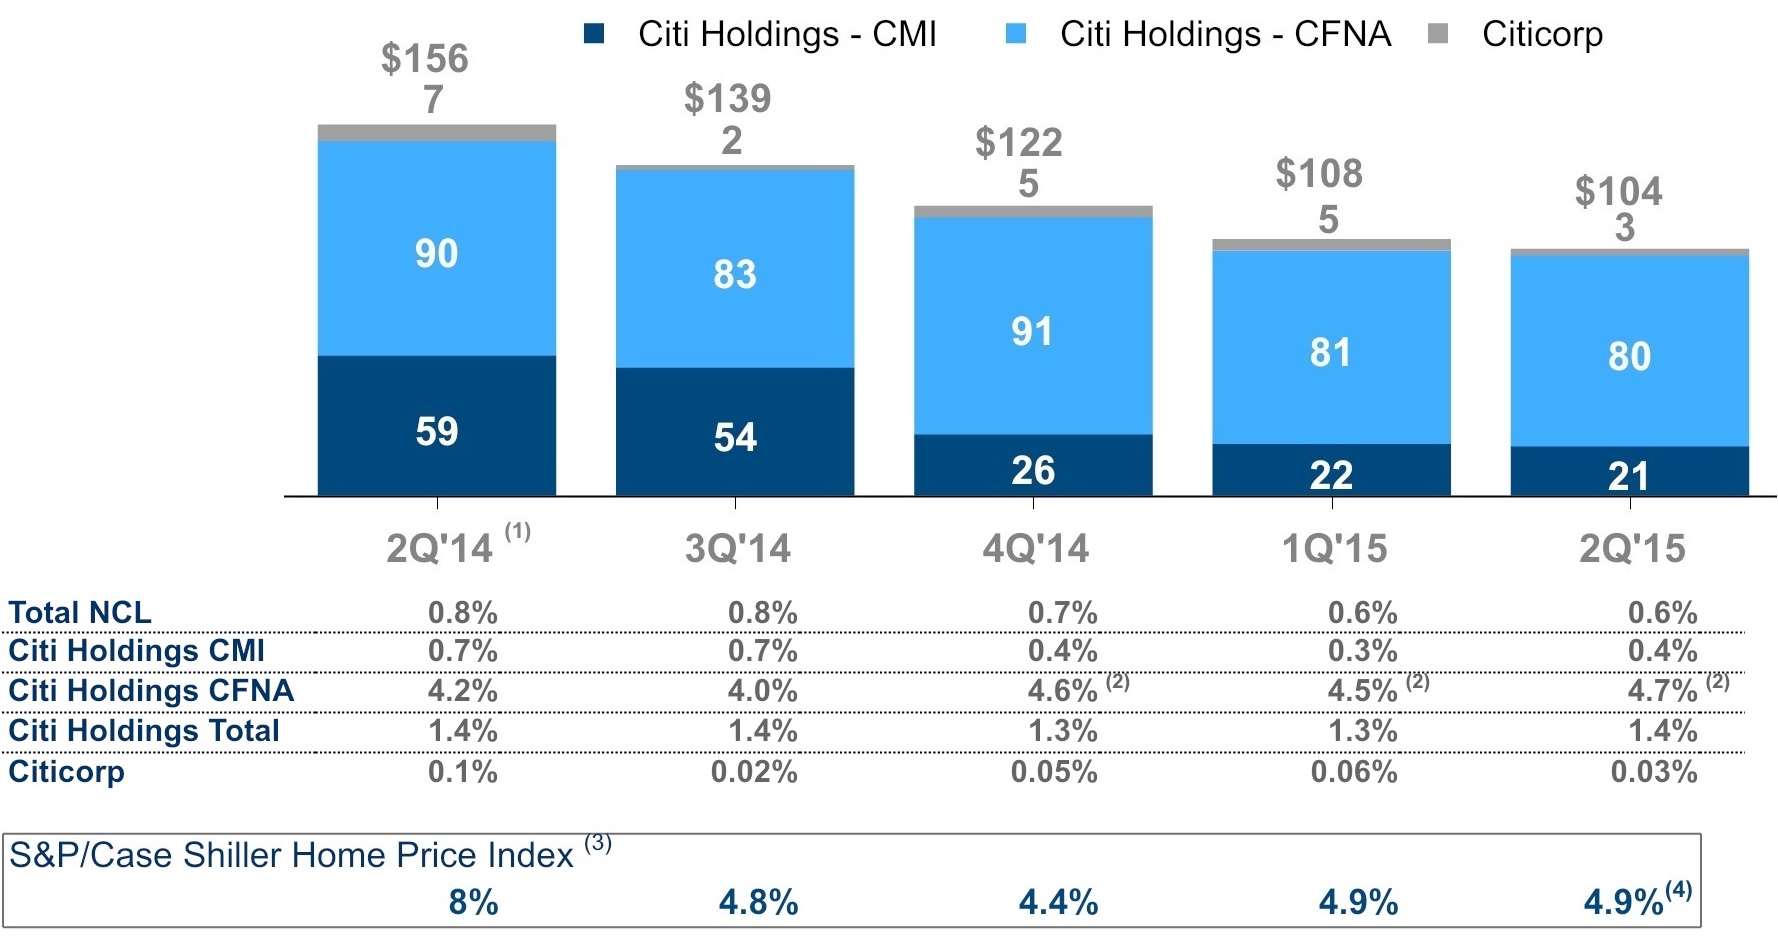
Note: CMI refers to loans originated by CitiMortgage. CFNA refers to loans originated by CitiFinancial. Totals may not sum due to rounding.
(1) | 2Q'14 excludes a recovery of approximately $58 million in CitiMortgage. |
(2) | Increase in 4Q'14, 1Q'15 and 2Q'15 CitiFinancial residential first mortgage net credit loss rate largely driven by ongoing loss mitigation activities. |
(3) | Year-over-year change in the S&P/Case-Shiller U.S. National Home Price Index. |
(4) | Year-over-year change as of April 2015. |
North America Residential First Mortgage Delinquencies-Citi Holdings In billions of dollars |
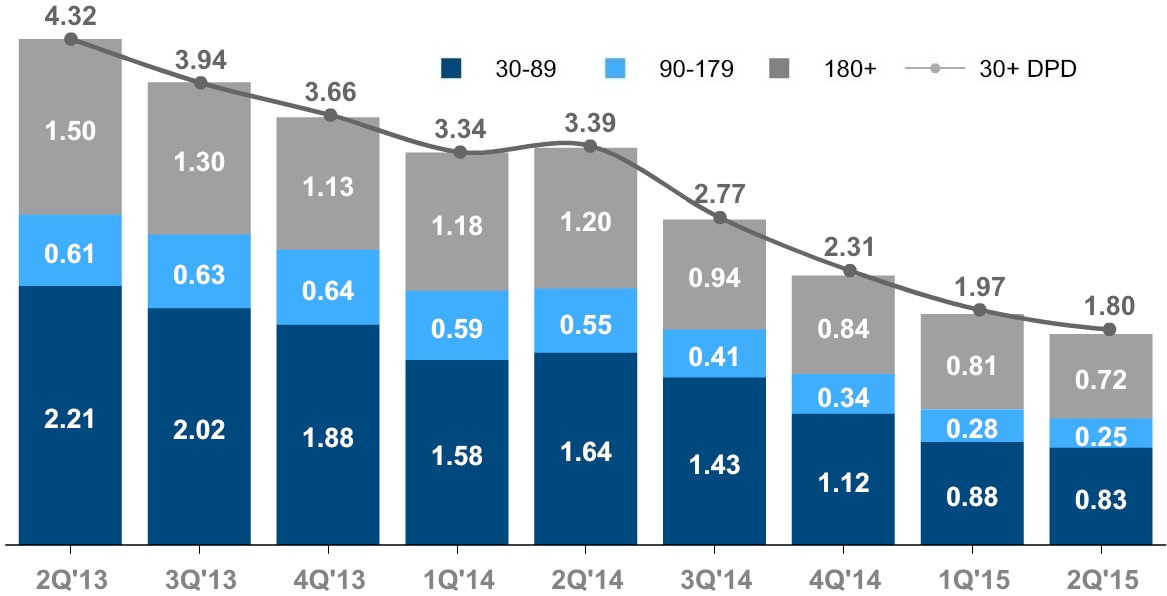
Note: Days past due excludes (i) U.S. mortgage loans that are guaranteed by U.S. government-sponsored agencies because the potential loss predominantly resides with the U.S. agencies, and (ii) loans recorded at fair value. Totals may not sum due to rounding.
Residential first mortgage portfolio net credit losses of $104 million declined 4% from the first quarter of 2015, with total Citi Holdings net credit losses (CitiMortgage and CitiFinancial) declining 2% sequentially.
Residential first mortgages originated by CitiFinancial have a higher net credit loss rate (4.7%, compared to 0.4% for CitiMortgage as of the second quarter of 2015), as CitiFinancial borrowers tend to have higher loan-to-value ratios (LTVs) and lower FICO (Fair Isaac Corporation) scores than CitiMortgage borrowers. CitiFinancial's residential first mortgages also have a significantly different geographic distribution, with different mortgage market conditions that tend to lag the overall improvements in home price index (HPI).
During the second quarter of 2015, continued management actions, primarily delinquent loans transferred to held-for-sale, were the primary driver of the overall improvement in delinquencies within Citi Holdings' residential first mortgage portfolio. Citi transferred to held-for-sale approximately $0.2 billion of delinquent residential first mortgages in the second quarter of 2015 (unchanged from the first quarter of 2015). Credit performance from quarter to quarter could continue to be impacted by the amount of delinquent loan sales or transfers to held-for-sale, as well as overall trends in HPI and interest rates.
62
North America Residential First Mortgages-State Delinquency Trends
The following tables set forth, for total Citigroup, the six states and/or regions with the highest concentration of Citi's residential first mortgages as of June 30, 2015 and March 31, 2015.
In billions of dollars | June 30, 2015 | March 31, 2015 | ||||||||||||||||||||
State (1) | ENR (2) | ENR Distribution | 90+DPD % | % LTV > 100% (3) | Refreshed FICO | ENR (2) | ENR Distribution | 90+DPD % | % LTV > 100% (3) | Refreshed FICO | ||||||||||||
CA | $ | 19.1 | | 33 | % | 0.4 | % | 1 | % | 749 | | $ | 18.7 | | 32 | % | 0.4 | % | 1 | % | 748 | |
NY/NJ/CT (4) | 12.5 | | 22 | | 1.3 | | 2 | | 744 | | 12.4 | | 21 | | 1.5 | | 2 | | 743 | | ||
VA/MD | 2.7 | | 5 | | 2.4 | | 6 | | 701 | | 2.8 | | 5 | | 2.6 | | 8 | | 699 | | ||
FL (4) | 2.6 | | 4 | | 2.2 | | 9 | | 706 | | 2.6 | | 5 | | 2.7 | | 12 | | 702 | | ||
TX | 2.4 | | 4 | | 2.4 | | - | | 686 | | 2.5 | | 4 | | 2.6 | | - | | 683 | | ||
IL (4) | 2.4 | | 4 | | 2.0 | | 8 | | 721 | | 2.4 | | 4 | | 2.3 | | 11 | | 718 | | ||
Other | 16.2 | | 28 | | 2.9 | | 6 | | 682 | | 16.8 | | 29 | | 3.2 | | 7 | | 679 | | ||
Total | $ | 58.0 | | 100 | % | 1.6 | % | 3 | % | 721 | | $ | 58.2 | | 100 | % | 1.8 | % | 4 | % | 718 | |
Note: Totals may not sum due to rounding.
(1) | Certain of the states are included as part of a region based on Citi's view of similar HPI within the region. |
(2) | Ending net receivables. Excludes loans in Canada and Puerto Rico, loans guaranteed by U.S. government agencies, loans recorded at fair value and loans subject to LTSCs. Excludes balances for which FICO or LTV data are unavailable. |
(3) | LTV ratios (loan balance divided by appraised value) are calculated at origination and updated by applying market price data. |
(4) | New York, New Jersey, Connecticut, Florida and Illinois are judicial states. |
Foreclosures
A substantial majority of Citi's foreclosure inventory consists of residential first mortgages. At June 30, 2015 , Citi's foreclosure inventory included approximately $0.4 billion, or 0.7%, of the total residential first mortgage portfolio, compared to $0.5 billion, or 0.8%, at March 31, 2015 (based on the dollar amount of ending net receivables of loans in foreclosure inventory, excluding loans that are guaranteed by U.S. government agencies and loans subject to LTSCs). This decline in the second quarter of 2015 was largely attributable to an increase in completed foreclosures.
Citi's foreclosure inventory continues to be impacted by the ongoing extensive state and regulatory requirements related to the foreclosure process, which continue to result in longer foreclosure timelines. Citi's average timeframes to move a loan out of foreclosure are two to three times longer than historical norms, and continue to be even more pronounced in judicial states, where Citi has a higher concentration of residential first mortgages in foreclosure. As of June 30, 2015 , approximately 21% of Citi's total foreclosure inventory was active foreclosure units in process for over two years, compared to 20% as of March 31, 2015.
North America Consumer Mortgage Quarterly Credit Trends-Net Credit Losses and Delinquencies-Home Equity Loans
Citi's home equity loan portfolio consists of both fixed-rate home equity loans and loans extended under home equity lines of credit. Fixed-rate home equity loans are fully amortizing. Home equity lines of credit allow for amounts to be drawn for a period of time with the payment of interest only and then, at the end of the draw period, the then-outstanding amount is converted to an amortizing loan (the interest-only payment feature during the revolving period is standard for this product across the industry). After conversion, the home equity loans typically have a 20-year amortization period.
63
Revolving HELOCs
At June 30, 2015 , Citi's home equity loan portfolio of $26.1 billion included approximately $14.8 billion of home equity lines of credit (Revolving HELOCs) that are still within their revolving period and have not commenced amortization, or "reset," compared to $16.0 billion at March 31, 2015. The following chart indicates the FICO and combined loan-to-value (CLTV) characteristics of Citi's Revolving HELOCs portfolio and the year in which they reset:
North America Home Equity Lines of Credit Amortization – Citigroup Total ENR by Reset Year In billions of dollars as of June 30, 2015 |
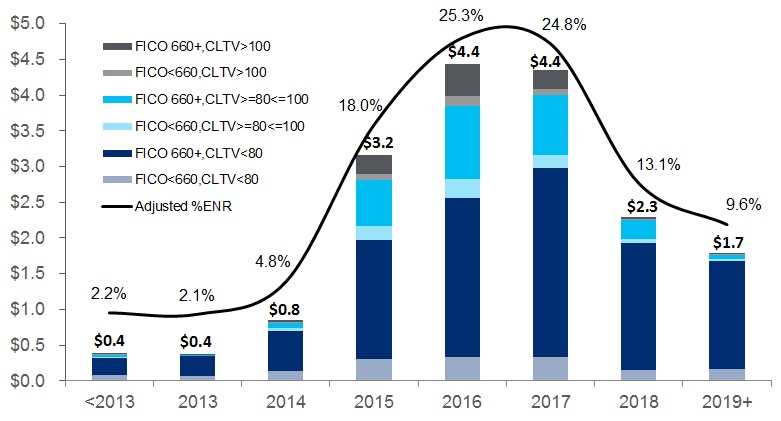
Note: Totals may not sum due to rounding.
Approximately 16% of Citi's total Revolving HELOCs portfolio had commenced amortization as of June 30, 2015 (compared to 12% as of March 31, 2015). Of the remaining Revolving HELOCs portfolio, approximately 73% will commence amortization during the remainder of 2015–2017. Before commencing amortization, Revolving HELOC borrowers are required to pay only interest on their loans. Upon amortization, these borrowers will be required to pay both interest, usually at a variable rate, and principal that amortizes typically over 20 years, rather than the typical 30-year amortization. As a result, Citi's customers with Revolving HELOCs that reset could experience "payment shock" due to the higher required payments on the loans.
While it is not certain what, if any, impact this payment shock could have on Citi's delinquency rates and net credit losses, Citi currently estimates that the monthly loan payment for its Revolving HELOCs that reset during the remainder of 2015–2017 could increase on average by approximately $360, or 165%. Increases in interest rates could further increase these payments given the variable nature of the interest rates on these loans post-reset. Of the Revolving HELOCs that will commence amortization during the remainder of 2015–2017, approximately $1.2 billion, or 11%, of the loans have a CLTV greater than 100% as of June 30, 2015 . Borrowers' high loan-to-value positions, as well as the cost and availability of refinancing options, could limit borrowers' ability to refinance their Revolving HELOCs as these loans begin to reset.
Based on the limited number of Revolving HELOCs that have begun amortization as of June 30, 2015 , approximately 5.9% of the amortizing home equity loans were 30+ days past due, compared to 2.6% of the total outstanding home equity loan portfolio (amortizing and non-amortizing). This
compared to 6.2% and 2.7%, respectively, as of March 31, 2015. As newly amortizing loans continue to season, the delinquency rate of the amortizing Revolving HELOC portfolio could increase. In addition, the resets have generally occurred during a period of historically low interest rates, which Citi believes has likely reduced the overall "payment shock" to the borrower.
Citi continues to monitor this reset risk closely and will continue to consider any potential impact in determining its allowance for loan loss reserves. In addition, management continues to review and take additional actions to offset potential reset risk, such as establishment of a borrower outreach program to provide reset risk education, establishment of a reset risk mitigation unit and proactively contacting high-risk borrowers. For further information on reset risk, see "Risk Factors-Credit and Market Risks" in Citi's 2014 Annual Report on Form 10-K.
Net Credit Losses and Delinquencies
The following charts detail the quarterly credit trends for Citi's home equity loan portfolio in North America .
North America Home Equity - EOP Loans In billions of dollars |
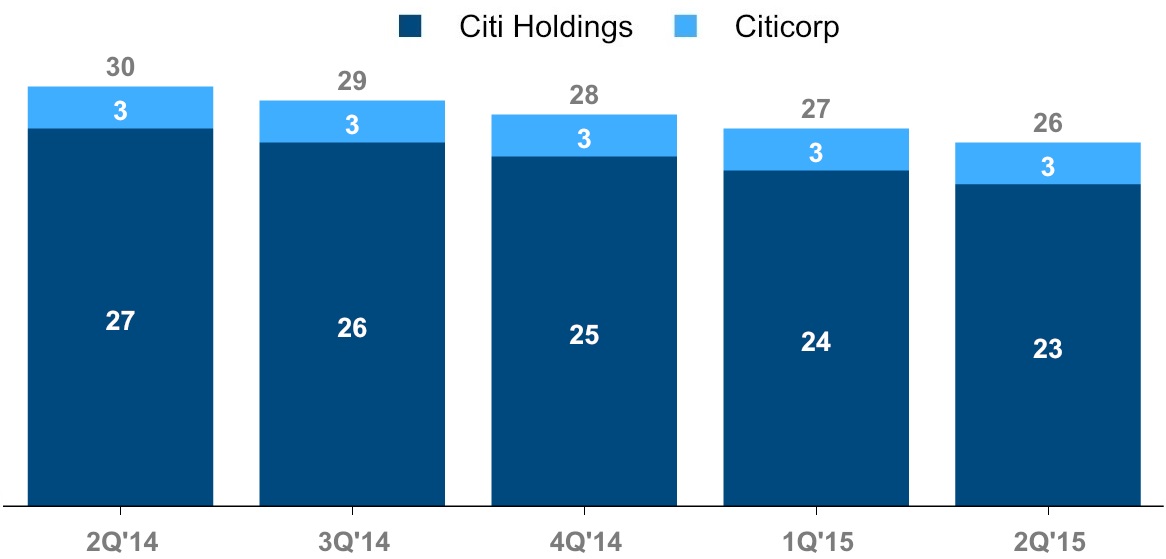
North America Home Equity - Net Credit Losses In millions of dollars |
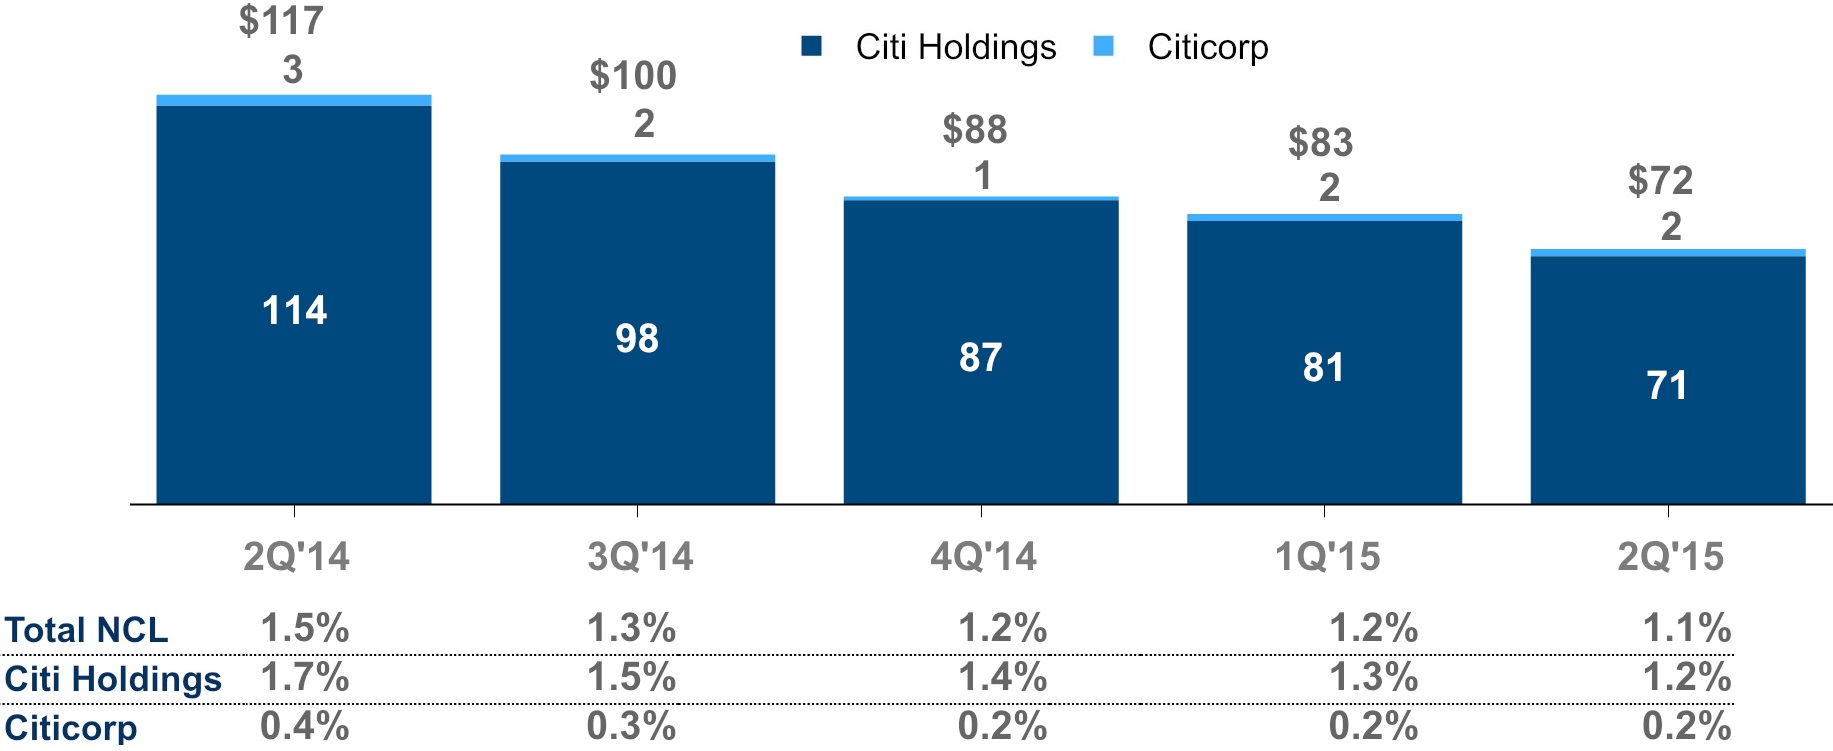
Note: Totals may not sum due to rounding.
64
North America Home Equity Loan Delinquencies - Citi Holdings In billions of dollars |
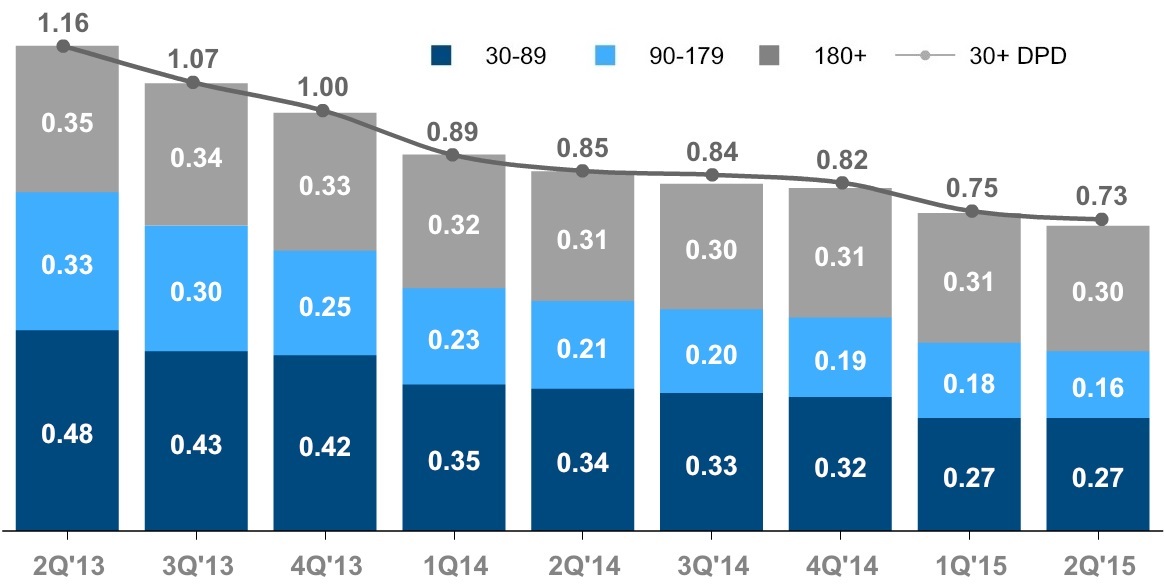
Note: Totals may not sum due to rounding.
As evidenced by the tables above, home equity loan net credit losses and delinquencies continued to improve during the second quarter of 2015, largely driven by the continued improvement in HPI. During the second quarter of 2015, the decline in delinquencies was primarily due to liquidations and continued modifications.
Given the currently limited market in which to sell delinquent home equity loans, as well as the relatively smaller number of home equity loan modifications and modification programs (see Note 15 to the Consolidated Financial Statements), Citi's ability to reduce delinquencies or net credit losses in its home equity loan portfolio in Citi Holdings, whether pursuant to deterioration of the underlying credit performance of these loans, the reset of the Revolving HELOCs (as discussed above) or otherwise, is more limited as compared to residential first mortgages.
North America Home Equity Loans-State Delinquency Trends
The following tables set forth, for total Citigroup, the six states and/or regions with the highest concentration of Citi's home equity loans as of June 30, 2015 and March 31, 2015.
In billions of dollars | June 30, 2015 | March 31, 2015 | ||||||||||||||||||||
State (1) | ENR (2) | ENR Distribution | 90+DPD % | % CLTV > 100% (3) | Refreshed FICO | ENR (2) | ENR Distribution | 90+DPD % | % CLTV > 100% (3) | Refreshed FICO | ||||||||||||
CA | $ | 6.8 | | 28 | % | 1.5 | % | 8 | % | 729 | | $ | 7.1 | | 28 | % | 1.5 | % | 10 | % | 729 | |
NY/NJ/CT (4) | 6.4 | | 26 | | 2.4 | | 11 | | 722 | | 6.6 | | 26 | | 2.5 | | 11 | | 721 | | ||
FL (4) | 1.7 | | 7 | | 1.9 | | 29 | | 709 | | 1.8 | | 7 | | 2.2 | | 35 | | 707 | | ||
VA/MD | 1.5 | | 6 | | 1.7 | | 27 | | 707 | | 1.6 | | 6 | | 1.6 | | 29 | | 706 | | ||
IL (4) | 1.0 | | 4 | | 1.4 | | 37 | | 718 | | 1.1 | | 4 | | 1.4 | | 41 | | 717 | | ||
IN/OH/MI (4) | 0.8 | | 3 | | 1.6 | | 33 | | 690 | | 0.8 | | 3 | | 1.9 | | 37 | | 688 | | ||
Other | 6.4 | | 26 | | 1.7 | | 18 | | 703 | | 6.7 | | 26 | | 1.7 | | 20 | | 702 | | ||
Total | $ | 24.7 | | 100 | % | 1.8 | % | 16 | % | 716 | | $ | 25.7 | | 100 | % | 1.9 | % | 18 | % | 715 | |
Note: Totals may not sum due to rounding.
(1) | Certain of the states are included as part of a region based on Citi's view of similar HPI within the region. |
(2) | Ending net receivables. Excludes loans in Canada and Puerto Rico and loans subject to LTSCs. Excludes balances for which FICO or LTV data are unavailable. |
(3) | Represents combined loan-to-value (CLTV) for both residential first mortgages and home equity loans. CLTV ratios (loan balance divided by appraised value) are calculated at origination and updated by applying market price data. |
(4) | New York, New Jersey, Connecticut, Indiana, Ohio, Florida and Illinois are judicial states. |
65
CONSUMER LOAN DETAILS
Consumer Loan Delinquency Amounts and Ratios
| Total loans (1) | 90+ days past due (2) | 30-89 days past due (2) | ||||||||||||||||||
In millions of dollars, | June 30, | June 30, | March 31, 2015 | June 30, | June 30, | March 31, 2015 | June 30, | ||||||||||||||
Citicorp (3)(4) |
|
|
|
|
|
|
| ||||||||||||||
Total | $ | 283.9 | | $ | 2,134 | | $ | 2,245 | | $ | 2,704 | | $ | 2,387 | | $ | 2,511 | | $ | 2,815 | |
Ratio |
| 0.75 | % | 0.80 | % | 0.92 | % | 0.84 | % | 0.90 | % | 0.96 | % | ||||||||
Retail banking |
|
|
|
|
|
|
| ||||||||||||||
Total | $ | 149.8 | | $ | 636 | | $ | 617 | | $ | 989 | | $ | 797 | | $ | 845 | | $ | 965 | |
Ratio |
| 0.43 | % | 0.42 | % | 0.64 | % | 0.53 | % | 0.58 | % | 0.63 | % | ||||||||
North America | 48.8 | | 150 | | 123 | | 227 | | 176 | | 203 | | 203 | | |||||||
Ratio |
| 0.31 | % | 0.26 | % | 0.50 | % | 0.37 | % | 0.43 | % | 0.45 | % | ||||||||
Latin America | 25.7 | | 296 | | 306 | | 540 | | 266 | | 282 | | 344 | | |||||||
Ratio |
| 1.15 | % | 1.20 | % | 1.85 | % | 1.04 | % | 1.10 | % | 1.18 | % | ||||||||
Asia (5) | 75.3 | | 190 | | 188 | | 222 | | 355 | | 360 | | 418 | | |||||||
Ratio |
| 0.25 | % | 0.25 | % | 0.28 | % | 0.47 | % | 0.48 | % | 0.53 | % | ||||||||
Cards |
|
|
|
|
|
|
| ||||||||||||||
Total | $ | 134.1 | | $ | 1,498 | | $ | 1,628 | | $ | 1,715 | | $ | 1,590 | | $ | 1,666 | | $ | 1,850 | |
Ratio |
| 1.12 | % | 1.23 | % | 1.22 | % | 1.19 | % | 1.26 | % | 1.32 | % | ||||||||
North America-Citi-branded | 64.5 | | 495 | | 569 | | 583 | | 462 | | 497 | | 540 | | |||||||
Ratio |
| 0.77 | % | 0.90 | % | 0.87 | % | 0.72 | % | 0.78 | % | 0.80 | % | ||||||||
North America-Citi retail services | 43.2 | | 567 | | 629 | | 606 | | 652 | | 673 | | 683 | | |||||||
Ratio |
| 1.31 | % | 1.48 | % | 1.41 | % | 1.51 | % | 1.59 | % | 1.58 | % | ||||||||
Latin America | 8.3 | | 245 | | 240 | | 303 | | 229 | | 247 | | 326 | | |||||||
Ratio |
| 2.95 | % | 2.82 | % | 3.00 | % | 2.76 | % | 2.91 | % | 3.23 | % | ||||||||
Asia (5) | 18.1 | | 191 | | 190 | | 223 | | 247 | | 249 | | 301 | | |||||||
Ratio |
| 1.06 | % | 1.07 | % | 1.14 | % | 1.36 | % | 1.40 | % | 1.54 | % | ||||||||
Citi Holdings (6)(7) |
|
|
|
|
|
|
| ||||||||||||||
Total | $ | 58.4 | | $ | 1,540 | | $ | 1,698 | | $ | 2,708 | | $ | 1,272 | | $ | 1,339 | | $ | 2,504 | |
Ratio |
| 2.76 | % | 2.88 | % | 3.23 | % | 2.28 | % | 2.27 | % | 2.99 | % | ||||||||
International | 4.2 | | 78 | | 91 | | 238 | | 119 | | 142 | | 330 | | |||||||
Ratio |
| 1.86 | % | 1.86 | % | 2.27 | % | 2.83 | % | 2.90 | % | 3.14 | % | ||||||||
North America | 54.2 | | 1,462 | | 1,607 | | 2,470 | | 1,153 | | 1,197 | | 2,174 | | |||||||
Ratio |
| 2.84 | % | 2.97 | % | 3.37 | % | 2.24 | % | 2.21 | % | 2.97 | % | ||||||||
Total Citigroup | $ | 342.3 | | $ | 3,674 | | $ | 3,943 | | $ | 5,412 | | $ | 3,659 | | $ | 3,850 | | $ | 5,319 | |
Ratio |
| 1.08 | % | 1.17 | % | 1.43 | % | 1.08 | % | 1.14 | % | 1.41 | % | ||||||||
(1) | Total loans include interest and fees on credit cards. |
(2) | The ratios of 90+ days past due and 30–89 days past due are calculated based on end-of-period (EOP) loans, net of unearned income. |
(3) | The 90+ days past due balances for North America-Citi-branded and North America-Citi retail services are generally still accruing interest. Citigroup's policy is generally to accrue interest on credit card loans until 180 days past due, unless notification of bankruptcy filing has been received earlier. |
(4) | The 90+ days and 30–89 days past due and related ratios for Citicorp North America exclude U.S. mortgage loans that are guaranteed by U.S. government-sponsored entities since the potential loss predominantly resides within the U.S. government-sponsored entities. The amounts excluded for loans 90+ days past due and (EOP loans) were $423 million ($0.8 billion), $534 million ($1.1 billion) and $668 million ($1.2 billion) at June 30, 2015, March 31, 2015 and June 30, 2014, respectively. The amounts excluded for loans 30–89 days past due (EOP loans have the same adjustment as above) were $75 million, $111 million and $125 million at June 30, 2015, March 31, 2015 and June 30, 2014, respectively. |
(5) | For reporting purposes, Asia GCB includes the results of operations of EMEA GCB for all periods presented. |
(6) | The 90+ days and 30–89 days past due and related ratios for Citi Holdings North America exclude U.S. mortgage loans that are guaranteed by U.S. government-sponsored entities since the potential loss predominantly resides within the U.S. government-sponsored entities. The amounts excluded for loans 90+ days past due (and EOP loans) for each period were $1.7 billion ($2.7 billion), $1.8 billion ($2.5 billion) and $2.8 billion ($5.2 billion) at June 30, 2015, March 31, 2015 and June 30, 2014, respectively. The amounts excluded for loans 30–89 days past due (EOP loans have the same adjustment as above) for each period were $0.3 |
billion, $0.2 billion and $0.7 billion at June 30, 2015, March 31, 2015 and June 30, 2014, respectively.
66
(7) | The June 30, 2015, March 31, 2015 and June 30, 2014 loans 90+ days past due and 30–89 days past due and related ratios for North America exclude $12 million, $12 million and $17 million, respectively, of loans that are carried at fair value. |
Consumer Loan Net Credit Losses and Ratios
| Average loans (1) | Net credit losses (2)(3) | ||||||||||
In millions of dollars, except average loan amounts in billions | 2Q15 | 2Q15 | 1Q15 | 2Q14 | ||||||||
Citicorp |
|
|
|
| ||||||||
Total | $ | 282.2 | | $ | 1,579 | | $ | 1,551 | | $ | 1,738 | |
Ratio |
| 2.24 | % | 2.22 | % | 2.39 | % | |||||
Retail banking |
|
|
|
| ||||||||
Total | $ | 149.8 | | $ | 315 | | $ | 294 | | $ | 331 | |
Ratio |
| 0.84 | % | 0.80 | % | 0.87 | % | |||||
North America | 49.0 | | 40 | | 36 | | 37 | | ||||
Ratio |
| 0.33 | % | 0.31 | % | 0.33 | % | |||||
Latin America | 25.7 | | 196 | | 188 | | 211 | | ||||
Ratio |
| 3.06 | % | 2.97 | % | 2.92 | % | |||||
Asia (4) | 75.1 | | 79 | | 70 | | 83 | | ||||
Ratio |
| 0.42 | % | 0.38 | % | 0.42 | % | |||||
Cards |
|
|
|
| ||||||||
Total | $ | 132.4 | | $ | 1,264 | | $ | 1,257 | | $ | 1,407 | |
Ratio |
| 3.83 | % | 3.78 | % | 4.08 | % | |||||
North America-Citi-branded | 63.2 | | 503 | | 492 | | 570 | | ||||
Ratio |
| 3.19 | % | 3.11 | % | 3.44 | % | |||||
North America-Retail services | 42.6 | | 457 | | 433 | | 465 | | ||||
Ratio |
| 4.30 | % | 4.00 | % | 4.40 | % | |||||
Latin America | 8.5 | | 196 | | 229 | | 243 | | ||||
Ratio |
| 9.25 | % | 10.55 | % | 9.46 | % | |||||
Asia (4) | 18.1 | | 108 | | 103 | | 129 | | ||||
Ratio |
| 2.39 | % | 2.32 | % | 2.69 | % | |||||
Citi Holdings (3) |
|
|
|
| ||||||||
Total | $ | 59.9 | | $ | 234 | | $ | 414 | | $ | 439 | |
Ratio |
| 1.57 | % | 2.20 | % | 1.88 | % | |||||
International | 4.5 | | 41 | | 51 | | 83 | | ||||
Ratio |
| 3.65 | % | 2.80 | % | 2.60 | % | |||||
North America | 55.4 | | 193 | | 363 | | 356 | | ||||
Ratio |
| 1.40 | % | 2.14 | % | 1.77 | % | |||||
Other (5) | - | | 1 | | 1 | | 1 | | ||||
Total Citigroup | $ | 342.1 | | $ | 1,814 | | $ | 1,966 | | $ | 2,178 | |
Ratio |
| 2.13 | % | 2.22 | % | 2.27 | % | |||||
(1) | Average loans include interest and fees on credit cards. |
(2) | The ratios of net credit losses are calculated based on average loans, net of unearned income. |
(3) | As a result of the entry into an agreement in March 2015 to sell OneMain Financial (OneMain), OneMain was classified as held-for-sale (HFS) at the end of the first quarter 2015. As a result of HFS accounting treatment, approximately $160 million of net credit losses were recorded as a reduction in revenue (Other revenue) during the second quarter of 2015. |
(4) | For reporting purposes, Asia GCB includes the results of operations of EMEA GCB for all periods presented. |
(5) | Represents NCLs on loans classified as Consumer loans on the Consolidated Balance Sheet that are not included in the Citi Holdings consumer credit metrics. |
67
CORPORATE CREDIT DETAILS
Consistent with its overall strategy, Citi's corporate clients are typically large, multi-national corporations which value Citi's global network. Citi aims to establish relationships with these clients that encompass multiple products, consistent with client needs, including cash management and trade services, foreign exchange, lending, capital markets and M&A advisory.
Corporate Credit Portfolio
The following table sets forth Citi's corporate credit portfolio (excluding private bank in ICG ), before consideration of collateral or hedges, by remaining tenor at June 30, 2015 , March 31, 2015 and December 31, 2014 . The vast majority of Citi's corporate credit portfolio resides in ICG; as of June 30, 2015, less than 1% of Citi's corporate credit exposure resided in Citi Holdings.
| At June 30, 2015 | At March 31, 2015 | At December 31, 2014 | |||||||||||||||||||||||||||||||||
In billions of dollars | Due within 1 year | Greater than 1 year but within 5 years | Greater than 5 years | Total Exposure | Due | Greater | Greater | Total | Due within 1 year | Greater than 1 year but within 5 years | Greater than 5 years | Total exposure | ||||||||||||||||||||||||
Direct outstandings (on-balance sheet) (1) | $ | 97 | | $ | 98 | | $ | 29 | | $ | 224 | | $ | 93 | | $ | 91 | | $ | 32 | | $ | 216 | | $ | 95 | | $ | 85 | | $ | 33 | | $ | 213 | |
Unfunded lending commitments (off-balance sheet) (2) | 93 | | 202 | | 36 | | 331 | | 86 | | 206 | | 27 | | 319 | | 92 | | 207 | | 33 | | 332 | | ||||||||||||
Total exposure | $ | 190 | | $ | 300 | | $ | 65 | | $ | 555 | | $ | 179 | | $ | 297 | | $ | 59 | | $ | 535 | | $ | 187 | | $ | 292 | | $ | 66 | | $ | 545 | |
(1) | Includes drawn loans, overdrafts, bankers' acceptances and leases. |
(2) | Includes unused commitments to lend, letters of credit and financial guarantees. |
Portfolio Mix-Geography, Counterparty and Industry
Citi's corporate credit portfolio is diverse across geography and counterparty. The following table shows the percentage by region based on Citi's internal management geography:
| June 30, | March 31, | December 31, | |||
North America | 55 | % | 54 | % | 55 | % |
EMEA | 25 | | 25 | | 25 | |
Asia | 13 | | 14 | | 13 | |
Latin America | 7 | | 7 | | 7 | |
Total | 100 | % | 100 | % | 100 | % |
The maintenance of accurate and consistent risk ratings across the corporate credit portfolio facilitates the comparison of credit exposure across all lines of business, geographic regions and products. Counterparty risk ratings reflect an estimated probability of default for a counterparty and are derived primarily through the use of validated statistical models, scorecard models and external agency ratings (under defined circumstances), in combination with consideration of factors specific to the obligor or market, such as management experience, competitive position, regulatory environment and commodity prices. Facility risk ratings are assigned that reflect the probability of default of
the obligor and factors that affect the loss-given-default of the facility, such as support or collateral. Internal obligor ratings that generally correspond to BBB and above are
considered investment grade, while those below are considered non-investment grade.
Citigroup also has incorporated climate risk assessment and reporting criteria for certain obligors, as necessary. Factors evaluated include consideration of climate risk to an
obligor's business and physical assets and, when relevant, consideration of cost-effective options to reduce greenhouse gas emissions.
68
The following table presents the corporate credit portfolio by facility risk rating at June 30, 2015 , March 31, 2015 and December 31, 2014 , as a percentage of the total corporate credit portfolio:
| Total Exposure | |||||
| June 30, | March 31, | December 31, | |||
AAA/AA/A | 51 | % | 50 | % | 49 | % |
BBB | 33 | | 33 | | 33 | |
BB/B | 15 | | 15 | | 16 | |
CCC or below | 1 | | 2 | | 1 | |
Unrated | - | | - | | 1 | |
Total | 100 | % | 100 | % | 100 | % |
Note: Total exposure includes direct outstandings and unfunded lending commitments.
Citi's corporate credit portfolio is also diversified by industry. The following table shows the allocation of Citi's total corporate credit portfolio by industry:
| Total Exposure | |||||
| June 30, | March 31, | December 31, | |||
Transportation and industrial | 21 | % | 21 | % | 21 | % |
Consumer retail and health | 15 | | 16 | | 17 | |
Technology, media and telecom | 11 | | 10 | | 9 | |
Energy (1) | 10 | | 10 | | 10 | |
Power, chemicals, commodities and metals and mining | 10 | | 10 | | 10 | |
Banks/broker-dealers | 8 | | 8 | | 8 | |
Hedge funds | 6 | | 5 | | 5 | |
Real estate | 5 | | 5 | | 6 | |
Public sector | 5 | | 6 | | 5 | |
Insurance and special purpose entities | 5 | | 5 | | 5 | |
Other industries | 4 | | 4 | | 4 | |
Total | 100 | % | 100 | % | 100 | % |
Note: Total exposure includes direct outstandings and unfunded lending commitments.
(1) In addition to this exposure, Citi also has energy-related exposure within the "Public sector" (e.g., energy-related state-owned entities) and "Transportation and industrial" sector (e.g., off-shore drilling entities) included in the table above. As of June 30, 2015, Citi's total exposure to these energy-related entities remained largely consistent with the prior quarter, at approximately $7 billion, of which approximately $4 billion consisted of direct outstanding funded loans.
As of June 30, 2015, Citi's total corporate credit exposure to the energy and energy-related sector (see footnote 1 to the table above) was approximately $60 billion, with approximately $22 billion, or 3%, of Citi's total outstanding loans consisting of direct outstanding funded loans. This compared to approximately $58 billion of total
corporate credit exposure and $22 billion of direct outstanding funded loans as of March 31, 2015. In addition, as of June 30, 2015, approximately 72% of Citi's total corporate credit energy and energy-related exposure (based on the methodology described above) was in the United States, United Kingdom and Canada (compared to approximately 69% at March 31, 2015). Also, as of June 30, 2015, approximately 83% of Citi's total energy and energy-related exposures were rated investment grade (compared to approximately 82% as of March 31, 2015). While market developments led to an approximate $43 million loan loss reserve build in ICG during the current quarter, Citi did not experience any material net credit losses against its corporate energy exposures in the current quarter.
Credit Risk Mitigation
As part of its overall risk management activities, Citigroup uses credit derivatives and other risk mitigants to hedge portions of the credit risk in its corporate credit portfolio, in addition to outright asset sales. The results of the mark-to-market and any realized gains or losses on credit derivatives are reflected in Principal transactions on the Consolidated Statement of Income.
At June 30, 2015 , March 31, 2015 and December 31, 2014 , $25.2 billion, $27.2 billion and $27.6 billion, respectively, of the corporate credit portfolio was economically hedged. Citigroup's expected loss model used in the calculation of its loan loss reserve does not include the favorable impact of credit derivatives and other mitigants that are marked-to-market. In addition, the reported amounts of direct outstandings and unfunded lending commitments in the tables above do not reflect the impact of these hedging transactions. At June 30, 2015 , March 31, 2015 and December 31, 2014 , the credit protection was economically hedging underlying corporate credit portfolio exposures with the following risk rating distribution:
Rating of Hedged Exposure
| June 30, | March 31, | December 31, | |||
AAA/AA/A | 23 | % | 23 | % | 24 | % |
BBB | 38 | | 38 | | 42 | |
BB/B | 34 | | 33 | | 28 | |
CCC or below | 5 | | 6 | | 6 | |
Total | 100 | % | 100 | % | 100 | % |
At June 30, 2015 , March 31, 2015 and December 31, 2014 , the credit protection was economically hedging underlying corporate credit portfolio exposures with the following industry distribution:
69
Industry of Hedged Exposure
| June 30, | March 31, | December 31, | |||
Transportation and industrial | 30 | % | 30 | % | 30 | % |
Technology, media and telecom | 14 | | 14 | | 15 | |
Power, chemicals, commodities and metals and mining | 13 | | 15 | | 15 | |
Energy | 13 | | 12 | | 10 | |
Consumer retail and health | 12 | | 12 | | 11 | |
Banks/broker-dealers | 6 | | 7 | | 7 | |
Public Sector | 6 | | 4 | | 6 | |
Insurance and special purpose entities | 4 | | 4 | | 4 | |
Other industries | 2 | | 2 | | 2 | |
Total | 100 | % | 100 | % | 100 | % |
For additional information on Citi's corporate credit portfolio, including allowance for loan losses, coverage ratios and corporate non-accrual loans, see "Credit Risk-Loans Outstanding, Details of Credit Loss Experience, Allowance for Loan Losses and Non-Accrual Loans and Assets" above.
70
MARKET RISK
Market risk encompasses funding and liquidity risk and price risk, each of which arise in the normal course of business of a global financial intermediary such as Citi. For additional information, see "Managing Global Risk-Market Risk" in Citi's 2014 Annual Report on Form 10-K.
Funding and Liquidity Risk
For additional information on funding and liquidity risk at Citigroup, including Citi's liquidity management, stress testing and certain of its additional liquidity measures, see "Market Risk-Funding and Liquidity Risk" and "Risk Factors" in Citi's 2014 Annual Report on Form 10-K.
High-Quality Liquid Assets
| Parent (1) | Significant Citibank Entities (2) | Other Citibank and Banamex Entities | Total | ||||||||||||||||||||
In billions of dollars | Jun. 30, 2015 | Mar. 31, 2015 | Jun. 30, 2015 | Mar. 31, 2015 | Jun. 30, 2015 | Mar. 31, 2015 | Jun. 30, 2015 | Mar. 31, 2015 | ||||||||||||||||
Available cash | $ | 17.8 | | $ | 18.3 | | $ | 63.7 | | $ | 71.3 | | $ | 8.2 | | $ | 4.9 | | $ | 89.7 | | $ | 94.5 | |
Unencumbered liquid securities | 29.0 | | 30.3 | | 210.7 | | 207.1 | | 56.4 | | 68.6 | | $ | 296.1 | | $ | 306.0 | | ||||||
Total | $ | 46.8 | | $ | 48.6 | | $ | 274.4 | | $ | 278.4 | | $ | 64.6 | | $ | 73.5 | | $ | 385.8 | | $ | 400.5 | |
Note: Amounts set forth in the table above are based on the U.S. Liquidity Coverage Ratio (LCR) rules. All amounts are as of period end and may increase or decrease intra-period in the ordinary course of business.
(1) "Parent" consists of Citigroup, the parent holding company and Citi's broker-dealer subsidiaries that are consolidated into Citigroup.
(2) "Significant Citibank Entities" consist of Citibank, N.A. units domiciled in the U.S., Western Europe, Hong Kong, Japan and Singapore.
As set forth in the table above, Citi's high-quality liquid assets (HQLA) as of June 30, 2015 were $385.8 billion, compared to $400.5 billion as of March 31, 2015. The decrease in HQLA quarter-over-quarter was largely driven by Citi's purposeful reduction of short-term borrowings. In addition, as Citi continues to improve the liquidity value of its deposits (see "Deposits" and "Liquidity Coverage Ratio (LCR)" below), Citi is able to reduce its required levels of HQLA.
Prior to September 30, 2014, Citi reported its HQLA based on the Basel Committee's LCR rules. On this basis, Citi's HQLA was $434.9 billion as of June 30, 2014. Year-over-year, the decrease in Citi's HQLA was primarily due to the impact of the U.S. LCR rules, which excluded municipal securities, covered bonds and residential mortgage-backed securities from the definition of HQLA.
The following table shows further detail of the composition of Citi's HQLA by type of asset as of June 30, 2015 and March 31, 2015. For securities, the amounts represent the liquidity value that potentially could be realized, and thus exclude any securities that are encumbered, as well as the haircuts that would be required for secured financing transactions.
In billions of dollars | Jun. 30, 2015 | Mar. 31, 2015 | ||||
Available cash | $ | 89.7 | | $ | 94.5 | |
U.S. Treasuries | 138.2 | | 135.4 | | ||
U.S. Agencies/Agency MBS | 59.7 | | 57.3 | | ||
Foreign government (1) | 94.1 | | 110.3 | | ||
Other investment grade | 4.0 | | 3.1 | | ||
Total | $ | 385.8 | | $ | 400.5 | |
Note: Amounts set forth in the table above are based on the U.S. LCR rules.
(1) | Foreign government includes securities issued or guaranteed by foreign sovereigns, agencies and multilateral development banks. Foreign government securities are held largely to support local liquidity requirements and Citi's local franchises and principally included government bonds from Brazil, Hong Kong, India, Korea, Mexico and Singapore. |
Citi's HQLA as set forth above does not include additional potential liquidity in the form of Citigroup's borrowing capacity from the various Federal Home Loan Banks (FHLB), which was approximately $37 billion as of June 30, 2015 (compared to $38 billion as of March 31, 2015 and $27 billion as of June 30, 2014) and is maintained by pledged collateral to all such banks. The HQLA shown above also does not include Citi's borrowing capacity at the U.S. Federal Reserve Bank discount window or international central banks, which would be in addition to the resources noted above.
In general, Citigroup can freely fund legal entities within its bank vehicles. Citigroup's bank subsidiaries, including Citibank, N.A., can lend to the Citigroup parent and broker-
71
dealer entities in accordance with Section 23A of the Federal Reserve Act. As of June 30, 2015, the amount available for lending to these entities under Section 23A was approximately $17 billion (unchanged from March 31, 2015 and June 30, 2014), subject to collateral requirements.
Deposits
Deposits are the primary and lowest cost funding source for Citi's bank subsidiaries. The table below sets forth the end-of-period deposits, by business and/or segment, and the total average deposits for each of the periods indicated.
In billions of dollars | Jun. 30, 2015 | Mar. 31, 2015 | Jun. 30, 2014 | ||||||
Global Consumer Banking |
|
|
| ||||||
North America | $ | 173.5 | | $ | 172.6 | | $ | 170.6 | |
Latin America | 42.1 | | 42.0 | | 46.3 | | |||
Asia (1) | 89.6 | | 89.7 | | 93.1 | | |||
Total | $ | 305.2 | | $ | 304.3 | | $ | 310.0 | |
ICG |
|
|
| ||||||
Treasury and trade solutions (TTS) | $ | 397.5 | | $ | 386.5 | | $ | 383.5 | |
Banking ex-TTS | 108.2 | | 104.4 | | 93.6 | | |||
Markets and securities services | 82.4 | | 80.2 | | 94.7 | | |||
Total | $ | 588.1 | | $ | 571.1 | | $ | 571.9 | |
Corporate/Other | 7.0 | | 12.3 | | 31.4 | | |||
Total Citicorp | $ | 900.3 | | $ | 887.7 | | $ | 913.3 | |
Total Citi Holdings (2) | 7.7 | | 11.9 | | 52.4 | | |||
Total Citigroup deposits (EOP) | $ | 908.0 | | $ | 899.6 | | $ | 965.7 | |
Total Citigroup deposits (AVG) | $ | 906.4 | | $ | 899.5 | | $ | 959.5 | |
(1) | For reporting purposes, includes EMEA GCB for all periods presented. |
(2) | June 30, 2015 and March 31, 2015 deposit balances reflect the reclassification to held-for-sale of approximately $20 billion of deposits as a result of Citigroup's entry into an agreement in December 2014 to sell its Japan retail banking business. |
End-of-period deposits decreased 6% year-over-year and increased 1% quarter-over-quarter. Excluding the impact of FX translation, Citigroup's end-of-period deposits declined 1% year-over-year. On this basis, Citicorp deposits grew 3%, offset by a decline in Citi Holdings deposits. Within Citicorp, GCB deposits increased 3% year-over-year, driven by 4% growth in international deposits. ICG deposits increased 8% year-over-year, with continued high-quality deposit growth (as discussed below), particularly in treasury and trade solutions in North America . The decline in Citi Holdings deposits was primarily driven by the reclassification to held-for-sale of deposits relating to Citi's Japan retail banking business (see note 2 to the table above), as well as the continued transfer of MSSB deposits to Morgan Stanley, which was completed as of June 30, 2015. Average deposits declined 1% year-over-year, as the growth in Citicorp was more than offset by the reduction in Citi Holdings deposits. Average deposits grew 1% quarter-over-quarter, primarily due to 4% growth in ICG , partially offset by the ongoing reduction in Citi Holdings deposits.
Citi monitors its deposit base across multiple dimensions, including what Citi refers to as "LCR value" or the liquidity value of the deposit base under the U.S. LCR rules. Under U.S. LCR rules, deposits are assigned liquidity values based on expected behavior under stress, determined by the type of deposit and the type of client. Generally, the U.S. LCR rules prioritize operating accounts of consumers (including retail and commercial banking deposits) and corporations, while assigning lower liquidity values to non-operating balances of financial institutions. As of June 30, 2015, Citi's total deposits had a liquidity value of approximately 74% under the U.S. LCR rules, a slight increase from 73% as of March 31, 2015, with a liquidity value of approximately 87% for Citi's GCB deposits and 68% for ICG deposits, including Corporate/Other .
Long-Term Debt
Long-term debt (generally defined as debt with original maturities of one year or more) represents the most significant component of Citi's funding for the parent entities and is a supplementary source of funding for the bank entities.
Long-term debt is an important funding source due in part to its multi-year maturity structure. The weighted-average maturities of unsecured long-term debt issued by Citigroup and its affiliates (including Citibank, N.A.) with a remaining life greater than one year (excluding remaining trust preferred securities outstanding) was approximately 6.7 years as of June 30, 2015 , a slight decline from the prior quarter and year, due in part to the repurchase of certain longer-dated debt securities during the second quarter of 2015.
Citi's long-term debt outstanding at the parent includes benchmark debt and what Citi refers to as customer-related debt, consisting of structured notes, such as equity- and credit-linked notes, as well as non-structured notes. Citi's issuance of customer-related debt is generally driven by customer demand and supplements benchmark debt issuance as a source of funding for Citi's parent entities. Citi's long-term debt at the bank also includes FHLB advances and securitizations.
72
Long-Term Debt Outstanding
The following table sets forth Citi's total long-term debt outstanding for the periods indicated:
In billions of dollars | Jun. 30, 2015 | Mar. 31, 2015 | Jun. 30, 2014 | ||||||
Parent (1) | $ | 155.1 | | $ | 151.8 | | $ | 163.0 | |
Benchmark debt: |
|
|
| ||||||
Senior debt | 97.3 | | 95.5 | | 97.8 | | |||
Subordinated debt | 25.6 | | 25.5 | | 28.1 | | |||
Trust preferred | 1.7 | | 1.7 | | 1.8 | | |||
Customer-Related debt: | | | | ||||||
Structured debt | 23.7 | | 21.9 | | 22.5 | | |||
Non-structured debt | 4.5 | | 5.0 | | 8.0 | | |||
Local Country and Other (1)(3) | 2.3 | | 2.2 | | 4.8 | | |||
Bank | $ | 56.7 | | $ | 58.7 | | $ | 64.0 | |
FHLB Borrowings | 16.8 | | 16.3 | | 19.1 | | |||
Securitizations (3) | 32.0 | | 35.2 | | 38.1 | | |||
Local Country and Other (2) | 7.9 | | 7.2 | | 6.8 | | |||
Total long-term debt (1) | $ | 211.8 | | $ | 210.5 | | $ | 227.0 | |
Note: Amounts represent the current value of long-term debt on Citi's Consolidated Balance Sheet which, for certain debt instruments, includes consideration of fair value, hedging impacts and unamortized discounts and premiums.
(1) | June 30, 2015 and March 31, 2015 long-term debt balances exclude approximately $5.9 billion and $4.7 billion, respectively, of long-term debt (consisting largely of personal loan securitizations) relating to OneMain Financial, classified as held-for-sale, as a result of Citigroup's entry into an agreement in March 2015 to sell its OneMain Financial business. |
(2) | Local country debt includes debt issued by Citi's affiliates in support of their local operations. |
(3) | Predominantly credit card securitizations, primarily backed by Citi-branded credit cards. |
Citi's total long-term debt outstanding decreased year-over-year and increased slightly quarter-over-quarter. Year-over-year, Citi's total long-term debt outstanding decreased primarily due to a reduction in securitizations at the bank entities, as well as the reclassification to held-for-sale of long-term debt relating to OneMain Financial (see note 1 to the table above). Sequentially, Citi's total long-term debt increased slightly due to issuance of senior debt at the parent level, partially offset by continued reductions in credit card securitizations at the bank entities.
As part of its liability management, Citi has considered, and may continue to consider, opportunities to repurchase its long-term debt pursuant to open market purchases, tender offers or other means. Such repurchases help reduce Citi's overall funding costs. During the second quarter of 2015, Citi repurchased an aggregate of approximately $2.8 billion of its outstanding long-term debt.
Going forward, changes in Citi's long-term debt outstanding will continue to reflect the funding needs of its businesses as well as the market and economic environment and any regulatory changes or requirements. For additional information on regulatory changes and requirements impacting Citi's overall funding and liquidity, see "Market Risk - Funding and Liquidity Risk - Total Loss-Absorbing Capacity," "Liquidity Management, Stress Testing and Measurement" and "Risk Factors" in Citi's 2014 Annual Report on Form 10-K.
Long-Term Debt Issuances and Maturities
The table below details Citi's long-term debt issuances and maturities (including repurchases and redemptions) during the periods presented:
| 2Q15 | 1Q15 | 2Q14 | |||||||||||||||
In billions of dollars | Maturities | Issuances | Maturities | Issuances | Maturities | Issuances | ||||||||||||
Parent (1) | $ | 7.0 | | $ | 12.5 | | $ | 8.6 | | $ | 11.1 | | $ | 11.1 | | $ | 10.0 | |
Benchmark debt: |
|
|
|
|
|
| ||||||||||||
Senior debt | 3.2 | | 5.4 | | 5.1 | | 6.1 | | 4.7 | | 5.6 | | ||||||
Subordinated debt | 2.0 | | 3.0 | | 0.4 | | 1.0 | | 1.0 | | 1.0 | | ||||||
Trust preferred | - | | - | | - | | - | | 2.1 | | - | | ||||||
Customer-related debt: | | |
|
|
|
| ||||||||||||
Structured debt | 1.4 | | 3.9 | | 2.5 | | 2.8 | | 2.2 | | 2.2 | | ||||||
Non-structured debt | 0.3 | | 0.1 | | 0.4 | | - | | 0.3 | | 0.4 | | ||||||
Local Country and Other (1) | 0.1 | | 0.1 | | 0.2 | | 1.2 | | 0.8 | | 0.8 | | ||||||
Bank | $ | 3.6 | | $ | 1.7 | | $ | 6.9 | | $ | 0.6 | | $ | 4.2 | | $ | 8.7 | |
FHLB borrowings | - | | 0.5 | | 3.5 | | - | | 1.0 | | 6.1 | | ||||||
Securitizations | 3.2 | | - | | 2.8 | | - | | 1.4 | | 2.4 | | ||||||
Local Country and Other | 0.4 | | 1.2 | | 0.5 | | 0.6 | | 1.8 | | 0.2 | | ||||||
Total (1) | $ | 10.6 | | $ | 14.2 | | $ | 15.5 | | $ | 11.7 | | $ | 15.3 | | $ | 18.7 | |
(1) As a result of OneMain Financial's reclassification to held-for-sale in March 2015, 2Q15 excludes issuances of $1.2 billion relating to OneMain Financial and classified to held-for-sale, while 1Q15 includes issuances of $1.2 billion subsequently reclassified to held-for-sale.
73
| Maturities 1H15 |
|
| ||||||||||||||||||||||||
In billions of dollars | 2015 | 2016 | 2017 | 2018 | 2019 | 2020 | Thereafter | Total | |||||||||||||||||||
Parent (1) | $ | 15.6 | | $ | 8.0 | | $ | 19.4 | | $ | 25.8 | | $ | 19.3 | | $ | 18.8 | | $ | 5.8 | | $ | 58.0 | | $ | 155.1 | |
Benchmark debt: |
|
|
|
|
|
|
|
| | ||||||||||||||||||
Senior debt | 8.3 | | 5.3 | | 11.9 | | 19.4 | | 15.4 | | 14.6 | | 4.0 | | 26.7 | | 97.3 | | |||||||||
Subordinated debt | 2.4 | | 0.1 | | 1.5 | | 2.9 | | 1.2 | | 1.3 | | - | | 18.6 | | 25.6 | | |||||||||
Trust preferred | - | | - | | - | | - | | - | | - | | - | | 1.7 | | 1.7 | | |||||||||
Customer-related debt: |
|
|
|
|
|
|
|
| | ||||||||||||||||||
Structured debt | 3.9 | | 1.7 | | 5.1 | | 3.0 | | 2.3 | | 1.7 | | 1.7 | | 8.2 | | 23.7 | | |||||||||
Non-structured debt | 0.7 | | 0.9 | | 0.9 | | 0.5 | | 0.4 | | 0.2 | | 0.1 | | 1.5 | | 4.5 | | |||||||||
Local Country and Other (1) | 0.3 | | - | | - | | - | | - | | 1.0 | | - | | 1.3 | | 2.3 | | |||||||||
Bank | $ | 10.5 | | $ | 3.5 | | $ | 23.2 | | $ | 14.8 | | $ | 9.0 | | $ | 2.2 | | $ | 0.3 | | $ | 3.7 | | 56.7 | | |
FHLB borrowings | 3.5 | | 0.5 | | 9.6 | | 6.3 | | 0.4 | | - | | - | | - | | 16.8 | | |||||||||
Securitizations | 6.0 | | 1.8 | | 10.2 | | 6.4 | | 8.3 | | 1.9 | | - | | 3.4 | | 32.0 | | |||||||||
Local Country and Other | 0.9 | | 1.2 | | 3.4 | | 2.1 | | 0.3 | | 0.3 | | 0.3 | | 0.3 | | 7.9 | | |||||||||
Total long-term debt (1) | $ | 26.1 | | $ | 11.5 | | $ | 42.6 | | $ | 40.6 | | $ | 28.3 | | $ | 21.0 | | $ | 6.1 | | $ | 61.7 | | $ | 211.8 | |
(1) Maturities exclude OneMain Financial long-term debt of approximately $5.9 billion (consisting largely of personal loan securitizations) reclassified to held-for-sale as a result of Citigroup's entry into an agreement in March 2015 to sell its OneMain Financial business.
Secured Funding Transactions and Short-Term Borrowings
Secured Funding
Secured funding is primarily conducted through Citi's broker-dealer subsidiaries to fund efficiently both secured lending activity and a portion of trading inventory. Citi also conducts a smaller portion of its secured funding transactions through its bank entities, which is typically collateralized by foreign government securities. Generally, daily changes in the level of Citi's secured funding are primarily due to fluctuations in secured lending activity in the matched book (as described below) and trading inventory.
Secured funding of $177 billion as of June 30, 2015 declined 4% from the prior-year period, primarily driven by the impact of FX translation, and was largely unchanged sequentially. Excluding the impact of FX translation, secured funding increased 6% from the prior-year period driven by normal business activity. Average balances for secured funding were approximately $183 billion for the quarter ended June 30, 2015 , compared to $177 billion for the quarter ended March 31, 2015 and $193 billion for the quarter ended June 30, 2014 .
The portion of secured funding in the broker-dealer subsidiaries that funds secured lending is commonly referred to as "matched book" activity. The majority of this activity is secured by high quality, liquid securities such as U.S. Treasury securities, U.S. agency securities and foreign sovereign debt. Other secured funding is secured by less liquid securities, including equity securities, corporate bonds and asset-backed securities. The tenor of Citi's matched book liabilities is equal to or longer than the tenor of the corresponding matched book assets.
The remainder of the secured funding activity in the broker-dealer subsidiaries serves to fund trading inventory. To
maintain reliable funding under a wide range of market conditions, including under periods of stress, Citi manages these activities by taking into consideration the quality of the underlying collateral, and stipulating financing tenor. The weighted average maturity of Citi's secured funding of less liquid trading inventory was greater than 110 days as of June 30, 2015 .
Citi manages the risks in its secured funding by conducting daily stress tests to account for changes in capacity, tenors, haircut, collateral profile and client actions. Additionally, Citi maintains counterparty diversification by establishing concentration triggers and assessing counterparty reliability and stability under stress. Citi generally sources secured funding from more than 150 counterparties.
Commercial Paper
The following table sets forth Citi's commercial paper outstanding for each of its parent and significant Citibank entities, respectively, for each of the periods indicated. Similar to other short-term borrowings described below, as Citi continued to grow its high-quality deposits, it reduced its reliance on short-term borrowings, including commercial paper.
In billions of dollars | Jun. 30, 2015 | Mar. 31, 2015 | Jun. 30, 2014 | ||||||
Commercial paper |
|
|
| ||||||
Parent | $ | - | | $ | 0.1 | | $ | 0.2 | |
Significant Citibank entities | 10.0 | | 10.9 | | 14.7 | | |||
Total | $ | 10.0 | | $ | 11.0 | | $ | 14.9 | |
74
Other Short-Term Borrowings
At June 30, 2015 , Citi's other short-term borrowings, which included borrowings from the FHLB and other market participants, were approximately $16 billion , compared to $28 billion at March 31, 2015 , and $45 billion at June 30, 2014 . As described under "Commercial Paper" above, Citi purposefully reduced its other short-term borrowings, including FHLB borrowings, as it continued to grow its high-quality deposits.
Liquidity Coverage Ratio (LCR)
In addition to internal short-term liquidity measures that Citi has developed, Citi also monitors its short-term liquidity by reference to the LCR, as calculated pursuant to the U.S. LCR rules. For additional information on the LCR, see "Market Risk - Funding and Liquidity Risk - Short-Term Liquidity Measurement; Liquidity Coverage Ratio" in Citi's 2014 Annual Report on Form 10-K.
The table below sets forth the components of Citi's LCR calculation and HQLA in excess of net outflows as of June 30, 2015 and March 31, 2015.
in billions of dollars | Jun. 30, 2015 | Mar. 31, 2015 | ||||
HQLA | $ | 385.8 | | $ | 400.5 | |
Net outflows | $ | 347.3 | | $ | 361.0 | |
LCR | 111 | % | 111 | % | ||
HQLA in excess of net outflows | $ | 38.6 | | $ | 39.5 | |
Note: Amounts set forth in the table above are based on the U.S. LCR rules.
As set forth in the table above, Citi's LCR remained unchanged quarter-over-quarter as the reduction in Citi's HQLA was offset by reduced deposit and debt maturity outflows reflecting the improvement in the LCR liquidity value of Citi's deposits as well as the continued reduction in short-term borrowings (each as described above).
As noted above, prior to September 30, 2014, Citi reported its LCR based on the Basel Committee's LCR rules. On this basis, Citi's LCR was 123% as of June 30, 2014. The decrease in Citi's LCR year-over-year was primarily due to the impact of the U.S. LCR rules. Specifically, as discussed under "High-Quality Liquid Assets" above, the U.S. LCR rules excluded certain assets from the calculation of HQLA. In addition, net outflows are higher under the U.S. LCR rules, primarily due to the "peak day" outflow requirement (i.e., net outflows are required to be based on the highest individual day's mismatch between contractual and certain non-defined maturity inflows and outflows within the 30-day LCR period) as well as higher deposit outflow assumptions resulting from the more stringent deposit classifications (e.g., the nature of the deposit balance or counterparty designation) under the U.S. LCR rules.
75
Credit Ratings
Citigroup's funding and liquidity, its funding capacity, ability to access capital markets and other sources of funds, the cost of these funds, and its ability to maintain certain deposits are partially dependent on its credit ratings. The table below sets forth the ratings for Citigroup and Citibank, N.A. as of June 30, 2015 . While not included in the table below, the long-term and short-term ratings of Citigroup Global Markets Inc. (CGMI) were A/A-1 at Standard & Poor's and A+/F1 at Fitch as of June 30, 2015 .
| Citigroup Inc. | Citibank, N.A. | ||||
| Senior debt | Commercial paper | Outlook | Long- term | Short- term | Outlook |
Fitch Ratings (Fitch) | A | F1 | Stable | A+ | F1 | Stable |
Moody's Investors Service (Moody's) | Baa1 | P-2 | Stable | A1 | P-1 | Stable |
Standard & Poor's (S&P) (1) | A- | A-2 | Negative | A | A-1 | Stable |
(1) See "Recent Credit Rating Developments" below.
Recent Credit Rating Developments
On May 19, 2015, Fitch revised its methodology relating to U.S. GSIBs by revising its U.S. Support Rating Floor (SRF), which sets the lower bound on the long-term ratings of U.S. GSIBs, to ‘No Floor' from ‘A'. This had no direct impact on Citigroup, as it did not benefit from the SRF. Additionally, Fitch introduced a rating differential between the long-term ratings of a bank's holding and operating companies, reflecting the expected implementation of total loss-absorbing capital (TLAC) requirements for U.S. GSIBs and the likelihood of a substantial debt buffer in the holding company. As a result of these methodology changes, Fitch upgraded the long-term ratings and deposit ratings of Citi's material U.S. operating companies by one notch. Specifically, the long-term ratings of Citibank, N.A. and CGMI (as noted above) were upgraded to ‘A+' from ‘A' and the deposit ratings for Citibank, N.A were upgraded to ‘AA-' from ‘A+'.
On May 28, 2015, Moody's concluded its reviews on 13 global investment banks. As a result of its reviews, Moody's affirmed Citigroup's Baseline Credit Assessment (BCA), or unsupported rating, of ‘baa2' and upgraded Citibank, N.A.'s long-term senior unsecured debt and long-term deposit ratings 1-notch to ‘A1' from ‘A2'. Moody's also upgraded Citigroup's senior unsecured debt rating by 1-notch, to ‘Baa1' from ‘Baa2' and its preferred stock rating to ‘Ba2' from ‘Ba3'.
As a result of the completion of its annual review of the U.S. banking industry, including the U.S. GSIBs, on July 23, 2015 S&P upgraded Citigroup's stand-alone credit profile (SACP), or unsupported rating, by 1-notch to ‘a-' from ‘bbb+', which also resulted in a 1-notch upgrade to Citigroup's hybrid capital instruments to ‘BB+' from ‘BB'. S&P affirmed the ‘A/A-1' issuer credit ratings on Citigroup's core and highly strategic operating subsidiaries, including Citibank, N.A. and Citigroup Global Markets Inc., with government support reduced from 2-notches to 1-notch, in line with its methodology for a U.S. highly systemically important institution with an ‘a-' SACP. These rating actions were driven by S&P's view that the risk to the U.S. banking industry has
reduced due to wide-ranging regulatory changes, and that Citigroup's management has effectively strengthened, de-risked, and simplified Citi's business model. Additionally, S&P revised the outlook on the ratings of Citi's operating subsidiaries, including Citibank, N.A. and Citigroup Global Markets Inc., to positive from stable as the long-term rating could be upgraded if the 1-notch of government support is removed and Citigroup's "Additional Loss Absorbing Capital" (ALAC) is sufficient to contribute 2-notches of uplift. The rating outlook on Citigroup and other U.S. GSIBs remains negative, reflecting S&P's ongoing evaluation of government support.
Potential Impacts of Ratings Downgrades
Ratings downgrades by Moody's, Fitch or S&P could negatively impact Citigroup's and/or Citibank, N.A.'s funding and liquidity due to reduced funding capacity, including derivatives triggers, which could take the form of cash obligations and collateral requirements.
The following information is provided for the purpose of analyzing the potential funding and liquidity impact to Citigroup and Citibank, N.A. of a hypothetical, simultaneous
ratings downgrade across all three major rating agencies. This analysis is subject to certain estimates, estimation methodologies, and judgments and uncertainties. Uncertainties include potential ratings limitations that certain entities may have with respect to permissible counterparties, as well as general subjective counterparty behavior. For example, certain corporate customers and trading counterparties could re-evaluate their business relationships with Citi and limit the trading of certain contracts or market instruments with Citi. Changes in counterparty behavior could impact Citi's funding and liquidity, as well as the results of operations of certain of its businesses. The actual impact to Citigroup or Citibank, N.A. is unpredictable and may differ materially from the potential funding and liquidity impacts described below.
For additional information on the impact of credit rating changes on Citi and its applicable subsidiaries, see "Risk
76
Factors-Liquidity Risks" in Citigroup's 2014 Annual Report on Form 10-K.
Citigroup Inc. and Citibank, N.A.-Potential Derivative Triggers
As of June 30, 2015 , Citi estimates that a hypothetical one-notch downgrade of the senior debt/long-term rating of Citigroup Inc. across all three major rating agencies could impact Citigroup's funding and liquidity due to derivative triggers by approximately $0.8 billion, compared to $0.9 billion as of March 31, 2015. Other funding sources, such as secured financing transactions and other margin requirements, for which there are no explicit triggers, could also be adversely affected.
As of June 30, 2015 , Citi estimates that a hypothetical one-notch downgrade of the senior debt/long-term rating of Citibank, N.A. across all three major rating agencies could impact Citibank, N.A.'s funding and liquidity by approximately $1.3 billion, compared to $1.5 billion as of March 31, 2015, due to derivative triggers.
In total, Citi estimates that a one-notch downgrade of Citigroup and Citibank, N.A., across all three major rating agencies, could result in aggregate cash obligations and collateral requirements of approximately $2.1 billion, compared to $2.4 billion as of March 31, 2015 (see also Note 21 to the Consolidated Financial Statements). As set forth under "High-Quality Liquid Assets" above, the liquidity resources of Citi's parent entities were approximately $47 billion, and the liquidity resources of Citi's significant Citibank entities and other Citibank and Banamex entities were approximately $339 billion, for a total of approximately $386 billion as of June 30, 2015 . These liquidity resources are available in part as a contingency for the potential events described above.
In addition, a broad range of mitigating actions are currently included in Citigroup's and Citibank, N.A.'s contingency funding plans. For Citigroup, these mitigating factors include, but are not limited to, accessing surplus funding capacity from existing clients, tailoring levels of secured lending, and adjusting the size of select trading books and collateralized borrowings from Citi's significant bank subsidiaries. Mitigating actions available to Citibank, N.A. include, but are not limited to, selling or financing highly liquid government securities, tailoring levels of secured lending, adjusting the size of select trading books, reducing loan originations and renewals, raising additional deposits, or borrowing from the FHLB or central banks. Citi believes these mitigating actions could substantially reduce the funding and liquidity risk, if any, of the potential downgrades described above.
Citibank, N.A.-Additional Potential Impacts
In addition to the above derivative triggers, Citi believes that a potential one-notch downgrade of Citibank, N.A.'s senior debt/long-term rating by S&P and Fitch could also have an adverse impact on the commercial paper/short-term rating of Citibank, N.A. As of June 30, 2015 , Citibank, N.A. had liquidity commitments of approximately $10.0 billion to consolidated asset-backed commercial paper conduits, compared to $10.9 billion as of March 31, 2015 (as referenced in Note 20 to the Consolidated Financial Statements).
In addition to the above-referenced liquidity resources of Citi's significant Citibank entities and other Citibank and Banamex entities, Citibank, N.A. could reduce the funding and liquidity risk, if any, of the potential downgrades described above through mitigating actions, including repricing or reducing certain commitments to commercial paper conduits. In the event of the potential downgrades described above, Citi believes that certain corporate customers could re-evaluate their deposit relationships with Citibank, N.A. This re-evaluation could result in clients adjusting their discretionary deposit levels or changing their depository institution, which could potentially reduce certain deposit levels at Citibank, N.A. However, Citi could choose to adjust pricing, offer alternative deposit products to its existing customers or seek to attract deposits from new customers, in addition to the mitigating actions referenced above.
77
Price Risk
Price risk losses arise from fluctuations in the market value of non-trading and trading positions resulting from changes in interest rates, credit spreads, foreign exchange rates, equity and commodity prices, and in their implied volatilities. For additional information on Citi's price risk measurement and stress testing, see "Managing Global Risk-Market Risk-Price Risk" in Citi's 2014 Annual Report on Form 10-K.
Price Risk-Non-Trading Portfolios
For additional information on Citi's net interest revenue (for interest rate exposure purposes), interest rate risk and interest rate risk measurement, see "Managing Global Risk-Market Risk-Price Risk-Non-Trading Portfolios" in Citi's 2014 Annual Report on Form 10-K.
The following table sets forth the estimated impact to Citi's net interest revenue, Accumulated Other Comprehensive Income (AOCI) and the Common Equity Tier 1 Capital ratio (on a fully implemented basis), each assuming an unanticipated parallel instantaneous 100 basis point increase in interest rates.
In millions of dollars (unless otherwise noted) | Jun. 30, 2015 | Mar. 31, 2015 | Jun. 30, 2014 | ||||||
Estimated annualized impact to net interest revenue |
|
|
| ||||||
U.S. dollar (1) | $ | 1,360 | | $ | 1,263 | | $ | 1,255 | |
All other currencies | 645 | | 611 | | 681 | | |||
Total | $ | 2,005 | | $ | 1,874 | | $ | 1,936 | |
As a % of average interest-earning assets | 0.12 | % | 0.12 | % | 0.11 | % | |||
Estimated initial impact to AOCI (after-tax) (2) | $ | (4,213 | ) | $ | (3,931 | ) | $ | (3,395 | ) |
Estimated initial impact on Common Equity Tier 1 Capital ratio (bps) (3) | (47 | ) | (45 | ) | (38 | ) | |||
(1) | Certain trading-oriented businesses within Citi have accrual-accounted positions that are excluded from the estimated impact to net interest revenue in the table since these exposures are managed economically in combination with mark-to-market positions. The U.S. dollar interest rate exposure associated with these businesses was $(236) million for a 100 basis point instantaneous increase in interest rates as of June 30, 2015 . |
(2) | Includes the effect of changes in interest rates on AOCI related to investment securities, cash flow hedges and pension liability adjustments. |
(3) | The estimated initial impact to the Common Equity Tier 1 Capital ratio considers the effect of Citi's deferred tax asset position and is based on only the estimated initial AOCI impact above. |
The sequential increase in the estimated impact to net interest revenue primarily reflected changes in balance sheet composition, including the increase in certain of Citi's deposit balances, partly offset by Citi Treasury actions. The sequential increase in the estimated impact to AOCI and the Common Equity Tier 1 Capital ratio primarily reflected changes in the composition of Citi Treasury's investment and interest rate derivatives portfolio.
In the event of an unanticipated parallel instantaneous 100 basis point increase in interest rates, Citi expects the negative impact to AOCI would be offset in shareholders' equity through the combination of expected incremental net interest revenue and the expected recovery of the impact on AOCI
through accretion of Citi's investment portfolio over a period of time. As of June 30, 2015 , Citi expects that the negative $4.2 billion impact to AOCI in such a scenario could potentially be offset over approximately 21 months.
The following table sets forth the estimated impact to Citi's net interest revenue, AOCI and the Common Equity Tier 1 Capital ratio (on a fully implemented basis) under four different changes in interest rate scenarios for the U.S. dollar and Citi's other currencies. While Citi also monitors the impact of a parallel decrease in interest rates, a 100 basis point decrease in short-term interest rates is not meaningful, as it would imply negative interest rates in many of Citi's markets.
In millions of dollars (unless otherwise noted) | Scenario 1 | Scenario 2 | Scenario 3 | Scenario 4 | ||||||||
Overnight rate change (bps) | 100 | | 100 | | - | | - | | ||||
10-year rate change (bps) | 100 | | - | | 100 | | (100 | ) | ||||
Estimated annualized impact to net interest revenue |
|
|
|
| ||||||||
U.S. dollar | $ | 1,360 | | $ | 1,323 | | $ | 90 | | $ | (148 | ) |
All other currencies | 645 | | 601 | | 37 | | (37 | ) | ||||
Total | $ | 2,005 | | $ | 1,924 | | $ | 127 | | $ | (185 | ) |
Estimated initial impact to AOCI (after-tax) (1) | $ | (4,213 | ) | $ | (2,677 | ) | $ | (1,708 | ) | $ | 1,464 | |
Estimated initial impact to Common Equity Tier 1 Capital ratio (bps) (2) | (47 | ) | (30 | ) | (19 | ) | 16 | | ||||
Note: Each scenario in the table above assumes that the rate change will occur instantaneously. Changes in interest rates for maturities between the overnight rate and the 10-year are interpolated.
(1) | Includes the effect of changes in interest rates on AOCI related to investment securities, cash flow hedges and pension liability adjustments. |
(2) | The estimated initial impact to the Common Equity Tier 1 Capital ratio considers the effect of Citi's deferred tax asset position and is based on only the estimated AOCI impact above. |
78
As shown in the table above, the magnitude of the impact to Citi's net interest revenue and AOCI is greater under scenario 2 as compared to scenario 3. This is because the combination of changes to Citi's investment portfolio, partially offset by changes related to Citi's pension liabilities, results in a net position that is more sensitive to rates at shorter and intermediate term maturities.
Changes in Foreign Exchange Rates-Impacts on AOCI and Capital
As of June 30, 2015, Citi estimates that a simultaneous 5% appreciation of the U.S. dollar against all of Citi's other currencies could reduce Citi's tangible common equity (TCE) by approximately $1.6 billion, or 0.9% of TCE, as a result of changes to Citi's foreign currency translation adjustment in AOCI, net of hedges. This impact would be primarily due to changes in the value of the Mexican peso, the British pound sterling, the euro, the Chinese yuan and the Australian dollar.
Despite this decrease in TCE, Citi believes its business model and management of foreign currency translation exposure work to minimize the effect of changes in foreign exchange rates on its Common Equity Tier 1 Capital ratio. Specifically, as currency movements change the value of Citi's net investments in foreign-currency-denominated capital, these movements also change the value of Citi's risk-weighted assets denominated in those currencies. This, coupled with Citi's foreign currency hedging strategies, such as foreign currency borrowings, foreign currency forwards and other currency hedging instruments, lessens the impact of foreign currency movements on Citi's Common Equity Tier 1 Capital ratio.
The effect of Citi's business model and management strategies on changes in foreign exchange rates are shown in the table below. For additional information in the changes in AOCI, see Note 18 to the Consolidated Financial Statements.
| For the quarter ended | ||||||||
In millions of dollars (unless otherwise noted) | Jun. 30, 2015 | Mar. 31, 2015 | Jun. 30, 2014 | ||||||
Change in FX spot rate (1) | 0.2 | % | (4.5 | )% | 1.2 | % | |||
Change in TCE due to foreign currency translation, net of hedges | $ | (44 | ) | $ | (1,763 | ) | $ | (170 | ) |
As a % of Tangible Common Equity | - | % | (1.0 | )% | (0.1 | )% | |||
Estimated impact to Common Equity Tier 1 Capital ratio (on a fully implemented basis) due to changes in foreign currency translation, net of hedges (bps) | (3 | ) | - | | (3 | ) | |||
(1) | FX spot rate change is a weighted average based upon Citi's quarterly average GAAP capital exposure to foreign countries. |
79
Interest Revenue/Expense and Yields
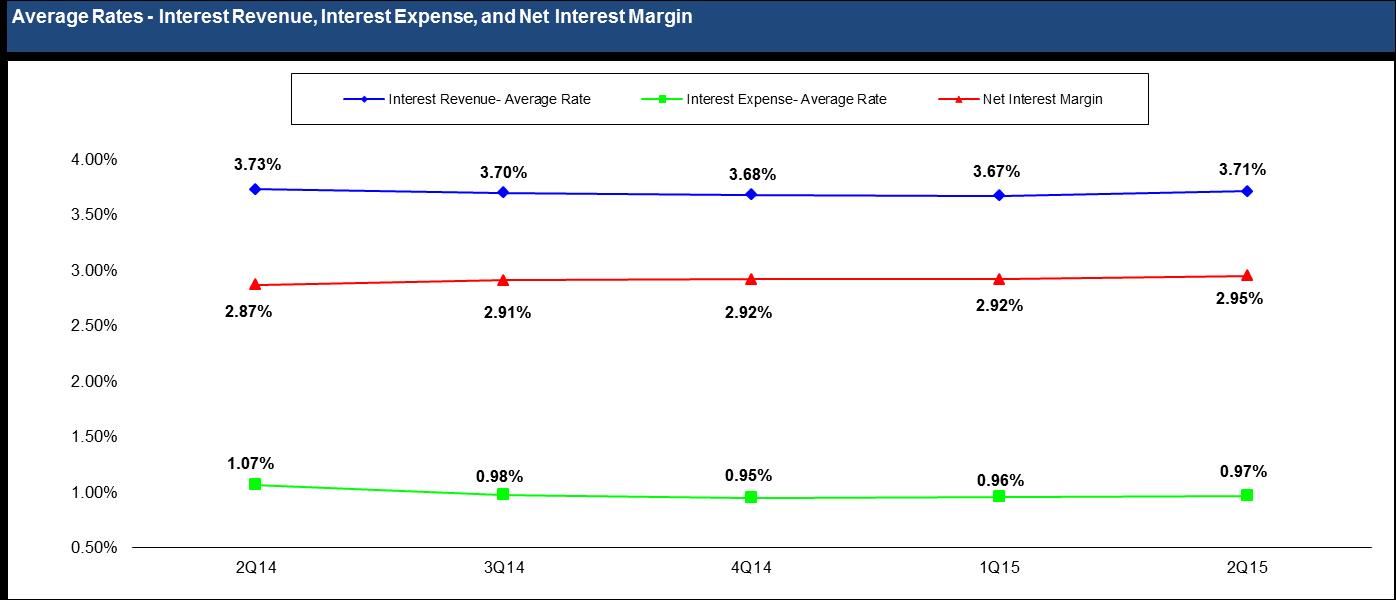
|
| 2nd Qtr. |
| 1st Qtr. |
| 2nd Qtr. |
| Change | ||||||||
In millions of dollars, except as otherwise noted | 2015 |
| 2015 |
| 2014 |
| 2Q15 vs. 2Q14 | ||||||||
Interest revenue (1) | $ | 14,995 | |
| $ | 14,724 | |
| $ | 15,682 | |
| (4 | )% |
|
Interest expense | 3,051 | |
| 3,028 | |
| 3,615 | |
| (16 | ) |
| |||
Net interest revenue (1)(2) | $ | 11,944 | |
| $ | 11,696 | |
| $ | 12,067 | |
| (1 | )% |
|
Interest revenue-average rate | 3.71 | % |
| 3.67 | % |
| 3.73 | % |
| (2 | ) | bps | |||
Interest expense-average rate | 0.97 | |
| 0.96 | |
| 1.07 | |
| (10 | ) | bps | |||
Net interest margin | 2.95 | % |
| 2.92 | % |
| 2.87 | % |
| 8 | | bps | |||
Interest-rate benchmarks |
|
|
|
|
|
|
|
| |||||||
Two-year U.S. Treasury note-average rate | 0.61 | % |
| 0.60 | % |
| 0.42 | % |
| 19 | | bps | |||
10-year U.S. Treasury note-average rate | 2.16 | |
| 1.97 | |
| 2.62 | |
| (46 | ) | bps | |||
10-year vs. two-year spread | 155 | | bps | 137 | | bps | 220 | | bps |
| |
| |||
(1) | Net interest revenue includes the taxable equivalent adjustments (based on the U.S. federal statutory tax rate of 35%) of $121 million, $124 million and $121 million for the three months ended June 30, 2015, March 31, 2015 and June 30, 2014, respectively. |
(2) | Excludes expenses associated with certain hybrid financial instruments, which are classified as Long-term debt and accounted for at fair value with changes recorded in Principal transactions . |
Citi's net interest margin (NIM) is calculated by dividing gross interest revenue less gross interest expense by average interest earning assets. Citi's NIM increased sequentially to 295 basis points, driven by a higher-than-expected contribution from trading NIM, which can fluctuate quarter-to-quarter. Excluding this impact, Citi's NIM would have been closer to 291 basis points in the second quarter of 2015. Citi's NIM will be impacted during the remainder of 2015 by divestitures from Citi Holdings, including OneMain Financial and the Japan retail banking business, although the ultimate impact to NIM will be dependent on the timing and overall impact of these divestitures to Citi's results of operations.
80
Average Balances and Interest Rates-Assets (1)(2)(3)(4)
| Average volume | Interest revenue | % Average rate | |||||||||||||||||||||
| 2nd Qtr. | 1st Qtr. | 2nd Qtr. | 2nd Qtr. | 1st Qtr. | 2nd Qtr. | 2nd Qtr. | 1st Qtr. | 2nd Qtr. | |||||||||||||||
In millions of dollars, except rates | 2015 | 2015 | 2014 | 2015 | 2015 | 2014 | 2015 | 2015 | 2014 | |||||||||||||||
Assets |
|
|
|
|
|
|
|
|
| |||||||||||||||
Deposits with banks (5) | $ | 134,641 | | $ | 139,173 | | $ | 160,555 | | $ | 168 | | $ | 183 | | $ | 250 | | 0.50 | % | 0.53 | % | 0.62 | % |
Federal funds sold and securities borrowed or purchased under agreements to resell (6) |
|
|
|
|
|
| | | | | | |||||||||||||
In U.S. offices | $ | 149,577 | | $ | 151,077 | | $ | 159,178 | | $ | 307 | | $ | 283 | | $ | 257 | | 0.82 | % | 0.76 | % | 0.65 | % |
In offices outside the U.S. (5) | 86,458 | | 90,102 | | 106,245 | | 357 | | 359 | | 335 | | 1.66 | % | 1.62 | % | 1.26 | % | ||||||
Total | $ | 236,035 | | $ | 241,179 | | $ | 265,423 | | $ | 664 | | $ | 642 | | $ | 592 | | 1.13 | % | 1.08 | % | 0.89 | % |
Trading account assets (7)(8) |
|
|
|
|
|
| | | | | | |||||||||||||
In U.S. offices | $ | 118,896 | | $ | 116,950 | | $ | 111,204 | | $ | 985 | | $ | 918 | | $ | 804 | | 3.32 | % | 3.18 | % | 2.90 | % |
In offices outside the U.S. (5) | 110,691 | | 111,309 | | 123,015 | | 671 | | 516 | | 683 | | 2.43 | % | 1.88 | % | 2.23 | % | ||||||
Total | $ | 229,587 | | $ | 228,259 | | $ | 234,219 | | $ | 1,656 | | $ | 1,434 | | $ | 1,487 | | 2.89 | % | 2.55 | % | 2.55 | % |
Investments |
|
|
|
|
|
| | | | | | |||||||||||||
In U.S. offices |
|
|
|
|
|
| | | | | | |||||||||||||
Taxable | $ | 214,168 | | $ | 213,431 | | $ | 188,005 | | $ | 973 | | $ | 940 | | $ | 783 | | 1.82 | % | 1.79 | % | 1.67 | % |
Exempt from U.S. income tax | 19,818 | | 20,740 | | 20,689 | | 99 | | 83 | | 173 | | 2.00 | % | 1.62 | % | 3.35 | % | ||||||
In offices outside the U.S. (5) | 99,045 | | 102,168 | | 114,575 | | 760 | | 769 | | 933 | | 3.08 | % | 3.05 | % | 3.27 | % | ||||||
Total | $ | 333,031 | | $ | 336,339 | | $ | 323,269 | | $ | 1,832 | | $ | 1,792 | | $ | 1,889 | | 2.21 | % | 2.16 | % | 2.34 | % |
Loans (net of unearned income) (9) |
|
|
|
|
|
| | | | | | |||||||||||||
In U.S. offices | $ | 347,779 | | $ | 357,951 | | $ | 361,875 | | $ | 6,292 | | $ | 6,368 | | $ | 6,475 | | 7.26 | % | 7.21 | % | 7.18 | % |
In offices outside the U.S. (5) | 279,247 | | 276,914 | | 303,196 | | 3,721 | | 4,195 | | 4,892 | | 5.34 | % | 6.14 | % | 6.47 | % | ||||||
Total | $ | 627,026 | | $ | 634,865 | | $ | 665,071 | | $ | 10,013 | | $ | 10,563 | | $ | 11,367 | | 6.41 | % | 6.75 | % | 6.86 | % |
Other interest-earning assets (10) | $ | 62,656 | | $ | 45,501 | | $ | 39,088 | | $ | 662 | | $ | 110 | | $ | 97 | | 4.24 | % | 0.98 | % | 1.00 | % |
Total interest-earning assets | $ | 1,622,976 | | $ | 1,625,316 | | $ | 1,687,625 | | $ | 14,995 | | $ | 14,724 | | $ | 15,682 | | 3.71 | % | 3.67 | % | 3.73 | % |
Non-interest-earning assets (7) | $ | 216,708 | | $ | 227,808 | | $ | 215,443 | |
|
|
|
|
|
| |||||||||
Total assets | $ | 1,839,684 | | $ | 1,853,124 | | $ | 1,903,068 | |
|
|
|
|
|
| |||||||||
(1) | Net interest revenue includes the taxable equivalent adjustments (based on the U.S. federal statutory tax rate of 35%) of $121 million, $124 million and $121 million for the three months ended June 30, 2015, March 31, 2015 and June 30, 2014, respectively. |
(2) | Interest rates and amounts include the effects of risk management activities associated with the respective asset and liability categories. |
(3) | Monthly or quarterly averages have been used by certain subsidiaries where daily averages are unavailable. |
(4) | Detailed average volume, Interest revenue and Interest expense exclude Discontinued operations . See Note 2 to the Consolidated Financial Statements. |
(5) | Average rates reflect prevailing local interest rates, including inflationary effects and monetary corrections in certain countries. |
(6) | Average volumes of securities borrowed or purchased under agreements to resell are reported net pursuant to FIN 41 (ASC 210-20-45). However, Interest revenue excludes the impact of FIN 41 (ASC 210-20-45). |
(7) | The fair value carrying amounts of derivative contracts are reported net, pursuant to FIN 39 (ASC 815-10-45), in Non-interest-earning assets and Other non-interest-bearing liabilities . |
(8) | Interest expense on Trading account liabilities of ICG is reported as a reduction of Interest revenue . Interest revenue and Interest expense on cash collateral positions are reported in interest on Trading account assets and Trading account liabilities , respectively. |
(9) | Includes cash-basis loans. |
(10) | Includes brokerage receivables. |
81
Average Balances and Interest Rates-Liabilities and Equity, and Net Interest Revenue (1)(2)(3)(4)
| Average volume | Interest expense | % Average rate | |||||||||||||||||||||
| 2nd Qtr. | 1st Qtr. | 2nd Qtr. | 2nd Qtr. | 1st Qtr. | 2nd Qtr. | 2nd Qtr. | 1st Qtr. | 2nd Qtr. | |||||||||||||||
In millions of dollars, except rates | 2015 | 2015 | 2014 | 2015 | 2015 | 2014 | 2015 | 2015 | 2014 | |||||||||||||||
Liabilities |
|
|
|
|
|
|
|
|
| |||||||||||||||
Deposits |
|
|
|
|
|
|
|
|
| |||||||||||||||
In U.S. offices (5) | $ | 269,673 | | $ | 281,518 | | $ | 293,480 | | $ | 330 | | $ | 356 | | $ | 356 | | 0.49 | % | 0.51 | % | 0.49 | % |
In offices outside the U.S. (6) | 431,305 | | 416,878 | | 472,654 | | 958 | | 970 | | 1,113 | | 0.89 | % | 0.94 | % | 0.94 | % | ||||||
Total | $ | 700,978 | | $ | 698,396 | | $ | 766,134 | | $ | 1,288 | | $ | 1,326 | | $ | 1,469 | | 0.74 | % | 0.77 | % | 0.77 | % |
Federal funds purchased and securities loaned or sold under agreements to repurchase (7) |
|
|
|
|
|
| | | | | | | ||||||||||||
In U.S. offices | $ | 112,690 | | $ | 106,394 | | $ | 99,617 | | $ | 183 | | $ | 163 | | $ | 198 | | 0.65 | % | 0.62 | % | 0.80 | % |
In offices outside the U.S. (6) | 70,602 | | 70,720 | | 93,685 | | 260 | | 213 | | 339 | | 1.48 | % | 1.22 | % | 1.45 | % | ||||||
Total | $ | 183,292 | | $ | 177,114 | | $ | 193,302 | | $ | 443 | | $ | 376 | | $ | 537 | | 0.97 | % | 0.86 | % | 1.11 | % |
Trading account liabilities (8)(9) |
|
|
|
|
|
| | | | | | | ||||||||||||
In U.S. offices | $ | 26,008 | | $ | 28,040 | | $ | 31,403 | | $ | 27 | | $ | 23 | | $ | 23 | | 0.42 | % | 0.33 | % | 0.29 | % |
In offices outside the U.S. (6) | 46,972 | | 45,159 | | 50,927 | | 27 | | 24 | | 25 | | 0.23 | % | 0.22 | % | 0.20 | % | ||||||
Total | $ | 72,980 | | $ | 73,199 | | $ | 82,330 | | $ | 54 | | $ | 47 | | $ | 48 | | 0.30 | % | 0.26 | % | 0.23 | % |
Short-term borrowings (10) |
|
|
|
|
|
| | | | | | | ||||||||||||
In U.S. offices | $ | 65,695 | | $ | 72,060 | | $ | 76,824 | | $ | 73 | | $ | 21 | | $ | 52 | | 0.45 | % | 0.12 | % | 0.27 | % |
In offices outside the U.S. (6) | 48,584 | | 57,078 | | 38,336 | | 84 | | 98 | | 110 | | 0.69 | % | 0.70 | % | 1.15 | % | ||||||
Total | $ | 114,279 | | $ | 129,138 | | $ | 115,160 | | $ | 157 | | $ | 119 | | $ | 162 | | 0.55 | % | 0.37 | % | 0.56 | % |
Long-term debt (11) |
|
|
|
|
|
| | | | | | | ||||||||||||
In U.S. offices | $ | 180,517 | | $ | 191,555 | | $ | 195,397 | | $ | 1,057 | | $ | 1,110 | | $ | 1,323 | | 2.35 | % | 2.35 | % | 2.72 | % |
In offices outside the U.S. (6) | 7,393 | | 7,007 | | 8,671 | | 52 | | 50 | | 76 | | 2.82 | % | 2.89 | % | 3.52 | % | ||||||
Total | $ | 187,910 | | $ | 198,562 | | $ | 204,068 | | $ | 1,109 | | $ | 1,160 | | $ | 1,399 | | 2.37 | % | 2.37 | % | 2.75 | % |
Total interest-bearing liabilities | $ | 1,259,439 | | $ | 1,276,409 | | $ | 1,360,994 | | $ | 3,051 | | $ | 3,028 | | $ | 3,615 | | 0.97 | % | 0.96 | % | 1.07 | % |
Demand deposits in U.S. offices | $ | 24,670 | | $ | 24,018 | | $ | 27,796 | |
|
|
|
|
|
| |||||||||
Other non-interest-bearing liabilities (8) | 336,701 | | 339,129 | | 301,148 | |
|
|
|
|
|
| ||||||||||||
Total liabilities | $ | 1,620,810 | | $ | 1,639,556 | | $ | 1,689,938 | |
|
|
|
|
|
| |||||||||
Citigroup stockholders' equity (12) | $ | 217,522 | | $ | 212,133 | | $ | 211,400 | |
|
|
|
|
|
| |||||||||
Noncontrolling interest | 1,352 | | 1,435 | | 1,730 | |
|
|
|
|
|
| ||||||||||||
Total equity (12) | $ | 218,874 | | $ | 213,568 | | $ | 213,130 | |
|
|
|
|
|
| |||||||||
Total liabilities and stockholders' equity | $ | 1,839,684 | | $ | 1,853,124 | | $ | 1,903,068 | |
|
|
|
|
|
| |||||||||
Net interest revenue as a percentage of average interest-earning assets (13) |
|
|
|
|
|
|
|
|
| |||||||||||||||
In U.S. offices | $ | 884,959 | | $ | 942,923 | | $ | 950,037 | | $ | 7,087 | | $ | 7,004 | | $ | 6,640 | | 3.21 | % | 3.01 | % | 2.80 | % |
In offices outside the U.S. (6) | 738,017 | | 682,393 | | 737,588 | | 4,857 | | 4,692 | | 5,427 | | 2.64 | | 2.79 | | 2.95 | | ||||||
Total | $ | 1,622,976 | | $ | 1,625,316 | | $ | 1,687,625 | | $ | 11,944 | | $ | 11,696 | | $ | 12,067 | | 2.95 | % | 2.92 | % | 2.87 | % |
(1) | Net interest revenue includes the taxable equivalent adjustments (based on the U.S. federal statutory tax rate of 35%) of $121 million, $124 million and $121 million for the three months ended June 30, 2015, March 31, 2015 and June 30, 2014, respectively. |
(2) | Interest rates and amounts include the effects of risk management activities associated with the respective asset and liability categories. |
(3) | Monthly or quarterly averages have been used by certain subsidiaries where daily averages are unavailable. |
(4) | Detailed average volume, Interest revenue and Interest expense exclude Discontinued operations . See Note 2 to the Consolidated Financial Statements. |
(5) | Consists of other time deposits and savings deposits. Savings deposits are made up of insured money market accounts, NOW accounts, and other savings deposits. The interest expense on savings deposits includes FDIC deposit insurance fees and charges. |
(6) | Average rates reflect prevailing local interest rates, including inflationary effects and monetary corrections in certain countries. |
(7) | Average volumes of securities sold under agreements to repurchase are reported net pursuant to FIN 41 (ASC 210-20-45). However, Interest expense excludes the impact of FIN 41 (ASC 210-20-45). |
(8) | The fair value carrying amounts of derivative contracts are reported net, pursuant to FIN 39 (ASC 815-10-45), in Non-interest-earning assets and Other non-interest-bearing liabilities . |
82
(9) | Interest expense on Trading account liabilities of ICG is reported as a reduction of Interest revenue . Interest revenue and Interest expense on cash collateral positions are reported in interest on Trading account assets and Trading account liabilities , respectively. |
(10) | Includes brokerage payables. |
(11) | Excludes hybrid financial instruments and beneficial interests in consolidated VIEs that are classified as Long-term debt , as these obligations are accounted for in changes in fair value recorded in Principal transactions . |
(12) | Includes stockholders' equity from discontinued operations. |
(13) | Includes allocations for capital and funding costs based on the location of the asset. |
Average Balances and Interest Rates-Assets (1)(2)(3)(4)
Taxable Equivalent Basis
| Average volume | Interest revenue | % Average rate | |||||||||||||
In millions of dollars, except rates | Six Months 2015 | Six Months 2014 | Six Months 2015 | Six Months 2014 | Six Months 2015 | Six Months 2014 | ||||||||||
Assets |
|
|
|
|
|
| ||||||||||
Deposits with banks (5) | $ | 136,907 | | $ | 167,736 | | $ | 351 | | $ | 502 | | 0.52 | % | 0.60 | % |
Federal funds sold and securities borrowed or purchased under agreements to resell (6) |
|
|
|
|
|
| ||||||||||
In U.S. offices | $ | 150,327 | | $ | 156,023 | | $ | 590 | | $ | 506 | | 0.79 | % | 0.65 | % |
In offices outside the U.S. (5) | 88,280 | | 104,286 | | 716 | | 680 | | 1.64 | % | 1.31 | % | ||||
Total | $ | 238,607 | | $ | 260,309 | | $ | 1,306 | | $ | 1,186 | | 1.10 | % | 0.92 | % |
Trading account assets (7)(8) |
|
|
|
|
|
| ||||||||||
In U.S. offices | $ | 117,923 | | $ | 112,366 | | $ | 1,903 | | $ | 1,683 | | 3.25 | % | 3.02 | % |
In offices outside the U.S. (5) | 111,000 | | 121,951 | | 1,187 | | 1,323 | | 2.16 | % | 2.19 | % | ||||
Total | $ | 228,923 | | $ | 234,317 | | $ | 3,090 | | $ | 3,006 | | 2.72 | % | 2.59 | % |
Investments |
|
|
|
|
|
| ||||||||||
In U.S. offices |
|
|
|
|
|
| ||||||||||
Taxable | $ | 213,800 | | $ | 180,713 | | $ | 1,913 | | $ | 1,516 | | 1.80 | % | 1.69 | % |
Exempt from U.S. income tax | 20,279 | | 20,285 | | 182 | | 371 | | 1.81 | % | 3.69 | % | ||||
In offices outside the U.S. (5) | 100,607 | | 114,507 | | 1,529 | | 1,849 | | 3.06 | % | 3.26 | % | ||||
Total | $ | 334,686 | | $ | 315,505 | | $ | 3,624 | | $ | 3,736 | | 2.18 | % | 2.39 | % |
Loans (net of unearned income) (9) |
|
|
|
|
|
| ||||||||||
In U.S. offices | $ | 352,865 | | $ | 362,167 | | $ | 12,660 | | $ | 12,963 | | 7.24 | % | 7.22 | % |
In offices outside the U.S. (5) | 278,081 | | 299,722 | | 7,916 | | 9,590 | | 5.74 | % | 6.45 | % | ||||
Total | $ | 630,946 | | $ | 661,889 | | $ | 20,576 | | $ | 22,553 | | 6.58 | % | 6.87 | % |
Other interest-earning assets (10) | $ | 54,080 | | $ | 36,487 | | $ | 772 | | $ | 177 | | 2.88 | % | 0.98 | % |
Total interest-earning assets | $ | 1,624,149 | | $ | 1,676,243 | | $ | 29,719 | | $ | 31,160 | | 3.69 | % | 3.75 | % |
Non-interest-earning assets (7) | $ | 222,258 | | $ | 219,912 | |
| |
| |
| |
| | ||
Total assets | $ | 1,846,407 | | $ | 1,896,155 | |
| |
| |
| |
| | ||
(1) | Net interest revenue includes the taxable equivalent adjustments (based on the U.S. federal statutory tax rate of 35%) of $121 million, $124 million and $121 million for the three months ended June 30, 2015, March 31, 2015 and June 30, 2014, respectively. |
(2) | Interest rates and amounts include the effects of risk management activities associated with the respective asset and liability categories. |
(3) | Monthly or quarterly averages have been used by certain subsidiaries where daily averages are unavailable. |
(4) | Detailed average volume, Interest revenue and Interest expense exclude Discontinued operations . See Note 2 to the Consolidated Financial Statements. |
(5) | Average rates reflect prevailing local interest rates, including inflationary effects and monetary corrections in certain countries. |
(6) | Average volumes of securities borrowed or purchased under agreements to resell are reported net pursuant to FIN 41 (ASC 210-20-45). However, Interest revenue excludes the impact of FIN 41 (ASC 210-20-45). |
(7) | The fair value carrying amounts of derivative contracts are reported in Non-interest-earning assets and Other non-interest-bearing liabilities . |
(8) | Interest expense on Trading account liabilities of ICG is reported as a reduction of Interest revenue . Interest revenue and Interest expense on cash collateral positions are reported in interest on Trading account assets and Trading account liabilities , respectively. |
(9) | Includes cash-basis loans. |
83
Average Balances and Interest Rates-Liabilities and Equity, and Net Interest Revenue (1)(2)(3)(4)
Taxable Equivalent Basis
| Average volume | Interest expense | % Average rate | |||||||||||||
In millions of dollars, except rates | Six Months 2015 | Six Months 2014 | Six Months 2015 | Six Months 2014 | Six Months 2015 | Six Months 2014 | ||||||||||
Liabilities |
|
|
|
|
|
| ||||||||||
Deposits |
|
|
|
|
|
| ||||||||||
In U.S. offices (5) | $ | 275,596 | | $ | 287,370 | | $ | 686 | | $ | 758 | | 0.50 | % | 0.53 | % |
In offices outside the U.S. (6) | 424,092 | | 476,159 | | 1,928 | | 2,160 | | 0.92 | % | 0.91 | % | ||||
Total | $ | 699,688 | | $ | 763,529 | | $ | 2,614 | | $ | 2,918 | | 0.75 | % | 0.77 | % |
Federal funds purchased and securities loaned or sold under agreements to repurchase (7) |
|
|
|
|
|
| ||||||||||
In U.S. offices | $ | 109,542 | | $ | 101,597 | | $ | 346 | | $ | 354 | | 0.64 | % | 0.70 | % |
In offices outside the U.S. (6) | 70,661 | | 93,627 | | 473 | | 708 | | 1.35 | % | 1.52 | % | ||||
Total | $ | 180,203 | | $ | 195,224 | | $ | 819 | | $ | 1,062 | | 0.92 | % | 1.10 | % |
Trading account liabilities (8)(9) |
|
|
|
|
|
| ||||||||||
In U.S. offices | $ | 27,024 | | $ | 29,533 | | $ | 50 | | $ | 44 | | 0.37 | % | 0.30 | % |
In offices outside the U.S. (6) | 46,066 | | 48,051 | | 51 | | 45 | | 0.22 | % | 0.19 | % | ||||
Total | $ | 73,090 | | $ | 77,584 | | $ | 101 | | $ | 89 | | 0.28 | % | 0.23 | % |
Short-term borrowings (10) |
|
|
|
|
|
| ||||||||||
In U.S. offices | $ | 68,878 | | $ | 78,097 | | $ | 94 | | $ | 89 | | 0.28 | % | 0.23 | % |
In offices outside the U.S. (6) | 52,831 | | 36,885 | | 182 | | 210 | | 0.69 | % | 1.15 | % | ||||
Total | $ | 121,709 | | $ | 114,982 | | $ | 276 | | $ | 299 | | 0.46 | % | 0.52 | % |
Long-term debt (11) |
|
|
|
|
|
| ||||||||||
In U.S. offices | $ | 186,036 | | $ | 192,470 | | $ | 2,167 | | $ | 2,683 | | 2.35 | % | 2.81 | % |
In offices outside the U.S. (6) | 7,200 | | 8,803 | | 102 | | 155 | | 2.86 | % | 3.55 | % | ||||
Total | $ | 193,236 | | $ | 201,273 | | $ | 2,269 | | $ | 2,838 | | 2.37 | % | 2.84 | % |
Total interest-bearing liabilities | $ | 1,267,926 | | $ | 1,352,592 | | $ | 6,079 | | $ | 7,206 | | 0.97 | % | 1.07 | % |
Demand deposits in U.S. offices | $ | 24,344 | | $ | 27,863 | |
| |
| |
| |
| |||
Other non-interest-bearing liabilities (8) | 337,915 | | 305,053 | |
| |
| |
| |
| |||||
Total liabilities | $ | 1,630,185 | | $ | 1,685,508 | |
| |
| |
| |
| |||
Citigroup stockholders' equity (12) | $ | 214,828 | | $ | 208,843 | |
| |
| |
| |
| |||
Noncontrolling interest | 1,394 | | 1,804 | |
| |
| |
| |
| |||||
Total equity (12) | $ | 216,222 | | $ | 210,647 | |
| |
| |
| |
| |||
Total liabilities and stockholders' equity | $ | 1,846,407 | | $ | 1,896,155 | |
| |
| |
| |
| |||
Net interest revenue as a percentage of average interest-earning assets (13) |
|
|
|
|
|
| ||||||||||
In U.S. offices | $ | 913,944 | | $ | 946,824 | | $ | 14,091 | | $ | 13,316 | | 3.11 | % | 2.84 | % |
In offices outside the U.S. (6) | 710,205 | | 729,419 | | 9,549 | | 10,638 | | 2.71 | % | 2.94 | % | ||||
Total | $ | 1,624,149 | | $ | 1,676,243 | | $ | 23,640 | | $ | 23,954 | | 2.94 | % | 2.88 | % |
(1) | Net interest revenue includes the taxable equivalent adjustments (based on the U.S. federal statutory tax rate of 35%) of $244 million and $249 million for the six months ended June 30, 2015 and June 30, 2014, respectively. |
(2) | Interest rates and amounts include the effects of risk management activities associated with the respective asset and liability categories. |
(3) | Monthly or quarterly averages have been used by certain subsidiaries where daily averages are unavailable. |
(4) | Detailed average volume, Interest revenue and Interest expense exclude Discontinued operations . See Note 2 to the Consolidated Financial Statements. |
(5) | Consists of other time deposits and savings deposits. Savings deposits are made up of insured money market accounts, NOW accounts, and other savings deposits. The interest expense on savings deposits includes FDIC deposit insurance fees and charges. |
(6) | Average rates reflect prevailing local interest rates, including inflationary effects and monetary corrections in certain countries. |
(7) | Average volumes of securities loaned or sold under agreements to repurchase are reported net pursuant to FIN 41 (ASC 210-20-45). However, Interest expense excludes the impact of FIN 41 (ASC 210-20-45). |
(8) | The fair value carrying amounts of derivative contracts are reported in Non-interest-earning assets and Other non-interest-bearing liabilities . |
(9) | Interest expense on Trading account liabilities of ICG is reported as a reduction of Interest revenue . Interest revenue and Interest expense on cash collateral positions are reported in interest on Trading account assets and Trading account liabilities , respectively. |
84
(10) | Excludes hybrid financial instruments and beneficial interests in consolidated VIEs that are classified as Long-term debt , as these obligations are accounted for in changes in fair value recorded in Principal transactions . |
(11) | Includes stockholders' equity from discontinued operations. |
(12) | Includes allocations for capital and funding costs based on the location of the asset. |
| 2nd Qtr. 2015 vs. 1st Qtr. 2015 | 2nd Qtr. 2015 vs. 2nd Qtr. 2014 | ||||||||||||||||
| Increase (decrease) due to change in: | Increase (decrease) due to change in: | ||||||||||||||||
In millions of dollars | Average volume | Average rate | Net change | Average volume | Average rate | Net change | ||||||||||||
Deposits with banks (4) | $ | (6 | ) | $ | (9 | ) | $ | (15 | ) | $ | (37 | ) | $ | (45 | ) | $ | (82 | ) |
Federal funds sold and securities borrowed or purchased under agreements to resell |
|
|
|
|
|
| ||||||||||||
In U.S. offices | $ | (3 | ) | $ | 27 | | $ | 24 | | $ | (16 | ) | $ | 66 | | $ | 50 | |
In offices outside the U.S. (4) | (15 | ) | 13 | | (2 | ) | (70 | ) | 92 | | 22 | | ||||||
Total | $ | (18 | ) | $ | 40 | | $ | 22 | | $ | (86 | ) | $ | 158 | | $ | 72 | |
Trading account assets (5) |
|
|
|
|
|
| ||||||||||||
In U.S. offices | $ | 15 | | $ | 52 | | $ | 67 | | $ | 58 | | $ | 123 | | $ | 181 | |
In offices outside the U.S. (4) | (3 | ) | 158 | | 155 | | (72 | ) | 60 | | (12 | ) | ||||||
Total | $ | 12 | | $ | 210 | | $ | 222 | | $ | (14 | ) | $ | 183 | | $ | 169 | |
Investments (1) |
|
|
|
|
|
| ||||||||||||
In U.S. offices | $ | (1 | ) | $ | 50 | | $ | 49 | | $ | 116 | | $ | - | | $ | 116 | |
In offices outside the U.S. (4) | (24 | ) | 15 | | (9 | ) | (121 | ) | (52 | ) | (173 | ) | ||||||
Total | $ | (25 | ) | $ | 65 | | $ | 40 | | $ | (5 | ) | $ | (52 | ) | $ | (57 | ) |
Loans (net of unearned income) (6) |
|
|
|
|
|
| ||||||||||||
In U.S. offices | $ | (183 | ) | $ | 107 | | $ | (76 | ) | $ | (254 | ) | $ | 71 | | $ | (183 | ) |
In offices outside the U.S. (4) | 35 | | (509 | ) | (474 | ) | (365 | ) | (806 | ) | (1,171 | ) | ||||||
Total | $ | (148 | ) | $ | (402 | ) | $ | (550 | ) | $ | (619 | ) | $ | (735 | ) | $ | (1,354 | ) |
Other interest-earning assets (7) | $ | 56 | | $ | 496 | | $ | 552 | | $ | 88 | | $ | 477 | | $ | 565 | |
Total interest revenue | $ | (129 | ) | $ | 400 | | $ | 271 | | $ | (673 | ) | $ | (14 | ) | $ | (687 | ) |
(1) | The taxable equivalent adjustment is based on the U.S. federal statutory tax rate of 35% and is included in this presentation. |
(2) | Rate/volume variance is allocated based on the percentage relationship of changes in volume and changes in rate to the total net change. |
(3) | Detailed average volume, Interest revenue and Interest expense exclude Discontinued operations . See Note 2 to the Consolidated Financial Statements. |
(4) | Changes in average rates reflect changes in prevailing local interest rates, including inflationary effects and monetary corrections in certain countries. |
(5) | Interest expense on Trading account liabilities of ICG is reported as a reduction of Interest revenue . Interest revenue and Interest expense on cash collateral positions are reported in interest on Trading account assets and Trading account liabilities , respectively. |
(6) | Includes cash-basis loans. |
(7) | Includes brokerage receivables. |
85
| 2nd Qtr. 2015 vs. 1st Qtr. 2015 | 2nd Qtr. 2015 vs. 2nd Qtr. 2014 | ||||||||||||||||
| Increase (decrease) due to change in: | Increase (decrease) due to change in: | ||||||||||||||||
In millions of dollars | Average volume | Average rate | Net change | Average volume | Average rate | Net change | ||||||||||||
Deposits |
|
|
|
|
|
| ||||||||||||
In U.S. offices | $ | (15 | ) | $ | (11 | ) | $ | (26 | ) | $ | (29 | ) | $ | 3 | | $ | (26 | ) |
In offices outside the U.S. (4) | 33 | | (45 | ) | (12 | ) | (94 | ) | (61 | ) | (155 | ) | ||||||
Total | $ | 18 | | $ | (56 | ) | $ | (38 | ) | $ | (123 | ) | $ | (58 | ) | $ | (181 | ) |
Federal funds purchased and securities loaned or sold under agreements to repurchase |
|
|
|
|
|
| ||||||||||||
In U.S. offices | $ | 10 | | $ | 10 | | $ | 20 | | $ | 24 | | $ | (39 | ) | $ | (15 | ) |
In offices outside the U.S. (4) | - | | 47 | | 47 | | (85 | ) | 6 | | (79 | ) | ||||||
Total | $ | 10 | | $ | 57 | | $ | 67 | | $ | (61 | ) | $ | (33 | ) | $ | (94 | ) |
Trading account liabilities (5) |
|
|
|
|
|
| ||||||||||||
In U.S. offices | $ | (2 | ) | $ | 6 | | $ | 4 | | $ | (4 | ) | $ | 8 | | $ | 4 | |
In offices outside the U.S. (4) | 1 | | 2 | | 3 | | (2 | ) | 4 | | 2 | | ||||||
Total | $ | (1 | ) | $ | 8 | | $ | 7 | | $ | (6 | ) | $ | 12 | | $ | 6 | |
Short-term borrowings (6) |
|
|
|
|
|
| ||||||||||||
In U.S. offices | $ | (2 | ) | $ | 54 | | $ | 52 | | $ | 17 | | $ | 4 | | $ | 21 | |
In offices outside the U.S. (4) | (15 | ) | 1 | | (14 | ) | 167 | | (193 | ) | (26 | ) | ||||||
Total | $ | (17 | ) | $ | 55 | | $ | 38 | | $ | 184 | | $ | (189 | ) | $ | (5 | ) |
Long-term debt |
|
|
|
|
|
| ||||||||||||
In U.S. offices | $ | (65 | ) | $ | 12 | | $ | (53 | ) | $ | (150 | ) | $ | (116 | ) | $ | (266 | ) |
In offices outside the U.S. (4) | 3 | | (2 | ) | 1 | | 123 | | (147 | ) | (24 | ) | ||||||
Total | $ | (62 | ) | $ | 10 | | $ | (52 | ) | $ | (27 | ) | $ | (263 | ) | $ | (290 | ) |
Total interest expense | $ | (52 | ) | $ | 74 | | $ | 22 | | $ | (33 | ) | $ | (531 | ) | $ | (564 | ) |
Net interest revenue | $ | (77 | ) | $ | 325 | | $ | 248 | | $ | (640 | ) | $ | 517 | | $ | (123 | ) |
(1) | The taxable equivalent adjustment is based on the U.S. federal statutory tax rate of 35% and is included in this presentation. |
(2) | Rate/volume variance is allocated based on the percentage relationship of changes in volume and changes in rate to the total net change. |
(3) | Detailed average volume, Interest revenue and Interest expense exclude Discontinued operations . See Note 2 to the Consolidated Financial Statements. |
(4) | Changes in average rates reflect changes in prevailing local interest rates, including inflationary effects and monetary corrections in certain countries. |
(5) | Interest expense on Trading account liabilities of ICG is reported as a reduction of Interest revenue . Interest revenue and Interest expense on cash collateral positions are reported in interest on Trading account assets and Trading account liabilities , respectively. |
(6) | Includes brokerage payables. |
86
Analysis of Changes in Interest Revenue, Interest Expense, and Net Interest Revenue (1)(2)(3)
| Six Months 2015 vs. Six Months 2014 | ||||||||
| Increase (decrease) due to change in: | ||||||||
In millions of dollars | Average volume | Average rate | Net change (2) | ||||||
Deposits at interest with banks (4) | $ | (85 | ) | $ | (66 | ) | $ | (151 | ) |
Federal funds sold and securities borrowed or purchased under agreements to resell |
|
|
| ||||||
In U.S. offices | $ | (19 | ) | $ | 103 | | $ | 84 | |
In offices outside the U.S. (4) | (114 | ) | 150 | | 36 | | |||
Total | $ | (133 | ) | $ | 253 | | $ | 120 | |
Trading account assets (5) |
|
|
| ||||||
In U.S. offices | $ | 86 | | $ | 134 | | $ | 220 | |
In offices outside the U.S. (4) | (117 | ) | (19 | ) | (136 | ) | |||
Total | $ | (31 | ) | $ | 115 | | $ | 84 | |
Investments (1) |
|
| | ||||||
In U.S. offices | $ | 299 | | $ | (91 | ) | $ | 208 | |
In offices outside the U.S. (4) | (216 | ) | (104 | ) | (320 | ) | |||
Total | $ | 83 | | $ | (195 | ) | $ | (112 | ) |
Loans (net of unearned income) (6) |
|
|
| ||||||
In U.S. offices | $ | (334 | ) | $ | 31 | | $ | (303 | ) |
In offices outside the U.S. (4) | (662 | ) | (1,012 | ) | (1,674 | ) | |||
Total | $ | (996 | ) | $ | (981 | ) | $ | (1,977 | ) |
Other interest-earning assets | $ | 118 | | $ | 477 | | $ | 595 | |
Total interest revenue | $ | (1,044 | ) | $ | (397 | ) | $ | (1,441 | ) |
Deposits (7) |
|
|
| ||||||
In U.S. offices | $ | (30 | ) | $ | (42 | ) | $ | (72 | ) |
In offices outside the U.S. (4) | (237 | ) | 5 | | (232 | ) | |||
Total | $ | (267 | ) | $ | (37 | ) | $ | (304 | ) |
Federal funds purchased and securities loaned or sold under agreements to repurchase |
|
|
| ||||||
In U.S. offices | $ | 27 | | $ | (35 | ) | $ | (8 | ) |
In offices outside the U.S. (4) | (160 | ) | (75 | ) | (235 | ) | |||
Total | $ | (133 | ) | $ | (110 | ) | $ | (243 | ) |
Trading account liabilities (5) |
|
|
| ||||||
In U.S. offices | $ | (4 | ) | $ | 10 | | $ | 6 | |
In offices outside the U.S. (4) | (2 | ) | 8 | | 6 | | |||
Total | $ | (6 | ) | $ | 18 | | $ | 12 | |
Short-term borrowings |
|
|
| ||||||
In U.S. offices | $ | (11 | ) | $ | 16 | | $ | 5 | |
In offices outside the U.S. (4) | 72 | | (100 | ) | (28 | ) | |||
Total | $ | 61 | | $ | (84 | ) | $ | (23 | ) |
Long-term debt |
|
|
| ||||||
In U.S. offices | $ | (87 | ) | $ | (429 | ) | $ | (516 | ) |
In offices outside the U.S. (4) | (26 | ) | (27 | ) | (53 | ) | |||
Total | $ | (113 | ) | $ | (456 | ) | $ | (569 | ) |
Total interest expense | $ | (458 | ) | $ | (669 | ) | $ | (1,127 | ) |
Net interest revenue | $ | (586 | ) | $ | 272 | | $ | (314 | ) |
(1) | The taxable equivalent adjustment is based on the U.S. Federal statutory tax rate of 35% and is included in this presentation. |
(2) | Rate/volume variance is allocated based on the percentage relationship of changes in volume and changes in rate to the total net change. |
(3) | Detailed average volume, Interest revenue and Interest expense exclude Discontinued operations . |
(4) | Changes in average rates reflect changes in prevailing local interest rates, including inflationary effects and monetary corrections in certain countries. |
87
(5) | Interest expense on Trading account liabilities of ICG is reported as a reduction of Interest revenue . Interest revenue and Interest expense on cash collateral positions are reported in Trading account assets and Trading account liabilities , respectively. |
(6) | Includes cash-basis loans. |
(7) | The interest expense on deposits includes the FDIC assessment and deposit insurance fees and charges of $584 million and $532 million for the six months ended June 30, 2015 and June 30, 2014, respectively. |
88
Price Risk-Trading Portfolios
For additional information on the measures Citi uses to monitor price risk in its trading portfolios, as well as additional information on value at risk (VAR) and Citi's VAR model, see "Managing Global Risk-Market Risk-Price Risk-Trading Portfolios" in Citi's 2014 Annual Report on Form 10-K.
Value at Risk
As of June 30, 2015, Citi estimates that the conservative features of its VAR calibration contribute an approximate 20% add-on (compared to 23% at March 31, 2015) to what would be a VAR estimated under the assumption of stable and perfectly normal distributed markets.
As set forth in the table below, Citi's average and quarter-end trading and credit portfolio VAR decreased sequentially due to exposure changes in commodities trading as well as the G10 rates business, including hedging activity associated with non-trading positions.
|
| Second Quarter |
| First Quarter |
| Second Quarter | ||||||||||||
In millions of dollars | June 30, 2015 | 2015 Average | March 31, 2015 | 2015 Average | June 30, 2014 | 2014 Average | ||||||||||||
Interest rate | $ | 33 | | $ | 42 | | $ | 63 | | $ | 60 | | $ | 81 | | $ | 85 | |
Credit spread | 64 | | 70 | | 71 | | 75 | | $ | 72 | | $ | 73 | | ||||
Covariance adjustment (1) | (22 | ) | (25 | ) | (34 | ) | (33 | ) | (41 | ) | (43 | ) | ||||||
Fully diversified interest rate and credit spread | $ | 75 | | $ | 87 | | $ | 100 | | $ | 102 | | $ | 112 | | $ | 115 | |
Foreign exchange | 32 | | 34 | | 29 | | 31 | | 26 | | 34 | | ||||||
Equity | 24 | | 21 | | 25 | | 16 | | 24 | | 26 | | ||||||
Commodity | 18 | | 18 | | 22 | | 24 | | 13 | | 15 | | ||||||
Covariance adjustment (1) | (66 | ) | (70 | ) | (69 | ) | (66 | ) | (72 | ) | (79 | ) | ||||||
Total Trading VAR-all market risk factors, including general and specific risk (excluding credit portfolios) (2) | $ | 83 | | $ | 90 | | $ | 107 | | $ | 107 | | $ | 103 | | $ | 111 | |
Specific risk-only component (3) | $ | 7 | | $ | 6 | | $ | 8 | | $ | 6 | | $ | 9 | | $ | 12 | |
Total Trading VAR-general market risk factors only (excluding credit portfolios) (2) | $ | 76 | | $ | 84 | | $ | 99 | | $ | 101 | | $ | 94 | | $ | 99 | |
Incremental Impact of the Credit Portfolio (4) | $ | 15 | | $ | 23 | | $ | 30 | | $ | 24 | | $ | 14 | | $ | 24 | |
Total Trading and Credit Portfolio VAR | $ | 98 | | $ | 113 | | $ | 137 | | $ | 131 | | $ | 117 | | $ | 135 | |
(1) | Covariance adjustment (also known as diversification benefit) equals the difference between the total VAR and the sum of the VARs tied to each individual risk type. The benefit reflects the fact that the risks within each and across risk types are not perfectly correlated and, consequently, the total VAR on a given day will be lower than the sum of the VARs relating to each individual risk type. The determination of the primary drivers of changes to the covariance adjustment is made by an examination of the impact of both model parameter and position changes. |
(2) The total Trading VAR includes mark-to-market and certain fair value option trading positions from ICG and Citi Holdings, with the exception of hedges to the loan portfolio, fair value option loans, and all CVA exposures. Available-for-sale and accrual exposures are not included.
(3) | The specific risk-only component represents the level of equity and fixed income issuer-specific risk embedded in VAR. |
(4) | The credit portfolio is composed of mark-to-market positions associated with non-trading business units including Citi Treasury, the CVA relating to derivative counterparties and all associated CVA hedges. FVA and DVA are not included. The credit portfolio also includes hedges to the loan portfolio, fair value option loans and hedges to the leveraged finance pipeline within capital markets origination within ICG . |
89
The table below provides the range of market factor VARs associated with Citi's Total Trading VAR, inclusive of specific risk, that was experienced during the following quarters:
| Second Quarter | First Quarter | Second Quarter | |||||||||||||||
| 2015 | 2015 | 2014 | |||||||||||||||
In millions of dollars | Low | High | Low | High | Low | High | ||||||||||||
Interest rate | $ | 29 | | $ | 73 | | $ | 39 | | $ | 84 | | $ | 65 | | $ | 101 | |
Credit spread | 63 | | 77 | | 66 | | 94 | | 68 | | 82 | | ||||||
Fully diversified interest rate and credit spread | $ | 71 | | $ | 106 | | $ | 86 | | $ | 127 | | $ | 101 | | $ | 129 | |
Foreign exchange | 22 | | 51 | | 20 | | 43 | | 23 | | 59 | | ||||||
Equity | 12 | | 32 | | 9 | | 26 | | 18 | | 44 | | ||||||
Commodity | 15 | | 22 | | 18 | | 37 | | 11 | | 20 | | ||||||
Total Trading | $ | 71 | | $ | 107 | | $ | 85 | | $ | 140 | | $ | 96 | | $ | 139 | |
Total Trading and Credit Portfolio | 89 | | 141 | | 108 | | 158 | | 111 | | 172 | | ||||||
Note: No covariance adjustment can be inferred from the above table as the high and low for each market factor will be from different close of business dates.
The following table provides the VAR for ICG during the second quarter of 2015, excluding the CVA relating to derivative counterparties, hedges of CVA, fair value option loans and hedges to the loan portfolio.
In millions of dollars | Jun. 30, 2015 | ||
Total-all market risk factors, including general and specific risk | $ | 79 | |
Average-during quarter | $ | 84 | |
High-during quarter | 99 | | |
Low-during quarter | 67 | | |
Regulatory VAR Back-testing
In accordance with Basel III, Citi is required to perform back-testing to evaluate the effectiveness of its Regulatory VAR model (for additional information on Regulatory VAR, see "Managing Global Risk-Market Risk-Price Risk-Trading Portfolios" in Citi's 2014 Annual Report on Form 10-K). Regulatory VAR back-testing is the process in which the daily one-day VAR, at a 99% confidence interval, is compared to the buy-and-hold profit and loss (e.g., the profit and loss impact if the portfolio is held constant at the end of the day and re-priced the following day). Buy-and-hold profit and loss represents the daily mark-to-market profit and loss attributable to price movements in covered positions from the close of the previous business day. Buy-and-hold profit and loss excludes realized trading revenue, net interest, fees and commissions, intra-day trading profit and loss, and changes in reserves. Regulatory VAR back-testing is performed against buy-and-hold profit and loss on a monthly basis for multiple portfolios across the
organization (trading desk level, ICG business segment and
Citigroup) and the results are shared with the U.S. banking
regulators.
Based on a 99% confidence level, Citi would expect two to three days in any one year where buy-and-hold losses exceeded the Regulatory VAR. Given the conservative calibration of Citi's VAR model (as a result of taking the greater of short- and long-term volatilities and fat-tail scaling of volatilities), Citi would expect fewer exceptions under
normal and stable market conditions. Periods of unstable market conditions could increase the number of back-testing exceptions.
As of June 30, 2015, there were two back-testing exceptions observed for Citi's Regulatory VAR for the prior 12 months. As previously disclosed, trading losses on October 15, 2014 exceeded the VAR estimate at the Citigroup level due to significant market movements and volatility that impacted various fixed income as well as equities trading business. The second back-testing exception occurred on January 15, 2015 following the Swiss National Bank's announcement removing the minimum exchange rate of Swiss franc per euro.
90
COUNTRY AND CROSS-BORDER RISK
For an overview of, and additional information on, country and cross-border risk at Citi, including its risk management processes, see "Risk Factors," "Managing Global Risk" and "Managing Global Risk-Country and Cross-Border Risk" in Citi's 2014 Annual Report on Form 10-K.
COUNTRY RISK
Emerging Markets Exposures
Citi generally defines emerging markets as countries in Latin America , Asia (other than Japan, Australia and New Zealand), central and eastern Europe, the Middle East and Africa.
The following table presents Citicorp's principal emerging markets assets as of June 30, 2015. For
purposes of the table below, loan amounts are generally based on the domicile of the borrower. For example, a loan to a Chinese subsidiary of a Switzerland-based corporation will generally be categorized as a loan in China. Trading account assets and investment securities are generally categorized below based on the domicile of the issuer of the security or the underlying reference entity (for additional information on the assets included in the table, see the footnotes to the table below).
As of June 30, 2015 | As of Mar. 31, 2015 | As of June 30, 2014 | GCB NCL Rate | ||||||||||||||||||||||||
In billions of dollars | Trading Account Assets (1) | Investment Securities (2) | ICG Loans (3)(4) | GCB Loans (3) | Aggregate (5) | Aggregate (5) | Aggregate (5) | 2Q'15 | 1Q'15 | 2Q'14 | |||||||||||||||||
Mexico | $ | 4.9 | | $ | 18.9 | | $ | 9.5 | | $ | 27.0 | | $ | 60.3 | | $ | 59.9 | | $ | 70.5 | | 4.7 | % | 5.3 | % | 4.7 | % |
Korea | 0.4 | | 9.8 | | 3.5 | | 21.1 | | 34.8 | | 37.3 | | 40.9 | | 0.6 | | 0.6 | | 1.0 | | |||||||
Singapore | 0.1 | | 6.3 | | 8.1 | | 14.4 | | 28.9 | | 27.8 | | 30.6 | | 0.3 | | 0.2 | | 0.3 | | |||||||
Hong Kong | 0.4 | | 3.3 | | 11.3 | | 10.8 | | 25.8 | | 26.8 | | 29.0 | | 0.5 | | 0.4 | | 0.4 | | |||||||
India | 2.0 | | 7.0 | | 9.4 | | 6.2 | | 24.6 | | 26.1 | | 26.3 | | 0.6 | | 0.7 | | 1.0 | | |||||||
Brazil | 2.7 | | 2.8 | | 15.0 | | 3.4 | | 23.9 | | 23.0 | | 27.4 | | 6.9 | | 4.8 | | 5.5 | | |||||||
China | 2.8 | | 3.0 | | 10.2 | | 5.1 | | 21.1 | | 19.8 | | 22.8 | | 0.8 | | 1.0 | | 0.8 | | |||||||
Taiwan | 1.6 | | 0.9 | | 4.7 | | 7.7 | | 15.0 | | 13.6 | | 14.8 | | 0.2 | | 0.2 | | (0.1 | ) | |||||||
Poland | 0.2 | | 3.7 | | 1.4 | | 2.8 | | 8.1 | | 8.6 | | 9.8 | | 0.3 | | 0.3 | | 0.2 | | |||||||
Malaysia | 0.2 | | 0.2 | | 1.9 | | 5.2 | | 7.4 | | 7.4 | | 9.2 | | 0.8 | | 0.7 | | 0.7 | | |||||||
Indonesia | 0.3 | | 0.8 | | 4.0 | | 1.3 | | 6.5 | | 6.5 | | 7.3 | | 4.1 | | 2.2 | | 2.3 | | |||||||
Russia (6) | 0.4 | | 0.5 | | 3.3 | | 1.1 | | 5.3 | | 6.1 | | 8.9 | | 3.5 | | 3.0 | | 2.4 | | |||||||
Colombia | 0.1 | | 0.4 | | 2.4 | | 1.9 | | 4.8 | | 4.3 | | 5.7 | | 3.0 | | 3.4 | | 3.5 | | |||||||
UAE | (0.3 | ) | - | | 3.2 | | 1.6 | | 4.6 | | 4.3 | | 4.3 | | 2.0 | | 1.7 | | 1.9 | | |||||||
Thailand | 0.1 | | 1.1 | | 1.1 | | 2.0 | | 4.3 | | 4.7 | | 4.9 | | 2.9 | | 2.8 | | 2.2 | | |||||||
Turkey | (0.1 | ) | 0.2 | | 2.9 | | 0.8 | | 3.7 | | 4.0 | | 5.0 | | (0.4 | ) | (0.1 | ) | (0.1 | ) | |||||||
Argentina (6) | 0.4 | | 0.3 | | 1.7 | | 1.2 | | 3.5 | | 3.2 | | 2.7 | | 0.7 | | 0.8 | | 0.7 | | |||||||
Philippines | 0.1 | | 0.4 | | 1.3 | | 1.0 | | 2.8 | | 3.0 | | 3.0 | | 4.0 | | 4.6 | | 4.2 | | |||||||
South Africa | (0.1 | ) | 0.6 | | 1.9 | | - | | 2.4 | | 3.2 | | 2.1 | | - | | - | | - | | |||||||
Peru | - | | 0.3 | | 1.6 | | - | | 1.8 | | 1.8 | | 1.4 | | - | | - | | - | | |||||||
Note: Aggregate may not cross-foot due to rounding.
(1) | Trading account assets are shown on a net basis and include derivative exposures where the underlying reference entity is located in that country. Does not include counterparty credit exposures. |
(2) | Investment securities include securities available-for-sale, recorded at fair market value, and securities held-to-maturity, recorded at historical cost. Does not include investments accounted for under the equity method. |
(3) | Reflects funded loans, net of unearned income. In addition to the funded loans disclosed in the table above, through its ICG businesses, Citi had unfunded commitments to corporate customers in the emerging markets of approximately $33 billion as of June 30, 2015 (compared to $36 billion and $33 billion as of March 31, 2015 and June 30, 2014, respectively); no single country accounted for more than $4 billion of this amount. |
(4) | As of June 30, 2015, non-accrual loans represented 0.4% of total ICG loans in the emerging markets. For the countries in the table above, non-accrual loan ratios as of June 30, 2015 ranged from 0.0% to 0.3%, other than in Hong Kong and Brazil. In Hong Kong, the non-accrual loan ratio was 1.3% in each of the quarters presented, primarily reflecting the impact of one counterparty. In Brazil, the non-accrual loan ratio was 0.6% as of June 30, 2015 (compared to 0.6% and 0.3% as of March 31, 2015 and June 30, 2014, respectively), primarily reflecting the impact of one counterparty. |
(5) | Aggregate of Trading account assets, Investment securities, ICG loans and GCB loans, based on the methodologies described above. |
(6) | For additional information on certain risks relating to Russia and Argentina, see "Cross-Border Risk" below. |
91
Emerging Markets Trading Account Assets and Investment Securities
In the ordinary course of business, Citi holds securities in its trading accounts and investment accounts, including those above. Trading account assets are marked to market daily, with asset levels varying as Citi maintains inventory consistent with customer needs. Investment securities are recorded at either fair value or historical cost, based on the underlying accounting treatment, and are predominantly held as part of the local entity asset and liability management program or to comply with local regulatory requirements. In the markets in the table above, 98% of Citi's investment securities were related to sovereign issuers as of June 30, 2015.
Emerging Markets Consumer Lending
GCB 's strategy within the emerging markets is consistent with GCB 's overall strategy, which is to leverage its global footprint to serve its target clients. The retail bank seeks to be the preeminent bank for the emerging affluent and affluent consumers in large urban centers. In credit cards and in certain retail markets, Citi serves customers in a somewhat broader set of segments and geographies. Commercial banking generally serves small- and middle-market enterprises operating in GCB 's geographic markets, focused on clients that value Citi's global capabilities. Overall, Citi believes that its customers are more resilient than the overall market under a wide range of economic conditions. Citi's consumer business has a well established risk appetite framework across geographies and products that reflects the business strategy and activities and establishes boundaries around the key risks that arise from the strategy and activities.
As of June 30, 2015, GCB had approximately $116 billion of consumer loans outstanding to borrowers in the emerging markets, or approximately 41% of GCB 's total loans, compared to $115 billion (41%) and $125 billion (42%) as of March 31, 2015 and June 30, 2014, respectively. Of the approximate $116 billion as of June 30, 2015, the five largest emerging markets-Mexico, Korea, Singapore, Hong Kong and Taiwan-comprised approximately 29% of GCB 's total loans.
Within the emerging markets, 30% of Citi's GCB loans were mortgages, 26% were commercial markets loans, 24% were personal loans and 20% were credit cards loans, each as of June 30, 2015.
Overall consumer credit quality remained generally stable in the second quarter of 2015, as net credit losses in the emerging markets were 1.9% of average loans, compared to 1.9% and 2.0% in the first quarter of 2015 and second quarter of 2014, respectively, consistent with Citi's target market strategy and risk appetite framework.
Emerging Markets Corporate Lending
Consistent with ICG 's overall strategy, Citi's corporate clients in the emerging markets are typically large, multinational corporations that value Citi's global network. Citi aims to establish relationships with these clients that encompass multiple products, consistent with client needs, including cash management and trade services, foreign exchange, lending, capital markets and M&A advisory. Citi believes that its target corporate segment is more resilient under a wide range of economic conditions, and that its relationship-based approach to client service enables it to effectively manage the risks inherent in such relationships. Citi has a well established risk appetite framework around its corporate lending activities, including risk-based limits and approval authorities and portfolio concentration boundaries.
As of June 30, 2015, ICG had approximately $118 billion of loans outstanding to borrowers in the emerging markets, representing approximately 41% of ICG total loans outstanding, compared to $115 billion (41%) and $132 billion (47%) as of March 31, 2015 and June 30, 2014, respectively. No single emerging market-country accounted for more than 5% of Citi's ICG loans as of the end of the second quarter of 2015.
As of June 30, 2015, approximately 75% of Citi's emerging markets corporate credit portfolio (excluding private bank in ICG ), including loans and unfunded lending commitments, was rated investment grade, which Citi considers to be ratings of BBB or better according to its internal risk measurement system and methodology (for additional information on Citi's internal risk measurement system for corporate credit, see "Corporate Credit Details" above). The vast majority of the remainder was rated BB or B according to Citi's internal risk measurement system and methodology.
Overall ICG net credit losses in the emerging markets were 0.2% of average loans in the second quarter of 2015, compared to 0.0% in both the first quarter of 2015 and second quarter of 2014. The ratio of non-accrual ICG loans to total loans in the emerging markets declined to 0.4% as of June 30, 2015, compared to 0.6% and 0.5% as of March 31, 2015 and June 30, 2014, respectively.
92
CROSS-BORDER RISK
Argentina
For additional background and other information relating to Citi's operations, risks and exposures in Argentina, see "Managing Global Risk-Cross-Border Risk" in Citi's 2014 Annual Report on Form 10-K and First Quarter of 2015 Form 10-Q.
As of June 30, 2015, Citi's net investment in its Argentine operations was approximately $865 million, compared to $840 million at March 31, 2015. Citi uses the Argentine peso as the functional currency in Argentina and translates its financial statements into U.S. dollars using the official exchange rate as published by the Central Bank of Argentina. According to the official exchange rate, the Argentine peso devalued to 9.09 pesos to one U.S. dollar at June 30, 2015 compared to 8.82 pesos to one U.S. dollar at March 31, 2015.
At June 30, 2015, Citi had cumulative translation losses related to its investment in Argentina, net of qualifying net investment hedges, of approximately $1.63 billion (pretax), which were recorded in stockholders' equity. This compared to $1.59 billion (pretax) as of March 31, 2015. The cumulative translation losses would not be reclassified into earnings unless realized upon sale, deconsolidation, or liquidation of substantially all of Citi's Argentine operations.
Citi hedges currency risk in its net investment in Argentina to the extent possible and prudent. As of June 30, 2015, Citi's total hedges against its net investment in Argentina were approximately $881 million, compared to $860 million as of March 31, 2015.
As of June 30, 2015, Citi had total third-party assets of approximately $4.4 billion in Citi Argentina ($4.3 billion as of March 31, 2015), primarily composed of corporate and consumer loans and cash on deposit with and short-term paper issued by the Central Bank of Argentina. A significant portion of these assets was funded with local deposits. Included in the total assets were U.S.-dollar-denominated assets of approximately $500 million, compared to approximately $460 million at March 31, 2015. (For additional information on Citi's exposures related to Argentina, see "Emerging Market Exposures" above, which sets forth Citi's trading account assets, investment securities, ICG loans and GCB loans in Argentina, based on the methodology described in such section. As described in such section, these assets totaled approximately $3.5 billion as of June 30, 2015. Approximately $240 million of such exposure is held by non-Argentine Citi subsidiaries and thus is not included in the $4.4 billion amount set forth above, which pertains only to Citi Argentina, as disclosed.)
As widely reported and previously disclosed, Argentina continues to be engaged in litigation in the U.S. with certain "holdout" bond investors who did not accept restructured bonds in the restructuring of Argentine debt after Argentina defaulted on its sovereign obligations in 2001. Also as previously disclosed, Citi Argentina has acted as a custodian in Argentina for certain of the restructured bonds that are part of the "holdout" bond litigation; specifically, U.S.-
dollar-denominated restructured bonds governed by Argentina law and payable in Argentina.
This situation continued to evolve during the second quarter of 2015, with the holdout investors taking steps in the U.S. courts to try to expand the scope of the order to cover additional external indebtedness of the Republic of Argentina and with the government of Argentina taking legal measures against the Argentine branch as a result of Citi's planned exit of its custody business in Argentina. Additional negative consequences to Citi's franchise in Argentina may occur, some of which could be significant, including sanctions, additional business restrictions, the loss of licenses to operate in Argentina and criminal charges against bank employees. The situation could also expose Citi and Citi Argentina to further litigation and penalties.
Venezuela
Since 2003, the Venezuelan government has implemented and operated restrictive foreign exchange controls. These exchange controls have limited Citi's ability to obtain U.S. dollars in Venezuela; Citi has not been able to acquire U.S. dollars from the Venezuelan government since 2008.
As previously disclosed, the Venezuelan government maintains a three-tiered foreign exchange system. As of June 30, 2015, the three separate official foreign exchange rates were:
• | the preferential foreign exchange rate offered by the National Center for Foreign Trade (CENCOEX), fixed at 6.3 bolivars to one U.S. dollar; |
• | the SICAD rate, which was 12.8 bolivars to one U.S. dollar; and |
• | the SIMADI rate, which was 197 bolivars to one U.S. dollar. |
Citi uses the U.S. dollar as the functional currency for its operations in Venezuela. As of June 30, 2015, Citi remeasures its net bolivar denominated monetary assets at the SICAD rate, as the SICAD rate is the only rate at which Citi is legally eligible to acquire U.S. dollars from CENCOEX, despite the limited availability of U.S. dollars and although the SICAD rate may not necessarily be reflective of economic reality. Losses due to remeasurement of Citi's bolivar-denominated assets and liabilities due to changes in the SICAD rate are recorded in earnings. Further devaluation in the SICAD exchange rate, a change in Citi's eligibility to utilize a different exchange mechanism resulting in a less favorable rate, or other unfavorable changes to the foreign exchange mechanisms would result in foreign exchange losses in the period in which such devaluation or change occurs.
At June 30, 2015, Citi's net investment in its Venezuelan operations was approximately $192 million ($180 million at March 31, 2015), which included net monetary assets denominated in Venezuelan bolivars of approximately $155 million ($151 million at March 31, 2015). Total third-party assets of Citi Venezuela were approximately $0.9 billion at June 30, 2015 (compared to $1.1 billion at March 31, 2015), primarily composed of cash on deposit with the Central Bank of Venezuela, corporate and consumer loans, and
93
government bonds. A significant portion of these assets was funded with local deposits.
Greece
On July 13, 2015, Eurozone lenders approved in principle a third bailout financing program for Greece which would provide Greece with up to 86 billion euros ($96 billion) in new loans, subject to stricter reform conditions and additional austerity measures. These measures must be implemented by the Greek government in a tightly monitored rolling schedule of legislation and implementation. The deal has been approved by the Greek parliament, which has begun to pass the necessary legislation, allowing negotiations on a new memorandum of understanding to begin. If these negotiations fail or the reforms falter, the new loans will not be extended, which would lead to Greece defaulting on its debt obligations and possibly even to exit from the Euro. In addition, although Greek banks have reopened after a period of closure, capital controls remain.
As of June 30, 2015, Citi had total third-party assets and liabilities of approximately $201 million and $404 million, respectively, in Citi's Greek branch. This compared to approximately $44 million and $481 million, respectively, as of March 31, 2015. Included in the total third-party assets and liabilities as of the end of the current quarter were non-euro-denominated assets and liabilities of $0.8 million and $27 million, respectively (compared to $1.5 million and $52 million, respectively, as of March 31, 2015). As of July 31, 2015, Citi's estimates that its Greek branch had approximately $80 million and $620 million in total third-party assets and liabilities, respectively.
If Greece were to leave the EMU, certain of its obligations could be redenominated from the euro to a new country currency (e.g., drachma). While alternative scenarios could develop, redenomination could be accompanied by an immediate devaluation of the new currency as compared to the euro and the U.S. dollar. Citi is exposed to potential redenomination and devaluation risks arising from (i) euro-denominated assets and/or liabilities located or held within Greece that are governed by local country law (local exposures), as well as (ii) other euro-denominated assets and liabilities, such as loans and securitized products, between entities outside of Greece and a client or clients within Greece that are governed by local country law (offshore exposures).
If Greece were to withdraw from the EMU, and assuming a symmetrical redenomination and devaluation occurred, Citi believes its risk of loss would be limited as its liabilities subject to redenomination exceeded assets held both locally and offshore as of June 30, 2015. However,
the actual assets and liabilities that could be subject to redenomination and devaluation risk, as well as whether any redenomination is asymmetrical, are subject to substantial legal and other uncertainties. In addition, other events outside of Citi's control-such as the extent of any deposit
flight and devaluation, imposition by U.S. regulators of mandatory loan reserve requirements or any functional
currency change and the accounting impact thereof-could further negatively impact Citi in such an event.
In addition to Citi's Greek branch assets and liabilities described above, as of June 30, 2015, other (non-Greek) Citi branches and subsidiaries had exposures of approximately $1.1 billion to Greek obligors, such as loans (including unfunded commitments), derivatives, and securitized products, net of purchased credit protection, that could experience credit losses under potential country or
cross-border risk events. This estimated exposure is based on Citi's internal risk management measures and systems where the country designation is based on the country to which the
client relationship, taken as a whole, is most directly exposed to economic, financial, sociopolitical or legal risks. As a result, the estimated exposures described above may include exposures to subsidiaries within the client relationship that are actually domiciled outside of Greece (e.g., loans, derivatives and other exposures to a U.K. subsidiary of a Greece-based corporation). Citi believes that the risk of loss associated with its estimated exposure described above is likely lower because a significant amount of the exposure relates to high-quality secured corporate loans not expected to be subject to redenomination.
Russia
Continued unrest in the region and international sanctions are having a significant impact on Russia's economy. The Russian ruble appreciated by 4% against the U.S. dollar from March 31, 2015 to June 30, 2015.
Citibank operates in Russia through a subsidiary, which uses the Russian ruble as its functional currency. Citibank's net investment in Russia was approximately $1.2 billion at June 30, 2015, compared to $1.0 billion at March 31, 2015. Substantially all of Citibank's net investment was hedged (subject to related tax adjustments) as of June 30, 2015, using forward foreign exchange contracts. Total third-party assets of the Russian Citibank subsidiary were approximately $4.6 billion as of June 30, 2015 and March 31, 2015. These assets were primarily composed of corporate and consumer loans, Russian government debt securities, and cash on deposit with the Central Bank of Russia. The large majority of the above assets were funded by local deposit liabilities.
For additional information on Citi's exposures related to Russia, see "Emerging Market Exposures" above, which sets forth Citi's trading account assets, investment securities, ICG loans and GCB loans in Russia, based on the methodology described in such section. As disclosed in such section, these assets totaled approximately $5.3 billion as of June 30, 2015. Approximately $1.5 billion of such exposure is held on non-Russian Citi subsidiaries and thus is not included in the $4.6 billion amount set forth above, which pertains only to the Russian Citibank subsidiary, as disclosed.
94
INCOME TAXES
Deferred Tax Assets
For additional information on Citi's deferred tax assets (DTAs), see "Risk Factors-Business and Operational Risks," "Significant Accounting Policies and Significant Estimates-Income Taxes" and Note 9 to the Consolidated Financial Statements in Citi's 2014 Annual Report on Form 10-K.
At June 30, 2015, Citigroup had recorded net DTAs of approximately $47.9 billion, a decrease of $0.3 billion from March 31, 2015 and a decrease of $1.5 billion from December 31, 2014. The sequential decrease in DTAs was driven primarily by the continued generation of U.S. taxable earnings in Citicorp partially offset by the change in Other Comprehensive Income (see Note 18 to the Consolidated Financial statements).
The following table summarizes Citi's net DTAs balance as of the periods presented. Of Citi's net DTAs as of June 30, 2015, those arising from net operating losses, foreign tax credit and general business credit carry-forwards are 100% deducted in calculating Citi's regulatory capital, while DTAs arising from temporary differences are deducted from regulatory capital if in excess of the 10%/15% limitations (see "Capital Resources" above). Approximately $16.3 billion of the net DTA was not deducted in calculating regulatory capital pursuant to full Basel III implementation standards as of June 30, 2015. Citigroup seeks to improve the regulatory capital benefits of its DTAs through tax planning actions, including third-party transactions, as appropriate.
Jurisdiction/Component | DTAs balance | |||||
In billions of dollars | June 30, | December 31, 2014 | ||||
Total U.S. | $ | 45.4 | | $ | 46.5 | |
Total foreign | 2.5 | | 2.8 | | ||
Total | $ | 47.9 | | $ | 49.3 | |
Effective Tax Rate
Citi's effective tax rate for the second quarter of 2015 was 29.2% (excluding CVA/DVA), lower than the effective tax rate in the second quarter of 2014 of 33.5% (excluding CVA/DVA and the impact of the mortgage settlement in the prior-year period). The current quarter rate reflected a state and local audit settlement, which increased the value of Citi's DTAs, the impact of certain legal entity restructurings and dispositions and New York City tax reform (see below), which reduced the value of the DTAs (See "Executive Summary").
Tax Legislation
In April 2015, the Governor of New York signed legislation bringing New York City into substantive conformity with the New York State corporate tax system, which had been reformed in 2014. The legislation is retroactive to January 1, 2015. Citigroup reported the effect of these changes in its second quarter of 2015 results with a charge of $212 million.
95
DISCLOSURE CONTROLS AND PROCEDURES
Citi's disclosure controls and procedures are designed to ensure that information required to be disclosed under the Securities Exchange Act of 1934, as amended, is recorded, processed, summarized and reported within the time periods specified in the SEC's rules and forms, including without limitation that information required to be disclosed by Citi in its SEC filings is accumulated and communicated to management, including the Chief Executive Officer (CEO) and Chief Financial Officer (CFO) as appropriate to allow for timely decisions regarding required disclosure.
Citi's Disclosure Committee assists the CEO and CFO in their responsibilities to design, establish, maintain and evaluate the effectiveness of Citi's disclosure controls and procedures. The Disclosure Committee is responsible for, among other things, the oversight, maintenance and implementation of the disclosure controls and procedures, subject to the supervision and oversight of the CEO and CFO.
Citi's management, with the participation of its CEO and CFO, has evaluated the effectiveness of Citigroup's disclosure controls and procedures (as defined in Rule 13a-15(e) under the Securities Exchange Act of 1934) as of June 30, 2015 and, based on that evaluation, the CEO and CFO have concluded that at that date Citigroup's disclosure controls and procedures were effective.
DISCLOSURE PURSUANT TO SECTION 219 OF THE IRAN THREAT REDUCTION AND SYRIA HUMAN RIGHTS ACT
Pursuant to Section 219 of the Iran Threat Reduction and Syria Human Rights Act of 2012, which added Section 13(r) to the Securities Exchange Act of 1934, as amended, Citi is required to disclose in its annual or quarterly reports, as applicable, whether it or any of its affiliates knowingly engaged in certain activities, transactions or dealings relating to Iran or with individuals or entities that are subject to sanctions under U.S. law. Disclosure is generally required even where the activities, transactions or dealings were conducted in compliance with applicable law.
Citibank, N.A. has branch operations in Venezuela (Citibank Venezuela). This branch participates in the local government-run clearing and settlement exchange network. As required by the local law and the applicable operating rules for this exchange network, all network participants, including Citibank Venezuela, must process transactions in which funds are drawn from, or deposited into, client accounts of other network participants.
The Office of Foreign Assets Control (OFAC) has been aware of the requirement for Citibank Venezuela to process transactions on this exchange network. Citi has a license application pending with OFAC in connection with this activity.
During the second quarter of 2015, Citibank Venezuela received three incoming payments from Banco Internacional de Desarrollo (BID), an OFAC designated bank, through Venezuela's Electronic Clearing House System (Camara de Compensación Electronica or CCE). The three payments
represented personal transfers by an individual retail accountholder, debiting the accountholder's account at BID and crediting the accountholder's account at Citibank Venezuela. The total value of the transactions was approximately $101,600.00 (1.3 million VEF). The transactions did not result in any revenue or profit for Citi.
96
FORWARD-LOOKING STATEMENTS
Certain statements in this Form 10-Q, including but not limited to statements included within the Management's Discussion and Analysis of Financial Condition and Results of Operations, are "forward-looking statements" within the meaning of the U.S. Private Securities Litigation Reform Act of 1995. In addition, Citigroup also may make forward-looking statements in its other documents filed or furnished with the SEC, and its management may make forward-looking statements orally to analysts, investors, representatives of the media and others.
Generally, forward-looking statements are not based on historical facts but instead represent Citigroup's and its management's beliefs regarding future events. Such statements may be identified by words such as believe, expect, anticipate, intend, estimate, may increase, may fluctuate, and similar expressions or future or conditional verbs such as will, should, would and could.
Such statements are based on management's current expectations and are subject to risks, uncertainties and changes in circumstances. Actual results and capital and other financial conditions may differ materially from those included in these statements due to a variety of factors, including without limitation the precautionary statements included within each individual business' discussion and analysis of its results of operations above and in Citi's 2014 Annual Report on Form 10-K, the factors listed and described under "Risk Factors" in Citi's 2014 Annual Report on Form 10-K and the risks and uncertainties summarized below:
• | the ongoing extensive regulatory changes and uncertainties faced by Citi globally, including, among others, interest rate caps and caps on interchange rates, and the potential impact these changes and uncertainties could have on Citi's strategy, individual businesses' and overall results of operations, ability to make progress on its execution priorities and its compliance risks and costs; |
• | uncertainties relating to ongoing regulatory supervision and potential changes to the regulatory capital requirements applicable to Citi and certain of its affiliated entities, and the potential impact these uncertainties could have on Citi's total risk-weighted assets, leverage assets and ability to meet its capital requirements as it projects or as required; |
• | the potential impact ongoing events in the banking industry generally, including litigation and regulatory settlements, can have on Citi's operational risk-weighted assets and thus its overall risk-weighted assets; |
• | the potential impact to Citi if it is unable to address the shortcomings identified in 2014 by the Federal Reserve Board and FDIC as part of Citi's 2015 resolution plan submission, including the potential for more stringent capital, leverage or liquidity requirements, restrictions on its growth, activities or operations, or requirements to divest certain assets or operations, which could negatively impact Citi's operations or strategy; |
• | the ongoing uncertainties and potential impact to Citi's funding and liquidity management and structure and |
overall results of operations as a result of potential regulatory requirements in the U.S. mandating minimum levels of total loss-absorbing capacity (TLAC), including the potential interplay between Citi's capital and TLAC requirements;
• | the potential impact to Citi's derivative businesses and results of operations arising from the ongoing implementation and interpretation of derivatives regulation in the U.S. and globally, including on Citi's competitive position and its compliance risks and costs; |
• | ongoing interpretive uncertainties and compliance risks and costs associated with the implementation of the Volcker Rule; |
• | the uncertainties and potential impact to Citi's businesses and results of operations of recently adopted and anticipated future regulations applicable to securitizations; |
• | the potential impact to Citi's businesses, results of operations and financial condition of ongoing macroeconomic uncertainties and volatilities, including changes in U.S. and non-U.S. fiscal and monetary actions or expected actions, geopolitical tensions, economic growth, including in the emerging markets, and ongoing concerns relating to potential sovereign defaults and the potential impact of any such defaults on the global economy; |
• | risks arising from Citi's international and emerging markets operations, such as in Argentina, including nationalization or loss of licenses, sanctions, criminal charges, closure of branches or subsidiaries, confiscation of assets, fraud and foreign exchange controls, as well as changes in foreign exchange rates generally and increased compliance and regulatory risks and costs; |
• | the potential impact to Citi's delinquency rates, net credit losses, loan loss reserves and overall results of operations as Citi's revolving home equity lines of credit (HELOCs) continue to "reset," particularly given the limitations on Citi's ability to reduce or mitigate this reset risk going forward; |
• | the potential impact concentrations of risk could have on Citi's hedging strategies and results of operations, including Citi's credit risk to the U.S. government and its agencies and market risk arising from Citi's high volume of transactions with counterparties in the financial services industry; |
• | the potential impact to Citi's funding and liquidity, as well as its liquidity planning and management, arising from the continued heightened regulatory focus on, and ongoing changes to, the liquidity standards and requirements applicable, or expected to be applicable, to Citi; |
• | potential impacts on Citi's liquidity and/or costs of funding as a result of external factors, such as market disruptions, governmental fiscal and monetary policies, regulatory requirements and changes in Citi's credit spreads; |
• | rating downgrades of Citi or its more significant subsidiaries, including as a result of changes in assumptions relating to government support, and the |
97
potential impact on Citi's funding and liquidity as well as the results of operations for certain of its businesses;
• | the potential impact to Citi's businesses, business practices, reputation, financial condition or results of operations that could result from the extensive legal, governmental and regulatory proceedings, investigations and inquiries to which Citi is or may be subject at any given time, including as a result of fines, penalties, consent orders or other similar remedies or sanctions; |
• | uncertainties arising from the continued heightened scrutiny and expectations of the financial services industry by regulators and other enforcement authorities with respect to "conduct" risk, the overall "culture" of the financial services industry generally and the effectiveness of an individual firm's control functions in deterring or preventing employee misconduct; |
• | Citi's ability to meet the Federal Reserve Board's evolving stress testing requirements and qualitative factors pursuant to the annual Comprehensive Capital Analysis and Review (CCAR), including as a result of the potential inclusion of Citi's GSIB surcharge requirement in the stress tests; |
• | Citi's ability to continue to wind-down the assets in Citi Holdings, including those pursuant to which it has executed agreements to sell the assets, as it expects or projects, whether due to required regulatory approvals or other closing conditions, market appetite and/or buyer funding or otherwise; |
• | Citi's ability to successfully achieve its execution priorities, including maintaining expense discipline, continuing to wind down Citi Holdings while maintaining it at or above "break even" on a full-year 2015 basis and continued utilization of its deferred tax assets (DTAs), and the potential impact its inability to do so could have on the achievement of its 2015 operating efficiency and return on assets targets; |
• | Citi's ability to continue to utilize its DTAs (including the foreign tax credit component of its DTAs), including by continuing to generate U.S. taxable income during the relevant carry-forward periods, changes in Citi's accumulated other comprehensive income (AOCI), whether as a result of changes in interest or foreign exchange rates, or otherwise; |
• | the impact on the value of Citi's DTAs and its results of operations if corporate tax rates in the U.S. or certain local, state or foreign jurisdictions decline, or if other changes are made to the U.S. tax system, such as the treatment of foreign corporate earnings; |
• | the potential impact to Citi if Citi's interpretation or application of the extensive tax laws to which it is subject, such as with respect to withholding tax obligations and stamp and other transactional taxes, differs from that of the relevant governmental taxing authorities; |
• | the potential impact to Citi from continually evolving and increasing cybersecurity and other technological risks and attacks, including fraud losses, additional costs, reputational damage, loss of customers, regulatory penalties, exposure to litigation and other potential financial losses to both Citi and its clients and customers; |
• | Citi's failure to maintain, or its ability to enter into any new (including the acquisition of related card receivables portfolios), co-branding or private-label relationships with various third-party retailers and merchants within its U.S. credit card businesses in North America GCB as it expects or projects, or on terms favorable to the businesses, and the potential impact of any such event(s) on the results of operations or financial condition of those businesses; |
• | the potential impact to Citi's results of operations and financial condition if its risk management models, processes or strategies are not effective; |
• | the potential impact on Citi's performance, including its competitive position and ability to execute its strategy, if Citi is unable to hire or retain qualified employees due to regulatory restrictions on compensation or otherwise; and |
• | the impact incorrect assumptions or estimates in Citi's financial statements, as well as ongoing regulatory or other changes to financial accounting and reporting standards or interpretations, could have on Citi's financial condition and results of operations and how it records and reports its financial condition and results of operations. |
Any forward-looking statements made by or on behalf of Citigroup speak only as to the date they are made, and Citi does not undertake to update forward-looking statements to reflect the impact of circumstances or events that arise after the date the forward-looking statements were made.
98
This page intentionally left blank.
99
FINANCIAL STATEMENTS AND NOTES TABLE OF CONTENTS
CONSOLIDATED FINANCIAL STATEMENTS |
|
Consolidated Statement of Income (Unaudited)- For the Three and Six Months Ended June 30, 2015 and 2014 | 101 |
Consolidated Statement of Comprehensive Income (Unaudited)-For the Three and Six Months Ended June 30, 2015 and 2014 | 103 |
Consolidated Balance Sheet-June 30, 2015 (Unaudited) and December 31, 2014 | 104 |
Consolidated Statement of Changes in Stockholders' Equity(Unaudited)-For the Six Months Ended June 30, 2015 and 2014 | 106 |
Consolidated Statement of Cash Flows (Unaudited)- For the Six Months Ended June 30, 2015 and 2014 | 108 |
NOTES TO CONSOLIDATED FINANCIAL STATEMENTS |
|
Note 1-Basis of Presentation and Accounting Changes | 110 |
Note 2-Discontinued Operations and Significant Disposals | 112 |
Note 3-Business Segments | 115 |
Note 4-Interest Revenue and Expense | 116 |
Note 5-Commissions and Fees | 117 |
Note 6-Principal Transactions | 118 |
Note 7-Incentive Plans | 119 |
Note 8-Retirement Benefits | 120 |
Note 9-Earnings per Share | 125 |
Note 10-Federal Funds, Securities Borrowed, Loaned and Subject to Repurchase Agreements | 126 |
Note 11-Brokerage Receivables and Brokerage Payables | 129 |
Note 12-Trading Account Assets and Liabilities | 129 |
Note 13-Investments | 130 |
Note 14-Loans | 143 |
|
|
Note 15-Allowance for Credit Losses | 150 |
Note 16-Goodwill and Intangible Assets | 152 |
Note 17-Debt | 154 |
Note 18-Changes in Accumulated Other Comprehensive Income (Loss) | 155 |
Note 19-Preferred Stock | 159 |
Note 20-Securitizations and Variable Interest Entities | 161 |
Note 21-Derivatives Activities | 176 |
Note 22-Fair Value Measurement | 191 |
Note 23-Fair Value Elections | 217 |
Note 24-Guarantees and Commitments | 221 |
Note 25-Contingencies | 227 |
|
|
100
CONSOLIDATED FINANCIAL STATEMENTS
| Three Months Ended June 30, | Six Months Ended June 30, | ||||||||||
In millions of dollars, except per share amounts | 2015 | 2014 | 2015 | 2014 | ||||||||
Revenues (1) |
|
|
| |
| | ||||||
Interest revenue | $ | 14,873 | | $ | 15,561 | | $ | 29,473 | | $ | 30,911 | |
Interest expense | 3,051 | | 3,615 | | 6,079 | | 7,206 | | ||||
Net interest revenue | $ | 11,822 | | $ | 11,946 | | $ | 23,394 | | $ | 23,705 | |
Commissions and fees | $ | 3,194 | | $ | 3,441 | | $ | 6,364 | | $ | 6,625 | |
Principal transactions | 2,173 | | 1,843 | | 4,144 | | 4,731 | | ||||
Administration and other fiduciary fees | 995 | | 1,029 | | 1,957 | | 2,038 | | ||||
Realized gains on sales of investments, net | 183 | | 84 | | 490 | | 212 | | ||||
Other-than-temporary impairment losses on investments |
|
|
| |
| | ||||||
Gross impairment losses | (43 | ) | (37 | ) | (115 | ) | (238 | ) | ||||
Less: Impairments recognized in AOCI | - | | - | | - | | - | | ||||
Net impairment (losses) recognized in earnings | $ | (43 | ) | $ | (37 | ) | $ | (115 | ) | $ | (238 | ) |
Insurance premiums | $ | 482 | | $ | 538 | | $ | 979 | | $ | 1,083 | |
Other revenue | 664 | | 581 | | 1,993 | | 1,475 | | ||||
Total non-interest revenues | $ | 7,648 | | $ | 7,479 | | $ | 15,812 | | $ | 15,926 | |
Total revenues, net of interest expense | $ | 19,470 | | $ | 19,425 | | $ | 39,206 | | $ | 39,631 | |
Provisions for credit losses and for benefits and claims |
|
|
| |
| | ||||||
Provision for loan losses | $ | 1,515 | | $ | 1,579 | | $ | 3,270 | | $ | 3,372 | |
Policyholder benefits and claims | 181 | | 182 | | 378 | | 390 | | ||||
Provision (release) for unfunded lending commitments | (48 | ) | (31 | ) | (85 | ) | (58 | ) | ||||
Total provisions for credit losses and for benefits and claims | $ | 1,648 | | $ | 1,730 | | $ | 3,563 | | $ | 3,704 | |
Operating expenses (1) |
|
|
| |
| | ||||||
Compensation and benefits | $ | 5,483 | | $ | 6,028 | | $ | 11,003 | | $ | 12,038 | |
Premises and equipment | 737 | | 819 | | 1,446 | | 1,624 | | ||||
Technology/communication | 1,656 | | 1,619 | | 3,256 | | 3,149 | | ||||
Advertising and marketing | 393 | | 460 | | 785 | | 918 | | ||||
Other operating | 2,659 | | 6,595 | | 5,322 | | 9,941 | | ||||
Total operating expenses | $ | 10,928 | | $ | 15,521 | | $ | 21,812 | | $ | 27,670 | |
Income from continuing operations before income taxes | $ | 6,894 | | $ | 2,174 | | $ | 13,831 | | $ | 8,257 | |
Provision for income taxes | 2,036 | | 1,921 | | 4,156 | | 4,052 | | ||||
Income from continuing operations | $ | 4,858 | | $ | 253 | | $ | 9,675 | | $ | 4,205 | |
Discontinued operations |
|
|
| |
| | ||||||
Income (loss) from discontinued operations | $ | 9 | | $ | (3 | ) | $ | 1 | | $ | 37 | |
Provision for income taxes | 3 | | 19 | | - | | 22 | | ||||
Income (loss) from discontinued operations, net of taxes | $ | 6 | | $ | (22 | ) | $ | 1 | | $ | 15 | |
Net income before attribution of noncontrolling interests | $ | 4,864 | | $ | 231 | | $ | 9,676 | | $ | 4,220 | |
Noncontrolling interests | 18 | | 50 | | 60 | | 95 | | ||||
Citigroup's net income | $ | 4,846 | | $ | 181 | | $ | 9,616 | | $ | 4,125 | |
Basic earnings per share (2) |
|
|
| |
| | ||||||
Income from continuing operations | $ | 1.51 | | $ | 0.03 | | $ | 3.03 | | $ | 1.26 | |
Income (loss) from discontinued operations, net of taxes | - | | (0.01 | ) | - | | - | | ||||
Net income | $ | 1.52 | | $ | 0.03 | | $ | 3.03 | | $ | 1.26 | |
Weighted average common shares outstanding | 3,020.0 | | 3,033.8 | | 3,027.1 | | 3,035.6 | | ||||
101
Diluted earnings per share (2) |
|
|
| |
| | ||||||
Income from continuing operations | $ | 1.51 | | $ | 0.03 | | $ | 3.02 | | $ | 1.26 | |
Income (loss) from discontinued operations, net of taxes | - | | (0.01 | ) | - | | - | | ||||
Net income | $ | 1.51 | | $ | 0.03 | | $ | 3.02 | | $ | 1.26 | |
Adjusted weighted average common shares outstanding | 3,025.0 | | 3,038.3 | | 3,032.1 | | 3,040.8 | | ||||
(1) | Certain prior-period revenue and expense lines and totals were reclassified to conform to the current period's presentation. See Note 3 to the Consolidated Financial Statements. |
(2) | Due to rounding, earnings per share on continuing operations and discontinued operations may not sum to earnings per share on net income. |
The Notes to the Consolidated Financial Statements are an integral part of these Consolidated Financial Statements.
102
CONSOLIDATED STATEMENT OF COMPREHENSIVE INCOME
(Unaudited) Citigroup Inc. and Subsidiaries
| Three Months Ended June 30, | Six Months Ended June 30, | ||||||||||
In millions of dollars | 2015 | 2014 | 2015 | 2014 | ||||||||
Net income before attribution of noncontrolling interests | $ | 4,864 | | $ | 231 | | $ | 9,676 | | $ | 4,220 | |
Add: Citigroup's other comprehensive income (loss) | | |
| | | | | | ||||
Net change in unrealized gains and losses on investment securities, net of taxes | $ | (935 | ) | $ | 1,006 | | $ | (344 | ) | $ | 1,434 | |
Net change in cash flow hedges, net of taxes | 92 | | 120 | | 178 | | 238 | | ||||
Benefit plans liability adjustment, net of taxes (1) | 578 | | (144 | ) | 488 | | (177 | ) | ||||
Net change in foreign currency translation adjustment, net of taxes and hedges | (148 | ) | 17 | | (2,210 | ) | (509 | ) | ||||
Citigroup's total other comprehensive income (loss) | $ | (413 | ) | $ | 999 | | $ | (1,888 | ) | $ | 986 | |
Total comprehensive income before attribution of noncontrolling interests | $ | 4,451 | | $ | 1,230 | | $ | 7,788 | | $ | 5,206 | |
Less: Net income attributable to noncontrolling interests | 18 | | 50 | | 60 | | 95 | | ||||
Citigroup's comprehensive income | $ | 4,433 | | $ | 1,180 | | $ | 7,728 | | $ | 5,111 | |
(1) Reflects adjustments based on the actuarial valuations of the Company's significant pension and postretirement plans, including changes in the mortality assumptions at June 30, 2015 , and amortization of amounts previously recognized in Accumulated other comprehensive income (loss). See Note 8 to the Consolidated Financial Statements.
The Notes to the Consolidated Financial Statements are an integral part of these Consolidated Financial Statements.
103
| June 30, |
| ||||
| 2015 | December 31, | ||||
In millions of dollars | (Unaudited) | 2014 | ||||
Assets |
| |
| | ||
Cash and due from banks (including segregated cash and other deposits) | $ | 23,413 | | $ | 32,108 | |
Deposits with banks | 130,685 | | 128,089 | | ||
Federal funds sold and securities borrowed or purchased under agreements to resell (including $132,067 and $144,191 as of June 30, 2015 and December 31, 2014, respectively, at fair value) | 237,054 | | 242,570 | | ||
Brokerage receivables | 43,921 | | 28,419 | | ||
Trading account assets (including $99,995 and $106,217 pledged to creditors at June 30, 2015 and December 31, 2014, respectively) | 279,197 | | 296,786 | | ||
Investments: |
|
| ||||
Available for sale (including $11,169 and $13,808 pledged to creditors as of June 30, 2015 and December 31, 2014, respectively) | 294,126 | | 300,143 | | ||
Held to maturity (including $2,690 and $2,974 pledged to creditors as of June 30, 2015 and December 31, 2014, respectively) | 30,166 | | 23,921 | | ||
Non-marketable equity securities (including $2,288 and $2,758 at fair value as of June 30, 2015 and December 31, 2014 respectively) | 7,829 | | 9,379 | | ||
Total investments | $ | 332,121 | | $ | 333,443 | |
Loans: |
| |
| | ||
Consumer (including $39 and $43 as of June 30, 2015 and December 31, 2014, respectively, at fair value) | 342,349 | | 369,970 | | ||
Corporate (including $6,499 and $5,858 as of June 30, 2015 and December 31, 2014, respectively, at fair value) | 289,769 | | 274,665 | | ||
Loans, net of unearned income | $ | 632,118 | | $ | 644,635 | |
Allowance for loan losses | (14,075 | ) | (15,994 | ) | ||
Total loans, net | $ | 618,043 | | $ | 628,641 | |
Goodwill | 23,012 | | 23,592 | | ||
Intangible assets (other than MSRs) | 4,071 | | 4,566 | | ||
Mortgage servicing rights (MSRs) | 1,924 | | 1,845 | | ||
Other assets (including $8,272 and $7,762 as of June 30, 2015 and December 31, 2014, respectively, at fair value) | 135,929 | | 122,122 | | ||
Total assets | $ | 1,829,370 | | $ | 1,842,181 | |
| June 30, |
| ||||
| 2015 | December 31, | ||||
In millions of dollars | (Unaudited) | 2014 | ||||
Assets of consolidated VIEs to be used to settle obligations of consolidated VIEs |
| |
| | ||
Cash and due from banks | $ | 91 | | $ | 300 | |
Trading account assets | 1,096 | | 671 | | ||
Investments | 6,645 | | 8,014 | | ||
Loans, net of unearned income |
| |
| | ||
Consumer | 58,372 | | 66,383 | | ||
Corporate | 26,448 | | 29,596 | | ||
Loans, net of unearned income | $ | 84,820 | | $ | 95,979 | |
Allowance for loan losses | (2,374 | ) | (2,793 | ) | ||
Total loans, net | $ | 82,446 | | $ | 93,186 | |
Other assets | 6,043 | | 619 | | ||
Total assets of consolidated VIEs to be used to settle obligations of consolidated VIEs | $ | 96,321 | | $ | 102,790 | |
Statement continues on the next page.
104
CONSOLIDATED BALANCE SHEET Citigroup Inc. and Subsidiaries
(Continued)
| June 30, |
| ||||
| 2015 | December 31, | ||||
In millions of dollars, except shares and per share amounts | (Unaudited) | 2014 | ||||
Liabilities |
| |
| | ||
Non-interest-bearing deposits in U.S. offices | $ | 135,013 | | $ | 128,958 | |
Interest-bearing deposits in U.S. offices (including $824 and $994 as of June 30, 2015 and December 31, 2014, respectively, at fair value) | 268,947 | | 284,978 | | ||
Non-interest-bearing deposits in offices outside the U.S. | 72,629 | | 70,925 | | ||
Interest-bearing deposits in offices outside the U.S. (including $565 and $690 as of June 30, 2015 and December 31, 2014, respectively, at fair value) | 431,448 | | 414,471 | | ||
Total deposits | $ | 908,037 | | $ | 899,332 | |
Federal funds purchased and securities loaned or sold under agreements to repurchase (including $38,735 and $36,725 as of June 30, 2015 and December 31, 2014, respectively, at fair value) | 177,012 | | 173,438 | | ||
Brokerage payables | 54,867 | | 52,180 | | ||
Trading account liabilities | 136,295 | | 139,036 | | ||
Short-term borrowings (including $870 and $1,496 as of June 30, 2015 and December 31, 2014, respectively, at fair value) | 25,907 | | 58,335 | | ||
Long-term debt (including $27,214 and $26,180 as of June 30, 2015 and December 31, 2014, respectively, at fair value) | 211,845 | | 223,080 | | ||
Other liabilities (including $1,245 and $1,776 as of June 30, 2015 and December 31, 2014, respectively, at fair value) | 94,582 | | 85,084 | | ||
Total liabilities | $ | 1,608,545 | | $ | 1,630,485 | |
Stockholders' equity |
| |
| | ||
Preferred stock ($1.00 par value; authorized shares: 30 million), issued shares: 558,720 as of June 30, 2015 and 418,720 as of December 31, 2014, at aggregate liquidation value | $ | 13,968 | | $ | 10,468 | |
Common stock ($0.01 par value; authorized shares: 6 billion), issued shares: 3,099,474,404 as of June 30, 2015 and 3,082,037,568 as of December 31, 2014 | 31 | | 31 | | ||
Additional paid-in capital | 108,219 | | 107,979 | | ||
Retained earnings | 126,954 | | 117,852 | | ||
Treasury stock, at cost: June 30, 2015-89,629,131 shares and December 31, 2014-58,119,993 shares | (4,628 | ) | (2,929 | ) | ||
Accumulated other comprehensive income (loss) | (25,104 | ) | (23,216 | ) | ||
Total Citigroup stockholders' equity | $ | 219,440 | | $ | 210,185 | |
Noncontrolling interest | 1,385 | | 1,511 | | ||
Total equity | $ | 220,825 | | $ | 211,696 | |
Total liabilities and equity | $ | 1,829,370 | | $ | 1,842,181 | |
The following table presents certain liabilities of consolidated VIEs, which are included in the Consolidated Balance Sheet above. The liabilities in the table below include third-party liabilities of consolidated VIEs only and exclude intercompany balances that eliminate in consolidation. The liabilities also exclude amounts where creditors or beneficial interest holders have recourse to the general credit of Citigroup.
| June 30, |
| ||||
| 2015 | December 31, | ||||
In millions of dollars | (Unaudited) | 2014 | ||||
Liabilities of consolidated VIEs for which creditors or beneficial interest holders do not have recourse to the general credit of Citigroup |
| |
| | ||
Short-term borrowings | $ | 12,928 | | $ | 20,254 | |
Long-term debt | 32,082 | | 40,078 | | ||
Other liabilities | 5,294 | | 901 | | ||
Total liabilities of consolidated VIEs for which creditors or beneficial interest holders do not have recourse to the general credit of Citigroup | $ | 50,304 | | $ | 61,233 | |
The Notes to the Consolidated Financial Statements are an integral part of these Consolidated Financial Statements.
105
CONSOLIDATED STATEMENT OF CHANGES IN STOCKHOLDERS' EQUITY
(Unaudited) | Citigroup Inc. and Subsidiaries |
| Six Months Ended June 30, | |||||
In millions of dollars, except shares in thousands | 2015 | 2014 | ||||
Preferred stock at aggregate liquidation value |
| |
| | ||
Balance, beginning of year | $ | 10,468 | | $ | 6,738 | |
Issuance of new preferred stock | 3,500 | | 2,230 | | ||
Balance, end of period | $ | 13,968 | | $ | 8,968 | |
Common stock and additional paid-in capital |
| |
| | ||
Balance, beginning of year | $ | 108,010 | | $ | 107,224 | |
Employee benefit plans | 279 | | 492 | | ||
Preferred stock issuance expense | (14 | ) | (24 | ) | ||
Other | (25 | ) | 8 | | ||
Balance, end of period | $ | 108,250 | | $ | 107,700 | |
Retained earnings |
| |
| | ||
Balance, beginning of year | $ | 117,852 | | $ | 111,168 | |
Adjustment to opening balance, net of taxes (1) | - | | $ | (347 | ) | |
Adjusted balance, beginning of period | $ | 117,852 | | $ | 110,821 | |
Citigroup's net income | 9,616 | | 4,125 | | ||
Common dividends (2) | (184 | ) | (60 | ) | ||
Preferred dividends | (330 | ) | (224 | ) | ||
Tax benefit | - | | 353 | | ||
Balance, end of period | $ | 126,954 | | $ | 115,015 | |
Treasury stock, at cost |
| |
| | ||
Balance, beginning of year | $ | (2,929 | ) | $ | (1,658 | ) |
Employee benefit plans (3) | 151 | | (196 | ) | ||
Treasury stock acquired (4) | (1,850 | ) | (666 | ) | ||
Balance, end of period | $ | (4,628 | ) | $ | (2,520 | ) |
Citigroup's accumulated other comprehensive income (loss) |
| |
| | ||
Balance, beginning of year | $ | (23,216 | ) | $ | (19,133 | ) |
Citigroup's total other comprehensive income (loss) | (1,888 | ) | 986 | | ||
Balance, end of period | $ | (25,104 | ) | $ | (18,147 | ) |
Total Citigroup common stockholders' equity | $ | 205,472 | | $ | 202,048 | |
Total Citigroup stockholders' equity | $ | 219,440 | | $ | 211,016 | |
Noncontrolling interests |
| |
| | ||
Balance, beginning of year | $ | 1,511 | | $ | 1,794 | |
Transactions between Citigroup and the noncontrolling-interest shareholders | (114 | ) | (68 | ) | ||
Net income attributable to noncontrolling-interest shareholders | 60 | | 95 | | ||
Dividends paid to noncontrolling-interest shareholders | (10 | ) | (17 | ) | ||
Other comprehensive income (loss) attributable to noncontrolling-interest shareholders | (61 | ) | (2 | ) | ||
Other | (1 | ) | (65 | ) | ||
Net change in noncontrolling interests | $ | (126 | ) | $ | (57 | ) |
Balance, end of period | $ | 1,385 | | $ | 1,737 | |
Total equity | $ | 220,825 | | $ | 212,753 | |
(1) | Citi adopted ASU 2014-01 Investments-Equity Method and Joint Ventures (Topic 323): Accounting for Investments in Affordable Housing , in the first quarter of 2015 on a retrospective basis. This adjustment to opening Retained earnings represents the impact to periods prior to January 1, 2014 and is shown as an adjustment to the opening balance since the second quarter of 2014 is the earliest period disclosed in this Form 10-Q. See Note 1 to the Consolidated Financial Statements for additional information. |
(2) | Common dividends declared were $0.01 per share in the first quarter and $0.05 in the second quarter of 2015 and $0.01 per share in the first and second quarter of 2014 . |
(3) | Includes treasury stock related to (i) certain activity on employee stock option program exercises where the employee delivers existing shares to cover the option exercise, or (ii) under Citi's employee restricted or deferred stock programs where shares are withheld to satisfy tax requirements. |
(4) | For the six months ended June 30, 2015 and 2014, primarily consists of open market purchases under Citi's Board of Directors-approved common stock repurchase program. |
106
The Notes to the Consolidated Financial Statements are an integral part of these Consolidated Financial Statements.
107
CONSOLIDATED STATEMENT OF CASH FLOWS (Unaudited)
Citigroup Inc. and Subsidiaries
| Six Months Ended June 30, | |||||
In millions of dollars | 2015 | 2014 | ||||
Cash flows from operating activities of continuing operations |
|
| ||||
Net income before attribution of noncontrolling interests | $ | 9,676 | | $ | 4,220 | |
Net income attributable to noncontrolling interests | 60 | | 95 | | ||
Citigroup's net income | $ | 9,616 | | $ | 4,125 | |
Income from discontinued operations, net of taxes | 1 | | 15 | | ||
Income from continuing operations-excluding noncontrolling interests | $ | 9,615 | | $ | 4,110 | |
Adjustments to reconcile net income to net cash provided by operating activities of continuing operations |
|
| ||||
Depreciation and amortization | 1,767 | | 1,739 | | ||
Provision for loan losses | 3,270 | | 3,372 | | ||
Realized gains from sales of investments | (490 | ) | (212 | ) | ||
Net impairment losses recognized in earnings | 136 | | 238 | | ||
Change in trading account assets | 17,589 | | (4,848 | ) | ||
Change in trading account liabilities | (2,741 | ) | 14,608 | | ||
Change in brokerage receivables net of brokerage payables | (12,815 | ) | (7,574 | ) | ||
Change in loans held-for-sale | (1,869 | ) | (1,854 | ) | ||
Change in other assets | (1,382 | ) | (2,830 | ) | ||
Change in other liabilities | 3,575 | | 14,833 | | ||
Other, net | 1,691 | | 4,381 | | ||
Total adjustments | $ | 8,731 | | $ | 21,853 | |
Net cash provided by operating activities of continuing operations | $ | 18,346 | | $ | 25,963 | |
Cash flows from investing activities of continuing operations |
|
| ||||
Change in deposits with banks | $ | (2,911 | ) | $ | 15,188 | |
Change in federal funds sold and securities borrowed or purchased under agreements to resell | 5,516 | | 6,684 | | ||
Change in loans | (9,945 | ) | (12,743 | ) | ||
Proceeds from sales and securitizations of loans | 6,377 | | 2,158 | | ||
Purchases of investments | (140,945 | ) | (138,510 | ) | ||
Proceeds from sales of investments | 89,707 | | 81,041 | | ||
Proceeds from maturities of investments | 44,732 | | 44,670 | | ||
Capital expenditures on premises and equipment and capitalized software | (1,471 | ) | (2,207 | ) | ||
Proceeds from sales of premises and equipment, subsidiaries and affiliates, and repossessed assets | 328 | | 231 | | ||
Net cash used in investing activities of continuing operations | $ | (8,612 | ) | $ | (3,488 | ) |
Cash flows from financing activities of continuing operations |
|
| ||||
Dividends paid | $ | (514 | ) | $ | (284 | ) |
Issuance of preferred stock | 3,486 | | 2,206 | | ||
Treasury stock acquired | (1,850 | ) | (666 | ) | ||
Stock tendered for payment of withholding taxes | (423 | ) | (504 | ) | ||
Change in federal funds purchased and securities loaned or sold under agreements to repurchase | 3,574 | | (19,600 | ) | ||
Issuance of long-term debt | 27,183 | | 29,246 | | ||
Payments and redemptions of long-term debt | (26,059 | ) | (24,966 | ) | ||
Change in deposits | 8,705 | | (2,548 | ) | ||
Change in short-term borrowings | (32,428 | ) | 100 | | ||
Net cash used in financing activities of continuing operations | $ | (18,326 | ) | $ | (17,016 | ) |
Effect of exchange rate changes on cash and cash equivalents | $ | (103 | ) | $ | (76 | ) |
Change in cash and due from banks | $ | (8,695 | ) | $ | 5,383 | |
Statement continues on the next page. | ||||||
108
Cash and due from banks at beginning of period | 32,108 | | 29,885 | | ||
Cash and due from banks at end of period | $ | 23,413 | | $ | 35,268 | |
Supplemental disclosure of cash flow information for continuing operations |
|
| ||||
Cash paid during the year for income taxes | $ | 2,863 | | $ | 3,086 | |
Cash paid during the year for interest | 4,928 | | 5,834 | | ||
Non-cash investing activities |
|
| ||||
Decrease in net loans associated with significant disposals reclassified to HFS | $ | (8,874 | ) | $ | - | |
Decrease in investments associated with significant disposals reclassified to HFS | (1,444 | ) | - | | ||
Decrease in goodwill and intangible assets associated with significant disposals reclassified to HFS | (213 | ) | - | | ||
Decrease in deposits with banks with significant disposals reclassified to HFS | (315 | ) | - | | ||
Transfers to loans HFS from loans | 4,500 | | 9,000 | | ||
Transfers to OREO and other repossessed assets | 158 | | 142 | | ||
Non-cash financing activities |
|
| ||||
Decrease in long-term debt associated with significant disposals reclassified to HFS | $ | (5,923 | ) | $ | - | |
The Notes to the Consolidated Financial Statements are an integral part of these Consolidated Financial Statements.
109
NOTES TO CONSOLIDATED FINANCIAL STATEMENTS
1 . BASIS OF PRESENTATION AND ACCOUNTING CHANGES
Basis of Presentation
The accompanying unaudited Consolidated Financial Statements as of June 30, 2015 and for the three- and six-month periods ended June 30, 2015 and 2014 include the accounts of Citigroup Inc. (Citigroup) and its consolidated subsidiaries (collectively, the Company, Citi or Citigroup).
In the opinion of management, all adjustments, consisting of normal recurring adjustments, necessary for a fair presentation have been reflected. The accompanying unaudited Consolidated Financial Statements should be read in conjunction with Citigroup's Annual Report on Form 10-K for the year ended December 31, 2014 filed with the U.S. Securities and Exchange Commission (SEC) on February 25, 2015, including the historical audited consolidated financial statements of Citigroup reflecting the adoption of an accounting change (see "Accounting Changes" below) and certain realignments and reclassifications set forth in Citigroup's Current Report on Form 8-K filed with the SEC on May 27, 2015 (2014 Annual Report on Form 10-K), and Citigroup's Quarterly Report on Form 10-Q for the quarter ended March 31, 2015 filed with the SEC on May 11, 2015 (First Quarter of 2015 Form 10-Q).
Certain financial information that is normally included in annual financial statements prepared in accordance with U.S. generally accepted accounting principles (GAAP), but is not required for interim reporting purposes, has been condensed or omitted.
Management must make estimates and assumptions that affect the Consolidated Financial Statements and the related footnote disclosures. While management makes its best judgment, actual results could differ from those estimates. Current market conditions increase the risk and complexity of the judgments in these estimates.
Certain other reclassifications have been made to the prior-period's financial statements and notes to conform to the current period's presentation.
As noted above, the Notes to Consolidated Financial Statements are unaudited.
ACCOUNTING CHANGES
Accounting for Investments in Tax Credit Partnerships
In January 2014, the FASB issued Accounting Standards Update (ASU) No. 2014-01, Investments-Equity Method and Joint Ventures (Topic 323): Accounting for Investments in Qualified Affordable Housing Projects . Any transition adjustment is reflected as an adjustment to retained earnings in the earliest period presented (retrospective application).
The ASU is applicable to Citi's portfolio of low income housing tax credit (LIHTC) partnership interests. The new standard widens the scope of investments eligible to elect to apply a new alternative method, the proportional amortization method, under which the cost of the investment is amortized to tax expense in proportion to the amount of
tax credits and other tax benefits received. Citi qualifies to elect the proportional amortization method under the ASU for its entire LIHTC portfolio. These investments were previously accounted for under the equity method, which resulted in losses (due to amortization of the investment) being recognized in Other revenue and tax credits and benefits being recognized in the Income tax expense line. In contrast, the proportional amortization method combines the amortization of the investment and receipt of the tax credits/benefits into one line, Income tax expense .
Citi adopted ASU 2014-01 in the first quarter of 2015.
The adoption of this ASU was applied retrospectively and cumulatively reduced Retained earnings by approximately $349 million , Other assets by approximately $178 million , and deferred tax assets by approximately $171 million .
Accounting for Repurchase-to-Maturity Transactions
In June 2014, the FASB issued ASU No. 2014-11, Transfers and Servicing (Topic 860): Repurchase-to-Maturity Transactions, Repurchase Financings, and Disclosures. The ASU changes the accounting for repurchase-to-maturity transactions and linked repurchase financings to secured borrowing accounting, which is consistent with the accounting for other repurchase agreements. The ASU also requires disclosures about transfers accounted for as sales in transactions that are economically similar to repurchase agreements (see Note 21 to the Consolidated Financial Statements) and about the types of collateral pledged in repurchase agreements and similar transactions accounted for as secured borrowings (see Note 10 to the Consolidated Financial Statements). The ASU's provisions became effective for Citi from the first quarter of 2015, with the exception of the collateral disclosures which are effective in the second quarter of 2015. The effect of adopting the ASU is required to be reflected as a cumulative effect adjustment to retained earnings as of the beginning of the period of adoption. Adoption of the ASU did not have a material effect on the Company's financial statements.
Classification of Certain Government-Guaranteed Mortgage Loans upon Foreclosure
In August 2014, the FASB issued ASU No. 2014-14, Receivables-Troubled Debt Restructuring by Creditors (Subtopic 310-40): Classification of Certain Government-Guaranteed Mortgage Loans upon Foreclosure , which requires that a mortgage loan be derecognized and a separate other receivable be recognized upon foreclosure if the following conditions are met: (i) the loan has a government guarantee that is not separable from the loan before foreclosure; (ii) at the time of foreclosure, the creditor has the intent to convey the real estate property to the guarantor and make a claim on the guarantee, and the creditor has the ability to recover under that claim; and (iii) at the time of foreclosure, any amount of the claim that is determined on the basis of the fair value of the real estate is fixed. Upon foreclosure, the separate other receivable is measured based
110
on the amount of the loan balance (principal and interest) expected to be recovered from the guarantor.
Citi early adopted the ASU on a modified retrospective basis in the fourth quarter of 2014, which resulted in reclassifying approximately $130 million of foreclosed assets from Other Real Estate Owned to a separate other receivable that is included in Other assets . Given the modified retrospective approach to adoption, prior periods have not been restated.
Disclosures for Investments in Certain Entities That Calculate Net Asset Value (NAV) per Share
In May 2015, the FASB issued ASU No. 2015-07, Fair Value Measurement (Topic 820): Disclosures for Investments in Certain Entities That Calculate Net Asset Value per Share (or Its Equivalent), which is intended to reduce diversity in practice related to the categorization of investments measured at NAV within the fair value hierarchy. The ASU removes the current requirement to categorize investments for which fair value is measured using the NAV per share practical expedient within the fair value hierarchy. Citi elected to early adopt the ASU in the second quarter of 2015. The adoption of the ASU was applied retrospectively and reduced Level 3 assets by $1.0 billion and $1.1 billion as of June 30, 2015 and December 31, 2014, respectively.
FUTURE APPLICATION OF ACCOUNTING STANDARDS
Revenue Recognition
In May 2014, the FASB issued ASU No. 2014-09, Revenue from Contracts with Customers , which requires an entity to recognize the amount of revenue to which it expects to be entitled for the transfer of promised goods or services to customers. The ASU will replace most existing revenue recognition guidance in GAAP when it becomes effective on January 1, 2018. Early application is permitted for annual periods beginning after December 15, 2016. The standard permits the use of either the retrospective or cumulative effect transition method. The Company is evaluating the effect that ASU 2014-09 will have on its consolidated financial statements and related disclosures. The Company has not yet selected a transition method nor has it determined the effect of the standard on its financial statements.
Consolidation
In February 2015, the FASB issued ASU No. 2015-02, Consolidation (Topic 810): Amendments to the Consolidation Analysis , which is intended to improve certain areas of consolidation guidance for legal entities such as limited partnerships, limited liability companies, and securitization structures. The ASU will reduce the number of consolidation models. The ASU will be effective on January 1, 2016. Early adoption is permitted, including adoption in an interim period. The Company is evaluating the effect that ASU 2015-02 will have on its Consolidated Financial Statements.
Debt Issuance Costs
In April 2015, the FASB issued ASU 2015-03, Interest- Imputation of Interest (Subtopic 835-30), Simplifying the Presentation of Debt Issuance Costs , to conform the presentation of debt issuance costs to that of debt discounts and premiums. Thus, the ASU requires that debt issuance costs related to a recognized debt liability be presented in the balance sheet as a direct deduction from the carrying amount of that debt liability. The ASU will be effective for Citi on January 1, 2016 for both interim and annual periods and will be applied retrospectively to all periods presented. Early adoption is permitted for financial statements that have not been previously issued. The ASU is not expected to have a material effect on the Company.
Accounting for Financial Instruments-Credit Losses
In December 2012, the FASB issued a proposed ASU, Financial Instruments-Credit Losses. This proposed ASU, or exposure draft, was issued for public comment in order to allow stakeholders the opportunity to review the proposal and provide comments to the FASB and does not constitute accounting guidance until a final ASU is issued.
The exposure draft contains proposed guidance developed by the FASB with the goal of improving financial reporting about expected credit losses on loans, securities and other financial assets held by financial institutions and other organizations. The exposure draft proposes a new accounting model intended to require earlier recognition of credit losses, while also providing additional transparency about credit risk.
The FASB's proposed model would utilize an "expected credit loss" measurement objective for the recognition of credit losses for loans, held-to-maturity securities and other receivables at the time the financial asset is originated or acquired and adjusted each period for changes in expected credit losses. For available-for-sale securities where fair value is less than cost, credit-related impairment would be recognized in the allowance for credit losses and adjusted each period for changes in credit. This would replace the multiple existing impairment models in GAAP, which generally require that a loss be "incurred" before it is recognized.
The FASB's proposed model represents a significant departure from existing GAAP, and may result in material changes to the Company's accounting for financial instruments. The impact of the FASB's final ASU on the Company's financial statements will be assessed when it is issued. The exposure draft does not contain a proposed effective date; this would be included in the final ASU, when issued.
111
2 . DISCONTINUED OPERATIONS AND SIGNIFICANT DISPOSALS
Discontinued Operations
The following Discontinued operations are recorded within the Corporate/Other segment.
Sale of Brazil Credicard Business
Citi sold its non-Citibank-branded cards and consumer finance business in Brazil (Credicard) in 2013 and reported it as Discontinued operations . Residual costs and resolution of certain contingencies resulted in income from Discontinued operations, net of taxes, of $8 million and $3 million , for the three months ended June 30, 2015 and 2014 , respectively, and income from Discontinued operations, net of taxes, of $6 million and $56 million , for the six months ended June 30, 2015 and 2014 , respectively.
Sale of Certain Citi Capital Advisors Business
Citi sold its liquid strategies business within Citi Capital Advisors (CCA) pursuant to two separate transactions in 2013 and reported them as Discontinued operations . Citigroup retained a 24.9% passive equity interest in the management company (which is held in Citi's Institutional Clients Group segment). Residual costs from the disposals resulted in no income or losses from Discontinued operations , net of taxes for the three months ended June 30, 2015 and 2014 , respectively and income from Discontinued operations, net of taxes, of $1 million and losses from Discontinued operations , net of taxes, of $2 million for the six months ended June 30, 2015 and 2014 , respectively.
Sale of Egg Banking plc Credit Card Business
Citi completed the sale of the Egg Banking plc (Egg) credit card business in 2011 and reported it as Discontinued operations . Residual costs from the disposal resulted in losses from Discontinued operations , net of taxes, of $2 million and $5 million for the three months ended June 30, 2015 and 2014 , respectively and losses from Discontinued operations, net of taxes, of $6 million and $19 million , for the six months ended June 30, 2015 and 2014 , respectively.
Audit of Citi German Consumer Tax Group
Citi completed the sale of its German retail banking operations in 2008 and has reported them as Discontinued operations . During 2014, residual costs associated with German retail banking operations resulted in a tax expense of $20 million .
Combined Results for Discontinued Operations
The following is summarized financial information for Credicard, CCA, Egg and previous Discontinued operations for which Citi continues to have minimal residual costs associated with the sales:
| Three Months Ended June 30, | Six Months Ended June 30, | ||||||||||
In millions of dollars | 2015 | 2014 | 2015 | 2014 | ||||||||
Total revenues, net of interest expense | $ | - | | $ | 4 | | $ | - | | $ | 73 | |
Income (loss) from discontinued operations | $ | 9 | | $ | (3 | ) | $ | 1 | | $ | 37 | |
Provision (benefit) for income taxes | 3 | | 19 | | - | | 22 | | ||||
Income (loss) from discontinued operations, net of taxes | $ | 6 | | $ | (22 | ) | $ | 1 | | $ | 15 | |
Cash flows for the Discontinued operations were not material for all periods presented.
Significant Disposals
The following sales were identified as significant disposals, including the assets and liabilities that were reclassified to HFS within Other assets and Other liabilities on the Consolidated Balance Sheet and the Income (loss) before taxes (benefits ) related to each business.
Agreement to Sell OneMain Financial Business
On March 3, 2015, Citi entered into an agreement to sell its OneMain Financial business that is part of Citi Holdings. The sale, which is subject to regulatory approvals and other customary closing conditions, is expected to occur in the third quarter of 2015. Income before taxes is as follows:
| Three Months Ended June 30, | Six Months Ended June 30, | ||||||||||
In millions of dollars | 2015 | 2014 | 2015 | 2014 | ||||||||
Income before taxes | $ | 168 | | $ | 226 | | $ | 346 | | $ | 487 | |
112
The following assets and liabilities of the OneMain Financial business were identified and reclassified to HFS within Other assets and Other liabilities on the Consolidated Balance Sheet at June 30, 2015 :
In millions of dollars | June 30, 2015 | | |
Assets |
| ||
Cash and deposits with banks | $ | 420 | |
Investments | 1,444 | | |
Loans (net of allowance of $684 million) | 7,533 | | |
Intangible assets | 152 | | |
Other assets | 361 | | |
Total assets | $ | 9,910 | |
Liabilities |
| ||
Long-term debt | $ | 5,923 | |
Other liabilities, due to/from subs | 2,033 | | |
Other liabilities | 1,453 | | |
Total liabilities | $ | 9,409 | |
Agreement to Sell Japan Cards Business
On March 31, 2015, Citi entered into an agreement to sell its Japan cards business that is part of Citi Holdings effective January 1, 2015. The sale, which is subject to regulatory approvals and other customary closing conditions, is expected to occur by the fourth quarter of 2015. Income before taxes is as follows:
| Three Months Ended June 30, | Six Months Ended June 30, | ||||||||||
In millions of dollars | 2015 | 2014 | 2015 | 2014 | ||||||||
Income before taxes | $ | 10 | | $ | (1 | ) | $ | 9 | | $ | (1 | ) |
The following assets and liabilities of the Japan cards business were identified and reclassified to HFS within Other assets and Other liabilities on the Consolidated Balance Sheet at June 30, 2015 :
In millions of dollars | June 30, 2015 | | |
Assets |
| ||
Cash and deposits with banks | $ | 16 | |
Loans (net allowance of $23 million) | 1,341 | | |
Goodwill | 61 | | |
Other assets | 73 | | |
Total assets | $ | 1,491 | |
Liabilities |
| ||
Other liabilities | $ | 455 | |
Total liabilities | $ | 455 | |
Agreement to Sell Japan Retail Banking Business
On December 25, 2014, Citi entered into an agreement to sell its Japan retail banking business that is part of Citi Holdings effective January 1, 2015. The sale, which is subject to regulatory approvals and other customary closing conditions, is expected to occur by the fourth quarter of 2015. Income before taxes is as follows:
| Three Months Ended June 30, | Six Months Ended June 30, | ||||||||||
In millions of dollars | 2015 | 2014 | 2015 | 2014 | ||||||||
Income before taxes | $ | 20 | | $ | (2 | ) | $ | 20 | | $ | - | |
The following assets and liabilities of the Japan retail banking business were identified and reclassified to HFS within Other assets and Other liabilities on the Consolidated Balance Sheet at June 30, 2015 and December 31, 2014 :
| June 30, | Dec. 31, | ||||
In millions of dollars | 2015 | 2014 | ||||
Assets |
|
| ||||
Cash and deposits with banks | $ | 97 | | $ | 151 | |
Loans (net of allowance of $1 million and $2 million at June 30, 2015 and December 31, 2014) | 545 | | 544 | | ||
Goodwill | 51 | | 51 | | ||
Other assets, advances to/from subs | 19,286 | | 19,854 | | ||
Other assets | 58 | | 66 | | ||
Total assets | $ | 20,037 | | $ | 20,666 | |
Liabilities |
| | ||||
Deposits | $ | 19,982 | | $ | 20,605 | |
Other liabilities | 55 | | 61 | | ||
Total liabilities | $ | 20,037 | | $ | 20,666 | |
113
Combined Significant Disposals-HFS Balance Sheet Reclassifications
The following assets and liabilities of the Japan retail banking, Japan cards business and OneMain Financial business were identified and reclassified to HFS within Other assets and Other liabilities on the Consolidated Balance Sheet at June 30, 2015 (OneMain, Japan cards and Japan retail) and December 31, 2014 (Japan retail):
In millions of dollars | June 30, 2015 | Dec. 31, 2014 | ||||
Assets |
|
| ||||
Cash and deposits with banks | $ | 533 | | $ | 151 | |
Investments | 1,444 | | - | | ||
Loans (net of allowance of $708 million and $2 million at June 30, 2015 and December 31, 2014) | 9,419 | | 544 | | ||
Goodwill | 112 | | 51 | | ||
Intangible assets | 152 | | - | | ||
Other assets, advances to/from subs | 19,286 | | 19,854 | | ||
Other assets | 492 | | 66 | | ||
Total assets | $ | 31,438 | | $ | 20,666 | |
Liabilities |
| | ||||
Deposits | $ | 19,982 | | $ | 20,605 | |
Long-term debt | 5,923 | | - | | ||
Other liabilities, due to/from subs | 2,033 | | - | | ||
Other liabilities | 1,963 | | 61 | | ||
Total liabilities | $ | 29,901 | | $ | 20,666 | |
Sale of Spain Consumer Operations
On September 22, 2014, Citi sold its consumer operations in Spain, which were part of Citi Holdings, including $1.7 billion of consumer loans (net of allowance), $3.4 billion of assets under management, $2.2 billion of customer deposits, 45 branches, 48 ATMs and 938 employees, with the buyer assuming the related current pension commitments at closing. The transaction generated a pretax gain on sale of $243 million ( $131 million after-tax). Income before taxes is as follows:
| Three Months Ended June 30, | Six Months Ended June 30, | ||||||||||
In millions of dollars | 2015 | 2014 | 2015 | 2014 | ||||||||
Income before taxes | $ | - | | $ | 12 | | $ | - | | $ | 33 | |
Sale of Greece Consumer Operations
On September 30, 2014, Citi sold its consumer operations in Greece, which were part of Citi Holdings, including $353 million of consumer loans (net of allowance), $1.1 billion of assets under management, $1.2 billion of customer deposits, 20 branches, 85 ATMs and 719 employees, with the buyer assuming certain limited pension obligations related to Diners' Club's employees at closing. The transaction generated a pretax gain on sale of $209 million ( $91 million after-tax).
| Three Months Ended June 30, | Six Months Ended June 30, | ||||||||||
In millions of dollars | 2015 | 2014 | 2015 | 2014 | ||||||||
Income before taxes | $ | - | | $ | (25 | ) | $ | - | | $ | (40 | ) |
114
3 . BUSINESS SEGMENTS
Citigroup's activities are conducted through the Global Consumer Banking (GCB), Institutional Clients Group (ICG), Corporate/Other and Citi Holdings business segments.
GCB includes a global, full-service consumer franchise delivering a wide array of banking, credit card lending and investment services through a network of local branches, offices and electronic delivery systems and is composed of four GCB businesses: North America, EMEA, Latin America and Asia .
ICG is composed of Banking and Markets and securities services and provides corporate, institutional, public sector and high-net-worth clients in approximately 100 countries with a broad range of banking and financial products and services.
Corporate/Other includes certain unallocated costs of global functions, other corporate expenses and net treasury results, unallocated corporate expenses, offsets to certain line-item reclassifications and eliminations, the results of discontinued operations and unallocated taxes.
Citi Holdings is composed of businesses and portfolios of assets that Citigroup has determined are not central to its core Citicorp businesses.
The accounting policies of these reportable segments are the same as those disclosed in Note 1 to the Consolidated
Financial Statements in Citi's 2014 Annual Report on Form 10-K.The prior-period balances reflect reclassifications to conform the presentation for all periods to the current period's presentation. Effective January 1, 2015, financial data was reclassified from Citicorp to Citi Holdings for the consumer businesses in 11 markets and the consumer finance business in Korea in Global Consumer Banking (GCB) and certain businesses in Institutional Clients Group that Citi intends to exit, changes in Citi's charge out of certain assets and non-interest revenues from the Corporate/Other segment to Citi's businesses, changes in charge outs of certain administrative, operations and technology costs among Citi's businesses and certain other immaterial reclassifications. Citi's consolidated results remain unchanged for all periods presented as a result of the changes discussed above.
In addition, as discussed in Note 1 to the Consolidated Financial Statements, Citi adopted ASU 2014-01 in the first quarter of 2015. The ASU is applicable to Citi's portfolio of low income housing tax credit partnership interests. Citi's disclosures reflect the retrospective application of the ASU and impacts Citi's consolidated assets, revenues, provision for income taxes and net income for all periods presented.
The following table presents certain information regarding the Company's continuing operations by segment:
| Revenues, net of interest expense (1) | Provision (benefits) for income taxes | Income (loss) from continuing operations (2) | Identifiable assets | ||||||||||||||||||||
| Three Months Ended June 30, |
|
| |||||||||||||||||||||
In millions of dollars, except identifiable assets in billions | 2015 | 2014 | 2015 | 2014 | 2015 | 2014 | June 30, 2015 | December 31, 2014 | ||||||||||||||||
Global Consumer Banking | $ | 8,549 | | $ | 8,944 | | $ | 805 | | $ | 802 | | $ | 1,630 | | $ | 1,563 | | $ | 395 | | $ | 406 | |
Institutional Clients Group | 8,878 | | 8,402 | | 1,317 | | 1,205 | | 2,835 | | 2,566 | | 1,266 | | 1,257 | | ||||||||
Corporate/Other | 370 | | 89 | | (245 | ) | (163 | ) | 230 | | (384 | ) | 52 | | 50 | | ||||||||
Total Citicorp | $ | 17,797 | | $ | 17,435 | | $ | 1,877 | | $ | 1,844 | | $ | 4,695 | | $ | 3,745 | | $ | 1,713 | | $ | 1,713 | |
Citi Holdings | 1,673 | | 1,990 | | 159 | | 77 | | 163 | | (3,492 | ) | 116 | | 129 | | ||||||||
Total | $ | 19,470 | | $ | 19,425 | | $ | 2,036 | | $ | 1,921 | | $ | 4,858 | | $ | 253 | | $ | 1,829 | | $ | 1,842 | |
| Revenues, net of interest expense (1) | Provision (benefits) for income taxes | Income (loss) from continuing operations (2) | |||||||||||||||
| Six Months Ended June 30, | |||||||||||||||||
In millions of dollars | 2015 | 2014 | 2015 | 2014 | 2015 | 2014 | ||||||||||||
Global Consumer Banking | $ | 17,211 | | $ | 17,788 | | $ | 1,725 | | $ | 1,544 | | $ | 3,355 | | $ | 3,237 | |
Institutional Clients Group | 17,906 | | 17,556 | | 2,675 | | 2,526 | | 5,799 | | 5,514 | | ||||||
Corporate/Other | 582 | | 312 | | (557 | ) | 46 | | 211 | | (772 | ) | ||||||
Total Citicorp | $ | 35,699 | | $ | 35,656 | | $ | 3,843 | | $ | 4,116 | | $ | 9,365 | | $ | 7,979 | |
Citi Holdings | 3,507 | | 3,975 | | 313 | | (64 | ) | 310 | | (3,774 | ) | ||||||
Total | $ | 39,206 | | $ | 39,631 | | $ | 4,156 | | $ | 4,052 | | $ | 9,675 | | $ | 4,205 | |
(1) | Includes Citicorp (excluding Corporate/Other ) total revenues, net of interest expense, in North America of $8.0 billion and $7.9 billion ; in EMEA of $2.8 billion and $2.7 billion ; in Latin America of $3.0 billion and $3.3 billion ; and in Asia of $3.6 billion and $3.4 billion for the three months ended June 30, 2015 and 2014, respectively. Regional numbers exclude Citi Holdings and Corporate/Other , which largely operate within the U.S. Includes Citicorp (excluding Corporate/Other ) total revenues, net of interest expense, in North America of $16.3 billion and $16.2 billion ; in EMEA of $5.8 billion and $5.8 billion ; in Latin America of $5.9 billion and $6.5 billion ; and in Asia of $7.1 billion and $6.8 billion for the six months ended June 30, 2015 and 2014, respectively. |
(2) | Includes pretax provisions (credits) for credit losses and for benefits and claims in the GCB results of $1.5 billion and $1.5 billion ; in the ICG results of $(95) million and $(112) million ; and in Citi Holdings results of $0.2 billion and $0.4 billion for the three months ended June 30, 2015 and 2014, respectively. Includes pretax provisions (credits) for credit losses and for benefits and claims in the GCB results of $3.0 billion and $3.0 billion ; in the ICG results of $(21) million and $(85) million ; and in Citi Holdings results of $0.6 billion and $0.8 billion for the six months ended June 30, 2015 and 2014, respectively. |
115
4 . INTEREST REVENUE AND EXPENSE
For the three and six months ended June 30, 2015 and 2014, Interest revenue and Interest expense consisted of the following:
| Three Months Ended | Six Months Ended June 30, | ||||||||||
In millions of dollars | 2015 | 2014 | 2015 | 2014 | ||||||||
Interest revenue |
|
|
|
| ||||||||
Loan interest, including fees | $ | 10,529 | | $ | 11,361 | | $ | 21,084 | | $ | 22,542 | |
Deposits with banks | 168 | | 250 | | 351 | | 502 | | ||||
Federal funds sold and securities borrowed or purchased under agreements to resell | 664 | | 592 | | 1,306 | | 1,186 | | ||||
Investments, including dividends | 1,770 | | 1,807 | | 3,481 | | 3,564 | | ||||
Trading account assets (1) | 1,620 | | 1,454 | | 3,019 | | 2,940 | | ||||
Other interest | 122 | | 97 | | 232 | | 177 | | ||||
Total interest revenue | $ | 14,873 | | $ | 15,561 | | $ | 29,473 | | $ | 30,911 | |
Interest expense |
|
|
|
| ||||||||
Deposits (2) | $ | 1,288 | | $ | 1,469 | | $ | 2,613 | | $ | 2,918 | |
Federal funds purchased and securities loaned or sold under agreements to repurchase | 443 | | 537 | | 819 | | 1,062 | | ||||
Trading account liabilities (1) | 54 | | 48 | | 101 | | 89 | | ||||
Short-term borrowings | 157 | | 162 | | 277 | | 299 | | ||||
Long-term debt | 1,109 | | 1,399 | | 2,269 | | 2,838 | | ||||
Total interest expense | $ | 3,051 | | $ | 3,615 | | $ | 6,079 | | $ | 7,206 | |
Net interest revenue | $ | 11,822 | | $ | 11,946 | | $ | 23,394 | | $ | 23,705 | |
Provision for loan losses | 1,515 | | 1,579 | | 3,270 | | 3,372 | | ||||
Net interest revenue after provision for loan losses | $ | 10,307 | | $ | 10,367 | | $ | 20,124 | | $ | 20,333 | |
(1) | Interest expense on Trading account liabilities of ICG is reported as a reduction of interest revenue from Trading account assets . |
(2) | Includes deposit insurance fees and charges of $289 million and $251 million for the three months ended June 30, 2015 and 2014, respectively, and $584 million |
and $532 million for the six months ended June 30, 2015 and 2014, respectively.
116
5 . COMMISSIONS AND FEES
The primary components of Commissions and fees revenue are investment banking fees, trading-related fees, credit card and bank card fees and fees related to trade and securities services in ICG .
Investment banking fees are substantially composed of underwriting and advisory revenues and are recognized when Citigroup's performance under the terms of a contractual arrangement is completed, which is typically at the closing of the transaction. Underwriting revenue is recorded in Commissions and fees , net of both reimbursable and non-reimbursable expenses, consistent with the AICPA Audit and Accounting Guide for Brokers and Dealers in Securities (codified in ASC 940-605-05-1). Expenses associated with advisory transactions are recorded in Other operating expenses, net of client reimbursements. Out-of-pocket expenses are deferred and recognized at the time the related revenue is recognized. In general, expenses incurred related to investment banking transactions that fail to close (are not consummated) are recorded gross in Other operating expenses .
Trading-related fees primarily include commissions and fees from the following: executing transactions for clients on exchanges and over-the-counter markets; sale of mutual funds, insurance and other annuity products; and assisting clients in clearing transactions, providing brokerage services and other such activities. Trading-related fees are recognized when earned in Commissions and fees . Gains or losses, if any, on these transactions are included in Principal transactions (see Note 6 to the Consolidated Financial Statements).
Credit card and bank card fees are primarily composed of interchange revenue and certain card fees, including annual fees, reduced by reward program costs and certain partner payments. Interchange revenue and fees are recognized when earned; annual card fees are deferred and amortized on a straight-line basis over a 12 -month period. Reward costs are recognized when points are earned by the customers. The following table presents Commissions and fees revenue for the three and six months ended June 30 :
| Three Months Ended June 30, | Six Months Ended June 30, | ||||||||||
In millions of dollars | 2015 | 2014 | 2015 | 2014 | ||||||||
Investment banking | $ | 960 | | $ | 1,083 | | $ | 1,898 | | $ | 1,917 | |
Trading-related | 616 | | 645 | | 1,250 | | 1,346 | | ||||
Credit cards and bank cards | 497 | | 565 | | 998 | | 1,128 | | ||||
Trade and securities services | 448 | | 473 | | 883 | | 926 | | ||||
Other consumer (1) | 182 | | 229 | | 362 | | 442 | | ||||
Corporate finance (2) | 126 | | 153 | | 271 | | 276 | | ||||
Checking-related | 130 | | 134 | | 246 | | 270 | | ||||
Loan servicing | 119 | | 98 | | 214 | | 186 | | ||||
Other | 116 | | 61 | | 242 | | 134 | | ||||
Total commissions and fees | $ | 3,194 | | $ | 3,441 | | $ | 6,364 | | $ | 6,625 | |
(1) | Primarily consists of fees for investment fund administration and management, third-party collections, commercial demand deposit accounts and certain credit card services. |
(2) | Consists primarily of fees earned from structuring and underwriting loan syndications. |
117
6 . PRINCIPAL TRANSACTIONS
Principal transactions revenue consists of realized and unrealized gains and losses from trading activities. Trading activities include revenues from fixed income, equities, credit and commodities products and foreign exchange transactions. Not included in the table below is the impact of net interest revenue related to trading activities, which is an integral part of trading activities' profitability. See Note 4 to the Consolidated Financial Statements for information about net
interest revenue related to trading activities. Principal transactions include CVA (credit valuation adjustments on derivatives), FVA (funding valuation adjustments) on over-the-counter derivatives and DVA (debt valuation adjustments on issued liabilities for which the fair value option has been elected), which adjustments are discussed further in Note 22 to the Consolidated Financial Statements.
The following table presents principal transactions revenue for the three and six months ended June 30 :
| Three Months Ended June 30, | Six Months Ended June 30, | ||||||||||
In millions of dollars | 2015 | 2014 | 2015 | 2014 | ||||||||
Global Consumer Banking | $ | 157 | | $ | 170 | | $ | 330 | | $ | 342 | |
Institutional Clients Group | 1,797 | | 1,577 | | 3,996 | | 4,181 | | ||||
Corporate/Other | 182 | | - | | (240 | ) | 20 | | ||||
Subtotal Citicorp | $ | 2,136 | | $ | 1,747 | | $ | 4,086 | | $ | 4,543 | |
Citi Holdings | 37 | | 96 | | 58 | | 188 | | ||||
Total Citigroup | $ | 2,173 | | $ | 1,843 | | $ | 4,144 | | $ | 4,731 | |
Interest rate contracts (1) | $ | 1,393 | | $ | 939 | | $ | 2,590 | | $ | 2,329 | |
Foreign exchange contracts (2) | 718 | | 625 | | 804 | | 1,173 | | ||||
Equity contracts (3) | (185 | ) | (92 | ) | (71 | ) | 46 | | ||||
Commodity and other contracts (4) | 117 | | 98 | | 434 | | 322 | | ||||
Credit products and derivatives (5) | 130 | | 273 | | 387 | | 861 | | ||||
Total | $ | 2,173 | | $ | 1,843 | | $ | 4,144 | | $ | 4,731 | |
(1) | Includes revenues from government securities and corporate debt, municipal securities, mortgage securities and other debt instruments. Also includes spot and forward trading of currencies and exchange-traded and over-the-counter (OTC) currency options, options on fixed income securities, interest rate swaps, currency swaps, swap options, caps and floors, financial futures, OTC options and forward contracts on fixed income securities. |
(2) | Includes revenues from foreign exchange spot, forward, option and swap contracts, as well as FX translation gains and losses. |
(3) | Includes revenues from common, preferred and convertible preferred stock, convertible corporate debt, equity-linked notes and exchange-traded and OTC equity options and warrants. |
(4) | Primarily includes revenues from crude oil, refined oil products, natural gas and other commodities trades. |
(5) | Includes revenues from structured credit products. |
118
7 . INCENTIVE PLANS
All equity awards granted since April 19, 2005 have been made pursuant to stockholder-approved stock incentive plans that are administered by the Personnel and Compensation Committee of the Citigroup Board of Directors, which is composed entirely of independent non-employee directors. For additional information on Citi's incentive plans, see Note 7 to the Consolidated Financial Statements in Citi's 2014 Annual Report on Form 10-K.
119
8 . RETIREMENT BENEFITS
For additional information on Citi's retirement benefits, see Note 8 to the Consolidated Financial Statements in the Company's 2014 Annual Report on Form 10-K.
Pension and Postretirement Plans
The Company has several non-contributory defined benefit pension plans covering certain U.S. employees and has various defined benefit pension and termination indemnity plans covering employees outside the United States.
The U.S. qualified defined benefit plan was frozen effective January 1, 2008 for most employees. Accordingly, no additional compensation-based contributions were credited to the cash balance portion of the plan for existing plan participants after 2007. However, certain employees covered under the prior final pay plan formula continue to accrue benefits. The Company also offers postretirement health care and life insurance benefits to certain eligible U.S. retired employees, as well as to certain eligible employees outside the United States.
The Company also sponsors a number of non-contributory, nonqualified pension plans. These plans, which
are unfunded, provide supplemental defined pension benefits to certain U.S. employees. With the exception of certain employees covered under the prior final pay plan formula, the benefits under these plans were frozen in prior years.
The plan obligations, plan assets and periodic plan expense for the Company's most significant pension and postretirement benefit plans (Significant Plans) are remeasured and disclosed quarterly, instead of annually. The Significant Plans captured approximately 90% of the Company's global pension and postretirement plan obligations as of June 30, 2015. All other plans (All Other Plans) are remeasured annually with a December 31 measurement date.
Net (Benefit) Expense
The following table summarizes the components of net (benefit) expense recognized in the Consolidated Statement of Income for the Company's U.S. qualified and nonqualified pension plans and postretirement plans and plans outside the United States, for Significant Plans and All Other Plans, for the periods indicated.
| Three Months Ended June 30, | ||||||||||||||||||||||||||
| Pension plans |
| Postretirement benefit plans | ||||||||||||||||||||||||
| U.S. plans |
| Non-U.S. plans |
| U.S. plans |
| Non-U.S. plans | ||||||||||||||||||||
In millions of dollars | 2015 | 2014 |
| 2015 | 2014 |
| 2015 | 2014 |
| 2015 | 2014 | ||||||||||||||||
Qualified plans |
| |
| |
|
| |
| |
|
| |
| |
|
| |
| | ||||||||
Benefits earned during the period | $ | - | | $ | 1 | |
| $ | 43 | | $ | 47 | |
| $ | - | | $ | - | |
| $ | 3 | | $ | 3 | |
Interest cost on benefit obligation | 131 | | 138 | |
| 80 | | 98 | |
| 8 | | 9 | |
| 30 | | 31 | | ||||||||
Expected return on plan assets | (223 | ) | (219 | ) |
| (83 | ) | (98 | ) |
| - | | - | |
| (27 | ) | (31 | ) | ||||||||
Amortization of unrecognized |
| |
| |
|
| |
| |
|
| |
| |
|
| |
| | ||||||||
Prior service (benefit) cost | (1 | ) | (1 | ) |
| - | | 1 | |
| - | | - | |
| (3 | ) | (3 | ) | ||||||||
Net actuarial loss | 38 | | 26 | |
| 18 | | 20 | |
| - | | 1 | |
| 12 | | 11 | | ||||||||
Curtailment loss (1) | 10 | | - | |
| - | | 17 | |
| - | | - | |
| - | | - | | ||||||||
Settlement loss (gain) (1) | - | | - | |
| - | | 13 | |
| - | | - | |
| - | | (2 | ) | ||||||||
Net qualified plans (benefit) expense | $ | (45 | ) | $ | (55 | ) | | $ | 58 | | $ | 98 | |
| $ | 8 | | $ | 10 | |
| $ | 15 | | $ | 9 | |
Nonqualified plans expense | 10 | | 12 | |
| - | | - | |
| - | | - | |
| - | | - | | ||||||||
Total net (benefit) expense | $ | (35 | ) | $ | (43 | ) |
| $ | 58 | | $ | 98 | |
| $ | 8 | | $ | 10 | |
| $ | 15 | | $ | 9 | |
(1) | Losses (gains) due to curtailment and settlement relate to repositioning actions in the U.S. and certain countries outside the U.S. |
120
| Six Months Ended June 30, | ||||||||||||||||||||||||||
| Pension plans |
| Postretirement benefit plans | ||||||||||||||||||||||||
| U.S. plans |
| Non-U.S. plans |
| U.S. plans |
| Non-U.S. plans | ||||||||||||||||||||
In millions of dollars | 2015 | 2014 |
| 2015 | 2014 |
| 2015 | 2014 |
| 2015 | 2014 | ||||||||||||||||
Qualified plans |
| |
| |
|
| |
| |
|
| |
| |
|
| |
| | ||||||||
Benefits earned during the period | $ | 2 | | $ | 3 | |
| $ | 87 | | $ | 93 | |
| $ | - | | $ | - | |
| $ | 7 | | $ | 7 | |
Interest cost on benefit obligation | 268 | | 278 | |
| 160 | | 194 | |
| 16 | | 17 | |
| 57 | | 60 | | ||||||||
Expected return on plan assets | (445 | ) | (436 | ) |
| (167 | ) | (193 | ) |
| - | | (1 | ) |
| (56 | ) | (61 | ) | ||||||||
Amortization of unrecognized | | |
|
|
| |
| |
|
|
|
| | |
| | |||||||||||
Prior service (benefit) cost | (2 | ) | (2 | ) |
| - | | 2 | |
| - | | - | |
| (6 | ) | (6 | ) | ||||||||
Net actuarial loss | 75 | | 49 | |
| 39 | | 40 | |
| - | | - | |
| 23 | | 20 | | ||||||||
Curtailment loss (1) | 10 | | - | |
| - | | 17 | |
| - | | - | |
| - | | - | | ||||||||
Settlement loss (gain) (1) | - | | - | |
| - | | 13 | |
| - | | - | |
| - | | (2 | ) | ||||||||
Net qualified plans (benefit) expense | $ | (92 | ) | $ | (108 | ) |
| $ | 119 | | $ | 166 | | | $ | 16 | | $ | 16 | |
| $ | 25 | | $ | 18 | |
Nonqualified plans expense | 22 | | 24 | |
| - | | - | |
| - | | - | |
| - | | - | | ||||||||
Total net (benefit) expense | $ | (70 | ) | $ | (84 | ) |
| $ | 119 | | $ | 166 | |
| $ | 16 | | $ | 16 | |
| $ | 25 | | $ | 18 | |
(1) | Losses (gains) due to curtailment and settlement relate to repositioning actions in the U.S. and certain countries outside the U.S. |
Funded Status and Accumulated Other Comprehensive Income
The following table summarizes the funded status and amounts recognized in the Consolidated Balance Sheet for the Company's Significant Plans.
| Six Months Ended June 30, | ||||||||||||||
| Pension plans |
| Postretirement benefit plans | ||||||||||||
In millions of dollars | U.S. plans |
| Non-U.S. plans |
| U.S. plans |
| Non-U.S. plans | ||||||||
Change in projected benefit obligation |
| |
|
| |
|
| |
|
| | ||||
Projected benefit obligation at beginning of year | $ | 14,839 | |
| $ | 7,252 | |
| $ | 917 | |
| $ | 1,527 | |
Plans measured annually | - | |
| (2,070 | ) |
| - | |
| (348 | ) | ||||
Projected benefit obligation at beginning of year - Significant Plans | $ | 14,839 | |
| $ | 5,182 | |
| $ | 917 | |
| $ | 1,179 | |
First quarter activity | 201 | |
| (47 | ) |
| 3 | |
| (25 | ) | ||||
Projected benefit obligation at March 31, 2015 - Significant Plans | $ | 15,040 | |
| $ | 5,135 | |
| $ | 920 | |
| $ | 1,154 | |
Benefits earned during the period | 1 | |
| 25 | |
| - | |
| 3 | | ||||
Interest cost on benefit obligation | 137 | |
| 65 | |
| 7 | |
| 22 | | ||||
Actuarial gain | (1,011 | ) |
| (153 | ) |
| (70 | ) |
| (55 | ) | ||||
Benefits paid, net of participants' contributions | (194 | ) |
| (51 | ) |
| (13 | ) |
| (13 | ) | ||||
Curtailment loss (1) | 10 | |
| - | |
| - | |
| - | | ||||
Foreign exchange impact and other | - | |
| 114 | |
| - | |
| (31 | ) | ||||
Projected benefit obligation at period end - Significant Plans | $ | 13,983 | |
| $ | 5,135 | | | $ | 844 | |
| $ | 1,080 | |
(1) | Losses due to curtailment relate to repositioning actions in the U.S. |
121
| Six Months Ended June 30, 2015 | ||||||||||||||
| Pension plans |
| Postretirement benefit plans | ||||||||||||
In millions of dollars | U.S. plans |
| Non-U.S. plans |
| U.S. plans |
| Non-U.S. plans | ||||||||
Change in plan assets |
| |
|
| |
|
| |
|
| | ||||
Plan assets at fair value at beginning of year | $ | 13,071 | |
| $ | 7,057 | |
| $ | 10 | |
| $ | 1,384 | |
Plans measured annually | - | |
| (1,406 | ) |
| - | |
| (9 | ) | ||||
Plan assets at fair value at beginning of year - Significant Plans | $ | 13,071 | |
| $ | 5,651 | |
| $ | 10 | |
| $ | 1,375 | |
First quarter activity | 129 | |
| (154 | ) |
| $ | (4 | ) |
| (54 | ) | |||
Plan assets at fair value at March 31, 2015- Significant Plans | $ | 13,200 | |
| $ | 5,497 | |
| $ | 6 | |
| $ | 1,321 | |
Actual return on plan assets | (75 | ) |
| (142 | ) |
| (2 | ) |
| 5 | | ||||
Company contributions | 13 | |
| 12 | |
| 12 | |
| - | | ||||
Plan participants' contributions | - | |
| 1 | |
| - | |
| - | | ||||
Benefits paid | (194 | ) |
| (52 | ) |
| (13 | ) |
| (13 | ) | ||||
Foreign exchange impact and other | - | |
| 158 | |
| - | |
| (35 | ) | ||||
Plan assets at fair value at period end - Significant Plans | $ | 12,944 | |
| $ | 5,474 | |
| $ | 3 | |
| $ | 1,278 | |
|
|
|
|
|
|
|
| ||||||||
Funded status of the plans |
|
|
|
|
|
|
| ||||||||
Qualified plans | $ | (314 | ) |
| $ | 339 | |
| $ | (841 | ) |
| $ | 198 | |
Nonqualified plans | (725 | ) |
| - | |
| - | |
| - | | ||||
Funded status of the plans at period end - Significant Plans | $ | (1,039 | ) |
| $ | 339 | |
| $ | (841 | ) |
| $ | 198 | |
|
|
|
|
|
|
|
| ||||||||
Net amount recognized |
| |
|
| |
|
| |
|
| | ||||
Benefit asset | $ | - | |
| $ | 339 | |
| $ | - | |
| $ | 198 | |
Benefit liability | (1,039 | ) |
| - | |
| (841 | ) |
| - | | ||||
Net amount recognized on the balance sheet - Significant Plans | $ | (1,039 | ) |
| $ | 339 | |
| $ | (841 | ) |
| $ | 198 | |
|
|
|
|
|
|
|
| ||||||||
Amounts recognized in Accumulated other comprehensive income (loss) |
|
| |
|
| |
|
| | ||||||
Prior service benefit (cost) | $ | - | |
| $ | 13 | |
| $ | - | |
| $ | 127 | |
Net actuarial gain (loss) | (5,508 | ) |
| (1,188 | ) |
| (7 | ) |
| (486 | ) | ||||
Net amount recognized in equity (pretax) - Significant Plans | $ | (5,508 | ) |
| $ | (1,175 | ) |
| $ | (7 | ) |
| $ | (359 | ) |
|
|
|
|
|
|
|
| ||||||||
Accumulated benefit obligation at period end - Significant Plans | $ | 13,966 | |
| $ | 4,819 | |
| $ | 844 | |
| $ | 1,080 | |
| Three Months Ended |
| Six Months Ended | ||||
In millions of dollars | June 30, 2015 |
| June 30, 2015 | ||||
Beginning of period balance, net of tax (1) (2) | $ | (5,249 | ) |
| $ | (5,159 | ) |
Actuarial assumptions changes and plan experience | 1,293 | |
| 877 | | ||
Net asset gain (loss) due to difference between actual and expected returns | (535 | ) |
| (370 | ) | ||
Net amortizations | 61 | |
| 125 | | ||
Prior service credit | - | |
| (6 | ) | ||
Foreign exchange impact and other | (9 | ) |
| 63 | | ||
Change in deferred taxes, net | (232 | ) |
| (201 | ) | ||
Change, net of tax | $ | 578 | |
| $ | 488 | |
End of period balance, net of tax (1) (2) | $ | (4,671 | ) |
| $ | (4,671 | ) |
(1) | See Note 18 to the Consolidated Financial Statements for further discussion of net Accumulated other comprehensive income (loss) balance. |
(2) | Includes net-of-tax amounts for certain profit sharing plans outside the U.S. |
122
Plan Assumptions
The Company utilizes a number of assumptions to determine plan obligations and expenses. Changes in one or a combination of these assumptions will have an impact on the Company's pension and postretirement projected benefit obligations, funded status and (benefit) expense. Changes in the plans' funded status resulting from changes in the projected benefit obligation and fair value of plan assets will have a corresponding impact on Accumulated other comprehensive income (loss) .
The discount rates used during the period in determining the pension and postretirement net (benefit) expense for the Significant Plans are shown in the following table:
Net benefit (expense) assumed discount rates during the period 1) | Three Months Ended | |
Jun. 30, 2015 | Mar. 31, 2015 | |
U.S. plans |
|
|
Qualified pension | 3.85% | 4.00% |
Nonqualified pension | 3.70 | 3.90 |
Postretirement | 3.65 | 3.80 |
Non-U.S. plans |
|
|
Pension | 0.70-12.25 | 1.00-12.00 |
Weighted average | 5.14 | 5.44 |
Postretirement | 8.00 | 8.00 |
(1) The Company uses a quarterly remeasurement approach for its Significant Plans. The rates for the three months ended March 31, 2015 and June 30, 2015 shown above were utilized to calculate the first and second quarter expense, respectively.
The discount rates used at period end in determining the pension and postretirement benefit obligations for the Significant Plans are shown in the following table:
Plan obligations assumed discount rates at period ended (1) | June 30, | Mar. 31, 2015 | Dec. 31, 2014 |
U.S. plans |
|
| |
Qualified pension | 4.45% | 3.85% | 4.00% |
Nonqualified pension | 4.30 | 3.70 | 3.90 |
Postretirement | 4.20 | 3.65 | 3.80 |
Non-U.S. plans |
|
|
|
Pension | 1.00 - 12.00 | 0.70 - 12.25 | 1.00-12.00 |
Weighted average | 5.41 | 5.14 | 5.44 |
Postretirement | 8.50 | 8.00 | 8.00 |
(1) For the Significant Plans, the June 30, 2015 rates shown above are
utilized to calculate the June 30, 2015 benefit obligation and will be
utilized to calculate the 2015 third quarter expense. The rates shown
above for the year ended 2014 were utilized to calculate the first quarter
2015 expense. The March 31, 2015 rates were utilized to calculate the
2015 second quarter expense.
Sensitivities of Certain Key Assumptions
The following table summarizes the estimated effect on the Company's Significant Plans quarterly expense of a one-percentage-point change in the discount rate:
| Three Months Ended June 30, 2015 | |
In millions of dollars | One-percentage-point increase | One-percentage-point decrease |
Pension |
|
|
U.S. plans | $8 | $(13) |
Non-U.S. plans | (6) | 8 |
|
|
|
Postretirement |
|
|
U.S. plans | $1 | $(1) |
Non-U.S. plans | (3) | 3 |
|
|
|
Since the U.S. plans were frozen, the majority of the prospective service cost has been eliminated and the gain/loss amortization period was changed to the life expectancy for inactive participants. As a result, expense for the U.S. plans is driven more by interest costs than service costs and an increase in the discount rate would increase expense, while a decrease in the discount rate would decrease expense.
Contributions
The Company's funding practice for U.S. and non-U.S. pension plans is generally to fund to minimum funding requirements in accordance with applicable local laws and regulations. The Company may increase its contributions above the minimum required contribution, if appropriate. In addition, management has the ability to change its funding practices. For the U.S. pension plans, there were no required minimum cash contributions during the second quarter of 2015.
The following table summarizes the actual Company contributions for the six months ended June 30, 2015 and 2014, as well as estimated expected Company contributions for the remainder of 2015 and the contributions made in the third and fourth quarters of 2014. Expected contributions are subject to change since contribution decisions are affected by various factors, such as market performance and regulatory requirements.
123
Summary of Company Contributions
| Pension plans |
| Postretirement plans | ||||||||||||||||||||||||
| U.S. plans (1) |
| Non-U.S. plans |
| U.S. plans |
| Non-U.S. plans | ||||||||||||||||||||
In millions of dollars | 2015 | 2014 |
| 2015 | 2014 |
| 2015 | 2014 |
| 2015 | 2014 | ||||||||||||||||
Company contributions (2) for the six months ended June 30 | $ | 22 | | $ | 23 | |
| $ | 29 | | $ | 87 | |
| $ | 32 | | $ | 20 | |
| $ | 5 | | $ | 8 | |
Company contributions made in second half of 2014 or expected to be made in the remainder of 2015 | $ | 24 | | $ | 22 | |
| $ | 33 | | $ | 95 | |
| $ | 33 | | $ | 29 | |
| $ | 4 | | $ | 91 | |
(1) | The U.S. pension plans include benefits paid directly by the Company for the nonqualified pension plans. |
(2) | Company contributions are composed of cash contributions made to the plans and benefits paid directly to participants by the Company. |
Defined Contribution Plans
The Company sponsors defined contribution plans in the U.S. and in certain non-U.S. locations, all of which are administered in accordance with local laws. The most significant defined contribution plan is the Citigroup 401(k) Plan sponsored by the Company in the U.S.
Under the Citigroup 401(k) Plan, eligible U.S. employees receive matching contributions of up to 6% of their eligible compensation for 2015 and 2014, subject to statutory limits. Additionally, for eligible employees whose eligible compensation is $100,000 or less, a fixed contribution of up to 2% of eligible compensation is provided.
All Company contributions are invested according to participants' individual elections. The expense associated with this plan amounted to approximately $99 million and $101 million for the three months ended June 30, 2015 and 2014, respectively, and $200 million and $204 million for the six months ended June 30, 2015 and 2014, respectively.
Postemployment Plans
The Company sponsors U.S. postemployment plans that provide income continuation and health and welfare benefits to certain eligible U.S. employees on long-term disability.
The following table summarizes the components of net expense recognized in the Consolidated Statement of Income for the Company's U.S. postemployment plans.
| Three Months Ended June 30, |
| Six Months Ended June 30, | ||||||||||||
In millions of dollars | 2015 |
| 2014 |
| 2015 |
| 2014 | ||||||||
Service-related expense |
| |
|
| |
|
| |
|
| | ||||
Benefits earned during the period | $ | - | |
| $ | - | |
| $ | - | |
| $ | - | |
Interest cost on benefit obligation | 1 | |
| 1 | |
| 2 | |
| 2 | | ||||
Amortization of unrecognized |
|
|
|
|
|
|
| ||||||||
Prior service benefit | (8 | ) |
| (8 | ) |
| (15 | ) |
| (15 | ) | ||||
Net actuarial loss | 3 | |
| 3 | |
| 6 | |
| 7 | | ||||
Total service-related benefit | $ | (4 | ) |
| $ | (4 | ) |
| $ | (7 | ) |
| $ | (6 | ) |
Non-service-related (benefit) expense | $ | (3 | ) |
| $ | 8 | |
| $ | 6 | |
| $ | 17 | |
Total net expense | $ | (7 | ) |
| $ | 4 | |
| $ | (1 | ) |
| $ | 11 | |
124
9 . EARNINGS PER SHARE
The following is a reconciliation of the income and share data used in the basic and diluted earnings per share (EPS) computations for the three and six months ended June 30 :
| Three Months Ended | Six Months Ended June 30, | ||||||||||
In millions, except per-share amounts | 2015 | 2014 | 2015 | 2014 | ||||||||
Income from continuing operations before attribution of noncontrolling interests | $ | 4,858 | | $ | 253 | | $ | 9,675 | | $ | 4,205 | |
Less: Noncontrolling interests from continuing operations | 18 | | 50 | | 60 | | 95 | | ||||
Net income from continuing operations (for EPS purposes) | $ | 4,840 | | $ | 203 | | $ | 9,615 | | $ | 4,110 | |
Income (loss) from discontinued operations, net of taxes | 6 | | (22 | ) | 1 | | 15 | | ||||
Citigroup's net income | $ | 4,846 | | $ | 181 | | $ | 9,616 | | $ | 4,125 | |
Less: Preferred dividends (1) | 202 | | 100 | | 330 | | 224 | | ||||
Net income available to common shareholders | $ | 4,644 | | $ | 81 | | $ | 9,286 | | $ | 3,901 | |
Less: Dividends and undistributed earnings allocated to employee restricted and deferred shares with nonforfeitable rights to dividends, applicable to basic EPS | 64 | | 1 | | 126 | | 64 | | ||||
Net income allocated to common shareholders for basic and diluted EPS | $ | 4,580 | | $ | 80 | | $ | 9,160 | | $ | 3,837 | |
Weighted-average common shares outstanding applicable to basic EPS | 3,020.0 | | 3,033.8 | | 3,027.1 | | 3,035.6 | | ||||
Effect of dilutive securities |
|
|
| |
| |||||||
Options (2) | 4.9 | | 4.3 | | 4.9 | | 4.9 | | ||||
Other employee plans | 0.1 | | 0.2 | | 0.1 | | 0.3 | | ||||
Convertible securities (3) | - | | - | | - | | - | | ||||
Adjusted weighted-average common shares outstanding applicable to diluted EPS | 3,025.0 | | 3,038.3 | | 3,032.1 | | 3,040.8 | | ||||
Basic earnings per share (4) |
|
|
| |
| |||||||
Income from continuing operations | $ | 1.51 | | $ | 0.03 | | $ | 3.03 | | $ | 1.26 | |
Discontinued operations | - | | (0.01 | ) | - | | - | | ||||
Net income | $ | 1.52 | | $ | 0.03 | | $ | 3.03 | | $ | 1.26 | |
Diluted earnings per share (4) |
|
|
|
| ||||||||
Income from continuing operations | $ | 1.51 | | $ | 0.03 | | $ | 3.02 | | $ | 1.26 | |
Discontinued operations | - | | (0.01 | ) | - | | - | | ||||
Net income | $ | 1.51 | | $ | 0.03 | | $ | 3.02 | | $ | 1.26 | |
(1) | See Note 19 to the Consolidated Financial Statements for the potential future impact of preferred stock dividends. |
(2) | During the second quarters of 2015 and 2014, weighted-average options to purchase 0.9 million and 7.5 million shares of common stock, respectively, were outstanding but not included in the computation of earnings per share because the weighted-average exercise prices of $201.01 and $117.33 per share, respectively, were anti-dilutive. |
(3) | Warrants issued to the U.S. Treasury as part of the Troubled Asset Relief Program (TARP) and the loss-sharing agreement (all of which were subsequently sold to the public in January 2011), with exercise prices of $178.50 and $106.10 per share for approximately 21.0 million and 25.5 million shares of Citigroup common stock, respectively. Both warrants were not included in the computation of earnings per share in the three and six months ended June 30, 2015 and 2014 because they were anti-dilutive. |
(4) | Due to rounding, earnings per share on continuing operations and discontinued operations may not sum to earnings per share on net income. |
125
10 . FEDERAL FUNDS, SECURITIES BORROWED, LOANED AND SUBJECT TO REPURCHASE AGREEMENTS
Federal funds sold and securities borrowed or purchased under agreements to resell , at their respective carrying values, consisted of the following at June 30 , 2015 and December 31, 2014 :
In millions of dollars | June 30, | December 31, 2014 | ||||
Securities purchased under agreements to resell | $ | 132,083 | | $ | 123,979 | |
Deposits paid for securities borrowed | 104,971 | | 118,591 | | ||
Total | $ | 237,054 | | $ | 242,570 | |
Federal funds purchased and securities loaned or sold under agreements to repurchase , at their respective carrying values, consisted of the following at June 30 , 2015 and December 31, 2014 :
In millions of dollars | June 30, | December 31, 2014 | ||||
Federal funds purchased | $ | 776 | | $ | 334 | |
Securities sold under agreements to repurchase | 154,546 | | 147,204 | | ||
Deposits received for securities loaned | 21,690 | | 25,900 | | ||
Total | $ | 177,012 | | $ | 173,438 | |
The resale and repurchase agreements represent collateralized financing transactions. The Company executes these transactions primarily through its broker-dealer subsidiaries to facilitate customer matched-book activity and to efficiently fund a portion of the Company's trading inventory. Transactions executed by the Company's bank subsidiaries primarily facilitate customer financing activity.
To maintain reliable funding under a wide range of market conditions, including under periods of stress, Citi manages these activities by taking into consideration the quality of the underlying collateral, and stipulating financing tenor. Citi manages the risks in its collateralized financing transactions by conducting daily stress tests to account for changes in capacity, tenors, haircut, collateral profile and client actions. Additionally, Citi maintains counterparty diversification by establishing concentration triggers and assessing counterparty reliability and stability under stress.
It is the Company's policy to take possession of the underlying collateral, monitor its market value relative to the amounts due under the agreements and, when necessary, require prompt transfer of additional collateral in order to maintain contractual margin protection. For resale and repurchase agreements, when necessary, the Company posts additional collateral in order to maintain contractual margin protection.
Collateral typically consists of government and government-agency securities, corporate and municipal bonds, equities, and mortgage-backed and other asset-backed securities.
The resale and repurchase agreements are generally documented under industry standard agreements that allow the prompt close-out of all transactions (including the liquidation of securities held) and the offsetting of obligations to return cash or securities by the non-defaulting party, following a payment default or other type of default under the relevant master agreement. Events of default generally include (i) failure to deliver cash or securities as required under the transaction, (ii) failure to provide or return cash or securities as used for margining purposes, (iii) breach of representation, (iv) cross-default to another transaction entered into among the parties, or, in some cases, their affiliates, and (v) a repudiation of obligations under the agreement. The counterparty that receives the securities in these transactions is generally unrestricted in its use of the securities, with the exception of transactions executed on a tri-party basis, where the collateral is maintained by a custodian and operational limitations may restrict its use of the securities.
A substantial portion of the resale and repurchase agreements is recorded at fair value, as described in Notes 22 and 23 to the Consolidated Financial Statements. The remaining portion is carried at the amount of cash initially advanced or received, plus accrued interest, as specified in the respective agreements.
The securities borrowing and lending agreements also represent collateralized financing transactions similar to the resale and repurchase agreements. Collateral typically consists of government and government-agency securities and corporate debt and equity securities.
Similar to the resale and repurchase agreements, securities borrowing and lending agreements are generally documented under industry standard agreements that allow the prompt close-out of all transactions (including the liquidation of securities held) and the offsetting of obligations to return cash or securities by the non-defaulting party, following a payment default or other default by the other party under the relevant master agreement. Events of default and rights to use securities under the securities borrowing and lending agreements are similar to the resale and repurchase agreements referenced above.
A substantial portion of securities borrowing and lending agreements is recorded at the amount of cash advanced or received. The remaining portion is recorded at fair value as the Company elected the fair value option for certain securities borrowed and loaned portfolios, as described in Note 23 to the Consolidated Financial Statements. With respect to securities loaned, the Company receives cash collateral in an amount generally in excess of the market value of the securities loaned. The Company monitors the market value of securities borrowed and securities loaned on a daily basis and obtains or posts additional collateral in order to maintain contractual margin protection.
The enforceability of offsetting rights incorporated in the master netting agreements for resale and repurchase agreements and securities borrowing and lending agreements is evidenced to the extent that a supportive legal opinion has been obtained from counsel of recognized standing that provides the requisite level of certainty regarding the enforceability of these agreements, and that the exercise of
126
rights by the non-defaulting party to terminate and close-out transactions on a net basis under these agreements will not be stayed or avoided under applicable law upon an event of default including bankruptcy, insolvency or similar proceeding.
A legal opinion may not have been sought or obtained for certain jurisdictions where local law is silent or sufficiently ambiguous to determine the enforceability of offsetting rights or where adverse case law or conflicting regulation may cast doubt on the enforceability of such rights. In some jurisdictions and for some counterparty types, the insolvency law for a particular counterparty type may be nonexistent or unclear as overlapping regimes may exist. For example, this may be the case for certain sovereigns, municipalities, central banks and U.S. pension plans.
The following tables present the gross and net resale and repurchase agreements and securities borrowing and lending
agreements and the related offsetting amount permitted under ASC 210-20-45, as of June 30, 2015 and December 31, 2014 . The tables also include amounts related to financial instruments that are not permitted to be offset under ASC 210-20-45 but would be eligible for offsetting to the extent that an event of default occurred and a legal opinion supporting enforceability of the offsetting rights has been obtained. Remaining exposures continue to be secured by financial collateral, but the Company may not have sought or been able to obtain a legal opinion evidencing enforceability of the offsetting right.
| As of June 30, 2015 | ||||||||||||||
In millions of dollars | Gross amounts | Gross amounts | Net amounts of | Amounts | Net | ||||||||||
Securities purchased under agreements to resell | $ | 179,973 | | $ | 47,890 | | $ | 132,083 | | $ | 99,055 | | $ | 33,028 | |
Deposits paid for securities borrowed | 104,971 | | - | | 104,971 | | 14,982 | | 89,989 | | |||||
Total | $ | 284,944 | | $ | 47,890 | | $ | 237,054 | | $ | 114,037 | | $ | 123,017 | |
In millions of dollars | Gross amounts | Gross amounts | Net amounts of | Amounts | Net | ||||||||||
Securities sold under agreements to repurchase | $ | 202,436 | | $ | 47,890 | | $ | 154,546 | | $ | 77,855 | | $ | 76,691 | |
Deposits received for securities loaned | 21,690 | | - | | 21,690 | | 2,688 | | 19,002 | | |||||
Total | $ | 224,126 | | $ | 47,890 | | $ | 176,236 | | $ | 80,543 | | $ | 95,693 | |
| As of December 31, 2014 | ||||||||||||||
In millions of dollars | Gross amounts | Gross amounts | Net amounts of | Amounts | Net | ||||||||||
Securities purchased under agreements to resell | $ | 180,318 | | $ | 56,339 | | $ | 123,979 | | $ | 94,353 | | $ | 29,626 | |
Deposits paid for securities borrowed | 118,591 | | - | | 118,591 | | 15,139 | | 103,452 | | |||||
Total | $ | 298,909 | | $ | 56,339 | | $ | 242,570 | | $ | 109,492 | | $ | 133,078 | |
In millions of dollars | Gross amounts | Gross amounts | Net amounts of | Amounts | Net | ||||||||||
Securities sold under agreements to repurchase | $ | 203,543 | | $ | 56,339 | | $ | 147,204 | | $ | 72,928 | | $ | 74,276 | |
Deposits received for securities loaned | 25,900 | | - | | 25,900 | | 5,190 | | 20,710 | | |||||
Total | $ | 229,443 | | $ | 56,339 | | $ | 173,104 | | $ | 78,118 | | $ | 94,986 | |
127
(1) | Includes financial instruments subject to enforceable master netting agreements that are permitted to be offset under ASC 210-20-45. |
(2) | The total of this column for each period excludes Federal funds sold/purchased. See tables above. |
(3) | Includes financial instruments subject to enforceable master netting agreements that are not permitted to be offset under ASC 210-20-45 but would be eligible for offsetting to the extent that an event of default has occurred and a legal opinion supporting enforceability of the offsetting right has been obtained. |
(4) | Remaining exposures continue to be secured by financial collateral, but the Company may not have sought or been able to obtain a legal opinion evidencing enforceability of the offsetting right. |
The following table presents the gross amount of liabilities associated with repurchase agreements and securities lending agreements, by remaining contractual maturity as of June 30, 2015 :
In millions of dollars | Open and Overnight | Up to 30 Days | 31-90 Days | Greater than 90 days | Total | ||||||||||
Securities sold under agreements to repurchase | $ | 107,314 | | $ | 51,753 | | $ | 19,215 | | $ | 24,154 | | $ | 202,436 | |
Deposits received for securities loaned | 12,745 | | 5,439 | | 2,423 | | 1,083 | | 21,690 | | |||||
Total | $ | 120,059 | | $ | 57,192 | | $ | 21,638 | | $ | 25,237 | | $ | 224,126 | |
The following table presents the gross amount of liabilities associated with repurchase agreements and securities lending agreements, by class of underlying collateral as of June 30, 2015 :
In millions of dollars | Repurchase Agreements | Securities Lending Agreements | Total | ||||||
U.S Treasury and federal agency | $ | 79,091 | | $ | - | | $ | 79,091 | |
State and municipal | 568 | | - | | 568 | | |||
Foreign government | 58,111 | | 795 | | 58,906 | | |||
Corporate bonds | 17,325 | | 1,168 | | 18,493 | | |||
Equity securities | 13,930 | | 19,547 | | 33,477 | | |||
Mortgage-backed securities | 21,041 | | - | | 21,041 | | |||
Asset-backed securities | 5,099 | | - | | 5,099 | | |||
Other | 7,271 | | 180 | | 7,451 | | |||
Total | $ | 202,436 | | $ | 21,690 | | $ | 224,126 | |
128
11 . BROKERAGE RECEIVABLES AND BROKERAGE
PAYABLES
The Company has receivables and payables for financial instruments sold to and purchased from brokers, dealers and customers, which arise in the ordinary course of business. The Company is exposed to risk of loss from the inability of brokers, dealers or customers to pay for purchases or to deliver the financial instruments sold, in which case the Company would have to sell or purchase the financial instruments at prevailing market prices. Credit risk is reduced to the extent that an exchange or clearing organization acts as a counterparty to the transaction and replaces the broker, dealer or customer in question.
The Company seeks to protect itself from the risks associated with customer activities by requiring customers to maintain margin collateral in compliance with regulatory and internal guidelines. Margin levels are monitored daily, and customers deposit additional collateral as required. Where customers cannot meet collateral requirements, the Company may liquidate sufficient underlying financial instruments to bring the customer into compliance with the required margin level.
Exposure to credit risk is impacted by market volatility, which may impair the ability of clients to satisfy their obligations to the Company. Credit limits are established and closely monitored for customers and for brokers and dealers engaged in forwards, futures and other transactions deemed to be credit sensitive.
Brokerage receivables and Brokerage payables consisted of the following at June 30 , 2015 and December 31, 2014 :
In millions of dollars | June 30, 2015 | December 31, 2014 | ||||
Receivables from customers | $ | 14,187 | | $ | 10,380 | |
Receivables from brokers, dealers, and clearing organizations | 29,734 | | 18,039 | | ||
Total brokerage receivables (1) | $ | 43,921 | | $ | 28,419 | |
Payables to customers | $ | 35,336 | | $ | 33,984 | |
Payables to brokers, dealers, and clearing organizations | 19,531 | | 18,196 | | ||
Total brokerage payables (1) | $ | 54,867 | | $ | 52,180 | |
(1) | Brokerage receivables and payables are accounted for in accordance with ASC 940-320. |
12 . TRADING ACCOUNT ASSETS AND LIABILITIES
Trading account assets and Trading account liabilities are carried at fair value, other than physical commodities accounted for at the lower of cost or fair value, and consist of the following at June 30, 2015 and December 31, 2014 :
In millions of dollars | June 30, | December 31, 2014 | ||||
Trading account assets |
|
| ||||
Mortgage-backed securities (1) |
|
| ||||
U.S. government-sponsored agency guaranteed | $ | 26,047 | | $ | 27,053 | |
Prime | 1,239 | | 1,271 | | ||
Alt-A | 647 | | 709 | | ||
Subprime | 1,010 | | 1,382 | | ||
Non-U.S. residential | 919 | | 1,476 | | ||
Commercial | 3,714 | | 4,343 | | ||
Total mortgage-backed securities | $ | 33,576 | | $ | 36,234 | |
U.S. Treasury and federal agency securities |
|
| ||||
U.S. Treasury | $ | 20,192 | | $ | 18,906 | |
Agency obligations | 1,800 | | 1,568 | | ||
Total U.S. Treasury and federal agency securities | $ | 21,992 | | $ | 20,474 | |
State and municipal securities | $ | 3,332 | | $ | 3,402 | |
Foreign government securities | 58,321 | | 64,937 | | ||
Corporate | 21,539 | | 27,797 | | ||
Derivatives (2) | 60,843 | | 67,957 | | ||
Equity securities | 58,047 | | 57,846 | | ||
Asset-backed securities (1) | 5,731 | | 4,546 | | ||
Other trading assets (3) | 15,816 | | 13,593 | | ||
Total trading account assets | $ | 279,197 | | $ | 296,786 | |
Trading account liabilities |
|
| ||||
Securities sold, not yet purchased | $ | 72,979 | | $ | 70,944 | |
Derivatives (2) | 63,316 | | 68,092 | | ||
Total trading account liabilities | $ | 136,295 | | $ | 139,036 | |
(1) | The Company invests in mortgage-backed and asset-backed securities. These securitizations are generally considered VIEs. The Company's maximum exposure to loss from these VIEs is equal to the carrying amount of the securities, which is reflected in the table above. For mortgage-backed and asset-backed securitizations in which the Company has other involvement, see Note 20 to the Consolidated Financial Statements. |
(2) | Presented net, pursuant to enforceable master netting agreements. See Note 21 to the Consolidated Financial Statements for a discussion regarding the accounting and reporting for derivatives. |
(3) | Includes investments in unallocated precious metals, as discussed in Note 23 to the Consolidated Financial Statements. Also includes physical commodities accounted for at the lower of cost or fair value. |
129
13 . INVESTMENTS
Overview
| June 30, | December 31, 2014 | ||||
In millions of dollars | ||||||
Securities available-for-sale (AFS) | $ | 294,126 | | $ | 300,143 | |
Debt securities held-to-maturity (HTM) (1) | 30,166 | | 23,921 | | ||
Non-marketable equity securities carried at fair value (2) | 2,288 | | 2,758 | | ||
Non-marketable equity securities carried at cost (3) | 5,541 | | 6,621 | | ||
Total investments | $ | 332,121 | | $ | 333,443 | |
(1) | Carried at adjusted amortized cost basis, net of any credit-related impairment. |
(2) | Unrealized gains and losses for non-marketable equity securities carried at fair value are recognized in earnings. |
(3) | Primarily consists of shares issued by the Federal Reserve Bank, Federal Home Loan Banks, foreign central banks and various clearing houses of which Citigroup is a member. |
The following table presents interest and dividend income on investments for the three and six months ended June 30, 2015 and 2014 :
| Three Months Ended June 30, | Six Months Ended June 30, | ||||||||||
In millions of dollars | 2015 | 2014 | 2015 | 2014 | ||||||||
Taxable interest | $ | 1,598 | | $ | 1,544 | | $ | 3,191 | | $ | 3,011 | |
Interest exempt from U.S. federal income tax | 49 | | 147 | | 72 | | 311 | | ||||
Dividend income | 123 | | 116 | | 218 | | 242 | | ||||
Total interest and dividend income | $ | 1,770 | | $ | 1,807 | | $ | 3,481 | | $ | 3,564 | |
The following table presents realized gains and losses on the sale of investments for the three and six months ended June 30, 2015 and 2014 . The gross realized investment losses exclude losses from other-than-temporary impairment (OTTI):
| Three Months Ended June 30, | Six Months Ended June 30, | ||||||||||
In millions of dollars | 2015 | 2014 | 2015 | 2014 | ||||||||
Gross realized investment gains | $ | 357 | | $ | 168 | | $ | 714 | | $ | 460 | |
Gross realized investment losses | (174 | ) | (84 | ) | (224 | ) | (248 | ) | ||||
Net realized gains on sale of investments | $ | 183 | | $ | 84 | | $ | 490 | | $ | 212 | |
The Company has sold certain debt securities that were classified as HTM. These sales were in response to significant deterioration in the creditworthiness of the issuers or securities. In addition, other securities were reclassified to AFS investments in response to significant credit deterioration. Because the Company generally intends to sell the securities, Citi recorded OTTI on the securities. The following table sets forth, for the periods indicated, the carrying value of HTM securities sold and reclassified to AFS, as well as the related gain (loss) or the OTTI losses recorded on these securities.
| Three Months Ended June 30, | Six Months Ended June 30, | ||||||||||
In millions of dollars | 2015 | 2014 | 2015 | 2014 | ||||||||
Carrying value of HTM securities sold | $ | 22 | | $ | 5 | | $ | 49 | | $ | 5 | |
Net realized gain on sale of HTM securities | 3 | | - | | 5 | | - | | ||||
Carrying value of securities reclassified to AFS | - | | 14 | | 94 | | 66 | | ||||
OTTI losses on securities reclassified to AFS | - | | (1 | ) | (5 | ) | (9 | ) | ||||
130
Securities Available-for-Sale
The amortized cost and fair value of AFS securities at June 30, 2015 and December 31, 2014 were as follows:
| June 30, 2015 | December 31, 2014 | ||||||||||||||||||||||
In millions of dollars | Amortized cost | Gross unrealized gains (1) (2) | Gross unrealized losses (1) (2) | Fair value | Amortized cost | Gross unrealized gains (1) | Gross unrealized losses (1) | Fair value | ||||||||||||||||
Debt securities AFS |
|
|
|
|
|
|
|
| ||||||||||||||||
Mortgage-backed securities (3) |
|
|
|
|
|
|
|
| ||||||||||||||||
U.S. government-sponsored agency guaranteed | $ | 34,099 | | $ | 452 | | $ | 176 | | $ | 34,375 | | $ | 35,647 | | $ | 603 | | $ | 159 | | $ | 36,091 | |
Prime | 16 | | - | | - | | 16 | | 12 | | - | | - | | 12 | | ||||||||
Alt-A | 2 | | - | | - | | 2 | | 43 | | 1 | | - | | 44 | | ||||||||
Non-U.S. residential | 7,054 | | 42 | | 7 | | 7,089 | | 8,247 | | 67 | | 7 | | 8,307 | | ||||||||
Commercial | 510 | | 5 | | 2 | | 513 | | 551 | | 6 | | 3 | | 554 | | ||||||||
Total mortgage-backed securities | $ | 41,681 | | $ | 499 | | $ | 185 | | $ | 41,995 | | $ | 44,500 | | $ | 677 | | $ | 169 | | $ | 45,008 | |
U.S. Treasury and federal agency securities |
|
|
|
|
|
|
|
| ||||||||||||||||
U.S. Treasury | $ | 114,607 | | $ | 640 | | $ | 266 | | $ | 114,981 | | $ | 110,492 | | $ | 353 | | $ | 127 | | $ | 110,718 | |
Agency obligations | 9,645 | | 53 | | 9 | | 9,689 | | 12,925 | | 60 | | 13 | | 12,972 | | ||||||||
Total U.S. Treasury and federal agency securities | $ | 124,252 | | $ | 693 | | $ | 275 | | $ | 124,670 | | $ | 123,417 | | $ | 413 | | $ | 140 | | $ | 123,690 | |
State and municipal (4) | $ | 12,537 | | $ | 98 | | $ | 922 | | $ | 11,713 | | $ | 13,526 | | $ | 150 | | $ | 977 | | $ | 12,699 | |
Foreign government | 87,505 | | 491 | | 400 | | 87,596 | | 90,249 | | 734 | | 286 | | 90,697 | | ||||||||
Corporate | 14,670 | | 154 | | 92 | | 14,732 | | 12,033 | | 215 | | 91 | | 12,157 | | ||||||||
Asset-backed securities (3) | 11,621 | | 20 | | 33 | | 11,608 | | 12,534 | | 30 | | 58 | | 12,506 | | ||||||||
Other debt securities | 841 | | - | | - | | 841 | | 661 | | - | | - | | 661 | | ||||||||
Total debt securities AFS | $ | 293,107 | | $ | 1,955 | | $ | 1,907 | | $ | 293,155 | | $ | 296,920 | | $ | 2,219 | | $ | 1,721 | | $ | 297,418 | |
Marketable equity securities AFS | $ | 988 | | $ | 27 | | $ | 44 | | $ | 971 | | $ | 2,461 | | $ | 308 | | $ | 44 | | $ | 2,725 | |
Total securities AFS | $ | 294,095 | | $ | 1,982 | | $ | 1,951 | | $ | 294,126 | | $ | 299,381 | | $ | 2,527 | | $ | 1,765 | | $ | 300,143 | |
(1) | Gross unrealized gains and losses, as presented, do not include the impact of minority investments and the related allocations and pick-up of unrealized gains and losses of AFS securities. These amounts totaled unrealized gains of $ 34 million and $ 27 million as of June 30, 2015 and December 31, 2014 , respectively. |
(2) | Gross unrealized gains and losses, as presented, as of June 30, 2015 do not include the impact of unrealized gains and losses of AFS securities of OneMain Financial ( North America consumer finance business), which were reclassified as HFS as of June 30, 2015 . These amounts totaled unrealized gains of $69 million and unrealized losses of $8 million as of June 30, 2015 . |
(3) | The Company invests in mortgage-backed and asset-backed securities. These securitizations are generally considered VIEs. The Company's maximum exposure to loss from these VIEs is equal to the carrying amount of the securities, which is reflected in the table above. For mortgage-backed and asset-backed securitizations in which the Company has other involvement, see Note 20 to the Consolidated Financial Statements. |
(4) | The gross unrealized losses on state and municipal debt securities are primarily attributable to the effects of fair value hedge accounting. Specifically, Citi hedges the LIBOR-benchmark interest rate component of certain fixed-rate tax-exempt state and municipal debt securities utilizing LIBOR-based interest rate swaps. During the hedge period, losses incurred on the LIBOR-hedging swaps recorded in earnings were substantially offset by gains on the state and municipal debt securities attributable to changes in the LIBOR swap rate being hedged. However, because the LIBOR swap rate decreased significantly during the hedge period while the overall fair value of the municipal debt securities was relatively unchanged, the effect of reclassifying fair value gains on these securities from Accumulated other comprehensive income (loss) (AOCI) to earnings, attributable solely to changes in the LIBOR swap rate, resulted in net unrealized losses remaining in AOCI that relate to the unhedged components of these securities. |
As discussed in more detail below, the Company conducts periodic reviews of all securities with unrealized losses to evaluate whether the impairment is other-than-temporary. Any credit-related impairment related to debt securities is recorded in earnings as OTTI. Non-credit-related impairment is recognized in AOCI if the Company does not plan to sell and is not likely to be required to sell. For other debt securities with OTTI, the entire impairment is recognized in the Consolidated Statement of Income.
131
The table below shows the fair value of AFS securities that have been in an unrealized loss position for less than 12 months or for 12 months or longer as of June 30, 2015 and December 31, 2014 :
| Less than 12 months | 12 months or longer | Total | |||||||||||||||
In millions of dollars | Fair value | Gross unrealized losses | Fair value | Gross unrealized losses | Fair value | Gross unrealized losses | ||||||||||||
June 30, 2015 |
|
|
|
|
|
| ||||||||||||
Securities AFS |
|
|
|
|
|
| ||||||||||||
Mortgage-backed securities |
|
|
|
|
|
| ||||||||||||
U.S. government-sponsored agency guaranteed | $ | 9,521 | | $ | 85 | | $ | 2,332 | | $ | 91 | | $ | 11,853 | | $ | 176 | |
Prime | 11 | | - | | 3 | | - | | 14 | | - | | ||||||
Non-U.S. residential | 2,236 | | 5 | | 298 | | 2 | | 2,534 | | 7 | | ||||||
Commercial | 125 | | 1 | | 53 | | 1 | | 178 | | 2 | | ||||||
Total mortgage-backed securities | $ | 11,893 | | $ | 91 | | $ | 2,686 | | $ | 94 | | $ | 14,579 | | $ | 185 | |
U.S. Treasury and federal agency securities |
|
|
|
|
|
| ||||||||||||
U.S. Treasury | $ | 36,123 | | $ | 263 | | $ | 1,012 | | $ | 3 | | $ | 37,135 | | $ | 266 | |
Agency obligations | 1,980 | | 8 | | 49 | | 1 | | 2,029 | | 9 | | ||||||
Total U.S. Treasury and federal agency securities | $ | 38,103 | | $ | 271 | | $ | 1,061 | | $ | 4 | | $ | 39,164 | | $ | 275 | |
State and municipal | $ | 613 | | $ | 24 | | $ | 5,172 | | $ | 898 | | $ | 5,785 | | $ | 922 | |
Foreign government | 24,935 | | 287 | | 5,339 | | 113 | | 30,274 | | 400 | | ||||||
Corporate | 5,731 | | 76 | | 923 | | 16 | | 6,654 | | 92 | | ||||||
Asset-backed securities | 3,149 | | 8 | | 3,443 | | 25 | | 6,592 | | 33 | | ||||||
Other debt securities | 180 | | - | | - | | - | | 180 | | - | | ||||||
Marketable equity securities AFS | 20 | | 2 | | 300 | | 42 | | 320 | | 44 | | ||||||
Total securities AFS | $ | 84,624 | | $ | 759 | | $ | 18,924 | | $ | 1,192 | | $ | 103,548 | | $ | 1,951 | |
December 31, 2014 |
| |
| |
| |
| |
| |
| | ||||||
Securities AFS |
| |
| |
| |
| |
| |
| | ||||||
Mortgage-backed securities |
| |
| |
| |
| |
| |
| | ||||||
U.S. government-sponsored agency guaranteed | $ | 4,198 | | $ | 30 | | $ | 5,547 | | $ | 129 | | $ | 9,745 | | $ | 159 | |
Prime | 5 | | - | | 2 | | - | | 7 | | - | | ||||||
Non-U.S. residential | 1,276 | | 3 | | 199 | | 4 | | 1,475 | | 7 | | ||||||
Commercial | 124 | | 1 | | 136 | | 2 | | 260 | | 3 | | ||||||
Total mortgage-backed securities | $ | 5,603 | | $ | 34 | | $ | 5,884 | | $ | 135 | | $ | 11,487 | | $ | 169 | |
U.S. Treasury and federal agency securities |
| |
| |
| |
| |
| |
| | ||||||
U.S. Treasury | $ | 36,581 | | $ | 119 | | $ | 1,013 | | $ | 8 | | $ | 37,594 | | $ | 127 | |
Agency obligations | 5,698 | | 9 | | 754 | | 4 | | 6,452 | | 13 | | ||||||
Total U.S. Treasury and federal agency securities | $ | 42,279 | | $ | 128 | | $ | 1,767 | | $ | 12 | | $ | 44,046 | | $ | 140 | |
State and municipal | $ | 386 | | $ | 15 | | $ | 5,802 | | $ | 962 | | $ | 6,188 | | $ | 977 | |
Foreign government | 18,495 | | 147 | | 5,984 | | 139 | | 24,479 | | 286 | | ||||||
Corporate | 3,511 | | 63 | | 1,350 | | 28 | | 4,861 | | 91 | | ||||||
Asset-backed securities | 3,701 | | 13 | | 3,816 | | 45 | | 7,517 | | 58 | | ||||||
Other debt securities | - | | - | | - | | - | | - | | - | | ||||||
Marketable equity securities AFS | 51 | | 4 | | 218 | | 40 | | 269 | | 44 | | ||||||
Total securities AFS | $ | 74,026 | | $ | 404 | | $ | 24,821 | | $ | 1,361 | | $ | 98,847 | | $ | 1,765 | |
132
The following table presents the amortized cost and fair value of AFS debt securities by contractual maturity dates as of June 30, 2015 and December 31, 2014 :
| June 30, 2015 | December 31, 2014 | ||||||||||
In millions of dollars | Amortized cost | Fair value | Amortized cost | Fair value | ||||||||
Mortgage-backed securities (1) |
|
|
|
| ||||||||
Due within 1 year | $ | 40 | | $ | 40 | | $ | 44 | | $ | 44 | |
After 1 but within 5 years | 940 | | 946 | | 931 | | 935 | | ||||
After 5 but within 10 years | 1,162 | | 1,177 | | 1,362 | | 1,387 | | ||||
After 10 years (2) | 39,539 | | 39,832 | | 42,163 | | 42,642 | | ||||
Total | $ | 41,681 | | $ | 41,995 | | $ | 44,500 | | $ | 45,008 | |
U.S. Treasury and federal agency securities |
|
|
|
| ||||||||
Due within 1 year | $ | 3,762 | | $ | 3,763 | | $ | 13,070 | | $ | 13,084 | |
After 1 but within 5 years | 114,168 | | 114,654 | | 104,982 | | 105,131 | | ||||
After 5 but within 10 years | 4,866 | | 4,831 | | 2,286 | | 2,325 | | ||||
After 10 years (2) | 1,456 | | 1,422 | | 3,079 | | 3,150 | | ||||
Total | $ | 124,252 | | $ | 124,670 | | $ | 123,417 | | $ | 123,690 | |
State and municipal |
|
|
|
| ||||||||
Due within 1 year | $ | 1,047 | | $ | 1,045 | | $ | 652 | | $ | 651 | |
After 1 but within 5 years | 3,965 | | 3,966 | | 4,387 | | 4,381 | | ||||
After 5 but within 10 years | 513 | | 523 | | 524 | | 537 | | ||||
After 10 years (2) | 7,012 | | 6,179 | | 7,963 | | 7,130 | | ||||
Total | $ | 12,537 | | $ | 11,713 | | $ | 13,526 | | $ | 12,699 | |
Foreign government |
|
|
|
| ||||||||
Due within 1 year | $ | 31,715 | | $ | 31,737 | | $ | 31,355 | | $ | 31,382 | |
After 1 but within 5 years | 39,770 | | 39,771 | | 41,913 | | 42,467 | | ||||
After 5 but within 10 years | 15,341 | | 15,376 | | 16,008 | | 15,779 | | ||||
After 10 years (2) | 679 | | 712 | | 973 | | 1,069 | | ||||
Total | $ | 87,505 | | $ | 87,596 | | $ | 90,249 | | $ | 90,697 | |
All other (3) |
|
|
|
| ||||||||
Due within 1 year | $ | 1,458 | | $ | 1,460 | | $ | 1,248 | | $ | 1,251 | |
After 1 but within 5 years | 12,873 | | 12,941 | | 10,442 | | 10,535 | | ||||
After 5 but within 10 years | 7,947 | | 7,948 | | 7,282 | | 7,318 | | ||||
After 10 years (2) | 4,854 | | 4,832 | | 6,256 | | 6,220 | | ||||
Total | $ | 27,132 | | $ | 27,181 | | $ | 25,228 | | $ | 25,324 | |
Total debt securities AFS | $ | 293,107 | | $ | 293,155 | | $ | 296,920 | | $ | 297,418 | |
(1) | Includes mortgage-backed securities of U.S. government-sponsored agencies. |
(2) | Investments with no stated maturities are included as contractual maturities of greater than 10 years. Actual maturities may differ due to call or prepayment rights. |
(3) | Includes corporate, asset-backed and other debt securities. |
133
Debt Securities Held-to-Maturity
During the second quarter of 2015, securities with a total fair value of approximately $7.1 billion were transferred from AFS to HTM, composed of $7.0 billion of U.S. government agency mortgage-backed securities and $0.1 billion of obligations of U.S. states and municipalities. The transfer reflects the Company's intent to hold these securities to maturity or to issuer call in order to reduce the impact of price volatility on AOCI and certain capital measures under Basel III. While these securities were transferred to HTM at fair value as of the transfer date, no subsequent changes in value may be recorded, other than any subsequent OTTI and the amortization of differences between the carrying values at the transfer date and the par values of each security as an adjustment of yield over the remaining contractual life of each security. Any net unrealized holding losses within AOCI related to the respective securities at the date of transfer, inclusive of any cumulative fair value hedge adjustments, will be amortized over the remaining contractual life of each security as an adjustment of yield in a manner consistent with the amortization of any premium or discount.
The carrying value and fair value of debt securities HTM at June 30, 2015 and December 31, 2014 were as follows:
In millions of dollars | Amortized cost basis (1) | Net unrealized gains (losses) recognized in AOCI | Carrying value (2) | Gross unrealized gains | Gross unrealized (losses) | Fair value | ||||||||||||
June 30, 2015 |
|
|
|
|
| |||||||||||||
Debt securities held-to-maturity |
|
|
|
|
|
| ||||||||||||
Mortgage-backed securities (3) |
|
|
|
|
|
| ||||||||||||
U.S. government agency guaranteed | $ | 16,060 | | $ | 146 | | $ | 16,206 | | $ | 74 | | $ | (98 | ) | $ | 16,182 | |
Prime | 57 | | (11 | ) | 46 | | 4 | | - | | 50 | | ||||||
Alt-A | 1,026 | | (182 | ) | 844 | | 497 | | (304 | ) | 1,037 | | ||||||
Subprime | 5 | | - | | 5 | | 14 | | - | | 19 | | ||||||
Non-U.S. residential | 619 | | (88 | ) | 531 | | 53 | | - | | 584 | | ||||||
Commercial | 8 | | - | | 8 | | - | | - | | 8 | | ||||||
Total mortgage-backed securities | $ | 17,775 | | $ | (135 | ) | $ | 17,640 | | $ | 642 | | $ | (402 | ) | $ | 17,880 | |
State and municipal (4) | $ | 8,695 | | $ | (435 | ) | $ | 8,260 | | $ | 117 | | $ | (128 | ) | $ | 8,249 | |
Foreign government | 3,945 | | - | | 3,945 | | 42 | | - | | 3,987 | | ||||||
Asset-backed securities (3) | 337 | | (16 | ) | 321 | | 47 | | (1 | ) | 367 | | ||||||
Total debt securities held-to-maturity | $ | 30,752 | | $ | (586 | ) | $ | 30,166 | | $ | 848 | | $ | (531 | ) | $ | 30,483 | |
December 31, 2014 |
|
| |
| |
| |
| |
| | |||||||
Debt securities held-to-maturity |
| |
| |
| |
| |
| |
| | ||||||
Mortgage-backed securities (3) |
| |
| |
| |
| |
| |
| | ||||||
U.S. government agency guaranteed | $ | 8,795 | | $ | 95 | | $ | 8,890 | | $ | 106 | | $ | (6 | ) | $ | 8,990 | |
Prime | 60 | | (12 | ) | 48 | | 6 | | (1 | ) | 53 | | ||||||
Alt-A | 1,125 | | (213 | ) | 912 | | 537 | | (287 | ) | 1,162 | | ||||||
Subprime | 6 | | (1 | ) | 5 | | 15 | | - | | 20 | | ||||||
Non-U.S. residential | 983 | | (137 | ) | 846 | | 92 | | - | | 938 | | ||||||
Commercial | 8 | | - | | 8 | | 1 | | - | | 9 | | ||||||
Total mortgage-backed securities | $ | 10,977 | | $ | (268 | ) | $ | 10,709 | | $ | 757 | | $ | (294 | ) | $ | 11,172 | |
State and municipal | $ | 8,443 | | $ | (494 | ) | $ | 7,949 | | $ | 227 | | $ | (57 | ) | $ | 8,119 | |
Foreign government | 4,725 | | - | | 4,725 | | 77 | | - | | 4,802 | | ||||||
Asset-backed securities (3) | 556 | | (18 | ) | 538 | | 50 | | (10 | ) | 578 | | ||||||
Total debt securities held-to-maturity (5) | $ | 24,701 | | $ | (780 | ) | $ | 23,921 | | $ | 1,111 | | $ | (361 | ) | $ | 24,671 | |
(1) | For securities transferred to HTM from Trading account assets , amortized cost basis is defined as the fair value of the securities at the date of transfer plus any accretion income and less any impairments recognized in earnings subsequent to transfer. For securities transferred to HTM from AFS, amortized cost is defined as the original purchase cost, adjusted for the cumulative accretion or amortization of any purchase discount or premium, plus or minus any cumulative fair value hedge adjustments, net of accretion or amortization, and less any other-than-temporary impairment recognized in earnings. |
(2) | HTM securities are carried on the Consolidated Balance Sheet at amortized cost basis, plus or minus any unamortized unrealized gains and losses and fair value hedge adjustments recognized in AOCI prior to reclassifying the securities from AFS to HTM. Changes in the values of these securities are not reported in the financial statements, except for the amortization of any difference between the carrying value at the transfer date and par value of the securities, and the recognition of any non-credit fair value adjustments in AOCI in connection with the recognition of any credit impairment in earnings related to securities the Company continues to intend to hold until maturity. |
134
(3) | The Company invests in mortgage-backed and asset-backed securities. These securitizations are generally considered VIEs. The Company's maximum exposure to loss from these VIEs is equal to the carrying amount of the securities, which is reflected in the table above. For mortgage-backed and asset-backed securitizations in which the Company has other involvement, see Note 20 to the Consolidated Financial Statements. |
(4) | The net unrealized losses recognized in AOCI on state and municipal debt securities are primarily attributable to the effects of fair value hedge accounting applied when these debt securities were classified as AFS. Specifically, Citi hedged the LIBOR-benchmark interest rate component of certain fixed-rate tax-exempt state and municipal debt securities utilizing LIBOR-based interest rate swaps. During the hedge period, losses incurred on the LIBOR-hedging swaps recorded in earnings were substantially offset by gains on the state and municipal debt securities attributable to changes in the LIBOR swap rate being hedged. However, because the LIBOR swap rate decreased significantly during the hedge period while the overall fair value of the municipal debt securities was relatively unchanged, the effect of reclassifying fair value gains on these securities from AOCI to earnings attributable solely to changes in the LIBOR swap rate resulted in net unrealized losses remaining in AOCI that relate to the unhedged components of these securities. Upon transfer of these debt securities to HTM, all hedges have been de-designated and hedge accounting has ceased. |
(5) | During the second quarter of 2014, securities with a total fair value of approximately $11.8 billion were transferred from AFS to HTM and comprised $5.4 billion of U.S. government agency mortgage-backed securities and $6.4 billion of obligations of U.S. states and municipalities. The transfer reflects the Company's intent to hold these securities to maturity or to issuer call in order to reduce the impact of price volatility on AOCI and certain capital measures under Basel III. While these securities were transferred to HTM at fair value as of the transfer date, no subsequent changes in value may be recorded, other than in connection with the recognition of any subsequent other-than-temporary impairment and the amortization of differences between the carrying values at the transfer date and the par values of each security as an adjustment of yield over the remaining contractual life of each security. Any net unrealized holding losses within AOCI related to the respective securities at the date of transfer, inclusive of any cumulative fair value hedge adjustments, will be amortized over the remaining contractual life of each security as an adjustment of yield in a manner consistent with the amortization of any premium or discount. |
The Company has the positive intent and ability to hold these securities to maturity or, where applicable, the exercise of any issuer call options, absent any unforeseen significant changes in circumstances, including deterioration in credit or changes in regulatory capital requirements.
The net unrealized losses classified in AOCI primarily relate to debt securities previously classified as AFS that have been transferred to HTM, and include any cumulative fair
value hedge adjustments. The net unrealized loss amount also includes any non-credit-related changes in fair value of HTM securities that have suffered credit impairment recorded in earnings. The AOCI balance related to HTM securities is amortized over the remaining contractual life of the related securities as an adjustment of yield in a manner consistent with the accretion of any difference between the carrying value at the transfer date and par value of the same debt securities.
The table below shows the fair value of debt securities HTM that have been in an unrecognized loss position as of June 30, 2015 and December 31, 2014 for less than 12 months and for 12 months or longer:
| Less than 12 months | 12 months or longer | Total | |||||||||||||||
In millions of dollars | Fair | Gross | Fair | Gross | Fair | Gross | ||||||||||||
June 30, 2015 |
|
|
|
|
|
| ||||||||||||
Debt securities held-to-maturity |
|
|
|
|
|
| ||||||||||||
Mortgage-backed securities | $ | - | | $ | - | | $ | 8,638 | | $ | 402 | | $ | 8,638 | | $ | 402 | |
State and municipal | 2,905 | | 64 | | 1,519 | | 64 | | 4,424 | | 128 | | ||||||
Asset-backed securities | - | | - | | 6 | | 1 | | 6 | | 1 | | ||||||
Total debt securities held-to-maturity | $ | 2,905 | | $ | 64 | | $ | 10,163 | | $ | 467 | | $ | 13,068 | | $ | 531 | |
December 31, 2014 |
|
|
|
|
|
| ||||||||||||
Debt securities held-to-maturity |
|
|
|
|
|
| ||||||||||||
Mortgage-backed securities | $ | 4 | | $ | - | | $ | 1,134 | | $ | 294 | | $ | 1,138 | | $ | 294 | |
State and municipal | 2,528 | | 34 | | 314 | | 23 | | 2,842 | | 57 | | ||||||
Asset-backed securities | 9 | | 1 | | 174 | | 9 | | 183 | | 10 | | ||||||
Total debt securities held-to-maturity | $ | 2,541 | | $ | 35 | | $ | 1,622 | | $ | 326 | | $ | 4,163 | | $ | 361 | |
Excluded from the gross unrecognized losses presented in the above table are $(586) million and $(780) million of net unrealized losses recorded in AOCI as of June 30, 2015 and December 31, 2014 , respectively, primarily related to the difference between the amortized cost and carrying value of HTM securities that were reclassified from AFS. Substantially all of these net unrecognized losses relate to securities that have been in a loss position for 12 months or longer at June 30, 2015 and December 31, 2014 .
135
| June 30, 2015 | December 31, 2014 | ||||||||||
In millions of dollars | Carrying value | Fair value | Carrying value | Fair value | ||||||||
Mortgage-backed securities |
|
|
|
| ||||||||
Due within 1 year | $ | - | | $ | - | | $ | - | | $ | - | |
After 1 but within 5 years | 8 | | 8 | | - | | - | | ||||
After 5 but within 10 years | 821 | | 827 | | 863 | | 869 | | ||||
After 10 years (1) | 16,811 | | 17,045 | | 9,846 | | 10,303 | | ||||
Total | $ | 17,640 | | $ | 17,880 | | $ | 10,709 | | $ | 11,172 | |
State and municipal |
|
|
|
| ||||||||
Due within 1 year | $ | 266 | | $ | 265 | | $ | 205 | | $ | 205 | |
After 1 but within 5 years | 294 | | 295 | | 243 | | 243 | | ||||
After 5 but within 10 years | 172 | | 176 | | 140 | | 144 | | ||||
After 10 years (1) | 7,528 | | 7,513 | | 7,361 | | 7,527 | | ||||
Total | $ | 8,260 | | $ | 8,249 | | $ | 7,949 | | $ | 8,119 | |
Foreign government |
|
|
|
| ||||||||
Due within 1 year | $ | - | | $ | - | | $ | - | | $ | - | |
After 1 but within 5 years | 3,945 | | 3,987 | | 4,725 | | 4,802 | | ||||
After 5 but within 10 years | - | | - | | - | | - | | ||||
After 10 years (1) | - | | - | | - | | - | | ||||
Total | $ | 3,945 | | $ | 3,987 | | $ | 4,725 | | $ | 4,802 | |
All other (2) |
|
|
|
| ||||||||
Due within 1 year | $ | - | | $ | - | | $ | - | | $ | - | |
After 1 but within 5 years | - | | - | | - | | - | | ||||
After 5 but within 10 years | - | | - | | - | | - | | ||||
After 10 years (1) | 321 | | 367 | | 538 | | 578 | | ||||
Total | $ | 321 | | $ | 367 | | $ | 538 | | $ | 578 | |
Total debt securities held-to-maturity | $ | 30,166 | | $ | 30,483 | | $ | 23,921 | | $ | 24,671 | |
(1) | Investments with no stated maturities are included as contractual maturities of greater than 10 years. Actual maturities may differ due to call or prepayment rights. |
(2) | Includes corporate and asset-backed securities. |
136
Evaluating Investments for Other-Than-Temporary Impairment
Overview
The Company conducts periodic reviews of all securities with unrealized losses to evaluate whether the impairment is other-than-temporary.
An unrealized loss exists when the current fair value of an individual security is less than its amortized cost basis. Unrealized losses that are determined to be temporary in nature are recorded, net of tax, in AOCI for AFS securities. Losses related to HTM securities generally are not recorded, as these investments are carried at adjusted amortized cost basis. However, for HTM securities with credit-related losses, the credit loss is recognized in earnings as OTTI and any difference between the cost basis adjusted for the OTTI and fair value is recognized in AOCI and amortized as an adjustment of yield over the remaining contractual life of the security. For securities transferred to HTM from Trading account assets , amortized cost is defined as the fair value of the securities at the date of transfer, plus any accretion income and less any impairment recognized in earnings subsequent to transfer. For securities transferred to HTM from AFS, amortized cost is defined as the original purchase cost, adjusted for the cumulative accretion or amortization of any purchase discount or premium, plus or minus any cumulative fair value hedge adjustments, net of accretion or amortization, and less any impairment recognized in earnings.
Regardless of the classification of the securities as AFS or HTM, the Company assesses each position with an unrealized loss for OTTI. Factors considered in determining whether a loss is temporary include:
• | the length of time and the extent to which fair value has been below cost; |
• | the severity of the impairment; |
• | the cause of the impairment and the financial condition and near-term prospects of the issuer; |
• | activity in the market of the issuer that may indicate adverse credit conditions; and |
• | the Company's ability and intent to hold the investment for a period of time sufficient to allow for any anticipated recovery. |
The Company's review for impairment generally entails:
• | identification and evaluation of impaired investments; |
• | analysis of individual investments that have fair values less than amortized cost, including consideration of the length of time the investment has been in an unrealized loss position and the expected recovery period; |
• | consideration of evidential matter, including an evaluation of factors or triggers that could cause individual investments to qualify as having other-than-temporary impairment and those that would not support other-than-temporary impairment; and |
• | documentation of the results of these analyses, as required under business policies. |
Debt
The entire difference between amortized cost basis and fair value is recognized in earnings as OTTI for impaired debt securities that the Company has an intent to sell or for which the Company believes it will more-likely-than-not be required to sell prior to recovery of the amortized cost basis. However, for those securities that the Company does not intend to sell and is not likely to be required to sell, only the credit-related impairment is recognized in earnings and any non-credit-related impairment is recorded in AOCI.
For debt securities, credit impairment exists where management does not expect to receive contractual principal and interest cash flows sufficient to recover the entire amortized cost basis of a security.
Equity
For equity securities, management considers the various factors described above, including its intent and ability to hold the equity security for a period of time sufficient for recovery to cost or whether it is more-likely-than-not that the Company will be required to sell the security prior to recovery of its cost basis. Where management lacks that intent or ability, the security's decline in fair value is deemed to be other-than-temporary and is recorded in earnings. AFS equity securities deemed to be other-than-temporarily impaired are written down to fair value, with the full difference between fair value and cost recognized in earnings.
Management assesses equity method investments that have fair values that are less than their respective carrying values for OTTI. Fair value is measured as price multiplied by quantity if the investee has publicly listed securities. If the investee is not publicly listed, other methods are used (see Note 22 to the Consolidated Financial Statements).
For impaired equity method investments that Citi plans to sell prior to recovery of value or would likely be required to sell, with no expectation that the fair value will recover prior to the expected sale date, the full impairment is recognized in earnings as OTTI regardless of severity and duration. The measurement of the OTTI does not include partial projected recoveries subsequent to the balance sheet date.
For impaired equity method investments that management does not plan to sell and is not likely to be required to sell prior to recovery of value, the evaluation of whether an impairment is other-than-temporary is based on (i) whether and when an equity method investment will recover in value and (ii) whether the investor has the intent and ability to hold that investment for a period of time sufficient to recover the value. The determination of whether the impairment is considered other-than-temporary considers the following indicators, regardless of the time and extent of impairment:
• | the cause of the impairment and the financial condition and near-term prospects of the issuer, including any specific events that may influence the operations of the issuer; |
• | the intent and ability to hold the investment for a period of time sufficient to allow for any anticipated recovery in market value; and |
137
• | the length of time and extent to which fair value has been less than the carrying value. |
The sections below describe the Company's process for identifying credit-related impairments for security types that have the most significant unrealized losses as of June 30, 2015 .
Akbank
As of December 31, 2014, Citi's remaining 9.9% stake in Akbank T.A.S., an equity investment in Turkey (Akbank), is recorded within marketable equity securities available-for-sale. The revaluation of the Turkish lira was hedged, so the change in the value of the currency related to the Akbank investment did not have a significant impact on earnings during the year. During the first quarter of 2015, Citi sold its remaining investment in Akbank.
Mortgage-backed securities
For U.S. mortgage-backed securities (and in particular for Alt-A and other mortgage-backed securities that have significant unrealized losses as a percentage of amortized cost), credit impairment is assessed using a cash flow model that estimates the principal and interest cash flows on the underlying mortgages using the security-specific collateral and transaction structure. The model distributes the estimated cash flows to the various tranches of securities, considering the transaction structure and any subordination and credit enhancements that exist in that structure. The cash flow model incorporates actual cash flows on the mortgage-backed securities through the current period and then estimates the remaining cash flows using a number of assumptions, including default rates, prepayment rates, recovery rates (on foreclosed properties) and loss severity rates (on non-agency mortgage-backed securities).
Management develops specific assumptions using market data, internal estimates and estimates published by rating agencies and other third-party sources. Default rates are projected by considering current underlying mortgage loan
performance, generally assuming the default of (i) 10% of current loans, (ii) 25% of 30 -59 day delinquent loans, (iii) 70% of 60 -90 day delinquent loans and (iv) 100% of 91 + day delinquent loans. These estimates are extrapolated along a default timing curve to estimate the total lifetime pool default rate. Other assumptions contemplate the actual collateral attributes, including geographic concentrations, rating actions and current market prices.
Cash flow projections are developed using different stress test scenarios. Management evaluates the results of those stress tests (including the severity of any cash shortfall indicated and the likelihood of the stress scenarios actually occurring based on the underlying pool's characteristics and performance) to assess whether management expects to recover the amortized cost basis of the security. If cash flow projections indicate that the Company does not expect to recover its amortized cost basis, the Company recognizes the estimated credit loss in earnings.
State and municipal securities
The process for identifying credit impairments in Citigroup's AFS and HTM state and municipal bonds is primarily based on a credit analysis that incorporates third-party credit ratings. Citigroup monitors the bond issuers and any insurers providing default protection in the form of financial guarantee insurance. The average external credit rating, ignoring any insurance, is Aa3/AA-. In the event of an external rating downgrade or other indicator of credit impairment (i.e., based on instrument-specific estimates of cash flows or probability of issuer default), the subject bond is specifically reviewed for adverse changes in the amount or timing of expected contractual principal and interest payments.
For state and municipal bonds with unrealized losses that Citigroup plans to sell (for AFS only), would be more likely than not required to sell (for AFS only) or will be subject to an issuer call deemed probable of exercise prior to the expected recovery of its amortized cost basis (for AFS and HTM), the full impairment is recognized in earnings.
Recognition and Measurement of OTTI
The following table presents the total OTTI recognized in earnings for the three and six months ended June 30, 2015 :
OTTI on Investments and Other Assets | Three Months Ended | Six Months Ended | ||||||||||||||||||||||
In millions of dollars | AFS (1) | HTM | Other Assets | Total | AFS (1) | HTM | Other Assets | Total | ||||||||||||||||
Impairment losses related to securities that the Company does not intend to sell nor will likely be required to sell: |
|
|
|
|
|
|
|
| ||||||||||||||||
Total OTTI losses recognized during the period | $ | - | | $ | - | | $ | - | | $ | - | | $ | - | | $ | - | | $ | - | | $ | - | |
Less: portion of impairment loss recognized in AOCI (before taxes) | - | | - | | - | | - | | - | | - | | - | | - | | ||||||||
Net impairment losses recognized in earnings for securities that the Company does not intend to sell nor will likely be required to sell | $ | - | | $ | - | | $ | - | | $ | - | | $ | - | | $ | - | | $ | - | | $ | - | |
Impairment losses recognized in earnings for securities that the Company intends to sell, would be more likely than not required to sell or will be subject to an issuer call deemed probable of exercise | 19 | | 19 | | 5 | | 43 | | 88 | | 22 | | 5 | | 115 | | ||||||||
Total impairment losses recognized in earnings | $ | 19 | | $ | 19 | | $ | 5 | | $ | 43 | | $ | 88 | | $ | 22 | | $ | 5 | | $ | 115 | |
(1) | Includes OTTI on non-marketable equity securities. |
138
The following table presents the total OTTI recognized in earnings for the three and six months ended June 30, 2014 :
OTTI on Investments and Other Assets | Three Months Ended | Six Months Ended | ||||||||||||||||||||||
In millions of dollars | AFS (1) | HTM | Other | Total | AFS (1) | HTM | Other | Total | ||||||||||||||||
Impairment losses related to securities that the Company does not intend to sell nor will likely be required to sell: |
|
|
|
|
|
|
|
| ||||||||||||||||
Total OTTI losses recognized during the period | $ | 2 | | $ | - | | $ | - | | $ | 2 | | $ | 2 | | $ | - | | $ | - | | $ | 2 | |
Less: portion of impairment loss recognized in AOCI (before taxes) | - | | - | | - | | - | | - | | - | | - | | - | | ||||||||
Net impairment losses recognized in earnings for securities that the Company does not intend to sell nor will likely be required to sell | $ | 2 | | $ | - | | $ | - | | $ | 2 | | $ | 2 | | $ | - | | $ | - | | $ | 2 | |
Impairment losses recognized in earnings for securities that the Company intends to sell, would be more likely than not required to sell or will be subject to an issuer call deemed probable of exercise | 35 | | - | | - | | 35 | | 236 | | - | | - | | 236 | | ||||||||
Total impairment losses recognized in earnings | $ | 37 | | $ | - | | $ | - | | $ | 37 | | $ | 238 | | $ | - | | $ | - | | $ | 238 | |
(1) | Includes OTTI on non-marketable equity securities. |
The following is a three-month roll-forward of the credit-related impairments recognized in earnings for AFS and HTM debt securities held as of June 30, 2015 that the Company does not intend to sell nor likely will be required to sell:
| Cumulative OTTI credit losses recognized in earnings on securities still held | ||||||||||||||
In millions of dollars | Mar. 31, 2015 balance | Credit | Credit | Reductions due to | Jun. 30, 2015 balance | ||||||||||
AFS debt securities |
|
|
|
|
| ||||||||||
Mortgage-backed securities | $ | 295 | | $ | - | | $ | - | | $ | - | | $ | 295 | |
Foreign government securities | 170 | | - | | - | | - | | 170 | | |||||
Corporate | 112 | | - | | - | | - | | 112 | | |||||
All other debt securities | 149 | | - | | - | | - | | 149 | | |||||
Total OTTI credit losses recognized for AFS debt securities | $ | 726 | | $ | - | | $ | - | | $ | - | | $ | 726 | |
HTM debt securities |
|
|
|
|
| ||||||||||
Mortgage-backed securities (1) | $ | 668 | | $ | - | | $ | - | | $ | - | | $ | 668 | |
Corporate | - | | - | | - | | - | | - | | |||||
All other debt securities | 133 | | - | | - | | - | | 133 | | |||||
Total OTTI credit losses recognized for HTM debt securities | $ | 801 | | $ | - | | $ | - | | $ | - | | $ | 801 | |
(1) | Primarily consists of Alt-A securities. |
139
The following is a three-month roll-forward of the credit-related impairments recognized in earnings for AFS and HTM debt securities held as of June 30, 2014 that the Company does not intend to sell nor likely will be required to sell:
| Cumulative OTTI credit losses recognized in earnings on securities still held | ||||||||||||||
In millions of dollars | Mar. 31, 2014 balance | Credit impairments recognized in earnings on securities not previously impaired | Credit impairments recognized in earnings on securities that have been previously impaired | Reductions due to credit-impaired securities sold, transferred or matured | Jun. 30, 2014 balance | ||||||||||
AFS debt securities |
|
|
|
|
| ||||||||||
Mortgage-backed securities | $ | 295 | | $ | - | | $ | - | | $ | - | | $ | 295 | |
Foreign government securities | 171 | | - | | - | | - | | 171 | | |||||
Corporate | 113 | | - | | - | | (1 | ) | 112 | | |||||
All other debt securities | 144 | | 2 | | - | | - | | 146 | | |||||
Total OTTI credit losses recognized for AFS debt securities | $ | 723 | | $ | 2 | | $ | - | | $ | (1 | ) | $ | 724 | |
HTM debt securities |
|
|
|
|
| ||||||||||
Mortgage-backed securities (1) | $ | 665 | | $ | - | | $ | - | | $ | - | | $ | 665 | |
Corporate | 56 | | - | | - | | - | | 56 | | |||||
All other debt securities | 133 | | - | | - | | - | | 133 | | |||||
Total OTTI credit losses recognized for HTM debt securities | $ | 854 | | $ | - | | $ | - | | $ | - | | $ | 854 | |
(1) Primarily consists of Alt-A securities.
The following is a six-month roll-forward of the credit-related impairments recognized in earnings for AFS and HTM debt securities held as of June 30, 2015 that the Company does not intend to sell nor likely will be required to sell:
| Cumulative OTTI credit losses recognized in earnings on securities still held | ||||||||||||||
In millions of dollars | Dec. 31, 2014 balance | Credit | Credit | Reductions due to | June 30, 2015 balance | ||||||||||
AFS debt securities |
|
|
|
|
| ||||||||||
Mortgage-backed securities | $ | 295 | | $ | - | | $ | - | | $ | - | | $ | 295 | |
Foreign government securities | 171 | | - | | - | | (1 | ) | 170 | | |||||
Corporate | 118 | | - | | - | | (6 | ) | 112 | | |||||
All other debt securities | 149 | | - | | - | | - | | 149 | | |||||
Total OTTI credit losses recognized for AFS debt securities | $ | 733 | | $ | - | | $ | - | | $ | (7 | ) | $ | 726 | |
HTM debt securities |
|
|
|
|
| ||||||||||
Mortgage-backed securities (1) | $ | 670 | | $ | - | | $ | - | | $ | (2 | ) | $ | 668 | |
Corporate | - | | - | | - | | - | | - | | |||||
All other debt securities | 133 | | - | | - | | - | | 133 | | |||||
Total OTTI credit losses recognized for HTM debt securities | $ | 803 | | $ | - | | $ | - | | $ | (2 | ) | $ | 801 | |
(1) | Primarily consists of Alt-A securities. |
140
The following is a six-month roll-forward of the credit-related impairments recognized in earnings for AFS and HTM debt securities held as of June 30, 2014 that the Company does not intend to sell nor likely will be required to sell:
| Cumulative OTTI credit losses recognized in earnings on securities still held | ||||||||||||||
In millions of dollars | Dec. 31, 2013 balance | Credit | Credit | Reductions due to | Jun. 30, 2014 balance | ||||||||||
AFS debt securities |
|
|
|
|
| ||||||||||
Mortgage-backed securities | $ | 295 | | $ | - | | $ | - | | $ | - | | $ | 295 | |
Foreign government securities | 171 | | - | | - | | - | | 171 | | |||||
Corporate | 113 | | - | | - | | (1 | ) | 112 | | |||||
All other debt securities | 144 | | 2 | | - | | - | | 146 | | |||||
Total OTTI credit losses recognized for AFS debt securities | $ | 723 | | $ | 2 | | $ | - | | $ | (1 | ) | $ | 724 | |
HTM debt securities |
|
|
|
|
| ||||||||||
Mortgage-backed securities (1) | $ | 678 | | $ | - | | $ | - | | $ | (13 | ) | $ | 665 | |
Corporate | 56 | | - | | - | | - | | 56 | | |||||
All other debt securities | 133 | | - | | - | | - | | 133 | | |||||
Total OTTI credit losses recognized for HTM debt securities | $ | 867 | | $ | - | | $ | - | | $ | (13 | ) | $ | 854 | |
(1) Primarily consists of Alt-A securities.
141
Investments in Alternative Investment Funds That Calculate Net Asset Value per Share
The Company holds investments in certain alternative investment funds that calculate net asset value (NAV) per share, including hedge funds, private equity funds, funds of funds and real estate funds. The Company's investments include co-investments in funds that are managed by the Company and investments in funds that are managed by third parties. Investments in funds are generally classified as non-marketable equity securities carried at fair value. The fair values of these investments are estimated using the NAV per share of the Company's ownership interest in the funds, where it is not probable that the Company will sell an investment at a price other than the NAV.
| Fair value | Unfunded | Redemption frequency (if currently eligible) monthly, quarterly, annually | Redemption notice period | ||||||||||
In millions of dollars | June 30, 2015 | December 31, 2014 | June 30, 2015 | December 31, 2014 |
|
| ||||||||
Hedge funds | $ | 4 | | $ | 8 | | $ | - | | $ | - | | Generally quarterly | 10-95 days |
Private equity funds (1)(2) | 849 | | 891 | | 188 | | 205 | | - | - | ||||
Real estate funds (2)(3) | 144 | | 166 | | 20 | | 24 | | - | - | ||||
Total (4) | $ | 997 | | $ | 1,065 | | $ | 208 | | $ | 229 | | - | - |
(1) | Private equity funds include funds that invest in infrastructure, leveraged buyout transactions, emerging markets and venture capital. |
(2) | With respect to the Company's investments in private equity funds and real estate funds, distributions from each fund will be received as the underlying assets held by these funds are liquidated. It is estimated that the underlying assets of these funds will be liquidated over a period of several years as market conditions allow. Private equity and real estate funds do not allow redemption of investments by their investors. Investors are permitted to sell or transfer their investments, subject to the approval of the general partner or investment manager of these funds, which generally may not be unreasonably withheld. |
(3) | Includes several real estate funds that invest primarily in commercial real estate in the U.S., Europe and Asia. |
(4) | Included in the total fair value of investments above are $1.0 billion and $0.8 billion of fund assets that are valued using NAVs provided by third-party asset managers as of June 30, 2015 and December 31, 2014 , respectively. |
142
14 . LOANS
Citigroup loans are reported in two categories-consumer and corporate. These categories are classified primarily according to the segment and subsegment that manage the loans.
Consumer Loans
Consumer loans represent loans and leases managed primarily by the Global Consumer Banking businesses in Citicorp and in Citi Holdings. The following table provides information by loan type for the periods indicated:
In millions of dollars | June 30, | December 31, 2014 | ||||
Consumer loans |
|
| ||||
In U.S. offices |
|
| ||||
Mortgage and real estate (1) | $ | 90,715 | | $ | 96,533 | |
Installment, revolving credit, and other | 4,956 | | 14,450 | | ||
Cards | 107,096 | | 112,982 | | ||
Commercial and industrial | 6,493 | | 5,895 | | ||
| $ | 209,260 | | $ | 229,860 | |
In offices outside the U.S. |
| | ||||
Mortgage and real estate (1) | $ | 50,704 | | $ | 54,462 | |
Installment, revolving credit, and other | 30,958 | | 31,128 | | ||
Cards | 28,662 | | 32,032 | | ||
Commercial and industrial | 22,953 | | 22,561 | | ||
Lease financing | 493 | | 609 | | ||
| $ | 133,770 | | $ | 140,792 | |
Total Consumer loans | $ | 343,030 | | $ | 370,652 | |
Net unearned income | (681 | ) | (682 | ) | ||
Consumer loans, net of unearned income | $ | 342,349 | | $ | 369,970 | |
(1) | Loans secured primarily by real estate. |
Citigroup has established a risk management process to monitor, evaluate and manage the principal risks associated with its consumer loan portfolio. Credit quality indicators that are actively monitored include delinquency status, consumer credit scores (FICO), and loan to value (LTV) ratios, each as discussed in more detail below.
Included in the loan table above are lending products whose terms may give rise to greater credit issues. Credit cards with below-market introductory interest rates and interest-only loans are examples of such products. These products are closely managed using credit techniques that are intended to mitigate their higher inherent risk.
During the three and six months ended June 30, 2015 and 2014 , the Company sold and/or reclassified to held-for-sale $1.5 billion and $14.6 billion , and $3.4 billion and $3.8 billion respectively, of consumer loans. The Company did not have significant purchases of consumer loans during the three and six months ended June 30, 2015 and 2014 .
Delinquency Status
Delinquency status is monitored and considered a key indicator of credit quality of consumer loans. Principally the U.S. residential first mortgage loans use the Mortgage Banking Association (MBA) method of reporting delinquencies, which considers a loan delinquent if a monthly payment has not been received by the end of the day immediately preceding the loan's next due date. All other loans use a method of reporting delinquencies, which considers a loan delinquent if a monthly payment has not been received by the close of business on the loan's next due date.
As a general policy, residential first mortgages, home equity loans and installment loans are classified as non-accrual when loan payments are 90 days contractually past due. Credit cards and unsecured revolving loans generally accrue interest until payments are 180 days past due. Home equity loans in regulated bank entities are classified as non-accrual if the related residential first mortgage is 90 days or more past due. Mortgage loans in regulated bank entities discharged through Chapter 7 bankruptcy, other than Federal Housing Administration (FHA)-insured loans, are classified as non-accrual. Commercial market loans are placed on a cash (non-accrual) basis when it is determined, based on actual experience and a forward-looking assessment of the collectability of the loan in full, that the payment of interest or principal is doubtful or when interest or principal is 90 days past due.
The policy for re-aging modified U.S. consumer loans to current status varies by product. Generally, one of the conditions to qualify for these modifications is that a minimum number of payments (typically ranging from one to three ) be made. Upon modification, the loan is re-aged to current status. However, re-aging practices for certain open-ended consumer loans, such as credit cards, are governed by Federal Financial Institutions Examination Council (FFIEC) guidelines. For open-ended consumer loans subject to FFIEC guidelines, one of the conditions for the loan to be re-aged to current status is that at least three consecutive minimum monthly payments, or the equivalent amount, must be received. In addition, under FFIEC guidelines, the number of times that such a loan can be re-aged is subject to limitations (generally once in 12 months and twice in five years). Furthermore, FHA and Department of Veterans Affairs (VA) loans are modified under those respective agencies' guidelines and payments are not always required in order to re-age a modified loan to current.
The following tables provide details on Citigroup's consumer loan delinquency and non-accrual loans as of June 30, 2015 and December 31, 2014 :
In millions of dollars | Total current (1)(2) | 30-89 days past due (3) | ≥ 90 days past due (3) | Past due government guaranteed (4) | Total loans (2) | Total non-accrual | 90 days past due and accruing | ||||||||||||||
In North America offices |
|
|
|
|
|
|
| ||||||||||||||
Residential first mortgages | $ | 59,431 | | $ | 964 | | $ | 1,054 | | $ | 2,557 | | $ | 64,006 | | $ | 2,551 | | $ | 2,161 | |
Home equity loans (5) | 22,374 | | 284 | | 479 | | - | | 23,137 | | 1,171 | | - | | |||||||
Credit cards | 105,569 | | 1,114 | | 1,062 | | - | | 107,745 | | - | | 1,062 | | |||||||
Installment and other | 7,247 | | 60 | | 40 | | - | | 7,347 | | 43 | | 4 | | |||||||
Commercial market loans | 8,463 | | 21 | | 39 | | - | | 8,523 | | 161 | | 9 | | |||||||
Total | $ | 203,084 | | $ | 2,443 | | $ | 2,674 | | $ | 2,557 | | $ | 210,758 | | $ | 3,926 | | $ | 3,236 | |
In offices outside North America |
|
|
|
|
|
|
| ||||||||||||||
Residential first mortgages | $ | 41,818 | | $ | 271 | | $ | 183 | | $ | - | | $ | 42,272 | | $ | 410 | | $ | - | |
Home equity loans (5) | - | | - | | - | | - | | - | | - | | - | | |||||||
Credit cards | 28,461 | | 544 | | 497 | | - | | 29,502 | | 346 | | 303 | | |||||||
Installment and other | 28,706 | | 317 | | 136 | | - | | 29,159 | | 201 | | - | | |||||||
Commercial market loans | 30,160 | | 84 | | 184 | | - | | 30,428 | | 365 | | - | | |||||||
Total | $ | 129,145 | | $ | 1,216 | | $ | 1,000 | | $ | - | | $ | 131,361 | | $ | 1,322 | | $ | 303 | |
Total GCB and Citi Holdings Consumer | $ | 332,229 | | $ | 3,659 | | $ | 3,674 | | $ | 2,557 | | $ | 342,119 | | $ | 5,248 | | $ | 3,539 | |
Other (6) | 213 | | 9 | | 8 | | - | | 230 | | 31 | | - | | |||||||
Total Citigroup | $ | 332,442 | | $ | 3,668 | | $ | 3,682 | | $ | 2,557 | | $ | 342,349 | | $ | 5,279 | | $ | 3,539 | |
(1) | Loans less than 30 days past due are presented as current. |
(2) | Includes $39 million of residential first mortgages recorded at fair value. |
(3) | Excludes loans guaranteed by U.S. government-sponsored entities. |
(4) | Consists of residential first mortgages that are guaranteed by U.S. government-sponsored entities that are 30–89 days past due of $0.4 billion and 90 days past due of $2.2 billion . |
(5) | Fixed-rate home equity loans and loans extended under home equity lines of credit, which are typically in junior lien positions. |
(6) | Represents loans classified as Consumer loans on the Consolidated Balance Sheet that are not included in the Citi Holdings Consumer credit metrics. |
In millions of dollars | Total current (1)(2) | 30-89 days past due (3) | ≥ 90 days past due (3) | Past due government guaranteed (4) | Total loans (2) | Total non-accrual | 90 days past due and accruing | ||||||||||||||
In North America offices |
|
|
|
|
|
|
| ||||||||||||||
Residential first mortgages | $ | 61,730 | | $ | 1,280 | | $ | 1,371 | | $ | 3,443 | | $ | 67,824 | | $ | 2,746 | | $ | 2,759 | |
Home equity loans (5) | 27,262 | | 335 | | 520 | | - | | 28,117 | | 1,271 | | - | | |||||||
Credit cards | 111,441 | | 1,316 | | 1,271 | | - | | 114,028 | | - | | 1,273 | | |||||||
Installment and other | 12,361 | | 229 | | 284 | | - | | 12,874 | | 254 | | 3 | | |||||||
Commercial market loans | 8,630 | | 31 | | 13 | | - | | 8,674 | | 135 | | 15 | | |||||||
Total | $ | 221,424 | | $ | 3,191 | | $ | 3,459 | | $ | 3,443 | | $ | 231,517 | | $ | 4,406 | | $ | 4,050 | |
In offices outside North America |
|
|
|
|
|
|
| ||||||||||||||
Residential first mortgages | $ | 44,782 | | $ | 312 | | $ | 223 | | $ | - | | $ | 45,317 | | $ | 454 | | $ | - | |
Home equity loans (5) | - | | - | | - | | - | | - | | - | | - | | |||||||
Credit cards | 30,327 | | 602 | | 553 | | - | | 31,482 | | 413 | | 322 | | |||||||
Installment and other | 29,297 | | 328 | | 149 | | - | | 29,774 | | 216 | | - | | |||||||
Commercial market loans | 31,280 | | 86 | | 255 | | - | | 31,621 | | 405 | | - | | |||||||
Total | $ | 135,686 | | $ | 1,328 | | $ | 1,180 | | $ | - | | $ | 138,194 | | $ | 1,488 | | $ | 322 | |
Total GCB and Citi Holdings | $ | 357,110 | | $ | 4,519 | | $ | 4,639 | | $ | 3,443 | | $ | 369,711 | | $ | 5,894 | | $ | 4,372 | |
Other | 238 | | 10 | | 11 | | - | | 259 | | 30 | | - | | |||||||
Total Citigroup | $ | 357,348 | | $ | 4,529 | | $ | 4,650 | | $ | 3,443 | | $ | 369,970 | | $ | 5,924 | | $ | 4,372 | |
(1) | Loans less than 30 days past due are presented as current. |
(2) | Includes $43 million of residential first mortgages recorded at fair value. |
(3) | Excludes loans guaranteed by U.S. government-sponsored entities. |
(4) | Consists of residential first mortgages that are guaranteed by U.S. government-sponsored entities that are 30–89 days past due of $0.6 billion and 90 days past due of $2.8 billion . |
(5) | Fixed-rate home equity loans and loans extended under home equity lines of credit, which are typically in junior lien positions. |
Consumer Credit Scores (FICO)
In the U.S., independent credit agencies rate an individual's risk for assuming debt based on the individual's credit history and assign every consumer a "FICO" (Fair Isaac Corporation) credit score. These scores are continually updated by the agencies based upon an individual's credit actions (e.g., taking out a loan or missed or late payments).
The following tables provide details on the FICO scores attributable to Citi's U.S. consumer loan portfolio as of June 30, 2015 and December 31, 2014 (commercial market loans are not included in the table since they are business-based and FICO scores are not a primary driver in their credit evaluation). FICO scores are updated monthly for substantially all of the portfolio or, otherwise, on a quarterly basis, for the remaining portfolio.
FICO score distribution in U.S. portfolio (1)(2) | June 30, 2015 | ||||||||
In millions of dollars | Less than 620 | ≥ 620 but less than 660 | Equal to or greater than 660 | ||||||
Residential first mortgages | $ | 7,381 | | $ | 4,778 | | $ | 45,885 | |
Home equity loans | 2,891 | | 2,277 | | 19,614 | | |||
Credit cards | 6,853 | | 9,543 | | 88,141 | | |||
Installment and other | 330 | | 253 | | 2,570 | | |||
Total | $ | 17,455 | | $ | 16,851 | | $ | 156,210 | |
(1) | Excludes loans guaranteed by U.S. government entities, loans subject to long-term standby commitments (LTSCs) with U.S. government-sponsored entities and loans recorded at fair value. |
(2) | Excludes balances where FICO was not available. Such amounts are not material. |
FICO score distribution in U.S. portfolio (1)(2) | December 31, 2014 | ||||||||
In millions of dollars | Less than 620 | ≥ 620 but less than 660 | Equal to or greater than 660 | ||||||
Residential first mortgages | $ | 8,911 | | $ | 5,463 | | $ | 45,783 | |
Home equity loans | 3,257 | | 2,456 | | 20,957 | | |||
Credit cards | 7,647 | | 10,296 | | 92,877 | | |||
Installment and other | 4,015 | | 2,520 | | 5,150 | | |||
Total | $ | 23,830 | | $ | 20,735 | | $ | 164,767 | |
(1) | Excludes loans guaranteed by U.S. government entities, loans subject to LTSCs with U.S. government-sponsored entities and loans recorded at fair value. |
(2) | Excludes balances where FICO was not available. Such amounts are not material. |
Loan to Value (LTV) Ratios
LTV ratios (loan balance divided by appraised value) are calculated at origination and updated by applying market price data.
The following tables provide details on the LTV ratios attributable to Citi's U.S. consumer mortgage portfolios as of June 30, 2015 and December 31, 2014 . LTV ratios are updated monthly using the most recent Core Logic Home Price Index data available for substantially all of the portfolio applied at the Metropolitan Statistical Area level, if available, or the state level if not. The remainder of the portfolio is updated in a similar manner using the Federal Housing Finance Agency indices.
LTV distribution in U.S. portfolio (1)(2) | June 30, 2015 | ||||||||
In millions of dollars | Less than or equal to 80% | > 80% but less than or equal to 100% | Greater than 100% | ||||||
Residential first mortgages | $ | 48,757 | | $ | 7,466 | | $ | 1,960 | |
Home equity loans | 14,487 | | 6,279 | | 3,903 | | |||
Total | $ | 63,244 | | $ | 13,745 | | $ | 5,863 | |
(1) | Excludes loans guaranteed by U.S. government entities, loans subject to LTSCs with U.S. government-sponsored entities and loans recorded at fair value. |
(2) | Excludes balances where LTV was not available. Such amounts are not material. |
LTV distribution in U.S. portfolio (1)(2) | December 31, 2014 | ||||||||
In millions of dollars | Less than or equal to 80% | > 80% but less than or equal to 100% | Greater than 100% | ||||||
Residential first mortgages | $ | 48,163 | | $ | 9,480 | | $ | 2,670 | |
Home equity loans | 14,638 | | 7,267 | | 4,641 | | |||
Total | $ | 62,801 | | $ | 16,747 | | $ | 7,311 | |
(1) | Excludes loans guaranteed by U.S. government entities, loans subject to LTSCs with U.S. government-sponsored entities and loans recorded at fair value. |
(2) | Excludes balances where LTV was not available. Such amounts are not material. |
Impaired Consumer Loans
Impaired loans are those loans where Citigroup believes it is probable all amounts due according to the original contractual terms of the loan will not be collected. Impaired consumer loans include non-accrual commercial market loans, as well as smaller-balance homogeneous loans whose terms have been modified due to the borrower's financial difficulties and where Citigroup has granted a concession to the borrower. These modifications may include interest rate reductions and/or principal forgiveness. Impaired consumer loans exclude smaller-balance homogeneous loans that have not been modified and are carried on a non-accrual basis.
The following tables present information about total impaired consumer loans at and for the periods ended June 30, 2015 and December 31, 2014 , respectively, and for the three and six months ended June 30, 2015 and 2014 for interest income recognized on impaired consumer loans:
|
|
|
|
| Three Months Ended June 30, | Six months ended June 30, | ||||||||||||||||||
| Balance at June 30, 2015 | 2015 | 2014 | 2015 | 2014 | |||||||||||||||||||
In millions of dollars | Recorded investment (1)(2) | Unpaid principal balance | Related specific allowance (3) | Average carrying value (4) | Interest income recognized (5) | Interest income recognized (5) | Interest income recognized (5) | Interest income recognized (5) | ||||||||||||||||
Mortgage and real estate |
|
|
|
|
|
|
|
| ||||||||||||||||
Residential first mortgages | $ | 10,059 | | $ | 10,801 | | $ | 1,497 | | $ | 12,371 | | $ | 111 | | $ | 181 | | $ | 252 | | $ | 365 | |
Home equity loans | 1,912 | | 2,541 | | 582 | | 1,990 | | 17 | | 19 | | 34 | | 38 | | ||||||||
Credit cards | 2,118 | | 2,157 | | 740 | | 2,340 | | 45 | | 50 | | 89 | | 101 | | ||||||||
Installment and other |
|
|
|
|
|
| |
| ||||||||||||||||
Individual installment and other | 452 | | 469 | | 243 | | 700 | | 8 | | 29 | | 39 | | 63 | | ||||||||
Commercial market loans | 374 | | 589 | | 114 | | 387 | | 3 | | 4 | | 6 | | 15 | | ||||||||
Total | $ | 14,915 | | $ | 16,557 | | $ | 3,176 | | $ | 17,788 | | $ | 184 | | $ | 283 | | $ | 420 | | $ | 582 | |
(1) | Recorded investment in a loan includes net deferred loan fees and costs, unamortized premium or discount and direct write-downs and includes accrued interest only on credit card loans. |
(2) | $1,765 million of residential first mortgages, $513 million of home equity loans and $121 million of commercial market loans do not have a specific allowance. |
(3) Included in the Allowance for loan losses .
(4) Average carrying value represents the average recorded investment ending balance for the last four quarters and does not include the related specific allowance.
(5) Includes amounts recognized on both an accrual and cash basis.
| Balance at December 31, 2014 | |||||||||||
In millions of dollars | Recorded investment (1)(2) | Unpaid principal balance | Related specific allowance (3) | Average carrying value (4) | ||||||||
Mortgage and real estate |
|
|
|
| ||||||||
Residential first mortgages | $ | 13,551 | | $ | 14,387 | | $ | 1,909 | | $ | 15,389 | |
Home equity loans | 2,029 | | 2,674 | | 599 | | 2,075 | | ||||
Credit cards | 2,407 | | 2,447 | | 849 | | 2,732 | | ||||
Installment and other |
|
|
|
| ||||||||
Individual installment and other | 948 | | 963 | | 450 | | 975 | | ||||
Commercial market loans | 423 | | 599 | | 110 | | 381 | | ||||
Total | $ | 19,358 | | $ | 21,070 | | $ | 3,917 | | $ | 21,552 | |
(1) | Recorded investment in a loan includes net deferred loan fees and costs, unamortized premium or discount and direct write-downs and includes accrued interest only on credit card loans. |
(2) | $1,896 million of residential first mortgages, $554 million of home equity loans and $158 million of commercial market loans do not have a specific allowance. |
(3) | Included in the Allowance for loan losses . |
(4) | Average carrying value represents the average recorded investment ending balance for last four quarters and does not include the related specific allowance. |
Consumer Troubled Debt Restructurings
The following tables present consumer TDRs occurring during the three and six months ended June 30, 2015 and 2014 :
| At and for the three months ended June 30, 2015 | |||||||||||||||
In millions of dollars except number of loans modified | Number of loans modified | Post- modification recorded investment (1)(2) | Deferred principal (3) | Contingent principal forgiveness (4) | Principal forgiveness (5) | Average interest rate reduction | ||||||||||
North America |
|
|
|
|
|
| ||||||||||
Residential first mortgages | 2,709 | | $ | 366 | | $ | 2 | | $ | 1 | | $ | 8 | | 1 | % |
Home equity loans | 1,292 | | 45 | | - | | - | | 1 | | 2 | | ||||
Credit cards | 44,848 | | 184 | | - | | - | | - | | 16 | | ||||
Installment and other revolving | 1,092 | | 9 | | - | | - | | - | | 14 | | ||||
Commercial markets (6) | 99 | | 17 | | - | | - | | - | | - | | ||||
Total (7) | 50,040 | | $ | 621 | | $ | 2 | | $ | 1 | | $ | 9 | |
| |
International |
|
|
|
|
|
| ||||||||||
Residential first mortgages | 742 | | $ | 23 | | $ | - | | $ | - | | $ | - | | - | % |
Home equity loans | 16 | | 2 | | - | | - | | - | | - | | ||||
Credit cards | 37,587 | | 103 | | - | | - | | 2 | | 12 | | ||||
Installment and other revolving | 13,167 | | 61 | | - | | - | | 2 | | 6 | | ||||
Commercial markets (6) | 53 | | 23 | | - | | - | | - | | 1 | | ||||
Total (7) | 51,565 | | $ | 212 | | $ | - | | $ | - | | $ | 4 | |
| |
| At and for the three months ended June 30, 2014 | |||||||||||||||
In millions of dollars except number of loans modified | Number of loans modified | Post- modification recorded investment (1)(8) | Deferred principal (3) | Contingent principal forgiveness (4) | Principal forgiveness (5) | Average interest rate reduction | ||||||||||
North America |
|
|
|
|
|
| ||||||||||
Residential first mortgages | 4,723 | | $ | 555 | | $ | 10 | | $ | 7 | | $ | 2 | | 1 | % |
Home equity loans | 1,883 | | 69 | | 1 | | - | | 2 | | 3 | | ||||
Credit cards | 42,750 | | 190 | | - | | - | | - | | 15 | | ||||
Installment and other revolving | 10,830 | | 81 | | - | | - | | - | | 6 | | ||||
Commercial markets (6) | 53 | | 9 | | - | | - | | - | | - | | ||||
Total (7) | 60,239 | | $ | 904 | | $ | 11 | | $ | 7 | | $ | 4 | |
| |
International |
|
|
|
|
|
| ||||||||||
Residential first mortgages | 746 | | $ | 27 | | $ | - | | $ | - | | $ | - | | 1 | % |
Home equity loans | 6 | | 1 | | - | | - | | - | | - | | ||||
Credit cards | 31,763 | | 112 | | - | | - | | 2 | | 14 | | ||||
Installment and other revolving | 14,219 | | 72 | | - | | - | | 2 | | 13 | | ||||
Commercial markets (6) | 124 | | 41 | | - | | - | | - | | 1 | | ||||
Total (7) | 46,858 | | $ | 253 | | $ | - | | $ | - | | $ | 4 | |
| |
(1) | Post-modification balances include past due amounts that are capitalized at the modification date. |
(2) | Post-modification balances in North America include $ 62 million of residential first mortgages and $ 15 million of home equity loans to borrowers who have gone through Chapter 7 bankruptcy in the three months ended June 30, 2015 . These amounts include $ 35 million of residential first mortgages and $ 12 million of home equity loans that were newly classified as TDRs in the three months ended June 30, 2015 as a result of OCC guidance, as described above. |
(3) | Represents portion of contractual loan principal that is non-interest bearing but still due from the borrower. Such deferred principal is charged off at the time of permanent modification to the extent that the related loan balance exceeds the underlying collateral value. |
(4) | Represents portion of contractual loan principal that is non-interest bearing and, depending upon borrower performance, eligible for forgiveness. |
(5) | Represents portion of contractual loan principal that was forgiven at the time of permanent modification. |
(6) Commercial markets loans are generally borrower-specific modifications and incorporate changes in the amount and/or timing of principal and/or interest.
(7) The above tables reflect activity for loans outstanding as of the end of the reporting period that were considered TDRs.
(8) Post-modification balances in North America include $ 75 million of residential first mortgages and $ 21 million of home equity loans to borrowers who have gone through Chapter 7 bankruptcy in the three months ended June 30, 2014 . These amounts include $ 42 million of residential first mortgages and $ 18 million of home equity loans that were newly classified as TDRs in the three months ended June 30, 2014 as a result of OCC guidance, as described above.
| At and for the six months ended June 30, 2015 | |||||||||||||||
In millions of dollars except number of loans modified | Number of loans modified | Post- modification recorded investment (1)(2) | Deferred principal (3) | Contingent principal forgiveness (4) | Principal forgiveness (5) | Average interest rate reduction | ||||||||||
North America |
|
|
|
|
|
| ||||||||||
Residential first mortgages | 5,802 | | $ | 773 | | $ | 6 | | $ | 3 | | $ | 17 | | 1 | % |
Home equity loans | 2,550 | | 90 | | 1 | | - | | 2 | | 2 | | ||||
Credit cards | 95,158 | | 396 | | - | | - | | - | | 16 | | ||||
Installment and other revolving | 2,076 | | 18 | | - | | - | | - | | 13 | | ||||
Commercial markets (6) | 156 | | 28 | | - | | - | | - | | - | | ||||
Total (8) | 105,742 | | $ | 1,305 | | $ | 7 | | $ | 3 | | $ | 19 | |
| |
International |
|
|
|
|
|
| ||||||||||
Residential first mortgages | 1,611 | | $ | 44 | | $ | - | | $ | - | | $ | - | | - | % |
Home equity loans | 30 | | 5 | | - | | - | | - | | - | | ||||
Credit cards | 78,018 | | 201 | | - | | - | | 4 | | 13 | | ||||
Installment and other revolving | 29,114 | | 131 | | - | | - | | 4 | | 5 | | ||||
Commercial markets (6) | 136 | | 51 | | - | | - | | - | | 2 | | ||||
Total (8) | 108,909 | | $ | 432 | | $ | - | | $ | - | | $ | 8 | |
| |
| At and for the six months ended June 30, 2014 | |||||||||||||||
In millions of dollars except number of loans modified | Number of loans modified | Post- modification recorded investment (1)(7) | Deferred principal (3) | Contingent principal forgiveness (4) | Principal forgiveness (5) | Average interest rate reduction | ||||||||||
North America |
|
|
|
|
|
| ||||||||||
Residential first mortgages | 10,502 | | $ | 1,240 | | $ | 28 | | $ | 19 | | $ | 6 | | 1 | % |
Home equity loans | 4,202 | | 153 | | 2 | | - | | 11 | | 2 | | ||||
Credit cards | 87,726 | | 390 | | - | | - | | - | | 15 | | ||||
Installment and other revolving | 24,666 | | 182 | | - | | - | | - | | 6 | | ||||
Commercial markets (6) | 91 | | 22 | | - | | - | | - | | - | | ||||
Total (8) | 127,187 | | $ | 1,987 | | $ | 30 | | $ | 19 | | $ | 17 | |
| |
International |
|
|
|
|
|
| ||||||||||
Residential first mortgages | 1,292 | | $ | 49 | | $ | - | | $ | - | | $ | 1 | | 1 | % |
Home equity loans | 38 | | 6 | | - | | - | | - | | - | | ||||
Credit cards | 68,869 | | 234 | | - | | - | | 4 | | 14 | | ||||
Installment and other revolving | 29,081 | | 146 | | - | | - | | 3 | | 10 | | ||||
Commercial markets (6) | 220 | | 134 | | - | | - | | - | | 1 | | ||||
Total (8) | 99,500 | | $ | 569 | | $ | - | | $ | - | | $ | 8 | |
| |
(1) | Post-modification balances include past due amounts that are capitalized at modification date. |
(2) | Post-modification balances in North America include $ 127 million of residential first mortgages and $ 29 million of home equity loans to borrowers who have gone through Chapter 7 bankruptcy in the six months ended June 30, 2015 . These amounts include $ 73 million of residential first mortgages and $ 24 million of home equity loans that are newly classified as TDRs as a result of OCC guidance received in the six months ended June 30, 2015 , as described above. |
(3) | Represents portion of contractual loan principal that is non-interest bearing but still due from the borrower. Such deferred principal is charged off at the time of permanent modification to the extent that the related loan balance exceeds the underlying collateral value. |
(4) | Represents portion of contractual loan principal that is non-interest bearing and, depending upon borrower performance, eligible for forgiveness. |
(5) | Represents portion of contractual loan principal that was forgiven at the time of permanent modification. |
(6) Commercial markets loans are generally borrower-specific modifications and incorporate changes in the amount and/or timing of principal and/or interest.
(7) Post-modification balances in North America include $ 166 million of residential first mortgages and $ 43 million of home equity loans to borrowers who have gone through Chapter 7 bankruptcy in the six months ended June 30, 2014 . These amounts include $ 99 million of residential first mortgages and $ 37 million of home equity loans that are newly classified as TDRs as a result of OCC guidance received in the six months ended June 30, 2014 , as described above.
(8) The above tables reflect activity for loans outstanding as of the end of the reporting period that were considered TDRs.
The following table presents consumer TDRs that defaulted during the three and six months ended June 30, 2015 and 2014 , respectively, for which the payment default occurred within one year of a permanent modification. Default is defined as 60 days past due, except for classifiably managed commercial markets loans, where default is defined as 90 days past due.
| Three Months Ended June 30, | Six Months Ended June 30, | ||||||||||
In millions of dollars | 2015 | 2014 | 2015 | 2014 | ||||||||
North America |
|
|
|
| ||||||||
Residential first mortgages | $ | 117 | | $ | 168 | | $ | 227 | | $ | 413 | |
Home equity loans | 10 | | 17 | | 21 | | 40 | | ||||
Credit cards | 49 | | 48 | | 92 | | 99 | | ||||
Installment and other revolving | 2 | | 21 | | 3 | | 41 | | ||||
Commercial markets | 1 | | 1 | | 3 | | 7 | | ||||
Total | $ | 179 | | $ | 255 | | $ | 346 | | $ | 600 | |
International |
|
|
|
| ||||||||
Residential first mortgages | $ | 6 | | $ | 5 | | $ | 12 | | $ | 11 | |
Home equity loans | - | | - | | - | | - | | ||||
Credit cards | 36 | | 59 | | 71 | | 122 | | ||||
Installment and other revolving | 23 | | 28 | | 46 | | 56 | | ||||
Commercial markets | 7 | | 95 | | 17 | | 100 | | ||||
Total | $ | 72 | | $ | 187 | | $ | 146 | | $ | 289 | |
143
Corporate Loans
Corporate loans represent loans and leases managed by the Institutional Clients Group in Citicorp or, to a much lesser extent, in Citi Holdings. The following table presents information by corporate loan type as of June 30, 2015 and December 31, 2014 :
In millions of dollars | June 30, | December 31, | ||||
Corporate |
|
| ||||
In U.S. offices |
|
| ||||
Commercial and industrial | $ | 40,697 | | $ | 35,055 | |
Financial institutions | 37,360 | | 36,272 | | ||
Mortgage and real estate (1) | 34,680 | | 32,537 | | ||
Installment, revolving credit and other | 31,882 | | 29,207 | | ||
Lease financing | 1,707 | | 1,758 | | ||
| $ | 146,326 | | $ | 134,829 | |
In offices outside the U.S. |
|
| ||||
Commercial and industrial | $ | 83,184 | | $ | 79,239 | |
Financial institutions | 29,675 | | 33,269 | | ||
Mortgage and real estate (1) | 5,948 | | 6,031 | | ||
Installment, revolving credit and other | 20,214 | | 19,259 | | ||
Lease financing | 309 | | 356 | | ||
Governments and official institutions | 4,714 | | 2,236 | | ||
| $ | 144,044 | | $ | 140,390 | |
Total Corporate loans | $ | 290,370 | | $ | 275,219 | |
Net unearned income | (601 | ) | (554 | ) | ||
Corporate loans, net of unearned income | $ | 289,769 | | $ | 274,665 | |
(1) | Loans secured primarily by real estate. |
The Company sold and/or reclassified (to held-for-sale) $0.5 billion and $1.1 billion of corporate loans during the three and six months ended June 30, 2015 , respectively and
$1.4 billion and $2.5 billion during the three and six months
ended June 30, 2014, respectively. The Company did not have significant purchases of corporate loans classified as held-for-investment for the three and six months ended June 30, 2015 or 2014.
Corporate loans are identified as impaired and placed on a cash (non-accrual) basis when it is determined, based on actual experience and a forward-looking assessment of the collectability of the loan in full, that the payment of interest or principal is doubtful or when interest or principal is 90 days past due, except when the loan is well collateralized and in the process of collection. Any interest accrued on impaired corporate loans and leases is reversed at 90 days and charged against current earnings, and interest is thereafter included in earnings only to the extent actually received in cash. When there is doubt regarding the ultimate collectability of principal, all cash receipts are thereafter applied to reduce the recorded investment in the loan. While corporate loans are generally managed based on their internally assigned risk rating (see further discussion below), the following tables present delinquency information by corporate loan type as of June 30, 2015 and December 31, 2014 .
In millions of dollars | 30-89 days past due and accruing (1) | ≥ 90 days past due and accruing (1) | Total past due and accruing | Total non-accrual (2) | Total current (3) | Total loans (4) | ||||||||||||
Commercial and industrial | $ | 37 | | $ | 2 | | $ | 39 | | $ | 626 | | $ | 118,357 | | $ | 119,022 | |
Financial institutions | 14 | | - | | 14 | | 200 | | 65,750 | | 65,964 | | ||||||
Mortgage and real estate | 123 | | - | | 123 | | 247 | | 40,185 | | 40,555 | | ||||||
Leases | - | | - | | - | | 48 | | 1,968 | | 2,016 | | ||||||
Other | 54 | | 5 | | 59 | | 37 | | 55,608 | | 55,704 | | ||||||
Loans at fair value | | | | | | | | | | | 6,499 | | ||||||
Purchased distressed loans | | | | | | | | | | | 9 | | ||||||
Total | $ | 228 | | $ | 7 | | $ | 235 | | $ | 1,158 | | $ | 281,868 | | $ | 289,769 | |
(1) | Corporate loans that are 90 days past due are generally classified as non-accrual. Corporate loans are considered past due when principal or interest is contractually due but unpaid. |
(2) | Citi generally does not manage corporate loans on a delinquency basis. Non-accrual loans generally include those loans that are ≥ 90 days past due or those loans for which Citi believes, based on actual experience and a forward-looking assessment of the collectability of the loan in full, that the payment of interest or principal is doubtful. |
(3) | Corporate loans are past due when principal or interest is contractually due but unpaid. Loans less than 30 days past due are presented as current. |
(4) | Total loans include loans at fair value, which are not included in the various delinquency columns. |
144
In millions of dollars | 30-89 days past due and accruing (1) | ≥ 90 days past due and accruing (1) | Total past due and accruing | Total non-accrual (2) | Total current (3) | Total loans (4) | ||||||||||||
Commercial and industrial | $ | 50 | | $ | - | | $ | 50 | | $ | 575 | | $ | 109,764 | | $ | 110,389 | |
Financial institutions | 2 | | - | | 2 | | 250 | | 67,580 | | 67,832 | | ||||||
Mortgage and real estate | 86 | | - | | 86 | | 252 | | 38,135 | | 38,473 | | ||||||
Leases | - | | - | | - | | 51 | | 2,062 | | 2,113 | | ||||||
Other | 49 | | 1 | | 50 | | 55 | | 49,844 | | 49,949 | | ||||||
Loans at fair value | | | | | | | | | | | 5,858 | | ||||||
Purchased Distressed Loans | | | | | | | | | | | 51 | | ||||||
Total | $ | 187 | | $ | 1 | | $ | 188 | | $ | 1,183 | | $ | 267,385 | | $ | 274,665 | |
(1) | Corporate loans that are 90 days past due are generally classified as non-accrual. Corporate loans are considered past due when principal or interest is contractually due but unpaid. |
(2) | Citi generally does not manage corporate loans on a delinquency basis. Non-accrual loans generally include those loans that are ≥ 90 days past due or those loans for which Citi believes, based on actual experience and a forward-looking assessment of the collectability of the loan in full, that the payment of interest or principal is doubtful. |
(3) | Corporate loans are past due when principal or interest is contractually due but unpaid. Loans less than 30 days past due are presented as current. |
(4) | Total loans include loans at fair value, which are not included in the various delinquency columns. |
Citigroup has a risk management process to monitor, evaluate and manage the principal risks associated with its corporate loan portfolio. As part of its risk management process, Citi assigns numeric risk ratings to its corporate loan facilities based on quantitative and qualitative assessments of the obligor and facility. These risk ratings are reviewed at least annually or more often if material events related to the obligor or facility warrant. Factors considered in assigning the risk ratings include financial condition of the obligor, qualitative assessment of management and strategy, amount and sources of repayment, amount and type of collateral and guarantee arrangements, amount and type of any contingencies associated with the obligor, and the obligor's industry and geography.
The obligor risk ratings are defined by ranges of default probabilities. The facility risk ratings are defined by ranges of loss norms, which are the product of the probability of default and the loss given default. The investment grade rating categories are similar to the category BBB-/Baa3 and above as defined by S&P and Moody's. Loans classified according to the bank regulatory definitions as special mention, substandard and doubtful will have risk ratings within the non-investment grade categories.
Corporate Loans Credit Quality Indicators at June 30, 2015 and December 31, 2014
| Recorded investment in loans (1) | |||||
In millions of dollars | June 30, 2015 | December 31, | ||||
Investment grade (2) |
|
| ||||
Commercial and industrial | $ | 86,276 | | $ | 80,812 | |
Financial institutions | 55,691 | | 56,154 | | ||
Mortgage and real estate | 17,559 | | 16,068 | | ||
Leases | 1,592 | | 1,669 | | ||
Other | 49,844 | | 46,284 | | ||
Total investment grade | $ | 210,962 | | $ | 200,987 | |
Non-investment grade (2) |
|
| ||||
Accrual |
|
| ||||
Commercial and industrial | $ | 32,097 | | $ | 29,003 | |
Financial institutions | 10,072 | | 11,429 | | ||
Mortgage and real estate | 3,238 | | 3,587 | | ||
Leases | 376 | | 393 | | ||
Other | 5,819 | | 3,609 | | ||
Non-accrual |
|
| ||||
Commercial and industrial | 626 | | 575 | | ||
Financial institutions | 200 | | 250 | | ||
Mortgage and real estate | 247 | | 252 | | ||
Leases | 48 | | 51 | | ||
Other | 37 | | 55 | | ||
Total non-investment grade | $ | 52,760 | | $ | 49,204 | |
Private bank loans managed on a delinquency basis (2) | $ | 19,548 | | $ | 18,616 | |
Loans at fair value | 6,499 | | 5,858 | | ||
Corporate loans, net of unearned income | $ | 289,769 | | $ | 274,665 | |
145
(1) | Recorded investment in a loan includes net deferred loan fees and costs, unamortized premium or discount, less any direct write-downs. |
(2) | Held-for-investment loans are accounted for on an amortized cost basis. |
Corporate loans and leases identified as impaired and placed on non-accrual status are written down to the extent that principal is judged to be uncollectible. Impaired collateral-dependent loans and leases, where repayment is expected to be provided solely by the sale of the underlying
collateral and there are no other available and reliable sources of repayment, are written down to the lower of cost or collateral value, less cost to sell. Cash-basis loans are returned to an accrual status when all contractual principal and interest amounts are reasonably assured of repayment and there is a sustained period of repayment performance, generally six months , in accordance with the contractual terms of the loan.
The following tables present non-accrual loan information by Corporate loan type at June 30, 2015 and December 31, 2014 and interest income recognized on non-accrual Corporate loans for the six months ended June 30, 2015 .
|
|
|
|
| Three Months Ended | Six Months Ended | ||||||||||||
| June 30, 2015 | |||||||||||||||||
In millions of dollars | Recorded investment (1) | Unpaid principal balance | Related specific allowance | Average carrying value (2) | Interest income recognized (3) | Interest income recognized (3) | ||||||||||||
Non-accrual corporate loans |
|
|
|
|
|
| ||||||||||||
Commercial and industrial | $ | 626 | | $ | 997 | | $ | 97 | | $ | 632 | | $ | 4 | | $ | 4 | |
Financial institutions | 200 | | 205 | | 6 | | 239 | | - | | - | | ||||||
Mortgage and real estate | 247 | | 317 | | 17 | | 246 | | - | | 1 | | ||||||
Lease financing | 48 | | 49 | | 29 | | 49 | | - | | - | | ||||||
Other | 37 | | 133 | | 13 | | 48 | | - | | - | | ||||||
Total non-accrual corporate loans | $ | 1,158 | | $ | 1,701 | | $ | 162 | | $ | 1,214 | | $ | 4 | | $ | 5 | |
| At December 31, 2014 | |||||||||||
In millions of dollars | Recorded investment (1) | Unpaid principal balance | Related specific allowance | Average carrying value (2) | ||||||||
Non-accrual corporate loans |
|
|
|
| ||||||||
Commercial and industrial | $ | 575 | | $ | 863 | | $ | 155 | | $ | 658 | |
Financial institutions | 250 | | 262 | | 7 | | 278 | | ||||
Mortgage and real estate | 252 | | 287 | | 24 | | 263 | | ||||
Lease financing | 51 | | 53 | | 29 | | 85 | | ||||
Other | 55 | | 68 | | 21 | | 60 | | ||||
Total non-accrual corporate loans | $ | 1,183 | | $ | 1,533 | | $ | 236 | | $ | 1,344 | |
146
| June 30, 2015 | December 31, 2014 | ||||||||||
In millions of dollars | Recorded investment (1) | Related specific allowance | Recorded investment (1) | Related specific allowance | ||||||||
Non-accrual corporate loans with valuation allowances |
|
|
|
| ||||||||
Commercial and industrial | $ | 293 | | $ | 97 | | $ | 224 | | $ | 155 | |
Financial institutions | 16 | | 6 | | 37 | | 7 | | ||||
Mortgage and real estate | 73 | | 17 | | 70 | | 24 | | ||||
Lease financing | 47 | | 29 | | 47 | | 29 | | ||||
Other | 36 | | 13 | | 55 | | 21 | | ||||
Total non-accrual corporate loans with specific allowance | $ | 465 | | $ | 162 | | $ | 433 | | $ | 236 | |
Non-accrual corporate loans without specific allowance |
|
|
|
| ||||||||
Commercial and industrial | $ | 333 | |
| | $ | 351 | |
| | ||
Financial institutions | 184 | |
| | 213 | |
| | ||||
Mortgage and real estate | 174 | |
| | 182 | |
| | ||||
Lease financing | 1 | |
| | 4 | |
| | ||||
Other | 1 | |
| | - | |
| | ||||
Total non-accrual corporate loans without specific allowance | $ | 693 | | N/A | | $ | 750 | | N/A | | ||
(1) | Recorded investment in a loan includes net deferred loan fees and costs, unamortized premium or discount, less any direct write-downs. |
(2) | Average carrying value represents the average recorded investment balance and does not include related specific allowance. |
(3) | Interest income recognized for the three- and six-month periods ended June 30, 2014 was $15 million and $25 million , respectively. |
N/A Not Applicable
Corporate Troubled Debt Restructurings
In millions of dollars | Carrying Value | TDRs involving changes in the amount and/or timing of principal payments (1) | TDRs involving changes in the amount and/or timing of interest payments (2) | TDRs involving changes in the amount and/or timing of both principal and interest payments | ||||||||
Commercial and industrial | $ | 66 | | $ | 34 | | $ | - | | $ | 33 | |
Financial institutions | - | | - | | - | | - | | ||||
Mortgage and real estate | 11 | | 1 | | - | | 10 | | ||||
Other | - | | - | | - | | - | | ||||
Total | $ | 77 | | $ | 35 | | $ | - | | $ | 43 | |
(1) | TDRs involving changes in the amount or timing of principal payments may involve principal forgiveness or deferral of periodic and/or final principal payments. Because forgiveness of principal is rare for commercial loans, modifications typically have little to no impact on the loans' projected cash flows and thus little to no impact on the allowance established for the loan. Charge-offs for amounts deemed uncollectable may be recorded at the time of the restructuring or may have already been recorded in prior periods such that no charge-off is required at the time of the modification. |
(2) | TDRs involving changes in the amount or timing of interest payments may involve a below-market interest rate. |
147
In millions of dollars | Carrying Value | TDRs involving changes in the amount and/or timing of principal payments (1) | TDRs involving changes in the amount and/or timing of interest payments (2) | TDRs involving changes in the amount and/or timing of both principal and interest payments | ||||||||
Commercial and industrial | $ | 7 | | $ | 7 | | $ | - | | $ | - | |
Financial institutions | - | | - | | - | | - | | ||||
Mortgage and real estate | 1 | | - | | 1 | | - | | ||||
Other | - | | - | | - | | - | | ||||
Total | $ | 8 | | $ | 7 | | $ | 1 | | $ | - | |
(1) | TDRs involving changes in the amount or timing of principal payments may involve principal forgiveness or deferral of periodic and/or final principal payments. Because forgiveness of principal is rare for commercial loans, modifications typically have little to no impact on the loans' projected cash flows and thus little to no impact on the allowance established for the loan. Charge-offs for amounts deemed uncollectable may be recorded at the time of the restructuring or may have already been recorded in prior periods such that no charge-off is required at the time of the modification. |
(2) | TDRs involving changes in the amount or timing of interest payments may involve a below-market interest rate. |
In millions of dollars | Carrying Value | TDRs involving changes in the amount and/or timing of principal payments (1) | TDRs involving changes in the amount and/or timing of interest payments (2) | TDRs involving changes in the amount and/or timing of both principal and interest payments | ||||||||
Commercial and industrial | $ | 66 | | $ | 34 | | $ | - | | $ | 33 | |
Financial institutions | - | | - | | - | | - | | ||||
Mortgage and real estate | 12 | | 2 | | - | | 10 | | ||||
Other | - | | - | | - | | - | | ||||
Total | $ | 78 | | $ | 36 | | $ | - | | $ | 43 | |
(1) | TDRs involving changes in the amount or timing of principal payments may involve principal forgiveness or deferral of periodic and/or final principal payments. Because forgiveness of principal is rare for commercial loans, modifications typically have little to no impact on the loans' projected cash flows and thus little to no impact on the allowance established for the loan. Charge-offs for amounts deemed uncollectable may be recorded at the time of the restructuring or may have already been recorded in prior periods such that no charge-off is required at the time of the modification. |
(2) | TDRs involving changes in the amount or timing of interest payments may involve a below-market interest rate. |
In millions of dollars | Carrying Value | TDRs involving changes in the amount and/or timing of principal payments (1) | TDRs involving changes in the amount and/or timing of interest payments (2) | TDRs involving changes in the amount and/or timing of both principal and interest payments | ||||||||
Commercial and industrial | $ | 47 | | $ | 30 | | $ | 17 | | $ | - | |
Financial institutions | - | | - | | - | | - | | ||||
Mortgage and real estate | 5 | | 4 | | 1 | | - | | ||||
Other | - | | - | | - | | - | | ||||
Total | $ | 52 | | $ | 34 | | $ | 18 | | $ | - | |
(1) | TDRs involving changes in the amount or timing of principal payments may involve principal forgiveness or deferral of periodic and/or final principal payments. Because forgiveness of principal is rare for commercial loans, modifications typically have little to no impact on the loans' projected cash flows and thus little to no impact on the allowance established for the loan. Charge-offs for amounts deemed uncollectable may be recorded at the time of the restructuring or may have already been recorded in prior periods such that no charge-off is required at the time of the modification. |
(2) | TDRs involving changes in the amount or timing of interest payments may involve a below-market interest rate. |
148
In millions of dollars | TDR balances at June 30, 2015 | TDR loans in payment default during the three months ended | TDR loans in payment default six months ended June 30, 2015 | TDR balances at June 30, 2014 | TDR loans in payment default during the three months ended | TDR loans in payment default six months ended | ||||||||||||
Commercial and industrial | $ | 118 | | $ | - | | $ | - | | $ | 203 | | $ | - | | $ | - | |
Loans to financial institutions | 1 | | 1 | | 1 | | - | | - | | - | | ||||||
Mortgage and real estate | 113 | | - | | - | | 130 | | - | | - | | ||||||
Other | 326 | | - | | - | | 340 | | - | | - | | ||||||
Total | $ | 558 | | $ | 1 | | $ | 1 | | $ | 673 | | $ | - | | $ | - | |
149
15 . ALLOWANCE FOR CREDIT LOSSES
| Three Months Ended June 30, | Six Months Ended | ||||||||||
In millions of dollars | 2015 | 2014 | 2015 | 2014 | ||||||||
Allowance for loan losses at beginning of period | $ | 14,598 | | $ | 18,923 | | $ | 15,994 | | $ | 19,648 | |
Gross credit losses | (2,335 | ) | (2,812 | ) | (4,793 | ) | (5,795 | ) | ||||
Gross recoveries (1) | 415 | | 623 | | 916 | | 1,167 | | ||||
Net credit losses (NCLs) (2) | $ | (1,920 | ) | $ | (2,189 | ) | $ | (3,877 | ) | $ | (4,628 | ) |
NCLs | $ | 1,920 | | $ | 2,189 | | $ | 3,877 | | $ | 4,628 | |
Net reserve releases | (199 | ) | (521 | ) | (290 | ) | (1,081 | ) | ||||
Net specific reserve releases | (206 | ) | (89 | ) | (317 | ) | (175 | ) | ||||
Total provision for credit losses | $ | 1,515 | | $ | 1,579 | | $ | 3,270 | | $ | 3,372 | |
Other, net (3) | (118 | ) | (423 | ) | (1,312 | ) | (502 | ) | ||||
Allowance for loan losses at end of period | $ | 14,075 | | $ | 17,890 | | $ | 14,075 | | $ | 17,890 | |
Allowance for credit losses on unfunded lending commitments at beginning of period | $ | 1,023 | | $ | 1,202 | | $ | 1,063 | | $ | 1,229 | |
Provision (release) for unfunded lending commitments | (48 | ) | (31 | ) | (85 | ) | (58 | ) | ||||
Other, net | (2 | ) | 5 | | (5 | ) | 5 | | ||||
Allowance for credit losses on unfunded lending commitments at end of period (4) | $ | 973 | | $ | 1,176 | | $ | 973 | | $ | 1,176 | |
Total allowance for loans, leases, and unfunded lending commitments | $ | 15,048 | | $ | 19,066 | | $ | 15,048 | | $ | 19,066 | |
(1) | Recoveries have been reduced by certain collection costs that are incurred only if collection efforts are successful. |
(2) | As a result of the entry into an agreement in March 2015 to sell OneMain Financial (OneMain), OneMain was classified as held-for-sale (HFS) at the end of the first quarter of 2015. As a result of HFS accounting treatment, approximately $160 million of net credit losses were recorded as a reduction in revenue (Other revenue) during the second quarter of 2015. |
(3) | The second quarter of 2015 includes a reduction of approximately $88 million related to the sale or transfers to HFS of various loan portfolios, including a reduction of $34 million related to a transfer of a real estate loan portfolio to HFS. Additionally, the second quarter of 2015 includes a reduction of approximately $39 million related to FX translation. The first quarter of 2015 includes a reduction of approximately $1.0 billion related to the sale or transfers to HFS of various loan portfolios, including a reduction of $281 million related to a transfer of a real estate loan portfolio to HFS. Additionally, the first quarter of 2015 includes a reduction of approximately $145 million related to FX translation. The second quarter of 2014 includes a reduction of approximately $480 million related to the sale or transfers to HFS of various loan portfolios, including a reduction of approximately $204 million and $177 million related to the transfer of HFS of businesses in Greece and Spain and $29 million related to the sale of the Honduras business, and $66 million related to a transfer of a real estate loan portfolio to HFS. These amounts are partially offset by FX translation on the entire allowance balance. The first quarter of 2014 includes reductions of approximately $79 million related to the sale or transfer to HFS of various loan portfolios. |
(4) | Represents additional credit loss reserves for unfunded lending commitments and letters of credit recorded in Other liabilities on the Consolidated Balance Sheet. |
Allowance for Credit Losses and Investment in Loans
| Three Months Ended | |||||||||||||||||
| June 30, 2015 | June 30, 2014 | ||||||||||||||||
In millions of dollars | Corporate | Consumer | Total | Corporate | Consumer | Total | ||||||||||||
Allowance for loan losses at beginning of period | $ | 2,476 | | $ | 12,122 | | $ | 14,598 | | $ | 2,472 | | $ | 16,451 | | $ | 18,923 | |
Charge-offs | (123 | ) | (2,212 | ) | (2,335 | ) | (47 | ) | (2,765 | ) | (2,812 | ) | ||||||
Recoveries | 17 | | 398 | | 415 | | 36 | | 587 | | 623 | | ||||||
Replenishment of net charge-offs | 106 | | 1,814 | | 1,920 | | 11 | | 2,178 | | 2,189 | | ||||||
Net reserve releases | (41 | ) | (158 | ) | (199 | ) | (26 | ) | (495 | ) | (521 | ) | ||||||
Net specific reserve releases | (119 | ) | (87 | ) | (206 | ) | (75 | ) | (14 | ) | (89 | ) | ||||||
Other | 10 | | (128 | ) | (118 | ) | (1 | ) | (422 | ) | (423 | ) | ||||||
Ending balance | $ | 2,326 | | $ | 11,749 | | $ | 14,075 | | $ | 2,370 | | $ | 15,520 | | $ | 17,890 | |
150
| Six Months Ended | |||||||||||||||||
| June 30, 2015 | June 30, 2014 | ||||||||||||||||
In millions of dollars | Corporate | Consumer | Total | Corporate | Consumer | Total | ||||||||||||
Allowance for loan losses at beginning of period | $ | 2,389 | | $ | 13,605 | | $ | 15,994 | | $ | 2,584 | | $ | 17,064 | | $ | 19,648 | |
Charge-offs | (146 | ) | (4,647 | ) | (4,793 | ) | (221 | ) | (5,574 | ) | (5,795 | ) | ||||||
Recoveries | 49 | | 867 | | 916 | | 65 | | 1,102 | | 1,167 | | ||||||
Replenishment of net charge-offs | 97 | | 3,780 | | 3,877 | | 156 | | 4,472 | | 4,628 | | ||||||
Net reserve build (releases) | 59 | | (349 | ) | (290 | ) | (127 | ) | (954 | ) | (1,081 | ) | ||||||
Net specific reserve build (releases) | (116 | ) | (201 | ) | (317 | ) | (85 | ) | (90 | ) | (175 | ) | ||||||
Other | (6 | ) | (1,306 | ) | (1,312 | ) | (2 | ) | (500 | ) | (502 | ) | ||||||
Ending balance | $ | 2,326 | | $ | 11,749 | | $ | 14,075 | | $ | 2,370 | | $ | 15,520 | | $ | 17,890 | |
| June 30, 2015 | December 31, 2014 | ||||||||||||||||
In millions of dollars | Corporate | Consumer | Total | Corporate | Consumer | Total | ||||||||||||
Allowance for loan losses |
| |
| |
| |
|
|
| |||||||||
Determined in accordance with ASC 450 | $ | 2,161 | | $ | 8,553 | | $ | 10,714 | | $ | 2,110 | | $ | 9,673 | | $ | 11,783 | |
Determined in accordance with ASC 310-10-35 | 162 | | 3,176 | | 3,338 | | 235 | | 3,917 | | 4,152 | | ||||||
Determined in accordance with ASC 310-30 | 3 | | 20 | | 23 | | 44 | | 15 | | 59 | | ||||||
Total allowance for loan losses | $ | 2,326 | | $ | 11,749 | | $ | 14,075 | | $ | 2,389 | | $ | 13,605 | | $ | 15,994 | |
Loans, net of unearned income |
|
|
|
|
| | | |||||||||||
Loans collectively evaluated for impairment in accordance with ASC 450 | $ | 281,827 | | $ | 327,061 | | $ | 608,888 | | $ | 267,271 | | $ | 350,199 | | $ | 617,470 | |
Loans individually evaluated for impairment in accordance with ASC 310-10-35 | 1,434 | | 14,915 | | 16,349 | | 1,485 | | 19,358 | | 20,843 | | ||||||
Loans acquired with deteriorated credit quality in accordance with ASC 310-30 | 9 | | 334 | | 343 | | 51 | | 370 | | 421 | | ||||||
Loans held at fair value | 6,499 | | 39 | | 6,538 | | 5,858 | | 43 | | 5,901 | | ||||||
Total loans, net of unearned income | $ | 289,769 | | $ | 342,349 | | $ | 632,118 | | $ | 274,665 | | $ | 369,970 | | $ | 644,635 | |
151
16 . GOODWILL AND INTANGIBLE ASSETS
Goodwill
The changes in Goodwill during the six months ended June 30, 2015 were as follows:
In millions of dollars |
| ||
Balance at December 31, 2014 | $ | 23,592 | |
Foreign exchange translation and other | (312 | ) | |
Impairment of goodwill | (16 | ) | |
Divestitures, purchase accounting adjustments and other | (114 | ) | |
Balance at March 31, 2015 | $ | 23,150 | |
Foreign exchange translation and other | (123 | ) | |
Divestitures, purchase accounting adjustments and other | (15 | ) | |
Balance at June 30, 2015 | $ | 23,012 | |
The goodwill impairment testing process, including the methodology and assumptions used to estimate the fair value of the reporting units, is disclosed in more detail in Note 1 of Citigroup's 2014 Annual Report on Form 10-K.
As previously discussed in Note 17 of Citigroup's 2014 Annual Report on Form 10-K, effective January 1, 2015, certain consumer banking and institutional businesses were transferred to Citi Holdings and aggregated to form five new reporting units: Citi Holdings Consumer EMEA , Citi Holdings- Consumer Latin America , Citi Holdings- Consumer Japan , Citi Holdings- Consumer Finance South Korea , and Citi Holdings- ICG . Goodwill balances associated with the transfers were allocated to each of the component businesses based on their relative fair values to the legacy reporting units.
As required by ASC 350, a goodwill impairment test was performed as of January 1, 2015 under the legacy and new reporting structures. The test resulted in full impairment of the new Citi Holdings- Consumer Finance South Korea reporting unit's $16 million goodwill, which was recorded as an operating expense in the first quarter of 2015. There were no other triggering events during the first
quarter of 2015 and therefore no additional goodwill impairment test was performed.
During the second quarter of 2015, there were no triggering events that would more likely-than-not reduce the fair value of a reporting unit below its carrying amount for all reporting units with goodwill balances, except for Citi Holdings- Consumer Latin America . A goodwill impairment test was performed as of June 30, 2015, resulted in fair value in excess of book value and therefore no indication of impairment.
The fair values of the Company's reporting units as of the most recent tests substantially exceeded their carrying values and did not indicate a risk of impairment based on current valuations, with the exception of the Citi Holdings- Consumer EMEA and Citi Holdings- Consumer Latin America reporting units.
While there was no indication of impairment, goodwill present in Citi Holdings- Consumer EMEA and Citi Holdings- Consumer Latin America of $13 million and $70 million , respectively, may be particularly sensitive to further deterioration in economic conditions. The fair value as a percentage of allocated book value as of the January 1, 2015 test for Citi Holdings- Consumer EMEA and June 30, 2015 test for Citi Holdings- Consumer Latin America was 107% and 101% , respectively.
The following table shows reporting units with goodwill balances as of June 30, 2015 .
In millions of dollars |
| ||
Reporting Unit (1)(2) | Goodwill | ||
North America Global Consumer Banking | $ | 6,729 | |
EMEA Global Consumer Banking | 310 | | |
Asia Global Consumer Banking | 4,589 | | |
Latin America Global Consumer Banking | 1,442 | | |
Banking | 3,293 | | |
Markets and Securities Services | 6,566 | | |
Citi Holdings - Consumer EMEA | 13 | | |
Citi Holdings - Consumer Japan (3) | - | | |
Citi Holdings - Consumer Latin America | 70 | | |
Total | $ | 23,012 | |
(1) | Citi Holdings -Other and Citi Holdings- ICG are excluded from the table as there is no goodwill allocated to them. |
(2) | Citi Holdings- Consumer Finance South Korea is excluded from the table as the allocated goodwill of $16 million was fully-impaired during the first quarter of 2015. |
(3) | The entire Citi Holdings- Consumer Japan reporting unit is classified as held-for-sale since the first quarter of 2015. |
152
Intangible Assets
The components of intangible assets as of June 30, 2015 and December 31, 2014 were as follows:
| June 30, 2015 | December 31, 2014 | ||||||||||||||||
In millions of dollars | Gross carrying amount | Accumulated amortization | Net carrying amount | Gross carrying amount | Accumulated amortization | Net carrying amount | ||||||||||||
Purchased credit card relationships | $ | 7,610 | | $ | 6,404 | | $ | 1,206 | | $ | 7,626 | | $ | 6,294 | | $ | 1,332 | |
Core deposit intangibles | 1,102 | | 999 | | 103 | | 1,153 | | 1,021 | | 132 | | ||||||
Other customer relationships | 478 | | 335 | | 143 | | 579 | | 331 | | 248 | | ||||||
Present value of future profits | 165 | | 158 | | 7 | | 233 | | 154 | | 79 | | ||||||
Indefinite-lived intangible assets | 272 | | - | | 272 | | 290 | | - | | 290 | | ||||||
Other (1) | 5,158 | | 2,818 | | 2,340 | | 5,217 | | 2,732 | | 2,485 | | ||||||
Intangible assets (excluding MSRs) | $ | 14,785 | | $ | 10,714 | | $ | 4,071 | | $ | 15,098 | | $ | 10,532 | | $ | 4,566 | |
Mortgage servicing rights (MSRs) (2) | 1,924 | | - | | 1,924 | | 1,845 | | - | | 1,845 | | ||||||
Total intangible assets | $ | 16,709 | | $ | 10,714 | | $ | 5,995 | | $ | 16,943 | | $ | 10,532 | | $ | 6,411 | |
(1) | Includes contract-related intangible assets. |
(2) | For additional information on Citi's MSRs, including the roll-forward for the six months ended June 30, 2015, see Note 20 to the Consolidated Financial Statements. |
The changes in intangible assets during the six months ended June 30, 2015 were as follows:
| Net carrying |
|
|
|
| Net carrying amount at | ||||||||||||
In millions of dollars | December 31, 2014 | Acquisitions/ divestitures | Amortization | Impairments | FX and other (1) | June 30, | ||||||||||||
Purchased credit card relationships | $ | 1,332 | | $ | - | | $ | (134 | ) | $ | - | | $ | 8 | | $ | 1,206 | |
Core deposit intangibles | 132 | | - | | (22 | ) | - | | (7 | ) | 103 | | ||||||
Other customer relationships | 248 | | (87 | ) | (12 | ) | - | | (6 | ) | 143 | | ||||||
Present value of future profits | 79 | | (65 | ) | (7 | ) | - | | - | | 7 | | ||||||
Indefinite-lived intangible assets | 290 | | - | | - | | - | | (18 | ) | 272 | | ||||||
Other | 2,485 | | (6 | ) | (159 | ) | (5 | ) | 25 | | 2,340 | | ||||||
Intangible assets (excluding MSRs) | $ | 4,566 | | $ | (158 | ) | $ | (334 | ) | $ | (5 | ) | $ | 2 | | $ | 4,071 | |
Mortgage servicing rights (MSRs) (2) | 1,845 | |
|
|
|
| 1,924 | | ||||||||||
Total intangible assets | $ | 6,411 | |
|
|
|
| $ | 5,995 | | ||||||||
(1) | Includes foreign exchange translation, purchase accounting adjustments and other. |
(2) | For additional information on Citi's MSRs, including the roll-forward for the six months ended June 30, 2015, see Note 20 to the Consolidated Financial Statements. |
153
17 . DEBT
Short-Term Borrowings
In millions of dollars | June 30, | December 31, | ||||
Commercial paper | | | ||||
Significant Citibank entities (1) | $ | 9,990 | | $ | 16,085 | |
Parent (2) | - | | 70 | | ||
Total Commercial paper | $ | 9,990 | | $ | 16,155 | |
Other borrowings (3) | $ | 15,917 | | $ | 42,180 | |
Total | $ | 25,907 | | $ | 58,335 | |
(1) | Significant Citibank entities consist of Citibank, N.A. units domiciled in the U.S., Western Europe, Hong Kong and Singapore. |
(2) | Parent includes the parent holding company (Citigroup Inc.) and Citi's broker-dealer subsidiaries that are consolidated into Citigroup. |
(3) | Includes borrowings from the Federal Home Loan Banks and other market participants. At June 30, 2015 and December 31, 2014 , collateralized short-term advances from the Federal Home Loan Banks were $1.0 billion and $11.2 billion , respectively. |
Borrowings under bank lines of credit may be at interest rates based on LIBOR, CD rates, the prime rate or bids submitted by the banks. Citigroup pays commitment fees for its lines of credit.
Some of Citigroup's non-bank subsidiaries have credit facilities with Citigroup's subsidiary depository institutions, including Citibank, N.A. Borrowings under these facilities are secured in accordance with Section 23A of the Federal Reserve Act.
Citigroup Global Markets Holdings Inc. (CGMHI) has borrowing agreements consisting of facilities that CGMHI has been advised are available, but where no contractual lending obligation exists. These arrangements are reviewed on an ongoing basis to ensure flexibility in meeting CGMHI's short-term requirements.
Long-Term Debt
In millions of dollars | June 30, 2015 | December 31, 2014 | ||||
Citigroup Inc. (1) | $ | 151,105 | | $ | 149,512 | |
Bank (2) | 56,706 | | 65,146 | | ||
Broker-dealer (3) | 4,034 | | 8,422 | | ||
Total | $ | 211,845 | | $ | 223,080 | |
(1) | Parent holding company, Citigroup Inc. |
(2) | Represents the Significant Citibank entities as well as other Citibank and Banamex entities. At June 30, 2015 and December 31, 2014 , collateralized long-term advances from the Federal Home Loan Banks were $16.8 billion and $19.8 billion , respectively. |
(3) | Represents broker-dealer subsidiaries that are consolidated into Citigroup Inc., the parent holding company. |
Long-term debt outstanding includes trust preferred securities with a balance sheet carrying value of $1.7 billion at both June 30, 2015 and December 31, 2014 (for the structure and terms of Citi's trust preferred securities, see Note 20 to the Consolidated Financial Statements).
The following table summarizes the Company's outstanding trust preferred securities at June 30, 2015 :
|
|
|
|
|
| Junior subordinated debentures owned by trust | |||||||||
Trust | Issuance date | Securities issued | Liquidation value (1) | Coupon rate (2) | Common shares issued to parent | Amount | Maturity | Redeemable by issuer beginning | |||||||
In millions of dollars, except share amounts | | | | | | | | | | ||||||
Citigroup Capital III | Dec. 1996 | 194,053 | | $ | 194 | | 7.625 | % | 6,003 | | $ | 200 | | Dec. 1, 2036 | Not redeemable |
Citigroup Capital XIII | Sept. 2010 | 89,840,000 | | 2,246 | | 7.875 | | 1,000 | | 2,246 | | Oct. 30, 2040 | Oct. 30, 2015 | ||
Citigroup Capital XVIII | June 2007 | 99,901 | | 157 | | 6.829 | | 50 | | 157 | | June 28, 2067 | June 28, 2017 | ||
Total obligated |
|
| | $ | 2,597 | |
|
| $ | 2,603 | |
|
| ||
Note: Distributions on the trust preferred securities and interest on the subordinated debentures are payable semiannually for Citigroup Capital III and Citigroup Capital XVIII and quarterly for Citigroup Capital XIII.
(1) | Represents the notional value received by investors from the trusts at the time of issuance. |
(2) | In each case, the coupon rate on the subordinated debentures is the same as that on the trust preferred securities. |
154
18 . CHANGES IN ACCUMULATED OTHER COMPREHENSIVE INCOME (LOSS)
Changes in each component of Citigroup's Accumulated other comprehensive income (loss) for the three and six months ended June 30, 2015 and 2014 are as follows:
In millions of dollars | Net unrealized gains (losses) on investment securities | Cash flow hedges (1) | Benefit plans (2) | Foreign currency translation adjustment, net of hedges (CTA) (3)(4) | Accumulated other comprehensive income (loss) | ||||||||||
Balance, March 31, 2015 | $ | 648 | | $ | (823 | ) | $ | (5,249 | ) | $ | (19,267 | ) | $ | (24,691 | ) |
Other comprehensive income (losses) before reclassifications | $ | (844 | ) | $ | 22 | | $ | 539 | | $ | (148 | ) | $ | (431 | ) |
Increase (decrease) due to amounts reclassified from AOCI | (91 | ) | 70 | | 39 | | - | | 18 | | |||||
Change, net of taxes | $ | (935 | ) | $ | 92 | | $ | 578 | | $ | (148 | ) | $ | (413 | ) |
Balance at June 30, 2015 | $ | (287 | ) | $ | (731 | ) | $ | (4,671 | ) | $ | (19,415 | ) | $ | (25,104 | ) |
Six months ended June 30, 2015 :
Balance, December 31, 2014 | $ | 57 | | $ | (909 | ) | $ | (5,159 | ) | $ | (17,205 | ) | $ | (23,216 | ) |
Other comprehensive income before reclassifications | $ | (103 | ) | $ | 54 | | $ | 408 | | $ | (2,210 | ) | $ | (1,851 | ) |
Increase (decrease) due to amounts reclassified from AOCI | (241 | ) | 124 | | 80 | | - | | (37 | ) | |||||
Change, net of taxes | $ | (344 | ) | $ | 178 | | $ | 488 | | $ | (2,210 | ) | $ | (1,888 | ) |
Balance at June 30, 2015 | $ | (287 | ) | $ | (731 | ) | $ | (4,671 | ) | $ | (19,415 | ) | $ | (25,104 | ) |
Three Months Ended June 30, 2014 :
Balance, March 31, 2014 | $ | (1,212 | ) | $ | (1,127 | ) | $ | (4,022 | ) | $ | (12,785 | ) | $ | (19,146 | ) |
Other comprehensive income before reclassifications | $ | 1,037 | | $ | 58 | | $ | (195 | ) | $ | 17 | | $ | 917 | |
Increase (decrease) due to amounts reclassified from AOCI | (31 | ) | 62 | | 51 | | - | | 82 | | |||||
Change, net of taxes | $ | 1,006 | | $ | 120 | | $ | (144 | ) | $ | 17 | | $ | 999 | |
Balance at June 30, 2014 | $ | (206 | ) | $ | (1,007 | ) | $ | (4,166 | ) | $ | (12,768 | ) | $ | (18,147 | ) |
Balance, December 31, 2013 | $ | (1,640 | ) | $ | (1,245 | ) | $ | (3,989 | ) | $ | (12,259 | ) | $ | (19,133 | ) |
Other comprehensive income before reclassifications | $ | 1,415 | | $ | 104 | | $ | (257 | ) | $ | (509 | ) | $ | 753 | |
Increase (decrease) due to amounts reclassified from AOCI | 19 | | 134 | | 80 | | - | | 233 | | |||||
Change, net of taxes | $ | 1,434 | | $ | 238 | | $ | (177 | ) | $ | (509 | ) | $ | 986 | |
Balance at June 30, 2014 | $ | (206 | ) | $ | (1,007 | ) | $ | (4,166 | ) | $ | (12,768 | ) | $ | (18,147 | ) |
(1) | Primarily driven by Citigroup's pay fixed/receive floating interest rate swap programs that hedge the floating rates on liabilities. |
(2) | Primarily reflects adjustments based on the quarterly actuarial valuations of the Company's significant pension and postretirement plans, annual actuarial valuations of all other plans, and amortization of amounts previously recognized in other comprehensive income. |
(3) | Primarily reflects the movements in (by order of impact) the Mexican peso, British pound, Korean won and euro against the U.S. dollar, and changes in related tax effects and hedges for the quarter ended June 30, 2015 . Primarily reflects the movements in (by order of impact) the euro, Mexican peso, British pound, and Brazilian real against the U.S. dollar, and changes in related tax effects and hedges for the quarter ended March 31, 2015 . Primarily reflects the movements in (by order of impact) the Korean won, British pound, euro and Mexican peso against the U.S. dollar, and changes in related tax effects and hedges for the quarter ended June 30, 2014 . Primarily reflects the movements in (by order of impact) the Russian ruble, Argentine peso, Korean won, and Japanese yen against the U.S. dollar, and changes in related tax effects and hedges for the quarter ended March 31, 2014. |
(4) | During 2014, $137 million ( $84 million net of tax) was reclassified to reflect the allocation of foreign currency translation between net unrealized gains (losses) on investment securities to CTA. |
155
The pretax and after-tax changes in each component of Accumulated other comprehensive income (loss) for the three and six months ended June 30, 2015 and 2014 are as follows:
In millions of dollars | Pretax | Tax effect | After-tax | ||||||
Balance, March 31, 2015 | $ | (32,279 | ) | $ | 7,588 | | $ | (24,691 | ) |
Change in net unrealized gains (losses) on investment securities | (1,517 | ) | 582 | | (935 | ) | |||
Cash flow hedges | 118 | | (26 | ) | 92 | | |||
Benefit plans | 810 | | (232 | ) | 578 | | |||
Foreign currency translation adjustment | (280 | ) | 132 | | (148 | ) | |||
Change | $ | (869 | ) | $ | 456 | | $ | (413 | ) |
Balance, June 30, 2015 | $ | (33,148 | ) | $ | 8,044 | | $ | (25,104 | ) |
Six months ended June 30, 2015 :
In millions of dollars | Pretax | Tax effect | After-tax | ||||||
Balance, December 31, 2014 | $ | (31,060 | ) | $ | 7,844 | | $ | (23,216 | ) |
Change in net unrealized gains (losses) on investment securities | (468 | ) | 124 | | (344 | ) | |||
Cash flow hedges | 274 | | (96 | ) | 178 | | |||
Benefit plans | 689 | | (201 | ) | 488 | | |||
Foreign currency translation adjustment | (2,583 | ) | 373 | | (2,210 | ) | |||
Change | $ | (2,088 | ) | $ | 200 | | $ | (1,888 | ) |
Balance, June 30, 2015 | $ | (33,148 | ) | $ | 8,044 | | $ | (25,104 | ) |
Three Months Ended June 30, 2014 :
In millions of dollars | Pretax | Tax effect | After-tax | ||||||
Balance, March 31, 2014 | $ | (27,297 | ) | $ | 8,151 | | $ | (19,146 | ) |
Change in net unrealized gains (losses) on investment securities | 1,585 | | (579 | ) | 1,006 | | |||
Cash flow hedges | 205 | | (85 | ) | 120 | | |||
Benefit plans | (239 | ) | 95 | | (144 | ) | |||
Foreign currency translation adjustment | 101 | | (84 | ) | 17 | | |||
Change | $ | 1,652 | | $ | (653 | ) | $ | 999 | |
Balance, June 30, 2014 | $ | (25,645 | ) | $ | 7,498 | | $ | (18,147 | ) |
Six months ended June 30, 2014 :
In millions of dollars | Pretax | Tax effect | After-tax | ||||||
Balance, December 31, 2013 | $ | (27,596 | ) | $ | 8,463 | | $ | (19,133 | ) |
Change in net unrealized gains (losses) on investment securities | 2,288 | | (854 | ) | 1,434 | | |||
Cash flow hedges | 386 | | (148 | ) | 238 | | |||
Benefit plans | (294 | ) | 117 | | (177 | ) | |||
Foreign currency translation adjustment | (429 | ) | (80 | ) | (509 | ) | |||
Change | $ | 1,951 | | $ | (965 | ) | $ | 986 | |
Balance, June 30, 2014 | $ | (25,645 | ) | $ | 7,498 | | $ | (18,147 | ) |
156
| Increase (decrease) in AOCI due to amounts reclassified to Consolidated Statement of Income | |||||
In millions of dollars | Three Months Ended June 30, | Six Months Ended June 30, | ||||
| 2015 | 2015 | ||||
Realized (gains) losses on sales of investments | $ | (183 | ) | $ | (490 | ) |
OTTI gross impairment losses | 43 | | 115 | | ||
Subtotal, pretax | $ | (140 | ) | $ | (375 | ) |
Tax effect | 49 | | 134 | | ||
Net realized (gains) losses on investment securities, after-tax (1) | $ | (91 | ) | $ | (241 | ) |
Interest rate contracts | $ | 74 | | $ | 120 | |
Foreign exchange contracts | 37 | | 77 | | ||
Subtotal, pretax | $ | 111 | | $ | 197 | |
Tax effect | (41 | ) | (73 | ) | ||
Amortization of cash flow hedges, after-tax (2) | $ | 70 | | $ | 124 | |
Amortization of unrecognized |
|
| ||||
Prior service cost (benefit) | $ | (10 | ) | $ | (21 | ) |
Net actuarial loss | 72 | | 147 | | ||
Curtailment/settlement impact (3) | 10 | | 10 | | ||
Subtotal, pretax | $ | 72 | | $ | 136 | |
Tax effect | (33 | ) | (56 | ) | ||
Amortization of benefit plans, after-tax (3) | $ | 39 | | $ | 80 | |
Foreign currency translation adjustment | $ | - | | $ | - | |
Total amounts reclassified out of AOCI, pretax | $ | 43 | | $ | (42 | ) |
Total tax effect | (25 | ) | 5 | | ||
Total amounts reclassified out of AOCI, after-tax | $ | 18 | | $ | (37 | ) |
(1) | The pretax amount is reclassified to Realized gains (losses) on sales of investments, net and Gross impairment losses on the Consolidated Statement of Income. See Note 13 to the Consolidated Financial Statements for additional details. |
(2) | See Note 21 to the Consolidated Financial Statements for additional details. |
(3) | See Notes 1 and 8 to the Consolidated Financial Statements for additional details. |
157
During the three and six months ended June 30, 2014, the Company recognized a pretax loss of $ 136 million ($ 82 million net of tax) and pretax loss of $ 373 million ($ 233 million net of tax), respectively, related to amounts reclassified out of Accumulated other comprehensive income (loss) into the Consolidated Statement of Income. See details in the table below:
| Increase (decrease) in AOCI due to amounts reclassified to Consolidated Statement of Income | |||||
In millions of dollars | Three Months Ended June 30, | Six Months Ended June 30, | ||||
| 2014 | 2014 | ||||
Realized (gains) losses on sales of investments | $ | (84 | ) | $ | (212 | ) |
OTTI gross impairment losses | 37 | | 238 | | ||
Subtotal, pretax | $ | (47 | ) | $ | 26 | |
Tax effect | 16 | | (7 | ) | ||
Net realized (gains) losses on investment securities, after-tax (1) | $ | (31 | ) | $ | 19 | |
Interest rate contracts | $ | 73 | | $ | 134 | |
Foreign exchange contracts | 28 | | 84 | | ||
Subtotal, pretax | $ | 101 | | $ | 218 | |
Tax effect | (39 | ) | (84 | ) | ||
Amortization of cash flow hedges, after-tax (2) | $ | 62 | | $ | 134 | |
Amortization of unrecognized |
| | ||||
Prior service cost (benefit) | $ | (10 | ) | $ | (19 | ) |
Net actuarial loss | 64 | | 120 | | ||
Curtailment/settlement impact (3) | 28 | | 28 | | ||
Subtotal, pretax | $ | 82 | | $ | 129 | |
Tax effect | (31 | ) | (49 | ) | ||
Amortization of benefit plans, after-tax (3) | $ | 51 | | $ | 80 | |
Foreign currency translation adjustment | $ | - | | $ | - | |
Total amounts reclassified out of AOCI, pretax | $ | 136 | | $ | 373 | |
Total tax effect | (54 | ) | (140 | ) | ||
Total amounts reclassified out of AOCI, after-tax | $ | 82 | | $ | 233 | |
(1) | The pretax amount is reclassified to Realized gains (losses) on sales of investments, net and Gross impairment losses on the Consolidated Statement of Income. See Note 13 to the Consolidated Financial Statements for additional details. |
(2) | See Note 21 to the Consolidated Financial Statements for additional details. |
(3) | See Notes 1 and 8 to the Consolidated Financial Statements for additional details. |
158
19 . PREFERRED STOCK
The following table summarizes the Company's preferred stock outstanding at June 30, 2015 and December 31, 2014 :
|
|
|
|
|
| Carrying value in millions of dollars | |||||||||
| Issuance date | Redeemable by issuer beginning | Dividend | Redemption | Number | June 30, | December 31, | ||||||||
Series AA (1) | January 25, 2008 | February 15, 2018 | 8.125 | % | $ | 25 | | 3,870,330 | | $ | 97 | | $ | 97 | |
Series E (2) | April 28, 2008 | April 30, 2018 | 8.400 | % | 1,000 | | 121,254 | | 121 | | 121 | | |||
Series A (3) | October 29, 2012 | January 30, 2023 | 5.950 | % | 1,000 | | 1,500,000 | | 1,500 | | 1,500 | | |||
Series B (4) | December 13, 2012 | February 15, 2023 | 5.900 | % | 1,000 | | 750,000 | | 750 | | 750 | | |||
Series C (5) | March 26, 2013 | April 22, 2018 | 5.800 | % | 25 | | 23,000,000 | | 575 | | 575 | | |||
Series D (6) | April 30, 2013 | May 15, 2023 | 5.350 | % | 1,000 | | 1,250,000 | | 1,250 | | 1,250 | | |||
Series J (7) | September 19, 2013 | September 30, 2023 | 7.125 | % | 25 | | 38,000,000 | | 950 | | 950 | | |||
Series K (8) | October 31, 2013 | November 15, 2023 | 6.875 | % | 25 | | 59,800,000 | | 1,495 | | 1,495 | | |||
Series L (9) | February 12, 2014 | February 12, 2019 | 6.875 | % | 25 | | 19,200,000 | | 480 | | 480 | | |||
Series M (10) | April 30, 2014 | May 15, 2024 | 6.300 | % | 1,000 | | 1,750,000 | | 1,750 | | 1,750 | | |||
Series N (11) | October 29, 2014 | November 15, 2019 | 5.800 | % | 1,000 | | 1,500,000 | | 1,500 | | 1,500 | | |||
Series O (12) | March 20, 2015 | March 27, 2020 | 5.875 | % | 1,000 | | 1,500,000 | | 1,500 | | - | | |||
Series P (13) | April 24, 2015 | May 15, 2025 | 5.950 | % | 1,000 | | 2,000,000 | | 2,000 | | - | | |||
|
|
|
| |
| |
| | $ | 13,968 | | $ | 10,468 | | |
(1) | Issued as depositary shares, each representing a 1/1,000 th interest in a share of the corresponding series of non-cumulative perpetual preferred stock. Dividends are payable quarterly on February 15, May 15, August 15 and November 15 when, as and if declared by the Citi Board of Directors. |
(2) | Issued as depositary shares, each representing a 1/25 th interest in a share of the corresponding series of non-cumulative perpetual preferred stock. Dividends are payable semi-annually on April 30 and October 30 at a fixed rate until April 30, 2018, thereafter payable quarterly on January 30, April 30, July 30 and October 30 at a floating rate, in each case when, as and if declared by the Citi Board of Directors. |
(3) | Issued as depositary shares, each representing a 1/25 th interest in a share of the corresponding series of non-cumulative perpetual preferred stock. Dividends are payable semi-annually on January 30 and July 30 at a fixed rate until January 30, 2023, thereafter payable quarterly on January 30, April 30, July 30 and October 30 at a floating rate, in each case when, as and if declared by the Citi Board of Directors. |
(4) | Issued as depositary shares, each representing a 1/25 th interest in a share of the corresponding series of non-cumulative perpetual preferred stock. Dividends are payable semi-annually on February 15 and August 15 at a fixed rate until February 15, 2023, thereafter payable quarterly on February 15, May 15, August 15 and November 15 at a floating rate, in `each case when, as and if declared by the Citi Board of Directors. |
(5) | Issued as depositary shares, each representing a 1/1,000 th interest in a share of the corresponding series of non-cumulative perpetual preferred stock. Dividends are payable quarterly on January 22, April 22, July 22 and October 22 when, as and if declared by the Citi Board of Directors. |
(6) | Issued as depositary shares, each representing a 1/25 th interest in a share of the corresponding series of non-cumulative perpetual preferred stock. Dividends are payable semi-annually on May 15 and November 15 at a fixed rate until May 15, 2023, thereafter payable quarterly on February 15, May 15, August 15 and November 15 at a floating rate, in each case when, as and if declared by the Citi Board of Directors. |
(7) | Issued as depositary shares, each representing a 1/1,000 th interest in a share of the corresponding series of non-cumulative perpetual preferred stock. Dividends are payable quarterly on March 30, June 30, September 30 and December 30 at a fixed rate until September 30, 2023, thereafter payable quarterly on the same dates at a floating rate, in each case when, as and if declared by the Citi Board of Directors. |
(8) | Issued as depositary shares, each representing a 1/1,000 th interest in a share of the corresponding series of non-cumulative perpetual preferred stock. Dividends are payable quarterly on February 15, May 15, August 15 and November 15 at a fixed rate until November 15, 2023, thereafter payable quarterly on the same dates at a floating rate, in each case when, as and if declared by the Citi Board of Directors. |
(9) | Issued as depositary shares, each representing a 1/1,000 th interest in a share of the corresponding series of non-cumulative perpetual preferred stock. Dividends are payable quarterly on February 12, May 12, August 12 and November 12 at a fixed rate, in each case when, as and if declared by the Citi Board of Directors. |
(10) | Issued as depositary shares, each representing a 1/25 th interest in a share of the corresponding series of non-cumulative perpetual preferred stock. Dividends are payable semi-annually on May 15 and November 15 at a fixed rate until May 15, 2024, thereafter payable quarterly on February 15, May 15, August 15, and November 15 at a floating rate, in each case when, as and if declared by the Citi Board of Directors. |
(11) | Issued as depositary shares, each representing a 1/25 th interest in a share of the corresponding series of non-cumulative perpetual preferred stock. Dividends are payable semi-annually on May 15 and November 15 at a fixed rate until, but excluding, November 15, 2019, and thereafter payable quarterly on February 15, May 15, August 15 and November 15 at a floating rate, in each case when, as and if declared by the Citi Board of Directors. |
(12) | Issued as depositary shares, each representing a 1/25 th interest in a share of the corresponding series of non-cumulative perpetual preferred stock. Dividends are payable semi-annually on March 27 and September 27 at a fixed rate until, but excluding, March 27, 2020, and thereafter payable quarterly on March 27, June 27, September 27 and December 27 at a floating rate, in each case when, as and if declared by the Citi Board of Directors. |
(13) | Issued as depositary shares, each representing a 1/25 th interest in a share of the corresponding series of non-cumulative perpetual preferred stock. Dividends are payable semi-annually on May 15 and November 15 at a fixed rate beginning November 15, 2015 until, but excluding, May 15, 2015, and thereafter payable quarterly on February 15, May 15, August 15, and November 15 at a floating rate, in each case when, as and if declared by the Citi Board of Directors. |
159
During the second quarter of 2015 , Citi distributed $330 million in dividends on its outstanding preferred stock. As of June 30, 2015, Citi estimates that it will distribute preferred dividends of approximately $439 million during the remainder of 2015, in each case assuming such dividends are approved by the Citi Board of Directors.
160
20 . SECURITIZATIONS AND VARIABLE INTEREST ENTITIES
Uses of Special Purpose Entities
A special purpose entity (SPE) is an entity designed to fulfill a specific limited need of the company that organized it. The principal uses of SPEs by Citi are to obtain liquidity and favorable capital treatment by securitizing certain financial assets, to assist clients in securitizing their financial assets and to create investment products for clients. SPEs may be organized in various legal forms, including trusts, partnerships or corporations. In a securitization, the company transferring assets to an SPE converts all (or a portion) of those assets into cash before they would have been realized in the normal course of business through the SPE's issuance of debt and equity instruments, certificates, commercial paper or other notes of indebtedness. These issuances are recorded on the balance sheet of the SPE, which may or may not be consolidated onto the balance sheet of the company that organized the SPE.
Investors usually have recourse only to the assets in the SPE, but may also benefit from other credit enhancements, such as a collateral account, a line of credit or a liquidity facility, such as a liquidity put option or asset purchase agreement. Because of these enhancements, the SPE issuances typically obtain a more favorable credit rating than the transferor could obtain for its own debt issuances. This results in less expensive financing costs than unsecured debt. The SPE may also enter into derivative contracts in order to convert the yield or currency of the underlying assets to match the needs of the SPE investors or to limit or change the credit risk of the SPE. Citigroup may be the provider of certain credit enhancements as well as the counterparty to any related derivative contracts.
Most of Citigroup's SPEs are variable interest entities (VIEs), as described below.
Variable Interest Entities
VIEs are entities that have either a total equity investment that is insufficient to permit the entity to finance its activities without additional subordinated financial support, or whose equity investors lack the characteristics of a controlling financial interest (i.e., ability to make significant decisions through voting rights and a right to receive the expected residual returns of the entity or an obligation to absorb the expected losses of the entity). Investors that finance the VIE through debt or equity interests or other counterparties providing other forms of support, such as guarantees, subordinated fee arrangements or certain types of derivative contracts are variable interest holders in the entity.
The variable interest holder, if any, that has a controlling financial interest in a VIE is deemed to be the primary beneficiary and must consolidate the VIE. Citigroup would be deemed to have a controlling financial interest and be the primary beneficiary if it has both of the following characteristics:
• | power to direct the activities of the VIE that most significantly impact the entity's economic performance; and |
• | an obligation to absorb losses of the entity that could potentially be significant to the VIE, or a right to receive benefits from the entity that could potentially be significant to the VIE. |
The Company must evaluate each VIE to understand the purpose and design of the entity, the role the Company had in the entity's design and its involvement in the VIE's ongoing activities. The Company then must evaluate which activities most significantly impact the economic performance of the VIE and who has the power to direct such activities.
For those VIEs where the Company determines that it has the power to direct the activities that most significantly impact the VIE's economic performance, the Company must then evaluate its economic interests, if any, and determine whether it could absorb losses or receive benefits that could potentially be significant to the VIE. When evaluating whether the Company has an obligation to absorb losses that could potentially be significant, it considers the maximum exposure to such loss without consideration of probability. Such obligations could be in various forms, including, but not limited to, debt and equity investments, guarantees, liquidity agreements and certain derivative contracts.
In various other transactions, the Company may: (i) act as a derivative counterparty (for example, interest rate swap, cross-currency swap, or purchaser of credit protection under a credit default swap or total return swap where the Company pays the total return on certain assets to the SPE); (ii) act as underwriter or placement agent; (iii) provide administrative, trustee or other services; or (iv) make a market in debt securities or other instruments issued by VIEs. The Company generally considers such involvement, by itself, not to be variable interests and thus not an indicator of power or potentially significant benefits or losses.
See Note 1 to the Consolidated Financial Statements for a discussion of impending changes to targeted areas of consolidation guidance.
161
| As of June 30, 2015 |
| ||||||||||||||||||||||
|
|
|
| Maximum exposure to loss in significant unconsolidated VIEs (1) | ||||||||||||||||||||
|
|
|
| Funded exposures (2) | Unfunded exposures |
| ||||||||||||||||||
In millions of dollars | Total involvement with SPE assets | Consolidated VIE / SPE assets | Significant unconsolidated VIE assets (3) | Debt investments | Equity investments | Funding commitments | Guarantees and derivatives | Total | ||||||||||||||||
Credit card securitizations | $ | 55,415 | | $ | 55,242 | | $ | 173 | | $ | - | | $ | - | | $ | - | | $ | - | | $ | - | |
Mortgage securitizations (4) |
|
|
|
|
|
|
|
| ||||||||||||||||
U.S. agency-sponsored | 248,073 | | - | | 248,073 | | 3,983 | | - | | - | | 102 | | 4,085 | | ||||||||
Non-agency-sponsored | 15,878 | | 1,010 | | 14,868 | | 459 | | - | | - | | 1 | | 460 | | ||||||||
Citi-administered asset-backed commercial paper conduits (ABCP) | 25,931 | | 25,931 | | - | | - | | - | | - | | - | | - | | ||||||||
Collateralized debt obligations (CDOs) | 4,589 | | - | | 4,589 | | 362 | | - | | - | | 84 | | 446 | | ||||||||
Collateralized loan obligations (CLOs) | 19,136 | | - | | 19,136 | | 2,172 | | - | | - | | - | | 2,172 | | ||||||||
Asset-based financing | 67,913 | | 1,178 | | 66,735 | | 24,815 | | 169 | | 2,148 | | 354 | | 27,486 | | ||||||||
Municipal securities tender option bond trusts (TOBs) | 10,496 | | 5,236 | | 5,260 | | 85 | | - | | 3,440 | | - | | 3,525 | | ||||||||
Municipal investments | 22,418 | | 57 | | 22,361 | | 2,084 | | 2,154 | | 2,660 | | - | | 6,898 | | ||||||||
Client intermediation | 2,225 | | 695 | | 1,530 | | 22 | | - | | - | | - | | 22 | | ||||||||
Investment funds (5) | 31,714 | | 943 | | 30,771 | | 13 | | 374 | | 102 | | - | | 489 | | ||||||||
Trust preferred securities | 2,635 | | - | | 2,635 | | - | | 6 | | - | | - | | 6 | | ||||||||
Other | 10,187 | | 6,029 | | 4,158 | | 73 | | 576 | | 47 | | 55 | | 751 | | ||||||||
Total (6) | $ | 516,610 | | $ | 96,321 | | $ | 420,289 | | $ | 34,068 | | $ | 3,279 | | $ | 8,397 | | $ | 596 | | $ | 46,340 | |
| As of December 31, 2014 |
| ||||||||||||||||||||||
|
|
|
| Maximum exposure to loss in significant unconsolidated VIEs (1) | ||||||||||||||||||||
|
|
|
| Funded exposures (2) | Unfunded exposures |
| ||||||||||||||||||
In millions of dollars | Total involvement with SPE assets | Consolidated VIE / SPE assets | Significant unconsolidated VIE assets (3) | Debt investments | Equity investments | Funding commitments | Guarantees and derivatives | Total | ||||||||||||||||
Credit card securitizations | $ | 60,503 | | $ | 60,271 | | $ | 232 | | $ | - | | $ | - | | $ | - | | $ | - | | $ | - | |
Mortgage securitizations (4) |
|
|
|
|
|
|
|
| ||||||||||||||||
U.S. agency-sponsored | 264,848 | | - | | 264,848 | | 5,213 | | - | | - | | 110 | | 5,323 | | ||||||||
Non-agency-sponsored | 17,888 | | 1,304 | | 16,584 | | 577 | | - | | - | | 1 | | 578 | | ||||||||
Citi-administered asset-backed commercial paper conduits (ABCP) | 29,181 | | 29,181 | | - | | - | | - | | - | | - | | - | | ||||||||
Collateralized debt obligations (CDOs) | 5,617 | | - | | 5,617 | | 219 | | - | | - | | 86 | | 305 | | ||||||||
Collateralized loan obligations (CLOs) | 14,119 | | - | | 14,119 | | 1,746 | | - | | - | | - | | 1,746 | | ||||||||
Asset-based financing | 63,900 | | 1,151 | | 62,749 | | 22,928 | | 66 | | 2,271 | | 333 | | 25,598 | | ||||||||
Municipal securities tender option bond trusts (TOBs) | 12,280 | | 6,671 | | 5,609 | | 3 | | - | | 3,670 | | - | | 3,673 | | ||||||||
Municipal investments | 23,706 | | 70 | | 23,636 | | 2,014 | | 2,197 | | 2,225 | | - | | 6,436 | | ||||||||
Client intermediation | 1,745 | | 137 | | 1,608 | | 10 | | - | | - | | 10 | | 20 | | ||||||||
Investment funds (5) | 31,992 | | 1,096 | | 30,896 | | 16 | | 382 | | 124 | | - | | 522 | | ||||||||
Trust preferred securities | 2,633 | | - | | 2,633 | | - | | 6 | | - | | - | | 6 | | ||||||||
Other | 8,298 | | 2,909 | | 5,389 | | 183 | | 1,451 | | 23 | | 73 | | 1,730 | | ||||||||
Total (6) | $ | 536,710 | | $ | 102,790 | | $ | 433,920 | | $ | 32,909 | | $ | 4,102 | | $ | 8,313 | | $ | 613 | | $ | 45,937 | |
(1) | The definition of maximum exposure to loss is included in the text that follows this table. |
(2) | Included on Citigroup's June 30, 2015 and December 31, 2014 Consolidated Balance Sheet. |
162
(3) | A significant unconsolidated VIE is an entity where the Company has any variable interest or continuing involvement considered to be significant, regardless of the likelihood of loss or the notional amount of exposure. |
(4) | Citigroup mortgage securitizations also include agency and non-agency (private-label) re-securitization activities. These SPEs are not consolidated. See "Re-securitizations" below for further discussion. |
(5) Substantially all of the unconsolidated investment funds' assets are related to retirement funds in Mexico managed by Citi. See "Investment Funds" below for further discussion.
(6) Citi's total involvement with Citicorp SPE assets was $470.2 billion and $483.9 billion as of June 30, 2015 and December 31, 2014 , respectively, with the remainder related to Citi Holdings.
The previous tables do not include:
• | certain venture capital investments made by some of the Company's private equity subsidiaries, as the Company accounts for these investments in accordance with the Investment Company Audit Guide (codified in ASC 946); |
• | certain limited partnerships that are investment funds that qualify for the deferral from the requirements of ASC 810 where the Company is the general partner and the limited partners have the right to replace the general partner or liquidate the funds; |
• | certain investment funds for which the Company provides investment management services and personal estate trusts for which the Company provides administrative, trustee and/or investment management services; |
• | VIEs structured by third parties where the Company holds securities in inventory, as these investments are made on arm's-length terms; |
• | certain positions in mortgage-backed and asset-backed securities held by the Company, which are classified as Trading account assets or Investments , where the Company has no other involvement with the related securitization entity deemed to be significant (for more information on these positions, see Notes 12 and 13 to the Consolidated Financial Statements); |
• | certain representations and warranties exposures in legacy Securities and Banking -sponsored mortgage-backed and asset-backed securitizations, where the Company has no variable interest or continuing involvement as servicer. The outstanding balance of mortgage loans securitized during 2005 to 2008 where the Company has no variable interest or continuing involvement as servicer was approximately $13 billion and $14 billion at June 30, 2015 and December 31, 2014 , respectively; and |
• | certain representations and warranties exposures in Citigroup residential mortgage securitizations, where the original mortgage loan balances are no longer outstanding. |
The asset balances for consolidated VIEs represent the carrying amounts of the assets consolidated by the Company. The carrying amount may represent the amortized cost or the current fair value of the assets depending on the legal form of the asset (e.g., security or loan) and the Company's standard accounting policies for the asset type and line of business.
The asset balances for unconsolidated VIEs where the Company has significant involvement represent the most current information available to the Company. In most cases, the asset balances represent an amortized cost basis without regard to impairments in fair value, unless fair value information is readily available to the Company. For VIEs that obtain asset exposures synthetically through derivative instruments (for example, synthetic CDOs), the tables generally include the full original notional amount of the derivative as an asset balance.
The maximum funded exposure represents the balance sheet carrying amount of the Company's investment in the VIE. It reflects the initial amount of cash invested in the VIE adjusted for any accrued interest and cash principal payments received. The carrying amount may also be adjusted for increases or declines in fair value or any impairment in value recognized in earnings. The maximum exposure of unfunded positions represents the remaining undrawn committed amount, including liquidity and credit facilities provided by the Company, or the notional amount of a derivative instrument considered to be a variable interest. In certain transactions, the Company has entered into derivative instruments or other arrangements that are not considered variable interests in the VIE (e.g., interest rate swaps, cross-currency swaps, or where the Company is the purchaser of credit protection under a credit default swap or total return swap where the Company pays the total return on certain assets to the SPE). Receivables under such arrangements are not included in the maximum exposure amounts.
163
Funding Commitments for Significant Unconsolidated VIEs-Liquidity Facilities and Loan Commitments
The following table presents the notional amount of liquidity facilities and loan commitments that are classified as funding commitments in the VIE tables above as of June 30, 2015 and December 31, 2014 :
| June 30, 2015 | December 31, 2014 | ||||||||||
| Liquidity | Loan | Liquidity | Loan | ||||||||
In millions of dollars | facilities | commitments | facilities | commitments | ||||||||
Asset-based financing | $ | 5 | | $ | 2,143 | | $ | 5 | | $ | 2,266 | |
Municipal securities tender option bond trusts (TOBs) | 3,440 | | - | | 3,670 | | - | | ||||
Municipal investments | - | | 2,660 | | - | | 2,225 | | ||||
Investment funds | - | | 102 | | - | | 124 | | ||||
Other | - | | 47 | | - | | 23 | | ||||
Total funding commitments | $ | 3,445 | | $ | 4,952 | | $ | 3,675 | | $ | 4,638 | |
Consolidated VIEs
The Company engages in on-balance sheet securitizations, which are securitizations that do not qualify for sales treatment; thus, the assets remain on the Company's balance sheet, and any proceeds received are recognized as secured liabilities. The consolidated VIEs included in the tables below represent hundreds of separate entities with which the Company is involved. In general, the third-party investors in the obligations of consolidated VIEs have legal recourse only to the assets of the respective VIEs and do not have such recourse to the Company, except where the Company has provided a guarantee to the investors or is the counterparty to certain derivative transactions involving the VIE. Thus, the
Company's maximum legal exposure to loss related to consolidated VIEs is significantly less than the carrying value of the consolidated VIE assets due to outstanding third-party financing. Intercompany assets and liabilities are excluded from the table. All VIE assets are restricted from being sold or pledged as collateral. The cash flows from these assets are the only source used to pay down the associated liabilities, which are non-recourse to the Company's general assets.
The following table presents the carrying amounts and classifications of consolidated assets that are collateral for consolidated VIE obligations as of June 30, 2015 and December 31, 2014 :
In billions of dollars | June 30, 2015 | December 31, 2014 | ||||
Cash | $ | 0.1 | | $ | 0.3 | |
Trading account assets | 1.1 | | 0.7 | | ||
Investments | 6.6 | | 8.0 | | ||
Total loans, net of allowance | 82.4 | | 93.2 | | ||
Other | 6.1 | | 0.6 | | ||
Total assets | $ | 96.3 | | $ | 102.8 | |
Short-term borrowings | $ | 15.3 | | $ | 22.7 | |
Long-term debt | 32.1 | | 40.1 | | ||
Other liabilities | 5.3 | | 0.9 | | ||
Total liabilities (1) | $ | 52.7 | | $ | 63.7 | |
(1) | The total liabilities of consolidated VIEs for which creditors or beneficial interest holders do not have recourse to the general credit of Citi were $50.3 billion and $61.2 billion as of June 30, 2015 and December 31, 2014 , respectively. Liabilities of consolidated VIEs for which creditors or beneficial interest holders have recourse to the general credit of Citi comprise two items included in the above table: 1) credit enhancements provided to consolidated Citi-administered commercial paper conduits in the form of letters of credit of $2.3 billion at June 30, 2015 and December 31, 2014 and; 2) credit guarantees provided by Citi to certain consolidated municipal tender option bond trusts of $83 million and $198 million at June 30, 2015 and December 31, 2014 , respectively. |
Significant Interests in Unconsolidated VIEs-Balance Sheet Classification
The following table presents the carrying amounts and classification of significant variable interests in unconsolidated VIEs as of June 30, 2015 and December 31, 2014 :
In billions of dollars | June 30, 2015 | December 31, 2014 | ||||
Trading account assets | $ | 5.9 | | $ | 7.6 | |
Investments | 2.6 | | 2.6 | | ||
Total loans, net of allowance | 26.8 | | 25.0 | | ||
Other | 2.0 | | 2.0 | | ||
Total assets | $ | 37.3 | | $ | 37.2 | |
164
Credit Card Securitizations
The Company securitizes credit card receivables through trusts established to purchase the receivables. Citigroup transfers receivables into the trusts on a non-recourse basis. Credit card securitizations are revolving securitizations; as customers pay their credit card balances, the cash proceeds are used to purchase new receivables and replenish the receivables in the trust.
Substantially all of the Company's credit card securitization activity is through two trusts-Citibank Credit Card Master Trust (Master Trust) and the Citibank Omni Master Trust (Omni Trust), with the substantial majority through the Master Trust. These trusts are consolidated entities because, as servicer, Citigroup has the power to direct
the activities that most significantly impact the economic performance of the trusts, Citigroup holds a seller's interest and certain securities issued by the trusts, and also provides liquidity facilities to the trusts, which could result in potentially significant losses or benefits from the trusts. Accordingly, the transferred credit card receivables remain on Citi's Consolidated Balance Sheet with no gain or loss recognized. The debt issued by the trusts to third parties is included on Citi's Consolidated Balance Sheet.
The Company utilizes securitizations as one of the sources of funding for its business in North America . The following table reflects amounts related to the Company's securitized credit card receivables as of June 30, 2015 and December 31, 2014 :
In billions of dollars | June 30, 2015 | December 31, 2014 | ||||
Ownership interests in principal amount of trust credit card receivables | ||||||
Sold to investors via trust-issued securities | $ | 31.3 | | $ | 37.0 | |
Retained by Citigroup as trust-issued securities | 9.0 | | 10.1 | | ||
Retained by Citigroup via non-certificated interests | 15.9 | | 14.2 | | ||
Total | $ | 56.2 | | $ | 61.3 | |
Credit Card Securitizations
The following tables summarize selected cash flow information related to Citigroup's credit card securitizations for the three and six months ended June 30, 2015 and 2014 :
| Three months ended | |||||
In billions of dollars | 2015 | 2014 | ||||
Proceeds from new securitizations | $ | - | | $ | 2.4 | |
Pay down of maturing notes | (3.1 | ) | (1.3 | ) | ||
| Six months ended June 30, | |||||
In billions of dollars | 2015 | 2014 | ||||
Proceeds from new securitizations | $ | - | | $ | 6.8 | |
Pay down of maturing notes | (5.8 | ) | (1.3 | ) | ||
Managed Loans
After securitization of credit card receivables, the Company continues to maintain credit card customer account relationships and provides servicing for receivables transferred to the trusts. As a result, the Company considers the securitized credit card receivables to be part of the business it manages. As Citigroup consolidates the credit card trusts, all managed securitized card receivables are on-balance sheet.
Funding, Liquidity Facilities and Subordinated Interests
As noted above, Citigroup securitizes credit card receivables through two securitization trusts-Master Trust, which is part of Citicorp, and Omni Trust, which is also substantially all part of Citicorp. The liabilities of the trusts are included in the Consolidated Balance Sheet, excluding those retained by Citigroup.
The Master Trust issues fixed- and floating-rate term notes. Some of the term notes are issued to multi-seller commercial paper conduits. The weighted average maturity of
the term notes issued by the Master Trust was 2.8 years as of June 30, 2015 and December 31, 2014 .
Master Trust Liabilities (at par value)
In billions of dollars | June 30, 2015 | Dec. 31, 2014 | ||||
Term notes issued to third parties | $ | 30.0 | | $ | 35.7 | |
Term notes retained by Citigroup affiliates | 7.1 | | 8.2 | | ||
Total Master Trust liabilities | $ | 37.1 | | $ | 43.9 | |
The Omni Trust issues fixed- and floating-rate term notes, some of which are purchased by multi-seller commercial paper conduits. The weighted average maturity of the third-party term notes issued by the Omni Trust was 1.4 years as of June 30, 2015 and 1.9 years as of December 31, 2014 .
Omni Trust Liabilities (at par value)
In billions of dollars | June 30, 2015 | Dec. 31, 2014 | ||||
Term notes issued to third parties | $ | 1.3 | | $ | 1.3 | |
Term notes retained by Citigroup affiliates | 1.9 | | 1.9 | | ||
Total Omni Trust liabilities | $ | 3.2 | | $ | 3.2 | |
165
Mortgage Securitizations
The Company provides a wide range of mortgage loan products to a diverse customer base. Once originated, the Company often securitizes these loans through the use of VIEs. These VIEs are funded through the issuance of trust certificates backed solely by the transferred assets. These certificates have the same life as the transferred assets. In addition to providing a source of liquidity and less expensive funding, securitizing these assets also reduces the Company's credit exposure to the borrowers. These mortgage loan securitizations are primarily non-recourse, thereby effectively transferring the risk of future credit losses to the purchasers of the securities issued by the trust. However, the Company's U.S. consumer mortgage business generally retains the servicing rights and in certain instances retains investment securities, interest-only strips and residual interests in future cash flows from the trusts and also provides servicing for a limited number of ICG securitizations.
The Company securitizes mortgage loans generally through either a government-sponsored agency, such as Ginnie Mae, Fannie Mae or Freddie Mac (U.S. agency-sponsored
mortgages), or private-label (non-agency-sponsored mortgages) securitization. The Company is not the primary beneficiary of its U.S. agency-sponsored mortgage securitizations because Citigroup does not have the power to direct the activities of the VIE that most significantly impact the entity's economic performance. Therefore, Citi does not consolidate these U.S. agency-sponsored mortgage securitizations.
The Company does not consolidate certain non-agency-sponsored mortgage securitizations because Citi is either not the servicer with the power to direct the significant activities of the entity or Citi is the servicer but the servicing relationship is deemed to be a fiduciary relationship; therefore, Citi is not deemed to be the primary beneficiary of the entity.
In certain instances, the Company has (i) the power to direct the activities and (ii) the obligation to either absorb losses or the right to receive benefits that could be potentially significant to its non-agency-sponsored mortgage securitizations and, therefore, is the primary beneficiary and thus consolidates the VIE.
Mortgage Securitizations
The following tables summarize selected cash flow information related to Citigroup mortgage securitizations for the three and six months ended June 30, 2015 and 2014 :
| Three months ended June 30, | |||||||||||
| 2015 | 2014 | ||||||||||
In billions of dollars | U.S. agency- | | Non-agency- | | U.S. agency- | | Non-agency- | | ||||
Proceeds from new securitizations | $ | 7.3 | | $ | 2.5 | | $ | 6.1 | | $ | 3.6 | |
Contractual servicing fees received | 0.1 | | - | | 0.1 | | - | | ||||
Cash flows received on retained interests and other net cash flows | - | | - | | - | | - | | ||||
| Six months ended June 30, | |||||||||||
| 2015 | 2014 | ||||||||||
In billions of dollars | U.S. agency- | | Non-agency- | | U.S. agency- | | Non-agency- | | ||||
Proceeds from new securitizations | $ | 12.9 | | $ | 6.1 | | $ | 13.3 | | $ | 5.2 | |
Contractual servicing fees received | 0.2 | | - | | 0.3 | | - | | ||||
Cash flows received on retained interests and other net cash flows | - | | - | | - | | - | | ||||
Gains recognized on the securitizations of U.S. agency-sponsored mortgages were $48 million and $90 million for the three and six months ended June 30, 2015 , respectively. For the three and six months ended June 30, 2015 , gains recognized on the securitization of non-agency sponsored mortgages were $15 million and $31 million , respectively.
Gains recognized on the securitization of U.S. agency-sponsored mortgages were $19 million and $32 million for the three and six months ended June 30, 2014 , respectively. For the three and six months ended June 30, 2014 , gains recognized on the securitization of non-agency sponsored mortgages were $25 million and $29 million , respectively.
166
Key assumptions used in measuring the fair value of retained interests at the date of sale or securitization of mortgage receivables for the three and six months ended June 30, 2015 and 2014 were as follows:
| Three months ended June 30, 2015 | |||||
|
| Non-agency-sponsored mortgages (1) |
| |||
| U.S. agency- | | Senior | | Subordinated | |
Discount rate | 0.0% to 8.2% | | - | | 11.2% to 12.1% | |
Weighted average discount rate | 7.0 | % | - | | 11.6 | % |
Constant prepayment rate | 5.7% to 15.5% | | - | | 3.5% to 8.0% | |
Weighted average constant prepayment rate | 9.3 | % | - | | 5.6 | % |
Anticipated net credit losses (2) | NM | | - | | 38.1% to 52.1% | |
Weighted average anticipated net credit losses | NM | | - | | 45.7 | % |
Weighted average life | 6.9 to 10.1 years | | - | | 8.9 to 12.9 years | |
| Three months ended June 30, 2014 | |||||
|
| Non-agency-sponsored mortgages (1) |
| |||
| U.S. agency- | | Senior | | Subordinated | |
Discount rate | 0.7% to 12.0% | | 4.6 | % | 2.6% to 7.0% | |
Weighted average discount rate | 10.9 | % | 4.6 | % | 6.1 | % |
Constant prepayment rate | 4.7% to 13.3% | | 0.0 | % | 3.3 | % |
Weighted average constant prepayment rate | 5.5 | % | 0.0 | % | 3.3 | % |
Anticipated net credit losses (2) | NM | | 40.0 | % | 58.5 | % |
Weighted average anticipated net credit losses | NM | | 40.0 | % | 58.5 | % |
Weighted average life | 7.4 to 9.4 years | | 8.6 years | | 4.0 to 10.1 years | |
| Six months ended June 30, 2015 | |||||
|
| Non-agency-sponsored mortgages (1) |
| |||
| U.S. agency- | | Senior | | Subordinated | |
Discount rate | 0.0% to 8.2% | | 2.8 | % | 0.0% to 12.1% | |
Weighted average discount rate | 7.0 | % | 2.8 | % | 5.5 | % |
Constant prepayment rate | 5.7% to 34.9% | | 0.0 | % | 0.0% to 8.0% | |
Weighted average constant prepayment rate | 13.6 | % | 0.0 | % | 3.3 | % |
Anticipated net credit losses (2) | NM | | 40.0 | % | 0.0% to 55.9% | |
Weighted average anticipated net credit losses | NM | | 40.0 | % | 40.2 | % |
Weighted average life | 3.5 to 10.1 years | | 9.7 years | | 0.0 to 12.9 years | |
| Six months ended June 30, 2014 | |||||
|
| Non-agency-sponsored mortgages (1) |
| |||
| U.S. agency- | | Senior | | Subordinated | |
Discount rate | 0.0% to 12.0% | | 1.4% to 4.6% | | 2.6% to 9.1% | |
Weighted average discount rate | 10.7 | % | 3.8 | % | 6.8 | % |
Constant prepayment rate | 0.0% to 16.0% | | 0.0 | % | 3.3% to 6.1% | |
Weighted average constant prepayment rate | 5.1 | % | 0.0 | % | 5.2 | % |
Anticipated net credit losses (2) | NM | | 40.0 | % | 40.0% to 58.5% | |
Weighted average anticipated net credit losses | NM | | 40.0 | % | 52.9 | % |
Weighted average life | 0.0 to 9.7 years | | 2.6 to 8.6 years | | 3.0 to 14.5 years | |
(1) | Disclosure of non-agency-sponsored mortgages as senior and subordinated interests is indicative of the interests' position in the capital structure of the securitization. |
167
(2) | Anticipated net credit losses represent estimated loss severity associated with defaulted mortgage loans underlying the mortgage securitizations disclosed above. Anticipated net credit losses, in this instance, do not represent total credit losses incurred to date, nor do they represent credit losses expected on retained interests in mortgage securitizations. |
NM Not meaningful. Anticipated net credit losses are not meaningful due to U.S. agency guarantees.
The interests retained by the Company range from highly rated and/or senior in the capital structure to unrated and/or residual interests.
At June 30, 2015 and December 31, 2014 , the key assumptions used to value retained interests, and the sensitivity of the fair value to adverse changes of 10% and 20% in each of the key assumptions, are set forth in the tables
below. The negative effect of each change is calculated independently, holding all other assumptions constant. Because the key assumptions may not be independent, the net effect of simultaneous adverse changes in the key assumptions may be less than the sum of the individual effects shown below.
| June 30, 2015 | |||||
|
| Non-agency-sponsored mortgages (1) |
| |||
| U.S. agency- | | Senior | | Subordinated | |
Discount rate | 0.0% to 22.8% | | 0.4% to 37.6% | | 1.5% to 20.0% | |
Weighted average discount rate | 6.8 | % | 10.8 | % | 8.4 | % |
Constant prepayment rate | 6.1% to 28.6% | | 3.2% to 100.0% | | 0.5% to 21.5% | |
Weighted average constant prepayment rate | 13.2 | % | 13.8 | % | 8.1 | % |
Anticipated net credit losses (2) | NM | | 0.0% to 83.0% | | 5.1% to 79.9% | |
Weighted average anticipated net credit losses | NM | | 40.7 | % | 49.8 | % |
Weighted average life | 0.5 to 21.6 years | | 0.3 to 24.2 years | | 0.4 to 21.9 years | |
| December 31, 2014 | |||||
|
| Non-agency-sponsored mortgages (1) |
| |||
| U.S. agency- | | Senior | | Subordinated | |
Discount rate | 0.0% to 21.2% | | 1.1% to 47.1% | | 1.3% to 19.6% | |
Weighted average discount rate | 8.4 | % | 7.7 | % | 8.2 | % |
Constant prepayment rate | 6.0% to 41.4% | | 2.0% to 100.0% | | 0.5% to 16.2% | |
Weighted average constant prepayment rate | 15.3 | % | 10.9 | % | 7.2 | % |
Anticipated net credit losses (2) | NM | | 0.0% to 92.4% | | 13.7% to 83.8% | |
Weighted average anticipated net credit losses | NM | | 51.7 | % | 52.5 | % |
Weighted average life | 0.0 to 16.0 years | | 0.3 to 14.4 years | | 0.0 to 24.4 years | |
(1) | Disclosure of non-agency-sponsored mortgages as senior and subordinated interests is indicative of the interests' position in the capital structure of the securitization. |
(2) | Anticipated net credit losses represent estimated loss severity associated with defaulted mortgage loans underlying the mortgage securitizations disclosed above. Anticipated net credit losses, in this instance, do not represent total credit losses incurred to date, nor do they represent credit losses expected on retained interests in mortgage securitizations. |
(3) | Citi Holdings held no subordinated interests in mortgage securitizations as of June 30, 2015 and December 31, 2014 . |
NM Not meaningful. Anticipated net credit losses are not meaningful due to U.S. agency guarantees.
168
|
| Non-agency-sponsored mortgages (1) |
| ||||||
In millions of dollars at June 30, 2015 | U.S. agency- | | Senior | | Subordinated | | |||
Carrying value of retained interests | $ | 2,556 | | $ | 181 | | $ | 547 | |
Discount rates |
|
|
| ||||||
Adverse change of 10% | $ | (71 | ) | $ | (8 | ) | $ | (29 | ) |
Adverse change of 20% | (138 | ) | (15 | ) | (56 | ) | |||
Constant prepayment rate |
|
|
| ||||||
Adverse change of 10% | (103 | ) | (3 | ) | (10 | ) | |||
Adverse change of 20% | (199 | ) | (6 | ) | (20 | ) | |||
Anticipated net credit losses |
|
|
| ||||||
Adverse change of 10% | NM | | (6 | ) | (9 | ) | |||
Adverse change of 20% | NM | | (12 | ) | (15 | ) | |||
|
| Non-agency-sponsored mortgages (1) |
| ||||||
In millions of dollars at December 31, 2014 | U.S. agency- | | Senior | | Subordinated | | |||
Carrying value of retained interests | $ | 2,374 | | $ | 310 | | $ | 554 | |
Discount rates |
|
|
| ||||||
Adverse change of 10% | $ | (69 | ) | $ | (7 | ) | $ | (30 | ) |
Adverse change of 20% | (134 | ) | (13 | ) | (57 | ) | |||
Constant prepayment rate |
|
|
| ||||||
Adverse change of 10% | (93 | ) | (3 | ) | (9 | ) | |||
Adverse change of 20% | (179 | ) | (5 | ) | (18 | ) | |||
Anticipated net credit losses |
|
|
| ||||||
Adverse change of 10% | NM | | (6 | ) | (9 | ) | |||
Adverse change of 20% | NM | | (10 | ) | (16 | ) | |||
(1) | Disclosure of non-agency-sponsored mortgages as senior and subordinated interests is indicative of the interests' position in the capital structure of the securitization. |
NM Not meaningful. Anticipated net credit losses are not meaningful due to U.S. agency guarantees.
Mortgage Servicing Rights
In connection with the securitization of mortgage loans, the Company's U.S. consumer mortgage business generally retains the servicing rights, which entitle the Company to a future stream of cash flows based on the outstanding principal balances of the loans and the contractual servicing fee. Failure to service the loans in accordance with contractual requirements may lead to a termination of the servicing rights and the loss of future servicing fees.
These transactions create an intangible asset referred to as mortgage servicing rights (MSRs), which are recorded at fair value on Citi's Consolidated Balance Sheet. The fair value of Citi's capitalized MSRs was $1.9 billion and $2.3 billion at June 30, 2015 and 2014 , respectively. Of these amounts, approximately $1.8 billion was specific to Citicorp, with the remainder to Citi Holdings as of June 30, 2015 and 2014 . The MSRs correspond to principal loan balances of $209 billion and $250 billion as of June 30, 2015 and 2014 , respectively. The following tables summarize the changes in capitalized MSRs for the three and six months ended June 30, 2015 and 2014 :
| Three months ended June 30, | |||||
In millions of dollars | 2015 | 2014 | ||||
Balance, as of March 31 | $ | 1,685 | | $ | 2,586 | |
Originations | 68 | | 49 | | ||
Changes in fair value of MSRs due to changes in inputs and assumptions | 262 | | (91 | ) | ||
Other changes (1) | (82 | ) | (99 | ) | ||
Sale of MSRs | (9 | ) | (163 | ) | ||
Balance, as of June 30 | $ | 1,924 | | $ | 2,282 | |
| Six months ended June 30, | |||||
In millions of dollars | 2015 | 2014 | ||||
Balance, beginning of year | $ | 1,845 | | $ | 2,718 | |
Originations | 111 | | 99 | | ||
Changes in fair value of MSRs due to changes in inputs and assumptions | 191 | | (175 | ) | ||
Other changes (1) | (182 | ) | (225 | ) | ||
Sale of MSRs | (41 | ) | (135 | ) | ||
Balance, as of June 30 | $ | 1,924 | | $ | 2,282 | |
(1) | Represents changes due to customer payments and passage of time. |
169
The fair value of the MSRs is primarily affected by changes in prepayments of mortgages that result from shifts in mortgage interest rates. Specifically, higher interest rates tend to lead to declining prepayments, which causes the fair value of the MSRs to increase. In managing this risk, the Company economically hedges a significant portion of the value of its MSRs through the use of interest rate derivative contracts, forward purchase and sale commitments of mortgage-backed securities and purchased securities classified as Trading account assets . The Company receives fees during the course of servicing previously securitized mortgages. The amounts of these fees for the three and six months ended June 30, 2015 and 2014 were as follows:
| Three months ended June 30, | Six months ended June 30, | ||||||||||
In millions of dollars | 2015 | 2014 | 2015 | 2014 | ||||||||
Servicing fees | $ | 141 | | $ | 162 | | $ | 281 | | $ | 332 | |
Late fees | 4 | | 5 | | 8 | | 15 | | ||||
Ancillary fees | 15 | | 16 | | 22 | | 36 | | ||||
Total MSR fees | $ | 160 | | $ | 183 | | $ | 311 | | $ | 383 | |
These fees are classified in the Consolidated Statement of Income as Other revenue.
Re-securitizations
The Company engages in re-securitization transactions in which debt securities are transferred to a VIE in exchange for new beneficial interests. During the three and six months ended June 30, 2015 , Citi transferred non-agency (private-label) securities with an original par value of approximately $195 million and $649 million , respectively, to re-securitization entities, compared to $251 million and $389 million for the three and six months ended June 30, 2014 . These securities are backed by either residential or commercial mortgages and are often structured on behalf of clients.
As of June 30, 2015 , the fair value of Citi-retained interests in private-label re-securitization transactions structured by Citi totaled approximately $435 million (including $79 million related to re-securitization transactions executed in 2015 ), which has been recorded in Trading account assets . Of this amount, approximately $29 million was related to senior beneficial interests and approximately $406 million was related to subordinated beneficial interests. As of December 31, 2014 , the fair value of Citi-retained interests in private-label re-securitization transactions structured by Citi totaled approximately $545 million (including $194 million related to re-securitization transactions executed in 2014 ). Of this amount, approximately $133 million was related to senior beneficial interests, and approximately $412 million was related to subordinated beneficial interests. The original par value of private-label re-securitization transactions in which Citi holds a retained interest as of June 30, 2015 and December 31, 2014 was approximately $5.2 billion and $5.1 billion , respectively.
The Company also re-securitizes U.S. government-agency guaranteed mortgage-backed (agency) securities. During the three and six months ended June 30, 2015 , Citi transferred agency securities with a fair value of approximately $4.6 billion and $8.9 billion , respectively, to re-securitization
entities compared to approximately $4.9 billion and $11.3 billion for the three and six months ended June 30, 2014 .
As of June 30, 2015 , the fair value of Citi-retained interests in agency re-securitization transactions structured by Citi totaled approximately $2.1 billion (including $1.6 billion related to re-securitization transactions executed in 2015 ) compared to $1.8 billion as of December 31, 2014 (including $1.5 billion related to re-securitization transactions executed in 2014 ), which is recorded in Trading account assets . The original fair value of agency re-securitization transactions in which Citi holds a retained interest as of June 30, 2015 and December 31, 2014 was approximately $69.0 billion and $73.0 billion , respectively.
As of June 30, 2015 and December 31, 2014 , the Company did not consolidate any private-label or agency re-securitization entities.
Citi-Administered Asset-Backed Commercial Paper Conduits
The Company is active in the asset-backed commercial paper conduit business as administrator of several multi-seller commercial paper conduits and also as a service provider to single-seller and other commercial paper conduits sponsored by third parties.
Citi's multi-seller commercial paper conduits are designed to provide the Company's clients access to low-cost funding in the commercial paper markets. The conduits purchase assets from or provide financing facilities to clients and are funded by issuing commercial paper to third-party investors. The conduits generally do not purchase assets originated by the Company. The funding of the conduits is facilitated by the liquidity support and credit enhancements provided by the Company.
As administrator to Citi's conduits, the Company is generally responsible for selecting and structuring assets purchased or financed by the conduits, making decisions regarding the funding of the conduits, including determining the tenor and other features of the commercial paper issued, monitoring the quality and performance of the conduits' assets, and facilitating the operations and cash flows of the conduits. In return, the Company earns structuring fees from customers for individual transactions and earns an administration fee from the conduit, which is equal to the income from the client program and liquidity fees of the conduit after payment of conduit expenses. This administration fee is fairly stable, since most risks and rewards of the underlying assets are passed back to the clients. Once the asset pricing is negotiated, most ongoing income, costs and fees are relatively stable as a percentage of the conduit's size.
The conduits administered by the Company do not generally invest in liquid securities that are formally rated by third parties. The assets are privately negotiated and structured transactions that are generally designed to be held by the conduit, rather than actively traded and sold. The yield earned by the conduit on each asset is generally tied to the rate on the commercial paper issued by the conduit, thus passing interest rate risk to the client. Each asset purchased by the conduit is structured with transaction-specific credit enhancement features provided by the third-party client seller, including over collateralization, cash and excess spread collateral accounts, direct recourse or third-party guarantees. These
170
credit enhancements are sized with the objective of approximating a credit rating of A or above, based on the Company's internal risk ratings. At June 30, 2015 and December 31, 2014 , the conduits had approximately $25.9 billion and $29.2 billion of purchased assets outstanding, respectively, and had incremental funding commitments with clients of approximately $12.8 billion and $13.5 billion , respectively.
Substantially all of the funding of the conduits is in the form of short-term commercial paper. At June 30, 2015 and December 31, 2014 , the weighted average remaining lives of the commercial paper issued by the conduits were approximately 60 and 57 days , respectively.
The primary credit enhancement provided to the conduit investors is in the form of transaction-specific credit enhancements described above. One conduit holds only loans that are fully guaranteed primarily by AAA-rated government agencies that support export and development financing programs. In addition to the transaction-specific credit enhancements, the conduits, other than the government guaranteed loan conduit, have obtained a letter of credit from the Company, which is equal to at least 8% to 10% of the conduit's assets with a minimum of $200 million . The letters of credit provided by the Company to the conduits total approximately $2.3 billion as of June 30, 2015 and December 31, 2014 . The net result across multi-seller conduits administered by the Company, other than the government guaranteed loan conduit, is that, in the event defaulted assets exceed the transaction-specific credit enhancements described above, any losses in each conduit are allocated first to the Company and then the commercial paper investors.
The Company also provides the conduits with two forms of liquidity agreements that are used to provide funding to the conduits in the event of a market disruption, among other events. Each asset of the conduits is supported by a transaction-specific liquidity facility in the form of an asset purchase agreement (APA). Under the APA, the Company has generally agreed to purchase non-defaulted eligible receivables from the conduit at par. The APA is not designed to provide credit support to the conduit, as it generally does not permit the purchase of defaulted or impaired assets. Any funding under the APA will likely subject the underlying conduit clients to increased interest costs. In addition, the Company provides the conduits with program-wide liquidity in the form of short-term lending commitments. Under these commitments, the Company has agreed to lend to the conduits in the event of a short-term disruption in the commercial paper market, subject to specified conditions. The Company receives fees for providing both types of liquidity agreements and considers these fees to be on fair market terms.
Finally, the Company is one of several named dealers in the commercial paper issued by the conduits and earns a market-based fee for providing such services. Along with third-party dealers, the Company makes a market in the commercial paper and may from time to time fund commercial paper pending sale to a third party. On specific dates with less liquidity in the market, the Company may hold in inventory commercial paper issued by conduits administered by the Company, as well as conduits administered by third parties. Separately, in the normal course of business, the Company
invests in commercial paper, including commercial paper issued by the Company's conduits. At June 30, 2015 and December 31, 2014 , the Company owned $15.2 billion and $10.6 billion , respectively, of the commercial paper issued by its administered conduits. The Company's investments were not driven by market illiquidity and the Company is not obligated under any agreement to purchase the commercial paper issued by the conduits.
The asset-backed commercial paper conduits are consolidated by the Company. The Company has determined that, through its roles as administrator and liquidity provider, it has the power to direct the activities that most significantly impact the entities' economic performance. These powers include its ability to structure and approve the assets purchased by the conduits, its ongoing surveillance and credit mitigation activities, its ability to sell or repurchase assets out of the conduits, and its liability management. In addition, as a result of all the Company's involvement described above, it was concluded that the Company has an economic interest that could potentially be significant. However, the assets and liabilities of the conduits are separate and apart from those of Citigroup. No assets of any conduit are available to satisfy the creditors of Citigroup or any of its other subsidiaries.
Collateralized Debt and Loan Obligations
A securitized collateralized debt obligation (CDO) is a VIE that purchases a pool of assets consisting of asset-backed securities and synthetic exposures through derivatives on asset-backed securities and issues multiple tranches of equity and notes to investors.
A cash CDO, or arbitrage CDO, is a CDO designed to take advantage of the difference between the yield on a portfolio of selected assets, typically residential mortgage-backed securities, and the cost of funding the CDO through the sale of notes to investors. "Cash flow" CDOs are entities in which the CDO passes on cash flows from a pool of assets, while "market value" CDOs pay to investors the market value of the pool of assets owned by the CDO at maturity. In these transactions, all of the equity and notes issued by the CDO are funded, as the cash is needed to purchase the debt securities.
A synthetic CDO is similar to a cash CDO, except that the CDO obtains exposure to all or a portion of the referenced assets synthetically through derivative instruments, such as credit default swaps. Because the CDO does not need to raise cash sufficient to purchase the entire referenced portfolio, a substantial portion of the senior tranches of risk is typically passed on to CDO investors in the form of unfunded liabilities or derivative instruments. The CDO writes credit protection on select referenced debt securities to the Company or third parties. Risk is then passed on to the CDO investors in the form of funded notes or purchased credit protection through derivative instruments. Any cash raised from investors is invested in a portfolio of collateral securities or investment contracts. The collateral is then used to support the obligations of the CDO on the credit default swaps written to counterparties.
A securitized collateralized loan obligation (CLO) is substantially similar to the CDO transactions described above, except that the assets owned by the VIE (either cash instruments or synthetic exposures through derivative
171
instruments) are corporate loans and to a lesser extent corporate bonds, rather than asset-backed debt securities.
A third-party asset manager is typically retained by the CDO/CLO to select the pool of assets and manage those assets over the term of the VIE.
The Company earns fees for warehousing assets prior to the creation of a "cash flow" or "market value" CDO/CLO, structuring CDOs/CLOs and placing debt securities with investors. In addition, the Company has retained interests in many of the CDOs/CLOs it has structured and makes a market in the issued notes.
The Company's continuing involvement in synthetic CDOs/CLOs generally includes purchasing credit protection through credit default swaps with the CDO/CLO, owning a portion of the capital structure of the CDO/CLO in the form of both unfunded derivative positions (primarily "super-senior" exposures discussed below) and funded notes, entering into interest-rate swap and total-return swap transactions with the CDO/CLO, lending to the CDO/CLO, and making a market in the funded notes.
Where a CDO/CLO entity issues preferred shares (or subordinated notes that are the equivalent form), the preferred shares generally represent an insufficient amount of equity (less than 10% ) and create the presumption that preferred shares are insufficient to finance the entity's activities without subordinated financial support. In addition, although the preferred shareholders generally have full exposure to expected losses on the collateral and uncapped potential to receive expected residual returns, they generally do not have the ability to make decisions significantly affecting the entity's financial results because of their limited role in making day-to-day decisions and their limited ability to remove the asset manager. Because one or both of the above conditions will generally be met, the Company has concluded, even where a CDO/CLO entity issued preferred shares, the entity should be classified as a VIE.
In general, the asset manager, through its ability to purchase and sell assets or-where the reinvestment period of a CDO/CLO has expired-the ability to sell assets, will have the power to direct the activities of the entity that most significantly impact the economic performance of the CDO/CLO. However, where a CDO/CLO has experienced an event of default or an optional redemption period has gone into effect, the activities of the asset manager may be curtailed and/or certain additional rights will generally be provided to the investors in a CDO/CLO entity, including the right to direct the liquidation of the CDO/CLO entity.
The Company has retained significant portions of the "super-senior" positions issued by certain CDOs. These positions are referred to as "super-senior" because they represent the most senior positions in the CDO and, at the time of structuring, were senior to tranches rated AAA by independent rating agencies.
The Company does not generally have the power to direct the activities of the entity that most significantly impact the economic performance of the CDOs/CLOs, as this power is generally held by a third-party asset manager of the CDO/CLO. As such, those CDOs/CLOs are not consolidated. The Company may consolidate the CDO/CLO when: (i) the Company is the asset manager and no other single investor has
the unilateral ability to remove the Company or unilaterally cause the liquidation of the CDO/CLO, or the Company is not the asset manager but has a unilateral right to remove the third-party asset manager or unilaterally liquidate the CDO/CLO and receive the underlying assets, and (ii) the Company has economic exposure to the entity that could be potentially significant to the entity.
The Company continues to monitor its involvement in unconsolidated CDOs/CLOs to assess future consolidation risk. For example, if the Company were to acquire additional interests in these entities and obtain the right, due to an event of default trigger being met, to unilaterally liquidate or direct the activities of a CDO/CLO, the Company may be required to consolidate the asset entity. For cash CDOs/CLOs, the net result of such consolidation would be to gross up the Company's balance sheet by the current fair value of the securities held by third parties and assets held by the CDO/CLO, which amounts are not considered material. For synthetic CDOs/CLOs, the net result of such consolidation may reduce the Company's balance sheet, because intercompany derivative receivables and payables would be eliminated in consolidation, and other assets held by the CDO/CLO and the securities held by third parties would be recognized at their current fair values.
Key Assumptions and Retained Interests
At June 30, 2015 and December 31, 2014 , the key assumptions used to value retained interests in CLOs and CDOs, and the sensitivity of the fair value to adverse changes of 10% and 20% are set forth in the tables below:
| June 30, 2015 | |
| CDOs | CLOs |
Discount rate | 44.9% to 49.4% | 1.5% to 1.6% |
| December 31, 2014 | |
| CDOs | CLOs |
Discount rate | 44.7% to 49.2% | 1.4% to 5.0% |
| June 30, 2015 | |||||
In millions of dollars | CDOs | CLOs | ||||
Carrying value of retained interests | $ | 7 | | $ | 1,816 | |
Discount rates |
|
| ||||
Adverse change of 10% | $ | (1 | ) | $ | (10 | ) |
Adverse change of 20% | (1 | ) | (20 | ) | ||
| December 31, 2014 | |||||
In millions of dollars | CDOs | CLOs | ||||
Carrying value of retained interests | $ | 6 | | $ | 1,549 | |
Discount rates |
|
| ||||
Adverse change of 10% | $ | (1 | ) | $ | (9 | ) |
Adverse change of 20% | (2 | ) | (18 | ) | ||
172
Asset-Based Financing
The Company provides loans and other forms of financing to VIEs that hold assets. Those loans are subject to the same credit approvals as all other loans originated or purchased by the Company. Financings in the form of debt securities or derivatives are, in most circumstances, reported in Trading account assets and accounted for at fair value through earnings. The Company generally does not have the power to direct the activities that most significantly impact these VIEs' economic performance, and thus it does not consolidate them.
Asset-Based Financing
The primary types of Citigroup's asset-based financings, total assets of the unconsolidated VIEs with significant involvement, and the Company's maximum exposure to loss at June 30, 2015 and December 31, 2014 are shown below. For the Company to realize the maximum loss, the VIE (borrower) would have to default with no recovery from the assets held by the VIE.
| June 30, 2015 | |||||
In millions of dollars | Total | Maximum | ||||
Type |
|
| ||||
Commercial and other real estate | $ | 30,731 | | $ | 11,292 | |
Corporate loans | 586 | | 685 | | ||
Hedge funds and equities | 368 | | 58 | | ||
Airplanes, ships and other assets | 35,050 | | 15,451 | | ||
Total | $ | 66,735 | | $ | 27,486 | |
| December 31, 2014 | |||||
In millions of dollars | Total | Maximum | ||||
Type |
|
| ||||
Commercial and other real estate | $ | 26,146 | | $ | 9,476 | |
Corporate loans | 460 | | 473 | | ||
Hedge funds and equities | - | | - | | ||
Airplanes, ships and other assets | 36,143 | | 15,649 | | ||
Total | $ | 62,749 | | $ | 25,598 | |
The following table summarizes selected cash flow information related to asset-based financings for the quarters ended June 30, 2015 and 2014 :
| Three months ended | |||||
In billions of dollars | 2015 | 2014 | ||||
Proceeds from new securitizations | $ | - | | $ | - | |
Cash flows received on retained interests and other net cash flows | - | | 0.2 | | ||
| Six months ended June 30, | |||||
In billions of dollars | 2015 | 2014 | ||||
Proceeds from new securitizations | $ | - | | $ | 0.5 | |
Cash flows received on retained interests and other net cash flows | - | | 0.3 | | ||
Municipal Securities Tender Option Bond (TOB) Trusts
TOB trusts may hold fixed- or floating-rate, taxable or tax-exempt securities issued by state and local governments and municipalities. The trusts are typically structured as single-issuer trusts whose assets are purchased from either the Company or from other investors in the municipal securities market. TOB trusts finance the purchase of their municipal assets by issuing two classes of certificates: long-term, floating rate certificates ("Floaters") that are supported by a liquidity facility and residual interest certificates ("Residuals"). The Floaters are purchased by third-party investors, typically tax-exempt money market funds. The Residuals are purchased by the original owner of the municipal securities that are being financed.
Generally, there are two types of TOB trusts: customer TOB trusts and non-customer TOB trusts. Customer TOB trusts are trusts utilized by customers of the Company to finance their municipal securities investments; the Residuals issued by such trusts are purchased by the customer employing the funding. Non-customer TOB trusts are trusts used by the Company to finance its own investments in municipal securities; the Residuals issued by non-customer TOB trusts are purchased by the Company.
With respect to both customer and non-customer TOB trusts, the Company provides remarketing agent services. If Floaters are optionally tendered and the Company, in its role as remarketing agent, is unable to find a new investor within a specified period of time, the Company may, but is not obligated to, purchase the tendered Floaters into its own inventory. The level of the Company's inventory of such Floaters fluctuates over time. At June 30, 2015 and December 31, 2014 , the Company held $108 million and $3 million , respectively, of Floaters related to customer and non-customer TOB trusts.
For certain customer TOB trusts, the Company may also serve as a voluntary advance provider. In this capacity, the Company may, but is not obligated to, make loan advances to customer TOB trusts, which advances would be used by the Trusts to purchase optionally tendered Floaters that have not otherwise been successfully remarketed to a new investor. Such loans are secured by pledged Floaters. As of June 30, 2015, the Company had no outstanding voluntary advances to customer TOB trusts.
For certain non-customer trusts, the Company also provides credit enhancement. At June 30, 2015 and December 31, 2014 , approximately $83 million and $198 million , respectively, of the municipal bonds owned by TOB trusts have a credit guarantee provided by the Company.
The Company also provides liquidity services to many of the outstanding customer and non-customer trusts. If a trust is unwound early due to an event other than a credit event on the underlying municipal bond, the underlying municipal bonds are sold out of the Trust and bond sale proceeds are used to redeem the outstanding Trust certificates. If there is a shortfall in the trust's cash flows between the redemption price of the tendered Floaters and the proceeds from the sale of the underlying municipal bonds, the trust draws on the liquidity agreement in an amount equal to the shortfall. For certain customer TOB trusts the Company has executed a reimbursement agreement with the holder of the Residuals,
173
pursuant to which the Residual holder is obligated to reimburse the Company for any payment it is required to make under the liquidity arrangement. Through this reimbursement agreement, the Residual holder remains economically exposed to fluctuations in value of the underlying municipal bonds. These reimbursement agreements may be subject to daily margining based on changes in value of the underlying municipal bond. In cases where a third party provides liquidity to a non-customer TOB trust, a similar reimbursement arrangement may be made whereby the Company (or a consolidated subsidiary of the Company) as Residual holder absorbs any losses incurred by the liquidity provider.
At June 30, 2015 and December 31, 2014 , liquidity agreements provided with respect to customer TOB trusts totaled $3.4 billion and $3.7 billion , respectively, of which $2.5 billion and $2.6 billion , respectively, were offset by reimbursement agreements. For the remaining exposure related to TOB transactions, where the Residual owned by the customer was at least 25% of the bond value at the inception of the transaction, no reimbursement agreement was executed.
The Company also provides other liquidity agreements or letters of credit to customer-sponsored municipal investment funds, which are not variable interest entities, and municipality-related issuers that totaled $6.5 billion and $7.4 billion as of June 30, 2015 and December 31, 2014 , respectively. These liquidity agreements and letters of credit are offset by reimbursement agreements with various term-out provisions.
The Company considers both customer and non-customer TOB trusts to be VIEs. Customer TOB trusts are not consolidated by the Company as the power rests with the customer Residual holder, which may unilaterally cause the sale of the trust's bonds.
Non-customer TOB trusts generally are consolidated as the Company holds the Residual interest, and thus has the power to direct the activities that most significantly impact the trust's economic performance (i.e. unilateral sale).
Municipal Investments
Municipal investment transactions include debt and equity interests in partnerships that finance the construction and rehabilitation of low-income housing, facilitate lending in new or underserved markets, or finance the construction or operation of renewable municipal energy facilities. The Company generally invests in these partnerships as a limited partner and earns a return primarily through the receipt of tax credits and grants earned from the investments made by the partnership. The Company may also provide construction loans or permanent loans for the development or operation of real estate properties held by partnerships. These entities are generally considered VIEs. The power to direct the activities of these entities is typically held by the general partner. Accordingly, these entities are not consolidated by the Company.
Client Intermediation
Client intermediation transactions represent a range of transactions designed to provide investors with specified returns based on the returns of an underlying security, referenced asset or index. These transactions include credit-linked notes and equity-linked notes. In these transactions, the VIE typically obtains exposure to the underlying security, referenced asset or index through a derivative instrument, such as a total-return swap or a credit-default swap. In turn the VIE issues notes to investors that pay a return based on the specified underlying security, referenced asset or index. The VIE invests the proceeds in a financial asset or a guaranteed insurance contract that serves as collateral for the derivative contract over the term of the transaction. The Company's involvement in these transactions includes being the counterparty to the VIE's derivative instruments and investing in a portion of the notes issued by the VIE. In certain transactions, the investor's maximum risk of loss is limited, and the Company absorbs risk of loss above a specified level. The Company does not have the power to direct the activities of the VIEs that most significantly impact their economic performance, and thus it does not consolidate them.
The Company's maximum risk of loss in these transactions is defined as the amount invested in notes issued by the VIE and the notional amount of any risk of loss absorbed by the Company through a separate instrument issued by the VIE. The derivative instrument held by the Company may generate a receivable from the VIE (for example, where the Company purchases credit protection from the VIE in connection with the VIE's issuance of a credit-linked note), which is collateralized by the assets owned by the VIE. These derivative instruments are not considered variable interests, and any associated receivables are not included in the calculation of maximum exposure to the VIE.
The proceeds from new securitizations related to the Company's client intermediation transactions for the three and six months ended June 30, 2015 totaled approximately $0.6 billion and $0.8 billion , respectively, compared to $0.3 billion and $1.2 billion for the three and six months ended June 30, 2014 .
174
Investment Funds
The Company is the investment manager for certain investment funds and retirement funds that invest in various asset classes including private equity, hedge funds, real estate, fixed income and infrastructure. The Company earns a management fee, which is a percentage of capital under management, and may earn performance fees. In addition, for some of these funds the Company has an ownership interest in the investment funds. The Company has also established a number of investment funds as opportunities for qualified employees to invest in private equity investments. The Company acts as investment manager to these funds and may provide employees with financing on both recourse and non-recourse bases for a portion of the employees' investment commitments.
The Company has determined that a majority of the investment entities managed by Citigroup are provided a deferral from the requirements of ASC 810, because they meet the criteria in Accounting Standards Update No. 2010-10, Consolidation (Topic 810), Amendments for Certain Investment Funds (ASU 2010-10). These entities continue to be evaluated under the requirements of ASC 810-10, prior to the implementation of SFAS 167 (FIN 46(R), Consolidation of Variable Interest Entities ), which required that a VIE be consolidated by the party with a variable interest that will absorb a majority of the entity's expected losses or residual returns, or both. See Note 1 to the Consolidated Financial Statements for a discussion of ASU 2015-02 which includes impending changes to targeted areas of consolidation guidance. When ASU 2015-02 becomes effective on January 1, 2016, it will eliminate the above noted deferral for certain investment entities pursuant to ASU 2010-10.
Trust Preferred Securities
The Company has previously raised financing through the issuance of trust preferred securities. In these transactions, the Company forms a statutory business trust and owns all of the voting equity shares of the trust. The trust issues preferred equity securities to third-party investors and invests the gross proceeds in junior subordinated deferrable interest debentures issued by the Company. The trusts have no assets, operations, revenues or cash flows other than those related to the issuance, administration and repayment of the preferred equity securities held by third-party investors. Obligations of the trusts are fully and unconditionally guaranteed by the Company.
Because the sole asset of each of the trusts is a receivable from the Company and the proceeds to the Company from the receivable exceed the Company's investment in the VIE's equity shares, the Company is not permitted to consolidate the trusts, even though it owns all of the voting equity shares of the trust, has fully guaranteed the trusts' obligations, and has the right to redeem the preferred securities in certain circumstances. The Company recognizes the subordinated debentures on its Consolidated Balance Sheet as long-term liabilities. (For additional information, see Note 17 to the Consolidated Financial Statements.)
175
21 . DERIVATIVES ACTIVITIES
In the ordinary course of business, Citigroup enters into various types of derivative transactions. These derivative
transactions include:
• | Futures and forward contracts, which are commitments to buy or sell at a future date a financial instrument, commodity or currency at a contracted price and may be settled in cash or through delivery. |
• | Swap contracts, which are commitments to settle in cash at a future date or dates that may range from a few days to a number of years, based on differentials between specified indices or financial instruments, as applied to a notional principal amount. |
• | Option contracts, which give the purchaser, for a premium, the right, but not the obligation, to buy or sell within a specified time a financial instrument, commodity or currency at a contracted price that may also be settled in cash, based on differentials between specified indices or prices. |
Swaps and forwards and some option contracts are over-the-counter (OTC) derivatives that are bilaterally negotiated with counterparties and settled with those counterparties, except for swap contracts that are novated and "cleared" through central counterparties (CCPs). Futures contracts and other option contracts are standardized contracts that are traded on an exchange with a CCP as the counterparty from the inception of the transaction. Citigroup enters into these derivative contracts relating to interest rate, foreign currency, commodity and other market/credit risks for the following reasons:
• | Trading Purposes: Citigroup trades derivatives as an active market maker. Citigroup offers its customers derivatives in connection with their risk management actions to transfer, modify or reduce their interest rate, foreign exchange and other market/credit risks or for their own trading purposes. Citigroup also manages its derivative risk positions through offsetting trade activities, controls focused on price verification, and daily reporting of positions to senior managers. |
• | Hedging : Citigroup uses derivatives in connection with its risk-management activities to hedge certain risks or reposition the risk profile of the Company. For example, Citigroup issues fixed-rate long-term debt and then enters into a receive-fixed, pay-variable-rate interest rate swap with the same tenor and notional amount to convert the interest payments to a net variable-rate basis. This strategy is the most common form of an interest rate hedge, as it minimizes net interest cost in certain yield curve environments. Derivatives are also used to manage risks inherent in specific groups of on-balance-sheet assets and liabilities, including AFS securities and borrowings, as well as other interest-sensitive assets and liabilities. In addition, foreign-exchange contracts are used to hedge non-U.S.-dollar-denominated debt, foreign-currency-denominated AFS securities and net investment exposures. |
Derivatives may expose Citigroup to market, credit or liquidity risks in excess of the amounts recorded on the Consolidated Balance Sheet. Market risk on a derivative product is the exposure created by potential fluctuations in interest rates, foreign-exchange rates and other factors and is a function of the type of product, the volume of transactions, the tenor and terms of the agreement and the underlying volatility. Credit risk is the exposure to loss in the event of nonperformance by the other party to the transaction where the value of any collateral held is not adequate to cover such losses. The recognition in earnings of unrealized gains on these transactions is subject to management's assessment of the probability of counterparty default. Liquidity risk is the potential exposure that arises when the size of a derivative position may not be able to be monetized in a reasonable period of time and at a reasonable cost in periods of high volatility and financial stress.
Derivative transactions are customarily documented under industry standard master agreements that provide that, following an uncured payment default or other event of default, the non-defaulting party may promptly terminate all transactions between the parties and determine the net amount due to be paid to, or by, the defaulting party. Events of default include: (i) failure to make a payment on a derivatives transaction that remains uncured following applicable notice and grace periods, (ii) breach of agreement that remains uncured after applicable notice and grace periods, (iii) breach of a representation, (iv) cross default, either to third-party debt or to other derivative transactions entered into between the parties, or, in some cases, their affiliates, (v) the occurrence of a merger or consolidation which results in a party's becoming a materially weaker credit, and (vi) the cessation or repudiation of any applicable guarantee or other credit support document. Obligations under master netting agreements are often secured by collateral posted under an industry standard credit support annex to the master netting agreement. An event of default may also occur under a credit support annex if a party fails to make a collateral delivery that remains uncured following applicable notice and grace periods.
The netting and collateral rights incorporated in the master netting agreements are considered to be legally enforceable if a supportive legal opinion has been obtained from counsel of recognized standing that provides the requisite level of certainty regarding enforceability and that the exercise of rights by the non-defaulting party to terminate and close-out transactions on a net basis under these agreements will not be stayed or avoided under applicable law upon an event of default including bankruptcy, insolvency or similar proceeding.
A legal opinion may not be sought for certain jurisdictions where local law is silent or unclear as to the enforceability of such rights or where adverse case law or conflicting regulation may cast doubt on the enforceability of such rights. In some jurisdictions and for some counterparty types, the insolvency law may not provide the requisite level of certainty. For example, this may be the case for certain sovereigns, municipalities, central banks and U.S. pension plans.
176
Exposure to credit risk on derivatives is affected by market volatility, which may impair the ability of counterparties to satisfy their obligations to the Company. Credit limits are established and closely monitored for customers engaged in derivatives transactions. Citi considers the level of legal certainty regarding enforceability of its offsetting rights under master netting agreements and credit support annexes to be an important factor in its risk management process. Specifically, Citi generally transacts much lower volumes of derivatives under master netting agreements where Citi does not have the requisite level of legal certainty regarding enforceability, because such derivatives consume greater amounts of single counterparty credit limits than those executed under enforceable master netting agreements.
Cash collateral and security collateral in the form of G10 government debt securities is often posted by a party to a master netting agreement to secure the net open exposure of the other party; the receiving party is free to commingle/rehypothecate such collateral in the ordinary course of its business. Nonstandard collateral such as corporate bonds, municipal bonds, U.S. agency securities and/or MBS may also be pledged as collateral for derivative transactions. Security collateral posted to open and maintain a master netting agreement with a counterparty, in the form of cash and/or securities, may from time to time be segregated in an account at a third-party custodian pursuant to a tri-party account control agreement.
177
Information pertaining to Citigroup's derivative activity, based on notional amounts, as of June 30, 2015 and December 31, 2014 , is presented in the table below. Derivative notional amounts are reference amounts from which contractual payments are derived and do not represent a complete and accurate measure of Citi's exposure to derivative transactions. Rather, as discussed above, Citi's derivative exposure arises primarily from market fluctuations (i.e., market risk), counterparty failure (i.e., credit risk) and/or periods of high volatility or financial stress (i.e., liquidity risk), as well as any market valuation adjustments that may be
required on the transactions. Moreover, notional amounts do not reflect the netting of offsetting trades (also as discussed above). For example, if Citi enters into an interest rate swap with $100 million notional, and offsets this risk with an identical but opposite position with a different counterparty, $200 million in derivative notionals is reported, although these offsetting positions may result in de minimus overall market risk. Aggregate derivative notional amounts can fluctuate from period to period in the normal course of business based on Citi's market share, levels of client activity and other factors.
Derivative Notionals
| Hedging instruments under ASC 815 (1)(2) | Other derivative instruments | ||||||||||||||||
| | | Trading derivatives | Management hedges (3) | ||||||||||||||
In millions of dollars | June 30, | December 31, | June 30, | December 31, | June 30, | December 31, | ||||||||||||
Interest rate contracts |
|
|
|
|
|
| ||||||||||||
Swaps | $ | 181,036 | | $ | 163,348 | | $ | 26,306,205 | | $ | 31,906,549 | | $ | 29,287 | | $ | 31,945 | |
Futures and forwards | - | | - | | 8,849,802 | | 7,044,990 | | 43,444 | | 42,305 | | ||||||
Written options | - | | - | | 3,192,935 | | 3,311,751 | | 3,829 | | 3,913 | | ||||||
Purchased options | - | | - | | 3,065,328 | | 3,171,056 | | 4,225 | | 4,910 | | ||||||
Total interest rate contract notionals | $ | 181,036 | | $ | 163,348 | | $ | 41,414,270 | | $ | 45,434,346 | | $ | 80,785 | | $ | 83,073 | |
Foreign exchange contracts |
|
|
|
|
|
| ||||||||||||
Swaps | $ | 24,889 | | $ | 25,157 | | $ | 4,372,752 | | $ | 4,567,977 | | $ | 24,746 | | $ | 23,990 | |
Futures, forwards and spot (4) | 69,450 | | 73,219 | | 3,203,918 | | 3,003,295 | | 5,171 | | 7,069 | | ||||||
Written options | - | | - | | 1,272,458 | | 1,343,520 | | - | | 432 | | ||||||
Purchased options | - | | - | | 1,282,250 | | 1,363,382 | | - | | 432 | | ||||||
Total foreign exchange contract notionals | $ | 94,339 | | $ | 98,376 | | $ | 10,131,378 | | $ | 10,278,174 | | $ | 29,917 | | $ | 31,923 | |
Equity contracts |
|
|
|
|
|
| ||||||||||||
Swaps | $ | - | | $ | - | | $ | 150,754 | | $ | 131,344 | | $ | - | | $ | - | |
Futures and forwards | - | | - | | 34,260 | | 30,510 | | - | | - | | ||||||
Written options | - | | - | | 360,982 | | 305,627 | | - | | - | | ||||||
Purchased options | - | | - | | 339,443 | | 275,216 | | - | | - | | ||||||
Total equity contract notionals | $ | - | | $ | - | | $ | 885,439 | | $ | 742,697 | | $ | - | | $ | - | |
Commodity and other contracts |
|
|
|
|
|
| ||||||||||||
Swaps | $ | - | | $ | - | | $ | 85,081 | | $ | 90,817 | | $ | - | | $ | - | |
Futures and forwards | 957 | | 1,089 | | 109,524 | | 106,021 | | - | | - | | ||||||
Written options | - | | - | | 101,857 | | 104,581 | | - | | - | | ||||||
Purchased options | - | | - | | 93,007 | | 95,567 | | - | | - | | ||||||
Total commodity and other contract notionals | $ | 957 | | $ | 1,089 | | $ | 389,469 | | $ | 396,986 | | $ | - | | $ | - | |
Credit derivatives (5) |
|
|
|
|
|
| ||||||||||||
Protection sold | $ | - | | $ | - | | $ | 1,171,760 | | $ | 1,063,858 | | $ | - | | $ | - | |
Protection purchased | - | | - | | 1,209,602 | | 1,100,369 | | 15,094 | | 16,018 | | ||||||
Total credit derivatives | $ | - | | $ | - | | $ | 2,381,362 | | $ | 2,164,227 | | $ | 15,094 | | $ | 16,018 | |
Total derivative notionals | $ | 276,332 | | $ | 262,813 | | $ | 55,201,918 | | $ | 59,016,430 | | $ | 125,796 | | $ | 131,014 | |
(1) | The notional amounts presented in this table do not include hedge accounting relationships under ASC 815 where Citigroup is hedging the foreign currency risk of a net investment in a foreign operation by issuing a foreign-currency-denominated debt instrument. The notional amount of such debt was $3,256 million and $3,752 million at June 30, 2015 and December 31, 2014 , respectively. |
(2) | Derivatives in hedge accounting relationships accounted for under ASC 815 are recorded in either Other assets/Other liabilities or Trading account assets/Trading account liabilities on the Consolidated Balance Sheet. |
(3) | Management hedges represent derivative instruments used to mitigate certain economic risks, but for which hedge accounting is not applied. These derivatives are recorded in either Other assets/Other liabilities or Trading account assets/Trading account liabilities on the Consolidated Balance Sheet. |
178
(4) | Foreign exchange notional contracts include spot contract notionals of $1,398 billion and $849 billion at June 30, 2015 and December 31, 2014, respectively. Previous presentations of foreign exchange derivative notional contracts did not include spot contracts. There was no impact to the Consolidated Financial Statements related to this updated presentation. |
(5) | Credit derivatives are arrangements designed to allow one party (protection buyer) to transfer the credit risk of a "reference asset" to another party (protection seller). These arrangements allow a protection seller to assume the credit risk associated with the reference asset without directly purchasing that asset. The Company enters into credit derivative positions for purposes such as risk management, yield enhancement, reduction of credit concentrations and diversification of overall risk. |
The following tables present the gross and net fair values of the Company's derivative transactions, and the related offsetting amounts permitted under ASC 210-20-45 and ASC 815-10-45, as of June 30, 2015 and December 31, 2014 . Under ASC 210-20-45, gross positive fair values are offset against gross negative fair values by counterparty pursuant to enforceable master netting agreements. Under ASC 815-10-45, payables and receivables in respect of cash collateral received from or paid to a given counterparty pursuant to a credit support annex are included in the offsetting amount if a legal opinion supporting enforceability of netting and collateral rights has been obtained. GAAP does not permit similar offsetting for security collateral. The tables also include amounts that are not permitted to be offset under ASC 210-20-45 and ASC 815-10-45, such as security collateral posted or cash collateral posted at third-party custodians, but would be eligible for offsetting to the extent an event of default occurred and a legal opinion supporting enforceability of the netting and collateral rights has been obtained.
179
Derivative Mark-to-Market (MTM) Receivables/Payables
In millions of dollars at June 30, 2015 | Derivatives classified in Trading account assets / liabilities (1)(2)(3) | Derivatives classified in Other assets / liabilities (2)(3) | ||||||||||
Derivatives instruments designated as ASC 815 hedges | Assets | Liabilities | Assets | Liabilities | ||||||||
Over-the-counter | $ | 1,067 | | $ | 147 | | $ | 2,566 | | $ | 278 | |
Cleared | 3,519 | | 774 | | 2 | | 17 | | ||||
Interest rate contracts | $ | 4,586 | | $ | 921 | | $ | 2,568 | | $ | 295 | |
Over-the-counter | $ | 2,495 | | $ | 988 | | $ | 473 | | $ | 336 | |
Foreign exchange contracts | $ | 2,495 | | $ | 988 | | $ | 473 | | $ | 336 | |
Total derivative instruments designated as ASC 815 hedges | $ | 7,081 | | $ | 1,909 | | $ | 3,041 | | $ | 631 | |
Derivatives instruments not designated as ASC 815 hedges | | | | | ||||||||
Over-the-counter | $ | 298,384 | | $ | 280,552 | | $ | 103 | | $ | 2 | |
Cleared | 146,677 | | 152,172 | | 159 | | 185 | | ||||
Exchange traded | 56 | | 62 | | - | | - | | ||||
Interest rate contracts | $ | 445,117 | | $ | 432,786 | | $ | 262 | | $ | 187 | |
Over-the-counter | $ | 119,179 | | $ | 125,300 | | $ | - | | $ | 68 | |
Cleared | 279 | | 266 | | - | | - | | ||||
Exchange traded | 14 | | 38 | | - | | - | | ||||
Foreign exchange contracts | $ | 119,472 | | $ | 125,604 | | $ | - | | $ | 68 | |
Over-the-counter | $ | 17,596 | | $ | 24,804 | | $ | - | | $ | - | |
Cleared | 48 | | 54 | | - | | - | | ||||
Exchange traded | 6,795 | | 6,536 | | - | | - | | ||||
Equity contracts | $ | 24,439 | | $ | 31,394 | | $ | - | | $ | - | |
Over-the-counter | $ | 13,759 | | $ | 17,722 | | $ | - | | $ | - | |
Exchange traded | 2,115 | | 2,096 | | - | | - | | ||||
Commodity and other contracts | $ | 15,874 | | $ | 19,818 | | $ | - | | $ | - | |
Over-the-counter | $ | 33,647 | | $ | 34,042 | | $ | 286 | | $ | 259 | |
Cleared | 5,411 | | 5,164 | | 18 | | 145 | | ||||
Credit derivatives (4) | $ | 39,058 | | $ | 39,206 | | $ | 304 | | $ | 404 | |
Total derivatives instruments not designated as ASC 815 hedges | $ | 643,960 | | $ | 648,808 | | $ | 566 | | $ | 659 | |
Total derivatives | $ | 651,041 | | $ | 650,717 | | $ | 3,607 | | $ | 1,290 | |
Cash collateral paid/received (5)(6) | $ | 6,059 | | $ | 12,911 | | $ | - | | $ | 4 | |
Less: Netting agreements (7) | (558,440 | ) | (558,440 | ) | - | | - | | ||||
Less: Netting cash collateral received/paid (8) | (37,817 | ) | (41,872 | ) | (1,956 | ) | (50 | ) | ||||
Net receivables/payables included on the consolidated balance sheet (9) | $ | 60,843 | | $ | 63,316 | | $ | 1,651 | | $ | 1,244 | |
Additional amounts subject to an enforceable master netting agreement but not offset on the Consolidated Balance Sheet | ||||||||||||
Less: Cash collateral received/paid | $ | (558 | ) | $ | (1 | ) | $ | - | | $ | - | |
Less: Non-cash collateral received/paid | (9,838 | ) | (5,313 | ) | (543 | ) | - | | ||||
Total net receivables/payables (9) | $ | 50,447 | | $ | 58,002 | | $ | 1,108 | | $ | 1,244 | |
(1) | The trading derivatives fair values are presented in Note 12 to the Consolidated Financial Statements. |
(2) | Derivative mark-to-market receivables/payables related to management hedges are recorded in either Other assets/Other liabilities or Trading account assets/Trading account liabilities . |
(3) | Over-the-counter (OTC) derivatives are derivatives executed and settled bilaterally with counterparties without the use of an organized exchange or central clearing house. Cleared derivatives include derivatives executed bilaterally with a counterparty in the OTC market but then novated to a central clearing house, whereby the central clearing house becomes the counterparty to both of the original counterparties. Exchange traded derivatives include derivatives executed directly on an organized exchange that provides pre-trade price transparency. |
(4) | The credit derivatives trading assets comprise $13,796 million related to protection purchased and $25,262 million related to protection sold as of June 30, 2015 . The credit derivatives trading liabilities comprise $26,069 million related to protection purchased and $13,137 million related to protection sold as of June 30, 2015 . |
(5) | For the trading account assets/liabilities, reflects the net amount of the $47,931 million and $50,728 million of gross cash collateral paid and received, respectively. Of the gross cash collateral paid, $41,872 million was used to offset trading derivative liabilities and, of the gross cash collateral received, $37,817 million was used to offset trading derivative assets. |
(6) | For cash collateral paid with respect to non-trading derivative liabilities, this is the net amount of $50 million of the gross cash collateral paid, of which $50 million is netted against non-trading derivative positions within Other liabilities . For cash collateral received with respect to non-trading derivative liabilities, |
180
reflects the net amount of $1,960 million the gross cash collateral received, of which $1,956 million is netted against OTC non-trading derivative positions within Other assets .
(7) | Represents the netting of derivative receivable and payable balances with the same counterparty under enforceable netting agreements. Approximately $402 billion , $152 billion and $4 billion of the netting against trading account asset/liability balances is attributable to each of the OTC, cleared and exchange traded derivatives, respectively. |
(8) | Represents the netting of cash collateral paid and received by counterparty under enforceable credit support agreements. Substantially all cash collateral received and paid is netted against OTC derivative assets and liabilities, respectively. |
(9) | The net receivables/payables include approximately $11 billion of derivative asset and $9 billion of derivative liability fair values not subject to enforceable master netting agreements, respectively. |
In millions of dollars at December 31, 2014 | Derivatives classified in Trading account assets / liabilities (1)(2)(3) | Derivatives classified in Other assets / liabilities (2)(3) | ||||||||||
Derivatives instruments designated as ASC 815 hedges | Assets | Liabilities | Assets | Liabilities | ||||||||
Over-the-counter | $ | 1,508 | | $ | 204 | | $ | 3,117 | | $ | 414 | |
Cleared | 4,300 | | 868 | | - | | 25 | | ||||
Interest rate contracts | $ | 5,808 | | $ | 1,072 | | $ | 3,117 | | $ | 439 | |
Over-the-counter | $ | 3,885 | | $ | 743 | | $ | 678 | | $ | 588 | |
Foreign exchange contracts | $ | 3,885 | | $ | 743 | | $ | 678 | | $ | 588 | |
Total derivative instruments designated as ASC 815 hedges | $ | 9,693 | | $ | 1,815 | | $ | 3,795 | | $ | 1,027 | |
Derivatives instruments not designated as ASC 815 hedges | | | | | ||||||||
Over-the-counter | $ | 376,778 | | $ | 359,689 | | $ | 106 | | $ | - | |
Cleared | 255,847 | | 261,499 | | 6 | | 21 | | ||||
Exchange traded | 20 | | 22 | | 141 | | 164 | | ||||
Interest rate contracts | $ | 632,645 | | $ | 621,210 | | $ | 253 | | $ | 185 | |
Over-the-counter | $ | 151,736 | | $ | 157,650 | | $ | - | | $ | 17 | |
Cleared | 366 | | 387 | | - | | - | | ||||
Exchange traded | 7 | | 46 | | - | | - | | ||||
Foreign exchange contracts | $ | 152,109 | | $ | 158,083 | | $ | - | | $ | 17 | |
Over-the-counter | $ | 20,425 | | $ | 28,333 | | $ | - | | $ | - | |
Cleared | 16 | | 35 | | - | | - | | ||||
Exchange traded | 4,311 | | 4,101 | | - | | - | | ||||
Equity contracts | $ | 24,752 | | $ | 32,469 | | $ | - | | $ | - | |
Over-the-counter | $ | 19,943 | | $ | 23,103 | | $ | - | | $ | - | |
Exchange traded | 3,577 | | 3,083 | | - | | - | | ||||
Commodity and other contracts | $ | 23,520 | | $ | 26,186 | | $ | - | | $ | - | |
Over-the-counter | $ | 39,412 | | $ | 39,439 | | $ | 265 | | $ | 384 | |
Cleared | 4,106 | | 3,991 | | 13 | | 171 | | ||||
Credit derivatives (4) | $ | 43,518 | | $ | 43,430 | | $ | 278 | | $ | 555 | |
Total Derivatives instruments not designated as ASC 815 hedges | $ | 876,544 | | $ | 881,378 | | $ | 531 | | $ | 757 | |
Total derivatives | $ | 886,237 | | $ | 883,193 | | $ | 4,326 | | $ | 1,784 | |
Cash collateral paid/received (5)(6) | $ | 6,523 | | $ | 9,846 | | $ | 123 | | $ | 7 | |
Less: Netting agreements (7) | (777,178 | ) | (777,178 | ) | - | | - | | ||||
Less: Netting cash collateral received/paid (8) | (47,625 | ) | (47,769 | ) | (1,791 | ) | (15 | ) | ||||
Net receivables/payables included on the Consolidated Balance Sheet (9) | $ | 67,957 | | $ | 68,092 | | $ | 2,658 | | $ | 1,776 | |
Additional amounts subject to an enforceable master netting agreement but not offset on the Consolidated Balance Sheet | ||||||||||||
Less: Cash collateral received/paid | $ | (867 | ) | $ | (11 | ) | $ | - | | $ | - | |
Less: Non-cash collateral received/paid | (10,043 | ) | (6,264 | ) | (1,293 | ) | - | | ||||
Total net receivables/payables (9) | $ | 57,047 | | $ | 61,817 | | $ | 1,365 | | $ | 1,776 | |
(1) | The trading derivatives fair values are presented in Note 12 to the Consolidated Financial Statements. |
(2) | Derivative mark-to-market receivables/payables related to management hedges are recorded in either Other assets/Other liabilities or Trading account assets/Trading account liabilities . |
(3) | Over-the-counter (OTC) derivatives include derivatives executed and settled bilaterally with counterparties without the use of an organized exchange or central clearing house. Cleared derivatives include derivatives executed bilaterally with a counterparty in the OTC market but then novated to a central clearing house, whereby the central clearing house becomes the counterparty to both of the original counterparties. Exchange traded derivatives include derivatives executed directly on an organized exchange that provides pre-trade price transparency. |
181
(4) | The credit derivatives trading assets comprise $18,430 million related to protection purchased and $25,088 million related to protection sold as of December 31, 2014 . The credit derivatives trading liabilities comprise $25,972 million related to protection purchased and $17,458 million related to protection sold as of December 31, 2014 . |
(5) | For the trading account assets/liabilities, reflects the net amount of the $54,292 million and $57,471 million of gross cash collateral paid and received, respectively. Of the gross cash collateral paid, $47,769 million was used to offset derivative liabilities and, of the gross cash collateral received, $47,625 million was used to offset derivative assets. |
(6) | For cash collateral paid with respect to non-trading derivative liabilities, reflects the net amount of $138 million of the gross cash collateral received, of which $15 million is netted against OTC non-trading derivative positions within Other liabilities . For cash collateral received with respect to non-trading derivative liabilities, reflects the net amount of $1,798 million of gross cash collateral received of which $1,791 million is netted against non-trading derivative positions within Other assets . |
(7) | Represents the netting of derivative receivable and payable balances with the same counterparty under enforceable netting agreements. Approximately $510 billion , $264 billion and $3 billion of the netting against trading account asset/liability balances is attributable to each of the OTC, cleared and exchange-traded derivatives, respectively. |
(8) | Represents the netting of cash collateral paid and received by counterparty under enforceable credit support agreements. Substantially all cash collateral received is netted against OTC derivative assets. Cash collateral paid of approximately $46 billion and $2 billion is netted against OTC and cleared derivative liabilities, respectively. |
(9) | The net receivables/payables include approximately $11 billion of derivative asset and $10 billion of liability fair values not subject to enforceable master netting agreements. |
For the three and six months ended June 30, 2015 and 2014 , the amounts recognized in Principal transactions in the Consolidated Statement of Income related to derivatives not designated in a qualifying hedging relationship, as well as the underlying non-derivative instruments, are presented in Note 6 to the Consolidated Financial Statements. Citigroup presents this disclosure by business classification, showing derivative gains and losses related to its trading activities together with gains and losses related to non-derivative instruments within
the same trading portfolios, as this represents the way these portfolios are risk managed.
The amounts recognized in Other revenue in the Consolidated Statement of Income for the three and six months ended June 30, 2015 and 2014 related to derivatives not designated in a qualifying hedging relationship are shown below. The table below does not include any offsetting gains/losses on the economically hedged items to the extent such amounts are also recorded in Other revenue .
| Gains (losses) included in Other revenue | |||||||||||
| Three Months Ended June 30, | Six Months Ended June 30, | ||||||||||
In millions of dollars | 2015 | 2014 | 2015 | 2014 | ||||||||
Interest rate contracts | $ | (51 | ) | $ | (164 | ) | $ | (36 | ) | $ | (197 | ) |
Foreign exchange | (31 | ) | 20 | | (46 | ) | 51 | | ||||
Credit derivatives | 61 | | (139 | ) | 71 | | (234 | ) | ||||
Total Citigroup | $ | (21 | ) | $ | (283 | ) | $ | (11 | ) | $ | (380 | ) |
182
Accounting for Derivative Hedging
Citigroup accounts for its hedging activities in accordance with ASC 815, Derivatives and Hedging . As a general rule, hedge accounting is permitted where the Company is exposed to a particular risk, such as interest-rate or foreign-exchange risk, that causes changes in the fair value of an asset or liability or variability in the expected future cash flows of an existing asset, liability or a forecasted transaction that may affect earnings.
Derivative contracts hedging the risks associated with changes in fair value are referred to as fair value hedges, while contracts hedging the variability of expected future cash flows are cash flow hedges. Hedges that utilize derivatives or debt instruments to manage the foreign exchange risk associated with equity investments in non-U.S.-dollar-functional-currency foreign subsidiaries (net investment in a foreign operation) are net investment hedges.
If certain hedging criteria specified in ASC 815 are met, including testing for hedge effectiveness, hedge accounting may be applied. The hedge effectiveness assessment methodologies for similar hedges are performed in a similar manner and are used consistently throughout the hedging relationships. For fair value hedges, changes in the value of the hedging derivative, as well as changes in the value of the related hedged item due to the risk being hedged are reflected in current earnings. For cash flow hedges and net investment hedges, changes in the value of the hedging derivative are reflected in Accumulated other comprehensive income (loss) in Citigroup's stockholders' equity to the extent the hedge is highly effective. Hedge ineffectiveness, in either case, is reflected in current earnings.
For asset/liability management hedging, fixed-rate long-term debt is recorded at amortized cost under GAAP. However, by designating an interest rate swap contract as a hedging instrument and electing to apply ASC 815 fair value hedge accounting, the carrying value of the debt is adjusted for changes in the benchmark interest rate, with such changes in value recorded in current earnings. The related interest-rate swap also is recorded on the balance sheet at fair value, with any changes in fair value also reflected in earnings. Thus, any ineffectiveness resulting from the hedging relationship is captured in current earnings.
Alternatively, for management hedges that do not meet the ASC 815 hedging criteria, only the derivative is recorded at fair value on the balance sheet, with the associated changes in fair value recorded in earnings, while the debt continues to be carried at amortized cost. Therefore, current earnings are affected only by the interest rate shifts and other factors that cause a change in the swap's value. This type of hedge is undertaken when hedging requirements cannot be achieved or management decides not to apply ASC 815 hedge accounting.
Another alternative is to elect to carry the debt at fair value under the fair value option. Once the irrevocable election is made upon issuance of the debt, the full changes in fair value of the debt are reported in earnings. The related interest rate swap, with changes in fair value, is also reflected in earnings, which provides a natural offset to the debt's fair value change. To the extent the two offsets are not exactly equal because the full change in the fair value of the debt
includes risks not offset by the interest rate swap, the difference is captured in current earnings.
The key requirements to achieve ASC 815 hedge accounting are documentation of a hedging strategy and specific hedge relationships at hedge inception and substantiating hedge effectiveness on an ongoing basis. A derivative must be highly effective in accomplishing the hedge objective of offsetting either changes in the fair value or cash flows of the hedged item for the risk being hedged. Any ineffectiveness in the hedge relationship is recognized in current earnings. The assessment of effectiveness may exclude changes in the value of the hedged item that are unrelated to the risks being hedged. Similarly, the assessment of effectiveness may exclude changes in the fair value of a derivative related to time value that, if excluded, are recognized in current earnings.
Fair Value Hedges
Hedging of benchmark interest rate risk
Citigroup hedges exposure to changes in the fair value of outstanding fixed-rate issued debt and certificates of deposit. These hedges are designated as fair value hedges of the benchmark interest rate risk associated with the currency of the hedged liability. The fixed cash flows of the hedged items are converted to benchmark variable-rate cash flows by entering into receive-fixed, pay-variable interest rate swaps. These fair value hedge relationships use either regression or dollar-offset ratio analysis to assess whether the hedging relationships are highly effective at inception and on an ongoing basis.
Citigroup also hedges exposure to changes in the fair value of fixed-rate assets, including available-for-sale debt securities and loans. The hedging instruments used are receive-variable, pay-fixed interest rate swaps. These fair value hedging relationships use either regression or dollar-offset ratio analysis to assess whether the hedging relationships are highly effective at inception and on an ongoing basis.
183
Hedging of foreign exchange risk
Citigroup hedges the change in fair value attributable to foreign-exchange rate movements in available-for-sale securities that are denominated in currencies other than the functional currency of the entity holding the securities, which may be within or outside the U.S. The hedging instrument employed is generally a forward foreign-exchange contract. In this hedge, the change in fair value of the hedged available-for-sale security attributable to the portion of foreign exchange risk hedged is reported in earnings, and not Accumulated other comprehensive income (loss) -which serves to offset the change in fair value of the forward contract that is also reflected in earnings. Citigroup considers the premium associated with forward contracts (i.e., the differential between spot and contractual forward rates) as the cost of hedging; this is excluded from the assessment of hedge effectiveness and reflected directly in earnings. The dollar-offset method is used to assess hedge effectiveness. Since that assessment is based on changes in fair value attributable to changes in spot rates on both the available-for-sale securities and the forward contracts for the portion of the relationship hedged, the amount of hedge ineffectiveness is not significant.
184
The following table summarizes the gains (losses) on the Company's fair value hedges for the three and six months ended June 30, 2015 and 2014 :
| Gains (losses) on fair value hedges (1) | |||||||||||
| Three Months Ended June 30, | Six Months Ended June 30, | ||||||||||
In millions of dollars | 2015 | 2014 | 2015 | 2014 | ||||||||
Gain (loss) on the derivatives in designated and qualifying fair value hedges |
|
|
|
| ||||||||
Interest rate contracts | $ | (1,680 | ) | $ | 344 | | $ | (1,039 | ) | $ | 608 | |
Foreign exchange contracts | 16 | | 321 | | 1,404 | | 330 | | ||||
Commodity contracts | (75 | ) | (103 | ) | 41 | | (103 | ) | ||||
Total gain (loss) on the derivatives in designated and qualifying fair value hedges | $ | (1,739 | ) | $ | 562 | | $ | 406 | | $ | 835 | |
Gain (loss) on the hedged item in designated and qualifying fair value hedges |
|
|
|
| ||||||||
Interest rate hedges | $ | 1,606 | | $ | (368 | ) | $ | 998 | | $ | (654 | ) |
Foreign exchange hedges | 36 | | (360 | ) | (1,385 | ) | (368 | ) | ||||
Commodity hedges | 76 | | 106 | | (28 | ) | 106 | | ||||
Total gain (loss) on the hedged item in designated and qualifying fair value hedges | $ | 1,718 | | $ | (622 | ) | $ | (415 | ) | $ | (916 | ) |
Hedge ineffectiveness recognized in earnings on designated and qualifying fair value hedges |
|
|
|
| ||||||||
Interest rate hedges | $ | (74 | ) | $ | (25 | ) | $ | (41 | ) | $ | (46 | ) |
Foreign exchange hedges | 21 | | (4 | ) | (17 | ) | - | | ||||
Total hedge ineffectiveness recognized in earnings on designated and qualifying fair value hedges | $ | (53 | ) | $ | (29 | ) | $ | (58 | ) | $ | (46 | ) |
Net gain (loss) excluded from assessment of the effectiveness of fair value hedges |
|
|
|
| ||||||||
Interest rate contracts | $ | - | | $ | 1 | | $ | - | | $ | - | |
Foreign exchange contracts (2) | 31 | | (35 | ) | 36 | | (38 | ) | ||||
Commodity hedges (2) | 1 | | 3 | | 13 | | 3 | | ||||
Total net gain (loss) excluded from assessment of the effectiveness of fair value hedges | $ | 32 | | $ | (31 | ) | $ | 49 | | $ | (35 | ) |
(1) | Amounts are included in Other revenue on the Consolidated Statement of Income. The accrued interest income on fair value hedges is recorded in Net interest revenue and is excluded from this table. |
(2) | Amounts relate to the premium associated with forward contracts (differential between spot and contractual forward rates). These amounts are excluded from the assessment of hedge effectiveness and are reflected directly in earnings. |
Cash Flow Hedges
Hedging of benchmark interest rate risk
Citigroup hedges variable cash flows associated with floating-rate liabilities and the rollover (re-issuance) of liabilities. Variable cash flows from those liabilities are converted to fixed-rate cash flows by entering into receive-variable, pay-fixed interest rate swaps and receive-variable, pay-fixed forward-starting interest rate swaps. Citi also hedges variable cash flows from recognized and forecasted floating-rate assets. Variable cash flows from those assets are converted to fixed-rate cash flows by entering into receive-fixed, pay-variable interest rate swaps. These cash-flow hedging relationships use either regression analysis or dollar-offset ratio analysis to assess whether the hedging relationships are highly effective at inception and on an ongoing basis. When certain variable interest rates, associated with hedged items, do not qualify as benchmark interest rates, Citigroup designates the risk being hedged as the risk of overall changes in the hedged cash flows. Since efforts are made to match the terms of the derivatives to those of the hedged forecasted cash flows as closely as
possible, the amount of hedge ineffectiveness is not significant.
Hedging of foreign exchange risk
Citigroup locks in the functional currency equivalent cash flows of long-term debt and short-term borrowings that are denominated in currencies other than the functional currency of the issuing entity. Depending on the risk management objectives, these types of hedges are designated as either cash flow hedges of only foreign exchange risk or cash flow hedges of both foreign exchange and interest rate risk, and the hedging instruments used are foreign exchange cross-currency swaps and forward contracts. These cash flow hedge relationships use dollar-offset ratio analysis to determine whether the hedging relationships are highly effective at inception and on an ongoing basis.
Hedging of overall changes in cash flows
Citigroup makes purchases of certain "to-be-announced" (TBA) mortgage-backed securities that meet the definition of a derivative (i.e., a forward securities purchase).
185
Citigroup commonly designates these derivatives as hedges of the overall cash flow variability related to the forecasted acquisition of the TBA mortgage-backed securities. Since the hedged transaction is the gross settlement of the forward contract, hedge effectiveness is assessed by assuring that the terms of the hedging instrument and the hedged forecasted transaction are the same and that delivery of the securities remains probable.
Hedging total return
Citigroup generally manages the risk associated with leveraged loans it has originated or in which it participates by transferring a majority of its exposure to the market through SPEs prior to or shortly after funding. Retained exposures to
leveraged loans receivable are generally hedged using total return swaps.
The amount of hedge ineffectiveness on the cash flow hedges recognized in earnings for the three and six months ended June 30, 2015 and 2014 is not significant. The pretax change in Accumulated other comprehensive income (loss) from cash flow hedges is presented below:
| Three Months Ended June 30, | Six Months Ended June 30, | ||||||||||
In millions of dollars | 2015 | 2014 | 2015 | 2014 | ||||||||
Effective portion of cash flow hedges included in AOCI |
|
|
|
| ||||||||
Interest rate contracts | $ | 17 | | $ | 155 | | $ | 237 | | $ | 223 | |
Foreign exchange contracts | (10 | ) | (51 | ) | (160 | ) | (57 | ) | ||||
Credit derivatives | - | | - | | - | | 2 | | ||||
Total effective portion of cash flow hedges included in AOCI | $ | 7 | | $ | 104 | | $ | 77 | | $ | 168 | |
Effective portion of cash flow hedges reclassified from AOCI to earnings | | |
|
| ||||||||
Interest rate contracts | $ | (74 | ) | $ | (73 | ) | $ | (120 | ) | $ | (134 | ) |
Foreign exchange contracts | (37 | ) | (28 | ) | (77 | ) | (84 | ) | ||||
Total effective portion of cash flow hedges reclassified from AOCI to earnings (1) | $ | (111 | ) | $ | (101 | ) | $ | (197 | ) | $ | (218 | ) |
(1) | Included primarily in Other revenue and Net interest revenue on the Consolidated Income Statement. |
For cash flow hedges, the changes in the fair value of the hedging derivative remaining in Accumulated other comprehensive income (loss) on the Consolidated Balance Sheet will be included in the earnings of future periods to offset the variability of the hedged cash flows when such cash flows affect earnings. The net loss associated with cash flow hedges expected to be reclassified from Accumulated other comprehensive income (loss) within 12 months of June 30, 2015 is approximately $ 0.4 billion . The maximum length of time over which forecasted cash flows are hedged is 10 years .
The after-tax impact of cash flow hedges on AOCI is shown in Note 18 to the Consolidated Financial Statements.
Net Investment Hedges
Consistent with ASC 830-20, Foreign Currency Matters-Foreign Currency Transactions , ASC 815 allows hedging of the foreign currency risk of a net investment in a foreign operation. Citigroup uses foreign currency forwards, options and foreign-currency-denominated debt instruments to manage the foreign exchange risk associated with Citigroup's equity investments in several non-U.S.-dollar-functional-currency foreign subsidiaries. Citigroup records the change in the carrying amount of these investments in the Foreign currency translation adjustment account within Accumulated other comprehensive income (loss) . Simultaneously, the effective portion of the hedge of this exposure is also recorded in the Foreign currency translation adjustment account and the ineffective portion, if any, is immediately recorded in earnings.
For derivatives designated as net investment hedges, Citigroup follows the forward-rate method outlined in ASC 815-35-35-16 through 35-26. According to that method, all changes in fair value, including changes related to the forward-rate component of the foreign currency forward contracts and the time value of foreign currency options, are recorded in the Foreign currency translation adjustment account within Accumulated other comprehensive income (loss) .
For foreign-currency-denominated debt instruments that are designated as hedges of net investments, the translation
186
gain or loss that is recorded in the Foreign currency translation adjustment account is based on the spot exchange rate between the functional currency of the respective subsidiary and the U.S. dollar, which is the functional currency of Citigroup. To the extent the notional amount of the hedging instrument exactly matches the hedged net investment and the underlying exchange rate of the derivative hedging instrument relates to the exchange rate between the functional currency of the net investment and Citigroup's functional currency (or, in the case of a non-derivative debt instrument, such instrument is denominated in the functional currency of the net investment), no ineffectiveness is recorded in earnings.
The pretax gain (loss) recorded in the Foreign currency translation adjustment account within Accumulated other comprehensive income (loss) , related to the effective portion of the net investment hedges, is $ (243) million and $ 757 million for the three and six months ended June 30, 2015 and $ (1,141) million and $ (1,618) million for the three and six months ended June 30, 2014 , respectively.
Credit Derivatives
Citi is a market maker and trades a range of credit derivatives. Through these contracts, Citi either purchases or writes protection on either a single name or a portfolio of reference credits. Citi also uses credit derivatives to help mitigate credit risk in its corporate and consumer loan portfolios and other cash positions, and to facilitate client transactions.
Citi monitors its counterparty credit risk in credit derivative contracts. As of June 30, 2015 and December 31, 2014 , approximately 98% of the gross receivables are from counterparties with which Citi maintains collateral agreements. A majority of Citi's top 15 counterparties (by receivable balance owed to Citi) are banks, financial institutions or other dealers. Contracts with these counterparties do not include ratings-based termination events. However, counterparty ratings downgrades may have an incremental effect by lowering the threshold at which Citi may
call for additional collateral.
The range of credit derivatives entered into includes credit default swaps, total return swaps, credit options and credit-linked notes.
A credit default swap is a contract in which, for a fee, a protection seller agrees to reimburse a protection buyer for any losses that occur due to a predefined credit event on a reference entity. These credit events are defined by the terms of the derivative contract and the reference credit and are generally limited to the market standard of failure to pay on indebtedness and bankruptcy of the reference credit and, in a more limited range of transactions, debt restructuring. Credit derivative transactions that reference emerging market entities will also typically include additional credit events to cover the acceleration of indebtedness and the risk of repudiation or a payment moratorium. In certain transactions, protection may be provided on a portfolio of reference entities or asset-backed securities. If there is no credit event, as defined by the specific derivative contract, then the protection seller makes no payments to the protection buyer and receives only the contractually specified fee. However, if a credit event occurs as defined in the specific derivative contract sold, the
protection seller will be required to make a payment to the protection buyer. Under certain contracts, the seller of protection may not be required to make a payment until a specified amount of losses has occurred with respect to the portfolio and/or may only be required to pay for losses up to a specified amount.
A total return swap typically transfers the total economic performance of a reference asset, which includes all associated cash flows, as well as capital appreciation or depreciation. The protection buyer receives a floating rate of interest and any depreciation on the reference asset from the protection seller and, in return, the protection seller receives the cash flows associated with the reference asset plus any appreciation. Thus, according to the total return swap agreement, the protection seller will be obligated to make a payment any time the floating interest rate payment plus any depreciation of the reference asset exceeds the cash flows associated with the underlying asset. A total return swap may terminate upon a default of the reference asset or a credit event with respect to the reference entity subject to the provisions of the related total return swap agreement between the protection seller and the protection buyer.
A credit option is a credit derivative that allows investors to trade or hedge changes in the credit quality of a reference entity. For example, in a credit spread option, the option writer assumes the obligation to purchase or sell credit protection on the reference entity at a specified "strike" spread level. The option purchaser buys the right to sell credit default protection on the reference entity to, or purchase it from, the option writer at the strike spread level. The payments on credit spread options depend either on a particular credit spread or the price of the underlying credit-sensitive asset or other reference. The options usually terminate if a credit event occurs with respect to the underlying reference entity.
A credit-linked note is a form of credit derivative structured as a debt security with an embedded credit default swap. The purchaser of the note effectively provides credit protection to the issuer by agreeing to receive a return that could be negatively affected by credit events on the underlying reference credit. If the reference entity defaults, the note may be cash settled or physically settled by delivery of a debt security of the reference entity. Thus, the maximum amount of the note purchaser's exposure is the amount paid for the credit-linked note.
187
The following tables summarize the key characteristics of Citi's credit derivatives portfolio by counterparty and derivative form as of June 30, 2015 and December 31, 2014 :
| Fair values | Notionals | ||||||||||
In millions of dollars at June 30, 2015 | Receivable (1) | Payable (2) | Protection | Protection | ||||||||
By industry/counterparty | | | | | ||||||||
Banks | $ | 19,211 | | $ | 17,471 | | $ | 580,952 | | $ | 576,798 | |
Broker-dealers | 6,891 | | 7,565 | | 195,843 | | 193,676 | | ||||
Non-financial | 86 | | 300 | | 4,039 | | 1,577 | | ||||
Insurance and other financial institutions | 13,174 | | 14,274 | | 443,862 | | 399,709 | | ||||
Total by industry/counterparty | $ | 39,362 | | $ | 39,610 | | $ | 1,224,696 | | $ | 1,171,760 | |
By instrument | | | | | ||||||||
Credit default swaps and options | $ | 39,053 | | $ | 38,320 | | $ | 1,205,705 | | $ | 1,167,390 | |
Total return swaps and other | 309 | | 1,290 | | 18,991 | | 4,370 | | ||||
Total by instrument | $ | 39,362 | | $ | 39,610 | | $ | 1,224,696 | | $ | 1,171,760 | |
By rating | | | | | ||||||||
Investment grade | $ | 15,813 | | $ | 15,786 | | $ | 936,496 | | $ | 894,935 | |
Non-investment grade | 23,549 | | 23,824 | | 288,200 | | 276,825 | | ||||
Total by rating | $ | 39,362 | | $ | 39,610 | | $ | 1,224,696 | | $ | 1,171,760 | |
By maturity | | | | | ||||||||
Within 1 year | $ | 2,697 | | $ | 2,567 | | $ | 253,344 | | $ | 234,619 | |
From 1 to 5 years | 32,104 | | 32,636 | | 890,348 | | 866,199 | | ||||
After 5 years | 4,561 | | 4,407 | | 81,004 | | 70,942 | | ||||
Total by maturity | $ | 39,362 | | $ | 39,610 | | $ | 1,224,696 | | $ | 1,171,760 | |
(1) | The fair value amount receivable is composed of $ 14,100 million under protection purchased and $ 25,262 million under protection sold. |
(2) | The fair value amount payable is composed of $ 26,473 million under protection purchased and $ 13,137 million under protection sold. |
188
| Fair values | Notionals | ||||||||||
In millions of dollars at December 31, 2014 | Receivable (1) | Payable (2) | Protection | Protection | ||||||||
By industry/counterparty | | | | | ||||||||
Banks | $ | 24,828 | | $ | 23,189 | | $ | 574,764 | | $ | 604,700 | |
Broker-dealers | 8,093 | | 9,309 | | 204,542 | | 199,693 | | ||||
Non-financial | 91 | | 113 | | 3,697 | | 1,595 | | ||||
Insurance and other financial institutions | 10,784 | | 11,374 | | 333,384 | | 257,870 | | ||||
Total by industry/counterparty | $ | 43,796 | | $ | 43,985 | | $ | 1,116,387 | | $ | 1,063,858 | |
By instrument | | | | | ||||||||
Credit default swaps and options | $ | 42,930 | | $ | 42,201 | | $ | 1,094,199 | | $ | 1,054,671 | |
Total return swaps and other | 866 | | 1,784 | | 22,188 | | 9,187 | | ||||
Total by instrument | $ | 43,796 | | $ | 43,985 | | $ | 1,116,387 | | $ | 1,063,858 | |
By rating | | | | | ||||||||
Investment grade | $ | 17,432 | | $ | 17,182 | | $ | 824,831 | | $ | 786,848 | |
Non-investment grade | 26,364 | | 26,803 | | 291,556 | | 277,010 | | ||||
Total by rating | $ | 43,796 | | $ | 43,985 | | $ | 1,116,387 | | $ | 1,063,858 | |
By maturity | | | | | ||||||||
Within 1 year | $ | 4,356 | | $ | 4,278 | | $ | 250,489 | | $ | 229,502 | |
From 1 to 5 years | 34,692 | | 35,160 | | 790,251 | | 772,001 | | ||||
After 5 years | 4,748 | | 4,547 | | 75,647 | | 62,355 | | ||||
Total by maturity | $ | 43,796 | | $ | 43,985 | | $ | 1,116,387 | | $ | 1,063,858 | |
(1) | The fair value amount receivable is composed of $ 18,708 million under protection purchased and $ 25,088 million under protection sold. |
(2) | The fair value amount payable is composed of $ 26,527 million under protection purchased and $ 17,458 million under protection sold. |
Fair values included in the above tables are prior to application of any netting agreements and cash collateral. For notional amounts, Citi generally has a mismatch between the total notional amounts of protection purchased and sold, and it may hold the reference assets directly, rather than entering into offsetting credit derivative contracts as and when desired. The open risk exposures from credit derivative contracts are largely matched after certain cash positions in reference assets are considered and after notional amounts are adjusted, either to a duration-based equivalent basis or to reflect the level of subordination in tranched structures. The ratings of the credit derivatives portfolio presented in the tables and used to evaluate payment/performance risk are based on the assigned internal or external ratings of the referenced asset or entity. Where external ratings are used, investment-grade ratings are considered to be ‘Baa/BBB' and above, while anything below is considered non-investment grade. Citi's internal ratings are in line with the related external rating system.
Citigroup evaluates the payment/performance risk of the credit derivatives for which it stands as a protection seller based on the credit rating assigned to the underlying referenced credit. Credit derivatives written on an underlying non-investment grade reference credit represent greater payment risk to the Company. The non-investment grade category in the table above also includes credit derivatives where the underlying referenced entity has been downgraded subsequent to the inception of the derivative.
The maximum potential amount of future payments under credit derivative contracts presented in the table above is based on the notional value of the derivatives. The Company believes that the notional amount for credit protection sold is not representative of the actual loss exposure based on historical experience. This amount has not been reduced by the value of the reference assets and the related cash flows. In accordance with most credit derivative contracts, should a credit event occur, the Company usually is liable for the difference between the protection sold and the value of the reference assets. Furthermore, the notional amount for credit protection sold has not been reduced for any cash collateral paid to a given counterparty, as such payments would be calculated after netting all derivative exposures, including any credit derivatives with that counterparty in accordance with a related master netting agreement. Due to such netting processes, determining the amount of collateral that corresponds to credit derivative exposures alone is not possible. The Company actively monitors open credit-risk exposures and manages this exposure by using a variety of strategies, including purchased credit derivatives, cash collateral or direct holdings of the referenced assets. This risk mitigation activity is not captured in the table above.
189
Credit-Risk-Related Contingent Features in Derivatives
Certain derivative instruments contain provisions that require the Company to either post additional collateral or immediately settle any outstanding liability balances upon the occurrence of a specified event related to the credit risk of the Company. These events, which are defined by the existing derivative contracts, are primarily downgrades in the credit ratings of the Company and its affiliates. The fair value (excluding CVA) of all derivative instruments with credit-risk-related contingent features that were in a net liability position at both June 30, 2015 and December 31, 2014 was $ 24 billion and $ 30 billion , respectively. The Company had posted $ 21 billion and $ 27 billion as collateral for this exposure in the normal course of business as of June 30, 2015 and December 31, 2014 , respectively.
A downgrade could trigger additional collateral or cash settlement requirements for the Company and certain affiliates. In the event that Citigroup and Citibank, N.A. were downgraded a single notch by all three major rating agencies as of June 30, 2015 , the Company could be required to post an additional $ 2.0 billion as either collateral or settlement of the derivative transactions. Additionally, the Company could be required to segregate with third-party custodians collateral previously received from existing derivative counterparties in the amount of $ 0.1 billion upon the single notch downgrade, resulting in aggregate cash obligations and collateral requirements of approximately $ 2.1 billion .
Derivatives Accompanied by Financial Asset Transfers
The Company executes total return swaps which provide it with synthetic exposure to substantially all of the economic return of the securities or other financial assets referenced in the contract. In certain cases, the derivative transaction is accompanied by the Company's transfer of the referenced financial asset to the derivative counterparty, most typically in response to the derivative counterparty's desire to hedge, in whole or in part, its synthetic exposure under the derivative contract by holding the referenced asset in funded form. In certain jurisdictions these transactions qualify as sales, resulting in derecognition of the securities transferred (see Note 1 to the Consolidated Financial Statements in Citi's 2014 Annual Report on Form 10-K for further discussion of the related sale conditions for transfers of financial assets). For a significant portion of the transactions, the Company has also executed another total return swap where the Company passes on substantially all of the economic return of the referenced securities to a different third party seeking the exposure. In those cases, the Company is not exposed, on a net basis, to changes in the economic return of the referenced securities.
These transactions generally involve the transfer of the Company's liquid government bonds, convertible bonds, or publicly traded corporate equity securities from the trading portfolio and are executed with third-party financial institutions. The accompanying derivatives are typically total return swaps. The derivatives are cash settled and subject to ongoing margin requirements.
When the conditions for sale accounting are met, the Company reports the transfer of the referenced financial asset as a sale and separately reports the accompanying derivative
transaction. These transactions generally do not result in a gain or loss on the sale of the security, because the transferred security was held at fair value in the Company's trading portfolio. For transfers of financial assets accounted for by the Company as a sale, where the Company has retained substantially all of the economic exposure to the transferred asset through a total return swap executed in contemplation of the initial sale with the same counterparty and still outstanding as of June 30, 2015 , both the asset carrying amounts derecognized and gross cash proceeds received as of the date of derecognition were $2.2 billion . At June 30, 2015 , the fair value of these previously derecognized assets was $2.1 billion and the fair value of the total return swaps was $17 million recorded as gross derivative assets and $71 million recorded as gross derivative liabilities. The balances for the total return swaps are on a gross basis, before the application of counterparty and cash collateral netting, and are included primarily as equity derivatives in the tabular disclosures in this Note.
190
22 . FAIR VALUE MEASUREMENT
ASC 820-10 Fair Value Measurement , defines fair value, establishes a consistent framework for measuring fair value and requires disclosures about fair value measurements. Fair value is defined as the price that would be received to sell an asset or paid to transfer a liability in an orderly transaction between market participants at the measurement date. Among other things, the standard requires the Company to maximize the use of observable inputs and minimize the use of unobservable inputs when measuring fair value.
Under ASC 820-10, the probability of default of a counterparty is factored into the valuation of derivative positions and includes the impact of Citigroup's own credit risk on derivatives and other liabilities measured at fair value.
Fair Value Hierarchy
ASC 820-10 specifies a hierarchy of inputs based on whether the inputs are observable or unobservable. Observable inputs are developed using market data and reflect market participant assumptions, while unobservable inputs reflect the Company's market assumptions. These two types of inputs have created the following fair value hierarchy:
• | Level 1: Quoted prices for identical instruments in active markets. |
• | Level 2: Quoted prices for similar instruments in active markets; quoted prices for identical or similar instruments in markets that are not active; and model-derived valuations in which all significant inputs and significant value drivers are observable in active markets. |
• | Level 3: Valuations derived from valuation techniques in which one or more significant inputs or significant value drivers are unobservable . |
As required under the fair value hierarchy, the Company considers relevant and observable market inputs in its valuations where possible. The frequency of transactions, the size of the bid-ask spread and the amount of adjustment necessary when comparing similar transactions are all factors in determining the liquidity of markets and the relevance of observed prices in those markets.
The Company's policy with respect to transfers between levels of the fair value hierarchy is to recognize transfers into and out of each level as of the end of the reporting period.
Determination of Fair Value
For assets and liabilities carried at fair value, the Company measures such value using the procedures set out below, irrespective of whether these assets and liabilities are measured at fair value as a result of an election or whether they are required to be measured at fair value.
When available, the Company generally uses quoted market prices to determine fair value and classifies such items as Level 1. In some cases where a market price is available, the Company will make use of acceptable practical expedients (such as matrix pricing) to calculate fair value, in which case the items are classified as Level 2.
The Company may also apply a price-based methodology, which utilizes, where available, quoted prices or other market
information obtained from recent trading activity in positions with the same or similar characteristics to the position being valued. The market activity and the amount of the bid-ask spread are among the factors considered in determining the liquidity of markets and the relevance of observed prices from those markets. If relevant and observable prices are available, those valuations may be classified as Level 2. When less liquidity exists for a security or loan, a quoted price is stale, a significant adjustment to the price of a similar security is necessary to reflect differences in the terms of the actual security or loan being valued, or prices from independent sources are insufficient to corroborate the valuation, the "price" inputs are considered unobservable and the fair value measurements are classified as Level 3.
If quoted market prices are not available, fair value is based upon internally developed valuation techniques that use, where possible, current market-based parameters, such as interest rates, currency rates and option volatilities. Items valued using such internally generated valuation techniques are classified according to the lowest level input or value driver that is significant to the valuation. Thus, an item may be classified as Level 3 even though there may be some significant inputs that are readily observable.
Fair value estimates from internal valuation techniques are verified, where possible, to prices obtained from independent vendors or brokers. Vendors' and brokers' valuations may be based on a variety of inputs ranging from observed prices to proprietary valuation models.
The following section describes the valuation methodologies used by the Company to measure various financial instruments at fair value, including an indication of the level in the fair value hierarchy in which each instrument is generally classified. Where appropriate, the description includes details of the valuation models, the key inputs to those models and any significant assumptions.
Market valuation adjustments
Generally, the unit of account for a financial instrument is the individual financial instrument. The Company applies market valuation adjustments that are consistent with the unit of account, which does not include adjustment due to the size of the Company's position, except as follows. ASC 820-10 permits an exception, through an accounting policy election, to measure the fair value of a portfolio of financial assets and financial liabilities on the basis of the net open risk position when certain criteria are met. Citi has elected to measure certain portfolios of financial instruments, such as derivatives, that meet those criteria on the basis of the net open risk position. The Company applies market valuation adjustments, including adjustments to account for the size of the net open risk position, consistent with market participant assumptions and in accordance with the unit of account.
Liquidity adjustments are applied to items in Level 2 or Level 3 of the fair-value hierarchy in an effort to ensure that the fair value reflects the price at which the net open risk position could be liquidated. The liquidity adjustment is based on the bid/offer spread for an instrument. When Citi has elected to measure certain portfolios of financial investments, such as derivatives, on the basis of the net open risk position,
191
the liquidity adjustment is adjusted to take into account the size of the position.
Credit valuation adjustments (CVA) and, effective in the third quarter of 2014, funding valuation adjustments (FVA), are applied to over-the-counter (OTC) derivative instruments in which the base valuation generally discounts expected cash flows using the relevant base interest rate curve for the currency of the derivative (e.g., LIBOR for uncollateralized U.S. dollar derivatives). As not all counterparties have the same credit risk as that implied by the relevant base curve, a CVA is necessary to incorporate the market view of both counterparty credit risk and Citi's own credit risk in the valuation. FVA reflects a market funding risk premium inherent in the uncollateralized portion of derivative portfolios, and in collateralized derivatives where the terms of the agreement do not permit the reuse of the collateral received.
Citi's CVA methodology is composed of two steps. First, the credit exposure profile for each counterparty is determined using the terms of all individual derivative positions and a Monte Carlo simulation or other quantitative analysis to generate a series of expected cash flows at future points in time. The calculation of this exposure profile considers the effect of credit risk mitigants, including pledged cash or other collateral and any legal right of offset that exists with a counterparty through arrangements such as netting agreements. Individual derivative contracts that are subject to an enforceable master netting agreement with a counterparty are aggregated for this purpose, since it is those aggregate net cash flows that are subject to nonperformance risk. This process identifies specific, point-in-time future cash flows that are subject to nonperformance risk, rather than using the current recognized net asset or liability as a basis to measure the CVA. Second, market-based views of default probabilities
derived from observed credit spreads in the credit default swap
(CDS) market are applied to the expected future cash flows
determined in step one. Citi's own-credit CVA is determined
using Citi-specific CDS spreads for the relevant tenor.
Generally, counterparty CVA is determined using CDS spread
indices for each credit rating and tenor. For certain identified
netting sets where individual analysis is practicable
(e.g., exposures to counterparties with liquid CDSs),
counterparty-specific CDS spreads are used.
The CVA and FVA are designed to incorporate a market view of the credit and funding risk, respectively, inherent in the derivative portfolio. However, most unsecured derivative instruments are negotiated bilateral contracts and are not commonly transferred to third parties. Derivative instruments are normally settled contractually or, if terminated early, are terminated at a value negotiated bilaterally between the counterparties. Thus, the CVA and FVA may not be realized upon a settlement or termination in the normal course of business. In addition, all or a portion of these adjustments may be reversed or otherwise adjusted in future periods in the event of changes in the credit or funding risk associated with the derivative instruments.
The table below summarizes the CVA and FVA applied to the fair value of derivative instruments for the periods indicated:
| Credit and funding valuation adjustments contra-liability (contra-asset) | |||||
In millions of dollars | June 30, | December 31, | ||||
Counterparty CVA | $ | (1,666 | ) | $ | (1,853 | ) |
Asset FVA | (466 | ) | (518 | ) | ||
Citigroup (own-credit) CVA | 569 | | 580 | | ||
Liability FVA | 64 | | 19 | | ||
Total CVA-derivative instruments (1) | $ | (1,499 | ) | $ | (1,772 | ) |
(1) | FVA is included with CVA for presentation purposes. |
The table below summarizes pretax gains (losses) related to changes in CVA on derivative instruments, net of hedges, FVA on derivatives and debt valuation adjustments (DVA) on Citi's own fair value option (FVO) liabilities for the periods indicated:
| Credit/funding/debt valuation adjustments gain (loss) | |||||||||||
| Three Months Ended June 30, | Six months ended June 30, | ||||||||||
In millions of dollars | 2015 | 2014 | 2015 | 2014 | ||||||||
Counterparty CVA | $ | (20 | ) | $ | 63 | | $ | (159 | ) | $ | 70 | |
Asset FVA | 94 | | - | | 52 | | - | | ||||
Own-credit CVA | 20 | | (52 | ) | (16 | ) | (86 | ) | ||||
Liability FVA | (12 | ) | - | | 45 | | - | | ||||
Total CVA-derivative instruments | $ | 82 | | $ | 11 | | $ | (78 | ) | $ | (16 | ) |
DVA related to own FVO liabilities | $ | 230 | | $ | (44 | ) | $ | 318 | | $ | (10 | ) |
Total CVA and DVA (1) | $ | 312 | | $ | (33 | ) | $ | 240 | | $ | (26 | ) |
(1) | FVA is included with CVA for presentation purposes. |
Valuation Process for Fair Value Measurements
Price verification procedures and related internal control procedures are governed by the Citigroup Pricing and Price Verification Policy and Standards , which is jointly owned by Finance and Risk Management.
For fair value measurements of substantially all assets and liabilities held by the Company, individual business units are responsible for valuing the trading account assets and liabilities, and Product Control within Finance performs independent price verification procedures to evaluate those fair value measurements. Product Control is independent of the individual business units and reports to the Global Head of Product Control. It has authority over the valuation of financial assets and liabilities. Fair value measurements of assets and liabilities are determined using various techniques, including, but not limited to, discounted cash flows and internal models, such as option and correlation models.
Based on the observability of inputs used, Product Control classifies the inventory as Level 1, Level 2 or Level 3 of the fair value hierarchy. When a position involves one or more significant inputs that are not directly observable, price
192
verification procedures are performed that may include reviewing relevant historical data, analyzing profit and loss, valuing each component of a structured trade individually, and benchmarking, among others.
Reports of inventory that is classified within Level 3 of the fair value hierarchy are distributed to senior management in Finance, Risk and the business. This inventory is also discussed in Risk Committees and in monthly meetings with senior trading management. As deemed necessary, reports may go to the Audit Committee of the Board of Directors or to the full Board of Directors. Whenever an adjustment is needed to bring the price of an asset or liability to its exit price, Product Control reports it to management along with other price verification results.
In addition, the pricing models used in measuring fair value are governed by an independent control framework. Although the models are developed and tested by the individual business units, they are independently validated by the Model Validation Group within Risk Management and reviewed by Finance with respect to their impact on the price verification procedures. The purpose of this independent control framework is to assess model risk arising from models' theoretical soundness, calibration techniques where needed, and the appropriateness of the model for a specific product in a defined market. To ensure their continued applicability, models are independently reviewed annually. In addition, Risk Management approves and maintains a list of products permitted to be valued under each approved model for a given business.
Securities purchased under agreements to resell and securities sold under agreements to repurchase
No quoted prices exist for such instruments, so fair value is determined using a discounted cash-flow technique. Cash flows are estimated based on the terms of the contract, taking into account any embedded derivative or other features. Expected cash flows are discounted using interest rates appropriate to the maturity of the instrument as well as the nature of the underlying collateral. Generally, when such instruments are held at fair value, they are classified within Level 2 of the fair value hierarchy, as the inputs used in the valuation are readily observable. However, certain long-dated positions are classified within Level 3 of the fair value hierarchy.
Trading account assets and liabilities-trading securities and trading loans
When available, the Company generally uses quoted market prices in active markets to determine the fair value of trading securities; such items are classified as Level 1 of the fair value hierarchy. Examples include some government securities and exchange-traded equity securities.
For bonds and secondary market loans traded over the counter, the Company generally determines fair value utilizing valuation techniques, including discounted cash flows, price-based and internal models, such as Black-Scholes and Monte Carlo simulation. Fair value estimates from these internal valuation techniques are verified, where possible, to prices obtained from independent sources, including third-party
vendors. Vendors compile prices from various sources and may apply matrix pricing for similar bonds or loans where no price is observable. A price-based methodology utilizes, where available, quoted prices or other market information obtained from recent trading activity of assets with similar characteristics to the bond or loan being valued. The yields used in discounted cash flow models are derived from the same price information. Trading securities and loans priced using such methods are generally classified as Level 2. However, when less liquidity exists for a security or loan, a quoted price is stale, a significant adjustment to the price of a similar security or loan is necessary to reflect differences in the terms of the actual security or loan being valued, or prices from independent sources are insufficient to corroborate valuation, a loan or security is generally classified as Level 3. The price input used in a price-based methodology may be zero for a security, such as a subprime CDO, that is not receiving any principal or interest and is currently written down to zero.
Where the Company's principal market for a portfolio of loans is the securitization market, the Company uses the securitization price to determine the fair value of the portfolio. The securitization price is determined from the assumed proceeds of a hypothetical securitization in the current market, adjusted for transformation costs (i.e., direct costs other than transaction costs) and securitization uncertainties such as market conditions and liquidity. As a result of the severe reduction in the level of activity in certain securitization markets since the second half of 2007, observable securitization prices for certain directly comparable portfolios of loans have not been readily available. Therefore, such portfolios of loans are generally classified as Level 3 of the fair value hierarchy. However, for other loan securitization markets, such as commercial real estate loans, price verification of the hypothetical securitizations has been possible, since these markets have remained active. Accordingly, this loan portfolio is classified as Level 2 of the fair value hierarchy.
Trading account assets and liabilities-derivatives
Exchange-traded derivatives, measured at fair value using quoted (i.e., exchange) prices in active markets, where available, are classified as Level 1 of the fair value hierarchy.
Derivatives without a quoted price in an active market and derivatives executed over the counter are valued using internal valuation techniques. These derivative instruments are classified as either Level 2 or Level 3 depending upon the observability of the significant inputs to the model.
The valuation techniques and inputs depend on the type of derivative and the nature of the underlying instrument. The principal techniques used to value these instruments are discounted cash flows and internal models, including Black-Scholes and Monte Carlo simulation.
The key inputs depend upon the type of derivative and the nature of the underlying instrument and include interest rate yield curves, foreign-exchange rates, volatilities and correlation. The Company uses overnight indexed swap (OIS) curves as fair value measurement inputs for the valuation of certain collateralized derivatives. Citi uses the relevant
193
benchmark curve for the currency of the derivative (e.g., the London Interbank Offered Rate for U.S. dollar derivatives) as the discount rate for uncollateralized derivatives.
As referenced above, during the third quarter of 2014 , Citi incorporated FVA into the fair value measurements due to what it believes to be an industry migration toward incorporating the market's view of funding risk premium in OTC derivatives. The incurred charge in 2014 in connection with the implementation of FVA was reflected in Principal transactions as a change in accounting estimate. Citi's FVA methodology leverages the existing CVA methodology to estimate a funding exposure profile. The calculation of this exposure profile considers collateral agreements where the terms do not permit the firm to reuse the collateral received, including where counterparties post collateral to third-party custodians.
Subprime-related direct exposures in CDOs
The valuation of high-grade and mezzanine asset-backed security (ABS) CDO positions utilizes prices based on the underlying assets of each high-grade and mezzanine ABS CDO.
For most of the lending and structured direct subprime exposures, fair value is determined utilizing observable transactions where available, other market data for similar assets in markets that are not active and other internal valuation techniques.
Investments
The investments category includes available-for-sale debt and marketable equity securities whose fair value is generally determined by utilizing similar procedures described for trading securities above or, in some cases, using vendor pricing as the primary source.
Also included in investments are nonpublic investments in private equity and real estate entities. Determining the fair value of nonpublic securities involves a significant degree of management resources and judgment, as no quoted prices exist and such securities are generally very thinly traded. In addition, there may be transfer restrictions on private equity securities. The Company's process for determining the fair value of such securities utilizes commonly accepted valuation techniques, including comparables analysis. In determining the fair value of nonpublic securities, the Company also considers events such as a proposed sale of the investee company, initial public offerings, equity issuances or other observable transactions.
Private equity securities are generally classified as Level 3 of the fair value hierarchy.
Short-term borrowings and long-term debt
Where fair value accounting has been elected, the fair value of non-structured liabilities is determined by utilizing internal models using the appropriate discount rate for the applicable maturity. Such instruments are generally classified as Level 2 of the fair value hierarchy when all significant inputs are readily observable.
The Company determines the fair value of hybrid financial instruments, including structured liabilities, using the
appropriate derivative valuation methodology (described above in "Trading account assets and liabilities-derivatives") given the nature of the embedded risk profile. Such instruments are classified as Level 2 or Level 3 depending on the observability of significant inputs to the model.
Alt-A mortgage securities
The Company classifies its Alt-A mortgage securities as held-to-maturity, available-for-sale or trading investments. The securities classified as trading and available-for-sale are recorded at fair value with changes in fair value reported in current earnings and AOCI, respectively. For these purposes, Citi defines Alt-A mortgage securities as non-agency residential mortgage-backed securities (RMBS) where (i) the underlying collateral has weighted average FICO scores between 680 and 720 or (ii) for instances where FICO scores are greater than 720, RMBS have 30% or less of the underlying collateral composed of full documentation loans.
Similar to the valuation methodologies used for other trading securities and trading loans, the Company generally determines the fair values of Alt-A mortgage securities utilizing internal valuation techniques. Fair value estimates from internal valuation techniques are verified, where possible, to prices obtained from independent vendors. Consensus data providers compile prices from various sources. Where available, the Company may also make use of quoted prices for recent trading activity in securities with the same or similar characteristics to the security being valued.
The valuation techniques used for Alt-A mortgage securities, as with other mortgage exposures, are price-based and yield analysis. The primary market-derived input is yield. Cash flows are based on current collateral performance with prepayment rates and loss projections reflective of current economic conditions of housing price change, unemployment rates, interest rates, borrower attributes and other market indicators.
Alt-A mortgage securities that are valued using these methods are generally classified as Level 2. However, Alt-A mortgage securities backed by Alt-A mortgages of lower quality or subordinated tranches in the capital structure are mostly classified as Level 3 due to the reduced liquidity that exists for such positions, which reduces the reliability of prices available from independent sources.
194
Items Measured at Fair Value on a Recurring Basis
The following tables present for each of the fair value hierarchy levels the Company's assets and liabilities that are measured at fair value on a recurring basis at June 30, 2015 and December 31, 2014 . The Company's hedging of positions that have been classified in the Level 3 category is not limited
to other financial instruments (hedging instruments) that have been classified as Level 3, but also instruments classified as Level 1 or Level 2 of the fair value hierarchy. The effects of these hedges are presented gross in the following tables.
Fair Value Levels
In millions of dollars at June 30, 2015 | Level 1 (1) | Level 2 (1) | Level 3 | Gross | Netting (2) | Net | ||||||||||||
Assets |
|
|
|
|
|
| ||||||||||||
Federal funds sold and securities borrowed or purchased under agreements to resell | $ | - | | $ | 173,553 | | $ | 1,070 | | $ | 174,623 | | $ | (42,556 | ) | $ | 132,067 | |
Trading non-derivative assets |
|
|
|
|
|
| ||||||||||||
Trading mortgage-backed securities |
|
|
|
|
|
| ||||||||||||
U.S. government-sponsored agency guaranteed | $ | - | | $ | 25,436 | | $ | 611 | | $ | 26,047 | | $ | - | | $ | 26,047 | |
Residential | - | | 1,609 | | 2,206 | | 3,815 | | - | | 3,815 | | ||||||
Commercial | - | | 3,346 | | 368 | | 3,714 | | - | | 3,714 | | ||||||
Total trading mortgage-backed securities | $ | - | | $ | 30,391 | | $ | 3,185 | | $ | 33,576 | | $ | - | | $ | 33,576 | |
U.S. Treasury and federal agency securities | $ | 18,577 | | $ | 3,415 | | $ | - | | $ | 21,992 | | $ | - | | $ | 21,992 | |
State and municipal | - | | 3,083 | | 249 | | 3,332 | | - | | 3,332 | | ||||||
Foreign government | 34,201 | | 24,038 | | 82 | | 58,321 | | - | | 58,321 | | ||||||
Corporate | 517 | | 20,314 | | 708 | | 21,539 | | - | | 21,539 | | ||||||
Equity securities | 52,540 | | 2,766 | | 2,741 | | 58,047 | | - | | 58,047 | | ||||||
Asset-backed securities | - | | 1,495 | | 4,236 | | 5,731 | | - | | 5,731 | | ||||||
Other trading assets | - | | 12,718 | | 3,098 | | 15,816 | | - | | 15,816 | | ||||||
Total trading non-derivative assets | $ | 105,835 | | $ | 98,220 | | $ | 14,299 | | $ | 218,354 | | $ | - | | $ | 218,354 | |
Trading derivatives | | | | |
|
| ||||||||||||
Interest rate contracts | $ | 45 | | $ | 446,909 | | $ | 2,749 | | $ | 449,703 | |
|
| ||||
Foreign exchange contracts | 1 | | 120,920 | | 1,046 | | 121,967 | |
|
| ||||||||
Equity contracts | 2,518 | | 19,806 | | 2,115 | | 24,439 | |
|
| ||||||||
Commodity contracts | 233 | | 14,896 | | 745 | | 15,874 | |
|
| ||||||||
Credit derivatives | - | | 36,268 | | 2,790 | | 39,058 | |
|
| ||||||||
Total trading derivatives | $ | 2,797 | | $ | 638,799 | | $ | 9,445 | | $ | 651,041 | |
|
| ||||
Cash collateral paid (3) |
|
|
| $ | 6,059 | |
|
| ||||||||||
Netting agreements |
|
|
|
| $ | (558,440 | ) |
| ||||||||||
Netting of cash collateral received |
|
|
|
| (37,817 | ) |
| |||||||||||
Total trading derivatives | $ | 2,797 | | $ | 638,799 | | $ | 9,445 | | $ | 657,100 | | $ | (596,257 | ) | $ | 60,843 | |
Investments |
|
|
|
|
|
| ||||||||||||
Mortgage-backed securities |
|
|
|
|
|
| ||||||||||||
U.S. government-sponsored agency guaranteed | $ | - | | $ | 34,279 | | $ | 96 | | $ | 34,375 | | $ | - | | $ | 34,375 | |
Residential | - | | 7,097 | | 10 | | 7,107 | | - | | 7,107 | | ||||||
Commercial | - | | 513 | | - | | 513 | | - | | 513 | | ||||||
Total investment mortgage-backed securities | $ | - | | $ | 41,889 | | $ | 106 | | $ | 41,995 | | $ | - | | $ | 41,995 | |
U.S. Treasury and federal agency securities | $ | 114,561 | | $ | 10,104 | | $ | 5 | | $ | 124,670 | | $ | - | | $ | 124,670 | |
State and municipal | $ | - | | $ | 9,560 | | $ | 2,153 | | $ | 11,713 | | $ | - | | $ | 11,713 | |
Foreign government | 37,888 | | 49,215 | | 493 | | 87,596 | | - | | 87,596 | | ||||||
Corporate | 2,592 | | 11,442 | | 698 | | 14,732 | | - | | 14,732 | | ||||||
Equity securities | 411 | | 77 | | 483 | | 971 | | - | | 971 | | ||||||
Asset-backed securities | - | | 11,105 | | 503 | | 11,608 | | - | | 11,608 | | ||||||
Other debt securities | - | | 841 | | - | | 841 | | - | | 841 | | ||||||
Non-marketable equity securities (4) | - | | 53 | | 1,238 | | 1,291 | | - | | 1,291 | | ||||||
Total investments | $ | 155,452 | | $ | 134,286 | | $ | 5,679 | | $ | 295,417 | | $ | - | | $ | 295,417 | |
195
In millions of dollars at June 30, 2015 | Level 1 (1) | Level 2 (1) | Level 3 | Gross | Netting (2) | Net | ||||||||||||
Loans (5) | $ | - | | $ | 2,698 | | $ | 3,840 | | $ | 6,538 | | $ | - | | $ | 6,538 | |
Mortgage servicing rights | - | | - | | 1,924 | | 1,924 | | - | | 1,924 | | ||||||
Non-trading derivatives and other financial assets measured on a recurring basis, gross | $ | 120 | | $ | 9,969 | | $ | 139 | | $ | 10,228 | |
|
| ||||
Cash collateral paid (6) |
|
|
| - | |
|
| |||||||||||
Netting of cash collateral received |
|
|
|
| $ | (1,956 | ) |
| ||||||||||
Non-trading derivatives and other financial assets measured on a recurring basis (10) | $ | 120 | | $ | 9,969 | | $ | 139 | | $ | 10,228 | | $ | (1,956 | ) | $ | 8,272 | |
Total assets | $ | 264,204 | | $ | 1,057,525 | | $ | 36,396 | | $ | 1,364,184 | | $ | (640,769 | ) | $ | 723,415 | |
Total as a percentage of gross assets (7) | 19.4 | % | 77.9 | % | 2.7 | % | | | | | | | ||||||
Liabilities |
|
|
|
|
|
| ||||||||||||
Interest-bearing deposits | $ | - | | $ | 1,042 | | $ | 347 | | $ | 1,389 | | $ | - | | $ | 1,389 | |
Federal funds purchased and securities loaned or sold under agreements to repurchase | - | | 80,326 | | 965 | | 81,291 | | (42,556 | ) | 38,735 | | ||||||
Trading account liabilities |
|
|
|
|
|
| ||||||||||||
Securities sold, not yet purchased | 57,012 | | 15,710 | | 257 | | 72,979 | | | | 72,979 | | ||||||
Trading derivatives |
|
|
|
|
|
| ||||||||||||
Interest rate contracts | 30 | | 430,505 | | 3,172 | | 433,707 | |
|
| ||||||||
Foreign exchange contracts | 7 | | 125,930 | | 655 | | 126,592 | |
|
| ||||||||
Equity contracts | 2,629 | | 26,295 | | 2,470 | | 31,394 | |
|
| ||||||||
Commodity contracts | 261 | | 17,085 | | 2,472 | | 19,818 | |
|
| ||||||||
Credit derivatives | - | | 35,842 | | 3,364 | | 39,206 | |
|
| ||||||||
Total trading derivatives | $ | 2,927 | | $ | 635,657 | | $ | 12,133 | | $ | 650,717 | |
|
| ||||
Cash collateral received (8) |
|
|
| $ | 12,911 | |
|
| ||||||||||
Netting agreements |
|
|
|
| $ | (558,440 | ) |
| ||||||||||
Netting of cash collateral paid |
|
|
|
| (41,872 | ) |
| |||||||||||
Total trading derivatives | $ | 2,927 | | $ | 635,657 | | $ | 12,133 | | $ | 663,628 | | $ | (600,312 | ) | $ | 63,316 | |
Short-term borrowings | $ | - | | $ | 737 | | $ | 133 | | $ | 870 | | $ | - | | $ | 870 | |
Long-term debt | - | | 19,549 | | 7,665 | | 27,214 | | - | | 27,214 | | ||||||
Non-trading derivatives and other financial liabilities measured on a recurring basis, gross | $ | - | | $ | 1,287 | | $ | 4 | | $ | 1,291 | |
|
| ||||
Cash collateral received (9) |
|
|
| 4 | |
|
| |||||||||||
Netting of cash collateral paid |
|
|
|
| (50 | ) |
| |||||||||||
Total non-trading derivatives and other financial liabilities measured on a recurring basis | $ | - | | $ | 1,287 | | $ | 4 | | $ | 1,295 | | $ | (50 | ) | $ | 1,245 | |
Total liabilities | $ | 59,939 | | $ | 754,308 | | $ | 21,504 | | $ | 848,666 | | $ | (642,918 | ) | $ | 205,748 | |
Total as a percentage of gross liabilities (7) | 7.2 | % | 90.2 | % | 2.6 | % |
|
|
| |||||||||
(1) | For the three and six months ended June 30, 2015 , the Company transferred assets of approximately $1.0 billion and $1.6 billion from Level 1 to Level 2, respectively, primarily related to foreign government securities not traded in active markets. During the three and six months ended June 30, 2015 , the Company transferred assets of approximately $1.2 billion and $3.1 billion from Level 2 to Level 1, respectively, primarily related to foreign government bonds and equity securities traded with sufficient frequency to constitute a liquid market. During the six months ended June 30, 2015 , the Company transferred liabilities of approximately $0.3 billion from Level 2 to Level 1 and there were no material transfers of liabilities from Level 1 to Level 2. |
(2) | Represents netting of: (i) the amounts due under securities purchased under agreements to resell and the amounts owed under securities sold under agreements to repurchase; and (ii) derivative exposures covered by a qualifying master netting agreement and cash collateral offsetting. |
(3) | Reflects the net amount of $47,931 million of gross cash collateral paid, of which $41,872 million was used to offset trading derivative liabilities. |
(4) | Amounts exclude $1.0 billion investments measured at Net Asset Value (NAV) in accordance with ASU No. 2015-07, Fair Value Measurement (Topic 820): Disclosures for Investments in Certain Entities That Calculate Net Asset Value per Share (or Its Equivalent). See Note 1 to the Consolidated Financial Statements. |
(5) | There is no allowance for loan losses recorded for loans reported at fair value. |
(6) | Reflects $50 million of gross cash collateral paid, all of which was used to offset non-trading derivative liabilities. |
(7) | Because the amount of the cash collateral paid/received has not been allocated to the Level 1, 2 and 3 subtotals, these percentages are calculated based on total assets and liabilities measured at fair value on a recurring basis, excluding the cash collateral paid/received on derivatives. |
(8) | Reflects the net amount of $50,728 million of gross cash collateral received, of which $37,817 million was used to offset trading derivative assets. |
(9) | Reflects the net amount of $1,960 million of gross cash collateral received, of which $1,956 million was used to offset non-trading derivative assets. |
(10) | Includes assets transferred as a result of the announced sale of OneMain Financial. For additional information see Note 2 to the Consolidated Financial Statements. |
196
Fair Value Levels
In millions of dollars at December 31, 2014 | Level 1 (1) | Level 2 (1) | Level 3 | Gross | Netting (2) | Net | ||||||||||||
Assets |
|
|
|
|
|
| ||||||||||||
Federal funds sold and securities borrowed or purchased under agreements to resell | $ | - | | $ | 187,922 | | $ | 3,398 | | $ | 191,320 | | $ | (47,129 | ) | $ | 144,191 | |
Trading non-derivative assets |
|
|
|
|
|
| ||||||||||||
Trading mortgage-backed securities |
|
|
|
|
|
| ||||||||||||
U.S. government-sponsored agency guaranteed | - | | 25,968 | | 1,085 | | 27,053 | | - | | 27,053 | | ||||||
Residential | - | | 2,158 | | 2,680 | | 4,838 | | - | | 4,838 | | ||||||
Commercial | - | | 3,903 | | 440 | | 4,343 | | - | | 4,343 | | ||||||
Total trading mortgage-backed securities | $ | - | | $ | 32,029 | | $ | 4,205 | | $ | 36,234 | | $ | - | | $ | 36,234 | |
U.S. Treasury and federal agency securities | $ | 15,991 | | $ | 4,483 | | $ | - | | $ | 20,474 | | $ | - | | $ | 20,474 | |
State and municipal | - | | 3,161 | | 241 | | 3,402 | | - | | 3,402 | | ||||||
Foreign government | 37,995 | | 26,736 | | 206 | | 64,937 | | - | | 64,937 | | ||||||
Corporate | 1,337 | | 25,640 | | 820 | | 27,797 | | - | | 27,797 | | ||||||
Equity securities | 51,346 | | 4,281 | | 2,219 | | 57,846 | | - | | 57,846 | | ||||||
Asset-backed securities | - | | 1,252 | | 3,294 | | 4,546 | | - | | 4,546 | | ||||||
Other trading assets | - | | 9,221 | | 4,372 | | 13,593 | | - | | 13,593 | | ||||||
Total trading non-derivative assets | $ | 106,669 | | $ | 106,803 | | $ | 15,357 | | $ | 228,829 | | $ | - | | $ | 228,829 | |
Trading derivatives |
|
|
|
|
|
| ||||||||||||
Interest rate contracts | $ | 74 | | $ | 634,318 | | $ | 4,061 | | $ | 638,453 | |
|
| ||||
Foreign exchange contracts | - | | 154,744 | | 1,250 | | 155,994 | |
|
| ||||||||
Equity contracts | 2,748 | | 19,969 | | 2,035 | | 24,752 | |
|
| ||||||||
Commodity contracts | 647 | | 21,850 | | 1,023 | | 23,520 | |
|
| ||||||||
Credit derivatives | - | | 40,618 | | 2,900 | | 43,518 | |
|
| ||||||||
Total trading derivatives | $ | 3,469 | | $ | 871,499 | | $ | 11,269 | | $ | 886,237 | |
|
| ||||
Cash collateral paid (3) |
|
|
| $ | 6,523 | |
|
| ||||||||||
Netting agreements |
|
|
|
| $ | (777,178 | ) |
| ||||||||||
Netting of cash collateral received (6) |
|
|
|
| (47,625 | ) |
| |||||||||||
Total trading derivatives | $ | 3,469 | | $ | 871,499 | | $ | 11,269 | | $ | 892,760 | | $ | (824,803 | ) | $ | 67,957 | |
Investments |
|
|
|
|
|
| ||||||||||||
Mortgage-backed securities |
|
|
|
|
|
| ||||||||||||
U.S. government-sponsored agency guaranteed | $ | - | | $ | 36,053 | | $ | 38 | | $ | 36,091 | | $ | - | | $ | 36,091 | |
Residential | - | | 8,355 | | 8 | | 8,363 | | - | | 8,363 | | ||||||
Commercial | - | | 553 | | 1 | | 554 | | - | | 554 | | ||||||
Total investment mortgage-backed securities | $ | - | | $ | 44,961 | | $ | 47 | | $ | 45,008 | | $ | - | | $ | 45,008 | |
U.S. Treasury and federal agency securities | $ | 110,710 | | $ | 12,974 | | $ | 6 | | $ | 123,690 | | $ | - | | $ | 123,690 | |
State and municipal | $ | - | | $ | 10,519 | | $ | 2,180 | | $ | 12,699 | | $ | - | | $ | 12,699 | |
Foreign government | 37,280 | | 52,739 | | 678 | | 90,697 | | - | | 90,697 | | ||||||
Corporate | 1,739 | | 9,746 | | 672 | | 12,157 | | - | | 12,157 | | ||||||
Equity securities | 1,770 | | 274 | | 681 | | 2,725 | | - | | 2,725 | | ||||||
Asset-backed securities | - | | 11,957 | | 549 | | 12,506 | | - | | 12,506 | | ||||||
Other debt securities | - | | 661 | | - | | 661 | | - | | 661 | | ||||||
Non-marketable equity securities (7) | - | | 233 | | 1,460 | | 1,693 | | - | | 1,693 | | ||||||
Total investments | $ | 151,499 | | $ | 144,064 | | $ | 6,273 | | $ | 301,836 | | $ | - | | $ | 301,836 | |
197
In millions of dollars at December 31, 2014 | Level 1 (1) | Level 2 (1) | Level 3 | Gross | Netting (2) | Net | ||||||||||||
Loans (4) | $ | - | | $ | 2,793 | | $ | 3,108 | | $ | 5,901 | | $ | - | | $ | 5,901 | |
Mortgage servicing rights | - | | - | | 1,845 | | 1,845 | | - | | 1,845 | | ||||||
Non-trading derivatives and other financial assets measured on a recurring basis, gross | $ | - | | $ | 9,352 | | $ | 78 | | $ | 9,430 | |
|
| ||||
Cash collateral paid (5) |
|
|
| 123 | |
|
| |||||||||||
Netting of cash collateral received (8) |
|
|
|
| $ | (1,791 | ) |
| ||||||||||
Non-trading derivatives and other financial assets measured on a recurring basis | $ | - | | $ | 9,352 | | $ | 78 | | $ | 9,553 | | $ | (1,791 | ) | $ | 7,762 | |
Total assets | $ | 261,637 | | $ | 1,322,433 | | $ | 41,328 | | $ | 1,632,044 | | $ | (873,723 | ) | $ | 758,321 | |
Total as a percentage of gross assets (5) | 16.1 | % | 81.4 | % | 2.5 | % |
|
|
| |||||||||
Liabilities |
|
|
|
|
|
| ||||||||||||
Interest-bearing deposits | $ | - | | $ | 1,198 | | $ | 486 | | $ | 1,684 | | $ | - | | $ | 1,684 | |
Federal funds purchased and securities loaned or sold under agreements to repurchase | - | | 82,811 | | 1,043 | | 83,854 | | (47,129 | ) | 36,725 | | ||||||
Trading account liabilities |
|
|
|
|
|
| ||||||||||||
Securities sold, not yet purchased | 59,463 | | 11,057 | | 424 | | 70,944 | | - | | 70,944 | | ||||||
Trading account derivatives |
|
|
|
|
|
| ||||||||||||
Interest rate contracts | 77 | | 617,933 | | 4,272 | | 622,282 | |
|
| ||||||||
Foreign exchange contracts | - | | 158,354 | | 472 | | 158,826 | |
|
| ||||||||
Equity contracts | 2,955 | | 26,616 | | 2,898 | | 32,469 | |
|
| ||||||||
Commodity contracts | 669 | | 22,872 | | 2,645 | | 26,186 | |
|
| ||||||||
Credit derivatives | - | | 39,787 | | 3,643 | | 43,430 | |
|
| ||||||||
Total trading derivatives | $ | 3,701 | | $ | 865,562 | | $ | 13,930 | | $ | 883,193 | |
|
| ||||
Cash collateral received (8) |
|
|
| $ | 9,846 | |
|
| ||||||||||
Netting agreements |
|
|
|
| $ | (777,178 | ) |
| ||||||||||
Netting of cash collateral paid (3) |
|
|
|
| (47,769 | ) |
| |||||||||||
Total trading derivatives | $ | 3,701 | | $ | 865,562 | | $ | 13,930 | | $ | 893,039 | | $ | (824,947 | ) | $ | 68,092 | |
Short-term borrowings | $ | - | | $ | 1,152 | | $ | 344 | | $ | 1,496 | | $ | - | | $ | 1,496 | |
Long-term debt | - | | 18,890 | | 7,290 | | 26,180 | | - | | 26,180 | | ||||||
Non-trading derivatives and other financial liabilities measured on a recurring basis, gross | $ | - | | $ | 1,777 | | $ | 7 | | $ | 1,784 | |
|
| ||||
Cash collateral received (9) |
|
|
| $ | 7 | |
|
| ||||||||||
Netting of cash collateral paid (5) |
|
|
|
| (15 | ) |
| |||||||||||
Non-trading derivatives and other financial liabilities measured on a recurring basis | - | | 1,777 | | 7 | | 1,791 | | (15 | ) | 1,776 | | ||||||
Total liabilities | $ | 63,164 | | $ | 982,447 | | $ | 23,524 | | $ | 1,078,988 | | $ | (872,091 | ) | $ | 206,897 | |
Total as a percentage of gross liabilities (6) | 5.9 | % | 91.9 | % | 2.2 | % |
|
|
| |||||||||
(1) | For the year ended December 31, 2014 , the Company transferred assets of approximately $4.1 billion from Level 1 to Level 2, primarily related to foreign government securities not traded with sufficient frequency to constitute an active market and Citi refining its methodology for certain equity contracts to reflect the prevalence of off-exchange trading. During the year ended December 31, 2014 , the Company transferred assets of approximately $4.2 billion from Level 2 to Level 1, primarily related to foreign government bonds traded with sufficient frequency to constitute a liquid market. During the year ended December 31, 2014 , the Company transferred liabilities of approximately $1.4 billion from Level 1 to Level 2, as Citi refined its methodology for certain equity contracts to reflect the prevalence of off-exchange trading. During the year ended December 31, 2014 , there were no material liability transfers from Level 2 to Level 1. |
(2) | Represents netting of: (i) the amounts due under securities purchased under agreements to resell and the amounts owed under securities sold under agreements to repurchase; and (ii) derivative exposures covered by a qualifying master netting agreement and cash collateral offsetting. |
(3) | Reflects the net amount of $54,292 million of gross cash collateral paid, of which $47,769 million was used to offset trading derivative liabilities. |
(4) | There is no allowance for loan losses recorded for loans reported at fair value. |
(5) | Reflects the net amount of $138 million of gross cash collateral paid, of which $15 million was used to offset non-trading derivative liabilities. |
(6) | Because the amount of the cash collateral paid/received has not been allocated to the Level 1, 2 and 3 subtotals, these percentages are calculated based on total assets and liabilities measured at fair value on a recurring basis, excluding the cash collateral paid/received on derivatives. |
(7) | Amounts exclude $1.1 billion investments measured at Net Asset Value (NAV) in accordance with ASU No. 2015-07, Fair Value Measurement (Topic 820): Disclosures for Investments in Certain Entities That Calculate Net Asset Value per Share (or Its Equivalent). See Note 1 to the Consolidated Financial Statements. |
(8) | Reflects the net amount of $57,471 million of gross cash collateral received, of which $47,625 million was used to offset trading derivative assets. |
(9) | Reflects the net amount of $1,798 million of gross cash collateral received, of which $1,791 million was used to offset non-trading derivative assets. |
198
Changes in Level 3 Fair Value Category
The following tables present the changes in the Level 3 fair value category for the three and six months ended June 30, 2015 and 2014 . As discussed above, the Company classifies financial instruments as Level 3 of the fair value hierarchy when there is reliance on at least one significant unobservable input to the valuation model. In addition to these unobservable inputs, the valuation models for Level 3 financial instruments typically also rely on a number of inputs that are readily observable either directly or indirectly. The gains and losses presented below include changes in the fair value related to both observable and unobservable inputs.
The Company often hedges positions with offsetting positions that are classified in a different level. For example, the gains and losses for assets and liabilities in the Level 3 category presented in the tables below do not reflect the effect of offsetting losses and gains on hedging instruments that have been classified by the Company in the Level 1 and Level 2 categories. In addition, the Company hedges items classified in the Level 3 category with instruments also classified in Level 3 of the fair value hierarchy. The effects of these hedges are presented gross in the following tables.
Level 3 Fair Value Rollforward
|
| Net realized/unrealized | Transfers |
|
|
|
|
| Unrealized | ||||||||||||||||||||||||
In millions of dollars | Mar. 31, 2015 | Principal | Other (1)(2) | into | out of | Purchases | Issuances | Sales | Settlements | Jun. 30, 2015 | |||||||||||||||||||||||
Assets |
|
|
|
|
|
|
|
|
|
|
| ||||||||||||||||||||||
Federal funds sold and securities borrowed or purchased under agreements to resell | $ | 4,022 | | $ | (95 | ) | $ | - | | $ | - | | $ | (2,756 | ) | $ | 20 | | $ | - | | $ | - | | $ | (121 | ) | $ | 1,070 | | $ | - | |
Trading non-derivative assets | | | | | | | | |
| | | ||||||||||||||||||||||
Trading mortgage-backed securities | | | | | | | | | | | | ||||||||||||||||||||||
U.S. government-sponsored agency guaranteed | $ | 818 | | $ | 26 | | $ | - | | $ | 188 | | $ | (340 | ) | $ | 172 | | $ | - | | $ | (267 | ) | $ | 14 | | $ | 611 | | $ | 7 | |
Residential | 2,130 | | 129 | | - | | 133 | | (66 | ) | 631 | | - | | (751 | ) | - | | 2,206 | | 14 | | |||||||||||
Commercial | 599 | | (2 | ) | - | | 68 | | (65 | ) | 92 | | - | | (324 | ) | - | | 368 | | (1 | ) | |||||||||||
Total trading mortgage-backed securities | $ | 3,547 | | $ | 153 | | $ | - | | $ | 389 | | $ | (471 | ) | $ | 895 | | $ | - | | $ | (1,342 | ) | $ | 14 | | $ | 3,185 | | $ | 20 | |
U.S. Treasury and federal agency securities | $ | - | | $ | - | | $ | - | | $ | - | | $ | - | | $ | - | | $ | - | | $ | - | | $ | - | | $ | - | | $ | - | |
State and municipal | 247 | | (2 | ) | - | | 13 | | - | | - | | - | | (9 | ) | - | | 249 | | 1 | | |||||||||||
Foreign government | 115 | | - | | - | | - | | (8 | ) | 39 | | - | | (59 | ) | (5 | ) | 82 | | (2 | ) | |||||||||||
Corporate | 767 | | 128 | | - | | 41 | | (26 | ) | 164 | | - | | (355 | ) | (11 | ) | 708 | | (45 | ) | |||||||||||
Equity securities | 2,598 | | (25 | ) | - | | 38 | | (173 | ) | 360 | | - | | (57 | ) | - | | 2,741 | | 66 | | |||||||||||
Asset-backed securities | 3,553 | | 106 | | - | | 505 | | (81 | ) | 1,696 | | - | | (1,543 | ) | - | | 4,236 | | 181 | | |||||||||||
Other trading assets | 4,393 | | 201 | | - | | 107 | | (1,536 | ) | 630 | | 19 | | (704 | ) | (12 | ) | 3,098 | | 29 | | |||||||||||
Total trading non-derivative assets | $ | 15,220 | | $ | 561 | | $ | - | | $ | 1,093 | | $ | (2,295 | ) | $ | 3,784 | | $ | 19 | | $ | (4,069 | ) | $ | (14 | ) | $ | 14,299 | | $ | 250 | |
Trading derivatives, net (4) | | | | | | | | | | | | | | | | | | | | | | | |||||||||||
Interest rate contracts | (334 | ) | (358 | ) | - | | (2 | ) | (46 | ) | 12 | | - | | 169 | | 136 | | (423 | ) | (152 | ) | |||||||||||
Foreign exchange contracts | 646 | | (123 | ) | - | | (42 | ) | (85 | ) | 83 | | - | | (83 | ) | (5 | ) | 391 | | (153 | ) | |||||||||||
Equity contracts | (774 | ) | 351 | | - | | - | | 15 | | 61 | | - | | (75 | ) | 67 | | (355 | ) | (70 | ) | |||||||||||
Commodity contracts | (1,729 | ) | (56 | ) | - | | 1 | | (6 | ) | - | | - | | - | | 63 | | (1,727 | ) | 89 | | |||||||||||
Credit derivatives | (663 | ) | (24 | ) | - | | (51 | ) | (45 | ) | - | | - | | (3 | ) | 212 | | (574 | ) | (228 | ) | |||||||||||
Total trading derivatives, net (4) | $ | (2,854 | ) | $ | (210 | ) | $ | - | | $ | (94 | ) | $ | (167 | ) | $ | 156 | | $ | - | | $ | 8 | | $ | 473 | | $ | (2,688 | ) | $ | (514 | ) |
199
|
| Net realized/unrealized | Transfers |
|
|
|
|
| Unrealized | ||||||||||||||||||||||||
In millions of dollars | Mar. 31, 2015 | Principal | Other (1)(2) | into | out of | Purchases | Issuances | Sales | Settlements | Jun. 30, 2015 | |||||||||||||||||||||||
Investments |
|
|
|
|
|
|
|
|
|
|
| ||||||||||||||||||||||
Mortgage-backed securities |
|
|
|
|
|
|
|
|
|
|
| ||||||||||||||||||||||
U.S. government-sponsored agency guaranteed | $ | 70 | | $ | - | | $ | 1 | | $ | 59 | | $ | (33 | ) | $ | - | | $ | - | | $ | (1 | ) | $ | - | | $ | 96 | | $ | 1 | |
Residential | 10 | | - | | (3 | ) | - | | - | | 11 | | - | | (8 | ) | - | | 10 | | - | | |||||||||||
Commercial | 2 | | - | | - | | - | | (2 | ) | - | | - | | - | | - | | - | | - | | |||||||||||
Total investment mortgage-backed securities | $ | 82 | | $ | - | | $ | (2 | ) | $ | 59 | | $ | (35 | ) | $ | 11 | | $ | - | | $ | (9 | ) | $ | - | | $ | 106 | | $ | 1 | |
U.S. Treasury and federal agency securities | $ | 5 | | $ | - | | $ | - | | $ | - | | $ | - | | $ | - | | $ | - | | $ | - | | $ | - | | $ | 5 | | $ | - | |
State and municipal | 2,247 | | - | | (39 | ) | 54 | | (99 | ) | 166 | | - | | (176 | ) | - | | 2,153 | | (43 | ) | |||||||||||
Foreign government | 575 | | - | | (3 | ) | (8 | ) | - | | 310 | | - | | (223 | ) | (158 | ) | 493 | | 4 | | |||||||||||
Corporate | 584 | | - | | 72 | | - | | (3 | ) | 55 | | - | | (9 | ) | (1 | ) | 698 | | - | | |||||||||||
Equity securities | 519 | | - | | 2 | | - | | (7 | ) | - | | - | | (31 | ) | - | | 483 | | (1 | ) | |||||||||||
Asset-backed securities | 517 | | - | | 20 | | - | | (48 | ) | 14 | | - | | - | | - | | 503 | | 22 | | |||||||||||
Other debt securities | - | | - | | - | | - | | - | | - | | - | | - | | - | | - | | - | | |||||||||||
Non-marketable equity securities | 1,289 | | - | | (53 | ) | 75 | | (6 | ) | 4 | | - | | (53 | ) | (18 | ) | 1,238 | | 11 | | |||||||||||
Total investments | $ | 5,818 | | $ | - | | $ | (3 | ) | $ | 180 | | $ | (198 | ) | $ | 560 | | $ | - | | $ | (501 | ) | $ | (177 | ) | $ | 5,679 | | $ | (6 | ) |
Loans | $ | 3,906 | | $ | - | | $ | (20 | ) | $ | - | | $ | (85 | ) | $ | 365 | | $ | 42 | | $ | (278 | ) | $ | (90 | ) | $ | 3,840 | | $ | 26 | |
Mortgage servicing rights | 1,685 | | - | | 270 | | - | | - | | - | | 68 | | (9 | ) | (90 | ) | 1,924 | | (77 | ) | |||||||||||
Other financial assets measured on a recurring basis | 148 | | - | | 10 | | 14 | | (5 | ) | - | | 38 | | (9 | ) | (57 | ) | 139 | | 348 | | |||||||||||
Liabilities |
|
|
|
|
|
|
|
|
|
|
| ||||||||||||||||||||||
Interest-bearing deposits | $ | 465 | | $ | - | | $ | 101 | | $ | - | | $ | - | | $ | - | | $ | - | | $ | - | | $ | (17 | ) | $ | 347 | | $ | (164 | ) |
Federal funds purchased and securities loaned or sold under agreements to repurchase | 1,060 | | 29 | | - | | - | | - | | - | | - | | (8 | ) | (58 | ) | 965 | | 25 | | |||||||||||
Trading account liabilities |
|
|
|
|
|
|
|
|
|
|
| ||||||||||||||||||||||
Securities sold, not yet purchased | 223 | | (12 | ) | - | | 105 | | (144 | ) | - | | - | | 87 | | (26 | ) | 257 | | (38 | ) | |||||||||||
Short-term borrowings | 120 | | 17 | | - | | 16 | | (3 | ) | - | | 33 | | - | | (16 | ) | 133 | | (1 | ) | |||||||||||
Long-term debt | 7,196 | | 82 | | - | | 374 | | (1,091 | ) | - | | 1,452 | | - | | (184 | ) | 7,665 | | 213 | | |||||||||||
Other financial liabilities measured on a recurring basis | 8 | | - | | (4 | ) | - | | (4 | ) | (1 | ) | 2 | | - | | (5 | ) | 4 | | (4 | ) | |||||||||||
200
|
| Net realized/unrealized | Transfers |
|
|
|
|
| Unrealized | ||||||||||||||||||||||||
In millions of dollars | Dec. 31, 2014 | Principal | Other (1)(2) | into | out of | Purchases | Issuances | Sales | Settlements | Jun. 30, 2015 | |||||||||||||||||||||||
Assets |
|
|
|
|
|
|
|
|
|
|
| ||||||||||||||||||||||
Federal funds sold and securities borrowed or purchased under agreements to resell | $ | 3,398 | | $ | (135 | ) | $ | - | | $ | - | | $ | (2,856 | ) | $ | 784 | | $ | - | | $ | - | | $ | (121 | ) | $ | 1,070 | | $ | - | |
Trading non-derivative assets |
|
|
|
|
|
|
|
|
|
|
| ||||||||||||||||||||||
Trading mortgage-backed securities |
|
|
|
|
|
|
|
|
|
|
| ||||||||||||||||||||||
U.S. government-sponsored agency guaranteed | 1,085 | | 29 | | - | | 482 | | (850 | ) | 339 | | - | | (488 | ) | 14 | | 611 | | 5 | | |||||||||||
Residential | 2,680 | | 206 | | - | | 178 | | (282 | ) | 1,129 | | - | | (1,705 | ) | - | | 2,206 | | (91 | ) | |||||||||||
Commercial | 440 | | 13 | | - | | 156 | | (78 | ) | 412 | | - | | (575 | ) | - | | 368 | | (8 | ) | |||||||||||
Total trading mortgage-backed securities | $ | 4,205 | | $ | 248 | | $ | - | | $ | 816 | | $ | (1,210 | ) | $ | 1,880 | | $ | - | | $ | (2,768 | ) | $ | 14 | | $ | 3,185 | | $ | (94 | ) |
U.S. Treasury and federal agency securities | $ | - | | $ | - | | $ | - | | $ | - | | $ | - | | $ | - | | $ | - | | $ | - | | $ | - | | $ | - | | $ | - | |
State and municipal | 241 | | (10 | ) | - | | 27 | | (7 | ) | 9 | | - | | (11 | ) | - | | 249 | | 2 | | |||||||||||
Foreign government | 206 | | (3 | ) | - | | 27 | | (100 | ) | 105 | | - | | (99 | ) | (54 | ) | 82 | | 4 | | |||||||||||
Corporate | 820 | | 204 | | - | | 54 | | (85 | ) | 511 | | - | | (785 | ) | (11 | ) | 708 | | 48 | | |||||||||||
Equity securities | 2,219 | | (46 | ) | - | | 162 | | (188 | ) | 742 | | - | | (148 | ) | - | | 2,741 | | 55 | | |||||||||||
Asset-backed securities | 3,294 | | 233 | | - | | 570 | | (115 | ) | 2,759 | | - | | (2,505 | ) | - | | 4,236 | | 179 | | |||||||||||
Other trading assets | 4,372 | | 60 | | - | | 317 | | (1,928 | ) | 1,632 | | 32 | | (1,367 | ) | (20 | ) | 3,098 | | 15 | | |||||||||||
Total trading non-derivative assets | $ | 15,357 | | $ | 686 | | $ | - | | $ | 1,973 | | $ | (3,633 | ) | $ | 7,638 | | $ | 32 | | $ | (7,683 | ) | $ | (71 | ) | $ | 14,299 | | $ | 209 | |
Trading derivatives, net (4) |
|
|
|
|
|
|
|
|
|
|
| ||||||||||||||||||||||
Interest rate contracts | $ | (211 | ) | $ | (428 | ) | $ | - | | $ | (136 | ) | $ | (39 | ) | $ | 18 | | $ | - | | $ | 166 | | $ | 207 | | $ | (423 | ) | $ | (58 | ) |
Foreign exchange contracts | 778 | | (424 | ) | - | | (1 | ) | (81 | ) | 174 | | - | | (178 | ) | 123 | | 391 | | (63 | ) | |||||||||||
Equity contracts | (863 | ) | 322 | | - | | (23 | ) | 116 | | 150 | | - | | (140 | ) | 83 | | (355 | ) | (166 | ) | |||||||||||
Commodity contracts | (1,622 | ) | (390 | ) | - | | 183 | | 10 | | - | | - | | - | | 92 | | (1,727 | ) | (158 | ) | |||||||||||
Credit derivatives | (743 | ) | (122 | ) | - | | 31 | | 8 | | - | | - | | (3 | ) | 255 | | (574 | ) | (191 | ) | |||||||||||
Total trading derivatives, net (4) | $ | (2,661 | ) | $ | (1,042 | ) | $ | - | | $ | 54 | | $ | 14 | | $ | 342 | | $ | - | | $ | (155 | ) | $ | 760 | | $ | (2,688 | ) | $ | (636 | ) |
201
|
| Net realized/unrealized | Transfers |
|
|
|
|
| Unrealized | ||||||||||||||||||||||||
In millions of dollars | Dec. 31, 2014 | Principal | Other (1)(2) | into | out of | Purchases | Issuances | Sales | Settlements | Jun. 30, 2015 | |||||||||||||||||||||||
Investments |
|
|
|
|
|
|
|
|
|
|
| ||||||||||||||||||||||
Mortgage-backed securities |
|
|
|
|
|
|
|
|
|
|
| ||||||||||||||||||||||
U.S. government-sponsored agency guaranteed | $ | 38 | | $ | - | | $ | - | | $ | 104 | | $ | (45 | ) | $ | - | | $ | - | | $ | (1 | ) | $ | - | | $ | 96 | | $ | (1 | ) |
Residential | 8 | | - | | (1 | ) | - | | - | | 11 | | - | | (8 | ) | - | | 10 | | 1 | | |||||||||||
Commercial | 1 | | - | | - | | 2 | | (3 | ) | - | | - | | - | | - | | - | | - | | |||||||||||
Total investment mortgage-backed securities | $ | 47 | | $ | - | | $ | (1 | ) | $ | 106 | | $ | (48 | ) | $ | 11 | | $ | - | | $ | (9 | ) | $ | - | | $ | 106 | | $ | - | |
U.S. Treasury and federal agency securities | $ | 6 | | $ | - | | $ | - | | $ | - | | $ | - | | $ | - | | $ | - | | $ | (1 | ) | $ | - | | $ | 5 | | $ | - | |
State and municipal | 2,180 | | - | | (7 | ) | 159 | | (238 | ) | 399 | | - | | (340 | ) | - | | 2,153 | | (31 | ) | |||||||||||
Foreign government | 678 | | - | | 48 | | (8 | ) | (105 | ) | 484 | | - | | (334 | ) | (270 | ) | 493 | | 5 | | |||||||||||
Corporate | 672 | | - | | 46 | | 2 | | (44 | ) | 69 | | - | | (13 | ) | (34 | ) | 698 | | - | | |||||||||||
Equity securities | 681 | | - | | (86 | ) | 7 | | (10 | ) | - | | - | | (109 | ) | - | | 483 | | - | | |||||||||||
Asset-backed securities | 549 | | - | | (20 | ) | - | | (58 | ) | 33 | | - | | (1 | ) | - | | 503 | | 22 | | |||||||||||
Other debt securities | - | | - | | - | | - | | - | | - | | - | | - | | - | | - | | - | | |||||||||||
Non-marketable equity securities | 1,460 | | - | | (10 | ) | 75 | | 6 | | 4 | | - | | (53 | ) | (244 | ) | 1,238 | | 74 | | |||||||||||
Total investments | $ | 6,273 | | $ | - | | $ | (30 | ) | $ | 341 | | $ | (497 | ) | $ | 1,000 | | $ | - | | $ | (860 | ) | $ | (548 | ) | $ | 5,679 | | $ | 70 | |
Loans | $ | 3,108 | | $ | - | | $ | (74 | ) | $ | 689 | | $ | (85 | ) | $ | 574 | | $ | 363 | | $ | (375 | ) | $ | (360 | ) | $ | 3,840 | | $ | 29 | |
Mortgage servicing rights | 1,845 | | - | | 193 | | - | | - | | - | | 111 | | (41 | ) | (184 | ) | 1,924 | | (390 | ) | |||||||||||
Other financial assets measured on a recurring basis | 78 | | - | | 16 | | 80 | | (7 | ) | 3 | | 98 | | (14 | ) | (115 | ) | 139 | | 596 | | |||||||||||
Liabilities |
|
|
|
|
|
|
|
|
|
|
| ||||||||||||||||||||||
Interest-bearing deposits | $ | 486 | | $ | - | | $ | 101 | | $ | - | | $ | - | | $ | - | | $ | - | | $ | - | | $ | (38 | ) | $ | 347 | | $ | (265 | ) |
Federal funds purchased and securities loaned or sold under agreements to repurchase | 1,043 | | (23 | ) | - | | - | | - | | - | | - | | (7 | ) | (94 | ) | 965 | | 15 | | |||||||||||
Trading account liabilities |
|
|
|
|
|
|
|
|
|
|
| ||||||||||||||||||||||
Securities sold, not yet purchased | 424 | | (22 | ) | - | | 197 | | (187 | ) | - | | - | | 157 | | (356 | ) | 257 | | (50 | ) | |||||||||||
Short-term borrowings | 344 | | 10 | | - | | 17 | | (15 | ) | - | | 49 | | - | | (252 | ) | 133 | | (3 | ) | |||||||||||
Long-term debt | 7,290 | | 368 | | - | | 1,086 | | (2,038 | ) | - | | 2,401 | | - | | (706 | ) | 7,665 | | (17 | ) | |||||||||||
Other financial liabilities measured on a recurring basis | 7 | | - | | (7 | ) | - | | (4 | ) | (2 | ) | 2 | | - | | (6 | ) | 4 | | (3 | ) | |||||||||||
(1) | Changes in fair value for available-for-sale investments are recorded in Accumulated other comprehensive income (loss) , unless related to other-than-temporary impairment, while gains and losses from sales are recorded in Realized gains (losses) from sales of investments on the Consolidated Statement of Income. |
(2) | Unrealized gains (losses) on MSRs are recorded in Other revenue on the Consolidated Statement of Income. |
(3) | Represents the amount of total gains or losses for the period, included in earnings (and Accumulated other comprehensive income (loss) for changes in fair value of available-for-sale investments), attributable to the change in fair value relating to assets and liabilities classified as Level 3 that are still held at June 30, 2015 . |
(4) | Total Level 3 derivative assets and liabilities have been netted in these tables for presentation purposes only. |
202
|
| Net realized/unrealized | Transfers |
|
|
|
|
| Unrealized | ||||||||||||||||||||||||
In millions of dollars | Mar. 31, 2014 | Principal | Other (1)(2) | into | out of | Purchases | Issuances | Sales | Settlements | Jun. 30, 2014 | |||||||||||||||||||||||
Assets |
|
|
|
|
|
|
|
|
|
|
| ||||||||||||||||||||||
Federal funds sold and securities borrowed or purchased under agreements to resell | $ | 3,451 | | $ | (78 | ) | $ | - | | $ | 16 | | $ | (8 | ) | $ | 75 | | $ | - | | $ | - | | $ | (93 | ) | $ | 3,363 | | $ | 129 | |
Trading non-derivative assets | | | | | | | | |
| | | ||||||||||||||||||||||
Trading mortgage-backed securities | | | | | | | | | | | | ||||||||||||||||||||||
U.S. government-sponsored agency guaranteed | $ | 788 | | $ | 17 | | $ | - | | $ | 198 | | $ | (213 | ) | $ | 107 | | $ | 4 | | $ | (196 | ) | $ | (8 | ) | $ | 697 | | $ | 8 | |
Residential | 2,744 | | 160 | | - | | 79 | | (129 | ) | 704 | | - | | (948 | ) | - | | 2,610 | | 98 | | |||||||||||
Commercial | 241 | | 6 | | - | | 41 | | (38 | ) | 204 | | - | | (45 | ) | - | | 409 | | 2 | | |||||||||||
Total trading mortgage-backed securities | $ | 3,773 | | $ | 183 | | $ | - | | $ | 318 | | $ | (380 | ) | $ | 1,015 | | $ | 4 | | $ | (1,189 | ) | $ | (8 | ) | $ | 3,716 | | $ | 108 | |
U.S. Treasury and federal agency securities | $ | - | | $ | 3 | | $ | - | | $ | - | | $ | - | | $ | - | | $ | - | | $ | (3 | ) | $ | - | | $ | - | | $ | - | |
State and municipal | 121 | | 2 | | - | | 134 | | - | | 9 | | - | | (24 | ) | - | | 242 | | (17 | ) | |||||||||||
Foreign government | 373 | | (10 | ) | - | | 37 | | (17 | ) | 221 | | - | | (139 | ) | - | | 465 | | (1 | ) | |||||||||||
Corporate | 1,665 | | (109 | ) | - | | 66 | | (195 | ) | 679 | | - | | (840 | ) | (4 | ) | 1,262 | | (28 | ) | |||||||||||
Equity securities | 1,385 | | (42 | ) | - | | 1 | | (55 | ) | 654 | | - | | (80 | ) | - | | 1,863 | | (160 | ) | |||||||||||
Asset-backed securities | 3,441 | | 339 | | - | | 50 | | (53 | ) | 759 | | - | | (1,160 | ) | - | | 3,376 | | 296 | | |||||||||||
Other trading assets | 3,452 | | 58 | | - | | 456 | | (715 | ) | 1,811 | | - | | (1,046 | ) | - | | 4,016 | | 21 | | |||||||||||
Total trading non-derivative assets | $ | 14,210 | | $ | 424 | | $ | - | | $ | 1,062 | | $ | (1,415 | ) | $ | 5,148 | | $ | 4 | | $ | (4,481 | ) | $ | (12 | ) | $ | 14,940 | | $ | 219 | |
Trading derivatives, net (4) | | | | | | | | | | | | | | | | | | | | | | | |||||||||||
Interest rate contracts | 233 | | (236 | ) | - | | 116 | | (133 | ) | 24 | | - | | (52 | ) | 65 | | 17 | | (293 | ) | |||||||||||
Foreign exchange contracts | 829 | | (41 | ) | - | | 32 | | 11 | | - | | - | | (1 | ) | 17 | | 847 | | 3 | | |||||||||||
Equity contracts | (1,236 | ) | 90 | | - | | (73 | ) | 278 | | 112 | | - | | (43 | ) | (21 | ) | (893 | ) | (415 | ) | |||||||||||
Commodity contracts | (1,329 | ) | 173 | | - | | (5 | ) | (39 | ) | - | | - | | - | | (29 | ) | (1,229 | ) | 128 | | |||||||||||
Credit derivatives | (257 | ) | (164 | ) | - | | (23 | ) | (15 | ) | 102 | | - | | - | | 158 | | (199 | ) | (20 | ) | |||||||||||
Total trading derivatives, net (4) | $ | (1,760 | ) | $ | (178 | ) | $ | - | | $ | 47 | | $ | 102 | | $ | 238 | | $ | - | | $ | (96 | ) | $ | 190 | | $ | (1,457 | ) | $ | (597 | ) |
203
|
| Net realized/unrealized | Transfers |
|
|
|
|
| Unrealized | ||||||||||||||||||||||||
In millions of dollars | Mar. 31, 2014 | Principal | Other (1)(2) | into | out of | Purchases | Issuances | Sales | Settlements | Jun. 30, 2014 | |||||||||||||||||||||||
Investments |
|
|
|
|
|
|
|
|
|
|
| ||||||||||||||||||||||
Mortgage-backed securities |
|
|
|
|
|
|
|
|
|
|
| ||||||||||||||||||||||
U.S. government-sponsored agency guaranteed | $ | 199 | | $ | - | | $ | (3 | ) | $ | 11 | | $ | (17 | ) | $ | - | | $ | - | | $ | (27 | ) | $ | - | | $ | 163 | | $ | (3 | ) |
Residential | 30 | | - | | 10 | | 17 | | (1 | ) | - | | - | | (39 | ) | - | | 17 | | - | | |||||||||||
Commercial | 1 | | - | | - | | 3 | | - | | 3 | | - | | - | | - | | 7 | | - | | |||||||||||
Total investment mortgage-backed securities | $ | 230 | | $ | - | | $ | 7 | | $ | 31 | | $ | (18 | ) | $ | 3 | | $ | - | | $ | (66 | ) | $ | - | | $ | 187 | | $ | (3 | ) |
U.S. Treasury and federal agency securities | $ | 7 | | $ | - | | $ | - | | $ | - | | $ | - | | $ | - | | $ | - | | $ | - | | $ | - | | $ | 7 | | $ | - | |
State and municipal | 1,903 | | - | | 29 | | 463 | | (180 | ) | 125 | | - | | (238 | ) | - | | 2,102 | | 37 | | |||||||||||
Foreign government | 274 | | - | | (7 | ) | 160 | | - | | 280 | | - | | (29 | ) | (63 | ) | 615 | | - | | |||||||||||
Corporate | 531 | | - | | 14 | | 16 | | - | | 19 | | - | | (48 | ) | (20 | ) | 512 | | (2 | ) | |||||||||||
Equity securities | 831 | | - | | (4 | ) | 6 | | (12 | ) | 5 | | - | | - | | - | | 826 | | (9 | ) | |||||||||||
Asset-backed securities | 1,877 | | - | | 3 | | - | | - | | 7 | | - | | - | | (148 | ) | 1,739 | | 10 | | |||||||||||
Other debt securities | 99 | | - | | - | | - | | - | | - | | - | | (1 | ) | (50 | ) | 48 | | - | | |||||||||||
Non-marketable equity securities | 2,615 | | - | | (20 | ) | - | | - | | 201 | | - | | (176 | ) | (125 | ) | 2,495 | | 107 | | |||||||||||
Total investments | $ | 8,367 | | $ | - | | $ | 22 | | $ | 676 | | $ | (210 | ) | $ | 640 | | $ | - | | $ | (558 | ) | $ | (406 | ) | $ | 8,531 | | $ | 140 | |
Loans | $ | 4,142 | | $ | - | | $ | (124 | ) | $ | 84 | | $ | 6 | | $ | 113 | | $ | 15 | | $ | (38 | ) | $ | (888 | ) | $ | 3,310 | | $ | 17 | |
Mortgage servicing rights | 2,586 | | - | | (101 | ) | - | | - | | - | | 62 | | (163 | ) | (102 | ) | 2,282 | | (101 | ) | |||||||||||
Other financial assets measured on a recurring basis | 179 | | - | | 27 | | - | | - | | 1 | | 51 | | (5 | ) | (52 | ) | 201 | | 23 | | |||||||||||
Liabilities | | | | | | | | | | | | ||||||||||||||||||||||
Interest-bearing deposits | $ | 935 | | $ | - | | $ | (20 | ) | $ | - | | $ | - | | $ | - | | $ | - | | $ | - | | $ | (46 | ) | $ | 909 | | $ | 12 | |
Federal funds purchased and securities loaned or sold under agreements to repurchase | 940 | | (2 | ) | - | | 54 | | - | | 47 | | - | | (11 | ) | - | | 1,032 | | (8 | ) | |||||||||||
Trading account liabilities | | | | | | | | | | | | ||||||||||||||||||||||
Securities sold, not yet purchased | 482 | | 5 | | - | | 31 | | (22 | ) | - | | - | | 144 | | (158 | ) | 472 | | (9 | ) | |||||||||||
Short-term borrowings | 27 | | (14 | ) | - | | 80 | | - | | 8 | | - | | - | | - | | 129 | | (1 | ) | |||||||||||
Long-term debt | 8,646 | | (97 | ) | 24 | | 654 | | (1,384 | ) | - | | 1,006 | | - | | (1,148 | ) | 7,847 | | (311 | ) | |||||||||||
Other financial liabilities measured on a recurring basis | 3 | | - | | (1 | ) | 4 | | - | | (1 | ) | - | | - | | (1 | ) | 6 | | - | | |||||||||||
204
|
| Net realized/unrealized | Transfers |
|
|
|
|
| Unrealized | ||||||||||||||||||||||||
In millions of dollars | Dec. 31, 2013 | Principal | Other (1)(2) | into | out of | Purchases | Issuances | Sales | Settlements | Jun. 30, 2014 | |||||||||||||||||||||||
Assets |
|
|
|
|
|
|
|
|
|
|
| ||||||||||||||||||||||
Federal funds sold and securities borrowed or purchased under agreements to resell | $ | 3,566 | | $ | (79 | ) | $ | - | | $ | 67 | | $ | (8 | ) | $ | 75 | | $ | - | | $ | - | | $ | (258 | ) | $ | 3,363 | | $ | 153 | |
Trading non-derivative assets |
|
|
|
|
|
|
|
|
|
|
| ||||||||||||||||||||||
Trading mortgage-backed securities |
|
|
|
|
|
|
|
|
|
|
| ||||||||||||||||||||||
U.S. government-sponsored agency guaranteed | 1,094 | | 98 | | - | | 377 | | (598 | ) | 261 | | 7 | | (517 | ) | (25 | ) | 697 | | 14 | | |||||||||||
Residential | 2,854 | | 317 | | - | | 153 | | (282 | ) | 1,680 | | - | | (2,112 | ) | - | | 2,610 | | 124 | | |||||||||||
Commercial | 256 | | 11 | | - | | 76 | | (62 | ) | 236 | | - | | (108 | ) | - | | 409 | | 5 | | |||||||||||
Total trading mortgage-backed securities | $ | 4,204 | | $ | 426 | | $ | - | | $ | 606 | | $ | (942 | ) | $ | 2,177 | | $ | 7 | | $ | (2,737 | ) | $ | (25 | ) | $ | 3,716 | | $ | 143 | |
U.S. Treasury and federal agency securities | $ | - | | $ | 3 | | $ | - | | $ | - | | $ | - | | $ | - | | $ | - | | $ | (3 | ) | $ | - | | $ | - | | $ | - | |
State and municipal | 222 | | 4 | | - | | 145 | | (104 | ) | 18 | | - | | (43 | ) | - | | 242 | | (20 | ) | |||||||||||
Foreign government | 416 | | (16 | ) | - | | 86 | | (102 | ) | 359 | | - | | (278 | ) | - | | 465 | | 39 | | |||||||||||
Corporate | 1,835 | | (82 | ) | - | | 253 | | (340 | ) | 1,271 | | - | | (1,668 | ) | (7 | ) | 1,262 | | (56 | ) | |||||||||||
Equity securities | 1,057 | | (213 | ) | - | | 36 | | (60 | ) | 1,186 | | - | | (143 | ) | - | | 1,863 | | (58 | ) | |||||||||||
Asset-backed securities | 4,342 | | 608 | | - | | 83 | | (228 | ) | 1,702 | | - | | (3,131 | ) | - | | 3,376 | | 448 | | |||||||||||
Other trading assets | 3,184 | | 81 | | - | | 1,031 | | (1,179 | ) | 2,875 | | - | | (1,910 | ) | (66 | ) | 4,016 | | 22 | | |||||||||||
Total trading non-derivative assets | $ | 15,260 | | $ | 811 | | $ | - | | $ | 2,240 | | $ | (2,955 | ) | $ | 9,588 | | $ | 7 | | $ | (9,913 | ) | $ | (98 | ) | $ | 14,940 | | $ | 518 | |
Trading derivatives, net (4) |
|
|
|
|
|
|
|
|
|
|
| ||||||||||||||||||||||
Interest rate contracts | $ | 839 | | $ | (584 | ) | $ | - | | $ | 152 | | $ | (124 | ) | $ | 42 | | $ | - | | $ | (98 | ) | $ | (210 | ) | $ | 17 | | $ | (225 | ) |
Foreign exchange contracts | 695 | | 97 | | - | | 21 | | 30 | | 1 | | - | | (1 | ) | 4 | | 847 | | 145 | | |||||||||||
Equity contracts | (858 | ) | 242 | | - | | (591 | ) | 330 | | 262 | | - | | (137 | ) | (141 | ) | (893 | ) | (431 | ) | |||||||||||
Commodity contracts | (1,393 | ) | 248 | | - | | 25 | | (8 | ) | - | | - | | - | | (101 | ) | (1,229 | ) | 197 | | |||||||||||
Credit derivatives | (274 | ) | (227 | ) | - | | (84 | ) | (45 | ) | 103 | | - | | (3 | ) | 331 | | (199 | ) | (325 | ) | |||||||||||
Total trading derivatives, net (4) | $ | (991 | ) | $ | (224 | ) | $ | - | | $ | (477 | ) | $ | 183 | | $ | 408 | | $ | - | | $ | (239 | ) | $ | (117 | ) | $ | (1,457 | ) | $ | (639 | ) |
Investments |
|
|
|
|
|
|
|
|
|
|
| ||||||||||||||||||||||
Mortgage-backed securities |
|
|
|
|
|
|
|
|
|
|
| ||||||||||||||||||||||
U.S. government-sponsored agency guaranteed | $ | 187 | | $ | - | | $ | 45 | | $ | 35 | | $ | (54 | ) | $ | 17 | | $ | - | | $ | (66 | ) | $ | (1 | ) | $ | 163 | | $ | (3 | ) |
Residential | 102 | | - | | 33 | | 30 | | (1 | ) | 17 | | - | | (164 | ) | - | | 17 | | - | | |||||||||||
Commercial | - | | - | | - | | 4 | | - | | 3 | | - | | - | | - | | 7 | | - | | |||||||||||
Total investment mortgage-backed securities | $ | 289 | | $ | - | | $ | 78 | | $ | 69 | | $ | (55 | ) | $ | 37 | | $ | - | | $ | (230 | ) | $ | (1 | ) | $ | 187 | | $ | (3 | ) |
U.S. Treasury and federal agency securities | $ | 8 | | $ | - | | $ | - | | $ | - | | $ | - | | $ | - | | $ | - | | $ | (1 | ) | $ | - | | $ | 7 | | $ | - | |
State and municipal | 1,643 | | - | | 65 | | 717 | | (465 | ) | 498 | | - | | (356 | ) | - | | 2,102 | | 72 | | |||||||||||
Foreign government | 344 | | - | | (5 | ) | 182 | | (42 | ) | 329 | | - | | (107 | ) | (86 | ) | 615 | | - | | |||||||||||
Corporate | 285 | | - | | 13 | | 18 | | (1 | ) | 266 | | - | | (49 | ) | (20 | ) | 512 | | (4 | ) | |||||||||||
Equity securities | 815 | | - | | 12 | | 12 | | (12 | ) | 6 | | - | | (7 | ) | - | | 826 | | 7 | | |||||||||||
Asset-backed securities | 1,960 | | - | | 11 | | - | | (42 | ) | 55 | | - | | (97 | ) | (148 | ) | 1,739 | | 5 | | |||||||||||
Other debt securities | 50 | | - | | (1 | ) | - | | - | | 50 | | - | | (1 | ) | (50 | ) | 48 | | - | | |||||||||||
Non-marketable equity securities | 2,508 | | - | | 128 | | 67 | | - | | 363 | | - | | (259 | ) | (312 | ) | 2,495 | | 15 | | |||||||||||
Total investments | $ | 7,902 | | $ | - | | $ | 301 | | $ | 1,065 | | $ | (617 | ) | $ | 1,604 | | $ | - | | $ | (1,107 | ) | $ | (617 | ) | $ | 8,531 | | $ | 92 | |
205
|
| Net realized/unrealized | Transfers |
|
|
|
|
| Unrealized | ||||||||||||||||||||||||
In millions of dollars | Dec. 31, 2013 | Principal | Other (1)(2) | into | out of | Purchases | Issuances | Sales | Settlements | Jun. 30, 2014 | |||||||||||||||||||||||
Loans | $ | 4,143 | | $ | - | | $ | (152 | ) | $ | 84 | | $ | 6 | | $ | 266 | | $ | 65 | | $ | (117 | ) | $ | (985 | ) | $ | 3,310 | | $ | 17 | |
Mortgage servicing rights | 2,718 | | - | | (215 | ) | - | | - | | - | | 112 | | (135 | ) | (198 | ) | 2,282 | | (216 | ) | |||||||||||
Other financial assets measured on a recurring basis | 181 | | - | | 25 | | - | | - | | 1 | | 87 | | (9 | ) | (84 | ) | 201 | | 17 | | |||||||||||
Liabilities |
|
|
|
|
|
|
|
|
|
|
| ||||||||||||||||||||||
Interest-bearing deposits | $ | 890 | | $ | - | | $ | (90 | ) | $ | - | | $ | - | | $ | - | | $ | - | | $ | - | | $ | (71 | ) | $ | 909 | | $ | 3 | |
Federal funds purchased and securities loaned or sold under agreements to repurchase | 902 | | (9 | ) | - | | 54 | | - | | 78 | | - | | (11 | ) | - | | 1,032 | | (21 | ) | |||||||||||
Trading account liabilities |
|
|
|
|
|
|
|
|
|
|
| ||||||||||||||||||||||
Securities sold, not yet purchased | 590 | | 15 | | - | | 49 | | (51 | ) | - | | - | | 294 | | (395 | ) | 472 | | (6 | ) | |||||||||||
Short-term borrowings | 29 | | (31 | ) | - | | 80 | | - | | 8 | | 1 | | - | | (20 | ) | 129 | | (6 | ) | |||||||||||
Long-term debt | 7,621 | | (381 | ) | 49 | | 1,613 | | (2,238 | ) | - | | 1,946 | | - | | (1,427 | ) | 7,847 | | (521 | ) | |||||||||||
Other financial liabilities measured on a recurring basis | 10 | | - | | (1 | ) | 4 | | - | | (1 | ) | 1 | | (3 | ) | (6 | ) | 6 | | - | | |||||||||||
(1) | Changes in fair value of available-for-sale investments are recorded in Accumulated other comprehensive income (loss) , unless related to other-than-temporary impairment, while gains and losses from sales are recorded in Realized gains (losses) from sales of investments on the Consolidated Statement of Income. |
(2) | Unrealized gains (losses) on MSRs are recorded in Other revenue on the Consolidated Statement of Income. |
(3) | Represents the amount of total gains or losses for the period, included in earnings (and Accumulated other comprehensive income (loss) for changes in fair value of available-for-sale investments), attributable to the change in fair value relating to assets and liabilities classified as Level 3 that are still held at June 30, 2014 . |
(4) | Total Level 3 derivative assets and liabilities have been netted in these tables for presentation purposes only. |
Level 3 Fair Value Rollforward
The following were the significant Level 3 transfers for the period March 31, 2015 to June 30, 2015:
• | Transfers of Federal Funds sold and securities borrowed or purchased under agreements to resell of $2.8 billion from Level 3 to Level 2 related to shortening of the remaining tenor of certain reverse repos. There is more transparency and observability for repo curves used in the valuation of structured reverse repos with tenors up to five years; thus, these positions are generally classified as Level 2. |
• | Transfers of Other trading assets of $1.5 billion related to trading loans for which there was increased transparency into market quotations. |
• | Transfers of Long-term debt of $1.1 billion from Level 3 to Level 2, mainly related to structured debt, reflecting certain unobservable inputs becoming less significant and certain underlying market inputs being more observable. |
The following were the significant Level 3 transfers for the period December 31, 2014 to June 30, 2015:
• | Transfers of Federal Funds sold and securities borrowed or purchased under agreements to resell of $2.9 billion from Level 3 to Level 2 related to shortening of the remaining tenor of certain reverse repos. There is more transparency and observability for repo curves used in the valuation of structured reverse repos with tenors up to five years; thus, these positions are generally classified as Level 2. |
• | Transfers of Other trading assets of $1.9 billion related to trading loans for which there was increased transparency into market quotations. |
• | Transfers of Long-term debt of $2.0 billion from Level 3 to Level 2, mainly related to structured debt, reflecting certain unobservable inputs becoming less significant and certain underlying market inputs being more observable. |
The following were the significant Level 3 transfers for the period March 31, 2014 to June 30, 2014:
• | Transfers of Long-term debt of $1.4 billion from Level 3 to Level 2, mainly related to structured debt, reflecting certain unobservable inputs becoming less significant and certain underlying market inputs being more observable. |
The following were the significant transfers for the period December 31, 2013 to June 30, 2014:
• | Transfers of Long-term debt of $1.6 billion from Level 2 to Level 3, and of $2.2 billion from Level 3 to Level 2, mainly related to structured debt, reflecting changes in the significance of unobservable inputs as well as certain underlying market inputs becoming less or more observable. |
• | Transfers of Other trading assets of $1.0 billion from Level 2 to Level 3, and of $1.2 billion from Level 3 to Level 2, related to trading loans, reflecting changes in the volume of market quotations. |
206
Valuation Techniques and Inputs for Level 3 Fair Value Measurements
The Company's Level 3 inventory consists of both cash securities and derivatives of varying complexities. The valuation methodologies applied to measure the fair value of these positions include discounted cash flow analyses, internal models and comparative analysis. A position is classified within Level 3 of the fair value hierarchy when at least one input is unobservable and is considered significant to its valuation. The specific reason an input is deemed unobservable varies. For example, at least one significant input to the pricing model is not observable in the market, at least one significant input has been adjusted to make it more representative of the position being valued, or the price quote available does not reflect sufficient trading activities.
The following tables present the valuation techniques covering the majority of Level 3 inventory and the most significant unobservable inputs used in Level 3 fair value measurements as of June 30, 2015 and December 31, 2014 . Differences between this table and amounts presented in the Level 3 Fair Value Rollforward table represent individually immaterial items that have been measured using a variety of valuation techniques other than those listed.
Valuation Techniques and Inputs for Level 3 Fair Value Measurements
As of June 30, 2015 | Fair Value (1) (in millions) | Methodology | Input | Low (2)(3) | High (2)(3) | Weighted Average (4) | ||||||||
Assets |
|
|
|
|
|
| ||||||||
Federal funds sold and securities borrowed or purchased under agreements to resell | $ | 1,070 | | Model-based | Credit - IR correlation | (24.00 | )% | (1.00 | )% | (9.71 | )% | |||
Mortgage-backed securities | $ | 2,203 | | Price-based | Price | $ | 6.38 | | $ | 107.82 | | $ | 85.39 | |
| 1,038 | | Yield analysis | Yield | 0.68 | % | 16.92 | % | 4.51 | % | ||||
State and municipal, foreign government, corporate and other debt securities | $ | 4,602 | | Price-based | Price | $ | - | | $ | 120.00 | | $ | 73.36 | |
| 1,681 | | Cash flow | Credit spread | 20 bps | | 1,056 bps | | 316 bps | | ||||
| | | | Yield | 0.47 | % | 28.50 | % | 4.88 | % | ||||
Equity securities (5) | $ | 2,695 | | Price-based | Price (5) | $ | - | | $ | 34.02 | | $ | 6.45 | |
| 477 | | Cash flow | Yield | 4.00 | % | 5.00 | % | 4.50 | % | ||||
|
|
| WAL | 0.01 years | | 3.72 years | | 1.07 years | | |||||
Asset-backed securities | $ | 4,453 | | Price-based | Price | $ | 5.00 | | $ | 100.04 | | $ | 76.00 | |
Non-marketable equity | $ | 836 | | Comparables analysis | Discount to price | - | % | 90.00 | % | 37.75 | % | |||
| 372 | | Price-based | EBITDA multiples | 4.70 | x | 12.50 | x | 10.17 | x | ||||
| | | | PE ratio | 9.10 | x | 9.10 | x | 9.10 | x | ||||
|
|
| Price-to-book ratio | 1.17 | x | 2.03 | x | 1.56 | x | |||||
|
|
| Price | $ | - | | $ | 3,687 | | $ | 759 | | ||
Derivatives-Gross (6) |
|
|
|
|
|
| ||||||||
Interest rate contracts (gross) | $ | 5,775 | | Model-based | Mean reversion | (7.02 | )% | 20.00 | % | 2.02 | % | |||
|
|
| IR Normal Volatility | 0.40 | % | 226.00 | % | 98.86 | % | |||||
|
|
| IR-IR Correlation | (79.00 | )% | 86.90 | % | (24.20 | )% | |||||
Foreign exchange contracts (gross) | $ | 1,416 | | Model-based | Foreign exchange (FX) volatility | 1.75 | % | 32.34 | % | 10.50 | % | |||
| 256 | | Cash flow | Forward price | 39.60 | % | 219.40 | % | 106.05 | % | ||||
|
|
| Interest rate | 6.50 | % | 6.50 | % | 6.50 | % | |||||
|
|
| IR-IR correlation | (51.00 | )% | 86.90 | % | 34.87 | % | |||||
|
|
| IR-FX correlation | (28.08 | )% | 60.00 | % | 48.50 | % | |||||
Equity contracts (gross) (7) | $ | 4,332 | | Model-based | Equity volatility | 13.58 | % | 67.70 | % | 31.69 | % | |||
|
|
| Forward price | 89.70 | % | 113.54 | % | 93.17 | % | |||||
207
As of June 30, 2015 | Fair Value (1) (in millions) | Methodology | Input | Low (2)(3) | High (2)(3) | Weighted Average (4) | ||||||||
|
|
| Equity-FX correlation | (88.20 | )% | 56.90 | % | (26.38 | )% | |||||
|
|
| Equity-equity correlation | (66.30 | )% | 95.00 | % | 39.96 | % | |||||
|
|
| Equity-IR correlation | (38.00 | )% | 71.00 | % | 32.73 | % | |||||
Commodity contracts (gross) | $ | 3,214 | | Model-based | Commodity volatility | 5.00 | % | 83.00 | % | 24.00 | % | |||
|
|
| Commodity correlation | (57.00 | )% | 91.00 | % | 30.00 | % | |||||
|
|
| Forward price | 53.58 | % | 263.20 | % | 105.14 | % | |||||
Credit derivatives (gross) | $ | 4,802 | | Model-based | Recovery rate | 20.00 | % | 75.00 | % | 39.88 | % | |||
| 1,346 | | Price-based | Credit correlation | 5.00 | % | 95.00 | % | 47.54 | % | ||||
|
|
| Price | $ | - | | $ | 111.19 | | $ | 58.76 | | ||
|
|
| Credit spread | 5 bps | | 1,300 bps | | 189 bps | | |||||
|
|
| Upfront points | (0.37 | )% | 99.16 | % | 61.01 | % | |||||
Nontrading derivatives and other financial assets and liabilities measured on a recurring basis (gross) (6) | $ | 76 | | Model-based | Redemption rate | 12.99 | % | 99.50 | % | 76.18 | % | |||
|
|
| Recovery rate | 19.50 | % | 40.00 | % | 36.63 | % | |||||
|
|
| Credit spread | 76 bps | | 452 bps | | 414 bps | | |||||
|
|
| Interest rate | 7.14 | % | 7.18 | % | 7.16 | % | |||||
Loans | $ | 1,856 | | Cash flow | Yield | 1.50 | % | 4.50 | % | 2.35 | % | |||
| 887 | | Model-based | Credit spread | 39 bps | | 905 bps | | 162 bps | | ||||
| 659 | | Price-based | Appraised value | $56,342,575 | $418,054,694 | $375,095,357 | |||||||
| 438 | | Yield analysis |
| | | | |||||||
Mortgage servicing rights | $ | 1,829 | | Cash flow | Yield | 5.45 | % | 50.19 | % | 11.22 | % | |||
|
|
| WAL | 3.43 years | | 8.06 years | | 5.74 years | | |||||
Liabilities |
|
|
|
|
|
| ||||||||
Interest-bearing deposits | $ | 347 | | Model-based | Equity-IR correlation | 30.00 | % | 33.00 | % | 32.50 | % | |||
Federal funds purchased and securities loaned or sold under agreements to repurchase | $ | 965 | | Model-based | Interest rate | 0.91 | % | 2.48 | % | 2.13 | % | |||
Trading account liabilities |
|
|
|
|
|
| ||||||||
Securities sold, not yet purchased | $ | 181 | | Price-based | Price | $ | 0.19 | | $ | 277.07 | | $ | 56.03 | |
| $ | 74 | | Model-based | Equity volatility | 15.00 | % | 67.70 | % | 32.60 | % | |||
|
|
| Equity forward | 89.70 | % | 106.90 | % | 92.10 | % | |||||
Short-term borrowings and long-term debt | $ | 7,777 | | Model-based | Equity-equity correlation | (66.30 | )% | 95.00 | % | 39.34 | % | |||
|
|
| Mean reversion | 1.00 | % | 20.00 | % | 10.50 | % | |||||
|
|
| Equity volatility | 15.00 | % | 67.70 | % | 32.60 | % | |||||
|
|
| Credit correlation | 87.50 | % | 87.50 | % | 87.50 | % | |||||
|
|
| FX volatility | 8.60 | % | 13.50 | % | 12.52 | % | |||||
|
|
| Equity-FX correlation | (88.20 | )% | 56.90 | % | (27.18 | )% | |||||
|
|
| Forward price | 53.58 | % | 263.20 | % | 103.51 | % | |||||
|
|
| Equity forward | 89.50 | % | 106.90 | % | 92.20 | % | |||||
|
|
|
|
|
|
| ||||||||
208
As of December 31, 2014 | Fair Value (1) (in millions) | Methodology | Input | Low (2)(3) | High (2)(3) | Weighted Average (4) | ||||||||
Assets |
|
|
|
|
|
| ||||||||
Federal funds sold and securities borrowed or purchased under agreements to resell | $ | 3,156 | | Model-based | Interest rate | 1.27 | % | 1.97 | % | 1.80 | % | |||
Mortgage-backed securities | $ | 2,874 | | Price-based | Price | $ | - | | $ | 127.87 | | $ | 81.43 | |
| 1,117 | | Yield analysis | Yield | 0.01 | % | 19.91 | % | 5.89 | % | ||||
State and municipal, foreign government, corporate and other debt securities | $ | 5,937 | | Price-based | Price | $ | - | | $ | 124.00 | | $ | 90.62 | |
| 1,860 | | Cash flow | Credit spread | 25 bps | | 600 bps | | 233 bps | | ||||
Equity securities (5) | $ | 2,163 | | Price-based | Price (5) | $ | - | | $ | 141.00 | | $ | 91.00 | |
| 679 | | Cash flow | Yield | 4.00 | % | 5.00 | % | 4.50 | % | ||||
|
|
| WAL | 0.01 years | | 3.14 years | | 1.07 years | | |||||
Asset-backed securities | $ | 3,607 | | Price-based | Price | $ | - | | $ | 105.50 | | $ | 67.01 | |
Non-marketable equity | $ | 1,224 | | Price-based | Discount to price | - | % | 90.00 | % | 4.04 | % | |||
| 1,055 | | Comparables analysis | EBITDA multiples | 2.90 | x | 13.10 | x | 9.77 | x | ||||
| | |
| PE ratio | 8.10 | x | 13.10 | x | 8.43 | x | ||||
| | |
| Price-to-book ratio | 0.99 | x | 1.56 | x | 1.15 | x | ||||
Derivatives-Gross (6) |
|
|
| | | | ||||||||
Interest rate contracts (gross) | $ | 8,309 | | Model-based | Interest rate (IR) lognormal volatility | 18.05 | % | 90.65 | % | 30.21 | % | |||
| | |
| Mean reversion | 1.00 | % | 20.00 | % | 10.50 | % | ||||
Foreign exchange contracts (gross) | $ | 1,428 | | Model-based | Foreign exchange (FX) volatility | 0.37 | % | 58.40 | % | 8.57 | % | |||
| 294 | | Cash flow | Interest rate | 3.72 | % | 8.27 | % | 5.02 | % | ||||
|
|
| IR-FX correlation | 40.00 | % | 60.00 | % | 50.00 | % | |||||
Equity contracts (gross) (7) | $ | 4,431 | | Model-based | Equity volatility | 9.56 | % | 82.44 | % | 24.61 | % | |||
| 502 | | Price-based | Equity forward | 84.10 | % | 100.80 | % | 94.10 | % | ||||
| | |
| Equity-FX correlation | (88.20 | )% | 48.70 | % | (25.17 | )% | ||||
| | |
| Equity-equity correlation | (66.30 | )% | 94.80 | % | 36.87 | % | ||||
|
|
| Price | $ | 0.01 | | $ | 144.50 | | $ | 93.05 | | ||
Commodity contracts (gross) | $ | 3,606 | | Model-based | Commodity volatility | 5.00 | % | 83.00 | % | 24.00 | % | |||
|
|
| Commodity correlation | (57.00 | )% | 91.00 | % | 30.00 | % | |||||
| | |
| Forward price | 35.34 | % | 268.77 | % | 101.74 | % | ||||
Credit derivatives (gross) | $ | 4,944 | | Model-based | Recovery rate | 13.97 | % | 75.00 | % | 37.62 | % | |||
| 1,584 | | Price-based | Credit correlation | - | % | 95.00 | % | 58.76 | % | ||||
| |
| Price | $ | 1.00 | | $ | 144.50 | | $ | 53.86 | | ||
| |
| Credit spread | 1 bps | | 3,380 bps | | 180 bps | | |||||
|
|
| Upfront points | 0.39 | | 100.00 | | 52.26 | | |||||
Nontrading derivatives and other financial assets and liabilities measured on a recurring basis (gross) (6) | $ | 74 | | Model-based | Redemption rate | 13.00 | % | 99.50 | % | 68.73 | % | |||
| |
| Forward Price | 107.00 | % | 107.10 | % | 107.05 | % | |||||
Loans | $ | 1,095 | | Cash flow | Yield | 1.60 | % | 4.50 | % | 2.23 | % | |||
| 832 | | Model-based | Price | $ | 4.72 | | $ | 106.55 | | $ | 98.56 | | |
| 740 | | Price-based | Credit spread | 35 bps | | 500 bps | | 199 bps | | ||||
| 441 | | Yield analysis |
| | | | | | | ||||
209
As of December 31, 2014 | Fair Value (1) (in millions) | Methodology | Input | Low (2)(3) | High (2)(3) | Weighted Average (4) | ||||||||
Mortgage servicing rights | $ | 1,750 | | Cash flow | Yield | 5.19 | % | 21.40 | % | 10.25 | % | |||
|
|
| WAL | 3.31 years | | 7.89 years | | 5.17 years | | |||||
Liabilities | | |
|
| | | | | | | ||||
Interest-bearing deposits | $ | 486 | | Model-based | Equity-IR correlation | 34.00 | % | 37.00 | % | 35.43 | % | |||
| |
| Commodity correlation | (57.00 | )% | 91.00 | % | 30.00 | % | |||||
| |
| Commodity volatility | 5.00 | % | 83.00 | % | 24.00 | % | |||||
|
|
| Forward price | 35.34 | % | 268.77 | % | 101.74 | % | |||||
Federal funds purchased and securities loaned or sold under agreements to repurchase | $ | 1,043 | | Model-based | Interest rate | 0.74 | % | 2.26 | % | 1.90 | % | |||
Trading account liabilities | | |
|
| | | | | | | ||||
Securities sold, not yet purchased | $ | 251 | | Model-based | Credit-IR correlation | (70.49 | )% | 8.81 | % | 47.17 | % | |||
| $ | 142 | | Price-based | Price | $ | - | | $ | 117.00 | | $ | 70.33 | |
Short-term borrowings and long-term debt | $ | 7,204 | | Model-based | IR lognormal volatility | 18.05 | % | 90.65 | % | 30.21 | % | |||
|
|
| Mean reversion | 1.00 | % | 20.00 | % | 10.50 | % | |||||
|
|
| Equity volatility | 10.18 | % | 69.65 | % | 23.72 | % | |||||
| |
| Credit correlation | 87.50 | % | 87.50 | % | 87.50 | % | |||||
|
|
| Equity forward | 89.50 | % | 100.80 | % | 95.80 | % | |||||
| |
| Forward price | 35.34 | % | 268.77 | % | 101.80 | % | |||||
| |
| Commodity correlation | (57.00 | )% | 91.00 | % | 30.00 | % | |||||
|
|
| Commodity volatility | 5.00 | % | 83.00 | % | 24.00 | % | |||||
(1) | The fair value amounts presented in this table represent the primary valuation technique or techniques for each class of assets or liabilities. |
(2) | Some inputs are shown as zero due to rounding. |
(3) | When the low and high inputs are the same, there is either a constant input applied to all positions, or the methodology involving the input applies to only one large position. |
(4) | Weighted averages are calculated based on the fair value of the instrument. |
(5) | For equity securities, the price and fund NAV inputs are expressed on an absolute basis, not as a percentage of the notional amount. |
(6) | Both trading and nontrading account derivatives-assets and liabilities-are presented on a gross absolute value basis. |
(7) | Includes hybrid products. |
210
Sensitivity to Unobservable Inputs and Interrelationships between Unobservable Inputs
The impact of key unobservable inputs on the Level 3 fair value measurements may not be independent of one another. In addition, the amount and direction of the impact on a fair value measurement for a given change in an unobservable input depends on the nature of the instrument as well as whether the Company holds the instrument as an asset or a liability. For certain instruments, the pricing, hedging and risk management are sensitive to the correlation between various inputs rather than on the analysis and aggregation of the individual inputs.
The following section describes the sensitivities and interrelationships of the most significant unobservable inputs used by the Company in Level 3 fair value measurements.
Correlation
Correlation is a measure of the co-movement between two or more variables. A variety of correlation-related assumptions are required for a wide range of instruments, including equity and credit baskets, foreign-exchange options, CDOs backed by loans or bonds, mortgages, subprime mortgages and many other instruments. For almost all of these instruments, correlations are not observable in the market and must be estimated using historical information. Estimating correlation can be especially difficult where it may vary over time. Extracting correlation information from market data requires significant assumptions regarding the informational efficiency of the market (for example, swaption markets). Changes in correlation levels can have a major impact, favorable or unfavorable, on the value of an instrument, depending on its nature. A change in the default correlation of the fair value of the underlying bonds comprising a CDO structure would affect the fair value of the senior tranche. For example, an increase in the default correlation of the underlying bonds would reduce the fair value of the senior tranche, because highly correlated instruments produce larger losses in the event of default and a part of these losses would become attributable to the senior tranche. That same change in default correlation would have a different impact on junior tranches of the same structure.
Volatility
Volatility represents the speed and severity of market price changes and is a key factor in pricing options. Typically, instruments can become more expensive if volatility increases. For example, as an index becomes more volatile, the cost to Citi of maintaining a given level of exposure increases because more frequent rebalancing of the portfolio is required. Volatility generally depends on the tenor of the underlying instrument and the strike price or level defined in the contract. Volatilities for certain combinations of tenor and strike are not observable. The general relationship between changes in the value of a portfolio to changes in volatility also depends on changes in interest rates and the level of the underlying index. Generally, long option positions (assets) benefit from increases in volatility, whereas short option positions (liabilities) will suffer losses. Some instruments are more sensitive to changes in volatility than others. For example, an
at-the-money option would experience a larger percentage change in its fair value than a deep-in-the-money option. In addition, the fair value of an option with more than one underlying security (for example, an option on a basket of bonds) depends on the volatility of the individual underlying securities as well as their correlations.
Yield
Adjusted yield is generally used to discount the projected future principal and interest cash flows on instruments, such as asset-backed securities. Adjusted yield is impacted by changes in the interest rate environment and relevant credit spreads.
In some circumstances, the yield of an instrument is not observable in the market and must be estimated from historical data or from yields of similar securities. This estimated yield may need to be adjusted to capture the characteristics of the security being valued. In other situations, the estimated yield may not represent sufficient market liquidity and must be adjusted as well. Whenever the amount of the adjustment is significant to the value of the security, the fair value measurement is classified as Level 3.
Prepayment
Voluntary unscheduled payments (prepayments) change the future cash flows for the investor and thereby change the fair value of the security. The effect of prepayments is more pronounced for residential mortgage-backed securities. An increase in prepayments-in speed or magnitude-generally creates losses for the holder of these securities. Prepayment is generally negatively correlated with delinquency and interest rate. A combination of low prepayment and high delinquencies amplify each input's negative impact on mortgage securities' valuation. As prepayment speeds change, the weighted average life of the security changes, which impacts the valuation either positively or negatively, depending upon the nature of the security and the direction of the change in the weighted average life.
Recovery
Recovery is the proportion of the total outstanding balance of a bond or loan that is expected to be collected in a liquidation scenario. For many credit securities (such as asset-backed securities), there is no directly observable market input for recovery, but indications of recovery levels are available from pricing services. The assumed recovery of a security may differ from its actual recovery that will be observable in the future. The recovery rate impacts the valuation of credit securities. Generally, an increase in the recovery rate assumption increases the fair value of the security. An increase in loss severity, the inverse of the recovery rate, reduces the amount of principal available for distribution and, as a result, decreases the fair value of the security.
Credit Spread
Credit spread is a component of the security representing its credit quality. Credit spread reflects the market perception of changes in prepayment, delinquency and recovery rates, therefore capturing the impact of other variables on the fair value. Changes in credit spread affect the fair value of
211
securities differently depending on the characteristics and maturity profile of the security. For example, credit spread is a more significant driver of the fair value measurement of a high yield bond as compared to an investment grade bond. Generally, the credit spread for an investment grade bond is also more observable and less volatile than its high yield counterpart.
Qualitative Discussion of the Ranges of Significant Unobservable Inputs
The following section describes the ranges of the most significant unobservable inputs used by the Company in Level 3 fair value measurements. The level of aggregation and the diversity of instruments held by the Company lead to a wide range of unobservable inputs that may not be evenly distributed across the Level 3 inventory.
Correlation
There are many different types of correlation inputs, including credit correlation, cross-asset correlation (such as equity-interest rate correlation), and same-asset correlation (such as interest rate-interest rate correlation). Correlation inputs are generally used to value hybrid and exotic instruments. Generally, same-asset correlation inputs have a narrower range than cross-asset correlation inputs. However, due to the complex and unique nature of these instruments, the ranges for correlation inputs can vary widely across portfolios.
Volatility
Similar to correlation, asset-specific volatility inputs vary widely by asset type. For example, ranges for foreign exchange volatility are generally lower and narrower than equity volatility. Equity volatilities are wider due to the nature of the equities market and the terms of certain exotic instruments. For most instruments, the interest rate volatility input is on the lower end of the range; however, for certain structured or exotic instruments (such as market-linked deposits or exotic interest rate derivatives), the range is much wider.
Yield
Ranges for the yield inputs vary significantly depending upon the type of security. For example, securities that typically have lower yields, such as municipal bonds, will fall on the lower end of the range, while more illiquid securities or securities with lower credit quality, such as certain residual tranche asset-backed securities, will have much higher yield inputs.
Credit Spread
Credit spread is relevant primarily for fixed income and credit instruments; however, the ranges for the credit spread input can vary across instruments. For example, certain fixed income instruments, such as certificates of deposit, typically have lower credit spreads, whereas certain derivative instruments with high-risk counterparties are typically subject to higher credit spreads when they are uncollateralized or have a longer tenor. Other instruments, such as credit default swaps, also have credit spreads that vary with the attributes of the
underlying obligor. Stronger companies have tighter credit spreads, and weaker companies have wider credit spreads.
Price
The price input is a significant unobservable input for certain fixed income instruments. For these instruments, the price input is expressed as a percentage of the notional amount, with a price of $100 meaning that the instrument is valued at par. For most of these instruments, the price varies between zero to $100, or slightly above $100. Relatively illiquid assets that have experienced significant losses since issuance, such as certain asset-backed securities, are at the lower end of the range, whereas most investment grade corporate bonds will fall in the middle to the higher end of the range. For certain structured debt instruments with embedded derivatives, the price input may be above $100 to reflect the embedded features of the instrument (for example, a step-up coupon or a conversion option).
The price input is also a significant unobservable input for certain equity securities; however, the range of price inputs varies depending on the nature of the position, the number of shares outstanding and other factors.
212
Items Measured at Fair Value on a Nonrecurring Basis
Certain assets and liabilities are measured at fair value on a nonrecurring basis and therefore are not included in the tables above. These include assets measured at cost that have been written down to fair value during the periods as a result of an impairment. In addition, these assets include loans held-for-sale and other real estate owned that are measured at the lower of cost or market.
The following table presents the carrying amounts of all assets that were still held as of June 30, 2015 and December 31, 2014 , for which a nonrecurring fair value measurement was recorded:
In millions of dollars | Fair value | Level 2 | Level 3 | ||||||
June 30, 2015 |
|
|
| ||||||
Loans held-for-sale | $ | 6,075 | | $ | 1,906 | | $ | 4,169 | |
Other real estate owned | 117 | | 22 | | 95 | | |||
Loans (1) | 1,053 | | 677 | | 376 | | |||
Total assets at fair value on a nonrecurring basis | $ | 7,245 | | $ | 2,605 | | $ | 4,640 | |
In millions of dollars | Fair value | Level 2 | Level 3 | ||||||
December 31, 2014 |
|
|
| ||||||
Loans held-for-sale | $ | 4,152 | | $ | 1,084 | | $ | 3,068 | |
Other real estate owned | 102 | | 21 | | 81 | | |||
Loans (1) | 3,367 | | 2,881 | | 486 | | |||
Total assets at fair value on a nonrecurring basis | $ | 7,621 | | $ | 3,986 | | $ | 3,635 | |
(1) | Represents impaired loans held for investment whose carrying amount is based on the fair value of the underlying collateral, including primarily real-estate secured loans. |
The fair value of loans-held-for-sale is determined where possible using quoted secondary-market prices. If no such quoted price exists, the fair value of a loan is determined using quoted prices for a similar asset or assets, adjusted for the specific attributes of that loan. Fair value for the other real estate owned is based on appraisals. For loans whose carrying amount is based on the fair value of the underlying collateral, the fair values depend on the type of collateral. Fair value of the collateral is typically estimated based on quoted market prices if available, appraisals or other internal valuation techniques.
Where the fair value of the related collateral is based on an unadjusted appraised value, the loan is generally classified as Level 2. Where significant adjustments are made to the appraised value, the loan is classified as Level 3. Additionally, for corporate loans, appraisals of the collateral are often based on sales of similar assets; however, because the prices of similar assets require significant adjustments to reflect the unique features of the underlying collateral, these fair value measurements are generally classified as Level 3.
Valuation Techniques and Inputs for Level 3 Nonrecurring Fair Value Measurements
The following tables present the valuation techniques covering the majority of Level 3 nonrecurring fair value measurements and the most significant unobservable inputs used in those measurements as of June 30, 2015 and December 31, 2014 :
As of June 30, 2015 | Fair Value (1) (in millions) | Methodology | Input | Low | High | Weighted average (2) | ||||||||
Loans held-for-sale | $ | 4,108 | | Price-based | Price | $ | 98.80 | | $ | 100.00 | | $ | 99.93 | |
Other real estate owned | $ | 71 | | Price-based | Discount to price (4) | 34.00 | % | 34.00 | % | 34.00 | % | |||
| 16 | | Comparables analysis | Appraised Value | $ | - | | $ | 18,888,568 | | $ | 10,082,929 | | |
Loans (3) | $ | 245 | | Price-based | Discount to price (4) | 13.00 | % | 34.00 | % | 15.62 | % | |||
| $ | 88 | | Cash Flow | Appraised Value | $ | 3,610,109 | | $ | 34,523,614 | | $ | 27,322,705 | |
| | | | Yield | 8.50 | % | 15.00 | % | 12.97 | % | ||||
(1) | The fair value amounts presented in this table represent the primary valuation technique or techniques for each class of assets or liabilities. |
(2) | Weighted averages are calculated based on the fair value of the instrument. |
(3) | Represents loans held for investment whose carrying amounts are based on the fair value of the underlying collateral. |
(4) | Includes estimated costs to sell. |
213
As of December 31, 2014 | Fair Value (1) (in millions) | Methodology | Input | Low | High | Weighted average (2) | ||||||||
Loans held-for-sale | $ | 2,740 | | Price-based | Price | $ | 92.00 | | $ | 100.00 | | $ | 99.54 | |
| | | | Credit Spread | 5 bps | | 358 bps | | 175 bps | | ||||
Other real estate owned | $ | 76 | | Price-based | Appraised Value | $11,000 | $11,124,137 | $4,730,129 | ||||||
| | | | Discount to price (4) | 13.00 | % | 64.00 | % | 28.80 | % | ||||
Loans (3) | $ | 437 | | Price-based | Discount to price (4) | 13.00 | % | 34.00 | % | 28.92 | % | |||
(1) | The fair value amounts presented in this table represent the primary valuation technique or techniques for each class of assets or liabilities. |
(2) | Weighted averages are based on the fair value of the instrument. |
(3) | Represents loans held for investment whose carrying amounts are based on the fair value of the underlying collateral. |
(4) | Includes estimated costs to sell. |
Nonrecurring Fair Value Changes
The following table presents total nonrecurring fair value measurements for the period, included in earnings, attributable to the change in fair value relating to assets that are still held at June 30, 2015 and June 30, 2014 :
| Three months ended June 30, | |||||
In millions of dollars | 2015 | 2014 | ||||
Loans held-for-sale | $ | (20 | ) | $ | (3 | ) |
Other real estate owned | (3 | ) | 1 | | ||
Loans (1) | (61 | ) | (147 | ) | ||
Total nonrecurring fair value gains (losses) | $ | (84 | ) | $ | (149 | ) |
(1) | Represents loans held for investment whose carrying amount is based on the fair value of the underlying collateral, including primarily real-estate loans. |
| Six months ended June 30, | |||||
In millions of dollars | 2015 | 2014 | ||||
Loans held-for-sale | $ | (20 | ) | $ | 71 | |
Other real estate owned | (4 | ) | (5 | ) | ||
Loans (1) | (107 | ) | (367 | ) | ||
Total nonrecurring fair value gains (losses) | $ | (131 | ) | $ | (301 | ) |
(1) | Represents loans held for investment whose carrying amount is based on the fair value of the underlying collateral, including primarily real-estate loans. |
214
Estimated Fair Value of Financial Instruments Not Carried at Fair Value
The table below presents the carrying value and fair value of Citigroup's financial instruments that are not carried at fair value. The table below therefore excludes items measured at fair value on a recurring basis presented in the tables above.
The disclosure also excludes leases, affiliate investments, pension and benefit obligations and insurance policy claim reserves. In addition, contract-holder fund amounts exclude certain insurance contracts. Also, as required, the disclosure excludes the effect of taxes, any premium or discount that could result from offering for sale at one time the entire holdings of a particular instrument, excess fair value associated with deposits with no fixed maturity, and other expenses that would be incurred in a market transaction. In addition, the table excludes the values of non-financial assets and liabilities, as well as a wide range of franchise, relationship and intangible values, which are integral to a full assessment of Citigroup's financial position and the value of its net assets.
The fair value represents management's best estimates based on a range of methodologies and assumptions. The
carrying value of short-term financial instruments not accounted for at fair value, as well as receivables and payables arising in the ordinary course of business, approximates fair value because of the relatively short period of time between their origination and expected realization. Quoted market prices are used when available for investments and for liabilities, such as long-term debt not carried at fair value. For loans not accounted for at fair value, cash flows are discounted at quoted secondary market rates or estimated market rates if available. Otherwise, sales of comparable loan portfolios or current market origination rates for loans with similar terms and risk characteristics are used. Expected credit losses are either embedded in the estimated future cash flows or incorporated as an adjustment to the discount rate used. The value of collateral is also considered. For liabilities such as long-term debt not accounted for at fair value and without quoted market prices, market borrowing rates of interest are used to discount contractual cash flows.
| June 30, 2015 | Estimated fair value | |||||||||||||
| Carrying value | Estimated fair value |
|
|
| ||||||||||
In billions of dollars | Level 1 | Level 2 | Level 3 | ||||||||||||
Assets |
|
|
|
|
| ||||||||||
Investments | $ | 35.7 | | $ | 36.8 | | $ | 3.7 | | $ | 30.5 | | $ | 2.6 | |
Federal funds sold and securities borrowed or purchased under agreements to resell | 105.0 | | 105.0 | | - | | 97.1 | | 7.9 | | |||||
Loans (1)(2) | 609.0 | | 607.4 | | - | | 6.9 | | 600.5 | | |||||
Other financial assets (2)(3) | 225.3 | | 225.3 | | 8.2 | | 145.9 | | 71.2 | | |||||
Liabilities |
|
|
|
|
| ||||||||||
Deposits | $ | 906.6 | | $ | 926.4 | | $ | - | | $ | 769.2 | | $ | 157.2 | |
Federal funds purchased and securities loaned or sold under agreements to repurchase | 138.3 | | 138.3 | | - | | 137.8 | | 0.5 | | |||||
Long-term debt (4) | 184.6 | | 190.4 | | - | | 169.5 | | 20.9 | | |||||
Other financial liabilities (5) | 110.5 | | 110.5 | | - | | 20.8 | | 89.7 | | |||||
| December 31, 2014 | Estimated fair value | |||||||||||||
| Carrying value | Estimated fair value |
|
|
| ||||||||||
In billions of dollars | Level 1 | Level 2 | Level 3 | ||||||||||||
Assets |
|
|
|
|
| ||||||||||
Investments | $ | 30.5 | | $ | 32.2 | | $ | 4.5 | | $ | 25.2 | | $ | 2.5 | |
Federal funds sold and securities borrowed or purchased under agreements to resell | 98.4 | | 98.4 | | - | | 89.7 | | 8.7 | | |||||
Loans (1)(2) | 620.0 | | 617.6 | | - | | 5.6 | | 612.0 | | |||||
Other financial assets (2)(3) | 213.8 | | 213.8 | | 8.3 | | 151.9 | | 53.6 | | |||||
Liabilities |
|
|
|
|
| ||||||||||
Deposits | $ | 897.6 | | $ | 894.4 | | $ | - | | $ | 766.7 | | $ | 127.7 | |
Federal funds purchased and securities loaned or sold under agreements to repurchase | 136.7 | | 136.7 | | - | | 136.5 | | 0.2 | | |||||
Long-term debt (4) | 196.9 | | 202.5 | | - | | 172.7 | | 29.8 | | |||||
Other financial liabilities (5) | 136.2 | | 136.2 | | - | | 41.4 | | 94.8 | | |||||
215
(1) | The carrying value of loans is net of the Allowance for loan losses of $14.1 billion for June 30, 2015 and $16.0 billion for December 31, 2014 . In addition, the carrying values exclude $2.5 billion and $2.7 billion of lease finance receivables at June 30, 2015 and December 31, 2014 , respectively. |
(2) | Includes items measured at fair value on a nonrecurring basis. |
(3) | Includes cash and due from banks, deposits with banks, brokerage receivables, reinsurance recoverable and other financial instruments included in Other assets on the Consolidated Balance Sheet, for all of which the carrying value is a reasonable estimate of fair value. |
(4) | The carrying value includes long-term debt balances under qualifying fair value hedges. |
(5) | Includes brokerage payables, separate and variable accounts, short-term borrowings (carried at cost) and other financial instruments included in Other liabilities on the Consolidated Balance Sheet, for all of which the carrying value is a reasonable estimate of fair value. |
Fair values vary from period to period based on changes in a wide range of factors, including interest rates, credit quality and market perceptions of value, and as existing assets and liabilities run off and new transactions are entered into. The estimated fair values of loans reflect changes in credit status since the loans were made, changes in interest rates in the case of fixed-rate loans, and premium values at origination of certain loans.
The estimated fair values of the Company's corporate unfunded lending commitments at June 30, 2015 and December 31, 2014 were liabilities of $4.6 billion and $5.5 billion , respectively, substantially all of which are classified as Level 3. The Company does not estimate the fair values of consumer unfunded lending commitments, which are generally cancelable by providing notice to the borrower.
216
23 . FAIR VALUE ELECTIONS
The Company may elect to report most financial instruments and certain other items at fair value on an instrument-by-instrument basis with changes in fair value reported in earnings. The election is made upon the initial recognition of an eligible financial asset, financial liability or firm commitment or when certain specified reconsideration events occur. The fair value election may not be revoked once an election is made. The changes in fair value are recorded in
current earnings. Additional discussion regarding the applicable areas in which fair value elections were made is presented in Note 22 to the Consolidated Financial Statements.
All servicing rights are recognized initially at fair value. The Company has elected fair value accounting for its mortgage servicing rights. See Note 20 to the Consolidated Financial Statements for further discussions regarding the accounting and reporting of MSRs.
| Changes in fair value gains (losses) for the | |||||||||||
| Three Months Ended June 30, | Six Months Ended June 30, | ||||||||||
In millions of dollars | 2015 | 2014 | 2015 | 2014 | ||||||||
Assets |
|
|
|
| ||||||||
Federal funds sold and securities borrowed or purchased under agreements to resell Selected portfolios of securities purchased under agreements to resell and securities borrowed | $ | (116 | ) | $ | (53 | ) | $ | (120 | ) | $ | 69 | |
Trading account assets | 136 | | (428 | ) | 227 | | (238 | ) | ||||
Investments | 4 | | 21 | | 49 | | 50 | | ||||
Loans |
|
| | | ||||||||
Certain corporate loans (1) | 40 | | (1 | ) | (9 | ) | 13 | | ||||
Certain consumer loans (1) | - | | (22 | ) | 2 | | (46 | ) | ||||
Total loans | $ | 40 | | $ | (23 | ) | $ | (7 | ) | $ | (33 | ) |
Other assets |
|
| | | ||||||||
MSRs | 262 | | (91 | ) | $ | 191 | | $ | (175 | ) | ||
Certain mortgage loans held for sale (2) | 70 | | 138 | | 172 | | 258 | | ||||
Total other assets | $ | 332 | | $ | 47 | | $ | 363 | | $ | 83 | |
Total assets | $ | 396 | | $ | (436 | ) | $ | 512 | | $ | (69 | ) |
Liabilities |
|
|
|
| ||||||||
Interest-bearing deposits | $ | 23 | | $ | (32 | ) | $ | 33 | | $ | (56 | ) |
Federal funds purchased and securities loaned or sold under agreements to repurchase Selected portfolios of securities sold under agreements to repurchase and securities loaned | - | | - | | 2 | | (6 | ) | ||||
Trading account liabilities | (44 | ) | (16 | ) | (15 | ) | (13 | ) | ||||
Short-term borrowings | (67 | ) | (93 | ) | (68 | ) | (74 | ) | ||||
Long-term debt | 500 | | (717 | ) | 455 | | (989 | ) | ||||
Total liabilities | $ | 412 | | $ | (858 | ) | $ | 407 | | $ | (1,138 | ) |
(1) | Includes mortgage loans held by mortgage loan securitization VIEs consolidated upon the adoption of ASC 810, Consolidation (SFAS 167), on January 1, 2010. |
(2) | Includes gains (losses) associated with interest rate lock-commitments for those loans that have been originated and elected under the fair value option. |
217
Own Debt Valuation Adjustments
Own debt valuation adjustments are recognized on Citi's liabilities for which the fair value option has been elected using Citi's credit spreads observed in the bond market. The fair value of liabilities for which the fair value option is elected (other than non-recourse and similar liabilities) is impacted by the narrowing or widening of the Company's credit spreads. The estimated change in the fair value of these liabilities due to such changes in the Company's own credit risk (or instrument-specific credit risk) was a gain of $ 231 million and a loss of $ 44 million for the three months ended June 30, 2015 and 2014 , respectively and a gain of $ 318 million and a loss of $ 10 million for the six months ended June 30, 2015 and 2014 , respectively. Changes in fair value resulting from changes in instrument-specific credit risk were estimated by incorporating the Company's current credit spreads observable in the bond market into the relevant valuation technique used to value each liability as described above.
The Fair Value Option for Financial Assets and Financial Liabilities
Selected portfolios of securities purchased under agreements to resell, securities borrowed, securities sold under agreements to repurchase, securities loaned and certain non-collateralized short-term borrowings
The Company elected the fair value option for certain portfolios of fixed-income securities purchased under agreements to resell and fixed-income securities sold under agreements to repurchase, securities borrowed, securities loaned, and certain non-collateralized short-term borrowings held primarily by broker-dealer entities in the United States, United Kingdom and Japan. In each case, the election was made because the related interest-rate risk is managed on a portfolio basis, primarily with derivative instruments that are accounted for at fair value through earnings.
Changes in fair value for transactions in these portfolios are recorded in Principal transactions . The related interest revenue and interest expense are measured based on the contractual rates specified in the transactions and are reported as interest revenue and expense in the Consolidated Statement of Income.
Certain loans and other credit products
Citigroup has elected the fair value option for certain originated and purchased loans, including certain unfunded loan products, such as guarantees and letters of credit, executed by Citigroup's lending and trading businesses. None of these credit products are highly leveraged financing commitments. Significant groups of transactions include loans and unfunded loan products that are expected to be either sold or securitized in the near term, or transactions where the economic risks are hedged with derivative instruments, such as purchased credit default swaps or total return swaps where the Company pays the total return on the underlying loans to a third party. Citigroup has elected the fair value option to mitigate accounting mismatches in cases where hedge accounting is complex and to achieve operational simplifications. Fair value was not elected for most lending transactions across the Company.
The following table provides information about certain credit products carried at fair value at June 30, 2015 and December 31, 2014 :
| June 30, 2015 | December 31, 2014 | ||||||||||
In millions of dollars | Trading assets | Loans | Trading assets | Loans | ||||||||
Carrying amount reported on the Consolidated Balance Sheet | $ | 10,793 | | $ | 6,538 | | $ | 10,290 | | $ | 5,901 | |
Aggregate unpaid principal balance in excess of (less than) fair value | 224 | | 50 | | 234 | | 125 | | ||||
Balance of non-accrual loans or loans more than 90 days past due | 7 | | 2 | | 13 | | 3 | | ||||
Aggregate unpaid principal balance in excess of fair value for non-accrual loans or loans more than 90 days past due | 11 | | 1 | | 28 | | 1 | | ||||
In addition to the amounts reported above, $ 1,935 million and $ 2,335 million of unfunded commitments related to certain credit products selected for fair value accounting were outstanding as of June 30, 2015 and December 31, 2014 , respectively.
Changes in fair value of funded and unfunded credit products are classified in Principal transactions in the Company's Consolidated Statement of Income. Related interest revenue is measured based on the contractual interest rates and reported as Interest revenue on Trading account assets or loan interest depending on the balance sheet classifications of the credit products. The changes in fair value for the six months ended June 30, 2015 and 2014 due to instrument-specific credit risk totaled to a loss of $ 27 million and $ 29 million , respectively.
218
Certain investments in unallocated precious metals
Citigroup invests in unallocated precious metals accounts (gold, silver, platinum and palladium) as part of its commodity and foreign currency trading activities or to economically hedge certain exposures from issuing structured liabilities. Under ASC 815, the investment is bifurcated into a debt host contract and a commodity forward derivative instrument. Citigroup elects the fair value option for the debt host contract, and reports the debt host contract within Trading account assets on the Company's Consolidated Balance Sheet. The total carrying amount of debt host contracts across unallocated precious metals accounts was approximately $ 2.4 billion and $ 1.2 billion at June 30, 2015 and December 31, 2014 , respectively. The amounts are expected to fluctuate based on trading activity in future periods.
As part of its commodity and foreign currency trading activities, Citi sells (buys) unallocated precious metals investments and executes forward purchase (sale) derivative contracts with trading counterparties. When Citi sells an unallocated precious metals investment, Citi's receivable from its depository bank is repaid and Citi derecognizes its investment in the unallocated precious metal. The forward purchase (sale) contract with the trading counterparty indexed to unallocated precious metals is accounted for as a derivative, at fair value through earnings. As of June 30, 2015 , there were approximately $ 11.2 billion and $ 8.8 billion notional amounts of such forward purchase and forward sale derivative contracts outstanding, respectively.
Certain investments in private equity and real estate ventures and certain equity method and other investments
Citigroup invests in private equity and real estate ventures for the purpose of earning investment returns and for capital appreciation. The Company has elected the fair value option for certain of these ventures, because such investments are considered similar to many private equity or hedge fund activities in Citi's investment companies, which are reported at fair value. The fair value option brings consistency in the accounting and evaluation of these investments. All investments (debt and equity) in such private equity and real estate entities are accounted for at fair value. These investments are classified as Investments on Citigroup's Consolidated Balance Sheet.
Changes in the fair values of these investments are classified in Other revenue in the Company's Consolidated Statement of Income.
Citigroup also elects the fair value option for certain non-marketable equity securities whose risk is managed with derivative instruments that are accounted for at fair value through earnings. These securities are classified as Trading account assets on Citigroup's Consolidated Balance Sheet. Changes in the fair value of these securities and the related derivative instruments are recorded in Principal transactions .
Certain mortgage loans HFS
Citigroup has elected the fair value option for certain purchased and originated prime fixed-rate and conforming adjustable-rate first mortgage loans HFS. These loans are intended for sale or securitization and are hedged with derivative instruments. The Company has elected the fair value option to mitigate accounting mismatches in cases where hedge accounting is complex and to achieve operational simplifications.
The following table provides information about certain mortgage loans HFS carried at fair value at June 30, 2015 and December 31, 2014 :
In millions of dollars | June 30, | December 31, 2014 | ||||
Carrying amount reported on the Consolidated Balance Sheet | $ | 1,273 | | $ | 1,447 | |
Aggregate fair value in excess of unpaid principal balance | 32 | | 67 | | ||
Balance of non-accrual loans or loans more than 90 days past due | - | | - | | ||
Aggregate unpaid principal balance in excess of fair value for non-accrual loans or loans more than 90 days past due | - | | - | | ||
The changes in fair values of these mortgage loans are reported in Other revenue in the Company's Consolidated Statement of Income. There was no net change in fair value during the six months ended June 30, 2015 and 2014 due
to instrument-specific credit risk. Related interest income continues to be measured based on the contractual interest rates and reported as Interest revenue in the Consolidated Statement of Income.
219
Certain structured liabilities
The Company has elected the fair value option for certain structured liabilities whose performance is linked to structured interest rates, inflation, currency, equity, referenced credit or commodity risks. The Company elected the fair value option, because these exposures are considered to be trading-related positions and, therefore, are managed on a fair value basis. These positions will continue to be classified as debt, deposits or derivatives ( Trading account liabilities ) on the Company's Consolidated Balance Sheet according to their legal form.
The following table provides information about the carrying value of structured notes, disaggregated by type of embedded derivative instrument at June 30, 2015 and December 31, 2014 :
In billions of dollars | June 30, 2015 | December 31, 2014 | ||||
Interest rate linked | $ | 10.3 | | $ | 10.9 | |
Foreign exchange linked | 0.4 | | 0.3 | | ||
Equity linked | 10.1 | | 8.0 | | ||
Commodity linked | 1.5 | | 1.4 | | ||
Credit linked | 2.2 | | 2.5 | | ||
Total | $ | 24.5 | | $ | 23.1 | |
The change in fair value of these structured liabilities is reported in Principal transactions in the Company's Consolidated Statement of Income. Changes in fair value of these structured liabilities include an economic component for accrued interest, which is included in the change in fair value reported in Principal transactions .
Certain non-structured liabilities
The Company has elected the fair value option for certain non-structured liabilities with fixed and floating interest rates. The Company has elected the fair value option where the interest-rate risk of such liabilities is economically hedged with derivative contracts or the proceeds are used to purchase financial assets that will also be accounted for at fair value through earnings. The election has been made to mitigate accounting mismatches and to achieve operational simplifications. These positions are reported in Short-term borrowings and Long-term debt on the Company's Consolidated Balance Sheet. The change in fair value of these non-structured liabilities is reported in Principal transactions in the Company's Consolidated Statement of Income. Related interest expense on non-structured liabilities is measured based on the contractual interest rates and reported as Interest expense in the Consolidated Statement of Income.
The following table provides information about long-term debt carried at fair value at June 30, 2015 and December 31, 2014 :
In millions of dollars | June 30, 2015 | December 31, 2014 | ||||
Carrying amount reported on the Consolidated Balance Sheet | $ | 27,214 | | $ | 26,180 | |
Aggregate unpaid principal balance in excess of (less than) fair value | 582 | | (151 | ) | ||
The following table provides information about short-term borrowings carried at fair value at June 30, 2015 and December 31, 2014 :
In millions of dollars | June 30, 2015 | December 31, 2014 | ||||
Carrying amount reported on the Consolidated Balance Sheet | $ | 870 | | $ | 1,496 | |
Aggregate unpaid principal balance in excess of (less than) fair value | 14 | | 31 | | ||
220
24 . GUARANTEES AND COMMITMENTS
Citi provides a variety of guarantees and indemnifications to its customers to enhance their credit standing and enable them to complete a wide variety of business transactions. For
certain contracts meeting the definition of a guarantee, the guarantor must recognize, at inception, a liability for the fair value of the obligation undertaken in issuing the guarantee.
In addition, the guarantor must disclose the maximum potential amount of future payments that the guarantor could be required to make under the guarantee, if there were a total
default by the guaranteed parties. The determination of the maximum potential future payments is based on the notional amount of the guarantees without consideration of possible recoveries under recourse provisions or from collateral held or pledged. As such, Citi believes such amounts bear no relationship to the anticipated losses, if any, on these guarantees.
The following tables present information about Citi's guarantees at June 30, 2015 and December 31, 2014 :
| Maximum potential amount of future payments |
| ||||||||||
In billions of dollars at June 30, 2015 except carrying value in millions | Expire within 1 year | Expire after 1 year | Total amount outstanding | Carrying value (in millions of dollars) | ||||||||
Financial standby letters of credit | $ | 25.5 | | $ | 69.9 | | $ | 95.4 | | $ | 219 | |
Performance guarantees | 7.3 | | 4.0 | | 11.3 | | 25 | | ||||
Derivative instruments considered to be guarantees | 9.0 | | 77.0 | | 86.0 | | 1,598 | | ||||
Loans sold with recourse | - | | 0.2 | | 0.2 | | 17 | | ||||
Securities lending indemnifications (1) | 126.5 | | - | | 126.5 | | - | | ||||
Credit card merchant processing (1) | 83.8 | | - | | 83.8 | | - | | ||||
Custody indemnifications and other | - | | 52.7 | | 52.7 | | 55 | | ||||
Total | $ | 252.1 | | $ | 203.8 | | $ | 455.9 | | $ | 1,914 | |
| Maximum potential amount of future payments |
| ||||||||||
In billions of dollars at December 31, 2014 except carrying value in millions | Expire within 1 year | Expire after 1 year | Total amount outstanding | Carrying value ( in millions of dollars) | ||||||||
Financial standby letters of credit | $ | 25.4 | | $ | 73.0 | | $ | 98.4 | | $ | 242 | |
Performance guarantees | 7.1 | | 4.8 | | 11.9 | | 29 | | ||||
Derivative instruments considered to be guarantees | 12.5 | | 79.2 | | 91.7 | | 2,806 | | ||||
Loans sold with recourse | - | | 0.2 | | 0.2 | | 15 | | ||||
Securities lending indemnifications (1) | 127.5 | | - | | 127.5 | | - | | ||||
Credit card merchant processing (1) | 86.0 | | - | | 86.0 | | - | | ||||
Custody indemnifications and other | - | | 48.9 | | 48.9 | | 54 | | ||||
Total | $ | 258.5 | | $ | 206.1 | | $ | 464.6 | | $ | 3,146 | |
(1) | The carrying values of securities lending indemnifications and credit card merchant processing were not material for either period presented, as the probability of potential liabilities arising from these guarantees is minimal. |
Financial standby letters of credit
Citi issues standby letters of credit, which substitute its own credit for that of the borrower. If a letter of credit is drawn down, the borrower is obligated to repay Citi. Standby letters of credit protect a third party from defaults on contractual obligations. Financial standby letters of credit include: (i) guarantees of payment of insurance premiums and reinsurance risks that support industrial revenue bond underwriting; (ii) settlement of payment obligations to clearing houses, including futures and over-the-counter derivatives clearing (see further discussion below); (iii) support options and purchases of securities in lieu of escrow deposit accounts; and (iv) letters of credit that backstop loans, credit facilities, promissory notes and trade acceptances.
Performance guarantees
Performance guarantees and letters of credit are issued to guarantee a customer's tender bid on a construction or systems-installation project or to guarantee completion of such projects in accordance with contract terms. They are also issued to support a customer's obligation to supply specified products, commodities, or maintenance or warranty services to a third party.
Derivative instruments considered to be guarantees
Derivatives are financial instruments whose cash flows are based on a notional amount and an underlying instrument, reference credit or index, where there is little or no initial investment, and whose terms require or permit net settlement. For a discussion of Citi's derivatives activities, see Note 21 to the Consolidated Financial Statements.
221
Derivative instruments considered to be guarantees include only those instruments that require Citi to make payments to the counterparty based on changes in an underlying instrument that is related to an asset, a liability or an equity security held by the guaranteed party. More specifically, derivative instruments considered to be guarantees include certain over-the-counter written put options where the counterparty is not a bank, hedge fund or broker-dealer (such counterparties are considered to be dealers in these markets and may, therefore, not hold the underlying instruments). Credit derivatives sold by Citi are excluded from the tables above, as they are disclosed separately in Note 21 to the Consolidated Financial Statements. In instances where Citi's maximum potential future payment is unlimited, the notional amount of the contract is disclosed.
Loans sold with recourse
Loans sold with recourse represent Citi's obligations to reimburse the buyers for loan losses under certain circumstances. Recourse refers to the clause in a sales agreement under which a seller/lender will fully reimburse the buyer/investor for any losses resulting from the purchased loans. This may be accomplished by the seller taking back any loans that become delinquent.
In addition to the amounts shown in the tables above, Citi has recorded a repurchase reserve for its potential repurchases or make-whole liability regarding residential mortgage representation and warranty claims related to its whole loan sales to the U.S. government-sponsored enterprises (GSEs) and, to a lesser extent, private investors. The repurchase reserve was approximately $175 million and $224 million at June 30, 2015 and December 31, 2014 , respectively, and these amounts are included in Other liabilities on the Consolidated Balance Sheet.
Securities lending indemnifications
Owners of securities frequently lend those securities for a fee to other parties who may sell them short or deliver them to another party to satisfy some other obligation. Banks may administer such securities lending programs for their clients. Securities lending indemnifications are issued by the bank to guarantee that a securities lending customer will be made whole in the event that the security borrower does not return the security subject to the lending agreement and collateral held is insufficient to cover the market value of the security.
Credit card merchant processing
Credit card merchant processing guarantees represent the Company's indirect obligations in connection with: (i) providing transaction processing services to various merchants with respect to its private-label cards; and (ii) potential liability for bank card transaction processing services. The nature of the liability in either case arises as a result of a billing dispute between a merchant and a cardholder that is ultimately resolved in the cardholder's favor. The merchant is liable to refund the amount to the cardholder. In general, if the credit card processing company
is unable to collect this amount from the merchant, the credit card processing company bears the loss for the amount of the credit or refund paid to the cardholder.
With regard to (i) above, Citi has the primary contingent liability with respect to its portfolio of private-label merchants. The risk of loss is mitigated as the cash flows between Citi and the merchant are settled on a net basis and Citi has the right to offset any payments with cash flows otherwise due to the merchant. To further mitigate this risk, Citi may delay settlement, require a merchant to make an escrow deposit, include event triggers to provide Citi with more financial and operational control in the event of the financial deterioration of the merchant or require various credit enhancements (including letters of credit and bank guarantees). In the unlikely event that a private-label merchant is unable to deliver products, services or a refund to its private-label cardholders, Citi is contingently liable to credit or refund cardholders.
With regard to (ii) above, Citi has a potential liability for bank card transactions where Citi provides the transaction processing services as well as those where a third party provides the services and Citi acts as a secondary guarantor, should that processor fail to perform.
Citi's maximum potential contingent liability related to both bank card and private-label merchant processing services is estimated to be the total volume of credit card transactions that meet the requirements to be valid charge-back transactions at any given time. At June 30, 2015 and December 31, 2014 , this maximum potential exposure was estimated to be $84 billion and $86 billion , respectively.
However, Citi believes that the maximum exposure is not representative of the actual potential loss exposure based on its historical experience. This contingent liability is unlikely to arise, as most products and services are delivered when purchased and amounts are refunded when items are returned to merchants. Citi assesses the probability and amount of its contingent liability related to merchant processing based on the financial strength of the primary guarantor, the extent and nature of unresolved charge-backs and its historical loss experience. At June 30, 2015 and December 31, 2014 , the losses incurred and the carrying amounts of Citi's contingent obligations related to merchant processing activities were immaterial.
Custody indemnifications
Custody indemnifications are issued to guarantee that custody clients will be made whole in the event that a third-party subcustodian or depository institution fails to safeguard clients' assets.
222
Other guarantees and indemnifications
Credit Card Protection Programs
Citi, through its credit card businesses, provides various cardholder protection programs on several of its card products, including programs that provide insurance coverage for rental cars, coverage for certain losses associated with purchased products, price protection for certain purchases and protection for lost luggage. These guarantees are not included in the table, since the total outstanding amount of the guarantees and Citi's maximum exposure to loss cannot be quantified. The protection is limited to certain types of purchases and losses, and it is not possible to quantify the purchases that would qualify for these benefits at any given time. Citi assesses the probability and amount of its potential liability related to these programs based on the extent and nature of its historical loss experience. At June 30, 2015 and December 31, 2014 , the actual and estimated losses incurred and the carrying value of Citi's obligations related to these programs were immaterial.
Other Representation and Warranty Indemnifications
In the normal course of business, Citi provides standard representations and warranties to counterparties in contracts in connection with numerous transactions and also provides indemnifications, including indemnifications that protect the counterparties to the contracts in the event that additional taxes are owed due either to a change in the tax law or an adverse interpretation of the tax law. Counterparties to these transactions provide Citi with comparable indemnifications. While such representations, warranties and indemnifications are essential components of many contractual relationships, they do not represent the underlying business purpose for the transactions. The indemnification clauses are often standard contractual terms related to Citi's own performance under the terms of a contract and are entered into in the normal course of business based on an assessment that the risk of loss is remote. Often these clauses are intended to ensure that terms of a contract are met at inception. No compensation is received for these standard representations and warranties, and it is not possible to determine their fair value because they rarely, if ever, result in a payment. In many cases, there are no stated or notional amounts included in the indemnification clauses, and the contingencies potentially triggering the obligation to indemnify have not occurred and are not expected to occur. As a result, these indemnifications are not included in the tables above.
Value-Transfer Networks
Citi is a member of, or shareholder in, hundreds of value-transfer networks (VTNs) (payment, clearing and settlement systems as well as exchanges) around the world. As a condition of membership, many of these VTNs require that members stand ready to pay a pro rata share of the losses incurred by the organization due to another member's default on its obligations. Citi's potential obligations may be limited to its membership interests in the VTNs, contributions to the VTN's funds, or, in limited cases, the obligation may be
unlimited. The maximum exposure cannot be estimated as this would require an assessment of future claims that have not yet occurred. Citi believes the risk of loss is remote given historical experience with the VTNs. Accordingly, Citi's participation in VTNs is not reported in the guarantees tables above, and there are no amounts reflected on the Consolidated Balance Sheet as of June 30, 2015 or December 31, 2014 for potential obligations that could arise from Citi's involvement with VTN associations.
Long-Term Care Insurance Indemnification
In the sale of an insurance subsidiary, the Company provided an indemnification to an insurance company for policyholder claims and other liabilities relating to a book of long-term care (LTC) business (for the entire term of the LTC policies) that is fully reinsured by another insurance company. The reinsurer has funded two trusts with securities whose fair value (approximately $6.2 billion at both June 30, 2015 and December 31, 2014 ) is designed to cover the insurance company's statutory liabilities for the LTC policies. The assets in these trusts are evaluated and adjusted periodically to ensure that the fair value of the assets continues to cover the estimated statutory liabilities related to the LTC policies, as those statutory liabilities change over time.
If the reinsurer fails to perform under the reinsurance agreement for any reason, including insolvency, and the assets in the two trusts are insufficient or unavailable to the ceding insurance company, then Citi must indemnify the ceding insurance company for any losses actually incurred in connection with the LTC policies. Since both events would have to occur before Citi would become responsible for any payment to the ceding insurance company pursuant to its indemnification obligation, and the likelihood of such events occurring is currently not probable, there is no liability reflected in the Consolidated Balance Sheet as of June 30, 2015 and December 31, 2014 related to this indemnification. Citi continues to closely monitor its potential exposure under this indemnification obligation.
Futures and over-the-counter derivatives clearing
Citi provides clearing services for clients executing exchange-traded futures and over-the-counter (OTC) derivatives contracts with central counterparties (CCPs). Based on all relevant facts and circumstances, Citi has concluded that it acts as an agent for accounting purposes in its role as clearing member for these client transactions. As such, Citi does not reflect the underlying exchange-traded futures or OTC derivatives contracts in its Consolidated Financial Statements. See Note 21 for a discussion of Citi's derivatives activities that are reflected in its Consolidated Financial Statements.
As a clearing member, Citi collects and remits cash and securities collateral (margin) between its clients and the respective CCP. There are two types of margin: initial margin and variation margin. Where Citi obtains benefits from or controls cash initial margin (e.g., retains an interest spread), cash initial margin collected from clients and remitted to the CCP is reflected within Brokerage Payables (payables to customers) and Brokerage Receivables
223
(receivables from brokers, dealers and clearing organizations), respectively. However, for OTC derivatives contracts where Citi has contractually agreed with the client that (a) Citi will pass through to the client all interest paid by the CCP on cash initial margin; (b) Citi will not utilize its right as clearing member to transform cash margin into other assets; and (c) Citi does not guarantee and is not liable to the client for the performance of the CCP, cash initial margin collected from clients and remitted to the CCP is not reflected on Citi's Consolidated Balance Sheet. The total amount of cash initial margin collected and remitted in this manner was approximately $4.1 billion and $3.2 billion as of June 30, 2015 and December 31, 2014 , respectively.
Variation margin due from clients to the respective CCP, or from the CCP to clients, reflects changes in the value of the client's derivative contracts for each trading day. As a clearing member, Citi is exposed to the risk of non-performance by clients (e.g., failure of a client to post variation margin to the CCP for negative changes in the value of the client's derivative contracts). In the event of non-performance by a client, Citi would move to close out the client's positions. The CCP would typically utilize initial margin posted by the client and held by the CCP, with any remaining shortfalls required to be paid by Citi as clearing member. Citi generally holds incremental cash or securities margin posted by the client, which would typically be expected to be sufficient to mitigate Citi's credit risk in the event the client fails to perform.
As required by ASC 860-30-25-5, securities collateral posted by clients is not recognized on Citi's Consolidated Balance Sheet.
Carrying Value-Guarantees and Indemnifications
At June 30, 2015 and December 31, 2014 , the total carrying amounts of the liabilities related to the guarantees and indemnifications included in the tables above amounted to approximately $1.9 billion and $3.1 billion , respectively. The carrying value of financial and performance guarantees is included in Other liabilities . For loans sold with recourse, the carrying value of the liability is included in Other liabilities .
Collateral
Cash collateral available to Citi to reimburse losses realized under these guarantees and indemnifications amounted to $55 billion and $63 billion at June 30, 2015 and December 31, 2014 , respectively. Securities and other marketable assets held as collateral amounted to $77 billion and $70 billion at June 30, 2015 and December 31, 2014 , respectively. The majority of collateral is held to reimburse losses realized under securities lending indemnifications. Additionally, letters of credit in favor of Citi held as collateral amounted to $4.2 billion and $4.0 billion at June 30, 2015 and December 31, 2014 , respectively. Other property may also be available to Citi to cover losses under certain guarantees and indemnifications; however, the value of such property has not been determined.
Performance risk
Citi evaluates the performance risk of its guarantees based on the assigned referenced counterparty internal or external ratings. Where external ratings are used, investment-grade ratings are considered to be Baa/BBB and above, while anything below is considered non-investment grade. Citi's internal ratings are in line with the related external rating system. On certain underlying referenced assets or entities, ratings are not available. Such referenced assets are included in the "not rated" category. The maximum potential amount of the future payments related to the outstanding guarantees is determined to be the notional amount of these contracts, which is the par amount of the assets guaranteed.
Presented in the tables below are the maximum potential amounts of future payments that are classified based upon internal and external credit ratings as of June 30, 2015 and December 31, 2014 . As previously mentioned, the determination of the maximum potential future payments is based on the notional amount of the guarantees without consideration of possible recoveries under recourse provisions or from collateral held or pledged. As such, Citi believes such amounts bear no relationship to the anticipated losses, if any, on these guarantees.
| Maximum potential amount of future payments | |||||||||||
In billions of dollars at June 30, 2015 | Investment grade | Non-investment grade | Not rated | Total | ||||||||
Financial standby letters of credit | $ | 70.5 | | $ | 14.4 | | $ | 10.5 | | $ | 95.4 | |
Performance guarantees | 6.8 | | 3.8 | | 0.7 | | 11.3 | | ||||
Derivative instruments deemed to be guarantees | - | | - | | 86.0 | | 86.0 | | ||||
Loans sold with recourse | - | | - | | 0.2 | | 0.2 | | ||||
Securities lending indemnifications | - | | - | | 126.5 | | 126.5 | | ||||
Credit card merchant processing | - | | - | | 83.8 | | 83.8 | | ||||
Custody indemnifications and other | 52.6 | | 0.1 | | - | | 52.7 | | ||||
Total | $ | 129.9 | | $ | 18.3 | | $ | 307.7 | | $ | 455.9 | |
224
| Maximum potential amount of future payments | |||||||||||
In billions of dollars at December 31, 2014 | Investment grade | Non-investment grade | Not rated | Total | ||||||||
Financial standby letters of credit | $ | 73.0 | | $ | 15.9 | | $ | 9.5 | | $ | 98.4 | |
Performance guarantees | 7.3 | | 3.9 | | 0.7 | | 11.9 | | ||||
Derivative instruments deemed to be guarantees | - | | - | | 91.7 | | 91.7 | | ||||
Loans sold with recourse | - | | - | | 0.2 | | 0.2 | | ||||
Securities lending indemnifications | - | | - | | 127.5 | | 127.5 | | ||||
Credit card merchant processing | - | | - | | 86.0 | | 86.0 | | ||||
Custody indemnifications and other | 48.8 | | 0.1 | | - | | 48.9 | | ||||
Total | $ | 129.1 | | $ | 19.9 | | $ | 315.6 | | $ | 464.6 | |
225
Credit Commitments and Lines of Credit
The table below summarizes Citigroup's credit commitments as of June 30, 2015 and December 31, 2014:
In millions of dollars | U.S. | Outside of U.S. | June 30, | December 31, 2014 | ||||||||
Commercial and similar letters of credit | $ | 1,358 | | $ | 5,001 | | $ | 6,359 | | $ | 6,634 | |
One- to four-family residential mortgages | 1,669 | | 2,199 | | 3,868 | | 5,674 | | ||||
Revolving open-end loans secured by one- to four-family residential properties | 13,303 | | 2,361 | | 15,664 | | 16,098 | | ||||
Commercial real estate, construction and land development | 6,938 | | 1,477 | | 8,415 | | 9,242 | | ||||
Credit card lines | 486,115 | | 117,191 | | 603,306 | | 612,049 | | ||||
Commercial and other consumer loan commitments | 163,579 | | 85,954 | | 249,533 | | 243,680 | | ||||
Other commitments and contingencies | 4,630 | | 6,380 | | 11,010 | | 10,663 | | ||||
Total | $ | 677,592 | | $ | 220,563 | | $ | 898,155 | | $ | 904,040 | |
The majority of unused commitments are contingent upon customers' maintaining specific credit standards.
Commercial commitments generally have floating interest rates and fixed expiration dates and may require payment of fees. Such fees (net of certain direct costs) are deferred and, upon exercise of the commitment, amortized over the life of the loan or, if exercise is deemed remote, amortized over the commitment period.
Commercial and similar letters of credit
A commercial letter of credit is an instrument by which Citigroup substitutes its credit for that of a customer to enable the customer to finance the purchase of goods or to incur other commitments. Citigroup issues a letter on behalf of its client to a supplier and agrees to pay the supplier upon presentation of documentary evidence that the supplier has performed in accordance with the terms of the letter of credit. When a letter of credit is drawn, the customer is then required to reimburse Citigroup.
One- to four-family residential mortgages
A one- to four-family residential mortgage commitment is a written confirmation from Citigroup to a seller of a property that the bank will advance the specified sums enabling the buyer to complete the purchase.
Revolving open-end loans secured by one- to four-family
residential properties
Revolving open-end loans secured by one- to four-family residential properties are essentially home equity lines of credit. A home equity line of credit is a loan secured by a primary residence or second home to the extent of the excess of fair market value over the debt outstanding for the first mortgage.
Commercial real estate, construction and land development
Commercial real estate, construction and land development include unused portions of commitments to extend credit for the purpose of financing commercial and multifamily residential properties as well as land development projects.
Both secured-by-real-estate and unsecured commitments are included in this line, as well as
undistributed loan proceeds, where there is an obligation to advance for construction progress payments. However, this line only includes those extensions of credit that, once funded, will be classified as Total loans, net on the Consolidated Balance Sheet.
Credit card lines
Citigroup provides credit to customers by issuing credit cards. The credit card lines are cancellable by providing notice to the cardholder or without such notice as permitted by local law.
Commercial and other consumer loan commitments
Commercial and other consumer loan commitments include overdraft and liquidity facilities, as well as commercial commitments to make or purchase loans, to purchase third-party receivables, to provide note issuance or revolving underwriting facilities and to invest in the form of equity. Amounts include $52 billion and $53 billion with an original maturity of less than one year at June 30, 2015 and December 31, 2014, respectively.
In addition, included in this line item are highly leveraged financing commitments, which are agreements that provide funding to a borrower with higher levels of debt (measured by the ratio of debt capital to equity capital of the borrower) than is generally considered normal for other companies. This type of financing is commonly employed in corporate acquisitions, management buy-outs and similar transactions.
Other commitments and contingencies
Other commitments and contingencies include committed or unsettled regular-way reverse repurchase agreements and all other transactions related to commitments and contingencies not reported on the lines above.
226
25 . CONTINGENCIES
The following information supplements and amends, as applicable, the disclosures in Note 28 to the Consolidated Financial Statements of Citigroup's 2014 Annual Report on Form 10-K and Note 25 to the Consolidated Financial Statements of Citigroup's First Quarter of 2015 Form 10-Q. For purposes of this Note, Citigroup, its affiliates and subsidiaries, and current and former officers, directors and employees, are sometimes collectively referred to as Citigroup and Related Parties.
In accordance with ASC 450, Citigroup establishes accruals for contingencies, including the litigation and regulatory matters disclosed herein, when Citigroup believes it is probable that a loss has been incurred and the amount of the loss can be reasonably estimated. Once established, accruals are adjusted from time to time, as appropriate, in light of additional information. The amount of loss ultimately incurred in relation to those matters may be substantially higher or lower than the amounts accrued for those matters.
If Citigroup has not accrued for a matter because the matter does not meet the criteria for accrual (as set forth above), or Citigroup believes an exposure to loss exists in excess of the amount accrued for a particular matter, in each case assuming a material loss is reasonably possible, Citigroup discloses the matter. In addition, for such matters, Citigroup discloses an estimate of the aggregate reasonably possible loss or range of loss in excess of the amounts accrued for those matters as to which an estimate can be made. At June 30, 2015, Citigroup's estimate was materially unchanged from its estimate of approximately $4 billion at December 31, 2014, as more fully described in Note 28 to the Consolidated Financial Statements in the 2014 Annual Report on Form 10-K.
As available information changes, the matters for which Citigroup is able to estimate will change, and the estimates themselves will change. In addition, while many estimates presented in financial statements and other financial disclosure involve significant judgment and may be subject to significant uncertainty, estimates of the range of reasonably possible loss arising from litigation and regulatory proceedings are subject to particular uncertainties. For example, at the time of making an estimate, Citigroup may have only preliminary, incomplete or inaccurate information about the facts underlying the claim; its assumptions about the future rulings of the court or other tribunal on significant issues, or the behavior and incentives of adverse parties or regulators, may prove to be wrong; and the outcomes it is attempting to predict are often not amenable to the use of statistical or other quantitative analytical tools. In addition, from time to time an outcome may occur that Citigroup had not accounted for in its estimates because it had deemed such an outcome to be remote. For all these reasons, the amount of loss in excess of accruals ultimately incurred for the matters as to which an estimate has been made could be substantially higher or lower than the range of loss included in the estimate.
Subject to the foregoing, it is the opinion of Citigroup's management, based on current knowledge and after taking into account its current legal accruals, that the eventual outcome of all matters described in this Note would not be likely to have a
material adverse effect on the consolidated financial condition of Citigroup. Nonetheless, given the substantial or indeterminate amounts sought in certain of these matters, and the inherent unpredictability of such matters, an adverse outcome in certain of these matters could, from time to time, have a material adverse effect on Citigroup's consolidated results of operations or cash flows in particular quarterly or annual periods.
For further information on ASC 450 and Citigroup's accounting and disclosure framework for contingencies, including for litigation and regulatory matters disclosed herein, see Note 28 to the Consolidated Financial Statements of Citigroup's 2014 Annual Report on Form 10-K.
Commodities Financing Contracts
The High Court in London issued a judgment on May 22, 2015 holding that Citigroup had properly served bring forward event notices, but that because the metal has not been properly delivered, the counterparty did not yet have to pay Citigroup.
Credit Crisis-Related Litigation and Other Matters
Mortgage-Related Litigation and Other Matters
Mortgage-Backed Securities and CDO Investor Actions: On June 17, 2015, the court dismissed with prejudice certain fraud claims in COMMERZBANK AG LONDON BRANCH v. UBS AG, ET AL. The court also ordered the remaining fraud claims, which concern LIBOR, be withdrawn without prejudice. Additional information concerning this action is publicly available in court filings under the docket number 654464/2013 (N.Y. Sup. Ct.) (Friedman, J.).
As of June 30, 2015, the aggregate original purchase amount of the purchases at issue in the pending MBS and CDO investor suits is approximately $1.95 billion , and the aggregate original purchase amount of the purchases covered by tolling agreements with MBS and CDO investors threatening litigation is approximately $1.4 billion .
Alternative Investment Fund-Related Litigation and Other Matters
On June 25, 2015, the parties in BEACH v. CITIGROUP ALTERNATIVE INVESTMENTS LLC executed a memorandum of understanding outlining the terms of a tentative class action settlement. On June 29, 2015, the court ordered that the case be stayed pending the filing of final settlement papers. Additional information concerning this action is publicly available in court filings under the docket number 12-cv-7717 (S.D.N.Y.) (Castel, J.).
Foreign Exchange Matters
Regulatory Actions: On May 20, 2015, Citigroup announced settlements with the U.S. Department of Justice (DOJ) and the Board of Governors of the Federal Reserve System (FRB) to resolve their respective investigations into Citigroup's foreign exchange business. Pursuant to the terms of the settlement with the DOJ, Citicorp pleaded guilty to a violation of the Sherman Act, will pay a fine of $925 million and be subject to a three -year probation period, the conditions of which include the continued implementation, remediation and strengthening of its controls relating to its foreign exchange business.
227
Additional information concerning this action is publicly available in court filings under the docket number 3:15-cr-78 (D. Conn.). Pursuant to the terms of the settlement with the FRB, Citigroup paid a civil penalty of $342 million and agreed to further enhance the control framework governing its foreign exchange business.
Antitrust and Other Litigation : On May 20, 2015, Citigroup announced that it has reached an agreement in principle to settle the consolidated class action in IN RE FOREIGN EXCHANGE BENCHMARK RATES ANTITRUST LITIGATION for a payment of $394 million , subject to court approval. As contemplated by the agreement, on July 17, 2015, the plaintiffs filed a second consolidated amended complaint, asserting claims under the Sherman Act and the Commodity Exchange Act based on allegations that defendants colluded to manipulate various foreign exchange benchmarks and engaged in other collusive conduct in connection with the trading of currencies. Additional information concerning this action is publicly available in court filings under the docket number 1:13-cv-7789 (S.D.N.Y) (Schofield, J.).
On May 21, 2015, an action captioned NYPL v. JPMORGAN CHASE & CO., ET. AL was brought in the United States District Court for the Northern District of California against Citigroup, as well as numerous other foreign exchange dealers. An amended complaint was filed on June 11, 2015. The plaintiff seeks to represent a putative class of "consumers and businesses in the United States who directly purchased supracompetitive foreign currency exchange rates" from defendants for their end use. The plaintiff alleges violations of the Sherman Act, and seeks injunctive relief and treble damages. Additional information concerning this action is publicly available in court filings under the docket number 3:15-cv-02290 (N.D. Cal.) (Chhabria, J).
In June 2015, actions captioned BAKIZADA v. BANK OF AMERICA CORPORATION, ET AL., TEEL v. BANK OF AMERICA CORPORATION, ET AL., and ROBERT CHARLES CLASS A, L.P. v. BANK OF AMERICA CORPORATION, ET AL. were brought in the United States District Court for the Southern District of New York against Citigroup and Related Parties, as well as numerous other foreign exchange dealers. The respective plaintiffs each seek to represent a putative class of investors who held foreign exchange futures or options on foreign exchange futures, and whose daily cash flows were calculated based on any key foreign exchange benchmark rates or who transacted at or around the time of the setting of key foreign exchange benchmark rates. The respective plaintiffs each allege violations of the Commodity Exchange Act, the Sherman Act, and/or the Clayton Act, and seek compensatory damages, treble damages where authorized by statute, injunctive relief, and/or disgorgement. Additional information concerning these actions is publicly available in court filings under the following docket numbers: 1:15-cv-4230 (S.D.N.Y.) (Schofield, J.); 1:15-cv-4436 (S.D.N.Y.) (Schofield, J.); and 1:15-cv-4926 (S.D.N.Y.) (Schofield, J.).
On June 3, 2015, an action captioned ALLEN v. BANK OF AMERICA CORPORATION, ET AL. was brought in the United States District Court for the Southern District of New York against Citigroup, as well as numerous other foreign exchange dealers. The plaintiff seeks to represent a putative class of participants, beneficiaries, and named fiduciaries of qualified Employee Retirement Income Security Act (ERISA) plans for whom a defendant provided foreign exchange transactional services or authorized or permitted foreign exchange transactional services involving a plan's assets in connection with its exercise of authority or control regarding an ERISA plan. The plaintiff alleges violations of ERISA, and seeks compensatory damages, restitution, disgorgement, and declaratory relief. Additional information concerning this action is publicly available in court filings under the docket number 1:15-cv-4285 (S.D.N.Y.) (Schofield, J.).
Interbank Offered Rates-Related Litigation and Other Matters
Antitrust and Other Litigation : Following the January 21, 2015 United States Supreme Court's remand of the action captioned GELBOIM, ET Al. v. BANK OF AMERICA CORP., ET AL. to the United States Court of Appeals for the Second Circuit for consideration on the merits of the plaintiffs' appeal of the dismissal of their antitrust claims, plaintiff-appellants submitted their opening brief on May 20, 2015, and defendants-appellees submitted their response brief on July 17, 2015. Additional information concerning this appeal is publicly available in court filings under the docket number 13-3565 (2d Cir.).
Following the March 31, 2015 dismissal of the action captioned 7 WEST 57 th STREET REALTY CO. v. CITIGROUP, INC., ET AL., the plaintiff moved for leave to file a second amended complaint on June 1, 2015. Additional information concerning this action is publicly available in court filings under the docket number 1:13-cv-981 (Gardephe, J.).
On July 24, 2015, a putative class action captioned SONTERRA CAPITAL MASTER FUND, LTD. v. UBS AG was brought in the United States District Court for the Southern District of New York against Citigroup and Related Parties, as well as other bank defendants, alleging manipulation of Yen LIBOR, Euroyen TIBOR, and the prices of Euroyen-based derivatives. The plaintiff asserts claims under the Sherman Act, the Commodity Exchange Act, and the Racketeer Influenced and Corrupt Organizations Act and for unjust enrichment, and seeks compensatory damages, treble damages where authorized by statute, injunctive relief, and/or disgorgement. Additional information concerning this action is publicly available in court filings under the docket number 1:15-cv-05844 (S.D.N.Y.).
Interchange Fees Litigation
On July 28, 2015, various objectors to the class settlement filed motions in the U.S. District Court to vacate the court's prior approval of the class settlement, alleging improprieties by two of the lawyers involved in the Interchange MDL. Additional information concerning this matter, including the district court proceedings and appeals related to the class
228
settlement, is publicly available in court filings under the docket numbers 05-md-1720 (E.D.N.Y.) (Brodie, J.) and 12-4671 (2d Cir.).
Money Laundering Inquiries
As previously disclosed, on July 22, 2015, Banamex USA (BUSA) entered into a joint consent order with the Federal Deposit Insurance Corporation (FDIC) and the Commissioner of the California Department of Business Oversight (DBO). The FDIC and DBO asserted, among other issues, that BUSA committed violations of the Bank Secrecy Act and failed to comply with an August 2, 2012 consent order issued by the FDIC. Without admitting or denying those allegations, BUSA paid a civil monetary penalty totaling $140 million to the FDIC and the DBO.
Regulatory Review of Consumer "Add-On" Products
On July 21, 2015, Citigroup announced it had reached an agreement with the Office of the Comptroller of the Currency (OCC) and the Consumer Financial Protection Bureau (CFPB) to resolve previously disclosed regulatory reviews of billing and marketing practices related to such add-on products, including those administered by third-party vendors, as well as fees for expedited phone payments on certain products. As part of the agreement, Citigroup paid fines totaling $70 million to the OCC and CFPB and will refund $700 million to customers affected by the issues cited in the consent order. Citigroup previously discontinued marketing the products cited in the consent order and no longer charges expedited pay by phone fees. Customer remediation has been underway since 2013.
Regulatory Review of Student Loan Servicing
Citibank, N.A. is currently subject to regulatory investigation concerning certain student loan servicing practices. Citibank, N.A. is cooperating with the investigation. Similar servicing practices have been the subject of an enforcement action against at least one other institution. In light of that action and the current regulatory focus on student loans, regulators may order that Citibank, N.A. remediate customers and/or impose penalties or other relief.
Parmalat Litigation and Related Matters
On June 16, 2015, the Parmalat administrator refiled the claim in an Italian civil court, claiming damages of 1.8 billion Euro against Citigroup and Related Parties and other financial institutions.
Allied Irish Bank Litigation
On June 30, 2015, the court largely denied Citibank N.A.'s motion for summary judgment. Additional information concerning this matter is publicly available in court filings under the docket number 03 Civ. 3748 (S.D.N.Y.) (Batts, J.).
Settlement Payments
Payments required in settlement agreements described above have been made or are covered by existing litigation accruals.
[End of Consolidated Financial Statements and Notes to Consolidated Financial Statements]
229
230
UNREGISTERED SALES OF EQUITY, PURCHASES OF EQUITY SECURITIES, DIVIDENDS
Unregistered Sales of Equity Securities
None.
Equity Security Repurchases
The following table summarizes Citi's equity security repurchases, which consisted entirely of common stock repurchases, during the three months ended June 30, 2015 :
In millions, except per share amounts | Total shares purchased | Average price paid per share | Approximate dollar value of shares that may yet be purchased under the plan or programs | |||||
April 2015 |
|
|
| |||||
Open market repurchases (1) | 7.2 | | $ | 52.42 | | $ | 7,409 | |
Employee transactions (2) | - | | - | | N/A | | ||
May 2015 |
|
|
| |||||
Open market repurchases (1) | 6.7 | | 54.43 | | 7,042 | | ||
Employee transactions (2) | - | | - | | N/A | | ||
June 2015 |
|
|
| |||||
Open market repurchases (1) | 14.4 | | 56.27 | | 6,235 | | ||
Employee transactions (2) | - | | - | | N/A | | ||
Amounts as of June 30, 2015 | 28.3 | | $ | 54.85 | | $ | 6,235 | |
(1) | Represents repurchases under the $7.8 billion 2015 common stock repurchase program (2015 Repurchase Program) that was approved by Citigroup's Board of Directors and announced on March 11, 2015, which was part of the planned capital actions included by Citi in its 2015 Comprehensive Capital Analysis and Review (CCAR). The 2015 Repurchase Program extends through the second quarter of 2016. Shares repurchased under the 2015 Repurchase Program are treasury stock. |
(2) | Consisted of shares added to treasury stock related to (i) certain activity on employee stock option program exercises where the employee delivers existing shares to cover the option exercise, or (ii) under Citi's employee restricted or deferred stock programs where shares are withheld to satisfy tax requirements. |
N/A Not applicable
Dividends
In addition to Board of Directors' approval, Citi's ability to pay common stock dividends substantially depends on regulatory approval, including an annual regulatory review of the results of the CCAR process required by the Federal Reserve Board and the supervisory stress tests required under the Dodd-Frank Act. See "Risk Factors-Business and Operational Risks" in Citi's 2014 Annual Report on Form 10-K. For information on the ability of Citigroup's subsidiary depository institutions and non-bank subsidiaries to pay dividends, see Note 19 to the Consolidated Financial Statements in Citi's 2014 Annual Report on Form 10-K. Any dividend on Citi's outstanding common stock would also need to be made in compliance with Citi's obligations to its outstanding preferred stock.
231
SIGNATURES
Pursuant to the requirements of the Securities Exchange Act of 1934, the Registrant has duly caused this report to be signed on its behalf by the undersigned, thereunto duly authorized, on the 3rd day of August, 2015.
CITIGROUP INC.
(Registrant)
By /s/ John C. Gerspach
John C. Gerspach
Chief Financial Officer
(Principal Financial Officer)
By /s/ Jeffrey R. Walsh
Jeffrey R. Walsh
Controller and Chief Accounting Officer
(Principal Accounting Officer)
232
EXHIBIT INDEX
Exhibit Number | Description of Exhibit |
|
|
3.01 | Restated Certificate of Incorporation of Citigroup Inc., as in effect on the date hereof, incorporated by reference to Exhibit 3.01 to Citigroup Inc.'s Quarterly Report on Form 10-Q for the quarter ended March 31, 2015 (File No. 1-9924). |
|
|
12.01+ | Calculation of Ratio of Income to Fixed Charges. |
|
|
12.02+ | Calculation of Ratio of Income to Fixed Charges Including Preferred Stock Dividends. |
|
|
31.01+ | Certification of principal executive officer pursuant to Section 302 of the Sarbanes-Oxley Act of 2002. |
|
|
31.02+ | Certification of principal financial officer pursuant to Section 302 of the Sarbanes-Oxley Act of 2002. |
|
|
32.01+ | Certification pursuant to 18 U.S.C. Section 1350, as adopted pursuant to Section 906 of the Sarbanes-Oxley Act of 2002. |
|
|
101.01+ | Financial statements from the Quarterly Report on Form 10-Q of Citigroup Inc. for the quarter ended June 30, 2015, filed on August 3, 2015, formatted in XBRL: (i) the Consolidated Statement of Income, (ii) the Consolidated Balance Sheet, (iii) the Consolidated Statement of Changes in Equity, (iv) the Consolidated Statement of Cash Flows and (v) the Notes to Consolidated Financial Statements. |
The total amount of securities authorized pursuant to any instrument defining rights of holders of long-term debt of the Company does not exceed 10% of the total assets of the Company and its consolidated subsidiaries. The Company will furnish copies of any such instrument to the SEC upon request.
+ Filed herewith