Table of Contents
UNITED STATES
SECURITIES AND EXCHANGE COMMISSION
Washington, D.C. 20549
FORM 10-K
(Mark One) | ||
ý | ANNUAL REPORT PURSUANT TO SECTION 13 OR 15 (d) OF THE SECURITIES EXCHANGE ACT OF 1934 | |
For the fiscal year ended September 30, 2017 | ||
Or | ||
o | TRANSITION REPORT PURSUANT TO SECTION 13 OR 15(d) OF THE SECURITIES EXCHANGE ACT OF 1934 | |
Commission file number 001-07172
BRT APARTMENTS CORP.
Maryland (State or other jurisdiction of incorporation or organization) |
| 13-2755856 (I.R.S. employer identification no.) |
60 Cutter Mill Road, Great Neck, New York (Address of principal executive offices) |
| 11021 (Zip Code) |
516-466-3100
Registrant's telephone number, including area code
Title of each class |
| Name of each exchange on which registered |
Shares of common stock, par value $.01 per share |
| New York Stock Exchange |
Securities registered pursuant to Section 12(g) of the Act:
NONE
(Title of Class)
Indicate by check mark if the registrant is a well-known seasoned issuer, as defined in Rule 405 of the Securities Act. Yes o No ý
Indicate by check mark if the registrant is not required to file reports pursuant to Section 13 or 15(d) of the Act. Yes o No ý
Indicate by check mark whether the registrant: (1) has filed all reports required to be filed by Section 13 or 15(d) of the Securities Exchange Act of 1934 during the preceding 12 months (or for such shorter period that the registrant was required to file such reports), and (2) has been subject to such filing requirements for the past 90 days. Yes ý No o
Indicate by check mark whether the registrant has submitted electronically and posted on its corporate Web site, if any, every Interactive Data File required to be submitted and posted pursuant to Rule 405 of Regulation S-T (232.405 of this chapter) during the preceding 12 months (or for such shorter period that the registrant was required to submit and post such files). Yes ý No o
Indicate by check mark if disclosure of delinquent filers pursuant to Item 405 of Regulation S-K (Section 229.405 of this chapter) is not contained herein, and will not be contained, to the best of registrant's knowledge, in definitive proxy or information statements incorporated by reference in Part III of this Form 10-K or any amendment to this Form 10-K o
Indicate by check mark whether the registrant is a large accelerated filer, an accelerated filer, a non-accelerated filer. or a smaller reporting company or an emerging growth company. See definitions of "large accelerated filer," "accelerated filer," "smaller reporting company" and "emerging growth company" in Rule 12b-2 of the Exchange Act. (Check one):
Large accelerated filer o | Accelerated filer ý | Non-accelerated filer o (Do not check if a smaller reporting company) | Smaller reporting company o |
Emerging growth company o
If an emerging growth company, indicate by check mark if the registrant has elected not to use the extended transition period for complying with any new or revised financial standards provided pursuant to Section 13(a) of the Exchange Act. o
Indicate by check mark whether registrant is a shell company (as defined in Exchange Act Rule 12b-2). Yes o No ý
The aggregate market value of voting and non-voting common equity held by non-affiliates of the registrant was approximately $64.6 million based on the last sale price of the common equity on March 31, 2017, which is the last business day of the registrant's most recently completed second quarter.
As of December 1, 2017, the registrant had 14,022,438 shares of common stock outstanding.
DOCUMENTS INCORPORATED BY REFERENCE
Portions of the proxy statement for the annual meeting of stockholders of BRT Apartments Corp. to be filed not later than January 29, 2018 are incorporated by reference into Part III of this Form 10-K.
Table of Contents
TABLE OF CONTENTS
Form 10-K
|
|
|
Item No. |
| Page(s) |
PART I |
| |
1 | Business | 3 |
1A. | Risk Factors | 12 |
1B. | Unresolved Staff Comments | 20 |
2 | Properties | 20 |
3 | Legal Proceedings | 20 |
4 | Mine Safety Disclosures | 20 |
PART II |
| |
5 | Market for Registrant's Common Equity, Related Stockholder Matters and Issuer Purchases of Equity Securities | 21 |
6 | Selected Financial Data | 24 |
7 | Management's Discussion and Analysis of Financial Condition and Results of Operations | 27 |
7A. | Quantitative and Qualitative Disclosures About Market Risk | 35 |
8 | Financial Statements and Supplementary Data | 35 |
9 | Changes In and Disagreements With Accountants on Accounting and Financial Disclosure | 35 |
9A. | Controls and Procedures | 35 |
9B. | Other Information | 36 |
PART III |
| |
10 | Directors, Executive Officers and Corporate Governance | 37 |
11 | Executive Compensation | 38 |
12 | Security Ownership of Certain Beneficial Owners and Management and Related Stockholder Matters | 38 |
13 | Certain Relationships and Related Transactions, and Director Independence | 38 |
14 | Principal Accountant Fees and Services | 38 |
PART IV |
| |
15 | Exhibits and Financial Statement Schedules | 39 |
16 | Form 10-K Summary | 41 |
Signatures | 42 | |
Table of Contents
Forward-Looking Statements
This Annual Report on Form 10-K, together with other statements and information publicly disseminated by us, contains certain forward looking statements within the meaning of Section 27A of the Securities Act of 1933, as amended, and Section 21E of the Securities Exchange Act of 1934, as amended. We intend such forward-looking statements to be covered by the safe harbor provisions for forward-looking statements contained in the Private Securities Litigation Reform Act of 1995 and include this statement for purposes of complying with these safe harbor provisions. Forward-looking statements relate to expectations, beliefs, projections, future plans and strategies, anticipated events or trends concerning matters that are not historical facts. Forward looking statements are generally identifiable by use of words such as "may," "will," "will likely result," "shall," "should," "could," "believe," "expect," "intend," "anticipate," "estimate," "project" or similar expressions or variations thereof.
Forward-looking statements contained in this Annual Report on Form 10- K are based on our beliefs, assumptions and expectations of our future performance taking into account all information currently available to us. These beliefs, assumptions and expectations can change as a result of many possible events or factors, not all of which are known to us or within our control, and which could materially affect actual results, performance or achievements. Factors which may cause actual results to vary from our forward-looking statements include, but are not limited to:
• | general economic and business conditions, including those currently affecting our nation's economy and real estate markets; |
• | the availability of, and costs associated with, sources of capital and liquidity; |
• | accessibility of debt and equity capital markets; |
• | general and local real estate conditions, including any changes in the value of our real estate; |
• | changes in Federal, state and local governmental laws and regulations, including laws and regulations relating to taxes and real estate and related investments; |
• | the level and volatility of interest rates; |
• | our acquisition strategy, which may not produce the cash flows or income expected; |
• | the competitive environment in which we operate, including competition that could adversely affect our ability to acquire properties and/or limit our ability to lease apartments or increase or maintain rental income; |
• | a limited number of multi-family property acquisition opportunities acceptable to us; |
• | the condition of Fannie Mae or Freddie Mac, which could adversely impact us; |
• | our failure to comply with laws, including those requiring access to our properties by disabled persons, which could result in substantial costs; |
• | insufficient cash flows, which could limit our ability to make required payments on our debt obligations; |
• | impairment in the value of real estate we own; |
• | failure of property managers to properly manage properties; |
• | disagreements with, or misconduct by, joint venture partners; |
• | decreased rental rates or increasing vacancy rates; |
• | our ability to lease units in newly acquired or newly constructed multi-family properties; |
• | potential defaults on or non-renewal of leases by tenants; |
• | creditworthiness of tenants; |
• | our ability to obtain financing for acquisitions; |
• | development and acquisition risks, including rising or unanticipated costs and failure of such acquisitions and developments to perform in accordance with projections; |
• | the timing of acquisitions and dispositions; |
• | our ability to reinvest the net proceeds of dispositions into more, or as favorable, acquisition opportunities; |
• | potential natural disasters such as hurricanes, tornadoes and floods; |
1
Table of Contents
• | board determinations as to timing and payment of dividends, if any, and our ability or willingness to pay future dividends; |
• | financing risks, including the risks that our cash flows from operations may be insufficient to meet required debt service obligations and we may be unable to refinance our existing debt upon maturity or obtain new financing on attractive terms or at all; |
• | lack of or insufficient amounts of insurance to cover, among other things, losses from catastrophes; |
• | our ability to maintain our qualification as a REIT; |
• | possible environmental liabilities, including costs, fines or penalties that may be incurred due to necessary remediation of contamination of properties presently owned or previously owned by us or a subsidiary owned by us or acquired by us. |
• | increases in real estate taxes at properties we acquire due to such acquisitions or other factors; and |
• | the other factors described in this Annual Report on Form 10-K, including those set forth under the captions "Risk Factors" and "Business". |
We caution you not to place undue reliance on forward-looking statements, which speak only as of the date of this Annual Report on Form 10-K. Except to the extent otherwise required by applicable law or regulation, we undertake no obligation to update these forward-looking statements to reflect events or circumstances after the date of the filing of this Annual Report on Form 10-K or to reflect the occurrence of unanticipated events.
2
Table of Contents
PART I
Item l. Business.
General
We are an internally managed real estate investment trust, also known as a REIT, that is primarily focused on the ownership, operation and development of multi-family properties. Most of our multi-family properties are owned by consolidated joint ventures in which we have a substantial ownership position. At September 30, 2017, we: (i) own 33 multi-family properties located in eleven states with an aggregate of 9,568 units (including 402 units at a development property) and a net book value of $900.7 million; and (ii) have ownership interests, through unconsolidated entities, in three multi-family properties with a net book value of $21.3 million. Most of our properties are located in the Southeast United States and Texas. We commenced our multi-family activities in January 2012.
We are also engaged, to a limited extent, in the ownership, operation and development of commercial, mixed use and other real estate assets. Through February 2016, these other real estate assets primarily consisted of our interest in a consolidated joint venture, which we refer to as the Newark Joint Venture, which owned several properties in Newark, New Jersey. At September 30, 2015, the net book value of our other real estate assets, including $141.4 million in net book value attributed to the Newark Joint Venture's assets, was $152.0 million. On February 23, 2016, we sold all of our interest in the Newark Joint Venture for $16.9 million, and in the quarter ended March 31, 2016, recognized a $15.5 million gain on this sale. At September 30, 2017, the net book value of our other real estate assets is $16.0 million, including a real estate loan to the Newark Joint Venture of $5.5 million. See notes 1, 5 and 6 to our consolidated financial statements.
From our inception on June 16, 1972 through November 1, 2014, we were engaged in real estate lending. These activities involved originating and holding for investment short-term mortgage loans secured by commercial or multi-family real estate property in the United States.
Information regarding our multi-family property and other real estate assets segments is included in note 14 to our consolidated financial statements and is incorporated herein by this reference. The financial information included herein has been reclassified as described in note 1 to our consolidated financial statements.
BRT Apartments Corp. is the successor to BRT Realty Trust ("BRT Trust") pursuant to the conversion, which we refer to as the "conversion", of BRT Trust from a Massachusetts business trust to a Maryland corporation on March 18, 2017. BRT Trust was formed on June 16, 1972. Our address is 60 Cutter Mill Road, Suite 303, Great Neck, New York 11021, telephone number 516-466-3100. Our website can be accessed at www.brtapartments.com , where copies of our Annual Reports on Form 10-K, Quarterly Reports on Form 10-Q, Current Reports on Form 8-K and other filings with the Securities and Exchange Commission, or SEC, can be obtained free of charge. These SEC filings are added to our website as soon as reasonably practicable.
Unless otherwise indicated or the context otherwise requires, all references to (i) "us", "we", "BRT" or the "Company" refer (i)(a) from and after the conversion, to BRT Apartments Corp. and its consolidated subsidiaries and (b) prior to the conversion, to the predecessor BRT Trust and its consolidated subsidiaries, (ii)"common stock" or "shares" refer (a) from and after the conversion, to common stock and (b) prior to the conversion, shares of beneficial interests, (iii) a year ( e.g ., 2017) refers to the applicable fiscal year ended September 30th, (iii) the sale of properties includes the sale of our partnership interest in a venture that owned Village Green, a Little Rock, AK multi-family property, (iv) information regarding properties owned by unconsolidated joint ventures is separately described and is not included with information regarding our consolidated joint ventures; (v) all interest rates give effect to the related interest rate derivative, if any, and (vi) "same store properties" refer to properties that we owned and operated for the entirety of both periods being compared, except for properties that are under construction, in lease-up, or are are undergoing development or redevelopment. We move properties previously excluded from our same store portfolio (because they were under construction, in lease up or are in development or redevelopment) into the same store designation once they have stabilized (as described below) and such status has been reflected fully in all quarters during the applicable periods of comparison. Newly constructed, lease-up, development and redevelopment properties are deemed stabilized upon attainment of at least 90% physical occupancy. Our multi-family property Retreat at Cinco Ranch-Katy, Texas is not included as a stabilized property because of the damage it suffered in Hurricane Harvey.
3
Table of Contents
Our Multi-Family Property Activities
Generally, our multifamily properties are garden apartment, mid-rise or town home style properties that provide residents with amenities, such as a clubhouse, swimming pool, laundry facilities and cable television access. Residential leases are typically for a one year term and may require security deposits equal to one month's rent. Substantially all of the units at these properties are leased at market rates. Set forth below is selected information regarding the multi-family properties owned by us as of September 30, 2017 :
|
|
|
|
|
|
|
| Our Percentage |
|
| Average Monthly Rental Rate Per Occupied Unit (3)($) |
|
| Average Physical Occupancy in: | ||||||||||||||
Property Name and Location |
| Number of Units |
| Age (1) |
| Acquisition Date |
| Ownership (%) (2) |
|
| 2017 |
| 2016 |
| 2015 |
| 2014 |
|
| 2017 |
| 2016 |
| 2015 |
| 2014 |
| |
The Fountains Apartments-Palm Beach Gardens, FL |
| 542 |
| 45 |
| 3/22/2012 |
| 80 |
|
| 1,327 | |
| 1,239 |
| 1,169 |
| 1,050 |
|
| 95.2 |
| 96.0 |
| 96.3 |
| 96.6 |
|
Waverly Place Apartments-Melbourne, FL (4) |
| 208 |
| 30 |
| 3/30/2012 |
| 80 |
|
| 956 | |
| 866 |
| 798 |
| 722 |
|
| 96.3 |
| 97.9 |
| 94.0 |
| 95.9 |
|
Silvana Oaks Apartments-N. Charleston, SC |
| 208 |
| 7 |
| 10/4/2012 |
| 100 |
|
| 1,126 | |
| 1,077 |
| 998 |
| 970 |
|
| 94.5 |
| 93.3 |
| 93.6 |
| 93.4 |
|
Avondale Station-Decatur, GA |
| 212 |
| 63 |
| 11/19/2012 |
| 100 |
|
| 979 | |
| 920 |
| 852 |
| 776 |
|
| 97.6 |
| 94.6 |
| 97.1 |
| 96.8 |
|
Stonecrossing Apartments-Houston, TX |
| 240 |
| 39 |
| 4/19/2013 |
| 91 |
|
| 891 | |
| 906 |
| 884 |
| 856 |
|
| 90.8 |
| 92.1 |
| 93.5 |
| 94.3 |
|
Stonecrossing East (Pathways)-Houston, TX |
| 144 |
| 38 |
| 6/7/2013 |
| 91 |
|
| 918 | |
| 909 |
| 886 |
| 823 |
|
| 87.8 |
| 89.8 |
| 92.6 |
| 93.7 |
|
Brixworth at Bridge Street-Huntsville, AL |
| 208 |
| 32 |
| 10/18/2013 |
| 80 |
|
| 690 | |
| 688 |
| 655 |
| 650 |
|
| 95.9 |
| 96.8 |
| 93.7 |
| 93.3 |
|
Newbridge Commons-Columbus, OH |
| 264 |
| 18 |
| 11/21/2013 |
| 100 |
|
| 801 | |
| 762 |
| 729 |
| 691 |
|
| 96.8 |
| 96.9 |
| 95.4 |
| 90.5 |
|
Waterside at Castleton-Indianapolis, IN |
| 400 |
| 34 |
| 1/21/2014 |
| 80 |
|
| 652 | |
| 642 |
| 621 |
| 609 |
|
| 92.0 |
| 94.1 |
| 92.1 |
| 90.7 |
|
Crossings of Bellevue-Nashville, TN |
| 300 |
| 32 |
| 4/2/2014 |
| 80 |
|
| 1,066 | |
| 1,032 |
| 955 |
| 907 |
|
| 97.3 |
| 97.8 |
| 97.1 |
| 97.9 |
|
Kendall Manor-Houston, TX |
| 272 |
| 36 |
| 7/8/2014 |
| 80 |
|
| 840 | |
| 833 |
| 796 |
| 769 |
|
| 92.1 |
| 93.9 |
| 94.4 |
| 91.2 |
|
Avalon Apartments-Pensacola, FL |
| 276 |
| 9 |
| 12/22/2014 |
| 98 |
|
| 969 | |
| 970 |
| 912 |
| - |
|
| 90.9 |
| 91.9 |
| 90.9 |
| - |
|
The Apartments at Venue-Valley, AL |
| 618 |
| 9 |
| 7/27/2015 |
| 61 |
|
| 743 | |
| 724 |
| 715 |
| - |
|
| 94.6 |
| 95.4 |
| 93.4 |
| - |
|
Parkway Grande-San Marcos, TX |
| 192 |
| 3 |
| 9/10/2015 |
| 80 |
|
| 1,044 | |
| 998 |
| 852 |
| - |
|
| 95.0 |
| 93.6 |
| 95.3 |
| - |
|
Cedar Lakes - Lake St. Louis, MO |
| 420 |
| 31 |
| 9/25/2015 |
| 80 |
|
| 789 | |
| 788 |
| 715 |
| - |
|
| 92.9 |
| 91.9 |
| 93.4 |
| - |
|
Factory at GARCO Park-N. Charleston, SC (5) |
| 271 |
| 1 |
| 10/13/2015 |
| 65 |
|
| 889 | |
| N/A |
| N/A |
| - |
|
| 33.8 |
| N/A |
| N/A |
| - |
|
Woodland Trails-LaGrange, GA |
| 236 |
| 8 |
| 11/18/2015 |
| 100 |
|
| 873 | |
| 832 |
| 849 |
| - |
|
| 95.7 |
| 94.6 |
| 96.2 |
| - |
|
Retreat at Cinco Ranch- Katy, TX (6) |
| 268 |
| 9 |
| 1/22/2016 |
| 75 |
|
| 1,098 | |
| 1,177 |
| - |
| - |
|
| 89.5 |
| 90.5 |
| - |
| - |
|
Grove at River Place - Macon, GA |
| 240 |
| 29 |
| 2/1/2016 |
| 80 |
|
| 662 | |
| 622 |
| - |
| - |
|
| 95.2 |
| 97.2 |
| - |
| - |
|
|
|
|
|
|
|
|
|
|
|
|
|
|
|
|
|
|
|
|
|
|
|
|
|
|
|
|
| |
|
|
|
|
|
|
|
| Our Percentage |
|
| Average Monthly Rental Rate Per Occupied Unit (2)($) |
|
| Average Physical Occupancy in: | ||||||||||||||
4
Table of Contents
Property Name and Location |
| Number of Units |
| Age (1) |
| Acquisition Date |
| Ownership (%) |
|
| 2017 |
| 2016 |
| 2015 |
| 2014 |
|
| 2017 |
| 2016 |
| 2015 |
| 2014 |
| |
Civic Center I-Southaven, MS |
| 392 |
| 15 |
| 2/29/2016 |
| 60 |
|
| 834 |
| 825 |
| - |
| - |
|
| 96.4 |
| 97.7 |
| - |
| - |
| |
The Veranda as Shavano - San Antonio, TX |
| 288 |
| 4 |
| 5/6/2016 |
| 65 |
|
| 982 |
| 953 |
| - |
| - |
|
| 92.0 |
| 83.4 |
| - |
| - |
| |
Chatham Court and Reflections - Dallas, TX |
| 494 |
| 31 |
| 5/11/2016 |
| 50 |
|
| 876 |
| 813 |
| - |
| - |
|
| 93.4 |
| 93.4 |
| - |
| - |
| |
Waters Edge at Harbison- Columbia, SC |
| 204 |
| 21 |
| 5/31/2016 |
| 80 |
|
| 878 |
| 821 |
| - |
| - |
|
| 93.7 |
| 94.2 |
| - |
| - |
| |
The Pointe at Lenox Park- Atlanta, GA |
| 271 |
| 28 |
| 8/15/2016 |
| 74 |
|
| 1,176 |
| 1,190 |
| - |
| - |
|
| 91.1 |
| 94.0 |
| - |
| - |
| |
Civic Center II - Southaven, MS |
| 384 |
| 12 |
| 9/1/2016 |
| 60 |
|
| 883 |
| 879 |
| - |
| - |
|
| 96.7 |
| 97.4 |
| - |
| - |
| |
Verandas at Alamo Ranch-San Antonio, TX |
| 288 |
| 2 |
| 9/19/2016 |
| 72 |
|
| 972 |
| 974 |
| - |
| - |
|
| 89.0 |
| 85.8 |
| - |
| - |
| |
Kilburn Crossing - Fredricksburg, VA |
| 220 |
| 12 |
| 11/4/2016 |
| 80 |
|
| 1,246 |
| - |
| - |
| - |
|
| 95.0 |
| - |
| - |
| - |
| |
Tower at OPOP - St. Louis, MO |
| 128 |
| 3 |
| 2/28/2017 |
| 76 |
|
| 1,189 |
| - |
| - |
| - |
|
| 93.5 |
| - |
| - |
| - |
| |
Lofts at OPOP - St. Louis, MO |
| 53 |
| 3 |
| 2/28/2017 |
| 76 |
|
| 1,211 |
| - |
| - |
| - |
|
| 95.0 |
| - |
| - |
| - |
| |
Vanguard Heights - Creve Coeur, MO (7) |
| 174 |
| 1 |
| 4/4/2017 |
| 78 |
|
| 1,652 |
| - |
| - |
| - |
|
| 74.7 |
| - |
| - |
| - |
| |
Bells Bluff - West Nashville, TN (8) |
| 402 |
| N/A |
| 6/2/2017 |
| 58 |
|
| - |
| - |
| - |
| - |
|
| N/A |
| - |
| - |
| - |
| |
Mercer Crossing - Farmers Branch, TX |
| 509 |
| 1 |
| 6/29/2017 |
| 50 |
|
| 1,272 |
| - |
| - |
| - |
|
| 91.4 |
| - |
| - |
| - |
| |
Jackson Square - Tallahassee, FL |
| 242 |
| 21 |
| 8/30/2017 |
| 80 |
|
| 1,062 |
| - |
| - |
| - |
|
| 94.2 |
| - |
| - |
| - |
| |
Total |
| 9,568 |
|
|
|
|
|
|
|
|
|
|
|
|
|
|
|
|
|
|
|
|
|
|
|
|
| |
(1) Reflects the approximate age of the property based on the year original construction was completed, other than Lofts at OPOP which was rehabbed in 2014.
(2) Distributions to, and profit sharing between, joint venture partners is determined pursuant to the applicable agreement governing the relationship between the parties and may not
be pro rata to the ownership interest each joint venture partner has in the applicable joint venture.
(3) Monthly rental rate per unit reflects our period of ownership.
(4) This property was sold on October 25, 2017.
(5) This property was under development in 2015 and 2016 and is currently in lease up.
(6) | Results impacted by Hurricane Harvey. See "Item 7" Management's Discussion and Analysis of Financial Condition and Results of Operations - Hurricane Harvey". |
(7) | This property is in lease up. |
(8) A development property.
5
Table of Contents
State |
| Number of Properties |
| Number of Units |
| Estimated 2018 Revenues (1) |
| Percent of 2018 Estimated Revenues | |||||
Texas |
| 9 | |
| 2,695 | |
| $ | 33,112 | | (2) | 30.5 | % |
Florida |
| 4 | |
| 1,268 | |
| 15,661 | | (3) | 14.4 | % | |
Georgia |
| 4 | |
| 959 | |
| 11,251 | |
| 10.4 | % | |
Mississippi |
| 2 | |
| 776 | |
| 8,310 | |
| 7.7 | % | |
Alabama |
| 2 | |
| 826 | |
| 7,849 | |
| 7.2 | % | |
South Carolina |
| 3 | |
| 683 | |
| 8,048 | | (4) | 7.4 | % | |
Tennessee |
| 2 | |
| 702 | |
| 3,991 | | (5) | 3.7 | % | |
Missouri |
| 4 | |
| 775 | |
| 10,706 | | (4) | 9.9 | % | |
Indiana |
| 1 | |
| 400 | |
| 3,417 | |
| 3.2 | % | |
Ohio |
| 1 | |
| 264 | |
| 2,671 | |
| 2.5 | % | |
Virginia |
| 1 | |
| 220 | |
| 3,448 | |
| 3.1 | % | |
Total |
| 33 | |
| 9,568 | |
| $ | 108,464 | |
| 100.0 | % |
___________________________
(1) | Reflects our estimate of the rental and other revenues to be generated in 2018 by our multi-family properties located in such state and generally |
assumes the same rental and occupancy rates as in effect in 2017.
(2) | Assumes revenues are reduced by an estimated $117 relating to anticipated rent concessions to be offered through January 2018 as a result of the damage sustained at Retreat at Cinco Ranch-Katy, Texas from Hurricane Harvey. See "Item 7. Management's Discussion and Analysis of Financial Condition and Results of Operations-Hurricane Harvey". |
(3) | Includes $214 representing one month of revenues for Waverly Place Apartments, Melbourne, FL which was sold in October 2017. |
(4) | Assumes additional revenues of $848 and $215 will be generated in South Carolina and Missouri, respectively, by an increase in occupancy at properties in lease up to stabilized levels. |
(5) | Assumes no revenues are generated from a 402 unit development property. |
Multi-family Properties Owned Through Unconsolidated Joint Ventures
Location |
| Number of Units |
| BRT's Initial Investment |
| Total Purchase Price |
| Total Acquisition Debt |
| Percent Ownership | ||||||||
Columbia, SC |
| 374 | |
| $ | 5,670 | |
| $ | 58,300 | |
| $ | 41,000 | |
| 32 | % |
Columbia, SC (1) |
| 339 | |
| 8,665 | |
| 5,915 | |
| - | |
| 46 | % | |||
Forney, TX |
| 313 | |
| 7,500 | |
| 39,000 | |
| 25,350 | |
| 50 | % | |||
|
| 1,026 | |
| $ | 21,835 | |
| $ | 103,215 | |
| $ | 66,350 | |
|
| |
_________________
(1) | Reflects land purchased for a development project at which the construction of a 339 unit multi-family property is planned. See note 9 of the consolidated financial statements. |
Our Acquisition Process and Underwriting Criteria
We identify multi-family property acquisition opportunities primarily through relationships developed over time by our officers with former borrowers, current joint venture partners, real estate investors and brokers. We are interested in acquiring the following types of multi-family properties:
• | Class B or better properties with strong and stable cash flows in markets where we believe there exists opportunity for rental growth and further value creation; |
• | Class B or better properties that offer significant potential for capital appreciation through repositioning or rehabilitating the asset to drive rental growth; |
• | properties available at opportunistic prices providing an opportunity for a significant appreciation in value; and |
6
Table of Contents
• | development of Class A properties in markets where we believe we can generate significant returns from the operation and if appropriate, sale of the development. |
Our current business plan is to acquire properties with cap rates ranging from 5% to 6.25% that will provide stable risk adjusted total returns ( i.e., operating income plus capital appreciation). In identifying opportunities that will achieve these goals, we seek acquisitions that will achieve an approximate 7% to 9% annual return on invested cash and an internal rate of return of approximately 10% to 20%. We have also focused, but have not limited ourselves, to acquiring properties located in the Southeast United States and Texas. Subject to the foregoing, we are opportunistic in pursuing multi-family property acquisitions and do not mandate any specific acquisition criteria, though we take the following into account in evaluating an acquisition opportunity: location, demographics, size of the target market, property quality, availability and terms and conditions of long term fixed rate mortgage debt, potential for capital appreciation or recurring income, extent and nature of contemplated capital improvements and property age. We generally acquire properties with a joint venture partner with knowledge and experience in owning and operating multi-family properties in the target market as this enhances our understanding of such market and assists us in managing our risk with respect to a particular acquisition.
Approvals of the acquisition of a multi-family property are based on a review of property information as well as other due diligence activities undertaken by us and, as applicable, our venture partner. Those activities include a consideration of economic, demographic and other factors with respect to the target market and sub-market (including the stability of its population and the potential for population growth, the economic and employment base, presence of and barriers to entry of alternative housing stock, rental rates for comparable properties, the competitive positioning of the proposed acquisition and the regulatory environment ( i.e . applicable rent regulation)), a review of an independent third party property condition report, a Phase I environmental report with respect to the property, a review of recent and projected results of operations for the property prepared by the seller, us or our joint venture partner, an assessment of our joint venture partner's knowledge and expertise with respect to the acquisition and operation of multi-family properties and the relevant market and sub-market, a site visit to the property and the surrounding area, an inspection of a sample of units at the property, the potential for rent increases and the possibility of enhancing the property and the costs thereof. To the extent a property to be acquired requires renovations or improvements, or if we and our joint venture partner believe that improving a property will generate greater rent, funds are generally set aside by us and our joint venture partner at the time of acquisition to provide the capital needed for such renovation and improvements. At September 30, 2017, an aggregate of $6.2 million has been allocated to fund improvements at 15 multi-family properties.
A key consideration in our acquisition process is the availability of mortgage debt to finance the acquisition (or the ability to assume the mortgage debt on the property) and the terms and conditions ( e.g ., interest rate, amortization and maturity) of such debt. Typically, approximately 25% to 35% of the purchase price is paid in cash and the balance is financed with mortgage debt. We believe that the use of leverage of up to 75% allows us the ability to earn a greater return on our investment than we would otherwise earn. Generally, the mortgage debt obtained in connection with an acquisition matures five to ten years thereafter, is interest only for one to three years after the acquisition, and provides for a fixed interest rate and for the amortization of the principal of such debt over 30 years.
Potential acquisitions are reviewed and approved by our investment committee. Approval requires the assent of not less than five of the eight members of this committee, all of whom are our executive officers. Board of director approval is required for any single multi-family property acquisition in which our equity investment exceeds $15 million.
We are partners in two multi-family development opportunities with the same joint venture partner or its affiliates, including an unconsolidated joint venture. We pursue these opportunities when we believe the potential higher returns justify the additional risks. The factors considered in pursuing these opportunities generally include the factors considered in evaluating a standard acquisition opportunity, and we place additional emphasis on our joint venture partner's ability to execute a development project. Though we may from time-to-time pursue other development activities, we do not anticipate development properties will constitute a significant part of our portfolio.
7
Table of Contents
Property Acquisitions
Location |
| Purchase |
| No. of |
|
|
| Acquisition |
| Initial BRT |
| Ownership Percentage |
| Capitalized Property | ||||||||||
Fredricksburg, VA |
| 11/4/2016 |
| 220 | |
| $ | 38,490 | |
| $ | 29,900 | |
| $ | 8,720 | |
| 80 | % |
| $ | 643 | |
St. Louis, MO |
| 2/28/2017 |
| 128 | |
| 27,000 | |
| 20,000 | |
| 6,001 | |
| 76 | % |
| 423 | | ||||
St. Louis, MO |
| 2/28/2017 |
| 53 | |
| 8,000 | |
| 6,200 | |
| 2,002 | |
| 76 | % |
| 134 | | ||||
Creve Coeur, MO |
| 4/4/2017 |
| 174 | |
| 39,600 | |
| 29,000 | |
| 9,408 | |
| 78 | % |
| 569 | | ||||
West Nashville, TN (1) |
| 6/2/2017 |
| 402 | |
| 5,228 | |
| - | |
| 4,800 | |
| 58 | % |
| - | | ||||
Farmers Branch, TX |
| 6/29/2017 |
| 509 | |
| 85,698 | |
| 55,200 | |
| 16,200 | |
| 50 | % |
| 992 | | ||||
Tallahassee, FL |
| 8/30/2017 |
| 242 | |
| 27,588 | |
| 21,524 | |
| 7,015 | |
| 80 | % |
| 377 | | ||||
|
|
|
| 1,728 | |
| $ | 231,604 | |
| $ | 161,824 | |
| $ | 54,146 | |
|
|
| $ | 3,138 | | |
(1) | This is a development project at which we expect construction to be completed by December 2018. |
Location |
| Purchase |
| No. of |
|
|
| Acquisition |
| Initial BRT |
| Ownership Percentage |
| Capitalized Property | ||||||||||
Madison, AL |
| 12/7/2017 |
| 204 | |
| $ | 18,400 | |
| $ | 15,000 | |
| $ | 4,456 | |
| 80 | % |
| $ | 174 | |
Property Sales
We monitor our portfolio to identify properties that should be sold. Factors considered in deciding whether to sell a property generally include our evaluation of the current market price of such property compared to its projected economics and changes in the factors considered by us in acquiring such property. We also believe it is important for us to maintain strong relationships with our joint venture partners. Accordingly, we also take into account our partners' desires with respect to property sales. If our partners deem it in their own economic interest to dispose of a property at an earlier date than we would otherwise dispose of a property, we may accommodate such request.
Property Name and Location |
| Sale |
| No. of |
| Sales Price |
| Gain on Sale |
| Non-Controlling Partner's Share of Gain | |||||||
Church and University - Greenville, NC |
| 10/19/2016 |
| 350 | |
| $ | 68,000 | |
| $ | 18,483 | |
| 9,329 | | |
Spring Valley - Panama City, FL |
| 10/26/2016 |
| 160 | |
| 14,720 | |
| 7,393 | |
| $ | 3,478 | | ||
Sandtown Vista - Atlanta, GA |
| 11/21/2016 |
| 350 | |
| 36,750 | |
| 8,905 | |
| 4,166 | | |||
Autumn Brook - Hixson, TN |
| 11/30/2016 |
| 156 | |
| 10,775 | |
| 608 | |
| 152 | | |||
Fort Washington - New York, NY (1) |
| 12/21/2016 |
| 1 | |
| 465 | |
| 449 | |
| - | | |||
Meadowbrook Apartments - Humble, TX |
| 7/11/2017 |
| 260 | |
| 18,000 | |
| 7,707 | |
| 3,143 | | |||
Parkside Apartments - Humble, TX |
| 7/11/2017 |
| 160 | |
| 11,300 | |
| 4,767 | |
| 1,943 | | |||
Ashwood Apartments - Pasadena, TX |
| 7/27/2017 |
| 144 | |
| 9,750 | |
| 4,289 | |
| 2,629 | | |||
|
|
|
| 1,581 | |
| $ | 169,760 | |
| $ | 52,601 | |
| $ | 24,840 | |
(1) Reflects the sale of a cooperative apartment unit included in our other real estate segment.
8
Table of Contents
The following table summarizes information regarding a property sold during the period from October 1, 2017 through December 8, 2017:
Property Name and Location |
| Sale Date |
| No. of |
| Sales Price |
| Estimated Gain on Sale |
| Non-Controlling Partner's Share of Estimated Gain | ||||||
Waverly Place Apartments - Melbourne, FL (a) |
| 10/25/2017 |
| 208 |
| $ | 22,250 | |
| $ | 12,700 | |
| $ | 2,800 | |
__________________________
(1) | Property classified as held for sale at September 30, 2017. |
Joint Venture Arrangements
The arrangements with our multi-family property joint venture partners are deal specific and vary from transaction to transaction. Generally, these arrangements provide for us and our partner to receive net cash flow available for distribution in the following order of priority (in certain cases, we are entitled to these distributions on a senior or preferential basis):
• | a preferred return of 9% to 10% on each party's unreturned capital contributions, until such preferred return has been paid in full, |
• | the return in full of each party's capital contribution, and |
• | the remaining net cash flow is distributed based upon satisfaction of performance hurdles which vary by transaction. |
Though, as noted above, each joint venture operating agreement contains different terms, such agreements generally provide for a buy-sell procedure under specified circumstances, including, (i) if the partners are unable to agree on major decisions or (ii) upon a change in control of our subsidiary owning the interest in the joint venture. Further, these arrangements may also allow us, and in some cases, our joint venture partner, to force the sale of the property after it has been owned by the joint venture for a specified period ( e.g ., four to five years after the acquisition).
Property Management
The day-to-day management of our multi-family properties is overseen by property management companies operating in the market in which the property is located. Many of these management companies are owned by our joint venture partners or their affiliates. Generally, we can terminate these management companies upon specified notice or for cause, subject to the approval of the mortgage lender and, in some cases, our joint venture partner. We believe satisfactory replacements for property managers are available, if required.
Mortgage Debt
YEAR |
|
| Principal Payments Due | ||
2018 (1) |
|
| $ | 35,016 | |
2019 (1) |
|
| 59,858 | | |
2020 |
|
| 61,875 | | |
2021 |
|
| 22,279 | | |
2022 |
|
| 40,428 | | |
Thereafter |
|
| 484,715 | | |
Total |
|
| $ | 704,171 | |
(1) | Includes $185 and $8,847 for 2018 and 2019, respectively, related to the Waverly Place Apartments' mortgage. This property was sold in October 2017. |
As of September 30, 2017, the weighted average annual interest rate of the mortgage debt on our 33 multi-family properties is 4.03% and the weighted average remaining term to maturity of such debt is approximately 6.9 years. The mortgage debt associated with our multi-family properties is generally non-recourse to (i) the joint venture that owns the property, subject to standard carve-outs and (ii) to us and our subsidiary acquiring the equity interest in such joint venture. We, at the parent entity level ( i.e ., BRT Apartments Corp.), are the standard carve-out guarantor with respect to the Avalon, Silvana Oaks,Woodland Trails, Stonecrossing, Stonecrossing East and Avondale properties. (The term "standard carve-outs" refers to
9
Table of Contents
recourse items to an otherwise non-recourse mortgage and are customary to mortgage financing. While carve-outs vary from lender to lender and transaction to transaction, the carve-outs may include, among other things, a voluntary bankruptcy filing, environmental liabilities, the sale, financing or encumbrance of the property in violation of loan documents, damage to property as a result of intentional misconduct or gross negligence, failure to pay valid taxes and other claims which could create a lien on a property and the conversion of security deposits, insurance proceeds or condemnation awards). At September 30, 2017, the principal amount of mortgage debt outstanding with respect to the properties at which we are the carve-out guarantor is approximately $86.6 million.
Insurance
The multi-family properties are covered by all risk property insurance covering 100% of the replacement cost for each building and business interruption and rental loss insurance (covering up to twelve months of loss). On a case-by-case basis, based on an assessment of the likelihood of the risk, availability of insurance, cost of insurance and in accordance with standard market practice, we obtain earthquake, windstorm, flood, terrorism and boiler and machinery insurance. We carry comprehensive liability insurance and umbrella policies for each of our properties which provide no less than $5 million of coverage per incident. We request certain extension of coverage, valuation clauses, and deductibles in accordance with standard market practice and availability.
Although we may carry insurance for potential losses associated with our multi-family properties, we may still incur losses due to uninsured risks, deductibles, co-payments or losses in excess of applicable insurance coverage and those losses may be material. In addition, a substantial amount of our insurance coverage is provided through blanket policies obtained by our joint venture partners or the property managers for such property. A consequence of obtaining insurance coverage in this manner is that losses on properties in which we have no ownership interest could reduce significantly or eliminate the coverage available on one or more properties in which we have an interest.
Changes in our Multi-Family Portfolio
Year |
| Number of Multi-Family Properties Acquired |
| Number of Units Acquired |
2012 |
| 5 |
| 1,451 |
2013 |
| 9 |
| 2,334 |
2014 |
| 13 |
| 4,174 |
2015 |
| 4 |
| 1,506 |
2016 |
| 11 |
| 3,336 |
2017 (1) |
| 7 |
| 1,728 |
Total |
| 49 |
| 14,529 |
(1) Includes the purchase of land in West Nashville, TN on which we are developing a 402 unit multi-family complex.
Year |
| Number of Multi-Family Properties Sold |
| Number of Units Sold |
2015 |
| 3 |
| 1,175 |
2016 |
| 6 |
| 2,206 |
2017 |
| 7 |
| 1,580 |
Total |
| 16 |
| 4,961 |
Our Other Real Estate Assets and Activities
We also own other real estate assets with an aggregate net book value of $16.0 million at September 30, 2017, including a $5.5 million loan receivable from the Newark Joint Venture, undeveloped land, cooperative apartment units and a leasehold position at a commercial property. See notes 6 and 14 to our consolidated financial statements.
10
Table of Contents
Corporate Level Financing Arrangement
As of September 30, 2017, $37.4 million (excluding deferred costs of $382,000) in principal amount of our junior subordinated notes is outstanding. These notes mature in April 2036, contain limited covenants (including covenants prohibiting us from paying dividends or repurchasing capital stock if there is an event of default (as defined therein) on these notes), are redeemable at our option, and from August 1, 2012 through April 30, 2016 bore an interest rate of 4.9%. From May 1, 2016 through maturity, these notes bear an interest rate, which resets and is payable quarterly, of three month LIBOR plus 200 basis points. At September 30, 2017, the interest rate on these notes is 3.31%.
Competition
We compete to acquire real estate assets and in particular, multi-family properties, with other owners and operators of such properties including other multi-family REITs, pension and investment funds, real estate developers and private real estate investors. Competition to acquire such properties is based on price and ability to secure financing on a timely basis and complete an acquisition. To the extent that a potential joint venture partner introduces us to a multi-family acquisition opportunity, we compete with other sources of equity capital to participate in such joint venture based on the financial returns we are willing to offer such potential partner and the other terms and conditions of the joint venture arrangement. We also compete for tenants at our multi-family properties-such competition depends upon various factors, including alternative housing options available in the applicable sub-market, rent, amenities provided and proximity to employment and quality of life venues.
Many of our competitors possess greater financial and other resources than we possess.
Environmental Regulation
We are subject to regulation at the federal, state and municipal levels and are exposed to potential liability should our properties or actions result in damage to the environment or to other persons or properties. These conditions include the presence or growth of mold, potential leakage of underground storage tanks, breakage or leaks from sewer lines and risks pertaining to waste handling. The potential costs of compliance, property damage restoration and other costs for which we could be liable or which could occur without regard to our fault or knowledge, are unknown and could potentially be material.
In the course of acquiring and owning multi family properties, an independent environmental consulting firm is engaged to perform a level 1 environmental assessment (and if appropriate, a level 2 assessment) as part of the due diligence process. We believe these assessment reports provide a reasonable basis for discovery of potential hazardous conditions prior to acquisition. Should any potential environmental risks or conditions be discovered during our due diligence process, the potential costs of remediation will be assessed carefully and factored into the cost of acquisition, assuming the identified risks and factors are deemed to be manageable and within reason. Some risks or conditions may be identified that are significant enough to cause us to abandon the possibility of acquiring a given property. As of the date of this report, we have no knowledge of any material claims made or pending against us with regard to environmental damage for which we may be found liable, nor are we aware of any potential hazards to the environment related to any of our properties which could reasonably be expected to result in a material loss.
Our Structure
We share facilities, personnel and other resources with several affiliated entities including, among others, Gould Investors L.P., a master limited partnership involved primarily in the ownership and operation of a diversified portfolio of real estate assets, and One Liberty Properties, Inc., an NYSE listed equity REIT. Eight individuals (including Jeffrey A. Gould, Chief Executive Officer and President, Mitchell Gould, Executive Vice President and George Zweier, Chief Financial Officer), devote substantially all of their business time to our activities, while our other personnel (including several officers) share their services on a part-time basis with us and other affiliated entities that share our executive offices. (Including our full and part-time personnel, we estimate that we have the equivalent of 12 full time employees). The allocation of expenses for the shared facilities, personnel and other resources is computed in accordance with a Shared Services Agreement by and among us and the affiliated entities. The allocation is based on the estimated time devoted by executive, administrative and clerical personnel to the affairs of each entity that is a party to this agreement.
In addition, through December 31, 2015, we were party to an Advisory Agreement, as amended, between us and REIT Management Corp., our former advisor. REIT Management is wholly owned by Fredric H. Gould, a member of our Board of Trustees and the former chairman of such board, and he and certain of our executive officers, including our Chairman of the Board and Chief Executive Officer, received compensation from REIT Management. Pursuant to this agreement, REIT Management furnished advisory and administrative services with respect to our business, including, without limitation, developing and maintaining banking and financing relationships, participating in the analysis and approvals of multi-family
11
Table of Contents
property acquisitions and dispositions and providing investment advice. We paid fees pursuant to this agreement of $693,000 and $2.4 million in 2016 and 2015, respectively.
Effective as of December 31, 2015, the Advisory Agreement terminated. In lieu thereof, we retained related parties to provide the services previously provided pursuant to such agreement (the "Services"). The aggregate fees paid for the Services in 2017 and 2016 was $1.2 million and $862,000, respectively.
Item 1A. Risk Factors.
Set forth below is a discussion of certain risks affecting our business. Any adverse effects arising from the realization of any of the risks discussed, including our financial condition and results of operation, may, and likely will, adversely affect many aspects of our business.
We face numerous risks associated with the real estate industry that could adversely affect our results of operations through decreased revenues or increased costs.
As a real estate company, we are subject to various changes in real estate conditions, and any negative trends in such real estate conditions may adversely affect our results of operations through decreased revenues or increased costs. These conditions include:
• | changes in national, regional and local economic conditions, which may be negatively impacted by concerns about inflation, deflation, government deficits, unemployment rates and decreased consumer confidence particularly in markets in which we have a high concentration of properties; |
• | increases in interest rates, which could adversely affect our ability to obtain financing or to buy or sell properties on favorable terms or at all; |
• | the inability of residents and tenants to pay rent; |
• | the existence and quality of the competition, such as the attractiveness of our properties as compared to our co mpetitors' properties based on considerations such as convenience of location, rental rates, amenities and safety record; |
• | increased operating costs, including increased real property taxes, maintenance, insurance and utility costs (including increased prices for fossil fuels); |
• | weather conditions that may increase or decrease energy costs and other weather-related expenses; |
• | oversupply of apartments or single-family housing or a reduction in demand for real estate in the markets in which our properties are located; |
• | a favorable interest rate environment that may result in a significant number of potential residents of our multi-family properties deciding to purchase homes instead of renting; |
• | changes in, or increased costs of compliance with, laws and/or governmental regulations, including those governing usage, zoning, the environment and taxes; and |
• | rent control or stabilization laws, or other laws regulating rental housing, which could prevent us from raising rents to offset increases in operating costs. |
Moreover, other factors may adversely affect our results of operations, including potential liability under environmental and other laws and other unforeseen events, many of which are discussed elsewhere in the following risk factors. Any or all of these factors could materially adversely affect our results of operations through decreased revenues or increased costs.
Our acquisition, development and property improvement activities are limited by the funds available to us.
Our ability to acquire additional multi-family properties, develop new properties and improve the properties in our portfolio is limited by the funds available to us and our ability to obtain, on acceptable terms, equity contributions from joint
12
Table of Contents
venture partners and mortgage debt from lenders. At September 30, 2017, we had approximately $12.4 million of cash and cash equivalents and approximately $6.2 million designated as restricted cash for improvements at 15 multi-family properties. Our multi-family acquisition and improvement activities are constrained by funds available to us which will limit growth in our revenues and operating results.
If interest rates increase or credit markets tighten, it may be more difficult for us to refinance our mortgage debt at favorable rates as it matures or to secure financing for acquisitions.
Year |
| Principal Payments Due at Maturity |
| Weighted Average Interest Rate | |||
2018 |
| $ | 29,000 | |
| 3.73 | % |
2019 (1) |
| 53,426 | |
| 3.86 | | |
2020 |
| 55,071 | |
| 3.22 | | |
2021 |
| 14,001 | |
| 4.29 | | |
2022 |
| 32,072 | |
| 4.40 | | |
2023 and thereafter |
| 446,134 | |
| 4.19 | | |
|
| $ | 629,704 | |
| 4.07 | % |
_______________________
(1) | Includes $8,750 related to the Waverly Place Apartments' mortgage. This property was sold in October 2017. |
Increases in interest rates, or reduced access to credit markets due, among other things, to more stringent lending requirements or our high level of leverage, may make it difficult for us to refinance our mortgage debt as it matures or limit the availability of mortgage debt, thereby limiting our acquisition and/or refinancing activities. Even in the event that we are able to secure mortgage debt on, or otherwise refinance our mortgage debt, due to increased costs associated with securing financing and other factors beyond our control, we may be unable to refinance the entire mortgage debt as it matures or be subject to unfavorable terms (such as higher loan fees, interest rates and periodic payments) if we do refinance the mortgage debt. Either of these results could reduce operating cash flow and earnings, which may adversely affect the investment goals of our stockholders.
Though interest rates have been at historically low levels the past several years, they have been increasing recently and may continue to increase. If we are required to refinance mortgage debt that matures over the next several years at higher interest rates than such mortgage debt currently bears, our operating cash flow may be significantly reduced.
We are not currently required to pay any dividends to maintain our status as a REIT.
We are required to distribute annually at least 90% of our ordinary taxable income to qualify as a REIT under the Internal Revenue Code of 1986, as amended, and the rules and regulations promulgated thereunder, which we refer to as the Code. Because current tax laws allow us to offset our net operating loss carryforwards, or NOLs ($15.8 million at December 31, 2016 and, after giving effect to our operations and properly sales effected from January 1, 2017 through November 30, 2017, an estimated $7 million to $11 million at November 30, 2017), against our Federal taxable income until the NOLs are used or expire, we are not currently required (and have not been required since 2010) to pay a dividend to maintain our REIT status. See note 11 to our consolidated financial statements. Though we were not required to do so to qualify as a REIT, on each of September 12, 2017 and December 5, 2017, we declared dividends of $0.18 per share. We cannot assure you that we will pay dividends in the future. If we do not continue to pay cash dividends, the price of our common stock may decline.
We may not be able to compete with competitors, many of which have greater financial and other resources than we possess.
We compete with many third parties engaged in the ownership and operation of multi-family properties, including other REITs, specialty finance companies, public and private investors, investment and pension funds and other entities. Many of these competitors have substantially greater financial and other resources than we do. Larger and more established competitors enjoy significant competitive advantages that result from, among other things, enhanced operating efficiencies and more extensive networks providing greater and more favorable access to capital, financing and tax credit allocations and more
13
Table of Contents
favorable acquisition opportunities. Larger multi-family property operators have the ability and capacity to acquire a greater number of higher quality properties at more favorable locations and on more favorable terms and conditions.
We may incur impairment charges in 2018.
We evaluate on a quarterly basis our real estate portfolios for indicators of impairment. Impairment charges reflect management's judgment of the probability and severity of the decline in the value of real estate assets we own. These charges and provisions may be required in the future as a result of factors beyond our control, including, among other things, changes in the economic environment and market conditions affecting the value of real property assets or natural or man-made disasters. If we are required to take impairment charges, our results of operations will be adversely impacted.
We may need to make significant capital improvements and incur deferred maintenance costs with respect to our multi-family properties and may not have sufficient funds for such purposes.
Our multi-family properties face competition from newer, and updated properties. At September 30, 2017 the weighted average age (based on the number of units) of our multi-family properties is approximately 20 years. To remain competitive and increase occupancy at these properties and/or make them attractive to potential tenants or purchasers, we may have to make significant capital improvements and/or incur deferred maintenance costs with respect to these properties. At September 30, 2017, $6.2 million, which is reflected as restricted cash on our consolidated balance sheet, has been earmarked for improvements at specific properties and may not be used for other properties. The cost of future improvements and deferred maintenance is unknown and the amounts earmarked for specific properties may be insufficient to effectuate needed improvements. Our results of operations and financial conditions may be adversely affected if we are required to expend significant funds (other than funds earmarked for such purposes) to repair or improve our properties.
Our transactions with affiliated entities involve conflicts of interest.
Entities affiliated with us and with certain of our executive officers provide services to us and on our behalf. These transactions raise the possibility that we may not receive terms as favorable as those that we would receive if the transactions were entered into with unaffiliated entities.
Senior management and other key personnel are critical to our business and our future success may depend on our ability to retain them.
We depend on the services of Jeffrey A. Gould, our president and chief executive officer, and other members of senior management to carry out our business and investment strategies. Although Jeffrey A. Gould devotes substantially all of his business time to our affairs, he devotes a limited amount of his business time to entities affiliated with us. In addition to Jeffrey A. Gould, only two other executive officers, Mitchell Gould, our executive vice president, and George Zweier, a vice president and our chief financial officer, devote all or substantially all of their business time to us. Many of our executives (i) provide Services (see Item 1 "Business-Our Structure") to us and/or (ii) share their services on a part-time basis with entities affiliated with us and located in the same executive offices pursuant to a shared services agreement. We rely on part-time executive officers to provide certain services to us, including legal and certain accounting services, since we do not employ full-time executive officers to handle these services. If the shared services agreement is terminated or the executives performing Services are unwilling to continue to do so, we will have to obtain such services from other sources or hire employees to perform them. We may not be able to replace these services or hire such employees in a timely manner or on terms, including cost and level of expertise, that are equivalent to or better than those we receive pursuant to the Services and the shared services agreement.
In addition, in the future we may need to attract and retain qualified senior management and other key personnel, both on a full-time and part-time basis. The loss of the services of any of our senior management or other key personnel or our inability to recruit and retain qualified personnel in the future, could impair our ability to carry out our business and our investment strategies.
We do not carry key man life insurance on members of our senior management.
We could be negatively impacted by changes in our relationship with Fannie Mae or Freddie Mac, changes in the condition of Fannie Mae or Freddie Mac and by changes in government support for multi-family housing.
Fannie Mae and Freddie Mac have been a major source of financing for multi-family real estate in the United States and we have used loan programs sponsored by these agencies to finance many of our acquisitions of multi-family properties. There has been ongoing discussion by the government with regard to the long term structure and viability of Fannie Mae and Freddie Mac, which could result in adjustments to guidelines for their loan products. Should these agencies have their mandates changed or reduced, lose key personnel, be disbanded or reorganized by the government or otherwise discontinue
14
Table of Contents
providing liquidity for the multi-family sector, our ability to obtain financing through loan programs sponsored by the agencies could be negatively impacted. In addition, changes in our relationships with Fannie Mae and Freddie Mac, and the lenders that participate in these loan programs, with respect to our existing mortgage financing could impact our ability to obtain comparable financing for new acquisitions or refinancing for our existing multi-family real estate investments. Should our access to financing provided through Fannie Mae and Freddie Mac loan programs be reduced or impaired, it would significantly reduce our access to debt capital and/or increase borrowing costs and could significantly limit our ability to acquire properties on acceptable terms and reduce the values to be realized upon property sales.
Most of our multi-family properties are located in a limited number of markets, which makes us susceptible to adverse developments in such markets.
In addition to general, national and regional conditions, the operating performance of our multi-family residential properties is impacted by the economic conditions, including economic conditions of the specific markets in which our properties are concentrated. At September 30, 2017, approximately 31%, 14%, 10% and 10% of our estimated 2018 revenues from multi-family properties are attributable to properties located in Texas, Florida, Georgia and Missouri, respectively. Accordingly, adverse developments in such markets, including economic developments or natural or man-made disasters, could adversely impact the operations of these properties and therefore our operating results and cash flow. The concentration of our properties in a limited number of markets exposes us to risks of adverse developments which are greater than the risks of owning properties with a more geographically diverse portfolio.
Our revenues are significantly influenced by demand for multi-family properties generally, and a decrease in such demand will likely have a greater adverse effect on our revenues than if we owned a more diversified real estate portfolio.
Our current portfolio is focused predominately on multi-family properties, and we expect that going forward we will continue to focus predominately on the acquisition, disposition and operation of such properties. As a result, we are subject to risks inherent in investments in a single industry, and a decrease in the demand for multi-family properties would likely have a greater adverse effect on our rental revenues than if we owned a more diversified real estate portfolio.
We are subject to certain limitations associated with selling multi-family properties, which could limit our operational and financial flexibility.
Our ability to sell properties and the terms (including sales price and the timing of the sale) at which such properties may be sold may be limited by various factors and conditions, including factors and conditions over which we have limited or no control. These factors and conditions include:
• | the agreement of our joint venture partner to sell a property; |
• | adverse market conditions, including the limited availability of mortgage debt required by a buyer to acquire a property or increased interest rates; |
• the need to expend funds to correct defects or to make improvements before a property can be sold; and
• | federal tax laws that may limit our ability to profit on the sale of properties that we have owned for less than two years. |
The foregoing factors and conditions may limit our ability to dispose of properties, which may have a material adverse effect on our financial condition and the market value of our securities.
The failure of third party property management companies to properly manage our properties or obtain sufficient insurance coverage could adversely impact our results of operations.
We and our joint venture partners rely on third party property management companies to manage our properties. These management companies are responsible for, among other things, leasing and marketing rental units, selecting tenants (including an evaluation of the creditworthiness of tenants), collecting rent, paying operating expenses, maintaining the property and obtaining insurance coverage for the properties they manage. If these property management companies do not perform their duties properly or we or our joint venture partners do not effectively supervise the activities of these managers, the occupancy rates and rental rates at the properties managed by such property managers may decline and the expenses at such properties may increase. At September 30, 2017, one property manager and its affiliates manage eight properties, a second property manager and its affiliates manage seven properties and 13 other property managers manage five or fewer properties. The loss of our property managers, and in particular, the managers that manage multiple properties, could result in a decrease in occupancy
15
Table of Contents
rates, rental rates or both or an increase in expenses. Further, property managers are also responsible for obtaining insurance coverage with respect to the properties they manage, which coverage is often obtained pursuant to blanket policies covering many properties in which we have no interest. Losses at properties managed by our property managers but in which we have no interest could reduce significantly the insurance coverage available at our properties managed by these property managers. Finally, some of the management companies are owned by our joint venture partners or their affiliates. The termination of a management company may require the approval of the mortgagee, our joint venture partner or both. If we are unable to terminate an underperforming property manager on a timely basis, our occupancy and rental rates may decrease and our expenses may increase.
Increased competition and increased affordability of residential homes could limit our ability to retain our tenants or increase or maintain rents.
Our multi-family properties compete with numerous housing alternatives, including other multi-family and single-family rental homes, as well as owner occupied single and multi-family homes. Our ability to retain tenants and increase or maintain rents or occupancy levels could be adversely affected by the alternative housing in a particular area and, due to declining housing prices, mortgage interest rates and government programs to promote home ownership, the increasing affordability of owner occupied single and multi-family homes.
Development, redevelopment and construction risks could affect our operating results.
We intend to continue to develop and redevelop multi-family properties. These activities may be exposed to the following risks:
• | we may abandon opportunities that we have already begun to explore for a number of reasons, including changes in local market conditions or increases in construction or financing costs, and, as a result, we may fail to recover expenses already incurred in exploring those opportunities; |
• | occupancy rates and rents at development properties may fail to meet our original expectations for a number of reasons, including changes in market and economic conditions beyond our control and the development by competitors of competing properties; |
• | we may be unable to obtain, or experience delays in obtaining, necessary zoning, occupancy, or other required governmental or third party permits and authorizations, which could result in increased costs or the delay or abandonment of development opportunities; |
• | we may incur costs that exceed our original estimates due to increased material, labor or other costs; |
• | we may be unable to complete construction and lease-up of a development project on schedule, resulting in increased construction and financing costs and a decrease in expected rental revenues; |
• | we may be unable to obtain financing with favorable terms, or at all, for the proposed development of a property, which may cause us to delay or abandon a development opportunity; and |
• | we may be unable to refinance with favorable terms, or at all, any construction or other financing obtained for a development property, which may cause us to sell the property on less favorable terms or surrender the property to the lender. |
If we are unable to address effectively these and other risks associated with development projects, our financial condition and results of operations may be adversely effected.
Risks involved in conducting real estate activity through joint ventures.
We have in the past and intend in the future to continue to acquire properties through joint ventures with other persons or entities when we believe that circumstances warrant the use of such structure. Joint venture investments involve risks not otherwise present when acquiring real estate directly, including the possibility that:
• | our joint venture partner might become bankrupt, insolvent or otherwise refuse or be unable to meet their obligations to us or the venture (including their obligation to make capital contributions or property distributions when due); |
• | we may incur liabilities as a result of action taken by our joint venture partner; |
16
Table of Contents
• | our joint venture partner may not perform its property oversight responsibilities; |
• | our joint venture partner may have economic or business interests or goals which are or become inconsistent with our business interests or goals, including inconsistent goals relating to the sale or refinancing of properties held in the joint venture or the timing of the termination or liquidation of the joint venture; |
• | our joint venture partners obtain blanket property casualty and business interruption insurance insuring properties we own jointly and other properties in which we have no ownership interest and as as a result, claims or losses with respect to properties owned by our joint venture partners but in which we have no interest could significantly reduce or eliminate the insurance available to properties in which we have an interest; |
• | our joint venture partner may be in a position to take action or withhold consent contrary to our instructions or requests, including actions that may make it more difficult to maintain our qualification as a REIT; |
• | our joint venture partner might engage in unlawful or fraudulent conduct with respect to our jointly owned properties or other properties in which they have an ownership interest; |
• | our joint venture partner may trigger a buy-sell arrangement, which could cause us to sell our interest, or acquire our partner's interest, at a time when we otherwise would not have initiated such a transaction; |
• | disputes between us and our joint venture partners may result in litigation or arbitration that would increase our expenses and divert management's attention from operating our business; |
• | disagreements with our joint venture partners with respect to property management (including with respect to whether a property should be sold, refinanced, or improved) could result in an impasse resulting in the inability to operate the property effectively; and |
• | our joint venture partners may have other competing real estate interests in the markets in which our properties are located that could influence the partners to take actions favoring their properties to the detriment of the jointly owned properties. |
Seven of our multi-family property joint ventures are owned with one joint venture partner or its affiliates, four of our multi-family property joint ventures are owned with a second joint venture partner or its affiliates and four of our multi-family property joint ventures are owned with a third partner. We may be adversely effected if we are unable to maintain a satisfactory working relationship with either of these joint venture partners or if either partner becomes financially distressed.
Compliance with REIT requirements may hinder our ability to maximize profits.
We must continually satisfy tests concerning, among other things, our sources of income, the amounts we distribute to our stockholders and the ownership of our common stock, to qualify as a REIT for Federal income tax purposes. We may also be required to make distributions to stockholders at disadvantageous times or when we do not have funds readily available for distribution. Accordingly, compliance with REIT requirements may hinder our ability to operate solely on the basis of maximizing profits.
To qualify as a REIT, we must also ensure that at the end of each calendar quarter at least 75% of the value of our assets consists of cash, cash items, government securities and qualified REIT real estate assets. The remainder of our investment in securities cannot include more than 10% of the outstanding voting securities of any one issuer or more than 10% of the total value of the outstanding securities of such issuer. In addition, no more than 5% of the value of our assets can consist of the securities of any one issuer, other than a qualified REIT security. If we fail to comply with these requirements, we must dispose of the portion of our assets in excess of such amounts within 30 days after the end of the calendar quarter in order to avoid losing our REIT status and suffering adverse tax consequences. This requirement could cause us to dispose of assets for consideration of less than their true value and could lead to a material adverse impact on our results of operations and financial condition.
Because real estate investments are illiquid, we may not be able to dispose of properties needed.
Real estate investments generally cannot be sold quickly. We may not be able to reconfigure our portfolio promptly in response to economic or other conditions. Further, even if we are able to sell properties, we may be unable to reinvest the proceeds of such sales in opportunities that are as favorable as the properties sold. Our inability to reconfigure our portfolio to profitably reinvest the proceeds of property sales promptly could adversely affect our financial condition and results of operations.
17
Table of Contents
We could be adversely affected if we or any of our subsidiaries are required to register as an investment company under the Investment Company Act of 1940 as amended (the "1940 Act").
We conduct our operations so that neither we, nor any of our subsidiaries is required to register as investment companies under the 1940 Act. If we or any of our subsidiaries is required to register as an investment company but fail to do so, the unregistered entity would be prohibited from engaging in certain business, and criminal and civil actions could be brought against such entity. In addition, the contracts of such entity would be unenforceable unless a court required enforcement, and a court could appoint a receiver to take control of the entity and liquidate its business.
We depend on our subsidiaries for cash flow and will be adversely impacted if these subsidiaries are prohibited from distributing cash to us.
We conduct, and intend to conduct, all our business operations through our subsidiaries. Accordingly, our only source of cash to fund our operations and pay our obligations is distributions from our subsidiaries of their net earnings and cash flows. We cannot assure you that our subsidiaries will be able to, or be permitted to, make distributions to us that will enable us to fund our operations. Each of our subsidiaries is or will be a distinct legal entity and, under certain circumstances, legal and contractual restrictions, may limit our ability to obtain cash from such entities. In addition, because we operate through our subsidiaries, your claims as stockholders will be structurally subordinated to all existing and future liabilities and obligations of our subsidiaries. Therefore, in the event of our bankruptcy, liquidation or reorganization, our assets and those of our subsidiaries will be able to satisfy your claims as stockholders only after all our and our subsidiaries' liabilities and obligations have been paid in full.
Liabilities relating to environmental matters may impact the value of our properties.
We may be subject to environmental liabilities arising from the ownership of properties. Under various federal, state and local laws, an owner or operator of real property may become liable for the costs of removal of certain hazardous substances released on its property. These laws often impose liability without regard to whether the owner or operator knew of, or was responsible for, the release of such hazardous substances.
The presence of hazardous substances on our properties may adversely affect our ability to finance or sell the property and we may incur substantial remediation costs. The discovery of material environmental liabilities attached to such properties could have a material adverse effect on our results of operations and financial condition.
Our operating results and assets may be negatively affected if our insurance coverage is insufficient to compensate us for casualty events occurring at our properties.
Our multi-family properties, including the properties owned by the joint ventures in which we are members, carry all risk property insurance covering the property and improvements thereto for the cost of replacement in the event of a casualty. Though we maintain insurance coverage, such coverage may be insufficient to compensate us for losses sustained as a result of a casualty because, among other things:
• | the amount of insurance coverage maintained for any property may be insufficient to pay the full replacement cost following a casualty event, |
• | the rent loss coverage under a policy may not extend for the full period of time that a tenant or tenants may be entitled to a rent abatement that is a result of, or that may be required to complete restoration following, a casualty event, |
• | certain types of losses, such as those arising from earthquakes, floods, hurricanes and terrorist attacks, may be uninsurable or may not be economically feasible to insure, |
• | changes in zoning, building codes and ordinances, environmental considerations and other factors may make it impossible or impracticable, to use insurance proceeds to replace damaged or destroyed improvements at a property, |
• | insurance coverage is part of blanket insurance policies in which losses on properties in which we have no ownership interest could reduce significantly or eliminate the coverage available on our properties, and |
• | the deductibles applicable to one or more buildings at a property may be greater than the losses sustained at such buildings. |
18
Table of Contents
If our insurance coverage is insufficient to cover losses sustained as a result of one or more casualty events, our operating results and the value of our portfolio will be adversely affected.
Changes to the U.S. federal income tax laws, including the enactment of certain proposed tax reform measures, could have an adverse impact on our business and financial results.
Changes to the U.S. federal income tax laws are proposed regularly. One proposal that is currently being considered by the U.S. Congress is the recently announced Tax Cuts and Jobs Act of 2017. The Tax Cuts and Jobs Act of 2017, as well as other proposals, if enacted, may result in a significant reform of the Code and include many changes, including significant changes to the taxation of business entities and the deductibility of certain expenses. Moreover, legislative and regulatory changes may be more likely in the 115th Congress because the Presidency and Congress are controlled by the same political party and significant reform of the Code has been described publicly as a legislative priority. Additionally, the REIT rules are constantly under review by persons involved in the legislative process and by the IRS and the U.S. Treasury Department, which may result in revisions to regulations and interpretations in addition to statutory changes. If enacted, certain such changes could have an adverse impact on our business and financial results. For example, certain proposals set forth in the Trump administration and House Republican tax plans could reduce the relative competitive advantage of operating as a REIT as compared with operating as a regular C-corporation. These proposals, among others, include: the lowering of income tax rates on individuals and corporations, which could ease the burden of double taxation on corporate dividends and make the single level of taxation on REIT distributions relatively less attractive; allowing the expensing of capital expenditures, which could have a similar impact and also could result in the bunching of taxable income and required distributions for REITs; and further limiting or eliminating the deductibility of interest expense, which could disrupt the real estate market and could (due to higher taxable income amounts) result in corresponding increases of required cash distributions by REITs, which could cause REITs in certain circumstances to have insufficient funds for operations or expansion. In addition, the repeal of the favorable tax treatment of like-kind exchanges under Section 1031 of the Code, which are routinely used by many REITS, might be included as a component of any such tax reform.
We cannot predict whether, when or to what extent new U.S. federal tax laws, regulations, interpretations or rulings will be issued, nor is the long-term impact of proposed tax reforms on the real estate investment industry or REITs clear. Prospective investors are urged to consult their tax advisors regarding the effect of potential changes to the U.S. federal tax laws on an investment in our common stock.
Compliance or failure to comply with the Americans with Disabilities Act of 1990 or other safety regulations and requirements could result in substantial costs.
The Americans with Disabilities Act generally requires that public buildings, including our properties, be made accessible to disabled persons. Non-compliance could result in the imposition of fines by the federal government or the award of damages to private litigants. From time-to-time claims may be asserted against us with respect to some of our properties under the Americans with Disabilities Act. If, under the Americans with Disabilities Act, we are required to make substantial alterations and capital expenditures in one or more of our properties, including the removal of access barriers, it could adversely affect our financial condition and results of operations.
Our properties are subject to various federal, state and local regulatory requirements, such as state and local fire and life safety requirements. If we fail to comply with these requirements, we could incur fines or private damage awards. We do not know whether existing requirements will change or whether compliance with future requirements will require significant unanticipated expenditures that will affect our cash flow and results of operations.
Breaches of information technology systems could materially harm our business and reputation.
We, our joint venture partners and the property managers managing our properties collect and retain on information technology systems certain financial, personal and other sensitive information provided by third parties, including tenants, vendors and employees. Such persons also rely on information technology systems for the collection and distribution of funds. There can be no assurance that we, our joint venture partners or property managers will be able to prevent unauthorized access to sensitive information or the unauthorized distribution of funds. Any loss of this information or unauthorized distribution of funds as a result of a breach of information technology systems may result in loss of funds to which we are entitled, legal liability and costs (including damages and penalties), as well as damage to our reputation, that could materially and adversely affect our business and financial performance.
19
Table of Contents
Item 1B. Unresolved Staff Comments.
None.
Item 2. Properties.
Our executive office is located at 60 Cutter Mill Road, Suite 303, Great Neck, New York. We believe that such facilities are satisfactory for our current and projected needs.
The information set forth under "Item 1-Business" is incorporated herein by this reference to the extent responsive to the information called for by this item.
Item 3. Legal Proceedings.
None.
Item 4. Mine Safety Disclosures.
Not applicable.
20
Table of Contents
PART II
Item 5. Market for Registrant's Common Equity, Related Stockholder Matters and Issuer Purchases of Equity Securities.
Market Information; Holders
|
| Fiscal 2017 |
| Fiscal 2016 | ||||||||||||
Fiscal Quarters |
| High |
| Low |
| High |
| Low | ||||||||
First Quarter |
| $ | 8.25 | |
| $ | 7.57 | |
| $ | 7.48 | |
| $ | 6.02 | |
Second Quarter |
| 8.70 | |
| 8.01 | |
| 7.15 | |
| 5.41 | | ||||
Third Quarter |
| 8.44 | |
| 7.59 | |
| 7.28 | |
| 6.93 | | ||||
Fourth Quarter |
| 11.01 | |
| 7.36 | |
| 8.25 | |
| 7.01 | | ||||
On November 30, 2017, the high and low sales prices of a share of our common stock was $11.07 and $10.00, respectively.
As of November 30, 2017, there were approximately 874 holders of record of our common stock.
Dividends
We are taxed as a REIT under the Code. To qualify as a REIT, we must meet a number of organizational and operational requirements, including a requirement that we distribute to our stockholders within the time frames prescribed by the Code at least 90% of our ordinary taxable income. Management currently intends to maintain our REIT status. As a REIT, we generally will not be subject to corporate Federal income tax on taxable income we distribute to stockholders in accordance with the Code. If we fail to qualify as a REIT in any taxable year, we will be subject to Federal income taxes at regular corporate rates and may not be able to qualify as a REIT for four subsequent tax years. Even if we qualify for Federal taxation as a REIT, we are subject to certain state and local taxes on our income and to Federal income and excise taxes on undistributed taxable income, ( i.e ., taxable income not distributed in the amounts and in the time frames prescribed by the Code).
At December 31, 2016, we had NOLs of $15.8 million and we estimate that after giving effect to our share of the gains from properties sold, and our operations during the period from, January 1, 2017 through November 30, 2017, that our NOLs at November 30, 2017 range from $7 million to $11 million; therefore, we are not currently required by Code provisions relating to REITs to pay cash dividends to maintain our status as a REIT. Notwithstanding the foregoing, on October 5, 2017, we paid a cash dividend of $.18 per share and on January 5, 2018, we will pay a cash dividend of $.18 per share. For Federal income tax purposes, these dividends will be included in 2017 income and is anticipated that they will be treated as long-term capital gains. Though we intend to continue to pay cash dividends on a quarterly basis, we cannot provide any assurance that we will do so.
See "Item 1. Business - Corporate Level Financing Arrangements" for information regarding limitations on our ability to pay dividends if there is an event of default under our junior subordinated notes.
21
Table of Contents
Stock Performance Graph
This graph compares, for the five years ended September 30, 2017, the cumulative return of our shares of common stock with the Standard & Poor's 500 Stock Index and an index consisting of apartment REITs ( i.e ., FTSE NAREIT Equity Apartments). The graph assumes $100 invested on September 30, 2012 and assumes the reinvestment of dividends.
COMPARISON OF 5 YEAR CUMULATIVE TOTAL RETURN*
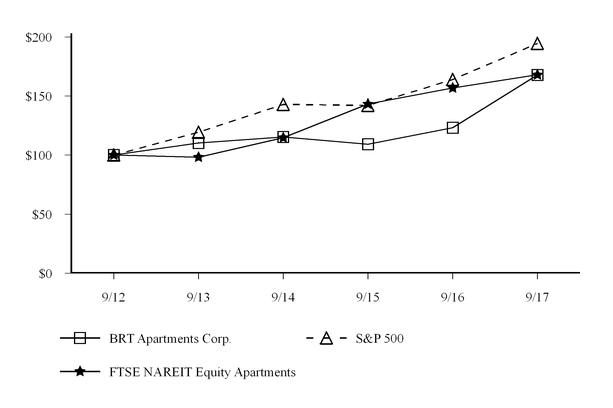
|
| 9/12 |
| 9/13 |
| 9/14 |
| 9/15 |
| 9/16 |
| 9/17 | ||||||||||||
BRT Apartments Corp. |
| $ | 100.00 | |
| $ | 110.31 | |
| $ | 115.38 | |
| $ | 109.08 | |
| $ | 123.08 | |
| $ | 167.83 | |
S&P 500 |
| 100.00 | |
| 119.34 | |
| 142.89 | |
| 142.02 | |
| 163.93 | |
| 194.44 | | ||||||
FTSE NAREIT Equity Apartments |
| 100.00 | |
| 98.24 | |
| 114.73 | |
| 143.18 | |
| 156.79 | |
| 167.92 | | ||||||
_______________________________________________________________________________
* $100 invested on 9/30/12 in stock or index, including reinvestment of dividends. Fiscal year ending September 30.
22
Table of Contents
Issuer Purchases of Equity Securities
On March 11, 2016, our Board of Directors authorized us to repurchase up to $5.0 million of our shares of common stock through September 30, 2017. The table below provides information regarding our repurchase of shares of common stock pursuant to such authorization during the periods presented.
Period |
| (a) Total Number of Shares Purchased |
| (b) Average Price Paid per Share |
| (c) Total Number of Shares Purchased as Part of Publicly Announced Plans or Programs |
| (d) Maximum Number (or Approximate Dollar Value) of Shares that May Yet Be Purchased Under the Plans or Programs |
July 1 - July 31, 2017 |
| - |
| - |
| - |
| $4,296,264 |
August 1 - August 31, 2017 |
| 2,593 |
| $7.92 |
| 2,593 |
| 4,275,729 |
September 1- September 30, 2017 |
| - |
| - |
| - |
| $4,275,729 |
Total |
| 2,593 |
|
|
| 2,593 |
|
|
On September 12, 2017, our Board of Directors authorized us to repurchase, effective as of October 1, 2017, up to $5.0 million of shares of our common stock through September 30, 2019. No shares have been purchased pursuant to this share repurchase plan.
23
Table of Contents
Item 6. Selected Financial Data.
The following table, not covered by the report of the independent registered public accounting firm, sets forth selected historical financial data for each of the years indicated. This table should be read in conjunction with the detailed information and consolidated financial statements appearing elsewhere herein, including note 1 to our consolidated financial statements which delineates the manner in which the financial information set forth below and elsewhere herein has been reclassified.
(Dollars in thousands, except per share amounts) |
| 2017 |
| 2016 |
| 2015 |
| 2014 |
| 2013 | ||||||||||
Operating statement data : |
|
|
|
|
|
|
|
|
|
| ||||||||||
Total revenues (1) |
| $ | 105,771 | |
| $ | 98,521 | |
| $ | 81,098 | |
| $ | 61,813 | |
| $ | 28,984 | |
Total expenses (1) |
| 119,337 | |
| 107,658 | |
| 91,379 | |
| 74,030 | |
| 38,330 | | |||||
Gain on sale of real estate |
| 52,601 | |
| 46,477 | |
| 15,005 | |
| - | |
| - | | |||||
Income (loss) from continuing operations |
| 37,188 | |
| 33,179 | |
| 4,724 | |
| (12,217 | ) |
| (3,335 | ) | |||||
Income (loss) from discontinued operations (2) |
| - | |
| 12,679 | |
| (6,329 | ) |
| (3,949 | ) |
| 5,424 | | |||||
(Income) loss attributable to non-controlling interests |
| (22,028 | ) |
| (13,869 | ) |
| (783 | ) |
| 6,712 | |
| 2,924 | | |||||
Net income (loss) attributable to common stockholders |
| 13,600 | |
| 31,289 | |
| (2,388 | ) |
| (9,454 | ) |
| 5,013 | | |||||
Earnings (loss) per share of common stock: |
|
|
|
| |
|
| |
|
| |
|
| |||||||
Income (loss) from continuing operations |
| $ | 0.97 | |
| $ | 1.21 | |
| $ | (0.02 | ) |
| $ | (0.81 | ) |
| $ | (0.21 | ) |
Income (loss) from discontinued operations |
| - | |
| 1.02 | |
| (0.15 | ) |
| 0.15 | |
| 0.56 | | |||||
Basic and diluted earnings (loss) per share |
| $ | 0.97 | |
| $ | 2.23 | |
| $ | (0.17 | ) |
| $ | (0.66 | ) |
| $ | 0.35 | |
Balance sheet data: |
|
| |
|
| |
|
| |
|
| |
|
| ||||||
Total assets |
| $ | 993,897 | |
| $ | 874,899 | |
| $ | 820,869 | |
| $ | 734,620 | |
| $ | 549,491 | |
Real estate properties, net (3) |
| 902,281 | |
| 759,576 | |
| 591,727 | |
| 522,591 | |
| 310,541 | | |||||
Cash and cash equivalents |
| 12,383 | |
| 27,399 | |
| 15,556 | |
| 22,639 | |
| 55,782 | | |||||
Assets related to discontinued operations (4) |
| - | |
| - | |
| 173,228 | |
| 134,188 | |
| 142,607 | | |||||
Mortgages payable, net of deferred fees (5) |
| 697,826 | |
| 588,457 | |
| 451,159 | |
| 382,690 | |
| 230,570 | | |||||
Junior subordinated notes, net of deferred fees |
| 37,018 | |
| 36,998 | |
| 36,978 | |
| 36,958 | |
| 36,938 | | |||||
Total BRT Apartments Corp. stockholders' equity |
| 165,996 | |
| 151,290 | |
| 122,655 | |
| 130,140 | |
| 138,791 | | |||||
(1) | The increases from 2013 through 2017 are due primarily to the increases in the number of multi-family properties owned. |
(2) Primarily reflects the operations of the Newark Joint Venture from 2014 through its sale in 2016 and our real estate lending activities in 2013.
See note 5 to our consolidated financial statements.
(3) | The increases from 2013 through 2017 are due to our multi-family property acquisitions. |
(4) | Primarily reflects the assets of the Newark Joint Venture. See note 4 to our consolidated financial statements. |
(5) | The increase from 2013 to 2017 is due to the mortgage debt incurred in the acquisition of multi-family properties. |
24
Table of Contents
Funds from Operations; Adjusted Funds from Operations.
In view of our multi-family property activities, we disclose funds from operations ("FFO") and adjusted funds from operations ("AFFO") because we believe that such metrics are a widely recognized and appropriate measure of the performance of an equity REIT.
We compute FFO in accordance with the "White Paper on Funds From Operations" issued by the National Association of Real Estate Investment Trusts ("NAREIT") and NAREIT's related guidance. FFO is defined in the White Paper as net income (loss), computed in accordance with generally accepted accounting principles, excluding gains (or losses) from sales of property, plus depreciation and amortization, plus impairment write-downs of depreciable real estate and after adjustments for unconsolidated partnerships and joint ventures. Adjustments for unconsolidated partnerships and joint ventures are calculated to reflect funds from operations on the same basis. In computing FFO, we do not add back to net income the amortization of costs in connection with our financing activities or depreciation of non-real estate assets. We compute AFFO by adjusting FFO for loss on extinguishment of debt, our straight-line rent accruals, restricted stock expense, restricted stock unit ("RSU") expense, and deferred mortgage costs (including our share of our unconsolidated joint ventures). Since the NAREIT White Paper does not provide guidelines for computing AFFO, the computation of AFFO may vary from one REIT to another.
We believe that FFO and AFFO are useful and standard supplemental measures of the operating performance for equity REITs and are used frequently by securities analysts, investors and other interested parties in evaluating equity REITs, many of which present FFO and AFFO when reporting their operating results. FFO and AFFO are intended to exclude GAAP historical cost depreciation and amortization of real estate assets, which assures that the value of real estate assets diminish predictability over time. In fact, real estate values have historically risen and fallen with market conditions. As a result, we believe that FFO and AFFO provide a performance measure that, when compared year over year, should reflect the impact to operations from trends in occupancy rates, rental rates, operating costs, interest costs and other matters without the inclusion of depreciation and amortization, providing a perspective that may not be necessarily apparent from net income. We also consider FFO and AFFO to be useful to us in evaluating potential property acquisitions.
FFO and AFFO do not represent net income or cash flows from operations as defined by GAAP. FFO and AFFO should not be considered to be an alternative to net income as a reliable measure of our operating performance; nor should FFO and AFFO be considered an alternative to cash flows from operating, investing or financing activities (as defined by GAAP) as measures of liquidity.
FFO and AFFO do not measure whether cash flow is sufficient to fund all of our cash needs, including principal amortization and capital improvements. FFO and AFFO do not represent cash flows from operating, investing or financing activities as defined by GAAP.
Management recognizes that there are limitations in the use of FFO and AFFO. In evaluating our performance, management is careful to examine GAAP measures such as net income (loss) and cash flows from operating, investing and financing activities. Management also reviews the reconciliation of net income (loss) to FFO and AFFO.
25
Table of Contents
The table below provides a reconciliation of net income (loss) determined in accordance with GAAP to FFO and AFFO for each of the indicated years (amounts in thousands):
|
| 2017 |
| 2016 |
| 2015 |
| 2014 |
| 2013 | ||||||||||
Net income (loss) attributable to common stockholders |
| $ | 13,600 | |
| $ | 31,289 | |
| $ | (2,388 | ) |
| $ | (9,454 | ) |
| $ | 5,013 | |
Add: depreciation of properties |
| 30,491 | |
| 24,329 | |
| 20,681 | |
| 15,562 | |
| 7,076 | | |||||
Add: our share of depreciation in unconsolidated joint ventures |
| 737 | |
| 20 | |
| 20 | |
| 20 | |
| 34 | | |||||
Add: amortization of deferred leasing costs |
| - | |
| 15 | |
| 71 | |
| 62 | |
| 64 | | |||||
Deduct: gain on sales of real estate and partnership interests |
| (52,601 | ) |
| (62,330 | ) |
| (15,005 | ) |
| - | |
| (6,250 | ) | |||||
Adjustment for non-controlling interests |
| 17,122 | |
| 13,320 | |
| 221 | |
| (4,012 | ) |
| (1,549 | ) | |||||
Funds from operations |
| 9,349 | |
| 6,643 | |
| 3,600 | |
| 2,178 | |
| 4,388 | | |||||
Adjust for: straight-line rent accruals |
| (56 | ) |
| (200 | ) |
| (411 | ) |
| (542 | ) |
| (263 | ) | |||||
Add: loss on extinguishment of debt |
| 1,463 | |
| 4,547 | |
| - | |
| - | |
| - | | |||||
Add: amortization of restricted stock and RSU expense |
| 1,218 | |
| 1,005 | |
| 906 | |
| 805 | |
| 691 | | |||||
Add: amortization of deferred mortgage costs |
| 1,244 | |
| 1,645 | |
| 2,242 | |
| 1,825 | |
| 1,371 | | |||||
Adjustment for non-controlling interest |
| (920 | ) |
| (2,729 | ) |
| (703 | ) |
| (424 | ) |
| (463 | ) | |||||
Adjusted funds from operations |
| $ | 12,298 | |
| $ | 10,911 | |
| $ | 5,634 | |
| $ | 3,842 | |
| $ | 5,724 | |
The table below provides a reconciliation of net income (loss) per common share (on a diluted basis) determined in accordance with GAAP to FFO and AFFO.
|
| 2017 |
| 2016 |
| 2015 |
| 2014 |
| 2013 | ||||||||||
Net income (loss) attributable to common stockholders |
| $ | 0.97 | |
| $ | 2.23 | |
| $ | (0.17 | ) |
| $ | (0.66 | ) |
| $ | 0.35 | |
Add: depreciation of properties |
| 2.18 | |
| 1.74 | |
| 1.46 | |
| 1.10 | |
| 0.51 | | |||||
Add: our share of depreciation in unconsolidated joint ventures |
| 0.05 | |
| - | |
| - | |
| - | |
| - | | |||||
Add: amortization of deferred leasing costs |
| - | |
| - | |
| - | |
| - | |
| - | | |||||
Deduct: gain on sales of real estate and partnership interests |
| (3.75 | ) |
| (4.45 | ) |
| (1.07 | ) |
| - | |
| (0.44 | ) | |||||
Adjustment for non-controlling interests |
| 1.22 | |
| 0.95 | |
| 0.02 | |
| (0.28 | ) |
| (0.11 | ) | |||||
Funds from operations |
| 0.67 | |
| 0.47 | |
| 0.24 | |
| 0.16 | |
| 0.31 | | |||||
Adjustment for: straight-line rent accruals |
| - | |
| (0.01 | ) |
| (0.04 | ) |
| (0.04 | ) |
| (0.02 | ) | |||||
Add: loss on extinguishment of debt |
| 0.10 | |
| 0.32 | |
| - | |
| - | |
| - | | |||||
Add: amortization of restricted stock and RSU expense |
| 0.09 | |
| 0.07 | |
| 0.07 | |
| 0.06 | |
| 0.05 | | |||||
Add: amortization of deferred mortgage costs |
| 0.09 | |
| 0.12 | |
| 0.16 | |
| 0.13 | |
| 0.1 | | |||||
Adjustment for non-controlling interests |
| (0.07 | ) |
| (0.19 | ) |
| (0.07 | ) |
| (0.03 | ) |
| (0.03 | ) | |||||
Adjusted funds from operations |
| $ | 0.88 | |
| $ | 0.78 | |
| $ | 0.36 | |
| $ | 0.28 | |
| $ | 0.41 | |
26
Table of Contents
Item 7. Management's Discussion and Analysis of Financial Condition and Results of Operations.
Overview
We are a REIT that is focused primarily on the ownership, operation and development of multi-family properties. These properties derive revenue primarily from tenant rental payments. Generally, these properties are owned by consolidated joint ventures in which we contributed 70% to 80% of the equity, with the remaining equity contributed by our joint venture partner. At September 30, 2017, we own 33 multi-family properties located in eleven states with an aggregate of 9,568 units (including 402 units at a development property). At September 30, 2017, the net carrying value of these multi-family assets was $900.7 million. We also have ownership interests, through unconsolidated entities, in three multi-family properties with a net book value, at September 30, 2017, of $21.3 million.
We also own and operate other real estate assets. At September 30, 2017, the carrying value of these other real estate assets is $16.0 million, including a real estate loan of $5.5 million.
See notes 1, 5 and 14 to our consolidated financial statements for information about discontinued operations, operating segments and the reclassification of financial information presented herein.
Highlights of 2017
During 2017, we:
• | declared a cash dividend of $.18 per share payable on October 4, 2017 to stockholders of record on September 25, 2017; |
• | acquired seven multi-family properties with 1,728 units (including a development property at which the construction of 402 units is in progress), for a purchase price of $231.6 million, including mortgage debt of $161.8 million and $54.1 million of our equity - we refer to these seven properties as the "2017 Acquisitions"; |
• | acquired interests in three unconsolidated joint ventures that own multi-family properties with an aggregate of 1,026 units, including 339 units under development, for an equity investment of $21.8 million; |
• | sold seven multi-family properties with an aggregate of 1,580 units, which we refer to as the 2017 Sold Properties, and one cooperative apartment unit, for a sales price of $169.8 million and a gain of $52.6 million - $24.8 million of this gain was allocated to our joint venture partners; and |
• | obtained the repayment of $13.6 million in principal amount outstanding on the loan to the Newark Joint Venture and as a result, at September 30, 2017, $5.5 million in principal amount of this loan is outstanding. |
Hurricane Harvey
In August 2017, Hurricane Harvey caused significant damage to our 268 unit Retreat at Cinco Ranch - Katy, Texas property. Among other things, 96 of our ground floor units are currently uninhabitable and as a result of the extensive damage to the common areas of the property ( i.e. , pool and clubhouse), we have offered, and may continue to offer, rent concessions and other accommodations to induce current and prospective tenants for the second and third floor units to continue to reside or to reside at the property. We reduced the net book value of this property by $3.6 million and, because we believe it is probable that we will recover such sum from our insurance coverage, less a $100,000 deductible, we recognized $3.5 million in insurance recoveries. Though this insurance claim with respect to this $3.6 million claim damage has not been resolved, as of December 12, 2017, $1.1 million of insurance proceeds has been received.
We believe that our business interruption insurance will cover our losses in rental income with respect to the ground floor units until such units are repaired and accordingly, have not reduced our estimate of revenues to be generated from such units. We are also seeking to recover from our insurance carriers the cost of any rent concessions and other accommodations we offer tenants and prospective tenants, and estimate that through January 2018, such concessions will be approximately $117,000. We may be required to continue to offer rent concessions after January 2018 and can provide no assurance that we will be reimbursed for any rent concessions provided. We anticipate that this property will be substantially repaired by September 2018.
27
Table of Contents
Recent Developments
On December 5, 2017, we declared a cash dividend of $0.18 per share payable on January 5, 2018 to stockholders of record on December 22, 2017.
On October 25, 2017, we sold Waverly Place Apartments, Melbourne, Florida, for a sales price of $22.3 million. We anticipate that during the quarter ended December 31, 2017, we will recognize a $12.7 million gain on the sale and that non-controlling partner's share of the gain will be approximately $2.8 million. In 2017, this property contributed $2.6 million of revenues and $2.4 million of operating expenses, interest expense and depreciation.
On December 7, 2017, we acquired Magnolia Pointe at Madison, a 204 unit multi-family property located in Madison, Alabama, for $18.4 million, including $15 million of mortgage debt obtained in connection with the acquisition. The mortgage debt bears interest at 4.08% per year, is interest only until 2022 and matures in December 2027.
Years Ended September 30, 2017 and 2016
Revenues
(Dollars in thousands): |
| 2017 |
| 2016 |
| Increase (Decrease) |
| % Change | |||||||
Rental and other revenue from real estate properties |
| $ | 104,477 | |
| $ | 95,202 | |
| $ | 9,275 | |
| 9.7 | % |
Other income |
| 1,294 | |
| 3,319 | |
| $ | (2,025 | ) |
| (61.0 | )% | ||
Total revenues |
| $ | 105,771 | |
| $ | 98,521 | |
| $ | 7,250 | |
| 7.4 | % |
Rental and other revenue from real estate properties. The components of the increase are as follows:
$21.9 million from the inclusion, for a full year, of the operations of ten properties that were acquired in 2016 (the "2016 Acquisitions"); and
• | $8.7 million from the operations of the 2017 Acquisitions; |
• | $2.1 million due primarily to rental rate increases from the operations of same store properties. Two properties, The Fountains Apartments and The Apartments at Venue, accounted for 50% of the increase at same store properties. Average rents at same store properties increased to $918 per occupied unit in 2017 from $888 per occupied unit in 2016. |
These increases were offset by the loss of rental and other revenue of $10.7 million from the sale of the 2017 Sold Properties. The results for 2016 include $13.6 million of rental revenue from six multi-family properties sold in 2016 (the "2016 Sold Properties").
Other income.
The decrease is due to the inclusion in 2016 of $2.5 million of deferred interest on the loan to the Newark Joint Venture that had not been recognized for several years prior thereto due to recoverability concerns. See notes 5 and 6 to our consolidated financial statements.
28
Table of Contents
Expenses
(Dollars in thousands) |
| 2017 |
| 2016 |
| Increase (Decrease) |
| % Change | |||||||
Real estate operating expenses |
| $ | 51,279 | |
| $ | 47,519 | |
| $ | 3,760 | |
| 7.9 | % |
Interest expense |
| 28,171 | |
| 23,878 | |
| 4,293 | |
| 18.0 | % | |||
Advisor's fees, related party |
| - | |
| 693 | |
| (693 | ) |
| (100.0 | )% | |||
Property acquisition costs |
| - | |
| 3,852 | |
| (3,852 | ) |
| (100.0 | )% | |||
General and administrative |
| 9,396 | |
| 8,536 | |
| 860 | |
| 10.1 | % | |||
Depreciation |
| 30,491 | |
| 23,180 | |
| 7,311 | |
| 31.5 | % | |||
Total expenses |
| $ | 119,337 | |
| $ | 107,658 | |
| 11,679 | |
| 10.8 | % | |
Real estate operating expenses. The components of the increase are as follows:
• | $11.1 million from the inclusion, for a full year, of the operations of the 2016 Acquisitions; |
• | $3.6 million from the operations of the 2017 Acquisitions; |
• | $1.2 million from operations of the same store properties due to an increase (i) of approximately $701,000 from real estate taxes at five properties primarily as a result of real property tax reassessments and (ii) in repair and maintenance expense at several properties; and |
• | $606,000 from the operations of a property engaged in lease up activities. |
The increase was offset by:
• | A decline in operating expenses of $5.0 million from the sale of the 2017 Sold Properties. |
• | A decline in operating expenses of $8.0 million from the 2016 Sold Properties. |
Interest expense. The components of the increase are as follows:
• | $6.1 million due to the inclusion, for a full year, of the interest expense associated with the mortgage debt incurred in the 2016 Acquisitions; |
• | $3.3 million from the mortgage debt incurred in the 2017 Acquisitions; |
• | $358,000 from the cessation of the capitalization of interest from a development property in connection with the commencement of lease up activities. |
The increase was offset by decreases of:
• | $2.1 million from the sale of the 2017 Sold Properties. |
• | $3.0 million from the 2016 Sold Properties. |
• | $422,000 on our junior subordinated notes due to the reduction in the interest rate thereon. From August 1, 2012 through April 29, 2016, these notes carried an interest rate of 4.9% and commencing May 1, 2016, these notes bear an interest rate of three months LIBOR and 200 basis points. At September 30, 2017 and 2016, the interest rate on these notes was 3.31% and 2.76%, respectively. |
Advisor's fee, related party. The decrease is due to the termination of the advisory agreement effective December 31, 2015.
Property acquisition costs. Due to a change in an accounting standard effective October 1, 2016, these costs are generally capitalized as part of the basis of an asset acquisition. During 2017, we capitalized $3.1 million of such costs.
29
Table of Contents
General and administrative expense. These costs increased primarily as a result of a $331,000 increase in fees paid in connection with the Services, a $ 237,000 increase in compensation paid to our employees, including $125,000 increase in compensation paid to our chief executive officer, and a $213,000 increase primarily related to amortization of restricted stock units granted in 2016. In 2017, 2016 and 2015, general and administrative expense is allocated between our two segments in proportion to the estimated time spent by our full time personnel on such segments.
Depreciation. The components of the increase are as follows:
• | $4.3 million from the operations of the 2017 Acquisitions; |
• | $8.2 million from the inclusion, for a full year, of the operations of the 2016 Acquisitions; and |
• | $728,000 from the operations of a property in connection with the commencement of lease up activities. |
The increase was offset by decreases in depreciation of:
• | $2.8 million from the sales of the 2017 Sold Properties. |
• | $2.4 million from the 2016 Sold Properties. |
Other revenue and expense items
Equity in loss of unconsolidated joint ventures. The results for 2017 reflects a $384,000 loss associated with investments in two unconsolidated joint ventures, including the loss of $293,000 attributable to depreciation expense associated with our ownership interest in Canalside Lofts.
Gain on sale of real estate. The results for 2017 reflect the $52.6 million gain from the sale of 2017 Sold Properties, of which $24.8 million was allocated to non-controlling interests. The results for 2016 reflect the $46.5 million gain from the sale of the 2016 Sold Properties and two cooperative apartment units, of which $18.8 million was allocated to non-controlling interests.
Gain on sale of partnership interest. In 2016, we sold our interest in a joint venture that owned Village Green, Little Rock, AK multi-family property and recognized a $386,000 gain on the sale. There was no corresponding gain in 2017.
Loss on extinguishment of debt . In 2017, we incurred $1.5 million of mortgage prepayment charges in connection with the sale of four properties. In 2016 we incurred $4.5 million of mortgage prepayment charges in connection with the sale of two properties.
Provision for taxes. For 2017 and 2016, these amounts reflect the federal alternative minimum tax we are required to pay as a result of the use of our loss carry forwards to offset taxable income; 2017 also includes the payment of $1.2 million of state taxes due to the unavailability of loss carryforwards at the state level.
Discontinued operations
In 2016, we sold our interest in the Newark Joint Venture and reclassified the operations of the venture to discontinued operations for all comparative periods. The $12.7 million of income from discontinued operations reflects the $15.5 million gain on the sale of our interest in the venture, net of the venture's operating losses of $2.8 million incurred during 2016.
Years Ended September 30, 2016 and 2015
Revenues
(Dollars in thousands): |
| 2016 |
| 2015 |
| Increase (Decrease) |
| % Change | |||||||
Rental and other revenue from real estate properties |
| $ | 95,202 | |
| $ | 81,026 | |
| $ | 14,176 | |
| 17.5 | % |
Other income |
| 3,319 | |
| 72 | |
| 3,247 | |
| N/A | | |||
Total revenues |
| $ | 98,521 | |
| $ | 81,098 | |
| $ | 17,423 | |
| 21.5 | % |
30
Table of Contents
Rental and other revenue from real estate properties. The components of the increase are as follows:
• | $13.3 million from the operations of the 2016 Acquisitions; |
• | $11.6 million due to the inclusion, for a full year, of the operations of four properties that were acquired in 2015 (the "2015 Acquisitions"); |
• | $2.8 million from operations of our Southridge-Greenville, South Carolina property, which prior to its sale in October 2016, was engaged in lease up activities; and |
• | $2.7 million due primarily to rental rate increases from the operations of same store properties. Seven properties accounted for 78% of the increase at same store properties. Average rents at same store properties increased to $892 per occupied unit in 2016 from $841 per occupied unit in the prior year. |
These increases were offset by the loss of rental and other revenue of $8.8 million from the sale of the 2016 Sold Properties. The results for 2015 include $7.5 million of rental revenue from three multi-family properties sold in 2015 (the "2015 Sold Properties").
Other income.
The increase is due to the inclusion of interest on the loan receivable from the Newark Joint Venture. At September 30, 2016, the loan receivable was in principal amount of $19.5 million. Through December 31, 2015, the interest income on this receivable was eliminated in consolidation. As a result of the February 2016 sale of our interest in the Newark Joint Venture, this interest income is reflected on our consolidated statement of operations. See notes 5 and 6 to our consolidated financial statements.
Expenses
(Dollars in thousands) |
| 2016 |
| 2015 |
| Increase (Decrease) |
| % Change | |||||||
Real estate operating expenses |
| $ | 47,519 | |
| $ | 42,612 | |
| $ | 4,907 | |
| 11.5 | % |
Interest expense |
| 23,878 | |
| 19,297 | |
| 4,581 | |
| 23.7 | % | |||
Advisor's fees, related party |
| 693 | |
| 2,448 | |
| (1,755 | ) |
| N/A | | |||
Property acquisition costs |
| 3,852 | |
| 1,885 | |
| 1,967 | |
| N/A | | |||
General and administrative |
| 8,536 | |
| 6,683 | |
| 1,853 | |
| 27.7 | % | |||
Depreciation |
| 23,180 | |
| 18,454 | |
| 4,726 | |
| 25.6 | % | |||
Total expenses |
| $ | 107,658 | |
| $ | 91,379 | |
| $ | 16,279 | |
| 17.8 | % |
Operating expenses related to real estate properties. The components of the increase are as follows:
• | $6.2 million from the operations of the 2016 Acquisitions; |
• | $6.0 million to the inclusion, for a full year, of the operations of the 2015 Acquisitions; |
• | $1.0 million from the operations of a property engaged in lease up activities; and |
• | $608,000 from operations of the same store properties. |
The increase was offset by a decline in operating expenses of $3.9 million from the sale of the 2016 Sold Properties. The results for 2015 include operating expenses of $5.0 million from the 2015 Sold Properties.
Interest expense. The increase is primarily due to mortgage interest expense of:
• | $4.0 million from the mortgage debt incurred in the 2016 Acquisitions; |
• | $3.3 million due to the inclusion, for a full year, of the interest expense associated with the mortgage debt incurred in the 2015 Acquisitions; |
• | $825,000 from four same store properties that obtained supplemental debt; and |
31
Table of Contents
• | $596,000 from the cessation of the capitalization of interest from a development property in connection with the commencement of lease up activities. |
The increase was offset by $2.3 million from the sale of the 2016 Sold Properties. The results for 2015 include interest expense of $1.6 million from the 2015 Sold Properties. The increase in the interest expense was also offset by a $256,000 decrease in such expense on our junior subordinated notes due to the reduction in the interest rate on such notes. From August 1, 2012 through April 29, 2016, these notes carried an interest rate of 4.9% and commencing May 1, 2016, these notes bear an interest rate of three months LIBOR and 200 basis points. At September 30, 2016, the interest rate on these notes is 2.76%.
Advisor's fee, related party. The decrease is due to the termination of the Advisory Agreement effective December 31, 2015.
Property acquisition costs. The increase is due to increased acquisition activity, including the payment of $2.2 million of acquisition fees to our venture partners.
General and administrative expense. These costs increased primarily as a result of the inclusion of $863,000 of fees for the Services, $368,000 of professional fees primarily related to the conversion from a Massachusetts business trust to a Maryland corporation and $262,000 related to higher compensation paid primarily to our chief executive officer.
Depreciation. The components of the increase are as follows:
• | $4.8 million from the operations of the 2016 Acquisitions; |
• | $4.3 million from the inclusion, for a full year, of the operations of the 2015 Acquisitions; and |
• | $1.1 million from the operations of a property in connection with the commencement of lease up activities. |
The increase was offset by $3.2 million from the sales of the 2016 Sold Properties. The results for 2015 include depreciation of $1.2 million from the 2015 Sold Properties. The increase was also offset by $1.0 million from the finalization of purchase price allocations with respect to certain properties acquired.
Other revenue and expense items
Gain on sale of real estate. We sold five multi-family properties and two cooperative apartment units for $199.7 million. We recognized a gain of $46.5 million from the sale of these properties, of which $18.8 million was allocated to non-controlling interests. The 2015 period includes the sale of three multi-family properties for a $14.4 million gain, of which $5.2 million was allocated to non-controlling interests.
Gain on sale of partnership interest. In 2016, we sold our interest in a joint venture that owned Village Green, Little Rock, AK multi-family property and recognized a $386,000 gain on the sale. There was no corresponding gain in 2015.
Loss on extinguishment of debt . In 2016, we incurred an aggregate $4.5 million of mortgage prepayment charges in connection with the sale of two properties. There was no corresponding charge in 2015.
Provision for Federal tax. This amount reflects the federal alternative minimum tax that we are required to pay as a result of the use of our loss carry forwards to offset 2016 taxable income.
Discontinued operations
In 2016, we sold our interest in the Newark Joint Venture and reclassified the operations of the venture to discontinued operations for all comparative periods. The $12.7 million of income from discontinued operations reflects the $15.5 million gain on the sale of our interest in the venture, net of the venture's operating losses of $2.8 million incurred during 2016. See notes 1, 5 and 6 to our consolidated financial statements.
32
Table of Contents
Disclosure of Contractual Obligations
|
| Payment Due by Period | ||||||||||||||||||
(Dollars in thousands) |
| Less than |
| 1 - 3 |
| 3 - 5 |
| More than |
| Total | ||||||||||
Long-Term Debt Obligations (1) |
| $ | 63,955 | |
| $ | 172,607 | |
| $ | 108,263 | |
| $ | 604,623 | |
| $ | 949,448 | |
Operating Lease Obligation |
| 211 | |
| 437 | |
| 326 | |
| 116 | |
| 1,090 | | |||||
Purchase Obligations (2)(3) |
| 5,234 | |
| 10,469 | |
| 10,133 | |
| - | |
| 25,836 | | |||||
Total |
| $ | 69,400 | |
| $ | 183,513 | |
| $ | 118,722 | |
| $ | 604,739 | |
| $ | 976,374 | |
(1) | Includes payments of principal (including amortization payments) and interest and excludes deferred costs. Also includes $550 and $9,049 in "Less than a 1 Year" and "1-3 Years", respectively, relating to Waverly Place Apartments which was sold subsequent to September 30, 2017. Assumes that the interest rate on the junior subordinated notes will be 3.31% per annum. |
(2) | Assumes that $734 will be paid annually for the next five years pursuant to the shared services agreement ( i.e., the same amount paid in 2017 pursuant to this agreement) and $1,200 will be paid annually through September 30, 2021, for the Services. See "Business-Our Structure." |
(3) | Assumes that approximately $3,300 of property management fees will be paid annually to the managers of our multi-family properties Such sum reflects the amount we anticipate paying in 2018 on the multi-family properties we own at September 30, 2017. These fees are typically charges based on a percentage of rental revenues from a property. No amount has been reflected as payable pursuant thereto after five years as such amount is not determinable. |
|
| Payment due by Period | ||||||||||||||||||
(Dollars in thousands) |
| Less than 1 Year |
| 1 - 3 Years |
| 3 - 5 Years |
| More than 5 Years |
| Total | ||||||||||
Mortgages on multi-family properties (1) |
| $ | 62,524 | |
| $ | 169,745 | |
| $ | 104,639 | |
| $ | 551,646 | |
| $ | 888,554 | |
Junior subordinated notes (2) |
| 1,238 | |
| 2,476 | |
| 2,476 | |
| 52,977 | |
| 59,167 | | |||||
Other |
| 193 | |
| 386 | |
| 1,148 | |
| - | |
| 1,727 | | |||||
Total |
| $ | 63,955 | |
| $ | 172,607 | |
| $ | 108,263 | |
| $ | 604,623 | |
| $ | 949,448 | |
___________________________
(1) | Includes payments of principal (including amortization payments) and interest and excludes deferred costs. . Also includes $550 and $9,049 in "Less than a 1 Year" and "1-3 Years", respectively, relating to Waverly Place Apartments which was sold subsequent to September 30, 2017 |
(2) | Assumes that the interest rate on the junior subordinated notes will be 3.31% per annum |
Liquidity and Capital Resources
We require funds to pay operating expenses and debt service obligations, acquire properties, make capital improvements and pay dividends. In 2017, our primary sources of capital and liquidity were the operations of our multi-family properties (including distributions from the joint ventures that own such properties), mortgage debt financings and refinancings (an aggregate of $155.2 million, of which $134.2 million was used to acquire seven multi-family properties), $31.6 million in equity contributions from our joint venture partners for acquisitions, $27.3 million representing our share of the gains from the sale of the 2017 Properties Sold, $13.6 million and $2.6 million from the repayment of principal and deferred interest respectively, on the loan to the Newark Joint Venture, and our available cash (including restricted cash). At September 30, 2017 and November 30, 2017, our available cash (excluding restricted cash) is approximately $12.4 million and $20.3 million, respectively.
We anticipate that our operating expenses in 2018 and 2019 will be funded from cash generated from the operations of our multi-family properties and that the $180.1 million of debt service (including $124.5 million of principal payments) payable from 2018 through 2019 will be funded from the cash generated from operations of these properties, the refinancing of mortgages and our share of the proceeds from the sales of our properties. (The mortgage debt with respect to these properties generally is non-recourse to us and our subsidiary holding our interest in the applicable joint venture). We anticipate that capital improvements at 15 multi-family properties will be funded by approximately $6.2 million of restricted cash available at September 30, 2017 and that capital improvements at other properties will be funded by the operations of such properties.
33
Table of Contents
Our ability to acquire additional multi-family properties is limited by our available cash and our ability to obtain on acceptable terms, equity contributions from joint venture partners and mortgage debt from lenders. Further, if and to the extent that our NOL becomes fully utilized and we have ordinary taxable income, we will be required to make distributions to stockholders to maintain our REIT status and as a result, will be limited in our ability to use gains from property sales as a source of funds for operating expenses, debt service and property acquisitions.
We anticipate that the construction and other costs associated with the West Nashville, TN development project will be funded by capital previously contributed by our joint venture partners and us and remaining in-place construction financing of up to $47.4 million.
Off Balance Sheet Arrangements
Not applicable.
Significant Accounting Estimates and Critical Accounting Policies
Our significant accounting policies are more fully described in Note 1 to our consolidated financial statements. The preparation of financial statements and related disclosure in conformity with accounting principles generally accepted in the United States requires management to make certain judgments and estimates that affect the amounts reported in the consolidated financial statements and accompanying notes. Certain of our accounting policies are particularly important to understand our financial position and results of operations and require the application of significant judgments and estimates by our management; as a result they are subject to a degree of uncertainty. These significant accounting policies include the following:
Principles of Consolidation
We have entered into, and may continue to enter into, various joint venture agreements with unrelated third parties to hold or develop real estate assets. We must determine for each of these joint ventures whether to consolidate the entity or account for our investment under the equity or cost basis of accounting. Investments acquired or created are continually evaluated based on the accounting guidance relating to variable interest entities ("VIEs"), which requires the consolidation of VIEs in which we are considered to be the primary beneficiary. If the investment is determined not to be a VIE, then the investment is evaluated for consolidation (primarily using a voting interest model) under the remaining consolidation guidance relating to real estate entities. If we are the manager of a limited liability company, we also consider the consolidation guidance relating to the rights of non-managing members to assess whether any rights held by such members overcome the presumption of control by us. We evaluate our accounting for investments on a quarterly basis or when a reconsideration event (as defined in GAAP) with respect to our investments occurs. The analysis required to identify VIEs and primary beneficiaries is complex and requires substantial management judgment.
Carrying Value of Real Estate Portfolio
We conduct a quarterly review of each real estate asset owned by us and our joint ventures. This review is conducted in order to determine if indicators of impairment are present on the real estate.
In reviewing the value of the real estate assets owned, whether by us or our joint ventures, if there is an indicator of impairment, we seek to arrive at the fair value of each real estate asset by using one or more valuation techniques, such as comparable sales, discounted cash flow analysis or replacement cost analysis. Our real estate assets and our joint ventures' real estate assets are evaluated for indicators of impairment. If the analysis suggests that the undiscounted cash flows to be generated by the property will be insufficient to recover the investment made by us or any joint venture, as the case may be, an impairment provision will be calculated based upon the excess of the carrying amount of the property over its fair value using a discounted cash flow model. Real estate assets are valued at the lower of the recorded cost or estimated fair value. Any impairment taken with respect to our real estate assets reduces our net income, assets and stockholders' equity to the extent of the amount of the allowance, but it will not affect our cash flow until such time as the property is sold. No such charges were taken in the past three years.
34
Table of Contents
Revenue Recognition
Rental revenue from residential properties is recorded when due from residents and is recognized monthly as it is earned. Rental payments are due in advance. Leases on residential properties are generally for terms that do not exceed one year.
Rental revenue from commercial properties, including the base rent that each tenant is required to pay in accordance with the terms of their respective leases, net of any rent concessions and lease incentives, is reported on a straight-line basis over the non-cancellable term of the lease.
Purchase Price Allocations
We allocate the purchase price of properties to net tangible and identified intangible assets acquired based on their fair values. In making estimates of fair values for purposes of allocating purchase price, we use a number of sources, including independent appraisals that may be obtained in connection with the acquisition or financing of the respective property, our own analysis of recently acquired and existing comparable properties in our portfolio and other market data. We also consider information obtained about each property as a result of its pre-acquisition due diligence, marketing and leasing activities in estimating the fair value of the tangible and intangible assets acquired.
Item 7A. Quantitative and Qualitative Disclosures About Market Risk.
Our junior subordinated notes bear interest at the rate of three month LIBOR plus 200 basis points. A 100 basis point increase in the rate would result in an increase in interest expense in 2018 of $374,000 and a 100 basis point decrease in the rate would result in a $374,000 decrease in interest expense in 2018.
With the exception of five mortgages (three of which are subject to interest rate swap agreements), all of our mortgage debt is fixed rate. For the variable rate debt not subject to interest rate swaps, an increase of 100 basis points in the interest rate would reduce income before taxes by approximately $585,000 and a decrease of 100 basis points in the interest rate would increase income before taxes by approximately $585,000.
As of September 30, 2017, we had three interest rate swap agreements outstanding. The fair value of our interest rate swaps is dependent upon existing market interest rates and swap spreads, which change over time. At September 30, 2017, if there had been an increase of 100 basis points in forward interest rates, the fair market value of the interest rate swaps would have increased by $3.3 million . If there had been a decrease of 100 basis points in forward interest rates, the fair market value of the interest rate swaps would decrease by $3.6 million. These changes would not have any material impact on our net income or cash.
Item 8. Financial Statements and Supplementary Data.
The information required by this item appears in a separate section of this Report following Part IV.
Item 9. Changes in and Disagreements with Accountants on Accounting and Financial Disclosure.
Not applicable.
Item 9A. Controls and Procedures.
Evaluation of Disclosure Controls and Procedures
A review and evaluation was performed by our management, including our Chief Executive Officer and Chief Financial Officer, of the effectiveness of the design and operation of our disclosure controls and procedures (as such term is defined in Rules 13a-15(e) and 15d-15(e) under the Securities Exchange Act of 1934, as amended (the "Exchange Act") as of the end of the period covered by this Annual Report on Form 10-K. Based on that review and evaluation, the CEO and CFO have concluded that our disclosure controls and procedures, as designed and implemented as of September 30, 2017, were effective.
Changes in Internal Controls over Financial Reporting
There have been no changes in our internal controls over financial reporting, as defined in in Rules 13a-15(f) and 15d-15(f) promulgated under the Exchange Act, that occurred during the three months ended September 30, 2017 that materially affected, or is reasonably likely to materially affect, our internal controls over financial reporting.
35
Table of Contents
Management's Report on Internal Control Over Financial Reporting
Our management is responsible for establishing and maintaining adequate internal control over financial reporting. Internal control over financial reporting is defined in Rules 13a-15(f) and 15d-15(f) promulgated under the Exchange Act as a process designed by, or under the supervision of, a company's principal executive and principal financial officers and effected by a company's board, management and other personnel to provide reasonable assurance regarding the reliability of financial reporting and the preparation of financial statements for external purposes in accordance with GAAP and includes those policies and procedures that:
• | pertain to the maintenance of records that in reasonable detail accurately and fairly reflect the transactions and dispositions of the assets of a company; |
• | provide reasonable assurance that transactions are recorded as necessary to permit preparation of financial statements in accordance with GAAP, and that receipts and expenditures of a company are being made only in accordance with authorizations of management and directors of a company; and |
• | provide reasonable assurance regarding prevention or timely detection of unauthorized acquisition, use or disposition of a company's assets that could have a material effect on the financial transactions. |
Because of its inherent limitations, internal control over financial reporting may not prevent or detect misstatements. Projections of any evaluation of effectiveness to future periods are subject to the risks that controls may become inadequate because of changes in conditions or that the degree of compliance with the policies or procedures may deteriorate.
Our management, with the participation of our Chief Executive Officer and Chief Financial Officer, assessed the effectiveness of our internal control over financial reporting as of September 30, 2017. In making this assessment, our management used criteria set forth by the Committee of Sponsoring Organizations of the Treadway Commission in Internal Control-Integrated Framework (2013).
Based on its assessment, our management concluded that, as of September 30, 2017, our internal control over financial reporting was effective based on those criteria.
Our independent auditors, BDO USA, LLP, have issued an audit report on the effectiveness of internal control over financial reporting. This report appears on page F-2 of this Annual Report on Form 10-K.
Item 9B. Other Information.
During the first quarter of 2018, our board of directors or committees thereof:
• | adopted, subject to stockholder approval, the 2018 Incentive Plan. This plan permits the Company to grant: (i) stock options, restricted stock, restricted stock units, performance shares awards and any one or more of the foregoing, up to a maximum of 600,000 shares; and (ii) cash settled dividend equivalent rights in tandem with the grant of restricted stock units and certain performance based awards. |
• | approved the payment of the following fees to these related parties for the performance of Services in calendar 2018: Israel Rosenzweig, $55,125; Fredric H. Gould, $210,000; Matthew J. Gould, $220,500; David W. Kalish, $210,000; Mark H. Lundy, $110,250; Isaac Kalish, $248,100; and Steven Rosenzweig, $213,950. |
See also "Item 7. Management's Discussion and Analysis of Financial Condition and Results of Operations - Recent Developments" for information regarding other developments in the first quarter of 2018.
36
Table of Contents
PART III
Item 10. Directors, Executive Officers and Corporate Governance.
Apart from certain information concerning our executive officers which is set forth below in Part I of this report, the other information required by Item 10 is incorporated herein by reference to the applicable information to be in the proxy statement to be filed by January 29, 2018 for our 2018 Annual Meeting of Stockholders.
Executive Officers of Registrant
Name |
| Age |
| Office |
Israel Rosenzweig (1) |
| 70 |
| Chairman of the Board of Directors |
Jeffrey A. Gould (2) |
| 52 |
| President and Chief Executive Officer; Director |
Mitchell K. Gould (3) |
| 45 |
| Executive Vice President |
Matthew J. Gould (2) |
| 58 |
| Senior Vice President; Director |
David W. Kalish (4) |
| 70 |
| Senior Vice President, Finance |
Mark H. Lundy |
| 55 |
| Senior Vice President and General Counsel |
George E. Zweier |
| 53 |
| Vice President and Chief Financial Officer |
Isaac Kalish (4) |
| 42 |
| Vice President and Treasurer |
Steven Rosenzweig (1) |
| 42 |
| Vice President |
(1) | Steven Rosenzweig is the son of Israel Rosenzweig. |
(2) | Jeffrey A. Gould and Matthew J. Gould are sons of Fredric H. Gould, the former chairman of our board of Directors and currently, a Director. |
(3) | Mitchell K. Gould is a cousin of Fredric H. Gould |
(4) | Isaac Kalish is the son of David W. Kalish. |
Mitchell K. Gould, has been employed by us since 1998, and has served as a Vice President since 1999 and Executive Vice President since 2007.
David W. Kalish, a certified public accountant, has been our Senior Vice President, Finance since 1998. Mr. Kalish was our Vice President and Chief Financial Officer from 1990 until 1998. He has been Chief Financial Officer of One Liberty Properties, Inc. and Georgetown Partners, Inc. since 1990. Georgetown Partners is the managing general partner of Gould Investors, a related party.
Mark H. Lundy, has been our General Counsel and/or Counsel since 2007, Senior Vice President since 2005 and from 1993 to 2005 he served as a Vice President. He served as a Vice President of One Liberty Properties from 2000 to 2006 and has been its Secretary and Senior Vice President since June 1993 and 2006, respectively. Since 2013, Mr. Lundy has served as President and Chief Operating Officer, and from 1990 through 2013 as a Vice President (including Senior Vice President), of Georgetown Partners, Inc. He is licensed to practice law in New York and Washington, D.C.
George E. Zweier, a certified public accountant, has served as our Chief Financial Officer and a Vice President since 1998.
Isaac Kalish, a certified public accountant, has been associated with us since 2004, served as Assistant Treasurer from 2007 through 2014 and as Vice President and Treasurer since 2013 and 2014, respectively. Mr. Kalish has served as Vice President and Assistant Treasurer of One Liberty Properties since 2013 and 2007, respectively, as Assistant Treasurer of Georgetown Partners, Inc. from 2012 through 2013, and as its Treasurer since 2013.
Steven Rosenzweig, has served as a Vice President since March 2015 and has been associated with us since 2013. For more than five years prior thereto, he was affiliated with Willkie Farr & Gallagher LLP. He is licensed to practice law in New York.
37
Table of Contents
Item 11. Executive Compensation.
The information concerning our executive compensation required by Item 11 will be included in the proxy statement to be filed by January 29, 2018 with respect to our 2018 Annual Meeting of Stockholders, and is incorporated herein by reference.
Item 12. Security Ownership of Certain Beneficial Owners and Management and Related Stockholder Matters.
Except as set forth below, the information required by Item 12 will be included in the proxy statement to be filed by January 29, 2018 with respect to to our 2018 Annual Meeting of Stockholders, and is incorporated herein by reference.
Equity Compensation Plan Information
| Number of securities to be issued upon exercise (or vesting) of outstanding options, restricted stock units, warrants and rights (a) |
| Weighted-average exercise price of outstanding options, warrants and rights (b) |
| Number of securities remaining available-for future issuance under equity compensation plans-excluding securities reflected in column(a) (c) |
Equity compensation plans approved by security holders | 450,000 | (1) | - |
| 2,500 |
Equity compensation plans not approved by security holders | - |
| - |
| - |
Total | 450,000 | (1) | - |
| 2,500 |
(1) | Reflects the number of shares of common stock underlying restricted stock units. Such units vest in 2021 subject to the satisfaction of time,market and performance based vesting conditions. There is no exercise price associated with such units. Does not include 147,500 shares of common stock subject to restricted stock awards that vest, subject to continued service requirements, in 2022. See note 12 of our consolidated financial statements. |
Item 13. Certain Relationships and Related Transactions, and Director Independence.
The information concerning relationships and certain transactions required by Item 13 will be included in the proxy statement to be filed by January 29, 2018 with respect to our 2018 Annual Meeting of Stockholders, and is incorporated herein by reference.
Item 14. Principal Accounting Fees and Services.
The information concerning our principal accounting fees required by Item 14 will be included in the proxy statement to be filed by January 29, 2018 with respect to our 2018 Annual Meeting of Stockholders, and is incorporated herein by reference.
38
Table of Contents
PART IV
Item 15. Exhibits, Financial Statement Schedules.
(a)
1. All Financial Statements.
The response is submitted in a separate section of this report following Part IV.
2. Financial Statement Schedules.
The response is submitted in a separate section of this report following Part IV.
3. Exhibits:
In reviewing the agreements included as exhibits to this Annual Report on Form10-K, please remember they are included to provide you with information regarding their terms and are not intended to provide any other factual or disclosure information about us or the other parties to the agreements. The agreements contain representations and warranties by each of the parties to the applicable agreement. These representations and warranties have been made solely for the benefit of the other parties to the applicable agreement and:
• | should not in all instances be treated as categorical statements of fact, but rather as a way of allocating the risk to one of the parties if those statements prove to be inaccurate; |
• | have been qualified by disclosures that were made to the other party in connection with the negotiation of the applicable agreement, which disclosures are not necessarily reflected in the agreement; |
• | may apply standards of materiality in a way that is different from what may be viewed as material to you or other investors; and |
• | were made only as of the date of the applicable agreement or such other date or dates as may be specified in the agreement and are subject to more recent developments. Accordingly, these representations and warranties may not describe the actual state of affairs as of the date they were made or at any other time. |
39
Table of Contents
Exhibit No. |
| Title of Exhibits |
|
|
|
2.1 |
| Plan of Conversion dated December 8, 2016 (incorporated by reference to Annex B of Amendment No. 1 to our Registration Statement on Form S-4 filed January 12, 2017 (the "S-4 Registration") (Reg. No. 333-215221). |
|
|
|
3.1 |
| Articles of Incorporation of the Registrant (incorporated by reference to Exhibit 3.1 to our Current Report on Form 8-K filed March 20, 2017). |
|
|
|
3.2 |
| By-laws of the Registrant (incorporated by reference to Exhibit 3.2 to our Current Report on Form 8-K filed March 20, 2017). |
|
|
|
4.1 |
| Junior Subordinated Supplemental Indenture, dated as of March 15, 2011, between us and the Bank of New York Mellon (incorporated by reference to Exhibit 4.1 to our Form 8-K filed March 18, 2011). |
|
|
|
10.1 | * | Amended and Restated Advisory Agreement, effective as of January 1, 2007, between us and REIT Management Corp. (incorporated by reference to Exhibit 10.1 to our Form 8-K filed November 27, 2006). |
|
|
|
10.2 | * | Amendment No. 1 dated as of December 8, 2011 to Amended and Restated Advisory Agreement between us and REIT Management (incorporated by reference to exhibit 10.2 to our Form 10-Q for the period ended December 31, 2011). |
|
|
|
10.3 | * | Amendment No. 2 dated as of March 12, 2014 and effective as of June 30, 2014 to Amended and Restated Advisory Agreement between us and REIT Management, as amended. (incorporated by reference to Exhibit 10.1 to our Form 10-Q for the period ended March 31, 2014) |
|
|
|
10.4 | * | Shared Services Agreement, dated as of January 1, 2002, by and among Gould Investors L.P., us, One Liberty Properties, Inc., Majestic Property Management Corp., Majestic Property Affiliates, Inc. and REIT Management Corp. (incorporated by reference to Exhibit 10.2 to our Form 10-K filed December 11, 2008). |
|
|
|
10.5 | * | Form of Indemnification Agreement |
|
|
|
|
|
|
10.6 | * | Form of Restricted Shares Agreement for the 2012 Incentive Plan (incorporated by reference to Exhibit 10.1 to our Form 10-Q for the period ended December 31, 2013). |
|
|
|
10.7 | * | 2012 Incentive Plan (incorporated by reference to exhibit 99.1 to our Registration Statement on Form S-8 filed on June 11, 2012 (File No. 333-182044)). |
|
|
|
10.8 | * | Amended and Restated 2016 Incentive Plan (incorporated by reference to exhibit 10.1 to our Quarterly Report on Form 10-Q for the period ended March 31, 2016). |
|
|
|
10.9 |
| Membership Interest Purchase Agreement dated as of February 23, 2016 entered into between TRB Newark Assemblage, LLC ("TRB") and TRB Newark TRS, LLC ("TRB REIT" and together with TRB, collectively, the "Seller") and RBH Partners III, LLC, and joined by RBH-TRB Newark Holdings, LLC and GS-RBH Newark Holdings, LLC (incorporated by reference to exhibit 10.2 to our Quarterly Report on Form 10-Q for the period ended March 31, 2016). |
|
|
|
10.10 | * | Form of Performance Awards Agreement (incorporated by reference to exhibit 10.1 to our Current Report on Form 8-K filed on June 10, 2016). |
|
|
|
10.11 |
| Form of Restricted Shares Agreement for the Amended and Restated 2016 Incentive Plan (incorporated by reference to Exhibit 10.40 to our S-4 Registration). |
40
Table of Contents
Exhibit No. |
| Title of Exhibits |
14.1 |
| Revised Code of Business Conduct and Ethics of BRT Realty Trust, adopted June 12, 2006 (incorporated by reference to Exhibit 14.1 to the Form 8-K of BRT Realty Trust filed June 14, 2006). |
|
|
|
21.1 |
| Subsidiaries of the Registrant. |
|
|
|
23.1 |
| Consent of BDO USA LLP. |
|
|
|
31.1 |
| Certification of Chief Executive Officer pursuant to Section 302 of the Sarbanes-Oxley Act of 2002 (the "Act"). |
|
|
|
31.2 |
| Certification of Senior Vice President-Finance pursuant to Section 302 of the Act. |
|
|
|
31.3 |
| Certification of Chief Financial Officer pursuant to Section 302 of the Act. |
|
|
|
32.1 |
| Certification of Chief Executive Officer pursuant to Section 906 of the Act. |
|
|
|
32.2 |
| Certification of Senior Vice President-Finance pursuant to Section 906 of the Act. |
|
|
|
32.3 |
| Certification of Chief Financial Officer pursuant to Section 906 of the Act. |
|
|
|
101.INS |
| XBRL Instance Document. |
|
|
|
101.SCH |
| XBRL Taxonomy Extension Schema Document. |
|
|
|
101.CAL |
| XBRL Taxonomy Extension Calculation Linkbase Document. |
|
|
|
101.DEF |
| XBRL Taxonomy Extension Definition Linkbase Document. |
|
|
|
101.LAB |
| XBRL Taxonomy Extension Definition Label Linkbase Document. |
|
|
|
101.PRE |
| XBRL Taxonomy Extension Presentation Linkbase Document. |
_______________________________________________________________________________
* | Indicates management contract or compensatory plan or arrangement. |
(b) Exhibits.
See Item 15(a)(3) above. Except as otherwise indicated with respect to a specific exhibit, the file number for all of the exhibits incorporated by reference is: 001-07172.
(c) Financial Statements.
See Item 15(a)(2) above.
Item 16. Form 10-K Summary
Not applicable.
41
Table of Contents
SIGNATURES
Pursuant to the requirements of Section 13 or 15(d) of the Securities Exchange Act of 1934, the Registrant has duly caused this report to be signed on its behalf by the undersigned thereunto duly authorized.
|
|
| BRT APARTMENTS CORP. |
Date: December 14, 2017 |
| By: | /s/ JEFFREY A. GOULD |
|
|
| Jeffrey A. Gould Chief Executive Officer and President |
Pursuant to the requirements of the Securities Exchange Act of 1934, this report has been signed below by the following persons on behalf of the Registrant and in the capacity and on the dates indicated.
Signature |
| Title |
| Date |
|
|
|
|
|
/s/ ISRAEL ROSENZWEIG |
| Chairman of the Board |
| December 14, 2017 |
Israel Rosenzweig |
|
|
|
|
|
|
|
|
|
/s/ JEFFREY A. GOULD |
| Chief Executive Officer, President and Director (Principal Executive Officer) |
| December 14, 2017 |
Jeffrey A. Gould |
|
|
|
|
|
|
|
|
|
/s/ ALAN GINSBURG |
| Director |
| December 14, 2017 |
Alan Ginsburg |
|
|
|
|
|
|
|
|
|
/s/ FREDRIC H. GOULD |
| Director |
| December 14, 2017 |
Fredric H. Gould |
|
|
|
|
|
|
|
|
|
/s/ MATTHEW J. GOULD |
| Director |
| December 14, 2017 |
Matthew J. Gould |
|
|
|
|
|
|
|
|
|
/s/ LOUIS C. GRASSI |
| Director |
| December 14, 2017 |
Louis C. Grassi |
|
|
|
|
/s/ GARY HURAND |
| Director |
| December 14, 2017 |
Gary Hurand |
|
|
|
|
|
|
|
|
|
/s/ JEFFREY RUBIN |
| Director |
| December 14, 2017 |
Jeffrey Rubin |
|
|
|
|
|
|
|
|
|
/s/ JONATHAN SIMON |
| Director |
| December 14, 2017 |
Jonathan Simon |
|
|
|
|
|
|
|
|
|
/s/ ELIE WEISS |
| Director |
| December 14, 2017 |
Elie Weiss |
|
|
|
|
|
|
|
|
|
/s/ GEORGE E. ZWEIER |
| Chief Financial Officer and Vice President (Principal Financial and Accounting Officer) |
| December 14, 2017 |
George E. Zweier |
|
|
|
|
42
Table of Contents
Index
Item 8, Item 15(a)(1) and (2)
Index to Consolidated Financial Statements and Consolidated Financial Statement Schedules
| Page No. | |
Reports of Independent Registered Public Accounting Firm |
| F- 2 |
Consolidated Balance Sheets as of September 30, 2017 and 2016 |
| F- 4 |
Consolidated Statements of Operations for the years ended September 30, 2017, 2016 and 2015 |
| F- 5 |
Consolidated Statements of Comprehensive Income (Loss) for the years ended September 30, 2017, 2016 and 2015 |
| F- 6 |
Consolidated Statements of Stockholders' Equity for the years ended September 30, 2017, 2016 and 2015 |
| F- 7 |
Consolidated Statements of Cash Flows for the years ended September 30, 2017, 2016 and 2015 |
| F- 8 |
Notes to Consolidated Financial Statements |
| F- 10 |
Consolidated Financial Statement Schedule for the year ended September 30, 2017: |
|
|
III-Real Estate Properties and Accumulated Depreciation |
| F- 35 |
All other schedules are omitted because they are not applicable or the required information is shown in the consolidated financial statements or the notes thereto.
F- 1
Table of Contents
Index
REPORT OF INDEPENDENT REGISTERED PUBLIC ACCOUNTING FIRM
Board of Directors and Stockholders
BRT Apartments Corp. and Subsidiaries
Great Neck, New York
We have audited the accompanying consolidated balance sheets of BRT Apartments Corp. and Subsidiaries as of September 30, 2017 and 2016 and the related consolidated statements of operations and comprehensive (loss) income, stockholders' equity, and cash flows for each of the three years in the period ended September 30, 2017 . In connection with our audits of the financial statements, we have also audited the financial statement schedules listed in the accompanying index. These financial statements and schedules are the responsibility of BRT Apartments Corp. and Subsidiaries management. Our responsibility is to express an opinion on these financial statements and schedules based on our audits.
We conducted our audits in accordance with the standards of the Public Company Accounting Oversight Board (United States). Those standards require that we plan and perform the audit to obtain reasonable assurance about whether the financial statements are free of material misstatement. An audit includes examining, on a test basis, evidence supporting the amounts and disclosures in the financial statements, assessing the accounting principles used and significant estimates made by management, as well as evaluating the overall presentation of the financial statements and schedules. We believe that our audits provide a reasonable basis for our opinion.
In our opinion, the consolidated financial statements referred to above present fairly, in all material respects, the financial position of BRT Apartments Corp. and Subsidiaries at September 30, 2017 and 2016, and the results of its operations and its cash flows for each of the three years in the period ended September 30, 2017 , in conformity with accounting principles generally accepted in the United States of America.
Also, in our opinion, the financial statement schedules, when considered in relation to the basic consolidated financial statements taken as a whole, present fairly, in all material respects, the information set forth therein.
We also have audited, in accordance with the standards of the Public Company Accounting Oversight Board (United States), BRT Apartments Corp. and Subsidiaries internal control over financial reporting as of September 30, 2017 , based on criteria established in Internal Control - Integrated Framewor k (2013) issued by the Committee of Sponsoring Organizations of the Treadway Commission (COSO) and our report dated December 14, 2017 expressed an unqualified opinion thereon.
/s/ BDO USA LLP
New York, New York
December 14, 2017
F- 2
Table of Contents
Index
REPORT OF INDEPENDENT REGISTERED PUBLIC ACCOUNTING FIRM
Board of Directors and Stockholders
BRT Apartments Corp. and Subsidiaries
Great Neck, New York
We have audited BRT Apartments Corp. and Subsidiaries internal control over financial reporting as of September 30, 2017, based on criteria established in Internal Control - Integrated Framework (2013) issued by the Committee of Sponsoring Organizations of the Treadway Commission (the COSO criteria). BRT Apartments Corp. and Subsidiaries' management is responsible for maintaining effective internal control over financial reporting and for its assessment of the effectiveness of internal control over financial reporting, included in the accompanying Item 9A, Management's Report on Internal Control Over Financial Reporting. Our responsibility is to express an opinion on BRT Apartments Corp. and Subsidiaries' internal control over financial reporting based on our audit.
We conducted our audit in accordance with the standards of the Public Company Accounting Oversight Board (United States). Those standards require that we plan and perform the audit to obtain reasonable assurance about whether effective internal control over financial reporting was maintained in all material respects. Our audit included obtaining an understanding of internal control over financial reporting, assessing the risk that a material weakness exists, and testing and evaluating the design and operating effectiveness of internal control based on the assessed risk. Our audit also included performing such other procedures as we considered necessary in the circumstances. We believe that our audit provides a reasonable basis for our opinion.
A company's internal control over financial reporting is a process designed to provide reasonable assurance regarding the reliability of financial reporting and the preparation of financial statements for external purposes in accordance with generally accepted accounting principles. A company's internal control over financial reporting includes those policies and procedures that (1) pertain to the maintenance of records that, in reasonable detail, accurately and fairly reflect the transactions and dispositions of the assets of the company; (2) provide reasonable assurance that transactions are recorded as necessary to permit preparation of financial statements in accordance with generally accepted accounting principles, and that receipts and expenditures of the company are being made only in accordance with authorizations of management and directors of the company; and (3) provide reasonable assurance regarding prevention or timely detection of unauthorized acquisition, use, or disposition of the company's assets that could have a material effect on the financial statements.
Because of its inherent limitations, internal control over financial reporting may not prevent or detect misstatements. Also, projections of any evaluation of effectiveness to future periods are subject to the risk that controls may become inadequate because of changes in conditions, or that the degree of compliance with the policies or procedures may deteriorate.
In our opinion, BRT Apartments Corp. and Subsidiaries maintained, in all material respects, effective internal control over financial reporting as of September 30, 2017, based on the COSO criteria .
We also have audited, in accordance with the standards of the Public Company Accounting Oversight Board (United States), the consolidated balance sheets of BRT Apartments Corp. and Subsidiaries as of September 30, 2017 and 2016, and the related consolidated statements of operations and comprehensive (loss) income, stockholders' equity, and cash flows for each of the three years in the period ended September 30, 2017 and our report dated December 14, 2017, expressed an unqualified opinion thereon.
/s/ BDO USA LLP
New York, New York
December 14, 2017
F- 3
Table of Contents
Index
BRT APARTMENTS CORP. AND SUBSIDIARIES
CONSOLIDATED BALANCE SHEETS
(Dollars in thousands, except share data)
|
| September 30, | ||||||
|
| 2017 |
| 2016 | ||||
ASSETS |
|
| |
|
| | ||
Real estate properties, net of accumulated depreciation of $64,290 and $41,995 |
| $ | 902,281 | |
| $ | 759,576 | |
Real estate loan |
| 5,500 | |
| 19,500 | | ||
Cash and cash equivalents |
| 12,383 | |
| 27,399 | | ||
Restricted cash |
| 6,151 | |
| 7,383 | | ||
Deposits and escrows |
| 27,839 | |
| 18,972 | | ||
Investment in unconsolidated joint ventures |
| 21,415 | |
| 298 | | ||
Other assets |
| 9,359 | |
| 7,775 | | ||
Real estate properties held for sale |
| 8,969 | |
| 33,996 | | ||
Total Assets (a) |
| $ | 993,897 | |
| $ | 874,899 | |
LIABILITIES AND EQUITY |
|
|
|
| | |||
Liabilities: |
|
|
|
| | |||
Mortgages payable, net of deferred costs of $6,345 and $5,873 |
| $ | 697,826 | |
| $ | 588,457 | |
Junior subordinated notes, net of deferred costs of $382 and $402 |
| 37,018 | |
| 36,998 | | ||
Accounts payable and accrued liabilities |
| 22,348 | |
| 20,716 | | ||
Mortgage payable held for sale |
| - | |
| 27,052 | | ||
Total Liabilities (a) |
| 757,192 | |
| 673,223 | | ||
Commitments and contingencies |
| - | |
| - | | ||
Equity: |
|
|
|
| ||||
BRT Apartments Corp. stockholders' equity: |
|
|
|
| | |||
Preferred shares, $.01 and $1 par value: |
|
|
|
| | |||
Authorized 2,000 and 10,000 shares, none issued |
| - | |
| - | | ||
Common stock, $.01 par value, 300,000 shares authorized, |
|
|
|
| ||||
13,333 shares issued at September 30, 2017 |
| 133 | |
| - | | ||
Shares of beneficial interest, $3 par value, number of shares authorized, |
|
|
|
| | |||
unlimited; 13,232 issued at September 30, 2016 |
| - | |
| 39,696 | | ||
Additional paid-in capital |
| 201,910 | |
| 161,321 | | ||
Accumulated other comprehensive income (loss) |
| 1,000 | |
| (1,602 | ) | ||
Accumulated deficit |
| (37,047 | ) |
| (48,125 | ) | ||
Total BRT Apartments Corp. stockholders' equity |
| 165,996 | |
| 151,290 | | ||
Non-controlling interests |
| 70,709 | |
| 50,386 | | ||
Total Equity |
| 236,705 | |
| 201,676 | | ||
Total Liabilities and Equity |
| $ | 993,897 | |
| $ | 874,899 | |
(a) | The Company's consolidated balance sheets include the assets and liabilities of consolidated variable interest entities (VIEs). See note 4. The consolidated balance sheets include the following amounts related to the Company's VIEs as of September 30, 2017 and 2016, respectively: $707,546 and $686,101 of real estate properties, $8,626 and $11,855 of cash and cash equivalents, $13,873 and $ 19,505 of deposits and escrows, $8,148 and $3,584 of other assets, $8,969 and $33,996 of real estate properties held for sale, $558,568 and $ 535,602 of mortgages payable, $14,419 and $17,893 of accounts payable and accrued liabilities and $0 and $27,052 of mortgage payable held for sale. |
See accompanying notes to consolidated financial statements.
F- 4
Table of Contents
Index
BRT APARTMENTS CORP. AND SUBSIDIARIES
CONSOLIDATED STATEMENTS OF OPERATIONS
(Dollars in thousands, except share data)
|
| Year Ended September 30, | ||||||||||
|
| 2017 |
| 2016 |
| 2015 | ||||||
Revenues: |
|
| |
|
| |
|
| | |||
Rental and other revenue from real estate properties |
| $ | 104,477 | |
| $ | 95,202 | |
| $ | 81,026 | |
Other income |
| 1,294 | |
| 3,319 | |
| 72 | | |||
Total revenues |
| 105,771 | |
| 98,521 | |
| 81,098 | | |||
Expenses: |
|
| |
|
| |
|
| | |||
Real estate operating expenses-including $2,725, $1,950 and $1,233 to related parties |
| 51,279 | |
| 47,519 | |
| 42,612 | | |||
Interest expense |
| 28,171 | |
| 23,878 | |
| 19,297 | | |||
Advisor's fees, related party |
| - | |
| 693 | |
| 2,448 | | |||
Property acquisition costs-including $0, $2,221 and $1,293 to related parties |
| - | |
| 3,852 | |
| 1,885 | | |||
General and administrative-including $346, $157 and $171 to related party |
| 9,396 | |
| 8,536 | |
| 6,683 | | |||
Depreciation |
| 30,491 | |
| 23,180 | |
| 18,454 | | |||
Total expenses |
| 119,337 | |
| 107,658 | |
| 91,379 | | |||
Total revenues less total expenses |
| (13,566 | ) |
| (9,137 | ) |
| (10,281 | ) | |||
Equity in loss of unconsolidated joint ventures |
| (384 | ) |
| - | |
| - | | |||
Gain on sale of real estate |
| 52,601 | |
| 46,477 | |
| 15,005 | | |||
Gain on sale of partnership interest |
| - | |
| 386 | |
| - | | |||
Loss on extinguishment of debt |
| (1,463 | ) |
| (4,547 | ) |
| - | | |||
Income from continuing operations |
| 37,188 | |
| 33,179 | |
| 4,724 | | |||
Provision for taxes |
| 1,560 | |
| 700 | |
| - | | |||
Income from continuing operations, net of taxes |
| 35,628 | |
| 32,479 | |
| 4,724 | | |||
Discontinued operations: |
|
| |
|
| |
|
| | |||
Loss from discontinued operations |
| - | |
| (2,788 | ) |
| (6,329 | ) | |||
Gain on sale of partnership interest |
| - | |
| 15,467 | |
| - | | |||
Income (loss) from discontinued operations |
| - | |
| 12,679 | |
| (6,329 | ) | |||
Net income (loss) |
| 35,628 | |
| 45,158 | |
| (1,605 | ) | |||
(Income) attributable to non-controlling interests |
| (22,028 | ) |
| (13,869 | ) |
| (783 | ) | |||
Net income (loss) attributable to common stockholders |
| $ | 13,600 | |
| $ | 31,289 | |
| $ | (2,388 | ) |
|
|
|
|
|
|
| ||||||
Basic and diluted per share amounts attributable to common stockholders: |
|
| |
|
| |
|
| | |||
Income (loss) from continuing operations |
| $ | 0.97 | |
| $ | 1.21 | |
| $ | (0.02 | ) |
Income (loss) from discontinued operations |
| - | |
| 1.02 | |
| (0.15 | ) | |||
Basic and diluted earnings (loss) per share |
| $ | 0.97 | |
| $ | 2.23 | |
| $ | (0.17 | ) |
|
|
|
|
|
|
| ||||||
Amounts attributable to BRT Apartments Corp.: |
|
| |
|
| |
|
| | |||
Income (loss) from continuing operations |
| $ | 13,600 | |
| $ | 16,950 | |
| $ | (246 | ) |
Income (loss) from discontinued operations |
| - | |
| 14,339 | |
| (2,142 | ) | |||
Net income (loss) attributable to common stockholders |
| $ | 13,600 | |
| $ | 31,289 | |
| $ | (2,388 | ) |
|
|
|
|
|
|
| ||||||
Weighted average number of shares of common stock outstanding: |
|
| |
|
| |
|
| | |||
Basic |
| 13,993,638 | |
| 14,017,279 | |
| 14,133,352 | | |||
Diluted |
| 14,018,843 | |
| 14,017,279 | |
| 14,133,352 | | |||
See accompanying notes to consolidated financial statements.
F- 5
Table of Contents
Index
BRT REALTY TRUST AND SUBSIDIARIES
CONSOLIDATED STATEMENTS OF COMPREHENSIVE INCOME (LOSS)
(Dollars in thousands)
| Year Ended September 30, | |||||||||||
|
| 2017 |
| 2016 |
| 2015 | ||||||
Net income (loss) |
| $ | 35,628 | |
| $ | 45,158 | |
| $ | (1,605 | ) |
Other comprehensive income (loss): |
|
|
|
| |
|
| | ||||
Unrealized gain (loss) on derivative instruments |
| 3,047 | |
| (1,544 | ) |
| (50 | ) | |||
Other comprehensive income (loss) |
| 3,047 | |
| (1,544 | ) |
| (50 | ) | |||
Comprehensive income (loss) |
| 38,675 | |
| 43,614 | |
| (1,655 | ) | |||
Comprehensive (income) attributable to non-controlling interests |
| (22,473 | ) |
| (13,392 | ) |
| (776 | ) | |||
Comprehensive income (loss) attributable to common stockholders |
| $ | 16,202 | |
| $ | 30,222 | |
| $ | (2,431 | ) |
See accompanying notes to consolidated financial statements.
F- 6
Table of Contents
Index
BRT APARTMENTS CORP. AND SUBSIDIARIES
CONSOLIDATED STATEMENTS OF STOCKHOLDERS' EQUITY
Years Ended September 30, 2017, 2016 and 2015
(Dollars in thousands, except share data)
| Shares of Beneficial Interest |
| Shares of Common Stock |
| Additional Paid-In Capital |
| Accumulated Other Comprehensive Income (Loss) |
| (Accumulated Deficit) |
| Non Controlling Interests |
| Total | ||||||||||||||||
Balances, September 30, 2014 | $ | 40,965 | |
| $ | - | |
| $ | 166,209 | |
| $ | (8 | ) |
| $ | (77,026 | ) |
| $ | 38,499 | |
| $ | 168,639 | | ||
Restricted stock vesting | 355 | |
| - | |
| (355 | ) |
| - | |
| - | |
| - | |
| - | | |||||||||
Compensation expense-restricted stock | - | |
| - | |
| 906 | |
| - | |
| - | |
| - | |
| 906 | | |||||||||
Contributions from non-controlling interests | - | |
| - | |
| - | |
| - | |
| - | |
| 11,973 | |
| 11,973 | | |||||||||
Distributions to non-controlling interests | - | |
| - | |
| - | |
| - | |
| - | |
| (12,588 | ) |
| (12,588 | ) | |||||||||
Purchase of non- controlling interests | - | |
| - | |
| (3,531 | ) |
| - | | - | | - | |
| (1,148 | ) |
| (4,679 | ) | ||||||||
Shares repurchased - 345,081 shares | (1,035 | ) |
| - | |
| (1,387 | ) |
| - | |
| - | |
| - | |
| (2,422 | ) | |||||||||
Net loss | - | |
| - | |
| - | |
| - | |
| (2,388 | ) |
| 783 | |
| (1,605 | ) | |||||||||
Other comprehensive loss | - | |
| - | |
| - | |
| (50 | ) |
| - | |
| - | |
| (50 | ) | |||||||||
Comprehensive loss | - | |
| - | |
| - | |
| - | |
| - | |
| - | |
| (1,655 | ) | |||||||||
Balances, September 30, 2015 | $ | 40,285 | |
| $ | - | |
| $ | 161,842 | |
| $ | (58 | ) |
| $ | (79,414 | ) |
| $ | 37,519 | |
| $ | 160,174 | | ||
Restricted stock vesting | 390 | |
| - | |
| (390 | ) |
| - | |
| - | |
| - | |
| - | | |||||||||
Compensation expense-restricted stock and restricted stock units | - | |
| - | |
| 1,005 | |
| - | |
| - | |
| - | |
| 1,005 | | |||||||||
Contributions from non-controlling interests | - | |
| - | |
| - | |
| - | |
| - | |
| 33,613 | |
| 33,613 | | |||||||||
Distributions to non-controlling interests | - | |
| - | |
| - | |
| - | |
| - | |
| (32,825 | ) |
| (32,825 | ) | |||||||||
Deconsolidation of joint venture upon sale | - | | - | | - | |
| - | |
| - | |
| - | |
| (1,790 | ) |
| (1,790 | ) | ||||||||
Shares repurchased - 326,421 shares | (979 | ) |
| - | |
| (1,136 | ) |
| - | |
| - | |
|
|
| (2,115 | ) | ||||||||||
Net income | - | |
| - | |
| - | |
| - | |
| 31,289 | |
| 13,869 | |
| 45,158 | | |||||||||
Other comprehensive loss | - | |
| - | |
| - | |
| (1,544 | ) |
| - | |
| - | |
| (1,544 | ) | |||||||||
Comprehensive income | - | |
| - | |
| - | |
| - | |
| - | |
| - | |
| 43,614 | | |||||||||
Balances, September 30, 2016 | $ | 39,696 | |
| $ | - | |
| $ | 161,321 | |
| $ | (1,602 | ) |
| $ | (48,125 | ) |
| $ | 50,386 | |
| $ | 201,676 | | ||
Distributions - Common Stock - $0.18 per share | - | | - | | - | |
| - | |
| - | |
| (2,522 | ) |
| - | |
| (2,522 | ) | ||||||||
Restricted stock vesting | 375 | |
| - | |
| (375 | ) |
| - | |
| - | |
| - | |
| - | | |||||||||
Compensation expense-restricted stock and restricted stock units | - | |
| - | |
| 1,219 | |
| - | |
| - | |
| - | |
| 1,219 | | |||||||||
Contributions from non-controlling interests | - | |
| - | |
| - | |
| - | |
| - | |
| 31,606 | |
| 31,606 | | |||||||||
Distributions to non-controlling interests | - | |
| - | |
| - | |
| - | |
| - | |
| (33,756 | ) |
| (33,756 | ) | |||||||||
Shares repurchased - 23,897 shares | (17 | ) |
| (1 | ) |
| (175 | ) |
| - | |
| - | |
| - | |
| (193 | ) | |||||||||
Conversion to a Maryland corporation at $.01 par value | (40,054 | ) |
| 134 | |
| 39,920 | |
| - | |
| - | |
| - | |
| - | | |||||||||
Net income | - | |
| - | |
| - | |
| - | |
| 13,600 | |
| 22,028 | |
| 35,628 | | |||||||||
Other comprehensive income | - | |
| - | |
| - | |
| 2,602 | |
| - | |
| 445 | |
| 3,047 | | |||||||||
Comprehensive income | - | |
| - | |
| - | |
| - | |
| - | |
| - | |
| 38,675 | | |||||||||
Balances, September 30, 2017 | $ | - | |
| $ | 133 | |
| $ | 201,910 | |
| $ | 1,000 | |
| $ | (37,047 | ) |
| $ | 70,709 | |
| $ | 236,705 | | ||
See accompanying notes to consolidated financial statements
F- 7
Table of Contents
Index
BRT APARTMENTS CORP. AND SUBSIDIARIES
CONSOLIDATED STATEMENTS OF CASH FLOWS
(Dollars in Thousands)
|
| Year Ended September 30, | ||||||||||
|
| 2017 |
| 2016 |
| 2015 | ||||||
Cash flows from operating activities: |
|
|
|
| |
|
| | ||||
Net income (loss) |
| $ | 35,628 | |
| $ | 45,158 | |
| $ | (1,605 | ) |
Adjustments to reconcile net income (loss) to net cash provided by operating activities: |
|
|
|
| |
|
| | ||||
Depreciation and amortization |
| 31,754 | |
| 25,994 | |
| 22,957 | | |||
Amortization of restricted stock |
| 1,219 | |
| 1,005 | |
| 906 | | |||
Equity in (loss) of unconsolidated subsidiaries |
| 384 | |
| - | |
| - | | |||
Gain on sale of partnership interests |
| - | |
| (15,853 | ) |
| - | | |||
Gain on sale of real estate assets |
| (52,601 | ) |
| (46,477 | ) |
| (15,005 | ) | |||
Loss on extinguishment of debt |
| 1,463 | |
| 4,547 | |
| - | | |||
Effect of deconsolidation of non-controlling interest |
| - | |
| (1,692 | ) |
| - | | |||
Increases and decreases from changes in other assets and liabilities: |
| | |
|
| |
|
| | |||
Decrease (increase) in interest and dividends receivable |
| 2,328 | |
| (2,380 | ) |
| 17 | | |||
Increase in deposits and escrows |
| (8,867 | ) |
| (6,190 | ) |
| (602 | ) | |||
Increase in accounts payable and accrued liabilities |
| 698 | |
| 4,897 | |
| 1,739 | | |||
Decrease in other assets |
| 1,085 | |
| 1,071 | |
| - | | |||
Net cash provided by operating activities |
| 13,091 | |
| 10,080 | |
| 8,407 | | |||
Cash flows from investing activities: |
|
|
|
| |
|
| | ||||
Collections from real estate loans |
| 14,000 | |
| - | |
| 2,000 | | |||
Additions to real estate properties |
| (228,354 | ) |
| (302,628 | ) |
| (84,295 | ) | |||
Net costs capitalized to real estate owned |
| (9,298 | ) |
| (46,844 | ) |
| (59,407 | ) | |||
Net change in restricted cash-Newark |
| - | |
| (1,952 | ) |
| 9,558 | | |||
Net change in restricted cash-multi-family |
| 1,232 | |
| (865 | ) |
| 3,037 | | |||
Purchase of non controlling interest |
| - | |
| - | |
| (4,679 | ) | |||
Proceeds from the sale of real estate owned |
| 167,013 | |
| 197,264 | |
| 66,398 | | |||
Distributions from unconsolidated joint ventures |
| 424 | |
| - | |
| - | | |||
Contributions to unconsolidated joint ventures |
| (21,894 | ) |
| - | |
| - | | |||
Proceeds from the sale of joint venture interests |
| - | |
| 19,242 | |
| - | | |||
Net cash used in investing activities |
| (76,877 | ) |
| (135,783 | ) |
| (67,388 | ) | |||
Cash flows from financing activities: |
|
|
|
| |
|
| | ||||
Proceeds from mortgages payable |
| 155,172 | |
| 267,788 | |
| 98,907 | | |||
Increase in other borrowed funds |
| - | |
| 6,001 | |
| - | | |||
Mortgage payoffs |
| (96,322 | ) |
| (130,090 | ) |
| (37,504 | ) | |||
Mortgage principal payments |
| (5,163 | ) |
| (5,081 | ) |
| (3,252 | ) | |||
Increase in deferred borrowing costs |
| (2,574 | ) |
| (2,491 | ) |
| (3,758 | ) | |||
Capital contributions from non-controlling interests |
| 31,606 | |
| 33,613 | |
| 11,973 | | |||
Capital distributions to non-controlling interests |
| (33,756 | ) |
| (32,825 | ) |
| (12,588 | ) | |||
F- 8
Table of Contents
Index
Proceeds from sale of New Markets Tax Credits |
| - | |
| 2,746 | |
| - | | |||
Repurchase of shares of common stock |
| (193 | ) |
| (2,115 | ) |
| (2,422 | ) | |||
Net cash provided by financing activities |
| 48,770 | |
| 137,546 | |
| 51,356 | | |||
Net (decrease) increase in cash and cash equivalents |
| (15,016 | ) |
| 11,843 | |
| (7,625 | ) | |||
Cash and cash equivalents at beginning of year |
| 27,399 | |
| 15,556 | |
| 23,181 | | |||
Cash and cash equivalents at end of year |
| $ | 12,383 | |
| $ | 27,399 | |
| $ | 15,556 | |
Supplemental disclosures of cash flow information: |
|
|
|
| |
|
| | ||||
Cash paid during the year for interest expense, including capitalized interest of $263, $1,568 and $2,602 in 2017, 2016 and 2015 |
| $ | 27,135 | |
| $ | 27,680 | |
| $ | 24,324 | |
Cash paid during the year for income and excise taxes |
| $ | 1,884 | |
| $ | 1,264 | |
| $ | 131 | |
Acquisition of real estate through assumption of debt |
| $ | 27,638 | |
| $ | 16,051 | |
| $ | 45,129 | |
Assets removed due to casualty loss |
| $ | 3,571 | |
| $ | - | |
| $ | - | |
See accompanying notes to consolidated financial statements.
F- 9
Table of Contents
Index
BRT APARTMENTS CORP. AND SUBSIDIARIES
Notes to Consolidated Financial Statements (Continued)
September 30, 2017
NOTE 1-ORGANIZATION, BACKGROUND AND SIGNIFICANT ACCOUNTING POLICIES
Organization and Background
BRT Apartments Corp. ("BRT" or the "Company") is the successor to BRT Realty Trust pursuant to the conversion of BRT Realty Trust from a Massachusetts business trust to a Maryland corporation on March 18, 2017. BRT owns, operates and develops multi‑family properties and owns and operates other assets, including real estate and a real estate loan.
Generally, the multi‑family properties are acquired with venture partners in transactions in which the Company contributes 70% to 80% of the equity. At September 30, 2017 , the Company owns 33 multi-family properties with 9,568 units located in 11 states (including 402 units at a property under development). At September 30, 2017 , the net book value of the multi-family assets (including real estate assets held for sale), was $900,746,000 .
The Company also owns and operates various other real estate assets. At September 30, 2017 , the net book value of the other real estate assets was $16,004,000 , including a real estate loan of $5,500,000 .
BRT conducts its operations to qualify as a real estate investment trust, or REIT, for Federal income tax purposes.
Principles of Consolidation
The consolidated financial statements include the accounts and operations of BRT Apartments Corp. , its wholly owned subsidiaries, and its majority owned or controlled entities and its interests in variable interest entities ("VIEs") in which the Company has determined it is the primary beneficiary. Material intercompany balances and transactions have been eliminated.
The Company's consolidated joint ventures that own multi-family properties were determined to be VIEs because the voting rights of some equity investors are not proportional to their obligations to absorb the expected losses of the entity and their right to receive the expected residual returns. It was determined that the Company is the primary beneficiary of these joint ventures because it has a controlling financial interest in that it has the power to direct the activities of the VIE that most significantly impact the entity's economic performance and it has the obligation to absorb losses of the entity and the right to receive benefits from the entity that could potentially be significant to the VIE.
The joint ventures that own properties in Dallas, TX and St. Louis, MO were determined not to be VIE's but are consolidated because the Company has substantive participating rights in such entities.
With respect to its unconsolidated joint ventures, as (i) the Company is primarily the managing member but does not exercise substantial operating control over these entities or the Company is not the managing member and (ii) such entities are not VIEs, the Company determined that such joint ventures should be accounted for under the equity method of accounting for financial statement purposes.
Certain items on the consolidated financial statements for the prior years have been reclassified to conform with the current year's presentation, including the reclassification (i) of the operations and related assets of the Newark Joint Venture to discontinued operations, (ii) of deferred loan costs on the consolidated balance sheets from assets to a reduction of the carrying amount of mortgage payable and (iii) tenant utility reimbursements from real estate operating expenses to rental and other revenues from real estate properties. The reclassification of tenant utility reimbursements increased total revenues and expenses by $4,066,000 and $4,033,000 in 2016 and 2015, respectively, and had no effect on the Company's financial position, results of operation or cash flows.
Income Tax Status
The Company qualifies as a real estate investment trust under sections 856-860 of the Internal Revenue Code of 1986, as amended. The board of directors may, at its option, elect to revoke or terminate the Company's election to qualify as a real estate investment trust.
The Company will not be subject to federal, and generally state and local taxes on amounts it distributes to stockholders, provided it distributes 90% of its ordinary taxable income and meets other conditions. The Company currently has net operating loss carryforwards which it can use to reduce taxable income. Use of the net operating loss carryforward is subject to an alternative minimum tax.
F- 10
Table of Contents
Index
BRT APARTMENTS CORP. AND SUBSIDIARIES
Notes to Consolidated Financial Statements (Continued)
September 30, 2017
NOTE 1-ORGANIZATION, BACKGROUND AND SIGNIFICANT ACCOUNTING POLICIES (continued)
In accordance with Accounting Standards Codification ("ASC") Topic 740 - "Income Taxes", the Company believes that it has appropriate support for the income tax positions taken and, as such, does not have any uncertain tax positions that, if successfully challenged, could result in a material impact on the Company's financial position or results of operations. The Company's income tax returns for the previous six years are subject to review by the Internal Revenue Service.
Revenue Recognition
Rental revenue from multi-family properties is recorded when due from residents and is recognized monthly as it is earned. Rental payments are due in advance. Leases on residential properties are generally for terms that do not exceed one year.
Rental revenue from commercial properties, including the base rent that each tenant is required to pay in accordance with the terms of their respective leases, net of any rent concessions and lease incentives, is reported on a straight-line basis over the non-cancellable term of the lease.
Real Estate Properties
Real estate properties are stated at cost, net of accumulated depreciation, and include real property acquired through acquisition, development or foreclosure.
The Company assesses the fair value of real estate acquired (including land, buildings and improvements, and identified intangibles such as acquired in-place leases) and acquired liabilities and allocates the acquisition price, including transaction costs, based on these assessments. Depreciation for multi-family properties is computed on a straight-line basis over an estimated useful life of 30 years. Intangible assets (and liabilities) are amortized over the remaining life of the related leases at the time of acquisition and is usually less than one year. Expenditures for maintenance and repairs are charged to operations as incurred.
Real estate is classified as held for sale when management has determined that the applicable criteria have been met. Real estate assets that are expected to be disposed of are valued at the lower of their carrying amount or their fair value less costs to sell on an individual asset basis. Real estate classified as held for sale is not depreciated.
The Company accounts for the sale of real estate when title passes to the buyer, sufficient equity payments have been received, there is no continuing involvement by the Company and there is reasonable assurance that the remaining receivable, if any, will be collected.
Real Estate Asset Impairments
The Company reviews each real estate asset owned, including investments in real estate ventures, to determine if there are indicators of impairment. If such indicators are present, the Company determines whether the carrying amount of the asset can be recovered. Recognition of impairment is required if the undiscounted cash flows estimated to be generated by the asset are less than the asset's carrying amount and that carrying amount exceeds the estimated fair value of the asset. The estimated fair value is determined using a discounted cash flow model of the expected future cash flows through the useful life of the property. The analysis includes an estimate of the future cash flows that are expected to result from the real estate investment's use and eventual disposition. These cash flows consider factors such as expected future operating income, trends, the effects of leasing demands, and other factors. In evaluating a property for impairment, various factors are considered, including estimated current and expected operating cash flow from the property during the projected holding period, costs necessary to extend the life or improve the asset, expected capitalization rates, projected stabilized net operating income, selling costs, and the ability to hold and dispose of such real estate in the ordinary course of business. Valuation adjustments may be necessary in the event that effective interest rates, rent-up periods, future economic conditions, and other relevant factors vary significantly from those assumed in valuing the property. If future evaluations result in a decrease in the value of the property below its carrying value,
F- 11
Table of Contents
Index
BRT APARTMENTS CORP. AND SUBSIDIARIES
Notes to Consolidated Financial Statements (Continued)
September 30, 2017
NOTE 1-ORGANIZATION, BACKGROUND AND SIGNIFICANT ACCOUNTING POLICIES (continued)
the reduction will be recognized as an impairment charge. The fair values related to the impaired real estate assets are considered to be a level 3 valuation within the fair value hierarchy.
Fixed Asset Capitalization
A variety of costs may be incurred in the development of the Company's properties. After a determination is made to capitalize a cost, it is allocated to the specific project that is benefited. The costs of land and building under development include specifically identifiable costs. The capitalized costs include pre-construction costs essential to the development of the property, development costs, construction costs, interest costs, real estate taxes, and other costs incurred during the period of development. A construction project is considered substantially completed when it is available for occupancy, but no later than one year from cessation of major construction activity. The Company ceases capitalization when the project is available for occupancy.
Equity Based Compensation
Compensation expense for grants of restricted stock and restricted stock units ("RSUs") are amortized over the vesting period of such awards, based upon the estimated fair value of such award at the grant date. The deferred compensation related to the RSUs to be recognized as expense is net of certain and performance assumptions which are re-evaluated quarterly. For accounting purposes, the restricted shares are not included in the outstanding shares shown on the consolidated balance sheets until they vest; however, they are included in the calculation of both basic and diluted earnings per share as they participate in the earnings of the Company.
Derivatives and Hedging Activities
The Company's objective in using derivative financial instruments is to manage interest rate risk related to variable rate debt. The Company does not use derivatives for trading or speculative purposes. The Company records all derivatives on its consolidated balance sheets at fair value. The accounting for changes in the fair value of derivatives depends on the intended use of the derivative, whether the Company has elected to designate a derivative in a hedging relationship and apply hedge accounting and whether the hedging relationship has satisfied the criteria necessary to apply hedge accounting. Derivatives designated and qualifying as a hedge of the exposure to variability in expected future cash flows are considered cash flow hedges. For derivatives designated as cash flow hedges, the effective portion of changes in the fair value of the derivative is initially reported in accumulated other comprehensive income (loss) and subsequently reclassified to earnings in the period in which the hedge transaction affects earnings. The ineffective portion of changes in the fair value of the derivative is recognized directly in earnings. For derivatives not designated as cash flow hedges, changes in the fair value of the derivative are recognized directly in earnings in the period in which they occur.
Per Share Data
Basic earnings (loss) per share is determined by dividing net income (loss) applicable to holders of common stock for the applicable year by the weighted average number of shares of common stock outstanding during such year. Diluted earnings per share reflects the potential dilution that could occur if securities or other contracts to issue shares of common stock were exercised or converted into shares of common stock or resulted in the issuance of shares of common stock that share in the earnings of the Company. Diluted earnings (loss) per share is determined by dividing net income (loss) applicable to the holders of common stock for the applicable year by the sum of the weighted average number of shares of common stock outstanding plus the dilutive effect of the Company's unvested restricted stock units using the treasury stock method.
Cash Equivalents
Cash equivalents consist of highly liquid investments; primarily, direct United States treasury obligations with maturities of three months or less when purchased.
F- 12
Table of Contents
Index
BRT APARTMENTS CORP. AND SUBSIDIARIES
Notes to Consolidated Financial Statements (Continued)
September 30, 2017
NOTE 1-ORGANIZATION, BACKGROUND AND SIGNIFICANT ACCOUNTING POLICIES (continued)
Restricted Cash
Restricted cash consists of cash held for construction costs and property improvements for specific properties as may be required by contractual arrangements.
Deferred Costs
Fees and costs incurred in connection with multi-family property financings are deferred and amortized over the term of the related debt obligations. Fees and costs paid related to the successful negotiation of commercial leases are deferred and amortized on a straight-line basis over the terms of the respective leases.
Use of Estimates
The preparation of the financial statements in conformity with accounting principles generally accepted in the United States requires management to make estimates and assumptions that affect the amounts reported in the consolidated financial statements and accompanying notes. Actual results could differ from those estimates.
Segment Reporting
The Company operates in two reportable segments: (i) multi-family real estate; and (ii) other real estate assets. The multi-family real estate segment includes the ownership, operation and development of the Company's multi-family properties and the other real estate segment includes all activities related to the ownership, operation and disposition of the Company's other real estate assets.
New Pronouncements
In May 2014, the FASB issued Accounting Standards Update No. 2014-09, Revenue from Contracts with Customers (ASU 2014-09), prescribes a single, common revenue standards which supersedes nearly all existing revenue recognition guidance under U.S. GAAP, including most industry-specific requirements. The core principle of ASU 2014-09 is to recognize revenues when promised goods or services are transferred to customers in an amount that reflects the consideration to which an entity expects to be entitled for those goods or services. ASU 2014-09 outlines a five step model to achieve this core principle and, in doing so, more judgment and estimates may be required within the revenue recognition process than are required under existing U.S. GAAP. The standard is effective for annual periods beginning after December 15, 2017, and interim periods therein, using either of the following transition methods: (i) a full retrospective approach reflecting the application of the standard in each prior reporting period with the option to elect certain practical expedients, or (ii) a modified retrospective approach with the cumulative effect of initially adopting ASU 2014-09 recognized at the date of adoption (which includes additional footnote disclosures). We are currently evaluating the impact of our pending adoption of ASU 2014-09 on our consolidated financial statements and have not yet determined the method by which we will adopt the standard in 2018.
In April 2015, the Financial Accounting Standards Board ("FASB") issued Accounting Standards Update ("ASU") No. 2015-03 Interest - Imputation of Interest, which amends the balance sheet presentation for debt issuance costs. Under the amended guidance, a company will present unamortized debt issuance costs as a direct deduction from the carrying amount of that debt liability. The guidance is to be applied on a retrospective basis, and is effective for annual reporting periods beginning after December 15, 2015, with early adoption being permitted. The Company elected early adoption for the fiscal year ended September 30, 2017 , and its adoption did not have a material effect on its consolidated financial statements.
In February 2016, the FASB issued ASU No. 2016-02 , Leases. ASU 2016-02 supersedes the current accounting for leases and while retaining two distinct types of leases, finance and operating, (i) requires lessees to record a right of use asset and a related liability for the rights and obligations associated with a lease, regardless of lease classification, and recognize lease expense in a manner similar to current accounting (ii) eliminates most real estate specific lease provisions, and (iii) aligns many of the underlying lessor model principles with those in the new revenue standard. ASU 2016-02 is effective for fiscal years beginning after December 15, 2018 and early adoption is permitted. We are required to adopt ASU 2016-02 using the modified retrospective approach which requires us to record leases existing as of or are entered into after the beginning of the
F- 13
Table of Contents
Index
BRT APARTMENTS CORP. AND SUBSIDIARIES
Notes to Consolidated Financial Statements (Continued)
September 30, 2017
NOTE 1-ORGANIZATION, BACKGROUND AND SIGNIFICANT ACCOUNTING POLICIES (continued)
earliest comparative period presented in the financial statements under the new lease standard. We are currently evaluating the impact of our pending adoption of ASU No. 2016-02 on our consolidated financial statements. We believe our adoption of the new leasing standard will have an immaterial increase in the assets and liabilities on our consolidated balance sheets, with no material impact to our consolidated statements of income and comprehensive income.
In August 2016, the FASB issued ASU No. 2016-15, Statement of Cash Flows (Topic 230): Classification of Certain Cash Receipts and Cash Payments (a consensus of the Emerging Issues Task Force), which provides specific guidance on eight cash flow classification issues and how to reduce diversity in how certain cash receipts and cash payments are presented and classified in the statement of cash flows. The effective date of the standard will be fiscal years, and interim periods within those fiscal years, beginning after December 15, 2017, and early adoption is permitted. The Company is currently evaluating the new guidance to determine the impact, if any, on its consolidated financial statements.
In January 2017, the Financial Accounting Standards Board ("FASB") issued ASU 2017-01, Business Combinations (Topic 805): Clarifying the Definition of a Business. The ASU clarifies the definition of a business with the objective of adding guidance to assist companies and other reporting organizations with evaluating whether transactions should be accounted for as acquisitions (or disposals) of assets or business combinations. The ASU is effective for annual periods beginning after December 15, 2017, including interim periods within those periods. Early adoption is permitted. The Company elected early adoption effective for the quarter ended December 31, 2016. The Company's net income was favorably impacted as a result of the capitalization of acquisition costs - in prior periods, property acquisition costs were expensed during the period incurred. During the year ended September 30, 2017, capitalized acquisition costs were $3,364,000 , without giving effect to non-controlling interests.
NOTE 2-REAL ESTATE PROPERTIES
Real estate properties (including real estate properties held for sale), consist of the following:
|
| September 30, | ||||||
|
| 2017 |
| 2016 | ||||
Land |
| $ | 138,094 | |
| $ | 128,409 | |
Building |
| 808,366 | |
| 684,133 | | ||
Building improvements |
| 31,411 | |
| 25,717 | | ||
Real estate properties |
| 977,871 | |
| 838,259 | | ||
Accumulated depreciation |
| (66,621 | ) |
| (44,687 | ) | ||
Total real estate properties, net |
| $ | 911,250 | |
| $ | 793,572 | |
F- 14
Table of Contents
Index
BRT APARTMENTS CORP. AND SUBSIDIARIES
Notes to Consolidated Financial Statements (Continued)
September 30, 2017
NOTE 2-REAL ESTATE PROPERTIES (continued)
|
|
|
|
|
|
| Depreciation and |
| Sales |
| Other Dispositions |
|
| ||||||||||||||
Multi-family | $ | 783,085 | |
| $ | 255,992 | |
| $ | 9,173 | |
| $ | (30,379 | ) |
| $ | (113,552 | ) |
| $ | (3,571 | ) |
| $ | 900,748 | |
Land - Daytona, FL | 8,021 | |
| - | |
| - | |
| - | |
| - | |
| - | |
| 8,021 | | |||||||
Retail shopping center - Yonkers, NY | 2,466 | |
| - | |
| 125 | |
| (110 | ) |
| - | |
| - | |
| 2,481 | | |||||||
Total real estate properties | $ | 793,572 | |
| $ | 255,992 | |
| $ | 9,298 | |
| $ | (30,489 | ) |
| $ | (113,552 | ) |
| $ | (3,571 | ) |
| $ | 911,250 | |
Other dispositions set forth in the table above reflect the $ 3,571,000 reduction of the net book value of assets related to Retreat at Cinco Ranch, Katy, TX, which was damaged by Hurricane Harvey. The net book value was reduced due to damage to 96 ground floor units, the clubhouse, pool, landscaping and all HVAC units. The cost of repairing the damage is expected to be covered completely by insurance proceeds excluding a $100,000 deductible. Though the insurance claim has not been resolved, the Company believes it is probable that it will recover $3,471,000 and therefore has recognized such sum in insurance recoveries. Through December 12, 2017, the Company has received $1,100,000 in insurance proceeds.
The acquisitions completed in the year ended September 30, 2017 and described in note 3-Acquisitions, Dispositions and Impairment Charges, have been accounted for as asset acquisitions. The purchase prices were allocated to the acquired assets and assumed liabilities based on management's estimate of the relative fair value of these acquired assets and assumed liabilities at the dates of acquisition.
|
| Preliminary |
| Adjustments |
| Finalized | ||||||
|
|
|
|
|
|
| ||||||
Land |
| $ | 39,296 | |
| $ | (1,550 | ) |
| $ | 37,746 | |
Buildings and improvements |
| 299,327 | |
| 341 | |
| 299,668 | | |||
Acquisition-related intangible assets (in acquired lease intangibles, net) |
| 4,180 | |
| 1,209 | |
| 5,389 | | |||
Total consideration |
| $ | 342,803 | |
| $ | - | |
| $ | 342,803 | |
F- 15
Table of Contents
Index
BRT APARTMENTS CORP. AND SUBSIDIARIES
Notes to Consolidated Financial Statements (Continued)
September 30, 2017
NOTE 2-REAL ESTATE PROPERTIES (continued)
Location |
| Number of Properties at September 30, 2017 |
| Number of Units at September 30, 2017 |
| 2017 |
| % of 2017 | |||||
Texas |
| 9 | |
| 2,695 | |
| $ | 32,011 | |
| 31.1 | % |
Florida (a) |
| 4 | |
| 1,268 | |
| 15,339 | |
| 14.9 | % | |
Georgia |
| 4 | |
| 959 | |
| 11,842 | |
| 11.5 | % | |
Tennessee |
| 2 | |
| 702 | |
| 4,339 | |
| 4.2 | % | |
Alabama |
| 2 | |
| 826 | |
| 7,849 | |
| 7.6 | % | |
South Carolina |
| 3 | |
| 683 | |
| 6,305 | |
| 6.1 | % | |
Missouri |
| 4 | |
| 775 | |
| 7,694 | |
| 7.5 | % | |
Indiana |
| 1 | |
| 400 | |
| 3,418 | |
| 3.3 | % | |
Mississippi |
| 2 | |
| 776 | |
| 8,310 | |
| 8.1 | % | |
Ohio |
| 1 | |
| 264 | |
| 2,671 | |
| 2.6 | % | |
Virginia |
| 1 | |
| 220 | |
| 3,160 | |
| 3.1 | % | |
|
| 33 | |
| 9,568 | |
| $ | 102,938 | |
| 100 | % |
(a) | Includes Waverly Place Apartments - Melbourne, FL, which was sold on October 25, 2017. This property has 208 units and accounted for $2,567 of 2017 revenues. |
Year Ending September 30, |
| Amount | ||
2018 |
| $ | 1,119 | |
2019 |
| 1,119 | | |
2020 |
| 1,119 | | |
2021 |
| 1,132 | | |
2022 |
| 1,185 | | |
Thereafter |
| 4,500 | | |
Total |
| $ | 10,174 | |
Leases at the Company's multi-family properties are generally for a term of one year or less and are not reflected in the above table.
F- 16
Table of Contents
Index
BRT APARTMENTS CORP. AND SUBSIDIARIES
Notes to Consolidated Financial Statements (Continued)
September 30, 2017
NOTE 3-ACQUISITIONS, DISPOSITIONS AND IMPAIRMENT CHARGES
Property Acquisitions
The tables below provides information regarding the Company's purchases of multi-family properties during the years ended September 30, (dollars in thousands):
2017
Location |
| Purchase |
| No. of |
|
|
| Acquisition |
| Initial BRT |
| Ownership Percentage |
| Capitalized Property | ||||||||||
Fredricksburg, VA |
| 11/4/2016 |
| 220 | |
| $ | 38,490 | |
| $ | 29,900 | |
| $ | 8,720 | |
| 80 | % |
| $ | 643 | |
St. Louis, MO |
| 2/28/2017 |
| 128 | |
| 27,000 | |
| 20,000 | |
| 6,001 | |
| 76 | % |
| 423 | | ||||
St. Louis, MO |
| 2/28/2017 |
| 53 | |
| 8,000 | |
| 6,200 | |
| 2,002 | |
| 76 | % |
| 134 | | ||||
Creve Coeur, MO |
| 4/4/2017 |
| 174 | |
| 39,600 | |
| 29,000 | |
| 9,408 | |
| 78 | % |
| 569 | | ||||
West Nashville, TN (a) |
| 6/2/2017 |
| 402 | |
| 5,228 | |
| - | |
| 4,800 | |
| 58 | % |
| 226 | | ||||
Farmers Branch, TX |
| 6/29/2017 |
| 509 | |
| 85,698 | |
| 55,200 | |
| 16,200 | |
| 50 | % |
| 992 | | ||||
Tallahassee, FL |
| 8/30/2017 |
| 242 | |
| 27,588 | |
| 21,524 | |
| 7,015 | |
| 80 | % |
| 377 | | ||||
|
|
|
| 1,728 | |
| $ | 231,604 | |
| $ | 161,824 | |
| $ | 54,146 | |
|
|
| $ | 3,364 | | |
______________________
(a) | A development property. |
Location | Purchase |
| No. of |
|
|
| Acquisition |
| Initial BRT |
| Ownership Percentage |
| Property | ||||||||||
N. Charleston, SC (a) | 10/13/2015 |
| 271 | |
| $ | 3,625 | |
| - | |
| $ | 6,558 | |
| 65 | % |
| - | | ||
La Grange, GA | 11/18/2015 |
| 236 | |
| 22,800 | |
| $ | 16,051 | |
| 6,824 | |
| 100 | % |
| 57 | | |||
Katy, TX | 1/22/2016 |
| 268 | |
| 40,250 | |
| 30,750 | |
| 8,150 | |
| 75 | % |
| 382 | | ||||
Macon, GA | 2/1/2016 |
| 240 | |
| 14,525 | |
| 11,200 | |
| 3,250 | |
| 80 | % |
| 158 | | ||||
Southaven, MS | 2/29/2016 |
| 392 | |
| 35,000 | |
| 28,000 | |
| 5,856 | |
| 60 | % |
| 413 | | ||||
San Antonio, TX | 5/6/2016 |
| 288 | |
| 35,150 | |
| 26,400 | |
| 6,688 | |
| 65 | % |
| 539 | | ||||
Dallas, TX | 5/11/2016 |
| 494 | |
| 37,000 | |
| 27,938 | |
| 6,750 | |
| 50 | % |
| 567 | | ||||
Columbia, SC | 5/31/2016 |
| 204 | |
| 17,000 | |
| 12,934 | |
| 4,930 | |
| 80 | % |
| 302 | | ||||
Atlanta, GA | 8/15/2016 |
| 271 | |
| 39,125 | |
| 27,375 | |
| 10,769 | |
| 74 | % |
| 577 | | ||||
Southaven, MS | 9/1/2016 |
| 384 | |
| 38,205 | |
| 30,564 | |
| 6,060 | |
| 60 | % |
| 347 | | ||||
San Antonio, TX | 9/19/2016 |
| 288 | |
| 36,000 | |
| 27,000 | |
| 8,060 | |
| 72 | % |
| 510 | | ||||
|
|
| 3,336 | |
| $ | 318,680 | |
| $ | 238,212 | |
| $ | 73,895 | |
|
|
| $ | 3,852 | | |
________________________
(a) | A development property. |
F- 17
Table of Contents
Index
BRT APARTMENTS CORP. AND SUBSIDIARIES
Notes to Consolidated Financial Statements (Continued)
September 30, 2017
NOTE 3-ACQUISITIONS, DISPOSITIONS AND IMPAIRMENT CHARGES - (continued)
The table below provides information regarding the real estate properties acquired by the Company subsequent to September 30, 2017 (dollars in thousands):
Location | Purchase |
| No. of |
|
|
| Acquisition |
| Initial BRT |
| Ownership Percentage |
| Capitalized Property | ||||||||||
Madison, AL | 12/7/2017 |
| 204 | |
| $ | 18,420 | |
| $ | 15,000 | |
| $ | 4,456 | |
| 80 | % |
| $ | 174 | |
Property Dispositions
The tables below provide information regarding the Company's disposition of real estate properties during the years ended September 30, (dollars in thousands):
Location |
| Sale Date |
| No. of Units |
| Sales Price |
| Gain on Sale |
| Non-Controlling Partner's Share of Gain | |||||||
Greenville, NC |
| 10/19/2016 |
| 350 | |
| $ | 68,000 | |
| $ | 18,483 | |
| $ | 9,329 | |
Panama City, FL |
| 10/26/2016 |
| 160 | |
| 14,720 | |
| 7,393 | |
| 3,478 | | |||
Atlanta, GA |
| 11/21/2016 |
| 350 | |
| 36,750 | |
| 8,905 | |
| 4,166 | | |||
Hixson, TN |
| 11/30/2016 |
| 156 | |
| 10,775 | |
| 608 | |
| 152 | | |||
New York, NY |
| 12/21/2016 |
| 1 | |
| 465 | |
| 449 | |
| - | | |||
Humble, TX |
| 7/27/2017 |
| 260 | |
| 18,000 | |
| 7,707 | |
| 3,143 | | |||
Humble, TX |
| 7/27/2017 |
| 160 | |
| 11,300 | |
| 4,767 | |
| 1,943 | | |||
Pasadena, TX |
| 7/27/2017 |
| 144 | |
| 9,750 | |
| 4,289 | |
| 2,629 | | |||
|
|
|
| 1,581 | |
| $ | 169,760 | |
| $ | 52,601 | |
| $ | 24,840 | |
2016
Location | Sale Date |
| No. of Units |
| Sales Price |
| Gain on Sale |
| Non-Controlling Partner's Share of Gain | |||||||
Cordova, TN | 3/2/2016 |
| 464 | |
| $ | 31,100 | |
| $ | 6,731 | |
| $ | 2,195 | |
Kennesaw, GA | 3/15/2016 |
| 450 | |
| 64,000 | |
| 17,462 | |
| 10,037 | | |||
Pooler, GA | 4/6/2016 |
| 300 | |
| 38,500 | |
| 5,710 | |
| 1,405 | | |||
Collierville, TN | 6/1/2016 |
| 324 | |
| 34,300 | |
| 4,586 | |
| 917 | | |||
Little Rock, AK (a) | 6/6/2016 |
| 172 | |
| 2,372 | |
| 386 | |
| - | | |||
Wichita, KS | 9/1/2016 |
| 496 | |
| 30,400 | |
| 10,718 | |
| 4,241 | | |||
New York, NY | 12/17/2016 |
| 2 | |
| 1,377 | |
| 1,271 | |
| - | | |||
|
|
| 2,208 | |
| $ | 202,049 | |
| $ | 46,864 | |
| $ | 18,795 | |
(a) | Reflects the sale of a partnership interest |
F- 18
Table of Contents
Index
BRT APARTMENTS CORP. AND SUBSIDIARIES
Notes to Consolidated Financial Statements (Continued)
September 30, 2017
NOTE 3-ACQUISITIONS, DISPOSITIONS AND IMPAIRMENT CHARGES - (continued)
Location | Sale Date |
| No. of Units |
| Sales Price |
| Estimated Gain on Sale |
| Non-Controlling Partner's Share of Estimated Gain | |||||||
Melbourne, FL | 10/25/2017 |
| 208 | |
| $ | 22,250 | |
| $ | 12,700 | |
| $ | 2,800 | |
Impairment Charges
The Company reviews each real estate asset owned, including those held through investments in unconsolidated joint ventures, for impairment when there is an event or a change in circumstances indicating that the carrying amount may not be recoverable. The Company measures and records impairment losses, and reduces the carrying value of properties, when indicators of impairment are present and the expected undiscounted cash flows related to those properties are less than their carrying amounts. In cases where the Company does not expect to recover its carrying costs on properties held for use, the Company reduces its carrying costs to fair value, and for properties held for sale, the Company reduces its carrying value to the fair value less costs to sell. During the years ended September 30, 2017 , 2016 , and 2015 , no impairment charges were recorded.
NOTE 4 - VARIABLE INTEREST ENTITIES
The Company conducts a large portion of its business with joint venture partners. Many of the Company's consolidated joint ventures that own properties were determined to be variable interest entities ("VIEs") because the voting rights of some equity partners are not proportional to their obligations to absorb the expected loses of the entity and their rights to receive expected residual returns. It was determined that the Company is the primary beneficiary of these joint venture because it has a controlling financial interest in that it has the power to direct the activities of the VIE that most significantly impacts the entity's economic performance and it has the obligation to absorb losses of the entity and the right to receive benefits from the entity that could potentially be significant to the VIE.
|
| September 30, | ||||||
|
| 2017 |
| 2016 | ||||
ASSETS |
|
|
|
| ||||
Real estate properties, net of depreciation of $52,873 and $35,525 |
| $ | 707,546 | |
| $ | 686,101 | |
Cash and cash equivalents |
| 8,626 | |
| 11,855 | | ||
Deposits and escrows |
| 13,873 | |
| 19,505 | | ||
Other assets |
| 8,148 | |
| 3,584 | | ||
Real estate properties held for sale |
| 8,969 | |
| 33,996 | | ||
Total Assets |
| $ | 747,162 | |
| $ | 755,041 | |
|
|
|
|
| ||||
LIABILITIES |
|
|
|
| ||||
Mortgages payable, net of deferred costs of $5,170 and $4,856 |
| $ | 558,568 | |
| $ | 535,602 | |
Accounts payable and accrued liabilities |
| 14,419 | |
| 17,893 | | ||
Mortgage payable held for sale |
| - | |
| 27,052 | | ||
Total Liabilities |
| $ | 572,987 | |
| $ | 580,547 | |
F- 19
Table of Contents
Index
BRT APARTMENTS CORP. AND SUBSIDIARIES
Notes to Consolidated Financial Statements (Continued)
September 30, 2017
NOTE 5–DISCONTINUED OPERATIONS
On February 23, 2016, the Company sold, through subsidiaries which owned such interests, its equity interests in RBH - TRB Newark Holdings, LLC (the "Newark Joint Venture"), to RBH Partners III, LLC, for $16,900,000 (the "NJV Sale"). The Company recognized a gain of $15,467,000 in connection with this sale.
Other than the agreement of the Company's subsidiary to provide an indemnity with respect to up to $2,800,000 of obligations related to the venture, neither the Company nor its subsidiaries have any guaranty, indemnity or similar obligations with respect to the Newark Joint Venture.
Statement of Operations |
| Year Ended September 30, | ||||||
|
| |||||||
|
| 2016 |
| 2015 | ||||
Revenues: |
|
|
|
| ||||
Rental and other revenue from real estate properties |
| $ | 2,437 | |
| $ | 4,335 | |
Other income |
| 444 | |
| 1,067 | | ||
Total revenues |
| 2,881 | |
| 5,402 | | ||
|
| |
|
| ||||
Expenses: |
|
|
|
| ||||
Real estate operating expenses |
| 2,277 | |
| 4,610 | | ||
Interest expense |
| 2,242 | |
| 4,880 | | ||
Depreciation |
| 1,150 | |
| 2,241 | | ||
Total expense |
| 5,669 | |
| 11,731 | | ||
Income from discontinued operations |
| (2,788 | ) |
| (6,329 | ) | ||
Gain on sale of partnership interest |
| 15,467 | |
| - | | ||
Discontinued operations |
| $ | 12,679 | |
| $ | (6,329 | ) |
NOTE 6-REAL ESTATE LOAN
As a result of the sale of the Company's interest in the Newark Joint Venture in February 2016, the mortgage loan owed to the Company by the venture (the "NJV Loan Receivable"), which, prior to the sale, was eliminated in consolidation, is reflected as a real estate loan on the consolidated balance sheets. At September 30, 2016, the principal balance of the NJV Loan Receivable was $19,500,000 .
In February 2017, the Company received (i) a $13,600,000 principal paydown of the NJV Loan Receivable and (ii) $2,606,000 , representing all the interest ( i.e. , current and deferred) due through the repayment date. In connection with this transaction, the Company released certain properties from the mortgages securing the NJV Loan Receivable. This receivable, bears interest, payable monthly at a rate of 11% per year, is secured by several properties in Newark, NJ, and matures in April 2018. At September 30, 2017, the principal balance of the NJV Loan Receivable is $5,500,000 .
NOTE 7 -REAL ESTATE PROPERTY HELD FOR SALE
At September 30, 2017 , Waverly Place Apartments, Melbourne, FL, with a book value of $8,969,000 , was held for sale. This property was sold on October 25, 2017. The Company estimates it will recognize a gain on the sale of the property of approximately $12,700,000 , of which approximately $2,800,000 will be allocated to the non-controlling partner.
F- 20
Table of Contents
Index
BRT APARTMENTS CORP. AND SUBSIDIARIES
Notes to Consolidated Financial Statements (Continued)
September 30, 2017
NOTE 8-RESTRICTED CASH
Restricted cash represents funds for specific purposes and therefore are not generally available for general corporate purposes. As reflected on the consolidated balance sheets, restricted cash represents funds held by or on behalf of the Company specifically allocated for capital improvements at multi-family properties.
NOTE 9-INVESTMENT IN UNCONSOLIDATED VENTURES
Location |
| Number of Units |
| Initial Investment |
| Purchase Price |
| Acquisition Debt |
| Percent Ownership | ||||||||
Columbia, SC |
| 374 | |
| $ | 5,670 | |
| $ | 58,300 | |
| $ | 41,000 | |
| 32 | % |
Columbia, SC (a) |
| 339 | |
| 8,665 | |
| 5,915 | |
| - | |
| 46 | % | |||
Forney, TX (b) |
| 313 | |
| 7,500 | |
| 39,000 | |
| 25,350 | |
| 50 | % | |||
|
| 1,026 | |
| $ | 21,835 | |
| $ | 103,215 | |
| $ | 66,350 | |
|
| |
__________________________
(a) Reflects land purchased for a development project at which construction of 339 units is planned. Construction financing for this project of up to
$47,426,000 has been secured. Such financing bears interest at 4.08% and matures in June 2020. At September 30, 2017, no amounts have been
drawn on this financing.
(b) This interest is held through a tenancy-in-common.
NOTE 10-DEBT OBLIGATIONS
|
| September 30, | ||||||
|
| 2017 |
| 2016 | ||||
Mortgages payable |
| $ | 704,171 | |
| $ | 621,382 | |
Junior subordinated notes |
| 37,400 | |
| 37,400 | | ||
Deferred mortgage costs |
| (6,727 | ) |
| (6,275 | ) | ||
Total debt obligations |
| $ | 734,844 | |
| $ | 652,507 | |
Mortgage Payable
Year Ending September 30, |
| Scheduled Principal Payments |
| ||
2018 |
| $ | 35,016 | | (a) |
2019 |
| 59,858 | | (a) | |
2020 |
| 61,875 | |
| |
2021 |
| 22,279 | |
| |
2022 |
| 40,428 | |
| |
Thereafter |
| 484,715 | |
| |
|
| $ | 704,171 | |
|
|
|
|
| ||
(a) | Includes $185 in 2018 and $8,847 in 2019 related to Waverly Place, Melbourne, FL which was sold subsequent to September 30, 2017. |
F- 21
Table of Contents
Index
BRT APARTMENTS CORP. AND SUBSIDIARIES
Notes to Consolidated Financial Statements (Continued)
September 30, 2017
NOTE 10-DEBT OBLIGATIONS (continued)
The Company incurred the following mortgage debt in connection with these acquisitions in the years ended September 30, (dollars in thousands):
2017
Location |
| Closing Date |
| Acquisition Mortgage Debt |
| Interest Rate |
| Interest only period |
| Maturity Date |
| |||
Fredricksburg, VA |
| 11/4/2016 |
| $ | 27,638 | |
| 3.68 | % |
| N/A |
| February 2027 |
|
Saint Louis, MO |
| 2/28/2017 |
| 20,000 | |
| 4.79 | % |
| 72 months |
| March 2027 |
| |
Saint Louis, MO |
| 2/28/2017 |
| 6,197 | |
| 4.84 | % |
| 72 months |
| March 2027 |
| |
Creve Coeur, MO |
| 4/4/2017 |
| 29,000 | |
| LIBOR +2.50% |
| N/A |
| July 2018 | (a) | ||
Farmers Branch, TX |
| 6/29/2017 |
| 55,200 | |
| 4.22 | % |
| 60 months |
| July 2028 |
| |
Tallahassee, FL |
| 8/30/2017 |
| 21,524 | |
| 4.19 | % |
| 60 months |
| September 2027 |
| |
|
|
|
| $ | 159,559 | |
|
|
|
|
|
|
| |
____________________
(a) The borrower may elect to extend the maturity of this debt until April 2019.
Location |
| Closing Date |
| Acquisition Mortgage Debt | |
| Interest Rate |
| Interest only period |
| Maturity Date | |
LaGrange, GA |
| 11/18/15 |
| $ | 16,051 | |
| 4.36% |
| - |
| February 2022 |
Katy,TX |
| 1/22/16 |
| 30,750 | |
| 4.44% |
| 60 months |
| February 2026 | |
Macon,GA |
| 2/01/16 |
| 11,200 | |
| 4.39% |
| 24 months |
| February 2026 | |
Southaven, MS |
| 2/29/16 |
| 28,000 | |
| 4.24% |
| 60 months |
| March 2026 | |
San Antonio, TX (a) |
| 5/06/16 |
| 26,400 | |
| 3.61% |
| 23 months |
| May 2023 | |
Dallas,TX |
| 5/11/16 |
| 27,938 | |
| 4.01% |
| 24 months |
| May 2028 | |
Columbia,SC |
| 5/31/16 |
| 12,934 | |
| 4.28% |
| 36 months |
| June 2026 | |
Atlanta, GA |
| 8/15/16 |
| 27,375 | |
| 3.97% |
| 36 months |
| August 2026 | |
Southaven,MS |
| 9/01/16 |
| 30,564 | |
| 3.73% |
| 60 months |
| September 2026 | |
San Antonio, TX (a) |
| 9/16/16 |
| 27,000 | |
| 4.05% |
| 36 months |
| September 2026 | |
|
|
|
| $ | 238,212 | |
|
|
|
|
|
|
(a) The interest rate on this debt is fixed by the use of an interest rate swap.
Location |
| Closing Date |
| Supplemental Mortgage Debt |
| Interest Rate |
| Maturity Date | |||
Fredricksburg, VA |
| 11/4/2016 |
| $ | 2,261 | |
| 4.84 | % |
| February 2027 |
Decatur, GA |
| 5/31/2017 |
| 4,941 | |
| 5.32 | % |
| December 2022 | |
|
|
|
| $ | 7,202 | |
|
|
|
| |
F- 22
Table of Contents
Index
BRT APARTMENTS CORP. AND SUBSIDIARIES
Notes to Consolidated Financial Statements (Continued)
September 30, 2017
NOTE 10-DEBT OBLIGATIONS (continued)
Location |
| Closing Date |
| Supplemental Mortgage Debt |
| Interest Rate |
| Maturity Date | ||
Pensacola, FL |
| 10/13/15 |
| $ | 3,194 | |
| 4.92% |
| March 2022 |
Atlanta, GA |
| 11/10/15 |
| 5,000 | |
| 4.93% |
| July 2021 | |
Houston, TX |
| 2/09/16 |
| 3,865 | |
| 4.94% |
| August 2021 | |
Huntsville, AL |
| 4/15/16 |
| 2,650 | |
| 5.29% |
| November 2023 | |
|
|
|
| $ | 14,709 | |
|
|
|
|
Junior Subordinated Notes
At September 30, 2017 and 2016 the Company's junior subordinated notes had an outstanding principal balance of $37,400,000 . At September 30, 2017 , the interest rate on the outstanding balance resets quarterly and is based on three month LIBOR + 2.00% The rate in effect at September 30, 2017 is 3.31% . The notes mature April 30, 2036.
The junior subordinated notes require interest only payments through the maturity date, at which time repayment of all outstanding principal and unpaid interest is due. Interest expense for each of the years ended September 30, 2017 , 2016 and 2015 , which includes amortization of deferred costs, was $1,175,000 , $1,510,000 and $1,853,000 , respectively.
NOTE 11-INCOME TAXES
The Company elected to be taxed as a real estate investment trust ("REIT") pursuant to the Code. As a REIT, the Company will generally not be subject to Federal income taxes at the corporate level if it distributes 100% of its REIT taxable income, as defined, to its stockholders. To maintain its REIT status, the Company must distribute at least 90% of its ordinary taxable income; however, if it does not distribute 100% of its taxable income, it will be taxed on undistributed income. There are a number of organizational and operational requirements the Company must meet to remain a REIT. If the Company fails to qualify as a REIT in any taxable year, its taxable income will be subject to Federal income tax at regular corporate tax rates and it may not be able to qualify as a REIT for four subsequent tax years. Even if it is qualified as a REIT, the Company is subject to certain state and local income taxes and to Federal income and excise taxes on the undistributed taxable income. For income tax purposes, the Company reports on a calendar year basis.
During the years ended September 30, 2017 , 2016 and 2015 , the Company recorded $1,560,000 , $689,000 and $18,000 , respectively, of Federal alternative minimum tax and state franchise tax expense, net of refunds, relating to the 2017 , 2016 and 2015 calendar years.
Earnings and profits, which determine the taxability of dividends to stockholders, differs from net income reported for financial statement purposes due to various items, including timing differences related to loan loss provisions, impairment charges, depreciation methods and carrying values.
At December 31, 2016 , the Company had a net operating loss carry forward of $15,840,000 . These net operating losses may be available in future years to reduce taxable income when it is generated. These tax loss carry forwards begin to expire in 2030.
F- 23
Table of Contents
Index
BRT APARTMENTS CORP. AND SUBSIDIARIES
Notes to Consolidated Financial Statements (Continued)
September 30, 2017
NOTE 12-STOCKHOLDERS' EQUITY
Common Stock Dividend Distribution
During the year ended September 30, 2017 , the Company declared a cash distribution of $0.18 per share, which was paid on October 4, 2017. The Company did not declare or pay any dividends during the years ended September 30, 2016 and 2015 .
Stock Based Compensation
The Company's Amended and Restated 2016 Incentive Plan (the "Plan") permits the Company to grant: (i) stock options, restricted stock, restricted stock units, performance shares awards and any one or more of the foregoing, up to a maximum of 600,000 shares; and (ii) cash settled dividend equivalent rights in tandem with the grant of restricted stock units and certain performance based awards.
Restricted Stock Units
Pursuant to the Plan, in June 2016, the Company issued restricted stock units (the "Units") to acquire up to 450,000 shares of common stock . The Units entitle the recipients, subject to continued service through March 31, 2021 (the "Performance Period"), to receive in the aggregate, (i) 200,000 shares (the "TSR Award") of common stock based on achieving, during the Performance Period, specified levels in compounded annual growth rate ("CAGR") in total stockholder return ("TSR"), and (ii) 200,000 shares of common stock based on achieving, during the Performance Period, specified levels in CAGR in adjusted funds from operations, as determined pursuant to the performance agreement (the "AFFO Award"). In addition, up to 50,000 shares may be added to or subtracted from the TSR Award, based on attaining or failing to attain, as the case may be, during the Performance Period, of CAGR in TSR relative to the CAGR in TSR for the REITs that comprise, with specified exceptions, the FTSE NAREIT Equity Apartment Index. Finally, recipients are entitled to receive cash dividends with respect to the shares of common stock underlying their Units as if the underlying shares were outstanding during the Performance Period, if, when, and to the extent, the related Units vest. The Units were determined not to be participating securities and accordingly, for accounting purposes, the shares underlying the Units are excluded in the outstanding shares reflected on the consolidated balance sheet and from the calculation of basic earnings per share. Though the 450,000 shares underlying the units are contingently issuable shares, 350,000 of the such shares have not been included in the diluted earnings per share as the performance and market criteria with respect to the AFFO Award and a portion of the TSR Award have not been met. The Company included 100,000 shares of common stock underlying the TSR Awards in the calculation of diluted earnings per share as the market criteria with respect to such portion of the TSR award has been met at September 30, 2017.
For the TSR Awards, a third party appraiser prepared a Monte Carlo simulation pricing model to assist management in determining the fair value. For the AFFO Awards, the fair value is based on the market value on the date of grant. Expense is not recognized on the Units which the Company does not expect to vest as a result of conditions the Company does not expect to be met. The total amount recorded as deferred compensation with respect to the Units is $1,401,000 and is being charged to general and administrative expense over the Performance Period. The deferred compensation expense to be recognized is net of certain forfeiture and performance assumptions. The Company recorded $240,000 and $146,000 of compensation expense related to the amortization of unearned compensation with respect to the Units in the years ended September 30, 2017 and 2016, respectively. At September 30, 2017, $1,015,000 has been deferred as unearned compensation and will be charged to expense over the balance of the Performance Period.
Restricted Stock
In January 2017, the Company granted 147,500 shares of restricted stock pursuant to the Plan. As of September 30, 2017, an aggregate of 689,375 shared of unvested restricted stock are outstanding pursuant to the Plan and the 2012 Incentive Plan (the "Prior Plan"). No additional awards may be granted under the Prior Plan. All shares of restricted stock vest five years from the date of grant and under specified circumstances, including a change in control, may vest earlier. For financial statement purposes, the restricted stock is not included in the outstanding shares shown on the consolidated balance sheets until they vest, but are included in the earnings per share computation. During the years ended September 30, 2017 , 2016 and 2015, the Company recorded $978,000 and $859,000 , and $906,000 respectively, of compensation expense related to the amortization of unearned compensation with respect to the restricted stock awards. At September 30, 2017 , 2016 , and 2015, $2,356,000 and $2,089,000 and $2,184,000 ,
F- 24
Table of Contents
Index
BRT APARTMENTS CORP. AND SUBSIDIARIES
Notes to Consolidated Financial Statements (Continued)
September 30, 2017
NOTE 12-STOCKHOLDERS' EQUITY (continued)
respectively, has been deferred as unearned compensation and will be charged to expense over the remaining vesting periods of these restricted stock awards. The weighted average vesting period of these restricted shares is 2.3 years.
| Year Ended September 30, | |||||||
| 2017 |
| 2016 |
| 2015 | |||
Outstanding at beginning of the year | 666,775 | |
| 672,875 | |
| 648,225 | |
Issued | 147,500 | |
| 141,050 | |
| 142,950 | |
Cancelled | - | |
| (16,850 | ) |
| - | |
Vested | (124,900 | ) |
| (130,300 | ) |
| (118,300 | ) |
Outstanding at the end of the year | 689,375 | |
| 666,775 | |
| 672,875 | |
| Year Ended September 30, | ||||||||||
| 2017 |
| 2016 |
| 2015 | ||||||
Restricted stock grants | $ | 978 | |
| $ | 859 | |
| $ | 906 | |
Restricted stock units | 240 | |
| 146 | |
| - | | |||
Total compensation | $ | 1,218 | |
| $ | 1,005 | |
| $ | 906 | |
Earnings (Loss) Per Share
| Year Ended September 30, | ||||||||||
| 2017 |
| 2016 |
| 2015 | ||||||
Numerator for basic and diluted earnings per share attributable to common stockholders: |
| |
|
|
|
| | ||||
Net income (loss) attributable to common stockholders | $ | 13,600 | |
| $ | 31,289 | |
| $ | (2,388 | ) |
|
|
|
|
|
| ||||||
Denominator: |
|
|
|
|
| | |||||
Denominator for basic earnings per share-weighted average number of shares | 13,993,638 | |
| 14,017,279 | |
| 14,133,352 | | |||
Effect of diluted securities | 25,205 | |
| - | |
| - | | |||
Denominator for diluted earnings per share-adjusted weighted average number of shares and assumed conversions | 14,018,843 | |
| 14,017,279 | |
| 14,133,352 | | |||
|
|
|
|
|
| ||||||
Basic earnings (loss) per share | $ | 0.98 | |
| $ | 2.23 | |
| $ | (0.17 | ) |
Diluted earnings (loss) per share | $ | 0.98 | |
| $ | 2.23 | |
| $ | (0.17 | ) |
Share Buyback
In February 2016, pursuant to a share purchase program then in effect, the Company purchased 252,000 shares of common stock at a market price of $6.29 per share for an aggregate purchase price, including commissions, of $1,584,000 .
On March 11, 2016, the Board of Directors approved a share repurchase program authorizing the Company to repurchase up to $5,000,000 of shares of common stock through September 30, 2017. Pursuant to this authorization, the
F- 25
Table of Contents
Index
BRT APARTMENTS CORP. AND SUBSIDIARIES
Notes to Consolidated Financial Statements (Continued)
September 30, 2017
NOTE 12-STOCKHOLDERS' EQUITY (continued)
Company, from such date through September 30, 2017, repurchased 98,318 shares of common stock at an average market price of $7.37 per share, for an aggregate purchase price, including commissions, of $724,000 .
On September 12, 2017, the Board of Directors authorized the Company, effective as of October 1, 2017, to purchase up to $5.0 million of its shares of common stock through September 30, 2019. No shares have been repurchased pursuant to this repurchase plan.
NOTE 13-RELATED PARTY TRANSACTIONS
The Company paid REIT Management Corp., a company wholly owned by Fredric H. Gould, a director of the Company, advisory fees pursuant to its Advisory Agreement of $0 , $693,000 and $2,448,000 for the years ended September 30, 2017 , 2016 and 2015 , respectively. The Advisory Agreement terminated effective December 31, 2015. Effective as of January 1, 2016, the Company retained certain of its executive officers and Fredric H. Gould to provide services previously provided pursuant to such agreement. The aggregate fees paid in 2017 and 2016 for these services were $1,193,000 and $863,000 .
Management of certain properties owned by the Company and certain joint venture properties is provided by Majestic Property Management Corp. ("Majestic Property"), a company wholly owned by Fredric H. Gould, under renewable year-to-year agreements. Certain of the Company's officers and directors are also officers and directors of Majestic Property. Majestic Property provides real property management, real estate brokerage and construction supervision services to these properties. For the years ended September 30, 2017 , 2016 and 2015 , fees for these services were $32,000 , $34,000 , and $56,000 , respectively.
Fredric H. Gould is the vice chairman of the board of directors of One Liberty Properties, Inc., and certain of the Company's officers and directors are also officers and, or directors of One Liberty Properties, Inc. In addition, Mr. Gould is an executive officer and sole stockholder of Georgetown Partners, Inc., the managing general partner of Gould Investors L.P.("Gould Investors"). Certain of the Company's officers and directors are also officers and/or directors of Georgetown Partners, Inc. The allocation of expenses for the facilities, personnel and other resources shared by the Company, One Liberty and Gould Investors is computed in accordance with a shared services agreement by and among the Company and these entities and is included in general and administrative expense on the consolidated statements of operations. During the years ended September 30, 2017 , 2016 and 2015 , allocated general and administrative expenses reimbursed by the Company to Gould Investors L.P. pursuant to the shared services agreement aggregated $723,000 , $549,000 and $532,000 , respectively.
In addition to its share of rent included as part of the shared services agreement, the Company leased additional space in the same building directly from an affiliate of Gould Investors prior to the sale of the building in January 2015. The rent paid was $64,000 in the year ended September 30, 2015.
On December 11, 2015, the Company borrowed $8,000,000 from Gould Investors at an interest rate of 5.24% . This loan was satisfied on February 24, 2016. Interest expense for the year ended September 30, 2016 was $86,000 .
Management of many of the Company's multi family properties is performed by its joint venture partners or their affiliates, none of which are related to the Company. These management fees amounted to $2,834,000 , $1,919,000 and $1,436,000 in the years ended September 30, 2017, 2016 and 2015, respectively. In addition, the Company may pay an acquisition fee to its joint venture partner upon the purchase of a property. These acquisition fees amounted to $2,571,000 , $2,221,000 and $1,242,000 for the years ended September 30, 2017 , 2016 and 2015 , respectively.
The Company obtains certain insurance in conjunction with Gould Investors and reimburses Gould Investors for the Company's share of the insurance cost. Insurance reimbursements to Gould Investors for the years ended September 30, 2017 , 2016 and 2015 were $24,000 , $41,000 and $15,000 respectively.
See note 5 - Discontinued Operations for information regarding the Company's sale of its interest in the Newark Joint Venture to affiliates of its former partner in such venture.
F- 26
Table of Contents
Index
BRT APARTMENTS CORP. AND SUBSIDIARIES
Notes to Consolidated Financial Statements (Continued)
September 30, 2017
NOTE 14-SEGMENT REPORTING
Management has determined that the Company operates in two reportable segments: a multi-family real estate segment which includes the ownership, operation and development of its multi-family properties, and another real estate segment, which includes the ownership and operation and development of its other real estate assets.
|
| Multi-Family Real Estate |
| Other Real Estate |
| Total | ||||||
Revenues: |
|
|
|
|
|
| ||||||
Rental and other revenues from real estate properties |
| $ | 102,938 | |
| $ | 1,539 | |
| $ | 104,477 | |
Other income |
| (9 | ) |
| 1,303 | |
| 1,294 | | |||
Total revenues |
| 102,929 | |
| 2,842 | |
| 105,771 | | |||
Expenses: |
|
|
|
|
|
| ||||||
Real estate operating expenses |
| 50,733 | |
| 546 | |
| 51,279 | | |||
Interest expense |
| 26,782 | |
| 1,389 | |
| 28,171 | | |||
General and administrative |
| 9,208 | |
| 188 | |
| 9,396 | | |||
Depreciation |
| 30,381 | |
| 110 | |
| 30,491 | | |||
Total expenses |
| 117,104 | |
| 2,233 | |
| $ | 119,337 | | ||
Total revenue less total expenses |
| (14,175 | ) |
| 609 | |
| (13,566 | ) | |||
Equity in (loss) earnings of unconsolidated joint ventures |
| (417 | ) |
| 33 | |
| (384 | ) | |||
Gain on sale of real estate |
| 52,152 | |
| 449 | |
| 52,601 | | |||
Loss on extinguishment of debt |
| (1,463 | ) |
| - | |
| (1,463 | ) | |||
Income from continuing operations |
| 36,097 | |
| 1,091 | |
| 37,188 | | |||
Provision for taxes |
| 1,529 | |
| 31 | |
| 1,560 | | |||
Net income |
| 34,568 | |
| 1,060 | |
| 35,628 | | |||
Net (income) attributable to non-controlling interests |
| (21,896 | ) |
| (132 | ) |
| (22,028 | ) | |||
Net income attributable to common stockholders |
| $ | 12,672 | |
| $ | 928 | |
| $ | 13,600 | |
Segment Assets at September 30, 2017 |
| $ | 976,806 | |
| $ | 17,091 | |
| $ | 993,897 | |
F- 27
Table of Contents
Index
BRT APARTMENTS CORP. AND SUBSIDIARIES
Notes to Consolidated Financial Statements (Continued)
September 30, 2017
NOTE 14-SEGMENT REPORTING (continued)
|
| Multi-Family Real Estate |
| Other Real Estate |
| Total | ||||||
Revenues: |
|
| |
|
| |
|
| | |||
Rental and other revenues from real estate properties |
| $ | 93,795 | |
| $ | 1,407 | |
| $ | 95,202 | |
Other income |
| - | |
| 3,319 | |
| $ | 3,319 | | ||
Total revenues |
| 93,795 | |
| 4,726 | |
| 98,521 | | |||
Expenses: |
|
|
|
| |
|
| | ||||
Real estate operating expenses |
| 46,936 | |
| 583 | |
| 47,519 | | |||
Interest expense |
| 23,739 | |
| 139 | |
| 23,878 | | |||
Advisor's fee, related party |
| 593 | |
| 100 | |
| 693 | | |||
Property acquisition costs |
| 3,852 | |
| - | |
| 3,852 | | |||
General and administrative |
| 8,313 | |
| 223 | |
| 8,536 | | |||
Depreciation |
| 22,251 | |
| 929 | |
| 23,180 | | |||
Total expenses |
| 105,684 | |
| 1,974 | |
| 107,658 | | |||
Total revenues less total expenses |
| (11,889 | ) |
| 2,752 | |
| (9,137 | ) | |||
Gain on sale of real estate |
| 45,206 | |
| 1,271 | |
| 46,477 | | |||
Gain on sale of partnership interest |
| 386 | |
| - | |
| 386 | | |||
Loss on extinguishment of debt |
| (4,547 | ) |
| - | |
| (4,547 | ) | |||
Income from continuing operations |
| 29,156 | |
| 4,023 | |
| 33,179 | | |||
Provision for taxes |
| 686 | |
| 14 | |
| 700 | | |||
Income from continuing operations, net of taxes |
| 28,470 | |
| 4,009 | |
| 32,479 | | |||
Net (income) attributable to non-controlling interests |
| (15,420 | ) |
| (108 | ) |
| (15,528 | ) | |||
Net income attributable to common stockholders before reconciling items |
| $ | 58,312 | |
| $ | 8,046 | |
| $ | 16,951 | |
Reconciling adjustment: |
|
|
|
|
|
| ||||||
Discontinued operations, net of non-controlling interests |
|
|
|
|
| 14,338 | | |||||
Net income attributable to common stockholders |
|
|
|
|
| $ | 31,289 | | ||||
Segment assets at September 30, 2016 |
| $ | 843,898 | |
| $ | 31,001 | |
| $ | 874,899 | |
F- 28
Table of Contents
Index
BRT APARTMENTS CORP. AND SUBSIDIARIES
Notes to Consolidated Financial Statements (Continued)
September 30, 2017
NOTE 14-SEGMENT REPORTING (continued)
|
| Multi-Family Real Estate |
| Other Real Estate |
| Total | ||||||
Revenues: |
|
| |
|
| |
|
| | |||
Rental and other revenues from real estate properties |
| $ | 79,646 | |
| $ | 1,380 | |
| $ | 81,026 | |
Other income |
| - | |
| 72 | |
| 72 | | |||
Total revenues |
| 79,646 | |
| 1,452 | |
| 81,098 | | |||
Expenses: |
|
|
|
| |
|
| | ||||
Real estate operating expenses |
| 42,003 | |
| 609 | |
| 42,612 | | |||
Interest expense |
| 18,944 | |
| 353 | |
| 19,297 | | |||
Advisor's fee, related party |
| 2,077 | |
| 371 | |
| 2,448 | | |||
Property acquisition costs |
| 1,885 | |
| - | |
| 1,885 | | |||
General and administrative |
| 6,314 | |
| 369 | |
| 6,683 | | |||
Depreciation |
| 18,336 | |
| 118 | |
| 18,454 | | |||
Total expenses |
| 89,559 | |
| 1,820 | |
| 91,379 | | |||
Total revenues less total expenses |
| (9,913 | ) |
| (368 | ) |
| (10,281 | ) | |||
Gain on sale of real estate |
| 14,404 | |
| 601 | |
| 15,005 | | |||
Income from continuing operations |
| 4,491 | |
| 233 | |
| 4,724 | | |||
Net (income) attributable to non-controlling interests |
| (4,877 | ) |
| (93 | ) |
| (4,970 | ) | |||
Net (loss) income attributable to common stockholders before reconciling adjustment |
| $ | (386 | ) |
| $ | 140 | |
| $ | (246 | ) |
Reconciling adjustment: |
|
|
|
|
|
| ||||||
Discontinued operations, net of non-controlling interests |
|
|
|
|
| (2,142 | ) | |||||
Net loss attributable to common stockholders |
|
|
|
|
| (2,388 | ) | |||||
Segment assets at September 30, 2015 |
| $ | 616,909 | |
| $ | 55,425 | |
| $ | 672,334 | |
F- 29
Table of Contents
Index
BRT APARTMENTS CORP. AND SUBSIDIARIES
Notes to Consolidated Financial Statements (Continued)
September 30, 2017
NOTE 15-FAIR VALUE OF FINANCIAL INSTRUMENTS
Financial Instruments Not Measured at Fair Value
The following methods and assumptions were used to estimate the fair value of each class of financial instruments that are not reported at fair value on the consolidated balance sheets:
Cash and cash equivalents, restricted cash, accounts receivable (included in other assets), accounts payable and accrued liabilities: The carrying amounts reported in the balance sheets for these instruments approximate their fair value due to the short term nature of these accounts.
Junior subordinated notes: At September 30, 2017 and 2016 , the estimated fair value of the Company's junior subordinated notes is less than their carrying value by approximately $15,705,000 , and $16,549,000 , respectively based on market interest rates of 6.82% and 6.35% , respectively.
Mortgages payable: At September 30, 2017 , the estimated fair value of the Company's mortgages payable is lower than their carrying value by approximately $11,400,000 assuming market interest rates between 3.78% and 5.02% . At September 30, 2016, the estimated fair value was greater than the carrying value by $10,629,000 , assuming market interest rates between 3.05% and 4.25% . Market interest rates were determined using current financing transaction information provided by third party institutions.
Considerable judgment is necessary to interpret market data and develop estimated fair value. The use of different market assumptions and/or estimation methodologies may have a material effect on the estimated fair value assumptions. The fair values of the real estate loans and debt obligations are considered to be Level 2 valuations within the fair value hierarchy.
Financial Instruments Measured at Fair Value
|
| Carrying and Fair Value |
| Fair Value Measurements Using Fair Value Hierarchy | |||||||
|
| Level 1 |
| Level 2 | |||||||
Financial Assets: |
|
| |
|
| |
|
| | ||
Interest rate swaps |
| $ | 1,460 | |
| - | |
| $ | 1,460 | |
|
|
|
|
|
|
| |||||
Financial Liabilities: |
|
|
|
|
|
| |||||
Interest rate swap |
| $ | (14 | ) |
| - | |
| $ | (14 | ) |
Derivative financial instruments: Fair values are approximated using widely accepted valuation techniques including discounted cash flow analysis on the expected cash flows of the derivatives. This analysis reflects the contractual terms of the derivatives, including the period to maturity, and uses observable market-based inputs, including interest rate curves, and implied volatilities. At September 30, 2017 , these derivatives are included in other assets and accounts payable and accrued liabilities on the consolidated balance sheet.
Although the Company has determined that the majority of the inputs used to value its derivatives fall within Level 2 of the fair value hierarchy, the credit valuation adjustments associated with it utilize Level 3 inputs, such as estimates of current credit spreads to evaluate the likelihood of default by itself and its counterparty. As of September 30, 2017 , the Company assessed the significance of the impact of the credit valuation adjustments on the overall valuation of its derivative positions
F- 30
Table of Contents
Index
BRT APARTMENTS CORP. AND SUBSIDIARIES
Notes to Consolidated Financial Statements (Continued)
September 30, 2017
NOTE 15-FAIR VALUE OF FINANCIAL INSTRUMENTS (continued)
and determined that the credit valuation adjustments are not significant to the overall valuation of its derivatives. As a result, the Company determined that its derivative valuation is classified in Level 2 of the fair value hierarchy.
NOTE 16-COMMITMENT AND CONTINGENCIES
The Company maintains a non-contributory defined contribution pension plan covering eligible employees and officers. Contributions by the Company are made through a money purchase plan, based upon a percent of qualified employees' total salary as defined therein. Pension expense approximated $342,000 , $324,000 and $322,000 during the years ended September 30, 2017 , 2016 and 2015 , respectively. At September 30, 2017 and 2016 , $ 162,000 and $47,000 , respectively, remains unpaid and is included in accounts payable and accrued liabilities on the consolidated balance sheets.
At September 30, 2017, the Company is the carve out guarantor with respect to mortgage debt in principal amount of $86,600,000 at six multi-family properties.
NOTE 17-DERIVATIVE FINANCIAL INSTRUMENTS
Cash Flow Hedges of Interest Rate Risk
The Company's objectives in using interest rate derivatives are to add stability to interest expense and to manage its exposure to interest rate movements. To accomplish this objective, the Company primarily uses interest rate swaps as part of its interest rate risk management strategy. Interest rate swaps designated as cash flow hedges involve the receipt of variable amounts from a counterparty in exchange for the Company making fixed-rate payments over the life of the agreements without exchange of the underlying notional amount.
The effective portion of changes in the fair value of derivatives, designated and that qualify as cash flow hedges, is recorded in accumulated other comprehensive income (loss) on our consolidated balance sheets and is subsequently reclassified into earnings in the period that the hedged forecasted transaction affects earnings.
Amounts reported in accumulated other comprehensive income (loss) related to derivatives will be reclassified to interest expense as interest payments are made on the Company's variable-rate debt.
Interest Rate Derivative |
| Notional Amount |
| Rate |
| Maturity | |||
Interest Rate Swap |
| $ | 1,446 | |
| 5.25 | % |
| April 1, 2022 |
Interest Rate Swap |
| $ | 26,400 | |
| 3.61 | % |
| May 6, 2023 |
Interest Rate Swap |
| $ | 27,000 | |
| 4.05 | % |
| September 19, 2026 |
Derivatives as of: | ||||||||||
September 30, 2017 |
| September 30, 2016 | ||||||||
Balance Sheet Location |
| Fair Value |
| Balance Sheet Location |
| Fair Value | ||||
Other Assets |
| $ | 1,460 | |
| Other assets |
| $ | - | |
Accounts payable and accrued liabilities |
| $ | 14 | |
| Accounts payable and accrued liabilities |
| $ | 1,602 | |
F- 31
Table of Contents
Index
BRT APARTMENTS CORP. AND SUBSIDIARIES
Notes to Consolidated Financial Statements (Continued)
September 30, 2017
NOTE 17-DERIVATIVE FINANCIAL INSTRUMENTS - (continued)
|
| Year Ended September 30, | ||||||||||
|
| 2017 |
| 2016 |
| 2015 | ||||||
Amount of gain (loss) recognized on derivative in Other Comprehensive Income |
| $ | 2,660 | |
| $ | (1,695 | ) |
| $ | (83 | ) |
Less: amount of gain (loss) reclassified from Accumulated Other Comprehensive (loss) income into Interest Expense |
| $ | (387 | ) |
| $ | (150 | ) |
| $ | (33 | ) |
No gain or loss was recognized related to hedge ineffectiveness or to amounts excluded from effectiveness testing on the Trust's cash flow hedges during the years ended September 30, 2017 , 2016 or 2015 . During the twelve months ending September 30, 2018 , the Company estimates an additional $74,000 will be reclassified from other comprehensive income as an increase to interest expense.
Credit-risk-related Contingent Features
The agreement between the Company and its derivatives counterparty provides that if the Company defaults on any of its indebtedness, including default where repayment of the indebtedness has not been accelerated by the lender, the Trust could be declared in default on its derivative obligation.
As of September 30, 2017 , the fair value of the derivative in a net liability position, which includes accrued interest, but excludes any adjustment for nonperformance risk related to this agreement, was $16,000 . As of September 30, 2017 , the Company has not posted any collateral related to this agreement. If the Company had been in breach of this agreement at September 30, 2017 , it could have been required to settle its obligations thereunder at its termination value of $16,000 .
F- 32
Table of Contents
Index
BRT APARTMENTS CORP. AND SUBSIDIARIES
Notes to Consolidated Financial Statements (Continued)
September 30, 2017
|
| 2017 | ||||||||||||||||||
|
| 1st Quarter |
| 2nd Quarter |
| 3rd Quarter |
| 4th Quarter |
| Total | ||||||||||
Revenues |
| $ | 25,640 | |
| $ | 24,883 | |
| $ | 26,861 | |
| $ | 28,387 | |
| $ | 105,771 | |
Expenses |
| 28,027 | |
| 28,473 | |
| 30,333 | |
| 32,504 | |
| 119,337 | | |||||
Total revenues less total expenses |
| (2,387 | ) |
| (3,590 | ) |
| (3,472 | ) |
| (4,117 | ) |
| (13,566 | ) | |||||
Equity in loss of unconsolidated joint ventures |
| - | |
| - | |
| (307 | ) |
| (77 | ) |
| (384 | ) | |||||
Gain on sale of real estate |
| 35,838 | |
| - | |
| - | |
| 16,763 | |
| 52,601 | | |||||
Loss on extinguishment of debt |
| (799 | ) |
| - | |
| - | |
| (664 | ) |
| (1,463 | ) | |||||
Income (loss) income from continuing operations |
| 32,652 | |
| (3,590 | ) |
| (3,779 | ) |
| 11,905 | |
| 37,188 | | |||||
Provision for taxes |
| 350 | |
| 1,108 | |
| 41 | |
| 61 | |
| 1,560 | | |||||
Net income (loss) |
| 32,302 | |
| (4,698 | ) |
| (3,820 | ) |
| 11,844 | |
| 35,628 | | |||||
Net (income) loss attributable to non-controlling interests |
| (16,532 | ) |
| 469 | |
| 418 | |
| (6,383 | ) |
| (22,028 | ) | |||||
Net income (loss) attributable to common stockholders |
| $ | 15,770 | |
| $ | (4,229 | ) |
| $ | (3,402 | ) |
| $ | 5,461 | |
| $ | 13,600 | |
|
|
|
|
|
|
|
|
|
|
| ||||||||||
Basic and per share amounts attributable to common stockholders |
|
|
|
|
|
|
|
|
|
| ||||||||||
Basic and diluted income (loss) per share (a) |
| $ | 1.13 | |
| $ | (0.30 | ) |
| $ | (0.24 | ) |
| $ | 0.39 | |
| $ | 0.97 | |
(a) does not add across due to rounding
|
| 2016 | ||||||||||||||||||
|
| 1st Quarter |
| 2nd Quarter |
| 3rd Quarter |
| 4th Quarter |
| Total | ||||||||||
Revenues |
| $ | 22,326 | |
| $ | 26,019 | |
| $ | 24,287 | |
| $ | 25,889 | |
| $ | 98,521 | |
Expenses |
| 24,108 | |
| 27,011 | |
| 27,652 | |
| 28,887 | |
| 107,658 | | |||||
Total revenues less total expenses |
| (1,782 | ) |
| (992 | ) |
| (3,365 | ) |
| (2,998 | ) |
| (9,137 | ) | |||||
Gain on sale of real estate |
| 609 | |
| 24,226 | |
| 10,263 | |
| 11,379 | |
| 46,477 | | |||||
Gain on sale of partnership interest |
| - | |
| - | |
| 386 | |
| - | |
| 386 | | |||||
Loss on extinguishment of debt |
| - | |
| (2,668 | ) |
| - | |
| (1,879 | ) |
| (4,547 | ) | |||||
(Loss) income from continuing operations |
| (1,173 | ) |
| 20,566 | |
| 7,284 | |
| 6,502 | |
| 33,179 | | |||||
Provision for taxes |
| - | |
| - | |
| - | |
| 700 | |
| 700 | | |||||
(Loss) income from continuing operations, net of tax |
| (1,173 | ) |
| 20,566 | |
| 7,284 | |
| 5,802 | |
| 32,479 | | |||||
(Loss) income from discontinued operations |
| (1,600 | ) |
| 14,279 | |
| - | |
| - | |
| 12,679 | | |||||
Net (loss) income |
| (2,773 | ) |
| 34,845 | |
| 7,284 | |
| 5,802 | |
| 45,158 | | |||||
Net loss (income) attributable to non-controlling interests |
| 739 | |
| (9,909 | ) |
| (1,804 | ) |
| (2,895 | ) |
| (13,869 | ) | |||||
Net (loss) income attributable to common stockholders |
| $ | (2,034 | ) |
| $ | 24,936 | |
| $ | 5,480 | |
| $ | 2,907 | |
| $ | 31,289 | |
|
|
|
|
|
|
|
|
|
|
| ||||||||||
Basic and per share amounts attributable to common stockholders |
|
|
|
|
|
|
|
|
|
| ||||||||||
Continuing operations |
| $ | (0.10 | ) |
| $ | 0.7 | |
| $ | 0.39 | |
| $ | 0.21 | |
| $ | 1.21 | |
Discontinued operations |
| (0.04 | ) |
| 1.06 | |
| - | |
| - | |
| 1.02 | | |||||
Basic and diluted (loss) income per share |
| $ | (0.14 | ) |
| $ | 1.76 | |
| $ | 0.39 | |
| $ | 0.21 | |
| $ | 2.23 | |
F- 33
Table of Contents
Index
BRT APARTMENTS CORP. AND SUBSIDIARIES
Notes to Consolidated Financial Statements (Continued)
September 30, 2017
NOTE 19-SUBSEQUENT EVENTS
Subsequent events have been evaluated and any significant events, relative to our consolidated financial statements as of September 30, 2017 that warrant additional disclosure have been included in the notes to the consolidated financial statements.
F- 34
Table of Contents
Index
BRT APARTMENTS CORP. AND SUBSIDIARIES
SCHEDULE III-REAL ESTATE PROPERTIES AND ACCUMULATED DEPRECIATION
(Including Real Estate Property Held for Sale)
SEPTEMBER 30, 2017
(Dollars in thousands)
|
|
|
| Initial Cost to Company |
| Costs Capitalized Subsequent to |
| Gross Amount At Which Carried at September 30, 2017 |
|
|
|
|
|
|
| Depreciation Life For Latest Income Statement | |||||||||||||||||||||||||||||||||
|
|
|
|
|
|
|
|
|
|
|
|
|
|
|
|
|
|
|
|
|
|
|
|
|
| ||||||||||||||||||||||||
Description | Encumbrances |
| Land |
| Buildings and Improvements |
| Land |
| Improvements |
| Carrying |
| Land |
| Buildings and |
| Total |
| Accumulated |
| Date of |
| Date Acquired |
| |||||||||||||||||||||||||
Commercial |
|
|
|
| |
|
|
|
|
| |
|
|
| |
|
|
|
|
| |
|
| |
|
| |
|
| |
|
|
|
|
|
| |||||||||||||
Yonkers, NY. | $ | 1,448 |
|
| - | |
| $ | 4,000 |
|
| - | |
| $ | 320 |
|
| - |
|
| - | |
| $ | 4,320 | |
| $ | 4,320 | |
| $ | 1,837 | |
| (c) |
| Aug-2000 |
| 39 years | ||||||||
South Daytona, FL. | - |
|
| $ | 10,437 | |
| - |
|
| 49 | |
| - |
|
| - |
|
| $ | 8,021 | |
| - | |
| 8,021 | |
| - | |
| N/A |
| Feb-2008 |
| N/A | ||||||||||||
Multi-Family Residential |
|
|
|
| |
|
|
|
|
| |
|
|
|
|
|
|
|
| |
|
|
|
|
|
| |
|
|
|
|
|
| ||||||||||||||||
Palm Beach Gardens, FL | 46,176 |
|
| 16,260 | |
| 43,132 |
|
| - | |
| 4,560 |
|
| - |
|
| 16,260 | |
| 47,692 | |
| 63,952 | |
| 9,921 | |
| 1970 |
| Mar-2012 |
| 30 years | ||||||||||||||
Melbourne, FL | 9,033 |
|
| 1,150 | |
| 8,680 |
|
| - | |
| 1,471 |
|
| - |
|
| 1,150 | |
| 10,151 | |
| 11,301 | |
| 2,332 | |
| 1987 |
| Mar-2012 |
| 30 years | ||||||||||||||
North Charleston, SC | 16,793 |
|
| 2,436 | |
| 18,970 |
|
| - | |
| 1,112 |
|
| - |
|
| 2,436 | |
| 20,082 | |
| 22,518 | |
| 3,547 | |
| 2010 |
| Oct-2012 |
| 30 years | ||||||||||||||
Decatur, GA | 15,094 |
|
| 1,698 | |
| 8,676 |
|
| - | |
| 1,574 |
|
| - |
|
| 1,698 | |
| 10,250 | |
| 11,948 | |
| 1,804 | |
| 1954 |
| Nov-2012 |
| 30 years | ||||||||||||||
Houston, TX (Stonecrossing) | 12,659 |
|
| 5,143 | |
| 11,524 |
|
| - | |
| 464 |
|
| - |
|
| 5,143 | |
| 11,988 | |
| 17,131 | |
| 1,937 | |
| 1978 |
| April-2013 |
| 30 years | ||||||||||||||
Houston, TX (Stonecrossing East) | 7,270 |
|
| 3,044 | |
| 5,463 |
|
| - | |
| 930 |
|
| - |
|
| 3,044 | |
| 6,393 | |
| 9,437 | |
| 984 | |
| 1979 |
| April-2013 |
| 30 years | ||||||||||||||
Huntsville, AL | 12,064 |
|
| 1,047 | |
| 10,942 |
|
| - | |
| 1,599 |
|
| - |
|
| 1,047 | |
| 12,541 | |
| 13,588 | |
| 1,824 | |
| 1985 |
| Oct-2013 |
| 30 years | ||||||||||||||
Columbus, OH | 9,957 |
|
| 1,372 | |
| 12,678 |
|
| | |
| 469 |
|
| - |
|
| 1,372 | |
| 13,147 | |
| 14,519 | |
| 1,950 | |
| 1999 |
| Nov-2013 |
| 30 years | ||||||||||||||
Indianapolis, IN | 14,375 |
|
| 4,477 | |
| 14,240 |
|
| - | |
| 2,476 |
|
| - |
|
| 4,477 | |
| 16,716 | |
| 21,193 | |
| 2,276 | |
| 2007 |
| Jan-2014 |
| 30 years | ||||||||||||||
Nashville, TN | 23,181 |
|
| 4,565 | |
| 22,054 |
|
| | |
| 2,744 |
|
| - |
|
| 4,565 | |
| 24,798 | |
| 29,363 | |
| 2,921 | |
| 1985 |
| April-2014 |
| 30 years | ||||||||||||||
Houston, TX (Kendall Manor) | 15,242 |
|
| 1,849 | |
| 13,346 |
|
| - | |
| 2,009 |
|
| - |
|
| 1,849 | |
| 15,355 | |
| 17,204 | |
| 1,869 | |
| 1981 |
| July-2014 |
| 30 years | ||||||||||||||
Pensacola, FL | 19,349 |
|
| 2,758 | |
| 25,192 |
|
| - | |
| 584 |
|
| - |
|
| 2,758 | |
| 25,776 | |
| 28,534 | |
| 2,669 | |
| 2008 |
| Dec-2014 |
| 30 years | ||||||||||||||
Valley, AL | 28,990 |
|
| 1,040 | |
| 42,710 |
|
| - | |
| 907 |
|
| - |
|
| 1,040 | |
| 43,617 | |
| 44,657 | |
| 3,722 | |
| 2009 |
| July-2014 |
| 30 years | ||||||||||||||
San Marcos, TX | 17,158 |
|
| 2,163 | |
| 19,562 |
|
| - | |
| 218 |
|
| - |
|
| 2,163 | |
| 19,780 | |
| 21,943 | |
| 1,706 | |
| 2014 |
| Sept-2015 |
| 30 years | ||||||||||||||
Lake St. Louis, MO | 26,814 |
|
| 2,752 | |
| 33,248 |
|
| - | |
| 746 |
|
| - |
|
| 2,752 | |
| 33,994 | |
| 36,746 | |
| 2,627 | |
| 1986 |
| Sept-2015 |
| 30 years | ||||||||||||||
North Charleston, SC | 29,592 |
|
| 5,538 | |
| - |
|
| | |
| 35,105 |
|
| 318 |
|
| 5,538 | |
| 35,423 | |
| 40,961 | |
| 727 | |
| 2016 |
| Oct-15 |
| 30 years | ||||||||||||||
LaGrange, GA | 15,452 |
|
| 832 | |
| 21,968 |
|
| - | |
| 429 |
|
| - |
|
| 832 | |
| 22,397 | |
| 23,229 | |
| 1,532 | |
| 2009 |
| Nov-15 |
| 30 years | ||||||||||||||
Katy, TX | 30,750 |
|
| 4,194 | |
| 36,056 |
|
| | |
| (3,517 | ) |
| - |
|
| 4,194 | |
| 32,539 | |
| 36,733 | |
| 2,345 | |
| 2008 |
| Jan-16 |
| 30 years | ||||||||||||||
Macon, GA | 11,200 |
|
| 1,876 | |
| 12,649 |
|
| - | |
| 399 |
|
| - |
|
| 1,876 | |
| 13,048 | |
| 14,924 | |
| 937 | |
| 1988 |
| Feb-16 |
| 30 years | ||||||||||||||
Southaven, MS (Civic Center I) | 28,000 |
|
| 2,090 | |
| 32,910 |
|
| - | |
| 1,831 |
|
| - |
|
| 2,090 | |
| 34,741 | |
| 36,831 | |
| 2,154 | |
| 2002 |
| Feb-16 |
| 30 years | ||||||||||||||
San Antonio, TX | 26,400 |
|
| 5,540 | |
| 29,610 |
|
| - | |
| 699 |
|
| - |
|
| 5,540 | |
| 30,309 | |
| 35,849 | |
| 2,283 | |
| 2013 |
| May-16 |
| 30 years | ||||||||||||||
|
|
|
|
|
|
|
|
|
|
|
|
|
|
|
|
|
|
|
|
|
|
|
|
|
| ||||||||||||||||||||||||
|
|
|
| Initial Cost to Company |
| Costs Capitalized Subsequent to |
| Gross Amount At Which Carried |
|
|
|
|
|
|
| Depreciation Life For Latest Income Statement | |||||||||||||||||||||||||||||||||
|
|
|
|
|
|
|
|
|
|
|
|
|
|
|
|
|
|
|
|
|
|
|
|
|
| ||||||||||||||||||||||||
Description | Encumbrances |
| Land |
| Buildings and Improvements |
| Land |
| Improvements |
| Carrying |
| Land |
| Buildings and |
| Total |
| Accumulated |
| Date of |
| Date Acquired |
| |||||||||||||||||||||||||
Dallas, TX | 27,938 |
|
| 13,073 | |
| 23,927 |
|
| - | |
| 2,128 |
|
| - |
|
| 13,073 | |
| 26,055 | |
| 39,128 | |
| 1,539 | |
| 1986 |
| May-16 |
| 30 years | ||||||||||||||
Columbia, SC | 12,934 |
|
| 2,233 | |
| 14,767 |
|
| - | |
| 751 |
|
| - |
|
| 2,233 | |
| 15,518 | |
| 17,751 | |
| 1,050 | |
| 1996 |
| May-16 |
| 30 years | ||||||||||||||
Atlanta, GA | 27,375 |
|
| 10,347 | |
| 28,777 |
|
| - | |
| 888 |
|
| - |
|
| 10,347 | |
| 29,665 | |
| 40,012 | |
| 1,918 | |
| 1989 |
| Aug-16 |
| 30 years | ||||||||||||||
Southaven, MS (Civic Center II) | 30,564 |
|
| 2,077 | |
| 36,128 |
|
| - | |
| 609 |
|
| - |
|
| 2,077 | |
| 36,737 | |
| 38,814 | |
| 2,101 | |
| 2005 |
| Sep-16 |
| 30 years | ||||||||||||||
San Antonio, TX | 27,000 |
|
| 4,620 | |
| 31,380 |
|
| - | |
| 680 |
|
| - |
|
| 4,620 | |
| 32,060 | |
| 36,680 | |
| 1,775 | |
| 2015 |
| Sep-16 |
| 30 years | ||||||||||||||
Fredericksburg, VA | 29,441 |
|
| 6,985 | |
| 32,148 |
|
| - | |
| 550 |
|
| - |
|
| 6,985 | |
| 32,698 | |
| 39,683 | |
| 1,368 | |
| 2005 |
| Nov-16 |
| 30 years | ||||||||||||||
St. Louis, MO (Tower at OPOP) | 20,000 |
|
| 192 | |
| 27,231 |
|
| - | |
| 3 |
|
| - |
|
| 192 | |
| 27,234 | |
| 27,426 | |
| 693 | |
| 2014 |
| Feb-17 |
| 30 years | ||||||||||||||
St. Louis, MO (Lofts at OPOP) | 6,197 |
|
| 329 | |
| 7,805 |
|
| - | |
| 12 |
|
| - |
|
| 329 | |
| 7,817 | |
| 8,146 | |
| 280 | |
| 2014 |
| Feb-17 |
| 30 years | ||||||||||||||
Creve Coeur, MO | 29,000 |
|
| 2,270 | |
| 37,899 |
|
| - | |
| 48 |
|
| - |
|
| 2,270 | |
| 37,947 | |
| 40,217 | |
| 832 | |
| 2016 |
| Apr-17 |
| 30 years | ||||||||||||||
West Nashville, TN | - |
|
| 5,228 | |
| - |
|
| - | |
| 5,219 |
|
| - |
|
| 5,228 | |
| 5,219 | |
| 10,447 | |
| - | |
| 2017 |
| June-17 |
| 30 years | ||||||||||||||
Farmers Branch, TX | 55,200 |
|
| 7,343 | |
| 79,347 |
|
| - | |
| 24 |
|
| - |
|
| 7,343 | |
| 79,371 | |
| 86,714 | |
| 1,046 | |
| 2016 |
| June-17 |
| 30 years | ||||||||||||||
Tallahassee, FL | 21,524 |
|
| 3,553 | |
| 24,372 |
|
| - | |
| 27 |
|
| - |
|
| 3,553 | |
| 24,399 | |
| 27,952 | |
| 116 | |
| 1996 |
| Aug-17 |
| 30 years | ||||||||||||||
Total | $ | 704,170 |
|
| $ | 140,511 | |
| $ | 771,391 |
|
| $ | 49 | |
| $ | 68,068 |
|
| $ | 318 |
|
| $ | 138,095 | |
| $ | 839,777 | |
| $ | 977,872 | |
| $ | 66,622 | |
|
|
|
|
|
| ||||
|
|
|
|
|
|
|
|
|
|
|
|
|
|
|
|
|
|
|
|
| (a) | |
| (b) | |
|
|
|
|
|
| ||||||||||||||||||
F- 35
Table of Contents
Index
BRT REALTY TRUST AND SUBSIDIARIES
SCHEDULE III-REAL ESTATE PROPERTIES AND ACCUMULATED DEPRECIATION
(Including Real Estate Property Held for Sale)
SEPTEMBER 30, 2017
(Dollars in thousands)
Notes to the schedule:
| |
| ||
(a) | Total real estate properties | $ | 977,872 | |
| Less: Accumulated depreciation and amortization | (66,622 | ) | |
| Net real estate properties | $ | 911,250 | |
(b) | Amortization of the Company's leasehold interests is over the shorter of estimated useful life or the term of the respective land lease. |
| | |
(c) | Information not readily obtainable. |
| | |
A reconciliation of real estate properties is as follows:
|
| 2017 |
| 2016 |
| 2015 | ||||||
Balance at beginning of year |
| $ | 793,572 | |
| $ | 757,027 | |
| $ | 635,612 | |
Additions: |
|
|
|
|
|
| ||||||
Acquisitions |
| 239,923 | |
| 318,680 | |
| 129,425 | | |||
Capital improvements |
| 9,298 | |
| 19,649 | |
| 8,442 | | |||
Capitalized development expenses and carrying costs |
| 16,069 | |
| 27,194 | |
| 55,623 | | |||
|
| 265,290 | |
| 365,523 | |
| 193,490 | | |||
Deductions: |
|
|
|
|
|
| ||||||
Sales |
| 113,552 | |
| 150,786 | |
| 51,394 | | |||
Depreciation/amortization/paydowns |
| 30,489 | |
| 24,328 | |
| 20,681 | | |||
Other dispositions |
| 3,571 | |
| - | |
| - | | |||
Reconciliation of partnership interest |
| - | |
| 153,864 | |
| - | | |||
|
| 147,612 | |
| 328,978 | |
| 72,075 | | |||
Balance at end of year |
| $ | 911,250 | |
| $ | 793,572 | |
| $ | 757,027 | |
F- 36