Table of Contents
UNITED STATES
SECURITIES AND EXCHANGE COMMISSION
Washington, D.C. 20549
Form 10-K
x | ANNUAL REPORT PURSUANT TO SECTION 13 OR 15(d) OF THE SECURITIES EXCHANGE ACT OF 1934 |
For the fiscal year ended July 31, 2014
OR
¨ | TRANSITION REPORT PURSUANT TO SECTION 13 OR 15(d) OF THE SECURITIES EXCHANGE ACT OF 1934 |
For the transition period from to
Commission file number 1-14959
BRADY CORPORATION
(Exact name of registrant as specified in charter)
Wisconsin |
| 39-0178960 |
(State or other jurisdiction of incorporation or organization) |
| (IRS Employer Identification No.) |
6555 West Good Hope Road, Milwaukee, WI |
| 53223 |
(Address of principal executive offices) |
| (Zip Code) |
(414) 358-6600
(Registrant's telephone number, including area code)
Securities registered pursuant to Section 12(b) of the Act:
Title of each class |
| Name of each exchange on which registered |
Class A Nonvoting Common Stock, Par Value $.01 per share |
| New York Stock Exchange |
Securities registered pursuant to Section 12(g) of the Act:
None
Indicate by check mark if the registrant is a well-known seasoned issuer, as defined in Rule 405 of the Securities Act. Yes ý No ¨
Indicate by check mark if the registrant is not required to file reports pursuant to Section 13 or Section 15(d) of the Act. Yes ¨ No ý
Indicate by check mark whether the registrant (1) has filed all reports required to be filed by Section 13 or 15(d) of the Securities Exchange Act of 1934 during the preceding 12 months (or for such shorter period that the registrant was required to file such reports), and (2) has been subject to such filing requirements for the past 90 days. Yes ý No ¨
Indicate by check mark whether the registrant has submitted electronically and posted on its corporate Web site, if any, every Interactive Data File required to be submitted and posted pursuant to Rule 405 of Regulation S-T during the preceding 12 months (or for such shorter period that the registrant was required to submit and post such files). Yes ý No ¨
Indicate by check mark if disclosure of delinquent filers pursuant to Item 405 of Regulation S-K is not contained herein, and will not be contained, to the best of the registrant's knowledge, in definitive proxy or information statements incorporated by reference in Part III of this Form 10-K or any amendment to this Form 10-K. ¨
Indicate by check mark whether the registrant is a large accelerated filer, an accelerated filer, a non-accelerated filer, or a smaller reporting company. See definition of "large accelerated filer", "accelerated filer", and "smaller reporting company" in Rule 12b-2 of the Exchange Act. (Check one):
Large accelerated filer | x |
| Accelerated filer | ¨ |
Non-accelerated filer | ¨ (Do not check if a smaller reporting company) |
| Smaller reporting company | ¨ |
Indicate by check mark whether the registrant is a shell company (as defined in Rule 12b-2 of the Act). Yes ¨ No ý
The aggregate market value of the non-voting common stock held by non-affiliates of the registrant as of January 31, 2014, was approximately $1,258,833,135 based on closing sale price of $27.36 per share on that date as reported for the New York Stock Exchange. As of September 24, 2014, there were 47,708,274 outstanding shares of Class A Nonvoting Common Stock (the "Class A Common Stock"), and 3,538,628 shares of Class B Common Stock. The Class B Common Stock, all of which is held by affiliates of the registrant, is the only voting stock.
Table of Contents
INDEX
PART I | Page |
Item.1 Business | 3 |
General Development of Business | 3 |
Financial Information About Industry Segments | 3 |
Narrative Description of Business | 3 |
Overview | 3 |
Research and Development | 5 |
Operations | 6 |
Environment | 6 |
Employees | 6 |
Financial Information About Foreign and Domestic Operations and Export Sales | 6 |
Information Available on the Internet | 6 |
Item 1A. Risk Factors | 7 |
Item 1B. Unresolved Staff Comments | 12 |
Item 2. Properties | 12 |
Item 3. Legal Proceedings | 12 |
Item 4. Mine Safety Disclosures | 12 |
PART II |
|
Item 5. Market for Registrant's Common Equity, Related Stockholder Matters and Issuer Purchases of Equity Securities | 13 |
Item 6. Selected Financial Data | 15 |
Item 7. Management's Discussion and Analysis of Financial Condition and Results of Operations | 16 |
Item 7A. Quantitative and Qualitative Disclosures About Market Risk | 32 |
Item 8. Financial Statements and Supplementary Data | 33 |
Item 9. Changes in and Disagreements With Accountants on Accounting and Financial Disclosure | 73 |
Item 9A. Controls and Procedures | 74 |
Item 9B. Other Information | 76 |
PART III |
|
Item 10. Directors and Executive Officers of the Registrant | 76 |
Item 11. Executive Compensation | 81 |
Compensation Discussion and Analysis | 81 |
Management Development and Compensation Committee Interlocks and Insider Participation | 94 |
Management Development and Compensation Committee Report | 94 |
Compensation Policies and Practices | 95 |
Summary Compensation Table | 95 |
Grants of Plan-Based Awards for 201 4 | 97 |
Outstanding Equity Awards at 2014 Fiscal Year End | 97 |
Option Exercises and Stock Vested for Fiscal 201 4 | 99 |
Non-Qualified Deferred Compensation for Fiscal 201 4 | 100 |
Potential Payments Upon Termination or Change in Control | 100 |
Compensation of Directors | 102 |
Director Compensation Table - Fiscal 201 4 | 103 |
Item 12. Security Ownership of Certain Beneficial Owners and Management and Related Stockholder Matters | 104 |
Item 13. Certain Relationships, Related Transactions, and Director Independence | 106 |
Item 14. Principal Accounting Fees and Services | 107 |
PART IV |
|
Item 15. Exhibits and Financial Statement Schedules | 108 |
Signatures | 114 |
2
PART I
Item 1. Business
(a) General Development of Business
Brady Corporation ("Brady," "Company," "we," "us," "our") was incorporated under the laws of the state of Wisconsin in 1914. The Company's corporate headquarters are located at 6555 West Good Hope Road, Milwaukee, Wisconsin 53223, and the telephone number is (414) 358-6600.
Brady Corporation is a global manufacturer and supplier of identification solutions, specialty materials, and workplace safety products that identify and protect premises, products and people. The ability to provide customers with a broad range of proprietary, customized, and diverse products for use in various applications, along with a commitment to quality and service, a global footprint and multiple sales channels, have made Brady a world leader in many of its markets.
The Company's primary objective is to build upon its market position and increase shareholder value by improving in the following key competencies:
• | Global leadership position in niche markets |
• | Innovation advantage - Internally developed products drive growth and sustain gross profit margins |
• | Operational excellence - Continuous productivity improvement, business simplification and process transformation |
• | Customer service - Focus on the customer and understanding customer needs |
• | Compliance expertise |
Over the last two years, we made significant portfolio and management decisions designed to better position the Company for growth in the future. These changes were a meaningful shift from the more volatile and less profitable consumer electronics Die-Cut business, which was partially divested in fiscal 2014, to an expansion of our core Identification Solutions ("ID Solutions" or "IDS") business to focus on markets with long-term growth trends. In our Workplace Safety ("WPS") business, our strategy to return to growth included a focus on workplace safety critical industries in addition to increased investment in e-commerce expertise.
Key initiatives supporting the strategy in fiscal 2014 included:
• | Enhanced the WPS segment's multi-channel direct marketing model and increased its offering of identification and workplace safety products with a heightened focus on proprietary and customized product offerings. |
• | Increased investment in the WPS segment with an emphasis on e-commerce capabilities. |
• | Modified the healthcare strategy to focus on key accounts, the development of proprietary new products, and expansion of the sales focus on alternate healthcare sites. |
• | Expanded the Company's IDS business through sales force expansion in the United States and EMEA, increased focus on strategic accounts, and developed innovative proprietary new products. |
• | Divested the Company's less profitable Die-Cut business in Asia and Europe. |
• | Reduced the Company's cost structure through the consolidation of selected manufacturing facilities in the Americas and EMEA. |
• | Focused on the development of high quality products and improvements in customer service. |
In fiscal 2014, the Company entered into an agreement with LTI Flexible Products, Inc. (d/b/a Boyd Corporation) for the sale of its Die-Cut business. The first phase of the divestiture closed on May 1, 2014 and included the Company's European Die-Cut business and the portions of the Asia Die-Cut business operated in Korea, Thailand and Malaysia, together with the transfer of certain of the Company's employees in the United States supporting those operations. The second phase of the divestiture was for the Company's Die-Cut businesses located in China and closed on August 1, 2014, subsequent to the fiscal year ended July 31, 2014.
(b) Financial Information About Industry Segments
The information required by this Item is provided in Note 9 of the Notes to Consolidated Financial Statements contained in Item 8 - Financial Statements and Supplementary Data.
(c) Narrative Description of Business
Overview
The Company is organized and managed on a global basis within two business platforms: Identification Solutions and Workplace Safety, which are the reportable segments.
Table of Contents
The IDS segment includes high-performance and innovative identification and healthcare products that are manufactured internally under the Brady brand, and are primarily sold through distribution to a broad range of MRO and OEM customers and through other channels, including direct sales, catalog marketing, and the Internet.
The WPS segment includes workplace safety and compliance products, which are sold under multiple brand names through catalog and e-business to a broad range of MRO customers. Approximately half of the WPS business is resale product and half is manufactured internally.
Below is a summary of sales by reportable segments for the fiscal years ended July 31:
|
| 2014 |
| 2013 |
| 2012 | |||
IDS |
| 67.4 | % |
| 63.8 | % |
| 59.4 | % |
WPS |
| 32.6 | % |
| 36.2 | % |
| 40.6 | % |
Total |
| 100 | % |
| 100 | % |
| 100 | % |
ID Solutions
Within the ID Solutions platform, the primary product categories include:
• | Facility identification, which includes safety signs, pipe markers, labeling systems, spill control products, and lockout/tagout devices |
• | Product identification, which includes materials and printing systems for product identification, brand protection labeling, work in process labeling, and finished product identification |
• | Wire identification, which includes hand-held printers, wire markers, sleeves, and tags |
• | People identification, which includes self-expiring name tags, badges, lanyards, and access control software |
• | Patient identification, which includes wristbands and labels used in hospitals for tracking and improving the safety of patients |
• | Custom wristbands used in the leisure and entertainment industry such as theme parks, concerts and festivals |
Approximately 73% of ID Solutions products are sold under the Brady brand. In the United States, identification products for the utility industry are marketed under the Electromark brand; spill-control products are marketed under the SPC brand; and security and identification badges and systems are marketed under the B.I.G., Identicard/Identicam, STOPware, PromoVision, and Brady People ID brands. Wire identification products are marketed under the Modernotecnica brand in Italy and lockout/tagout products are offered under the Scafftag brand in the U.K. Custom labels and nameplates are available under the Stickolor brand in Brazil; and identification and patient safety products in the healthcare industry and custom wristbands for the leisure and entertainment industry are available under the PDC Innovative brand in the U.S. and Europe.
The ID Solutions platform offers high quality products with rapid response and superior service to provide solutions to customers. The business markets and sells products through multiple channels including distributors, direct sales, catalog marketing, and the Internet. The businesses' sales force partners with end-users and distributors by providing technical application and product expertise.
ID Solutions serves customers in many industries, which include industrial manufacturing, electronic manufacturing, healthcare, chemical, oil, gas, food and beverage, aerospace, defense, mass transit, electrical contractors, leisure and entertainment and telecommunications, among others.
The ID Solutions platform manufactures differentiated, proprietary products, most of which have been internally developed. These internally developed products include materials, printing systems, and software. IDS competes for business principally on the basis of production capabilities, engineering, research and development capabilities, materials expertise, global account management where needed, customer service, product quality and price. Competition is highly fragmented, ranging from smaller companies offering minimal product variety, to some of the world's largest major adhesive and electrical product companies offering competing products as part of their overall product lines.
Workplace Safety
Within the Workplace Safety business platform, the primary product categories are workplace safety and compliance products, which include informational signs, tags, security, safety and traffic compliance related products, first aid supplies, material handling, asset identification, safety and facility identification, and workplace regulatory products.
Products within the Workplace Safety platform are sold under a variety of brands including: safety and facility identification products offered under the Seton, Emedco, Signals, Personnel Concepts, Safety Signs Service and Pervaco brands; first aid supplies under the Accidental Health and Safety, Trafalgar, and Securimed brands; industrial, office equipment under the Runelandhs brand; and wire identification products marketed under the Carroll brand.
4
Table of Contents
Workplace Safety markets and sells products through multiple channels, including catalog, telemarketing and e-commerce. The business serves customers in many industries, including process industries, manufacturers, government, education, construction, and utilities.
The Workplace Safety platform manufactures a broad range of stock and custom identification products, and also sells a broad range of related resale products. Historically, both the Company and many of our competitors focused their businesses on catalog marketing, often with varying product niches. However, the competitive landscape is changing with the continued evolution of e-commerce channels. Many of our competitors extensively utilize e-commerce to promote the sale of their products. A consequence of this shift is price transparency, as prices on non-proprietary products can be easily compared. Dynamic pricing capabilities and enhanced customer experience are critical to convert customers from traditional catalog channels to the Internet.
Discontinued Operations
Discontinued operations include the Asia Die-Cut and Balkhausen Die-Cut businesses ("Die-Cut"), which were announced as held for sale in the third and fourth quarters of fiscal 2013, respectively. In fiscal 2014, the Company entered into an agreement with LTI Flexible Products, Inc. (d/b/a Boyd Corporation) for the sale of Die-Cut. The first phase of the divestiture closed in May 2014 and the second phase of the divestiture closed in August 2014. The assets and liabilities of the businesses included in the second phase were classified as held for sale on the consolidated balance sheet as of July 31, 2014. The operating results of the Die-Cut businesses were reflected as discontinued operations in the consolidated statements of earnings for the years ended July 31, 2014, 2013 and 2012. In addition, the following previously divested businesses were reported within discontinued operations: Brady Medical and Varitronics (divested in fiscal 2013) and Etimark (divested in fiscal 2012). These divested businesses were part of the IDS business platform.
The Die-Cut business consisted of the manufacture and sale of precision converted products such as gaskets, meshes, heat-dissipation materials, antennae, dampers, filters, and similar products sold primarily to the electronics industry with a concentration in the mobile-handset and hard-disk drive industries and other traditional die-cut parts and thermal management products used in the automotive, electronics and telecommunications industries. Products within the Die-Cut business were sold primarily under the Brady brand, with some European business marketed under the Balkhausen brand. The business sold through a technical direct sales force and was supported by global strategic account management. The Die-Cut business served customers in many industries, including mobile handset, hard disk drive, consumer electronics, and other computing devices, as well as products for the automotive and medical equipment industries.
Research and Development
The Company focuses its research and development ("R&D") efforts on pressure sensitive materials, printing systems and software, and it mainly supports the IDS segment. Material development involves the application of surface chemistry concepts for top coatings and adhesives applied to a variety of base materials. Systems design integrates materials, embedded software and a variety of printing technologies to form a complete solution for customer applications. In addition, the research and development team supports production and marketing efforts by providing application and technical expertise.
The Company owns patents and tradenames relating to certain products in the United States and internationally. Although the Company believes that patents are a significant driver in maintaining its position for certain products, technology in the areas covered by many of the patents continues to evolve and may limit the value of such patents. The Company's business is not dependent on any single patent or group of patents. Patents applicable to specific products extend for up to 20 years according to the date of patent application filing or patent grant, depending upon the legal term of patents in the various countries where patent protection is obtained. The Company's tradenames are valid ten years from the date of registration, and are typically renewed on an ongoing basis.
The Company spent $35.0 million , $33.6 million , and $34.5 million during the fiscal years ended July 31, 2014 , 2013 , and 2012 , respectively, on its R&D activities related to continuing operations. The increase in R&D spending in 2014 was primarily due to increased investment in new products. In addition, in fiscal 2014, the Company realigned the R&D processes in order to accelerate new product innovation and invested in emerging technologies such as RFID and sensing technology for harsh environments and mobile applications that allow users to work with a variety of electronic devices. As of July 31, 2014 , 198 employees were engaged in research and development activities for the Company.
5
Table of Contents
Operations
The materials used in the products manufactured consist primarily of a variety of plastic and synthetic films, paper, metal and metal foil, cloth, fiberglass, inks, dyes, adhesives, pigments, natural and synthetic rubber, organic chemicals, polymers, and solvents for consumable identification products in addition to electronic components, molded parts and sub-assemblies for printing systems. The Company operates a coating facility that manufactures bulk rolls of label stock for internal and external customers. In addition, the Company purchases finished products for resale.
The Company purchases raw materials, components and finished products from many suppliers. Overall, the Company is not dependent upon any single supplier for its most critical base materials or components; however, the Company has chosen in certain situations to sole source, or limit the sources of materials, components, or finished items for design or cost reasons. As a result, disruptions in supply could have an impact on results for a period of time, but we believe any disruptions would simply require qualification of new suppliers and the disruption would be modest. In certain instances, the qualification process could be more costly or take a longer period of time and in rare circumstances, such as a global shortage of critical materials or components, the financial impact could be significant. The Company currently operates 50 manufacturing or distribution facilities globally.
The Company carries working capital mainly related to accounts receivable and inventory. Inventory consists of raw materials, work in process and finished goods. Generally, custom products are made to order while an on-hand quantity of stock product is maintained to provide customers with timely delivery. Normal and customary payment terms range from net 30 to 90 days from date of invoice and varies by geographies.
The Company has a broad customer base, and no individual customer is 5% or more of total net sales.
Average delivery time for customer orders varies from same-day delivery to one month, depending on the type of product, customer request, and whether the product is stock or custom-designed and manufactured. The Company's backlog is not material, does not provide significant visibility for future business and is not pertinent to an understanding of the business.
Environment
Compliance with federal, state and local environmental protection laws during fiscal 2014 did not have a material impact on the Company's business, financial condition or results of operations.
Employees
As of July 31, 2014 , the Company employed approxima tely 7,200 ind ividuals. Brady has never experienced a material work stoppage due to a labor dispute and considers its relations with employees to be good.
(d) Financial Information About Foreign and Domestic Operations and Export Sales
The information required by this Item is provided in Note 9 of the Notes to Consolidated Financial Statements contained in Item 8 - Financial Statements and Supplementary Data.
(e) Information Available on the Internet
The Company's Corporate Internet address is http://www.bradycorp.com. The Company makes available, free of charge, on or through its Internet website copies of its Annual Report on Form 10-K, Quarterly Reports on Form 10-Q, Current Reports on Form 8-K, and amendments to all such reports as soon as reasonably practicable after such reports are electronically filed with or furnished to the SEC. The Company is not including the information contained on or available through its website as part of, or incorporating such information by reference into, this Annual Report on Form 10-K.
6
Table of Contents
Item 1A. Risk Factors
Investors should carefully consider the risks set forth below and all other information contained in this report and other documents we file with the SEC. The risks and uncertainties described below are those that we have identified as material, but are not the only risks and uncertainties facing us. Our business is also subject to general risk and uncertainties that affect many other companies, such as market conditions, geopolitical events, changes in laws or accounting rules, fluctuations in interest rates, terrorism, wars or conflicts, major health concerns, natural disasters or other disruptions of expected economic or business conditions. Additional risks and uncertainties not currently known to us or that we currently believe are immaterial also may impair our business, including our results of operations, liquidity and financial conditions.
Business Risks
Failure to successfully implement our strategy in the Healthcare sector, or if successfully implemented, failure to realize the benefits expected from the strategy, may adversely affect our business, sales, results of operations, cash flow and liquidity.
In December 2012, Brady acquired Precision Dynamics Corporation ("PDC") to establish a base for our healthcare strategy. In fiscal 2014, PDC represented 12.5% of our total sales from continuing operations. Sales declined approximately 2% at PDC in fiscal 2014 and the healthcare industry continues to be in a state of change with the uncertainty relating to government healthcare reforms. During fiscal 2014, we recorded impairment charges of $148.6 million, primarily related to the goodwill and other intangible assets in the PeopleID reporting unit, which consists primarily of the PDC business. The Company's strategy to grow this business includes: key account focus offering customers a broad range of products to meet their complete identification needs, development and launch of proprietary new products, full continuum of care in the healthcare industry, and international sales penetration. There is a risk that the Company will not be able to return the business to growth and grow the business consistently, the strategy will fail, or the business will face increased levels of competition and pricing pressure. If these risks materialize, their effects could adversely impact our business, sales, results of operations, cash flow and liquidity.
Failure to successfully implement our Workplace Safety strategy, or if successfully implemented, failure to realize the benefits expected from the strategy, may adversely affect our business, sales, results of operations, cash flow and liquidity.
In fiscal 2014, the Workplace Safety segment represented 32.6% of our total sales from continuing operations. Beginning in the second quarter of fiscal 2012, the WPS segment experienced deterioration in sales and profits due to a reduction in direct catalog mailings, increased e-commerce competition, and pricing adjustments. While traditional direct marketing channels such as catalogs are important means of selling WPS products, an increasing number of customers are purchasing products on the Internet. The Company's strategy to grow this business includes: increased volume of catalog mailings, expanded e-commerce presence, further developed pricing capabilities, growing the customer base, and the expansion of products offered. The rate of sales decline in fiscal 2014 lessened each quarter and the segment returned to positive organic growth of 0.9% in the fourth quarter of fiscal 2014 as the strategy began to take hold. There is a risk that the Company will not continue to successfully implement this strategy, or if successfully implemented, not realize its expected benefits, due to the continued levels of increased competition and pricing pressure brought about by the Internet. There is also a risk that the Company may not be able to permanently reverse the downward trends in this business and return the segment to historic levels of sales and profits. If these risks materialize, their effects could adversely impact our business, sales, results of operations, cash flow and liquidity.
Failure to compete effectively or remain competitive may have a negative impact on our business, sales, results of operations, cash flow and liquidity.
We actively compete with companies that produce and market the same or similar products, and in some instances, with companies that sell different products that are designed for the same end user. Additionally, we continue to face competition through the Internet in our entire business. Competition may force us to reduce prices or incur additional costs to remain competitive. We compete on the basis of price, customer support, product innovation, product offering, product quality, expertise, production capabilities, and for multinational customers, our global footprint. Present or future competitors may develop and introduce new and enhanced products, offer products based on alternative technologies and processes , accept lower profit, have greater financial, technical or other resources, or lower production costs or other pricing advantages. Any of these could put us at a disadvantage by threatening our share of sales or reducing our profit margins, which could adversely impact our results of operations, cash flow and liquidity. Additionally, throughout our global business, distributors and customers may seek lower cost sourcing opportunities, which could result in a loss of business that may adversely impact our business, sales, results of operations, cash flow and liquidity.
Failure to successfully complete our facility consolidation plans may adversely impact our business, sales, results of operations, cash flow and liquidity.
We continue to implement measures to reduce our cost structure, simplify our business structure, and standardize our processes. In fiscal 2013, we incurred approximately $26 million in restructuring costs associated with the reorganization of the
7
Table of Contents
Company along global product lines, which included the standardization of business systems and a restructuring of the global workforce. At the end of fiscal 2013 and into fiscal 2014, our focus turned to the consolidation of facilities, which resulted in approximately $15 million of restructuring expense in fiscal 2014. Facility consolidation activities will extend into fiscal 2015 as we slowed certain consolidation activities to ensure the highest levels of quality and delivery throughout the transition. Successfully completing the facilities consolidations is critical to our future competitiveness and to improve profitability. Facility consolidations will result in a higher concentration of operations in certain locations. Risks related to facility consolidations include poor execution impacting customer service, customer acceptance of these changes, inability to implement standard processes and systems, resource allocation among competing priorities, employee disruption and turnover, inability to manufacture and supply products in the event of a material casualty event at one of our principal facilities, and additional or higher than anticipated charges related to these actions. These actions to reduce our cost structure and the charges related to these actions could have a material adverse impact on our business, sales, results of operations, cash flow and liquidity.
Deterioration of or instability in the global economy and financial markets may adversely affect our business, sales, results of operations, cash flow and liquidity.
Our business and operating results could be affected by global economic conditions. In fiscal 2013, our business was negatively impacted by the weak economy in Europe, Australia and Brazil. In fiscal 2014, Brazil continued to weaken. When global economic conditions deteriorate or economic uncertainty continues, customers and potential customers may experience deterioration of their businesses, which may result in the delay or cancellation of plans to purchase our products. Our sensitivity to economic cycles and any related fluctuations in the businesses of our customers or potential customers could have a material adverse impact on our business, sales, results of operations, cash flow and liquidity.
Our failure or the failure of third-party service providers to protect our sites, networks and systems against security breaches, or otherwise to protect our confidential information, may substantially harm our business, sales, results of operations, cash flow and liquidity.
Our business systems collect, maintain, transmit and store data about our customers, vendors and others, including credit card information and personally identifiable information, as well as other confidential and proprietary information. We also employ third-party service providers that store, process and transmit proprietary, personal and confidential information on our behalf. We rely on encryption and authentication technology licensed from third parties in an effort to securely transmit confidential and sensitive information, including credit card numbers. Our security measures, and those of our third-party service providers, may not detect or prevent all attempts to hack our systems, denial-of-service attacks, viruses, malicious software, break-ins, phishing attacks, social engineering, security breaches or other attacks and similar disruptions that may jeopardize the security of information stored in or transmitted by our sites, networks and systems or that we or our third-party service providers otherwise maintain. We and our service providers may not have the resources or technical sophistication to anticipate or prevent all types of attacks, and techniques used to obtain unauthorized access to or sabotage systems change frequently and may not be known until launched against us or our third-party service providers. In addition, security breaches can also occur as a result of non-technical issues, including intentional or inadvertent breaches by our employees or by persons with whom we have commercial relationships. Although we maintain privacy, data breach and network security liability insurance, we cannot be certain that our coverage will be adequate for liabilities actually incurred or that insurance will continue to be available to us on economically reasonable terms, or at all. Any compromise or breach of our security measures, or those of our third-party service providers, could adversely impact our ability to conduct business, violate applicable privacy, data security and other laws, and cause significant legal and financial exposure, adverse publicity, and a loss of confidence in our security measures, which could have an adverse and material effect on our business, sales, results of operations, cash flow and liquidity.
The global nature of our business exposes us to foreign currency fluctuations that could adversely affect sales, results of operations, cash flow, and liquidity.
Approximately 50% of our sales are derived outside the United States. Sales and purchases in currencies other than the U.S. dollar expose us to fluctuations in foreign currencies relative to the U.S. dollar, and may adversely affect our financial statements. Increased strength of the U.S. dollar will increase the effective price of our products sold in currencies other than U.S. dollars into other countries. Decreased strength of the U.S. dollar could adversely affect the cost of materials, products, and services purchased overseas. Our sales and expenses are translated into U.S. dollars for reporting purposes, and the strengthening or weakening of the U.S. dollar could result in unfavorable translation effects. In addition, certain of our subsidiaries may invoice customers in a currency other than its functional currency, which could result in unfavorable translation effects on sales, results of operations, cash flow and liquidity.
8
Table of Contents
Failure to develop new products or gain acceptance of new products could adversely impact our sales, results of operations, cash flow and liquidity.
Development of proprietary products is a driver of core growth and reasonable gross profit margins both currently and in the future, particularly within our ID Solutions segment. Therefore, we must continue to develop new and innovative products, as well as acquire and retain the necessary intellectual property rights in these products. We continue to invest in the development and marketing of new products. These expenditures do not always result in products that will be accepted by our customers. Failure to develop successful new products may also cause customers to buy from a competitor or may cause us to lower our prices in order to compete. If we fail to make innovations, if we launch products with quality problems, or if customers do not accept our new products, then our sales, results of operations, cash flows, and liquidity could be adversely affected.
Inability to identify, complete, and integrate acquisitions and grow acquired companies, may adversely impact our sales, results of operations, cash flow and liquidity.
Our historical growth has included acquisitions, and our future growth strategy may include acquisition opportunities. For example, in fiscal 2013 the Company acquired PDC, a manufacturer of identification products primarily for the healthcare sector, for $301.2 million. We have not met the sales growth synergies identified at the time of the PDC acquisition, which, in addition to other factors, resulted in the Company recording impairment charges of $148.6 million during fiscal 2014, primarily related to the goodwill and other intangible assets in the PeopleID reporting unit, which consists primarily of the PDC business. Failure to achieve these synergies for PDC or other acquired companies may adversely impact our sales, results of operations, cash flow and liquidity. We may not focus on acquisitions as part of our growth strategy, or if we do, we may not be able to identify acquisition targets or successfully complete acquisitions in the future due to the absence of quality companies in our target markets, economic conditions, or price expectations from sellers. If we do not complete additional acquisitions, our growth may be limited.
Acquisitions place significant demands on management, operational, and financial resources. Recent and future acquisitions will require integration of operations, sales and marketing, information technology, finance, and administrative operations, which could decrease the time available to focus on our other growth strategies. We cannot assure that we will be able to successfully integrate acquisitions, that these acquisitions will operate profitably, or that we will be able to achieve the desired sales growth or operational success. Our sales, results of operations, cash flow, and liquidity could be adversely affected if we do not successfully integrate the newly acquired businesses, or if our other businesses suffer due to the increased focus on the acquired businesses.
Demand for our products may be adversely affected by numerous factors, some of which we cannot predict or control. This could adversely affect our sales, results of operations, cash flow and liquidity.
Numerous factors may affect the demand for our products, including:
• Future financial performance of major markets served
• Consolidation in the marketplace, allowing competitors and customers to be more efficient and more price competitive
• Future competitors entering the marketplace
• | Decreasing product life cycles |
• | Changes in customer preferences |
If any of these factors occur, the demand for our products could suffer, and this could adversely impact our sales, results of operations, cash flows and liquidity.
A large customer loss could significantly affect sales, results of operations, cash flow, and liquidity.
While we have a broad customer base and no individual customer represents 5% or more of total sales, we conduct business with several large customers and distribution companies. Our dependence on these customers makes relationships with them important. We cannot guarantee that these relationships will be retained in the future. Because these large customers account for a significant portion of sales, they may possess a greater capacity to negotiate reduced prices. If we are unable to provide products to our customers at the quality and prices acceptable to them, some of our customers may shift their business to competitors or may substitute another manufacturer's products. If one of the large customers consolidates, is acquired, or loses market share, the result of that event may have an adverse impact on our business. The loss of or reduction of business from one or more of these large customers could have a material adverse impact on our sales, results of operations, cash flows, and liquidity.
We depend on key employees and the loss of these individuals could have an adverse effect on our operations.
Our success depends to a large extent upon the continued services of our key executives, managers and other skilled employees. Over the past two fiscal years, we have experienced the loss of several key executives. We cannot ensure that we will be able to retain our key executives, managers and employees. The departure of our key personnel without adequate replacement could disrupt our business operations. Additionally, we need qualified managers and skilled employees with technical and industry
9
Table of Contents
experience to operate our business successfully. If we are unable to attract and retain qualified individuals or our costs to do so increase significantly, our operations could be materially adversely affected.
Divestitures could negatively impact our business and contingent liabilities from divested businesses could adversely affect our results of operations, cash flow and liquidity.
We continually assess the strategic fit of our existing businesses and may divest businesses that we determine do not align with our strategic plan, or that are not achieving the desired return on investment. For example, over the last three fiscal years, we have divested our Etimark, Brady Medical, and Varitronics businesses, and our Asia Die-Cut and Balkhausen Die-Cut businesses. Divestitures pose risks and challenges that could negatively impact our business. For example, when we decide to sell a business or assets, we may be unable to do so on satisfactory terms and within our anticipated time-frame, and even after reaching a definitive agreement to sell a business, the sale is typically subject to satisfaction of pre-closing conditions which may not be satisfied. In addition, the impact of the divestiture on our revenue and net earnings may be larger than projected, which could distract management, and disputes may arise with buyers. Also, we have retained responsibility for and have agreed to indemnify buyers against some contingent liabilities related to a number of businesses that we have recently sold. The resolution of these contingencies has not had a material adverse impact on our results of operations, cash flow and liquidity, but we cannot be certain that this favorable pattern will continue.
We are a global company headquartered in the United States. We are subject to extensive regulations by U.S. and non-U.S. governmental and self-regulatory entities at various levels of the governing bodies. Failure to comply with laws and regulations could adversely affect our sales, results of operations, cash flow and liquidity.
Our operations are subject to the risks of doing business domestically and globally, including the following:
• | Delays or disruptions in product deliveries and payments in connection with international manufacturing and sales |
• | Political and economic instability and disruptions |
• | Imposition of duties and tariffs |
• | Import, export and economic sanction laws |
• | Current and changing governmental policies, regulatory, and business environments |
• | Disadvantages from competing against companies from countries that are not subject to U.S. laws and regulations, including the Foreign Corrupt Practices Act |
• | Local labor market conditions |
• | Regulations relating to climate change, air emissions, wastewater discharges, handling and disposal of hazardous materials and wastes |
• | Regulations relating to health, safety and the protection of the environment |
• | Specific country regulations where our products are manufactured or sold |
• | Laws and regulations that apply to companies doing business with the government, including audit requirements of government contracts related to procurement integrity, export control, employment practices, and the accuracy of records and recording of costs |
Further , these laws and regulations are constantly evolving and it is impossible to accurately predict the effect they may have upon our sales, results of operations, cash flows and liquidity.
We cannot provide assurance that our internal controls and compliance systems will always protect us from acts committed by employees, agents or business partners that would violate U.S. and/or non-U.S. laws, including the laws governing payments to government officials, bribery, fraud, anti-kickback and false claims rules, competition, export and import compliance, money laundering and data privacy. Any such improper actions could subject us to civil or criminal investigations in the U.S. and in other jurisdictions, could lead to substantial civil or criminal, monetary and non-monetary penalties and related shareholder lawsuits, could damage our reputation, and could adversely impact our results of operations, cash flow and liquidity.
Product liability claims could adversely impact our financial condition, results of operations, cash flows, and reputation.
Our business exposes us to potential product liability risk, as well as warranty and recall claims that are inherent in the design, manufacture, sale and use of our products. We sell products in industries such as aerospace, defense, healthcare, chemical, and energy where the impact of product liability risk is high. To date, we have not incurred material costs related to these types of claims. However, in the event our products actually or allegedly fail to perform as expected and we are subject to such claims above the amount of insurance coverage, outside the scope of our coverage, or for which we do not have coverage, our financial condition, results of operations and cash flows, as well as our reputation, could be materially and adversely affected.
10
Table of Contents
Financial/Ownership Risks
Failure to execute our strategies could result in impairment of goodwill or other intangible assets, which may negatively impact earnings and profitability .
We have goodwill of $ 515.0 million and other intangible assets of $91.0 million as of July 31, 2014, which represents 48.3% of our total assets. During fiscal 2014, we recorded impairment charges of $148.6 million , primarily related to the goodwill and other intangible assets in the PeopleID reporting unit. During fiscal 2013, we recorded impairment charges of $204.4 million primarily related to goodwill in the WPS Americas and IDS APAC reporting units. We evaluate goodwill for impairment on an annual basis, or more frequently if impairment indicators are present, based upon the fair value of each reporting unit. We assess the impairment of other intangible assets on an annual basis, or more frequently if impairment indicators are present, based upon the expected future cash flows of the respective assets. These valuations include management's estimates of sales, profitability, cash flow generation, capital structure, cost of debt, interest rates, capital expenditures, and other assumptions. Significant negative industry or economic trends, disruptions to our business, inability to achieve sales projections or cost savings, inability to effectively integrate acquired businesses, unexpected significant changes or planned changes in use of the assets or in entity structure, and divestitures may adversely impact the assumptions used in the valuations. If the estimated fair value of our reporting units changes in future periods, we may be required to record an impairment charge related to goodwill or other intangible assets, which would reduce earnings and profit in such period.
Changes in tax legislation or tax rates could adversely affect results of operations and financial statements. Additionally, audits by taxing authorities could result in tax payments for prior periods.
We are subject to income taxes in the U.S. and in many non-U.S. jurisdictions. As such, our earnings are subject to risk due to changing tax laws and tax rates around the world. At any point in time, there are a number of tax proposals at various stages of legislation throughout the globe. While it is impossible for us to predict whether some or all of these proposals will be enacted, it likely would have an impact on our earnings.
Our tax filings are subject to audit by U.S. federal, state and local tax authorities and by non-U.S. tax authorities. If these audits result in payments or assessments that differ from our reserves, our future net earnings may be adversely impacted.
We review the probability of the realization of our deferred tax assets on a quarterly basis based on forecasts of taxable income in both the U.S. and foreign jurisdictions. As part of this review, we utilize historical results, projected future operating results, eligible carry-forward periods, tax planning opportunities, and other relevant considerations. Adverse changes in profitability and financial outlook in both the U.S. and/or foreign jurisdictions, or changes in our geographic footprint may require changes in the valuation allowances in order to reduce our deferred tax assets. Such changes could result in a material impact on earnings.
Our annual cash needs could require us to repatriate cash to the U.S. from foreign jurisdictions, which may result in tax charges. For example, in fiscal 2014, we repatriated cash to the U.S. in connection with the sale of the Die Cut businesses, which resulted in a tax charge of $4.0 million in continuing operations. In fiscal 2013, we repatriated cash to the U.S. in connection with the acquisition of PDC, which resulted in a tax charge of $26.6 million.
Substantially all of our voting stock is controlled by members of the Brady family, while our public investors hold non-voting stock. The interests of the voting and non-voting shareholders could differ, potentially resulting in decisions that unfavorably affect the value of the non-voting shares.
Substantially all of our voting stock is controlled by Elizabeth P. Pungello, one of the Directors, and William H. Brady III, both of whom are descendants of the Company's founder. All of our publicly traded shares are non-voting. Therefore, Ms. Pungello and Mr. Brady have control in most matters requiring approval or acquiescence by shareholders, including the composition of our Board of Directors and many corporate actions. Such concentration of ownership may discourage a potential acquirer from making a purchase offer that our public shareholders may find favorable, which in turn could adversely affect the market price of our common stock or prevent our shareholders from realizing a premium over our stock price. Furthermore, this concentration of voting share ownership may adversely affect the trading price for our non-voting common stock because investors may perceive disadvantages in owning stock in companies whose voting stock is controlled by a limited number of shareholders.
Failure to meet certain financial covenants required by our debt agreements may adversely affect our assets, results of operations, cash flows, and liquidity.
As of July 31, 2014, we had $263.2 million in outstanding indebtedness. In addition, based on the availability under our credit facilities as of July 31, 2014, we had the ability to incur an additional $404.4 million under our revolving credit agreement. Our current revolving credit agreement and long-term debt obligations also impose certain restrictions on us. Refer to Management's
11
Table of Contents
Discussion and Analysis of Financial Condition and Results of Operations ("MD&A") within Item 7 for more information regarding our credit agreement and long-term debt obligations. If we breach any of these restrictions or covenants and do not obtain a waiver from the lenders, then subject to applicable cure periods, the outstanding indebtedness (and any other indebtedness with cross-default provisions) could be declared immediately due and payable, which could adversely affect our assets, results of operations, cash flows and liquidity.
Item 1B. Unresolved Staff Comments
None.
Item 2. Properties
The Company currently operates 50 manufacturing or distribution facilities across the globe and are split by reporting segment as follows:
IDS: Thirty-seven facilities are used for our IDS business. Ten of which are located within the United States; five each are located in Belgium and Mexico; four in China; three each in the United Kingdom and Brazil; and one each in Canada, India, Italy, Hong Kong, Japan, Malaysia, and Singapore.
WPS: Thirteen facilities are used for our WPS business. Three of which are located in France; two each are located in Australia, Germany, and the United States; and one each in the Netherlands, Poland, Sweden, and the United Kingdom.
The Company's present operating facilities contain a total of approximately 2.8 million square feet of space, of which approximately 2.1 million square feet is leased. The Company believes that its equipment and facilities are modern, well maintained, and adequate for present needs.
Item 3. Legal Proceedings
The Company is, and may in the future be, party to litigation arising in the normal course of business. The Company is not currently a party to any material pending legal proceedings in which management believes the ultimate resolution would have a material effect on the Company's consolidated financial statements.
Item 4. Mine Safety Disclosures
Not applicable.
12
Table of Contents
PART II
Item 5. Market for Registrant's Common Equity, Related Stockholder Matters and Issuer Purchases of Equity Securities
(a) | Market Information |
Brady Corporation Class A Nonvoting Common Stock trades on the New York Stock Exchange under the symbol BRC. The following table sets forth the range of high and low daily closing sales prices for the Company's Class A stock as reported on the New York Stock Exchange for each of the quarters in the fiscal years ended July 31:
|
| 2014 |
| 2013 |
| 2012 | ||||||||||||||||||
|
| High |
| Low |
| High |
| Low |
| High |
| Low | ||||||||||||
4th Quarter |
| $ | 30.75 | |
| $ | 24.26 | |
| $ | 35.58 | |
| $ | 29.76 | |
| $ | 31.28 | |
| $ | 25.15 | |
3rd Quarter |
| $ | 27.89 | |
| $ | 25.15 | |
| $ | 36.33 | |
| $ | 31.51 | |
| $ | 34.37 | |
| $ | 29.41 | |
2nd Quarter |
| $ | 31.61 | |
| $ | 27.36 | |
| $ | 35.00 | |
| $ | 30.18 | |
| $ | 34.40 | |
| $ | 27.09 | |
1st Quarter |
| $ | 35.54 | |
| $ | 29.19 | |
| $ | 31.22 | |
| $ | 26.34 | |
| $ | 32.24 | |
| $ | 24.73 | |
There is no trading market for the Company's Class B Voting Common Stock.
(b) | Holders |
As of September 24, 2014 , there were 1,023 Class A Common Stock shareholders of record and approximately 10,467 beneficial shareholders. There are three Class B Common Stock shareholders.
(c) | Issuer Purchases of Equity Securities |
The Company has a share repurchase program of the Company's Class A Nonvoting Common Stock. The plan may be implemented by purchasing shares in the open market or in privately negotiated transactions, with repurchased shares available for use in connection with the Company's stock-based plans and for other corporate purposes. During the three months ended July 31, 2014 , the Company purchased 287,717 shares of its Class A Nonvoting Common Stock under this plan for $7.2 million . As of July 31, 2014 , there remained 966,242 shares to purchase in connection with this share repurchase program.
Period |
| Total Number of Shares Purchased |
| Average Price Paid per Share |
| Total Number of Shares Purchased as Part of Publicly Announced Plans |
| Maximum Number of Shares that May Yet Be Purchased Under the Plan | |||||
May 1, 2014 - May 31, 2014 |
| 287,717 | |
| $ | 25.18 | |
| 287,717 | |
| 966,242 | |
June 1, 2014 - June 30, 2014 |
| - | |
| - | |
| - | |
| 966,242 | ||
July 1, 2014 - July 31, 2014 |
| - | |
| - | |
| - | |
| 966,242 | ||
Total |
| 287,717 | |
| $ | 25.18 | |
| 287,717 | |
| 966,242 | |
(d) | Dividends |
The Company has historically paid quarterly dividends on outstanding common stock. Before any dividend may be paid on the Class B Common Stock, holders of the Class A Common Stock are entitled to receive an annual, noncumulative cash dividend of $0.01665 per share (subject to adjustment in the event of future stock splits, stock dividends or similar events involving shares of Class A Common Stock). Thereafter, any further dividend in that fiscal year must be paid on all shares of Class A Common Stock and Class B Common Stock on an equal basis. The Company believes that based on its historic dividend practice, this requirement will not impede it in following a similar dividend practice in the future.
During the two most recent fiscal years and for the first quarter of fiscal 2015 , the Company declared the following dividends per share on its Class A and Class B Common Stock for the years ended July 31:
|
| 2015 |
| 2014 |
| 2013 | ||||||||||||||||||||||||||||||
|
| 1st Qtr |
| 1st Qtr |
| 2nd Qtr |
| 3rd Qtr |
| 4th Qtr |
| 1st Qtr |
| 2nd Qtr |
| 3rd Qtr |
| 4th Qtr | ||||||||||||||||||
Class A |
| $ | 0.20 | |
| $ | 0.195 | |
| $ | 0.195 | |
| $ | 0.195 | |
| $ | 0.195 | |
| $ | 0.19 | |
| $ | 0.19 | |
| $ | 0.19 | |
| $ | 0.19 | |
Class B |
| 0.18335 | |
| 0.17835 | |
| 0.195 | |
| 0.195 | |
| 0.195 | |
| 0.17335 | |
| 0.19 | |
| 0.19 | |
| 0.19 | | |||||||||
13
Table of Contents
(e) | Common Stock Price Performance Graph |
The graph below shows a comparison of the cumulative return over the last five fiscal years had $100 been invested at the close of business on July 31, 2009 , in each of Brady Corporation Class A Common Stock, the Standard & Poor's (S&P) 500 Index, the Standard and Poor's SmallCap 600 Index, and the Russell 2000 Index.
Comparison of 5 Year Cumulative Total Return*
Among Brady Corporation, the S&P 500 Index,
the S&P SmallCap 600 Index, and the Russell 2000 Index
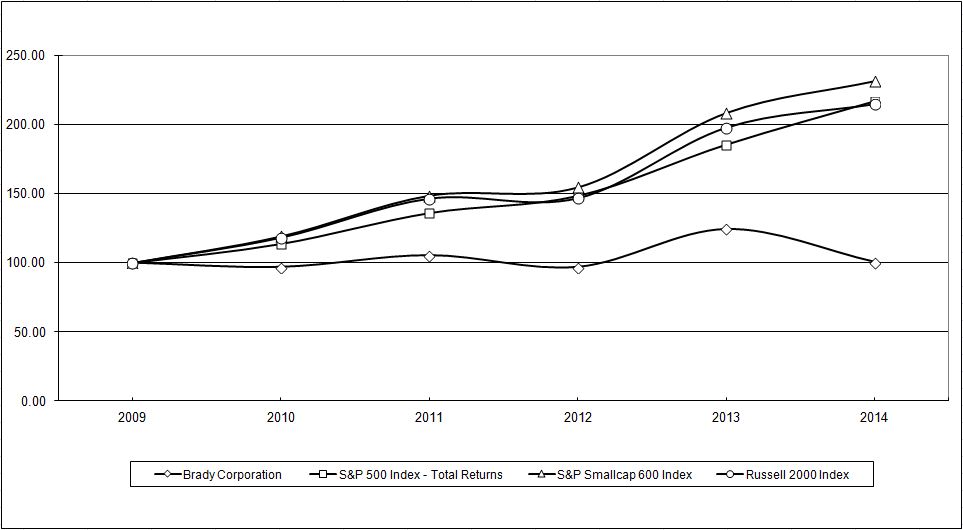
* | $100 invested on July 31, 2009 in stock or index-including reinvestment of dividends. Fiscal years ended July 31: |
|
| 2009 |
| 2010 |
| 2011 |
| 2012 |
| 2013 |
| 2014 | ||||||||||||
Brady Corporation |
| $ | 100.00 | |
| $ | 96.90 | |
| $ | 105.43 | |
| $ | 96.91 | |
| $ | 124.47 | |
| $ | 100.49 | |
S&P 500 Index |
| 100.00 | |
| 113.84 | |
| 136.21 | |
| 148.64 | |
| 185.80 | |
| 217.28 | | ||||||
S&P SmallCap 600 Index |
| 100.00 | |
| 119.17 | |
| 148.63 | |
| 154.56 | |
| 208.31 | |
| 231.31 | | ||||||
Russell 2000 Index |
| 100.00 | |
| 118.33 | |
| 146.65 | |
| 146.94 | |
| 198.06 | |
| 215.02 | | ||||||
Copyright (C) 2014, Standard & Poor's, a division of The McGraw-Hill Companies, Inc. All rights reserved.
14
Table of Contents
Item 6. Selected Financial Data
CONSOLIDATED STATEMENTS OF INCOME AND SELECTED FINANCIAL DATA
Years Ended July 31, 2010 through 2014
|
| 2014 |
| 2013 |
| 2012 |
| 2011 |
| 2010 | ||||||||||
Operating Data (1) |
|
|
|
|
|
|
|
|
|
| ||||||||||
Net Sales |
| $ | 1,225,034 | |
| $ | 1,157,792 | |
| $ | 1,071,504 | |
| $ | 1,059,355 | |
| $ | 966,070 | |
Gross Margin |
| 609,564 | |
| 609,348 | |
| 590,969 | |
| 587,950 | |
| 546,413 | | |||||
Operating Expenses: |
|
|
|
|
|
|
|
|
|
| ||||||||||
Research and development |
| 35,048 | |
| 33,552 | |
| 34,528 | |
| 38,268 | |
| 38,279 | | |||||
Selling, general and administrative |
| 452,164 | |
| 427,858 | |
| 392,694 | |
| 397,472 | |
| 381,071 | | |||||
Restructuring charges (2) |
| 15,012 | |
| 26,046 | |
| 6,084 | |
| 6,451 | |
| 12,640 | | |||||
Impairment charges (3) |
| 148,551 | |
| 204,448 | |
| - | |
| - | |
| - | | |||||
Total operating expenses |
| 650,775 | |
| 691,904 | |
| 433,306 | |
| 442,191 | |
| 431,990 | | |||||
Operating (Loss) Income |
| (41,211 | ) |
| (82,556 | ) |
| 157,663 | |
| 145,759 | |
| 114,423 | | |||||
Other Income (Expense): |
|
|
|
|
|
|
|
|
|
| ||||||||||
Investment and other income-net |
| 2,402 | |
| 3,523 | |
| 2,082 | |
| 3,989 | |
| 1,169 | | |||||
Interest expense |
| (14,300 | ) |
| (16,641 | ) |
| (19,090 | ) |
| (22,124 | ) |
| (21,222 | ) | |||||
Net other expense |
| (11,898 | ) |
| (13,118 | ) |
| (17,008 | ) |
| (18,135 | ) |
| (20,053 | ) | |||||
(Loss) earnings from continuing operations before income taxes |
| (53,109 | ) |
| (95,674 | ) |
| 140,655 | |
| 127,624 | |
| 94,370 | | |||||
Income Taxes (4) |
| (4,963 | ) |
| 42,583 | |
| 37,162 | |
| 21,667 | |
| 18,605 | | |||||
(Loss) earnings from continuing operations |
| $ | (48,146 | ) |
| $ | (138,257 | ) |
| $ | 103,493 | |
| $ | 105,957 | |
| $ | 75,765 | |
Earnings (loss) from discontinued operations, net of income taxes (5) |
| 2,178 | |
| (16,278 | ) |
| (121,404 | ) |
| 2,695 | |
| 6,191 | | |||||
Net (loss) earnings |
| $ | (45,968 | ) |
| $ | (154,535 | ) |
| $ | (17,911 | ) |
| $ | 108,652 | |
| $ | 81,956 | |
(Loss) earnings from continuing operations per Common Share- (Diluted): |
|
|
|
|
|
|
|
|
|
| ||||||||||
Class A nonvoting |
| $ | (0.93 | ) |
| $ | (2.70 | ) |
| $ | 1.95 | |
| $ | 1.99 | |
| $ | 1.43 | |
Class B voting |
| $ | (0.95 | ) |
| $ | (2.71 | ) |
| $ | 1.94 | |
| $ | 1.97 | |
| $ | 1.41 | |
Earnings (loss) from discontinued operations per Common Share - (Diluted): |
|
|
|
|
|
|
|
|
|
| ||||||||||
Class A nonvoting |
| $ | 0.04 | |
| $ | (0.32 | ) |
| $ | (2.29 | ) |
| $ | 0.05 | |
| $ | 0.12 | |
Class B voting |
| $ | 0.05 | |
| $ | (0.32 | ) |
| $ | (2.30 | ) |
| $ | 0.05 | |
| $ | 0.12 | |
Cash Dividends on: |
|
|
|
|
|
|
|
|
|
| ||||||||||
Class A common stock |
| $ | 0.78 | |
| $ | 0.76 | |
| $ | 0.74 | |
| $ | 0.72 | |
| $ | 0.70 | |
Class B common stock |
| $ | 0.76 | |
| $ | 0.74 | |
| $ | 0.72 | |
| $ | 0.70 | |
| $ | 0.68 | |
Balance Sheet at July 31: |
|
|
|
|
|
|
|
|
|
| ||||||||||
Total assets |
| 1,253,665 | |
| 1,438,683 | |
| 1,607,719 | |
| 1,861,505 | |
| 1,746,231 | | |||||
Long-term obligations, less current maturities |
| 159,296 | |
| 201,150 | |
| 254,944 | |
| 331,914 | |
| 382,940 | | |||||
Stockholders' investment |
| 733,076 | |
| 830,797 | |
| 1,009,353 | |
| 1,156,192 | |
| 1,005,027 | | |||||
Cash Flow Data: |
|
|
|
|
|
|
|
|
|
| ||||||||||
Net cash provided by operating activities |
| $ | 93,420 | |
| $ | 143,503 | |
| $ | 144,705 | |
| $ | 167,350 | |
| $ | 165,238 | |
Net cash provided by (used in) investing activities |
| 10,207 | |
| (325,766 | ) |
| (64,604 | ) |
| (22,631 | ) |
| (48,681 | ) | |||||
Net cash (used in) provided by financing activities |
| (115,387 | ) |
| (33,060 | ) |
| (147,824 | ) |
| (91,574 | ) |
| 15,275 | | |||||
Depreciation and amortization |
| 44,598 | |
| 48,725 | |
| 43,987 | |
| 48,827 | |
| 53,022 | | |||||
Capital expenditures |
| (43,398 | ) |
| (35,687 | ) |
| (24,147 | ) |
| (20,532 | ) |
| (26,296 | ) | |||||
(1) | Operating data has been impacted by the reclassification of the Die-Cut businesses into discontinued operations. The Company has elected to not separately disclose the cash flows related to discontinued operations. Refer to Note 15 within Item 8 for further information on discontinued operations. The operating data is also impacted by the acquisitive nature |
15
Table of Contents
of the Company as one, three, one, and three acquisitions were completed in fiscal years ended July 31, 2013, 2012, 2011, and 2010, respectively. There were no acquisitions during fiscal 2014. Refer to Note 2 within Item 8 for further information on the acquisitions that were completed.
(2) | In fiscal 2009, in response to the global economic downturn, the Company initiated several measures to address its cost structure, including a reduction in its workforce and decreased discretionary spending. The Company continued certain of these measures during fiscal 2010, 2011, and 2012. During fiscal 2013, the Company executed a business simplification project which included various measures to address its cost structure and resulted in restructuring charges during fiscal 2013 and into fiscal 2014. In addition, in fiscal 2014, the Company approved a plan to consolidate facilities in North America, Europe, and Asia in order to enhance customer service, improve efficiency of operations, and reduce operating expenses. This plan resulted in restructuring charges during fiscal 2014. |
(3) | The Company recognized an impairment charge of $148.6 million during the three months ended July 31, 2014, primarily related to the PeopleID reporting unit. The Company recognized an impairment charge of $204.4 million during the three months ended July 31, 2013, primarily related to the WPS segment. Refer to Note 3 within Item 8 for further information regarding the impairment charges. |
(4) | Fiscal 2014 was significantly impacted by the goodwill impairment charge of $100.4 million recorded on the PeopleID reporting unit and a tax charge of $4.0 million in continuing operations associated with the repatriation of the cash proceeds from the sale of the Die-Cut business. Fiscal 2013 was impacted by the goodwill impairment charge of $190.5 million recorded on the WPS Americas and IDS APAC reporting units, as well as a tax charge of $26.6 million associated with the funding of the PDC acquisition. |
(5) | The earnings from discontinued operations in fiscal 2014 include a $1.2 million net loss on the sale of the Die-Cut business. The loss from discontinued operations in fiscal 2013 was primarily attributable to a $15.7 million write-down of the Die-Cut business to its estimated fair value less costs to sell. The loss from discontinued operations in fiscal 2012 was primarily attributable to the $115.7 million goodwill impairment charge recorded during the three months ending January 31, 2012, which was related to the Die-Cut disposal group. Refer to Note 15 within Item 8 for further information regarding discontinued operations. |
Item 7. Management's Discussion and Analysis of Financial Condition and Results of Operations
Overview
In fiscal 2014 , the Company posted sales of $1,225.0 million and a net loss from continuing operations of $48.1 million . Sales increased by 5.8% from fiscal 2013 . Organic sales increased by 0.2% , currency fluctuations decreased sales by 0.1% and the acquisition of PDC increased sales by 5.7% . Fiscal 2014 sales growth was driven by the ID Solutions segment which grew by 11.6% from 2013 to 2014 primarily due to the acquisition, which was partially offset by the decline in sales in the Workplace Safety segment of 4.5% .
The fiscal 2014 net loss from continuing operations of $48.1 million was primarily due to non-cash impairment charges of $148.6 million and restructuring charges of $15.0 million .
The fiscal 2014 operating loss from continuing operations was $41.2 million . Excluding the impairment charges of $148.6 million and restructuring charges of $15.0 million , the Company generated operating income from continuing operations of $122.4 million in fiscal 2014 . Fiscal 2013 operating loss from continuing operations was $82.6 million . Excluding the impairment charges of $204.4 million and restructuring charges of $26.0 million , the Company generated operating income from continuing operations of $147.9 million in fiscal 2013 . This decline of $25.5 million was primarily due to the decrease in segment profit in the WPS business segment. The decline in operating results within the WPS business segment was primarily due to a 4.6% organic sales decline, incremental investment to drive key initiatives and growth, and increased costs from facility consolidation projects.
16
Table of Contents
Results of Operations
A comparison of results of Operating (loss) income from continuing operations for the fiscal years ended July 31, 2014 , 2013 , and 2012 is as follows:
(Dollars in thousands) |
| 2014 |
| % Sales |
| % Change |
| 2013 |
| % Sales |
| % Change |
| 2012 |
| % Sales | |||||||||||
Net Sales |
| $ | 1,225,034 | |
| | |
| 5.8 | % |
| $ | 1,157,792 | |
| | |
| 8.1 | % |
| $ | 1,071,504 | |
| | |
Gross Margin |
| 609,564 | |
| 49.8 | % |
| - | % |
| 609,348 | |
| 52.6 | % |
| 3.1 | % |
| 590,969 | |
| 55.2 | % | |||
Operating Expenses: |
|
|
|
|
|
|
|
|
|
|
|
|
|
|
|
| |||||||||||
Research and Development |
| 35,048 | |
| 2.9 | % |
| 4.5 | % |
| 33,552 | |
| 2.9 | % |
| (2.8 | )% |
| 34,528 | |
| 3.2 | % | |||
Selling, General & Administrative |
| 452,164 | |
| 36.9 | % |
| 5.7 | % |
| 427,858 | |
| 37.0 | % |
| 9.0 | % |
| 392,694 | |
| 36.6 | % | |||
Restructuring charges |
| 15,012 | |
| 1.2 | % |
| (42.4 | )% |
| 26,046 | |
| 2.2 | % |
| 328.1 | % |
| 6,084 | |
| 0.6 | % | |||
Impairment charges |
| 148,551 | |
| 12.1 | % |
| (27.3 | )% |
| 204,448 | |
| 17.7 | % |
| - | % |
| - | |
| - | % | |||
Total operating expenses |
| 650,775 | |
| 53.1 | % |
| (5.9 | )% |
| 691,904 | |
| 59.8 | % |
| 59.7 | % |
| 433,306 | |
| 40.4 | % | |||
Operating (loss) income |
| $ | (41,211 | ) |
| (3.4 | )% |
| 50.1 | % |
| $ | (82,556 | ) |
| (7.1 | )% |
| (152.4 | )% |
| $ | 157,663 | |
| 14.7 | % |
During fiscal 2014 , net sales increased 5.8% from fiscal 2013 , which consisted of organic growth of 0.2% , currency impact of a negative 0.1% , and growth from acquisitions of 5.7% . The acquisition growth was from the acquisition of PDC within the IDS segment in fiscal 2013. Organic sales within the IDS segment were up 2.9% , while organic sales within the WPS segment declined by 4.6% .
During fiscal 2013 , net sales increased 8.1% from fiscal 2012 , which consisted of an organic decline of 2.4% , currency impact of a negative 0.8% and growth from acquisitions of 11.3% . Over 90% of the acquisition growth was from the acquisition of PDC in fiscal 2013, with the remainder attributable to the acquisitions of Grafo in the IDS segment and Runelandhs and Pervaco in the WPS segment in fiscal 2012. Organic sales within the IDS segment were up 0.8% , while organic sales within the WPS platform declined by 7.0% .
Gross margin as a percentage of sales declined to 49.8% in fiscal 2014 from 52.6% in fiscal 2013 . The decline was primarily due to the sales decline and increased pricing actions in the WPS business, and an increase in facility consolidation costs in both segments. In the WPS segment, gross margin declined due to increased costs for facility consolidation projects, growth initiatives, and reduced sales as compared to the same period in the prior year. In the IDS segment, gross margin was negatively impacted by facility consolidation related expenses and product mix.
Gross margin as a percentage of sales declined to 52.6% in fiscal 2013 from 55.2% in fiscal 2012 . Approximately half of the decline was due to the acquisition of PDC, as it is a lower gross margin business compared to the remainder of the Company. The other half of the decline was attributed to the WPS segment in which the decline in sales, increased pricing actions, and the challenging global economy contributed to the reduced gross margin.
Research and development expenses increased to $35.0 million in fiscal 2014 from $33.6 million in fiscal 2013 . The increase was primarily due to increased investment in new products. In addition, in fiscal 2014, the Company realigned the R&D processes in order to accelerate new product innovation and invested in emerging technologies such as RFID and sensing technology for harsh environments and mobile applications that allow users to work with a variety of electronic devices. R&D expenses decreased to $33.6 million in fiscal 2013 from $34.5 million in 2012 due to the global consolidation of the project management office, which reduced costs while streamlining reporting processes globally.
Selling, general and administrative ("SG&A") expenses include selling costs directly attributed to the IDS and WPS segments, as well as administrative expenses including finance, information technology, human resources and legal. SG&A expenses increased to $452.2 million in fiscal 2014 compared to $427.9 million in fiscal 2013 . The increase was primarily due to incremental SG&A associated with the PDC business of approximately $22 million. In addition, the Company expanded its sales force in multiple geographies within the IDS segment in fiscal 2014 and increased spending in both on-line advertising as well as traditional print advertising within the WPS segment.
SG&A expense increased to $427.9 million in fiscal 2013 compared to $392.7 million in fiscal 2012 . The increase was primarily due to the addition of PDC, which also contributed to an incremental $6.0 million of amortization of intangible assets. The total increase in SG&A was partially offset by a reduction in variable incentive compensation from fiscal 2012 to fiscal 2013.
17
Table of Contents
In fiscal 2014, the Company announced a restructuring plan to consolidate facilities in North America, Europe and Asia. The Company implemented this restructuring plan to enhance customer service, improve efficiency of operations and reduce operating expenses, with expected annual pre-tax operational savings of approximately $10 million. The cash expenditures for these restructuring activities were funded with cash generated from operations. Facility consolidation activities will extend into fiscal 2015 as the Company slowed certain consolidation activities to ensure the highest levels of quality and delivery throughout the transition, and will result in approximately $15 million of additional restructuring charges. In fiscal 2013, the Company announced a restructuring action to reduce its global workforce by approximately 5-7% in order to address its cost structure.
In connection with these restructuring actions, the Company incurred restructuring charges of $15.0 million in fiscal 2014 . These charges consisted of $9.3 million of employee separation costs, $4.4 million of facility closure related costs, $1.0 million of contract termination costs, and $0.3 million of non-cash asset write-offs. The charges for employee separation costs consisted of severance pay, outplacement services, medical and other benefits. Non-cash asset write-offs consist mainly of indefinite-lived tradenames written off in conjunction with brand consolidations. Of the $15.0 million recognized in fiscal 2014, $9.0 million was incurred within the IDS segment and $6.0 million was incurred within the WPS segment.
Restructuring charges were $26.0 million in fiscal 2013 and consisted of employee separation costs, fixed asset write-offs, and other facility closure costs associated with the restructuring plan announced in February 2013 to reorganize into global product-based business platforms and reduce our global cost structure. Of the $26.0 million recognized in fiscal 2013, $15.8 million was incurred within the IDS segment and $10.2 million was incurred within the WPS segment.
Restructuring charges were $6.1 million in fiscal 2012 and consisted of costs incurred to consolidate facilities within both the IDS and WPS segments primarily in the Americas. The remaining charges related to severance costs associated with a prior year restructuring program. Of the $6.1 million recognized in fiscal 2012, $4.3 million was incurred within the IDS segment and $1.8 million was incurred within the WPS segment.
The Company performed its annual goodwill impairment assessment on May 1, 2014, and subsequently concluded that the PeopleID reporting unit was impaired. In conjunction with the goodwill impairment analysis, management concluded that other finite and indefinite-lived intangible assets within the reporting unit were impaired. Refer to the Item 7 - Business Segment Operating Results as well as Note 3 "Goodwill and Other Intangible Assets" of Item 8 for further discussion regarding the impairment charges. Impairment charges in continuing operations were $148.6 million in fiscal 2014, which consisted of $100.4 million in goodwill and $48.2 million in intangible assets primarily associated with the PeopleID reporting unit.
As a result of the Company's annual goodwill impairment assessment performed in fiscal 2013, the Company concluded that the WPS Americas and IDS APAC reporting units were impaired. In conjunction with the goodwill impairment analysis, management also concluded tradenames and certain fixed assets within the reporting units were impaired. Impairment charges in continuing operations were $204.4 million in fiscal 2013 and consisted of the following:
• $172.3 million in goodwill in the WPS Americas reporting unit
• $18.2 million in goodwill in the IDS APAC reporting unit
• $10.6 million in tradenames in the WPS segment
• $3.3 million in fixed assets in the IDS APAC reporting unit
Operating loss was $41.2 million in fiscal 2014 . Excluding the impairment charges of $148.6 million and restructuring charges of $15.0 million , the Company generated operating income from continuing operations of $122.4 million in fiscal 2014 . The fiscal 2013 operating loss was $82.6 million . Excluding the impairment charges of $204.4 million and restructuring charges of $26.0 million , the Company generated operating income of $147.9 million in fiscal 2013 . The decrease was mainly due to the decline in segment profit of the WPS business, which is discussed in further detail within the Business Segment Operating Results section.
Operating loss was $82.6 million in fiscal 2013. Excluding impairment charges of $204.4 million and restructuring charges of $26.0 million , the Company generated operating income of $147.9 million in fiscal 2013 . The fiscal 2012 operating income was $157.7 million . Excluding restructuring charges of $6.1 million , the Company generated income of $163.7 million in fiscal 2012 . The decrease was mainly due to the decline in segment profit of the WPS business.This decline was partially offset by a decrease in variable incentive compensation of approximately $10 million in fiscal 2013 as compared to fiscal 2012.
18
Table of Contents
OPERATING INCOME TO NET INCOME
(Dollars in thousands) |
| 2014 |
| % Sales |
| 2013 |
| % Sales |
| 2012 |
| % Sales | |||||||||
Operating (loss) income |
| $ | (41,211 | ) |
| (3.4 | )% |
| $ | (82,556 | ) |
| (7.1 | )% |
| $ | 157,663 | |
| 14.7 | % |
Other income and (expense): |
|
|
| | |
|
|
| | |
|
|
| | | ||||||
Investment and other income |
| 2,402 | |
| 0.2 | % |
| 3,523 | |
| 0.3 | % |
| 2,082 | |
| 0.2 | % | |||
Interest expense |
| (14,300 | ) |
| (1.2 | )% |
| (16,641 | ) |
| (1.4 | )% |
| (19,090 | ) |
| (1.8 | )% | |||
(Loss) earnings from continuing operations before tax |
| (53,109 | ) |
| (4.3 | )% |
| (95,674 | ) |
| (8.3 | )% |
| 140,655 | |
| 13.1 | % | |||
Income taxes |
| (4,963 | ) |
| (0.4 | )% |
| 42,583 | |
| 3.7 | % |
| 37,162 | |
| 3.5 | % | |||
(Loss) earnings from continuing operations |
| (48,146 | ) |
| (3.9 | )% |
| (138,257 | ) |
| (11.9 | )% |
| 103,493 | |
| 9.7 | % | |||
Earnings (loss) from discontinued operations, net of income taxes |
| 2,178 | |
| 0.2 | % |
| (16,278 | ) |
| (1.4 | )% |
| (121,404 | ) |
| (11.3 | )% | |||
Net (loss) earnings |
| $ | (45,968 | ) |
| (3.8 | )% |
| $ | (154,535 | ) |
| (13.3 | )% |
| $ | (17,911 | ) |
| (1.7 | )% |
Investment and Other Income
These amounts primarily consist of interest income and gains and losses on foreign currency and securities held in executive deferred compensation plans. Income of $2.4 million in fiscal 2014 , $3.5 million in fiscal 2013 and $2.1 million in fiscal 2012 has remained relatively consistent with no material changes year over year.
Interest Expense
Interest expense decreased to $14.3 million in fiscal 2014 compared to $16.6 million in fiscal 2013 and $19.1 million in fiscal 2012 . The decline since 2012 was due to the Company's declining principal balance under its outstanding debt agreements, along with changes in debt structure resulting in a reduction in the weighted average interest rate.
Income Taxes
The Company's effective tax rate from continuing operations was 9.3% in fiscal 2014 , compared to the effective tax rate from continuing operations of (44.5)% in fiscal 2013 . The income tax rate in fiscal 2014 was significantly impacted by the goodwill impairment and restructuring charges recorded in fiscal 2014. The income tax rate in fiscal 2013 was impacted by the goodwill impairment charge and a tax charge associated with the funding of the PDC acquisition. Excluding these items, the effective tax rate from continuing operations would have been approximately 28% in fiscal 2014 compared to 24.5% in fiscal 2013. The increase was due to several factors including increased valuation allowances and fluctuations in geographic profit mix.
The effective tax rate from continuing operations for fiscal 2013 was (44.5)% as compared to 26.4% in fiscal 2012 . The lower rate in fiscal 2013 was significantly impacted by the goodwill impairment charge recorded on the WPS Americas and IDS Asia reporting units in fiscal 2013, as well as a tax charge of $29.0 million primarily associated with the funding of the PDC acquisition. Excluding these items, our fiscal 2013 effective tax rate from continuing operations would have been 24.5%, slightly lower than the fiscal 2012 rate of 26.4% due mainly to fluctuation in geographic profit mix.
Earnings (Loss) from Discontinued Operations
Discontinued operations consist of the Asia Die-Cut and Balkhausen Die-cut businesses ("Die-Cut"), which was classified as held for sale beginning in the third quarter of fiscal 2013. In addition, the following previously divested businesses were reported within discontinued operations: Brady Medical and Varitronics (divested in fiscal 2013) and Etimark (divested in fiscal 2012). These divested businesses were part of the IDS business segment. The first phase of this Die-Cut divestiture closed on May 1, 2014 and the second phase of the divestiture closed on August 1, 2014, subsequent to the fiscal year ended July 31, 2014.
Earnings from discontinued operations net of income taxes were $2.2 million in fiscal 2014, compared to a loss from discontinued operations net of income taxes of $16.3 million and $121.4 million for fiscal 2013 and 2012 , respectively. In fiscal 2014, the Die-Cut business had net earnings from operations of $3.4 million, offset by a net loss on the sale of Die-Cut of $1.2 million. The loss in fiscal 2013 primarily related to a $15.7 million write-down of the Die-Cut disposal group to estimated fair value less costs to sell. The loss in fiscal 2012 primarily related to the $115.7 million goodwill impairment charge recorded during the second quarter of fiscal 2012 , which was related to the Die-Cut disposal group.
19
Table of Contents
There was no depreciation or amortization recognized within discontinued operations for fiscal 2014 as the Die-Cut business was first reported as held for sale in the prior year, at which point the fixed assets and intangible assets of these businesses were no longer depreciated or amortized in accordance with applicable U.S. GAAP. Depreciation and amortization recognized within discontinued operations for fiscal 2013 were $4.0 million and $4.8 million, respectively.
Business Segment Operating Results
The Company is organized and managed on a global basis within two business platforms: IDS and WPS, which are the reportable segments. Each business platform has a President that reports directly to the Company's chief operating decision maker, its Chief Executive Officer. Each platform has its own distinct operations, which are managed locally by its own management team, maintains its own financial reports and is evaluated based on global segment profit. The Company has determined that these business platforms comprise its operating and reportable segments based on the information used by the Chief Executive Officer to allocate resources and assess performance.
The segment results have been adjusted to reflect continuing operations in all periods presented. The sales and profit of discontinued operations are excluded from the following information.
|
| Years ended July 31, | ||||||||||
(Dollars in thousands) |
| 2014 |
| 2013 |
| 2012 | ||||||
SALES TO EXTERNAL CUSTOMERS |
|
|
|
|
|
| ||||||
ID Solutions |
| $ | 825,123 | |
| $ | 739,116 | |
| $ | 636,590 | |
WPS |
| 399,911 | |
| 418,676 | |
| 434,914 | | |||
Total |
| $ | 1,225,034 | |
| $ | 1,157,792 | |
| $ | 1,071,504 | |
SALES GROWTH INFORMATION |
|
|
|
|
|
| ||||||
ID Solutions |
|
|
|
|
|
| ||||||
Organic |
| 2.9 | % |
| 0.8 | % |
| 3.2 | % | |||
Currency |
| (0.2 | )% |
| (1.0 | )% |
| (1.6 | )% | |||
Acquisitions |
| 8.9 | % |
| 16.3 | % |
| 0.2 | % | |||
Total |
| 11.6 | % |
| 16.1 | % |
| 1.8 | % | |||
Workplace Safety |
|
|
|
|
|
| ||||||
Organic |
| (4.6 | )% |
| (7.0 | )% |
| (0.2 | )% | |||
Currency |
| 0.1 | % |
| (0.7 | )% |
| (1.2 | )% | |||
Acquisitions |
| -% | |
| 4.0 | % |
| 1.6 | % | |||
Total |
| (4.5 | )% |
| (3.7 | )% |
| 0.2 | % | |||
Total Company |
|
|
|
|
|
| ||||||
Organic |
| 0.2 | % |
| (2.4 | )% |
| 1.8 | % | |||
Currency |
| (0.1 | )% |
| (0.8 | )% |
| (1.5 | )% | |||
Acquisitions |
| 5.7 | % |
| 11.3 | % |
| 0.8 | % | |||
Total |
| 5.8 | % |
| 8.1 | % |
| 1.1 | % | |||
SEGMENT PROFIT |
|
|
|
|
|
| ||||||
ID Solutions |
| $ | 176,129 | |
| $ | 174,390 | |
| $ | 160,658 | |
Workplace Safety |
| 66,238 | |
| 95,241 | |
| 117,187 | | |||
Total |
| $ | 242,367 | |
| $ | 269,631 | |
| $ | 277,845 | |
SEGMENT PROFIT AS A PERCENT OF SALES |
|
|
|
|
|
| ||||||
ID Solutions |
| 21.3 | % |
| 23.6 | % |
| 25.2 | % | |||
Workplace Safety |
| 16.6 | % |
| 22.7 | % |
| 26.9 | % | |||
Total |
| 19.8 | % |
| 23.3 | % |
| 25.9 | % | |||
20
Table of Contents
|
| Years ended: | ||||||||||
(Dollars in thousands) |
| July 31, 2014 |
| July 31, 2013 |
| July 31, 2012 | ||||||
Total profit from reportable segments |
| $ | 242,367 | |
| $ | 269,631 | |
| $ | 277,845 | |
Unallocated costs: |
|
|
|
|
|
| ||||||
Administrative costs |
| 120,015 | |
| 121,693 | |
| 114,098 | | |||
Restructuring charges |
| 15,012 | |
| 26,046 | |
| 6,084 | | |||
Impairment charges |
| 148,551 | |
| 204,448 | |
| - | | |||
Investment and other income |
| (2,402 | ) |
| (3,523 | ) |
| (2,082 | ) | |||
Interest expense |
| 14,300 | |
| 16,641 | |
| 19,090 | | |||
(Loss) earnings from continuing operations before income taxes |
| $ | (53,109 | ) |
| $ | (95,674 | ) |
| $ | 140,655 | |
ID Solutions
Fiscal 2014 vs. 2013
Approximately 70% of net sales in the IDS segment were generated in the Americas region, 20% in EMEA, and 10% in APAC. IDS sales increased 11.6% to $825.1 million in fiscal 2014 , compared to $739.1 million in fiscal 2013 . The acquisition of PDC in December 2012 contributed to 8.9% of the sales growth for fiscal 2014. Organic sales increased by 2.9% and currency fluctuations were minimal, decreasing sales by 0.2% for the year ended July 31, 2014, as compared to the same period in the prior year.
Overall, organic sales within the IDS business grew in the low single digit percentages consistently each quarter in fiscal 2014. Organic growth in all regions was positive for the year with double digit growth in APAC, followed by mid-single digit growth in Europe and slightly lower growth in the Americas region.
Organic sales in the Americas grew in the low-single digits in fiscal 2014 as compared to fiscal 2013, primarily due to the sales force expansion and the development of proprietary new products in the core Brady brand business in the United States. This was partially offset by declines in Brazil and PDC. The Brazil business declined in both sales and profit as OEM sales were down due to weak economic conditions and increased competitive pressure. In the fourth quarter of fiscal 2014, the Company implemented a plan to consolidate a facility in Brazil to reduce its operations footprint and lower its cost structure. Sales in the PDC business declined approximately 2% organically in fiscal 2014, compared to annualized sales in fiscal 2013. PDC's healthcare business correlates with U.S. hospital admission rates, which were down approximately 2% during fiscal 2014.
The IDS business in EMEA grew in the mid-single digits in fiscal 2014 compared to the prior year. This growth was driven by our businesses in the established Western European economies as well as Central Europe. Growth was the result of expanding and refocusing our sales organization and the sale of new products. The exceptions were France and Italy, which are facing weak economic environments.
Sales within the IDS business in APAC had double-digit growth for the year ended July 31, 2014. We experienced slower growth in the fourth quarter of fiscal 2014 as compared to the preceding three quarters primarily due to the negative impact the Die-Cut divestiture had on certain Asia business units. Sales of product identification products to our OEM customers in China were particularly strong as we continue to expand production capacity and capabilities. The investment in our MRO growth strategies and the expansion of our MRO business in China also positively impacted sales.
Segment profit increased to $176.1 million in fiscal 2014 from $174.4 million in fiscal 2013, an increase of $1.7 million or 1.0%. As a percent of sales, segment profit was 21.3% in fiscal 2014, compared to 23.6% in the prior year. The decline in segment profit as a percent of sales was due to lower gross margin in fiscal 2014 as a result of product mix and increased costs associated with the facility consolidations. The main contributor to the product mix is a full year of PDC sales at lower gross margin than the existing business, as well as an increase in lower-margin printer sales.
The PeopleID reporting unit consists primarily of the Company's acquisition of PDC from fiscal 2013, as well as the existing Brady PeopleID business. Organic sales within the PDC business declined in the low single digit percentages from fiscal 2013 to fiscal 2014. Hospital admission rates are the primary driver of PDC's sales under its existing strategy, and there was a decline of approximately 2% in these rates during fiscal 2014. Management has revisited its planned growth and profit for the PDC business and concluded that the growth may not materialize as expected given slower than anticipated industry growth and fewer sales
21
Table of Contents
synergies than originally planned. As a result, management is implementing a modified strategy within the PDC business that will focus on the full continuum of care in the healthcare industry.
Management believes that the strategy modifications noted above will improve organic sales and profit within the PeopleID reporting unit in future years, but there is inherent risk in the revised strategy and the changing healthcare industry. As such, the Company's annual goodwill impairment analysis ("Step One") reflected the risk in the strategy and the decline in fiscal 2014 sales and profitability, which occurred during a period of time in which hospital admission rates were declining and the healthcare industry was reacting to healthcare reform. In addition, the PDC business fell short of internal forecasts, resulting in the conclusion that the PeopleID reporting unit failed Step One as the resulting fair value was less than the carrying value of the reporting unit.
Upon completion of the impairment assessment, the Company recognized a goodwill impairment charge of $100.4 million during fiscal 2014. In conjunction with the goodwill impairment test of the PeopleID reporting unit, finite and indefinite-lived intangibles associated with the reporting unit were revalued and analyzed for impairment. As a result, other intangibles in the amount of $48.2 million primarily associated with the PeopleID reporting unit were impaired during fiscal 2014.
Fiscal 2013 vs. 2012
Net sales increased by 16.1% from fiscal 2012 to 2013 , which consisted of organic growth of 0.8% , currency impact of a negative 1.0% and growth from acquisitions of 8.9% . Acquisition growth within the IDS segment was almost entirely generated by the acquisition of PDC in December 2012, with a small portion contributed by the acquisition of Grafo in March 2012.
The PDC acquisition contributed more than $100 million in sales in fiscal 2013 and provides an entry for the Company into the healthcare identification space. Organic sales in the IDS segment grew by 0.8% primarily due to growth within the Americas of approximately 1%, which was partially offset by modest declines in Europe and APAC. Within the Americas, North America growth was partially offset by a 10% decline in Brazil. Sales over the Internet increased by more than 15%, and we experienced a positive response to our fiscal 2013 product launches. In Europe, the decline in the IDS business platform was mainly driven by the economy, partially offset by our increased presence in emerging geographies, new and differentiated product launches, and our strategy to increase share in specific vertical markets. In APAC, sales growth was modest, as the de-consolidation of certain business units from the Asia Die-Cut disposal group impacted sales growth negatively.
Overall, sales globally were driven by new product launches and growth within vertical markets. New products launched included the BBP85 printer, which is a continuous-sleeving wire identification system for high volume applications in the electrical and aerospace markets, and three new high performance materials to address the changing requirements for identification of printed circuit boards and electronic components. Vertical market growth was focused within the chemical, oil, and gas industries, as well as our targeted strategic account management programs.
Segment profit increased to $174.4 million in fiscal 2013 from $160.7 million in fiscal 2012 , an increase of $13.7 million or 8.5%. The primary driver of the profit increase was the acquisition of PDC. This profit was partially offset by a decline in profitability in Brazil and Western Europe. Brazil's decline was due to a combination of sales decline, cost increases and expenses associated with the implementation of a new ERP system. In Western Europe, the largest decline in sales and profit was in Italy, where we experienced a 25.0% sales decline partially due to one-time sales in the prior year. In addition, Italy's profitability was impacted by product quality issues associated with a printer introduced in fiscal 2012.
The Company performed its annual goodwill impairment assessment for fiscal 2013 on May 1, 2013, and subsequently concluded that the IDS APAC reporting unit was impaired. Although sales grew from 2012 to 2013, profit declined and neither were as high as anticipated. Specifically, fourth quarter fiscal 2013 gross margin and segment profit declined compared to the prior year, while results were anticipated to increase over the prior year fourth quarter. In addition, projections were not sufficient to support the balance of goodwill remaining within the reporting unit. As such, the Company recorded a goodwill impairment charge of $18.2 million during fiscal 2013, which represented all of the remaining goodwill for this reporting unit.
Workplace Safety
Fiscal 2014 vs. 2013
Approximately 50% of net sales in the WPS segment were generated in EMEA, 30% in the Americas, and 20% in APAC. Net sales decreased 4.5% from $418.7 million in fiscal 2013 to $399.9 million in fiscal 2014 . The sales decline consists of a decrease in organic sales of 4.6% , partially offset by 0.1% growth due to positive currency fluctuations.
22
Table of Contents
Organic sales in the WPS segment declined since the second quarter of fiscal 2012 through the third quarter of fiscal 2014, due to a reduction in direct catalog mailings, increased e-commerce competition, and pricing adjustments. As a result, in connection with our organizational change to global business platforms in fiscal 2013, we refined our business strategy to focus on and invest in the following: expanding our e-commerce presence, increasing the offering of workplace safety products, enhancing our industry expertise, and further developing our pricing capabilities in order to optimize sales across multiple channels.
Although we experienced an organic sales decline for the year ended July 31, 2014, the sales decline lessened each quarter and returned to growth in the fourth quarter of fiscal 2014. This improving trend was primarily due to increased catalog mailings, better execution of our Internet offerings, and more effective pricing strategies that optimize both sales and profits. As a result of these changes, we saw WPS sales trends in the Americas improved slightly in fiscal 2014 compared to 2013 as the percentage rate of decline lessened to mid-single digits. WPS sales in APAC, which consists entirely of Australia, and WPS sales in EMEA returned to modest growth in the fourth quarter, primarily due to an increase in new customers, order volumes, and growth initiatives.
Segment profit decreased to $66.2 million in fiscal 2014 from $95.2 million in the prior year, a decline of $29.0 million, or 30.5%. As a percent of sales, segment profit was 16.6% in fiscal 2014, compared to 22.7% in the prior year. Similar to sales, although profit has declined, the rate of decline slowed in the second half of fiscal 2014 as the modified strategy began to take hold. WPS profit was also impacted by the increased costs due to facility consolidations and the incremental investment in implementing its e-commerce strategy.
In performing the fiscal 2014 annual goodwill impairment assessment, the Company completed a sensitivity analysis on the material assumptions used in the discounted cash flow models for each of its reporting units. The fair value was substantially in excess of carrying value for the entire WPS segment, however, the Company is providing a detailed sensitivity analysis of the WPS Europe and WPS APAC reporting units given that the WPS strategy remains a key risk in the current fiscal year. The WPS Americas reporting unit was impaired in the prior year and therefore has an insignificant goodwill balance remaining, as such, a sensitivity analysis was not completed.
The fair value of the WPS Europe and WPS APAC reporting units were substantially in excess of carrying value at the annual goodwill assessment date of May 1, 2014, with goodwill balances of $60.3 million and $32.8 million, respectively. The Company considers a reporting unit's fair value to be substantially in excess of its carrying value at 20% or greater. The Company prepares a discounted cash flow model and market multiples model to conclude upon fair value as part of its annual goodwill impairment test. In order to arrive at the assumptions for the discounted cash flow analysis completed as part of the annual goodwill impairment test, the Company considered multiple factors, including (a) macroeconomic conditions, (b) industry and market factors such as competition and changes in the market for the reporting unit's products, (c) overall financial performance such as cash flows, actual and planned revenue and profitability, and (d) changes in strategy for the reporting unit. The assumption with the most impact on our determination of fair value of both reporting units is profitability. A reduction in the annual profitability assumption by 100 basis points results in a decrease in the amount of fair value in excess of carrying value of 11% and 9% for WPS Europe and WPS APAC, respectively, but would still result in fair value substantially in excess of carrying value for both reporting units.
Fiscal 2013 vs. 2012
Net sales decreased by 3.7% from fiscal 2012 to 2013 , which consisted of an organic decline of 7.0% , currency impact of a negative 0.7% , and growth from acquisitions of 4.0% . The Company acquired Runelandhs and Pervaco in Europe in May 2012.
Organic sales in the WPS segment declined 7.0% within all geographies from fiscal 2012 to 2013 , and have declined for the preceding seven quarters. WPS APAC sales are generated entirely in Australia, and have declined for the last four quarters mainly due to the weakness in the Australian economy. In the Americas and Europe, organic sales declined by 5% and 6%, respectively. Beginning in fiscal 2012, we experienced a deterioration of this business due to a reduction in direct catalog mailings, increased e-commerce competition, and pricing adjustments. The Company continued to modify its strategy to grow this business, which included: investments in e-commerce capabilities, pricing structure changes and expansion of product offerings.
Segment profit decreased in fiscal 2013 to $95.2 million from $117.2 million , a decline of $22.0 million or 18.8%. This was primarily due to volume and price declines as a result of increased competition and reduced catalog advertising. In addition, the Company redirected some of its investment from the traditional catalog model to e-business, the benefits of which were anticipated to be realized in future fiscal years.
Since the global economic recession of 2009, organic growth within the WPS Americas reporting unit has been difficult to achieve, especially within mature economies such as the U.S. and Canada where business-to-business transactions over the Internet are more advanced than many of the European and Australian markets. With the acceleration of the Internet in the business-to-
23
Table of Contents
business market, competition and pricing pressure have intensified. As a result, organic sales declined by approximately 7.0% and segment profit declined by nearly 20% during fiscal 2013 as compared to fiscal 2012.
The Company modified its strategy within the WPS platform in fiscal 2013, which included investments in enhanced e-commerce capabilities, expanded product offerings, enhanced industry-specific expertise, and adjustments to pricing strategies. Although management believed the strategy modifications would improve organic sales and profitability of the WPS platform in future years, there is risk associated with any strategy. As such, the Company's fiscal 2013 annual goodwill impairment analysis ("Step One") reflected the risk in the strategy and the decline in fiscal 2013 sales and profitability, which occurred during a period of time in which the Company was redirecting its investment from the traditional catalog model to e-business. In addition, the rate of decline became more pronounced during the second half of fiscal 2013 and fell short of internal forecasts, resulting in the conclusion that WPS Americas failed Step One, as the resulting fair value was less than the carrying value of the reporting unit.
Upon completion of the impairment assessment, the Company recognized a goodwill impairment charge of $172.3 million during fiscal 2013. In conjunction with the goodwill impairment test of the WPS Americas reporting unit, indefinite-lived tradenames associated with the reporting unit were revalued and analyzed for impairment. As a result, indefinite-lived tradenames in the amount of $10.6 million primarily associated with the WPS Americas reporting unit were impaired during fiscal 2013.
Liquidity & Capital Resources
Cash and cash equivalents were $81.8 million at July 31, 2014 , a decline of $9.2 million from July 31, 2013. The significant changes were as follows:
| Years ended July 31, | ||||||||||
(Dollars in thousands) | 2014 |
| 2013 |
| 2012 | ||||||
Net cash flow provided by (used in): |
|
|
|
|
| ||||||
Operating activities | $ | 93,420 | |
| $ | 143,503 | |
| $ | 144,705 | |
Investing activities | 10,207 | |
| (325,766 | ) |
| (64,604 | ) | |||
Financing activities | (115,387 | ) |
| (33,060 | ) |
| (147,824 | ) | |||
Effect of exchange rate changes on cash | 2,536 | |
| 481 | |
| (16,348 | ) | |||
Net decrease in cash and cash equivalents | $ | (9,224 | ) |
| $ | (214,842 | ) |
| $ | (84,071 | ) |
Net cash provided by operating activities was $93.4 million during fiscal 2014 compared to $143.5 million in the prior year. The decrease was primarily due to changes in operating assets and liabilities. The Company used cash of approximately $4 million, $13 million, and $21 million for accounts receivable, inventory and accounts payable and accrued liabilities, respectively. Cash used for accounts receivable increased in fiscal 2014 due primarily to geographic sales mix. Sales increased in EMEA and APAC compared to the prior year and these regions have a higher days sales outstanding. The accounts payable and accrued liabilities use of cash included $10 million of restructuring expenses related to fiscal 2013 that were paid in fiscal 2014. Cash used for inventory increased primarily to maintain service levels during facility consolidations.
Net cash provided by investing activities was $10.2 million during fiscal 2014 primarily due to the cash received from the first phase of the sale of the Die-Cut business of $54.2 million, offset by $43.4 million spent on capital expenditures in fiscal 2014. Net cash used in investing activities was $325.8 million during fiscal 2013 primarily due to the acquisition of PDC for $301.2 million.
Net cash used in financing activities was $115.4 million during fiscal 2014 , compared to $33.1 million during the prior year. In fiscal 2014, the Company used cash to pay dividends of $40.5 million, purchased common shares for $30.6 million, and made a principal payment of $61.3 million on its private placement debt. This was offset primarily by cash proceeds of $12.1 million from the issuance of common stock related to stock option exercises during the year. In fiscal 2013, the Company used cash of $39.2 million to pay dividends and made a principal payment of $61.3 million on its private placement debt. This was offset by cash proceeds of $20.3 million from the issuance of common stock related to stock option exercises, and by the borrowing activity from the Company's credit revolver and multi-currency line of credit in China, which provided $50.6 million in cash in fiscal 2013.
Net cash provided by operating activities was $143.5 million during fiscal 2013 compared to $144.7 million in fiscal 2012 . Although there was minimal change in total from fiscal 2012 to 2013, the cash flow from pre-tax income declined approximately $30 million, primarily due to the decline in sales and profits in our WPS segment. This was offset by the improvement in working
24
Table of Contents
capital of approximately $30 million. This improvement was primarily attributable to a positive change in accounts payable and accrued liabilities related to fiscal 2013 working capital initiatives, which significantly improved days payable outstanding.
Net cash used in investing activities was $325.8 million during fiscal 2013 , compared to net cash used in investing activities of $64.6 million in fiscal 2012 . The increase in cash used in investing activities of $261.2 million was primarily due to cash used in the purchase of PDC in fiscal 2013 for $301.2 million and an increase in capital expenditures of $11.5 million for machinery in Brazil and new facilities in Thailand and Australia. This was partially offset by cash provided by divestitures of $10.2 million. See Note 2 within Item 8 for further information regarding acquisitions and divestitures.
Net cash used in financing activities was $33.1 million during fiscal 2013 , compared to $147.8 million in fiscal 2012 . The decrease in cash used in financing activities was due to a net draw on the Company's credit revolver and multi-currency line of credit in China for $50.6 million. In addition, cash provided by the issuance of common stock increased by $16.5 million, while cash used to repurchase common shares decreased by $44.8 million compared to 2012.
During fiscal 2004 through fiscal 2007, the Company completed three private placement note issuances totaling $500 million in ten-year fixed rate notes with varying maturity dates to institutional investors at interest rates varying from 5.14% to 5.33% . The notes must be repaid equally over seven years, with initial payment due dates ranging from 2008 to 2011, with interest payable on the notes due semiannually on various dates throughout the year, which began in December 2004. The private placements were exempt from the registration requirements of the Securities Act of 1933. The notes were not registered for resale and may not be resold absent such registration or an applicable exemption from the registration requirements of the Securities Act of 1933 and applicable state securities laws. The notes have certain prepayment penalties for repaying them prior to the maturity date. Under the debt agreement, the Company made scheduled principal payments of $61.3 million during each of the years ended July 31, 2008 through 2014.
On May 13, 2010, the Company completed a private placement of €75 million aggregate principal amount of senior unsecured notes to accredited institutional investors. The €75 million of senior notes consists of €30 million aggregate principal amount of 3.71% Series 2010-A Senior Notes, due May 13, 2017 and €45 million aggregate principal amount of 4.24% Series 2010-A Senior Notes, due May 13, 2020, with interest payable on the notes semiannually. This private placement was exempt from the registration requirements of the Securities Act of 1933. The notes were not registered for resale and may not be resold absent such registration or an applicable exemption from the registration requirements of the Securities Act of 1933 and applicable state securities laws. The notes have certain prepayment penalties for prepaying them prior to maturity. The notes have been fully and unconditionally guaranteed on an unsecured basis by the Company's domestic subsidiaries. These unsecured notes were issued pursuant to a note purchase agreement, dated May 13, 2010.
On February 1, 2012, the Company and certain of its subsidiaries entered into an unsecured $300 million multi-currency revolving loan agreement with a group of six banks that replaced and terminated the Company's previous credit agreement that had been entered into on October 5, 2006, and amended on March 18, 2008. Under the revolving loan agreement, which has a final maturity date of February 1, 2017, the Company has the option to select either a base interest rate (based upon the higher of the federal funds rate plus one-half of 1% or the prime rate of Bank of America plus a margin based upon the Company's consolidated leverage ratio) or a Eurocurrency interest rate (at the LIBOR rate plus a margin based on the Company's consolidated leverage ratio). At the Company's option, and subject to certain conditions, the available amount under the revolving loan agreement may be increased from $300 million up to $450 million .
In December 2012, the Company drew down $220 million from its revolving loan agreement with a group of six banks to fund a portion of the purchase price of the acquisition of PDC. The borrowings bear interest at LIBOR plus 1.125% per annum, which will be reset from time to time based upon changes in the LIBOR rate. As of July 31, 2013, there was $39 million outstanding on this revolving loan agreement, which was repaid during fiscal 2014. During fiscal 2014, the Company drew down an additional $63 million in order to fund dividends, principal payments on the private placement note issuances, share repurchases, and general corporate needs. The Company repaid $21 million of this borrowing during the three months ended July 31, 2014. During fiscal 2014 , the maximum amount outstanding on the revolving loan agreement was $72 million . As of July 31, 2014 , the outstanding balance on the credit facility was $42 million and the Company had outstanding letters of credit under the revolving loan agreement of $3.6 million. There was $254 million available for future borrowing under the credit facility, which can be increased to $404.4 million at the Company's option, subject to certain conditions.
In February 2013, the Company entered into an unsecured $26.2 million multi-currency line of credit in China, which was amended in November 2013 to $24.2 million and is due on demand. The line of credit supports USD-denominated or CNY-denominated borrowing to fund working capital and operations for the Company's Chinese entities. Borrowings under this facility may be made for a period up to one year from the date of borrowing with interest on the borrowings incurred equal to US Dollar LIBOR on the date of borrowing plus a margin based upon duration. There is no ultimate maturity on the facility and the facility
25
Table of Contents
is subject to periodic review and repricing. The Company is not required to comply with any financial covenants as part of this agreement. During fiscal 2014 , the maximum amount outstanding was $19.4 million , which was also the outstanding balance as of July 31, 2014. This was comprised of $6.9 million USD-denominated borrowings and $12.5 million USD equivalent of CNY-denominated borrowings. As of July 31, 2014 , there was $4.8 million available for future borrowing under this credit facility.
The Company's debt and revolving loan agreements require it to maintain certain financial covenants. The Company's June 2004, February 2006, March 2007, and May 2010 private placement debt agreements require the Company to maintain a ratio of debt to the trailing twelve months EBITDA, as defined in the debt agreements, of not more than a 3.5 to 1.0 ratio (leverage ratio). As of July 31, 2014 , the Company was in compliance with the financial covenant of the February 2006, March 2007, and May 2010 private placement debt agreements, with the ratio of debt to EBITDA, as defined by the agreements, equal to 1.7 to 1.0 . Additionally, the Company's February 2012 revolving loan agreement requires the Company to maintain a ratio of debt to trailing twelve months EBITDA, as defined by the debt agreement, of not more than a 3.25 to 1.0 ratio . The revolving loan agreement requires the Company's trailing twelve months EBITDA to interest expense of not less than a 3.0 to 1.0 ratio (interest expense coverage). As of July 31, 2014 , the Company was in compliance with the financial covenants of the revolving loan agreement, with the ratio of debt to EBITDA, as defined by the agreement, equal to 1.7 to 1.0 and the interest expense coverage ratio equal to 11.5 to 1.0
Long-term obligations (including current maturities) as a percentage of long-term obligations plus stockholders' investment were 21.6% at July 31, 2014 and 24.0% at July 31, 2013 . Long-term obligations decreased by $60.6 million from July 31, 2013 to July 31, 2014 , due to the principal payment on debt of $61.3 million, partially offset by the negative impact of foreign currency translation on the Company's Euro-denominated debt of $0.7 million. Stockholders' investment decreased $97.7 million from July 31, 2013 to July 31, 2014 , primarily due to the net loss of $46.0 million , an increase in treasury stock of $23.5 million from share repurchases in the second half of fiscal 2014, and dividend payments of $40.5 million. This was offset by an increase in additional paid-in capital of $5.6 million and an increase in Accumulated Other Comprehensive Income ("AOCI") of $8.1 million .
The Company's cash balances are generated and held in numerous locations throughout the world. At July 31, 2014 , 87.9% of the Company's cash and cash equivalents were held outside the United States. The Company's growth has historically been funded by a combination of cash provided by operating activities and debt financing. The Company believes that its cash flow from operating activities, in addition to its borrowing capacity, are sufficient to fund its anticipated requirements for working capital, capital expenditures, restructuring activities, acquisitions, common stock repurchases, scheduled debt repayments, and dividend payments for the next twelve months.
In fiscal 2014, the Company completed the first phase of the sale of its Die-Cut businesses. In conjunction with the sale of this business, the Company repatriated approximately $57 million of the cash received, which primarily consisted of purchase price, to the United States. The cash received from the sale of Die-Cut in fiscal 2014 and the fiscal 2013 acquisition of PDC resulted in repatriations of cash to the United States from foreign jurisdictions, which resulted in a $4.0 million and $26.6 million tax charge recognized in continuing operations during the fiscal years ended July 31, 2014 and 2013, respectively. The Company believes that its current credit arrangements are sound and that the strength of its balance sheet will allow financial flexibility to respond to both internal growth opportunities and those available through acquisition. However, future cash needs could require the Company to repatriate additional cash to the U.S. from foreign jurisdictions, which could result in material tax charges recognized in the period in which the decisions are made.
26
Table of Contents
Subsequent Events Affecting Financial Condition
On August 1, 2014, the Company closed the second and final phase of the sale of the Die-Cut business to LTI Flexible Products, Inc. (d/b/a Boyd Corporation) for cash proceeds of approximately $7 million. The second-phase closing involved the sale of the remainder of the Company's Asian Die-Cut business, with operations in Langfang, Wuxi and Shenzhen in China and associated global sales support.
On August 1, 2014, the Board of Directors appointed J. Michael Nauman as President and Chief Executive Officer of the Company, effective August 4, 2014. In addition, Mr. Nauman was appointed as a member of the Board of Directors, effective as of August 4, 2014, with a term expiring at the next annual meeting of shareholders in November 2014.
On September 10, 2014, the Board of Directors appointed Thomas J. Felmer to serve as the Company's Senior Vice President and President - Workplace Safety, effective immediately. With Mr. Felmer's appointment as President - Workplace Safety, the Board of Directors appointed Aaron J. Pearce to serve as Senior Vice President and Chief Financial Officer of the Company, effective immediately.
On September 10, 2014 , the Company announced an increase in the annual dividend to shareholders of the Company's Class A Common Stock, from $0.78 to $0.80 per share. A quarterly dividend of $0.20 will be paid on October 31, 2014 , to shareholders of record at the close of business on October 10, 2014 . This dividend represents an increase of 2.6% and is the 29th consecutive annual increase in dividends.
Off-Balance Sheet Arrangements
The Company does not have material off-balance sheet arrangements or related-party transactions. The Company is not aware of factors that are reasonably likely to adversely affect liquidity trends, other than the risk factors described in this and other Company filings. However, the following additional information is provided to assist those reviewing the Company's financial statements.
Operating Leases - The leases generally are entered into for investments in facilities such as manufacturing facilities, warehouses and office space, computer equipment and Company vehicles.
Purchase Commitments - The Company has purchase commitments for materials, supplies, services, and property, plant and equipment as part of the ordinary conduct of its business. In the aggregate, such commitments are not in excess of current market prices and are not material to the financial position of the Company. Due to the proprietary nature of many of the Company's materials and processes, certain supply contracts contain penalty provisions for early termination. The Company does not believe a material amount of penalties will be incurred under these contracts based upon historical experience and current expectations.
Other Contractual Obligations - The Company does not have material financial guarantees or other contractual commitments that are reasonably likely to adversely affect liquidity.
Related-Party Transactions - Based on an evaluation for the year ended July 31, 2014 , the Company does not have material related party transactions that affect the results of operations, cash flow or financial condition.
Payments Due Under Contractual Obligations
The Company's future commitments in continuing operations at July 31, 2014 for long-term debt, operating lease obligations, purchase obligations, interest obligations and other obligations are as follows (dollars in thousands):
|
| Payments Due by Period | ||||||||||||||||||||||
Contractual Obligations |
| Total |
| Less than 1 Year |
| 1-3 Years |
| 3-5 Years |
| More than 5 Years |
| Uncertain Timeframe | ||||||||||||
Long-Term Debt Obligations |
| $ | 201,810 | |
| $ | 42,514 | |
| $ | 99,050 | |
| $ | - | |
| $ | 60,246 | |
| $ | - | |
Operating Lease Obligations |
| 71,453 | |
| 16,163 | |
| 21,640 | |
| 16,700 | |
| 16,950 | |
| - | | ||||||
Purchase Obligations (1) |
| 52,933 | |
| 51,302 | |
| 204 | |
| 1,351 | |
| 76 | |
| - | | ||||||
Interest Obligations |
| 26,123 | |
| 8,487 | |
| 10,519 | |
| 5,109 | |
| 2,008 | |
| - | | ||||||
Tax Obligations |
| 17,849 | |
| - | |
| - | |
| - | |
| - | |
| 17,849 | | ||||||
Other Obligations (2) |
| 7,101 | |
| 476 | |
| 1,120 | |
| 1,368 | |
| 4,137 | |
| - | | ||||||
Total |
| $ | 377,269 | |
| $ | 118,942 | |
| $ | 132,533 | |
| $ | 24,528 | |
| $ | 83,417 | |
| $ | 17,849 | |
27
Table of Contents
(1) | Purchase obligations include all open purchase orders as of July 31, 2014 . |
(2) | Other obligations represent expected payments under the Company's U.S. postretirement medical plan and international pension plans as disclosed in Note 5 to the consolidated financial statements, under Item 8 of this report. |
Inflation and Changing Prices
Essentially all of the Company's revenue is derived from the sale of its products in competitive markets. Because prices are influenced by market conditions, it is not always possible to fully recover cost increases through pricing. Changes in product mix from year to year, timing differences in instituting price changes, and the large amount of part numbers make it impracticable to accurately define the impact of inflation on profit margins.
Critical Accounting Estimates
Management's discussion and analysis of the Company's financial condition and results of operations are based upon the Company's Consolidated Financial Statements, which have been prepared in accordance with accounting principles generally accepted in the United States. The preparation of these financial statements requires management to make estimates and judgments that affect the reported amounts of assets, liabilities, revenues and expenses, and related disclosure of contingent assets and liabilities. The Company bases these estimates and judgments on historical experience and on various other assumptions that are believed to be reasonable under the circumstances. Actual results may differ from these estimates and judgments.
The Company believes the following accounting estimates are most critical to an understanding of its financial statements. Estimates are considered to be critical if they meet both of the following criteria: (1) the estimate requires assumptions about material matters that are uncertain at the time the accounting estimates are made, and (2) material changes in the estimates are reasonably likely from period to period. For a detailed discussion on the application of these and other accounting estimates, refer to Note 1 to the Company's Consolidated Financial Statements.
Income Taxes
The Company's effective tax rate is based on pre-tax income and the tax rates applicable to that income in the various jurisdictions in which the Company operates. Significant judgment is required in determining the Company's effective income tax rate and in evaluating its tax positions. The Company establishes liabilities when it is more likely than not that the Company will not realize the full tax benefit of the position. The Company adjusts these liabilities in light of changing facts and circumstances.
Tax regulations may require items of income and expense to be included in a tax return in different periods than the items are reflected in the consolidated financial statements. As a result, the effective income tax rate reflected in the consolidated financial statements may be different than the tax rate reported in the income tax return. Some of these differences are permanent, such as expenses that are not deductible on the income tax return, and some are temporary differences, such as depreciation expense. Temporary differences create deferred tax assets and liabilities. Deferred tax assets generally represent items that can be used as tax deductions or credits in the tax return in future years for which the Company has already recorded the tax benefit in the consolidated financial statements. The Company establishes valuation allowances against its deferred tax assets when it is more likely than not that the amount of expected future taxable income will not support the use of the deduction or credit. The determination of the amount of valuation allowance to be provided on recorded deferred tax assets involves estimates regarding (1) the timing and amount of the reversal of taxable temporary differences, (2) expected future taxable income, and (3) the impact of tax planning strategies, and can also be impacted by changes to tax laws. Deferred tax liabilities generally represent tax expense recognized in the consolidated financial statements for which payment has been deferred or expensed for which the Company has already taken a deduction on an income tax return but has not yet recognized as expense in the consolidated financial statements.
The Company accounts for uncertain tax positions by recognizing the financial statement effects of a tax position only when, based upon the technical merits, it is "more-likely-than-not" that the position will be sustained upon examination. Judgment is required in evaluating tax positions and determining income tax provisions. The Company generally re-evaluates the technical merits of its tax positions and recognizes an uncertain tax benefit when (i) there is completion of a tax audit; (ii) there is a change in applicable tax law including a tax case ruling or legislative guidance; or (iii) there is an expiration of the statute of limitations.
In fiscal 2014, the Company completed the first phase of the sale of its Die-Cut businesses. In conjunction with the sale of this business platform, the Company repatriated approximately $57 million of the cash received, which primarily consisted of purchase price, to the United States. The Company does not provide for U.S. deferred taxes on cumulative earnings of non-U.S. affiliates and associated companies that have been re-invested indefinitely. These earnings related to ongoing operations have been reinvested in non-U.S. business operations, and the Company does not intend to repatriate these earnings to fund U.S. operations. In fiscal 2013, the Company repatriated approximately $204 million of foreign cash to help fund the acquisition of PDC. Given
28
Table of Contents
the sale of the Die-Cut business was the largest business divestiture in the Company's history and the acquisition of PDC was the largest acquisition in the Company's history, these repatriations were unique, and do not change management's assertion that the remaining cumulative earnings are reinvested indefinitely.
Goodwill and Other Indefinite-lived Intangible Assets
The allocation of purchase price for business combinations requires management estimates and judgment as to expectations for future cash flows of the acquired business and the allocation of those cash flows to identifiable intangible assets in determining the estimated fair value for purchase price allocation purposes. If the actual results differ from the estimates and judgments used in these estimates, the amounts recorded in the financial statements could result in a possible impairment of the intangible assets and goodwill or require acceleration of the amortization expense of finite-lived intangible assets. In addition, accounting guidance requires that goodwill and other indefinite-lived intangible assets be tested at least annually for impairment. If circumstances or events prior to the date of the required annual assessment indicate that, in management's judgment, it is more likely than not that there has been a reduction of fair value of a reporting unit below its carrying value, the Company performs an impairment analysis at the time of such circumstance or event. Changes in management's estimates or judgments could result in an impairment charge, and such a charge could have an adverse effect on the Company's financial condition and results of operations. To aid in establishing the value of goodwill and other intangible assets at the time of acquisition, Company policy states that all acquisitions with goodwill of greater than $20 million require the use of external valuations.
The Company has identified two operating segments, Identification Solutions and Workplace Safety. The Company has identified six reporting units within its two operating segments with the following goodwill balances as of July 31, 2014: IDS Americas & Europe, $319.0 million; IDS APAC, $0; PeopleID, $93.3 million; WPS Americas, $10.9 million; WPS Europe, $58.9 million; and WPS APAC, $32.9 million. Brady continues to believe that the discounted cash flow model and market multiples model provide a reasonable and meaningful fair value estimate based upon the reporting units' projections of future operating results and cash flows and replicates how market participants would value the Company's reporting units. The projections of future operating results, which are based on both past performance and the projections and assumptions used in the Company's current and long range operating plans, are subject to change as a result of changing economic and competitive conditions. Significant estimates used by management in the discounted cash flows methodology include estimates of future cash flows based on expected growth rates, price increases, fluctuations in gross margin and SG&A as a percentage of sales, capital expenditures, working capital levels, income tax rates, the benefits of recent acquisitions and expected synergies, and a weighted-average cost of capital that reflects the specific risk profile of the reporting unit being tested. Significant negative industry or economic trends, disruptions to the Company's business, loss of significant customers, inability to effectively integrate acquired businesses, unexpected significant changes or planned changes in use of the assets or in entity structure, and divestitures may adversely impact the assumptions used in the valuations.
In the event the fair value of a reporting unit is less than the carrying value, including goodwill, the Company would then perform an additional assessment that would compare the implied fair value of goodwill with the carrying amount of goodwill. The determination of the implied fair value of goodwill would require management to compare the fair value of the reporting unit to the estimated fair value of the assets and liabilities of the reporting unit. If necessary, the Company may consult valuation specialists to assist with the assessment of the estimated fair value of assets and liabilities for the reporting unit. If the implied fair value of the goodwill is less than the carrying value, an impairment charge would be recorded.
The Company considers a reporting unit's fair value to be substantially in excess of its carrying value at 20% or greater. The annual impairment testing performed on May 1, 2014, in accordance with ASC 350, "Intangibles - Goodwill and Other" ("Step One") indicated that each of the following reporting units had a fair value substantially in excess of its carrying value: IDS Americas & Europe, IDS APAC, WPS Americas, WPS Europe, and WPS APAC. The Company concluded that the PeopleID reporting unit failed Step One of the goodwill impairment test.
PeopleID Goodwill Impairment
Management proceeded to measure the amount of the potential impairment ("Step Two") for the PeopleID reporting unit with the assistance of a third party valuation firm utilizing a discounted cash flow model and market multiples approach. The Company calculated the fair value of the identifiable assets and liabilities of the reporting unit as if it had been acquired in a business combination, and the excess fair value of the reporting unit over the fair value of its identifiable assets and liabilities was the implied fair value of goodwill. Upon completion of the assessment, the Company recognized a goodwill impairment charge of $100.4 million during the three months ended July 31, 2014.
29
Table of Contents
In conjunction with the goodwill impairment test of the PeopleID reporting unit, the carrying value of the finite and indefinite-lived intangible assets within the reporting unit were compared to the fair value calculated as part of the Step Two analysis described above. Finite and indefinite-lived other intangible assets in the amount of $48.2 million primarily associated with the PeopleID reporting unit were impaired during the three months ended July 31, 2014.
Reserves and Allowances
The Company has recorded reserves or allowances for inventory obsolescence, uncollectible accounts receivable, and credit memos. These accounts require the use of estimates and judgment. The Company bases its estimates on historical experience and on various other assumptions that are believed to be reasonable under the circumstances. The Company believes that such estimates are made with consistent and appropriate methods. Actual results may differ from these estimates under different assumptions or conditions.
New Accounting Standards
The information required by this Item is provided in Note 1 of the Notes to Consolidated Financial Statements contained in Item 8 - Financial Statements and Supplementary Data.
Forward-Looking Statements
In this annual report on Form 10-K, statements that are not reported financial results or other historic information are "forward-looking statements." These forward-looking statements relate to, among other things, the Company's future financial position, business strategy, targets, projected sales, costs, earnings, capital expenditures, debt levels and cash flows, and plans and objectives of management for future operations.
The use of words such as "may," "will," "expect," "intend," "estimate," "anticipate," "believe," "should," "project" or "plan" or similar terminology are generally intended to identify forward-looking statements. These forward-looking statements by their nature address matters that are, to different degrees, uncertain and are subject to risks, assumptions, and other factors, some of which are beyond Brady's control, that could cause actual results to differ materially from those expressed or implied by such forward-looking statements. For Brady, uncertainties arise from:
• | Implementation of the healthcare strategy; |
• | Implementation of the Workplace Safety strategy; |
• | Future competition; |
• | Risks associated with restructuring plans; |
• | Future financial performance of major markets Brady serves, which include, without limitation, telecommunications, hard disk drive, manufacturing, electrical, construction, laboratory, education, governmental, public utility, computer, healthcare and transportation; |
• | Technology changes and potential security violations to the Company's information technology system |
• | Fluctuations in currency rates versus the U.S. dollar; |
• | Risks associated with international operations; |
• | Difficulties associated with exports; |
• | Brady's ability to develop and successfully market new products; |
• | Risks associated with identifying, completing, and integrating acquisitions; |
• | Changes in the supply of, or price for, parts and components; |
• | Increased price pressure from suppliers and customers; |
• | Brady's ability to retain significant contracts and customers; |
• | Risk associated with loss of key talent; |
• | Risks associated with divestitures and businesses held for sale; |
• | Risks associated with obtaining governmental approvals and maintaining regulatory compliance; |
• | Risk associated with product liability claims; |
• | Environmental, health and safety compliance costs and liabilities; |
• | Potential write-offs of Brady's substantial intangible assets; |
• | Risks associated with our ownership structure; |
• | Unforeseen tax consequences; |
• | Brady's ability to maintain compliance with its debt covenants; |
• | Increase in our level of debt; and |
30
Table of Contents
• | Numerous other matters of national, regional and global scale, including those of a political, economic, business, competitive, and regulatory nature contained from time to time in Brady's U.S. Securities and Exchange Commission filings, including, but not limited to, those factors listed in the "Risk Factors" section within Item 1A of Part I of this Form 10-K. |
These uncertainties may cause Brady's actual future results to be materially different than those expressed in its forward-looking statements. Brady does not undertake to update its forward-looking statements except as required by law.
Risk Factors
Refer to the information contained in Item 1A - Risk Factors.
31
Table of Contents
Item 7A. Quantitative and Qualitative Disclosures About Market Risk
The Company's business operations give rise to market risk exposure due to changes in foreign exchange rates. To manage that risk effectively, the Company enters into hedging transactions, according to established guidelines and policies that enable it to mitigate the adverse effects of this financial market risk.
The global nature of the Company's business requires active participation in the foreign exchange markets. As a result of investments, production facilities and other operations on a global scale, the Company has assets, liabilities and cash flows in currencies other than the U.S. Dollar. The objective of the Company's foreign currency exchange risk management is to minimize the impact of currency movements on non-functional currency transactions and minimize the foreign currency translation impact on the Company's operations. To achieve this objective, the Company hedges a portion of known exposures using forward contracts. Main exposures are related to transactions denominated in the British Pound, the Euro, Canadian Dollar, Australian Dollar, Swiss Franc, Malaysian Ringgit, and Singapore Dollar. As of July 31, 2014 , the Company had no outstanding forward foreign exchange contracts designated as cash flow hedges. The Company uses Euro-denominated debt of €75.0 million and British Pound-denominated intercompany debt of £25.0 million designated as hedge instruments to hedge portions of the Company's net investments in its European and British Pound denominated foreign operations. The Company's revolving credit facility allows it to borrow up to $100.0 million in currencies other than U.S. Dollars under an alternative currency sub-limit. The Company has periodically borrowed funds in Euro and British Pounds under this sub-limit. Debt issued in currencies other than U.S. Dollars acts as a natural hedge to the Company's exposure to the associated currency.
The Company also faces exchange rate risk from transactions with customers in countries outside the United States and from intercompany transactions between affiliates. Although the Company has a U.S. dollar functional currency for reporting purposes, it has manufacturing sites throughout the world and the majority of its sales are generated in foreign currencies. Costs incurred and sales recorded by subsidiaries operating outside of the United States are translated into U.S. dollars using exchange rates effective during the respective period. As a result, the Company is exposed to movements in the exchange rates of various currencies against the U.S. dollar. In particular, the Company has more sales in European currencies than it has expenses in those currencies. Therefore, when European currencies strengthen or weaken against the U.S. dollar, operating profits are increased or decreased, respectively.
Currency exchange rates decreased fiscal 2014 sales by 0.1% compared to fiscal 2013 as the U.S. dollar appreciated, on average, against other major currencies throughout the year. The most significant impact on sales due to currency fluctuations occurred during the second quarter ended January 31, 2014, as sales declined by 0.6% as compared to the same quarter of the prior year. This decline was primarily driven by the appreciation of the U.S. dollar against the Euro.
The Company is subject to the risk of change in foreign currency exchange rates due to its operations in foreign countries. The Company has manufacturing facilities and sells and distributes its products throughout the world. As a result, the Company's financial results could be significantly affected by factors such as changes in foreign currency exchange rates or weak economic conditions in the foreign markets in which the Company manufactures, distributes and sells its products. The Company's operating results are principally exposed to changes in exchange rates between the U.S. dollar and the Australian dollar, the Canadian dollar, the Singapore dollar, the Euro, the British Pound, the Brazilian Real, and the Chinese Yuan. Changes in foreign currency exchange rates for the Company's foreign subsidiaries reporting in local currencies are generally reported as a component of stockholders' investment. The Company's currency translation adjustment recorded in fiscal 2014 and 2013 as a separate component of stockholders' investment was $7.5 million favorable and $2.3 million unfavorable, respectively. As of July 31, 2014 and 2013 , the Company's foreign subsidiaries had net current assets (defined as current assets less current liabilities) subject to foreign currency translation risk of $200.1 million and $245.1 million, respectively. The potential decrease in net current assets as of July 31, 2014 , from a hypothetical 10 percent adverse change in quoted foreign currency exchange rates would be approximately $20 million. This sensitivity analysis assumes a parallel shift in all major foreign currency exchange rates versus the U.S. dollar. Exchange rates rarely move in the same direction relative to the U.S. dollar due to positive and negative correlations of the various global currencies. This assumption may overstate the impact of changing exchange rates on individual assets and liabilities denominated in a foreign currency.
The Company could be exposed to interest rate risk through its corporate borrowing activities. The objective of the Company's interest rate risk management activities is to manage the levels of the Company's fixed and floating interest rate exposure to be consistent with the Company's preferred mix. The interest rate risk management program allows the Company to enter into approved interest rate derivatives if there is a desire to modify the Company's exposure to interest rates. As of July 31, 2014 , the Company had no interest rate derivatives.
32
Table of Contents
Item 8. Financial Statements and Supplementary Data
BRADY CORPORATION & SUBSIDIARIES
INDEX TO FINANCIAL STATEMENTS
| Page |
Report of Independent Registered Public Accounting Firm | 34 |
Financial Statements: |
|
Consolidated Balance Sheets - July 31, 2014 and 2013 | 35 |
Consolidated Statements of Earnings - Years Ended July 31, 2014, 2013, and 2012 | 36 |
Consolidated Statements of Comprehensive Loss - Years Ended July 31, 2014, 2013 and 2012 | 37 |
Consolidated Statements of Stockholders' Investment - Years Ended July 31, 2014, 2013, and 2012 | 38 |
Consolidated Statements of Cash Flows - Years Ended July 31, 2014, 2013, and 2012 | 39 |
Notes to Consolidated Financial Statements - Years Ended July 31, 2014, 2013, and 2012 | 40 |
33
Table of Contents
REPORT OF INDEPENDENT REGISTERED PUBLIC ACCOUNTING FIRM
To the Board of Directors and Stockholders of
Brady Corporation
Milwaukee, Wisconsin
We have audited the accompanying consolidated balance sheets of Brady Corporation and subsidiaries (the "Company") as of July 31, 2014 and 2013, and the related consolidated statements of earnings, comprehensive loss, stockholders' investment, and cash flows for each of the three years in the period ended July 31, 2014. Our audits also included the financial statement schedule listed in the Index at Item 15. These consolidated financial statements and financial statement schedule are the responsibility of the Company's management. Our responsibility is to express an opinion on the consolidated financial statements and financial statement schedule based on our audits.
We conducted our audits in accordance with the standards of the Public Company Accounting Oversight Board (United States). Those standards require that we plan and perform the audit to obtain reasonable assurance about whether the financial statements are free of material misstatement. An audit includes examining, on a test basis, evidence supporting the amounts and disclosures in the financial statements. An audit also includes assessing the accounting principles used and significant estimates made by management, as well as evaluating the overall financial statement presentation. We believe that our audits provide a reasonable basis for our opinion.
In our opinion, such consolidated financial statements present fairly, in all material respects, the financial position of Brady Corporation and subsidiaries at July 31, 2014 and 2013, and the results of their operations and their cash flows for each of the three years in the period ended July 31, 2014, in conformity with accounting principles generally accepted in the United States of America. Also, in our opinion, such financial statement schedule, when considered in relation to the basic consolidated financial statements taken as a whole, present fairly, in all material respects, the information set forth therein.
We have also audited, in accordance with the standards of the Public Company Accounting Oversight Board (United States), the Company's internal control over financial reporting as of July 31, 2014, based on the criteria established in Internal Control-Integrated Framework (1992) issued by the Committee of Sponsoring Organizations of the Treadway Commission and our report dated September 29, 2014, expressed an unqualified opinion on the Company's internal control over financial reporting.
/s/ DELOITTE & TOUCHE LLP
Milwaukee, Wisconsin
September 29, 2014
34
Table of Contents
BRADY CORPORATION AND SUBSIDIARIES
CONSOLIDATED BALANCE SHEETS
July 31, 2014 and 2013
| 2014 |
| 2013 | ||||
| (Dollars in thousands) | ||||||
ASSETS |
|
|
| ||||
Current assets: |
|
|
| ||||
Cash and cash equivalents | $ | 81,834 | |
| $ | 91,058 | |
Accounts receivable - net | 177,648 | |
| 169,261 | | ||
Inventories: |
|
|
| ||||
Finished products | 73,096 | |
| 64,544 | | ||
Work-in-process | 17,689 | |
| 14,776 | | ||
Raw materials and supplies | 22,490 | |
| 15,387 | | ||
Total inventories | 113,275 | |
| 94,707 | | ||
Assets held for sale | 49,542 | |
| 119,864 | | ||
Prepaid expenses and other current assets | 41,543 | |
| 37,600 | | ||
Total current assets | 463,842 | |
| 512,490 | | ||
Other assets: |
|
|
| ||||
Goodwill | 515,004 | |
| 617,236 | | ||
Other intangible assets | 91,014 | |
| 156,851 | | ||
Deferred income taxes | 27,320 | |
| 8,623 | | ||
Other | 22,314 | |
| 21,325 | | ||
Property, plant and equipment: |
|
|
| ||||
Cost: |
|
|
| ||||
Land | 7,875 | |
| 7,861 | | ||
Buildings and improvements | 101,866 | |
| 91,471 | | ||
Machinery and equipment | 288,409 | |
| 266,787 | | ||
Construction in progress | 12,500 | |
| 11,842 | | ||
| 410,650 | |
| 377,961 | | ||
Less accumulated depreciation | 276,479 | |
| 255,803 | | ||
Property, plant and equipment - net | 134,171 | |
| 122,158 | | ||
Total | $ | 1,253,665 | |
| $ | 1,438,683 | |
LIABILITIES AND STOCKHOLDERS' INVESTMENT |
|
|
| ||||
Current liabilities: |
|
|
| ||||
Notes payable | $ | 61,422 | |
| $ | 50,613 | |
Accounts payable | 88,099 | |
| 82,519 | | ||
Wages and amounts withheld from employees | 38,064 | |
| 42,413 | | ||
Liabilities held for sale | 10,640 | |
| 34,583 | | ||
Taxes, other than income taxes | 7,994 | |
| 8,243 | | ||
Accrued income taxes | 7,893 | |
| 7,056 | | ||
Other current liabilities | 35,319 | |
| 36,806 | | ||
Current maturities on long-term debt | 42,514 | |
| 61,264 | | ||
Total current liabilities | 291,945 | |
| 323,497 | | ||
Long-term obligations, less current maturities | 159,296 | |
| 201,150 | | ||
Other liabilities | 69,348 | |
| 83,239 | | ||
Total liabilities | 520,589 | |
| 607,886 | | ||
Stockholders' investment: |
|
|
| ||||
Class A nonvoting common stock - Issued 51,261,487 and 51,261,487 shares, respectively; (aggregate liquidation preference of $42,803 and $42,803 at July 31, 2014 and 2013, respectively) | 513 | |
| 513 | | ||
Class B voting common stock - Issued and outstanding 3,538,628 shares | 35 | |
| 35 | | ||
Additional paid-in capital | 311,811 | |
| 306,191 | | ||
Earnings retained in the business | 452,057 | |
| 538,512 | | ||
Treasury stock - 3,477,291 and 2,626,276 shares, respectively of Class A nonvoting common stock, at cost | (93,337 | ) |
| (69,797 | ) | ||
Accumulated other comprehensive income | 64,156 | |
| 56,063 | | ||
Other | (2,159 | ) |
| (720 | ) | ||
Total stockholders' investment | 733,076 | |
| 830,797 | | ||
Total | $ | 1,253,665 | |
| $ | 1,438,683 | |
See Notes to Consolidated Financial Statements.
35
Table of Contents
BRADY CORPORATION AND SUBSIDIARIES
CONSOLIDATED STATEMENTS OF EARNINGS
Years Ended July 31, 2014 , 2013 and 2012
| 2014 |
| 2013 |
| 2012 | ||||||
| (In thousands, except per share amounts) | ||||||||||
Net sales | $ | 1,225,034 | |
| $ | 1,157,792 | |
| $ | 1,071,504 | |
Cost of products sold | 615,470 | |
| 548,444 | |
| 480,535 | | |||
Gross margin | 609,564 | |
| 609,348 | |
| 590,969 | | |||
Operating expenses: |
|
|
|
|
| ||||||
Research and development | 35,048 | |
| 33,552 | |
| 34,528 | | |||
Selling, general and administrative | 452,164 | |
| 427,858 | |
| 392,694 | | |||
Restructuring charges | 15,012 | |
| 26,046 | |
| 6,084 | | |||
Impairment charges | 148,551 | |
| 204,448 | |
| - | | |||
Total operating expenses | 650,775 | |
| 691,904 | |
| 433,306 | | |||
Operating (loss) income | (41,211 | ) |
| (82,556 | ) |
| 157,663 | | |||
Other income and (expense): |
|
|
|
|
| ||||||
Investment and other income | 2,402 | |
| 3,523 | |
| 2,082 | | |||
Interest expense | (14,300 | ) |
| (16,641 | ) |
| (19,090 | ) | |||
(Loss) earnings from continuing operations before income taxes | (53,109 | ) |
| (95,674 | ) |
| 140,655 | | |||
Income tax (benefit) expense | (4,963 | ) |
| 42,583 | |
| 37,162 | | |||
(Loss) earnings from continuing operations | $ | (48,146 | ) |
| $ | (138,257 | ) |
| $ | 103,493 | |
Earnings (loss) from discontinued operations, net of income taxes | 2,178 | |
| (16,278 | ) |
| (121,404 | ) | |||
Net loss | $ | (45,968 | ) |
| $ | (154,535 | ) |
| $ | (17,911 | ) |
(Loss) earnings from continuing operations per Class A Nonvoting Common Share |
|
|
|
|
| ||||||
Basic | $ | (0.93 | ) |
| $ | (2.70 | ) |
| $ | 1.97 | |
Diluted | $ | (0.93 | ) |
| $ | (2.70 | ) |
| $ | 1.95 | |
(Loss) earnings from continuing operations per Class B Voting Common Share: |
|
|
|
|
| ||||||
Basic | $ | (0.95 | ) |
| $ | (2.71 | ) |
| $ | 1.95 | |
Diluted | $ | (0.95 | ) |
| $ | (2.71 | ) |
| $ | 1.94 | |
Earnings (loss) from discontinued operations per Class A Nonvoting Common Share: |
|
|
|
|
| ||||||
Basic | $ | 0.04 | |
| $ | (0.32 | ) |
| $ | (2.31 | ) |
Diluted | $ | 0.04 | |
| $ | (0.32 | ) |
| $ | (2.29 | ) |
Earnings (loss) from discontinued operations per Class B Voting Common Share: |
|
|
|
|
| ||||||
Basic | $ | 0.05 | |
| $ | (0.32 | ) |
| $ | (2.31 | ) |
Diluted | $ | 0.05 | |
| $ | (0.32 | ) |
| $ | (2.30 | ) |
Net loss per Class A Nonvoting Common Share: |
|
|
|
|
| ||||||
Basic | $ | (0.89 | ) |
| $ | (3.02 | ) |
| $ | (0.35 | ) |
Diluted | $ | (0.89 | ) |
| $ | (3.02 | ) |
| $ | (0.34 | ) |
Dividends | $ | 0.78 | |
| $ | 0.76 | |
| $ | 0.74 | |
Net loss per Class B Voting Common Share: |
|
|
|
|
| ||||||
Basic | $ | (0.90 | ) |
| $ | (3.03 | ) |
| $ | (0.36 | ) |
Diluted | $ | (0.90 | ) |
| $ | (3.03 | ) |
| $ | (0.36 | ) |
Dividends | $ | 0.76 | |
| $ | 0.74 | |
| $ | 0.72 | |
Weighted average common shares outstanding (in thousands): |
|
|
|
|
| ||||||
Basic | 51,866 | |
| 51,330 | |
| 52,453 | | |||
Diluted | 51,866 | |
| 51,330 | |
| 52,821 | | |||
See Notes to Consolidated Financial Statements.
36
Table of Contents
BRADY CORPORATION AND SUBSIDIARIES
CONSOLIDATED STATEMENTS OF COMPREHENSIVE LOSS
Years Ended July 31, 2014 , 2013 and 2012
| 2014 |
| 2013 |
| 2012 | ||||||
| (Dollars in thousands) | ||||||||||
Net loss | $ | (45,968 | ) |
| $ | (154,535 | ) |
| $ | (17,911 | ) |
Other comprehensive (loss) income: |
|
|
|
|
| ||||||
Foreign currency translation adjustments: |
|
|
|
|
| ||||||
Net gain (loss) recognized in other comprehensive income (loss) | 4,543 | |
| (2,312 | ) |
| (62,827 | ) | |||
Reclassification adjustment for losses included in net loss | 3,004 | |
| - | |
| - | | |||
| 7,547 | |
| (2,312 | ) |
| (62,827 | ) | |||
|
|
|
|
|
| ||||||
Net investment hedge translation adjustments | (4,243 | ) |
| (6,537 | ) |
| 20,508 | | |||
Long-term intercompany loan translation adjustments: |
|
|
|
|
| ||||||
Net gain (loss) recognized in other comprehensive income (loss) | 211 | |
| 3,108 | |
| (2,170 | ) | |||
Reclassification adjustment for losses included in net loss | 865 | |
| - | |
| - | | |||
| 1,076 | |
| 3,108 | |
| (2,170 | ) | |||
|
|
|
|
|
| ||||||
Cash flow hedges: |
|
|
|
|
| ||||||
Net gain (loss) recognized in other comprehensive income (loss) | 8 | |
| (652 | ) |
| 2,389 | | |||
Reclassification adjustment for (gains) losses included in net loss | (147 | ) |
| (578 | ) |
| 494 | | |||
| (139 | ) |
| (1,230 | ) |
| 2,883 | | |||
Pension and other post-retirement benefits: |
|
|
|
|
| ||||||
Net gain (loss) recognized in other comprehensive income (loss) | 5,211 | |
| 1,617 | |
| (1,015 | ) | |||
Actuarial gain amortization | (240 | ) |
| (25 | ) |
| (201 | ) | |||
Prior service credit amortization | (203 | ) |
| (203 | ) |
| (203 | ) | |||
Reclassification adjustment for losses included in net earnings | 131 | |
| - | |
| - | | |||
| 4,899 | |
| 1,389 | |
| (1,419 | ) | |||
|
|
|
|
|
| ||||||
Other comprehensive income (loss), before tax | 9,140 | |
| (5,582 | ) |
| (43,025 | ) | |||
Income tax (expense) benefit related to items of other comprehensive income (loss) | (1,047 | ) |
| 2,234 | |
| (11,462 | ) | |||
Other comprehensive income (loss), net of tax | 8,093 | |
| (3,348 | ) |
| (54,487 | ) | |||
Comprehensive loss | $ | (37,875 | ) |
| $ | (157,883 | ) |
| $ | (72,398 | ) |
See Notes to Consolidated Financial Statements.
37
Table of Contents
BRADY CORPORATION AND SUBSIDIARIES
CONSOLIDATED STATEMENTS OF STOCKHOLDERS' INVESTMENT
|
| Common Stock |
| Additional Paid-In Capital |
| Earnings Retained in the Business |
| Treasury Stock |
| Accumulated Other Comprehensive Income |
| Other | ||||||||||||
|
| (In thousands, except per share amounts) | ||||||||||||||||||||||
Balances at July 31, 2011 |
| $ | 548 | |
| $ | 307,527 | |
| $ | 789,100 | |
| $ | (50,017 | ) |
| $ | 113,898 | |
| $ | (4,864 | ) |
Net (loss) earnings |
| - | |
| - | |
| (17,911 | ) |
| - | |
| - | |
| - | | ||||||
Net currency translation adjustment and other (Note 4) |
| - | |
| - | |
| - | |
| - | |
| (54,487 | ) |
| - | | ||||||
Issuance of 265,491 shares of Class A Common Stock under stock option plan |
| - | |
| (3,516 | ) |
| - | |
| 7,380 | |
| - | |
| - | | ||||||
Other (Note 8) |
| - | |
| (1,637 | ) |
| - | |
| (30 | ) |
| - | |
| 1,560 | | ||||||
Tax benefit from exercise of stock options and deferred compensation distributions |
| - | |
| 1,167 | |
| - | |
| - | |
| - | |
| - | | ||||||
Stock-based compensation expense (Note 8) |
| - | |
| 9,467 | |
| - | |
| - | |
| - | |
| - | | ||||||
Purchase of 1,869,193 shares of Class A Common Stock |
| - | |
| - | |
| - | |
| (49,933 | ) |
| - | |
| - | | ||||||
Cash dividends on Common Stock |
|
|
|
|
|
|
|
|
|
|
|
| ||||||||||||
Class A - $0.74 per share |
| - | |
| - | |
| (36,340 | ) |
| - | |
| - | |
| - | | ||||||
Class B - $0.72 per share |
| - | |
| - | |
| (2,559 | ) |
| - | |
| - | |
| - | | ||||||
Balances at July 31, 2012 |
| $ | 548 | |
| $ | 313,008 | |
| $ | 732,290 | |
| $ | (92,600 | ) |
| $ | 59,411 | |
| $ | (3,304 | ) |
Net (loss) earnings |
| - | |
| - | |
| (154,535 | ) |
| - | |
| - | |
| - | | ||||||
Net currency translation adjustment and other (Note 4) |
| - | |
| - | |
| - | |
| - | |
| (3,348 | ) |
| - | | ||||||
Issuance of 1,080,089 shares of Class A Common Stock under stock option plan |
| - | |
| (9,721 | ) |
| - | |
| 30,045 | |
| - | |
| - | | ||||||
Other (Note 8) |
| - | |
| (1,266 | ) |
| - | |
| (2,121 | ) |
| - | |
| 2,584 | | ||||||
Tax benefit from exercise of stock options and deferred compensation distributions |
| - | |
| 2,434 | |
| - | |
| - | |
| - | |
| - | | ||||||
Stock-based compensation expense (Note 8) |
| - | |
| 1,736 | |
| - | |
| - | |
| - | |
| - | | ||||||
Purchase of 188,167 shares of Class A Common Stock |
| - | |
| - | |
| - | |
| (5,121 | ) |
| - | |
| - | | ||||||
Cash dividends on Common Stock |
|
|
|
|
|
|
|
|
|
|
|
| ||||||||||||
Class A - $0.76 per share |
| - | |
| - | |
| (36,613 | ) |
| - | |
| - | |
| - | | ||||||
Class B - $0.74 per share |
| - | |
| - | |
| (2,630 | ) |
| - | |
| - | |
| - | | ||||||
Balances at July 31, 2013 |
| $ | 548 | |
| $ | 306,191 | |
| $ | 538,512 | |
| $ | (69,797 | ) |
| $ | 56,063 | |
| $ | (720 | ) |
Net (loss) earnings |
| - | |
| - | |
| (45,968 | ) |
| - | |
| - | |
| - | | ||||||
Net currency translation adjustment and other (Note 4) |
| - | |
| - | |
| - | |
| - | |
| 8,093 | |
| - | | ||||||
Issuance of 490,507 shares of Class A Common Stock under stock option plan |
| - | |
| 847 | |
| - | |
| 11,266 | |
| - | |
| - | | ||||||
Other (Note 8) |
| - | |
| (371 | ) |
| - | |
| (4,225 | ) |
| - | |
| (1,439 | ) | ||||||
Tax benefit from exercise of stock options and deferred compensation distributions |
| - | |
| (70 | ) |
| - | |
| - | |
| - | |
| - | | ||||||
Stock-based compensation expense (Note 8) |
| - | |
| 5,214 | |
| - | |
| - | |
| - | |
| - | | ||||||
Purchase of 1,180,531 shares of Class A Common Stock |
| - | |
| - | |
| - | |
| (30,581 | ) |
| - | |
| - | | ||||||
Cash dividends on Common Stock |
|
|
|
|
|
|
|
|
|
|
|
| ||||||||||||
Class A - $0.78 per share |
| - | |
| - | |
| (37,786 | ) |
| - | |
| - | |
| - | | ||||||
Class B - $0.76 per share |
| - | |
| - | |
| (2,701 | ) |
| - | |
| - | |
| - | | ||||||
Balances at July 31, 2014 |
| $ | 548 | |
| $ | 311,811 | |
| $ | 452,057 | |
| $ | (93,337 | ) |
| $ | 64,156 | |
| $ | (2,159 | ) |
See Notes to Consolidated Financial Statements.
38
Table of Contents
BRADY CORPORATION AND SUBSIDIARIES
CONSOLIDATED STATEMENTS OF CASH FLOWS
| 2014 |
| 2013 |
| 2012 | ||||||
| (Dollars in thousands) | ||||||||||
Operating activities: |
|
|
|
|
| ||||||
Net loss | $ | (45,968 | ) |
| $ | (154,535 | ) |
| $ | (17,911 | ) |
Adjustments to reconcile net loss to net cash provided by operating activities: |
|
|
|
|
| ||||||
Depreciation and amortization | 44,598 | |
| 48,725 | |
| 43,987 | | |||
Non-cash portion of restructuring charges | 566 | |
| 3,699 | |
| 458 | | |||
Non-cash portion of stock-based compensation expense | 5,214 | |
| 1,736 | |
| 9,735 | | |||
Impairment charges | 148,551 | |
| 204,448 | |
| 115,688 | | |||
Loss on write-down of assets held for sale | - | |
| 15,658 | |
| - | | |||
Loss on sales of businesses | 1,238 | |
| 3,138 | |
| 204 | | |||
Deferred income taxes | (27,516 | ) |
| 21,630 | |
| (9,679 | ) | |||
Changes in operating assets and liabilities (net of effects of business acquisitions/divestitures): |
|
|
|
|
| ||||||
Accounts receivable | (3,600 | ) |
| 1,535 | |
| 18,089 | | |||
Inventories | (12,608 | ) |
| 2,440 | |
| (7,674 | ) | |||
Prepaid expenses and other assets | (278 | ) |
| 5,036 | |
| (2,744 | ) | |||
Accounts payable and accrued liabilities | (20,508 | ) |
| (2,285 | ) |
| (29,370 | ) | |||
Income taxes | 3,731 | |
| (7,722 | ) |
| 23,922 | | |||
Net cash provided by operating activities | 93,420 | |
| 143,503 | |
| 144,705 | | |||
Investing activities: |
|
|
|
|
| ||||||
Purchases of property, plant and equipment | (43,398 | ) |
| (35,687 | ) |
| (24,147 | ) | |||
Payments of contingent consideration | - | |
| - | |
| (2,580 | ) | |||
Settlement of net investment hedges | - | |
| - | |
| (797 | ) | |||
Acquisition of business, net of cash acquired | - | |
| (301,157 | ) |
| (37,649 | ) | |||
Sales of businesses, net of cash retained | 54,242 | |
| 10,178 | |
| 856 | | |||
Other | (637 | ) |
| 900 | |
| (287 | ) | |||
Net cash provided by (used in) investing activities | 10,207 | |
| (325,766 | ) |
| (64,604 | ) | |||
Financing activities: |
|
|
|
|
| ||||||
Payment of dividends | (40,487 | ) |
| (39,243 | ) |
| (38,899 | ) | |||
Proceeds from issuance of common stock | 12,113 | |
| 20,324 | |
| 3,864 | | |||
Purchase of treasury stock | (30,581 | ) |
| (5,121 | ) |
| (49,933 | ) | |||
Proceeds from borrowing on notes payable | 63,000 | |
| 220,000 | |
| - | | |||
Repayment of borrowing on notes payable | (60,000 | ) |
| (181,000 | ) |
| - | | |||
Proceeds from borrowings on line of credit | 10,334 | |
| 11,613 | |
| - | | |||
Repayment of borrowing on line of credit | (2,398 | ) |
| - | |
| - | | |||
Principal payments on debt | (61,264 | ) |
| (61,264 | ) |
| (62,687 | ) | |||
Debt issuance costs | - | |
| - | |
| (961 | ) | |||
Income tax benefit from the exercise of stock options and deferred compensation distributions, and other | (6,104 | ) |
| 1,631 | |
| 792 | | |||
Net cash used in financing activities | (115,387 | ) |
| (33,060 | ) |
| (147,824 | ) | |||
Effect of exchange rate changes on cash | 2,536 | |
| 481 | |
| (16,348 | ) | |||
Net decrease in cash and cash equivalents | (9,224 | ) |
| (214,842 | ) |
| (84,071 | ) | |||
Cash and cash equivalents, beginning of period | 91,058 | |
| 305,900 | |
| 389,971 | | |||
Cash and cash equivalents, end of period | $ | 81,834 | |
| $ | 91,058 | |
| $ | 305,900 | |
Supplemental disclosures of cash flow information: |
|
|
|
|
| ||||||
Cash paid during the period for: |
|
|
|
|
| ||||||
Interest, net of capitalized interest | $ | 14,594 | |
| $ | 17,162 | |
| $ | 19,194 | |
Income taxes, net of refunds | 33,043 | |
| 34,030 | |
| 35,292 | | |||
Acquisitions: |
|
|
|
|
| ||||||
Fair value of assets acquired, net of cash | $ | - | |
| $ | 168,724 | |
| $ | 23,792 | |
Liabilities assumed | - | |
| (37,747 | ) |
| (8,987 | ) | |||
Goodwill | - | |
| 170,180 | |
| 22,844 | | |||
Net cash paid for acquisitions | $ | - | |
| $ | 301,157 | |
| $ | 37,649 | |
See Notes to Consolidated Financial Statements.
39
Table of Contents
BRADY CORPORATION AND SUBSIDIARIES
NOTES TO CONSOLIDATED FINANCIAL STATEMENTS
Years Ended July 31, 2014 , 2013 and 2012
(In thousands, except share and per share amounts)
1. Summary of Significant Accounting Policies
Nature of Operations - Brady Corporation is an international manufacturer of identification solutions and specialty materials that identify and protect premises, products and people. The ability to provide customers with a broad range of proprietary, customized, and diverse products for use in various applications, along with a commitment to quality and service, a global footprint, and multiple sales channels, have made Brady a world leader in many of its markets.
Principles of Consolidation - The accompanying consolidated financial statements include the accounts of Brady Corporation and its subsidiaries ("Brady" or the "Company"), all of which are wholly-owned. All intercompany accounts and transactions have been eliminated in consolidation.
Discontinued Operations - The results of operations of the Die-Cut businesses have been reported as discontinued operations for all periods presented. The corresponding assets and liabilities have been reclassified in accordance with the authoritative literature on assets held for sale at July 31, 2014 and 2013. In accordance with the authoritative literature, the Company has elected to not separately disclose the cash flows related to discontinued operations. See Note 15 for additional information about the Company's discontinued operations.
Use of Estimates - The preparation of financial statements in conformity with accounting principles generally accepted in the United States of America requires management to make estimates and assumptions that affect the reported amounts of assets and liabilities, disclosure of contingent assets and liabilities at the date of the financial statements, and the reported amounts of revenues and expenses during the reporting period. Actual results could differ from those estimates.
Subsequent Events - On August 1, 2014, the Company closed the second and final phase of the sale of the Die-Cut business to LTI Flexible Products, Inc. (d/b/a Boyd Corporation) for cash proceeds of approximately $7 million. The second-phase closing involved the sale of the remainder of the Company's Asian Die-Cut business, with operations in Langfang, Wuxi and Shenzhen in China and associated global sales support.
On August 1, 2014, the Board of Directors appointed J. Michael Nauman as President and Chief Executive Officer of the Company, effective August 4, 2014. In addition, Mr. Nauman was appointed as a member of the Board of Directors, effective as of August 4, 2014, with a term expiring at the next annual meeting of shareholders in November 2014.
On September 10, 2014, the Board of Directors appointed Thomas J. Felmer to serve as the Company's Senior Vice President and President - Workplace Safety, effective immediately. With Mr. Felmer's appointment as President - Workplace Safety, the Board of Directors appointed Aaron J. Pearce to serve as Senior Vice President and Chief Financial Officer of the Company, effective immediately.
On September 10, 2014 , the Company announced an increase in the annual dividend to shareholders of the Company's Class A Common Stock, from $0.78 to $0.80 per share. A quarterly dividend of $0.20 will be paid on October 31, 2014 , to shareholders of record at the close of business on October 10, 2014 . This dividend represents an increase of 2.6% and is the 29th consecutive annual increase in dividends.
Fair Value of Financial Instruments - The Company believes the carrying amount of its financial instruments (cash and cash equivalents, accounts receivable and accounts payable) is a reasonable estimate of the fair value of these instruments due to their short-term nature. See Note 7 for more information regarding the fair value of long-term debt and Note 12 for fair value measurements.
Cash Equivalents - The Company considers all highly liquid investments with original maturities of three months or less when acquired to be cash equivalents, which are recorded at cost.
Accounts Receivables - Accounts receivables are stated net of allowances for doubtful accounts of $3,069 and $5,093 as of July 31, 2014 and 2013 , respectively. The allowance for doubtful accounts decreased for the year ended July 31, 2014 compared to the year ended July 31, 2013. No single customer comprised more than 5% of the Company's consolidated net sales in fiscal 2014 , 2013 or 2012 , or 5% of the Company's consolidated accounts receivable as of July 31, 2014 or 2013 . Specific customer provisions are made during review of significant outstanding amounts, in which customer creditworthiness and current economic trends may indicate that collection is doubtful. In addition, provisions are made for the remainder of accounts receivable based upon the age of the receivable and the Company's historical collection experience.
40
Table of Contents
Inventories - Inventories are stated at the lower of cost or market. Cost has been determined using the last-in, first-out ("LIFO") method for certain domestic inventories ( 11.7% of total inventories at July 31, 2014 , and 12.0% of total inventories at July 31, 2013 ) and the first-in, first-out ("FIFO") or average cost methods for other inventories. Had all domestic inventories been accounted for on a FIFO basis instead of on a LIFO basis, the carrying value would have increased by $7,637 and $7,923 on July 31, 2014 and 2013 , respectively.
Goodwill - Goodwill is tested for impairment annually or more frequently if events or changes in circumstances indicate that the asset might be impaired. The Company completes impairment reviews for its reporting units using a fair-value method based on management's judgments and assumptions. The fair value represents the amount at which a reporting unit could be bought or sold in a current transaction between market participants on an arms-length basis. In estimating the fair value, the Company utilizes a discounted cash flow model and market multiples approach. The estimated fair value is compared with the carrying amount of the reporting unit, including goodwill. The annual impairment testing performed on May 1, 2014, in accordance with ASC 350, "Intangibles - Goodwill and Other" ("Step One") indicated that the following reporting units had a fair value substantially in excess of its carrying value: IDS Americas & Europe, IDS APAC, WPS Americas, WPS Europe and WPS APAC. The results of the Step One analysis completed over the Company's remaining reporting unit, PeopleID, indicated that it was potentially impaired. Refer to Note 3, "Goodwill and Other Intangible Assets" for further information.
Long-Lived and Other Intangible Assets - The cost of intangible assets with determinable useful lives is amortized to reflect the pattern of economic benefits consumed on a straight-line basis, over the estimated periods benefited. Intangible assets with indefinite useful lives as well as goodwill are not subject to amortization. These assets are assessed for impairment annually or more frequently as deemed necessary.
The Company evaluates whether events and circumstances have occurred that indicate the remaining estimated useful life of long-lived and other finite-lived intangible assets may warrant revision or that the remaining balance of an asset may not be recoverable. If impairment is determined to exist, any related impairment loss is calculated by comparing the fair value of the asset to its carrying value. In conjunction with the goodwill impairment test over the PeopleID reporting unit, long-lived assets associated with the reporting unit were analyzed for potential impairment. As a result, long-lived assets in the amount of $48,139 were impaired during the current period. Refer to Note 3, "Goodwill and Other Intangible Assets" for further information.
Property, Plant, and Equipment - Property, plant, and equipment are recorded at cost. The cost of buildings and improvements and machinery and equipment is being depreciated over their estimated useful lives using primarily the straight-line method for financial reporting purposes. The estimated useful lives range from 3 to 33 years as shown below.
Asset Category |
| Range of Useful Lives |
Buildings & Improvements |
| 10 to 33 Years |
Computer Systems |
| 5 Years |
Machinery & Equipment |
| 3 to 10 Years |
Fully depreciated assets are retained in property and accumulated depreciation accounts until disposal. Upon disposal, assets and related accumulated depreciation are removed from the accounts and the net amount, less proceeds from disposal, is charged or credited to operations. Leasehold improvements are depreciated over the shorter of the lease term or the estimated useful life of the respective asset. Depreciation expense was $26,727 , $22,976 , and $21,672 for the years ended July 31, 2014 , 2013 and 2012 , respectively.
Catalog Costs and Related Amortization - The Company accumulates all direct costs incurred, net of vendor cooperative advertising payments, in the development, production, and circulation of its catalogs on its balance sheet until such time as the related catalog is mailed. The catalog costs are subsequently amortized into selling, general, and administrative expense over the expected sales realization cycle, which is one year or less. Consequently, any difference between the estimated and actual revenue stream for a particular catalog and the related impact on amortization expense is realized within a period of one year or less. The estimate of the expected sales realization cycle for a particular catalog is based on the Company's historical sales experience with identical or similar catalogs, and an assessment of prevailing economic conditions and various competitive factors. The Company tracks subsequent sales realization, reassesses the marketplace, and compares its findings to the previous estimate, and adjusts the amortization of future catalogs, if necessary. At July 31, 2014 and 2013 , $13,959 and $11,255 , respectively, of prepaid catalog costs were included in prepaid expenses and other current assets.
Revenue Recognition - Revenue is recognized when it is both earned and realized or realizable. The Company's policy is to recognize revenue when title to the product and risk of loss have transferred to the customer, persuasive evidence of an arrangement exists, and collection of the sales proceeds is reasonably assured, all of which generally occur upon shipment of goods to customers. The majority of the Company's revenue relates to the sale of inventory to customers, and revenue is recognized
41
Table of Contents
when title and the risks and rewards of ownership pass to the customer. Given the nature of the Company's business and the applicable rules guiding revenue recognition, the Company's revenue recognition practices do not contain estimates that materially affect the results of operations, with the exception of estimated returns and credit memos. The Company provides for an allowance for estimated product returns and credit memos which is recognized as a deduction from sales at the time of the sale. As of July 31, 2014 and 2013 , the Company had a reserve for estimated product returns and credit memos of $3,161 and $2,711 , respectively.
Sales Incentives - The Company accounts for cash consideration (such as sales incentives and cash discounts) given to its customers or resellers as a reduction of revenue rather than an operating expense. Sales incentives for the years ended July 31, 2014 , 2013 , and 2012 were $36,175 , $28,000 , and $18,474 , respectively. The increase in sales incentives for the year ended July 31, 2014 as compared to the prior two years was due to twelve months of sales incentives related to Precision Dynamics Corporation ("PDC") compared to seven months in the prior year.
Shipping and Handling Fees and Costs - Amounts billed to a customer in a sale transaction related to shipping and handling fees are reported as net sales and the related costs incurred for shipping and handling are reported as cost of goods sold.
Advertising Costs - Advertising costs are expensed as incurred, except catalog and mailing costs as outlined above. Advertising expense for the years ended July 31, 2014 , 2013 , and 2012 was $82,561 , $77,905 , and $74,830 , respectively.
Stock-Based Compensation - The Company has an incentive stock plan under which the Board of Directors may grant nonqualified stock options to purchase shares of Class A Nonvoting Common Stock, restricted stock unit awards ("RSUs"), or restricted and unrestricted shares of Class A Nonvoting Common Stock to employees and non-employee directors. The options have an exercise price equal to the fair market value of the underlying stock at the date of grant and generally vest ratably over a three -year period, with one-third becoming exercisable one year after the grant date and one-third additional in each of the succeeding two years. Options issued under the plan, referred to herein as "service-based" options, generally expire 10 years from the date of grant. The Company also grants stock options to certain executives and key management employees that vest upon meeting certain financial performance conditions over the vesting schedule described above. These options are referred to herein as "performance-based" options. Performance-based stock options expire 10 years from the date of grant. The restricted shares and RSUs have an issuance price equal to the fair market value of the underlying stock at the date of grant.
In accordance with ASC 718 "Compensation - Stock Compensation," the Company measures and recognizes the compensation expense for all share-based awards made to employees and directors based on estimated grant-date fair values. The Black-Scholes option valuation model is used to determine the fair value of stock option awards on the date of grant. The Company recognizes the compensation cost of all share-based awards at the time it is deemed probable the award will vest. This cost is recognized on a straight-line basis over the vesting period of the award. If it is determined that it is not likely the award will vest, the expense recognized to date for the award is reversed in the period in which this is evident and the remaining expense is not recorded.
The Black-Scholes model requires the use of assumptions which determine the fair value of stock-based awards. The Company uses historical data regarding stock option exercise behaviors to estimate the expected term of options granted based on the period of time that options granted are expected to be outstanding. Expected volatilities are based on the historical volatility of the Company's stock. The expected dividend yield is based on the Company's historical dividend payments and historical yield. The risk-free interest rate is based on the U.S. Treasury yield curve in effect on the grant date for the length of time corresponding to the expected term of the option. The market value is calculated as the average of the high and the low stock price on the date of the grant.
The Company has estimated the fair value of its service-based and performance-based stock option awards granted during the years ended July 31, 2014 , 2013 , and 2012 using the Black-Scholes option valuation model. The weighted-average assumptions used in the Black-Scholes valuation model are reflected in the following table:
42
Table of Contents
|
| 2014 |
| 2013 |
| 2012 | ||||||||||||||||||
|
| Service-Based |
| Performance-Based |
| Service-Based |
| Performance-Based |
| Service-Based |
| Performance-Based | ||||||||||||
Black-Scholes Option Valuation Assumptions |
| Option Awards |
| Option Awards |
| Option Awards |
| Option Awards |
| Option Awards |
| Option Awards | ||||||||||||
Expected term (in years) |
| 5.97 | |
| - | |
| 5.93 | |
| - | |
| 5.89 | |
| 6.57 | | ||||||
Expected volatility |
| 37.32 | % |
| - | % |
| 38.67 | % |
| - | % |
| 39.41 | % |
| 39.21 | % | ||||||
Expected dividend yield |
| 2.35 | % |
| - | % |
| 2.21 | % |
| - | % |
| 2.07 | % |
| 1.99 | % | ||||||
Risk-free interest rate |
| 1.80 | % |
| - | % |
| 0.91 | % |
| - | % |
| 1.16 | % |
| 2.05 | % | ||||||
Weighted-average market value of underlying stock at grant date |
| $ | 30.98 | |
| $ | - | |
| $ | 30.58 | |
| $ | - | |
| $ | 27.05 | |
| $ | 29.55 | |
Weighted-average exercise price |
| $ | 30.98 | |
| $ | - | |
| $ | 30.58 | |
| $ | - | |
| $ | 27.05 | |
| $ | 29.55 | |
Weighted-average fair value of options granted during the period |
| $ | 9.17 | |
| $ | - | |
| $ | 9.05 | |
| $ | - | |
| $ | 8.42 | |
| $ | 10.01 | |
The Company includes as part of cash flows from financing activities the benefits of tax deductions in excess of the tax-effected compensation of the related stock-based awards for options exercised and restricted shares and RSUs vested during the period. See Note 8 "Stockholder's Investment" for more information regarding the Company's incentive stock plans.
Research and Development - Amounts expended for research and development are expensed as incurred.
Other Comprehensive Income - Other comprehensive income consists of foreign currency translation adjustments, net unrealized gains and losses from cash flow hedges and net investment hedges, and the unamortized gain on the post-retirement medical plans net of their related tax effects.
Foreign Currency Translation - Foreign currency assets and liabilities are translated into United States dollars at end of period rates of exchange, and income and expense accounts are translated at the weighted average rates of exchange for the period. Resulting translation adjustments are included in other comprehensive income.
Risk Management Activities - The Company is exposed to market risk, such as changes in interest rates and currency exchange rates. The Company does not hold or issue derivative financial instruments for trading purposes.
Income Taxes - The Company accounts for income taxes in accordance with ASC 740 "Income Taxes", which requires an asset and liability approach to financial accounting and reporting for income taxes. Deferred income tax assets and liabilities are computed for differences between the financial statement and tax basis of assets and liabilities that will result in taxable or deductible amounts in the future based on enacted tax laws and rates applicable to the periods in which the differences are expected to affect taxable income. Valuation allowances are established when necessary to reduce deferred tax assets to the amount expected to be realized. Income tax expense is the tax payable or refundable for the period plus or minus the change during the period in deferred tax assets and liabilities. The Company recognizes the effect of income tax positions only if sustaining those positions is more likely than not. Changes in recognition or measurement are reflected in the period in which a change in judgment occurs.
Foreign Currency Hedging - The objective of the Company's foreign currency exchange risk management is to minimize the impact of currency movements on non-functional currency transactions and minimize the foreign currency translation impact on the Company's foreign operations. While the Company's risk management objectives and strategies are driven from an economic perspective, the Company attempts, where possible and practical, to ensure that the hedging strategies it engages in qualify for hedge accounting and result in accounting treatment where the earnings effect of the hedging instrument provides substantial offset (in the same period) to the earnings effect of the hedged item. Generally, these risk management transactions will involve the use of foreign currency derivatives to protect against exposure resulting from transactions in a currency differing from the respective functional currency.
The Company recognizes derivative instruments as either assets or liabilities in the accompanying Consolidated Balance Sheets at fair value. Changes in the fair value (i.e., gains or losses) of the derivatives are recorded in the accompanying Consolidated Statements of Earnings as "Investment and other income", net, or as a component of Accumulated Other Comprehensive Income ("AOCI") in the accompanying Consolidated Balance Sheets and in the Consolidated Statements of Comprehensive Loss, as discussed below.
The Company utilizes forward foreign exchange currency contracts to reduce the exchange rate risk of specific foreign currency denominated transactions. These contracts typically require the exchange of a foreign currency for U.S. dollars at a fixed rate at a future date, with maturities of less than 18 months . These instruments may or may not qualify as hedges under the
43
Table of Contents
accounting guidance for derivative instruments and hedging activities based upon the intended objective of the contract. Hedge effectiveness is determined by how closely the changes in the fair value of the hedging instrument offset the changes in the fair value or cash flows of the hedged item. Hedge accounting is permitted only if the hedging relationship is expected to be highly effective at the inception of the hedge and on an on-going basis. Gains or losses on the derivative related to hedge ineffectiveness are recognized in current earnings. The amount of hedge ineffectiveness was not significant for the fiscal years ended July 31, 2014 , 2013 , and 2012 .
The Company has designated a portion of its foreign exchange contracts as cash flow hedges. For these instruments, the effective portion of the gain or loss on the derivative is reported as a component of AOCI and in the cash flow hedge section of the Consolidated Statements of Comprehensive Loss, and reclassified into earnings in the same period or periods during which the hedged transaction affects earnings.
The Company has designated a portion of its foreign exchange contracts as net investment hedges of the Company's net investments in foreign operations. The Company also utilizes Euro-denominated debt and British Pound-denominated intercompany loans designated as hedge instruments to hedge portions of the Company's net investments in Euro and British- Pound denominated foreign operations. For net investment hedges that meet the effectiveness requirements, the net gains or losses attributable to changes in spot exchange rates are recorded as cumulative translation within AOCI and are included in the net investment hedge section of the Consolidated Statements of Comprehensive Loss. Any ineffective portions are to be recognized in earnings. Recognition in earnings of amounts previously recorded in cumulative translation is limited to circumstances such as complete or substantially complete liquidation of the net investment in the hedged foreign operation.
The Company also enters into foreign exchange contracts to create economic hedges to manage foreign exchange risk exposure. The Company has not designated these derivative contracts as hedge transactions, and accordingly, the mark-to-market impact of these derivatives is recorded each period in current earnings.
See Note 14 "Derivatives and Hedging Activities" for more information regarding the Company's derivative instruments and hedging activities.
New Accounting Standards - In March 2013, the FASB issued ASU 2013-05, "Parent's Accounting for the Cumulative Translation Adjustment upon Derecognition of Certain Subsidiaries or Groups of Assets within a Foreign Entity or of an Investment in a Foreign Entity," which applies to the release of the cumulative translation adjustment into net earnings when a parent either sells a part or all of its investment in a foreign entity or no longer holds a controlling financial interest in a subsidiary or group of assets that is a business within a foreign entity. The guidance requires that a parent deconsolidate a subsidiary or derecognize a group of assets that is a business if the parent ceases to have a controlling financial interest in that group of assets, and resolves the diversity in practice for the treatment of business combinations achieved in stages involving a foreign entity. The guidance is effective for annual and interim reporting periods beginning after December 15, 2013, with early adoption permitted. The Company adopted this update in connection with the accounting for the sale of the Die-Cut business. It did not have a material impact on the Company's consolidated financial statements.
In July 2013, the FASB issued ASU 2013-11, "Presentation of an Unrecognized Tax Benefit When a Net Operating Loss Carryforward, a Similar Tax Loss, or a Tax Credit Carryforward Exists," which requires entities to present an unrecognized tax benefit as a reduction of a deferred tax asset for a net operating loss ("NOL") or tax credit carryforward whenever the NOL or tax credit carryforward would be available to reduce the additional taxable income or tax due if the tax position is disallowed. This accounting standard update requires entities to assess whether to net the unrecognized tax benefit with a deferred tax asset as of the reporting date. This guidance is effective for fiscal years beginning after December 15, 2013. The Company is not anticipating adoption of this update to have a material impact on the Company's consolidated financial statements.
In April 2014, the FASB issued ASU 2014-08, "Reporting Discontinued Operations and Disclosures of Disposals of Components of an Entity", which includes amendments that change the requirements for reporting discontinued operations and requires additional disclosures about discontinued operations. Under the new guidance, only disposals representing a strategic shift in operations should be presented as discontinued operations. Those strategic shifts should have a major effect on the organization's operations and financial results. Additionally, ASU 2014-08 requires expanded disclosures about discontinued operations that will provide financial statement users with more information about the assets, liabilities, income, expenses and cash flows of discontinued operations. The guidance is effective for fiscal and interim periods beginning after December 15, 2014. The adoption of this update is not expected to have a material impact on the financial statements of the Company.
In May 2014, the FASB issued ASU 2014-09, "Revenue from Contracts with Customers ", which eliminates the transaction-and industry-specific revenue recognition guidance under current GAAP and replaces it with a principle-based approach for determining revenue recognition. The accounting standard update requires revenue recognition when control of the goods or
44
Table of Contents
services transfers to the customer, replacing the existing guidance which requires revenue recognition when the risks and rewards transfer to the customer. Under the new guidance, companies should recognize revenues in amounts that reflect the payment to which a company expects to be entitled in exchange for those goods or services. The guidance is effective for fiscal and interim periods beginning after December 15, 2016. The Company is currently evaluating the impact of this update on its consolidated financial statements.
2. Acquisitions
The Company did not complete any business acquisitions during the fiscal year ended July 31, 2014, had one business acquisition during the fiscal year ended July 31, 2013, and completed three business acquisitions during the fiscal year ended July 31, 2012. All of these transactions were accounted for using business combination accounting; therefore, the results of the acquired operations are included in the accompanying consolidated financial statements only since their acquisition dates.
Fiscal 2013
On December 28, 2012, the Company acquired all of the outstanding shares of Precision Dynamics Corporation ("PDC"), a manufacturer of identification products primarily for the healthcare sector headquartered in Valencia, California. PDC is reported within the Company's ID Solutions segment. Financing for this acquisition consisted of $220,000 from the Company's revolving loan agreement and the balance from cash on hand. As of July 31, 2014, the Company has repaid the entire amount of the borrowing, of which $ 39,000 was repaid in fiscal 2014.
The Company acquired PDC to establish itself in the healthcare sector, consistent with the Company's mission to identify and protect premises, products and people. PDC's large customer base, strong channels to market, and broad product offering provide a foundation for future growth.
The following table details the final allocation of the PDC purchase price:
Fair values: |
| |||
| Cash and cash equivalents | $ | 12,904 | |
| Accounts receivable - net | 21,178 | | |
| Total inventories | 16,788 | | |
| Prepaid expenses and other current assets | 4,233 | | |
| Goodwill | 168,150 | | |
| Other intangible assets | 109,300 | | |
| Other assets | 483 | | |
| Property, plant and equipment | 18,015 | | |
| Accounts payable | (10,060 | ) | |
| Wages and amounts withheld from employees | (4,234 | ) | |
| Taxes, other than income taxes | (600 | ) | |
| Accrued income taxes | (57 | ) | |
| Other current liabilities | (5,181 | ) | |
| Other long-term liabilities | (16,858 | ) | |
|
| 314,061 | | |
| Less: cash acquired | (12,904 | ) | |
Fair value of total consideration | $ | 301,157 | | |
The final valuation was completed upon the conclusion of various state and local tax filing determinations in the second quarter of fiscal 2014. The other intangible assets consist of customer relationships of $102,500 , which are being amortized over a life of 10 years , and a definite-lived trademark of $6,800 , which is being amortized over a life of 3 years . Of the total $168,150 in acquired goodwill, $57,374 is tax deductible and $51,672 of the total $109,300 in other intangible assets is tax deductible.
45
Table of Contents
The following table reflects the unaudited pro-forma operating results of the Company for fiscal years 2013 and 2012 which give effect to the acquisition of PDC as if it had occurred at the beginning of fiscal 2012, after giving effect to certain adjustments, including amortization of intangible assets, interest expense on acquisition debt, and income tax effects. The pro-forma results have been prepared for comparative purposes only and are not necessarily indicative of the results of operations which may occur in the future or that would have occurred had the acquisitions been effected on the date indicated, nor are they necessarily indicative of the Company's future results of operations.
|
| 2013 |
| 2012 | ||||
Net sales, as reported |
| $ | 1,157,792 | |
| $ | 1,071,504 | |
Net sales, pro forma |
| 1,226,217 | |
| 1,241,372 | | ||
(Loss) earnings from continuing operations, as reported |
| (138,257 | ) |
| 103,493 | | ||
(Loss) earnings from continuing operations, pro forma |
| (133,957 | ) |
| 104,014 | | ||
Basic (loss) earnings from continuing operations per Class A Common Share, as reported |
| (2.70 | ) |
| 1.97 | | ||
Basic (loss) earnings from continuing operations per Class A Common Share, pro forma |
| (2.61 | ) |
| 1.98 | | ||
Diluted (loss) earnings from continuing operations per Class A Common Share, as reported |
| (2.70 | ) |
| 1.95 | | ||
Diluted (loss) earnings from continuing operations per Class A Common Share, pro forma |
| (2.61 | ) |
| 1.96 | | ||
Pro forma results for fiscal 2013, were adjusted to exclude $3,600 of acquisition-related expenses and $1,530 of nonrecurring expense related to the fair value adjustment to acquisition-date inventory, and were adjusted to include $529 in interest expense on acquisition debt and $429 in income tax benefit.
Pro forma results for fiscal 2012, were adjusted to include $3,600 of acquisition-related expenses, $1,530 of nonrecurring expense related to the fair value adjustment to acquisition-date inventory, $1,402 in interest expense on acquisition debt, and $2,526 in income tax expense.
Pro forma results for fiscal years 2013 and 2012 include $5,215 and $12,517 of pre-tax amortization expense related to intangible assets, respectively.
Fiscal 2012
In March 2012, the Company acquired Grafo Wiremarkers Africa (Proprietary) Limited ("Grafo"), based in Johannesburg, South Africa for $3,039 . Grafo offers a comprehensive range of wire identification products and is the sole distributor in Africa of locally developed Dartag ® ABS cablemarkers, and stainless steel ties and tags. Grafo has annual sales of approximately $3,000 and is included in the Company's IDS segment. The purchase price allocation resulted in $1,227 assigned to goodwill and $961 assigned to customer relationships. The amount assigned to the customer relationships is being amortized over seven years . The acquisition provided a base in South Africa for the Company to further expand its business with the established distributors and customers throughout South Africa and the Southern African Development Community (SADC) countries.
In May 2012, the Company acquired Runelandhs Försäljnings AB ("Runelandhs"), based in Kalmar, Sweden for $22,499 , net of cash received. Runelandhs is a direct marketer of industrial and office equipment with annual sales of approximately $19,000 . Its products include lifting, transporting, and warehouse equipment; workbenches and material handling supplies; products for environmental protection; and entrance, reception, and office furnishings. Runelandhs is included in the Company's WPS segment. The final purchase price allocation resulted in $13,177 assigned to goodwill, $5,340 assigned to the tradename, $5,474 assigned to customer relationships, and $95 assigned to non-compete agreements. The amount assigned to the trademark has an indefinite life. The amounts assigned to the customer relationships and non-compete agreements are being amortized over seven and five years, respectively. The acquisition expanded the Company's direct marketing presence in Scandinavia.
In May 2012, the Company acquired Pervaco AS ("Pervaco"), based in Kjeller, Norway for $12,111 , net of cash received. Pervaco is a direct marketer of facility identification products with annual sales of approximately $6,000 . Pervaco is included in the Company's WPS segment. The purchase price allocation resulted in $8,440 assigned to goodwill, $1,538 assigned to the tradename, $2,468 assigned to customer relationships, and $91 assigned to non-compete agreements. The amount assigned to the tradename has an indefinite life. The amounts assigned to the customer relationships and non-compete agreements are being amortized over five and three years, respectively. This acquisition also expanded the Company's direct marketing presence in Scandinavia.
46
Table of Contents
The following table summarizes the combined estimated fair values of the assets acquired and liabilities assumed at the date of the acquisition:
Current assets net of cash | $ | 5,082 | |
Property, plant & equipment | 2,743 | | |
Goodwill | 22,844 | | |
Customer relationships | 8,903 | | |
Tradenames | 6,878 | | |
Non-compete agreements | 186 | | |
|
| ||
Total assets acquired net of cash | $ | 46,636 | |
Liabilities assumed | 7,555 | | |
Debt assumed | 1,432 | | |
|
| ||
Net assets acquired | $ | 37,649 | |
|
| ||
The results of the operations of the acquired business have been included since the date of acquisition in the accompanying consolidated financial statements. Pro forma information related to the acquisitions during the twelve months ended July 31, 2012, is not included because the impact on the Company's consolidated results of operations is considered to be immaterial.
3. Goodwill and Other Intangible Assets
Changes in the carrying amount of goodwill by reportable segment for the years ended July 31, 2014 and 2013 , were as follows:
| IDS |
| WPS |
| Die-Cut |
| Total | ||||||||
Balance as of July 31, 2012 | $ | 367,893 | |
| $ | 276,941 | |
| $ | 31,957 | |
| $ | 676,791 | |
Current year acquisitions | 170,180 | |
| - | |
| - | |
| 170,180 | | ||||
Current year divestitures | (2,882 | ) |
| - | |
| - | |
| (2,882 | ) | ||||
Reclassification to assets held for sale | (4,129 | ) |
| - | |
| (33,218 | ) |
| (37,347 | ) | ||||
Impairment charge | (18,225 | ) |
| (172,280 | ) |
| - | |
| (190,505 | ) | ||||
Translation adjustments | 4,192 | |
| (4,454 | ) |
| 1,261 | |
| 999 | | ||||
Balance as of July 31, 2013 | $ | 517,029 | |
| $ | 100,207 | |
| $ | - | |
| $ | 617,236 | |
Impairment charge | (100,412 | ) |
| - | |
| - | |
| (100,412 | ) | ||||
Purchase accounting adjustments | (2,168 | ) |
| - | |
| - | |
| (2,168 | ) | ||||
Translation adjustments | (2,160 | ) |
| 2,508 | |
| - | |
| 348 | | ||||
Balance as of July 31, 2014 | $ | 412,289 | |
| $ | 102,715 | |
| $ | - | |
| $ | 515,004 | |
Goodwill decreased by $ 102,232 during fiscal 2014. The decline in the balance consisted of an impairment charge of $100,412 recognized on the Company's PeopleID reporting unit, and purchase accounting adjustments of $2,168 for the deferred tax impact primarily related to the release of escrow from the fiscal 2013 acquisition of Precision Dynamics Corporation ("PDC"). These decreases were partially offset by the positive effects of foreign translation of $348 .
Goodwill at July 31, 2014 included $118,637 and $172,280 of accumulated impairment losses within the IDS and WPS segments, respectively, for a total of $290,917 . Goodwill at July 31, 2013 included $18,225 and $172,280 of accumulated impairment losses within the IDS and WPS segments, respectively, for a total of $190,505 .
The annual impairment testing performed on May 1, 2014, in accordance with ASC 350, "Intangibles - Goodwill and Other" ("Step One") indicated that each of the following reporting units had a fair value substantially in excess of its carrying value: IDS Americas & Europe, IDS APAC, WPS Americas, WPS Europe, and WPS APAC. The results of the Step One analysis completed over the Company's People ID reporting unit indicated that it was potentially impaired.
47
Table of Contents
PeopleID Goodwill Impairment
The PeopleID reporting unit consists primarily of the Company's acquisition of PDC from fiscal 2013, as well as the existing Brady PeopleID business. Organic sales within the PDC business declined in the low single digit percentages from fiscal 2013 to fiscal 2014. Hospital admission rates are the primary driver of PDC's sales under its existing strategy, and there was a decline of approximately 2% in these rates during fiscal 2014. Management has revisited its planned growth and profit for the PDC business and concluded that the growth may not materialize as expected given slower than anticipated industry growth and fewer sales synergies than originally planned.
Management believes that strategy modifications will improve organic sales and profit within the PeopleID business in future years, but there is inherent risk in the revised strategy and the changing healthcare industry. As such, the Company's annual goodwill impairment analysis ("Step One") reflected the risk in the strategy and the decline in fiscal 2014 sales and profitability, which occurred during a period of time in which hospital admission rates were declining. In addition, the PDC business fell short of internal forecasts, resulting in the conclusion that the PeopleID reporting unit failed Step One as the resulting fair value was less than the carrying value of the reporting unit.
The Company proceeded to measure the amount of the potential impairment ("Step Two") with the assistance of a third party valuation firm utilizing a discounted cash flow model and market multiples approach. In Step Two of the goodwill impairment test, the Company determined the implied fair value of the goodwill and compared it to the carrying value. The Company allocated the fair value of the PeopleID reporting unit to its assets and liabilities as if the reporting unit had been acquired in a business combination. The excess fair value of the reporting unit over the fair value of its identifiable assets and liabilities was the implied fair value of goodwill. Upon completion of the assessment, the Company recognized a goodwill impairment charge of $100,412 during fiscal 2014.
Other Intangible Assets
Other intangible assets include patents, tradenames, customer relationships, non-compete agreements and other intangible assets with finite lives being amortized in accordance with the accounting guidance for other intangible assets. The net book value of these assets was as follows:
| July 31, 2014 |
| July 31, 2013 | ||||||||||||||||||||||||
| Weighted Average Amortization Period (Years) |
| Gross Carrying Amount |
| Accumulated Amortization |
| Net Book Value |
| Weighted Average Amortization Period (Years) |
| Gross Carrying Amount |
| Accumulated Amortization |
| Net Book Value | ||||||||||||
Amortized other intangible assets: |
|
|
|
|
|
|
|
|
|
|
|
|
|
|
| ||||||||||||
Patents | 5 |
| $ | 11,656 | |
| $ | (10,160 | ) |
| $ | 1,496 | |
| 5 |
| $ | 11,053 | |
| $ | (9,597 | ) |
| $ | 1,456 | |
Tradenames and other | 5 |
| 15,366 | |
| (10,706 | ) |
| 4,660 | |
| 5 |
| 15,289 | |
| (8,398 | ) |
| 6,891 | | ||||||
Customer relationships | 7 |
| 168,525 | |
| (114,363 | ) |
| 54,162 | |
| 8 |
| 261,076 | |
| (144,620 | ) |
| 116,456 | | ||||||
Non-compete agreements and other | 4 |
| 10,089 | |
| (9,622 | ) |
| 467 | |
| 4 |
| 14,942 | |
| (14,215 | ) |
| 727 | | ||||||
Unamortized other intangible assets: |
|
|
|
|
|
|
|
|
|
|
|
|
|
|
| ||||||||||||
Tradenames | N/A |
| 30,229 | |
| - | |
| 30,229 | |
| N/A |
| 31,321 | |
| - | |
| 31,321 | | ||||||
Total |
|
| $ | 235,865 | |
| $ | (144,851 | ) |
| $ | 91,014 | |
|
|
| $ | 333,681 | |
| $ | (176,830 | ) |
| $ | 156,851 | |
The value of goodwill and other intangible assets in the consolidated balance sheets at July 31, 2014 and 2013, differs from the value assigned to them in the original allocation of purchase due to the effect of fluctuations in foreign exchange rates. In conjunction with the goodwill impairment test of the PeopleID reporting unit, finite and indefinite-lived other intangible assets associated with the reporting unit were written down to fair value. As a result, the Company recognized an impairment charge of $48,139 during fiscal 2014.
Amortization expense on intangible assets during fiscal 2014 , 2013 , and 2012 was $ 17,871 , $ 17,148 and $ 10,576 , respectively. The amortization over each of the next five fiscal years is projected to be $ 12,474 , $ 10,267 , $ 7,747 , $ 6,850 and $ 6,305 for the fiscal years ending July 31, 2015 , 2016 , 2017 , 2018 and 2019 , respectively.
48
Table of Contents
4. Other Comprehensive Income
Other comprehensive income consists of foreign currency translation adjustments, net unrealized gains and losses from cash flow hedges and net investment hedges, and the unamortized gain on the post-retirement medical plans net of their related tax effects.
The following table illustrates the changes in the balances of each component of accumulated other comprehensive income for the periods presented. The unrealized gain (loss) on cash flow hedges and the unrecognized gain on the postretirement medical plan are presented net of tax:
| Unrealized gain (loss) on cash flow hedges |
| Gain on postretirement medical plan |
| Foreign currency translation adjustments |
| Accumulated other comprehensive income | ||||||||
Ending balance, July 31, 2012 | $ | 876 | |
| $ | 978 | |
| $ | 57,557 | |
| $ | 59,411 | |
Other comprehensive (loss) income before reclassification | (425 | ) |
| 1,103 | |
| (3,446 | ) |
| (2,768 | ) | ||||
Amounts reclassified from accumulated other comprehensive income | (352 | ) |
| (228 | ) |
| - | |
| (580 | ) | ||||
Ending balance, July 31, 2013 | $ | 99 | |
| $ | 1,853 | |
| $ | 54,111 | |
| $ | 56,063 | |
Other comprehensive (loss) income before reclassification | (21 | ) |
| 3,313 | |
| 1,334 | |
| 4,626 | | ||||
Amounts reclassified from accumulated other comprehensive income | (90 | ) |
| (312 | ) |
| 3,869 | |
| 3,467 | | ||||
Ending balance, July 31, 2014 | $ | (12 | ) |
| $ | 4,854 | |
| $ | 59,314 | |
| $ | 64,156 | |
The increase in accumulated other comprehensive income ("AOCI") as of July 31, 2014 compared to July 31, 2013 was primarily due to the accumulated foreign currency translation loss in Korea and Thailand, which was reclassified into earnings upon the completion of the first phase of the Die-Cut divestiture during the year ended July 31, 2014. The increase in AOCI is also attributable to a $ 4,691 actuarial gain on the U.S. post-retirement medical plan valuation for the year ended July 31, 2014. The depreciation of the U.S. dollar against other currencies also contributed to the increase in AOCI from the prior year. The foreign currency translation adjustments line in the table above includes the impact of foreign currency translation, foreign currency translation on intercompany notes, and the settlements of net investment hedges, net of tax. Of the total $3,467 in amounts reclassified from AOCI, the $ 3,869 loss on foreign currency translation adjustments was reclassified to the loss on the sale of the Die-Cut divestiture, the $90 gain on cash flow hedges was reclassified into cost of products sold, and the $312 net gain on postretirement plans was split with $443 of gains reclassified into SG&A and a $131 loss reclassified to the loss on the sale of the Die-Cut divestiture.
|
| 2014 |
| 2013 |
| 2012 | ||||||
Income tax (expense) benefit related to items of other comprehensive (loss) income: |
|
|
|
|
|
| ||||||
Net investment hedge translation adjustments |
| $ | 302 | |
| $ | 2,877 | |
| $ | (7,784 | ) |
Long-term intercompany loan settlements |
| 579 | |
| (650 | ) |
| (2,508 | ) | |||
Cash flow hedges |
| 28 | |
| 454 | |
| (855 | ) | |||
Pension and other post-retirement benefits |
| (1,898 | ) |
| (555 | ) |
| 583 | | |||
Other income tax adjustments |
| (58 | ) |
| 108 | |
| (898 | ) | |||
Income tax (expense) benefit related to items of other comprehensive (loss) income |
| $ | (1,047 | ) |
| $ | 2,234 | |
| $ | (11,462 | ) |
5. Employee Benefit Plans
The Company provides postretirement medical benefits (the "Plan") for eligible regular full and part-time domestic employees (including spouses) as outlined by the Plan. Postretirement benefits are provided only if the employee was hired prior to April 1, 2008, and retires on or after attainment of age 55 with 15 years of credited service. Credited service begins accruing at the later of age 40 or date of hire. All active employees first eligible to retire after July 31, 1992, are covered by an unfunded, contributory postretirement healthcare plan where employer contributions will not exceed a defined dollar benefit amount, regardless of the cost of the program. Employer contributions to the plan are based on the employee's age and service at retirement.
The accounting guidance on defined benefit pension and other postretirement plans requires full recognition of the funded status of defined benefit and other postretirement plans on the balance sheet as an asset or a liability. The guidance also requires
49
Table of Contents
that unrecognized prior service costs/credits, gains/losses, and transition obligations/assets be recorded in AOCI, thus not changing the income statement recognition rules for such plans.
The Plan is unfunded and recorded as a liability in the accompanying consolidated balance sheets as of July 31, 2014 and 2013 . The following table provides a reconciliation of the changes in the Plan's accumulated benefit obligation during the years ended July 31:
|
| 2014 |
| 2013 | ||||
Obligation at beginning of year |
| $ | 13,023 | |
| $ | 14,225 | |
Service cost |
| 674 | |
| 770 | | ||
Interest cost |
| 534 | |
| 476 | | ||
Actuarial (gain)/loss |
| (4,691 | ) |
| (1,745 | ) | ||
Benefit payments |
| (473 | ) |
| (703 | ) | ||
Plan amendments |
| (1,011 | ) |
| - | | ||
Obligation at end of fiscal year |
| $ | 8,056 | |
| $ | 13,023 | |
Estimated savings of $3,408 were included as an actuarial gain due to decreases in expected participation rate assumptions used in the actuarial valuation. The change in participation assumptions was primarily caused by the impact of the Health Care and Education Reconciliation Act of 2010 and Patient Protection and Affordable Care Act and significantly increased premium costs passed on to participants as a result of plan amendments made in recent prior years. It is anticipated that due to the availability of subsidized health insurance exchanges, which began operating January 1, 2014, the majority of future eligible retirees will now have access to more affordable plans and will not elect coverage under the current Company-sponsored plan.
In fiscal 2014, the Company amended the Plan effective January 1, 2015 to eliminate future increases in target contribution levels to eligible plan participants. This amendment resulted in a decrease in the accumulated benefit obligation of $1,011 .
As of July 31, 2014 and 2013 , amounts recognized as liabilities in the accompanying consolidated balance sheets consist of:
|
| 2014 |
| 2013 | ||||
Current liability |
| $ | 476 | |
| $ | 677 | |
Non-current liability |
| 7,580 | |
| 12,346 | | ||
|
| $ | 8,056 | |
| $ | 13,023 | |
As of July 31, 2014 and 2013 , pre-tax amounts recognized in accumulated other comprehensive income in the accompanying consolidated balance sheets consist of:
|
| 2014 |
| 2013 | ||||
Net actuarial gain |
| $ | 7,960 | |
| $ | 3,534 | |
Prior service credit |
| 2,011 | |
| 1,203 | | ||
|
| $ | 9,971 | |
| $ | 4,737 | |
Net periodic benefit cost for the Plan for fiscal years 2014 , 2013 , and 2012 includes the following components:
|
| Years Ended July 31, | ||||||||||
|
| 2014 |
| 2013 |
| 2012 | ||||||
Net periodic postretirement benefit cost included the following components: |
|
|
|
|
|
| ||||||
Service cost - benefits attributed to service during the period |
| $ | 674 | |
| $ | 770 | |
| $ | 644 | |
Prior service credit |
| (203 | ) |
| (203 | ) |
| (203 | ) | |||
Interest cost on accumulated postretirement benefit obligation |
| 534 | |
| 476 | |
| 633 | | |||
Amortization of unrecognized gain |
| (265 | ) |
| (47 | ) |
| (189 | ) | |||
Periodic postretirement benefit cost |
| $ | 740 | |
| $ | 996 | |
| $ | 885 | |
The estimated actuarial gain and prior service credit that will be amortized from accumulated other comprehensive income into net periodic postretirement benefit cost over the next fiscal year are $869 and $325 , respectively.
50
Table of Contents
The following assumptions were used in accounting for the Plan:
|
| 2014 |
| 2013 |
| 2012 | |||
Weighted average discount rate used in determining accumulated postretirement benefit obligation liability |
| 3.50 | % |
| 4.00 | % |
| 3.25 | % |
Weighted average discount rate used in determining net periodic benefit cost |
| 4.00 | % |
| 3.25 | % |
| 4.50 | % |
Assumed health care trend rate used to measure APBO at July 31 |
| 7.50 | % |
| 8.00 | % |
| 8.00 | % |
Rate to which cost trend rate is assumed to decline (the ultimate trend rate) |
| 5.50 | % |
| 5.50 | % |
| 5.50 | % |
Fiscal year the ultimate trend rate is reached |
| 2018 | |
| 2018 | |
| 2016 | |
The discount rate utilized in preparing the accumulated postretirement benefit obligation liability was decreased to 3.50% in fiscal 2014 from 4.00% in fiscal 2013 as a result of a decrease in the bond yield as of the Company's measurement date of July 31, 2014 .
A one-percentage point change in assumed health care cost trend rates would have the following effects on the Plan:
| | One-Percentage Point Increase | | One-Percentage Point Decrease | ||||
Effect on future service and interest cost | | $ | 14 | | | $ | (14 | ) |
Effect on accumulated postretirement benefit obligation at July 31, 2014 | | 26 | | | (28 | ) | ||
The following benefit payments, which reflect expected future service, as appropriate, are expected to be paid during the years ending July 31:
|
| ||
2015 | $ | 476 | |
2016 | 524 | | |
2017 | 596 | | |
2018 | 654 | | |
2019 | 714 | | |
2020 through 2024 | 4,137 | | |
The Company sponsors defined benefit pension plans that are primarily unfunded and provide an income benefit upon termination or retirement for certain of its international employees. As of July 31, 2014 and 2013 , the accumulated pension obligation related to these plans was $4,553 and $3,977 , respectively. As of July 31, 2014 and 2013 , pre-tax amounts recognized in accumulated other comprehensive income in the accompanying balance sheets were gains of $1,228 and $807 , respectively. The net periodic benefit cost for these plans was $286 , $388 , and $299 during the years ended July 31, 2014 , 2013 and 2012 , respectively.
The Company has retirement and profit-sharing plans covering substantially all full-time domestic employees and certain employees of its foreign subsidiaries. Contributions to the plans are determined annually or quarterly, according to the respective plans, based on earnings of the respective companies and employee contributions. Accrued retirement and profit-sharing contributions of $2,938 and $3,615 were included in other current liabilities on the accompanying consolidated balance sheets as of July 31, 2014 and 2013 , respectively. The amounts charged to expense for these retirement and profit sharing plans were $10,830 , $10,110 , and $12,569 during the years ended July 31, 2014 , 2013 and 2012 , respectively.
The Company also has deferred compensation plans for directors, officers and key executives which are discussed below. At July 31, 2014 and 2013 , $18,694 and $15,769 , respectively, of deferred compensation was included in other long-term liabilities in the accompanying consolidated balance sheets.
During fiscal 1998, the Company adopted a new deferred compensation plan that invests solely in shares of the Company's Class A Nonvoting Common Stock. Participants in a predecessor phantom stock plan were allowed to convert their balances in the old plan to this new plan. The new plan was funded initially by the issuance of shares of Class A Nonvoting Common Stock to a Rabbi Trust. All deferrals into the new plan result in purchases of Class A Nonvoting Common Stock by the Rabbi Trust. No deferrals are allowed into a predecessor plan. Shares held by the Rabbi Trust are distributed to participants upon separation from the Company as defined in the plan agreement.
During fiscal 2002, the Company adopted a new deferred compensation plan for executives and non-employee directors that allows future contributions to be invested in shares of the Company's Class A Nonvoting Common Stock or in certain other
51
Table of Contents
investment vehicles. Prior deferred compensation deferrals must remain in the Company's Class A Nonvoting Common Stock. All participant deferrals into the new plan result in purchases of Class A Nonvoting Common Stock or certain other investment vehicles by the Rabbi Trust. Balances held by the Rabbi Trust are distributed to participants upon separation from the Company as defined in the plan agreement. On May 1, 2006, the plan was amended to require that deferrals into the Company's Class A Nonvoting Common Stock must remain in the Company's Class A Nonvoting Common Stock and be distributed in shares of the Company's Class A Nonvoting Common Stock. On May 21, 2014, the Director Deferred Compensation Plan was amended to allow participants to transfer funds from other investment funds into the Company's Class A Nonvoting Common Stock. Funds are not permitted to be transferred from the Company's Class A Nonvoting Common Stock into other investment funds until six months after the Director resigns from the Board. No such amendment was made to the Executive Deferred Compensation Plan.
6. Income Taxes
(Loss) earnings from continuing operations consists of the following:
|
| Years Ended July 31, | ||||||||||
|
| 2014 |
| 2013 |
| 2012 | ||||||
United States |
| $ | (134,596 | ) |
| $ | (144,941 | ) |
| $ | 44,713 | |
Other Nations |
| 81,487 | |
| 49,267 | |
| 95,942 | | |||
Total |
| $ | (53,109 | ) |
| $ | (95,674 | ) |
| $ | 140,655 | |
Income tax (benefit) expense from continuing operations consists of the following:
|
| Years Ended July 31, | ||||||||||
|
| 2014 |
| 2013 |
| 2012 | ||||||
Current income tax expense: |
|
|
|
|
|
| ||||||
United States |
| $ | (1,137 | ) |
| $ | 64 | |
| $ | 9,606 | |
Other Nations |
| 19,513 | |
| 19,795 | |
| 34,948 | | |||
States (U.S.) |
| 1,090 | |
| 1,094 | |
| 2,287 | | |||
|
| $ | 19,466 | |
| $ | 20,953 | |
| $ | 46,841 | |
Deferred income tax (benefit) expense: |
|
|
|
|
|
| ||||||
United States |
| $ | (22,754 | ) |
| $ | 22,882 | |
| $ | (1,480 | ) |
Other Nations |
| (1,803 | ) |
| (806 | ) |
| (7,325 | ) | |||
States (U.S.) |
| 128 | |
| (446 | ) |
| (874 | ) | |||
|
| $ | (24,429 | ) |
| $ | 21,630 | |
| $ | (9,679 | ) |
Total |
| $ | (4,963 | ) |
| $ | 42,583 | |
| $ | 37,162 | |
Deferred income taxes result from temporary differences in the recognition of revenues and expenses for financial statement and income tax purposes.
52
Table of Contents
The approximate tax effects of temporary differences are as follows:
|
| July 31, 2014 | ||||||||||
|
| Assets |
| Liabilities |
| Total | ||||||
Inventories |
| $ | 5,460 | |
| $ | (126 | ) |
| $ | 5,334 | |
Prepaid catalog costs |
| 30 | |
| (3,180 | ) |
| (3,150 | ) | |||
Employee benefits |
| 1,533 | |
| (27 | ) |
| 1,506 | | |||
Accounts receivable |
| 852 | |
| (9 | ) |
| 843 | | |||
Other, net |
| 8,700 | |
| (1,015 | ) |
| 7,685 | | |||
Current |
| $ | 16,575 | |
| $ | (4,357 | ) |
| $ | 12,218 | |
Fixed Assets |
| 2,431 | |
| (4,587 | ) |
| (2,156 | ) | |||
Intangible Assets |
| 1,706 | |
| (27,381 | ) |
| (25,675 | ) | |||
Capitalized R&D expenditures |
| 1,425 | |
| - | |
| 1,425 | | |||
Deferred compensation |
| 21,733 | |
| - | |
| 21,733 | | |||
Postretirement benefits |
| 5,002 | |
| (4 | ) |
| 4,998 | | |||
Tax credit carry-forwards and net operating losses |
| 58,870 | |
| - | |
| 58,870 | | |||
Less valuation allowance |
| (37,409 | ) |
| - | |
| (37,409 | ) | |||
Other, net |
| 1,411 | |
| (6,499 | ) |
| (5,088 | ) | |||
Non-current |
| $ | 55,169 | |
| $ | (38,471 | ) |
| $ | 16,698 | |
Total |
| $ | 71,744 | |
| $ | (42,828 | ) |
| $ | 28,916 | |
|
| July 31, 2013 | ||||||||||
|
| Assets |
| Liabilities |
| Total | ||||||
Inventories |
| $ | 5,880 | |
| $ | (280 | ) |
| $ | 5,600 | |
Prepaid catalog costs |
| 9 | |
| (2,407 | ) |
| (2,398 | ) | |||
Employee benefits |
| 1,973 | |
| (5 | ) |
| 1,968 | | |||
Accounts receivable |
| 1,292 | |
| (63 | ) |
| 1,229 | | |||
Other, net |
| 9,721 | |
| (4,684 | ) |
| 5,037 | | |||
Current |
| $ | 18,875 | |
| $ | (7,439 | ) |
| $ | 11,436 | |
Fixed Assets |
| 2,717 | |
| (4,811 | ) |
| (2,094 | ) | |||
Intangible Assets |
| 1,705 | |
| (54,008 | ) |
| (52,303 | ) | |||
Capitalized R&D expenditures |
| 1,755 | |
| - | |
| 1,755 | | |||
Deferred compensation |
| 24,565 | |
| - | |
| 24,565 | | |||
Postretirement benefits |
| 7,220 | |
| - | |
| 7,220 | | |||
Tax credit carry-forwards and net operating losses |
| 62,199 | |
| (125 | ) |
| 62,074 | | |||
Less valuation allowance |
| (37,142 | ) |
| - | |
| (37,142 | ) | |||
Other, net |
| 109 | |
| (8,952 | ) |
| (8,843 | ) | |||
Non-current |
| $ | 63,128 | |
| $ | (67,896 | ) |
| $ | (4,768 | ) |
Total |
| $ | 82,003 | |
| $ | (75,335 | ) |
| $ | 6,668 | |
Tax loss carry-forwards at July 31, 2014 are comprised of:
• | Foreign net operating loss carry-forwards of $114,219 , of which $88,297 have no expiration date and the remainder of which expire within the next five to eight years . |
• | State net operating loss carry-forwards of $59,349 , which expire from 2015 to 2033 . |
• | Foreign tax credit carry-forwards of $14,812 , which expire from 2018 to 2024 . |
• | State research and development credit carry-forwards of $10,731 , which expire from 2015 to 2029 . |
The valuation allowance increased by $267 during the fiscal year ended July 31, 2014 mainly due to increased valuation allowances against state tax credit carry-forwards and increased valuation allowances in certain jurisdictions, including Brazil, Shenzhen, and Langfang. These increases were primarily offset by reductions in the tax rates applied to valuation allowances in Sweden and the United Kingdom. The valuation allowance increased by $11,295 during the fiscal year ended July 31, 2013 mainly due to additional valuation allowances for Wuxi, Shenzhen, and Brazil. If realized or reversed in future periods, substantially all of the valuation allowance would impact the income tax rate.
53
Table of Contents
Rate Reconciliation
A reconciliation of the tax computed by applying the statutory U.S. federal income tax rate to earnings (loss) from continuing operations before income taxes to the total income tax expense is as follows:
|
| Years Ended July 31, | |||||||
|
| 2014 |
| 2013 |
| 2012 | |||
Tax at statutory rate |
| 35.0 | % |
| 35.0 | % |
| 35.0 | % |
Goodwill impairment (1) |
| (40.3 | )% |
| (53.4 | )% |
| - | % |
State income taxes, net of federal tax benefit (2) |
| (1.1 | )% |
| (0.2 | )% |
| 0.1 | % |
International rate differential |
| (1.3 | )% |
| (4.6 | )% |
| (6.6 | )% |
Non-creditable withholding taxes |
| - | % |
| (1.5 | )% |
| 2.3 | % |
Rate variances arising from foreign subsidiary distributions |
| (7.5 | )% |
| (25.3 | )% |
| (6.5 | )% |
Adjustments to tax accruals and reserves (3) |
| 25.5 | % |
| 1.0 | % |
| 7.5 | % |
Research and development tax credits and section 199 manufacturer's deduction |
| 3.6 | % |
| 3.1 | % |
| (1.0 | )% |
Non-deductible divestiture fees and account write-offs |
| (5.2 | )% |
| - | % |
| - | % |
Deferred tax and other adjustments |
| 0.7 | % |
| 2.4 | % |
| (3.4 | )% |
Other, net |
| (0.1 | )% |
| (1.0 | )% |
| (1.0 | )% |
Effective tax rate |
| 9.3 | % |
| (44.5 | )% |
| 26.4 | % |
(1) | $61.1 million of the total goodwill impairment of $100.4 million recorded during the year ended July 31, 2014 is nondeductible for income tax purposes. $168.9 million of the total goodwill impairment of $190.5 million recorded during the year ended July 31, 2013 is nondeductible for income tax purposes. |
(2) | Includes a $3.1 million increase in valuation allowances against certain state tax credit carry-forwards during the year ended July 31, 2014. |
(3) | Includes the reduction of uncertain tax positions resulting from the settlement of certain domestic and foreign income tax audits during the year ended July 31, 2014. |
In fiscal 2013 and 2012, the Company was eligible for tax holidays on the earnings of certain subsidiaries. The benefits realized as a result of these tax holidays reduced the consolidated effective tax rate by approximately 0.7% in both fiscal 2013 and 2012. Remaining tax holidays as of July 31, 2014 are not significant.
54
Table of Contents
Uncertain Tax Positions
Balance at July 31, 2011 | $ | 22,343 | |
|
| ||
Additions based on tax positions related to the current year | 6,983 | | |
Additions for tax positions of prior years | 9,460 | | |
Reductions for tax positions of prior years | - | | |
Lapse of statute of limitations | (949 | ) | |
Settlements with tax authorities | - | | |
Cumulative Translation Adjustments and other | (1,305 | ) | |
|
| ||
Balance as of July 31, 2012 | $ | 36,532 | |
|
| ||
Additions based on tax positions related to the current year | 4,015 | | |
Additions for tax positions of prior years (1) | 2,809 | | |
Reductions for tax positions of prior years | - | | |
Lapse of statute of limitations | (5,613 | ) | |
Settlements with tax authorities | (590 | ) | |
Cumulative Translation Adjustments and other | 422 | | |
|
| ||
Balance as of July 31, 2013 | $ | 37,575 | |
|
| ||
Additions based on tax positions related to the current year | 4,596 | | |
Additions for tax positions of prior years | - | | |
Reductions for tax positions of prior years | (14,569 | ) | |
Lapse of statute of limitations | (3,711 | ) | |
Settlements with tax authorities | (5,832 | ) | |
Cumulative Translation Adjustments and other | (210 | ) | |
|
| ||
Balance as of July 31, 2014 | $ | 17,849 | |
(1) | Includes acquisitions |
The $17,849 of unrecognized tax benefits, if recognized, would affect the Company's effective income tax rate. The Company has classified $11,357 and $32,759 , excluding interest and penalties, of the reserve for uncertain tax positions in Other Liabilities on the Consolidated Balance Sheets as of July 31, 2014 and 2013 , respectively. The Company has classified $6,492 and $4,816 , excluding interest and penalties, as a reduction of long-term deferred income tax assets on the Consolidated Balance Sheets as of July 31, 2014 and 2013, respectively.
The Company recognizes interest and penalties related to unrecognized tax benefits within the provision for income taxes on the consolidated statements of earnings.
Interest expense is recognized on the amount of potentially underpaid taxes associated with the Company's tax positions, beginning in the first period in which interest starts accruing under the respective tax law and continuing until the tax positions are settled. The Company recognized a decrease of $498 , and an increase of $200 and $539 in interest expense during the years ended July 31, 2014, 2013 , and 2012 , respectively. There were increases of $25 , $313 and $855 of penalties related to the reserve for uncertain tax positions during the yeas ended July 31, 2014, 2013 and 2012, respectively. These amounts are net of reversals due to reductions for tax positions of prior years, statute of limitations, and settlements. At July 31, 2014 and 2013 , the Company had $1,739 and $2,265 , respectively, accrued for interest on unrecognized tax benefits. Penalties are accrued if the tax position does not meet the minimum statutory threshold to avoid the payment of a penalty.
At July 31, 2014 and 2013 , the Company had $2,664 and $2,689 , respectively, accrued for penalties on unrecognized tax benefits.
The Company estimates that it is reasonably possible that the unrecognized tax benefits may be reduced by $688 within twelve months as a result of the resolution of worldwide tax matters, tax audit settlements, amended tax filings, and/or statute
55
Table of Contents
expirations. The maximum amount that would be recognized through the consolidated statements of earnings as an income tax benefit is $688 .
During the year ended July 31, 2014, the Company recognized $4,111 of tax benefits (including interest and penalties) associated with the lapse of statutes of limitations.
The Company and its subsidiaries file income tax returns in the U.S., various state, and foreign jurisdictions. The following table summarizes the open tax years for the Company's major jurisdictions:
Jurisdiction |
| Open Tax Years |
United States - Federal |
| F'13 - F'14 |
France |
| F'13 - F'14 |
Germany |
| F'09 - F'14 |
United Kingdom |
| F'11 - F'14 |
Unremitted Earnings
The Company does not provide for U.S. deferred taxes on cumulative earnings of non-U.S. affiliates and associated companies that have been reinvested indefinitely. These earnings relate to ongoing operations and at July 31, 2014, were approximately $433,382 . These earnings have been reinvested in non-U.S. business operations, and the Company does not intend to repatriate these earnings to fund U.S. operations. It is impracticable to determine the income tax liability that would be payable if such earnings were not indefinitely reinvested.
7. Long-Term Obligations
On February 1, 2012, the Company and certain of its subsidiaries entered into an unsecured $300,000 multi-currency revolving loan agreement with a group of six banks that replaced and terminated the Company's previous credit agreement. Under the credit agreement, which has a final maturity date of February 1, 2017 , the Company has the option to select either a base interest rate (based upon the higher of the federal funds rate plus one-half of 1% or the prime rate of Bank of America plus a margin based on the Company's consolidated leverage ratio) or a Eurocurrency interest rate (at the LIBOR rate plus a margin based on the Company's consolidated leverage ratio). At the Company's option, and subject to certain conditions, the available amount under the new credit facility may be increased from $300,000 up to $450,000 .
In December 2012, the Company drew down $220,000 from its revolving loan agreement to fund a portion of the purchase price of the acquisition of PDC. The borrowings bear interest at LIBOR plus 1.125% per annum, which will be reset from time to time based upon changes in the LIBOR rate. As of July 31, 2013, there was $39,000 outstanding on this revolving loan agreement, which was repaid during fiscal 2014. During fiscal 2014, the Company drew down an additional $63,000 in order to fund dividends, principal payments on the private placement note issuances, share repurchases, and general corporate needs. The Company repaid $21,000 of this borrowing during the three months ended July 31, 2014, and intends to repay the remainder within 12 months of the current period end, as such, the borrowing is classified as "Notes Payable" within current liabilities on the Consolidated Balance Sheets. During fiscal 2014 , the maximum amount outstanding on the revolving loan agreement was $72,000 . As of July 31, 2014 , the outstanding balance on the credit facility was $42,000 and the Company had outstanding letters of credit under the revolving loan agreement of $3,634 . There was $254,366 available for future borrowing under the credit facility, which can be increased to $404,366 at the Company's option, subject to certain conditions.
In February 2013, the Company entered into an unsecured $26,200 multi-currency line of credit in China, which was amended in November 2013 to $24,200 and is due on demand. The line of credit supports USD-denominated or CNY-denominated borrowing to fund working capital and operations for the Company's Chinese entities. Borrowings under this facility may be made for a period up to one year from the date of borrowing with interest on the borrowings incurred equal to U.S. Dollar LIBOR on the date of borrowing plus a margin based upon duration. There is no ultimate maturity on the facility and the facility is subject to periodic review and repricing. The Company is not required to comply with any financial covenants as part of this agreement. During fiscal 2014 , the maximum amount outstanding was $19,422 , which was also the outstanding balance as of July 31, 2014. This was comprised of $6,923 USD-denominated borrowings and $12,499 USD equivalent of CNY-denominated borrowings. As of July 31, 2014 , there was $4,778 available for future borrowing under this credit facility.
56
Table of Contents
As of July 31, 2014 , borrowings on the revolving loan agreement and China line of credit were as follows:
| July 31, 2014 |
| Interest Rate | |||
USD-denominated borrowing on revolving loan agreement | $ | 42,000 | |
| 1.2472 | % |
USD-denominated borrowing on China line of credit | 6,923 | |
| 1.3548 | % | |
RMB-denominated borrowing on China line of credit (USD equivalent) | 12,499 | |
| 5.0400 | % | |
Notes payable | $ | 61,422 | |
| 2.0311 | % |
As of July 31, 2013, borrowings on the revolving loan agreement and China line of credit were as follows:
| July 31, 2013 |
| Interest Rate | |||
USD-denominated borrowing on revolving loan agreement | $ | 39,000 | |
| 1.2787 | % |
USD-denominated borrowing on China line of credit | 11,613 | |
| 1.1201 | % | |
Notes payable | $ | 50,613 | |
| 1.2423 | % |
The Company had outstanding letters of credit of $3,634 and $3,570 at July 31, 2014 and July 31, 2013 , respectively.
On May 13, 2010, the Company completed a private placement of €75.0 million aggregate principal amount of senior unsecured notes to accredited institutional investors. The €75.0 million of senior notes consists of €30.0 million aggregate principal amount of 3.71% Series 2010-A Senior Notes, due May 13, 2017 and €45.0 million aggregate principal amount of 4.24% Series 2010-A Senior Notes, due May 13, 2020, with interest payable on the notes semiannually. This private placement was exempt from the registration requirements of the Securities Act of 1933. The notes were not registered for resale and may not be resold absent such registration or an applicable exemption from the registration requirements of the Securities Act of 1933 and applicable state securities laws. The notes have certain prepayment penalties for repaying them prior to maturity. The notes have been fully and unconditionally guaranteed on an unsecured basis by the Company's domestic subsidiaries.
During fiscal 2004 through fiscal 2007, the Company completed three private placement note issuances totaling $500 million in ten-year fixed rate notes with varying maturity dates to institutional investors at interest rates varying from 5.14% to 5.33% . The notes must be repaid equally over seven years, with initial payment due dates ranging from 2008 to 2011, with interest payable on the notes due semiannually on various dates throughout the year, which began in December 2004. The private placements were exempt from the registration requirements of the Securities Act of 1933. The notes were not registered for resale and may not be resold absent such registration or an applicable exemption from the registration requirements of the Securities Act of 1933 and applicable state securities laws. The notes have certain prepayment penalties for repaying them prior to the maturity date. Under the debt agreement, the Company made scheduled principal payments of $61.3 million during each of the years ended July 31, 2008 through 2014.
The Company's debt and revolving loan agreements require it to maintain certain financial covenants. The Company's February 2006, March 2007, and May 2010 private placement debt agreements require the Company to maintain a ratio of debt to the trailing twelve months EBITDA, as defined in the debt agreements, of not more than a 3.5 to 1.0 ratio (leverage ratio). As of July 31, 2014 , the Company was in compliance with the financial covenant of the February 2006, March 2007, and May 2010 private placement debt agreements, with the ratio of debt to EBITDA, as defined by the agreements, equal to 1.7 to 1.0 . Additionally, the Company's February 2012 revolving loan agreement requires the Company to maintain a ratio of debt to trailing twelve months EBITDA, as defined by the debt agreement, of not more than a 3.25 to 1.0 ratio . The revolving loan agreement requires the Company's trailing twelve months EBITDA to interest expense of not less than a 3.0 to 1.0 ratio (interest expense coverage). As of July 31, 2014 , the Company was in compliance with the financial covenants of the revolving loan agreement, with the ratio of debt to EBITDA, as defined by the agreement, equal to 1.7 to 1.0 and the interest expense coverage ratio equal to 11.5 to 1.0 .
57
Table of Contents
Long-term obligations consist of the following as of July 31:
|
| 2014 |
| 2013 | ||||
Euro-denominated notes payable in 2017 at a fixed rate of 3.71% |
| $ | 40,164 | |
| $ | 39,900 | |
Euro-denominated notes payable in 2020 at a fixed rate of 4.24% |
| 60,246 | |
| 59,850 | | ||
USD-denominated notes payable through 2014 at a fixed rate of 5.14% |
| - | |
| 18,750 | | ||
USD-denominated notes payable through 2016 at a fixed rate of 5.30% |
| 52,286 | |
| 78,428 | | ||
USD-denominated notes payable through 2017 at a fixed rate of 5.33% |
| 49,114 | |
| 65,486 | | ||
|
| $ | 201,810 | |
| $ | 262,414 | |
Less current maturities |
| $ | (42,514 | ) |
| $ | (61,264 | ) |
|
| $ | 159,296 | |
| $ | 201,150 | |
The estimated fair value of the Company's long-term obligations was $216,280 and $276,132 at July 31, 2014 and July 31, 2013 , respectively, as compared to the carrying value of $201,810 and $262,414 at July 31, 2014 and July 31, 2013 , respectively. The fair value of the long-term obligations, which were determined using the market approach based upon the interest rates available to the Company for borrowings with similar terms and maturities, were determined to be Level 2 under the fair value hierarchy. Due to the short-term nature and variable interest rate pricing of the Company's revolving debt, it is determined that the carrying value of the debt equals the fair value of the debt.
Maturities on long-term debt are as follows:
Years Ending July 31, |
| ||
2015 | $ | 42,514 | |
2016 | 42,514 | | |
2017 | 56,536 | | |
2018 | - | | |
2019 | - | | |
Thereafter | 60,246 | | |
|
| ||
Total | $ | 201,810 | |
|
| ||
8. Stockholder's Investment
Information as to the Company's capital stock at July 31, 2014 and 2013 is as follows:
|
| July 31, 2014 |
| July 31, 2013 | ||||||||||||||||
|
| Shares Authorized |
| Shares Issued |
| (thousands) Amount |
| Shares Authorized |
| Shares Issued |
| (thousands) Amount | ||||||||
Preferred Stock, $.01 par value |
| 5,000,000 | |
|
|
|
|
| 5,000,000 | |
|
|
|
| ||||||
Cumulative Preferred Stock: 6% Cumulative |
| 5,000 | |
|
|
|
|
| 5,000 | |
|
|
|
| ||||||
1972 Series |
| 10,000 | |
|
|
|
|
| 10,000 | |
|
|
|
| ||||||
1979 Series |
| 30,000 | |
|
|
|
|
| 30,000 | |
|
|
|
| ||||||
Common Stock, $.01 par value: Class A Nonvoting |
| 100,000,000 | |
| 51,261,487 | |
| $ | 513 | |
| 100,000,000 | |
| 51,261,487 | |
| $ | 513 | |
Class B Voting |
| 10,000,000 | |
| 3,538,628 | |
| 35 | |
| 10,000,000 | |
| 3,538,628 | |
| 35 | | ||
|
|
|
|
|
| $ | 548 | |
|
|
|
|
| $ | 548 | | ||||
Before any dividend may be paid on the Class B Common Stock, holders of the Class A Common Stock are entitled to receive an annual, noncumulative cash dividend of $.01665 per share. Thereafter, any further dividend in that fiscal year must be paid on each share of Class A Common Stock and Class B Common Stock on an equal basis.
Other than as required by law, holders of the Class A Common Stock are not entitled to any vote on corporate matters, unless, in each of the three preceding fiscal years, the $.01665 preferential dividend described above has not been paid in full. Holders of the Class A Common Stock are entitled to one vote per share for the entire fiscal year immediately following the third consecutive fiscal year in which the preferential dividend is not paid in full. Holders of Class B Common Stock are entitled to one vote per share for the election of directors and for all other purposes.
58
Table of Contents
Upon liquidation, dissolution or winding up of the Company, and after distribution of any amounts due to holders of Cumulative Preferred Stock, holders of the Class A Common Stock are entitled to receive the sum of $0.835 per share before any payment or distribution to holders of the Class B Common Stock. Thereafter, holders of the Class B Common Stock are entitled to receive a payment or distribution of $0.835 per share. Thereafter, holders of the Class A Common Stock and Class B Common Stock share equally in all payments or distributions upon liquidation, dissolution or winding up of the Company.
The preferences in dividends and liquidation rights of the Class A Common Stock over the Class B Common Stock will terminate at any time that the voting rights of Class A Common Stock and Class B Common Stock become equal.
The following is a summary of other activity in stockholders' investment for the fiscal years ended July 31, 2014 , 2013 , and 2012 :
|
| Unearned Restricted Stock |
| Deferred Compensation |
| Shares Held in Rabbi Trust, at cost |
| Total | ||||||||
Balances at July 31, 2011 |
| $ | (5,362 | ) |
| $ | 12,093 | |
| $ | (11,595 | ) |
| $ | (4,864 | ) |
Shares at July 31, 2011 |
|
|
| 560,078 | |
| 560,078 | |
|
| ||||||
Sale of shares at cost |
| - | |
| (1,407 | ) |
| 1,368 | |
| (39 | ) | ||||
Purchase of shares at cost |
| - | |
| 924 | |
| (924 | ) |
| - | | ||||
Amortization of restricted stock |
| 1,599 | |
| - | |
| - | |
| 1,599 | | ||||
Balances at July 31, 2012 |
| (3,763 | ) |
| 11,610 | |
| (11,151 | ) |
| (3,304 | ) | ||||
Shares at July 31, 2012 |
|
|
| $ | 517,105 | |
| $ | 517,105 | |
|
| ||||
Sale of shares at cost |
| $ | - | |
| (1,461 | ) |
| 1,419 | |
| $ | (42 | ) | ||
Purchase of shares at cost |
| - | |
| 891 | |
| (891 | ) |
| - | | ||||
Forfeitures of restricted stock |
| 838 | |
| - | |
| - | |
| 838 | | ||||
Amortization of restricted stock |
| 1,788 | |
| - | |
| - | |
| 1,788 | | ||||
Balances at July 31, 2013 |
| $ | (1,137 | ) |
| $ | 11,040 | |
| $ | (10,623 | ) |
| $ | (720 | ) |
Shares at July 31, 2013 |
|
|
| 469,797 | |
| 469,797 | |
|
| ||||||
Sale of shares at cost |
| - | |
| (1,637 | ) |
| 1,496 | |
| (141 | ) | ||||
Purchase of shares at cost |
| - | |
| 821 | |
| (821 | ) |
| - | | ||||
Effect of plan amendment |
| - | |
| (2,435 | ) |
| - | |
| (2,435 | ) | ||||
Amortization of restricted stock |
| 1,137 | |
| - | |
| - | |
| 1,137 | | ||||
Balances at July 31, 2014 |
| $ | - | |
| $ | 7,789 | |
| $ | (9,948 | ) |
| $ | (2,159 | ) |
Shares at July 31, 2014 |
|
|
| 338,711 | |
| 423,415 | |
|
| ||||||
Deferred Compensation Plans
Prior to 2002, all Brady Corporation deferred compensation was invested in the Company's Class A Nonvoting Common Stock. In 2002, the Company adopted a new deferred compensation plan for both executives and directors which allowed investing in other investment funds in addition to the Company's Class A Nonvoting Common Stock. Under this plan, participants were allowed to transfer funds between the Company's Class A Nonvoting Common Stock and the other investment funds. On May 1, 2006 the plan was amended with the provision that deferrals into the Company's Class A Nonvoting Common Stock must remain in the Company's Class A Nonvoting Common Stock and be distributed in shares of the Company's Class A Nonvoting Common Stock. On May 21, 2014, the Director Deferred Compensation Plan was amended to allow participants to transfer funds from other investment funds into the Company's Class A Nonvoting Common Stock. Funds are not permitted to be transferred from the Company's Class A Nonvoting Common Stock into other investment funds until six months after the Director resigns from the Board. No such amendment was made to the Executive Deferred Compensation Plan.
At July 31, 2014 , the deferred compensation balance in stockholders' investment represents the investment at the original cost of shares held in the Company's Class A Nonvoting Common Stock for the deferred compensation plan prior to 2002 and the investment at the cost of shares held in the Company's Class A Nonvoting Common Stock for the plan subsequent to 2002, adjusted for the plan amendments on May 1, 2006 and May 21, 2014. The balance of shares held in the Rabbi Trust represents the investment in the Company's Class A Nonvoting Common Stock at the original cost of all the Company's Class A Nonvoting Common Stock held in deferred compensation plans.
59
Table of Contents
Incentive Stock Plans
The Company has an incentive stock plan under which the Board of Directors may grant nonqualified stock options to purchase shares of Class A Nonvoting Common Stock, restricted stock units ("RSUs"), or restricted and unrestricted shares of Class A Nonvoting Common Stock to employees and non-employee directors.
The options issued under the plan have an exercise price equal to the fair market value of the underlying stock at the date of grant and generally vest ratably over a three-year period, with one-third becoming exercisable one year after the grant date and one-third additional in each of the succeeding two years. Options issued under the plan, referred to herein as "service-based" options, generally expire 10 years from the date of grant. The Company also grants stock options to certain executives and key management employees that vest upon meeting certain financial performance conditions over the vesting schedule described above. These options are referred to herein as "performance-based" options. Performance-based stock options expire 10 years from the date of grant.
Restricted shares and RSUs issued under the plan have an issuance price equal to the fair market value of the underlying stock at the date of grant. The restricted shares awarded in fiscal 2008 were amended in fiscal 2011 to allow for vesting after either a five -year period or a seven -year period based upon both performance and service conditions. The restricted shares awarded in fiscal 2011 vest ratably at the end of years 3, 4 and 5 upon meeting certain performance and service conditions. These shares are referred to herein as "performance-based restricted shares." Restricted shares awarded in fiscal 2013 vest at the end of a three -year period based upon service conditions. These shares are referred to herein as "cliff-vested restricted shares." The restricted shares awarded in fiscal 2014 were issued to the Interim President and Chief Executive Officer in recognition of the increased duties upon appointment and are service-based. The shares vest upon the earlier of the end of the individual's term as Interim President and CEO or the Board appointment of a permanent President and CEO. These shares are referred to herein as "service-based cliff-vested restricted shares." The RSUs granted in fiscal 2014 vest ratably over a three -year period, with one-third vesting one year after the grant date and one-third additional in each of the succeeding two years. The Company also grants RSUs to certain executives and key management employees that vest upon meeting certain financial performance conditions over a specified vesting period, referred to herein as "performance-based RSUs." The performance-based RSUs granted in fiscal 2013 vest over a two -year period upon meeting both performance and service conditions.
As of July 31, 2014 , the Company has reserved 4,389,117 shares of Class A Nonvoting Common Stock for outstanding stock options, RSUs and restricted and unrestricted shares and 4,022,854 shares of Class A Nonvoting Common Stock remain for future issuance of stock options, RSUs and restricted and unrestricted shares under the active plans. The Company uses treasury stock or will issue new Class A Nonvoting Common Stock to deliver shares under these plans.
The Company recognizes the compensation cost of all share-based awards at the time it is deemed probable the award will vest. This cost is recognized on a straight-line basis over the vesting period of the award. If it is determined that it is unlikely the award will vest, the expense recognized to date for the award is reversed in the period in which this is evident and the remaining expense is not recorded. Total stock-based compensation expense recognized by the Company during the years ended July 31, 2014 , 2013 , and 2012 was $5,214 ( $3,232 net of taxes), $1,736 ( $1,059 net of taxes), and $9,735 ( $5,939 net of taxes), respectively. The increase in expense from fiscal 2013 to fiscal 2014 was due to the reversal of stock-based compensation expense of $7,883 in fiscal 2013 primarily related to performance awards that would not meet the financial performance conditions to vest.
As of July 31, 2014 , total unrecognized compensation cost related to share-based compensation awards that are expected to vest was $5,507 pre-tax, net of estimated forfeitures, which the Company expects to recognize over a weighted-average period of 1.3 years .
60
Table of Contents
|
| Option Price |
| Options Outstanding |
| Weighted Average Exercise Price | |||||||
Balance as of July 31, 2011 |
| $ | 13.31 | | - | $40.37 |
| 5,726,017 | |
| $ | 29.24 | |
Options granted |
| 27.00 | | - | 33.54 |
| 1,212,450 | |
| 27.91 | | ||
Options exercised |
| 13.31 | | - | 29.78 |
| (266,991 | ) |
| 20.21 | | ||
Options cancelled |
| 16.00 | | - | 38.31 |
| (417,725 | ) |
| 31.16 | | ||
Balance as of July 31, 2012 |
| $ | 13.31 | | - | $40.37 |
| 6,253,751 | |
| $ | 29.24 | |
Options granted |
| 30.21 | | - | 36.25 |
| 828,450 | |
| 30.58 | | ||
Options exercised |
| 13.31 | | - | 31.54 |
| (1,080,089 | ) |
| 22.79 | | ||
Options cancelled |
| 16.39 | | - | 38.31 |
| (895,527 | ) |
| 30.02 | | ||
Balance as of July 31, 2013 |
| $ | 17.23 | | - | $40.37 |
| 5,106,585 | |
| $ | 30.68 | |
Options granted |
| 29.28 | | - | 31.07 |
| 375,272 | |
| 30.98 | | ||
Options exercised |
| 17.33 | | - | 30.21 |
| (490,507 | ) |
| 26.45 | | ||
Options cancelled |
| 20.95 | | - | 38.31 |
| (787,090 | ) |
| 32.71 | | ||
Balance as of July 31, 2014 |
| $ | 17.23 | | - | $40.37 |
| 4,204,260 | |
| $ | 30.82 | |
The total fair value of options vested during the fiscal years ended July 31, 2014 , 2013 , and 2012 was $6,605 , $11,086 , and $8,016 , respectively. The total intrinsic value of options exercised during the fiscal years ended July 31, 2014 , 2013 , and 2012 was $2,452 , $10,728 , and $3,096 , respectively.
There were 3,004,348 , 3,311,043 , and 3,503,963 options exercisable with a weighted average exercise price of $31.15 , $31.46 , and $29.69 at July 31, 2014 , 2013 , and 2012 , respectively. The cash received from the exercise of options during the fiscal years ended July 31, 2014 , 2013 , and 2012 was $12,113 , $20,324 , and $3,864 , respectively. The tax benefit on options exercised during the fiscal years ended July 31, 2014 , 2013 , and 2012 was $952 , $1,964 , and $777 , respectively.
The following table summarizes information about stock options outstanding at July 31, 2014 :
|
| Options Outstanding |
| Options Outstanding and Exercisable | ||||||||||||||
Range of Exercise Prices |
| Number of Shares Outstanding at July 31, 2014 |
| Weighted Average Remaining Contractual Life (in years) |
| Weighted Average Exercise Price |
| Shares Exercisable at July 31, 2014 |
| Weighted Average Remaining Contractual Life (in years) |
| Weighted Average Exercise Price | ||||||
$17.00 - $27.99 |
| 664,383 | |
| 6.2 |
| $ | 25.00 | |
| 504,258 | |
| 5.8 |
| $ | 24.32 | |
$28.00 - $37.99 |
| 2,956,377 | |
| 5.7 |
| 30.66 | |
| 1,916,590 | |
| 4.4 |
| 30.77 | | ||
$38.00 - $40.99 |
| 583,500 | |
| 2.8 |
| 38.26 | |
| 583,500 | |
| 2.8 |
| 38.26 | | ||
Total |
| 4,204,260 | |
| 5.4 |
| 30.82 | |
| 3,004,348 | |
| 4.3 |
| $ | 31.15 | | |
As of July 31, 2014 , the aggregate intrinsic value (defined as the amount by which the fair value of the underlying stock exceeds the exercise price of an option) of options outstanding and the options exercisable was $1,145 and $1,145 , respectively.
61
Table of Contents
The following tables summarize the RSU and restricted share activity for the fiscal years ended July 31, 2014 , 2013 , and 2012 :
Service-Based RSUs and Restricted Shares |
| Shares |
| Weighted Average Grant Date Fair Value | |||
Balance as of July 31, 2012 |
| - | |
| $ | - | |
New grants |
| 5,000 | |
| 32.99 | | |
Vested |
| - | |
| - | | |
Forfeited |
| - | |
| - | | |
Balance as of July 31, 2013 |
| 5,000 | |
| $ | 32.99 | |
New grants |
| 108,055 | |
| 30.93 | | |
Vested |
| - | |
| - | | |
Forfeited |
| (8,198 | ) |
| 31.05 | | |
Balance as of July 31, 2014 |
| 104,857 | |
| $ | 31.02 | |
Performance-Based RSUs and Restricted Shares |
| Shares |
| Weighted Average Grant Date Fair Value | |||
Balance as of July 31, 2012 |
| 310,000 | |
| $ | 31.38 | |
New grants |
| 10,000 | |
| 30.21 | | |
Vested |
| (33,333 | ) |
| 28.35 | | |
Forfeited |
| (55,000 | ) |
| 32.83 | | |
Balance as of July 31, 2013 |
| 231,667 | |
| $ | 31.43 | |
New grants |
| - | |
| - | | |
Vested |
| (35,001 | ) |
| 28.35 | | |
Forfeited |
| (116,666 | ) |
| 31.61 | | |
Balance as of July 31, 2014 |
| 80,000 | |
| $ | 32.50 | |
9. Segment Information
Effective May 1, 2013, the Company is organized and managed on a global basis within two business platforms: Identification Solutions and Workplace Safety, which are the reportable segments.
The Company evaluates short-term segment performance based on segment profit or loss and customer sales. Segment profit or loss does not include certain administrative costs, such as the cost of finance, information technology, human resources, legal, and executive leadership, which are managed as global functions. Restructuring charges, impairment charges, equity compensation costs, interest expense, investment and other income (expense) and income taxes are also excluded when evaluating segment performance.
Each business platform has a President that reports directly to the Company's chief operating decision maker, its Chief Executive Officer. Each platform has its own distinct operations, is managed locally by its own management team, maintains its own financial reports and is evaluated based on global segment profit. The Company has determined that these business platforms comprise its operating and reportable segments based on the information used by the Chief Executive Officer to allocate resources and assess performance.
The segment results have been adjusted to reflect continuing operations in all periods presented. The depreciation and amortization expense and expenditures for property, plant and equipment for discontinued operations are included under "corporate," which then reconcile to the total company amounts as listed in the statement of cash flows.
62
Table of Contents
|
| 2014 |
| 2013 |
| 2012 | ||||||
Sales to External Customers: |
|
|
|
|
|
| ||||||
IDS |
| $ | 825,123 | |
| $ | 739,116 | |
| $ | 636,590 | |
WPS |
| 399,911 | |
| 418,676 | |
| 434,914 | | |||
Total Company |
| $ | 1,225,034 | |
| $ | 1,157,792 | |
| $ | 1,071,504 | |
Depreciation & Amortization: |
|
|
|
|
|
| ||||||
IDS |
| $ | 28,955 | |
| $ | 25,920 | |
| $ | 18,253 | |
WPS |
| 7,919 | |
| 9,078 | |
| 7,827 | | |||
Corporate |
| 7,724 | |
| 13,727 | |
| 17,907 | | |||
Total Company |
| $ | 44,598 | |
| $ | 48,725 | |
| $ | 43,987 | |
Segment Profit: |
|
|
|
|
|
| ||||||
IDS |
| $ | 176,129 | |
| $ | 174,390 | |
| $ | 160,658 | |
WPS |
| 66,238 | |
| 95,241 | |
| 117,187 | | |||
Total Company |
| $ | 242,367 | |
| $ | 269,631 | |
| $ | 277,845 | |
Assets: |
|
|
|
|
|
| ||||||
IDS |
| $ | 882,440 | |
| $ | 989,216 | |
| $ | 744,055 | |
WPS |
| 239,848 | |
| 239,219 | |
| 439,255 | | |||
Corporate |
| 131,377 | |
| 210,248 | |
| 424,409 | | |||
Total Company |
| $ | 1,253,665 | |
| $ | 1,438,683 | |
| $ | 1,607,719 | |
Expenditures for property, plant & equipment: |
|
|
|
|
|
| ||||||
IDS |
| $ | 28,774 | |
| $ | 18,186 | |
| $ | 15,213 | |
WPS |
| 10,580 | |
| 8,459 | |
| 4,989 | | |||
Corporate |
| 4,044 | |
| 9,042 | |
| 3,945 | | |||
Total Company |
| $ | 43,398 | |
| $ | 35,687 | |
| $ | 24,147 | |
Following is a reconciliation of segment profit to net earnings (loss) for the years ended July 31, 2014 , 2013 and 2012 :
| Years Ended July 31, | ||||||||||
| 2014 |
| 2013 |
| 2012 | ||||||
Total profit from reportable segments | $ | 242,367 | |
| $ | 269,631 | |
| $ | 277,845 | |
Unallocated costs: |
|
|
|
|
| ||||||
Administrative costs | 120,015 | |
| 121,693 | |
| 114,098 | | |||
Restructuring charges | 15,012 | |
| 26,046 | |
| 6,084 | | |||
Impairment charges (1) | 148,551 | |
| 204,448 | |
| - | | |||
Investment and other income | (2,402 | ) |
| (3,523 | ) |
| (2,082 | ) | |||
Interest expense | 14,300 | |
| 16,641 | |
| 19,090 | | |||
(Loss) earnings from continuing operations before income taxes | $ | (53,109 | ) |
| $ | (95,674 | ) |
| $ | 140,655 | |
(1) The impairment charges in fiscal 2014 were in the IDS reportable segment. Of the total $204,448 impairment charges in fiscal 2013, $182,800 was in the WPS reportable segment and $21,648 was in the IDS reportable segment.
|
| Revenues* Years Ended July 31, |
| Long-Lived Assets** As of Years Ended July 31, | ||||||||||||||||||||
|
| 2014 |
| 2013 |
| 2012 |
| 2014 |
| 2013 |
| 2012 | ||||||||||||
Geographic information: |
|
|
|
|
|
|
|
|
|
|
|
| ||||||||||||
United States |
| $ | 675,771 | |
| $ | 615,861 | |
| $ | 522,393 | |
| $ | 425,733 | |
| $ | 576,539 | |
| $ | 479,791 | |
Other |
| 615,974 | |
| 602,582 | |
| 611,899 | |
| 314,456 | |
| 319,706 | |
| 411,134 | | ||||||
Eliminations |
| (66,711 | ) |
| (60,651 | ) |
| (62,788 | ) |
| - | |
| - | |
| - | | ||||||
Consolidated total |
| $ | 1,225,034 | |
| $ | 1,157,792 | |
| $ | 1,071,504 | |
| $ | 740,189 | |
| $ | 896,245 | |
| $ | 890,925 | |
* Revenues are attributed based on country of origin. | ||||||||||||||||||||||||
** Long-lived assets consist of property, plant, and equipment, other intangible assets and goodwill. | ||||||||||||||||||||||||
63
Table of Contents
10. Net (Loss) Earnings per Common Share
Net (loss) earnings per common share is computed by dividing net (loss) earnings (after deducting restricted stock dividends and the applicable preferential Class A Common Stock dividends) by the weighted average Common Shares outstanding of 51,866 for 2014, 51,330 for 2013, and 52,453 for 2012. The Company utilizes the two-class method to calculate earnings per share.
In June 2008, the Financial Accounting Standards Board ("FASB") issued accounting guidance addressing whether instruments granted in share-based payment transactions are participating securities prior to vesting, and therefore, need to be included in the earnings allocation in computing earnings per share. This guidance requires that all outstanding unvested share-based payment awards that contain rights to non-forfeitable dividends be considered participating securities in undistributed earnings with common shareholders. The Company adopted the guidance during the first quarter of fiscal 2010. As a result, the dividends on the Company's performance-based restricted shares are reconciling items in the basic and diluted earnings per share calculations for the respective periods presented.
64
Table of Contents
Reconciliations of the numerator and denominator of the basic and diluted per share computations for the Company's Class A and Class B common stock are summarized as follows:
| Years ended July 31, | ||||||||||
| 2014 |
| 2013 |
| 2012 | ||||||
Numerator: (in thousands) |
|
|
|
|
| ||||||
(Loss) earnings from continuing operations | $ | (48,146 | ) |
| $ | (138,257 | ) |
| $ | 103,493 | |
Less: |
|
|
|
|
| ||||||
Restricted stock dividends | (92 | ) |
| (238 | ) |
| (229 | ) | |||
Numerator for basic and diluted earnings from continuing operations per Class A Nonvoting Common Share | $ | (48,238 | ) |
| $ | (138,495 | ) |
| $ | 103,264 | |
Less: |
|
|
|
|
| ||||||
Preferential dividends | (813 | ) |
| (797 | ) |
| (818 | ) | |||
Preferential dividends on dilutive stock options | (6 | ) |
| (5 | ) |
| (5 | ) | |||
Numerator for basic and diluted earnings from continuing operations per Class B Voting Common Share | $ | (49,057 | ) |
| $ | (139,297 | ) |
| $ | 102,441 | |
Denominator: (in thousands) |
|
|
|
|
| ||||||
Denominator for basic earnings from continuing operations per share for both Class A and Class B | 51,866 | |
| 51,330 | |
| 52,453 | | |||
Plus: Effect of dilutive stock options | - | |
| - | |
| 368 | | |||
Denominator for diluted earnings from continuing operations per share for both Class A and Class B | 51,866 | |
| 51,330 | |
| 52,821 | | |||
(Loss) earnings from continuing operations per Class A Nonvoting Common Share: |
|
|
|
|
| ||||||
Basic | $ | (0.93 | ) |
| $ | (2.70 | ) |
| $ | 1.97 | |
Diluted | $ | (0.93 | ) |
| $ | (2.70 | ) |
| $ | 1.95 | |
(Loss) earnings from continuing operations per Class B Voting Common Share: |
|
|
|
|
| ||||||
Basic | $ | (0.95 | ) |
| $ | (2.71 | ) |
| $ | 1.95 | |
Diluted | $ | (0.95 | ) |
| $ | (2.71 | ) |
| $ | 1.94 | |
Earnings (loss) from discontinued operations per Class A Nonvoting Common Share: |
|
|
|
|
| ||||||
Basic | $ | 0.04 | |
| $ | (0.32 | ) |
| $ | (2.31 | ) |
Diluted | $ | 0.04 | |
| $ | (0.32 | ) |
| $ | (2.29 | ) |
Earnings (loss) from discontinued operations per Class B Voting Common Share: |
|
|
|
|
| ||||||
Basic | $ | 0.05 | |
| $ | (0.32 | ) |
| $ | (2.31 | ) |
Diluted | $ | 0.05 | |
| $ | (0.32 | ) |
| $ | (2.30 | ) |
Net loss per Class A Nonvoting Common Share: |
|
|
|
|
| ||||||
Basic | $ | (0.89 | ) |
| $ | (3.02 | ) |
| $ | (0.35 | ) |
Diluted | $ | (0.89 | ) |
| $ | (3.02 | ) |
| $ | (0.34 | ) |
Net loss per Class B Voting Common Share: |
|
|
|
|
| ||||||
Basic | $ | (0.90 | ) |
| $ | (3.03 | ) |
| $ | (0.36 | ) |
Diluted | $ | (0.90 | ) |
| $ | (3.03 | ) |
| $ | (0.36 | ) |
In accordance with ASC 260, "Earnings per Share," all options to purchase Class A Nonvoting Common Stock were not included in the computation of diluted loss per share for fiscal 2014 and 2013 , since to do so would be anti-dilutive. Options to purchase approximately 4,592,486 shares of Class A Nonvoting Common Stock for the fiscal year ended July 31, 2012 , were not included in the computation of diluted net earnings (loss) per share as the impact of the inclusion of the options would have been anti-dilutive.
65
Table of Contents
11. Commitments and Contingencies
The Company has entered into various non-cancellable operating lease agreements. Rental expense charged to continuing operations on a straight-line basis was $17,344 , $18,108 , and $15,196 for the years ended July 31, 2014 , 2013 , and 2012 , respectively. Future minimum lease payments required under such leases in effect at July 31, 2014 were as follows:
Years ending July 31, |
| ||
2015 | $ | 16,163 | |
2016 | 11,813 | | |
2017 | 9,827 | | |
2018 | 8,985 | | |
2019 | 7,715 | | |
Thereafter | 16,950 | | |
| $ | 71,453 | |
In the normal course of business, the Company is named as a defendant in various lawsuits in which claims are asserted against the Company. In the opinion of management, the liabilities, if any, which may ultimately result from lawsuits are not expected to have a material effect on the consolidated financial statements of the Company.
12. Fair Value Measurements
The Company follows the guidance in ASC 820, "Fair Value Measurements and Disclosures" as it relates to its financial and non-financial assets and liabilities. The accounting guidance applies to other accounting pronouncements that require or permit fair value measurements, defines fair value based upon an exit price model, establishes a framework for measuring fair value, and expands the applicable disclosure requirements. The accounting guidance indicates, among other things, that a fair value measurement assumes that a transaction to sell an asset or transfer a liability occurs in the principal market for the asset or liability or, in the absence of a principal market, the most advantageous market for the asset or liability.
The accounting guidance on fair value measurements establishes a fair market value hierarchy for the pricing inputs used to measure fair market value. The Company's assets and liabilities measured at fair market value are classified in one of the following categories:
Level 1 - Assets or liabilities for which fair value is based on (unadjusted) quoted prices in active markets for identical instruments that are accessible as of the reporting date.
Level 2 - Assets or liabilities for which fair value is based on other significant pricing inputs that are either directly or indirectly observable.
Level 3 - Assets or liabilities for which fair value is based on significant unobservable pricing inputs to the extent little or no market data is available, which result in the use of management's own assumptions.
66
Table of Contents
The following tables set forth by level within the fair value hierarchy, the Company's financial assets and liabilities that were accounted for at fair value on a recurring basis at July 31, 2014, and July 31, 2013 , according to the valuation techniques the Company used to determine their fair values.
| Inputs Considered As |
|
|
|
| ||||||||
| Quoted Prices in Active Markets for Identical Assets (Level 1) |
| Significant Other Observable Inputs (Level 2) |
| Fair Values |
| Balance Sheet Classifications | ||||||
July 31, 2014 |
|
|
|
|
|
|
| ||||||
Trading securities | $ | 15,962 | |
| $ | - | |
| $ | 15,962 | |
| Other assets |
Foreign exchange contracts | - | |
| 166 | |
| 166 | |
| Prepaid expenses and other current assets | |||
Total Assets | $ | 15,962 | |
| $ | 166 | |
| $ | 16,128 | |
|
|
Foreign exchange contracts | $ | - | |
| $ | 389 | |
| $ | 389 | |
| Other current liabilities |
Total Liabilities | $ | - | |
| $ | 389 | |
| $ | 389 | |
|
|
July 31, 2013 |
|
|
|
|
|
|
| ||||||
Trading securities | $ | 14,975 | |
| $ | - | |
| $ | 14,975 | |
| Other assets |
Foreign exchange contracts | - | |
| 294 | |
| 294 | |
| Prepaid expenses and other current assets | |||
Total Assets | $ | 14,975 | |
| $ | 294 | |
| $ | 15,269 | |
|
|
Foreign exchange contracts | $ | - | |
| $ | 890 | |
| $ | 890 | |
| Other current liabilities |
Total Liabilities | $ | - | |
| $ | 890 | |
| $ | 890 | |
|
|
The following methods and assumptions were used to estimate the fair value of each class of financial instrument:
Trading securities: The Company's deferred compensation investments consist of investments in mutual funds. These investments were classified as Level 1 as the shares of these investments trade with sufficient frequency and volume to enable us to obtain pricing information on an ongoing basis.
Foreign exchange contracts: The Company's foreign exchange contracts were classified as Level 2, as the fair value was based on the present value of the future cash flows using external models that use observable inputs, such as interest rates, yield curves and foreign exchange rates. See Note 14, "Derivatives and Hedging Activities" for additional information.
There have been no transfers of assets or liabilities between the fair value hierarchy levels, outlined above, during the fiscal years ended July 31, 2014 and July 31, 2013 .
The Company's financial instruments, other than those presented in the disclosures above, include cash and cash equivalents, accounts receivable, notes payable, accounts payable, accrued liabilities and short-term and long-term debt. The fair values of cash and cash equivalents, accounts receivable, notes payable, accounts payable, and accrued liabilities approximated carrying values because of the short-term nature of these instruments. See Note 7 for information regarding the fair values of the Company's short-term and long-term debt.
During fiscal 2014, goodwill with a carrying amount of $193,689 in the PeopleID reporting unit was written down to its estimated implied fair value of $93,277 , resulting in a non-cash impairment charge of $100,412 . In order to arrive at the implied fair value of goodwill, the Company calculated the fair value of all of the assets and liabilities of the reporting unit as if it had been acquired in a business combination. After assigning fair value to the assets and liabilities of the reporting unit, the result was the implied fair value of goodwill of $93,277 , which represented a Level 3 asset measured at fair value on a nonrecurring basis subsequent to its original recognition.
The PeopleID reporting unit had intangible assets consisting of tradenames and customer relationships, which were valued using the income approach as part of the goodwill impairment valuation described above. The valuation was based upon current sales projections and profitability for each asset group, and the relief from royalty method was applied. As a result of the analysis, a definite-lived customer relationship with a carrying amount of $88,803 was written down to its estimated fair value of $44,600 . In addition, indefinite-lived tradenames and other definite-lived customer relationships with a carrying amount of $5,384 were written down to their estimated fair value of $1,448 . These represented Level 3 assets measured at fair value on a nonrecurring basis subsequent to their original recognition. These items resulted in a total non-cash impairment charge of $48,139 within the IDS segment.
67
Table of Contents
During fiscal 2013, the Company implemented a plan to divest its Die-Cut business. A fair-value measurement was performed and the assets and liabilities of the disposal group were recorded at approximate fair value less costs to sell and classified as "Assets held for sale" and "Liabilities held for sale." This resulted in a loss on the write-down of the disposal group of $15,658 , recorded within discontinued operations in the third quarter of fiscal 2013. Fair value measurements were performed each subsequent quarter through July 31, 2014. There were no additional fair value adjustments recorded during fiscal 2014. Fair value was determined utilizing a combination of external market factors and internal projections in accordance with ASC 360, "Property, Plant and Equipment."
During fiscal 2013, goodwill with a carrying amount of $183,146 in the WPS Americas reporting unit was written down to its estimated implied fair value of $10,866 , resulting in a non-cash impairment charge of $172,280 . In order to arrive at the implied fair value of goodwill, the Company calculated the fair value of all of the assets and liabilities of the reporting unit as if the reporting unit had been acquired in a business combination. After assigning fair value to the assets and liabilities of the reporting unit, the result was the implied fair value of goodwill of $10,866 , which represented a Level 3 asset measured at fair value on a nonrecurring basis subsequent to its original recognition.
The WPS Americas reporting unit had intangible assets consisting of tradenames and customer relationships, which were valued using the income approach as part of the goodwill impairment test described above. The valuation was based upon current sales projections and profitability for each asset group, and the relief from royalty method was applied. As a result of the analysis, indefinite-lived tradenames with a carrying amount of $25,449 were written down to the estimated fair value of $14,881 , which represented a Level 3 liability measured at fair value on a nonrecurring basis subsequent to its original recognition. This resulted in a non-cash impairment charge of $10,568 within the WPS segment.
During fiscal 2013, goodwill with a carrying amount of $18,225 in the IDS APAC reporting unit was written off, resulting in a non-cash impairment charge of $18,225 . When management compared the fair value to the carrying value of the reporting unit as part of the annual goodwill impairment test (Step One), a qualitative assessment was completed for Step Two because the amount by which the carrying value exceeded fair value was more than the balance of goodwill remaining. The fair value of the reporting unit was determined utilizing a combination of external market factors, internal projections, and other relevant Level 3 measurements. As such, the Company recognized a goodwill impairment charge of the entire remaining goodwill balance of $18,225 during the year ended July 31, 2013. As a result of the goodwill impairment, the Company analyzed fixed assets for potential impairment within the IDS APAC reporting unit by comparing undiscounted future cash flows to the carrying amount of the assets. Undiscounted future cash flows were determined using the Company's internal projections and other relevant Level 3 measurements. As a result, the Company concluded that fixed assets with a carrying amount of $4,367 was written down to its estimated fair value of $1,100 during the year ended July 31, 2013.
13. Restructuring
During fiscal 2012, the Company took various measures to address its cost structure in response to weaker sales forecasts across the Company. As a result of these actions, the Company recorded restructuring charges in continuing operations of $6,084 , which consisted of $4,947 of employee separation costs, $458 of fixed asset write-offs, $653 of other facility closure related costs, and $26 of contract termination costs. Of the $6,084 of restructuring charges recorded during fiscal 2012, $4,254 was incurred within IDS and $1,830 within WPS.
In fiscal 2013, the Company announced a restructuring action to reduce its global workforce by approximately 5-7% in order to address its cost structure. In connection with this restructuring action, the Company incurred restructuring charges of $26,046 in continuing operations. These charges consisted of $18,350 of employee separation costs, $4,125 of fixed asset write-offs and $3,571 of other facility closure related costs. Of the $26,046 of restructuring charges recorded during fiscal 2013, $15,870 was incurred within IDS and $10,176 within WPS. The charges for employee separation costs consisted of severance pay, outplacement services, medical and other benefits. Long-lived asset write-offs include both the net book value of property, plant and equipment written off in conjunction with facility consolidations, as well as indefinite-lived tradenames written off in conjunction with brand consolidations within the WPS segment.
In fiscal 2014, the Company announced a restructuring plan to consolidate facilities in North America, Europe and Asia. The Company implemented this restructuring plan to enhance customer service, improve efficiency of operations and reduce operating expenses. In connection with this restructuring plan, the Company incurred restructuring charges of $15,012 in continuing operations in fiscal 2014 . These charges consisted of $9,328 of employee separation costs, $4,374 of facility closure related costs, $1,043 of contract termination costs, and $267 of non-cash asset write-offs. Of the $15,012 of restructuring charges recorded during fiscal 2014, $9,013 was incurred within IDS and $5,999 was incurred within WPS. The charges for employee separation costs consisted of severance pay, outplacement services, medical and other benefits. Non-cash asset write-offs consist mainly of
68
Table of Contents
fixed assets written off in conjunction with facility consolidations. Facility consolidation activities will extend into fiscal 2015 and will result in approximately $15 million of additional restructuring charges.
The costs related to these restructuring activities were recorded on the consolidated statements of earnings as restructuring charges. The Company expects the majority of the remaining cash payments to be made during the next twelve months. The liability is included in wages and amounts withheld from employees on the consolidated balance sheets.
A roll-forward of the Company's restructuring activity for fiscal 2014 , 2013 and 2012 is below.
|
| Employee Related |
| Asset Write-offs |
| Other Facility Closure/Lease Termination Costs |
| Total | ||||||||
Restructuring liability ending balance, July 31, 2011 |
| $ | 2,207 | |
| $ | - | |
| $ | 50 | |
| $ | 2,257 | |
Restructuring charges in continuing operations |
| 4,947 | |
| 458 | |
| 679 | |
| 6,084 | | ||||
Restructuring charges in discontinued operations |
| 5,997 | |
| - | |
| 29 | |
| 6,026 | | ||||
Non-cash write-offs |
| - | |
| (458 | ) |
| - | |
| (458 | ) | ||||
Cash payments |
| (4,342 | ) |
| - | |
| (492 | ) |
| (4,834 | ) | ||||
Restructuring liability ending balance, July 31, 2012 |
| $ | 8,809 | |
| $ | - | |
| $ | 266 | |
| $ | 9,075 | |
Restructuring charges in continuing operations |
| $ | 18,350 | |
| $ | 4,125 | |
| $ | 3,571 | |
| $ | 26,046 | |
Restructuring charges in discontinued operations |
| 2,811 | |
| 362 | |
| 1,376 | |
| 4,549 | | ||||
Non-cash write-offs |
| - | |
| (4,487 | ) |
| - | |
| (4,487 | ) | ||||
Cash payments |
| (18,495 | ) |
| - | |
| (2,482 | ) |
| (20,977 | ) | ||||
Restructuring liability ending balance, July 31, 2013 |
| $ | 11,475 | |
| $ | - | |
| $ | 2,731 | |
| $ | 14,206 | |
Restructuring charges in continuing operations |
| $ | 9,328 | |
| $ | 267 | |
| $ | 5,417 | |
| $ | 15,012 | |
Restructuring charges in discontinued operations |
| 6,615 | |
| 299 | |
| 75 | |
| 6,989 | | ||||
Non-cash write-offs |
| - | |
| (566 | ) |
| - | |
| (566 | ) | ||||
Cash payments |
| (24,029 | ) |
| - | |
| (6,617 | ) |
| (30,646 | ) | ||||
Restructuring liability ending balance, July 31, 2014 |
| $ | 3,389 | |
| $ | - | |
| $ | 1,606 | |
| $ | 4,995 | |
14. Derivatives and Hedging Activities
The Company utilizes forward foreign exchange contracts to reduce the exchange rate risk of specific foreign currency denominated transactions. These contracts typically require the exchange of a foreign currency for U.S. dollars at a fixed rate at a future date, with maturities of less than 18 months , which qualify as cash flow hedges or net investment hedges under the accounting guidance for derivative instruments and hedging activities. The primary objective of the Company's foreign currency exchange risk management program is to minimize the impact of currency movements due to transactions in other than the respective subsidiaries' functional currency and to minimize the impact of currency movements on the Company's net investment denominated in a currency other than the U.S. Dollar. To achieve this objective, the Company hedges a portion of known exposures using forward foreign exchange contracts. As of July 31, 2014 and July 31, 2013 , the notional amount of outstanding forward foreign exchange contracts was $ 104,000 and $ 157,500 , respectively.
The Company hedges a portion of known exposures using forward foreign exchange contracts. Main exposures are related to transactions denominated in the British Pound, the Euro, Canadian Dollar, Australian Dollar, Malaysian Ringgit and Singapore Dollar. Generally, these risk management transactions will involve the use of foreign currency derivatives to minimize the impact of currency movements on non-functional currency transactions.
Hedge effectiveness is determined by how closely the changes in fair value of the hedging instrument offset the changes in the fair value or cash flows of the hedged item. Hedge accounting is permitted only if the hedging relationship is expected to be highly effective at the inception of the hedge and on an on-going basis. Gains or losses on the derivative related to hedge ineffectiveness are recognized in current earnings.
69
Table of Contents
Cash Flow Hedges
The Company has designated a portion of its forward foreign exchange contracts as cash flow hedges and recorded these contracts at fair value on the consolidated balance sheets. For these instruments, the effective portion of the gain or loss on the derivative is reported as a component of other comprehensive income ("OCI") and reclassified into earnings in the same period or periods during which the hedged transaction affects earnings. At July 31, 2014 and July 31, 2013 , unrealized losses of $ 21 and unrealized gains of $ 118 have been included in OCI, respectively. These balances are expected to be reclassified from OCI to earnings during the next twelve months when the hedged transactions impact earnings. For the years ended July 31, 2014 , 2013 , and 2012 , the Company reclassified gains of $147 and $578 , and losses of $494 from OCI into cost of goods sold, respectively.
The Company had no outstanding forward foreign exchange contracts designated as cash flow hedges at July 31, 2014 or July 31, 2013 .
Net Investment Hedges
The Company has also designated intercompany and third party foreign currency denominated debt instruments as net investment hedges. During 2014 , the Company designated certain British Pound intercompany loans as net investment hedges to hedge portions of its net investment in British foreign operations. At July 31, 2014 , the Company had £25,000 of intercompany loans so designated. As of July 31, 2014 and 2013 , the Company recognized in OCI losses of $2,271 and gains of $2,121 , respectively, on its intercompany loans designated as net investment hedges. On May 13, 2010, the Company completed the private placement of €75.0 million aggregate principal amount of senior unsecured notes to accredited institutional investors. This Euro-denominated debt obligation was designated as a net investment hedge to selectively hedge portions of its net investment in European foreign operations. As of July 31, 2014 and 2013 , the cumulative balance recognized in accumulated other comprehensive income were losses of $5,495 and $4,835 , respectively, on the Euro-denominated debt obligation. The changes recognized in other comprehensive income during the years ended July 31, 2014 , 2013 and 2012 were losses of $660 and $7,470 and gains of $15,705 , respectively, on the Euro-denominated debt obligation. The Company's foreign denominated debt obligations are valued under a market approach using publicized spot prices.
Additionally, the Company utilizes forward foreign exchange contracts designated as hedge instruments to hedge portions of its net investments in foreign operations. The net gains or losses attributable to changes in spot exchange rates are recorded in other comprehensive income. Recognition in earnings of amounts previously recorded in cumulative translation is limited to circumstances such as complete or substantially complete liquidation of the net investment in the hedged foreign operation. At July 31, 2014 and 2013 , the U.S dollar equivalent of these outstanding forward foreign exchange contracts totaled $ 5,300 and $ 4,500 , respectively. As of July 31, 2014 and 2013 , the Company recognized in OCI losses of $ 265 and $ 150 , respectively, on its net investment hedges.
Non-Designated Hedges
During the fiscal year ended July 31, 2014 , the Company recognized a gain of $1,147 in "Investment and other income" on the consolidated statements of earnings related to non-designated hedges. For the fiscal year ended July 31, 2013 , the Company recognized a loss of $1,594 in "Investment and other income" on the consolidated statement of earnings related to non-designated hedges.
70
Table of Contents
Fair values of derivative instruments in the consolidated balance sheets were as follows:
| Asset Derivatives |
| Liability Derivatives | ||||||||||||||||||||
| July 31, 2014 |
| July 31, 2013 |
| July 31, 2014 |
| July 31, 2013 | ||||||||||||||||
| Balance Sheet Location |
| Fair Value |
| Balance Sheet Location |
| Fair Value |
| Balance Sheet Location |
| Fair Value |
| Balance Sheet Location |
| Fair Value | ||||||||
Derivatives designated as hedging instruments |
|
|
|
|
|
|
|
|
|
|
|
|
|
|
| ||||||||
Net investment hedges |
|
|
|
|
|
|
|
|
|
|
|
|
|
|
| ||||||||
Foreign exchange contracts | Prepaid expenses and other current assets |
| $ | - | |
| Prepaid expenses and other current assets |
| $ | 7 | |
| Other current liabilities |
| $ | 14 | |
| Other current liabilities |
| $ | - | |
Foreign currency denominated debt | Prepaid expenses and other current assets |
| $ | - | |
| Prepaid expenses and other current assets |
| $ | - | |
| Long term obligations, less current maturities |
| $ | 100,410 | |
| Long term obligations, less current maturities |
| $ | 99,750 | |
Total derivatives designated as hedging instruments |
|
| $ | - | |
|
|
| $ | 7 | |
|
|
| $ | 100,424 | |
|
|
| $ | 99,750 | |
Derivatives not designated as hedging instruments |
|
|
|
|
|
|
|
|
|
|
|
|
|
|
| ||||||||
Foreign exchange contracts | Prepaid expenses and other current assets |
| $ | 166 | |
| Prepaid expenses and other current assets |
| $ | 287 | |
| Other current liabilities |
| $ | 375 | |
| Other current liabilities |
| $ | 890 | |
Total derivatives not designated as hedging instruments |
|
| $ | 166 | |
|
|
| $ | 287 | |
|
|
| $ | 375 | |
|
|
| $ | 890 | |
15. Discontinued Operations
Discontinued operations consist of the Asia Die-Cut and Balkhausen Die-cut businesses ("Die-Cut"), which were classified as held for sale beginning in the third quarter of fiscal 2013. In addition, the following previously divested businesses were reported within discontinued operations: Brady Medical and Varitronics (divested in fiscal 2013) and Etimark (divested in fiscal 2012). These divested businesses were part of the IDS business segment.
The Company entered into an agreement with LTI Flexible Products, Inc. (d/b/a Boyd Corporation) on February 24, 2014, for the sale of its Die-Cut businesses. The first phase of the divestiture closed on May 1, 2014 and the Company received approximately $54.2 million of cash proceeds for its businesses in Korea, Thailand and Malaysia, and its Balkhausen business in Europe. The second phase included the remainder of the Die-Cut businesses located in China. This portion of the divestiture closed on August 1, 2014.
The following table summarizes the operating results of discontinued operations for the fiscal years ending July 31, 2014, 2013 , and 2012 :
| 2014 |
| 2013 |
| 2012 | ||||||
Net sales | $ | 179,050 | |
| $ | 214,137 | |
| $ | 259,668 | |
Earnings (loss) from discontinued operations (1) | 6,715 | |
| 4,083 | |
| (117,905 | ) | |||
(Loss) on write-down of disposal group (2) | - | |
| (15,658 | ) |
| - | | |||
Income tax (expense) (3) | (3,299 | ) |
| (4,703 | ) |
| (3,499 | ) | |||
Loss on sale of discontinued operations (4) | (1,602 | ) |
| - | |
| - | | |||
Income tax benefit on sale of discontinued operations (5) | 364 | |
| - | |
| - | | |||
Earnings (loss) from discontinued operations, net of tax | $ | 2,178 | |
| $ | (16,278 | ) |
| $ | (121,404 | ) |
(1) | The loss from operations of discontinued businesses in fiscal 2012 was primarily attributable to the $115.7 million goodwill impairment charge recorded during the three months ended January 31, 2012, which was related to the Die-Cut business. |
(2) | The Company recorded a $15.7 million loss to write-down the Die-Cut business to its estimated fair value less costs to sell in the three months ended April 30, 2013. |
(3) | Fiscal 2013 income tax expense was significantly impacted by the fiscal 2013 losses in China and Sweden, which had no tax benefit, and the increase in valuation allowance related to Shenzhen, China. |
71
Table of Contents
(4) | Represents the loss incurred on the sale of the Die-Cut business, recorded in the three months ended July 31, 2014 and includes $3.9 million in liabilities retained as part of the divestiture agreement. |
(5) | The income tax benefit on the sale of discontinued operations was significantly impacted by the release of a reserve for uncertain tax positions of $4.0 million, which was triggered as a result of the Thailand stock sale during the three months ended July 31, 2014. This was offset by $3.6 million in tax expense related to the gain on the sale of the Balkhausen assets. The Thailand stock sale and the Balkhausen asset sale were included in the first phase of the Die-Cut divestiture. |
| July 31, 2014 | ||
Accounts receivable-net | $ | 20,174 | |
Total inventories | 5,883 | | |
Prepaid expenses and other current assets | 52 | | |
Total current assets | 26,109 | | |
|
| ||
Other assets: |
| ||
Goodwill | 8,923 | | |
Other intangible assets | 280 | | |
Other | 89 | | |
Property, plant and equipment-net | 14,141 | | |
Total assets | $ | 49,542 | |
|
| ||
Current liabilities: |
| ||
Accounts payable | $ | 9,199 | |
Wages and amounts withheld from employees | 1,140 | | |
Other current liabilities | 301 | | |
Total current liabilities | 10,640 | | |
|
| ||
Net assets of disposal group at fair value | 38,902 | | |
In accordance with authoritative literature, accumulated other comprehensive income will be reclassified to the statement of earnings upon liquidation or substantial liquidation of the disposal group. As of July 31, 2014, the accumulated other comprehensive income attributable to the second phase of the Die-Cut divestiture was approximately $35,000 , which reduces the net book value of the disposal group.
72
Table of Contents
16. Unaudited Quarterly Financial Information
|
| Quarters | ||||||||||||||||||
|
| First |
| Second |
| Third |
| Fourth |
| Total | ||||||||||
2014 |
|
|
|
|
|
|
|
|
|
| ||||||||||
Net sales |
| $ | 307,530 | |
| $ | 291,194 | |
| $ | 309,577 | |
| $ | 316,733 | |
| $ | 1,225,034 | |
Gross margin |
| 157,847 | |
| 142,536 | |
| 155,120 | |
| 154,061 | |
| 609,564 | | |||||
Operating income (loss) * |
| 29,689 | |
| 18,346 | |
| 26,767 | |
| (116,013 | ) |
| (41,211 | ) | |||||
Earnings (loss) from continuing operations |
| 18,135 | |
| 10,517 | |
| 20,183 | |
| (96,981 | ) |
| (48,146 | ) | |||||
Earnings (loss) from discontinued operations, net of income taxes ** |
| 5,795 | |
| 5,907 | |
| 3,904 | |
| (13,428 | ) |
| 2,178 | | |||||
Net earnings (loss) from continuing operations per |
|
|
|
|
|
|
|
|
|
| ||||||||||
Class A Common Share: |
|
|
|
|
|
|
|
|
|
| ||||||||||
Basic*** |
| $ | 0.35 | |
| $ | 0.20 | |
| $ | 0.39 | |
| $ | (1.89 | ) |
| $ | (0.93 | ) |
Diluted*** |
| $ | 0.35 | |
| $ | 0.20 | |
| $ | 0.39 | |
| $ | (1.89 | ) |
| $ | (0.93 | ) |
Net earnings (loss) from discontinued operations per |
|
|
|
|
|
|
|
|
|
| ||||||||||
Class A Common Share: |
|
|
|
|
|
|
|
|
|
| ||||||||||
Basic*** |
| $ | 0.11 | |
| $ | 0.11 | |
| $ | 0.08 | |
| $ | (0.26 | ) |
| $ | 0.04 | |
Diluted*** |
| $ | 0.11 | |
| $ | 0.11 | |
| $ | 0.08 | |
| $ | (0.26 | ) |
| $ | 0.04 | |
2013 |
|
|
|
|
|
|
|
|
|
| ||||||||||
Net sales |
| $ | 272,015 | |
| $ | 272,702 | |
| $ | 302,483 | |
| $ | 310,592 | |
| $ | 1,157,792 | |
Gross margin |
| 150,185 | |
| 141,891 | |
| 159,401 | |
| 157,871 | |
| 609,348 | | |||||
Operating income * |
| 43,236 | |
| 21,797 | |
| 30,935 | |
| (178,524 | ) |
| (82,556 | ) | |||||
Earnings from continuing operations |
| 26,291 | |
| (10,671 | ) |
| 21,680 | |
| (175,557 | ) |
| (138,257 | ) | |||||
Earnings (loss) from discontinued operations, net of income taxes ** |
| 896 | |
| 1,987 | |
| (17,447 | ) |
| (1,714 | ) |
| (16,278 | ) | |||||
Net earnings from continuing operations per |
|
|
|
|
|
|
|
|
|
| ||||||||||
Class A Common Share: |
|
|
|
|
|
|
|
|
|
| ||||||||||
Basic*** |
| $ | 0.51 | |
| $ | (0.21 | ) |
| $ | 0.42 | |
| $ | (3.40 | ) |
| $ | (2.70 | ) |
Diluted*** |
| $ | 0.51 | |
| $ | (0.21 | ) |
| $ | 0.42 | |
| $ | (3.40 | ) |
| $ | (2.70 | ) |
Net earnings (loss) from discontinued operations per |
|
|
|
|
|
|
|
|
|
| ||||||||||
Class A Common Share: |
|
|
|
|
|
|
|
|
|
| ||||||||||
Basic*** |
| $ | 0.02 | |
| $ | 0.04 | |
| $ | (0.34 | ) |
| $ | (0.03 | ) |
| $ | (0.32 | ) |
Diluted*** |
| $ | 0.02 | |
| $ | 0.04 | |
| $ | (0.34 | ) |
| $ | (0.03 | ) |
| $ | (0.32 | ) |
The quarterly financial data has been impacted by the reclassification of the Die-Cut business into discontinued operations. Refer to Note 15 within Item 8 for further information on discontinued operations.
* In fiscal 2014, the Company recorded before tax impairment charges of $148,551 in the fourth quarter ended July 31, 2014 and before tax restructuring charges of $6,840, $4,324, $3,039 and $809 in the first, second, third, and fourth quarters of fiscal 2014 , respectively, for a total of $15,012 . In fiscal 2013, the Company recorded before tax impairment charges of $204,448 in the fourth quarter ended July 31, 2013 and before tax restructuring charges of $1,933 , $8,540 and $15,573 in the second, third and fourth quarters of fiscal 2013 , respectively, for a total of $26,046 .
** | In fiscal 2014, the Company recorded restructuring charges of $6,989 and a loss on the sale of the Die Cut business of $1,602 in discontinued operations in the fourth quarter ended July 31, 2014. In fiscal 2013, the Company recorded a $15,658 loss to write-down the Die-Cut business to its estimated fair value less costs to sell in the three months ended April 30, 2013. |
*** The sum of the quarters does not equal the year-to-date total for fiscal 2014 and fiscal 2013 due to the quarterly changes in
weighted-average shares outstanding.
Item 9. Changes in and Disagreements with Accountants on Accounting and Financial Disclosure
None.
73
Table of Contents
Item 9A. Controls and Procedures
Disclosure Controls and Procedures:
Brady Corporation maintains a set of disclosure controls and procedures that are designed to ensure that information required to be disclosed by the Company in the reports filed by the Company under the Securities Exchange Act of 1934, as amended (the "Exchange Act"), is recorded, processed, summarized and reported within the time periods specified in the SEC's rules and forms. Disclosure controls and procedures include, without limitation, controls and procedures designed to ensure that information required to be disclosed by the Company in the reports the Company files under the Exchange Act is accumulated and communicated to the Company's management, including the Company's principal executive and principal financial officers, or persons performing similar functions, as appropriate to allow timely decisions regarding required disclosure. The Company carried out an evaluation, under the supervision and with the participation of its management, including its President and Chief Executive Officer and its Senior Vice President and Chief Financial Officer, of the effectiveness of the design and operation of the Company's disclosure controls and procedures pursuant to Rule 13a-15 of the Exchange Act. Based on that evaluation, the Company's President and Chief Executive Officer and Executive Vice President and Chief Financial Officer concluded that the Company's disclosure controls and procedures are effective as of the end of the period covered by this report.
Management's Report on Internal Control Over Financial Reporting:
The management of Brady Corporation and its subsidiaries is responsible for establishing and maintaining adequate internal control over financial reporting for the Company, as such term is defined in Rule 13a-15(f) under the Securities Exchange Act of 1934. The Company's internal control over financial reporting is designed to provide reasonable assurance regarding the reliability of financial reporting and the preparation of financial statements for external purposes in accordance with generally accepted accounting principles.
With the participation of the Chief Executive Officer and the Chief Financial Officer, management conducted an evaluation of the effectiveness of our internal control over financial reporting as of July 31, 2014, based on the framework and criteria established in Internal Control - Integrated Framework (1992) , issued by the Committee of Sponsoring Organizations of the Treadway Commission . Based on the assessment, management concluded that, as of July 31, 2014, the Company's internal control over financial reporting is effective based on those criteria. The Company's internal control over financial reporting, as of July 31, 2014, has been audited by Deloitte & Touche LLP, an independent registered public accounting firm, as stated in their report, which is included herein.
Because of the inherent limitations of internal control over financial reporting, misstatements may not be prevented or detected on a timely basis. Also, projections of any evaluation of the effectiveness of internal control over financial reporting to future periods are subject to the risk that the controls may become inadequate because of changes in conditions, or that the degree of compliance with the policies or procedures may deteriorate.
Changes in Internal Control Over Financial Reporting:
There were no changes in the Company's internal control over financial reporting (as defined in Exchange Act Rules 13a-15(f) and 15d-15(f)) that occurred during the Company's most recently completed fiscal quarter that have materially affected, or are reasonably likely to materially affect, the Company's internal control over financial reporting.
74
Table of Contents
REPORT OF INDEPENDENT REGISTERED PUBLIC ACCOUNTING FIRM
To the Board of Directors and Stockholders of
Brady Corporation
Milwaukee, Wisconsin
We have audited the internal control over financial reporting of Brady Corporation and subsidiaries (the "Company") as of July 31, 2014, based on criteria established in Internal Control - Integrated Framework (1992) issued by the Committee of Sponsoring Organizations of the Treadway Commission. The Company's management is responsible for maintaining effective internal control over financial reporting and for its assessment of the effectiveness of internal control over financial reporting, included in the accompanying Management's Report on Internal Control over Financial Reporting. Our responsibility is to express an opinion on the Company's internal control over financial reporting based on our audit.
We conducted our audit in accordance with the standards of the Public Company Accounting Oversight Board (United States). Those standards require that we plan and perform the audit to obtain reasonable assurance about whether effective internal control over financial reporting was maintained in all material respects. Our audit included obtaining an understanding of internal control over financial reporting, assessing the risk that a material weakness exists, testing and evaluating the design and operating effectiveness of internal control based on the assessed risk, and performing such other procedures as we considered necessary in the circumstances. We believe that our audit provides a reasonable basis for our opinion.
A company's internal control over financial reporting is a process designed by, or under the supervision of, the company's principal executive and principal financial officers, or persons performing similar functions, and effected by the company's board of directors, management, and other personnel to provide reasonable assurance regarding the reliability of financial reporting and the preparation of financial statements for external purposes in accordance with generally accepted accounting principles. A company's internal control over financial reporting includes those policies and procedures that (1) pertain to the maintenance of records that, in reasonable detail, accurately and fairly reflect the transactions and dispositions of the assets of the company; (2) provide reasonable assurance that transactions are recorded as necessary to permit preparation of financial statements in accordance with generally accepted accounting principles, and that receipts and expenditures of the company are being made only in accordance with authorizations of management and directors of the company; and (3) provide reasonable assurance regarding prevention or timely detection of unauthorized acquisition, use, or disposition of the company's assets that could have a material effect on the financial statements.
Because of the inherent limitations of internal control over financial reporting, including the possibility of collusion or improper management override of controls, material misstatements due to error or fraud may not be prevented or detected on a timely basis. Also, projections of any evaluation of the effectiveness of the internal control over financial reporting to future periods are subject to the risk that the controls may become inadequate because of changes in conditions, or that the degree of compliance with the policies or procedures may deteriorate.
In our opinion, the Company maintained, in all material respects, effective internal control over financial reporting as of July 31, 2014, based on the criteria established in Internal Control - Integrated Framework (1992) issued by the Committee of Sponsoring Organizations of the Treadway Commission.
We have also audited, in accordance with the standards of the Public Company Accounting Oversight Board (United States), the consolidated financial statements and financial statement schedule as of and for the year ended July 31, 2014, of the Company and our report dated September 29, 2014, expressed an unqualified opinion on those consolidated financial statements and financial statement schedule.
/s/ DELOITTE & TOUCHE LLP
Milwaukee, Wisconsin
September 29, 2014
75
Table of Contents
Item 9B. Other Information
None.
PART III
Item 10. Directors and Executive Officers of the Registrant
Name |
| Age |
| Title |
J. Michael Nauman |
| 52 |
| President, CEO and Director |
Aaron J. Pearce |
| 43 |
| Senior V.P., CFO |
Thomas J. Felmer |
| 52 |
| Senior V.P., President - Workplace Safety |
Stephen Millar (1) |
| 53 |
| President - Die Cut, President - Brady Asia Pacific and V.P., Brady Corporation |
Matthew O. Williamson |
| 58 |
| President - Identification Solutions and V.P., Brady Corporation |
Helena R. Nelligan |
| 48 |
| Senior V.P. - Human Resources |
Louis T. Bolognini |
| 58 |
| Senior V.P., Secretary and General Counsel |
Bentley N. Curran |
| 52 |
| V.P. - Digital Business and Chief Information Officer |
Kathleen M. Johnson |
| 60 |
| V.P. and Chief Accounting Officer |
Paul T. Meyer |
| 45 |
| Treasurer and Vice President - Tax |
Patrick W. Allender |
| 67 |
| Director |
Gary S. Balkema |
| 59 |
| Director |
Nancy L. Gioia |
| 54 |
| Director |
Conrad G. Goodkind |
| 70 |
| Director |
Frank W. Harris |
| 72 |
| Director |
Elizabeth P. Pungello |
| 47 |
| Director |
Bradley C. Richardson |
| 56 |
| Director |
(1) On August 1, 2014, the Company announced that Mr. Millar would be leaving his employment with the Company effective September 30, 2014.
J. Michael Nauman - Mr. Nauman has served on the Company's Board of Directors and as the Company's President and CEO since August 2014 . Prior to joining the Company, from 1994 to 2014 he held a number of senior management positions at Molex Incorporated. Mr. Nauman was Molex's Executive Vice President and President of the Global Integrated Products Division from 2009 to 2014, where he led global business units in the automotive, data communications, industrial, medical, military/aerospace and mobile sectors. From 2004 to 2009, he served as Molex's Senior Vice President and President, Global Integrated Product Division, President, Integrated Products Division and President, High Performance Products Division. The Company currently transacts business with Molex, and has historically done so, in the ordinary course of business and on an arm's length basis. Prior to joining Molex in 1994, Mr. Nauman was Controller and then President of Ohio Associated Enterprises, Inc., and a tax accountant and auditor for Arthur Andersen. He is a board member of the Arkansas Science & Technology Authority, Arkansas Science, Technology, Engineering and Math Coalition, and Museum of Discovery. Mr. Nauman's broad operational and financial experience, as well as his leadership and strategic perspective, provide the Board with insight and expertise to drive the Company's growth and performance. Mr. Nauman was identified as an officer and director candidate through a process conducted by a Search
76
Table of Contents
Committee of the Board of Directors, which utilized the resources of an executive search firm. Mr. Nauman holds a bachelor's of science degree in management from Case Western Reserve University, and is a certified public accountant and charter global management accountant.
Aaron J. Pearce - Mr. Pearce joined the Company in 2004 as Director of Internal Audit. From 2006 to 2008, he served as Finance Director for the Company's Asia Pacific region, and from 2008 to 2010, served as Global Tax Director. In January 2010, Mr. Pearce was appointed Vice President, Treasurer, and Director of Investor Relations, and in April, 2013, was named Vice President - Finance, with responsibility for finance support to the Company's Workplace Safety and ID Solutions businesses, financial planning and analysis, and investor relations. In September 2014, Mr. Pearce was appointed Senior Vice President and Chief Financial Officer. Prior to joining the Company, Mr. Pearce was an auditor with Deloitte & Touche LLP from 1994 to 2004. He holds a bachelors degree in business administration from the University of Wisconsin-Milwaukee and is a certified public accountant.
Thomas J. Felmer - Mr. Felmer joined the Company in 1989 and has held several sales and marketing positions until being named Vice President and General Manager of Brady's U.S. Signmark Division in 1994. In 1999, Mr. Felmer moved to Europe where he led the European Signmark business for two years, then gained additional responsibility for the European direct marketing business platforms, which he also led for two years. In 2003, Mr. Felmer returned to the United States where he was responsible for Brady's global sales and marketing processes, Brady Software businesses, and integration leader of the EMED acquisition. In June 2004, he was appointed President - Direct Marketing Americas, and was named Chief Financial Officer in January 2008. In October 2013, Mr. Felmer was appointed Interim President and CEO, and served in these positions until August 2014. In September 2014, Mr. Felmer was named President - Workplace Safety. Mr. Felmer received a bachelor's degree in business administration from the University of Wisconsin - Green Bay.
Stephen Millar - Mr. Millar joined the Company in 1999 as Managing Director of Brady Australia, a position he held until 2008 when he joined Brady Americas' leadership team as Vice President and General Manager responsible for its portfolio of people identification, medical and education businesses. In 2010, he returned to Asia in the role of MRO Director for the region. He was appointed President - Brady Asia Pacific in March 2011 and was appointed President - Die Cut effective May 1, 2013. Prior to joining Brady, Mr. Millar served in a variety of leadership positions in Australia and New Zealand with GNB Technologies, a global manufacturer of automotive and industrial batteries. He holds a bachelor's of commerce and administration degree from Victoria University of Wellington, New Zealand and is a member of the institute of Chartered Accountants of New Zealand.
Matthew O. Williamson - Mr. Williamson joined the Company in 1979. From 1979 to 1994, he served in a variety of sales and marketing leadership roles. From 1995 to 2003, Mr. Williamson served as the Vice President and General Manager of the Company's specialty tape and identification solution businesses. From 1996 to 1998, Mr. Williamson served as the Vice President and General Manager of the Identification Solutions and Specialty Tapes Division. From 1998 to 2001, he served as Vice President and General Manager of the Identification Solutions Division. From 2001 to 2003, he served as Vice President and General Manager of the Global High Performance Identification Business. In April 2003, he was appointed President of the Brady Americas business, and in January 2008, Mr. Williamson assumed responsibility for the Direct Marketing Americas business. Effective May 1, 2013, Mr. Williamson was appointed President - Identification Solutions, and has responsibility for the Identification Solutions business platform globally. He holds a bachelor's degree in marketing from the University of Wisconsin - Milwaukee.
Helena R. Nelligan - Ms. Nelligan joined the Company as Senior Vice President - Human Resources in November 2013. Prior to joining the Company, Ms. Nelligan held a variety of human resources leadership roles at Eaton Corporation from 2005 to 2013, including Vice President of Human Resources - Electrical Products Group, Vice President - Human Resources, Electrical Sector Americas and Director Human Resources - Electrical Components Division. From 1997 to 2005, Ms. Nelligan served in human resources leadership roles with Merisant Worldwide, Inc. and British Petroleum. She holds a bachelor's degree in criminal justice and a master's degree in labor relations and human resources from Michigan State University.
Louis T. Bolognini - Mr. Bolognini joined the Company as Senior Vice President, General Counsel and Secretary in January 2013. Prior to joining the Company, he served as Senior Vice President, General Counsel and Secretary of Imperial Sugar Company from June 2008 through September 2012 and was Vice President and General Counsel of BioLab, Inc., a pool and spa manufacturing and marketing company from 1999 to 2008. Mr. Bolognini served as Assistant General Counsel to BioLab's parent company, Great Lakes Chemical Corporation, from 1990 to 1999. Mr. Bolognini served as an officer of BioLab, Inc. within a two-year period prior to the March 18, 2009 Chapter 11 bankruptcy petition filed by BioLab's parent company, Chemtura Corporation, on behalf of itself and 26 U.S. affiliates, including BioLab. He holds a bachelor's degree in political science from Miami University and a Juris Doctor degree from the University of Toledo.
77
Table of Contents
Bentley N. Curran - Mr. Curran joined the Company in 1999 and has held several technology leadership positions until being named Vice President of Information Technology in 2005. In October 2007, he was appointed Chief Information Officer of Brady globally. In February 2012, he was appointed to his current position, Vice President of Digital Business and Chief Information Officer. Prior to joining Brady, Mr. Curran served in a variety of technology leadership roles for Compucom and the Speed Queen Company. He holds a bachelor's degree in business administration from Marian University and holds an associate of science degree in electronics and engineering systems.
Kathleen M. Johnson - Ms. Johnson joined the Company in 1989 as a division controller and became group finance director in 1996. In 2000, she was appointed Vice President. In 2008, she was appointed Chief Accounting Officer. Prior to joining Brady, she spent six years with Kraft Food Service. She started her career as a Certified Public Accountant with Deloitte & Touche. She holds a bachelor's degree in accounting from the University of Wisconsin - Whitewater.
Paul T. Meyer - Mr. Meyer joined the Company in 2009 as Global Tax Director. In May 2013, he was appointed Treasurer, and was named Vice President - Tax in November 2013. Prior to joining the Company, Mr. Meyer worked in the corporate tax departments of GE Healthcare and JohnsonDiversey. He began his career as a tax consultant with Ernst & Young. He holds a bachelor's degree in accounting and a master's degree in taxation from the University of Wisconsin-Milwaukee.
Patrick W. Allender - Mr. Allender was elected to the Board of Directors in 2007. He serves as the Chair of the Finance Committee and as a member of the Audit and Corporate Governance Committees. He served as Executive Vice President and CFO of Danaher Corporation from 1998 to 2005 and Executive Vice President from 2005 to 2007. Additionally, he served as a public accountant at Arthur Andersen from 1968 to 1985. He has served as a director of Colfax Corporation since 2008 and Diebold, Inc. since May 2011. Mr. Allender's strong background in finance and accounting, as well as his past experience as the CFO of a public company, provides the Board with financial expertise and insight.
Gary S. Balkema - Mr. Balkema was elected to the Board of Directors in 2010. He currently serves as the Chair of the Management Development and Compensation Committee and is a member of the Audit and Technology Committees. From 2000 to 2011, he served as the President of Bayer Healthcare LLC and Worldwide Consumer Care Division. He was also responsible for overseeing Bayer LLC USA's compliance program. He has over 20 years of general management experience. Mr. Balkema brings strong experience in consumer marketing skills and mergers and acquisitions and integrations. His broad operating and functional experience are valuable to the Company given the diverse nature of the Company's portfolio.
Nancy L. Gioia - Ms. Gioia was elected to the Board of Directors in 2013, and serves on the Technology Committee. Ms. Gioia joined Ford Motor Company in 1982 and will retire in October 2014. She currently serves as Director, Global Connectivity, Electrical and User Experience , and has held a variety of engineering and technology roles with Ford Motor Company, including Director, Global Electrification; Director, Sustainable Mobility Technologies and Hybrid Vehicle Programs; Director, North America Current Vehicle Model Quality; Engineering Director, Visteon/Ford Due Diligence; Engineering Director, Small FWD/RWD Car Platforms-North America; and Vehicle Programs Director, Lifestyle Vehicles. She previously served as a Director of Auto Alliance International, a joint venture of Ford Motor Company and Mazda Corporation; Director of the Electric Drive Transportation Association; and Director of the California Plug-in EV Collaborative; and currently serves as a Director of Inforum and the State of Michigan, Governor's Talent Investment Board. Ms. Gioia's extensive experience in strategy, technology and engineering solutions, as well as her general business experience, provides the Board with important expertise in product development and operations.
Conrad G. Goodkind - Mr. Goodkind was elected to the Board of Directors in 2007. He currently serves as the Lead Independent Director, Chair of the Corporate Governance Committee and as a member of the Finance and Audit Committees. He previously served as Secretary of the Company from 1999 to 2007. Mr. Goodkind was a partner in the law firm of Quarles & Brady, LLP, where his practice concentrated in corporate and securities law from 1979 to 2009. Prior to 1979, he served as Wisconsin's Deputy Commissioner of Securities. Mr. Goodkind previously served as a director of Cade Industries, Inc. and Able Distributing, Inc. His extensive experience in advising companies on a broad range of transactional matters, including mergers and acquisitions and securities offerings, and historical knowledge of the Company provide the Board with expertise and insight into governance, business and compliance issues that the Company encounters.
Frank W. Harris, Ph.D - Dr. Harris was elected to the Board of Directors in 1991. He serves as the Chair of the Technology Committee and as a member of the Management Development and Compensation Committee. He served as the Distinguished Professor of Polymer Science and Biomedical Engineering at the University of Akron from 1983 to 2008 and Professor of Chemistry at Wright State University from 1970 to 1983. He is the founder of several technology based companies including Akron Polymer Systems where he serves as President and CEO. Dr. Harris is the inventor of several commercialized products including an optical film that realized over one billion dollars in sales. His extensive experience in technology and engineering solutions provides the
78
Table of Contents
Board with important expertise in new product development.
Elizabeth P. Pungello, Ph.D - Dr. Pungello was elected to the Board of Directors in 2003. She serves as a member of the Management Development and Compensation, Corporate Governance and Technology Committees. Dr. Pungello is the President of the Brady Education Foundation in Chapel Hill, North Carolina and a Research Associate Professor in the Developmental Psychology Program at the University of North Carolina at Chapel Hill, and has appointments at the Frank Porter Graham Development Institute and the Center for Developmental Science. Dr. Pungello also serves on the editorial board of the Journal of Marriage and Family and the Early Childhood Research Quarterly, as a reviewer for several other journals, and on a number of other non-profit boards. She is the granddaughter of William H. Brady, Jr., the founder of Brady Corporation. As a result of her substantial ownership stake in the Company, as well as her family's history with the Company, she is well positioned to understand, articulate and advocate for the rights and interests of the Company's shareholders.
Bradley C. Richardson - Mr. Richardson was elected to the Board of Directors in 2007. He serves as the Chair of the Audit Committee and is a member of the Management Development and Compensation, Corporate Governance and Finance Committees. He is the Executive Vice President and CFO of PolyOne Corporation. He previously served as the Executive Vice President and CFO of Diebold, Inc. from 2009 to 2013, and as Executive Vice President Corporate Strategy and CFO of Modine Manufacturing from 2003 to 2009. Prior to Modine, he spent 21 years with BP Amoco serving in various financial and operational roles with assignments in North America, South America and Europe. Mr. Richardson has served on the boards of Modine Manufacturing and Tronox, Inc. He brings to the Company extensive knowledge and experience in the areas of operations, strategy, accounting, tax accounting and finance, which are areas of critical importance to the Company as a global public company.
All Directors serve until their respective successors are elected at the next annual meeting of shareholders. Officers serve at the discretion of the Board of Directors. None of the Company's Directors or executive officers has any family relationship with any other Director or executive officer.
Board Leadership Structure - The Board does not have a formal policy regarding the separation of the roles of Chief Executive Officer and Chairman of the Board as the Board believes it is in the best interests of the Company to make that determination based on the position and direction of the Company and the membership of the Board. The Board currently has not appointed a Chairman of the Board, and the Board has not had a practice of appointing a Chairman for a period in excess of 20 years. In fiscal 2010, the Board formalized the position of Lead Independent Director, which is elected on an annual basis from among the independent Directors of the Board based upon the recommendation of the Corporate Governance Committee. In fiscal 2011, upon the recommendation of the Corporate Governance Committee, the Board enhanced the duties of the Lead Independent Director, which include, among others: chairing executive sessions of the non-management Directors; meeting periodically with the Chief Executive Officer and consulting as necessary with management on current significant issues facing the Company; facilitating effective communication among the Chief Executive Officer and all members of the Board; and overseeing the Board's shareholder communication policies and procedures. Mr. Goodkind served as the Lead Independent Director in fiscal 2014.
The Board believes that its current leadership structure has enhanced the Board's oversight of, and independence from, Company management; the ability of the Board to carry out its roles and responsibilities on behalf of our shareholders; and our overall corporate governance.
Risk Oversight - The Board oversees the Company's risk management processes directly and through its committees. In general, the Board oversees the management of risks inherent in the operation of the Company's businesses, the implementation of its strategic plan, its acquisition and capital allocation program and its organizational structure. Each of the Board's committees also oversees the management of Company risks that fall within the committee's areas of responsibility. The Company's management is responsible for reporting significant risks to executives at the quarterly disclosure committee meeting. The significance of the risk is assessed by executive management and escalation to the respective board committee and Board of Directors is determined. The Company reviews its risk assessment with the Audit Committee annually.
Audit Committee Financial Expert - The Company's Board of Directors has determined that at least one Audit Committee financial expert is serving on its Audit Committee. Messrs. Richardson, Chair of the Audit Committee, and Allender and Balkema, members of the Audit Committee, are financial experts and are independent as that term is used in Item 7(d)(3)(iv) of Schedule 14A under the Exchange Act.
Director Independence - A majority of the Directors must meet the criteria for independence established by the Board in accordance with the rules of the New York Stock Exchange ("NYSE"). In determining the independence of a Director, the Board must find that a Director has no relationship that may interfere with the exercise of his or her independence from management
79
Table of Contents
and the Company. In undertaking this determination, the Board considered the commercial relationships of the Company with Mr. Richardson's employer, PolyOne Corporation, and with Ms. Gioia's employer, Ford Motor Company. The commercial relationships, which involve the purchase and sale of products on customary terms, do not exceed the maximum amounts proscribed by the director independence rules of the NYSE over the past three fiscal years. The compensation paid to Mr. Richardson and Ms. Gioia by their employers is not linked in any way to the commercial relationships their employers have with the Company. After consideration of these factors, the Board concluded that the commercial relationships were not material and did not prevent Mr. Richardson and Ms. Gioia from being considered independent. Based on application of the NYSE independence criteria, all current Directors and Directors during fiscal 2014, with the exception of Mr. Nauman, President and CEO, and the Company's former President and CEO, Mr. Jaehnert, are deemed independent. All members of the Audit, Management Development and Compensation, and Corporate Governance Committees are deemed independent.
Meetings of Non-management Directors - The non-management Directors of the Board regularly meet alone without any members of management present. The Lead Independent Director, currently Mr. Goodkind, is the presiding Director at these sessions. In fiscal 2014, there were 6 executive sessions. Interested parties can raise concerns to be addressed at these meetings by calling the confidential Brady hotline at 1-800-368-3613.
Audit Committee Members - The Audit Committee, which is a separately-designated standing committee of the Board of Directors, is composed of Messrs. Richardson (Chairman), Allender, Balkema, and Goodkind. Each member of the Audit Committee has been determined by the Board to be independent under the rules of the SEC and NYSE.
Code of Ethics - For a number of years, the Company has had a code of ethics for its employees. This code of ethics applies to all of the Company's employees, officers and Directors. The code of ethics can be viewed at the Company's corporate website, www.bradycorp.com, or may be obtained in print by any person, without charge, by contacting Brady Corporation, Investor Relations, P.O. Box 571, Milwaukee, WI 53201. The Company intends to satisfy the disclosure requirements under Item 5.05 of Form 8-K regarding an amendment to, or a waiver from, a provision of its code of ethics by placing such information on its Internet website.
Corporate Governance Guidelines - Brady's Corporate Governance Principles, as well as the charters of the Audit Committee, Corporate Governance Committee, and Management Development and Compensation Committee, are available on the Company's Corporate website, www.bradycorp.com. Shareholders may request printed copies of these documents from Brady Corporation, Investor Relations, P.O. Box 571, Milwaukee, WI 53201.
Director Qualifications - Brady's Corporate Governance Committee reviews the individual skills and characteristics of the Directors, as well as the composition of the Board as a whole. This assessment includes a consideration of independence, diversity, age, skills, expertise, and industry backgrounds in the context of the needs of the Board and the Company. Although the Company has no policy regarding diversity, the Corporate Governance Committee seeks a broad range of perspectives and considers both the personal characteristics and experience of Directors and prospective nominees to the Board so that, as a group, the Board will possess the appropriate talent, skills and expertise to oversee the Company's businesses.
SECTION 16(a) BENEFICIAL OWNERSHIP REPORTING COMPLIANCE
Section 16(a) of the Exchange Act requires the Company's Directors and executive officers, and persons who own more than ten percent of a registered class of the Company's equity securities, to file with the SEC initial reports of ownership and reports of changes in ownership of Common Stock and other equity securities of the Company. Executive officers, directors and greater than ten percent stockholders are required by SEC regulation to furnish the Company with copies of all Section 16(a) forms they file. To the Company's knowledge, based solely on a review of the copies of such reports furnished to the Company and written representations that no other reports were required, during the fiscal year ended July 31, 2014, all Section 16(a) filing requirements applicable to its officers, directors and greater than 10 percent beneficial owners were complied with other than with respect to the following:
• | A Form 4 for Mr. Felmer that was not filed on or before December 10, 2012, or a Form 5 at fiscal year end, as required to report the sale of 2,869 shares of Class A Nonvoting Common Stock on December 6, 2012. This transaction was reported on a Form 4 for Mr. Felmer that was filed on August 21, 2014. |
80
Table of Contents
Item 11. Executive Compensation
Compensation Discussion and Analysis
Overview
Our Compensation Discussion and Analysis focuses upon the Company's total compensation philosophy, the role of the Management Development & Compensation Committee (for purposes of the Compensation Discussion and Analysis section, the "Committee"), total compensation components inclusive of base salary, short-term incentives, long-term incentives, benefits, perquisites, severance amounts and change-in-control agreements for our executive officers, market and peer group data and the approach used by the Committee when determining each element of the total compensation package.
For fiscal 2014, the following executive officers' compensation is disclosed and discussed in this section (the "named executive officers" or "NEOs"):
• | Thomas J. Felmer, Senior Vice President, President-Workplace Safety, and Former Chief Financial Officer (1); |
• | Frank M. Jaehnert, Former President, Chief Executive Officer and Director (2); |
• | Louis T. Bolognini, Senior Vice President, General Counsel and Secretary; |
• | Stephen Millar, Vice President, Brady Corporation, President, Brady Asia Pacific, and President-Die Cut (3), and; |
• | Matthew O. Williamson, President-Identification Solutions and Vice President, Brady Corporation |
(1) Effective October 7, 2013, Mr. Felmer was appointed by the Company as Interim President and Chief Executive Officer during the search for Mr. Jaehnert's permanent replacement and held these positions until the appointment of J. Michael Nauman as the President and Chief Executive Officer, on August 4, 2014. Mr. Felmer also retained his position of Senior Vice President and CFO of the Company and served as Acting President-Workplace Safety during fiscal 2014. In September 2014, Mr. Felmer was named President-Workplace Safety.
(2) Effective October 7, 2013, Mr. Jaehnert retired and resigned from his position as President and Chief Executive Officer and Director of the Company.
(3) On August 1, 2014, the Company entered into a Separation Agreement with Mr. Millar in connection with his departure from the Company as a result of the elimination of his positions following the divestiture of the Company's Die Cut business. Mr. Millar's employment with the Company will end on September 30, 2014.
Retirement of Frank Jaehnert: On October 7, 2013, Mr. Jaehnert retired as the Company's President and Chief Executive Officer, effective October 7, 2013. Mr. Jaehnert remained employed by the Company through December 31, 2013, during which time he was available in a consultative position to assist with respect to transition issues. The Company entered into a written agreement with Mr. Jaehnert in connection with his retirement that provided for payment of his salary and benefits through December 31, 2013, and a severance payment of $800,000 to be paid in equal installments throughout the calendar year following his separation from employment on December 31, 2013. The agreement also contains 12-month non-competition and non-solicitation provisions, as well as standard confidentiality, waiver and non-disparagement provisions. The Company entered into the agreement with Mr. Jaehnert in order to obtain his assistance on transition issues and for an agreement not to compete with the Company or solicit its employees, customers and vendors for a period of 12 months after his retirement.
Appointment of J. Michael Nauman: On August 1, 2014, the Board of Directors appointed J. Michael Nauman as President, Chief Executive Officer and Director of the Company, effective August 4, 2014. None of Mr. Nauman's compensation was paid or payable in fiscal 2014.
The Company entered into an employment offer letter dated August 1, 2014 with Mr. Nauman (the "Offer Letter")
providing that Mr. Nauman will receive an annual base salary of $675,000, subject to periodic review and adjustment. The Offer Letter also provides that he will participate in the Company's annual cash incentive plan in fiscal 2015, with a targeted annual incentive opportunity of 100% of base salary and a maximum annual incentive opportunity of 200% of base salary. The Offer Letter further provides the Mr. Nauman will receive awards under the Company's 2012 Omnibus Incentive Stock Plan in September 2014, subject to the discretion of the Management Development and Compensation Committee, with a grant date value of $1.8 million, divided equally between time-based options and restricted stock units. Under the terms of the Offer Letter, Mr. Nauman will be required to hold, directly or indirectly, shares of Brady common stock equal to five times his base salary within five years of his appointment.
The Offer Letter provides that Mr. Nauman will be able to participate in all employee benefit plans and programs generally available to the Company's executive officers, including perquisites covering a car allowance, financial planning and executive physical program, and will be reimbursed for certain of his relocation expenses. The Offer Letter also contains 24-
81
Table of Contents
month non-competition and non-solicitation provisions, as well as standard confidentiality, waiver and non-disparagement provisions. Should Mr. Nauman's employment be terminated by the Company without cause or should he resign for good reason (as such events are defined in the Offer Letter), the Company will pay Mr. Nauman a severance benefit equal to two times the sum of his base salary and target bonus.
Upon commencement of his employment on August 4, 2014, and pursuant to the terms of the Offer Letter, the Company entered into a Restricted Stock Unit Agreement with Mr. Nauman (the "RSU Agreement") under which Mr. Nauman received 53,668 restricted stock units with an aggregate award value of $1.5 million, as calculated based on the 30-day average NYSE closing price of the Company's Class A Non-Voting Common Stock. The restricted stock units will vest in equal annual increments on the third, fourth and fifth anniversaries of the grant date, with vesting accelerated in the event of death, disability, termination following a change of control, or termination by the Company without cause (as such events are defined in the RSU Agreement).
Effective August 4, 2014, the Company also entered into a Change of Control Agreement with Mr. Nauman (the "Change of Control Agreement"). Under the terms of the Change of Control Agreement, in the event of a qualifying termination within 24 months following a change of control (as such events are defined in the Change of Control Agreement), Mr. Nauman will receive two times his annual base salary, two times his target bonus, and the amount of his target bonus prorated based on when the termination occurs.
Executive Summary
Our Business
Since our founding nearly 100 years ago, we have grown the Company by developing innovative high-performing products, participating in growing markets, delivering on-time solutions and leveraging our core competencies across our businesses. Our strategy is to be the market leader in each of the global businesses we are focused on.
Our passion around market leadership is tempered only by the fact that when we win, we win the right way. Our values have been, and will be, the cornerstone of everything that we do at Brady. Focus on the Customer, Invest in our People, Embrace Teamwork, Excel at Everything We Do, Be Bold and Decisive, Protect Our Future and Win the Right Way describe the behaviors that we expect and reward at Brady.
In order to achieve our goals, we recognize it is critical to assemble and maintain a leadership team with the integrity, skills and dedication needed to execute our growth plan. We design and use our compensation plans to help us achieve these objectives and align our rewards with the intended behaviors and outcomes.
Our Fiscal 2014 Performance and Link to Pay Decisions
Fiscal 2014 Resulted in No or Below Target Bonuses and Unearned Performance-Based Stock Options, Restricted Stock and Restricted Stock Units for NEOs
Fiscal 2014 was a year of challenge for Brady. We continued to be challenged by the competitive environment in our Workplace Safety ("WPS") business as new market entrants and the ongoing shift of buying patterns to the web have had a negative impact on our business. We returned both of Brady's segments to profitable organic sales growth in the fourth quarter of fiscal 2014 and we are confident that the actions we have taken and the improvements we are now seeing will enable future sales, profitability, and cash flow growth.
In fiscal 2014, we made significant portfolio and management decisions to better position the Company for growth in the future. These changes were a meaningful shift in the industries we serve as we are reducing our reliance on the more volatile and less profitable consumer electronics industry, to an expansion of our core Identification Solutions ("IDS") business to focus on markets with long-term growth trends. In our WPS business, our strategy to return to growth included a focus on workplace safety critical industries in addition to increased investment in e-commerce expertise.
• | On a GAAP basis, we incurred a fiscal 2014 net loss from continuing operations of $48.1 million. |
• | Brady continues to demonstrate adequate cash generation to meet ongoing business needs as we generated $93.4 million of cash flow from operating activities during the year ended July 31, 2014. |
• | Our sales from continuing operations for the full year were $1.23 billion, up 5.8% from fiscal 2013. Organic sales were up 0.2%, acquisitions increased sales by 5.7%, and foreign currency translation decreased sales by 0.1%. |
82
Table of Contents
Our gross debt-to-EBIDTA remains at approximately 1.7. Having a strong balance sheet puts us in a solid financial position to fund future growth opportunities or return value to our shareholders.
For fiscal 2014, with the exception of Messrs. Felmer and Bolognini, we did not increase the base salary or target bonus opportunities of our named executive officers. Mr. Felmer received a 2.5% increase in base salary over fiscal 2013 levels to better align his base pay with the peer group market median for Chief Financial Officers. Mr. Bolognini received a 3.1% increase in base salary over fiscal 2013 levels in recognition of the level of work performed in his first year as General Counsel.
Except for Messrs. Millar and Williamson, no named executive officer received a performance-based bonus award for fiscal 2014. In connection with Mr. Millar's contributions to the divestiture of the Company's Asia Die Cut business, Mr. Jaehnert recommended and the Committee approved a one-time discretionary bonus to Mr. Millar of $25,000. The bonus, which was paid on November 1, 2013, was reflective of Mr. Millar's commitment and contributions to improving performance of the Die Cut business despite the challenging business environment after the public announcement of the divestiture, which resulted in significant employee retention and motivational challenges. Organic sales growth, income from operations and net income financial metrics, as well as individual performance funded by the achievement of net income goals, served as the performance objectives under our fiscal 2014 bonus plan. Mr. Jaehnert was not eligible for a bonus due to his separation from the Company on December 31, 2013. Since we did not achieve the threshold level of performance relative to our Workplace Safety segment or total Company objectives, Messrs. Felmer and Bolognini did not receive a bonus for fiscal 2014. Mr. Millar received a bonus equal to AUD $43,953 which was reflective of the partial achievement of the Die Cut segment income from operations goal. Mr. Williamson received a bonus equal to $31,422 which was reflective of the partial achievement of the Identification Solutions segment organic sales growth goal.
Mr. Jaehnert did not receive a long-term incentive grant in fiscal 2014. As a group and excluding Mr. Jaehnert, the 2014 grant date fair market value of all equity compensation granted to our named executive officers was 120.7% of salary. Fiscal 2014 grants were made in the form of time-based stock options and time-based restricted stock units. Stock options, which are inherently performance-based and have value only to the extent that the price of our stock increases, have been and continue to be a significant part of our named executive officers' compensation package. Restricted stock units that vest with the passage of time were granted to our named executive officers for the first time beginning in fiscal 2014 and were intended to facilitate retention while shifting the Company's use of different equity types to more closely reflect general market norms. Excluding Mr. Jaehnert, the grant date value of awards granted to all other named executive officers was 31.9% higher than in fiscal 2013, realigning target total compensation levels with the market median after a year of lower than market equity award sizes (2013). Overall, target total compensation for our named executive officers was at the median of our peer group companies for fiscal 2014.
The final vesting opportunity to achieve the earnings per share goal established by the Committee for the 2008 and 2012 awards of performance-based restricted stock was fiscal 2014. Based on the performance of the Company in fiscal 2014, the vesting criteria for these awards was not met for the named executive officers who are currently employed by the Company and who had received these awards (Messrs. Felmer, Williamson, and Millar). As a result, the awards were forfeited on September 9, 2014, the date the Audit Committee accepted the results of the fiscal year audit.
The performance-based stock options granted in fiscal 2012 contain a performance vesting requirement based on the achievement of annual diluted earnings per share growth, including a second opportunity to vest over a two or three year period if the compound annual growth rate exceeds the annual growth target. The final vesting opportunity was fiscal 2014. Based on the performance of the Company in fiscal 2014, the vesting criteria for this award were not met for the named executive officers who had received this award (Messrs. Felmer, Jaehnert, Williamson, and Millar). As a result, the awards were forfeited on September 9, 2014, the date the Audit Committee accepted the results of the fiscal year audit.
Based upon input from an external compensation consultant and the Committee's desire to provide an incentive for retention and improved Company performance, effective August 2, 2010, a grant of 100,000 shares of performance-based restricted stock was issued to Mr. Jaehnert. This grant of performance-based restricted stock included both a performance vesting requirement based upon earnings per share growth and a service vesting requirement. The earnings per share growth goal was satisfied during fiscal 2011 and as of July 31, 2013, 33,333 shares of this award were vested. In accordance with the award agreement given in connection with this grant, an additional 35,001 shares vested upon Mr. Jaehnert's retirement and the remaining 31,666 shares forfeited on December 31, 2013, the date of Mr. Jaehnert's separation from the Company.
On October 7, 2013, Mr. Felmer was awarded 5,000 shares of service-based restricted stock in recognition of his increased duties upon his appointment as Interim President and Chief Executive Officer. The shares would vest upon the earlier of the end of Mr. Felmer's service as Interim President and CEO or the Board appointment of a permanent President and CEO, with the vesting having occurred upon the appointment of Mr. Nauman as President and Chief Executive Officer on August 4, 2014. On August 4, 2014, the Committee, for retention purposes, awarded Mr. Felmer an additional 5,000 time-based restricted stock units which will
83
Table of Contents
vest upon the first anniversary of the grant date, with vesting accelerated in the event of death, disability, termination following a change of control, or upon termination of employment by the Company without cause.
Executive Compensation Practices
As part of the Company's pay for performance philosophy, the Company's compensation program includes several features that maintain alignment with shareholders:
Emphasis on Variable Compensation |
| More than 45% of the named executive officers' possible compensation is tied to Company performance which the Company believes drives shareholder value. |
|
| |
Ownership Requirements |
| During fiscal 2014, the chief executive officer was required to own at least 100,000 shares of stock in the Company and Mr. Nauman is required to own shares in the Company at a value equal to five times his base salary. All other named executive officers are required to hold at least 30,000 shares of stock. Officers must meet their ownership requirements within five years. |
|
| |
Clawback Provisions |
| Following a review and analysis of relevant governance and incentive compensation practices and policies across our compensation peer group and other public companies, the Committee instituted a recoupment policy, effective August 2013, under which incentive compensation payments and/or awards may be recouped by the Company if such payments and/or awards were based on erroneous results. If the Committee determines that an executive officer or other key executive of the Company who participates in any of the Company's incentive plans has engaged in intentional misconduct that results in a material inaccuracy in the Company's financial statements or fraudulent or other willful and deliberate conduct that is detrimental to the Company or there is a material, negative revision of a performance measure for which incentive compensation was paid or awarded, the Committee may take a variety of actions including, among others, seeking repayment of incentive compensation (cash and/or equity) that is greater than what would have been awarded if the payments/awards had been based on accurate results and the forfeiture of incentive compensation. As this policy suggests, the Committee believes that any incentive compensation should be based only on accurate and reliable financial and operational information, and, thus, any inappropriately paid incentive compensation should be returned to the Company for the benefit of shareholders. The Committee expects that the implementation of this policy will serve to enhance the Company's compensation risk mitigation efforts. While the implemented policy affords the Committee discretion regarding the application and enforcement of the policy, the Company and the Committee will conform the policy to any requirements that may be promulgated by the national stock exchanges in the future, as mandated by the Dodd-Frank Wall Street Reform and Consumer Protection Act. |
|
| |
Performance Thresholds and Caps |
| Historically, 100% of annual cash and equity incentive awards were performance-based. Beginning in fiscal 2014, 50% of the annual equity incentive award was granted in time-based restricted stock units to facilitate retention while shifting the Company's use of different equity types to more closely reflect general market norms. In addition, the annual cash incentive plan has a maximum payment cap. |
|
| |
Securities Trading Policy |
| We prohibit executive officers from trading during certain periods at the end of each quarter until after we disclose our financial and operating results. We may impose additional restricted trading periods at any time if we believe trading by executives would not be appropriate because of developments that are, or could be, material and which have not been publicly disclosed. The Insider Trading Policy also prohibits the pledging of Company stock as collateral for loans, holding Company securities in a margin account by officers, directors or employees, and the hedging of Company securities. |
|
| |
Annual Risk Reviews |
| The Company conducts an annual compensation-related risk review and presents findings and suggested risk mitigation actions to both the Audit and Management Development and Compensation Committees. |
84
Table of Contents
The Company's compensation programs also maintain alignment with shareholders by not including certain features:
No Excessive Change of Control Severance |
| In fiscal 2014, for the former chief executive officer, the maximum cash benefit was equal to 3x salary and 3x the average bonus payment received in the three years immediately prior to the date the change of control occurs. Mr. Nauman's maximum cash benefit is equal to 2x salary and 2x target bonus plus a prorated target bonus in the year in which the termination occurs. For all other named executive officers, the maximum cash benefit is equal to 2x salary and 2x the average bonus payment received in the three years immediately prior to the date the change of control occurs. In the event of a change of control, unexercised stock options become fully exercisable or, if canceled, each named executive officer shall be given cash or stock equal to the in-the-money value of the canceled stock options.
|
|
| |
No Employment Agreements |
| In fiscal 2014, the Company did not maintain any employment agreements with its executives. Mr. Nauman's Offer Letter provides that he is deemed an at-will employee, but will receive a severance benefit in the event his employment is terminated by the Company without cause or for good reason as described in the Offer Letter and summarized above. |
|
| |
No Reloads, Repricing, or Options Issued at a Discount |
| Stock options issued are not repriced, replaced, or regranted through cancellation or by lowering the option price of a previously granted option. |
Compensation Philosophy and Objectives
We seek to align the interests of our executives with those of our investors by evaluating performance on the basis of key financial measurements that we believe closely correlate to long-term shareholder value. To this end, we have structured our compensation program around the following principles:
• | Provide a competitive total compensation package targeted at the median of our compensation peers; |
• | Incentivize long-term shareholder value creation by encouraging behaviors which facilitate long-term success without undue risk taking; and |
• | Realize top-tier company performance through a merit-based, pay-for-performance culture that is aligned with our Company values. |
Determining Compensation
Management Development and Compensation Committee's Role
The Committee is responsible for monitoring and approving the compensation of the Company's named executive officers. The Committee approves compensation and benefit policies and strategies, approves corporate goals and objectives relative to the chief executive officer and other executive officer compensation, oversees the development process and reviews development plans of key executives, reviews compensation-related risk, administers our equity incentive plans including compliance with executive share ownership requirements, approves all severance policies or pay-outs, and consults with management regarding employee compensation generally. With respect to executive officers, at the beginning of each year, the Committee sets base salaries, approves the cash bonuses paid for the prior fiscal year, approves equity incentive awards for the new fiscal year and establishes the objective performance targets to be achieved for the new year.
Consultants' Role
The Committee has historically utilized the services of an executive compensation consulting firm and legal counsel to assist with the review and evaluation of compensation levels and policies on a periodic basis, as well as to provide advice with respect to new or modified compensation arrangements. In fiscal 2014, the Committee utilized the services of Meridian Compensation Partners as compensation consultants and Quarles & Brady LLP, as legal counsel, both of which were determined to be independent by the Committee.
Management's Role
To aid in determining compensation for fiscal 2014 , management obtained data regarding comparable executive officer compensation through a standard data subscription with Equliar, Inc. For fiscal 2014, Mr. Jaehnert, our former chief executive officer, used this data to make recommendations to the Committee concerning compensation for each named executive officer other than himself. In setting compensation for our named executive officers, the Committee takes into consideration these recommendations, along with the results of the Company during the fiscal year, the level of responsibility, demonstrated leadership capability, the compensation levels of executives in comparable roles from within our peer group and the results of
85
Table of Contents
annual performance reviews which, for our chief executive officer, included feedback from his direct reports and a self-appraisal. In addition, during fiscal 2014, the Committee took into consideration the recommendations of its independent compensation consultant, particularly with respect to compensation elements related to the chief executive officer transition. Our former chief executive officer did not attend the portion of any committee meeting during which the Committee discussed matters related specifically to his compensation.
Tally Sheets
The Committee reviews executive officer compensation tally sheets each year. These summaries set forth the dollar amount of all components of each named executive officer's compensation, including base salary, annual target and actual cash incentive compensation, annual equity incentive compensation, the value of outstanding equity, stock option exercises during the year, stock option gains during the year, the value of Brady's contribution to retirement plans, the value of Company-provided health and welfare benefits and social security taxes paid on the executive's behalf. Reviewing this information allows the Committee to determine an executive officer's total compensation is and how a potential change to an element of our compensation program would affect the officer's overall compensation.
Components of Compensation
Our total compensation program includes five components: base salary, annual cash incentives, long-term equity incentives, employee benefits and perquisites. Each component serves a particular purpose and, therefore, each is considered independent of the other components, although all five components combine to provide a holistic total compensation approach. We use these components of compensation to attract, retain, motivate, develop and reward our executives.
The base salary, annual cash and long-term equity incentive components are determined through a pay-for-performance approach, targeted at market median for the achievement of performance goals with an opportunity for upper quartile pay when top-tier performance is achieved. Our compensation structure is balanced by the payment of below market median compensation to our named executive officers when actual fiscal results do not meet or exceed expected fiscal results, such as in fiscal years 2013 and 2014. The following table describes the purpose of each performance-based component and how that component is related to our pay-for-performance approach:
86
Table of Contents
|
|
|
|
|
Compensation Component |
| Purpose of Compensation Component |
| Compensation Component in Relation to Performance |
Base salary |
| A fixed level of income security used to attract and retain employees by compensating them for the primary functions and responsibilities of the position. |
| The base salary increase an employee receives depends upon the employee's individual performance, the employee's displayed skills and competencies and market competitiveness. |
|
|
| ||
Annual cash incentive award |
| To attract, retain, motivate and reward employees for achieving or exceeding annual performance goals at Company and platform levels. |
| Financial performance determines the actual amount of the executive's annual cash incentive award. Award amounts are "self-funded" because they are included in the financial performance results when determining actual financial performance. |
|
|
| ||
Annual equity incentive award: Time-based stock options and time-based restricted stock units |
| To attract, retain, motivate and reward top talent for the successful creation of long-term stockholder value. |
| An assessment of executive leadership, experience and expected future contribution, combined with market competitive grant information, are used to determine the amount of equity granted to each executive. Stock options are inherently performance-based in that the stock price must increase over time to provide compensation value to the executive. Restricted stock units are units that are settled in shares of common stock upon vesting. We believe restricted stock units serve as a strong reward and retention device, while promoting the alignment of executive decisions with Company goals and shareholder interests. |
Establishing Our Total Compensation Component Levels
The Committee uses peer group data to test the reasonableness and competitiveness of several components of compensation, including base salaries, annual cash incentives, and long-term equity incentives of positions similar to those of our named executive officers. The Committee's assessment of the revenue of the companies in the fiscal 2013 peer group resulted in revisions to the peer group for fiscal 2014 to more closely align the Company with a peer group of companies with similar annual revenues. The following 19 companies were included in the fiscal 2014 total compensation analysis conducted using publicly available data sourced through Equilar, Inc: Actuant Corporation; Acuity Brands Inc.; A.O. Smith Corporation; Barnes Group Inc; Clarcor Inc.; Curtiss-Wright Corporation; Enpro Industries, Inc.; Esco Tehcnologies Inc.; Graco Inc; H.B. Fuller Company; Hexcel Corporation; IDEX Corporation; II-IV Inc.; Mine Safety Appliances Company; Modine Manufacturing Company; Nordson Corporation; Plexus Corp; Watts Water Technologies Inc.; and Zebra Technologies Corporation.
Based on our analysis of the fiscal 2014 peer group used for determining fiscal 2014 compensation, performed in July 2013, the base salaries of our named executive officers were generally at the median of our peers. Fiscal 2014 target total compensation of our named executive officers, inclusive of base salary, cash incentives and equity awards, was also at the median of our peer companies, although certain of the named executive officers were above and others were below such mark.
Fiscal 2014 Named Executive Officer Compensation
Base Salaries
Other than with respect to Messrs. Felmer and Bolognini, Mr. Jaehnert did not recommend and the Committee did not approve increases in base salary for the named executive officers because they were paid base salaries consistent with the median of base salaries for similar positions at our peer group companies. The Committee approved a 2.5% increase in base salary for Mr. Felmer for fiscal 2014 to better align his base salary to the market median of our peer companies. Although Mr. Bolognini's base salary is above the median of our peer companies, Mr. Jaehnert recommended and the Committee agreed to provide a 3.1% increase in base salary for Mr. Bolognini for fiscal 2014 in recognition of his leadership of the legal function during his first year with the Company.
87
Table of Contents
Named Executive Officer |
| Fiscal 2013 |
| Fiscal 2014 |
| Percentage Increase |
| |||||
Thomas J. Felmer |
| $ | 377,500 | |
| $ | 384,625 | |
| 2.5 | % |
|
Frank M. Jaehnert |
| 800,000 | |
| 800,000 | |
| - | % |
| ||
Louis T. Bolognini |
| 320,000 | |
| 327,500 | |
| 3.1 | % |
| ||
Stephen Millar (1) |
| 304,313 | |
| 325,160 | |
| - | % |
| ||
Matthew O. Williamson |
| 383,675 | |
| 383,675 | |
| - | % |
| ||
(1) | The amounts in this table for Mr. Millar, who lived and worked in Australia, were paid to him in Australian Dollars. The amounts shown in U.S. dollars in the table above were converted from Australian Dollars at the average exchange rate for fiscal 2014: 1USD = 0.9195AUD; 2013: 1USD = 0.9825AUD. The difference between fiscal 2013 and fiscal 2014 base salaries is entirely related to exchange rate fluctuation. |
The salary detail in the table above reflects the annualized 12-month salary for each executive. The salaries in the Summary Compensation Table reflect fiscal year compensation earned including three (3) months at fiscal 2013 rates and nine (9) months at fiscal 2014 rates.
Annual Cash Incentive Awards
The Company is organized and managed on a global basis with two reportable segments: Identification Solutions ("IDS") and Workplace Safety ("WPS"). The Company's Asia Die Cut business, also considered a segment for the incentive award plan, is classified as discontinued operations for financial reporting purposes. All named executive officers participate in an annual cash incentive plan, which is based on fiscal year financial results of a segment or the Company. Set forth below is a description of the fiscal 2014 financial measures:
• | Organic sales growth: Organic sales growth is measured as the increase in sales of continuing operations, excluding all acquired and divested sales and adjusted for foreign currency changes for the current year, divided by organic sales from continuing operations from the prior year. Organic sales are also known as "core sales" and "base sales." Organic sales growth is reported quarterly and annually in the Company's 10-Q and 10-K SEC filings. |
• | Segment organic sales growth: Segment organic sales growth is measured as the increase in segment sales excluding all acquired and divested sales and adjusted for foreign currency changes for the current year, divided by segment organic sales from the prior year. |
• | Income from continuing operations: Income from continuing operations is measured as sales of continuing operations less the cost of goods sold, selling expenses and research and development expenses of continuing operations, at budgeted exchange rates, for the current year. |
• | Segment income from operations: Segment income from operations is measured as segment sales less the segment's cost of goods sold, selling expenses and research and development expenses, at budgeted exchange rates, for the current year. |
• | Net income from continuing operations: Net income from continuing operations is defined as revenues from continuing operations at actual exchange rates minus expenses for the cost of doing business. Net income from continuing operations excludes certain non-routine expenses such as restructuring charges, certain tax charges, certain other non-routine charges, and income or loss from acquisitions and divestitures completed in fiscal 2014. |
• | Total Company net income: Total Company net income is defined as total Company revenues at actual exchange rates minus total company expenses for the cost of doing business. Total Company net income excludes certain non-routine expenses such as restructuring charges, certain tax charges, certain other non-routine charges, and income or loss from acquisitions and gain or loss on the sale of businesses completed in fiscal 2014. |
• | Team Goals: Funded by the achievement of net income growth, each named executive officer is evaluated by the Committee on the attainment of key performance indicators agreed by the Committee at the start of the fiscal year to be critical to the execution of the Company's strategy. |
88
Table of Contents
Messrs. Jaehnert, Felmer and Bolognini
The cash incentive payable to Messrs. Jaehnert, Felmer and Bolognini for fiscal 2014 was based on organic sales growth, income from continuing operations, net income from continuing operations, and team goals. We use organic sales growth because we believe that the long-term value of our enterprise depends on our ability to grow revenue without regard for acquisitions. We use income from continuing operations because we believe it aligns to the management of sales and expenses, and we use net income from continuing operations to focus on effectively managing our costs while growing our revenue. Funded by the achievement of our net income goals, team goals are used to assess the delivery upon key performance indicators determined to be critical to the execution of the Company's strategy.
For fiscal 2014, no bonus was payable to these named executive officers as the organic sales, income from continuing operations and net income from continuing operations thresholds were not achieved. No bonus was payable to Mr. Jaehnert given his separation from the Company effective December 31, 2013. The threshold, target, maximum and actual amounts for Messrs. Jaehnert, Felmer, and Bolognini were as follows:
Performance Measure (weighting) |
| Threshold |
| Target |
| Maximum |
| Fiscal 2014 Actual Result | |||||||
Organic Sales Growth (30%) |
| 1.4 | % |
| 4.2 | % |
| 7.8% or more | |
| 0.2 | % | |||
Income from continuing operations (30%)(millions) |
| $266.6 |
| $290.0 |
| $309.7 or more | |
| $238.9 |
| |||||
Net Income from continuing operations (20%)(millions) |
| $97.5 |
| $112.0 |
| $125.0 or more | |
| ($48.1) |
| |||||
Team Goals (20%) |
| Varies by Individual | |||||||||||||
Fiscal 2014 Bonus Award |
|
|
|
|
|
|
| Actual (% of Salary) |
| Actual ($) | |||||
T. Felmer |
| 0 | % |
| 70 | % |
| 140 | % |
| 0 | % |
| $0 | |
L. Bolognini |
| 0 | % |
| 60 | % |
| 120 | % |
| 0 | % |
| $0 | |
Messrs. Millar and Williamson
The cash incentive payable to Mr. Millar for fiscal 2014 was based on achievement of Die Cut segment organic sales growth, Die Cut segment income from operations, total Company net income and team goals. The cash incentive payable to Mr. Williamson for fiscal 2014 was based on achievement of IDS segment organic sales growth, IDS segment income from operations, net income from continuing operations and team goals. We use segment organic sales and income from operations goals because we believe they align Messrs. Millar and Williamson to the management of sales and expenses directly within their control as the President-Brady Asia Pacific and President-Die Cut, and President-Identification Solutions, respectively. Like the other named executive officers, the company-wide performance measures for Messrs. Millar and Williamson focused on driving greater overall profitability. Funded by the achievement of our net income goals, team goals are evaluated against key performance indicators determined to be critical to the execution of the Company's strategy. Mr. Millar earned a bonus for the achievement of segment income from operations, but did not meet the threshold established for a bonus payment related to segment organic sales growth. Mr. Williamson earned a bonus for the achievement of segment organic sales growth, but did not meet the threshold established for a bonus payment related to segment income from operations. In addition, the Company did not achieve the threshold levels of total Company net income or net income from continuing operations for the year; therefore, no bonus is payable for these components.
For 2014, the threshold, target, maximum and actual amounts for Mr. Millar were as follows:
Performance Measure (weighting) |
| Threshold |
| Target |
| Maximum |
| Fiscal 2014 Actual Result | |||||||
Die Cut Segment Organic Sales Growth (30%) |
| 1.5 | % |
| 5.0 | % |
| 8.5% or more | |
| (2.4 | )% | |||
Die Cut Segment IFO (30%)(millions) |
| $17.7 |
| $19.6 |
| $22.0 or more | |
| $19.4 |
| |||||
Total Company Net Income (20%)(millions) |
| $110.0 |
| $126.0 |
| $141.0 or more | |
| ($46.0) |
| |||||
Team Goals (20%) |
| Various goals per Individual | |||||||||||||
Fiscal 2014 Bonus Award |
|
|
|
|
|
|
| Actual (% of Salary) |
| Actual (AUD $) | |||||
S. Millar |
| 0 | % |
| 70 | % |
| 140 | % |
| 15 | % |
| 43,953 | |
In connection with Mr. Millar's contributions to the divestiture of the Company's Die Cut business, management recommended and the committee approved a one-time bonus to Mr. Millar of $25,000, which was paid on November 1, 2013. The bonus was reflective of Mr. Millar's commitment and contributions to improving performance of the Die Cut business despite the challenging business environment after the public announcement of the divestiture which resulted in significant
89
Table of Contents
employee retention and motivational challenges. In addition, the Committee approved within Mr. Millar's Separation Agreement signed August 1, 2014, a one-time bonus of AUD $100,000 in recognition of his efforts in connection with the completion of the divestiture of the Company's Die Cut business. These bonuses are not reflected in the above table.
For 2014, the threshold, target, maximum and actual amounts for Mr. Williamson were as follows:
Performance Measure (weighting) |
| Threshold |
| Target |
| Maximum |
| Fiscal 2014 Actual Result | |||||||
IDS Segment Organic Sales Growth (30%) |
| 2.4 | % |
| 4.2 | % |
| 7.8% or more | |
| 2.9 | % | |||
IDS Segment IFO (30%)(millions) |
| $184.0 |
| $192.5 |
| $204.8 or more | |
| $173.9 |
| |||||
Net Income from continuing operations (20%)(millions) |
| $97.5 |
| $112.0 |
| $125.0 or more | |
| ($48.1) |
| |||||
Team Goals (20%) |
| Various goals per Individual | |||||||||||||
Fiscal 2014 Bonus Award |
|
|
|
|
|
|
| Actual (% of Salary) |
| Actual ($) | |||||
M. Williamson |
| 0 | % |
| 70 | % |
| 140 | % |
| 8 | % |
| $31,422 | |
The target annual cash incentive award that would be payable to each executive officer is calculated as a percentage of the officer's eligible compensation defined as base salary in effect during the fiscal year, pro-rated to reflect base salary adjustments throughout the fiscal year.
For fiscal 2014, the Committee reviewed the impact of unusual and unforeseen events on the payout of bonuses and determined that none would be considered in the calculation of bonus payouts. In general, the Committee regularly reviews and makes decisions on the impact of unusual events on a case-by-case basis and continually evaluates compensation policies and practices in light of ongoing developments and best practices in the area of incentive compensation.
Long-Term Equity Incentive Awards
The Company has historically utilized a variety of incentive vehicles including performance-based stock options, time-based stock options, performance-based restricted shares, time-based restricted shares and time-based restricted stock units to attract, retain and motivate key employees who directly impact the long-term performance of the Company. The size and type of equity awards for executives other than the chief executive officer are determined annually by the Committee with input from the chief executive officer. With regard to the award size given to the chief executive officer, the Committee uses its discretion in combination with market competitive information obtained periodically from Equilar Inc and, for fiscal 2014 in connection with the chief executive officer transition, the recommendation of its independent compensation consultant.
For fiscal 2014, the Committee reviewed the Black-Scholes valuations of historical grants, median levels of equity awarded to similar positions at our peer companies and the estimated value of all proposed grants and then authorized fiscal 2014 awards consisting of a combination of time-based stock options and time-based restricted stock units.
Performance-based Stock Options: Although stock options are inherently performance-based in that options have no value unless the stock price increases, the Committee believes that using additional performance criteria for vesting of stock options can serve as an additional motivator for executives to further drive Company performance. Performance-based stock options granted in fiscal 2012 have vesting criteria based upon year-over-year diluted EPS growth and an additional opportunity to vest over a two- or three-year period if the compound annual growth rate exceeds the annual target. Performance-based stock options granted prior to fiscal 2012 have vesting criteria based only upon year-over-year diluted EPS growth as measured against the S&P 600. No performance-based stock options were granted in fiscal 2013 or 2014.
Time-based Stock Options: Time-based stock option grants in fiscal 2014 were reviewed and approved by the Committee on September 10, 2013, with an effective grant date of September 20, 2013. The grant price was the fair market value of the stock on the grant date, which was calculated as the average of the high and low stock price on that date. The time-based stock options generally vest one-third each year for the first three years and have a ten-year life.
Time-based Restricted Stock/Units: The Company's first grants of time-based restricted stock units were awarded to our named executive officers at the start of fiscal 2014. Time-based restricted stock unit grants for fiscal 2014 were reviewed and approved by the Committee on September 10, 2013, with an effective grant date of September 20, 2013. The grant price was the final closing price on the date of grant. The time-based restricted stock units vest one-third each year for the first three years.
Service-Based Restricted Stock: Effective October 7, 2013, Mr. Felmer was awarded 5,000 shares of service-based restricted stock in recognition of his increased duties upon his appointment as Interim President and Chief Executive Officer. The shares would vest upon the earlier of the end of Mr. Felmer's service as Interim President and CEO or the Board appointment of a
90
Table of Contents
permanent President and CEO, with the vesting having occurred upon the appointment of Mr. Nauman as President and Chief Executive Officer on August 4, 2014.
Performance-based Restricted Stock/Units: Periodically, the Company has issued restricted stock or restricted stock units to key executives as an element of their overall compensation. In January 2008, the Committee approved the issuance of performance-based restricted stock awards to six of Brady's senior executives including current named executive officers Messrs. Jaehnert, Felmer, and Williamson. A total of 210,000 restricted shares were issued and included both a performance vesting requirement (earnings per share) and a service vesting requirement (five years). In addition to the original vesting criteria, the restricted stock awards were amended effective July 20, 2011, to include an additional vesting opportunity based upon earnings per share growth for the fiscal years ending July 31, 2013 or July 31, 2014, and a service vesting requirement through July 31, 2014. The final opportunity to achieve the vesting criteria was fiscal 2014, and based on the performance of the Company in fiscal 2014, the vesting criteria for this was award was not met which caused these awards to be forfeited.
On September 21, 2012, Mr. Millar was awarded 10,000 restricted stock units with both a performance vesting requirement and a service vesting requirement (two years). This award was approved to align Mr. Millar's incentive opportunity with the earnings per share goal established for the other NEOs in 2008. The final opportunity to achieve the vesting criteria was fiscal 2014, and based on the performance of the Company in fiscal 2014, the vesting criteria for this was award was not met which caused this award to be forfeited.
Based upon input from an external compensation consultant and the Committee's desire to provide an incentive for retention and improved Company performance, effective August 2, 2010, a grant of 100,000 shares of performance-based restricted stock was issued to Mr. Jaehnert. This grant of performance-based restricted stock included both a performance vesting requirement based upon earnings per share growth and a service vesting requirement. The earnings per share growth goal was satisfied during fiscal 2011 and as of July 31, 2013, 33,333 shares of this award were vested. In accordance with the award agreement given in connection with this grant, an additional 35,001 shares vested upon Mr. Jaehnert's retirement and the remaining 31,666 shares forfeited on December 31, 2013, the date of Mr. Jaehnert's separation from the Company.
Fiscal 2014 Annual Equity Grants
Named Officers |
| Number of Time-Based Stock Options |
| Grant Date Fair Value |
| Number of Time-Based RSUs |
| Grant Date Fair Value |
| Number of Time-Based Restricted Shares |
| Grant Date Fair Value | |||
T. Felmer |
| 33,682 | |
| $325,001 |
| 10,580 | |
| $325,118 |
| 5,000 | |
| $145,050 |
F. Jaehnert |
| _ | |
| _ |
| _ | |
| _ |
| _ | |
| _ |
L. Bolognini |
| 4,848 | |
| $142,508 |
| 4,639 | |
| $144,134 |
| _ | |
| _ |
S. Millar |
| 14,327 | |
| $137,508 |
| 4,476 | |
| $139,069 |
| _ | |
| _ |
M. Williamson |
| 25,006 | |
| $240,003 |
| 7,813 | |
| $242,750 |
| _ | |
| _ |
Other Elements of Compensation
Health and Welfare Benefits: We provide subsidized health and welfare benefits which include medical, dental, life and accidental death or dismemberment insurance, disability insurance and paid time off. Executive officers are entitled to participate in our health and welfare plans on generally the same terms and conditions as other employees, subject to limitations under applicable law. In addition, the Company provides employer-paid long-term care insurance and maintains a supplemental executive disability policy for executives. The supplemental disability policy provides for Group Long Term Disability insurance (LTD) of up to 60% of pre-tax base salary and bonus, up to a monthly maximum benefit of $25,000. Brady Corporation pays the premiums for these benefits; therefore, these benefits are taxable to the executive.
Retirement Benefits: Brady employees (including named executive officers) in the United States and certain expatriate employees working for its international subsidiaries are eligible to participate in the Brady Corporation Matched 401(k) Plan (the "Matched 401(k) Plan"). In addition, named executive officers in the United States and employees at many of our United States locations are also eligible to participate in the Brady Corporation Funded Retirement Plan ("Funded Retirement Plan").
Under the Funded Retirement Plan, the Company contributes 4% of the eligible earnings of each employee covered by the Funded Retirement Plan. In addition, participants may elect to have their annual pay reduced by up to 5% and have the amount of this reduction contributed to their Matched 401(k) Plan and matched with an additional 4% contribution by the Company. Participants may also elect to have up to another 45% of their eligible earnings contributed to the Matched 401(k) Plan (without an additional matching contribution by the Company and up to the maximum allowed by the IRS). The assets of the Matched 401(k) Plan and
91
Table of Contents
Funded Retirement Plan credited to each participant are invested by the trustee of the Plans as directed by each plan participant in a variety of investment funds as permitted by the Matched 401(k) Plan and the Funded Retirement Plan.
Due to the IRS income limitations for participating in the Matched 401(k) Plan and the Funded Retirement Plan, the named executive officers are eligible to participate in the Brady Restoration Plan. The Brady Restoration Plan is a non-qualified deferred compensation plan that allows an equivalent benefit to the Matched 401(k) Plan and the Funded Retirement Plan for named executive officer income above the IRS compensation limits.
Benefits are generally payable upon the death, disability, or retirement of the participant, or upon termination of employment before retirement, although benefits may be withdrawn from the Matched 401(k) Plan and paid to the participant if required for certain emergencies. Under certain specified circumstances, the Matched 401(k) Plan allows loans to be drawn on a participant's account. The participant is immediately fully vested with respect to employee contributions; all other contributions become fully vested over a two-year period of continuous service for the Matched 401(k) Plan and after six years of continuous service for the Funded Retirement Plan.
Deferred Compensation Arrangements: During fiscal 2002, the Company adopted the Brady Corporation Executive Deferred Compensation Plan ("Executive Deferred Compensation Plan"), under which executive officers, corporate staff officers and certain key management employees of the Company are permitted to defer portions of their salary and bonus into a plan account, the value of which is measured by the fair value of the underlying investments. The assets of the Executive Deferred Compensation Plan are held in a Rabbi Trust and are invested by the trustee as directed by the participant in several investment funds as permitted by the Executive Deferred Compensation Plan. The investment funds available in the Executive Deferred Compensation Plan include Brady Corporation Class A Nonvoting Common Stock and various mutual funds that are provided in the Matched 401(k) Plan. On May 1, 2006, the plan was amended to require that deferrals into the Company's Class A Nonvoting Common Stock must remain in the Company's Class A Nonvoting Common Stock and be distributed in shares of the Company's Class A Nonvoting Common Stock.
At least one year prior to termination of employment, the executive must elect whether to receive their account balance following termination of employment in a single lump sum payment or by means of distribution under an Annual Installment Method. If the executive does not submit an election form or has not submitted one timely, then payment shall be made each year for a period of five years. The first payment must be one-tenth of the balance held; the second one-ninth; and so on, with the balance held in the Rabbi Trust reduced by each payment. Distributions of the Company Class A Nonvoting Common Stock are made in-kind; distributions of other assets are in cash.
Effective January 1, 2008, the Executive Deferred Compensation Plan was amended and restated to comply with the provisions of Section 409A of the Internal Revenue Code. Amounts deferred prior to January 1, 2005 (which were fully vested under the terms of the plan), including past and future earnings credited thereon, will remain subject to the terms in place prior to January 1, 2005.
Millar Severance Agreement: On August 1, 2014, it was announced that Mr. Millar will be departing the Company and will remain employed by the Company through September 30, 2014. On August 1, 2014, the Company entered into a written agreement with Mr. Millar in connection with the termination of his employment that provided for payment of his salary and benefits through September 30, 2014, a severance payment of AUD $299,000 to be paid in equal installments throughout the calendar year following his separation from employment on September 30, 2014 and a payment of AUD 100,000 in recognition of his work on the divestiture of the Company's Die Cut business. The agreement also contains 12-month non-competition and non-solicitation provisions, as well as standard confidentiality, waiver and non-disparagement provisions. The Company entered into the agreement with Mr. Millar in order to obtain his assistance on transition issues after the closing of the Die Cut business divestiture and for an agreement not to compete with the Company or solicit its employees, customers and vendors for a period of 12 months after the conclusion of his employment.
Perquisites: Brady provides the named executive officers with the following perquisites that are not available to other non-executive employees:
• | Annual allowance for financial and tax planning |
• | Company car |
• | Long-term care insurance |
• | Personal liability insurance |
92
Table of Contents
Stock Ownership Requirements
We believe that the interests of shareholders and executives become aligned when executives become shareholders in possession of a meaningful amount of Company stock. Furthermore, this stock ownership encourages positive performance behaviors and discourages executive officers from taking undue risk. In order to encourage our executive officers and directors to acquire and retain ownership of a significant number of shares of the Company's stock, stock ownership requirements have been established.
The Board of Directors has established the following stock ownership requirements for our named executive officers:
F. Jaehnert |
| 100,000 shares |
T. Felmer |
| 30,000 shares |
L. Bolognini |
| 30,000 shares |
S. Millar |
| 30,000 shares |
M. Williamson |
| 30,000 shares |
The stock ownership requirement for each director is 5,000 shares of Company stock. Mr. Nauman's stock ownership requirement has been set at five times his base salary.
Each executive has a period of five years to satisfy the holding requirement. All named executive officers except Messrs. Millar and Bolognini met and retained their respective ownership levels as of fiscal 2014. Mr. Millar has until fiscal year 2016 and Mr. Bolognini has until fiscal 2018 to achieve their respective ownership level. If an executive does not meet the above ownership level or certain interim levels, the Committee may direct that the executive's after-tax payout on any incentive plans will be in Class A Nonvoting Common Stock to bring the executive up to the required level, and the executive may not sell any shares, other than to cover tax withholding requirements associated with the exercise or vesting of the equity award, until such time as they meet the requirements.
The Committee reviews the actual stock ownership levels of each of the named executive officers on an annual basis to ensure the guidelines are met. For purposes of determining whether an executive meets the required ownership level, Company stock owned outright, Company stock held in the Executive Deferred Compensation Plan, Company stock owned in the Employee 401(k) Plan or pension plan and time-based restricted stock or restricted stock units are included. In addition, 20% of any vested stock options that are "in the money" are included.
Insider Trading Policy
The Company's Insider Trading Policy prohibits hedging and other monetization transactions in Company securities by officers, directors and employees. The prohibition on hedging transactions includes financial instruments such as prepaid variable forwards, equity swaps, collars and exchange funds. The Insider Trading Policy also prohibits the pledging of Company stock as collateral for loans or holding Company securities in a margin account by officers, directors or employees.
Employment and Change of Control Agreements
In fiscal 2014, the Company did not have employment agreements with our executives. The Offer Letter entered into with Mr. Nauman on August 1, 2014, provides that he is deemed an at at-will employee, but will receive a severance benefit in the event his employment is terminated without cause or for good reason as described therein.
The Board of Directors of Brady Corporation approved change of control agreements for certain executive officers of the Company, including all the named executive officers. The agreements applicable to all of the named executive officers other than Mr. Jaehnert and Mr. Nauman provide a payment of an amount equal to two times their annual base salary and two times the average bonus payment received in the three years immediately prior to the date the change of control occurs in the event of termination or resignation upon a change of control. The agreements for Messrs. Felmer, Millar and Williamson also provide for reimbursement of any excise taxes imposed and, all of the agreements provide for up to $25,000 of attorney fees to enforce the executive's rights under the agreement. Payments under the agreement will be spread over two years.
In May 2003, the Board approved a Change of Control Agreement for Mr. Jaehnert, which was subsequently amended and restated in December 2008 to comply with Internal Revenue Code Section 409A. This agreement expired upon Mr. Jaehnert's retirement on December 31, 2013. See the section entitled "Appointment of J. Michael Nauman" above for a description of Mr. Nauman's Change of Control Agreement.
93
Table of Contents
Under the terms of the 2012 Omnibus Incentive Stock Plan, in the event of (a) the merger or consolidation of the Corporation with or into another corporation or corporations in which the Corporation is not the surviving corporation, (b) the adoption of any plan for the dissolution of the Corporation, or (c) the sale or exchange of all or substantially all the assets of the Corporation for cash or for shares of stock or other securities of another corporation, all then-unexercised stock options become fully exercisable. If any stock option is canceled subsequent to the events described above, the Corporation or the corporation assuming the obligations of the Corporation, shall pay an amount of cash or stock equal to the in-the-money value of the canceled stock options.
Non-Compete/Non-Solicitation/Confidentiality
Since fiscal 2013, agreements memorializing equity awards under the Company's 2012 Omnibus Incentive Stock Plan have contained non-competition, non-solicitation and confidential information covenants applicable to the award recipients. The confidential information covenant prohibits the use, disclosure, copying or duplication of the Company's confidential information other than in the course of authorized activities conducted in the course of the recipient's employment with the Company. The other covenants prohibit the recipient, for 12 months after termination of employment with the Company, from (i) performing duties for or as a competitor of the Company which are the same or similar to those performed by the recipient in the 24 months prior to termination of employment with the Company or (ii) inducing or encouraging employees, vendors or clients of the Company to breach, modify or terminate relationships or agreements they had with the Company during the 24 month period prior to the recipient's termination of employment. See the section entitled "Appointment of J. Michael Nauman" above for a description of the additional covenants applicable to Mr. Nauman.
Compliance with Tax Regulations Regarding Executive Compensation
Section 162(m) of the Internal Revenue Code, added by the Omnibus Budget Reconciliation Act of 1993, generally disallows a tax deduction to public companies for compensation over $1 million paid to the Company's chief executive officer or the other named executive officers. Qualifying performance-based compensation will not be subject to the deduction limit if certain requirements are met. The Company's executive compensation program, as currently constructed, is not likely to generate significant nondeductible compensation in excess of these limits. The Committee will continue to review these tax regulations as they apply to the Company's executive compensation program. It is the Committee's intent to preserve the deductibility of executive compensation to the extent reasonably practicable and to the extent consistent with its other compensation objectives.
The Committee also considers it important to retain flexibility to design compensation programs, even where compensation payable under such programs may not be fully deductible, if such programs effectively recognize a full range of criteria important to the Company's success and result in a gain to the Company that would outweigh the limited negative tax effect.
Management Development and Compensation Committee Interlocks and Insider Participation
During fiscal 2014, the Board's Management Development and Compensation Committee was composed of Messrs. Balkema, Harris, and Richardson and Ms. Pungello. None of these persons has at any time been an employee of the Company or any of its subsidiaries. There are no relationships among the Company's executive officers, members of the Committee or entities whose executives serve on the Board that require disclosure under applicable SEC regulations.
Management Development and Compensation Committee Report
The Committee has reviewed and discussed the Compensation Discussion and Analysis with management; and based on the review and discussions, the Committee recommended to the Board of Directors that the Compensation Discussion and Analysis be included in the Company's annual report on Form 10-K.
Gary Balkema, Chairman
Frank Harris
Elizabeth P. Pungello
Bradley Richardson
94
Table of Contents
Compensation Policies and Practices
The Company's compensation policies for executive officers and all other employees are designed to avoid incentives to create undue risks to the Company. The Company's compensation programs are weighted towards offering long-term incentives that reward sustainable performance; do not offer significant short-term incentives that might drive high-risk investments at the expense of the long-term Company value; and are set at reasonable and sustainable levels, as determined by a review of the Company's economic position, as well as the compensation offered by comparable companies. Under the oversight of its Audit and Management Development and Compensation Committees, the Company reviewed its compensation policies, practices and procedures for all employees to evaluate and ensure that they do not foster risk taking beyond that deemed acceptable within the Company's business model. The Company believes that its compensation policies, practices and procedures do not encourage employees to take unnecessary or excessive risks that are reasonably likely to have a material adverse effect on the Company.
Summary Compensation Table
The following table sets forth compensation awarded to, earned by, or paid to the named executive officers, who served as executive officers during the fiscal year ended July 31, 2014 , for services rendered to the Company and its subsidiaries during the fiscal years ended July 31, 2014 , July 31, 2013 and July 31, 2012 .
Name and Principal Position |
| Fiscal Year |
| Salary ($) |
| Bonus ($) |
| Restricted Stock Awards and RSUs ($)(1) |
| Option Awards ($)(2) |
| Non-Equity Incentive Plan Compensation ($)(3) |
| All Other Compensation ($)(4) |
| Total ($) | |||||||||||||
T.J. Felmer |
| 2014 |
| $ | 384,397 | |
| - | |
| $ | 477,221 | |
| $ | 325,001 | |
| $ | - | |
| $ | 59,842 | |
| $ | 1,246,461 | |
Senior VP, President-Workplace Safety, Former CFO |
| 2013 |
| 377,500 | |
| - | |
| - | |
| 422,007 | |
| - | |
| 54,164 | |
| 853,671 | | ||||||
|
| 2012 |
| 375,481 | |
| - | |
| - | |
| 755,909 | |
| - | |
| 105,811 | |
| 1,237,201 | | ||||||
F.M. Jaehnert |
| 2014 |
| 360,000 | |
| - | |
| - | |
| - | |
| - | |
| 541,074 | |
| 901,074 | | ||||||
Former President, CEO, & Director (5) |
| 2013 |
| 800,000 | |
| - | |
| - | |
| 834,740 | |
| - | |
| 101,198 | |
| 1,735,938 | | ||||||
|
| 2012 |
| 800,000 | |
| - | |
| - | |
| 2,086,727 | |
| - | |
| 238,296 | |
| 3,125,023 | | ||||||
L.T. Bolognini - Senior VP-General Counsel & Secretary (6) |
| 2014 |
| 327,500 | |
| - | |
| 144,134 | |
| 142,508 | |
| - | |
| 51,649 | |
| 665,791 | | ||||||
S. Millar |
| 2014 |
| 325,160 | |
| 25,000 | |
| 139,069 | |
| 137,508 | |
| 47,799 | |
| 83,825 | |
| 758,361 | | ||||||
President-APAC, VP - Brady Corporation (7) |
| 2013 |
| 304,314 | |
| - | |
| 302,100 | |
| 278,247 | |
| - | |
| 73,508 | |
| 958,169 | | ||||||
M.O. Williamson |
| 2014 |
| 383,675 | |
| - | |
| 242,750 | |
| 240,003 | |
| 31,422 | |
| 30,694 | |
| 928,544 | | ||||||
President - IDS & VP - Brady Corporation |
| 2013 |
| 380,666 | |
| - | |
| - | |
| 319,984 | |
| - | |
| 62,067 | |
| 762,717 | | ||||||
|
| 2012 |
| 370,481 | |
| - | |
| - | |
| 662,218 | |
| 122,148 | |
| 92,492 | |
| 1,247,339 | | ||||||
(1) | Represents the grant date fair value computed in accordance with accounting guidance for equity grants made or modified in the applicable year for restricted stock awards and restricted stock units ("RSUs"). The grant date fair value is calculated based on the number of shares of Common Stock underlying the restricted stock awards and RSUs, times the average of the high and low trade prices of Brady Common Stock on the date of grant. The actual value of a restricted stock award or RSU will depend on the market value of the Company's Common Stock on the date the stock is sold. The fiscal 2014 annual grant included time-based RSUs that vest one-third each year for the first three years. Effective September 21, 2012, a grant of 10,000 shares of performance-based RSUs was issued to Mr. Millar, which included a performance vesting requirement based upon earnings per share growth at either July 31, 2013 or July 31, 2014, provided that Mr. Millar remain employed through July 31, 2014. Effective October 7, 2013, an award of 5,000 shares of service-based restricted stock was issued to Mr. Felmer at a fair value of $29.70 per share as a result of his increased responsibilities with his appointment as Interim President and Chief Executive Officer. |
(2) | Represents the grant date fair value computed in accordance with accounting guidance for equity grants made or modified in the applicable year for performance-based and time-based stock options. The assumptions used to determine the value of the awards, including the use of the Black-Scholes method of valuation by the Company, are discussed in Note 1 of the Notes to Consolidated Financial Statements of the Company contained in Item 8 of this Form 10-K, for the fiscal year ended July 31, 2014. The actual value, if any, which an option holder will realize upon the exercise of an option will depend on the excess of the market value of the Company's Common Stock over the exercise price on the date the option is exercised, which cannot be forecasted with any accuracy. |
95
Table of Contents
(3) | Reflects incentive plan compensation earned during the listed fiscal years, which was paid during the next fiscal year. |
(4) | The amounts in this column for Messrs. Jaehnert, Felmer, Bolognini, and Williamson include: matching contributions to the Company's Matched 401(k) Plan, Funded Retirement Plan and Restoration Plan, the costs of group term life insurance for each named executive officer, use of a Company car and associated expenses, the cost of long-term care insurance, the cost of personal liability insurance, the cost of disability insurance and other perquisites. The perquisites may include an annual allowance for financial and tax planning and the cost of an annual physical health exam. For Mr. Jaehnert, this column for fiscal 2014 also includes $440,000 in severance payments and payment by the Company for $10,000 of legal fees and $20,000 of outplacement service fees incurred in conjunction with his separation in addition to the above amounts. The amounts in this column for Mr. Millar include: contributions for the Brady Australia Pension Plan, vehicle allowance and associated expenses and other perquisites as listed above. |
(5) | Mr. Jaehnert's base salary did not change in fiscal 2014 from fiscal 2013. The fiscal 2014 salary of $360,000 represents the amount earned during the fiscal year through December 31, 2013, the date Mr. Jaehnert's separation from the Company. |
(6) | Fiscal 2014 is the first year during Mr. Bolognini's term as officer in which he met the criteria as a Named Executive Officer. |
(7) | The amounts in this table for Mr. Millar, who works and lives in Australia, were paid to him in Australian Dollars. The amounts shown in U.S. dollars in the table above were converted from Australian Dollars at the average exchange rate for fiscal 2014: $1 = 0.9195 AUD and 2013: $1 = 0.9825 AUD. Fiscal 2013 was the first year during Mr. Millar's term as officer in which he met the criteria as a Named Executive Officer. |
Name |
| Fiscal Year |
| Retirement Plan Contri-butions ($) |
| Group Term Life Insurance ($) |
| Company Car ($) |
| Long-term Care Insurance ($) |
| Personal Liability Insurance ($) |
| Temp/ Total Disability ($) |
| Severance ($) |
| Other ($) |
| Total ($) | |||||||||||||||||
T.J. Felmer |
| 2014 |
| $ | 30,505 | |
| $ | 1,102 | |
| $ | 20,159 | |
| $ | 4,048 | |
| $ | - | |
| $ | - | |
|
|
| $ | 4,028 | |
| $ | 59,842 | | |
|
| 2013 |
| 30,200 | |
| 791 | |
| 14,940 | |
| 3,737 | |
| - | |
| - | |
|
|
| 4,496 | |
| 54,164 | | |||||||||
|
| 2012 |
| 72,759 | |
| 478 | |
| 24,761 | |
| 3,737 | |
| - | |
| - | |
|
|
| 4,076 | |
| 105,811 | | |||||||||
F.M. Jaehnert (1) |
| 2014 |
| 48,862 | |
| 3,870 | |
| 1,837 | |
| 2,570 | |
| 2,654 | |
| 7,920 | |
| 440,000 | |
| 33,361 | |
| 541,074 | | ||||||||
|
| 2013 |
| 64,000 | |
| 4,028 | |
| 12,201 | |
| 5,141 | |
| 2,654 | |
| 7,920 | |
|
|
| 5,254 | |
| 101,198 | | |||||||||
|
| 2012 |
| 195,835 | |
| 2,925 | |
| 18,966 | |
| 5,141 | |
| 2,654 | |
| 7,920 | |
|
|
| 4,855 | |
| 238,296 | | |||||||||
L.T. Bolognini (2) |
| 2014 |
| 24,462 | |
| 763 | |
| 16,201 | |
| 4,274 | |
| - | |
| - | |
|
|
| 5,949 | |
| 51,649 | | |||||||||
S. Millar |
| 2014 |
| 57,620 | |
| - | |
| 26,205 | |
| - | |
| - | |
| - | |
|
|
| - | |
| 83,825 | | |||||||||
(3) |
| 2013 |
| 49,227 | |
| - | |
| 24,281 | |
| - | |
| - | |
| - | |
|
|
| - | |
| 73,508 | | |||||||||
M. O. Williamson |
| 2014 |
| 30,694 | |
|
|
|
|
|
|
| - | |
| - | |
|
|
|
|
| 30,694 | | |||||||||||||
|
| 2013 |
| 40,581 | |
| 798 | |
| 10,847 | |
| 5,501 | |
| - | |
| - | |
|
|
| 4,340 | |
| 62,067 | | |||||||||
|
| 2012 |
| 67,001 | |
| 471 | |
| 15,188 | |
| 5,501 | |
| - | |
| - | |
|
|
| 4,332 | |
| 92,493 | | |||||||||
(1) Mr. Jaehnert retired and resigned as President, Chief Executive Officer, and director effective October 7, 2013 and his employment with the Company terminated on December 31, 2013. Payment by the Company for $10,000 of legal fees and $20,000 of outplacement service fees incurred in conjunction with his separation are included under ‘Other' in the table above.
(2) Fiscal 2014 was the first year during Mr. Bolognini's term as officer in which he met the criteria as a Named Executive Officer.
(3) The amounts in this table for Mr. Millar, who works and lives in Australia, were paid to him in Australian Dollars. The amounts shown in U.S. dollars in the table above were converted from Australian Dollars at the average exchange rate for fiscal 2014: $1 = 0.9195AUD and 2013: $1 = 0.9825 AUD. Fiscal 2013 is the first year during Mr. Millar's term as officer in which he met the criteria as a Named Executive Officer.
96
Table of Contents
Grants of Plan-Based Awards for 2014
The following table summarizes grants of plan-based awards made during fiscal 2014 to the named executive officers.
|
| Grant Date |
| Compensation Committee Approval Date |
| Estimated Future Payouts Under Non-Equity Incentive Plan Awards (1) |
| All Other Option Awards: Number of Securities Underlying Options |
| All Other Stock Awards: Number of Shares of Stock or Units |
| Exercise or Base Price of Stock or Option Awards |
| Grant Date Fair Value of Stock and Option Awards | ||||||||||||||||||
Name |
|
|
| Threshold ($) |
| Target ($) |
| Maximum ($) |
| (#) |
| (#) |
| (2) |
| ($) | ||||||||||||||||
T.J. Felmer |
|
|
|
|
| $ | - | |
| $ | 270,900 | |
| $ | 541,800 | |
|
|
|
|
|
|
|
| ||||||||
|
| 9/20/2013 |
| 9/10/2013 |
| - | |
| - | |
| - | |
| 33,862 | |
| 10,580 | |
| $ | 31.07 | |
| $ | 653,721 | | |||||
|
| 10/7/2013 |
| 10/6/2013 |
| - | |
| - | |
| - | |
|
|
| 5,000 | | (3) | 29.70 | |
| 148,500 | | ||||||||
F.M. Jaehnert |
| - | |
| - | |
| - | |
| - | |
| - | |
| - | |
| - | |
| - | |
| - | | |||||
L.T. Bolognini |
|
|
|
|
| - | |
| 198,000 | |
| 396,000 | |
|
|
|
|
|
|
|
| |||||||||||
|
| 9/20/2013 |
| 9/10/2013 |
| - | |
| - | |
| - | |
| 14,848 | |
| 4,639 | |
| 31.07 | |
| 286,642 | | |||||||
S. Millar |
|
|
|
|
| - | |
| 209,300 | |
| 418,600 | |
|
|
|
|
|
|
|
| |||||||||||
|
| 9/20/2013 |
| 9/10/2013 |
| - | |
| - | |
| - | |
| 14,327 | |
| 4,476 | |
| 31.07 | |
| 276,577 | | |||||||
M.O. Williamson |
|
|
|
|
| - | |
| 268,573 | |
| 537,145 | |
|
|
|
|
|
|
|
| |||||||||||
|
| 9/20/2013 |
| 9/10/2013 |
| - | |
| - | |
| - | |
| 25,006 | |
| 7,813 | |
| 31.07 | |
| 482,752 | | |||||||
(1) | At its September 2014 meeting, the Management Development and Compensation Compensation Committee approved the values of the annual cash incentive award under the Company's annual cash incentive plan. The structure of the plan is described in the Compensation Discussion and Analysis above and was set prior to the beginning of the fiscal year. Target payout levels can range from 0 to 200 percent of base salary. |
(2) | The exercise price and base price is the average of the high and low sale prices of the Company's Class A Common Stock as reported by the New York Stock Exchange on the date of the grant. The average of the high and low sale prices of the Company's Class A Common Stock as reported by the New York Stock Exchange on the grant dates of September 20, 2013 and October 7, 2013 was $31.07 and $29.70, respectively. |
(3) | Represents 5,000 shares of service-based restricted stock granted to Mr. Felmer on October 7, 2013 at a fair value of $29.70 per share as a result of his increased responsibilities with his appointment of Interim President and Chief Executive Officer. |
Outstanding Equity Awards at 2014 Fiscal Year End
|
| Option Awards |
| Stock Awards | |||||||||||||||
Name |
| Number of Securities Underlying Unexercised Options Exercisable (#) |
| Number of Securities Underlying Unexercised Options Unexercisable (#) |
| Option Exercise Price ($) |
| Option Expiration Date |
| Equity Incentive Plan Awards; Number of Unearned Shares, Units or Other Rights That Have Not Vested (#) |
| Equity Incentive Plan Awards: Market or Payout Value of Unearned Shares, Units or Other Rights That Have Not Vested ($) | |||||||
T.J. Felmer |
| 30,000 | |
|
|
| $ | 33.89 | |
| 8/1/2015 |
|
|
|
| ||||
|
| 25,000 | |
|
|
| 37.83 | |
| 11/30/2015 |
|
|
|
| |||||
|
| 25,000 | |
|
|
| 38.19 | |
| 11/30/2016 |
|
|
|
| |||||
|
| 25,000 | |
|
|
| 38.31 | |
| 12/4/2017 |
|
|
|
| |||||
|
| 25,000 | |
|
|
| 20.95 | |
| 12/4/2018 |
|
|
|
| |||||
|
| 23,334 | |
|
|
| 29.78 | |
| 8/3/2019 |
|
|
|
| |||||
|
| 35,000 | |
|
|
| 28.73 | |
| 9/25/2019 |
|
|
|
| |||||
|
| 11,667 | |
|
|
| 28.35 | |
| 8/2/2020 |
|
|
|
| |||||
|
| 40,000 | |
|
|
| 29.10 | |
| 9/24/2020 |
|
|
|
| |||||
|
|
|
| 45,000 | | (1) | 29.55 | |
| 8/1/2021 |
|
|
|
| |||||
|
| 23,334 | |
| 11,666 | | (3) | 27.00 | |
| 9/30/2021 |
|
|
|
| ||||
|
| 15,167 | |
| 30,333 | | (4) | 30.21 | |
| 9/21/2022 |
|
|
|
| ||||
97
Table of Contents
|
| - | |
| 33,862 | | (7) | 31.07 | |
| 9/20/2023 |
|
|
|
| ||||
|
|
|
|
|
|
|
|
|
| 35,000 | | (2) | $ | 915,250 | | ||||
|
|
|
|
|
|
|
|
|
| 10,580 | | (8) | 276,667 | | |||||
|
|
|
|
|
|
|
|
|
| 5,000 | | (9) | 130,750 | | |||||
F.M. Jaehnert |
| 60,000 | |
|
|
| $ | 28.84 | |
| 11/18/2014 |
|
|
|
| ||||
|
| 60,000 | |
|
|
| 33.89 | |
| 12/31/2014 |
|
|
|
| |||||
|
| 50,000 | |
|
|
| 37.83 | |
| 12/31/2014 |
|
|
|
| |||||
|
| 50,000 | |
|
|
| 38.19 | |
| 11/30/2016 |
|
|
|
| |||||
|
| 50,000 | |
|
|
| 38.31 | |
| 12/4/2017 |
|
|
|
| |||||
|
| 50,000 | |
|
|
| 20.95 | |
| 12/4/2018 |
|
|
|
| |||||
|
| 56,667 | |
|
|
| 29.78 | |
| 8/3/2019 |
|
|
|
| |||||
|
| 70,000 | |
|
|
| 28.73 | |
| 9/25/2019 |
|
|
|
| |||||
|
| 33,334 | |
|
|
| 28.35 | |
| 8/2/2020 |
|
|
|
| |||||
|
| 100,000 | |
|
|
| 29.10 | |
| 9/24/2020 |
|
|
|
| |||||
|
|
|
| 130,000 | | (1) | 29.55 | |
| 8/1/2021 |
|
|
|
| |||||
|
| 60,000 | |
| 30,000 | | (3) | 27.00 | |
| 9/30/2021 |
|
|
|
| ||||
|
| 30,000 | |
| 60,000 | | (4) | 30.21 | |
| 9/21/2022 |
|
|
|
| ||||
|
|
|
|
|
|
|
|
|
|
|
|
| |||||||
L.T. Bolognini |
| 8,334 | |
| 16,666 | | (6) | 34.64 | |
| 1/7/2023 |
|
|
|
| ||||
|
|
|
| 14,848 | | (7) | 31.07 | |
| 9/20/2023 |
|
|
|
| |||||
|
|
|
|
|
|
|
|
|
| 4,639 | | (8) | $ | 121,309.85 | | ||||
|
|
|
|
|
|
|
|
|
|
|
|
| |||||||
S. Millar |
| 5,000 | |
|
|
| 28.84 | |
| 11/18/2014 |
|
|
|
| |||||
|
| 3,500 | |
|
|
| 37.83 | |
| 11/30/2015 |
|
|
|
| |||||
|
| 5,000 | |
|
|
| 38.19 | |
| 11/30/2016 |
|
|
|
| |||||
|
| 5,000 | |
|
|
| 38.31 | |
| 12/4/2017 |
|
|
|
| |||||
|
| 10,000 | |
|
|
| 28.73 | |
| 9/25/2019 |
|
|
|
| |||||
|
| 10,000 | |
|
|
| 29.10 | |
| 9/24/2020 |
|
|
|
| |||||
|
|
|
| 40,000 | | (1) | 29.55 | |
| 8/1/2021 |
|
|
|
| |||||
|
|
|
| 10,000 | | (3) | 27.00 | |
| 9/30/2021 |
|
|
|
| |||||
|
| 10,000 | |
| 20,000 | | (4) | 30.21 | |
| 9/21/2022 |
|
|
|
| ||||
|
|
|
| 14,327 | | (7) | 31.07 | |
| 9/20/2023 |
|
|
|
| |||||
|
|
|
|
|
|
|
|
|
| 10,000 | | (5) | $ | 261,500 | | ||||
|
|
|
|
|
|
|
|
|
| 4,476 | | (8) | 117,047.4 | | |||||
M.O.Williamson |
| 30,000 | |
|
|
| 28.84 | |
| 11/18/2014 |
|
|
|
| |||||
|
| 30,000 | |
|
|
| 33.89 | |
| 8/1/2015 |
|
|
|
| |||||
|
| 25,000 | |
|
|
| 37.83 | |
| 11/30/2015 |
|
|
|
| |||||
|
| 25,000 | |
|
|
| 38.19 | |
| 11/30/2016 |
|
|
|
| |||||
|
| 25,000 | |
|
|
| 38.31 | |
| 12/4/2017 |
|
|
|
| |||||
|
| 8,334 | |
|
|
| 20.95 | |
| 12/4/2018 |
|
|
|
| |||||
|
| 23,334 | |
|
|
| 29.78 | |
| 8/3/2019 |
|
|
|
| |||||
|
| 35,000 | |
|
|
| 28.73 | |
| 9/25/2019 |
|
|
|
| |||||
|
| 10,000 | |
|
|
| 28.35 | |
| 8/2/2020 |
|
|
|
| |||||
|
| 35,000 | |
|
|
| 29.10 | |
| 9/24/2020 |
|
|
|
| |||||
|
|
|
| 40,000 | | (1) | 29.55 | |
| 8/1/2021 |
|
|
|
| |||||
|
| 20,000 | |
| 10,000 | | (3) | 27.00 | |
| 9/30/2021 |
|
|
|
| ||||
|
| 11,500 | |
| 23,000 | | (4) | 30.21 | |
| 9/21/2022 |
|
|
|
| ||||
|
|
|
| 15,629 | | (7) | 31.07 | |
| 9/20/2013 |
|
|
|
| |||||
|
|
|
|
|
|
|
|
|
| 35,000 | | (2) | $ | 915,250 | | ||||
|
|
|
|
|
|
|
|
|
| 7,813 | | (8) | 204,310 | | |||||
98
Table of Contents
(1) | The performance-based stock options granted on August 1, 2011 become exercisable in equal annual installments over a three-year period, with the vesting date being the date the Audit Committee accepts the results of the fiscal year audit confirming the achievement of annual 15 percent EPS growth. In the event the annual EPS growth goal is not achieved with respect to any fiscal year, the options may vest in full at the end of fiscal 2014 if the Corporation's Compounded Annual Growth Rate ("CAGR") for EPS over fiscal 2011 is 15 percent or more. Based on the performance of the Company in fiscal 2014, the vesting criteria for this award were not not met. As a result, the awards were forfeited on September 9, 2014, the date the Audit Committee accepted the results of the fiscal year audit. |
(2) | Effective July 20, 2011, the Management Development and Compensation Committee of the Board of Directors of the Company approved an amendment to the granting agreement under which the Company issued performance-based restricted stock on January 8, 2008. Pursuant to the amendment, the shares will vest upon meeting a financial performance vesting requirement based upon the Company's EPS growth at either July 31, 2013 or July 31, 2014, provided that the senior executives remain employed through July 31, 2014. The vesting requirement was not met at July 31, 2013. Based on the performance of the Company in fiscal 2014, the vesting criteria for this award was not met. As a result, the awards were forfeited on September 9, 2014, the date the Audit Committee accepted the results of the fiscal year audit. |
(3) | The remaining options will vest on September 30, 2014. |
(4) | One-half of the options vest on September 21, 2014 and the remaining options vest on September 21, 2015. |
(5) | On September 21, 2012, Mr. Millar was awarded 10,000 restricted stock units with both a performance vesting requirement and a service vesting requirement (two years). As of July 31, 2013, the vesting criteria for this award have not been met. Based on the performance of the Company in fiscal 2014, the vesting criteria for this award were not met. As a result, the award was forfeited on September 9, 2014, the date the Audit Committee accepted the results of the fiscal year audit. |
(6) | Mr. Bolognini was awarded 25,000 stock options on January 7, 2013, the date he joined the Company as an officer. One-half of the remaining options vest on January 7, 2015 and the remaining options vest on January 7, 2016. |
(7) | One-third of the options vest on September 20, 2014, one-third of the options vest on September 20, 2015, and one-third of the options vest on September 20, 2016. |
(8) | This award represents time-based restricted stock units granted on September 20, 2013 as part of the annual fiscal 2014 equity grant. One-third of the units vest on September 20, 2014, one-third of the units vest on September 20, 2015, and one-third of the units vest on September 20, 2016. |
(9) | Effective October 7, 2013, Mr. Felmer was awarded 5,000 shares of service-based restricted stock in recognition of his increased duties upon his appointment as Interim President and Chief Executive Officer. The shares vest upon the earlier of the end of Mr. Felmer's service as Interim President and CEO or the Board appointment of a permanent President and CEO. As the Board appointed a permanent President and CEO on August 4, 2014, the 5,000 shares vested on the same date. |
Option Exercises and Stock Vested for Fiscal 2014
The following table summarizes option exercises and the vesting of restricted stock during fiscal 2014 to the named executive officers. In connection with Mr. Jaehnert's retirement, 35,001 shares of restricted stock previously granted on August 2, 2010 vested on December 31, 2013 at a fair value of $30.93.
|
| Option Awards |
| Stock Awards | ||||||||||
Name |
| Number of Shares Acquired on Exercise (#) |
| Value Realized on Exercise ($) |
| Number of Shares Acquired on Vesting |
| Value Realized on Vesting ($) | ||||||
T.J. Felmer |
| - | |
| $ | - | |
|
|
| $ | - | | |
F.M. Jaehnert |
| 60,000 | |
| 624,402 | |
| 35,001 | |
| 1,082,581 | | ||
L.T. Bolognini |
| - | |
| - | |
| - | |
| - | | ||
S. Millar |
| 27,000 | |
| 113,074 | |
| - | |
| - | | ||
M.O. Williamson |
| 46,666 | |
| 348,094 | |
| - | |
| - | | ||
99
Table of Contents
Non-Qualified Deferred Compensation for Fiscal 2014
The following table summarizes the activity within the Executive Deferred Compensation Plan and the Brady Restoration Plan during fiscal 2014 for the named executive officers.
Name |
| Executive Contributions in Last Fiscal Year ($) |
| Registrant Contributions in Last Fiscal Year ($) |
| Aggregate Earnings in Last Fiscal Year ($) |
| Aggregate Withdrawals/ Distributions ($) |
| Aggregate Balance at Last Fiscal Year End ($) | ||||||||||
T.J. Felmer |
| $ | 4,958 | |
| $ | 9,916 | |
| $ | 266,669 | |
| $ | - | |
| $ | 2,558,351 | |
F.M. Jaehnert |
| 13,538 | |
| 37,800 | |
| (293,972 | ) |
| (252,955 | ) |
| 4,667,969 | | |||||
L.T. Bolognini |
| 2,168 | |
| 4,336 | |
| 445 | |
| - | |
| 6,950 | | |||||
S. Millar |
| - | |
| - | |
| 2 | |
| - | |
| 2,923 | | |||||
M.O. Williamson |
| 5,147 | |
| 10,294 | |
| 3,631 | |
| - | |
| 1,176,860 | | |||||
See discussion of the Company's nonqualified deferred compensation plan in the Compensation Discussion and Analysis. The executive contribution amounts reported here are derived from the salary and non-equity incentive plan compensation columns of the Summary Compensation Table. The registrant contribution amounts reported here are reported in the all other compensation columns of the Summary Compensation Table.
Potential Payments Upon Termination or Change in Control
As described in the Employment and Change of Control Agreements section of the Compensation Discussion and Analysis above, the Company has entered into change of control agreements with each of the named executive officers. The terms of the change of control agreement are triggered if, within a 24 month period beginning with the date a change of control occurs, (i) the executive's employment with the Company is involuntarily terminated other than by reason of death, disability or cause or (ii) the executive's employment with the Company is voluntarily terminated by the executive subsequent to (a) any reduction in the total of the executive's annual base salary, exclusive of fringe benefits, and the executive's target bonus in comparison with the executive's annual base salary and target bonus immediately prior to the date the change of control occurs, (b) a significant diminution in the responsibilities or authority of the executive in comparison with the executive's responsibility and authority immediately prior to the date the change of control occurs, or (c) the imposition of a requirement by the Company that the executive relocate to a principal work location more than 50 miles from the executive's principal work location immediately prior to the date the change of control occurs.
Following termination due to a change in control, executives shall be paid a multiplier of their annual base salary in effect immediately prior to the date the change of control occurs, plus a multiplier of their average bonus payment received over a three-year period prior to the date the change of control occurs. For Messrs. Felmer, Millar, and Williamson, the Company will also reimburse the executive for any excise tax incurred by the executive as a result of Section 280(g) of the Internal Revenue Code. If the payments upon termination due to change of control result in any excise tax incurred by Mr. Bolognini as a result of Section 280(g) of the Internal Revenue Code, he will be solely responsible for such excise tax. The Company will also reimburse a maximum of $25,000 of legal fees incurred by the executive in order to enforce the change of control agreement, in which the executive prevails.
The following information and tables set forth the amount of payments to each named executive officer in the event of termination of employment as a result of a change of control. See the section entitled "Jaehnert Severance Agreement" above in the Compensation Discussion and Analysis section for a description of the severance benefits paid to Mr. Jaehnert upon his resignation. No other employment agreements have been entered into between the Company and any of the named executive officers in fiscal year 2014.
Assumptions and General Principles
The following assumptions and general principles apply with respect to the tables that follow in this section.
• | The amounts shown in the tables assume that each named executive officer terminated employment on July 31, 2014 . Accordingly, the tables reflect amounts earned as of July 31, 2014 , and include estimates of amounts that would be paid to the named executive officer upon the occurrence of a change in control. The actual amounts that would be paid to a named executive officer can only be determined at the time of termination. |
• | The tables below include amounts the Company is obligated to pay the named executive officer as a result of the executed change in control agreement. The tables do not include benefits that are paid generally to all salaried employees or a broad group of salaried employees. Therefore, the named executive officers would receive benefits in addition to those set forth in the tables. |
100
Table of Contents
• | A named executive officer is entitled to receive base salary earned during his term of employment regardless of the manner in which the named executive officer's employment is terminated. As such, this amount is not shown in the tables. |
Thomas J. Felmer
The following table shows the amount payable assuming that the terms of the change of control agreement were triggered on July 31, 2014 and the named executive officer had to legally enforce the terms of the agreement.
Base Salary ($)(1) |
| Bonus ($) (2) |
| Restricted Stock Award/Unit Acceleration Gain $(3) |
| Stock Option Acceleration Gain $ (4) |
| Excise Tax Reimbursement ($) |
| Legal Fee Reimbursement ($) (5) |
| Total ($) | ||||||
774,000 |
| 348,899 | |
| 1,322,667 | |
| - | |
| 463,778 | |
| 25,000 | |
| 2,934,344 | |
(1) | Represents two times the base salary in effect at July 31, 2014 . |
(2) | Represents two times the average bonus payment received in the last three fiscal years ended July 31, 2014 , 2013 and 2012 . |
(3) | Represents the closing market price of $26.15 on 50,580 unvested restricted stock awards and RSUs that would vest due to the change in control. |
(4) | There are no unvested stock options that are in-the-money based upon the closing market price of $26.15 at July 31, 2014. |
(5) | Represents the maximum reimbursement of legal fees allowed. |
Frank M. Jaehnert
Mr. Jaehnert resigned and retired as President and Chief Executive Officer of the Company effective October 7, 2013, and remained employed by the Company until December 31, 2013, the date of separation. The Company entered into a written agreement with Mr. Jaehnert in connection with his retirement that provided for payment of his salary and benefits through December 31, 2013, and a severance payment of $800,000 to be paid in equal installments throughout the calendar year following his separation from employment on December 31, 2013. His resignation resulted in the accelerated vesting of 35,001 restricted stock awards with a grant date of August 2, 2010 on the separation date, December 31, 2013. The value of the vested restricted stock awards was $1,082,581, using a fair value of $30.93, the closing market price on the vesting date. No other vesting accelerations of unvested restricted stock or unvested stock options resulted in any payment under his separation agreement.
Louis T. Bolognini
Base Salary ($)(1) |
| Bonus ($) (2) |
| Restricted Stock Award/Unit Acceleration Gain $(3) |
| Stock Option Acceleration Gain $ (4) |
| Excise Tax Reimbursement ($) |
| Legal Fee Reimbursement ($) (5) |
| Total ($) | ||||||
660,000 |
| - | |
| 121,310 | |
| - | |
| - | |
| 25,000 | |
| 806,310 | |
(1) | Represents two times the base salary in effect at July 31, 2014 . |
(2) | Represents two times the average bonus payment received in the last three fiscal years ended July 31, 2014 , 2013 and 2012 . |
(3) | Represents the closing market price of $26.15 on 4,639 unvested RSUs that would vest due to the change in control. |
(4) | There are no unvested stock options that are in-the-money based upon the closing market price of $26.15 at July 31, 2014. |
(5) | Represents the maximum reimbursement of legal fees allowed. |
Stephen Millar
The following table shows the amount payable assuming that the terms of the change of control agreement were triggered on July 31, 2014 and the named executive officer had to legally enforce the terms of the agreement.
Base Salary ($)(1) |
| Bonus ($) (2) |
| Restricted Stock Award/Unit Acceleration Gain $(3) |
| Stock Option Acceleration Gain $ (4) |
| Excise Tax Reimbursement ($) |
| Legal Fee Reimbursement ($) (5) |
| Total ($) | ||||||
650,320 |
| 103,625 | |
| 378,547 | |
| - | |
| 184,345 | |
| 25,000 | |
| 1,341,837 | |
(1) Represents two times the base salary in effect at July 31, 2014 . As Mr. Millar works and lives in Australia, his base salary is paid to him in Australian Dollars. The amount shown in U.S. dollars was converted from Australian Dollars at the average fiscal 2014 exchange rate: $1 = 0.9195AUD.
(2) | Represents two times the average bonus payment received in the last three fiscal years ended July 31, 2014 , 2013 and 2012 . |
(3) | Represents the closing market price of $26.15 on 14,476 unvested RSUs that would vest due to the change in control. |
101
Table of Contents
(4) | There are no unvested stock options that are in-the-money based upon the closing market price of $26.15 at July 31, 2014. |
(5) | Represents the maximum reimbursement of legal fees allowed. |
Matthew O. Williamson
Base Salary ($) (1) |
| Bonus ($) (2) |
| Restricted Stock Award/Unit Acceleration Gain $(3) |
| Stock Option Acceleration Gain $ (4) |
| Excise Tax Reimbursement ($) |
| Legal Fee Reimbursement ($) (5) |
| Total ($) | ||||||
767,350 |
| 584,609 | |
| 1,119,560 | |
| - | |
| 449,268 | |
| 25,000 | |
| 2,945,787 | |
(1) | Represents two times the base salary in effect at July 31, 2014 . |
(2) | Represents two times the average bonus payment received in the last three fiscal years ended July 31, 2014 , 2013 and 2012 . |
(3) | Represents the closing market price of $26.15 on 42,813 unvested restricted stock awards and RSUs that would vest due to the change in control. |
(4) | There are no unvested stock options that are in-the-money based upon the closing market price of $26.15 at July 31, 2014. |
(5) | Represents the maximum reimbursement of legal fees allowed. |
Potential Payments Upon Termination Due to Death or Disability
In the event of termination due to death or disability, all unexercised, unexpired stock options would immediately vest and all restricted stock awards would immediately become unrestricted and fully vested. The following table shows the amount payable to the named executive officers should this event occur on July 31, 2014 .
Name |
| Unvested Shares of Restricted Stock/RSUs as of July 31, 2014 |
| Restricted Stock/RSUs Award Acceleration Gain $ (1) |
| Unvested Stock Options In-the Money as of July 31, 2014 |
| Stock Option Acceleration Gain $ (2) | ||||
T.J. Felmer |
| 50,580 | |
| 1,322,667 | |
| - | |
| - | |
F.M. Jaehnert |
| - | |
| - | |
| - | |
| - | |
L.T. Bolognini |
| 4,639 | |
| 121,310 | |
| - | |
| - | |
S. Millar |
| 14,476 | |
| 378,547 | |
| - | |
| - | |
M.O. Williamson |
| 42,813 | |
| 1,119,560 | |
| - | |
| - | |
(1) | Represents the closing market price of $26.15 on unvested awards that would vest due to death or disability. |
(2) | There are no unvested stock options that are in-the-money based upon the closing market price of $26.15 at July 31, 2014. |
Compensation of Directors
To ensure competitive compensation for the Directors, surveys prepared by various consulting firms and the National Association of Corporate Directors are reviewed by the Corporate Governance Committee and the Management Development and Compensation Committee in making recommendations to the Board of Directors regarding Director compensation. Directors who are employees of the Company receive no additional compensation for service on the Board or on any committee of the Board. The annual cash retainer paid to non-management Directors is $45,000. The remaining components of Director compensation include $10,000 for each committee chair ($15,000 for the Audit Committee Chair) and $1,500 plus expenses for each meeting of the Board or any committee thereof, which they attend and are a member or $1,000 for single issue telephonic committee meetings of the Board. Directors also receive $1,000 for each meeting they attend of any committee of which they are not a member. In addition, non-management Directors are eligible to receive compensation of up to $1,000 per day for special assignments required by management or the Board of Directors, so long as the compensation does not impair independence and is approved as required by the Board.
In fiscal 2014, the annual fee of the Lead Independent Director was increased from $46,500 to $50,000, consistent with the evolving role of independent board leadership and the enhanced responsibilities of the position. Mr. Goodkind served as Lead Independent Director in fiscal 2014. In fiscal 2014, the Corporate Governance Committee of the Board of Directors formed a search committee ("Search Committee") comprised of Messrs. Balkema, Goodkind and Richardson and Ms. Pungello, to lead the search process for hiring a permanent CEO. In February 2014, the Board, acting through Ms. Gioia and Messrs. Allender and
102
Table of Contents
Harris, all of whom were disinterested, authorized compensation of $1,000 per day for each day worked by Search Committee members on the CEO search, up to a maximum of $10,000.
Under the terms of the Brady Corporation 2012 Omnibus Incentive Stock Plan, 5,500,000 shares of the Company's Class A Common Stock have been authorized for issuance, and the Board has full and final authority to designate the non-management Directors to whom awards will be granted, the date on which awards will be granted and the number of shares of stock covered by each grant.
On September 11, 2013, the Board approved an annual stock-based compensation award of 4,250 time-based stock options (having a grant date fair value of $9.68 per share) and 1,450 unrestricted shares of Class A Common Stock (having a grant date fair value of $30.72 per share), for each non-management Director, effective September 20, 2013.
Directors are also eligible to defer portions of their fees into the Brady Corporation Director Deferred Compensation Plan ("Director Deferred Compensation Plan"), the value of which is measured by the fair value of the underlying investments. The assets of the Director Deferred Compensation Plan are held in a Rabbi Trust and are invested by the trustee as directed by the participant in several investment funds as permitted by the Director Deferred Compensation Plan. The investment funds available in the Director Deferred Compensation Plan include Brady Corporation Class A Nonvoting Common Stock and various mutual funds that are provided in the Employee 401(k) Plan.
At least one year prior to termination from the Board, the Director must elect whether to receive his/her account balance following termination in a single lump sum payment or by means of distribution under an Annual Installment Method. If the Director does not submit an election form or has not submitted one timely, then payment shall be made each year for a period of ten years. The first payment must be one-tenth of the balance held; the second one-ninth; and so on, with the balance held in the Trust reduced by each payment. Distributions of the Company Class A Nonvoting Common Stock are made in-kind; distributions of other assets are in cash.
Effective January 1, 2008, the Director Deferred Compensation Plan was amended and restated to comply with the provisions of Section 409A of the Internal Revenue Code. On May 21, 2014, the Director Deferred Compensation Plan was amended to allow participants to transfer funds from other investment funds into the Company's Class A Nonvoting Common Stock. Funds are not permitted to be transferred from the Company's Class A Nonvoting Common Stock into other investment funds until six months after the Director resigns from the Board.
Director Compensation Table - Fiscal 2014
Name |
| Fees Earned or Paid in Cash ($) |
| Option Awards ($) (1) |
| Stock Awards ($) (2) |
| Total ($) | ||||||||
Patrick W. Allender |
| $ | 103,000 | |
| $ | 41,158 | |
| $ | 44,544 | |
| $ | 188,702 | |
Gary S. Balkema |
| 117,500 | |
| 41,158 | |
| 44,544 | |
| 203,202 | | ||||
Nancy L. Gioia (3) |
| 51,750 | |
| 38,769 | |
| 42,659 | |
| 133,178 | | ||||
Conrad G. Goodkind |
| 168,000 | |
| 41,158 | |
| 44,544 | |
| 253,702 | | ||||
Frank W. Harris |
| 90,000 | |
| 41,158 | |
| 44,544 | |
| 175,702 | | ||||
Elizabeth P. Pungello |
| 93,000 | |
| 41,158 | |
| 44,544 | |
| 178,702 | | ||||
Bradley C. Richardson |
| 126,000 | |
| 41,158 | |
| 44,544 | |
| 211,702 | | ||||
(1) | Represents the grant date fair value computed in accordance with accounting guidance for equity grants made in fiscal 2014 for time-based stock options. The assumptions used to determine the value of the option awards, including the use of the Black-Scholes method of valuation by the Company, are discussed in Note 1 of the Notes to Consolidated Financial Statements of the Company contained in Item 8 of this Form 10-K for the fiscal year ended July 31, 2014 . |
The actual value, if any, which an option holder will realize upon the exercise of an option will depend on the excess of the market value of the Company's common stock over the exercise price on the date the option is exercised, which cannot be forecasted with any accuracy. Outstanding option awards at July 31, 2014 for each individual who served as a Director in fiscal 2014 include the following: Ms. Pungello, 59,550 shares; Mr. Harris, 59,550 shares; Mr. Allender, 51,550 shares; Mr. Goodkind, 51,550 shares; Mr. Richardson, 45,550 shares; Mr. Balkema, 31,150; and Ms. Gioia, 4,250.
103
Table of Contents
(2) | Represents the fair value of shares of Brady Corporation Class A Non-Voting Common Stock granted in fiscal 2014 as compensation for their services. The shares granted to the non-management directors, with the exception of Ms. Gioia, were valued at the closing market price of $30.72 on September 20, 2013, the date of grant. The shares granted to Ms. Gioia on were valued at the closing market price of $29.42 on December 4, 2013, the date of grant. |
(3) | Ms. Gioia was appointed to the Board on November 20, 2013. |
Item 12. Security Ownership of Certain Beneficial Owners and Management and Related Stockholder Matters
(a) Security Ownership of Certain Beneficial Owners
The following table sets forth the current beneficial ownership of shareholders who are known by the Company to own more than five percent (5%) of any class of the Company's voting shares on September 12, 2014. As of that date, nearly all of the voting stock of the Company was held by two trusts controlled by direct descendants of the Company's founder, William H. Brady, as follows:
Title of Class |
| Name and Address of Beneficial Owner |
| Amount of Beneficial Ownership |
| Percent of Ownership(2) | |||
Class B Common Stock |
| EBL GST Non-Exempt Stock B Trust(1) c/o Elizabeth P. Pungello 2002 S. Hawick Ct. Chapel Hill, NC 27516 |
| 1,769,304 | |
| 50 | % | |
|
| William H. Brady III Living Trust dated November 1, 2013 (3) |
| 1,769,304 | |
| 50 | % | |
|
| c/o William H. Brady III 249 Rosemont Ave. Pasadena, CA 91103 |
|
|
|
| |||
(1) | The trustee is Elizabeth P. Pungello, who has sole voting and dispositive power and who is the remainder beneficiary. Elizabeth Pungello is the great-granddaughter of William H. Brady and currently serves on the Company's Board of Directors. |
(2) | An additional 20 shares are owned by a third trust with different trustees. |
(3) | William H. Brady III is grantor of this revocable trust and shares voting and dispositive powers with respect to these shares with his co-trustee. William H. Brady III is the grandson of William H. Brady. |
104
Table of Contents
(b) Security Ownership of Management
The following table sets forth the current beneficial ownership of each class of equity securities of the Company by each Director and Named Executive Officer individually and by all Directors and Officers of the Company as a group as of August 5, 2014. Unless otherwise noted, the address for each of the listed persons is c/o Brady Corporation, 6555 West Good Hope Road, Milwaukee, Wisconsin 53223. Except as otherwise indicated, all shares are owned directly.
Title of Class |
| Name of Beneficial Owner & Nature of Beneficial Ownership |
| Amount of Beneficial Ownership(3)(4)(5) |
| Percent of Ownership | ||
Class A Common Stock |
| Elizabeth P. Pungello(1) |
| 1,293,661 | |
| 2.7 | % |
|
| Frank M. Jaehnert(2) |
| 928,062 | |
| 1.9 | % |
|
| Thomas J. Felmer |
| 344,694 | |
| 0.7 | % |
|
| Matthew O. Williamson |
| 320,365 | |
| 0.7 | % |
|
| Conrad G. Goodkind |
| 129,034 | |
| 0.3 | % |
|
| Frank W. Harris |
| 81,580 | |
| 0.2 | % |
|
| Stephen Millar |
| 74,768 | |
| 0.2 | % |
|
| Patrick W. Allender |
| 73,871 | |
| 0.2 | % |
|
| Bradley C. Richardson |
| 50,384 | |
| 0.1 | % |
|
| Gary S. Balkema |
| 30,503 | |
| 0.1 | % |
|
| Louis T. Bolognini |
| 14,831 | |
| * | |
|
| Nancy L. Gioia |
| 1,450 | |
| * | |
|
| All Officers and Directors as a Group (18 persons) |
| 3,657,911 | |
| 7.7 | % |
Class B Common Stock |
| Elizabeth P. Pungello(1) |
| 1,769,304 | |
| 50.0 | % |
* | Indicates less than one-tenth of one percent. |
(1) | Ms. Pungello's holdings of Class A Common Stock include 876,826 shares owned by a trust for which she is a trustee and has sole dispositive and voting authority . Ms. Pungello's holdings of Class B Common Stock include 1,769,304 shares owned by a trust over which she has sole dispositive and voting authority. |
(2) | Of the amount reported, Mr. Jaehnert's spouse owns 5,446 shares of Class A Common Stock directly. Mr. Jaehnert was not an Officer as of July 31, 2014, but is considered a Named Executive Officer for the fiscal year ended July 31, 2014. |
(3) | The amount shown for all officers and directors individually and as a group (18 persons) includes options to acquire a total of 1,941,462 shares of Class A Common Stock, which are currently exercisable or will be exercisable within 60 days of July 31, 2014, including the following: Ms. Pungello, 53,885 shares; Mr. Jaehnert, 700,001; Mr. Felmer, 304,957 shares; Mr. Williamson, 289,004 shares; Mr. Goodkind, 45,885 shares; Mr. Harris, 53,885 shares; Mr. Millar, 73,276 shares; Mr. Allender, 45,885 shares; Mr. Richardson, 39,885 shares; Mr. Balkema, 25,485 shares; Mr. Bolognini, 13,284 shares; Ms. Gioia, 0 shares; Mr. Curran, 143,596 shares; Ms. Johnson, 67,390 shares; Ms. Nelligan, 0 shares; Mr. Meyer, 5,536 shares; Mr. Nauman, 0 shares; and Mr. Pearce, 70,508 shares. It does not include other options for Class A Common Stock which have been granted at later dates and are not exercisable within 60 days of July 31, 2014. |
(4) | The amount shown for all officers and directors individually and as a group (18 persons) includes unvested restricted stock units to acquire 11,263 shares of Class A Common Stock, which will vest within 60 days of July 31, 2014, including the following: Mr. Jaehnert, 0 units; Mr. Felmer, 3,527 units; Mr. Williamson, 2,605 units; Mr. Millar, 1,492 units; Mr. Bolognini, 1,547 units; Mr. Curran, 950 units; Ms. Johnson, 435 units; Ms. Nelligan, 0 units; Mr. Meyer, 272 units;Mr. Nauman, 0 units; and Mr. Pearce, 435 units.. No unvested restricted stock units were held by directors at July 31, 2014. It does not include other unvested restricted stock awards or restricted stock units to acquire Class A Common Stock which have been granted at later dates and will not vest within 60 days of July 31, 2014. |
(5) | The amount shown for all officers and directors individually and as a group (18 persons) includes Class A Common Stock owned in deferred compensation plans totaling 206,333 shares of Class A Common Stock, including the following: Ms. Pungello, 2,333 shares; Mr. Jaehnert, 93,908 shares; Mr. Felmer, 11,455 shares; Mr. Williamson, 15,612 shares; Mr. Goodkind, 31,846 shares; Mr. Harris, 0 shares; Mr. Millar, 0 shares; Mr. Allender, 27,986 shares; Mr. Richardson, 10,499 shares; Mr. Balkema 3,018 shares; Mr. Bolognini, 0 shares; Ms. Gioia, 0 shares; Mr. Curran, 112 shares; Ms. Johnson, 6,292 shares; Ms. Nelligan, 0 shares; Mr. Meyer, 0 shares; Mr. Nauman, 0 shares; and Mr. Pearce, 3,272 shares. |
105
Table of Contents
(c) Changes in Control
No arrangements are known to the Company, which may, at a subsequent date, result in a change in control of the Company.
(d) Equity Compensation Plan Information
|
| As of July 31, 2014 | ||||||||
Plan Category |
| Number of securities to be issued upon exercise of outstanding options, warrants and rights (a) |
| Weighted-average exercise price of outstanding options, warrants and rights (b) |
| Number of securities remaining available for future issuance under equity compensation plans (excluding securities reflected in column (a)) (c) | ||||
Equity compensation plans approved by security holders |
| 4,389,117 | |
| $ | 30.82 | |
| 4,022,854 | |
Equity compensation plans not approved by security holders |
| None | |
| None | |
| None | | |
Total |
| 4,389,117 | |
| $ | 30.82 | |
| 4,022,854 | |
The Company's equity compensation plan allows the granting of stock options, restricted stock, and restricted stock units to various officers, directors and other employees of the Company at prices equal to fair market value at the date of grant. The Company has reserved 5,500,000 shares of Class A Nonvoting Common Stock for issuance under the Brady Corporation 2012 Omnibus Incentive Stock Plan. Generally, options will not be exercisable until one year after the date of grant, and will be exercisable thereafter, to the extent of one-third per year and have a maximum term of ten years. Generally, restricted stock units vest one-third per year for the first three years.
In August of 2009, 2010, and 2011, certain executives and key management employees were issued stock options that vest upon meeting certain financial performance conditions in addition to the vesting schedule described above. Performance-based options expire 10 years from the date of grant. All grants under the equity plans are at market price on the date of the grant.
The Company granted 5,000 three-year cliff-vested restricted shares in December 2012, with a grant price and fair value of $32.99 . The Company granted 5,000 service-based cliff-vested restricted shares in October 2013, with a grant price and fair value of $29.70 . The Company granted 103,055 time-based RSUs in fiscal 2014, with a weighted average grant price and fair value of $30.99 , of which 8,198 units were forfeited during fiscal 2014. As a result, as of July 31, 2014 , $99,857 time-based restricted shares and RSUs and 5,000 service-based restricted shares were outstanding with a weighted average grant date fair value of $31.98 and $29.70 , respectively.
The Company granted 210,000 performance-based restricted shares in fiscal 2008, with a grant price and fair value of $32.83 , and 100,000 performance-based restricted shares in August 2010, with a grant price and fair value of $28.35 . The Company granted 10,000 shares of performance-based RSUs in September 2012, with a grant price and fair value of $30.21 . Of the fiscal 2008 performance-based restricted shares granted, 55,000 shares were forfeited in fiscal 2013 and 85,000 shares were forfeited in fiscal 2014. Of the August 2010 performance-based restricted shares granted, 33,333 shares vested in fiscal 2013, 35,001 shares vested in fiscal 2014, and 31,666 shares were forfeited in fiscal 2014. As a result, as of July 31, 2014 , 80,000 performance-based restricted shares and RSUs were outstanding with a weighted average grant date fair value of $32.50 .
Item 13. Certain Relationships, Related Transactions, and Director Independence
The Company annually solicits information from its Directors in order to ensure there are no conflicts of interest. The information gathered annually is reviewed by the Company and if any transactions are not in accordance with the rules of the New York Stock Exchange or are potentially in violation of the Company's Corporate Governance Principles, the transactions are referred to the Corporate Governance Committee for approval, ratification, or other action. Further, potential affiliated party transactions are discussed at the Company's quarterly disclosure committee meetings. In addition, pursuant to its charter, the Company's Audit Committee periodically reviews reports and disclosures of insider and affiliated party transactions with the Company, if any. Furthermore, the Company's Directors are expected to be mindful of their fiduciary obligations to the Company and to report any potential conflicts to the Corporate Governance Committee for review. Based on the Company's consideration of all relevant facts and circumstances, the Corporate Governance Committee will decide whether or not to approve such transactions and will approve only those transactions that are in the best interest of the Company. Additionally, the Company has processes in place to educate executives and employees about affiliated transactions. The Company maintains an anonymous hotline by which
106
Table of Contents
employees may report potential conflicts of interest such as affiliated party transactions.
In undertaking its review of potential related party transactions, the Board considered the commercial relationships of the Company with Mr. Richardson's employer, PolyOne Corporation, and with Ms. Gioia's employer, Ford Motor Company. The commercial relationships, which involve the purchase and sale of products on customary terms, do not exceed the maximum amounts proscribed by the director independence rules of the NYSE over the past three fiscal years. The compensation paid to Mr. Richardson and Ms. Gioia by their employers is not linked in any way to the commercial relationships their employers have with the Company. After consideration of these factors, the Board concluded that Mr. Richardson and Ms. Gioia did not have a material interest in the transactions and the commercial relationships were not material to the Company. Based on these factors, including the evaluation of the commercial relationships between the Company and Mr. Richardson's and Ms. Gioia's employers, the Company has determined that it does not have material related party transactions that affect the results of operations, cash flow or financial condition. The Company has also determined that no transactions occurred in fiscal 2014, or are currently proposed, that would require disclosure under Item 404 (a) of Regulation S-K.
See Item 10 - Directors and Executive Officers of the Registrant for a discussion of Director independence.
Item 14. Principal Accounting Fees and Services
The following table presents the aggregate fees incurred for professional services by Deloitte & Touche LLP and Deloitte Tax LLP during the years ended July 31, 2014 and 2013 . Other than as set forth below, no professional services were rendered or fees billed by Deloitte & Touche LLP or Deloitte Tax LLP during the years ended July 31, 2014 and 2013 .
|
| 2014 |
| 2013 | ||||
|
| (Dollars in thousands) | ||||||
Audit, audit-related and tax compliance |
|
|
|
| ||||
Audit fees(1) |
| $ | 1,790 | |
| $ | 1,671 | |
Tax fees - compliance |
| 52 | |
| 292 | | ||
Subtotal audit, audit-related and tax compliance fees |
| 1,842 | |
| 1,963 | | ||
Non-audit related |
|
|
|
| ||||
Tax fees - planning and advice |
| 413 | |
| 464 | | ||
Other fees (2) |
| - | |
| 10 | | ||
Subtotal non-audit related fees |
| 413 | |
| 474 | | ||
Total fees |
| $ | 2,255 | |
| $ | 2,437 | |
(1) | Audit fees consist of professional services rendered for the audit of the Company's annual financial statements, attestation of management's assessment of internal control, reviews of the quarterly financial statements and statutory reporting compliance. |
(2) | All other fees relate to expatriate activities. |
|
| 2014 |
| 2013 |
Ratio of Tax Planning and Advice Fees and All Other Fees to Audit Fees, Audit-Related Fees and Tax Compliance Fees |
| .2 to 1 |
| .2 to 1 |
Pre-Approval Policy - The services performed by the Independent Registered Public Accounting Firm ("Independent Auditors") in fiscal 2014 and 2013 were pre-approved in accordance with the pre-approval policy and procedures adopted by the Audit Committee at its November 19, 2003 meeting. The policy requires the Audit Committee to pre-approve the audit and non-audit services performed by the Independent Auditors in order to assure that the provision of such services does not impair the auditor's independence. Unless a type of service to be performed by the Independent Auditors has received general pre-approval, it will require specific pre-approval by the Audit Committee. Any proposed services exceeding pre-approved cost levels will require specific pre-approval by the Audit Committee.
107
Table of Contents
PART IV
Item 15. Exhibits and Financial Statement Schedules
Item 15 (a) - The following documents are filed as part of this report:
1) & 2) Consolidated Financial Statement Schedule -
Schedule II Valuation and Qualifying Accounts
All other schedules are omitted as they are not required, or the required information is shown in the consolidated financial statements or notes thereto.
3) Exhibits - See Exhibit Index at page 109 of this Form 10-K.
108
Table of Contents
EXHIBIT INDEX
Exhibit Number | Description | |
2.1 | | Agreement and Plan of Merger, dated as of December 28, 2012, by and among Brady Corporation, BC I Merger Sub Corporation, Precision Dynamics Corporation, and Precision Dynamics Holding LLC (29) |
2.2 | | Share and Asset Purchase Agreement, dated as of February 24, 2014, by and among Brady Corporation and LTI Flexible Products, Inc. (d/b/a Boyd Corporation) (6) |
3.1 | | Restated Articles of Incorporation of Brady Corporation (1) |
3.2 | | By-laws of Brady Corporation, as amended (23) |
*10.1 | | Form of Change of Control Agreement, amended as of December 23, 2008, entered into with Thomas J. Felmer, Allan J. Klotsche, Peter C. Sephton, and Matthew O. Williamson (12) |
*10.2 | | Brady Corporation BradyGold Plan, as amended (2) |
*10.3 | | Executive Additional Compensation Plan, as amended (2) |
*10.4 | | Executive Deferred Compensation Plan, as amended (16) |
*10.5 | | Directors' Deferred Compensation Plan, as amended (25) |
*10.6 | | Forms of Non-Qualified Employee Stock Option Agreement, Director Stock Option Agreement, and Employee Performance Stock Option Agreement under 2006 Omnibus Incentive Stock Plan (10) |
*10.7 | | Brady Corporation 2004 Omnibus Incentive Stock Plan, as amended (10) |
*10.8 | | Form of Brady Corporation 2004 Nonqualified Stock Option Agreement under the 2004 Omnibus Incentive Stock Plan, as amended (13) |
10.9 | | Brady Corporation Automatic Dividend Reinvestment Plan (4) |
*10.10 | | Brady Corporation 2005 Nonqualified Plan for Non-employee Directors, as amended (3) |
*10.11 | | Forms of Nonqualified Stock Option Agreements under 2005 Non-qualified Plan for Non-employee Directors, as amended (8) |
*10.12 | | Brady Corporation 1997 Omnibus Incentive Stock Plan, as amended (10) |
*10.13 | | Brady Corporation 1997 Nonqualified Stock Option Plan for Non-Employee Directors, as amended (10) |
*10.14 | | Complete and Permanent Release and Retirement Agreement, dated as of October 6, 2013, with Frank Jaehnert(14) |
*10.15 | | Brady Corporation 2006 Omnibus Incentive Stock Plan, as amended (10) |
*10.16 | | Change of Control Agreement, amended as of May 22, 2013, entered into with Scott Hoffman (30) |
*10.17 | | Severance and Release Agreement, dated as of February 20, 2014, entered into with Scott Hoffman (25) |
*10.18 | | Form of Amendment, dated March 4, 2009, to granting agreement for performance-based stock options issued on August 2, 2004 to Frank M. Jaehnert, Thomas J. Felmer, Peter C. Sephton, Matthew O. Williamson, and Allan J. Klotsche (12) |
*10.19 | | Form of Performance-based Restricted Stock Agreement under Brady Corporation 2006 Omnibus Incentive Stock Plan (7) |
*10.20 | | Change of Control Agreement, amended as of December 23, 2008, entered into with Frank M. Jaehnert (12) |
*10.21 | | Restated Brady Corporation Restoration Plan (5) |
*10.22 | | Change of Control Agreement, dated as of February 28, 2013, entered into with Louis T. Bolognini (30) |
*10.23 | | Brady Corporation 2003 Omnibus Incentive Stock Plan, as amended (10) |
109
Table of Contents
10.24 | | Brady Note Purchase Agreement dated June 28, 2004 (11) |
10.25 | | First Supplement to Note Purchase Agreement, dated February 14, 2006 (9) |
10.26 | | Second Supplement to Note Purchase Agreement, dated March 23, 2007 (24) |
*10.27 | | Form of Change of Control Agreement, amended as of December 23, 2008, entered into with Kathleen Johnson (12) |
*10.28 | | Brady Corporation 2010 Omnibus Incentive Stock Plan, as amended (22) |
*10.29 | | Brady Corporation 2010 Nonqualified Stock Option Plan for Non-employee Directors (17) |
*10.30 | | Form of Non-Qualified Employee Stock Option Agreement and Employee Performance Stock Option Agreement under 2010 Omnibus Incentive Stock Plan (17) |
*10.31 | | Form of Director Stock Option Agreement under 2010 Nonqualified Stock Option Plan for Non-employee Directors (17) |
*10.32 | | Form of Amendment, dated February 17, 2010, to granting agreement for performance-based stock options issued on August 1, 2005 to Frank M. Jaehnert, Thomas J. Felmer, Peter C. Sephton, Matthew O. Williamson and Allan J. Klotsche (18) |
10.33 | | Brady Note Purchase Agreement dated May 13, 2010 (19) |
*10.34 | | Performance-based Restricted Stock Agreement with Frank M. Jaehnert, dated August 2, 2010 (20) |
*10.35 | | Form of Amendment to January 8, 2008 Brady Corporation Performance-Based Restricted Stock Agreement, dated July 20, 2011 (21) |
*10.36 | | Brady Corporation Incentive Compensation Plan for Senior Executives (15) |
*10.37 | | Form of Fiscal 2012 Performance Stock Option under the 2010 Omnibus Incentive Stock Plan (26) |
*10.38 | | Brady Corporation 2012 Omnibus Incentive Stock Plan (26) |
*10.39 | | Form of Non-Qualified Employee Stock Option Agreement under 2012 Omnibus Incentive Stock Plan (26) |
*10.40 | | Form of Non-Qualified Employee Performance Stock Option Agreement under 2012 Omnibus Incentive Stock Plan (26) |
*10.41 | | Form of Director Stock Option Agreement under 2012 Omnibus Incentive Stock Plan (26) |
*10.42 | | Change of Control Agreement, dated November 21, 2011, entered into with Stephen Millar (27) |
10.43 | | Revolving Credit Agreement, dated as of February 1, 2012 (28) |
*10.44 | | Form of Fiscal 2013 Non-Qualified Employee Stock Option Agreement under 2012 Omnibus Incentive Stock Plan (31) |
*10.45 | | Form of Fiscal 2013 Director Stock Option Agreement under 2012 Omnibus Incentive Stock Plan (31) |
*10.46 | | Performance-Based Restricted Stock Unit Agreement with Stephen Millar, dated September 21, 2012 (31) |
*10.47 | | Severance Agreement, dated as of March 25, 2013, entered into with Peter Sephton (30) |
*10.48 | | Form of Fiscal 2014 Non-Qualified Employee Stock Option Agreement under 2012 Omnibus Incentive Stock Plan (32) |
*10.49 | | Form of Fiscal 2014 Director Stock Option Agreement under 2012 Omnibus Incentive Stock Plan (32) |
*10.50 | | Form of Fiscal 2014 Restricted Stock Unit Agreement under 2012 Omnibus Incentive Stock Plan (32) |
*10.51 | | Deed of Release, dated as of August 1, 2014, with Stephen Millar (33) |
*10.52 | | Separation Agreement, dated as of November 20, 2013, with Allan J. Klotsche (34) |
*10.53 | | Employment Offer Letter, dated as of August 1, 2014, with J. Michael Nauman (35) |
110
Table of Contents
*10.54 | | Restricted Stock Unit Agreement, dated as of August 4, 2014, with J. Michael Nauman (35) |
*10.55 | | Change of Control Agreement, dated as of August 4, 2014, with J. Michael Nauman (35) |
*10.56 | | Restricted Stock Agreement, dated as of October 7, 2013, with Thomas J. Felmer (36) |
*10.57 | | Change of Control Agreement, dated as of March 3, 2014, with Helena R. Nelligan (37) |
*10.58 | | Change of Control Agreement, dated as of March 3, 2014, with Bentley N. Curran (37) |
*10.59 | | Change of Control Agreement, dated as of March 3, 2014, with Lee E. Marks (37) |
*10.60 | | Restricted Stock Unit Agreement, dated as of August 4, 2014, with Thomas J. Felmer |
*10.61 | | Form of Fiscal 2015 Non-Qualified Employee Stock Option Agreement under 2012 Omnibus Incentive Stock Plan |
*10.62 | | Form of Fiscal 2015 Director Stock Option Agreement under 2012 Omnibus Incentive Stock Plan |
*10.63 | | Form of Fiscal 2015 Restricted Stock Unit Agreement under 2012 Omnibus Incentive Stock Plan |
21 | | Subsidiaries of Brady Corporation |
23 | | Consent of Deloitte & Touche LLP, Independent Registered Public Accounting Firm |
31.1 | | Rule 13a-14(a)/15d-14(a) Certification of J. Michael Nauman |
31.2 | | Rule 13a-14(a)/15d-14(a) Certification of Aaron J. Pearce |
32.1 | | Section 1350 Certification of J. Michael Nauman |
32.2 | | Section 1350 Certification of Aaron J. Pearce |
101 | | Interactive Data File |
|
| |
|
| |
* | Management contract or compensatory plan or arrangement |
(1) | Incorporated by reference to Registrant's Registration Statement No. 333-04155 on Form S-3 |
(2) | Incorporated by reference to Registrant's Annual Report on Form 10-K filed for the fiscal year ended July 31, 1989 |
(3) | Incorporated by reference to Registrant's Current Report on Form 8-K filed November 25, 2008 |
(4) | Incorporated by reference to Registrant's Annual Report on Form 10-K for the fiscal year ended July 31, 1992 |
(5) | Incorporated by reference to Registrant's Quarterly Report on Form 10-Q for the fiscal quarter ended January 31, 2008 |
(6) | Incorporated by reference to Registrant's Current Report on Form 8-K filed March 19, 2008 |
(7) | Incorporated by reference to Registrant's Current Report on Form 8-K filed January 9, 2008 |
(8) | Incorporated by reference to Registrant's Current Report on Form 8-K filed December 4, 2006 |
(9) | Incorporated by reference to Registrant's Current Report on Form 8-K filed February 17, 2006 |
(10) | Incorporated by reference to Registrant's Annual Report on Form 10-K for the fiscal year ended July 31, 2008 |
(11) | Incorporated by reference to Registrant's 8-K/A filed August 3, 2004 |
(12) | Incorporated by reference to Registrant's Quarterly Report on Form 10-Q for the fiscal quarter ended January 31, 2009 |
(13) | Incorporated by reference to Registrant's Annual Report on Form 10-K for the fiscal year ended July 31, 2005 |
(14) | Incorporated by reference to Registrant's Annual Report on Form 10-K for the fiscal year ended July 31, 2006 |
(15) | Incorporated by reference to Registrant's Current Report on Form 8-K filed September 2, 2011 |
(16) | Incorporated by reference to Registrant's Quarterly Report on Form 10-Q for the fiscal quarter ended April 30, 2011 |
(17) | Incorporated by reference to Registrant's Annual Report on Form 10-K for the fiscal year ended July 31, 2009 |
(18) | Incorporated by reference to Registrant's Current Report on Form 8-K filed February 23, 2010 |
(19) | Incorporated by reference to Registrant's Current Report on Form 8-K filed May 14, 2010 |
(20) | Incorporated by reference to Registrant's Current Report on Form 8-K filed August 4, 2010 |
111
Table of Contents
(21) | Incorporated by reference to Registrant's Current Report on Form 8-K/A filed July 28, 2011 |
(22) | Incorporated by reference to Registrant's Current Report on Form 8-K filed September 27, 2010 |
(23) | Incorporated by reference to Registrant's Current Report on Form 8-K filed February 16, 2012 |
(24) | Incorporated by reference to Registrant's Current Report on Form 8-K filed March 26, 2007 |
(25) | Incorporated by reference to Registrant's Current Report on Form 8-K filed September 15, 2011 |
(26) | Incorporated by reference to Registrant's Annual Report on Form 10-K for the fiscal year ended July 31, 2011 |
(27) | Incorporated by reference to Registrant's Quarterly Report on Form 10-Q for the quarter ended October 31, 2011 |
(28) | Incorporated by reference to Registrant's Current Report on Form 8-K filed February 7, 2012 |
(29) | Incorporated by reference to Registrant's Current Report on Form 8-K filed December 31, 2012 |
(30) | Incorporated by reference to Registrant's Quarterly Report on Form 10-Q for the quarter ended April 30, 2013 |
(31) | Incorporated by reference to Registrant's Annual Report on Form 10-K for the fiscal year ended July 31, 2012 |
(32) | Incorporated by reference to Registrants Annual Report of Form 10-K for the fiscal year ended July 31, 2013 |
(33) | Incorporated by reference to Registrant's Current Report on Form 8-K filed August 1, 2014 |
(34) | Incorporated by reference to Registrant's Current Report on Form 8-K filed November 21, 2013 |
(35) | Incorporated by reference to Registrant's Current Report on Form 8-K filed August 4, 2014 |
(36) | Incorporated by reference to Registrant's Quarterly Report on Form 10-Q for the quarter ended October 31, 2013 |
(37) | Incorporated by reference to Registrant's Quarterly Report on Form 10-Q for the quarter ended January 31, 2014 |
112
Table of Contents
BRADY CORPORATION AND SUBSIDIARIES
SCHEDULE II - VALUATION AND QUALIFYING ACCOUNTS
|
| Year ended July 31, | ||||||||||
Description |
| 2014 |
| 2013 |
| 2012 | ||||||
|
| (Dollars in thousands) | ||||||||||
Valuation accounts deducted in balance sheet from assets to which they apply - Accounts receivable - allowance for doubtful accounts: |
|
|
|
|
|
| ||||||
Balances at beginning of period |
| $ | 5,093 | |
| $ | 6,005 | |
| $ | 6,183 | |
Additions - Charged to expense |
| 779 | |
| 1,018 | |
| 1,593 | | |||
Due to acquired businesses |
| - | |
| 531 | |
| 159 | | |||
Reclassified to continuing operations |
| 31 | |
| - | |
| - | | |||
Deductions - Bad debts written off, net of recoveries |
| (2,834 | ) |
| (1,429 | ) |
| (1,930 | ) | |||
Deductions - Reclassified to discontinued operations |
| - | |
| (1,032 | ) |
| - | | |||
Balances at end of period |
| $ | 3,069 | |
| $ | 5,093 | |
| $ | 6,005 | |
Inventory - Reserve for slow-moving inventory: |
|
|
|
|
|
| ||||||
Balances at beginning of period |
| $ | 11,317 | |
| $ | 11,316 | |
| $ | 13,009 | |
Additions - Charged to expense |
| 3,100 | |
| 2,629 | |
| 2,200 | | |||
Due to acquired businesses |
| - | |
| 2,887 | |
| 445 | | |||
Reclassified to continuing operations |
| 461 | |
|
|
|
| |||||
Deductions - Inventory write-offs |
| (2,619 | ) |
| (1,811 | ) |
| (4,338 | ) | |||
Deductions - Reclassified to discontinued operations |
| - | |
| (3,704 | ) |
| - | | |||
Balances at end of period |
| $ | 12,259 | |
| $ | 11,317 | |
| $ | 11,316 | |
Valuation allowances against deferred tax assets: |
| | |
|
|
|
| |||||
Balances at beginning of period |
| $ | 37,142 | |
| $ | 25,847 | |
| $ | 31,844 | |
Additions during year |
| 10,182 | |
| 10,853 | |
| 2,579 | | |||
Due to acquired businesses |
| - | |
| 983 | |
| - | | |||
Deductions - Valuation allowances reversed/utilized |
| (9,915 | ) |
| (541 | ) |
| (3,226 | ) | |||
Deductions - Valuation allowances reversed/written off |
| - | |
| - | |
| (5,350 | ) | |||
Balances at end of period |
| $ | 37,409 | |
| $ | 37,142 | |
| $ | 25,847 | |
113
Table of Contents
SIGNATURES
Pursuant to the requirements of Section 13 or 15(d) of the Securities Exchange Act of 1934, the Registrant has duly caused this report to be signed on its behalf by the undersigned, thereunto duly authorized this 29th day of September 2014.
B RADY C ORPORATION | ||
By: |
| /s/ AARON J. PEARCE |
|
| Aaron J. Pearce |
|
| Senior Vice President & Chief Financial Officer |
|
| (Principal Financial Officer) |
Pursuant to the requirements of the Securities Exchange Act of 1934, this report has been signed below by the following persons on behalf of the Registrant and in the capabilities and on the dates indicated.*
Signature |
| Title |
/s/ J. MICHAEL NAUMAN |
| President and Chief Executive Officer; Director |
J. Michael Nauman |
| ( Principal Executive Officer ) |
/s/ KATHLEEN M. JOHNSON |
| Vice President and Chief Accounting Officer |
Kathleen M. Johnson |
| (Principal Accounting Officer) |
/s/ BRADLEY C. RICHARDSON |
|
|
Bradley C. Richardson |
| Director |
/s/ PATRICK W. ALLENDER |
|
|
Patrick W. Allender |
| Director |
/s/ FRANK W. HARRIS |
|
|
Frank W. Harris |
| Director |
/s/ NANCY L. GIOIA |
|
|
Nancy L. Gioia |
| Director |
/s/ CONRAD G. GOODKIND |
|
|
Conrad G. Goodkind |
| Director |
/s/ ELIZABETH P. PUNGELLO |
|
|
Elizabeth P. Pungello |
| Director |
/s/ GARY S. BALKEMA |
|
|
Gary S. Balkema |
| Director |
* | Each of the above signatures is affixed as of September 29, 2014 |
114