|
UNITED STATES
SECURITIES AND EXCHANGE COMMISSION
Washington, D.C. 20549
___________________________
FORM 10-K
___________________________
ANNUAL REPORT PURSUANT TO SECTION 13 OR 15(d) OF THE
SECURITIES EXCHANGE ACT OF 1934
For the fiscal year ended December 31, 2017
Commission File Number 1-1136
___________________________
BRISTOL-MYERS SQUIBB COMPANY
(Exact name of registrant as specified in its charter)
___________________________
Delaware |
| 22-0790350 |
(State or other jurisdiction of incorporation or organization) |
| (IRS Employer Identification No.) |
345 Park Avenue, New York, N.Y. 10154
(Address of principal executive offices)
Telephone: (212) 546-4000
Securities registered pursuant to Section 12(b) of the Act:
Title of each class |
| Name of each exchange on which registered |
Common Stock, $0.10 Par Value |
| New York Stock Exchange |
1.000% Notes due 2025 |
| New York Stock Exchange |
1.750% Notes due 2035 |
| New York Stock Exchange |
Securities registered pursuant to Section 12(g) of the Act:
Title of each class |
$2 Convertible Preferred Stock, $1 Par Value |
___________________________
Indicate by check mark if the registrant is a well-known seasoned issuer, as defined in Rule 405 of the Securities Act. Yes x No ¨
Indicate by check mark if the registrant is not required to file reports pursuant to Section 13 or Section 15(d) of the Act. Yes ¨ No x
Indicate by check mark whether the registrant (1) has filed all reports required to be filed by Section 13 or 15(d) of the Securities Exchange Act of 1934 during the preceding 12 months (or for such shorter period that the registrant was required to file such reports), and (2) has been subject to such filing requirements for the past 90 days. Yes x No ¨
Indicate by check mark whether the registrant has submitted electronically and posted on its corporate Web site, if any, every Interactive Data File required to be submitted and posted pursuant to Rule 405 of Regulation S-T (§232.405 of this chapter) during the preceding 12 months (or for such shorter period that the registrant was required to submit and post such files). Yes x No ¨
Indicate by check mark if disclosure of delinquent filers pursuant to Item 405 of Regulation S-K (§229.405 of this chapter) is not contained herein, and will not be contained, to the best of the registrant's knowledge, in definitive proxy or information statements incorporated by reference in Part III of this Form 10-K or any amendment to this Form 10-K. ¨
Indicate by check mark whether the registrant is a large accelerated filer, an accelerated filer, a non-accelerated filer or a smaller reporting company. See definitions of "large accelerated filer", "accelerated filer" and "smaller reporting company" in Rule 12b-2 of the Exchange Act.
Large accelerated filer x |
| Accelerated filer ¨ |
| Non-accelerated filer ¨ |
| Smaller reporting company ¨ |
| Emerging growth company ¨ |
If an emerging growth company, indicate by check mark if the registrant has elected not to use the extended transition period for complying with any new or revised financial accounting standards provided pursuant to Section 13(a) of the Exchange Act. ¨
Indicate by check mark if the registrant is a shell company (as defined in Rule 12b-2 of the Exchange Act). Yes ¨ No x
The aggregate market value of the 1,638,694,099 shares of voting common equity held by non-affiliates of the registrant, computed by reference to the closing price as reported on the New York Stock Exchange, as of the last business day of the registrant's most recently completed second fiscal quarter (June 30, 2017 ) was approximately $91,308,035,210. Bristol-Myers Squibb has no non-voting common equity. At February 1, 2018 , there were 1,632,582,502 shares of common stock outstanding.
DOCUMENTS INCORPORATED BY REFERENCE: Portions of the Proxy Statement for the registrant's Annual Meeting of Stockholders to be held May 1, 2018, to be filed within 120 days after the conclusion of the registrant's fiscal year ended December 31, 2017 , are incorporated by reference into Part III of this Annual Report on Form 10-K.
|
BRISTOL-MYERS SQUIBB COMPANY
INDEX TO FORM 10-K
DECEMBER 31, 2017
|
|
|
|
PART I |
|
|
|
| Item 1. | Business | 3 |
|
| Acquisitions and Divestitures | 3 |
|
| Products, Intellectual Property and Product Exclusivity | 3 |
|
| Research and Development | 8 |
|
| Alliances | 11 |
|
| Marketing, Distribution and Customers | 12 |
|
| Competition | 12 |
|
| Pricing, Price Constraints and Market Access | 13 |
|
| Government Regulation | 14 |
|
| Sources and Availability of Raw Materials | 16 |
|
| Manufacturing and Quality Assurance | 16 |
|
| Environmental Regulation | 17 |
|
| Employees | 17 |
|
| Foreign Operations | 17 |
|
| Bristol-Myers Squibb Website | 17 |
| Item 1A. | Risk Factors | 19 |
| Item 1B. | Unresolved Staff Comments | 25 |
| Item 2. | Properties | 25 |
| Item 3. | Legal Proceedings | 25 |
| Item 4. | Mine Safety Disclosures | 25 |
|
|
|
|
PART IA |
| Executive Officers of the Registrant | 26 |
|
|
|
|
PART II |
|
|
|
| Item 5. | Market for the Registrant's Common Stock and Other Stockholder Matters | 27 |
| Item 6. | Selected Financial Data | 28 |
| Item 7. | Management's Discussion and Analysis of Financial Condition and Results of Operations | 29 |
| Item 7A. | Quantitative and Qualitative Disclosures About Market Risk | 56 |
| Item 8. | Financial Statements and Supplementary Data | 57 |
|
| Consolidated Statements of Earnings and Comprehensive Income | 57 |
|
| Consolidated Balance Sheets | 58 |
|
| Consolidated Statements of Cash Flows | 59 |
|
| Notes to the Financial Statements | 60 |
| Item 9. | Changes in and Disagreements with Accountants on Accounting and Financial Disclosure | 104 |
| Item 9A. | Controls and Procedures | 104 |
| Item 9B. | Other Information | 104 |
|
|
|
|
PART III |
|
|
|
| Item 10. | Directors and Executive Officers of the Registrant | 106 |
| Item 11. | Executive Compensation | 106 |
| Item 12. | Security Ownership of Certain Beneficial Owners and Management and Related Stockholder Matters | 106 |
| Item 13. | Certain Relationships and Related Transactions | 106 |
| Item 14. | Auditor Fees | 106 |
|
|
|
|
PART IV |
|
|
|
| Item 15. | Exhibits and Financial Statement Schedule | 106 |
| Item 16. | Form 10-K Summary | 106 |
|
|
|
|
SIGNATURES | 107 | ||
SUMMARY OF ABBREVIATED TERMS | 108 | ||
EXHIBIT INDEX | 109 | ||
* Indicates brand names of products which are trademarks not owned by BMS. Specific trademark ownership information is included in the Exhibit Index.
PART I
Item 1. | BUSINESS. |
General
Bristol-Myers Squibb Company was incorporated under the laws of the State of Delaware in August 1933 under the name Bristol-Myers Company, as successor to a New York business started in 1887. In 1989, Bristol-Myers Company changed its name to Bristol-Myers Squibb Company as a result of a merger. We are engaged in the discovery, development, licensing, manufacturing, marketing, distribution and sale of biopharmaceutical products on a global basis. Refer to the Summary of Abbreviated Terms at the end of this 2017 Form 10-K for terms used throughout the document.
We operate in one segment-BioPharmaceuticals. For additional information about business segments, refer to "Item 8. Financial Statements-Note 2 . Business Segment Information."
We compete with other worldwide research-based drug companies, smaller research companies and generic drug manufacturers. Our products are sold worldwide, primarily to wholesalers, retail pharmacies, hospitals, government entities and the medical profession. We manufacture products in the U.S., Puerto Rico and in four foreign countries. Most of our revenues come from products in the following therapeutic classes: oncology; cardiovascular; immunoscience; and virology, including HIV infection.
The percentage of revenues by significant region/country were as follows:
|
| Year Ended December 31, | ||||||||||
Dollars in Millions |
| 2017 |
| 2016 |
| 2015 | ||||||
United States |
| 55 | % |
| 55 | % |
| 49 | % | |||
Europe |
| 24 | % |
| 22 | % |
| 21 | % | |||
Japan |
| 7 | % |
| 7 | % |
| 10 | % | |||
Other |
| 14 | % |
| 16 | % |
| 20 | % | |||
|
|
|
|
|
|
| ||||||
Total Revenues |
| $ | 20,776 | |
| $ | 19,427 | |
| $ | 16,560 | |
Acquisitions and Divestitures
Acquisitions in the last five years include IFM in 2017, Cormorant and Padlock in 2016, Cardioxyl and Flexus in 2015 and iPierian in 2014 and we also entered into several license and other collaboration arrangements. Divestitures in the last five years include our small molecule manufacturing operations in Swords, Ireland in 2017, certain OTC brands and investigational HIV medicines businesses in 2016, Erbitux* in North America and certain mature and other OTC brands businesses in 2015 and our diabetes business in 2014. We also out-licensed our genetically defined disease investigational compounds in 2017. These transactions continue to allow us to focus our resources behind growth opportunities which drive the greatest long-term value.
Products, Intellectual Property and Product Exclusivity
Our pharmaceutical products include chemically-synthesized or small molecule drugs, and products produced from biological processes, called "biologics." Small molecule drugs are typically administered orally, e.g., in the form of a pill or tablet, although other drug delivery mechanisms are used as well. Biologics are typically administered to patients through injections or by intravenous infusion.
Below is a product summary including approved indications. For information about our alliance arrangements for the products below, refer to "-Alliances" below and "Item 8. Financial Statements-Note 3 . Alliances."
Opdivo | Opdivo , a biological product, is a fully human monoclonal antibody that binds to the PD-1 on T and NKT cells. Opdivo has received approvals for several anti-cancer indications including bladder, blood, colon, head and neck, kidney, liver, lung, melanoma and stomach. The Opdivo + Yervoy regimen also is approved in multiple markets for the treatment of melanoma. There are several ongoing potentially registrational studies for Opdivo across other tumor types and disease areas, in monotherapy and in combination with Yervoy and various anti-cancer agents. |
Eliquis | Eliquis is an oral Factor Xa inhibitor targeted at stroke prevention in atrial fibrillation and the prevention and treatment of VTE disorders. |
3
Orencia | Orencia , a biological product, is a fusion protein with novel immunosuppressive activity targeted initially at adult patients with moderately to severely active RA and PSA who have had an inadequate response to certain currently available treatments. Orencia is also indicated for certain pediatric patients with moderately to severely active polyarticular juvenile idiopathic arthritis. |
Sprycel | Sprycel is a multi-targeted tyrosine kinase inhibitor approved for the first-line treatment of adults with Philadelphia chromosome-positive CML in chronic phase, the treatment of adults with chronic, accelerated, or myeloid or lymphoid blast phase chronic myeloid leukemia with resistance or intolerance to prior therapy, including Gleevec* (imatinib mesylate) and the treatment of children with Philadelphia chromosome-positive CML in chronic phase. |
Yervoy | Yervoy , a biological product, is a monoclonal antibody for the treatment of adults and pediatric patients with unresectable or metastatic melanoma, as well as the adjuvant treatment of patients with melanoma who have undergone complete resection. |
Empliciti | Empliciti , a biological product, is a humanized monoclonal antibody for the treatment of multiple myeloma. |
Baraclude | Baraclude is a potent and selective inhibitor of the hepatitis B virus. |
Sustiva Franchise | The Sustiva Franchise includes Sustiva , a non-nucleoside reverse transcriptase inhibitor for the treatment of HIV, as well as bulk efavirenz which is included in the combination therapy Atripla* . |
Reyataz Franchise | The Reyataz Franchise includes Reyataz, a protease inhibitor for the treatment of HIV, and combination therapy Evotaz combining Reyataz and Gilead's Tybost* . |
Hepatitis C Franchise | Daklinza (daclatasvir (DCV)) is an oral small molecule NS5A replication complex inhibitor for the treatment of HCV. |
Sunvepra (asunaprevir (ASV)) is an oral small molecule NS3 protease inhibitor for the treatment of HCV and is part of the dual regimen of DCV+ASV in Japan and China.
We own or license a number of patents in the U.S. and foreign countries primarily covering our products. We have also developed many brand names and trademarks for our products. We consider the overall protection of our patents, trademarks, licenses and other intellectual property rights to be of material value and act to protect these rights from infringement.
In the pharmaceutical industry, the majority of an innovative product's commercial value is usually realized during the period in which the product has market exclusivity. A product's market exclusivity is generally determined by two forms of intellectual property: patent rights held by the innovator company and any regulatory forms of exclusivity to which the innovative drug is entitled.
Patents are a key determinant of market exclusivity for most branded pharmaceuticals. Patents provide the innovator with the right to exclude others from practicing an invention related to the medicine. Patents may cover, among other things, the active ingredient(s), various uses of a drug product, pharmaceutical formulations, drug delivery mechanisms and processes for (or intermediates useful in) the manufacture of products. Protection for individual products extends for varying periods in accordance with the expiration dates of patents in the various countries. The protection afforded, which may also vary from country to country, depends upon the type of patent, its scope of coverage and the availability of meaningful legal remedies in the country.
Market exclusivity is also sometimes influenced by regulatory data protection exclusivity rights. Many developed countries provide certain non-patent incentives for the development of medicines. For example, in the U.S., the EU, Japan, and certain other countries, regulatory data protection exclusivity rights are offered as incentives for research on medicines for rare diseases, or orphan drugs, and on medicines useful in treating pediatric patients. These incentives can provide a market exclusivity period on a product that expires beyond the patent term.
The U.S., EU and Japan each provide regulatory data protection, a period of time after the approval of a new drug during which the regulatory agency may not rely upon the innovator's data to approve a competitor's generic copy. In certain markets where patent protection and other forms of market exclusivity may have expired, regulatory data protection can be of particular importance. However, most regulatory forms of exclusivity do not prevent a competitor from gaining regulatory approval prior to the expiration of regulatory data protection exclusivity on the basis of the competitor's own safety and efficacy data on its drug, even when that drug is identical to that marketed by the innovator. When these patent rights and other forms of exclusivity expire and generic versions of a medicine are approved and marketed, there are often substantial and rapid declines in the sales of the original innovative product. For further discussion of the impact of generic competition on our business, refer to "-Generic Competition".
Specific aspects of the law governing market exclusivity and data regulatory protection for pharmaceuticals vary from country to country. The following summarizes key exclusivity rules in markets representing significant sales:
4
United States
In the U.S., most of our key products are protected by patents with varying terms depending on the type of patent and the filing date. A significant portion of a product's patent life, however, is lost during the time it takes an innovative company to develop and obtain regulatory approval of a new drug. As compensation at least in part for the lost patent term due to regulatory review periods, the innovator may, depending on a number of factors, apply to the government to restore lost patent term by extending the expiration date of one patent up to a maximum term of five years, provided that the extension cannot cause the patent to be in effect for more than 14 years from the date of drug approval.
A company seeking to market an innovative pharmaceutical in the U.S. must submit a complete set of safety and efficacy data to the FDA. If the innovative pharmaceutical is a chemical product, the company files a NDA. If the medicine is a biological product, a BLA is filed. The type of application filed affects regulatory data protection exclusivity rights.
Chemical products
A competitor seeking to launch a generic substitute of a chemical innovative drug in the U.S. must file an aNDA with the FDA. In the aNDA, the generic manufacturer needs to demonstrate only "bioequivalence" between the generic substitute and the approved NDA drug. The aNDA relies upon the safety and efficacy data previously filed by the innovator in its NDA.
An innovator company is required to list certain of its patents covering the medicine with the FDA in what is commonly known as the Orange Book. Absent a successful patent challenge, the FDA cannot approve an aNDA until after the innovator's listed patents expire. However, after the innovator has marketed its product for four years, a generic manufacturer may file an aNDA and allege that one or more of the patents listed in the Orange Book under an innovator's NDA is either invalid or not infringed. This allegation is commonly known as a Paragraph IV certification. The innovator then must decide whether to file a patent infringement suit against the generic manufacturer. From time to time, aNDAs, including Paragraph IV certifications, are filed with respect to certain of our products. We evaluate these aNDAs on a case-by-case basis and, where warranted, file suit against the generic manufacturer to protect our patent rights.
In addition to patent protection, certain innovative pharmaceutical products can receive periods of regulatory exclusivity. A NDA that is designated as an orphan drug can receive seven years of exclusivity for the orphan indication. During this time period, neither NDAs nor aNDAs for the same drug product can be approved for the same orphan use. A company may also earn six months of additional exclusivity for a drug where specific clinical studies are conducted at the written request of the FDA to study the use of the medicine to treat pediatric patients, and submission to the FDA is made prior to the loss of basic exclusivity.
Medicines approved under a NDA can also receive several types of regulatory data protection. An innovative chemical pharmaceutical product is entitled to five years of regulatory data protection in the U.S., during which the FDA cannot approve generic substitutes. If an innovator's patent is challenged, as described above, a generic manufacturer may file its aNDA after the fourth year of the five-year regulatory data protection period. A pharmaceutical drug product that contains an active ingredient that has been previously approved in an NDA, but is approved in a new formulation, but not for the drug itself, or for a new indication on the basis of new clinical studies, may receive three years of regulatory data protection for that formulation or indication.
Biologic products
The U.S. healthcare legislation enacted in 2010 created an approval pathway for biosimilar versions of innovative biological products that did not previously exist. Prior to that time, innovative biologics had essentially unlimited regulatory exclusivity. Under the new regulatory mechanism, the FDA can approve products that are similar to (but not generic copies of) innovative biologics on the basis of less extensive data than is required by a full BLA. After an innovator has marketed its product for four years, any manufacturer may file an application for approval of a "biosimilar" version of the innovator product. However, although an application for approval of a biosimilar may be filed four years after approval of the innovator product, qualified innovative biological products will receive 12 years of regulatory exclusivity, meaning that the FDA may not approve a biosimilar version until 12 years after the innovative biological product was first approved by the FDA. The law also provides a mechanism for innovators to enforce the patents that protect innovative biological products and for biosimilar applicants to challenge the patents. Such patent litigation may begin as early as four years after the innovative biological product is first approved by the FDA.
In the U.S., the increased likelihood of generic and biosimilar challenges to innovators' intellectual property has increased the risk of loss of innovators' market exclusivity. First, generic companies have increasingly sought to challenge innovators' basic patents covering major pharmaceutical products. Second, statutory and regulatory provisions in the U.S. limit the ability of an innovator company to prevent generic and biosimilar drugs from being approved and launched while patent litigation is ongoing. As a result of all of these developments, it is not possible to predict the length of market exclusivity for a particular product with certainty based solely on the expiration of the relevant patent(s) or the current forms of regulatory exclusivity.
5
European Union
Patents on pharmaceutical products are generally enforceable in the EU and, as in the U.S., may be extended to compensate for the patent term lost during the regulatory review process. Such extensions are granted on a country-by-country basis.
The primary route we use to obtain marketing authorization of pharmaceutical products in the EU is through the "centralized procedure." This procedure is compulsory for certain pharmaceutical products, in particular those using biotechnological processes, and is also available for certain new chemical compounds and products. A company seeking to market an innovative pharmaceutical product through the centralized procedure must file a complete set of safety data and efficacy data as part of an MAA with the EMA. After the EMA evaluates the MAA, it provides a recommendation to the EC and the EC then approves or denies the MAA. It is also possible for new chemical products to obtain marketing authorization in the EU through a "mutual recognition procedure," in which an application is made to a single member state, and if the member state approves the pharmaceutical product under a national procedure, then the applicant may submit that approval to the mutual recognition procedure of some or all other member states.
After obtaining marketing authorization approval, a company must obtain pricing and reimbursement for the pharmaceutical product, which is typically subject to member state law. In certain EU countries, this process can take place simultaneously while the product is marketed but in other EU countries, this process must be completed before the company can market the new product. The pricing and reimbursement procedure can take months and sometimes years to complete.
Throughout the EU, all products for which marketing authorizations have been filed after October/November 2005 are subject to an "8+2+1" regime. Eight years after the innovator has received its first community authorization for a medicinal product, a generic company may file a marketing authorization application for that product with the health authorities. If the marketing authorization application is approved, the generic company may not commercialize the product until after either 10 or 11 years have elapsed from the initial marketing authorization granted to the innovator. The possible extension to 11 years is available if the innovator, during the first eight years of the marketing authorization, obtains an additional indication that is of significant clinical benefit in comparison with existing treatments. For products that were filed prior to October/November 2005, there is a 10-year period of data protection under the centralized procedures and a period of either six or 10 years under the mutual recognition procedure (depending on the member state).
In contrast to the U.S., patents in the EU are not listed with regulatory authorities. Generic versions of pharmaceutical products can be approved after data protection expires, regardless of whether the innovator holds patents covering its drug. Thus, it is possible that an innovator may be seeking to enforce its patents against a generic competitor that is already marketing its product. Also, the European patent system has an opposition procedure in which generic manufacturers may challenge the validity of patents covering innovator products within nine months of grant.
In general, EU law treats chemically-synthesized drugs and biologically-derived drugs the same with respect to intellectual property and data protection. In addition to the relevant legislation and annexes related to biologic medicinal products, the EMA has issued guidelines that outline the additional information to be provided for biosimilar products, also known as generic biologics, in order to review an application for marketing approval.
Japan
In Japan, medicines of new chemical entities are generally afforded eight years of data exclusivity for approved indications and dosage. Patents on pharmaceutical products are enforceable. Generic copies can receive regulatory approval after data exclusivity and patent expirations. As in the U.S., patents in Japan may be extended to compensate for the patent term lost during the regulatory review process.
In general, Japanese law treats chemically-synthesized and biologically-derived drugs the same with respect to intellectual property and market exclusivity.
Rest of the World
In countries outside of the U.S., the EU and Japan, there is a wide variety of legal systems with respect to intellectual property and market exclusivity of pharmaceuticals. Most other developed countries utilize systems similar to either the U.S. or the EU. Among developing countries, some have adopted patent laws and/or regulatory exclusivity laws, while others have not. Some developing countries have formally adopted laws in order to comply with WTO commitments, but have not taken steps to implement these laws in a meaningful way. Enforcement of WTO actions is a long process between governments, and there is no assurance of the outcome. Thus, in assessing the likely future market exclusivity of our innovative drugs in developing countries, we take into account not only formal legal rights but political and other factors as well.
6
The following chart shows our key products together with the year in which the earliest basic exclusivity loss (patent rights or data exclusivity) occurred or is currently estimated to occur in the U.S., the EU and Japan. We also sell our pharmaceutical products in other countries; however, data is not provided on a country-by-country basis because individual country revenues are not significant outside the U.S., the EU and Japan. In many instances, the basic exclusivity loss date listed below is the expiration date of the patent that claims the active ingredient of the drug or the method of using the drug for the approved indication, if there is only one approved indication. In some instances, the basic exclusivity loss date listed in the chart is the expiration date of the data exclusivity period. In situations where there is only data exclusivity without patent protection, a competitor could seek regulatory approval by submitting its own clinical study data to obtain marketing approval prior to the expiration of data exclusivity.
We estimate the market exclusivity period for each of our products for the purpose of business planning only. The length of market exclusivity for any of our products is impossible to predict with certainty because of the complex interaction between patent and regulatory forms of exclusivity and the inherent uncertainties regarding patent litigation. There can be no assurance that a particular product will enjoy market exclusivity for the full period of time that appears in the estimate or that the exclusivity will be limited to the estimate.
|
| Total Revenues by Product |
| Estimated LOE | ||||||||||||||
Dollars in Millions |
| 2017 |
| 2016 |
| 2015 |
| U.S. |
| EU |
| Japan | ||||||
Prioritized Brands |
|
|
|
|
|
|
|
|
|
|
|
| ||||||
Opdivo (nivolumab) (a) |
| $ | 4,948 | |
| $ | 3,774 | |
| $ | 942 | |
| 2027 |
| 2026 |
| 2031 |
Eliquis (apixaban) (b) |
| 4,872 | |
| 3,343 | |
| 1,860 | |
| 2026 |
| 2026 |
| 2026 | |||
Orencia (abatacept) (c) |
| 2,479 | |
| 2,265 | |
| 1,885 | |
| 2019 |
| 2017 |
| 2018 | |||
Sprycel (dasatinib) (d) |
| 2,005 | |
| 1,824 | |
| 1,620 | |
| 2020 |
| ^^ |
| 2021 | |||
Yervoy (ipilimumab) (e) |
| 1,244 | |
| 1,053 | |
| 1,126 | |
| 2025 |
| 2025 |
| 2025 | |||
Empliciti (elotuzumab) (f) |
| 231 | |
| 150 | |
| 3 | |
| 2027 |
| 2026 |
| 2024 | |||
|
|
|
|
|
|
|
|
|
|
|
|
| ||||||
Established Brands |
|
|
|
|
|
|
|
|
|
|
|
| ||||||
Baraclude (entecavir) |
| 1,052 | |
| 1,192 | |
| 1,312 | |
| 2014 |
| 2011-2016 |
| 2016 | |||
Sustiva (efavirenz) Franchise (g) |
| 729 | |
| 1,065 | |
| 1,252 | |
| 2017 |
| 2013 |
| ++ | |||
Reyataz (atazanavir sulfate) Franchise (h) |
| 698 | |
| 912 | |
| 1,139 | |
| 2017 |
| 2017-2019 |
| 2019 | |||
Hepatitis C Franchise (i) |
| 406 | |
| 1,578 | |
| 1,603 | |
| 2028 |
| 2027 |
| 2028 | |||
Note: The estimated year of basic LOE in the table above includes granted extensions such as patent term restoration (PTR) and/or six months pediatric extensions only if obtained. There may be other later-expiring patents that cover particular forms, compositions, methods of manufacturing, or methods of using the drug which may result in a favorable market position for our products, but product exclusivity cannot be predicted or assured. Regulatory data protection (RDP) may be obtained as described in more detail in the "-Products, Intellectual Property and Product Exclusivity" section. References to the EU throughout this Form 10-K include all EU member states during the year ended December 31, 2017. Basic patent applications may not have been filed in all current member states for all of the listed products. In some instances, the date of basic exclusivity loss will be different in various EU member states.
++ We do not currently market the product in the country or region indicated.
^^ | In February 2017, the EPO Board of Appeal revoked the EU composition of matter ( COM) patent. In February 2017, the EPO Board of Appeal reversed and remanded an invalidity decision to the use of dasatinib to treat CML, which the EPO's Opposition Division had revoked in October 2012. Refer to "Item 8. Financial Statements-Note 18. Legal Proceedings and Contingencies" for more information. |
(a) | Opdivo : BMS jointly owns a patent with Ono covering nivolumab as a COM that expires 2027 in the U.S. and 2026 in the EU. PTRs have been filed, and if granted, will expire in 2028 in the U.S. and 2030 in the EU. The COM patent covering nivolumab in Japan expires in 2031 including the granted PTR. |
(b) | Eliquis : The LOE above is based upon the COM patent and expires in 2026 in the U.S., EU and Japan, including the granted PTR. BMS received Paragraph IV certifications from twenty-five aNDA filers and initiated U.S. Hatch Waxman patent litigation in April 2017. BMS has settled with several aNDA filers. In EU countries where there is no granted PTR, the COM patent expires in 2022. |
(c) | Orencia : The COM patent including PTR expires in 2019 in the U.S. and 2017 in the EU. In the U.S. and EU, the method of use patents covering all indications expire in 2021. In Japan, LOE is based on RDP exclusivity, which expires in 2018. Formulation and additional patents directed to abatacept expire in 2026 and beyond. BMS is not aware of an Orencia biosimilar on the market in the U.S., EU or Japan. |
(d) | Sprycel : In the U.S., the COM patent including PTR expires in June 2020. In 2013, BMS entered into a settlement agreement with Apotex regarding a patent infringement suit covering the monohydrate form of dasatinib whereby Apotex can launch its generic dasatinib monohydrate aNDA product in September 2024, or earlier in certain circumstances. In Japan, the COM patent expires in 2021 and RDP expires in 2019. For information on EU countries, see the above Footnote ^^. |
(e) | Yervoy : In the U.S. and Japan, the LOE is based on the COM patent which expires in 2025, including the granted PTRs. In the EU, the COM patent expires in 2025 including the PTR which has been granted in most countries; however, in countries in which the PTR has not been granted, the COM patent will expire in 2020. RDP expires in 2023 in the U.S. and 2021 in the EU. |
(f) | Empliciti : LOE period in the U.S., EU and Japan is based on RDP exclusivity. PTRs have been filed in the U.S., EU and Japan and if granted, will expire in 2029. BMS has a commercialization agreement with AbbVie for Empliciti . AbbVie owns a COM patent covering elotuzumab that expires in 2026 in the U.S. and 2024 in the EU and Japan (excluding potential PTRs). For more information about our arrangement with AbbVie, refer to "-Alliances" below and "Item 8. Financial Statements-Note 3 . Alliances." |
(g) | Sustiva Franchise : Exclusivity period relates to the Sustiva brand and does not include exclusivity related to any combination therapy. In the U.S., the LOE for efavirenz occurred in December 2017. |
(h) | Reyataz : In the EU, the market exclusivity is projected to expire between 2017 and 2019. The COM patent including PTR expired in 2017 in the U.S. and expires in 2019 in the EU. |
(i) | Hepatitis C Franchise: Relates to products including daclatasvir, such as the Daklinza brand. In the U.S., the LOE is based on the COM patent expiry and if the pending PTR is granted, the expiry will be 2029. In Europe, the LOE is based on the COM patent expiry in 2027, however, the PTR, which has been granted in many countries, will expire in 2029. In Japan, the COM patent expires in 2028 including the granted PTR. |
7
Research and Development
R&D is critical to our long-term competitiveness. We concentrate our R&D efforts in the following disease areas with significant unmet medical needs: oncology, including IO, immunoscience with priorities in lupus, RA and inflammatory bowel disease, cardiovascular with priority in heart disease and fibrotic disease with priorities in lung (IPF) and liver (NASH). We also continue to analyze and may selectively pursue promising leads in other areas. In addition to discovering and developing new molecular entities, we look for ways to expand the value of existing products through new indications and formulations that can provide additional benefits to patients.
In order for a new drug to reach the market, industry practice and government regulations in the U.S., the EU and most foreign countries provide for the determination of a drug's effectiveness and safety through preclinical tests and controlled clinical evaluation. The clinical development of a potential new drug typically includes Phase I, Phase II and Phase III clinical studies that have been designed specifically to support a new drug application for a particular indication, assuming the studies are successful.
Phase I clinical studies involve a small number of healthy volunteers or patients suffering from the indicated disease to test for safety and proper dosing. Phase II clinical studies involve a larger patient population to investigate side effects, efficacy, and optimal dosage of the drug candidate. Phase III clinical studies are conducted to confirm Phase II results in a significantly larger patient population over a longer term and to provide reliable and conclusive data regarding the safety and efficacy of a drug candidate. Although regulatory approval is typically based on the results of Phase III clinical studies, there are times when approval can be granted based on data from earlier studies.
We consider our registrational studies to be our significant R&D programs. These programs may include both investigational compounds in Phases II and III development for initial indications and marketed products that are in development for additional indications or formulations. Expanding our currently marketed products, particularly Opdivo in combination with Yervoy and other agents in both first and second-line therapy with new indications, is a substantial portion of our R&D program strategy.
Drug development is time consuming, expensive and risky. The R&D process typically takes about fourteen years, with approximately two and a half years often spent in Phase III, or late-stage, development. On average, only about one in 10,000 chemical compounds discovered by pharmaceutical industry researchers proves to be both medically effective and safe enough to become an approved medicine. Drug candidates can fail at any stage of the process, and even late-stage product candidates sometimes fail to receive regulatory approval. According to the KMR Group, based on industry success rates from 2012-2016, approximately 92% of compounds that enter Phase I development fail to achieve regulatory approval. Compounds that enter Phase II development have a failure rate of approximately 80% while approximately 30% fail Phase III development.
Total R&D expenses include the costs of discovery research, preclinical development, early- and late-stage clinical development and drug formulation, as well as post-commercialization and medical support of marketed products, proportionate allocations of enterprise-wide costs and licensing and acquiring assets. R&D expenses were $6.4 billion in 2017 , $4.9 billion in 2016 and $5.9 billion in 2015 including license and asset acquisition charges of approximately $1.1 billion , $440 million and $1.7 billion in 2017, 2016 and 2015, respectively. At the end of 2017 , we employed approximately 7,700 people in R&D and related support activities, including a substantial number of physicians, scientists holding graduate or postgraduate degrees and higher-skilled technical personnel.
We manage our R&D programs on a portfolio basis, investing resources in each stage of R&D from early discovery through late-stage development. We continually evaluate our portfolio of R&D assets to ensure that there is an appropriate balance of early-stage and late-stage programs to support the future growth of the Company. Spending on our late-stage development programs represented approximately 30-45% of our annual R&D expenses in the last three years. Opdivo is the only individual investigational compound or marketed product to represent 10% or more of our R&D expenses in any of the last three years.
As part of our operating model evolution, our R&D geographic footprint will significantly transform to foster speed and innovation in the future. The transformation involves the closing of our Hopewell, New Jersey and Wallingford, Connecticut R&D sites accompanied by additional investment in the expansion and opening of others. For example, we are expanding our Lawrenceville, New Jersey and Redwood City, California sites and plan to open a new R&D facility in Cambridge, Massachusetts in 2018. We supplement our internal drug discovery and development programs with alliances and collaborative agreements which help us bring new molecular agents, capabilities and platforms into our pipeline. Management continues to emphasize leadership, innovation, productivity and quality as strategies for success in our R&D activities.
8
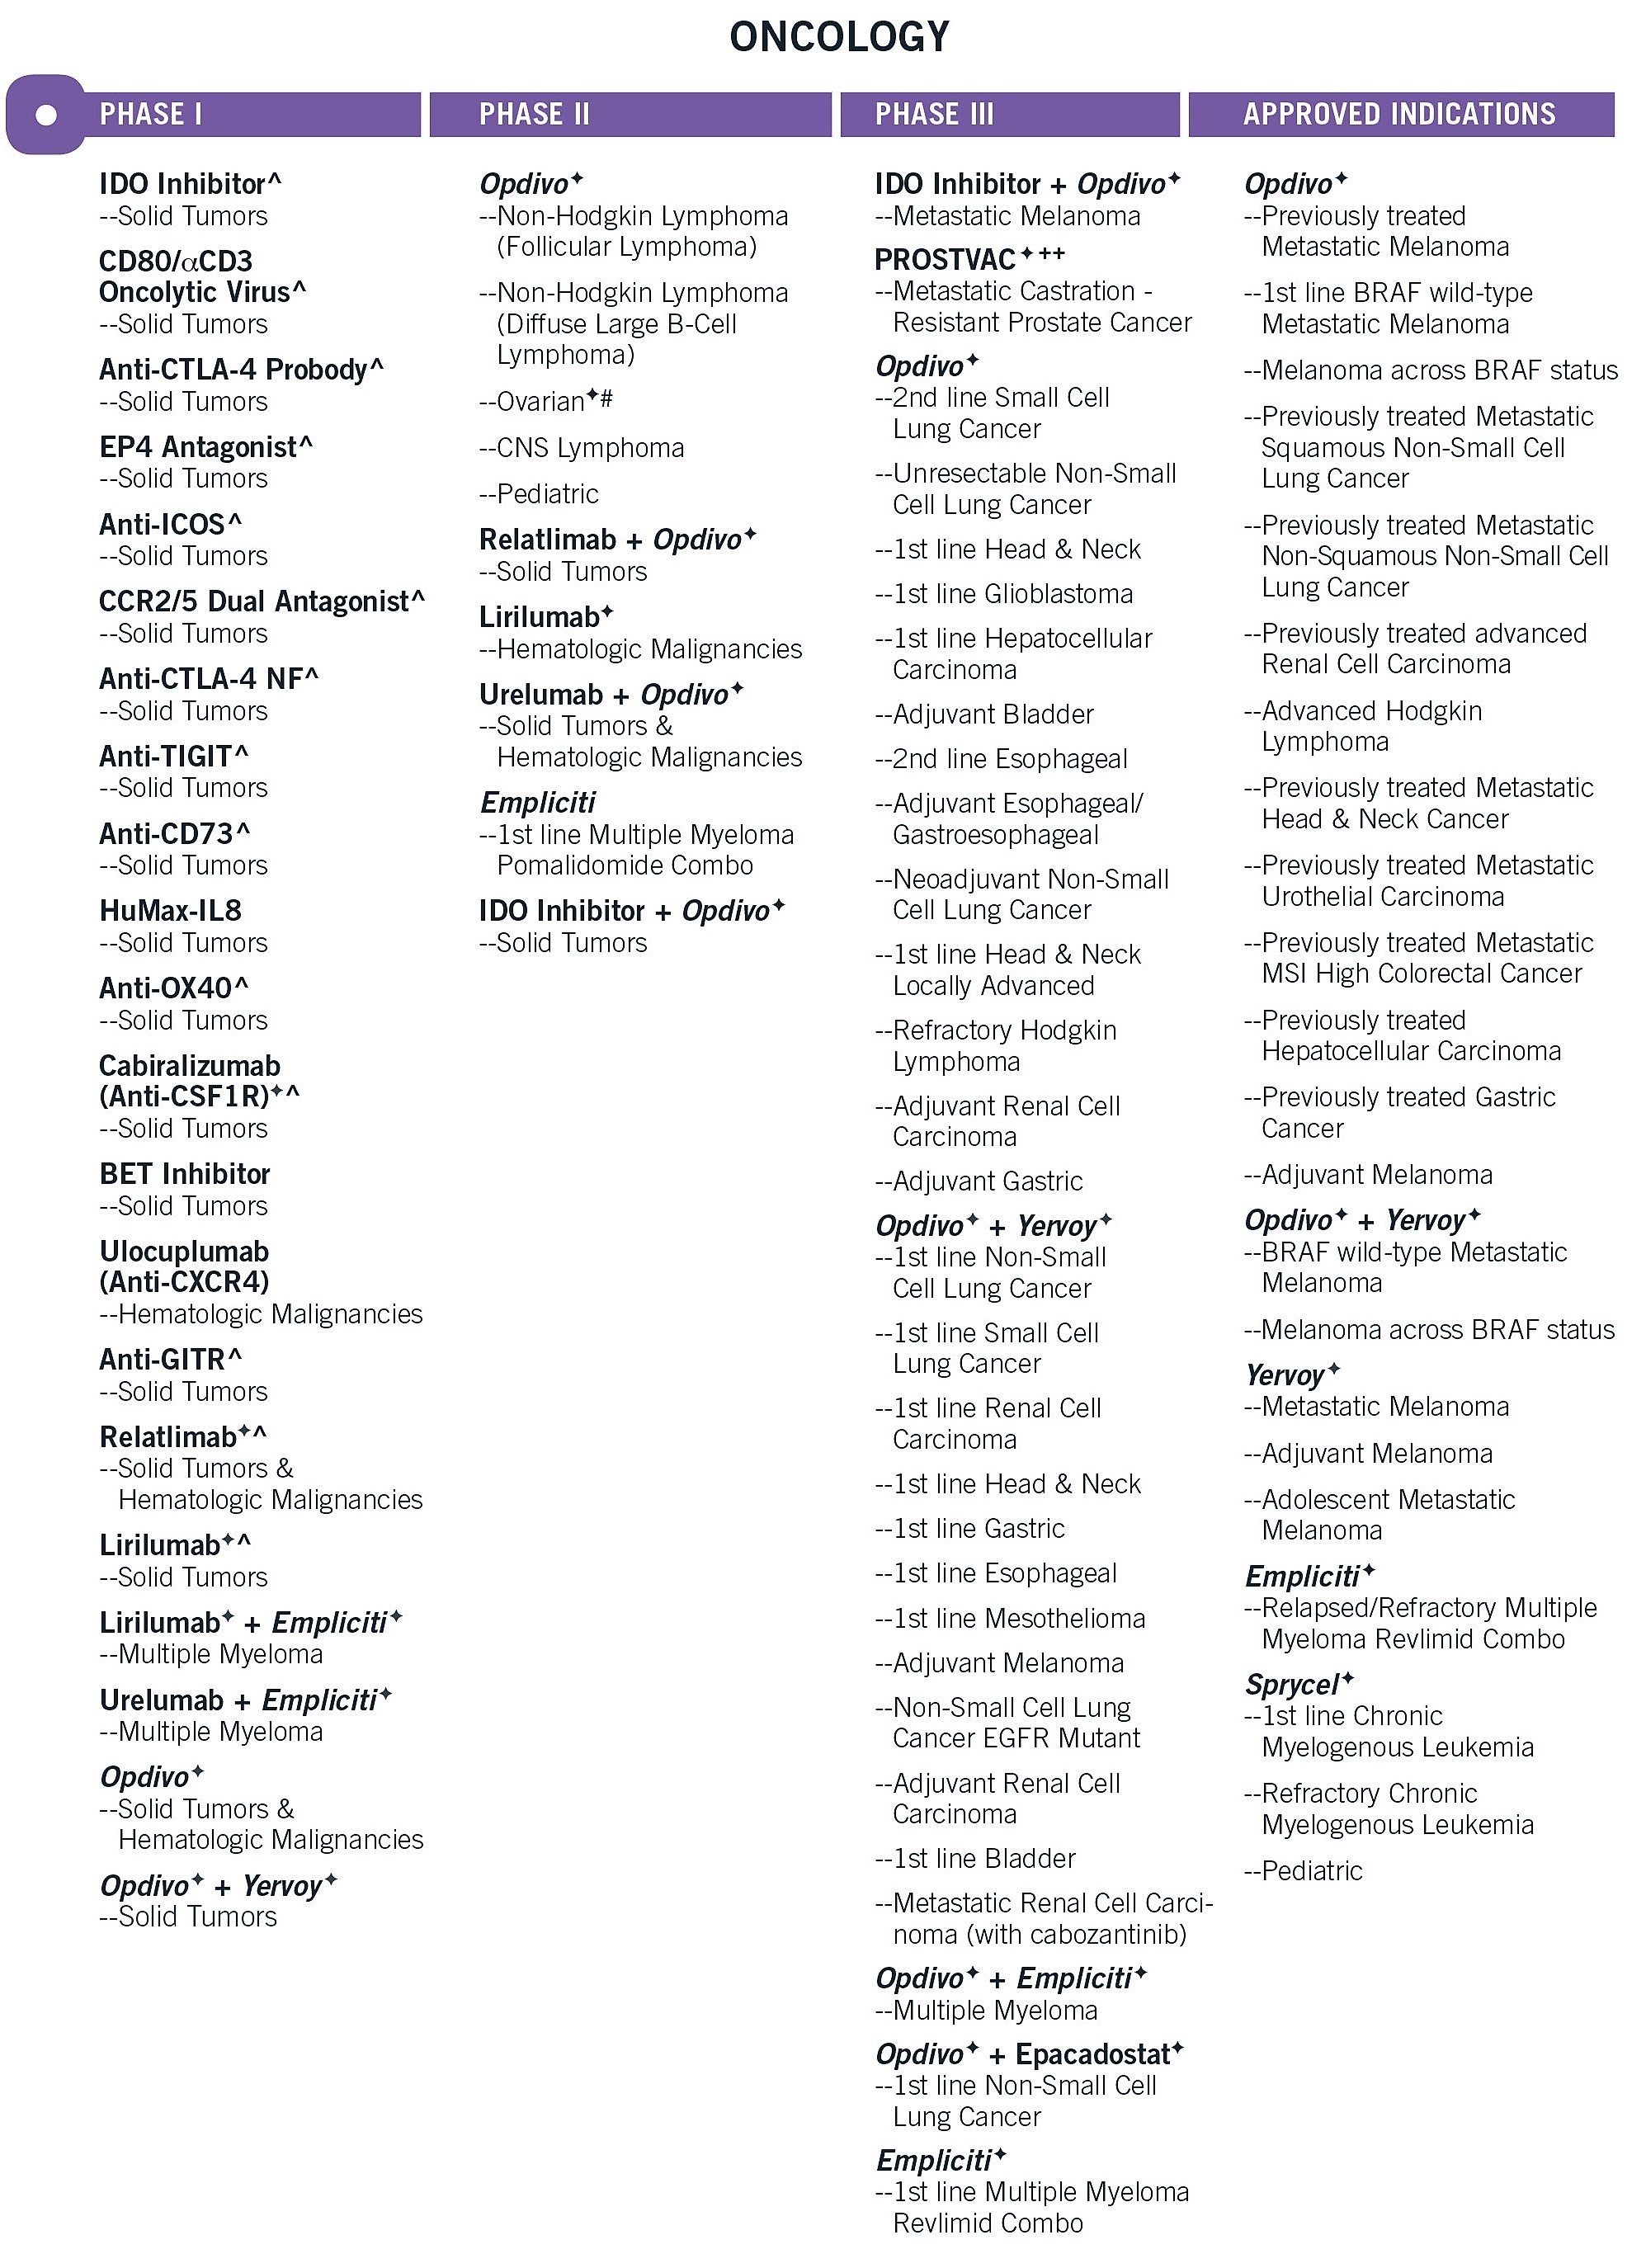
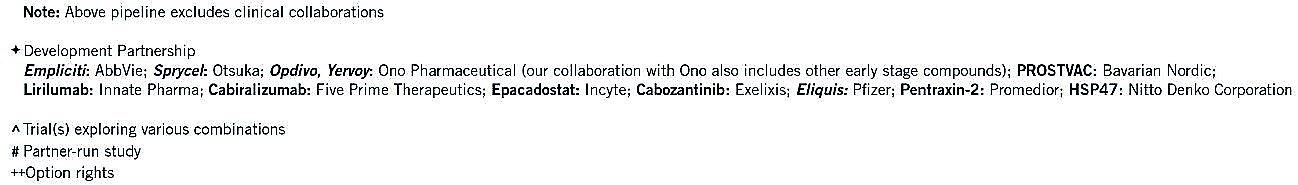
Listed below are our investigational compounds that we have in clinical studies as well as the approved and potential indications for our marketed products in the related therapeutic area as of January 1, 2018. Whether any of the listed compounds ultimately becomes a marketed product depends on the results of clinical studies, the competitive landscape of the potential product's market, reimbursement decisions by payers and the manufacturing processes necessary to produce the potential product on a commercial scale, among other factors. There can be no assurance that we will seek regulatory approval of any of these compounds or that, if such approval is sought, it will be obtained. There is also no assurance that a compound which gets approved will be commercially successful. At this stage of development, we cannot determine all intellectual property issues or all the patent protection that may, or may not, be available for these investigational compounds.
9
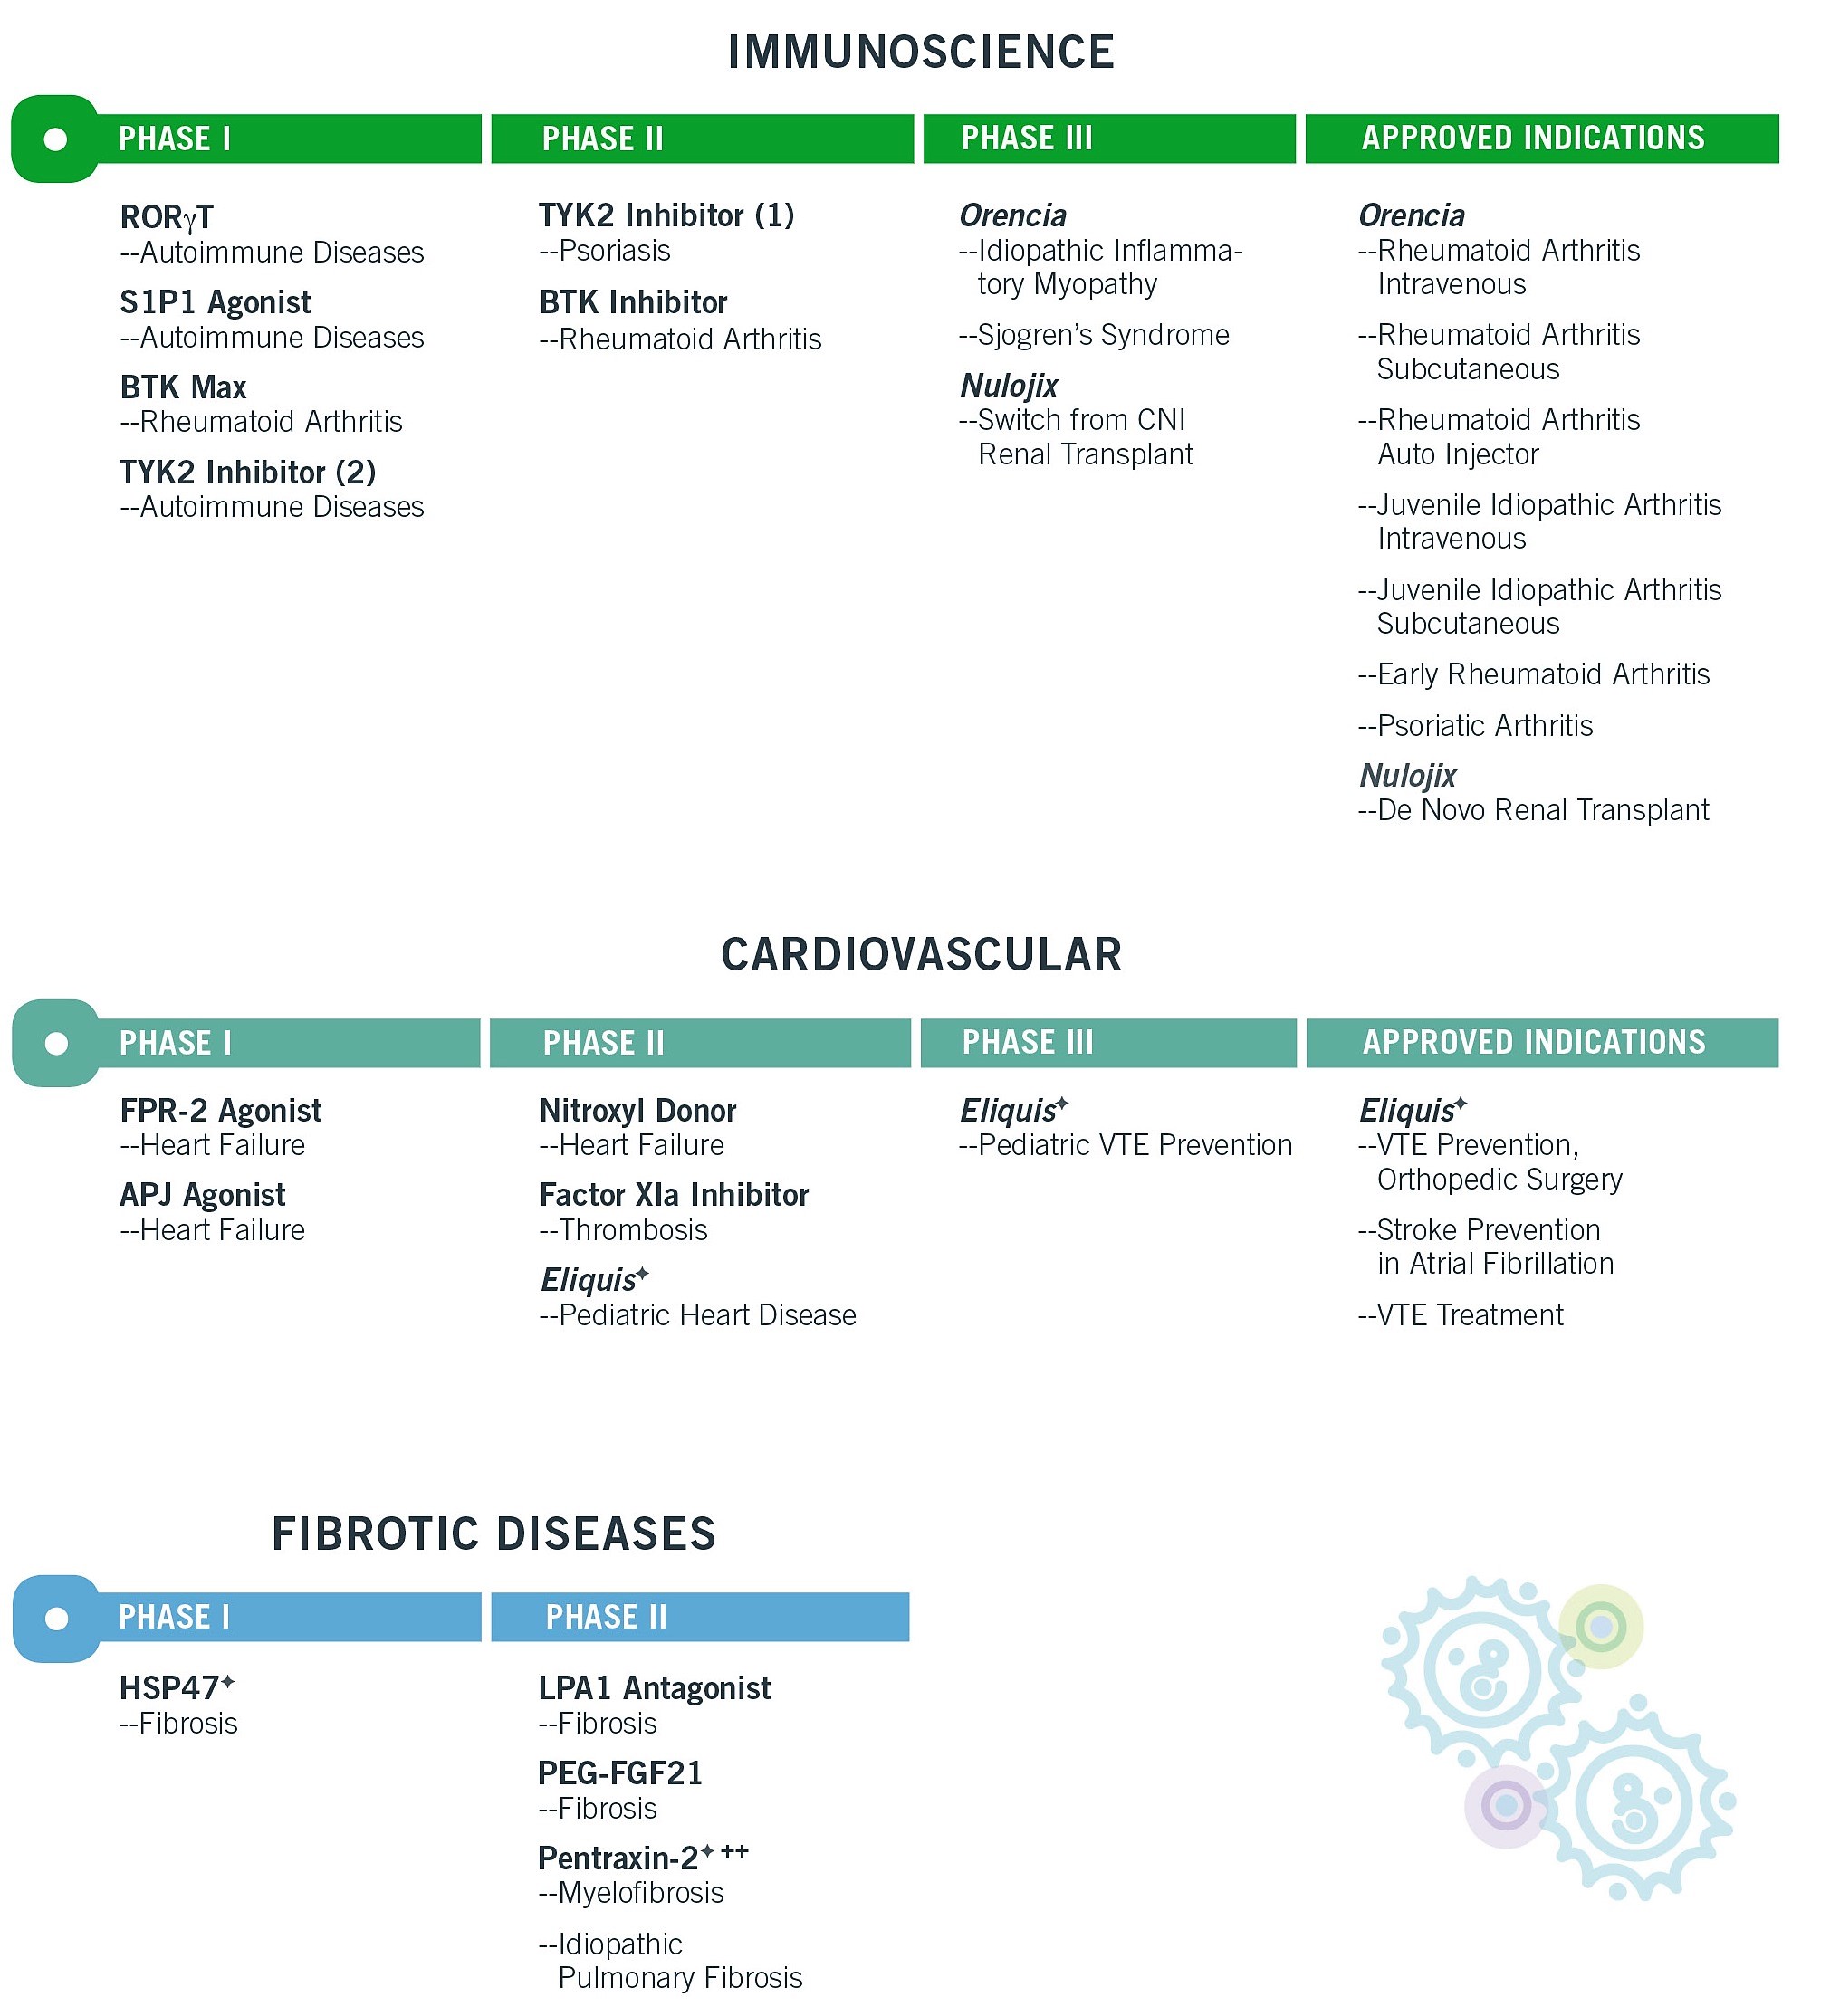
As of February 5, 2018, the following potential registrational study readouts for Opdivo are anticipated through 2019:
| |||||
Tumor | Study Details |
| Tumor | Study Details | |
Non-Small Cell Lung Cancer | CM-227 - Opdivo + Yervoy (1 st line) Part 1a |
| Head and Neck Cancer | CM-651 - Opdivo + Yervoy (1 st line) | |
CM-227 - Opdivo + Chemo (1 st line) Part 2 |
| CM-714 - Opdivo + Yervoy (1 st line) | |||
CM-9LA - Opdivo + Yervoy + Chemo (1 st line) |
| Small Cell Lung Cancer | CM-331 - Opdivo (2 nd line) | ||
Hepatocellular Carcinoma | CM-459 - Opdivo (1 st line) |
| CM-451 - Opdivo +/- Yervoy (1 st line Maintenance) | ||
|
|
|
| ||
Gastric Cancer | CM-649 - Opdivo + Yervoy or Chemo (1 st line) |
| Key | Phase II | Phase III |
10
Alliances
We enter into alliances with third parties that transfer rights to develop, manufacture, market and/or sell pharmaceutical products. These alliances include licensing, co-development, co-marketing and co-promotion arrangements and joint ventures. When such alliances involve sharing research and development costs, the risk of incurring all research and development expenses for compounds that do not lead to revenue-generating products is reduced. However, profitability on alliance products is generally lower because profits from alliance products are shared with our alliance partners. We actively pursue such arrangements and view alliances as an important complement to our own discovery, development and commercialization activities.
Our alliance arrangements contain customary early termination provisions following material breaches, bankruptcy or product safety concerns. The amount of notice required for early termination generally ranges from immediately upon notice to 180 days after receipt of notice. Termination immediately upon notice is generally available where the other party files a voluntary bankruptcy petition or if a material safety issue arises with a product such that the medical risk/benefit is incompatible with the welfare of patients to continue to develop or commercialize the product. Termination with a notice period is generally available where an involuntary bankruptcy petition has been filed and has not been dismissed or a material breach by a party has occurred and not been cured. Most of our alliance agreements also permit us to terminate without cause, which is typically exercisable with substantial advance written notice and is sometimes exercisable only after a specified period of time has elapsed after the alliance agreement is signed. Our alliances typically do not otherwise contain provisions that provide the other party the right to terminate the alliance.
We typically do not retain any rights to another party's product or intellectual property after an alliance terminates. The loss of rights to one or more products that are marketed and sold by us pursuant to an alliance could be material to our results of operations and cash flows could be material to our financial condition and liquidity. As is customary in the pharmaceutical industry, the terms of our alliances generally are co-extensive with the exclusivity period and may vary on a country-by-country basis.
Our most significant alliances for both currently marketed products and investigational compounds are described below. Refer to "Item 8. Financial Statements-Note 3 . Alliances" for additional information on these alliance agreements as well as other alliance agreements.
Pfizer
BMS and Pfizer jointly develop and commercialize Eliquis. BMS recognizes net product sales in most markets. Worldwide profits and losses are shared equally except in certain countries where Pfizer commercializes Eliquis and pays BMS a sales-based fee.
Otsuka
BMS and Otsuka jointly promote Sprycel in the U.S. and EU. BMS recognizes net product sales and a sales-based fee is paid to Otsuka.
Ono
BMS has the exclusive right to develop, manufacture and commercialize Opdivo worldwide except Japan, South Korea and Taiwan. BMS recognizes net product sales and pays Ono royalties of 4% in North America and 15% in all other applicable territories excluding the three countries listed above, subject to customary adjustments.
BMS and Ono jointly develop and commercialize Opdivo, Yervoy and several BMS investigational compounds in Japan, South Korea and Taiwan. BMS is responsible for supply of the products. Profits, losses and development costs are shared equally for all combination therapies involving compounds of both parties. Otherwise, sharing is 80% and 20% for activities involving only one of the party's compounds.
BMS and Ono also jointly develop and commercialize Orencia in Japan. BMS is responsible for the order fulfillment and distribution of the intravenous formulation and Ono is responsible for the subcutaneous formulation. Both formulations are jointly promoted with assigned customer accounts and BMS is responsible for the product supply. A co-promotion fee of 60% is paid when a sale is made to the other party's assigned customer.
AbbVie
BMS and AbbVie jointly develop Empliciti. AbbVie funds 20% of global development costs. BMS is solely responsible for supply, distribution and sales and marketing activities and recognizes net product sales. AbbVie shares 30% of all profits and losses in the U.S. and is paid tiered royalties outside of the U.S.
Gilead
BMS and Gilead formed a joint venture to develop and commercialize Atripla* in the U.S., Canada and in Europe. BMS recognizes alliance revenue for the bulk efavirenz component of Atripla* upon sales of Atripla* to third-party customers.
11
In December 2017, Gilead terminated BMS's participation in the U.S. joint venture which included the U.S. and Canada markets following the launch of a generic version of Sustiva in the U.S. BMS will receive a sales based fee from Gilead on net sales of Atripla* in the U.S. in 2018, 2019 and 2020.
Other Licensing Arrangements
We have other in-licensing and out-licensing arrangements without active participation by both parties, including those obtained from our acquisitions. We are typically entitled to receive or obligated to pay contingent milestone payments as well as royalties, if and when the products are commercialized.
Marketing, Distribution and Customers
We promote the appropriate use of our products directly to healthcare professionals and organizations such as doctors, nurse practitioners, physician assistants, pharmacists, technologists, hospitals, PBMs and MCOs. We also provide information about the appropriate use of our products to consumers in the U.S. through direct-to-consumer print, radio, television and digital advertising and promotion. In addition, we sponsor general advertising to educate the public about our innovative medical research and corporate mission. For a discussion of the regulation of promotion and marketing of pharmaceuticals, refer to "-Government Regulation".
Through our field sales and medical organizations, we explain the risks and benefits of the approved uses of our products to medical professionals. We work to gain access for our products on formularies and reimbursement plans (lists of recommended or approved medicines and other products), including Medicare Part D plans, by providing information about the clinical profiles of our products. Our marketing and sales of prescription pharmaceuticals is limited to the approved uses of the particular product, but we continue to develop scientific data and other information about potential additional uses of our products and provide such information as scientific exchange at scientific congresses or we share information about our products in other appropriate ways including the development of publications, or in response to unsolicited inquiries from doctors, other medical professionals and MCOs.
Our operations include several marketing and sales organizations. Each product marketing organization is supported by a sales force, which may be responsible for selling one or more products. We also have marketing organizations that focus on certain classes of customers such as managed care entities or certain types of marketing tools, such as digital or consumer communications. Our sales forces focus on communicating information about new approved products or uses, as well as approved uses of established products, and promotion to physicians is increasingly targeted at physician specialists who treat the patients in need of our medicines.
Our products are sold principally to wholesalers, specialty distributors, and to a lesser extent, directly to distributors, retailers, hospitals, clinics, government agencies and pharmacies. Refer to "Item 8. Financial Statements-Note 2 . Business Segment Information" for gross revenues to the three largest pharmaceutical wholesalers in the U.S. as a percentage of our global gross revenues.
Our U.S. business has DSAs with substantially all of our direct wholesaler and distributor customers that allow us to monitor U.S. wholesaler and distributor inventory levels and requires those wholesalers and distributors to maintain inventory levels that are no more than one month of their demand. The DSAs, including those with our three largest wholesalers, expired in December 2017. We have entered into letters of agreement with our three largest wholesalers and specialty distributor affiliates to both extend the current agreements through March 2018 and to enter into final agreements through December 31, 2020 prior to the expiration of the letters of agreement.
Our non-U.S. businesses have significantly more direct customers. Information on available direct customer product level inventory and corresponding out-movement information and the reliability of third-party demand information varies widely. We limit our direct customer sales channel inventory reporting to where we can reliably gather and report inventory levels from our customers.
In a number of countries outside of the U.S., we contract with distributors to support certain products. The services provided by these distributors vary by market, but may include distribution and logistics; regulatory and pharmacovigilance; and/or sales, advertising or promotion. Sales in these distributor-based countries represented approximately 1% of the Company's total revenues in 2017 .
Competition
The markets in which we compete are generally broad based and highly competitive. We compete with other worldwide research-based drug companies, many smaller research companies with more limited therapeutic focus and generic drug manufacturers. Important competitive factors include product efficacy, safety and ease of use, price and demonstrated cost-effectiveness, marketing effectiveness, product labeling, customer service and R&D of new products and processes. Sales of our products can be impacted by new studies that indicate a competitor's product is safer or more effective for treating a disease or particular form of disease than one of our products. Our revenues also can be impacted by additional labeling requirements relating to safety or convenience that may be imposed on products by the FDA or by similar regulatory agencies in different countries. If competitors introduce new products and processes with therapeutic or cost advantages, our products can be subject to progressive price reductions, decreased volume of sales or both.
12
Advancements in treating cancer with IO therapies continue to evolve at a rapid pace. Our IO products, particularly Opdivo , operate in a highly competitive marketplace. In addition to competing for market share with other IO products in approved indications such as lung cancer and melanoma, we face increased competition from existing competing IO products that receive FDA approval for additional indications and for new IO agents that receive FDA approval and enter the market. Furthermore, as therapies combining different IO products or IO products with existing chemotherapy or targeted therapy treatments are investigated for potential expanded approvals, we anticipate that our IO products will continue to experience intense competition.
Another competitive challenge we face is from generic pharmaceutical manufacturers. In the U.S. and the EU, the regulatory approval process exempts generics from costly and time-consuming clinical studies to demonstrate their safety and efficacy, allowing generic manufacturers to rely on the safety and efficacy of the innovator product. As a result, generic pharmaceutical manufacturers typically invest far less in R&D than research-based pharmaceutical companies and therefore can price their products significantly lower than branded products. Accordingly, when a branded product loses its market exclusivity, it normally faces intense price competition from generic forms of the product. Upon the expiration or loss of market exclusivity on a product, we can lose the major portion of that product's revenue in a very short period of time.
After the expiration of exclusivity, the rate of revenues decline of a product varies by country. In general, the decline in the U.S. market is more rapid than in most other developed countries, though we have observed rapid declines in a number of EU countries as well. Also, the declines in developed countries tend to be more rapid than in developing countries. The rate of revenues decline after the expiration of exclusivity has also historically been influenced by product characteristics. For example, drugs that are used in a large patient population (e.g., those prescribed by key primary care physicians) tend to experience more rapid declines than drugs in specialized areas of medicine (e.g., oncology). Drugs that are more complex to manufacture (e.g., sterile injectable products) usually experience a slower decline than those that are simpler to manufacture.
In certain countries outside the U.S., patent protection is weak or nonexistent and we must compete with generic versions shortly after we launch our innovative products. In addition, generic pharmaceutical companies may introduce a generic product before exclusivity has expired, and before the resolution of any related patent litigation. For more information about market exclusivity, refer to "-Products, Intellectual Property and Product Exclusivity".
We believe our long-term competitive position depends upon our success in discovering and developing innovative, cost-effective products that serve unmet medical needs, along with our ability to manufacture products efficiently and to market them effectively in a highly competitive environment.
Pricing, Price Constraints and Market Access
Our medicines are priced based on a number of factors, including the value of scientific innovation for patients and society in the context of overall health care spend, economic factors impacting health care systems' ability to provide appropriate and sustainable access and the necessity to sustain our investment in innovation platforms to address serious unmet medical needs. Central to price is the clinical value that this innovation brings to the market, the current landscape of alternative treatment options, the goal of ensuring appropriate patient access to this innovation and sustaining investment in creative platforms. We continue to explore new pricing approaches to ensure that patients have access to our medicines. Enhancing patient access to medicines is a priority for us. We are focused on offering creative tiered pricing, voluntary licensing, reimbursement support and patient assistance programs to optimize access while protecting innovation; advocating for sustainable healthcare policies and infrastructure, leveraging advocacy/payer's input and utilizing partnerships as appropriate; and improving access to care and supportive services for vulnerable patients through partnerships and demonstration projects. We are also monitoring new state laws, such as laws that have recently been enacted in California, Vermont, Nevada and New York that are focused on drug pricing transparency and/or limiting state spending on drugs. These laws could create new constraints on our ability to set prices and/or impact our market access in certain states.
The growth of MCOs, such as Optum (UHC), Silver Scripts (CVS) and Express Scripts (ESI) in the U.S. is also a major factor in the healthcare marketplace. Over half of the U.S. population now participates in some version of managed care. MCOs can include medical insurance companies, medical plan administrators, health-maintenance organizations, Medicare Part D prescription drug plans, alliances of hospitals and physicians and other physician organizations. Those organizations have been consolidating into fewer, larger entities, thus enhancing their purchasing strength and importance to us.
13
To successfully compete for business with MCOs, we must often demonstrate that our products offer not only medical benefits but also cost advantages as compared with other forms of care. Most new products that we introduce compete with other products already on the market or products that are later developed by competitors. As noted above, generic drugs are exempt from costly and time-consuming clinical studies to demonstrate their safety and efficacy and, as such, often have lower costs than brand-name drugs. MCOs that focus primarily on the immediate cost of drugs often favor generics for this reason. Many governments also encourage the use of generics as alternatives to brand-name drugs in their healthcare programs. Laws in the U.S. generally allow, and in many cases require, pharmacists to substitute generic drugs that have been rated under government procedures to be essentially equivalent to a brand-name drug. The substitution must be made unless the prescribing physician expressly forbids it.
Exclusion of a product from a formulary can lead to its sharply reduced usage in the MCO patient population. Consequently, pharmaceutical companies compete aggressively to have their products included. Where possible, companies compete for inclusion based upon unique features of their products, such as greater efficacy, better patient ease of use or fewer side effects. A lower overall cost of therapy is also an important factor. Products that demonstrate fewer therapeutic advantages must compete for inclusion based primarily on price. We have been generally, although not universally, successful in having our major products included on MCO formularies.
In many markets outside the U.S., we operate in an environment of government-mandated, cost-containment programs. In these markets, a significant portion of funding for healthcare services and the determination of pricing and reimbursement for pharmaceutical products are subject to government control. As a result, our products may face restricted access by both public and private payers and may be subject to assessments of comparative value and effectiveness against competitive products. Several governments have placed restrictions on physician prescription levels and patient reimbursements, emphasized greater use of generic drugs and/or enacted across-the-board price cuts as methods of cost control. In most EU countries, for example, the government regulates pricing of a new product at launch often through direct price controls, international price comparisons, controlling profits and/or reference pricing. In other markets, such as Germany, the government does not set pricing restrictions at launch, but pricing freedom is subsequently limited. Companies may also face significant delays in market access for new products, mainly in France, Spain, Italy and Belgium, and more than a year can elapse before new medicines become available on some national markets. Additionally, member states of the EU have regularly imposed new or additional cost containment measures for pharmaceuticals such as volume discounts, cost caps, cost sharing for increases in excess of prior year costs for individual products or aggregated market level spending, outcome-based pricing schemes and free products for a portion of the expected therapy period. In recent years, Italy, for example, has imposed mandatory price decreases. The existence of price differentials within the EU due to the different national pricing and reimbursement laws leads to significant parallel trade flows.
Government Regulation
The pharmaceutical industry is subject to extensive global regulations by regional, country, state and local agencies. The Federal Food, Drug, and Cosmetic Act, other Federal statutes and regulations, various state statutes and regulations (including newly enacted state laws regulating drug price transparency and drug spending), and laws and regulations of foreign governments govern to varying degrees the testing, approval, production, labeling, distribution, post-market surveillance, advertising, dissemination of information and promotion of our products. The lengthy process of laboratory and clinical testing, data analysis, manufacturing, development and regulatory review necessary for required governmental approvals is extremely costly and can significantly delay product introductions in a given market. Promotion, marketing, manufacturing and distribution of pharmaceutical products are extensively regulated in all major world markets. In addition, our operations are subject to complex Federal, state, local, and foreign environmental and occupational safety laws and regulations. We anticipate that the laws and regulations affecting the manufacture and sale of current products and the introduction of new products will continue to require substantial scientific and technical effort, time and expense as well as significant capital investments.
The FDA is of particular importance in the U.S. It has jurisdiction over virtually all of our activities and imposes requirements covering the testing, safety, effectiveness, manufacturing, labeling, marketing, advertising and post-marketing surveillance of our products. In many cases, the FDA requirements have increased the amount of time and money necessary to develop new products and bring them to market in the U.S.
The FDA mandates that drugs be manufactured, packaged and labeled in conformity with cGMP established by the FDA. In complying with cGMP regulations, manufacturers must continue to expend time, money and effort in production, recordkeeping and quality control to ensure that products meet applicable specifications and other requirements to ensure product safety and efficacy. The FDA periodically inspects our drug manufacturing facilities to ensure compliance with applicable cGMP requirements. Failure to comply with the statutory and regulatory requirements subjects us to possible legal or regulatory action, such as suspension of manufacturing, seizure of product or voluntary recall of a product. Adverse experiences with the use of products must be reported to the FDA and could result in the imposition of market restrictions through labeling changes or product removal. Product approvals may be withdrawn if compliance with regulatory requirements is not maintained or if problems concerning safety or efficacy occur following approval.
14
The Federal government has extensive enforcement powers over the activities of pharmaceutical manufacturers, including authority to withdraw or delay product approvals, commence actions to seize and prohibit the sale of unapproved or non-complying products, to halt manufacturing operations that are not in compliance with cGMPs, and to impose or seek injunctions, voluntary recalls, civil, monetary and criminal penalties. Such a restriction or prohibition on sales or withdrawal of approval of products marketed by us could materially adversely affect our business, financial condition and results of operations and cash flows.
Marketing authorization for our products is subject to revocation by the applicable governmental agencies. In addition, modifications or enhancements of approved products or changes in manufacturing locations are in many circumstances subject to additional FDA approvals, which may or may not be received and may be subject to a lengthy application process.
The distribution of pharmaceutical products is subject to the PDMA as part of the Federal Food, Drug, and Cosmetic Act, which regulates such activities at both the Federal and state level. Under the PDMA and its implementing regulations, states are permitted to require registration of manufacturers and distributors who provide pharmaceuticals even if such manufacturers or distributors have no place of business within the state. States are also permitted to adopt regulations limiting the distribution of product samples to licensed practitioners. The PDMA also imposes extensive licensing, personnel recordkeeping, packaging, quantity, labeling, product handling and facility storage and security requirements intended to prevent the sale of pharmaceutical product samples or other product diversions.
The FDA Amendments Act of 2007 imposed additional obligations on pharmaceutical companies and delegated more enforcement authority to the FDA in the area of drug safety. Key elements of this legislation give the FDA authority to (1) require that companies conduct post-marketing safety studies of drugs, (2) impose certain safety related drug labeling changes, (3) mandate risk mitigation measures such as the education of healthcare providers and the restricted distribution of medicines, (4) require companies to publicly disclose data from clinical studies and (5) pre-review television advertisements.
The marketing practices of all U.S. pharmaceutical manufacturers are subject to Federal and state healthcare laws that are used to protect the integrity of government healthcare programs. The OIG oversees compliance with applicable Federal laws, in connection with the payment for products by government funded programs, primarily Medicaid and Medicare. These laws include the Federal anti-kickback statute, which criminalizes the offering of something of value to induce the recommendation, order or purchase of products or services reimbursed under a government healthcare program. The OIG has issued a series of guidances to segments of the healthcare industry, including the 2003 Compliance Program Guidance for Pharmaceutical Manufacturers, which includes a recommendation that pharmaceutical manufacturers, at a minimum, adhere to the PhRMA Code, a voluntary industry code of marketing practices. We subscribe to the PhRMA Code, and have implemented a compliance program to address the requirements set forth in the guidance and our compliance with the healthcare laws. Failure to comply with these healthcare laws could subject us to administrative and legal proceedings, including actions by Federal and state government agencies. Such actions could result in the imposition of civil and criminal sanctions, which may include fines, penalties and injunctive remedies; the impact of which could materially adversely affect our business, financial condition and results of operations and cash flows.
We are also subject to the jurisdiction of various other Federal and state regulatory and enforcement departments and agencies, such as the Federal Trade Commission, the Department of Justice and the Department of Health and Human Services in the U.S. We are also licensed by the U.S. Drug Enforcement Agency to procure and produce controlled substances. We are, therefore, subject to possible administrative and legal proceedings and actions by these organizations. Such actions may result in the imposition of civil and criminal sanctions, which may include fines, penalties and injunctive or administrative remedies.
The U.S. healthcare industry is subject to various government-imposed regulations authorizing prices or price controls that have and will continue to have an impact on our total revenues. We participate in state government Medicaid programs, as well as certain other qualifying Federal and state government programs whereby discounts and rebates are provided to participating state and local government entities. We also participate in government programs that specify discounts to certain government entities; the most significant of which are the U.S. Department of Defense and the U.S. Department of Veterans Affairs. These entities receive minimum discounts based off a defined "non-federal average manufacturer price" for purchases. As a result of the Patient Protection and Affordable Care Act (HR 3590) and the reconciliation bill containing a package of changes to the healthcare bill, we have and will continue to experience additional financial costs and certain other changes to our business. For example, minimum rebates on our Medicaid drug sales have increased from 15.1% to 23.1% and Medicaid rebates have also been extended to drugs used in risk-based Medicaid managed care plans. In addition, we extend discounts to certain critical access hospitals, cancer hospitals and other covered entities as required by the expansion of the 340B Drug Pricing Program under the Public Health Service Act.
We are required to provide a 50% discount on our brand-name drugs to patients who fall within the Medicare Part D coverage gap, also referred to as the "donut hole", and pay an annual non-tax-deductible fee to the federal government based on an allocation of our market share of branded drug sales to certain government programs including Medicare, Medicaid, Department of Veterans Affairs, Department of Defense and TRICARE. The amount of the annual fee imposed on pharmaceutical manufacturers as a whole was $4.0 billion in 2017. The 2018 fee is $4.1 billion, and will then decrease to $2.8 billion in 2019 and thereafter.
15
Our activities outside the U.S. are also subject to regulatory requirements governing the testing, approval, safety, effectiveness, manufacturing, labeling and marketing of our products. These regulatory requirements vary from country to country. Whether or not FDA or EC approval has been obtained for a product, approval of the product by comparable regulatory authorities of countries outside of the U.S. or the EU, as the case may be, must be obtained prior to marketing the product in those countries. The approval process may be more or less rigorous from country to country and the time required for approval may be longer or shorter than that required in the U.S. Approval in one country does not assure that a product will be approved in another country.
For further discussion of these rebates and programs, refer to "Item 7. Management's Discussion and Analysis of Financial Condition and Results of Operations-GTN Adjustments" and "-Critical Accounting Policies."
Sources and Availability of Raw Materials
In general, we purchase our raw materials and supplies required for the production of our products in the open market. For some products, we purchase our raw materials and supplies from one source (the only source available to us) or a single source (the only approved source among many available to us), thereby requiring us to obtain such raw materials and supplies from that particular source. We attempt, if possible, to mitigate our raw material supply risks, through inventory management and alternative sourcing strategies. For further discussion of sourcing, refer to "-Manufacturing and Quality Assurance" below and discussions of particular products.
Manufacturing and Quality Assurance
We operate and manage our manufacturing network in a manner that permits us to improve efficiency while maintaining flexibility to reallocate manufacturing capacity. Pharmaceutical production processes are complex, highly regulated and vary widely from product to product. Given that shifting or adding manufacturing capacity can be a lengthy process requiring significant capital and other expenditures as well as regulatory approvals, we maintain and operate our flexible manufacturing network, consisting of internal and external resources that minimize unnecessary product transfers and inefficient uses of manufacturing capacity. For further discussion of the regulatory impact on our manufacturing, refer to "-Government Regulation and Price Constraints" above.
Our significant pharmaceutical manufacturing facilities are located in the U.S., Puerto Rico, France and Italy and require significant ongoing capital investment for both maintenance and compliance with increasing regulatory requirements. In addition, as our product portfolio changes over the next several years, we expect to continue modification of our existing manufacturing network to meet complex processing standards that may be required for newly introduced products, including biologics. Biologics manufacturing involves more complex processes than those of traditional pharmaceutical operations. The FDA approved our large scale multi-product bulk biologics manufacturing facility in Devens, Massachusetts in May 2012 and we continue to make capital investments in this facility. We are in the startup phase of our new large-scale biologics manufacturing facility in Cruiserath, Ireland, which is expected to be operational in 2019.
We rely on third parties to manufacture or supply us with all or a portion of the active product ingredient or drug substance necessary for us to manufacture various products, such as Opdivo , Sprycel , Yervoy, Eliquis , Orencia , Baraclude , Reyataz and the Sustiva Franchise, and we continue to shift towards using third party manufactures for supply of our established brands . To maintain a stable supply of these products, we take a variety of actions including inventory management and maintenance of additional quantities of materials, when possible, designed to provide for a reasonable level of these ingredients to be held by the third-party supplier, us or both, so that our manufacturing operations are not interrupted. Certain supply arrangements extend over multiple years with minimum purchase obligations determined using expected near or long-term demand requirements. As an additional protection, in some cases, we take steps to maintain an approved back-up source where available. For example, we have the capability to manufacture Opdivo internally and also have arrangements with third-party manufacturers to meet demand.
In connection with divestitures, licensing arrangements or distribution agreements of certain of our products, or in certain other circumstances, we have entered into agreements under which we have agreed to supply such products to third parties. In addition to liabilities that could arise from our failure to supply such products under the agreements, these arrangements could require us to invest in facilities for the production of non-strategic products, result in additional regulatory filings and obligations or cause an interruption in the manufacturing of our own products.
Our success depends in great measure upon customer confidence in the quality of our products and in the integrity of the data that support their safety and effectiveness. Product quality arises from a total commitment to quality in all parts of our operations, including research and development, purchasing, facilities planning, manufacturing, and distribution. We maintain records to demonstrate the quality and integrity of technical information and production processes.
16
Control of production processes involves established specifications and standards for ingredients, equipment and facilities, manufacturing methods, and operations, packaging materials and labeling. We perform tests at various stages of production processes, on the final product and on product samples held on stability to ensure that the product meets regulatory requirements and conforms to our standards. These tests may involve chemical and physical analyses, microbiological testing or a combination of these along with other analyses. Quality control testing is provided by business unit/site and third-party laboratories. Quality assurance groups routinely monitor manufacturing procedures and systems used by us, our subsidiaries and third-party suppliers to assure quality and compliance requirements are met.
Environmental Regulation
Our facilities and operations are subject to extensive U.S. and foreign laws and regulations relating to environmental protection and human health and safety, including those governing discharges of pollutants into the air and water; the use, management and disposal of hazardous, radioactive and biological materials and wastes; and the cleanup of contamination. Pollution controls and permits are required for many of our operations, and these permits are subject to modification, renewal or revocation by the issuing authorities.
Our environment, health and safety group monitors our operations around the world, providing us with an overview of regulatory requirements and overseeing the implementation of our standards for compliance. We also incur operating and capital costs for such matters on an ongoing basis, which were not material for 2017, 2016 and 2015. In addition, we invested in projects that reduce resource use of energy and water. Although we believe that we are in substantial compliance with applicable environmental, health and safety requirements and the permits required for our operations, we nevertheless could incur additional costs, including civil or criminal fines or penalties, clean-up costs or third-party claims for property damage or personal injury, for violations or liabilities under these laws.
Many of our current and former facilities have been in operation for many years, and over time, we and other operators of those facilities have generated, used, stored or disposed of substances or wastes that are considered hazardous under Federal, state and/or foreign environmental laws, including CERCLA. As a result, the soil and groundwater at or under certain of these facilities is or may be contaminated, and we may be required to make significant expenditures to investigate, control and remediate such contamination, and in some cases to provide compensation and/or restoration for damages to natural resources. Currently, we are involved in investigation and remediation at 16 current or former facilities. We have also been identified as a PRP under applicable laws for environmental conditions at approximately 20 former waste disposal or reprocessing facilities operated by third parties at which investigation and/or remediation activities are ongoing.
We may face liability under CERCLA and other Federal, state and foreign laws for the entire cost of investigation or remediation of contaminated sites, or for natural resource damages, regardless of fault or ownership at the time of the disposal or release. In addition, at certain sites we bear remediation responsibility pursuant to contractual obligations. Generally, at third-party operator sites involving multiple PRPs, liability has been or is expected to be apportioned based on the nature and amount of hazardous substances disposed of by each party at the site and the number of financially viable PRPs. For additional information about these matters, refer to "Item 8. Financial Statements-Note 18 . Legal Proceedings and Contingencies."
Employees
We have approximately 23,700 employees as of December 31, 2017 .
Foreign Operations
We have significant operations outside the U.S. They are conducted both through our subsidiaries and through distributors.
International operations are subject to certain risks, which are inherent in conducting business abroad, including, but not limited to, currency fluctuations, possible nationalization or expropriation, price and exchange controls, counterfeit products, limitations on foreign participation in local enterprises and other restrictive governmental actions. Our international businesses are also subject to government-imposed constraints, including laws on pricing or reimbursement for use of products.
Bristol-Myers Squibb Website
Our internet website address is www.bms.com . On our website, we make available, free of charge, our annual, quarterly and current reports, including amendments to such reports, as soon as reasonably practicable after we electronically file such material with, or furnish such material to, the SEC.
17
Information relating to corporate governance at Bristol-Myers Squibb, including our Principles of Integrity, Code of Ethics for Senior Financial Officers, Code of Business Conduct and Ethics for Directors, (collectively, the "Codes"), Corporate Governance Guidelines, and information concerning our Executive Committee, Board of Directors, including Board Committees and Committee charters, and transactions in Bristol-Myers Squibb securities by directors and executive officers, is available on our website under the "Investors-Corporate Governance" caption and in print to any stockholder upon request. Any waivers to the Codes by directors or executive officers and any material amendment to the Code of Business Conduct and Ethics for Directors and Code of Ethics for Senior Financial Officers will be posted promptly on our website. Information relating to stockholder services, including our Dividend Reinvestment Plan and direct deposit of dividends, is available on our website under the "Investors-Stockholder Services" caption. In addition, information about our Sustainability programs is available on our website under the "Responsibility" caption.
We incorporate by reference certain information from parts of our proxy statement for the 2017 Annual Meeting of Stockholders. The SEC allows us to disclose important information by referring to it in that manner. Please refer to such information. Our proxy statement for the 2018 Annual Meeting of Stockholders and 2017 Annual Report will be available on our website under the "Investors-SEC Filings" caption on or about March 22, 2018 .
18
Item 1A. | RISK FACTORS. |
Any of the factors described below could significantly and negatively affect our business, prospects, financial condition, operating results, or credit ratings, which could cause the trading price of our common stock to decline. Additional risks and uncertainties not presently known to us, or risks that we currently consider immaterial, could also impair our operations or financial condition.
The public announcement of data from our clinical studies, or those of our competitors, or news of any developments related to our, or our competitors', IO products or late-stage compounds may cause significant volatility in our stock price and depending on the data, may result in an adverse impact on our business, financial condition or results of operation. If the development of any of our key IO compounds, whether alone or as part of a combination therapy, is delayed or discontinued or a clinical study does not meet one or more of its primary endpoints, our stock price could decline significantly and there may be an adverse impact on our business, financial condition or results of operations.
We are focusing our efforts and resources in disease areas of high unmet need. With our more focused portfolio, investors are placing heightened scrutiny on some of our products or late-stage compounds. In particular, Opdivo is the backbone of our IO portfolio. During 2017, we announced multiple regulatory milestones for Opdivo, including the early stoppage of certain clinical studies for meeting their endpoints and label expansions for new indications. We have, however, also experienced setbacks and may continue to do so as there are further developments in our clinical studies. In 2018, we expect to receive further data from ongoing clinical studies including CheckMate-227, a combination study in the first-line lung cancer setting and decisions from health authorities regarding potential label expansions.
The announcement of data from our clinical studies, or those of our competitors, or news of any developments related to our, or our competitors', IO products or late-stage compounds, such as Opdivo, may cause significant volatility in our stock price and depending on the news, may result in an adverse impact on our business, financial condition or results of operation. Furthermore, the announcement of any negative or unexpected data or the discontinuation of development of any of our key IO compounds, whether alone or as part of a combination therapy, any delay in our anticipated timelines for filing for regulatory approval or a significant advancement of a competitor, may cause our stock price to decline significantly and may have an adverse impact on our business, financial condition or results of operations. There is no assurance that data from our clinical studies will support filings for regulatory approval, or that our key IO compounds may prove to be effective or as effective as other competing compounds, or even if approved, that any of our key IO compounds will become commercially successful for all approved indications.
We depend on several key products for most of our revenues, cash flows and earnings.
We derive a majority of our revenue and earnings from several key products. Our six prioritized brands comprised approximately 75% of revenues in 2017. Growth products such as Opdivo and Eliquis represented, and are expected to increasingly represent, a significant part of our revenue, earnings and cash flows. A reduction in revenue from any of these products could adversely impact our earnings and cash flows. Also, if one of our major products were to become subject to issues such as loss of patent protection, significant changes in demand, formulary access changes, material product liability, unexpected side effects, regulatory proceedings, negative publicity or a significant advancement of competing products, we may incur an adverse impact on our business, financial condition, results of operation or trading price of our stock.
We may experience difficulties or delays in the development and commercialization of new products.
Compounds or products may appear promising in development but fail to reach market within the expected or optimal timeframe, or at all. In addition, product extensions or additional indications may not be approved. Furthermore, products or indications approved under the U.S. FDA's Accelerated Approval Program may be contingent upon verification and description of clinical benefit in confirmatory studies and such studies may not be successful. For example, when we announced we would not pursue an accelerated regulatory pathway for the combination of Opdivo+Yervoy in lung cancer and when we reported negative results from CheckMate-026, we experienced negative impacts on our stock price in 2016. Developing and commercializing new compounds and products include inherent risks and uncertainties, including (i) due to efficacy and safety concerns, delayed or denied regulatory approvals, delays or challenges with producing products on a commercial scale or excessive costs to manufacture them; (ii) failure to enter into or implement optimal alliances for the development and/or commercialization of new products; (iii) failure to maintain a consistent scope and variety of promising late-stage products; (iv) failure of one or more of our products to achieve or maintain commercial viability; and (v) changes in regulatory approval processes may cause delays or denials of new product approvals.
Regulatory approval delays are especially common when a product is expected to have a Risk Evaluation and Mitigation Strategy, as required by the FDA to address significant risk/benefit issues. The inability to bring a product to market or a significant delay in the expected approval and related launch date of a new product could negatively impact our revenues and earnings. In addition, if certain acquired pipeline programs are canceled or we believe their commercial prospects have been reduced, we may recognize material non-cash impairment charges for those programs. Finally, losing key molecules and intermediaries or our compound library through a natural or man-made disaster or act of sabotage could negatively impact the product development cycle.
19
We face intense competition from other manufacturers, including for both innovative medicines and lower-priced generic products.
BMS is dependent on the market access, uptake and expansion for marketed brands, new product introductions, new indications, product extensions and co-promotional activities with alliance partners, to deliver future growth. Competition is keen and includes (i) lower-priced generics and increasingly aggressive generic commercialization tactics, (ii) new competitive products entering the market, particularly in IO, (iii) lower prices for other companies' products, real or perceived superior efficacy (benefit) or safety (risk) profiles or other differentiating factors, (iv) technological advances and patents attained by our competitors, (v) clinical study results from our products or a competitor's products that affect the value proposition for our products, (vi) business combinations among our competitors and major third-party payers and (vii) competing interests for external partnerships to develop and bring new products to markets. If we are unable to compete successfully against our competitors' products in the marketplace, this could have a material negative impact on our revenues and earnings.
Litigation claiming infringement of intellectual property may adversely affect our future revenues and operating earnings.
Third parties may claim that we infringe upon their intellectual property. Resolving an intellectual property infringement claim can be costly and time consuming and may require us to enter into license agreements, which may not be available on commercially reasonable terms. A successful claim of patent or other intellectual property infringement could subject us to significant damages or an injunction preventing the manufacture, sale, or use of the affected product or products. Any of these events could have a material adverse effect on our profitability and financial condition.
Adverse outcomes in other legal matters could negatively affect our business.
Current or future lawsuits, claims, proceedings and government investigations could preclude or delay the commercialization of our products or could adversely affect our operations, profitability, liquidity or financial condition, after any possible insurance recoveries, where available. Such legal matters include (i) intellectual property disputes; (ii) adverse decisions in litigation, including product liability and commercial cases; (iii) anti-bribery regulations, such as the U.S. Foreign Corrupt Practice Act or UK Bribery Act, including compliance with ongoing reporting obligations to the government resulting from any settlements, (iv) recalls or withdrawals of pharmaceutical products or forced closings of manufacturing plants; (v) the failure to fulfill obligations under supply contracts with the government and other customers; (vi) product pricing and promotional matters; (vii) lawsuits and claims asserting, or investigations into, violations of securities, antitrust, Federal and state pricing, consumer protection, data privacy and other laws; (viii) environmental, health, safety and sustainability matters; and (ix) tax liabilities resulting from assessments from tax authorities.
We could lose market exclusivity of a product earlier than expected.
In the pharmaceutical and biotechnology industries, the majority of an innovative product's commercial value is realized during its market exclusivity period. In the U.S. and in some other countries, when market exclusivity expires and generic versions are approved and marketed or when biosimilars are introduced (even if only for a competing product), there are usually very substantial and rapid declines in a product's revenues.
Market exclusivity for our products is based upon patent rights and certain regulatory forms of exclusivity. The scope of our patent rights varies from country to country and may also be dependent on the availability of meaningful legal remedies in a country. The failure to obtain patent and other intellectual property rights, or limitations on the use or loss of such rights, could be material to us. In some countries, including certain EU member states, basic patent protections for our products may not exist because certain countries did not historically offer the right to obtain specific types of patents and/or we (or our licensors) did not file in those countries. In addition, the patent environment can be unpredictable and the validity and enforceability of patents cannot be predicted with certainty. Absent relevant patent protection for a product, once the data exclusivity period expires, generic versions can be approved and marketed.
Generic and biosimilar product manufacturers as well as other groups seeking financial gain are also increasingly seeking to challenge patents before they expire, and we could face earlier-than-expected competition for any products at any time. Patents covering our key products have been, and are likely to continue to be, subject to patent litigation. For example, in February 2017 one of the EU patents for Sprycel was revoked by the Opposition Division of the EPO. We may experience a decline in European revenues upon the entry of generics into the market. Refer to "Item 8. Financial Statements-Note 18 . Legal Proceedings and Contingencies" for further information. In some cases, manufacturers may seek regulatory approval by submitting their own clinical study data to obtain marketing approval or choose to launch a generic product "at risk" before the expiration of the applicable patent(s) and/or before the final resolution of related patent litigation. There is no assurance that a particular product will enjoy market exclusivity for the full time period that appears in the estimates disclosed in this Form 10-K or that we assume when we provide our financial guidance. In addition, some countries, such as India, are allowing competitors to manufacture and sell competing generic products, which negatively impacts the protections afforded the Company. Lower-priced biosimilars for BMS biologic products or competing biologics could negatively impact our volumes and prices.
20
Increased pricing pressure and other restrictions in the U.S. and abroad from MCOs, institutional purchasers, and government agencies and programs, among others, could negatively affect our revenues and profit margins.
Our products continue to be subject to increasing pressures across the portfolio from market access, pricing and discounting and other restrictions in the U.S., the EU and other regions around the world, including from (i) rules and practices of MCOs and institutional and governmental purchasers; (ii) judicial decisions and changes in laws and regulations for federal healthcare programs such as Medicare and Medicaid, and other government actions and inquiries at both the federal and state level such as laws that have recently been enacted in California, Vermont, Nevada and New York that are focused on drug pricing transparency and/or limiting state spending on drugs; (iii) the potential impact of changes to pharmaceutical reimbursement, and increased pricing pressure from Medicare Part D formularies, Medicare Part B reimbursement rates to physicians as well as commercial formularies in general; (iv) reimbursement delays; (v) government price erosion mechanisms across Europe and in other countries, resulting in deflation for pharmaceutical product pricing; (vi) collection delays or failures to pay in government-funded public hospitals outside the U.S. (vii) the impact on pricing from parallel trade across borders; (viii) other developments in technology and/or industry practices that could impact the reimbursement policies and practices of third-party payers; and (ix) inhibited market access due to real or perceived differences in value propositions for our products compared to competing products.
We are subject to a variety of U.S. and international laws and regulations.
We are currently subject to a number of government laws and regulations and in the future, could become subject to new government laws and regulations. The costs of compliance with such laws and regulations, or the negative results of non-compliance, could adversely affect our business, our operating results and the financial condition of our Company; these include (i) additional healthcare reform initiatives in the U.S. or in other countries, including additional mandatory discounts or fees; (ii) new laws, regulations and judicial or other governmental decisions affecting pricing, drug reimbursement, receivable payments, and access or marketing within or across jurisdictions; (iii) changes in intellectual property law; (iv) changes in accounting standards; (v) new and increasing data privacy regulations and enforcement, particularly in the European Union and the U.S.; (vi) emerging and new global regulatory requirements for reporting payments and other value transfers to healthcare professionals; and (vii) the potential impact of importation restrictions, legislative and/or other regulatory changes.
Changes to tax regulations could negatively impact our earnings.
We are subject to income taxes in the U.S. and various other countries globally. In particular, although the passage of the Tax Cut and Jobs Act of 2017 reduced the U.S. tax rate to 21%, our future earnings could be negatively impacted by changes in tax legislation including changing tax rates and tax base such as limiting, phasing-out or eliminating deductions or tax credits, taxing certain excess income from intellectual property, changing rules for earnings repatriations and changing other tax laws in the U.S. or other countries. In addition, the one-time deemed repatriation tax of approximately $2.6 billion will be payable over the next eight years.
Third-party royalties represent a significant percentage of our pretax income and operating cash flow.
We have entered into several arrangements which entitle us to potential royalties from third parties for out-licensed intellectual property, commercialization rights and sales-based contingent proceeds related to the divestiture of businesses. In many of these arrangements we have minimal, if any, continuing involvement that contribute to the financial success of those activities. Royalties have continued to represent a significant percentage of our pretax income, including royalties related to the divestiture of our Erbitux* and diabetes businesses (including the transfer of certain future royalty rights pertaining to Amylin, Onglyza* and Farxiga* product sales), our Sanofi alliance, out-licensed intellectual property and the Merck patent infringement settlement. Pretax income generated from royalties were approximately $1.2 billion in 2017 and is expected to increase in 2018. Our pretax income could be adversely affected if the royalty streams decline in future periods.
21
The failure of third parties to meet their contractual, regulatory, and other obligations could adversely affect our business.
We rely on suppliers, vendors, outsourcing partners, alliance partners and other third parties to research, develop, manufacture, commercialize, co-promote and sell our products, manage certain marketing, selling, human resource, finance, IT and other business unit and functional services, and meet their contractual, regulatory and other obligations. Using these third parties poses a number of risks, such as: (i) they may not perform to our standards or legal requirements, for example, in relation to the outsourcing of significant clinical development activities for innovative medicines to some contract research organizations; (ii) they may not produce reliable results; (iii) they may not perform in a timely manner; (iv) they may not maintain confidentiality of our proprietary information; (v) they may incur a significant cyberattack or business disruption; (vi) disputes may arise with respect to ownership of rights to technology developed with our partners; and (vii) disagreements could cause delays in, or termination of, the research, development or commercialization of the product or result in litigation or arbitration. Moreover, some third parties are located in markets subject to political and social risk, corruption, infrastructure problems and natural disasters, in addition to country specific privacy and data security risk given current legal and regulatory environments. The failure of any critical third party to meet its obligations, including for future royalty and milestone payments; adequately deploy business continuity plans in the event of a crisis; and/or satisfactorily resolve significant disagreements with us or address other factors, could have a material adverse impact on our operations and results. In addition, if these third parties violate, or are alleged to have violated, any laws or regulations, including the local pharmaceutical code, U.S. Foreign Corrupt Practice Act, UK Bribery Act and other similar laws and regulations, during the performance of their obligations for us, it is possible that we could suffer financial and reputational harm or other negative outcomes, including possible legal consequences.
Failure to execute our business strategy could adversely impact our growth and profitability.
Our strategy is focused on delivering innovative, transformational medicines to patients. If we are unable to successfully execute on this strategy, this could negatively impact our future results of operations and market capitalization. In connection with this strategy, we are in the process of evolving our operating model to focus on investment in commercial opportunities against key brands and markets, accelerate the pipeline, streamline operations and realign manufacturing capabilities that broaden biologics capabilities, among other things. Our ability to successfully execute our operating model evolution could impact our results. If we are not able to achieve the cost savings we expect, this could negatively impact our operating margin and earnings results. In addition, we may be unable to consistently maintain an adequate pipeline, through internal R&D programs or transactions with third parties, to support future revenue growth. Competition among pharmaceutical companies for acquisition and product licensing opportunities is intense, and we may not be able to locate suitable acquisition targets or licensing partners at reasonable prices, or successfully execute such transactions. If we are unable to support and grow our marketed products, successfully execute the launches of newly approved products, advance our late-stage pipeline, manage change from our operating model evolution and manage our costs effectively, our operating results and financial condition could be negatively impacted.
Failure to attract and retain highly qualified personnel could affect our ability to successfully develop and commercialize products.
Our success is largely dependent on our continued ability to attract and retain highly qualified scientific, technical and management personnel, as well as personnel with expertise in clinical R&D, governmental regulation and commercialization. Competition for qualified personnel in the biopharmaceutical field is intense. We cannot be sure that we will be able to attract and retain quality personnel or that the costs of doing so will not materially increase.
Any businesses or assets we acquire in the future may underperform, and we may not be able to successfully integrate them into our existing business.
An essential component of our strategy has been business development activities seeking to source innovation externally to supplement our own discovery and development efforts. As such, we have acquired, or in-licensed, a number of assets and we expect to continue to support our pipeline with compounds or products obtained through licensing and acquisitions. Future revenues, profits and cash flows of an acquired company's products, technologies and pipeline candidates, may not materialize due to low product uptake, delayed or missed pipeline opportunities, the inability to capture expected synergies, increased competition, safety concerns, regulatory issues, supply chain problems or other factors beyond our control. For example we discontinued the development of FS102 which was in Phase I development for the treatment of breast and gastric cancer, and consequently did not exercise our option to purchase F-Star Alpha. As a result, we recorded an IPRD charge of $75 million. Substantial difficulties, costs and delays could result from integrating our acquisitions, including for (i) R&D, manufacturing, distribution, sales, marketing, promotion and information technology activities; (ii) policies, procedures, processes, controls and compliance; and (iii) tax considerations.
22
We could experience difficulties and delays in the manufacturing, distribution and sale of our products.
Our product supply and related patient access could be negatively impacted by, among other things: (i) product seizures or recalls or forced closings of manufacturing plants; (ii) our failure, or the failure of any of our suppliers, to comply with cGMP and other applicable regulations or quality assurance guidelines that could lead to manufacturing shutdowns, product shortages or delays in product manufacturing; (iii) manufacturing, quality assurance/quality control, supply problems or governmental approval delays; (iv) the failure of a sole source or single source supplier to provide us with the necessary raw materials, supplies or finished goods within a reasonable timeframe and with required quality; (v) the failure of a third-party manufacturer to supply us with bulk active or finished product on time; (vi) construction or regulatory approval delays for new facilities or the expansion of existing facilities, including those intended to support future demand for our biologics products, such as Opdivo; (vii) the failure to meet new and emerging regulations requiring products to be tracked throughout the distribution channels using unique identifiers to verify their authenticity in the supply chain; (viii) other manufacturing or distribution issues, including limits to manufacturing capacity and changes in the types of products produced, such as biologics, physical limitations or other business interruptions; and (ix) disruption in supply chain continuity including from natural disasters, acts of war or terrorism or other external factors over which we have no control impacting one or more of our facilities or at a critical supplier. For example, our new biologics manufacturing facility in Cruiserath, Ireland is expected to be operational in 2019. A delay in the planned opening of the site could impact the supply of our products or require us to obtain product supply from third parties at a significant cost.
Our manufacturing and commercial operations in Puerto Rico were impacted by the recent hurricanes. Our two manufacturing sites sustained some damage but are currently operating at reduced capacity. We continue to work to restore to normal operations. Disruption in our ability to operate our Puerto Rico manufacturing facilities (whether due to problems with the facility itself, the infrastructure and services available on the island, the unavailability of raw materials or supplies from vendors, the unavailability of key staff or otherwise) could materially and adversely affect our ability to supply our products and affect our product sales.
Product labeling changes for our marketed products could result in a negative impact on revenues and profit margins.
We or regulatory authorities may need to change the labeling for any pharmaceutical product, including after a product has been marketed for several years. These changes are often the result of additional data from post-marketing studies, head-to-head studies, adverse events reports, studies that identify biomarkers (objective characteristics that can indicate a particular response to a product or therapy) or other studies or post-marketing experience that produce important additional information about a product. New information added to a product's label can affect its risk-benefit profile, leading to potential recalls, withdrawals or declining revenue, as well as product liability claims. Sometimes additional information from these studies identifies a portion of the patient population that may be non-responsive to a medicine or would be at higher risk of adverse reactions and labeling changes based on such studies may limit the patient population. The studies providing such additional information may be sponsored by us, but they could also be sponsored by competitors, insurance companies, government institutions, managed care organizations, scientists, investigators, or other interested parties. While additional safety and efficacy information from such studies assist us and healthcare providers in identifying the best patient population for each product, it can also negatively impact our revenues due to inventory returns and a more limited patient population going forward. Additionally, certain study results, especially from head-to-head studies, could affect a product's formulary listing, which could also adversely affect revenues.
The illegal distribution and sale by third parties of counterfeit or unregistered versions of our products or stolen products could have a negative impact on our revenues, earnings, reputation and business.
Third parties may illegally distribute and sell counterfeit versions of our products, which do not meet our rigorous manufacturing and testing standards. A patient who receives a counterfeit drug may be at risk for a number of dangerous health consequences. Our reputation and business could suffer harm as a result of counterfeit drugs sold under our brand name. Thefts of inventory at warehouses, plants or while in-transit, which are then not properly stored and are later sold through unauthorized channels, could adversely impact patient safety, our reputation and our business. In addition, diversion of products from their authorized market into other channels may result in reduced revenues and negatively affect our profitability.
23
We are dependent on information technology and our systems and infrastructure face certain risks, including from cybersecurity breaches and data leakage.
We rely extensively on IT systems, networks and services, including internet sites, data hosting and processing facilities and tools, physical security systems and other hardware, software and technical applications and platforms, some of which are managed, hosted provided and/or used for third-parties or their vendors, to assist in conducting our business. A significant breakdown, invasion, corruption, destruction or interruption of critical information technology systems or infrastructure, by our workforce, others with authorized access to our systems or unauthorized persons could negatively impact operations. The ever-increasing use and evolution of technology, including cloud-based computing, creates opportunities for the unintentional dissemination or intentional destruction of confidential information stored in our, or our third-party providers', systems, portable media or storage devices. We could also experience a business interruption, theft of confidential information or reputational damage from industrial espionage attacks, malware or other cyber-attacks, which may compromise our system infrastructure or lead to data leakage, either internally or at our third-party providers. Although the aggregate impact on our operations and financial condition has not been material to date, we have been the target of events of this nature and expect them to continue as cybersecurity threats have been rapidly evolving in sophistication and becoming more prevalent in the industry. We have invested in industry appropriate protections and monitoring practices of our data and IT to reduce these risks and continue to monitor our systems on an ongoing basis for any current or potential threats. We maintain cyber insurance, however, this insurance may not be sufficient to cover the financial, legal, business or reputational losses that may result from an interruption or breach of our systems. There can be no assurance that our continuing efforts will prevent breakdowns or breaches to our or our third-party providers' databases or systems that could adversely affect our business.
Adverse changes in U.S., global, regional, local economic and political conditions could adversely affect our profitability.
Global economic and political risks pose significant challenges to a company's growth and profitability and are difficult to mitigate. We generated approximately 45% of our revenues outside of the U.S. in 2017. As such, our revenues, earnings and cash flow are exposed to risk from a strengthening U.S. dollar. We have exposure to customer credit risks in Europe, South America and other markets including from government-guaranteed hospital receivables in markets where payments are not received on time. We have significant operations in Europe, including for manufacturing and distribution. The results of our operations could be negatively impacted by any member country exiting the eurozone monetary union or EU, including the planned exit of the UK from the EU. Of note, the exit of the UK from the EU may have an impact on our research, commercial and general business operations in the UK and the EU. In addition, future pension plan funding requirements continue to be sensitive to global economic conditions and the related impact on equity markets. Additionally, disruptions in the credit markets or a downgrade of our current credit rating could increase our future borrowing costs and impair our ability to access capital and credit markets on terms commercially acceptable to us, which could adversely affect our liquidity and capital resources or significantly increase our cost of capital. Finally, our business, operations may be adversely affected by political volatility, conflicts or crises in individual countries or regions, including terrorist activities or war.
There can be no guarantee that we will pay dividends or repurchase stock.
The declaration, amount and timing of any dividends fall within the discretion of our Board of Directors. The Board's decision will depend on many factors, including our financial condition, earnings, capital requirements, debt service obligations, industry practice, legal requirements, regulatory constraints and other factors that our Board of Directors may deem relevant. A reduction or elimination of our dividend payments or dividend program could adversely affect our stock price. In addition, we could, at any time, decide not to buy back any more shares in the market, which could also adversely affect our stock price.
Increased use of social media platforms present risks and challenges.
We are increasing our use of social media to communicate Company news and events. The inappropriate and/or unauthorized use of certain media vehicles could cause brand damage or information leakage or could lead to legal implications, including from the improper collection and/or dissemination of personally identifiable information from employees, patients, healthcare professionals or other stakeholders. In addition, negative or inaccurate posts or comments about us on any social networking website could damage our reputation, brand image and goodwill. Further, the disclosure of non-public Company-sensitive information by our workforce or others through external media channels could lead to information loss. Identifying new points of entry as social media continues to expand presents new challenges.
24
Item 1B. | UNRESOLVED STAFF COMMENTS. |
None.
Item 2. | PROPERTIES. |
Our principal executive offices are located at 345 Park Avenue, New York, NY. We own or lease manufacturing, R&D, administration, storage and distribution facilities at approximately 160 sites worldwide. We believe our manufacturing properties, in combination with our third-party manufacturers, provide adequate production capacity for our current operations. For further information about our manufacturing properties, refer to "Item 1. Business-Manufacturing and Quality Assurance."
Our significant manufacturing and R&D locations by geographic area were as follows at December 31, 2017 :
| Manufacturing |
| R&D | ||
United States | 4 | |
| 5 | |
Europe | 2 | |
| 2 | |
Total | 6 | |
| 7 | |
Item 3. | LEGAL PROCEEDINGS. |
Information pertaining to legal proceedings can be found in "Item 8. Financial Statements-Note 18 . Legal Proceedings and Contingencies" and is incorporated by reference herein.
Item 4. | MINE SAFETY DISCLOSURES. |
Not applicable.
25
PART IA
Executive Officers of the Registrant
Name and Current Position |
| Age |
| Employment History for the Past 5 Years | |
Giovanni Caforio, M.D. Chairman of the Board and Chief Executive Officer Member of the Leadership Team |
| 53 | |
| 2011 to 2013 – President, U.S. Pharmaceuticals 2013 to 2014 – Executive Vice President and Chief Commercial Officer 2014 to 2015 – Chief Operating Officer and Director of the Company 2015 to 2017 – Chief Executive Officer and Director of the Company 2017 to present – Chairman of the Board and Chief Executive Officer |
Charles A. Bancroft Chief Financial Officer and Executive Vice President, Global Business Operations Member of the Leadership Team |
| 58 | |
| 2011 to 2016 - Chief Financial Officer and Executive Vice President, Global Services |
Joseph C. Caldarella Senior Vice President and Corporate Controller |
| 62 | |
| 2010 to present – Senior Vice President and Corporate Controller |
John E. Elicker Senior Vice President, Corporate Affairs and Investor Relations Member of the Leadership Team |
| 58 | |
| 2012 to 2017 – Senior Vice President, Public Affairs and Investor Relations 2017 to present – Senior Vice President, Corporate Affairs and Investor Relations |
Murdo Gordon Executive Vice President, Chief Commercial Officer Member of the Leadership Team |
| 51 | |
| 2011 to 2013 – Senior Vice President, Oncology and Immunology 2013 to 2015 – President, U.S. Pharmaceuticals 2015 to 2016 – Senior Vice President, Head of Worldwide Markets 2016 to present – Executive Vice President, Chief Commercial Officer |
Ann Powell Judge Senior Vice President, Chief Human Resources Officer Member of the Leadership Team |
| 52 | |
| 2009 to 2013 – Chief Human Resources Officer, Shire Pharmaceuticals 2013 to 2016 – Senior Vice President, Global Human Resources 2016 to present – Senior Vice President, Chief Human Resources Officer |
Sandra Leung Executive Vice President, General Counsel Member of the Leadership Team |
| 57 | |
| 2007 to 2014 – General Counsel and Corporate Secretary 2014 to 2015 – Executive Vice President, General Counsel and Corporate Secretary 2015 to present – Executive Vice President, General Counsel |
Thomas J. Lynch., M.D. Executive Vice President and Chief Scientific Officer Member of the Leadership Team |
| 57 | |
| 2017 to present – Executive Vice President and Chief Scientific Officer |
Louis S. Schmukler Senior Vice President & President, Global Product Development and Supply Member of the Leadership Team |
| 62 | |
| 2011 to 2017 – President, Global Product Development and Supply 2017 to present – Senior Vice President & President, Global Product Development and Supply |
Paul von Autenried Senior Vice President, Chief Information Officer Member of the Leadership Team |
| 56 | |
| 2012 to 2016 – Senior Vice President, Enterprise Services and Chief Information Officer 2016 to present – Senior Vice President, Chief Information Officer |
26
PART II
Item 5. | MARKET FOR THE REGISTRANT'S COMMON STOCK AND OTHER STOCKHOLDER MATTERS. |
Market Prices
Bristol-Myers Squibb common stock is traded on the New York Stock Exchange (Symbol: BMY). A quarterly summary of the high and low closing market price is presented below:
|
| 2017 |
| 2016 | ||||||||||||
|
| High |
| Low |
| High |
| Low | ||||||||
Common: |
|
|
|
|
|
|
|
| ||||||||
First Quarter |
| $ | 60.13 | |
| $ | 46.82 | |
| $ | 68.35 | |
| $ | 58.87 | |
Second Quarter |
| 57.33 | |
| 51.66 | |
| 74.29 | |
| 64.91 | | ||||
Third Quarter |
| 63.74 | |
| 54.24 | |
| 76.77 | |
| 53.87 | | ||||
Fourth Quarter |
| 65.35 | |
| 59.94 | |
| 59.61 | |
| 49.23 | | ||||
Holders of Common Stock
The number of record holders of common stock at December 31, 2017 was 41,402 .
The number of record holders is based upon the actual number of holders registered on our books at such date and does not include holders of shares in "street names" or persons, partnerships, associations, corporations or other entities identified in security position listings maintained by depository trust companies.
Dividends
Our Board of Directors declared the following quarterly dividends per share, which were paid in the periods indicated below:
|
| Common |
| Preferred | ||||||||||||
|
| 2017 |
| 2016 |
| 2017 |
| 2016 | ||||||||
First Quarter |
| $ | 0.39 | |
| $ | 0.38 | |
| $ | 0.50 | |
| $ | 0.50 | |
Second Quarter |
| 0.39 | |
| 0.38 | |
| 0.50 | |
| 0.50 | | ||||
Third Quarter |
| 0.39 | |
| 0.38 | |
| 0.50 | |
| 0.50 | | ||||
Fourth Quarter |
| 0.39 | |
| 0.38 | |
| 0.50 | |
| 0.50 | | ||||
|
| $ | 1.56 | |
| $ | 1.52 | |
| $ | 2.00 | |
| $ | 2.00 | |
In December 2017 , our Board of Directors declared a quarterly dividend of $0.40 per share on our common stock which was paid on February 1, 2018 to shareholders of record as of January 5, 2018. The Board of Directors also declared a quarterly dividend of $0.50 per share on our preferred stock, payable on March 1, 2018 to shareholders of record as of February 6, 2018.
UNREGISTERED SALES OF EQUITY SECURITIES AND USE OF PROCEEDS
The following table summarizes the surrenders of our equity securities during the three months ended December 31, 2017 :
Period | Total Number of Shares Purchased (a) |
| Average Price Paid per Share (a) |
| Total Number of Shares Purchased as Part of Publicly Announced Programs (b) |
| Approximate Dollar Value of Shares that May Yet Be Purchased Under the Programs (b) | ||||||
Dollars in Millions, Except Per Share Data |
|
|
|
|
|
|
| ||||||
October 1 to 31, 2017 | 1,498,834 | |
| $ | 63.02 | |
| 1,491,785 | |
| $ | 1,818 | |
November 1 to 30, 2017 | 1,444,201 | |
| $ | 61.85 | |
| 1,434,937 | |
| $ | 1,729 | |
December 1 to 31, 2017 | 1,121,513 | |
| $ | 62.11 | |
| 1,099,102 | |
| $ | 1,661 | |
Three months ended December 31, 2017 | 4,064,548 | |
|
|
| 4,025,824 | |
|
| ||||
(a) | Includes shares repurchased as part of publicly announced programs and shares of common stock surrendered to the Company to satisfy tax withholding obligations in connection with the vesting of awards under our long-term incentive program. |
(b) | In May 2010, the Board of Directors authorized the repurchase of up to $3.0 billion of common stock and in June 2012 increased its authorization for the repurchase of common stock by an additional $3.0 billion. In October 2016, the Board of Directors approved a new share repurchase program authorizing the repurchase of an additional $3.0 billion of common stock. The stock repurchase program does not have an expiration date. |
27
Item 6. | SELECTED FINANCIAL DATA. |
Five Year Financial Summary
Amounts in Millions, except per share data |
| 2017 |
| 2016 |
| 2015 |
| 2014 |
| 2013 | ||||||||||
Income Statement Data: (a) |
|
|
|
|
|
|
|
|
|
| ||||||||||
Total Revenues |
| $ | 20,776 | |
| $ | 19,427 | |
| $ | 16,560 | |
| $ | 15,879 | |
| $ | 16,385 | |
|
|
|
|
|
|
|
|
|
|
| ||||||||||
Net Earnings |
| 975 | |
| 4,507 | |
| 1,631 | |
| 2,029 | |
| 2,580 | | |||||
Net Earnings/(Loss) Attributable to: |
|
|
|
|
|
|
|
|
|
| ||||||||||
Noncontrolling Interest |
| (32 | ) |
| 50 | |
| 66 | |
| 25 | |
| 17 | | |||||
BMS |
| 1,007 | |
| 4,457 | |
| 1,565 | |
| 2,004 | |
| 2,563 | | |||||
|
|
|
|
|
|
|
|
|
|
| ||||||||||
Net Earnings per Common Share Attributable to BMS: |
|
|
|
|
|
|
|
|
|
| ||||||||||
Basic |
| $ | 0.61 | |
| $ | 2.67 | |
| $ | 0.94 | |
| $ | 1.21 | |
| $ | 1.56 | |
Diluted |
| $ | 0.61 | |
| $ | 2.65 | |
| $ | 0.93 | |
| $ | 1.20 | |
| $ | 1.54 | |
|
|
|
|
|
|
|
|
|
|
| ||||||||||
Average common shares outstanding: |
|
|
|
|
|
|
|
|
|
| ||||||||||
Basic |
| 1,645 | |
| 1,671 | |
| 1,667 | |
| 1,657 | |
| 1,644 | | |||||
Diluted |
| 1,652 | |
| 1,680 | |
| 1,679 | |
| 1,670 | |
| 1,662 | | |||||
|
|
|
|
|
|
|
|
|
|
| ||||||||||
Cash dividends paid on BMS common and preferred stock |
| $ | 2,577 | |
| $ | 2,547 | |
| $ | 2,477 | |
| $ | 2,398 | |
| $ | 2,309 | |
|
|
|
|
|
|
|
|
|
|
| ||||||||||
Cash dividends declared per common share |
| $ | 1.57 | |
| $ | 1.53 | |
| $ | 1.49 | |
| $ | 1.45 | |
| $ | 1.41 | |
|
|
|
|
|
|
|
|
|
|
| ||||||||||
Financial Position Data at December 31: |
|
|
|
|
|
|
|
|
|
| ||||||||||
Cash and cash equivalents |
| $ | 5,421 | |
| $ | 4,237 | |
| $ | 2,385 | |
| $ | 5,571 | |
| $ | 3,586 | |
Marketable securities (b) |
| 3,871 | |
| 4,832 | |
| 6,545 | |
| 6,272 | |
| 4,686 | | |||||
Total Assets |
| 33,551 | |
| 33,707 | |
| 31,748 | |
| 33,749 | |
| 38,592 | | |||||
Long-term debt (b) |
| 6,975 | |
| 6,465 | |
| 6,550 | |
| 7,242 | |
| 7,981 | | |||||
Equity |
| 11,847 | |
| 16,347 | |
| 14,424 | |
| 14,983 | |
| 15,236 | | |||||
(a) | For a discussion of items that affected the comparability of results for the years 2017 , 2016 and 2015 , refer to "Item 7. Management's Discussion and Analysis of Financial Condition and Results of Operations-Non-GAAP Financial Measures." |
(b) | Includes current and non-current portion. |
28
Item 7. MANAGEMENT'S DISCUSSION AND ANALYSIS OF FINANCIAL CONDITION AND RESULTS OF OPERATIONS.
EXECUTIVE SUMMARY
Bristol-Myers Squibb Company is a global specialty biopharmaceutical company whose mission is to discover, develop and deliver innovative medicines that help patients prevail over serious diseases. Refer to the Summary of Abbreviated Terms at the end of this 2017 Form 10-K for terms used throughout the document.
In 2017, we received 15 approvals for new medicines and additional indications and formulations of currently marketed medicines in major markets (the U.S., EU, Japan and China) including multiple regulatory milestone achievements for Opdivo . We are committed to investigating Opdivo alone and in combination with Yervoy and other anti-cancer agents for a wide array of tumor types, including broad programs in lung, head & neck, liver, kidney, bladder and gastric. We continue to believe that the breadth and depth of our IO portfolio positions us well for the future. We have 17 new IO compounds in clinical development and studies across more than 35 different tumor types. In addition, we advanced certain other non-IO R&D programs in our pipeline, including FGF21 for the treatment of NASH and TYK-2 inhibitor for the treatment of immune diseases such as psoriasis. We also continued to progress our company transformation initiatives enabling us to invest in our highest priority portfolio opportunities.
In 2017, our revenues increased 7% as a result of higher demand for our prioritized brands including Opdivo and Eliquis partially offset by increased competition for established brands, primarily Daklinza . The $2.04 decrease in GAAP EPS was due to tax charges attributed to tax reform ( $1.76 per share) and to a lesser extent higher license, asset acquisition and restructuring related charges and lower divestiture- related income. These items were partially offset by higher revenues, royalties and licensing income and a patent-infringement settlement. After adjusting for the impact of tax reform and other specified items, non-GAAP EPS increased $0.18 primarily as a result of higher revenues partially offset by product mix and higher R&D expenses supporting Opdivo and other IO programs.
In 2016, our revenues increased 17% as a result of higher demand for our prioritized brands including Opdivo and Eliquis partially offset by the expiration of our U.S. commercialization rights to Abilify *, the transfer of Erbitux * rights in North America and increased competition for Reyataz , Sustiva and Baraclude in certain markets. The $1.72 increase in GAAP EPS was due to higher revenues, divestiture-related income and lower license and asset acquisition charges partially offset by higher Opdivo related expenses. After adjusting for the impact of divestiture gains, R&D license and asset acquisition charges and other specified items, non-GAAP EPS increased by $0.82 primarily as a result of higher revenues partially offset by product mix.
Highlights
The following table summarizes our financial information:
|
| Year Ended December 31, | ||||||||||
Dollars in Millions, except per share data |
| 2017 |
| 2016 |
| 2015 | ||||||
Total Revenues |
| $ | 20,776 | |
| $ | 19,427 | |
| $ | 16,560 | |
|
|
|
|
|
|
| ||||||
Diluted Earnings Per Share |
|
|
|
|
|
| ||||||
GAAP |
| 0.61 | |
| 2.65 | |
| 0.93 | | |||
Non-GAAP |
| 3.01 | |
| 2.83 | |
| 2.01 | | |||
Our non-GAAP financial measures, including non-GAAP earnings and related EPS information, are adjusted to exclude specified items that represent certain costs, expenses, gains and losses and other items impacting the comparability of financial results. For a detailed listing of all specified items and further information and reconciliations of non-GAAP financial measures refer to "-Non-GAAP Financial Measures."
29
Significant Product and Pipeline Approvals
The following is a summary of the 15 significant approvals received in 2017 .
Product | Date | Approval |
Opdivo | December 2017 | FDA approval of injection for intravenous use for the adjuvant treatment of patients with melanoma with involvement of lymph nodes or metastatic disease who have undergone complete resection. |
September 2017 | FDA approval for the treatment of patients with HCC, a type of liver cancer, who have been previously treated with sorafenib. | |
Approval in Japan for the treatment of unresectable advanced or recurrent gastric cancer which has progressed after chemotherapy, received by our alliance partner, Ono. | ||
August 2017 | FDA approval for the treatment of adult and pediatric patients with MSI-H or dMMR mCRC that has progressed following treatment with a fluoropyrimidine, oxaliplatin and irinotecan. | |
June 2017 | EC approval for the treatment of patients with previously treated locally advanced unresectable or metastatic urothelial carcinoma, a type of bladder cancer, in adults after failure of platinum-containing therapy. | |
April 2017 | EC approval for the treatment of SCCHN in adults progressing on or after platinum-based therapy. | |
March 2017 | Approval in Japan for the treatment of recurrent or metastatic HNC, received by our alliance partner, Ono. | |
February 2017 | FDA approval for the treatment of patients with previously treated locally advanced or metastatic urothelial carcinoma. | |
Orencia | July 2017 | EC approval for the treatment of active PsA in adults for whom the response to previous disease-modifying antirheumatic drug therapy, including methotrexate, has been inadequate, and additional systemic therapy for psoriatic skin lesions is not required. |
FDA approval for the treatment of active PsA in adults. | ||
March 2017 | FDA approval of a new subcutaneous administration option for use in patients two years of age and older with moderately to severely active polyarticular JIA. | |
Sprycel | November 2017 | FDA expanded the indication for Sprycel tablets to include the treatment of children with Philadelphia chromosome-positive CML in chronic phase. |
Yervoy | July 2017 | FDA approval of an expanded indication for the treatment of unresectable or metastatic melanoma in pediatric patients. |
Hepatitis C Franchise | April 2017 | China FDA approval of the Daklinza and Sunvepra regimen for treatment-naive or experienced patients infected with genotype 1b chronic HCV. In addition, Daklinza was approved in China for combination use with other agents, including sofosbuvir, for adult patients with HCV genotypes 1-6 infection. |
Refer to "-Product and Pipeline Developments" for all of the developments in our marketed products and late-stage pipeline in 2017 and in early 2018.
Strategy
Our focus as a specialty biopharmaceutical company is on discovering, developing and delivering transformational medicines that address serious unmet medical needs. Our strategy is to combine the resources, scale and capability of a pharmaceutical company with the speed and focus on innovation of the biotech industry. Our four strategic priorities are to drive business performance, continue to build a leading franchise in IO, maintain a diversified portfolio both within and outside of IO, and continue our disciplined approach to capital allocation, including establishing partnerships, collaborations and in-licensing or acquiring investigational compounds as an essential component of successfully delivering transformational medicines to patients.
30
We are developing new medicines in the following core therapeutic areas: (1) oncology with a priority in IO; (2) immunoscience with priorities in lupus, rheumatoid arthritis and inflammatory bowel disease; (3) cardiovascular with a priority in heart disease and; (4) fibrotic disease with priorities in lung and liver. We continue to advance the next wave of innovative medicines by investing significantly in our pipeline both internally and through business developments activities. In IO, we continue to invest in monotherapy studies, combination approaches, and our next wave of early assets. We have entered into several collaboration agreements and expanded others to research and develop Opdivo and other approved or investigational oncology agents in combination regimens. We remain focused and well-resourced in our cancer development programs and seek to broaden the use of Opdivo in earlier lines of therapy, expand into new tumors, accelerate next wave IO mechanisms and develop treatment options for refractory IO patients. Beyond cancer, we continue to advance our early stage portfolio in immunoscience, cardiovascular, and fibrotic diseases and strengthen our partnerships with a diverse group of companies and academic institutions in new and expanded research activities. We believe our differentiated internal and external focus contributes to the advancing of our pipeline of potentially transformational medicines.
Our commercial model has been evolving and revenues from our marketed product portfolio continue to grow which demonstrates strong execution of our strategy. We continue to drive growth of Opdivo by expanding into additional indications and tumor types both as a monotherapy and in combination with Yervoy and other anti-cancer agents. Eliquis continues to grow, leveraging its best in class clinical profile and extensive real world data, and is now the number one novel oral anticoagulant in total prescriptions in the U.S. We are building on the continued success of our other prioritized brands and remain strongly committed to Orencia and Sprycel . Through our operating model transformation, our commercial infrastructure is uniquely leveraged for potential growth.
Our operating model continues to evolve and we have been successful in focusing commercial and R&D resources on prioritized brands and markets, strengthening our R&D capabilities in tumor biology, patient selection, and new biomarkers, delivering leaner administrative functions and streamlining our manufacturing network to reflect the importance of biologics in our current and future portfolio. The evolution in our operating model will enable us to deliver the necessary strategic, financial and operational flexibility to invest in the highest priority opportunities within our portfolio.
Looking ahead, we will continue to implement our biopharma strategy by driving the growth of key brands, executing product launches, investing in our diverse and innovative pipeline, aided by strategic business development, focusing on prioritized markets, increasing investments in our biologics manufacturing capabilities and maintaining a culture of continuous improvement.
Acquisition and Licensing Arrangements
Acquisition and licensing arrangements allow us to focus our resources behind our growth opportunities that drive the greatest long-term value. We are focused on the following core therapeutic areas: oncology, including IO, immunoscience, cardiovascular and fibrosis. Significant arrangements during the past three years are summarized below. Refer to "Item 8. Financial Statements-Note 4 . Acquisitions, Divestitures and Licensing Arrangements" for further information.
2017 Arrangements
Ono : BMS acquired an exclusive license to develop and commercialize ONO-4578, Ono's Prostaglandin E2 receptor 4 antagonist for the treatment of cancer. BMS acquired worldwide rights except in Japan, South Korea, and Taiwan where it was added to the existing collaboration and in China and ASEAN countries where Ono retained exclusive rights.
Halozyme : BMS and Halozyme entered into a global collaboration and license agreement to develop subcutaneously administered BMS IO medicines using Halozyme's ENHANZE * drug-delivery technology which may allow for more rapid delivery of large volume injectable medications.
IFM : BMS acquired all of the outstanding shares of IFM providing BMS with full rights to IFM's preclinical STING and NLRP3 agonist programs focused on enhancing the innate immune response for treating cancer.
Biogen : BMS out-licensed to Biogen exclusive rights to develop and commercialize BMS-986168, an anti-eTau compound in development for Progressive Supranuclear Palsy.
Roche : BMS out-licensed to Roche exclusive rights to develop and commercialize BMS-986089, an anti-myostatin adnectin in development for Duchenne Muscular Dystrophy.
CytomX : BMS and CytomX expanded their initial 2014 strategic collaboration to discover novel cancer treatment therapies that will include up to eight additional targets using CytomX's proprietary Probody platform for the treatment of cancer.
31
2016 Arrangements
PsiOxus : BMS acquired exclusive worldwide rights to PsiOxus's NG-348, a pre-clinical stage, "armed" oncolytic virus with the goal of addressing solid tumors.
Padlock : BMS acquired all of the outstanding shares of Padlock providing BMS with full rights to Padlock's PAD inhibitor discovery program focused on the development of treatment approaches for patients with rheumatoid arthritis.
Cormorant : BMS acquired all of the outstanding shares of Cormorant providing BMS with full rights to Cormorant's lead candidate HuMax-IL8, a monoclonal antibody that represents a potentially complementary IO mechanism of action to T-cell directed antibodies and co-stimulatory molecules.
Nitto Denko : BMS acquired an exclusive worldwide license to develop and commercialize Nitto Denko's investigational siRNA molecules targeting heat shock protein 47 (HSP47) in vitamin A containing formulations including Nitto Denko's lead asset ND-L02-s0201, currently in development for the treatment of advanced liver fibrosis, and the option to receive exclusive licenses for HSP47 siRNAs in vitamin A containing formulations for the treatment of lung and other organ fibrosis.
2015 Arrangements
Flexus : BMS acquired all of the outstanding shares of Flexus providing BMS with full rights to F001287, a preclinical small molecule IDO1-inhibitor targeted immunotherapy with potential to be used in combination with BMS's immuno-oncology portfolio. In addition, the transaction included Flexus's IDO/TDO discovery program which included its IDO-selective, IDO/TDO dual and TDO-selective compounds.
Cardioxyl : BMS acquired all of the outstanding shares of Cardioxyl providing BMS with full rights to CXL-1427, a nitroxyl prodrug in development for acute decompensated heart failure.
Five Prime : BMS and Five Prime entered into an exclusive worldwide licensing and collaboration agreement to develop and commercialize Five Prime's CSF1R antibody program, including cabiralizumab currently in development for IO indications and PVNS. BMS is responsible for the development, manufacturing and commercialization of cabiralizumab, subject to Five Prime's option to conduct certain studies at its cost to develop cabiralizumab in PVNS and in combination with its own internal oncology pipeline assets.
Promedior : BMS acquired a warrant providing BMS exclusive rights to acquire Promedior, whose lead asset, PRM-151, is being developed for the treatment of IPF and MF. The warrant is exercisable upon being provided data following completion of either of the IPF or MF Phase II clinical studies being directed by Promedior.
Bavarian Nordic : BMS acquired an exclusive option to globally license and commercialize Prostvac *, Bavarian Nordic's investigational Phase III prostate-specific antigen-targeting cancer immunotherapy in development for the treatment of asymptomatic or minimally symptomatic metastatic castration-resistant prostate cancer. In 2017, an independent Data Monitoring Committee determined that the continuation of the Phase III PROSPECT study of Prostvac * in patients with metastatic castration-resistant prostate cancer is futile.
uniQure : BMS entered into a collaboration and license agreement with uniQure granting BMS an exclusive license to uniQure's gene therapy technology platform for up to 10 specific collaboration targets. The collaboration includes uniQure's proprietary gene therapy program for congestive heart failure that is intended to restore the heart's ability to synthesize S100A1, a calcium sensor and master regulator of heart function, and thereby improve clinical outcomes for patients with reduced ejection fraction.
32
RESULTS OF OPERATIONS
Regional Revenues
The composition of the changes in revenues was as follows:
|
| Year Ended December 31, |
| 2017 vs. 2016 |
| 2016 vs. 2015 | ||||||||||||||||||
|
| Total Revenues |
| Analysis of % Change |
| Analysis of % Change | ||||||||||||||||||
|
|
|
|
|
|
|
| Total |
| Foreign |
| Total |
| Foreign | ||||||||||
Dollars in Millions |
| 2017 |
| 2016 |
| 2015 |
| Change |
| Exchange (b) |
| Change |
| Exchange (b) | ||||||||||
United States |
| $ | 11,358 | |
| $ | 10,720 | |
| $ | 8,188 | |
| 6 | % |
| - | |
| 31 | % |
| - | |
Europe |
| 4,988 | |
| 4,215 | |
| 3,491 | |
| 18 | % |
| 1 | % |
| 21 | % |
| (2 | )% | |||
Rest of the World |
| 3,877 | |
| 3,964 | |
| 4,142 | |
| (2 | )% |
| - | |
| (4 | )% |
| (4 | )% | |||
Other (a) |
| 553 | |
| 528 | |
| 739 | |
| 5 | % |
| N/A | |
| (29 | )% |
| N/A | | |||
Total |
| $ | 20,776 | |
| $ | 19,427 | |
| $ | 16,560 | |
| 7 | % |
| - | |
| 17 | % |
| (2 | )% |
(a) | Other revenues include royalties and alliance-related revenues for products not sold by our regional commercial organizations. |
(b) | Foreign exchange impacts were derived by applying the prior period average currency rates to the current period sales. |
U.S. revenues increased in 2017 due to higher demand for Eliquis and Opdivo partially offset by lower demand for established brands due to increased competition, primarily Daklinza and HIV brands. The lower growth rate in the U.S. was due to additional competition for Opdivo and Daklinza . Average U.S. net selling prices were approximately 2% higher after charge-backs, rebates and discounts. Refer to "-Product Revenues Commentary" for additional information.
U.S. revenues increased in 2016 due to higher demand for Opdivo , Eliquis and Daklinza , partially offset by the full year impact of the expiration/transfer of commercialization rights to Abilify* and Erbitux* . Average U.S. net selling prices were approximately 5% higher after charge-backs, rebates and discounts.
Europe revenues increased in 2017 due to higher demand for Opdivo and Eliquis partially offset by lower demand for Daklinza due to increased competition. Europe revenues increased in 2016 due to higher demand for Opdivo and Eliquis partially offset by lower demand for Yervoy .
Rest of the World revenues decreased in 2017 due to lower demand for established brands, including Daklinza , due to increased competition and out-licensing of a mature brand product, partially offset by higher demand for Opdivo and Eliquis . Rest of the World revenues decreased in 2016 due to increased competition for the Hepatitis C Franchise in Japan and unfavorable foreign exchange (primarily Latin America) partially offset by higher demand for Opdivo and Eliquis.
Other revenues decreased in 2016 as a result of the expiration of certain supply arrangements. Refer to "Item 8. Financial Statements-Note 3 . Alliances" for further discussion of the alliances.
No single country outside the U.S. contributed more than 10% of total revenues except for Japan which contributed 10% of total revenues in 2015.
33
GTN Adjustments
We recognize revenue net of GTN adjustments that are further described in "-Critical Accounting Policies". Our share of certain Abilify* and Atripla* revenues is reflected net of all GTN adjustments in alliance and other revenues.
The activities and ending reserve balances for each significant category of GTN adjustments were as follows:
Dollars in Millions |
| Charge-Backs and Cash Discounts |
| Medicaid and Medicare Rebates |
| Other Rebates, Returns, Discounts and Adjustments |
| Total | ||||||||
Balance at January 1, 2016 |
| $ | 97 | |
| $ | 434 | |
| $ | 890 | |
| $ | 1,421 | |
Provision related to sale made in: |
|
|
|
|
|
|
|
| ||||||||
Current period |
| 1,582 | |
| 1,438 | |
| 1,797 | |
| 4,817 | | ||||
Prior period |
| - | |
| (56 | ) |
| (99 | ) |
| (155 | ) | ||||
Payments and returns |
| (1,553 | ) |
| (1,296 | ) |
| (1,397 | ) |
| (4,246 | ) | ||||
Foreign currency translation and other |
| - | |
| - | |
| (31 | ) |
| (31 | ) | ||||
Balance at December 31, 2016 |
| $ | 126 | |
| $ | 520 | |
| $ | 1,160 | |
| $ | 1,806 | |
Provision related to sale made in: |
|
|
|
|
|
|
|
| ||||||||
Current period |
| 2,087 | |
| 2,090 | |
| 2,135 | |
| 6,312 | | ||||
Prior period |
| (3 | ) |
| (4 | ) |
| (64 | ) |
| (71 | ) | ||||
Payments and returns |
| (2,004 | ) |
| (1,810 | ) |
| (2,107 | ) |
| (5,921 | ) | ||||
Foreign currency translation and other |
| 3 | |
| - | |
| 104 | |
| 107 | | ||||
Balance at December 31, 2017 |
| $ | 209 | |
| $ | 796 | |
| $ | 1,228 | |
| $ | 2,233 | |
The reconciliation of gross product sales to net product sales by each significant category of GTN adjustments was as follows (excluding alliance and other revenues such as Abilify* and Atripla* ):
|
| Year Ended December 31, |
| % Change | ||||||||||||||
Dollars in Millions |
| 2017 |
| 2016 |
| 2015 |
| 2017 vs. 2016 |
| 2016 vs. 2015 | ||||||||
Gross product sales |
| $ | 25,499 | |
| $ | 22,364 | |
| $ | 17,166 | |
| 14 | % |
| 30 | % |
GTN Adjustments |
|
|
|
|
|
|
|
|
|
| ||||||||
Charge-backs and cash discounts |
| (2,084 | ) |
| (1,582 | ) |
| (1,043 | ) |
| 32 | % |
| 52 | % | |||
Medicaid and Medicare rebates |
| (2,086 | ) |
| (1,382 | ) |
| (859 | ) |
| 51 | % |
| 61 | % | |||
Other rebates, returns, discounts and adjustments |
| (2,071 | ) |
| (1,698 | ) |
| (1,219 | ) |
| 22 | % |
| 39 | % | |||
Total GTN Adjustments |
| (6,241 | ) |
| (4,662 | ) |
| (3,121 | ) |
| 34 | % |
| 49 | % | |||
Net product sales |
| $ | 19,258 | |
| $ | 17,702 | |
| $ | 14,045 | |
| 9 | % |
| 26 | % |
|
|
|
|
|
|
|
|
|
|
| ||||||||
GTN adjustments percentage |
| 24 | % |
| 21 | % |
| 18 | % |
| 3 | % |
| 3 | % | |||
U.S. |
| 31 | % |
| 26 | % |
| 25 | % |
| 5 | % |
| 1 | % | |||
Non-U.S. |
| 13 | % |
| 13 | % |
| 11 | % |
| - | |
| 2 | % | |||
GTN adjustments are primarily a function of product sales volume, regional and payer channel mix, contractual or legislative discounts and rebates. GTN adjustments are increasing at a higher rate than gross product sales due to higher U.S. Eliquis gross product sales, which has a relatively high GTN adjustment percentage as a result of competitive pressures to maintain its position on healthcare payer formularies allowing patients continued access through their medical plans.
34
Product Revenues
|
| Year Ended December 31, |
| % Change | ||||||||||||||
Dollars in Millions |
| 2017 |
| 2016 |
| 2015 |
| 2017 vs. 2016 |
| 2016 vs. 2015 | ||||||||
Prioritized Brands |
|
|
|
|
|
|
|
|
|
| ||||||||
Opdivo |
| $ | 4,948 | |
| $ | 3,774 | |
| $ | 942 | |
| 31 | % |
| ** | |
U.S. |
| 3,102 | |
| 2,664 | |
| 823 | |
| 16 | % |
| ** | | |||
Non-U.S. |
| 1,846 | |
| 1,110 | |
| 119 | |
| 66 | % |
| ** | | |||
|
|
|
|
|
|
|
|
|
|
| ||||||||
Eliquis |
| 4,872 | |
| 3,343 | |
| 1,860 | |
| 46 | % |
| 80 | % | |||
U.S. |
| 2,887 | |
| 1,963 | |
| 1,023 | |
| 47 | % |
| 92 | % | |||
Non-U.S. |
| 1,985 | |
| 1,380 | |
| 837 | |
| 44 | % |
| 65 | % | |||
|
|
|
|
|
|
|
|
|
|
| ||||||||
Orencia |
| 2,479 | |
| 2,265 | |
| 1,885 | |
| 9 | % |
| 20 | % | |||
U.S. |
| 1,704 | |
| 1,532 | |
| 1,271 | |
| 11 | % |
| 21 | % | |||
Non-U.S. |
| 775 | |
| 733 | |
| 614 | |
| 6 | % |
| 19 | % | |||
|
|
|
|
|
|
|
|
|
|
| ||||||||
Sprycel |
| 2,005 | |
| 1,824 | |
| 1,620 | |
| 10 | % |
| 13 | % | |||
U.S. |
| 1,105 | |
| 969 | |
| 829 | |
| 14 | % |
| 17 | % | |||
Non-U.S. |
| 900 | |
| 855 | |
| 791 | |
| 5 | % |
| 8 | % | |||
|
|
|
|
|
|
|
|
|
|
| ||||||||
Yervoy |
| 1,244 | |
| 1,053 | |
| 1,126 | |
| 18 | % |
| (6 | )% | |||
U.S. |
| 908 | |
| 802 | |
| 602 | |
| 13 | % |
| 33 | % | |||
Non-U.S. |
| 336 | |
| 251 | |
| 524 | |
| 34 | % |
| (52 | )% | |||
|
|
|
|
|
|
|
|
|
|
| ||||||||
Empliciti |
| 231 | |
| 150 | |
| 3 | |
| 54 | % |
| ** | | |||
U.S. |
| 151 | |
| 133 | |
| 3 | |
| 14 | % |
| ** | | |||
Non-U.S. |
| 80 | |
| 17 | |
| - | |
| ** | |
| N/A | | |||
|
|
|
|
|
|
|
|
|
|
| ||||||||
Established Brands |
|
|
|
|
|
|
|
|
|
| ||||||||
Baraclude |
| 1,052 | |
| 1,192 | |
| 1,312 | |
| (12 | )% |
| (9 | )% | |||
U.S. |
| 53 | |
| 66 | |
| 135 | |
| (20 | )% |
| (51 | )% | |||
Non-U.S. |
| 999 | |
| 1,126 | |
| 1,177 | |
| (11 | )% |
| (4 | )% | |||
|
|
|
|
|
|
|
|
|
|
| ||||||||
Sustiva Franchise |
| 729 | |
| 1,065 | |
| 1,252 | |
| (32 | )% |
| (15 | )% | |||
U.S. |
| 622 | |
| 901 | |
| 1,041 | |
| (31 | )% |
| (13 | )% | |||
Non-U.S. |
| 107 | |
| 164 | |
| 211 | |
| (35 | )% |
| (22 | )% | |||
|
|
|
|
|
|
|
|
|
|
| ||||||||
Reyataz Franchise |
| 698 | |
| 912 | |
| 1,139 | |
| (23 | )% |
| (20 | )% | |||
U.S. |
| 327 | |
| 484 | |
| 591 | |
| (32 | )% |
| (18 | )% | |||
Non-U.S. |
| 371 | |
| 428 | |
| 548 | |
| (13 | )% |
| (22 | )% | |||
|
|
|
|
|
|
|
|
|
|
| ||||||||
Hepatitis C Franchise |
| 406 | |
| 1,578 | |
| 1,603 | |
| (74 | )% |
| (2 | )% | |||
U.S. |
| 109 | |
| 827 | |
| 323 | |
| (87 | )% |
| ** | | |||
Non-U.S. |
| 297 | |
| 751 | |
| 1,280 | |
| (60 | )% |
| (41 | )% | |||
|
|
|
|
|
|
|
|
|
|
| ||||||||
Other Brands |
| 2,112 | |
| 2,271 | |
| 3,818 | |
| (7 | )% |
| (41 | )% | |||
U.S. |
| 390 | |
| 379 | |
| 1,547 | |
| 3 | % |
| (76 | )% | |||
Non-U.S. |
| 1,722 | |
| 1,892 | |
| 2,271 | |
| (9 | )% |
| (17 | )% | |||
|
|
|
|
|
|
|
|
|
|
| ||||||||
Total Revenues |
| 20,776 | |
| 19,427 | |
| 16,560 | |
| 7 | % |
| 17 | % | |||
U.S. |
| 11,358 | |
| 10,720 | |
| 8,188 | |
| 6 | % |
| 31 | % | |||
Non-U.S. |
| 9,418 | |
| 8,707 | |
| 8,372 | |
| 8 | % |
| 4 | % | |||
** Change in excess of 100%
35
Opdivo (nivolumab) - a fully human monoclonal antibody that binds to the PD-1 on T and NKT cells that has been approved for several anti-cancer indications including bladder, blood, colon, head and neck, kidney, liver, lung, melanoma and stomach and continues to be investigated across other tumor types and disease areas.
• | U.S. revenues increased in both periods due to higher demand. We expect increased competition for Opdivo to continue in the future due to new product entrants and expanded indications. |
• | International revenues increased in both periods due to higher demand as a result of launches of additional indications and approvals in new countries. |
Eliquis (apixaban) - an oral Factor Xa inhibitor, targeted at stroke prevention in adult patients with non-valvular atrial fibrillation and the prevention and treatment of VTE disorders.
• | U.S. and international revenues increased in both periods due to higher demand resulting from increased commercial acceptance of novel oral anticoagulants and market share gains. |
Orencia (abatacept) - a fusion protein indicated for adult patients with moderate to severe active RA and PsA and is also indicated for reducing signs and symptoms in certain pediatric patients with moderately to severely active polyarticular juvenile idiopathic arthritis.
• | U.S. revenues increased in both periods due to higher average net selling prices and demand. |
• | International revenues increased in both periods due to higher demand. |
Sprycel (dasatinib) - an oral inhibitor of multiple tyrosine kinase indicated for the first-line treatment of adults with Philadelphia chromosome-positive chronic myeloid leukemia in chronic phase and the treatment of adults with chronic, accelerated, or myeloid or lymphoid blast phase CML with resistance or intolerance to prior therapy, including Gleevec* (imatinib meslylate).
• | U.S. revenues increased in both periods due to higher demand and average net selling prices. |
• | International revenues increased in both periods due to higher demand. We may experience a decline in European revenues in the event that generic datasinib product enters the market. |
Yervoy (ipilimumab) - a monoclonal antibody for the treatment of patients with unresectable or metastatic melanoma.
• | U.S. revenues increased in both periods primarily due to higher demand. |
• | International revenues increased in 2017 due to higher demand in Europe following the approval of the Opdivo+Yervoy combination therapy for melanoma. International revenues decreased in 2016 due to lower demand resulting from the introduction of other IO products being used to treat patients with melanoma, including Opdivo . |
Empliciti (elotuzumab) - a humanized monoclonal antibody for the treatment of multiple myeloma.
• | Empliciti was launched in the U.S. in December 2015, in the EU in May 2016 and in Japan in September 2016. |
Baraclude (entecavir) - an oral antiviral agent for the treatment of chronic hepatitis B.
• | International revenues continued to decrease in both periods due to lower demand resulting from increased competition. |
Sustiva (efavirenz) Franchise - a non-nucleoside reverse transcriptase inhibitor for the treatment of HIV, which includes Sustiva , an antiretroviral drug, and bulk efavirenz, which is also included in the combination therapy, Atripla*.
• | U.S. revenues continued to decrease in both periods due to lower demand resulting from increased competition from new product entrants. The decrease in 2016 was partially offset by higher average net selling prices. The LOE occurred in December 2017. Gilead terminated BMS's participation in the U.S. and Canada joint venture following the launch of a generic version of Sustiva in the U.S. As a result, BMS's share of Atripla * revenues will further decline during the next three years. Refer to "Item 8. Financial Statements-Note 3 . Alliances" for further discussion. |
Reyataz (atazanavir sulfate) Franchise - Includes Reyataz - a protease inhibitor for the treatment of HIV and Evotaz (atazanavir 300 mg and cobicistat 150 mg) - a combination therapy containing Reyataz and Tybost* (cobicistat).
• | U.S. revenues continued to decrease due to lower demand resulting from new product entrants. The decrease in 2016 was partially offset by higher average net selling prices. The LOE occurred in December 2017 and will result in a higher decline in revenues in future periods due to generic competition. |
• | International revenues continued to decrease in both periods due to lower demand resulting from increased competition. The decrease in 2016 was also impacted by unfavorable foreign exchange. |
36
Hepatitis C Franchise - Daklinza (daclatasvir) - an NS5A replication complex inhibitor; Sunvepra (asunaprevir) - an NS3 protease inhibitor; and beclabuvir - an NS5B inhibitor.
• | U.S. revenues decreased in 2017 due to lower demand resulting from new product entrants. U.S. revenues increased in 2016 due to the launch of Daklinza in July 2015. |
• | International revenues decreased in both periods due to lower demand resulting from increased competition due to new product entrants. |
Other Brands - includes all other brands, including those which have lost exclusivity in major markets, OTC brands and royalty revenue.
• | U.S. revenues decreased in 2016 due to the expiration of BMS's commercialization rights to Abilify* in April 2015 and the transfer of BMS's North American Erbitux* rights to Lilly in October 2015. Refer to "Item 8. Financial Statements-Note 3 . Alliances" for further discussion. |
• | International revenues decreased in 2017 due to out-licensing and divestiture of certain other brands and continued generic erosion. International revenues decreased in 2016 due to the expiration of certain supply arrangements, divestiture of certain other brands, increased competition for OTC brands and unfavorable foreign exchange. |
Estimated End-User Demand
Pursuant to the SEC Consent Order described under "-SEC Consent Order", we monitor the level of inventory on hand in the U.S. wholesaler distribution channel and outside of the U.S. in the direct customer distribution channel. We are obligated to disclose products with levels of inventory in excess of one month on hand or expected demand, subject to a de minimis exception. Estimated levels of inventory in the distribution channel in excess of one month on hand for the following products were not material to our results of operations as of the dates indicated. At December 31, 2017, Daklinza had 1.7 months of inventory on hand in the U.S. as a result of minimum required stock levels to support patient demand. We expect inventory on hand levels of Daklinza to exceed one month over the near term. Below are international products that had estimated levels of inventory in the distribution channel in excess of one month on hand at September 30, 2017.
Dafalgan , an analgesic product sold principally in Europe, had 1.2 months of inventory on hand internationally at direct customers compared to also 1.2 months of inventory on hand at June 30, 2017. The level of inventory on hand was primarily attributable to France to support product seasonality.
Efferalgan , an analgesic product sold principally in Europe, had 1.2 months of inventory on hand internationally at direct customers compared to 0.8 months of inventory on hand at June 30, 2017. The level of inventory on hand was primarily attributable to France to support product seasonality.
Fervex , a cold and flu product, had 3.0 months of inventory on hand at direct customers compared to 4.0 months of inventory on hand at June 30, 2017. The level of inventory on hand was attributable to France to support product seasonality.
Perfalgan , an analgesic product, had 2.6 months of inventory on hand internationally at direct customers compared to 1.5 months of inventory on hand at June 30, 2017. The level of inventory on hand was primarily in the Gulf Countries due to extended delivery lead time.
In the U.S., we generally determine our months on hand estimates using inventory levels of product on hand and the amount of out-movement provided by our three largest wholesalers, which account for approximately 95% of total gross sales of U.S. products. Factors that may influence our estimates include generic competition, seasonality of products, wholesaler purchases in light of increases in wholesaler list prices, new product launches, new warehouse openings by wholesalers and new customer stockings by wholesalers. In addition, these estimates are calculated using third-party data, which may be impacted by their recordkeeping processes.
Our non-U.S. businesses have significantly more direct customers. Information on available direct customer product level inventory and corresponding out-movement information and the reliability of third-party demand information varies widely. We limit our direct customer sales channel inventory reporting to where we can influence demand. When this information does not exist or is otherwise not available, we have developed a variety of methodologies to estimate such data, including using historical sales made to direct customers and third-party market research data related to prescription trends and end-user demand. Given the difficulties inherent in estimating third-party demand information, we evaluate our methodologies to estimate direct customer product level inventory and to calculate months on hand on an ongoing basis and make changes as necessary. Factors that may affect our estimates include generic competition, seasonality of products, price increases, new product launches, new warehouse openings by direct customers, new customer stockings by direct customers and expected direct customer purchases for governmental bidding situations. As such, all of the information required to estimate months on hand in the direct customer distribution channel for non-U.S. business for the year ended December 31, 2017 is not available prior to the filing of this annual report on Form 10-K. We will disclose any product with levels of inventory in excess of one month on hand or expected demand, subject to a de minimis exception, in the next quarterly report on Form 10-Q.
37
Expenses
|
|
|
|
|
|
|
| % Change | ||||||||||
Dollar in Millions |
| 2017 |
| 2016 |
| 2015 |
| 2017 vs. 2016 |
| 2016 vs. 2015 | ||||||||
Cost of products sold |
| $ | 6,066 | |
| $ | 4,946 | |
| $ | 3,909 | |
| 23 | % |
| 27 | % |
Marketing, selling and administrative |
| 4,687 | |
| 4,911 | |
| 4,841 | |
| (5 | )% |
| 1 | % | |||
Research and development |
| 6,411 | |
| 4,940 | |
| 5,920 | |
| 30 | % |
| (17 | )% | |||
Other income (net) |
| (1,519 | ) |
| (1,285 | ) |
| (187 | ) |
| 18 | % |
| ** | | |||
Total Expenses |
| $ | 15,645 | |
| $ | 13,512 | |
| $ | 14,483 | |
| 16 | % |
| (7 | )% |
** Change in excess of 100%
Cost of products sold
Cost of products sold include material, internal labor and overhead costs from our owned manufacturing sites, third-party product supply costs and other supply chain costs managed by our global manufacturing and supply organization. Cost of products sold also includes royalties and profit sharing, certain excise taxes, foreign currency hedge settlement gains and losses and the amortization of acquired developed technology costs. Cost of products sold typically vary between periods as a result of product mix and volume (particularly royalties and profit sharing), and to a lesser extent changes in foreign currency, price, inflation and costs attributed to manufacturing site exits.
• | Cost of products sold increased in 2017 due to higher Eliquis profit sharing of $719 million and a $146 million impairment charge to reduce the carrying value of the small molecule active pharmaceutical ingredient manufacturing operations in Swords, Ireland. The remaining increase was primarily due to higher sales volume, inventory charges, manufacturing startup costs and foreign currency. Refer to "Item 8. Financial Statements-Note 4. Acquisitions, Divestitures and Licensing Arrangements" for further information. |
• | Cost of products sold increased in 2016 due to higher Eliquis profit sharing of $700 million , lower foreign currency hedge settlement gains and higher Puerto Rico excise tax. |
Marketing, selling and administrative
Marketing, selling and administrative expenses primarily include salary and benefit costs, third-party professional and marketing fees, outsourcing fees, shipping and handling costs, advertising and product promotion. Expenses are managed through regional commercialization organizations or global enabling functions such as finance, legal, information technology and human resources. Certain expenses are shared with alliance partners based upon contractual agreements. Expenses typically vary between periods due to new product launch promotional activities.
• | Marketing, selling and administrative expenses decreased in 2017 due to lower advertising, promotion and sales-force expenses supporting Daklinza and other established brands and lower BMS foundation grants. |
• | Marketing, selling and administrative expenses increased in 2016 due to higher advertising, promotion and sales-force expenses supporting Opdivo partially offset by lower spend for established brands and favorable foreign exchange. |
Research and development
Research and development activities include discovery research, preclinical and clinical development, drug formulation and medical support of marketed products. Expenses include salary and benefit costs, third-party grants and fees paid to clinical research organizations, supplies, upfront and contingent milestone payments for licensing and asset acquisitions of investigational compounds, IPRD impairment charges and proportionate allocations of enterprise-wide costs. The allocations include facilities, information technology, employee stock compensation costs and other appropriate costs. Certain expenses are shared with alliance partners based upon contractual agreements. Expenses typically vary between periods for a number of reasons, including the timing of license and asset acquisition charges and IPRD impairment charges.
• | Research and development expenses increased in 2017 due to higher license and asset acquisition charges, site exit charges, IPRD impairment charges and expansion of Opdivo and other IO development programs. |
• | Research and development expenses decreased in 2016 due to lower license and asset acquisition and IPRD impairment charges, partially offset by the acceleration and expansion of Opdivo development programs. |
38
Significant charges included in R&D expense were as follows:
| Year Ended December 31, |
| ||||||||||||
Dollars in Millions | 2017 |
| 2016 |
| 2015 |
| ||||||||
IFM | $ | 311 | | (a) |
| $ | - | |
|
| $ | - | |
|
CytomX | 200 | | (a) |
| 25 | | (a) |
| - | |
| |||
Halozyme | 105 | | (a) |
| - | |
|
| - | |
| |||
Flexus | 324 | | (b) |
| 100 | | (b) |
| 800 | | (a) | |||
Cardioxyl | 100 | | (b) |
| - | |
|
| 167 | | (a) | |||
PsiOxus | 50 | | (a) |
| - | |
|
| - | |
| |||
Ono | 40 | | (a) |
| - | |
|
| - | |
| |||
Padlock | - | |
|
| 139 | | (a) |
| - | |
| |||
Cormorant | - | |
|
| 35 | | (a) |
| - | |
| |||
Nitto Denko | - | |
|
| 100 | | (a) |
| - | |
| |||
Five Prime | - | |
|
| - | |
|
| 350 | | (a) | |||
Promedior | - | |
|
| - | |
|
| 84 | | (c) | |||
Bavarian Nordic | - | |
|
| - | |
|
| 60 | | (c) | |||
uniQure | - | |
|
| - | |
|
| 50 | | (a) | |||
Other | - | |
|
| 40 | |
|
| 168 | |
| |||
License and asset acquisition charges | 1,130 | |
|
| 439 | |
|
| 1,679 | |
| |||
|
|
|
|
|
|
|
|
| ||||||
F-Star Alpha | 75 | |
|
| - | |
|
| - | |
| |||
LPA1 Antagonist | - | |
|
| - | |
|
| 160 | |
| |||
Other | - | |
|
| 13 | |
|
| - | |
| |||
IPRD impairments | 75 | |
|
| 13 | |
|
| 160 | |
| |||
|
|
|
|
|
|
|
|
| ||||||
Site exit costs | 383 | |
|
| 83 | |
|
| 30 | |
| |||
Other | - | |
|
| - | |
|
| 14 | |
| |||
Site exit costs and other | 383 | |
|
| 83 | |
|
| 44 | |
| |||
|
|
|
|
|
|
|
|
| ||||||
Research and development significant charges | $ | 1,588 | |
|
| $ | 535 | |
|
| $ | 1,883 | |
|
(a) Upfront payment
(b) Milestone payment
(c) Option fee
• | License and asset acquisition charges resulted from strategic transactions to acquire or license certain investigational oncology, cardiovascular, immunoscience and fibrotic disease compounds (or options to acquire or license) as disclosed in "-Acquisition and Licensing Arrangements". |
• | IPRD impairment charges were related to the discontinued development of an investigational compound which was part of our alliance with F-Star Alpha in 2017 and LPA1 Antagonist Phase II study in 2015. |
• | Site exit costs resulted from the expected exit of R&D sites in the U.S. through 2020 primarily due to the reduction in the estimated useful lives of the related assets and an impairment charge to reduce the carrying value of a R&D facility in Wallingford, Connecticut. |
Other income (net)
• | Other income (net) increased in 2017 primarily due to a patent infringement settlement and out-licensing income partially offset by lower divestiture gains and related service fees and higher restructuring and debt redemption charges. |
• | Other income (net) increased in 2016 primarily due to divestiture gains and related service fees and royalties and lower debt redemption and litigation charges. |
39
Components of other income (net) were as follows:
|
| Year Ended December 31, | ||||||||||
Dollars in Millions |
| 2017 |
| 2016 |
| 2015 | ||||||
Interest expense |
| $ | 196 | |
| $ | 167 | |
| $ | 184 | |
Investment income |
| (154 | ) |
| (105 | ) |
| (101 | ) | |||
Provision for restructuring |
| 293 | |
| 109 | |
| 118 | | |||
Litigation and other settlements |
| (487 | ) |
| 47 | |
| 159 | | |||
Equity in net income of affiliates |
| (75 | ) |
| (77 | ) |
| (83 | ) | |||
Divestiture gains |
| (164 | ) |
| (576 | ) |
| (196 | ) | |||
Royalties and licensing income |
| (1,351 | ) |
| (719 | ) |
| (383 | ) | |||
Transition and other service fees |
| (37 | ) |
| (238 | ) |
| (122 | ) | |||
Pension charges |
| 162 | |
| 91 | |
| 160 | | |||
Intangible asset impairment |
| - | |
| 15 | |
| 13 | | |||
Equity investment impairment |
| 5 | |
| 45 | |
| - | | |||
Written option adjustment |
| - | |
| - | |
| (123 | ) | |||
Loss on debt redemption |
| 109 | |
| - | |
| 180 | | |||
Other |
| (16 | ) |
| (44 | ) |
| 7 | | |||
Other income (net) |
| $ | (1,519 | ) |
| $ | (1,285 | ) |
| $ | (187 | ) |
• | Restructuring charges relate to changes to the Company's operating model to drive continued success in the near- and long-term through a more focused investment in commercial opportunities for key brands and markets, a competitive and more agile R&D organization that can accelerate the pipeline, streamline operations and realign manufacturing capabilities that broaden biologics capabilities to reflect the current and future portfolio as well as streamline and simplify our small-molecule supply network. The new operating model is expected to enable the Company to deliver the strategic, financial and operational flexibility necessary to invest in the highest priorities across the Company. Aggregate restructuring charges of $826 million have been incurred in 2017 for all actions including accelerated depreciation and impairment charges resulting from early site exits. |
• | Litigation and other settlements include BMS's share of a patent-infringement settlement related to Merck's PD-1 antibody Keytruda* in 2017 as BMS and Ono signed a global patent license agreement with Merck. Merck made an initial payment of $625 million to BMS and Ono, of which BMS received $481 million. Merck is also obligated to pay ongoing royalties on global sales of Keytruda* of 6.5% from January 1, 2017 through December 31, 2023, and 2.5% from January 1, 2024 through December 31, 2026. The companies also granted certain rights to each other under their respective patent portfolios pertaining to PD-1. Payments and royalties are shared between BMS and Ono on a 75/25 percent allocation, respectively after adjusting for each parties' legal fees. |
• | Divestiture gains relate to additional contingent consideration for the diabetes business in 2017, certain OTC brands and investigational HIV medicines businesses in 2016, and the Mount Vernon, Indiana manufacturing facility, Erbitux* , Ixempra* and certain other OTC product businesses in 2015. |
• | Royalties and licensing income include upfront licensing fees from Biogen and Roche in connection with the out-licensing of certain investigational genetically defined disease compounds in 2017, royalties from the Merck patent infringement settlement in 2017 and contingent consideration from the Erbitux* and diabetes business divestitures in 2017, 2016 and 2015, including the transfer of certain royalty rights pertaining to Amylin product sales. |
• | Transition and other service fees included fees resulting from the divestiture of the diabetes and investigational HIV medicines businesses. |
• | Pension charges consist primarily of settlement charges due to the magnitude of lump sum payments for the principal of the U.S. pension plan. |
• | Written option adjustment includes income of $123 million resulting from the change in fair value of the written option liability attributed to the Reckitt alliance in 2015. |
• | A loss on debt redemption resulted from the repurchase of certain long-term debt obligations in 2017 and the early redemption of Euro notes and a tender offer for certain other debt securities in 2015. |
40
Income Taxes
Dollars in Millions | 2017 |
| 2016 |
| 2015 | ||||||
Earnings Before Income Taxes | $ | 5,131 | |
| $ | 5,915 | |
| $ | 2,077 | |
Provision for income taxes | 4,156 | |
| 1,408 | |
| 446 | | |||
Effective tax rate | 81.0 | % |
| 23.8 | % |
| 21.5 | % | |||
New tax reform legislation in the U.S. was enacted on December 22, 2017 known as the Tax Cuts and Jobs Act of 2017 (the Act). The Act moves from a worldwide tax system to a quasi-territorial tax system and comprises broad and complex changes to the U.S. tax code including, but not limited to, (1) reducing the U.S. tax rate from 35% to 21%; (2) adding a deemed repatriation transition tax on certain foreign earnings and profits; (3) generally eliminating U.S. federal income taxes on dividends from foreign subsidiaries; (4) including certain income of controlled foreign companies in U.S. taxable income; (5) creating a new minimum tax referred to as a base erosion anti-abuse income tax; (6) limiting certain research-based credits; and (7) eliminating the domestic manufacturing deduction.
Although many aspects of the Act are not effective until 2018, additional tax expense of $2.9 billion was recognized in the fourth quarter of 2017 upon enactment of the Act. The additional expense increased the effective tax rate by 56.7% and included a $2.6 billion one-time deemed repatriation transition tax on previously untaxed post-1986 foreign earnings and profits (including related tax reserves). Those earnings were effectively taxed at a 15.5% rate to the extent that the specified foreign corporations held cash and certain other assets and an 8.0% rate on the remaining earnings and profits. The remaining $ 285 million of additional tax expense included an adjustment to measure net deferred tax assets at the new U.S. tax rate of 21% .
The accounting for the reduction of deferred tax assets to the 21% tax rate is complete. The tax charge for the deemed repatriation tax is incomplete, but was recorded as a provisional amount as we were able to make a reasonable estimate of this tax. The provisional amounts may change when completed in 2018 upon finalizing untaxed post-1986 foreign earnings and profits and related cash and certain eligible assets of the specified foreign corporations. The provisional amounts may also change if additional guidance of the relevant tax code is released.
Excluding the above transitional impacts related to the Act, the tax impact attributed to non-deductible R&D charges, divestiture transactions and other specified items increased the effective tax rate by 3.3% in 2017, 1.8% in 2016 and 0.3% in 2015. No tax benefits were attributed to the R&D charges incurred in connection with the acquisitions of IFM, Cormorant, Padlock, Cardioxyl, Flexus and the warrant to acquire Promedior. Lower non-deductible goodwill allocated to business divestitures and higher valuation allowances attributed to capital loss carryforwards released in 2015 impacted the effective tax rate in 2015. In addition, the adoption of amended income tax accounting guidance related to share-based payments and the early adoption of intra-entity transfers of assets other than inventory reduced the effective tax rate by 2.4% in 2017. Earnings mix between high and low tax jurisdictions, domestic manufacturing deductions and higher U.S. foreign tax credits resulting from the Puerto Rico excise tax attributed to most of the remaining changes in the effective tax rates.
Prior to the Act, the effective income tax rate was typically lower than the U.S. statutory rate of 35% primarily due to earnings for certain of our manufacturing operations in low tax jurisdictions such as Switzerland, Ireland and Puerto Rico which were indefinitely reinvested. BMS operates under a favorable tax grant in Puerto Rico not scheduled to expire prior to 2023. Although the Company continues to assess the broad and complex changes to the U.S. tax code, it currently expects no significant net impact of tax reform on the effective tax rate in 2018. Refer to "Item 8. Financial Statements-Note 7. Income Taxes" for further information.
Non-GAAP Financial Measures
Our non-GAAP financial measures, including non-GAAP earnings and related EPS information, are adjusted to exclude certain costs, expenses, gains and losses and other specified items that are evaluated on an individual basis. These items are adjusted after considering their quantitative and qualitative aspects and typically have one or more of the following characteristics, such as being highly variable, difficult to project, unusual in nature, significant to the results of a particular period or not indicative of future operating results. Similar charges or gains were recognized in prior periods and will likely reoccur in future periods including restructuring costs, accelerated depreciation and impairment of property, plant and equipment and intangible assets, R&D charges in connection with the acquisition or licensing of third party intellectual property rights, divestiture gains or losses, pension, legal and other contractual settlement charges and debt redemption gains or losses, among other items. Deferred and current income taxes attributed to these items are also adjusted for considering their individual impact to the overall tax expense, deductibility and jurisdictional tax rates.
41
Non-GAAP information is intended to portray the results of our baseline performance, supplement or enhance management, analysts and investors' overall understanding of our underlying financial performance and facilitate comparisons among current, past and future periods. For example, non-GAAP earnings and EPS information is an indication of our baseline performance before items that are considered by us to not be reflective of our ongoing results. In addition, this information is among the primary indicators we use as a basis for evaluating performance, allocating resources, setting incentive compensation targets and planning and forecasting for future periods. This information is not intended to be considered in isolation or as a substitute for net earnings or diluted EPS prepared in accordance with GAAP.
Specified items were as follows:
|
| Year Ended December 31, | ||||||||||
Dollars in Millions |
| 2017 |
| 2016 |
| 2015 | ||||||
Impairment charges |
| $ | 146 | |
| $ | - | |
| $ | - | |
Accelerated depreciation and other shutdown costs |
| 3 | |
| 21 | |
| 84 | | |||
Cost of products sold |
| 149 | |
| 21 | |
| 84 | | |||
|
|
|
|
|
|
| ||||||
Marketing, selling and administrative |
| 1 | |
| - | |
| 10 | | |||
|
|
|
|
|
|
| ||||||
License and asset acquisition charges |
| 1,130 | |
| 439 | |
| 1,679 | | |||
IPRD impairments |
| 75 | |
| 13 | |
| 160 | | |||
Site exit costs and other |
| 383 | |
| 83 | |
| 44 | | |||
Research and development |
| 1,588 | |
| 535 | |
| 1,883 | | |||
|
|
|
|
|
|
| ||||||
Provision for restructuring |
| 293 | |
| 109 | |
| 115 | | |||
Litigation and other settlements |
| (481 | ) |
| 40 | |
| 158 | | |||
Divestiture gains |
| (126 | ) |
| (559 | ) |
| (187 | ) | |||
Royalties and licensing income |
| (497 | ) |
| (10 | ) |
| - | | |||
Pension charges |
| 162 | |
| 91 | |
| 160 | | |||
Intangible asset impairment |
| - | |
| 15 | |
| 13 | | |||
Written option adjustment |
| - | |
| - | |
| (123 | ) | |||
Loss on debt redemption |
| 109 | |
| - | |
| 180 | | |||
Other income (net) |
| (540 | ) |
| (314 | ) |
| 316 | | |||
|
|
|
|
|
|
| ||||||
Increase to pretax income |
| 1,198 | |
| 242 | |
| 2,293 | | |||
|
|
|
|
|
|
| ||||||
Income taxes on items above |
| (87 | ) |
| 51 | |
| (480 | ) | |||
Income taxes attributed to U.S. tax reform |
| 2,911 | |
| - | |
| - | | |||
Income taxes |
| 2,824 | |
| 51 | |
| (480 | ) | |||
|
|
|
|
|
|
| ||||||
Increase to net earnings |
| 4,022 | |
| 293 | |
| 1,813 | | |||
Noncontrolling interest |
| (59 | ) |
| - | |
| - | | |||
Increase to net earnings used for Diluted Non-GAAP EPS calculation |
| $ | 3,963 | |
| $ | 293 | |
| $ | 1,813 | |
The reconciliations from GAAP to Non-GAAP were as follows:
|
| Year Ended December 31, | ||||||||||
Dollars in Millions, except per share data |
| 2017 |
| 2016 |
| 2015 | ||||||
Net Earnings Attributable to BMS used for Diluted EPS Calculation - GAAP |
| $ | 1,007 | |
| $ | 4,457 | |
| $ | 1,565 | |
Specified Items |
| 3,963 | |
| 293 | |
| 1,813 | | |||
Net Earnings Attributable to BMS used for Diluted EPS Calculation - Non-GAAP |
| $ | 4,970 | |
| $ | 4,750 | |
| $ | 3,378 | |
|
|
|
|
|
|
| ||||||
Average Common Shares Outstanding - Diluted |
| 1,652 | |
| 1,680 | |
| 1,679 | | |||
|
|
|
|
|
|
| ||||||
Diluted EPS Attributable to BMS - GAAP |
| $ | 0.61 | |
| $ | 2.65 | |
| $ | 0.93 | |
Diluted EPS Attributable to Specified Items |
| 2.40 | |
| 0.18 | |
| 1.08 | | |||
Diluted EPS Attributable to BMS - Non-GAAP |
| $ | 3.01 | |
| $ | 2.83 | |
| $ | 2.01 | |
42
Financial Position, Liquidity and Capital Resources
Our net cash position was as follows:
Dollars in Millions |
| 2017 |
| 2016 | ||||
Cash and cash equivalents |
| $ | 5,421 | |
| $ | 4,237 | |
Marketable securities - current |
| 1,391 | |
| 2,113 | | ||
Marketable securities - non-current |
| 2,480 | |
| 2,719 | | ||
Total cash, cash equivalents and marketable securities |
| 9,292 | |
| 9,069 | | ||
Short-term debt obligations |
| (987 | ) |
| (992 | ) | ||
Long-term debt |
| (6,975 | ) |
| (5,716 | ) | ||
Net cash position |
| $ | 1,330 | |
| $ | 2,361 | |
Cash, cash equivalents and marketable securities held in the U.S. were approximately $4.1 billion at December 31, 2017. Most of the remaining $5.2 billion is held primarily in low-tax jurisdictions and is subject to restrictions or withholding taxes in certain jurisdictions. We are subject to a one-time deemed repatriation transition tax of $2.6 billion which will be payable over eight years as a result of U.S. tax reform. However, we expect to have more flexibility in accessing cash and future cash that may be generated in foreign subsidiaries. We believe that our existing cash, cash equivalents and marketable securities together with cash generated from operations and issuance of commercial paper in the U.S. will be sufficient to satisfy our normal cash requirements for at least the next few years, including dividends, capital expenditures, milestone payments, working capital, deemed repatriation transition tax and maturities of long-term debt.
Management continuously evaluates the Company's capital structure to ensure the Company is financed efficiently, which may result in the repurchase of common stock and debt securities, termination of interest rate swap contracts prior to maturity and issuance of debt securities.
The Company repurchased $2.5 billion of common stock in 2017 through accelerated share repurchase agreements, Rule 10b5-1 plans and open market purchases. The stock repurchases were funded by $1.5 billion of new long-term debt and cash. The Company repaid $750 million of long-term debt at maturity and repurchased $337 million of long-term debt in 2017. Refer to "Item 8. Financial Statements-Note 9. Financial Instruments and Fair Value Measurements and Note 15. Equity" for further information.
We issued commercial paper to fund near-term domestic liquidity requirements during 2017. The average amount of commercial paper outstanding was $389 million at a weighted-average rate of 1.17% during 2017. The maximum amount of commercial paper outstanding was $1.3 billion with $299 million outstanding at December 31, 2017.
Dividend payments were $2.6 billion in 2017 and $2.5 billion in both 2016 and 2015. Dividend decisions are made on a quarterly basis by our Board of Directors. Annual capital expenditures were approximately $1.1 billion in 2017, $ 1.2 billion in 2016 and $800 million in 2015 and are expected to be approximately $1.0 billion in 2018 and $850 million in 2019. We continue to expand our biologics manufacturing capabilities and other facility-related activities. For example, we are constructing a new large-scale biologics manufacturing facility in Ireland that will produce multiple therapies for our growing biologics portfolio when completed in 2019.
Our investment portfolio includes non-current marketable securities, which are subject to changes in fair value as a result of interest rate fluctuations and other market factors. Our investment policy establishes limits on the amount and time to maturity of investments with any institution. The policy also requires that investments are only entered into with corporate and financial institutions that meet high credit quality standards. Refer to "Item 8. Financial Statements-Note 9 . Financial Instruments and Fair Value Measurements" for further information.
We currently have three separate revolving credit facilities totaling $5.0 billion from a syndicate of lenders. The facilities provide for customary terms and conditions with no financial covenants. Our 364 day $2.0 billion facility expires in March 2018 and our two $1.5 billion facilities were extended to October 2021 and July 2022. Our two $1.5 billion , five-year facilities are extendable annually by one year on the anniversary date with the consent of the lenders. No borrowings were outstanding under any revolving credit facility at December 31, 2017 or 2016.
Additional regulations in the U.S. could be passed in the future including additional healthcare reform initiatives, further changes to tax laws, additional pricing laws and potential importation restrictions which may reduce our results of operations, operating cash flow, liquidity and financial flexibility. We continue to monitor the potential impact of the economic conditions in certain European and other countries and the related impact on prescription trends, pricing discounts and creditworthiness of our customers. We believe these economic conditions will not have a material impact on our liquidity, cash flow or financial flexibility.
43
Credit Ratings
BMS's long-term and short-term credit ratings assigned by Moody's Investors Service are A2 and Prime-1, respectively, with a stable rating outlook. BMS's long-term and short-term credit ratings assigned by Standard & Poor's are A+ and A-1+, respectively, with a stable rating outlook. BMS's long-term and short-term credit ratings assigned by Fitch are A- and F2, respectively, with a stable rating outlook. Our long-term ratings reflect the agencies' opinion that we have a low default risk but are somewhat susceptible to adverse effects of changes in circumstances and economic conditions. Our short-term ratings reflect the agencies' opinion that we have good to extremely strong capacity for timely repayment. Any credit rating downgrade may affect the interest rate of any debt we may incur, the fair market value of existing debt and our ability to access the capital markets generally.
Cash Flows
The following is a discussion of cash flow activities:
Dollars in Millions |
| 2017 |
| 2016 |
| 2015 | ||||||
Cash flow provided by/(used in): |
|
|
|
|
|
| ||||||
Operating activities |
| $ | 5,275 | |
| $ | 3,058 | |
| $ | 2,105 | |
Investing activities |
| (66 | ) |
| 1,480 | |
| (1,572 | ) | |||
Financing activities |
| (4,077 | ) |
| (2,653 | ) |
| (3,624 | ) | |||
Operating Activities
Cash flow from operating activities represents the cash receipts and disbursements from all of our activities other than investing and financing activities. Operating cash flow is derived by adjusting net earnings for noncontrolling interest, non-cash operating items, gains and losses attributed to investing and financing activities and changes in operating assets and liabilities resulting from timing differences between the receipts and payments of cash and when the transactions are recognized in our results of operations. As a result, changes in cash from operating activities reflect the timing of cash collections from customers and alliance partners; payments to suppliers, alliance partners and employees; customer discounts and rebates; and tax payments in the ordinary course of business. For example, annual employee bonuses are typically paid in the first quarter of the subsequent year. In addition, cash collections are impacted by longer payment terms for certain biologic products in the U.S., primarily certain products including Opdivo , Yervoy and Empliciti (120 days to 150 days). The longer payment terms are used to more closely align with the insurance reimbursement timing for physicians and cancer centers following administration to the patients.
The $2.2 billion change in cash flow from operating activities compared to 2016 was primarily attributable to the following items in addition to increased sales and the timing of cash collections and payments in the ordinary course of business:
• | Lower income tax payments of approximately $1.5 billion ; |
• | Out-licensing proceeds of $470 million related to the Biogen and Roche transactions; and |
• | Litigation settlement proceeds of $481 million related to Merck's PD-1 antibody Keytruda* (BMS's share) . |
Partially offset by:
• | Higher R&D licensing payments of approximately $400 million primarily due to the CytomX, Halozyme and Nitto Denko transactions. |
• | Higher contributions to pension plans of approximately $300 million . |
The $1.0 billion change in cash flow from operating activities compared to 2015 was primarily attributable to the following items in addition to increased sales and the timing of cash collections and payments in the ordinary course of business:
• | The wind-down of the Abilify* alliance in 2015 of approximately $700 million ; and |
• | Lower R&D licensing payments of approximately $600 million primarily due to the Five-Prime and Promedior transactions in 2015. |
Partially offset by:
• | Higher income tax payments of approximately $1.4 billion . |
44
Investing Activities
Cash requirements from investing activities include cash used for acquisitions, manufacturing and facility-related capital expenditures, purchases of marketable securities with maturities greater than 90 days reduced by proceeds from business divestitures (including royalties) and the sale and maturity of marketable securities.
The $1.5 billion change in cash flow from investing activities compared to 2016 was primarily attributable to:
• | Lower net sales of marketable securities with maturities greater than 90 days of $745 million which were essentially offset by changes in cash equivalents; |
• | Lower business divestiture proceeds of approximately $600 million primarily due to certain OTC brands and investigational HIV medicines businesses in 2016; and |
• | Higher asset acquisition payments of approximately $350 million primarily due to the acquisition of IFM in 2017. |
The $3.1 billion change in cash flow from investing activities compared to 2015 was primarily attributable to:
• | Higher net sales of marketable securities of approximately $2.1 billion in 2016 which were reinvested in cash and cash equivalents; |
• | Lower asset acquisition payments of approximately $800 million primarily due to the acquisition of Flexus in 2015; and |
• | Higher business divestiture proceeds of approximately $600 million including royalties and other contingent consideration received subsequent to the divestitures of certain OTC brands and investigational HIV medicines businesses in 2016 and the Mount Vernon, Indiana manufacturing facility, Ixempra * and mature and other OTC product businesses in 2015. |
Partially offset by:
• | Higher capital expenditures of approximately $400 million . |
Financing Activities
Cash requirements from financing activities include cash used to pay dividends, repurchase common stock and repay long-term debt and other borrowings reduced by proceeds from the exercise of stock options and issuance of long-term debt and other borrowings.
The $1.4 billion change in cash flow from financing activities compared to 2016 was primarily attributable to:
• | Higher repurchase of common stock of $2.2 billion primarily due to the accelerated share repurchase agreements. |
Partially offset by:
• | Higher net borrowing activity of $880 million primarily to fund the repurchase of common stock. |
The $1.0 billion change in cash flow from financing activities compared to 2015 was primarily attributable to:
• | Higher net borrowing activity of approximately $1.3 billion in 2016, primarily due to debt redemptions and reductions in cash overdrafts in 2015. |
Partially offset by:
• | Repurchase of common stock of approximately $200 million in 2016 (none in 2015). |
Contractual Obligations and Off-Balance Sheet Arrangements
Payments due by period for our contractual obligations at December 31, 2017 were as follows:
|
| Obligations Expiring by Period | ||||||||||||||||||||||||||
Dollars in Millions |
| Total |
| 2018 |
| 2019 |
| 2020 |
| 2021 |
| 2022 |
| Later Years | ||||||||||||||
Short-term borrowings |
| $ | 987 | |
| $ | 987 | |
| $ | - | |
| $ | - | |
| $ | - | |
| $ | - | |
| $ | - | |
Long-term debt |
| 6,835 | |
| - | |
| 1,250 | |
| - | |
| - | |
| 750 | |
| 4,835 | | |||||||
Interest on long-term debt (a) |
| 3,083 | |
| 213 | |
| 200 | |
| 192 | |
| 192 | |
| 192 | |
| 2,094 | | |||||||
Operating leases |
| 793 | |
| 141 | |
| 110 | |
| 90 | |
| 75 | |
| 71 | |
| 306 | | |||||||
Purchase obligations |
| 3,386 | |
| 1,480 | |
| 730 | |
| 499 | |
| 257 | |
| 239 | |
| 181 | | |||||||
Uncertain tax positions (b) |
| 69 | |
| 69 | |
| - | |
| - | |
| - | |
| - | |
| - | | |||||||
Deemed repatriation transition tax |
| 2,497 | |
| 102 | |
| 200 | |
| 200 | |
| 200 | |
| 200 | |
| 1,595 | | |||||||
Total (c) |
| $ | 17,650 | |
| $ | 2,992 | |
| $ | 2,490 | |
| $ | 981 | |
| $ | 724 | |
| $ | 1,452 | |
| $ | 9,011 | |
(a) | Includes estimated future interest payments and periodic cash settlements of derivatives. |
(b) | Includes only short-term uncertain tax benefits because of uncertainties regarding the timing of resolution. |
(c) | Excludes pension and other liabilities because of uncertainties regarding the timing of resolution. |
45
In addition to the above, we are committed to an aggregated $17.0 billion of potential future research and development milestone payments to third parties for in-licensing, asset acquisitions and development programs including early-stage milestones of $3.1 billion (milestones achieved through Phase III clinical studies) and late-stage milestones of $10.4 billion (milestones achieved post Phase III clinical studies). Payments generally are due and payable only upon achievement of certain developmental and regulatory milestones for which the specific timing cannot be predicted. Some of these agreements also provide for sales-based milestones aggregating $3.5 billion that we would be obligated to pay to alliance partners upon achievement of certain sales levels in addition to royalties. We also have certain manufacturing, development and commercialization obligations in connection with alliance arrangements. It is not practicable to estimate the amount of these obligations. Refer to "Item 8. Financial Statements-Note 3 . Alliances" for further information regarding our alliances. We do not have any off-balance sheet arrangements that are material or reasonably likely to become material to our financial condition or results of operations.
SEC Consent Order / FCPA Settlement
As previously disclosed, on August 4, 2004, we entered into a final settlement with the SEC, concluding an investigation concerning certain wholesaler inventory and accounting matters. The settlement was reached through a Consent, a copy of which was attached as Exhibit 10 to our quarterly report on Form 10-Q for the period ended September 30, 2004.
Under the terms of the Consent, we agreed, subject to certain defined exceptions, to limit sales of all products sold to our direct customers (including wholesalers, distributors, hospitals, retail outlets, pharmacies and government purchasers) based on expected demand or on amounts that do not exceed approximately one month of inventory on hand, without making a timely public disclosure of any change in practice. We also agreed in the Consent to certain measures that we have implemented including: (a) establishing a formal review and certification process of our annual and quarterly reports filed with the SEC; (b) establishing a business risk and disclosure group; (c) retaining an outside consultant to comprehensively study and help re-engineer our accounting and financial reporting processes; (d) publicly disclosing any sales incentives offered to direct customers for the purpose of inducing them to purchase products in excess of expected demand; and (e) ensuring that our budget process gives appropriate weight to inputs that come from the bottom to the top, and not just from the top to the bottom, and adequately documenting that process.
We have established a company-wide policy to limit our sales to direct customers for the purpose of complying with the Consent. This policy includes the adoption of various procedures to monitor and limit sales to direct customers in accordance with the terms of the Consent. These procedures include a governance process to escalate to appropriate management levels potential questions or concerns regarding compliance with the policy and timely resolution of such questions or concerns. In addition, compliance with the policy is monitored on a regular basis.
We maintain DSAs with our U.S. pharmaceutical wholesalers, which account for nearly 100% of our gross U.S. revenues. Under the current terms of the DSAs, our wholesaler customers provide us with weekly information with respect to months on hand product-level inventories and the amount of out-movement of products. The three largest wholesalers currently account for approximately 95% of our gross U.S. revenues. The inventory information received from our wholesalers, together with our internal information, is used to estimate months on hand product level inventories at these wholesalers. We estimate months on hand product inventory levels for our U.S. business's wholesaler customers other than the three largest wholesalers by extrapolating from the months on hand calculated for the three largest wholesalers. In contrast, our non-U.S. business has significantly more direct customers, limited information on direct customer product level inventory and corresponding out-movement information and the reliability of third-party demand information, where available, varies widely. Accordingly, we rely on a variety of methods to estimate months on hand product level inventories for these business units.
We believe the above-described procedures provide a reasonable basis to ensure compliance with the Consent.
In addition, as previously disclosed, in October 2015, the Company reached a civil settlement with the SEC of alleged FCPA violations in which the Company agreed to pay approximately $14.7 million in disgorgement, penalties and interest. As part of the settlement, the Company agreed to a two-year self-monitoring period of reporting to the government which concluded in October 2017.
Recently Issued Accounting Standards
For recently issued accounting standards, refer to "Item 8. Financial Statements-Note 1 . Accounting Policies-Recently Issued Accounting Standards."
46
Critical Accounting Policies
The preparation of financial statements requires the use of estimates and assumptions that affect the reported amounts of assets and liabilities and the reported amounts of revenue and expenses. Our critical accounting policies are those that significantly impact our financial condition and results of operations and require the most difficult, subjective or complex judgments, often as a result of the need to make estimates about the effect of matters that are inherently uncertain. Because of this uncertainty, actual results may vary from these estimates.
Revenue Recognition
Our accounting policy for revenue recognition has a substantial impact on reported results and relies on certain estimates. Revenue is recognized when persuasive evidence of an arrangement exists, the sales price is fixed or determinable, collectability is reasonably assured and title and substantially all of the risks and rewards of ownership have transferred (generally upon shipment except in certain EU markets which does not occur until delivery of the products to the customer). Revenue is also reduced for GTN sales adjustments discussed below, all of which involve significant estimates and judgment after considering legal interpretations of applicable laws and regulations, historical experience, payer channel mix (e.g. Medicare or Medicaid), current contract prices under applicable programs, unbilled claims and processing time lags and inventory levels in the distribution channel. Estimates are assessed each period and adjusted as required to revise information or actual experience.
GTN Adjustments
The following categories of GTN adjustments involve significant estimates, judgments and information obtained from external sources. Refer to "-Total Revenues" for further discussion and analysis of each significant category of GTN sales adjustments.
Charge-backs and cash discounts
Our U.S. business participates in programs with government entities, the most significant of which are the U.S. Department of Defense and the U.S. Department of Veterans Affairs, and other parties, including covered entities under the 340B Drug Pricing Program, whereby pricing on products is extended below wholesaler list price to participating entities. These entities purchase products through wholesalers at the lower program price and the wholesalers then charge us the difference between their acquisition cost and the lower program price. Accounts receivable is reduced for the estimated amount of unprocessed charge-back claims attributable to a sale (typically within a two to four week time lag).
In the U.S. and certain other countries, cash discounts are offered as an incentive for prompt payment, generally approximating 2% of the sales price. Accounts receivable is reduced for the estimated amount of unprocessed cash discounts (typically within a one month time lag).
Medicaid and Medicare rebates
Our U.S. business participates in state government Medicaid programs and other qualifying Federal and state government programs requiring discounts and rebates to participating state and local government entities. All discounts and rebates provided through these programs are included in our Medicaid rebate accrual. Medicaid rebates have also been extended to drugs used in managed Medicaid plans. The estimated amount of unpaid or unbilled rebates is presented as a liability.
Rebates and discounts are offered to managed healthcare organizations in the U.S. managing prescription drug programs and Medicare Advantage prescription drug plans covering the Medicare Part D drug benefit. We also pay a 50% point of service discount to the Centers for Medicare & Medicaid Services when the Medicare Part D beneficiaries are in the coverage gap ("donut hole"). The estimated amount of unpaid or unbilled rebates and discounts is presented as a liability.
Other rebates, returns, discounts and adjustments
Other GTN sales adjustments include sales returns and all other programs based on applicable laws and regulations for individual non-U.S. countries as well as rebates offered to managed healthcare organizations in the U.S. to a lesser extent. The non-U.S. programs include several different pricing schemes such as cost caps, volume discounts, outcome-based pricing schemes and pricing claw-backs that are based on sales of individual companies or an aggregation of all companies participating in a specific market. The estimated amount of unpaid or unbilled rebates and discounts is presented as a liability.
47
Estimated returns for established products are determined after considering historical experience and other factors including levels of inventory in the distribution channel, estimated shelf life, product recalls, product discontinuances, price changes of competitive products, introductions of generic products, introductions of competitive new products and lower demand following the LOE. The estimated amount for product returns is presented as a liability.
Estimated returns for new products are determined after considering historical sales return experience of similar products, such as those within the same product line, similar therapeutic area and/or similar distribution model. We defer recognition of revenue until the right of return expires, sufficient historical experience to estimate sales returns is developed in limited circumstances, or when insufficient historical experience with products in a similar therapeutic area, distribution method or other characteristic is available. This typically occurs when the new product is not an extension of an existing line of product or when historical experience with products in a similar therapeutic category is lacking. Estimated levels of inventory in the distribution channel and projected demand are also considered in estimating sales returns for new products.
Use of information from external sources
Information from external sources is used to estimate GTN adjustments. Our estimate of inventory at the wholesalers are based on the projected prescription demand-based sales for our products and historical inventory experience, as well as our analysis of third-party information, including written and oral information obtained from certain wholesalers with respect to their inventory levels and sell-through to customers and third-party market research data, and our internal information. The inventory information received from wholesalers is a product of their recordkeeping process and excludes inventory held by intermediaries to whom they sell, such as retailers and hospitals.
We have also continued the practice of combining retail and mail prescription volume on a retail-equivalent basis. We use this methodology for internal demand forecasts. We also use information from external sources to identify prescription trends, patient demand and average selling prices. Our estimates are subject to inherent limitations of estimates that rely on third-party information, as certain third-party information was itself in the form of estimates, and reflect other limitations including lags between the date as of which third-party information is generated and the date on which we receive third-party information.
Retirement Benefits
Accounting for pension and postretirement benefit plans requires actuarial valuations based on significant assumptions for discount rates and expected long-term rates of return on plan assets. In consultation with our actuaries, these significant assumptions and others such as salary growth, retirement, turnover, healthcare trends and mortality rates are evaluated and selected based on expectations or actual experience during each remeasurement date. Pension expense could vary within a range of outcomes and have a material effect on reported earnings, projected benefit obligations and future cash funding. Actual results in any given year may differ from those estimated because of economic and other factors.
The yield on high quality corporate bonds that coincides with the cash flows of the plans' estimated payouts is used in determining the discount rate. The Citi Pension Discount curve is used for the U.S. plans. The present value of benefit obligations at December 31, 2017 for the U.S. pension plans was determined using a 3.5% discount rate. If the assumed discount rate used in determining the U.S. pension plans' projected benefit obligation at December 31, 2017 was reduced by an additional 1%, the projected benefit obligation would increase by approximately $950 million.
The expected long-term rate of return on plan assets is estimated considering expected returns for individual asset classes with input from external advisors. We also consider long-term historical returns including actual performance compared to benchmarks for similar investments. The U.S. plans' pension expense for 2017 was determined using a 7.8% expected long-term rate of return on plan assets. If the expected long-term rate of return on plan assets used in determining the U.S. plans' pension expense for 2017 was reduced by 1%, such expense would increase by $40 million.
For a more detailed discussion on retirement benefits, refer to "Item 8. Financial Statements-Note 16 . Pension, Postretirement and Postemployment Liabilities."
Business Combinations and Divestitures
Goodwill and other intangible assets acquired in business combinations, licensing and other transactions were $8.1 billion (representing 24% of total assets) at December 31, 2017 .
48
Accounting for transactions as business combinations and divestitures is significantly different than asset acquisitions and divestitures. For example, acquired IPRD is capitalized for business combinations and expensed for asset acquisitions and the fair value of contingent consideration and goodwill are only recognized in business combination transactions. Likewise, when a portion of a reporting unit that constitutes a business is divested, goodwill associated with that business is included in the carrying value of the business in determining the gain or loss. Derecognition of goodwill does not occur in asset dispositions. As a result, it is important to determine whether a business or an asset or group of assets is acquired or divested. A business is defined in ASC 805 - Business Combinations as an integrated set of inputs and processes that are capable of generating outputs that have the ability to provide a return to its investors or owners. Typical inputs include long-lived assets (including intangible assets or rights to use long-lived assets), intellectual property and the ability to obtain access to required resources. Typical processes include strategic, operational and resource management processes that are typically documented or evident through an organized workforce.
We consider all of the above factors when determining whether a business was acquired (or divested) as well as the compound's development phase if no commercial products are involved. For example, in evaluating our acquisitions of IFM, Cormorant, Padlock, Cardioxyl and Flexus during the past three years, we concluded that no significant processes were transferred to us, thus the transactions were accounted for as asset acquisitions. As a result, the amounts allocated to the lead investigational compounds were expensed and not capitalized. In addition, contingent consideration from potential development, regulatory, approval and sales-based milestones and sales-based royalties were not included in the purchase price. Refer to "Item 8. Financial Statements-Note 4 . Acquisitions and Divestitures" for further discussion on our acquisitions.
Similarly, in evaluating divestitures of our small molecule manufacturing operations in Swords, Ireland, investigational HIV medicines business, the businesses comprising the alliance with Reckitt, the Medicines Company, Valeant Pharmaceuticals International, Inc., Erbitux* and Ixempra* , we concluded that all necessary inputs and processes were transferred, and consequently the transactions were accounted for as sales of businesses, which resulted in the allocation of goodwill ( $12 million in 2017, $98 million in 2016 and $73 million in 2015) to the carrying value of the businesses in determining the gain on sale. Contingent proceeds related to divestitures were not recognized until realized. We also concluded that not all inputs and significant processes to be capable of generating outputs were transferred in our out-licensing arrangements with Biogen and Roche, and consequently these transactions were not accounted for as sales of businesses in 2017.
Long-lived Assets
Other Intangible Assets, including IPRD
Other intangible assets were $ 1.2 billion at December 31, 2017 , including licenses ( $254 million of which $152 million is allocated to unapproved products), developed technology rights ( $565 million ), capitalized software ( $359 million ) and IPRD ( $32 million ). Intangible assets are assessed for impairment whenever current facts or circumstances warrant a review, although IPRD is assessed at least annually. Intangible assets are highly vulnerable to impairment charges, particularly newly acquired assets for recently launched products or IPRD. These assets are initially measured at fair value and therefore any reduction in expectations used in the valuations could potentially lead to impairment. Some of the more common potential risks leading to impairment include competition, earlier than expected LOE, pricing pressures, adverse regulatory changes or clinical study results, delay or failure to obtain regulatory approval and additional development costs, inability to achieve expected synergies, higher operating costs, changes in tax laws and other macro-economic changes. The complexity in estimating the fair value of intangible assets in connection with an impairment test is similar to the initial valuation.
Considering the high risk nature of research and development and the industry's success rate of bringing developmental compounds to market, impairment charges are likely to occur in future periods. We recognized a $75 million charge in 2017 for F-Star Alpha's FS102 which was in Phase I development for the treatment of breast and gastric cancer and $160 million in 2015 for BMS-986020 which was in Phase II development for treatment of IPF. For discussion on IPRD impairments, refer to "Item 8. Financial Statements-Note 13 . Goodwill and Other Intangible Assets."
49
Property, Plant and Equipment
Property, plant and equipment is tested for impairment whenever current facts or circumstances require a review including whether it is more likely than not that the asset will be disposed of prior to its estimated remaining useful life. Additionally, these long-lived assets are periodically reviewed to determine if any change in facts or circumstances would result in a change to the estimated useful life of the asset, possibly resulting in the acceleration of depreciation. If such circumstances exist, an estimate of undiscounted future cash flows generated by the asset, or the appropriate grouping of assets, is compared to the carrying value to determine whether an impairment exists at its lowest level of identifiable cash flows. If an asset is determined to be impaired, the loss is measured based on the difference between the asset's fair value and its carrying value. Expectations of future cash flows are subject to change based upon the near and long-term production volumes and margins generated by the asset as well as any potential alternative future use. The divestiture of our small molecule active pharmaceutical ingredient manufacturing operations in Swords, Ireland and sale of our R&D facility in Wallingford, Connecticut, resulted in $146 million and $79 million in impairment charges, respectively, to reduce the carrying value of assets held-for-sale to their fair value in 2017. Accelerated depreciation, impairment and other related charges for certain manufacturing and R&D facilities were $533 million in 2017 , $104 million in 2016 and $115 million in 2015 . Additional charges will continue to occur as a result of the Company's restructuring actions announced in the fourth quarter of 2016.
Assets Held-for-Sale
The following criteria is considered before concluding assets are classified as held-for-sale; 1) management's commitment to a plan to sell, 2) availability for immediate sale in its present condition, 3) initiation of an active program to identify a buyer, 4) probability of a completed sale within one year, 5) actively marketed for sale at a reasonable price in relation to its current fair value, and 6) likelihood of significant changes to the plan will be made or that the plan will be withdrawn. If all of the criteria is met as of the balance sheet date, the net assets are presented separately in the balance sheet as held-for-sale at the lower of its carrying amount or fair value less costs to sell and is no longer depreciated or amortized while classified as held-for-sale. For example, in evaluating the divestitures of our small molecule manufacturing operations in Swords, Ireland and our sale of our R&D facility in Wallingford, Connecticut, we concluded that all the necessary held-for-sale criteria were met in 2017 in a quarterly period prior to the completed sale. In evaluating the divestitures of the investigational HIV medicines business, the businesses comprising the alliances with Reckitt and Lilly, we concluded that all the necessary held-for-sale criteria were met in 2015.
Income Taxes
Valuation allowances are recognized to reduce deferred tax assets when it is more likely than not that a tax benefit will not be realized. The assessment of whether or not a valuation allowance is required often requires significant judgment including long-range forecasts of future taxable income and evaluation of tax planning initiatives. Adjustments to the deferred tax valuation allowances are made to earnings in the period when such assessments are made. Our deferred tax assets were $2.3 billion at December 31, 2017 (net of valuation allowances of $2.8 billion ) and $4.3 billion at December 31, 2016 (net of valuation allowances of $3.1 billion ).
The U.S. Federal net operating loss carryforwards were $317 million at December 31, 2017 . These carryforwards were acquired as a result of certain acquisitions and are subject to limitations under Section 382 of the Internal Revenue Code. The net operating loss carryforwards expire in varying amounts beginning in 2022. The foreign and state net operating loss carryforwards expire in varying amounts beginning in 2018 (certain amounts have unlimited lives).
As discussed more fully in the Results of Operations section of this MD&A, tax charges attributed to the one-time deemed repatriation tax on certain foreign earnings of $2.6 billion were recognized in the fourth quarter of 2017. The accounting for this income tax effect of the Act was incomplete as of the issuance date of the financial statements as we did not have all of the necessary information available, prepared and analyzed to complete the accounting. However, we were able to make a reasonable estimate of this tax, which was recorded as a provisional amount. The provisional amount may change when completed in 2018 upon finalizing the 2017 taxable income, untaxed post-1986 foreign earnings and profits and related cash and certain eligible assets of the specified foreign corporations. The provisional amounts may also change if additional interpretations of the relevant tax code are released.
Prior to the Mead Johnson split-off in 2009, the following transactions occurred: (i) an internal spin-off of Mead Johnson shares while still owned by us; (ii) conversion of Mead Johnson Class B shares to Class A shares; and; (iii) conversion of Mead Johnson & Company to a limited liability company. These transactions as well as the split-off of Mead Johnson through the exchange offer should qualify as tax-exempt transactions under the Internal Revenue Code based upon a private letter ruling received from the Internal Revenue Service related to the conversion of Mead Johnson Class B shares to Class A shares, and outside legal opinions.
50
Certain assumptions, representations and covenants by Mead Johnson were relied upon regarding the future conduct of its business and other matters which could affect the tax treatment of the exchange. For example, the current tax law generally creates a presumption that the exchange would be taxable to us, if Mead Johnson or its shareholders were to engage in transactions that result in a 50% or greater change in its stock ownership during a four year period beginning two years before the exchange offer, unless it is established that the exchange offer were not part of a plan or series of related transactions to effect such a change in ownership. If the internal spin-off or exchange offer were determined not to qualify as a tax exempt transaction, the transaction could be subject to tax as if the exchange was a taxable sale by us at market value.
In addition, a negative basis or excess loss account (ELA) existed in our investment in stock of Mead Johnson prior to these transactions. We received an opinion from outside legal counsel to the effect that it is more likely than not that we eliminated the ELA as part of these transactions and do not have taxable income with respect to the ELA. The tax law in this area is complex and it is possible that even if the internal spin-off and the exchange offer is tax exempt under the Internal Revenue Code, the IRS could assert that we have additional taxable income for the period with respect to the ELA. We could be exposed to additional taxes if this were to occur. Based upon our understanding of the Internal Revenue Code and opinion from outside legal counsel, a tax reserve of $244 million was established reducing the gain on disposal of Mead Johnson included in discontinued operations in 2009.
We agreed to certain tax related indemnities with Mead Johnson as set forth in the tax sharing agreement, including certain taxes related to its business prior to the completion of the IPO and created as part of the restructuring to facilitate the IPO. Mead Johnson has also agreed to indemnify us for potential tax effects resulting from the breach of certain representations discussed above as well as certain transactions related to the acquisition of Mead Johnson's stock or assets.
Liabilities are established for possible assessments by tax authorities resulting from known tax exposures including, but not limited to, transfer pricing matters, tax credits and deductibility of certain expenses. Such liabilities represent a reasonable provision for taxes ultimately expected to be paid and may need to be adjusted over time as more information becomes known.
For discussions on income taxes, refer to "Item 8. Financial Statements-Note 1 . Accounting Policies-Income Taxes" and "-Note 7 . Income Taxes."
Contingencies
In the normal course of business, we are subject to contingencies, such as legal proceedings and claims arising out of our business, that cover a wide range of matters, including, among others, government investigations, shareholder lawsuits, product and environmental liability, contractual claims and tax matters. We recognize accruals for such contingencies when it is probable that a liability will be incurred and the amount of the loss can be reasonably estimated. These estimates are subject to uncertainties that are difficult to predict and, as such, actual results could vary from these estimates.
For discussions on contingencies, refer to "Item 8. Financial Statements-Note 1 . Accounting Policies-Contingencies," "-Note 7 . Income Taxes" and "-Note 18 . Legal Proceedings and Contingencies."
Product and Pipeline Developments
Our R&D programs are managed on a portfolio basis from early discovery through late-stage development and include a balance of early-stage and late-stage programs to support future growth. Our late stage R&D programs in Phase III development include both investigational compounds for initial indications and additional indications or formulations for marketed products. Spending on these programs represent approximately 30-45% of our annual R&D expenses in the last three years. Opdivo was the only investigational compound or marketed product that represented greater than 10% of our R&D expenses in the last three years. Our late-stage development programs could potentially have an impact on our revenue and earnings within the next few years if regulatory approvals are obtained and products are successfully commercialized. The following are the developments in our marketed products and our late-stage pipeline:
51
Product | Indication | Date | Developments |
Opdivo | Biliary Tract Cancer | April 2017 | BMS and Ono announced Opdivo was designated for the treatment of biliary tract cancer under the Sakigake Designation System in Japan, which offers priority consultation and review. |
cHL | December 2017 | BMS and Seattle Genetics, Inc. highlighted an updated interim results from the Phase I/II study evaluating Opdivo and Adcetris * in relapsed/refractory cHL. Interim results were previously highlighted in June. | |
June 2017 | BMS announced extended follow-up data from CheckMate-205, a Phase II study evaluating Opdivo in patients with relapsed or progressed cHL after autologous stem cell transplant. | ||
June 2017 | BMS and Seattle Genetics, Inc. expanded their clinical collaboration to evaluate the combination of Opdivo and Adcetris* (brentuximab vedotin) in a pivotal Phase III study in relapsed/refractory or transplant advanced cHL. | ||
April 2017 | FDA approval for an updated indication for Opdivo for the treatment of adult patients with cHL that have relapsed or progressed after auto-HSCT and brentuximab vedotin, or three or more lines of systemic therapy that includes auto-HSCT. | ||
Gastric | September 2017 | Approval in Japan for the treatment of unresectable advanced or recurrent gastric cancer which has progressed after chemotherapy, received by our alliance partner, Ono. | |
January 2017 | Announced results of ONO-4538-12, a Phase III study evaluating Opdivo in patients with previously treated advanced gastric cancer refractory to or intolerant of standard therapy. Ono, our alliance partner, conducted the study. | ||
GBM | April 2017 | Announced CheckMate-143, a randomized Phase III study evaluating the efficacy and safety of Opdivo in patients with first recurrence of GBM did not meet its primary endpoint of improved overall survival over bevacizumab monotherapy. | |
HCC | September 2017 | FDA approval for the treatment of patients with HCC, a type of liver cancer, who have been previously treated with sorafenib. | |
HNC | April 2017 | EC approval for the treatment of SCCHN in adults progressing on or after platinum-based therapy. | |
March 2017 | Approval for the treatment of recurrent or metastatic HNC in Japan, received by our alliance partner, Ono. | ||
HPV | June 2017 | Announced data from a cohort of the Phase I/II CheckMate-358 study evaluating Opdivo for the treatment of patients with advanced cervical, vaginal and vulvar cancers, all associated with infection by HPV. | |
mCRC | August 2017 | FDA approval for the treatment of adult and pediatric patients with MSI-H or dMMR mCRC that has progressed following treatment with a fluoropyrimidine, oxaliplatin and irinotecan. | |
Melanoma | December 2017 | FDA approval of injection for intravenous use for the adjuvant treatment of patients with melanoma with involvement of lymph nodes or metastatic disease who have undergone complete resection. | |
October 2017 | Announced the EMA validated its type II variation application which seeks to expand the current indications to include the treatment of patients with melanoma who are at high risk of disease recurrence following complete surgical resection. | ||
September 2017 | Announced treatment with Opdivo resulted in significant improvement in recurrence-free survival compared to Yervoy in patients with stage IIIb/c or stage IV melanoma following complete surgical resection. | ||
July 2017 | Announced a Phase III study evaluating Opdivo versus Yervoy in patients with stage IIIb/c or stage IV melanoma who are at high risk of recurrence following complete surgical resection met its primary endpoint of recurrence-free survival at a planned interim analysis. | ||
June 2017 | Announced proof-of-concept data from the Phase I/IIa study for Opdivo in combination with BMS-986016, an investigational anti-LAG-3 therapy, in patients with advanced melanoma previously treated with anti-PD-1/PD-L1 therapy. | ||
mUC | June 2017 | EC approval for the treatment of patients with previously treated locally advanced unresectable or mUC, a type of bladder cancer, in adults after failure of platinum-containing therapy. | |
February 2017 | FDA approval for the treatment of patients with previously treated locally advanced or metastatic urothelial carcinoma, a type of bladder cancer. | ||
Multiple Myeloma | December 2017 | Announced the FDA lifted partial clinical holds placed on CheckMate-039 and CA204142, two clinical studies investigating Opdivo based combinations in patients with relapsed or refractory multiple myeloma. | |
September 2017 | Announced the FDA placed partial clinical holds on CheckMate-602, CheckMate-039 and CA204142, three clinical studies investigating Opdivo based combinations in patients with relapsed or refractory multiple myeloma. This partial clinical hold is related to risks identified in studies studying another anti-PD-1 agent, pembrolizumab, in patients with multiple myeloma. | ||
|
|
|
|
52
|
|
|
|
Opdivo | NSCLC | November 2017 | Announced Phase III study Checkmate-078, a multinational, randomized study evaluating Opdivo versus docetaxel in previously treated advanced or metastatic NSCLC, was stopped early having met its primary endpoint demonstrating superior overall survival. CheckMate-078 is a multinational Phase III study with predominately Chinese patients. BMS submitted a BLA for Opdivo to the China Food and Drug Administration (CFDA) for the proposed indication of previously treated NSCLC, which has been accepted by the CFDA. |
September 2017 | Announced three-year overall survival data from CheckMate-017 and CheckMate-057, two pivotal Phase III randomized studies evaluating Opdivo vs. docetaxel in patients with previously treated metastatic NSCLC. | ||
April 2017 | Announced five-year overall survival data from study CA209-003, a Phase I study evaluating Opdivo in patients with previously treated advanced NSCLC. | ||
RCC | November 2017 | Announced a three-year overall survival update from CheckMate-025, a Phase III study evaluating Opdivo vs. everolimus in previously treated advanced RCC. | |
Various | July 2017 | BMS and Clovis Oncology, Inc. announced a clinical collaboration to evaluate the combination of Opdivo and Rubraca * (rucaparib) in pivotal Phase III studies in advanced ovarian cancer and triple-negative breast cancer as well as a Phase II study in metastatic castration-resistant prostate cancer. | |
Announced FDA accepted the Company's sBLAs to update Opdivo dosing to include 480 mg infused over 30 minutes every four weeks for all currently approved monotherapy indications. The FDA action date is March 5, 2018. | |||
April 2017 | BMS and Incyte announced the companies will advance their clinical development program evaluating the combination of Opdivo with epacadostat into a Phase III registrational study in first-line NSCLC across the spectrum of PD-L1 expression and first-line HNC. | ||
Opdivo+Yervoy | CRC | January 2018 | Announced new data from CheckMate-142, a Phase II study evaluating Opdivo monotherapy or in combination with Yervoy for previously treated patients with dMMR or MSI-H metastatic CRC. Interim data had previously been announced in June 2017. |
Melanoma | June 2017 | Announced efficacy data from CheckMate-204, a Phase II study evaluating Opdivo+Yervoy as a potential treatment for patients with melanoma metastatic to the brain. | |
April 2017 | Announced overall survival data from CheckMate-067, a Phase III study evaluating Opdivo alone or in combination with Yervoy in patients with previously untreated advanced melanoma. | ||
MPM | June 2017 | Announced results from the IFCT-1501 MAPS-2 study evaluating Opdivo or Opdivo combined with Yervoy for previously treated unresectable MPM patients. | |
NSCLC | February 2018 | Announced that the pivotal Phase III CheckMate-227 study demonstrated superior progression-free survival with the combination of Opdivo + Yervoy versus chemotherapy in first-line NSCLC patients with high tumor mutation burden, regardless of PD-L1 expression. The study will continue as planned to assess the Opdivo + Yervoy combination for the co-primary endpoint of overall survival in patients who express PD-L1. | |
RCC | December 2017 | Announced FDA accepted the Company's sBLA's for priority review of Opdivo + Yervoy to treat intermediate and poor-risk patients with advanced RCC. The FDA action date is April 16, 2018. In November, announced results from a new exploratory analysis of PD-L1 expression subgroups of the Phase III CheckMate-214 study evaluating Opdivo + Yervo y vs. the standard of care, sunitinib, in intermediate- and poor-risk patients with previously untreated advanced or metastatic RCC. | |
November 2017 | Announced the EMA validated its type II variation application, which seeks to expand the current indications for Opdivo+Yervoy to include the treatment of intermediate- and poor-risk patients with advanced RCC. | ||
September 2017 | Announced CheckMate-214, a Phase III study evaluating Opdivo + Yervoy versus sunitinib in patients with previously untreated advanced or metastatic RCC, met its co-primary endpoint, demonstrating superior overall survival in intermediate- and poor-risk patients. The combination also met a secondary endpoint of improved overall survival in all randomized patients. Based on a planned interim analysis, an independent Data Monitoring Committee has recommended that the study be stopped early. | ||
August 2017 | Announced topline results from CheckMate-214. The combination of Opdivo+Yervoy met the co-primary endpoint of objective response rate and was favored in the co-primary endpoint of progression-free survival, however, it did not reach statistical significance. | ||
July 2017 | BMS and Exelixis, Inc. announced the initiation of the Phase III CheckMate 9ER study to evaluate Opdivo in combination with Cabometyx * (cabozantinib), Exelixis's small molecule inhibitor of receptor tyrosine kinases, or Opdivo and Yervoy in combination with Cabometyx * versus sunitinib in patients with previously untreated, advanced or metastatic RCC. | ||
SCLC | October 2017 | Announced data evaluating Opdivo and Opdivo + Yervoy in previously treated SCLC patients whose tumors were evaluable for tumor mutation burden from the Phase I/II CheckMate-032 study. | |
Various | February 2017 | BMS and Exelixis announced a clinical development collaboration to evaluate Cabometyx * with Opdivo , either alone or in combination with Yervoy . The agreement is expected to include a Phase III study in first-line RCC with additional studies planned in bladder cancer, HCC and potentially other tumor types. | |
|
|
|
|
53
|
|
|
|
Eliquis | NVAF | August 2017 | Announced results from a real-world data analysis of the U.S. Humana database, in which treatment with Eliquis was associated with a significantly lower risk of stroke/systemic embolism and lower rates of major bleeding compared to warfarin in patients aged 65 years and older with NVAF. |
Announced data from EMANATE, a Phase IV study, exploring the safety and efficacy of Eliquis in patients with NVAF undergoing cardioversion. | |||
Announced results from a real-world data analysis pooled from four large U.S. insurance claims databases, in which treatment with Eliquis was associated with a lower risk of stroke/systemic embolism and lower rates of major bleeding compared to warfarin for the overall population and for each of the selected high-risk patient sub-populations. | |||
March 2017 | Announced findings from a real-world data analysis of the U.S. Medicare database comparing the risk of stroke or systemic embolism and rate of major bleeding among patients with non-valvular atrial fibrillation who were treated with direct oral anticoagulants versus warfarin. | ||
|
|
|
|
Orencia | PsA | July 2017 | EC approval for the treatment of active PsA in adults for whom the response to previous disease-modifying antirheumatic drug therapy, including methotrexate, has been inadequate, and additional systemic therapy for psoriatic skin lesions is not required. |
FDA approval for active PsA in adults, a chronic, inflammatory disease that can affect both the skin and musculoskeletal system. | |||
JIA | March 2017 | FDA approval of a new subcutaneous administration option for use in patients two years of age and older with moderately to severely active polyarticular JIA. | |
|
|
|
|
Sprycel | ALL | December 2017 | Announced data from the Phase II CA180-372 study in pediatric patients with newly diagnosed Philadelphia chromosome-positive ALL treated with Sprycel added to a chemotherapy regimen. |
CML | November 2017 | FDA expanded the indication for Sprycel tablets to include the treatment of children with Philadelphia chromosome-positive CML in chronic phase. | |
June 2017 | Announced data from the Phase II CA180-226 study evaluating Sprycel in imatinib-resistant or -intolerant and newly diagnosed pediatric patients with chronic phase CML. | ||
May 2017 | Announced the EMA validated its grouped Type II variation/extension of application to treat children and adolescents aged 1 year to 18 years with chronic phase Philadelphia chromosome positive CML and to include the powder for oral suspension. | ||
|
|
|
|
Yervoy | Melanoma | January 2018 | EC approval of an expanded indication for the treatment of unresectable or metastatic melanoma in pediatric patients 12 years of age and older. |
October 2017 | Announced the FDA added five-year overall survival data from the Phase III CA184-029 study to the prescribing information for Yervoy for the adjuvant treatment of fully resected cutaneous melanoma with pathologic involvement of regional lymph nodes of more than 1 mm. | ||
July 2017 | FDA approval of an expanded indication for the treatment of unresectable or metastatic melanoma in pediatric patients. | ||
June 2017 | Announced relapse-free survival results from a Phase III study evaluating Yervoy 3 mg/kg and Yervoy 10mg/kg in patients with stage III or resectable stage IV melanoma who are at high risk of recurrence following complete surgical resection. | ||
|
|
|
|
Empliciti | Multiple Myeloma | June 2017 | Announced four-year follow-up data from a Phase III study evaluating Empliciti plus lenalidomide/dexamethasone vs. lenalidomide/dexamethasone alone in patients with relapsed/refractory multiple myeloma. |
|
|
|
|
Hepatitis C Franchise | HCV | April 2017 | China FDA approval of the Daklinza and Sunvepra regimen for treatment-naive or experienced patients infected with genotype 1b chronic HCV. In addition, Daklinza was approved in China for combination use with other agents, including sofosbuvir, for adult patients with HCV genotypes 1-6 infection. |
|
|
|
|
Prostvac* | Prostate Cancer | September 2017 | Bavarian Nordic A/S announced an independent Data Monitoring Committee determined that the continuation of the Phase III PROSPECT study of Prostvac* in patients with metastatic castration-resistant prostate cancer is futile. |
54
Special Note Regarding Forward-Looking Statements
This annual report on Form 10-K (including documents incorporated by reference) and other written and oral statements we make from time to time contain certain "forward-looking" statements within the meaning of Section 27A of the Securities Act of 1933 and Section 21E of the Securities Exchange Act of 1934. You can identify these forward-looking statements by the fact they use words such as "should", "expect", "anticipate", "estimate", "target", "may", "project", "guidance", "intend", "plan", "believe" and other words and terms of similar meaning and expression in connection with any discussion of future operating or financial performance. One can also identify forward-looking statements by the fact that they do not relate strictly to historical or current facts. Such forward-looking statements are based on current expectations and involve inherent risks and uncertainties, including factors that could delay, divert or change any of them, and could cause actual outcomes to differ materially from current expectations. These statements are likely to relate to, among other things, our goals, plans and projections regarding our financial position, results of operations, cash flows, market position, product development, product approvals, sales efforts, expenses, performance or results of current and anticipated products and the outcome of contingencies such as legal proceedings and financial results, which are based on current expectations that involve inherent risks and uncertainties, including internal or external factors that could delay, divert or change any of them in the next several years. We have included important factors in the cautionary statements included in this Annual Report on Form 10-K, particularly under "Item 1A. Risk Factors," that we believe could cause actual results to differ materially from any forward-looking statement.
Although we believe we have been prudent in our plans and assumptions, no assurance can be given that any goal or plan set forth in forward-looking statements can be achieved and readers are cautioned not to place undue reliance on such statements, which speak only as of the date made. We undertake no obligation to release publicly any revisions to forward-looking statements as a result of new information, future events or otherwise.
55
Item 7A. | QUANTITATIVE AND QUALITATIVE DISCLOSURES ABOUT MARKET RISK. |
We are exposed to market risk resulting from changes in currency exchange rates and interest rates. Certain derivative financial instruments are used when available on a cost-effective basis to hedge our underlying economic exposure. All of our financial instruments, including derivatives, are subject to counterparty credit risk considered as part of the overall fair value measurement. Derivative financial instruments are not used for trading purposes.
Foreign Exchange Risk
Significant amounts of our revenues, earnings and cash flow are exposed to changes in foreign currency rates. Our primary net foreign currency translation exposures are the euro and Japanese yen. Foreign currency forward contracts are used to manage risk primarily arising from certain intercompany purchase transactions; we are also exposed to foreign exchange transaction risk arising from non-functional currency denominated assets and liabilities and earnings denominated in non-U.S. dollar currencies. Foreign currency forward contracts are used to offset these exposures but are not designated as hedges.
We estimate that a 10% appreciation in the underlying currencies being hedged from their levels against the U.S. dollar (with all other variables held constant) would decrease the fair value of foreign exchange forward contracts by $175 million at December 31, 2017 , reducing earnings over the remaining life of the contracts.
We are also exposed to translation risk on non-U.S. dollar-denominated net assets. Non-U.S. dollar borrowings are used to hedge the foreign currency exposures of our net investment in certain foreign affiliates and are designated as hedges of net investments. The effective portion of foreign exchange gains or losses on these hedges is included in the foreign currency translation component of accumulated other comprehensive income/(loss). If our net investment decreases below the equivalent value of the non-U.S. debt borrowings, the change in the remeasurement basis of the debt would be subject to recognition in income as changes occur. For additional information, refer to "Item 8. Financial Statements-Note 9 . Financial Instruments and Fair Value Measurements."
Interest Rate Risk
We use fixed-to-floating interest rate swap contracts designated as fair value hedges to provide an appropriate balance of fixed and floating rate debt. We estimate that an increase of 100 basis points in short-term or long-term interest rates would decrease the fair value of our interest rate swap contracts by $25 million, thereby reducing earnings over the remaining life of the contracts.
We estimate that an increase of 100 basis points in long-term interest rates would decrease the fair value of long-term debt by $569 million. Our marketable securities are subject to changes in fair value as a result of interest rate fluctuations and other market factors. We estimate that an increase of 100 basis points in interest rates would decrease the fair value of our debt investments by approximately $70 million.
Credit Risk
We monitor our investments with counterparties with the objective of minimizing concentrations of credit risk. Our investment policy is to invest only in institutions that meet high credit quality standards and establishes limits on the amount and time to maturity of investments with any individual counterparty. The policy also requires that investments are only entered into with corporate and financial institutions that meet high credit quality standards.
The use of derivative instruments exposes us to credit risk if the counterparty fails to perform when the fair value of a derivative instrument contract is positive. If the counterparty fails to perform, collateral is not required by any party whether derivatives are in an asset or liability position. We have a policy of diversifying derivatives with counterparties to mitigate the overall risk of counterparty defaults. For additional information, refer to "Item 8. Financial Statements-Note 9 . Financial Instruments and Fair Value Measurements."
56
Item 8. | FINANCIAL STATEMENTS AND SUPPLEMENTARY DATA. |
BRISTOL-MYERS SQUIBB COMPANY
CONSOLIDATED STATEMENTS OF EARNINGS
Dollars in Millions, Except Per Share Data
|
| Year Ended December 31, | ||||||||||
EARNINGS |
| 2017 |
| 2016 |
| 2015 | ||||||
Net product sales |
| $ | 19,258 | |
| $ | 17,702 | |
| $ | 14,045 | |
Alliance and other revenues |
| 1,518 | |
| 1,725 | |
| 2,515 | | |||
Total Revenues |
| 20,776 | |
| 19,427 | |
| 16,560 | | |||
|
|
|
|
|
|
| ||||||
Cost of products sold |
| 6,066 | |
| 4,946 | |
| 3,909 | | |||
Marketing, selling and administrative |
| 4,687 | |
| 4,911 | |
| 4,841 | | |||
Research and development |
| 6,411 | |
| 4,940 | |
| 5,920 | | |||
Other income (net) |
| (1,519 | ) |
| (1,285 | ) |
| (187 | ) | |||
Total Expenses |
| 15,645 | |
| 13,512 | |
| 14,483 | | |||
|
|
|
|
|
|
| ||||||
Earnings Before Income Taxes |
| 5,131 | |
| 5,915 | |
| 2,077 | | |||
Provision for Income Taxes |
| 4,156 | |
| 1,408 | |
| 446 | | |||
Net Earnings |
| 975 | |
| 4,507 | |
| 1,631 | | |||
Noncontrolling Interest |
| (32 | ) |
| 50 | |
| 66 | | |||
Net Earnings Attributable to BMS |
| $ | 1,007 | |
| $ | 4,457 | |
| $ | 1,565 | |
|
|
|
|
|
|
| ||||||
Earnings per Common Share |
|
|
|
|
|
| ||||||
Basic |
| $ | 0.61 | |
| $ | 2.67 | |
| $ | 0.94 | |
Diluted |
| $ | 0.61 | |
| $ | 2.65 | |
| $ | 0.93 | |
|
|
|
|
|
|
| ||||||
Cash dividends declared per common share |
| $ | 1.57 | |
| $ | 1.53 | |
| $ | 1.49 | |
CONSOLIDATED STATEMENTS OF COMPREHENSIVE INCOME
Dollars in Millions
|
| Year Ended December 31, | ||||||||||
COMPREHENSIVE INCOME |
| 2017 |
| 2016 |
| 2015 | ||||||
Net Earnings |
| $ | 975 | |
| $ | 4,507 | |
| $ | 1,631 | |
Other Comprehensive Income/(Loss), net of taxes and reclassifications to earnings: |
|
|
|
|
|
| ||||||
Derivatives qualifying as cash flow hedges |
| (57 | ) |
| 4 | |
| (51 | ) | |||
Pension and postretirement benefits |
| 214 | |
| (17 | ) |
| 101 | | |||
Available-for-sale securities |
| 39 | |
| 16 | |
| (54 | ) | |||
Foreign currency translation |
| 18 | |
| (38 | ) |
| (39 | ) | |||
Total Other Comprehensive Income/(Loss) |
| 214 | |
| (35 | ) |
| (43 | ) | |||
|
|
|
|
|
|
| ||||||
Comprehensive Income |
| 1,189 | |
| 4,472 | |
| 1,588 | | |||
Comprehensive Income/(Loss) Attributable to Noncontrolling Interest |
| (32 | ) |
| 50 | |
| 66 | | |||
Comprehensive Income Attributable to BMS |
| $ | 1,221 | |
| $ | 4,422 | |
| $ | 1,522 | |
The accompanying notes are an integral part of these consolidated financial statements.
57
BRISTOL-MYERS SQUIBB COMPANY
CONSOLIDATED BALANCE SHEETS
Dollars in Millions, Except Share and Per Share Data
|
| December 31, | ||||||
ASSETS |
| 2017 |
| 2016 | ||||
Current Assets: |
|
|
|
| ||||
Cash and cash equivalents |
| $ | 5,421 | |
| $ | 4,237 | |
Marketable securities |
| 1,391 | |
| 2,113 | | ||
Receivables |
| 6,300 | |
| 5,543 | | ||
Inventories |
| 1,166 | |
| 1,241 | | ||
Prepaid expenses and other |
| 576 | |
| 570 | | ||
Total Current Assets |
| 14,854 | |
| 13,704 | | ||
Property, plant and equipment |
| 5,001 | |
| 4,980 | | ||
Goodwill |
| 6,863 | |
| 6,875 | | ||
Other intangible assets |
| 1,210 | |
| 1,385 | | ||
Deferred income taxes |
| 1,610 | |
| 2,996 | | ||
Marketable securities |
| 2,480 | |
| 2,719 | | ||
Other assets |
| 1,533 | |
| 1,048 | | ||
Total Assets |
| $ | 33,551 | |
| $ | 33,707 | |
|
|
|
|
| ||||
LIABILITIES |
|
|
|
| ||||
Current Liabilities: |
|
|
|
| ||||
Short-term debt obligations |
| $ | 987 | |
| $ | 992 | |
Accounts payable |
| 2,248 | |
| 1,664 | | ||
Accrued liabilities |
| 6,014 | |
| 5,271 | | ||
Deferred income |
| 83 | |
| 762 | | ||
Income taxes payable |
| 231 | |
| 152 | | ||
Total Current Liabilities |
| 9,563 | |
| 8,841 | | ||
Deferred income |
| 454 | |
| 547 | | ||
Income taxes payable |
| 3,548 | |
| 973 | | ||
Pension and other liabilities |
| 1,164 | |
| 1,283 | | ||
Long-term debt |
| 6,975 | |
| 5,716 | | ||
Total Liabilities |
| 21,704 | |
| 17,360 | | ||
|
|
|
|
| ||||
Commitments and contingencies |
| |
| | ||||
|
|
|
|
| ||||
EQUITY |
|
|
|
| ||||
Bristol-Myers Squibb Company Shareholders' Equity: |
|
|
|
| ||||
Preferred stock, $2 convertible series, par value $1 per share: Authorized 10 million shares; issued and outstanding 4,070 in 2017 and 4,129 in 2016, liquidation value of $50 per share |
| - | |
| - | | ||
Common stock, par value of $0.10 per share: Authorized 4.5 billion shares; 2.2 billion issued in both 2017 and 2016 |
| 221 | |
| 221 | | ||
Capital in excess of par value of stock |
| 1,898 | |
| 1,725 | | ||
Accumulated other comprehensive loss |
| (2,289 | ) |
| (2,503 | ) | ||
Retained earnings |
| 31,160 | |
| 33,513 | | ||
Less cost of treasury stock - 575 million common shares in 2017 and 536 million in 2016 |
| (19,249 | ) |
| (16,779 | ) | ||
Total Bristol-Myers Squibb Company Shareholders' Equity |
| 11,741 | |
| 16,177 | | ||
Noncontrolling interest |
| 106 | |
| 170 | | ||
Total Equity |
| 11,847 | |
| 16,347 | | ||
Total Liabilities and Equity |
| $ | 33,551 | |
| $ | 33,707 | |
The accompanying notes are an integral part of these consolidated financial statements.
58
BRISTOL-MYERS SQUIBB COMPANY
CONSOLIDATED STATEMENTS OF CASH FLOWS
Dollars in Millions
|
| Year Ended December 31, | ||||||||||
|
| 2017 |
| 2016 |
| 2015 | ||||||
Cash Flows From Operating Activities: |
|
|
|
|
|
| ||||||
Net earnings |
| $ | 975 | |
| $ | 4,507 | |
| $ | 1,631 | |
Adjustments to reconcile net earnings to net cash provided by operating activities: |
|
|
|
|
|
| ||||||
Depreciation and amortization, net |
| 789 | |
| 382 | |
| 376 | | |||
Deferred income taxes |
| 1,010 | |
| (204 | ) |
| (347 | ) | |||
Stock-based compensation |
| 199 | |
| 205 | |
| 235 | | |||
Impairment charges |
| 332 | |
| 108 | |
| 192 | | |||
Pension settlements and amortization |
| 236 | |
| 169 | |
| 245 | | |||
Divestiture gains and royalties |
| (706 | ) |
| (1,187 | ) |
| (490 | ) | |||
Asset acquisition charges |
| 760 | |
| 274 | |
| 983 | | |||
Other adjustments |
| 92 | |
| (44 | ) |
| 15 | | |||
Changes in operating assets and liabilities: |
|
|
|
|
|
| ||||||
Receivables |
| (431 | ) |
| (803 | ) |
| (942 | ) | |||
Inventories |
| (29 | ) |
| (152 | ) |
| 97 | | |||
Accounts payable |
| 320 | |
| 104 | |
| (919 | ) | |||
Deferred income |
| (642 | ) |
| (64 | ) |
| 218 | | |||
Income taxes payable |
| 2,597 | |
| (453 | ) |
| 194 | | |||
Other |
| (227 | ) |
| 216 | |
| 617 | | |||
Net Cash Provided by Operating Activities |
| 5,275 | |
| 3,058 | |
| 2,105 | | |||
Cash Flows From Investing Activities: |
|
|
|
|
|
| ||||||
Sale and maturities of marketable securities |
| 6,412 | |
| 4,809 | |
| 2,794 | | |||
Purchase of marketable securities |
| (5,437 | ) |
| (3,089 | ) |
| (3,143 | ) | |||
Capital expenditures |
| (1,055 | ) |
| (1,215 | ) |
| (820 | ) | |||
Divestiture and other proceeds |
| 722 | |
| 1,334 | |
| 708 | | |||
Acquisition and other payments |
| (708 | ) |
| (359 | ) |
| (1,111 | ) | |||
Net Cash Provided by/(Used in) Investing Activities |
| (66 | ) |
| 1,480 | |
| (1,572 | ) | |||
Cash Flows From Financing Activities: |
|
|
|
|
|
| ||||||
Short-term debt obligations, net |
| 727 | |
| 125 | |
| (449 | ) | |||
Issuance of long-term debt |
| 1,488 | |
| - | |
| 1,268 | | |||
Repayment of long-term debt |
| (1,224 | ) |
| (15 | ) |
| (1,957 | ) | |||
Repurchase of common stock |
| (2,469 | ) |
| (231 | ) |
| - | | |||
Dividends |
| (2,577 | ) |
| (2,547 | ) |
| (2,477 | ) | |||
Other |
| (22 | ) |
| 15 | |
| (9 | ) | |||
Net Cash Used in Financing Activities |
| (4,077 | ) |
| (2,653 | ) |
| (3,624 | ) | |||
Effect of Exchange Rates on Cash and Cash Equivalents |
| 52 | |
| (33 | ) |
| (95 | ) | |||
Increase/(Decrease) in Cash and Cash Equivalents |
| 1,184 | |
| 1,852 | |
| (3,186 | ) | |||
Cash and Cash Equivalents at Beginning of Year |
| 4,237 | |
| 2,385 | |
| 5,571 | | |||
Cash and Cash Equivalents at End of Year |
| $ | 5,421 | |
| $ | 4,237 | |
| $ | 2,385 | |
The accompanying notes are an integral part of these consolidated financial statements.
59
Note 1 . ACCOUNTING POLICIES AND RECENTLY ISSUED ACCOUNTING STANDARDS
Basis of Consolidation
The consolidated financial statements are prepared in conformity with U.S. GAAP, including the accounts of Bristol-Myers Squibb Company and all of its controlled majority-owned subsidiaries and certain variable interest entities. All intercompany balances and transactions are eliminated. Material subsequent events are evaluated and disclosed through the report issuance date. Refer to the Summary of Abbreviated Terms at the end of this 2017 Form 10-K for terms used throughout the document.
Alliance and license arrangements are assessed to determine whether the terms provide economic or other control over the entity requiring consolidation of an entity. Entities controlled by means other than a majority voting interest are referred to as variable interest entities and are consolidated when BMS has both the power to direct the activities of the variable interest entity that most significantly impacts its economic performance and the obligation to absorb losses or the right to receive benefits that could potentially be significant to the entity.
Use of Estimates and Judgments
The preparation of financial statements requires the use of management estimates, judgments and assumptions. The most significant assumptions are estimates in determining the fair value and potential impairment of intangible assets; sales rebate and return accruals; legal contingencies; income taxes; determining if an acquisition or divestiture is a business or an asset; and pension and postretirement benefits. Actual results may differ from estimated results.
Reclassifications
Certain prior period amounts were reclassified to conform to the current period presentation. The consolidated statement of cash flows previously presented interest rate swap contract terminations and issuance of common stock as separate line items within cash flows from financing activities which are now presented as components of other financing activities. The reclassifications provide a more concise financial statements presentations and additional information is disclosed in the notes if material.
Revenue Recognition
Revenue is recognized when persuasive evidence of an arrangement exists, the sales price is fixed or determinable, collectability is reasonably assured and title and substantially all risks and rewards of ownership are transferred, generally at time of shipment (including the supply of commercial products to alliance partners when they are the principal in the end customer sale). However, certain revenue of non-U.S. businesses is recognized on the date of receipt by the customer. Alliance and other revenue related to Abilify* and Atripla* is not recognized until the products are sold to the end customer by the alliance partner. Royalties are recognized when the third-party sales are reliably measurable and collectability is reasonably assured. Refer to "-Note 3 . Alliances" for further detail regarding alliances.
Revenue is reduced at the time of recognition for expected sales returns, discounts, rebates and sales allowances based on historical experience updated for changes in facts and circumstances including the impact of applicable healthcare legislation. Revenue is deferred when there is no historical experience with products in a similar therapeutic category or with similar operational characteristics, or until the right of return no longer exists or sufficient historical experience to estimate sales returns is developed.
Income Taxes
The provision for income taxes includes income taxes paid or payable for the current year plus the change in deferred taxes during the year. Deferred taxes result from differences between the financial and tax basis of assets and liabilities and are adjusted for changes in tax rates and tax laws when changes are enacted. Valuation allowances are recognized to reduce deferred tax assets when it is more likely than not that a tax benefit will not be realized. The assessment of whether or not a valuation allowance is required often requires significant judgment including the long-range forecast of future taxable income and the evaluation of tax planning initiatives. Adjustments to the deferred tax valuation allowances are made to earnings in the period when such assessments are made.
Tax benefits are recognized from an uncertain tax position only if it is more likely than not that the tax position will be sustained on examination by the taxing authorities based on the technical merits of the position. The tax benefit recognized in the financial statements for a particular tax position is based on the largest benefit that is more likely than not to be realized upon settlement.
Cash and Cash Equivalents
Cash and cash equivalents include bank deposits, time deposits, commercial paper and money market funds. Cash equivalents consist of highly liquid investments with original maturities of three months or less at the time of purchase and are recognized at cost, which approximates fair value.
60
Marketable Securities and Investments in Other Companies
Marketable securities are classified as "available-for-sale" on the date of purchase and reported at fair value. Fair value is determined based on observable market quotes or valuation models using assessments of counterparty credit worthiness, credit default risk or underlying security and overall capital market liquidity.
Investments in 50% or less owned companies are accounted for using the equity method of accounting when the ability to exercise significant influence is maintained. The share of net income or losses of equity investments is included in other income (net). Equity investments are reviewed for impairment by assessing if the decline in market value of the investment below the carrying value is other than temporary, which considers the intent and ability to retain the investment for a period of time sufficient to allow for any anticipated recovery in market value, the duration and extent that the market value has been less than cost and the investee's financial condition.
Inventory Valuation
Inventories are stated at the lower of average cost or market.
Property, Plant and Equipment and Depreciation
Expenditures for additions, renewals and improvements are capitalized at cost. Depreciation is computed on a straight-line method based on the estimated useful lives of the related assets ranging from 20 to 50 years for buildings and 3 to 20 years for machinery, equipment and fixtures.
Impairment of Long-Lived Assets
Current facts or circumstances are periodically evaluated to determine if the carrying value of depreciable assets to be held and used may not be recoverable. If such circumstances exist, an estimate of undiscounted future cash flows generated by the long-lived asset, or appropriate grouping of assets, is compared to the carrying value to determine whether an impairment exists at its lowest level of identifiable cash flows. If an asset is determined to be impaired, the loss is measured based on the difference between the asset's fair value and its carrying value. An estimate of the asset's fair value is based on quoted market prices in active markets, if available. If quoted market prices are not available, the estimate of fair value is based on various valuation techniques using unobservable fair value inputs, such as a discounted value of estimated future cash flows.
Capitalized Software
Eligible costs to obtain internal use software are capitalized and amortized over the estimated useful life of the software.
Acquisitions
Businesses acquired are consolidated upon obtaining control. The fair value of assets acquired and liabilities assumed are recognized at the date of acquisition. Any excess of the purchase price over the estimated fair values of the net assets acquired is recognized as goodwill. Business acquisition costs are expensed when incurred. Contingent consideration from potential development, regulatory, approval and sales-based milestones and sales-based royalties are included in the purchase price for business combinations and are excluded for asset acquisitions. Amounts allocated to the lead investigational compounds for asset acquisitions are expensed at the date of acquisition.
Goodwill, Acquired In-Process Research and Development and Other Intangible Assets
The fair value of acquired intangible assets is typically determined using the "income method" utilizing Level 3 fair value inputs. The market participant valuations assume a global view considering all potential jurisdictions and indications based on discounted after-tax cash flow projections, risk adjusted for estimated probability of technical and regulatory success (for IPRD).
Finite-lived intangible assets, including licenses, developed technology rights and IPRD projects that reach commercialization are amortized on a straight-line basis over their estimated useful life. Estimated useful lives are determined considering the period the assets are expected to contribute to future cash flows.
Goodwill is tested at least annually for impairment by assessing qualitative factors or performing a quantitative analysis in determining whether it is more likely than not that the fair value of net assets are below their carrying amounts. Examples of qualitative factors assessed include our share price, financial performance compared to budgets, long-term financial plans, macroeconomic, industry and market conditions as well as the substantial excess of fair value over the carrying value of net assets from the annual impairment test performed in a prior year. Each relevant factor is assessed both individually and in the aggregate.
61
IPRD is tested for impairment on an annual basis and more frequently if events occur or circumstances change that would indicate a potential reduction in the fair values of the assets below their carrying value. Impairment charges are recognized to the extent the carrying value of IPRD is determined to exceed its fair value.
Finite-lived intangible assets are tested for impairment when facts or circumstances suggest that the carrying value of the asset may not be recoverable. If the carrying value exceeds the projected undiscounted pretax cash flows of the intangible asset, an impairment loss equal to the excess of the carrying value over the estimated fair value (discounted after-tax cash flows) is recognized.
Restructuring
Restructuring charges are recognized as a result of actions to streamline operations and reduce the number of facilities. Estimating the impact of restructuring plans, including future termination benefits and other exit costs requires judgment. Actual results could vary from these estimates.
Contingencies
Loss contingencies from legal proceedings and claims may occur from government investigations, shareholder lawsuits, product and environmental liability, contractual claims, tax and other matters. Accruals are recognized when it is probable that a liability will be incurred and the amount of loss can be reasonably estimated. Gain contingencies (including contingent proceeds related to the divestitures) are not recognized until realized. Legal fees are expensed as incurred.
Advertising and Product Promotion Costs
Advertising and product promotion costs are included in marketing, selling and administrative expenses and were $740 million in 2017 , $789 million in 2016 and $825 million in 2015 . Advertising and product promotion costs are expensed as incurred.
Foreign Currency Translation
Foreign subsidiary earnings are translated into U.S. dollars using average exchange rates. The net assets of foreign subsidiaries are translated into U.S. dollars using current exchange rates. The U.S. dollar effects that arise from translating the net assets of these subsidiaries at changing rates are recognized in OCI.
Research and Development
Research and development costs are expensed as incurred. Clinical study costs are accrued over the service periods specified in the contracts and adjusted as necessary based upon an ongoing review of the level of effort and costs actually incurred. Research and development costs are presented net of reimbursements from alliance partners. Upfront and contingent milestone payments for asset acquisitions of investigational compounds are also included in research and development expenses if there are no alternative future uses.
Cash Flow
Payments for licensing and asset acquisitions of investigational compounds are included in operating activities as well as out-licensing proceeds. Payments for the acquisition of an ownership interest in a legal entity, including acquisitions that do not meet the accounting definition of a business are included in investing activities, as well as divestiture proceeds, royalties and other consideration received subsequent to the related sale of the asset or business. Other adjustments reflected in operating activities include divestiture gains and losses and related royalties, research and development asset acquisition charges, gains and losses on debt redemption and changes in the fair value of written option liabilities.
Recently Adopted Accounting Standards
Share-based Payment Transactions
Amended guidance for share-based payment transactions was adopted in the first quarter of 2017. Net excess tax benefits of $39 million in 2017 were recognized prospectively as a reduction of tax expense rather than capital in excess of par value of stock. Net excess tax benefits are also presented as an operating cash flow rather than a financing cash flow, and cash payments to tax authorities in connection with shares withheld for statutory tax withholding requirements are presented as a financing cash flow rather than an operating cash flow. The changes in cash flow presentation were applied retrospectively and increased operating cash flows and decreased financing cash flows by $125 million , $208 million and $273 million in 2017, 2016 and 2015, respectively.
62
Income Tax Accounting for Intra-entity Transfers of Assets Other Than Inventory
Amended guidance on income tax accounting for intra-entity transfers of assets other than inventory was early adopted in the first quarter of 2017 on a modified retrospective approach. The amended guidance requires tax consequences of these transfers be recognized in the period the transfer takes place. Net reductions to prepaid and deferred tax assets pertaining to pre-2017 internal transfers of intellectual property of $787 million were adjusted through retained earnings as a cumulative effect of an accounting change which will reduce the annual tax expense by $86 million beginning in 2017. In addition, the tax consequences of additional internal transfers of intellectual property that may occur in the future will be included in income tax expense upon transfer and not amortized in subsequent periods.
Recently Issued Accounting Standards
Revenue from Contracts with Customers
Amended guidance for revenue recognition will be adopted in the first quarter of 2018 using the modified retrospective method with the cumulative effect of the change recognized in retained earnings. The new guidance referred to as ASC 606 requires an entity to recognize the amount of revenue to which it expects to be entitled for the transfer of promised goods or services to customers and replaces most of the existing revenue recognition standards in U.S. GAAP. A five step model will be utilized to achieve the core principle; (1) identify the customer contract, (2) identify the contract's performance obligations, (3) determine the transaction price, (4) allocate the transaction price to the performance obligations and (5) recognize revenue when or as a performance obligation is satisfied.
The Company's assessment of the new standard's impact is substantially complete. The timing of recognizing revenue is not expected to change for typical net product sales to customers, most existing alliance arrangements as well as royalties and sale-based milestones from out-licensing arrangements. In addition, the timing of recognizing royalties, sales-based milestones and other forms of contingent consideration resulting from the divestiture of businesses is not expected to change.
However, transaction prices are no longer required to be fixed or determinable and certain variable consideration might be recognized prior to the occurrence or resolution of the contingent event to the extent it is probable that a significant reversal in the amount of estimated cumulative revenue will not occur. Certain estimated future royalties and termination fees for licensing rights previously reacquired by alliance partners are expected to be recognized as contract assets upon adoption of the new standard. Refer to the Sanofi and Lilly arrangements in "-Note 3. Alliances". As a result of the new guidance and cumulative effect adjustment, revenue and other income is expected to be lower in 2018 by approximately $200 million and $125 million , respectively, compared to what would have been reported under the previous standard. No significant changes to business processes, systems and controls are expected to be required.
Gains and Losses from the Derecognition of Nonfinancial Assets
Amended guidance for gains and losses from the derecognition of nonfinancial assets will be adopted in the first quarter of 2018 using the modified retrospective method. The amendments clarify the scope of asset derecognition guidance, adds guidance for partial sales of nonfinancial assets and clarifies recognizing gains and losses from the transfer of nonfinancial assets in contracts with noncustomers. The amended guidance clarifies that certain transactions such as the sale or out-licensing of product rights that do not constitute a business will require accounting similar to ASC 606 including the potential recognition of variable consideration. The amended guidance may result in earlier recognition of variable consideration depending on the facts and circumstances of each transaction.
Presentation of Net Periodic Pension and Postretirement Benefits
Amended guidance requiring all net periodic benefit components for defined benefit pension and other postretirement plans other than service costs to be recorded outside of income from operations (other income) will be adopted in the first quarter of 2018 on a retrospective basis. The Company expects that annual cost of products sold; marketing, selling and administrative; and research and development expenses will increase in the aggregate with a corresponding offset in other income. The service cost component will also be included in other income as the amounts are not material.
As adjusted amounts upon adoption of the new guidance are as follows:
|
| Year Ended December 31, | ||||||||||||||
|
| 2017 |
| 2016 | ||||||||||||
Dollars in Millions |
| As Reported |
| As Adjusted |
| As Reported |
| As Adjusted | ||||||||
Cost of products sold |
| $ | 6,066 | |
| $ | 6,092 | |
| $ | 4,946 | |
| $ | 4,967 | |
Marketing, selling and administrative |
| 4,687 | |
| 4,733 | |
| 4,911 | |
| 4,960 | | ||||
Research and development |
| 6,411 | |
| 6,474 | |
| 4,940 | |
| 5,005 | | ||||
Other income (net) |
| (1,519 | ) |
| (1,654 | ) |
| (1,285 | ) |
| (1,420 | ) | ||||
63
Definition of a Business
Amended guidance that revises the definition of a business will be adopted prospectively in the first quarter of 2018. The amendments provide an initial screen that when substantially all of the fair value of the gross assets acquired or disposed of is concentrated in a single identifiable asset or a group of similar identifiable assets, an integrated set of assets and activities would not represent a business. If the screen is not met, the set must include an input and a substantive process that together significantly contribute to the ability to create outputs for the set to represent a business. The amendment also narrows the definition of the term output and requires the transfer of an organized work force when outputs do not exist. The amended guidance may result in more transactions being accounted for as assets in the future with the impact to our results of operations dependent on the individual facts and circumstances of each transaction.
Recognition and Measurement of Financial Assets and Liabilities
Amended guidance for the recognition, measurement, presentation and disclosures of financial instruments will be adopted prospectively in the first quarter of 2018. The new guidance requires that fair value adjustments for equity securities with readily determinable fair values currently classified as available-for-sale be reported through earnings. The new guidance also requires a qualitative impairment assessment for equity investments without a readily determinable fair value based upon observable price changes and a charge through earnings if an impairment exists. The amended guidance is not expected to materially impact the Company's results of operations based upon the current equity investment portfolio.
Accounting for Hedging Activities
Amended guidance for derivatives and hedging will be adopted in the first quarter of 2018 on a modified retrospective approach. The amended guidance revises and expands items eligible for hedge accounting, simplifies hedge effectiveness testing and changes the timing of recognition and presentation for certain hedged items. Certain disclosure requirements are also modified for hedging activities on a prospective basis. The amended guidance is not expected to materially impact the Company's results of operations.
Leases
In February 2016, the FASB issued amended guidance on lease accounting. The amended guidance requires the recognition of a right-of-use asset and a lease liability, initially measured at the present value of future lease payments for leases with a term longer than 12 months. The guidance is effective January 1, 2019 with early adoption permitted on a modified retrospective approach. We intend to elect the available practical expedients on adoption. While our assessment of the amended standard remains ongoing, including our continued implementation of a leasing software system procured from a 3rd party vendor and evaluation of potential changes and enhancements to internal controls, we have substantially completed our lease information data gathering and lease data extraction processes and believe our overall implementation efforts remain on schedule. However, system readiness remains a critical factor in ensuring successful adoption on January 1, 2019. The undiscounted value of lease obligations is approximately $800 million as of December 31, 2017, consisting primarily of facility leases accounted for as operating leases. The initial right-of-use asset and lease liability amounts in the balance sheets upon adoption will be subject to several factors including the lease portfolio at the date of adoption, selection of an appropriate discount rate and determining the fixed lease components and lease renewal periods reasonably certain to occur. The amended guidance is not expected to materially impact the Company's results of operations other than the recognition of the right of use asset and lease liability.
Goodwill Impairment Testing
In January 2017, the FASB issued amended guidance that simplifies the recognition and measurement of a goodwill impairment loss by eliminating Step 2 of the quantitative impairment test. As a result, impairment charges will be required for the amount by which the reporting units carrying amount exceeds its fair value up to the amount of its allocated goodwill. The guidance is effective on a prospective basis on January 1, 2020, with early adoption permitted for interim or annual goodwill impairment tests performed after January 1, 2017. The amended guidance is not expected to materially impact the Company's results of operations.
Financial Instruments - Measurement of Credit Losses
In June 2016, the FASB issued amended guidance for the measurement of credit losses on financial instruments. Entities will be required to use a forward-looking estimated loss model. Available-for-sale debt security credit losses will be recognized as allowances rather than a reduction in amortized cost. The guidance is effective January 1, 2020 with early adoption permitted in 2019 on a modified retrospective approach. The amended guidance is not expected to materially impact the Company's results of operations.
Note 2 . BUSINESS SEGMENT INFORMATION
BMS operates in a single segment engaged in the discovery, development, licensing, manufacturing, marketing, distribution and sale of innovative medicines that help patients prevail over serious diseases. A global research and development organization and supply chain organization are responsible for the discovery, development, manufacturing and supply of products. Regional commercial organizations market, distribute and sell the products. The business is also supported by global corporate staff functions. Segment information is consistent with the financial information regularly reviewed by the chief executive officer for purposes of evaluating performance, allocating resources, setting incentive compensation targets, and planning and forecasting future periods.
64
Products are sold principally to wholesalers, and to a lesser extent, directly to distributors, retailers, hospitals, clinics, government agencies and pharmacies. Gross revenues to the three largest pharmaceutical wholesalers in the U.S. as a percentage of global gross revenues were as follows:
|
| 2017 |
| 2016 |
| 2015 | |||
McKesson Corporation |
| 24 | % |
| 22 | % |
| 21 | % |
AmerisourceBergen Corporation |
| 18 | % |
| 18 | % |
| 16 | % |
Cardinal Health, Inc. |
| 15 | % |
| 14 | % |
| 12 | % |
Selected geographic area information was as follows:
|
| Revenues |
| Property, Plant and Equipment | ||||||||||||||||
Dollars in Millions |
| 2017 |
| 2016 |
| 2015 |
| 2017 |
| 2016 | ||||||||||
United States |
| $ | 11,358 | |
| $ | 10,720 | |
| $ | 8,188 | |
| $ | 3,617 | |
| $ | 3,865 | |
Europe |
| 4,988 | |
| 4,215 | |
| 3,491 | |
| 1,266 | |
| 1,003 | | |||||
Rest of the World (a) |
| 3,877 | |
| 3,964 | |
| 4,142 | |
| 118 | |
| 112 | | |||||
Other (b) |
| 553 | |
| 528 | |
| 739 | |
| - | |
| - | | |||||
Total |
| $ | 20,776 | |
| $ | 19,427 | |
| $ | 16,560 | |
| $ | 5,001 | |
| $ | 4,980 | |
(a) | Includes Japan which represented 7% , 7% and 10% of total revenues in 2017 , 2016 and 2015 , respectively. |
(b) | Other revenues include royalties and alliance-related revenues for products not sold by our regional commercial organizations. |
Product revenues and the composition of total revenues were as follows:
|
| Year Ended December 31, | ||||||||||
Dollars in Millions |
| 2017 |
| 2016 |
| 2015 | ||||||
Prioritized Brands |
|
|
|
|
|
| ||||||
Opdivo |
| $ | 4,948 | |
| $ | 3,774 | |
| $ | 942 | |
Eliquis |
| 4,872 | |
| 3,343 | |
| 1,860 | | |||
Orencia |
| 2,479 | |
| 2,265 | |
| 1,885 | | |||
Sprycel |
| 2,005 | |
| 1,824 | |
| 1,620 | | |||
Yervoy |
| 1,244 | |
| 1,053 | |
| 1,126 | | |||
Empliciti |
| 231 | |
| 150 | |
| 3 | | |||
Established Brands |
|
|
|
|
|
| ||||||
Baraclude |
| 1,052 | |
| 1,192 | |
| 1,312 | | |||
Sustiva Franchise |
| 729 | |
| 1,065 | |
| 1,252 | | |||
Reyataz Franchise |
| 698 | |
| 912 | |
| 1,139 | | |||
Hepatitis C Franchise |
| 406 | |
| 1,578 | |
| 1,603 | | |||
Other Brands |
| 2,112 | |
| 2,271 | |
| 3,818 | | |||
Total Revenues |
| $ | 20,776 | |
| $ | 19,427 | |
| $ | 16,560 | |
|
|
|
|
|
|
| ||||||
Net product sales |
| $ | 19,258 | |
| $ | 17,702 | |
| $ | 14,045 | |
Alliance revenues |
| 1,294 | |
| 1,629 | |
| 2,408 | | |||
Other revenues |
| 224 | |
| 96 | |
| 107 | | |||
Total Revenues |
| $ | 20,776 | |
| $ | 19,427 | |
| $ | 16,560 | |
Note 3 . ALLIANCES
BMS enters into collaboration arrangements with third parties for the development and commercialization of certain products. Although each of these arrangements is unique in nature, both parties are active participants in the operating activities of the collaboration and exposed to significant risks and rewards depending on the commercial success of the activities. BMS may either in-license intellectual property owned by the other party or out-license its intellectual property to the other party. These arrangements also typically include research, development, manufacturing, and/or commercial activities and can cover a single investigational compound or commercial product or multiple compounds and/or products in various life cycle stages. The rights and obligations of the parties can be global or limited to geographic regions. We refer to these collaborations as alliances and our partners as alliance partners. Products sold through alliance arrangements in certain markets include Opdivo , Eliquis , Orencia, Sprycel , Yervoy , Empliciti , and Sustiva ( Atripla* ) and certain other brands.
65
Payments between alliance partners are accounted for and presented in the results of operations after considering the specific nature of the payment and the underlying activities to which the payments relate. Multiple alliance activities, including the transfer of rights, are only separated into individual units of accounting if they have standalone value from other activities that occur over the life of the arrangements. In these situations, the arrangement consideration is allocated to the activities or rights on a relative selling price basis. If multiple alliance activities or rights do not have standalone value, they are combined into a single unit of accounting.
The most common activities between BMS and its alliance partners are presented in results of operations as follows:
• | When BMS is the principal in the end customer sale, 100% of product sales are included in net product sales. When BMS's alliance partner is the principal in the end customer sale, BMS's contractual share of the third-party sales and/or royalty income are included in alliance revenue as the sale of commercial products are considered part of BMS's ongoing major or central operations. Refer to "Revenue Recognition" included in "-Note 1 . Accounting Policies" for information regarding recognition criteria. |
• | Amounts payable to BMS by alliance partners (who are the principal in the end customer sale) for supply of commercial products are included in alliance revenue as the sale of commercial products are considered part of BMS's ongoing major or central operations. |
• | Profit sharing, royalties and other sales-based fees payable by BMS to alliance partners are included in cost of products sold as incurred. |
• | Cost reimbursements between the parties are recognized as incurred and included in cost of products sold; marketing, selling and administrative expenses; or research and development expenses, based on the underlying nature of the related activities subject to reimbursement. |
• | Upfront and contingent development and approval milestones payable to BMS by alliance partners for investigational compounds and commercial products are deferred and amortized over the expected period of BMS's co-promotion obligation through the market exclusivity period or the periods in which the related compounds or products are expected to contribute to future cash flows. The amortization is presented consistent with the nature of the payment under the arrangement. For example, amounts received for investigational compounds are presented in other income (net) as the activities being performed at that time are not related to the sale of commercial products that are part of BMS's ongoing major or central operations; amounts received for commercial products are presented in alliance revenue as the sale of commercial products are considered part of BMS's ongoing major or central operations (except for the AstraZeneca alliance pertaining to the Amylin products - see further discussion under the specific AstraZeneca alliance disclosure herein). |
• | Upfront and contingent approval milestones payable by BMS to alliance partners for commercial products are capitalized and amortized over the shorter of the contractual term or the periods in which the related products are expected to contribute to future cash flows. The amortization is included in cost of products sold. |
• | Upfront and contingent milestones payable by BMS to alliance partners prior to regulatory approval are expensed as incurred and included in research and development expenses. |
• | Royalties and other contingent consideration payable to BMS by alliance partners related to the divestiture of such businesses are included in other income when earned. |
• | Equity in net income of affiliates is included in other income (net). |
• | All payments between BMS and its alliance partners are presented in cash flows from operating activities, except as otherwise described below. |
66
Selected financial information pertaining to our alliances was as follows, including net product sales when BMS is the principal in the third-party customer sale for products subject to the alliance. Expenses summarized below do not include all amounts attributed to the activities for the products in the alliance, but only the payments between the alliance partners or the related amortization if the payments were deferred or capitalized.
| Year Ended December 31, | ||||||||||
Dollars in Millions | 2017 |
| 2016 |
| 2015 | ||||||
Revenues from alliances: |
|
|
|
|
| ||||||
Net product sales | $ | 6,949 | |
| $ | 5,568 | |
| $ | 4,308 | |
Alliance revenues | 1,294 | |
| 1,629 | |
| 2,408 | | |||
Total Revenues | $ | 8,243 | |
| $ | 7,197 | |
| $ | 6,716 | |
|
|
|
|
|
| ||||||
Payments to/(from) alliance partners: |
|
|
|
|
| ||||||
Cost of products sold | $ | 2,723 | |
| $ | 2,129 | |
| $ | 1,655 | |
Marketing, selling and administrative | (58 | ) |
| (28 | ) |
| 15 | | |||
Research and development | 2 | |
| 56 | |
| 693 | | |||
Other income (net) | (731 | ) |
| (1,009 | ) |
| (733 | ) | |||
|
|
|
|
|
| ||||||
Noncontrolling interest, pretax | 12 | |
| 16 | |
| 51 | | |||
Selected Alliance Balance Sheet Information: |
| December 31, | ||||||
Dollars in Millions |
| 2017 |
| 2016 | ||||
Receivables – from alliance partners |
| $ | 522 | |
| $ | 903 | |
Accounts payable – to alliance partners |
| 878 | |
| 555 | | ||
Deferred income from alliances (a) |
| 467 | |
| 1,194 | | ||
(a) | Includes unamortized upfront, milestone and other licensing proceeds, revenue deferrals attributed to Atripla* and undelivered elements of diabetes business divestiture proceeds. Amortization of deferred income (primarily related to alliances) was $83 million in 2017 , $244 million in 2016 and $307 million in 2015 . |
Upfront payments for new licensing and alliance agreements (including options to license or acquire the related assets) charged to research and development expenses were $41 million in 2017 , $15 million in 2016 and $619 million in 2015 .
Specific information pertaining to each of our significant alliances is discussed below, including their nature and purpose; the significant rights and obligations of the parties; specific accounting policy elections; and the income statement classification of and amounts attributable to payments between the parties.
Pfizer
BMS and Pfizer jointly develop and commercialize Eliquis , an anticoagulant discovered by BMS. Pfizer funds between 50% and 60% of all development costs depending on the study. Profits and losses are shared equally on a global basis except in certain countries where Pfizer commercializes Eliquis and pays BMS a sales based fee.
Co-exclusive license rights were granted to Pfizer in exchange for an upfront payment and potential milestone payments. Both parties assumed certain obligations to actively participate in a joint executive committee and various other operating committees and have joint responsibilities for the research, development, distribution, sales and marketing activities of the alliance using resources in their own infrastructures. BMS manufactures the product in the alliance and is the principal in the end customer product sales in the U.S., significant countries in Europe, as well as Canada, Australia, China, Japan and South Korea. In 2015, BMS transferred full commercialization rights to Pfizer in certain smaller countries in order to simplify operations. In the transferred countries, BMS supplies the product to Pfizer at cost plus a percentage of the net sales price to end-customers.
The Company determined the rights transferred to Pfizer did not have standalone value as such rights were not sold separately by BMS or any other party, nor could Pfizer receive any benefit for the delivered rights without the fulfillment of other ongoing obligations by BMS under the alliance agreement, including the exclusive supply arrangement. As such, the global alliance was treated as a single unit of accounting and upfront proceeds and any subsequent contingent milestone proceeds are amortized over the expected period of BMS's co-promotion obligation through the market exclusivity period. BMS received $884 million in non-refundable upfront, milestone and other licensing payments related to Eliquis through December 31, 2017 . Amortization of the Eliquis deferred income is included in other income as Eliquis was not a commercial product at the commencement of the alliance.
67
Summarized financial information related to this alliance was as follows:
|
| Year Ended December 31, | ||||||||||
Dollars in Millions |
| 2017 |
| 2016 |
| 2015 | ||||||
Revenues from Pfizer alliance: |
|
|
|
|
|
| ||||||
Net product sales |
| $ | 4,808 | |
| $ | 3,306 | |
| $ | 1,849 | |
Alliance revenues |
| 64 | |
| 37 | |
| 11 | | |||
Total Revenues |
| $ | 4,872 | |
| $ | 3,343 | |
| $ | 1,860 | |
|
|
|
|
|
|
| ||||||
Payments to/(from) Pfizer: |
|
|
|
|
|
| ||||||
Cost of products sold – Profit sharing |
| $ | 2,314 | |
| $ | 1,595 | |
| $ | 895 | |
Other income (net) – Amortization of deferred income |
| (55 | ) |
| (55 | ) |
| (55 | ) | |||
Selected Alliance Balance Sheet Information: |
| December 31, | ||||||
Dollars in Millions |
| 2017 |
| 2016 | ||||
Deferred income |
| $ | 466 | |
| $ | 521 | |
Gilead
BMS and Gilead formed a joint venture in the U.S. and Canada and another joint venture in Europe to develop and commercialize a combination product named Atripla*, which combines BMS's Sustiva with Gilead's Truvada*. The two joint ventures are consolidated by Gilead.
In December 2017, Gilead terminated BMS's participation in the U.S. and Canada joint venture following the launch of a generic version of Sustiva by a third-party in the U.S. As a result, deferred income and alliance receivables attributed to Sustiva product held by the joint venture at December 31, 2017 was reduced by $438 million to reflect the post-termination selling price. In addition BMS is entitled to a fee equal to 55% of Atripla* U.S. net sales multiplied by the ratio of the difference in the average net selling prices of Atripla* and Truvada* to the Atripla* average net selling price in 2018. The fee is reduced to 35% in 2019 and 15% in 2020, of Atripla* U.S. net sales multiplied by the ratio described above. BMS will continue to supply Sustiva at cost plus a markup to Gilead during this three-year period unless either party elects to terminate the supply arrangement.
Prior to the termination of BMS's participation in the U.S. joint venture, both parties actively participated in a joint executive committee and various other operating committees with direct oversight over the activities of the joint venture. The joint venture purchased Sustiva and Truvada* API in bulk form from the parties and completed the finishing of Atripla* . The joint venture distributed Atripla* and was the principal in the end customer product sales. BMS recorded the bulk efavirenz component of Atripla * as alliance revenue which was based on the relative ratio of the average respective net selling prices of Truvada* and Sustiva . Alliance revenue and the related alliance receivable was not recognized until Atripla* was sold to third-party customers.
The joint venture in Europe was accounted for by BMS and continues to operate in a similar manner described above except that Gilead distributes Atripla*, is the principal in the end customer product sales and the parties no longer coordinate joint promotional activities. The European joint venture will continue until either party terminates the arrangement or the last patent expires that allows market exclusivity to Atripla* .
Summarized financial information related to this alliance was as follows:
|
| Year Ended December 31, | ||||||||||
Dollars in Millions |
| 2017 |
| 2016 |
| 2015 | ||||||
Revenues from Gilead alliances: |
|
|
|
|
|
| ||||||
Alliance revenues |
| $ | 623 | |
| $ | 934 | |
| $ | 1,096 | |
|
|
|
|
|
|
| ||||||
Equity in net loss of affiliates |
| $ | 13 | |
| $ | 12 | |
| $ | 17 | |
Selected Alliance Balance Sheet Information: |
| December 31, | ||||||
Dollars in Millions |
| 2017 |
| 2016 | ||||
Deferred income |
| $ | - | |
| $ | 634 | |
68
Otsuka
BMS and Otsuka co-promote Sprycel in the U.S., Japan and the EU (the Oncology Territory). Both parties actively participate in various governance committees, however, BMS has control over the decision making. BMS is responsible for the development and manufacture of the product and is also the principal in the end customer product sales. Ixempra* (ixabepilone) was included in the alliance prior to BMS's divestiture of that business in 2015. A fee is paid to Otsuka based on the following percentages of combined annual net sales of Sprycel and Ixempra* in the Oncology Territory (including post divestiture Ixempra* sales) through 2020:
| % of Net Sales |
$0 to $400 million | 65% |
$400 million to $600 million | 12% |
$600 million to $800 million | 3% |
$800 million to $1.0 billion | 2% |
In excess of $1.0 billion | 1% |
BMS also had a worldwide commercialization agreement with Otsuka, to co-develop and co-promote Abilify*, excluding certain Asian countries. The U.S. portion of the agreement expired in April 2015 and the EU portion expired in June 2014. In other countries where we had the exclusive right to sell Abilify* , expiration occurred on a country-by-country basis with the last expiration in Canada in January, 2018.
Both parties actively participated in joint executive governance and operating committees. Otsuka was responsible for providing all sales force efforts in 2013, however, BMS was responsible for certain operating expenses up to various annual limits. BMS purchased the API from Otsuka and completed the manufacturing of the product for subsequent sale to third-party customers in the U.S. and certain other countries. BMS provided other services including distribution, customer management and pharmacovigilance. BMS was the principal for the end customer product sales where it was the exclusive distributor for or had an exclusive right to sell Abilify*. Otsuka was the principal for the end customer product sales in the U.S. and in the EU. Alliance revenue was recorded for BMS's share of net sales to third-party customers in the U.S. and EU when Abilify* was shipped and all risks and rewards of ownership transferred to third-party customers.
Summarized financial information related to this alliance was as follows:
|
| Year Ended December 31, | ||||||||||
Dollars in Millions |
| 2017 |
| 2016 |
| 2015 | ||||||
Revenues from Otsuka alliances: |
|
|
|
|
|
| ||||||
Net product sales |
| $ | 1,814 | |
| $ | 1,670 | |
| $ | 1,501 | |
Alliance revenues |
| 7 | |
| 2 | |
| 604 | | |||
Total Revenues |
| $ | 1,821 | |
| $ | 1,672 | |
| $ | 2,105 | |
|
|
|
|
|
|
| ||||||
Payments to/(from) Otsuka: |
|
|
|
|
|
| ||||||
Cost of products sold: |
|
|
|
|
|
| ||||||
Oncology fee |
| $ | 299 | |
| $ | 304 | |
| $ | 299 | |
Royalties |
| 11 | |
| 10 | |
| 30 | | |||
Cost of product supply |
| 31 | |
| 30 | |
| 35 | | |||
Lilly
BMS had a commercialization agreement with Lilly through Lilly's subsidiary ImClone for the co-development and promotion of Erbitux * in the U.S., Canada and Japan. Both parties actively participated in a joint executive committee and various other operating committees and shared responsibilities for research and development using resources in their own infrastructures. Lilly manufactured bulk requirements for Erbitux* in its own facilities and filling and finishing was performed by a third party for which BMS had oversight responsibility. BMS had exclusive distribution rights in North America and was responsible for promotional efforts in North America although Lilly had the right to co-promote in the U.S. at their own expense. BMS was the principal in the end customer product sales in North America and paid Lilly a distribution fee for 39% of Erbitux * net sales in North America plus a share of certain royalties paid by Lilly. BMS's rights and obligations with respect to the commercialization of Erbitux * in North America would have expired in September 2018.
In October 2015, BMS transferred its rights to Erbitux* in North America to Lilly in exchange for sales-based royalties as described below. The transferred rights include, but are not limited to, full commercialization and manufacturing responsibilities. The transaction was accounted for as a business divestiture and resulted in a non-cash charge of $171 million for intangible assets directly related to the business and an allocation of goodwill.
69
BMS will receive royalties through September 2018, which are included in other income when earned. The royalty rates applicable to North America are 38% on Erbitux* net sales up to $165 million in 2015, $650 million in 2016, $650 million in 2017 and $480 million in 2018, plus 20% on net sales in excess of those amounts in each of the respective years. Royalties earned were $207 million in 2017 , $227 million in 2016 and $56 million in 2015 .
BMS shared rights to Erbitux * in Japan under an agreement with Lilly and Merck KGaA and received 50% of the pretax profit from Merck KGaA's net sales of Erbitux * in Japan which was further shared equally with Lilly. BMS transferred its co-commercialization rights in Japan to Merck KGaA in 2015 in exchange for sales-based royalties through 2032 which is included in other income when earned. Royalties earned were $17 million in 2017, $19 million in 2016 and $14 million in 2015. As a result of the adoption of ASC 606 in the first quarter of 2018, estimated future royalties resulting from the transfer of rights to Merck KGaA will be recorded as a cumulative effect adjustment in retained earnings. Subsequent changes in estimates will be recorded in other income (net).
Summarized financial information related to this alliance was as follows:
|
| Year Ended December 31, | ||||||||||
Dollars in Millions |
| 2017 |
| 2016 |
| 2015 | ||||||
Revenues from Lilly alliance: |
|
|
|
|
|
| ||||||
Net product sales |
| $ | - | |
| $ | - | |
| $ | 492 | |
Alliance revenues |
| - | |
| - | |
| 9 | | |||
Total revenues |
| $ | - | |
| $ | - | |
| $ | 501 | |
|
|
|
|
|
|
| ||||||
Cost of products sold |
| $ | - | |
| $ | - | |
| $ | 261 | |
|
|
|
|
|
|
| ||||||
Other income (net): |
|
|
|
|
|
| ||||||
Royalties |
| (224 | ) |
| (246 | ) |
| (70 | ) | |||
Divestiture loss |
| - | |
| - | |
| 171 | | |||
AstraZeneca
Prior to the diabetes business divestiture discussed below, BMS had an alliance with AstraZeneca consisting of three worldwide co-development and commercialization agreements covering (1) Onglyza* and related combination products sold under various names, (2) Farxiga* and related combination products and, (3) beginning in August 2012 after BMS's acquisition of Amylin, Amylin's portfolio of products including Bydureon* , Byetta* , Symlin* and Myalept* , as well as certain assets owned by Amylin, including a manufacturing facility located in West Chester, Ohio.
In February 2014, BMS and AstraZeneca terminated their alliance agreements and BMS sold to AstraZeneca substantially all of the diabetes business comprising the alliance. The divestiture included the shares of Amylin and the resulting transfer of its Ohio manufacturing facility; the intellectual property related to Onglyza* and Farxiga* (including BMS's interest in the out-licensing agreement for Onglyza* in Japan); and the purchase of BMS's manufacturing facility located in Mount Vernon, Indiana in 2015. Substantially all employees dedicated to the diabetes business were transferred to AstraZeneca.
BMS and AstraZeneca entered into several agreements in connection with the sale, including a supply agreement, a development agreement and a transitional services agreement. Under those agreements, BMS was obligated to supply certain products; to perform ongoing development activities for certain clinical study programs; and to provide transitional services such as accounting, financial services, customer service, distribution, regulatory, development, information technology and certain other administrative services for various periods in order to facilitate the orderly transfer of the business operations.
Consideration for the transaction includes a $2.7 billion payment at closing; contingent regulatory and sales-based milestone payments of up to $1.4 billion (including $800 million related to approval milestones and $600 million related to sales-based milestones, payable in 2020); royalty payments based on net sales through 2025 and payments up to $225 million if and when certain assets are transferred to AstraZeneca. AstraZeneca will also pay BMS for any required product supply at a price approximating the product cost as well as negotiated transitional service fees.
70
Royalty rates on net sales are as follows:
| 2015 | 2016 | 2017 | 2018 | 2019 | 2020 | 2021 - 2025 | ||||||||||
Onglyza* and Farxiga* Worldwide Net Sales up to $500 million | 35 | % | 27 | % | 12 | % | 20 | % | 22 | % | 25 | % | 14 | % | - | 20 | % |
Onglyza* and Farxiga* Worldwide Net Sales over $500 million | 7 | % | 9 | % | 12 | % | 20 | % | 22 | % | 25 | % | 14 | % | - | 20 | % |
Amylin products U.S. Net Sales | 2 | % | 2 | % | 5 | % | 10 | % | 12 | % | 12 | % | 5 | % | - | 10 | % |
The stock and asset purchase agreement contained multiple elements to be delivered subsequent to the closing of the transaction, including the China diabetes business (transferred in 2014), the Mount Vernon, Indiana manufacturing facility (transferred in 2015), and the activities under the development and supply agreements. Each of these elements was determined to have a standalone value. As a result, a portion of the consideration received at closing was allocated to the undelivered elements using the relative selling price method after determining the best estimated selling price for each element. The remaining amount of consideration was included in the calculation for the gain on sale of the diabetes business. Contingent milestone and royalty payments are similarly allocated among the underlying elements if and when the amounts are determined to be payable to BMS. Amounts allocated to the sale of the business are immediately recognized in the results of operations. Amounts allocated to the other elements are recognized in the results of operations only to the extent each element has been delivered.
Consideration of $179 million was received in 2015 for the transfer of the Mount Vernon, Indiana manufacturing facility and related inventories resulting in a gain of $79 million for the amounts allocated to the delivered elements. Contingent consideration of $100 million was received in 2017 from AstraZeneca upon achievement of a regulatory approval milestone resulting in an additional gain.
Consideration allocated to the development and supply agreements was amortized over the applicable service periods. Amortization of deferred income attributed to the development agreement ended in December 2016 and was included in other income as the sale of these services was not considered part of BMS's ongoing major or central operations. Amortization of deferred income attributed to the supply agreement ended in December 2017 and was recorded in alliance revenues. Revenues attributed to the supply agreement were included in alliance revenues.
Consideration for the transaction is presented for cash flow purposes based on the allocation process described above, either as an investing activity if attributed to the sale of the business or related assets or as an operating activity if attributed to the transitional services, supply arrangement or development agreement.
In September 2015, BMS transferred a percentage of its future royalty rights on Amylin net product sales in the U.S. to CPPIB. The transferred rights represent approximately 70% of potential future royalties BMS is entitled to in 2019 to 2025. In exchange for the transfer, BMS will receive an additional tiered-based royalty on Amylin net product sales in the U.S. from CPPIB in 2016 through 2018. These royalties are presented in other income and were $97 million in 2017 and $134 million in 2016.
In November 2017, BMS transferred a percentage of its future royalty rights on a portion of Onglyza* and Farxiga* net product sales to Royalty Pharma. The transferred rights represent approximately 20% to 25% of potential future royalties BMS is entitled to for those products in 2020 to 2025. In exchange for the transfer, BMS will receive an additional tiered-based royalty on Onglyza* and Farxiga* net product sales from Royalty Pharma in 2018 and 2019, which will be presented in other income when earned.
71
Summarized financial information related to the AstraZeneca alliances was as follows:
|
| Year Ended December 31, | ||||||||||
Dollars in Millions |
| 2017 |
| 2016 |
| 2015 | ||||||
Revenues from AstraZeneca alliances: |
|
|
|
|
|
| ||||||
Net product sales |
| $ | 6 | |
| $ | - | |
| $ | 14 | |
Alliance revenues |
| 125 | |
| 129 | |
| 182 | | |||
Total Revenues |
| $ | 131 | |
| $ | 129 | |
| $ | 196 | |
|
|
|
|
|
|
| ||||||
Other income (net): |
|
|
|
|
|
| ||||||
Amortization of deferred income |
| - | |
| (113 | ) |
| (105 | ) | |||
Royalties |
| (228 | ) |
| (227 | ) |
| (215 | ) | |||
Transitional services |
| (12 | ) |
| (7 | ) |
| (12 | ) | |||
Divestiture gain |
| (126 | ) |
| - | |
| (82 | ) | |||
|
|
|
|
|
|
| ||||||
Selected Alliance Cash Flow Information: |
|
|
|
|
|
| ||||||
Deferred income |
| - | |
| 19 | |
| 34 | | |||
Divestiture and other proceeds |
| 302 | |
| 216 | |
| 374 | | |||
Selected Alliance Balance Sheet Information: |
| December 31, | ||||||
Dollars in Millions |
| 2017 |
| 2016 | ||||
Deferred income – Services not yet performed for AstraZeneca |
| $ | - | |
| $ | 38 | |
Sanofi
BMS and Sanofi have co-development and co-commercialization agreements for Plavix* and Avapro* / Avalide*. Effective January 1, 2013, Sanofi assumed essentially all of the worldwide operations of the alliance with the exception of Plavix* in the U.S. and Puerto Rico where BMS is the operating partner with a 50.1% controlling interest. In exchange for the rights transferred to Sanofi, BMS receives quarterly royalties from January 1, 2013 until December 31, 2018 and a terminal payment from Sanofi of $200 million at the end of 2018. As a result of the adoption of ASC 606 in 2018, future royalties will no longer be recorded in alliance revenues and will be recorded as a cumulative effect adjustment in the first quarter of 2018 with a corresponding contract asset. In addition, a portion of the terminal payment will be recorded as a cumulative effect adjustment in the first quarter of 2018 with a corresponding contract asset.
Royalties received from Sanofi in the territory covering the Americas and Australia, opt-out markets, and former development royalties are presented in alliance revenues and were $200 million in 2017 , $195 million in 2016 and $211 million in 2015 . Royalties attributed to the territory covering Europe and Asia continue to be earned by the territory partnership and are included in equity in net income of affiliates. Alliance revenues attributed to the supply of irbesartan API to Sanofi were $80 million in 2015 .
72
Summarized financial information related to this alliance was as follows:
|
| Year Ended December 31, | ||||||||||
Dollars in Millions |
| 2017 |
| 2016 |
| 2015 | ||||||
Revenues from Sanofi alliances: |
|
|
|
|
|
| ||||||
Net product sales |
| $ | 27 | |
| $ | 38 | |
| $ | 110 | |
Alliance revenues |
| 207 | |
| 200 | |
| 296 | | |||
Total Revenues |
| $ | 234 | |
| $ | 238 | |
| $ | 406 | |
|
|
|
|
|
|
| ||||||
Payments to/(from) Sanofi: |
|
|
|
|
|
| ||||||
Equity in net income of affiliates |
| (95 | ) |
| (95 | ) |
| (104 | ) | |||
Noncontrolling interest – pretax |
| 12 | |
| 16 | |
| 51 | | |||
The following is summarized financial information for interests in the partnerships with Sanofi for the territory covering Europe and Asia, which are not consolidated but are accounted for using the equity method:
|
| Year Ended December 31, | ||||||||||
Dollars in Millions |
| 2017 |
| 2016 |
| 2015 | ||||||
Net sales |
| $ | 231 | |
| $ | 235 | |
| $ | 257 | |
Gross profit |
| 192 | |
| 195 | |
| 213 | | |||
Net income |
| 189 | |
| 192 | |
| 209 | | |||
Ono
BMS is the principal in the end customer product sales and has the exclusive right to develop, manufacture and commercialize Opdivo worldwide except in Japan, South Korea and Taiwan. Ono is entitled to receive royalties of 4% in North America and 15% in all territories excluding the three countries listed above, subject to customary adjustments.
BMS and Ono jointly develop and commercialize Opdivo , Yervoy and several BMS investigational compounds in Japan, South Korea and Taiwan. BMS is responsible for supply of the products. Profits, losses and development costs are shared equally for all combination therapies involving compounds of both parties. Otherwise, sharing is 80% and 20% for activities involving only one of the party's compounds.
BMS and Ono also jointly develop and commercialize Orencia in Japan. BMS is responsible for the order fulfillment and distribution of the intravenous formulation and Ono is responsible for the subcutaneous formulation. Both formulations are jointly promoted by both parties with assigned customer accounts and BMS is responsible for the product supply. A co-promotion fee of 60% is paid when a sale is made to the other party's assigned customer.
In 2017, Ono granted BMS an exclusive license for the development and commercialization of ONO-4578, Ono's Prostaglandin E2 receptor 4 antagonist. BMS acquired worldwide rights except in Japan, South Korea, and Taiwan where it was added to the existing collaboration and in China and ASEAN countries where Ono retained exclusive rights. BMS paid $40 million to Ono, which was included in R&D expense in 2017. Ono is eligible to receive subsequent clinical, regulatory and sales-based milestone payments of up to $480 million and royalties in countries where BMS has exclusive licensing rights.
Summarized financial information related to this alliance was as follows:
|
| Year Ended December 31, | ||||||||||
Dollars in Millions |
| 2017 |
| 2016 |
| 2015 | ||||||
Revenues from Ono alliances: |
|
|
|
|
|
| ||||||
Net product sales |
| $ | 145 | |
| $ | 147 | |
| $ | 113 | |
Alliance revenues |
| 268 | |
| 280 | |
| 61 | | |||
Total Revenues |
| $ | 413 | |
| $ | 427 | |
| $ | 174 | |
73
AbbVie
BMS was granted exclusive global rights to co-develop and commercialize Empliciti, a humanized monoclonal antibody for the treatment of multiple myeloma from PDL BioPharma, Inc. (now part of AbbVie). AbbVie currently participates in joint development and U.S. commercialization committees in which BMS has final decision making authority. Both parties jointly develop the product and AbbVie funds 20% of global development costs. BMS is solely responsible for supply, distribution and sales and marketing activities and is the principal in the end customer product sales. AbbVie shares 30% of all profits and losses in the U.S. and is paid tiered royalties outside of the U.S. BMS paid AbbVie $140 million for certain regulatory milestone events including $52 million for approval milestones through December 31, 2017. AbbVie is also entitled to receive an additional $120 million if certain regulatory events occur and $200 million if certain sales thresholds are achieved. The agreement may be terminated immediately by BMS or by either party for material breaches (subsequent to a notice period).
Summarized financial information related to this alliance was as follows:
|
| Year Ended December 31, | ||||||||||
Dollars in Millions |
| 2017 |
| 2016 |
| 2015 | ||||||
Revenues from AbbVie alliance: |
|
|
|
|
|
| ||||||
Net product sales |
| $ | 150 | |
| $ | 132 | |
| $ | 3 | |
|
|
|
|
|
|
| ||||||
Payments to/(from) AbbVie: |
|
|
|
|
|
| ||||||
Cost of products sold – Profit sharing |
| $ | 41 | |
| $ | 34 | |
| $ | 1 | |
F-Star Alpha
I n October 2014, BMS acquired an exclusive option to purchase F-Star Alpha and its lead asset FS102, an anti-HER2 antibody fragment, in development for the treatment of breast and gastric cancer among a well-defined population of HER2-positive patients. In 2017, BMS discontinued development of FS102 and did not exercise its option, resulting in an IPRD charge of $75 million included in R&D expense and attributed to noncontrolling interest.
Promedior
In September 2015, BMS purchased a warrant that gives BMS the exclusive right to acquire Promedior, a biotechnology company whose lead asset, PRM-151, is being developed for the treatment of IPF and MF. The warrant is exercisable upon delivery of Phase II data following either of the IPF or MF Phase II clinical studies being directed by Promedior. The upfront payment allocated to the warrant was $84 million and included in R&D expenses in 2015. The remaining $66 million of the $150 million upfront payment was allocated to Promedior's obligation to complete the Phase II studies which was amortized over the expected period of the Phase II studies. The allocation was determined using Level 3 inputs. BMS is obligated to pay an additional $250 million , plus additional aggregate consideration of up to $850 million for contingent development and regulatory approval milestone payments in the U.S. and Europe if it exercises the warrant.
Five Prime
In November 2015, BMS and Five Prime entered into an exclusive worldwide licensing and collaboration agreement for the development and commercialization of Five Prime's CSF1R antibody program, including cabiralizumab, currently in Phase I and II development for IO indications and Phase II development for PVNS. Five Prime is responsible for the completion of a Phase I study combining cabiralizumab with Opdivo as a potential treatment for a variety of cancers. BMS is responsible for development, manufacturing and commercialization activities. Five Prime may conduct certain studies at its cost to develop cabiralizumab in PVNS and in combination with its own internal oncology pipeline assets. Five Prime also retained an option to co-promote in the U.S. The agreement replaces a previous clinical collaboration agreement between the two parties.
In consideration for licensing rights, BMS made an upfront payment of $350 million in 2015 which was included in R&D expense. BMS will also be committed to pay up to $1.4 billion upon the achievement of contingent development and regulatory milestones as well as future royalties if the product is approved and commercialized.
74
Reckitt
In May 2013, BMS transferred to Reckitt the right to sell, distribute and market several OTC brands sold primarily in Mexico and Brazil through May 2016. BMS received royalties on net sales of the products and exclusively supplied certain of the products to Reckitt pursuant to a supply agreement at cost plus a markup. Certain limited assets, including marketing authorizations and certain employees directly attributed to the business, were transferred to Reckitt at the start of the alliance period. BMS retained ownership of all other assets related to the business including the trademarks covering the products.
BMS also granted Reckitt an option to acquire the trademarks, inventory and certain other assets exclusively related to the products at the end of the alliance period at a price determined primarily based upon a multiple of sales from May 2014 through May 2016. In April 2014, the alliance was modified to provide an option to Reckitt to purchase a BMS manufacturing facility located in Mexico primarily dedicated to the products included in the alliance as well as the related employees. In July 2015, Reckitt notified BMS that it was exercising its option. In May 2016, BMS sold the business for $317 million .
Non-refundable upfront proceeds of $485 million received by BMS in 2013 were allocated to two units of accounting, including the rights transferred to Reckitt and the fair value of the option to purchase the remaining assets using the best estimate of the selling price for these elements after considering various market factors. These market factors included an analysis of any estimated excess of the fair value of the business over the potential purchase price if the option is exercised. The fair value of the option was determined using Level 3 inputs and included in other liabilities. During 2015, BMS recognized other income of $123 million to decrease the fair value of the option to zero due to the strengthening of the U.S. dollar against local currencies. The amount allocated to the rights transferred to Reckitt is amortized as alliance revenue over the contractual term.
Summarized financial information related to this alliance was as follows:
|
| Year Ended December 31, | ||||||
Dollars in Millions |
| 2016 |
| 2015 | ||||
Revenues from Reckitt alliance: |
|
|
|
| ||||
Alliance revenues |
| $ | 48 | |
| $ | 140 | |
|
|
|
|
| ||||
Other income (net) – Divestiture gain |
| (277 | ) |
| - | | ||
|
|
|
|
| ||||
Selected Alliance Cash Flow Information: |
|
|
|
| ||||
Other changes in operating assets and liabilities |
| $ | - | |
| $ | (129 | ) |
Divestiture and other proceeds |
| 317 | |
| - | | ||
The Medicines Company
In February 2013, BMS transferred to The Medicines Company the right to sell, distribute and market Recothrom* on a global basis for two years. Certain employees directly attributed to the business and certain assets were transferred to The Medicines Company at the start of the alliance period, including the Biologics License Application and related regulatory assets. BMS retained all other assets related to Recothrom* including the patents, trademarks and inventory.
BMS also granted The Medicines Company an option to acquire the patents, trademarks, inventory and certain other assets exclusively related to Recothrom* at a price determined based on a multiple of sales (plus the cost of any remaining inventory held by BMS at that time). The Medicines Company exercised the option in February 2015 and acquired the business for $132 million resulting in a $59 million divestiture gain.
Valeant
In October 2012, BMS transferred to PharmaSwiss SA, a wholly-owned subsidiary of Valeant the right to sell, distribute, and market the certain mature brand products in Europe through December 31, 2014.
BMS also granted Valeant an option to acquire the trademarks and intellectual property exclusively related to the products at a price determined based on a multiple of sales. Valeant exercised the option in January 2015 and acquired the business for $61 million resulting in an $88 million divestiture gain.
75
Note 4 . ACQUISITIONS, DIVESTITURES AND LICENSING ARRANGEMENTS
Acquisitions
Acquisitions are evaluated to determine whether it is a business, an asset or a group of assets. The following transactions were accounted for as asset acquisitions since they were determined not to be a business as that term is defined in ASC 805 - Business Combinations primarily because no significant processes were acquired. As a result, the amounts allocated to the lead investigational compounds were expensed and not capitalized. The consideration of each transaction was allocated as follows:
Dollars in Millions |
| Year |
| Upfront Payment |
| R&D Expense |
| Deferred Tax Assets (a) |
| Contingent Consideration | ||||||||
IFM (b) |
| 2017 |
| $ | 325 | |
| $ | 311 | |
| $ | 14 | |
| $ | 2,020 | |
|
|
|
|
|
|
|
|
|
|
| ||||||||
Cormorant |
| 2016 |
| 35 | |
| 35 | |
| - | |
| 485 | | ||||
Padlock |
| 2016 |
| 150 | |
| 139 | |
| 11 | |
| 453 | | ||||
|
|
|
| $ | 185 | |
| $ | 174 | |
| $ | 11 | |
| $ | 938 | |
|
|
|
|
|
|
|
|
|
|
| ||||||||
Cardioxyl |
| 2015 |
| $ | 200 | |
| $ | 167 | |
| $ | 33 | |
| $ | 1,875 | |
Flexus (c) |
| 2015 |
| 814 | |
| 800 | |
| 14 | |
| 450 | | ||||
|
|
|
| $ | 1,014 | |
| $ | 967 | |
| $ | 47 | |
| $ | 2,325 | |
(a) | Relates to net operating loss and tax credit carryforwards. |
(b) | Includes $25 million for certain negotiation rights to collaborate, license or acquire an NLRP3 antagonist program from a newly formed entity established by the former shareholders of IFM. |
(c) Includes $14 million of acquisition costs.
IFM
In 2017, BMS acquired all of the outstanding shares of IFM, a private biotechnology company focused on developing therapies that modulate novel targets in the innate immune system to treat cancer, autoimmunity and inflammatory diseases. The acquisition provided BMS with full rights to IFM's preclinical STING and NLRP3 agonist programs focused on enhancing the innate immune response for treating cancer. Contingent consideration includes development, regulatory and sales-based milestone payments. BMS may pay up to $555 million in additional contingent milestones for any subsequent products selected from IFM's preclinical STING and NLRP3 agonist programs which is not included in the contingent consideration amount in the table above.
Cormorant
In 2016, BMS acquired all of the outstanding shares of Cormorant, a private pharmaceutical company focused on the development of therapies for cancer and rare diseases. The acquisition provided BMS with full rights to Cormorant's lead candidate HuMax-IL8, a Phase I/II monoclonal antibody that represents a potentially complementary immuno-oncology mechanism of action to T-cell directed antibodies and co-stimulatory molecules. Contingent consideration includes development and regulatory milestone payments.
Padlock
In 2016, BMS acquired all of the outstanding shares of Padlock, a private biotechnology company dedicated to creating new medicines to treat destructive autoimmune diseases. The acquisition provided BMS with full rights to Padlock's PAD inhibitor discovery program focused on the development of potentially transformational treatment approaches for patients with rheumatoid arthritis. Padlock's PAD discovery program may have additional utility in treating systemic lupus erythematosus and other autoimmune diseases. Contingent consideration includes development and regulatory milestone payments.
Cardioxyl
In 2015, BMS acquired all of the outstanding shares of Cardioxyl, a private biotechnology company focused on the discovery and development of novel therapeutic agents for cardiovascular disease. The acquisition provided BMS with full rights to CXL-1427, a nitroxyl prodrug in Phase II development for acute decompensated heart failure. Contingent consideration includes development, regulatory and sales-based milestone payments, of which $100 million was included in R&D expense in 2017 following the commencement of a Phase II clinical study.
76
Flexus
In 2015, BMS acquired all of the outstanding shares of Flexus, a private biotechnology company focused on the discovery and development of novel anti-cancer therapeutics. The acquisition provided BMS with full rights to F001287, a preclinical small molecule IDO1-inhibitor targeted immunotherapy. In addition, BMS acquired Flexus's IDO/TDO discovery program which includes its IDO-selective, IDO/TDO dual and TDO-selective compounds. Contingent consideration includes development and regulatory milestone payments of which $350 million and $100 million were included in R&D expense in 2017 and 2016, respectively, following the commencement of Phase I, Phase II, and Phase III clinical studies.
Divestitures
| Proceeds (a) |
| Divestiture (Gains) / Losses |
| Royalty (Income) | ||||||||||||||||||||||||||||||
Dollars in Millions | 2017 |
| 2016 |
| 2015 |
| 2017 |
| 2016 |
| 2015 |
| 2017 |
| 2016 |
| 2015 | ||||||||||||||||||
Investigational HIV medicines | $ | - | |
| $ | 387 | |
| $ | - | |
| $ | (11 | ) |
| $ | (272 | ) |
| $ | - | |
| $ | - | |
| $ | - | |
| $ | - | |
OTC brands (Reckitt) | - | |
| 317 | |
| - | |
| - | |
| (277 | ) |
| - | |
| - | |
| - | |
| - | | |||||||||
Diabetes | 405 | |
| 333 | |
| 374 | |
| (126 | ) |
| - | |
| (82 | ) |
| (329 | ) |
| (361 | ) |
| (215 | ) | |||||||||
Erbitux* | 218 | |
| 252 | |
| 9 | |
| - | |
| - | |
| 171 | |
| (224 | ) |
| (246 | ) |
| (70 | ) | |||||||||
Recothrom* | - | |
| - | |
| 132 | |
| - | |
| - | |
| (59 | ) |
| - | |
| - | |
| - | | |||||||||
Mature brand products (Valeant) | - | |
| - | |
| 61 | |
| - | |
| - | |
| (88 | ) |
| - | |
| - | |
| - | | |||||||||
Ixempra* | 4 | |
| 13 | |
| 113 | |
| - | |
| - | |
| (88 | ) |
| (4 | ) |
| (11 | ) |
| (8 | ) | |||||||||
Other | 24 | |
| 15 | |
| 8 | |
| (24 | ) |
| (15 | ) |
| (48 | ) |
| - | |
| - | |
| - | | |||||||||
| $ | 651 | |
| $ | 1,317 | |
| $ | 697 | |
| $ | (161 | ) |
| $ | (564 | ) |
| $ | (194 | ) |
| $ | (557 | ) |
| $ | (618 | ) |
| $ | (293 | ) |
(a) | Includes royalties received subsequent to the related sale of the asset or business. |
SK Biotek
In 2017, BMS sold its small molecule active pharmaceutical ingredient manufacturing operations in Swords, Ireland to SK Biotek for approximately $165 million , subject to certain adjustments. Initial proceeds of $158 million were received in the first quarter of 2018. The transaction was accounted for as the sale of a business. The divestiture includes the transfer of the facility, the majority of employees at the site, inventories and certain third-party contract manufacturing obligations. The assets were reduced to their estimated relative fair value after considering the purchase price resulting in an impairment charge of $146 million that was included in cost of products sold. SK Biotek will provide certain manufacturing services for BMS through 2022.
ViiV Healthcare
In 2016, BMS sold its investigational HIV medicines business consisting of a number of R&D programs at different stages of discovery and development to ViiV Healthcare. BMS received $350 million and is also entitled to receive from ViiV Healthcare contingent development and regulatory milestone payments of up to $1.1 billion , sales-based milestone payments of up to $4.3 billion and future tiered royalties. BMS earned transitional fees of $10 million and $105 million for certain R&D and other services in 2017 and 2016, respectively.
Other Divestitures
Refer to "-Note 3 . Alliances" for a discussion on the divestiture transactions with Reckitt, Lilly, The Medicines Company, Valeant and AstraZeneca. Revenues and pretax earnings related to all divestitures were not material in 2017 , 2016 and 2015 (excluding the divestiture gains and impairment charges).
Assets Held-For-Sale
In 2017, BMS agreed to sell a R&D facility in Wallingford, Connecticut. The transaction is expected to close in the first quarter of 2018 and will be accounted for as a sale of an asset. The asset was accounted for as held-for-sale as of December 31, 2017 and reduced to its estimated relative fair value resulting in an impairment charge of $79 million that was included in R&D expense.
77
Licensing Arrangements
Halozyme
In 2017, BMS and Halozyme entered into a global collaboration and license agreement to develop subcutaneously administered BMS IO medicines using Halozyme's ENHANZE * drug-delivery technology. This technology may allow for more rapid delivery of large volume injectable medications through subcutaneous delivery. BMS paid $105 million to Halozyme for access to the technology which was included in R&D expense. BMS designated multiple IO targets, including PD-1, to develop using the ENHANZE * technology and has an option to select additional targets within five years from the effective date up to a maximum of 11 targets. BMS may pay up to an additional $160 million in achieved contingent development, regulatory and sales-based milestones for each of the nominated collaboration targets, additional milestone payments for combination products and future royalties on sales of products using the ENHANZE * technology.
CytomX
In 2017, BMS expanded its strategic collaboration with CytomX to discover novel therapies using CytomX's proprietary Probody platform. As part of the original May 2014 collaboration to discover, develop and commercialize Probody therapeutics, BMS selected four oncology targets, including CTLA-4. Pursuant to the expanded agreement, CytomX granted BMS exclusive worldwide rights to develop and commercialize Probody therapeutics for up to eight additional targets. BMS paid CytomX $75 million for the rights to the initial four targets which was expensed as R&D prior to 2017. BMS paid $200 million to CytomX for access to the additional targets which was included in R&D expense in 2017. BMS will also reimburse CytomX for certain research costs over the collaboration period, pay contingent development, regulatory and sales based milestones up to $448 million if achieved for each collaboration target and future royalties.
Biogen
In 2017, BMS out-licensed to Biogen exclusive rights to develop and commercialize BMS-986168, an anti-eTau compound in development for Progressive Supranuclear Palsy. Biogen paid $300 million to BMS which was included in other income. BMS is also entitled to contingent development, regulatory and sales-based milestone payments of up to $410 million if achieved and future royalties. BMS originally acquired the rights to this compound in 2014 through its acquisition of iPierian. Biogen assumed all of BMS's remaining obligations to the former stockholders of iPierian.
Roche
In 2017, BMS out-licensed to Roche exclusive rights to develop and commercialize BMS-986089, an anti-myostatin adnectin in development for Duchenne Muscular Dystrophy. Roche paid $170 million to BMS which was included in other income. BMS is also entitled to contingent development and regulatory milestone payments of up to $205 million if achieved and future royalties.
78
Note 5 . OTHER INCOME (NET)
Other income (net) includes:
|
| Year Ended December 31, | ||||||||||
Dollars in Millions |
| 2017 |
| 2016 |
| 2015 | ||||||
Interest expense |
| $ | 196 | |
| $ | 167 | |
| $ | 184 | |
Investment income |
| (154 | ) |
| (105 | ) |
| (101 | ) | |||
Provision for restructuring |
| 293 | |
| 109 | |
| 118 | | |||
Litigation and other settlements |
| (487 | ) |
| 47 | |
| 159 | | |||
Equity in net income of affiliates |
| (75 | ) |
| (77 | ) |
| (83 | ) | |||
Divestiture gains |
| (164 | ) |
| (576 | ) |
| (196 | ) | |||
Royalties and licensing income |
| (1,351 | ) |
| (719 | ) |
| (383 | ) | |||
Transition and other service fees |
| (37 | ) |
| (238 | ) |
| (122 | ) | |||
Pension charges |
| 162 | |
| 91 | |
| 160 | | |||
Intangible asset impairment |
| - | |
| 15 | |
| 13 | | |||
Equity investment impairment |
| 5 | |
| 45 | |
| - | | |||
Written option adjustment |
| - | |
| - | |
| (123 | ) | |||
Loss on debt redemption |
| 109 | |
| - | |
| 180 | | |||
Other |
| (16 | ) |
| (44 | ) |
| 7 | | |||
Other income (net) |
| $ | (1,519 | ) |
| $ | (1,285 | ) |
| $ | (187 | ) |
• | Litigation and other settlements includes BMS's share of a patent-infringement settlement of $481 million related to Merck's PD-1 antibody Keytruda * in 2017 and $90 million in 2015 for a contractual dispute related to a license. |
• | Royalties and licensing income includes upfront licensing fees of $470 million from Biogen and Roche in 2017. |
• | Transition and other service fees were primarily related to the divestiture of the diabetes and investigational HIV medicines businesses. |
• | Written option adjustment includes the change in fair value of the written option liability attributed to the Reckitt alliance. |
• | Other includes an unrealized foreign exchange loss of $52 million in 2015 resulting from the remeasurement of the Bolivar-denominated cash and other monetary balances of BMS's wholly-owned subsidiary in Venezuela as of December 31, 2015. |
Note 6 . RESTRUCTURING
In October 2016, the Company announced a restructuring plan to evolve and streamline its operating model and expects to incur charges in connection with employee workforce reductions and early site exits. The majority of charges are expected to be incurred through 2020, range between $1.5 billion to $2.0 billion , and consist of employee termination benefit costs, contract termination costs, accelerated depreciation, impairment charges and other site exit costs. Cash outlays in connection with these actions are expected to be approximately 40% to 50% of the total charges. Charges of approximately $800 million have been recognized for these actions since the announcement including an impairment charge for a small molecule manufacturing operation in Swords, Ireland. Restructuring charges are recognized upon meeting certain criteria, including finalization of committed plans, reliable estimates and discussions with local works councils in certain markets.
Other restructuring charges in addition to the above actions recognized prior were primarily related to specialty care transformation initiatives designed to create a more simplified organization across all functions and geographic markets. In addition, accelerated depreciation and other charges were incurred in connection with the expected early exits of a small molecule manufacturing site in Cruiserath, Ireland and a R&D facility in Wallingford, Connecticut. Refer to "-Note 4 . Acquisitions, Divestitures and Licensing Arrangements" for further information.
Employee workforce reductions were approximately 1,900 in 2017 , 1,100 in 2016 and 1,200 in 2015 .
79
The following tables summarize the charges and activity related to the restructuring actions:
|
| Year Ended December 31, | ||||||||||
Dollars in Millions |
| 2017 |
| 2016 |
| 2015 | ||||||
Employee termination costs |
| $ | 267 | |
| $ | 97 | |
| $ | 110 | |
Other termination costs |
| 26 | |
| 12 | |
| 8 | | |||
Provision for restructuring |
| 293 | |
| 109 | |
| 118 | | |||
Accelerated depreciation |
| 289 | |
| 72 | |
| 104 | | |||
Asset impairments |
| 241 | |
| 13 | |
| 1 | | |||
Other shutdown costs |
| 3 | |
| 19 | |
| 10 | | |||
Total charges |
| $ | 826 | |
| $ | 213 | |
| $ | 233 | |
|
| Year Ended December 31, | ||||||||||
Dollars in Millions |
| 2017 |
| 2016 |
| 2015 | ||||||
Cost of products sold |
| $ | 149 | |
| $ | 21 | |
| $ | 84 | |
Marketing, selling and administrative |
| 1 | |
| - | |
| - | | |||
Research and development |
| 383 | |
| 83 | |
| 31 | | |||
Other income (net) |
| 293 | |
| 109 | |
| 118 | | |||
Total charges |
| $ | 826 | |
| $ | 213 | |
| $ | 233 | |
|
| Year Ended December 31, | ||||||||||
Dollars in Millions |
| 2017 |
| 2016 |
| 2015 | ||||||
Liability at January 1 |
| $ | 114 | |
| $ | 125 | |
| $ | 156 | |
Charges |
| 319 | |
| 116 | |
| 133 | | |||
Change in estimates |
| (26 | ) |
| (7 | ) |
| (15 | ) | |||
Provision for restructuring |
| 293 | |
| 109 | |
| 118 | | |||
Foreign currency translation |
| 18 | |
| - | |
| (15 | ) | |||
Spending |
| (239 | ) |
| (120 | ) |
| (134 | ) | |||
Liability at December 31 |
| $ | 186 | |
| $ | 114 | |
| $ | 125 | |
Note 7 . INCOME TAXES
The provision/(benefit) for income taxes consisted of:
|
| Year Ended December 31, | ||||||||||
Dollars in Millions |
| 2017 |
| 2016 |
| 2015 | ||||||
Current: |
|
|
|
|
|
| ||||||
U.S. |
| $ | 2,782 | |
| $ | 1,144 | |
| $ | 337 | |
Non-U.S. |
| 364 | |
| 468 | |
| 456 | | |||
Total Current |
| 3,146 | |
| 1,612 | |
| 793 | | |||
Deferred: |
|
|
|
|
|
| ||||||
U.S. |
| 1,063 | |
| (101 | ) |
| (394 | ) | |||
Non-U.S. |
| (53 | ) |
| (103 | ) |
| 47 | | |||
Total Deferred |
| 1,010 | |
| (204 | ) |
| (347 | ) | |||
Total Provision |
| $ | 4,156 | |
| $ | 1,408 | |
| $ | 446 | |
80
Effective Tax Rate
The reconciliation of the effective tax/(benefit) rate to the U.S. statutory Federal income tax rate was:
| % of Earnings Before Income Taxes | |||||||||||||||||||
Dollars in Millions | 2017 |
| 2016 |
| 2015 | |||||||||||||||
Earnings/(Loss) before income taxes: |
|
|
|
|
|
|
|
|
|
|
| |||||||||
U.S. | $ | 2,280 | |
|
|
| $ | 3,100 | |
|
|
| $ | (1,329 | ) |
|
| |||
Non-U.S. | 2,851 | |
|
|
| 2,815 | |
|
|
| 3,406 | |
|
| ||||||
Total | $ | 5,131 | |
|
|
| $ | 5,915 | |
|
|
| $ | 2,077 | |
|
| |||
U.S. statutory rate | 1,796 | |
| 35.0 | % |
| 2,070 | |
| 35.0 | % |
| 727 | |
| 35.0 | % | |||
Deemed repatriation transition tax | 2,611 | |
| 50.9 | % |
| - | |
| - | |
| - | |
| - | | |||
Deferred tax remeasurement | 285 | |
| 5.6 | % |
| - | |
| - | |
| - | |
| - | | |||
Foreign tax effect of certain operations in Ireland, Puerto Rico and Switzerland | (561 | ) |
| (10.9 | )% |
| (442 | ) |
| (7.5 | )% |
| (535 | ) |
| (25.8 | )% | |||
U.S. Federal valuation allowance release | - | |
| - | |
| (29 | ) |
| (0.5 | )% |
| (84 | ) |
| (4.0 | )% | |||
U.S. Federal, state and foreign contingent tax matters | 72 | |
| 1.4 | % |
| 87 | |
| 1.5 | % |
| 56 | |
| 2.7 | % | |||
U.S. Federal research based credits | (144 | ) |
| (2.8 | )% |
| (144 | ) |
| (2.4 | )% |
| (132 | ) |
| (6.4 | )% | |||
Goodwill allocated to divestitures | 4 | |
| 0.1 | % |
| 34 | |
| 0.6 | % |
| 25 | |
| 1.2 | % | |||
U.S. Branded Prescription Drug Fee | 52 | |
| 1.0 | % |
| 52 | |
| 0.9 | % |
| 44 | |
| 2.1 | % | |||
Non-deductible R&D charges | 266 | |
| 5.2 | % |
| 100 | |
| 1.7 | % |
| 369 | |
| 17.8 | % | |||
Puerto Rico excise tax | (131 | ) |
| (2.6 | )% |
| (131 | ) |
| (2.2 | )% |
| (55 | ) |
| (2.7 | )% | |||
Domestic manufacturing deduction | (78 | ) |
| (1.5 | )% |
| (122 | ) |
| (2.1 | )% |
| (17 | ) |
| (0.8 | )% | |||
State and local taxes (net of valuation allowance) | 77 | |
| 1.5 | % |
| 23 | |
| 0.4 | % |
| 16 | |
| 0.8 | % | |||
Foreign and other | (93 | ) |
| (1.9 | )% |
| (90 | ) |
| (1.6 | )% |
| 32 | |
| 1.6 | % | |||
| $ | 4,156 | |
| 81.0 | % |
| $ | 1,408 | |
| 23.8 | % |
| $ | 446 | |
| 21.5 | % |
New tax reform legislation in the U.S. was enacted on December 22, 2017 known as the Tax Cuts and Jobs Act of 2017 (the Act). The Act moves from a worldwide tax system to a quasi-territorial tax system and comprises broad and complex changes to the U.S. tax code including, but not limited to, (1) reducing the U.S. tax rate from 35% to 21% ; (2) adding a deemed repatriation transition tax on certain foreign earnings and profits; (3) generally eliminating U.S. federal income taxes on dividends from foreign subsidiaries; (4) including certain income of controlled foreign companies in U.S. taxable income; (5) creating a new minimum tax referred to as a base erosion anti-abuse income tax; (6) limiting certain research-based credits; and (7) eliminating the domestic manufacturing deduction.
Although many aspects of the Act are not effective until 2018, additional tax expense of $2.9 billion was recognized in the fourth quarter of 2017 upon enactment of the Act. The additional expense included a $2.6 billion one-time deemed repatriation transition tax on previously untaxed post-1986 foreign earnings and profits (including related tax reserves). Those earnings were effectively taxed at a 15.5% rate to the extent that the specified foreign corporations held cash and certain other assets and an 8.0% rate on the remaining earnings and profits. The remaining additional tax expense included an adjustment to measure net deferred tax assets at the new U.S. tax rate of 21% .
The accounting for the reduction of deferred tax assets to the 21% tax rate is complete. The tax charge for the deemed repatriation tax is incomplete, but was recorded as a provisional amount as we were able to make a reasonable estimate of this tax. The provisional amounts may change when completed in 2018 upon finalizing untaxed post-1986 foreign earnings and profits and related cash and certain eligible assets of the specified foreign corporations. The provisional amounts may also change if additional guidance of the relevant tax code is released.
Earnings for certain of our manufacturing operations in low tax jurisdictions, such as Switzerland, Ireland and Puerto Rico, were indefinitely reinvested prior to the enactment of the Act. BMS operates under a favorable tax grant in Puerto Rico not scheduled to expire prior to 2023.
As a result of the transition tax under the Act, the Company is no longer indefinitely reinvested with respect to its undistributed earnings from foreign subsidiaries and has provided a deferred tax liability or foreign and state income and withholding tax that would apply. The Company remains indefinitely reinvested with respect to its financial statement basis in excess of tax basis of its foreign subsidiaries. A determination of the deferred tax liability with respect to this basis difference is not practicable.
Valuation allowances attributed to capital loss carryforwards were released in 2015 following the divestiture of Recothrom* , Ixempra* and other mature brands. Goodwill allocated to business divestitures as well as the U.S. Branded Prescription Drug Fee are not deductible for tax purposes.
81
R&D charges primarily from acquisition related and milestone payments to former shareholders are not deductible for tax purposes. These include Flexus, Cardioxyl and IFM in 2017; Flexus, Padlock and Cormorant in 2016; and Flexus and Cardioxyl in 2015.
Puerto Rico imposes an excise tax on the gross company purchase price of goods sold from our manufacturer in Puerto Rico. The excise tax is recognized in cost of products sold when the intra-entity sale occurs. For U.S. income tax purposes, the excise tax is not deductible but results in foreign tax credits that are generally recognized in our provision for income taxes when the excise tax is incurred. Increased manufacturing activities for Opdivo resulted in the higher domestic manufacturing deduction in 2016 compared to 2015.
Deferred Taxes and Valuation Allowance
|
| December 31, | ||||||
Dollars in Millions |
| 2017 |
| 2016 | ||||
Deferred tax assets |
|
|
|
| ||||
Foreign net operating loss carryforwards |
| $ | 2,872 | |
| $ | 2,945 | |
State net operating loss and credit carryforwards |
| 143 | |
| 114 | | ||
U.S. Federal net operating loss and credit carryforwards |
| 99 | |
| 156 | | ||
Deferred income |
| 212 | |
| 764 | | ||
Milestone payments and license fees |
| 386 | |
| 534 | | ||
Pension and postretirement benefits |
| 131 | |
| 358 | | ||
Intercompany profit and other inventory items |
| 651 | |
| 1,241 | | ||
Other foreign deferred tax assets |
| 312 | |
| 188 | | ||
Share-based compensation |
| 60 | |
| 114 | | ||
Internal transfer of intellectual property |
| - | |
| 629 | | ||
Other |
| 280 | |
| 308 | | ||
Total deferred tax assets |
| 5,146 | |
| 7,351 | | ||
Valuation allowance |
| (2,827 | ) |
| (3,078 | ) | ||
Deferred tax assets net of valuation allowance |
| 2,319 | |
| 4,273 | | ||
|
|
|
|
| ||||
Deferred tax liabilities |
|
|
|
| ||||
Depreciation |
| (11 | ) |
| (125 | ) | ||
Acquired intangible assets |
| (216 | ) |
| (344 | ) | ||
Goodwill and other |
| (527 | ) |
| (855 | ) | ||
Total deferred tax liabilities |
| (754 | ) |
| (1,324 | ) | ||
Deferred tax assets, net |
| $ | 1,565 | |
| $ | 2,949 | |
|
|
|
|
| ||||
Recognized as: |
|
|
|
| ||||
Deferred income taxes – non-current |
| $ | 1,610 | |
| $ | 2,996 | |
Income taxes payable – non-current |
| (45 | ) |
| (47 | ) | ||
Total |
| $ | 1,565 | |
| $ | 2,949 | |
The adoption of amended guidance for intra-entity transfers of assets other than inventory resulted in net reductions to prepaid and deferred tax assets pertaining to pre-2017 internal transfers of intellectual property of $787 million and were adjusted through retained earnings as a cumulative effect of an accounting change. Additionally, amended guidance for share-based payment transactions was adopted in 2017 and net excess tax benefits of $39 million were recognized prospectively as a reduction of tax expense rather than capital in excess of par value of stock. The tax benefit realized as a result of stock related compensation credited to capital in excess of par value of stock was $92 million in 2016 and $147 million in 2015 . The adoption of amended guidance for both items reduced the effective tax rate by 2.4% in the year ended December 31, 2017. Refer to "-Note 1. Basis of Presentation and Recently Issued Accounting Standards" for more information.
The U.S. Federal net operating loss carryforwards were $317 million at December 31, 2017 . These carryforwards were acquired as a result of certain acquisitions and are subject to limitations under Section 382 of the Internal Revenue Code. The net operating loss carryforwards expire in varying amounts beginning in 2022. The foreign and state net operating loss carryforwards expire in varying amounts beginning in 2018 (certain amounts have unlimited lives).
82
At December 31, 2017 , a valuation allowance of $2,827 million was established for the following items: $2,654 million primarily for foreign net operating loss and tax credit carryforwards, $129 million for state deferred tax assets including net operating loss and tax credit carryforwards, $10 million for U.S. Federal net operating loss carryforwards and $34 million for other U.S. Federal deferred tax assets.
Changes in the valuation allowance were as follows:
|
| Year Ended December 31, | ||||||||||
Dollars in Millions |
| 2017 |
| 2016 |
| 2015 | ||||||
Balance at beginning of year |
| $ | 3,078 | |
| $ | 3,534 | |
| $ | 4,259 | |
Provision |
| 50 | |
| 39 | |
| 71 | | |||
Utilization |
| (335 | ) |
| (355 | ) |
| (436 | ) | |||
Foreign currency translation |
| 341 | |
| (142 | ) |
| (366 | ) | |||
Acquisitions |
| 2 | |
| 2 | |
| 6 | | |||
Non U.S. rate change |
| (309 | ) |
| - | |
| - | | |||
Balance at end of year |
| $ | 2,827 | |
| $ | 3,078 | |
| $ | 3,534 | |
Income tax payments were $546 million in 2017 , $2.0 billion in 2016 and $577 million in 2015 .
Business is conducted in various countries throughout the world and is subject to tax in numerous jurisdictions. A significant number of tax returns that are filed are subject to examination by various Federal, state and local tax authorities. Tax examinations are often complex, as tax authorities may disagree with the treatment of items reported requiring several years to resolve. Liabilities are established for possible assessments by tax authorities resulting from known tax exposures including, but not limited to, transfer pricing matters, tax credit deductibility of certain expenses, and deemed repatriation transition tax. Such liabilities represent a reasonable provision for taxes ultimately expected to be paid and may need to be adjusted over time as more information becomes known. The effect of changes in estimates related to contingent tax liabilities is included in the effective tax rate reconciliation above.
A reconciliation of the beginning and ending amount of gross unrecognized tax benefits is as follows:
|
| Year Ended December 31, | ||||||||||
Dollars in Millions |
| 2017 |
| 2016 |
| 2015 | ||||||
Balance at beginning of year |
| $ | 995 | |
| $ | 944 | |
| $ | 934 | |
Gross additions to tax positions related to current year |
| 173 | |
| 49 | |
| 52 | | |||
Gross additions to tax positions related to prior years |
| 30 | |
| 49 | |
| 56 | | |||
Gross additions to tax positions assumed in acquisitions |
| - | |
| 1 | |
| 1 | | |||
Gross reductions to tax positions related to prior years |
| (22 | ) |
| (22 | ) |
| (34 | ) | |||
Settlements |
| (20 | ) |
| (13 | ) |
| (46 | ) | |||
Reductions to tax positions related to lapse of statute |
| (13 | ) |
| (4 | ) |
| (9 | ) | |||
Cumulative translation adjustment |
| 12 | |
| (9 | ) |
| (10 | ) | |||
Balance at end of year |
| $ | 1,155 | |
| $ | 995 | |
| $ | 944 | |
Additional information regarding unrecognized tax benefits is as follows:
|
| Year Ended December 31, | ||||||||||
Dollars in Millions |
| 2017 |
| 2016 |
| 2015 | ||||||
Unrecognized tax benefits that if recognized would impact the effective tax rate |
| $ | 1,002 | |
| $ | 854 | |
| $ | 671 | |
Accrued interest |
| 148 | |
| 112 | |
| 93 | | |||
Accrued penalties |
| 15 | |
| 17 | |
| 16 | | |||
Accrued interest and penalties payable for unrecognized tax benefits are included in either current or non-current income taxes payable. Interest and penalties related to unrecognized tax benefits are included in income tax expense.
BMS is currently under examination by a number of tax authorities which have proposed or are considering proposing material adjustments to tax positions for issues such as transfer pricing, certain tax credits and the deductibility of certain expenses. It is reasonably possible that new issues will be raised by tax authorities which may require adjustments to the amount of unrecognized tax benefits; however, an estimate of such adjustments cannot reasonably be made at this time.
83
It is also reasonably possible that the total amount of unrecognized tax benefits at December 31, 2017 could decrease in the range of approximately $255 million to $315 million in the next twelve months as a result of the settlement of certain tax audits and other events. The expected change in unrecognized tax benefits may result in the payment of additional taxes, adjustment of certain deferred taxes and/or recognition of tax benefits. It is reasonably possible that new issues will be raised by tax authorities that may increase unrecognized tax benefits; however, an estimate of such increases cannot reasonably be made at this time. BMS believes that it has adequately provided for all open tax years by tax jurisdiction.
The following is a summary of major tax jurisdictions for which tax authorities may assert additional taxes based upon tax years currently under audit and subsequent years that will likely be audited:
U.S. |
| 2008 to 2017 |
Canada |
| 2006 to 2017 |
France |
| 2014 to 2017 |
Germany |
| 2007 to 2017 |
Italy |
| 2016 to 2017 |
Mexico |
| 2011 to 2017 |
Note 8 . EARNINGS PER SHARE
|
| Year Ended December 31, | ||||||||||
Amounts in Millions, Except Per Share Data |
| 2017 |
| 2016 |
| 2015 | ||||||
Net Earnings Attributable to BMS used for Basic and Diluted EPS Calculation |
| $ | 1,007 | |
| $ | 4,457 | |
| $ | 1,565 | |
|
|
|
|
|
|
| ||||||
Weighted-average common shares outstanding - basic |
| 1,645 | |
| 1,671 | |
| 1,667 | | |||
Incremental shares attributable to share-based compensation plans |
| 7 | |
| 9 | |
| 12 | | |||
Weighted-average common shares outstanding - diluted |
| 1,652 | |
| 1,680 | |
| 1,679 | | |||
|
|
|
|
|
|
| ||||||
Earnings per share - basic |
| $ | 0.61 | |
| $ | 2.67 | |
| $ | 0.94 | |
Earnings per share - diluted |
| $ | 0.61 | |
| $ | 2.65 | |
| $ | 0.93 | |
Note 9 . FINANCIAL INSTRUMENTS AND FAIR VALUE MEASUREMENTS
Financial instruments include cash and cash equivalents, marketable securities, accounts receivable and payable, debt instruments and derivatives.
Changes in exchange rates and interest rates create exposure to market risk. Certain derivative financial instruments are used when available on a cost-effective basis to hedge the underlying economic exposure. These instruments qualify as cash flow, net investment and fair value hedges upon meeting certain criteria, including effectiveness of offsetting hedged exposures. Changes in fair value of derivatives that do not qualify for hedge accounting are recognized in earnings as they occur. Derivative financial instruments are not used for trading purposes.
Financial instruments are subject to counterparty credit risk which is considered as part of the overall fair value measurement. Counterparty credit risk is monitored on an ongoing basis and mitigated by limiting amounts outstanding with any individual counterparty, utilizing conventional derivative financial instruments and only entering into agreements with counterparties that meet high credit quality standards. The consolidated financial statements would not be materially impacted if any counterparty failed to perform according to the terms of its agreement. Collateral is not required by any party whether derivatives are in an asset or liability position under the terms of the agreements.
84
Fair Value Measurements – The fair value of financial instruments are classified into one of the following categories:
Level 1 inputs utilize unadjusted quoted prices in active markets accessible at the measurement date for identical assets or liabilities. The fair value hierarchy provides the highest priority to Level 1 inputs.
Level 2 inputs utilize observable prices for similar instruments and quoted prices for identical or similar instruments in non-active markets. Additionally, certain corporate debt securities utilize a third-party matrix pricing model using significant inputs corroborated by market data for substantially the full term of the assets. Equity and fixed income funds are primarily invested in publicly traded securities valued at the respective net asset value of the underlying investments. Level 2 derivative instruments are valued using LIBOR yield curves, less credit valuation adjustments, and observable forward foreign exchange rates at the reporting date. Valuations of derivative contracts may fluctuate considerably from volatility in underlying foreign currencies and underlying interest rates driven by market conditions and the duration of the contract.
Level 3 unobservable inputs are used when little or no market data is available. There were no Level 3 financial assets or liabilities as of December 31, 2017 and 2016 .
Financial assets and liabilities measured at fair value on a recurring basis are summarized below:
|
| December 31, 2017 |
| December 31, 2016 | ||||||||||||
Dollars in Millions |
| Level 1 |
| Level 2 |
| Level 1 |
| Level 2 | ||||||||
Cash and cash equivalents - Money market and other securities |
| $ | - | |
| $ | 4,728 | |
| $ | - | |
| $ | 3,532 | |
Marketable securities: |
|
|
|
|
|
|
|
| ||||||||
Certificates of deposit |
| - | |
| 141 | |
| - | |
| 27 | | ||||
Commercial paper |
| - | |
| 50 | |
| - | |
| 750 | | ||||
Corporate debt securities |
| - | |
| 3,548 | |
| - | |
| 3,947 | | ||||
Equity funds |
| - | |
| 124 | |
| - | |
| 101 | | ||||
Fixed income funds |
| - | |
| 8 | |
| - | |
| 7 | | ||||
Derivative assets |
| - | |
| 13 | |
| - | |
| 75 | | ||||
Equity investments |
| 67 | |
| - | |
| 24 | |
| - | | ||||
Derivative liabilities |
| - | |
| (52 | ) |
| - | |
| (30 | ) | ||||
Equity investments not measured at fair value at year end and excluded from the above table were limited partnerships and other equity method investments of $66 million in 2017 and $37 million in 2016 and other equity investments without readily determinable fair values of $152 million in 2017 and $8 million in 2016. These amounts are included in Other assets.
Available-for-sale Securities
The following table summarizes available-for-sale securities:
| December 31, 2017 |
| December 31, 2016 | ||||||||||||||||||||||||||||
Dollars in Millions | Amortized |
| Gross Unrealized |
| Fair Value |
| Amortized |
| Gross Unrealized |
| Fair Value | ||||||||||||||||||||
Gains |
| Losses | Gains |
| Losses | ||||||||||||||||||||||||||
Certificates of deposit | $ | 141 | |
| $ | - | |
| $ | - | |
| $ | 141 | |
| $ | 27 | |
| $ | - | |
| $ | - | |
| $ | 27 | |
Commercial paper | 50 | |
| - | |
| - | |
| 50 | |
| 750 | |
| - | |
| - | |
| 750 | | ||||||||
Corporate debt securities | 3,555 | |
| 3 | |
| (10 | ) |
| 3,548 | |
| 3,945 | |
| 10 | |
| (8 | ) |
| 3,947 | | ||||||||
Equity investments | 31 | |
| 37 | |
| (1 | ) |
| 67 | |
| 31 | |
| - | |
| (7 | ) |
| 24 | | ||||||||
| $ | 3,777 | |
| $ | 40 | |
| $ | (11 | ) |
| $ | 3,806 | |
| $ | 4,753 | |
| $ | 10 | |
| $ | (15 | ) |
| $ | 4,748 | |
|
|
|
|
|
|
|
|
|
|
|
|
|
|
|
| ||||||||||||||||
Financial assets measured using the fair value option |
|
|
|
|
|
|
|
|
|
| |||||||||||||||||||||
Equity and fixed income funds (a) |
|
|
|
|
| 132 | |
|
|
|
|
|
|
| 108 | | |||||||||||||||
Total |
|
|
|
|
|
| $ | 3,938 | |
|
|
|
|
|
|
| $ | 4,856 | | ||||||||||||
85
Dollars in Millions | December 31, |
| December 31, | ||||
Current marketable securities | $ | 1,391 | |
| $ | 2,113 | |
Non-current marketable securities (b) | 2,480 | |
| 2,719 | | ||
Other assets (c) | 67 | |
| 24 | | ||
Total | $ | 3,938 | |
| $ | 4,856 | |
(a) | The fair value option for financial assets was elected for investments in equity and fixed income funds and are included in current marketable securities. Changes in fair value were not significant. |
(b) | All non-current marketable securities mature within five years as of December 31, 2017 and 2016 . |
(c) | Includes equity investments. |
Qualifying Hedges and Non-Qualifying Derivatives
The following summarizes the fair value of outstanding derivatives:
| December 31, 2017 |
| December 31, 2016 | ||||||||||||||||||||||||||||
| Asset (a) |
| Liability (b) |
| Asset (a) |
| Liability (b) | ||||||||||||||||||||||||
Dollars in Millions | Notional |
| Fair Value |
| Notional |
| Fair Value |
| Notional |
| Fair Value |
| Notional |
| Fair Value | ||||||||||||||||
Derivatives designated as hedging instruments: |
|
|
|
|
|
|
|
|
|
|
|
|
|
|
| ||||||||||||||||
Interest rate swap contracts | $ | - | |
| $ | - | |
| $ | 755 | |
| $ | (6 | ) |
| $ | 750 | |
| $ | 1 | |
| $ | 755 | |
| $ | (3 | ) |
Forward starting interest rate swap contracts | - | |
| - | |
| - | |
| - | |
| 500 | |
| 8 | |
| 250 | |
| (11 | ) | ||||||||
Foreign currency forward contracts | 944 | |
| 12 | |
| 489 | |
| (9 | ) |
| 967 | |
| 66 | |
| 198 | |
| (9 | ) | ||||||||
|
|
|
|
|
|
|
|
|
|
|
|
|
|
|
| ||||||||||||||||
Derivatives not designated as hedging instruments: |
|
|
|
|
|
|
|
|
|
|
|
|
|
|
| ||||||||||||||||
Foreign currency forward contracts | 206 | |
| 1 | |
| 1,369 | |
| (37 | ) |
| 106 | |
| - | |
| 360 | |
| (7 | ) | ||||||||
(a) | Included in prepaid expenses and other and other assets. |
(b) | Included in accrued liabilities and pension and other liabilities. |
Cash Flow Hedges - Foreign currency forward contracts are used to hedge certain forecasted intercompany inventory purchase transactions and certain other foreign currency transactions. The effective portion of changes in fair value for contracts designated as cash flow hedges are temporarily reported in accumulated other comprehensive loss and included in earnings when the hedged item affects earnings. The net gains on foreign currency forward contracts are expected to be reclassified to net earnings (primarily included in cost of products sold) within the next two years. The notional amount of outstanding foreign currency forward contracts was primarily attributed to the euro ( $1,904 million ) and Japanese yen ( $311 million ) at December 31, 2017 .
In 2015, BMS entered into $750 million of forward starting interest rate swap contracts maturing in March 2017 to hedge the variability of probable forecasted interest expense associated with potential future issuances of debt. BMS terminated the forward starting interest rate swap contracts in 2017 and the proceeds and related gain were not material. The contracts were designated as cash flow hedges with the effective portion of fair value changes included in other comprehensive income.
The earnings impact related to discontinued cash flow hedges and hedge ineffectiveness was not significant during all periods presented. Cash flow hedge accounting is discontinued when the forecasted transaction is no longer probable of occurring within 60 days after the originally forecasted date or when the hedge is no longer effective. Assessments to determine whether derivatives designated as qualifying hedges are highly effective in offsetting changes in the cash flows of hedged items are performed at inception and on a quarterly basis.
Net Investment Hedges - Non-U.S. dollar borrowings of €950 million ( $1,127 million ) at December 31, 2017 are designated to hedge the foreign currency exposures of the net investment in certain foreign affiliates. These borrowings are designated as net investment hedges and recognized in long term debt. The effective portion of foreign exchange loss on the remeasurement of euro debt was $134 million in 2017 and a gain of $48 million , and $80 million in 2016 and 2015 , respectively, and were recorded in the foreign currency translation component of accumulated other comprehensive loss with the related offset in long-term debt.
Fair Value Hedges - Fixed-to-floating interest rate swap contracts are designated as fair value hedges used as an interest rate risk management strategy to create an appropriate balance of fixed and floating rate debt. The contracts and underlying debt for the hedged benchmark risk are recorded at fair value. The effective interest rate for the contracts is one-month LIBOR ( 1.56% as of December 31, 2017 ) plus an interest rate spread ranging from 0.3% to 4.6% . When the underlying swap is terminated prior to maturity, the fair value basis adjustment to the underlying debt instrument is amortized as a reduction to interest expense over the remaining life of the debt.
86
The notional amount of fixed-to-floating interest rate swap contracts executed was $255 million in 2016. The notional amount of fixed-to-floating interest rate swap contracts terminated was $500 million in 2016 and $147 million in 2015 generating proceeds of $43 million in 2016 and $28 million in 2015 (including accrued interest). Additional contracts were terminated in connection with debt redemptions in 2015.
Debt Obligations
Short-term debt obligations include:
| December 31, | ||||||
Dollars in Millions | 2017 |
| 2016 | ||||
Commercial paper | $ | 299 | |
| $ | - | |
Non-U.S. short-term borrowings | 512 | |
| 109 | | ||
Other | 176 | |
| 134 | | ||
Current portion of long-term debt | - | |
| 749 | | ||
Total | $ | 987 | |
| $ | 992 | |
The average amount of commercial paper outstanding was $389 million at a weighted-average interest rate of 1.17% during 2017. The maximum amount of commercial paper outstanding was $1.3 billion with $299 million outstanding borrowings at December 31, 2017. There were no commercial paper borrowings in 2016.
Long-term debt and the current portion of long-term debt includes:
|
| December 31, | ||||||
Dollars in Millions |
| 2017 |
| 2016 | ||||
Principal Value: |
|
|
|
| ||||
0.875% Notes due 2017 |
| $ | - | |
| $ | 750 | |
1.750% Notes due 2019 |
| 500 | |
| 500 | | ||
1.600% Notes due 2019 |
| 750 | |
| - | | ||
2.000% Notes due 2022 |
| 750 | |
| 750 | | ||
7.150% Notes due 2023 |
| 302 | |
| 302 | | ||
3.250% Notes due 2023 |
| 500 | |
| 500 | | ||
1.000% Euro Notes due 2025 |
| 682 | |
| 601 | | ||
6.800% Notes due 2026 |
| 256 | |
| 256 | | ||
3.250% Notes due 2027 |
| 750 | |
| - | | ||
1.750% Euro Notes due 2035 |
| 682 | |
| 601 | | ||
5.875% Notes due 2036 |
| 287 | |
| 404 | | ||
6.125% Notes due 2038 |
| 230 | |
| 278 | | ||
3.250% Notes due 2042 |
| 500 | |
| 500 | | ||
4.500% Notes due 2044 |
| 500 | |
| 500 | | ||
6.875% Notes due 2097 |
| 87 | |
| 260 | | ||
0% - 5.75% Other - maturing 2018 - 2024 |
| 59 | |
| 59 | | ||
Subtotal |
| 6,835 | |
| 6,261 | | ||
|
|
|
|
| ||||
Adjustments to Principal Value: |
|
|
|
| ||||
Fair value of interest rate swap contracts |
| (6 | ) |
| (2 | ) | ||
Unamortized basis adjustment from swap terminations |
| 227 | |
| 287 | | ||
Unamortized bond discounts and issuance costs |
| (81 | ) |
| (81 | ) | ||
Total |
| $ | 6,975 | |
| $ | 6,465 | |
|
|
|
|
| ||||
Current portion of long-term debt |
| $ | - | |
| $ | 749 | |
Long-term debt |
| 6,975 | |
| 5,716 | | ||
The fair value of long-term debt was $7.5 billion and $6.9 billion at December 31, 2017 and 2016 , respectively, and was estimated using Level 2 inputs which are based upon the quoted market prices for the same or similar debt instruments. The fair value of short-term borrowings approximates the carrying value due to the short maturities of the debt instruments.
87
Senior unsecured notes were issued in registered public offerings in 2017 and 2015. The notes rank equally in right of payment with all of BMS's existing and future senior unsecured indebtedness and are redeemable in whole or in part, at any time at a predetermined redemption price. BMS also terminated forward starting interest rate swap contracts entered into during 2015, resulting in an unrealized loss in other comprehensive income. The following table summarizes the issuance of long-term debt obligations in 2017 and 2015 (none in 2016):
| 2017 |
| 2015 | ||||||||
Amounts in Millions | U.S. dollars |
| Euro |
| U.S. dollars | ||||||
Principal Value: |
|
|
|
|
| ||||||
1.600% Notes due 2019 | $ | 750 | |
| € | - | |
| $ | - | |
1.000% Euro Notes due 2025 | - | |
| 575 | |
| 643 | | |||
3.250% Notes due 2027 | 750 | |
| - | |
| - | | |||
1.750% Euro Notes due 2035 | - | |
| 575 | |
| 643 | | |||
Total | $ | 1,500 | |
| € | 1,150 | |
| $ | 1,286 | |
|
|
|
|
|
| ||||||
Proceeds net of discount and deferred loan issuance costs | $ | 1,488 | |
| € | 1,133 | |
| $ | 1,268 | |
|
|
|
|
|
| ||||||
Forward starting interest rate swap contracts terminated: |
|
|
|
|
| ||||||
Notional amount | $ | 750 | |
| € | 500 | |
| $ | 559 | |
Realized gain | 6 | |
| - | |
| - | | |||
Unrealized loss | (2 | ) |
| (16 | ) |
| (18 | ) | |||
BMS repaid $750 million of 0.875% Notes at maturity in 2017. The following summarizes the debt redemption activity for 2017 and 2015 (none in 2016):
Dollars in Millions |
| 2017 |
| 2015 | ||||
Principal amount |
| $ | 337 | |
| $ | 1,624 | |
Carrying value |
| 366 | |
| 1,795 | | ||
Debt redemption price |
| 474 | |
| 1,957 | | ||
Notional amount of interest rate swap contracts terminated |
| - | |
| 735 | | ||
Interest rate swap termination payments |
| - | |
| 11 | | ||
Loss on debt redemption (a) |
| 109 | |
| 180 | | ||
(a) | Including acceleration of debt issuance costs, loss on interest rate lock contract and other related fees. |
Interest payments were $215 million in 2017 , $191 million in 2016 and $205 million in 2015 net of amounts received from interest rate swap contracts.
We currently have three separate revolving credit facilities totaling $5.0 billion from a syndicate of lenders. The facilities provide for customary terms and conditions with no financial covenants. Our 364 day $2.0 billion facility expires in March 2018 and our two $1.5 billion facilities were extended to October 2021 and July 2022. Our two $1.5 billion , five-year facilities are extendable annually by one year on the anniversary date with the consent of the lenders. No borrowings were outstanding under any revolving credit facility at December 31, 2017 or 2016.
Available financial guarantees provided in the form of stand-by letters of credit and performance bonds were $704 million at December 31, 2017 . Stand-by letters of credit are issued through financial institutions in support of guarantees for various obligations. Performance bonds are issued to support a range of ongoing operating activities, including sale of products to hospitals and foreign ministries of health, bonds for customs, duties and value added tax and guarantees related to miscellaneous legal actions. A significant majority of the outstanding financial guarantees will expire within the year and are not expected to be funded.
88
Note 10 . RECEIVABLES
|
| December 31, | ||||||
Dollars in Millions |
| 2017 |
| 2016 | ||||
Trade receivables |
| $ | 4,599 | |
| $ | 3,948 | |
Less charge-backs and cash discounts |
| (209 | ) |
| (126 | ) | ||
Less bad debt allowances |
| (43 | ) |
| (48 | ) | ||
Net trade receivables |
| 4,347 | |
| 3,774 | | ||
Alliance receivables |
| 522 | |
| 903 | | ||
Prepaid and refundable income taxes |
| 691 | |
| 627 | | ||
Royalties, VAT and other |
| 740 | |
| 239 | | ||
Receivables |
| $ | 6,300 | |
| $ | 5,543 | |
Non-U.S. receivables sold on a nonrecourse basis were $637 million in 2017 , $618 million in 2016 , and $476 million in 2015 . In the aggregate, receivables from three pharmaceutical wholesalers in the U.S. represented 65% and 66% of total trade receivables at December 31, 2017 and 2016 , respectively.
Changes to the allowances for bad debt, charge-backs and cash discounts were as follows:
|
| Year Ended December 31, | ||||||||||
Dollars in Millions |
| 2017 |
| 2016 |
| 2015 | ||||||
Balance at beginning of year |
| $ | 174 | |
| $ | 122 | |
| $ | 93 | |
Provision |
| 2,090 | |
| 1,613 | |
| 1,059 | | |||
Utilization |
| (2,015 | ) |
| (1,561 | ) |
| (1,030 | ) | |||
Other |
| 3 | |
| - | |
| - | | |||
Balance at end of year |
| $ | 252 | |
| $ | 174 | |
| $ | 122 | |
Note 11 . INVENTORIES
|
| December 31, | ||||||
Dollars in Millions |
| 2017 |
| 2016 | ||||
Finished goods |
| $ | 384 | |
| $ | 310 | |
Work in process |
| 931 | |
| 988 | | ||
Raw and packaging materials |
| 273 | |
| 264 | | ||
Inventories |
| $ | 1,588 | |
| $ | 1,562 | |
|
|
|
|
| ||||
Inventories |
| $ | 1,166 | |
| $ | 1,241 | |
Other assets |
| 422 | |
| 321 | | ||
Other assets include inventory expected to remain on hand beyond one year in both periods.
89
Note 12 . PROPERTY, PLANT AND EQUIPMENT AND LEASES
|
| December 31, | ||||||
Dollars in Millions |
| 2017 |
| 2016 | ||||
Land |
| $ | 100 | |
| $ | 107 | |
Buildings |
| 4,848 | |
| 4,930 | | ||
Machinery, equipment and fixtures |
| 3,059 | |
| 3,287 | | ||
Construction in progress |
| 980 | |
| 849 | | ||
Gross property, plant and equipment |
| 8,987 | |
| 9,173 | | ||
Less accumulated depreciation |
| (3,986 | ) |
| (4,193 | ) | ||
Property, plant and equipment |
| $ | 5,001 | |
| $ | 4,980 | |
Depreciation expense was $682 million in 2017 , $448 million in 2016 and $500 million in 2015 .
Gross property, plant and equipment of $475 million ( $85 million net of accumulated depreciation) was reclassified to assets held-for-sale at December 31, 2017 as a result of the pending sale of a R&D facility in Wallingford, Connecticut. Refer to "-Note 4 . Acquisitions, Divestitures and Licensing Arrangements" for additional information.
Annual minimum rental commitments for non-cancelable operating leases (primarily real estate and motor vehicles) are approximately $100 million in each of the next five years and an aggregate $300 million thereafter. Operating lease expense was approximately $120 million in 2017 , $145 million in 2016 and $140 million in 2015 . Sublease income and capital lease obligations were not material for all periods presented.
Note 13 . GOODWILL AND OTHER INTANGIBLE ASSETS
|
|
|
| December 31, | ||||||
Dollars in Millions |
| Estimated Useful Lives |
| 2017 |
| 2016 | ||||
Goodwill |
|
|
| $ | 6,863 | |
| $ | 6,875 | |
|
|
|
|
|
|
| ||||
Other intangible assets: |
|
|
|
|
|
| ||||
Licenses |
| 5 – 15 years |
| $ | 567 | |
| $ | 564 | |
Developed technology rights |
| 9 – 15 years |
| 2,357 | |
| 2,357 | | ||
Capitalized software |
| 3 – 10 years |
| 1,381 | |
| 1,441 | | ||
IPRD |
|
|
| 32 | |
| 107 | | ||
Gross other intangible assets |
|
|
| 4,337 | |
| 4,469 | | ||
Less accumulated amortization |
|
|
| (3,127 | ) |
| (3,084 | ) | ||
Total other intangible assets |
|
|
| $ | 1,210 | |
| $ | 1,385 | |
Amortization expense of other intangible assets was $190 million in 2017 , $178 million in 2016 and $183 million in 2015 . Future annual amortization expense of other intangible assets is expected to be approximately $220 million in 2018 , $200 million in 2019 , $160 million in 2020 , $130 million in 2021 , and $100 million in 2022 . Other intangible asset impairment charges were $80 million in 2017 , $33 million in 2016 and $181 million in 2015 .
A $75 million IPRD charge was recognized and attributed to noncontrolling interest after BMS declined to exercise its option to purchase F-Star Alpha in 2017. A $160 million IPRD impairment charge was recognized for BMS-986020 (LPA1 Antagonist) which was in Phase II development for treatment of IPF in 2015. The full write-off was required after considering the occurrence of certain adverse events, voluntary suspension of the study and an internal assessment indicating a significantly lower likelihood of regulatory and commercial success. BMS acquired BMS-986020 with its acquisition of Amira Pharmaceuticals, Inc. in 2011.
90
Note 14 . ACCRUED LIABILITIES
|
| December 31, | ||||||
Dollars in Millions |
| 2017 |
| 2016 | ||||
Rebates and returns |
| $ | 2,024 | |
| $ | 1,680 | |
Employee compensation and benefits |
| 869 | |
| 818 | | ||
Research and development |
| 783 | |
| 718 | | ||
Dividends |
| 654 | |
| 660 | | ||
Royalties |
| 285 | |
| 246 | | ||
Branded Prescription Drug Fee |
| 303 | |
| 234 | | ||
Restructuring |
| 155 | |
| 90 | | ||
Pension and postretirement benefits |
| 40 | |
| 44 | | ||
Litigation and other settlements |
| 38 | |
| 43 | | ||
Other |
| 863 | |
| 738 | | ||
Accrued liabilities |
| $ | 6,014 | |
| $ | 5,271 | |
Note 15 . EQUITY
| Common Stock |
| Capital in Excess of Par Value of Stock |
| Accumulated Other Comprehensive Loss |
| Retained Earnings |
| Treasury Stock |
| Noncontrolling Interest | ||||||||||||||||||
Dollars and Shares in Millions | Shares |
| Par Value |
|
| Shares |
| Cost |
| ||||||||||||||||||||
Balance at January 1, 2015 | 2,208 | |
| $ | 221 | |
| $ | 1,507 | |
| $ | (2,425 | ) |
| $ | 32,541 | |
| 547 | |
| $ | (16,992 | ) |
| $ | 131 | |
Net earnings | - | |
| - | |
| - | |
| - | |
| 1,565 | |
| - | |
| - | |
| 84 | | ||||||
Other comprehensive loss | - | |
| - | |
| - | |
| (43 | ) |
| - | |
| - | |
| - | |
| - | | ||||||
Cash dividends | - | |
| - | |
| - | |
| - | |
| (2,493 | ) |
| - | |
| - | |
| - | | ||||||
Stock compensation | - | |
| - | |
| (48 | ) |
| - | |
| - | |
| (8 | ) |
| 431 | |
| - | | ||||||
Debt conversion | - | |
| - | |
| - | |
| - | |
| - | |
| - | |
| 2 | |
| - | | ||||||
Distributions | - | |
| - | |
| - | |
| - | |
| - | |
| - | |
| - | |
| (57 | ) | ||||||
Balance at December 31, 2015 | 2,208 | |
| 221 | |
| 1,459 | |
| (2,468 | ) |
| 31,613 | |
| 539 | |
| (16,559 | ) |
| 158 | | ||||||
Net earnings | - | |
| - | |
| - | |
| - | |
| 4,457 | |
| - | |
| - | |
| 50 | | ||||||
Other comprehensive loss | - | |
| - | |
| - | |
| (35 | ) |
| - | |
| - | |
| - | |
| - | | ||||||
Cash dividends | - | |
| - | |
| - | |
| - | |
| (2,557 | ) |
| - | |
| - | |
| - | | ||||||
Stock repurchase program | - | |
| - | |
| - | |
|
|
| - | |
| 4 | |
| (231 | ) |
| - | | |||||||
Stock compensation | - | |
| - | |
| 266 | |
| - | |
| - | |
| (7 | ) |
| 11 | |
| - | | ||||||
Distributions | - | |
| - | |
| - | |
| - | |
| - | |
| - | |
| - | |
| (38 | ) | ||||||
Balance at December 31, 2016 | 2,208 | |
| 221 | |
| 1,725 | |
| (2,503 | ) |
| 33,513 | |
| 536 | |
| (16,779 | ) |
| 170 | | ||||||
Accounting change - cumulative effect (a) | - | |
| - | |
| - | |
| - | |
| (787 | ) |
| - | |
| - | |
| - | | ||||||
Adjusted balance at January 1, 2017 | 2,208 | |
| 221 | |
| 1,725 | |
| (2,503 | ) |
| 32,726 | |
| 536 | |
| (16,779 | ) |
| 170 | | ||||||
Net earnings | - | |
| - | |
| - | |
| - | |
| 1,007 | |
| - | |
| - | |
| 27 | | ||||||
Other comprehensive income | - | |
| - | |
| - | |
| 214 | |
| - | |
| - | |
| - | |
| - | | ||||||
Cash dividends | - | |
| - | |
| - | |
| - | |
| (2,573 | ) |
| - | |
| - | |
| - | | ||||||
Stock repurchase program | - | |
| - | |
| - | |
| - | |
| - | |
| 44 | |
| (2,477 | ) |
| - | | ||||||
Stock compensation | - | |
| - | |
| 173 | |
| - | |
| - | |
| (5 | ) |
| 7 | |
| - | | ||||||
Variable interest entity | - | |
| - | |
| - | |
|
|
| - | |
| - | |
| - | |
| (59 | ) | |||||||
Distributions | - | |
| - | |
| - | |
| - | |
| - | |
| - | |
| - | |
| (32 | ) | ||||||
Balance at December 31, 2017 | 2,208 | |
| $ | 221 | |
| $ | 1,898 | |
| $ | (2,289 | ) |
| $ | 31,160 | |
| 575 | |
| $ | (19,249 | ) |
| $ | 106 | |
(a) Refer to "-Note 1 . Accounting Policies and Recently Issued Accounting Standards" for additional information.
91
BMS has a stock repurchase program authorized by its Board of Directors allowing for repurchases in the open market or through private transactions, including plans established in accordance with Rule 10b5-1 under the Securities Exchange Act of 1934. The stock repurchase program does not have an expiration date and may be suspended or discontinued at any time. Treasury stock is recognized at the cost to reacquire the shares. Shares issued from treasury are recognized utilizing the first-in first-out method. BMS repurchased shares during 2017 through Rule 10b5-1, open market purchases and accelerated share repurchase agreements.
BMS completed accelerated share repurchase agreements that repurchased approximately 36.5 million shares of the Company's common stock for an aggregate $2 billion in 2017. The agreements were funded through a combination of debt and cash.
The components of other comprehensive income/(loss) were as follows:
|
|
|
|
| Year Ended December 31, |
|
|
|
| ||||||||||||||||||||||||||
| 2017 |
| 2016 |
| 2015 | ||||||||||||||||||||||||||||||
Dollars in Millions | Pretax |
| Tax |
| After Tax |
| Pretax |
| Tax |
| After Tax |
| Pretax |
| Tax |
| After Tax | ||||||||||||||||||
Derivatives qualifying as cash flow hedges: |
|
|
|
|
|
|
|
|
|
|
|
|
|
|
|
|
| ||||||||||||||||||
Unrealized gains/(losses) | $ | (101 | ) |
| $ | 33 | |
| $ | (68 | ) |
| $ | (5 | ) |
| $ | - | |
| $ | (5 | ) |
| $ | 59 | |
| $ | (22 | ) |
| $ | 37 | |
Reclassified to net earnings (a) | 19 | |
| (8 | ) |
| 11 | |
| 12 | |
| (3 | ) |
| 9 | |
| (130 | ) |
| 42 | |
| (88 | ) | |||||||||
Derivatives qualifying as cash flow hedges | (82 | ) |
| 25 | |
| (57 | ) |
| 7 | |
| (3 | ) |
| 4 | |
| (71 | ) |
| 20 | |
| (51 | ) | |||||||||
Pension and postretirement benefits: |
|
|
|
|
|
|
|
|
|
|
|
|
|
|
|
|
| ||||||||||||||||||
Actuarial gains/(losses) | 47 | |
| 11 | |
| 58 | |
| (126 | ) |
| (3 | ) |
| (129 | ) |
| (88 | ) |
| 27 | |
| (61 | ) | |||||||||
Amortization (b) | 77 | |
| (31 | ) |
| 46 | |
| 78 | |
| (25 | ) |
| 53 | |
| 85 | |
| (28 | ) |
| 57 | | |||||||||
Settlements (c) | 167 | |
| (57 | ) |
| 110 | |
| 91 | |
| (32 | ) |
| 59 | |
| 160 | |
| (55 | ) |
| 105 | | |||||||||
Pension and postretirement benefits | 291 | |
| (77 | ) |
| 214 | |
| 43 | |
| (60 | ) |
| (17 | ) |
| 157 | |
| (56 | ) |
| 101 | | |||||||||
Available-for-sale securities: |
|
|
|
|
|
|
|
|
|
|
|
|
|
|
|
|
| ||||||||||||||||||
Unrealized gains/(losses) | 38 | |
| 6 | |
| 44 | |
| (12 | ) |
| (1 | ) |
| (13 | ) |
| (71 | ) |
| 14 | |
| (57 | ) | |||||||||
Realized (gains)/losses (c) | (7 | ) |
| 2 | |
| (5 | ) |
| 29 | |
| - | |
| 29 | |
| 3 | |
| - | |
| 3 | | |||||||||
Available-for-sale securities | 31 | |
| 8 | |
| 39 | |
| 17 | |
| (1 | ) |
| 16 | |
| (68 | ) |
| 14 | |
| (54 | ) | |||||||||
Foreign currency translation | (20 | ) |
| 38 | |
| 18 | |
| (33 | ) |
| (5 | ) |
| (38 | ) |
| (17 | ) |
| (22 | ) |
| (39 | ) | |||||||||
Total Other Comprehensive Income/(Loss) | $ | 220 | |
| $ | (6 | ) |
| $ | 214 | |
| $ | 34 | |
| $ | (69 | ) |
| $ | (35 | ) |
| $ | 1 | |
| $ | (44 | ) |
| $ | (43 | ) |
(a) | Included in cost of products sold |
(b) | Included in cost of products sold, research and development, and marketing, selling and administrative expenses |
(c) | Included in other income (net) |
The accumulated balances related to each component of other comprehensive loss, net of taxes, were as follows:
|
| December 31, | ||||||
Dollars in Millions |
| 2017 |
| 2016 | ||||
Derivatives qualifying as cash flow hedges |
| $ | (19 | ) |
| $ | 38 | |
Pension and postretirement benefits |
| (1,883 | ) |
| (2,097 | ) | ||
Available-for-sale securities |
| 32 | |
| (7 | ) | ||
Foreign currency translation |
| (419 | ) |
| (437 | ) | ||
Accumulated other comprehensive loss |
| $ | (2,289 | ) |
| $ | (2,503 | ) |
Note 16 . PENSION AND POSTRETIREMENT BENEFIT PLANS
BMS sponsors defined benefit pension plans, defined contribution plans and termination indemnity plans for regular full-time employees. The principal defined benefit pension plan is the Bristol-Myers Squibb Retirement Income Plan, covering most U.S. employees and representing approximately 66% of the consolidated pension plan assets and 62% of the obligations. Future benefits related to service for this plan were eliminated in 2009. BMS contributes at least the minimum amount required by the ERISA. Plan benefits are based primarily on the participant's years of credited service and final average compensation. Plan assets consist principally of equity and fixed-income securities.
92
The net periodic benefit cost/(credit) of defined benefit pension plans includes:
Dollars in Millions |
| 2017 |
| 2016 |
| 2015 | ||||||
Service cost - benefits earned during the year |
| $ | 25 | |
| $ | 24 | |
| $ | 25 | |
Interest cost on projected benefit obligation |
| 188 | |
| 192 | |
| 242 | | |||
Expected return on plan assets |
| (411 | ) |
| (418 | ) |
| (405 | ) | |||
Amortization of prior service credits |
| (4 | ) |
| (3 | ) |
| (3 | ) | |||
Amortization of net actuarial loss |
| 82 | |
| 84 | |
| 91 | | |||
Curtailments |
| (8 | ) |
| - | |
| (1 | ) | |||
Settlements |
| 167 | |
| 91 | |
| 161 | | |||
Special termination benefits |
| 3 | |
| 1 | |
| - | | |||
Net periodic benefit cost/(credit) |
| $ | 42 | |
| $ | (29 | ) |
| $ | 110 | |
Pension settlement charges were recognized after determining the annual lump sum payments will exceed the annual interest and service costs for certain pension plans, including the primary U.S. pension plan in 2017 , 2016 and 2015 .
Changes in defined benefit pension plan obligations, assets, funded status and amounts recognized in the consolidated balance sheets were as follows:
Dollars in Millions |
| 2017 |
| 2016 | ||||
Benefit obligations at beginning of year |
| $ | 6,440 | |
| $ | 6,418 | |
Service cost-benefits earned during the year |
| 25 | |
| 24 | | ||
Interest cost |
| 188 | |
| 192 | | ||
Settlements |
| (330 | ) |
| (173 | ) | ||
Actuarial (gains)/losses |
| 368 | |
| 253 | | ||
Benefits paid |
| (121 | ) |
| (109 | ) | ||
Foreign currency and other |
| 179 | |
| (165 | ) | ||
Benefit obligations at end of year |
| $ | 6,749 | |
| $ | 6,440 | |
|
|
|
|
| ||||
Fair value of plan assets at beginning of year |
| $ | 5,831 | |
| $ | 5,687 | |
Actual return on plan assets |
| 804 | |
| 513 | | ||
Employer contributions |
| 396 | |
| 81 | | ||
Settlements |
| (330 | ) |
| (173 | ) | ||
Benefits paid |
| (121 | ) |
| (109 | ) | ||
Foreign currency and other |
| 169 | |
| (168 | ) | ||
Fair value of plan assets at end of year |
| $ | 6,749 | |
| $ | 5,831 | |
|
|
|
|
| ||||
Funded status |
| $ | - | |
| $ | (609 | ) |
|
|
|
|
| ||||
Assets/(Liabilities) recognized: |
|
|
|
| ||||
Other assets |
| $ | 487 | |
| $ | 26 | |
Accrued liabilities |
| (31 | ) |
| (35 | ) | ||
Pension and other liabilities |
| (456 | ) |
| (600 | ) | ||
Funded status |
| $ | - | |
| $ | (609 | ) |
|
|
|
|
| ||||
Recognized in accumulated other comprehensive loss: |
|
|
|
| ||||
Net actuarial losses |
| $ | 2,849 | |
| $ | 3,123 | |
Prior service credit |
| (36 | ) |
| (39 | ) | ||
Total |
| $ | 2,813 | |
| $ | 3,084 | |
The accumulated benefit obligation for defined benefit pension plans was $6.7 billion and $6.4 billion at December 31, 2017 and 2016 , respectively.
93
Additional information related to pension plans was as follows:
Dollars in Millions |
| 2017 |
| 2016 | ||||
Pension plans with projected benefit obligations in excess of plan assets: |
|
|
|
| ||||
Projected benefit obligation |
| $ | 1,166 | |
| $ | 6,195 | |
Fair value of plan assets |
| 678 | |
| 5,559 | | ||
Pension plans with accumulated benefit obligations in excess of plan assets : |
|
|
|
| ||||
Accumulated benefit obligation |
| $ | 1,008 | |
| $ | 5,978 | |
Fair value of plan assets |
| 550 | |
| 5,380 | | ||
Actuarial Assumptions
Weighted-average assumptions used to determine defined benefit pension plan obligations at December 31 were as follows:
|
| 2017 |
| 2016 | ||
Discount rate |
| 3.1 | % |
| 3.5 | % |
Rate of compensation increase |
| 0.5 | % |
| 0.5 | % |
Weighted-average actuarial assumptions used to determine defined benefit pension plan net periodic benefit (credit)/cost for the years ended December 31 were as follows:
|
| 2017 |
| 2016 |
| 2015 | |||
Discount rate |
| 3.5 | % |
| 3.8 | % |
| 3.6 | % |
Expected long-term return on plan assets |
| 7.0 | % |
| 7.2 | % |
| 7.2 | % |
Rate of compensation increase |
| 0.5 | % |
| 0.5 | % |
| 0.8 | % |
The yield on high quality corporate bonds matching the duration of the benefit obligations is used in determining the discount rate. The Citi Pension Discount curve is used in developing the discount rate for the U.S. plans.
The expected return on plan assets was determined using the expected rate of return and a calculated value of assets, referred to as the "market-related value" which approximated the fair value of plan assets at December 31, 2017 . Differences between assumed and actual returns are amortized to the market-related value on a straight-line basis over a three-year period. Several factors are considered in developing the expected return on plan assets, including long-term historical returns and input from external advisors. Individual asset class return forecasts were developed based upon market conditions, for example, price-earnings levels and yields and long-term growth expectations. The expected long-term rate of return is the weighted-average of the target asset allocation of each individual asset class. Historical long-term actual annualized returns for U.S. pension plans were as follows:
|
| 2017 |
| 2016 |
| 2015 | |||
10 years |
| 6.8 | % |
| 6.1 | % |
| 6.7 | % |
15 years |
| 9.3 | % |
| 7.1 | % |
| 6.0 | % |
20 years |
| 7.5 | % |
| 7.7 | % |
| 8.1 | % |
Actuarial gains and losses resulted from changes in actuarial assumptions (such as changes in the discount rate and revised mortality rates) and from differences between assumed and actual experience (such as differences between actual and expected return on plan assets). Gains and losses are amortized over the life expectancy of the plan participants for U.S. plans ( 34 years in 2018 ) and expected remaining service periods for most other plans to the extent they exceed 10% of the higher of the market-related value or the projected benefit obligation for each respective plan. The amortization of net actuarial loss and prior service credit is expected to be approximately $80 million in 2018 . The periodic benefit cost or credit is included in cost of products sold, research and development, and marketing, selling and administrative expenses, except for curtailments, settlements and other special termination benefits which are included in other expenses.
94
Postretirement Benefit Plans
Comprehensive medical and group life benefits are provided for substantially all U.S. retirees electing to participate in comprehensive medical and group life plans and to a lesser extent certain benefits for non-U.S. employees. The medical plan is contributory. Contributions are adjusted periodically and vary by date of retirement. The life insurance plan is noncontributory. Plan assets consist principally of equity and fixed-income securities. Postretirement benefit plan obligations were $298 million and $308 million at December 31, 2017 and 2016 , respectively, and the fair value of plan assets were $364 million and $331 million at December 31, 2017 and 2016 , respectively. The weighted-average discount rate used to determine benefit obligations was 3.3% and 3.6% at December 31, 2017 and 2016 , respectively. The net periodic benefit credits were not material.
Plan Assets
The fair value of pension and postretirement plan assets by asset category at December 31, 2017 and 2016 was as follows:
|
| December 31, 2017 |
| December 31, 2016 | ||||||||||||||||||||||||||||
Dollars in Millions |
| Level 1 |
| Level 2 |
| Level 3 |
| Total |
| Level 1 |
| Level 2 |
| Level 3 |
| Total | ||||||||||||||||
Plan Assets |
|
|
|
|
|
|
|
|
|
|
|
|
|
|
|
| ||||||||||||||||
Equity securities |
| $ | 799 | |
| $ | - | |
| $ | - | |
| $ | 799 | |
| $ | 833 | |
| $ | - | |
| $ | - | |
| $ | 833 | |
Equity funds |
| 160 | |
| 1,358 | |
| - | |
| 1,518 | |
| 138 | |
| 1,230 | |
| - | |
| 1,368 | | ||||||||
Fixed income funds |
| - | |
| 724 | |
| - | |
| 724 | |
| - | |
| 804 | |
| - | |
| 804 | | ||||||||
Corporate debt securities |
| - | |
| 1,919 | |
| - | |
| 1,919 | |
| - | |
| 1,405 | |
| - | |
| 1,405 | | ||||||||
U.S. Treasury and agency securities |
| - | |
| 729 | |
| - | |
| 729 | |
| - | |
| 536 | |
| - | |
| 536 | | ||||||||
Short-term investment funds |
| - | |
| 135 | |
| - | |
| 135 | |
| - | |
| 90 | |
| - | |
| 90 | | ||||||||
Insurance contracts |
| - | |
| - | |
| 138 | |
| 138 | |
| - | |
| - | |
| 112 | |
| 112 | | ||||||||
Cash and cash equivalents |
| 214 | |
| - | |
| - | |
| 214 | |
| 81 | |
| - | |
| - | |
| 81 | | ||||||||
Other |
| - | |
| 92 | |
| 13 | |
| 105 | |
| - | |
| 93 | |
| - | |
| 93 | | ||||||||
Plan assets subject to leveling |
| $ | 1,173 | |
| $ | 4,957 | |
| $ | 151 | |
| $ | 6,281 | |
| $ | 1,052 | |
| $ | 4,158 | |
| $ | 112 | |
| $ | 5,322 | |
|
|
|
|
|
|
|
|
|
|
|
|
|
|
|
|
| ||||||||||||||||
Plan assets measured at NAV as a practical expedient |
|
|
|
|
|
|
|
|
|
|
|
|
|
| ||||||||||||||||||
Equity funds |
|
|
|
|
|
|
| $ | 488 | |
|
|
|
|
|
|
| $ | 476 | | ||||||||||||
Venture capital and limited partnerships |
|
|
|
|
|
|
| 154 | |
|
|
|
|
|
|
| 198 | | ||||||||||||||
Other |
|
|
|
|
|
|
| 191 | |
|
|
|
|
|
|
| 166 | | ||||||||||||||
Total plan assets measured at NAV as a practical expedient |
|
|
|
|
| 833 | |
|
|
|
|
|
|
| 840 | | ||||||||||||||||
Net plan assets |
|
|
|
|
|
|
| $ | 7,114 | |
|
|
|
|
|
|
| $ | 6,162 | | ||||||||||||
The investment valuation policies per investment class are as follows:
Level 1 inputs utilize unadjusted quoted prices in active markets accessible at the measurement date for identical assets or liabilities. The fair value hierarchy provides the highest priority to Level 1 inputs. These instruments include equity securities, equity funds and fixed income funds publicly traded on a national securities exchange, and cash and cash equivalents. Cash and cash equivalents are highly liquid investments with original maturities of three months or less at the time of purchase and are recognized at cost, which approximates fair value. Pending trade sales and purchases are included in cash and cash equivalents until final settlement.
Level 2 inputs utilize observable prices for similar instruments, quoted prices for identical or similar instruments in non-active markets, and other observable inputs that can be corroborated by market data for substantially the full term of the assets or liabilities. Equity funds, fixed income funds, and short-term investment funds classified as Level 2 within the fair value hierarchy are valued at the net asset value of their shares held at year end, which represents fair value. Corporate debt securities and U.S. Treasury and agency securities classified as Level 2 within the fair value hierarchy are valued utilizing observable prices for similar instruments and quoted prices for identical or similar instruments in markets that are not active.
Level 3 unobservable inputs are used when little or no market data is available. Insurance contracts are held by certain foreign pension plans and are carried at contract value, which approximates the estimated fair value and is based on the fair value of the underlying investment of the insurance company.
Venture capital and limited partnership investments are typically only redeemable through distributions upon liquidation of the underlying assets. There were no significant unfunded commitments for these investments and essentially all liquidations are expected to occur by 2019. Most of the remaining investments using the practical expedient are redeemable on a weekly or monthly basis.
95
The investment strategy is to maximize return while maintaining an appropriate level of risk to provide sufficient liquidity for benefit obligations and plan expenses. A target asset allocation of 43% public equity ( 16% international, 14% global and 13% U.S.), 7% private equity and 50% long-duration fixed income is maintained for the U.S. pension plans. Investments are diversified within each of the three major asset categories. Approximately 90% of the U.S. pension plans equity investments are actively managed. BMS common stock represents less than 1% of the plan assets at December 31, 2017 and 2016 .
Contributions and Estimated Future Benefit Payments
Contributions to pension plans were $396 million in 2017 , $81 million in 2016 and $118 million in 2015 and are expected to be approximately $70 million in 2018 . Estimated annual future benefit payments (including lump sum payments) range from approximately $275 million to $300 million in each of the next five years, and aggregate $1.6 billion in the subsequent five year period.
Savings Plans
The principal defined contribution plan is the Bristol-Myers Squibb Savings and Investment Program. The contribution is based on employee contributions and the level of Company match. The expense attributed to defined contribution plans in the U.S. was approximately $200 million in 2017 , 2016 and 2015 .
Note 17 . EMPLOYEE STOCK BENEFIT PLANS
On May 1, 2012, the shareholders approved the 2012 Plan, which replaced the 2007 Stock Incentive Plan. The 2012 Plan provides for 109 million shares to be authorized for grants, plus any shares from outstanding awards under the 2007 Plan as of February 29, 2012 that expire, are forfeited, canceled, or withheld to satisfy tax withholding obligations. As of December 31, 2017 , 104 million shares were available for award. Shares are issued from treasury stock to satisfy our obligations under this Plan.
Executive officers and key employees may be granted options to purchase common stock at no less than the market price on the date the option is granted. Options generally become exercisable ratably over four years and have a maximum term of ten years. The plan provides for the granting of stock appreciation rights whereby the grantee may surrender exercisable rights and receive common stock and/or cash measured by the excess of the market price of the common stock over the option exercise price. The Company has not granted any stock options or stock appreciation rights since 2009.
Restricted stock units may be granted to key employees, subject to restrictions as to continuous employment. Generally, vesting occurs ratably over a four year period from grant date. A stock unit is a right to receive stock at the end of the specified vesting period but has no voting rights.
Market share units are granted to executives. Vesting is conditioned upon continuous employment until the vesting date and a payout factor of at least 60% of the share price on the award date. The payout factor is the share price on vesting date divided by share price on award date, with a maximum of 200% . The share price used in the payout factor is calculated using an average of the closing prices on the grant or vest date, and the nine trading days immediately preceding the grant or vest date. Vesting occurs ratably over four years.
Performance share units are granted to executives, have a three year cycle and are granted as a target number of units subject to adjustment. The number of shares issued when performance share units vest is determined based on the achievement of performance goals and based on the Company's three-year total shareholder return relative to a peer group of companies. Vesting is conditioned upon continuous employment and occurs on the third anniversary of the grant date.
Stock-based compensation expense for awards ultimately expected to vest is recognized over the vesting period. Forfeitures are estimated based on historical experience at the time of grant and revised in subsequent periods if actual forfeitures differ from those estimates. Other information related to stock-based compensation benefits are as follows:
|
| Years Ended December 31, | ||||||||||
Dollars in Millions |
| 2017 |
| 2016 |
| 2015 | ||||||
Restricted stock units |
| $ | 95 | |
| $ | 89 | |
| $ | 82 | |
Market share units |
| 35 | |
| 37 | |
| 36 | | |||
Performance share units |
| 69 | |
| 79 | |
| 117 | | |||
Total stock-based compensation expense |
| $ | 199 | |
| $ | 205 | |
| $ | 235 | |
|
|
|
|
|
|
| ||||||
Income tax benefit |
| $ | 59 | |
| $ | 69 | |
| $ | 77 | |
96
|
| Stock Options |
| Restricted Stock Units |
| Market Share Units |
| Performance Share Units | ||||||||||||||||||||
|
| Number of Options Outstanding |
| Weighted- Average Exercise Price of Shares |
| Number of Nonvested Awards |
| Weighted- Average Grant-Date Fair Value |
| Number of Nonvested Awards |
| Weighted- Average Grant-Date Fair Value |
| Number of Nonvested Awards |
| Weighted- Average Grant-Date Fair Value | ||||||||||||
Shares in Millions |
|
|
|
|
|
|
|
| ||||||||||||||||||||
Balance at January 1, 2017 |
| 6.4 | |
| $ | 21.02 | |
| 4.6 | |
| $ | 56.90 | |
| 1.5 | |
| $ | 61.63 | |
| 4.1 | |
| $ | 60.97 | |
Granted |
| - | |
| - | |
| 2.7 | |
| 54.39 | |
| 0.9 | |
| 60.14 | |
| 1.3 | |
| 57.91 | | ||||
Released/Exercised |
| (2.5 | ) |
| 23.80 | |
| (1.7 | ) |
| 53.00 | |
| (0.6 | ) |
| 54.64 | |
| (1.5 | ) |
| 54.46 | | ||||
Adjustments for actual payout |
| - | |
| - | |
| - | |
| - | |
| - | |
| - | |
| - | |
| - | | ||||
Forfeited/Canceled |
| (0.1 | ) |
| 25.55 | |
| (0.7 | ) |
| 57.26 | |
| (0.3 | ) |
| 62.95 | |
| (0.4 | ) |
| 62.21 | | ||||
Balance at December 31, 2017 |
| 3.8 | |
| 19.04 | |
| 4.9 | |
| 56.85 | |
| 1.5 | |
| 62.25 | |
| 3.5 | |
| 62.57 | | ||||
|
|
|
|
|
|
|
|
|
|
|
|
|
|
|
|
| ||||||||||||
Vested or expected to vest |
| 3.8 | |
| 19.04 | |
| 4.3 | |
| 56.89 | |
| 1.4 | |
| 62.27 | |
| 3.3 | |
| 62.82 | | ||||
|
| Restricted |
| Market |
| Performance | ||||||
Dollars in Millions |
| Stock Units |
| Share Units |
| Share Units | ||||||
Unrecognized compensation cost |
| $ | 197 | |
| $ | 42 | |
| $ | 70 | |
Expected weighted-average period in years of compensation cost to be recognized |
| 2.7 | |
| 2.8 | |
| 1.7 | | |||
Amounts in Millions, except per share data |
| 2017 |
| 2016 |
| 2015 | ||||||
Weighted-average grant date fair value (per share): |
|
|
|
|
|
| ||||||
Restricted stock units |
| $ | 54.39 | |
| $ | 60.56 | |
| $ | 61.18 | |
Market share units |
| 60.14 | |
| 65.26 | |
| 67.03 | | |||
Performance share units |
| 57.91 | |
| 64.87 | |
| 65.07 | | |||
|
|
|
|
|
|
| ||||||
Fair value of awards that vested: |
|
|
|
|
|
| ||||||
Restricted stock units |
| $ | 91 | |
| $ | 81 | |
| $ | 77 | |
Market share units |
| 33 | |
| 50 | |
| 47 | | |||
Performance share units |
| 84 | |
| 93 | |
| 75 | | |||
|
|
|
|
|
|
| ||||||
Total intrinsic value of stock options exercised |
| $ | 84 | |
| $ | 158 | |
| $ | 206 | |
The fair value of restricted stock units, market share units and performance share units approximates the closing trading price of BMS's common stock on the grant date after adjusting for the units not eligible for accrued dividends. In addition, the fair value of market share units and performance share units considers the probability of satisfying the payout factor and total shareholder return, respectively.
The following table summarizes significant ranges of outstanding and exercisable options at December 31, 2017 :
|
| Options Outstanding and Exercisable | |||||||||||
Range of Exercise Prices |
| Number Outstanding and Exercisable (in millions) |
| Weighted-Average Remaining Contractual Life (in years) |
| Weighted-Average Exercise Price Per Share |
| Aggregate Intrinsic Value (in millions) | |||||
$17 - $24 |
| 3.8 | |
| 0.83 |
| $ | 19.04 | |
| $ | 160 | |
The aggregate intrinsic value in the preceding table represents the total pretax intrinsic value, based on the closing stock price of $61.28 on December 31, 2017 .
97
Note 18 . LEGAL PROCEEDINGS AND CONTINGENCIES
The Company and certain of its subsidiaries are involved in various lawsuits, claims, government investigations and other legal proceedings that arise in the ordinary course of business. These claims or proceedings can involve various types of parties, including governments, competitors, customers, suppliers, service providers, licensees, employees, or shareholders, among others. The resolution of these matters often develops over a long period of time and expectations can change as a result of new findings, rulings, appeals or settlement arrangements. The Company recognizes accruals for such contingencies when it is probable that a liability will be incurred and the amount of loss can be reasonably estimated. These matters involve patent infringement, antitrust, securities, pricing, sales and marketing practices, environmental, commercial, contractual rights, licensing obligations, health and safety matters, consumer fraud, employment matters, product liability and insurance coverage. Legal proceedings that are material or that the Company believes could become material are described below.
Although the Company believes it has substantial defenses in these matters, there can be no assurance that there will not be an increase in the scope of pending matters or that any future lawsuits, claims, government investigations or other legal proceedings will not be material. Unless otherwise noted, the Company is unable to assess the outcome of the respective litigation nor is it able to provide an estimated range of potential loss. Furthermore, failure to enforce our patent rights would likely result in substantial decreases in the respective product revenues from generic competition.
INTELLECTUAL PROPERTY
Plavix* - Australia
As previously disclosed, Sanofi was notified that, in August 2007, GenRx Proprietary Limited (GenRx) obtained regulatory approval of an application for clopidogrel bisulfate 75mg tablets in Australia. GenRx, formerly a subsidiary of Apotex Inc. (Apotex), has since changed its name to Apotex. In August 2007, Apotex filed an application in the Federal Court of Australia (the Federal Court) seeking revocation of Sanofi's Australian Patent No. 597784 (Case No. NSD 1639 of 2007). Sanofi filed counterclaims of infringement and sought an injunction. On September 21, 2007, the Federal Court granted Sanofi's injunction. A subsidiary of the Company was subsequently added as a party to the proceedings. In February 2008, a second company, Spirit Pharmaceuticals Pty. Ltd., also filed a revocation suit against the same patent. This case was consolidated with the Apotex case, and a trial occurred in April 2008. On August 12, 2008, the Federal Court of Australia held that claims of Patent No. 597784 covering clopidogrel bisulfate, hydrochloride, hydrobromide, and taurocholate salts were valid. The Federal Court also held that the process claims, pharmaceutical composition claims, and claim directed to clopidogrel and its pharmaceutically acceptable salts were invalid. The Company and Sanofi filed notices of appeal in the Full Court of the Federal Court of Australia (Full Court) appealing the holding of invalidity of the claim covering clopidogrel and its pharmaceutically acceptable salts, process claims, and pharmaceutical composition claims which have stayed the Federal Court's ruling. Apotex filed a notice of appeal appealing the holding of validity of the clopidogrel bisulfate, hydrochloride, hydrobromide, and taurocholate claims. A hearing on the appeals occurred in February 2009. On September 29, 2009, the Full Court held all of the claims of Patent No. 597784 invalid. In November 2009, the Company and Sanofi applied to the High Court of Australia (High Court) for special leave to appeal the judgment of the Full Court. In March 2010, the High Court denied the Company and Sanofi's request to hear the appeal of the Full Court decision. The case was remanded to the Federal Court for further proceedings related to damages sought by Apotex. The Company and Apotex have settled the Apotex case, and the case was dismissed. The Australian government has intervened in this matter and is seeking maximum damages up to 449 million AUD ( $346 million ), plus interest, which would be split between the Company and Sanofi, for alleged losses experienced for paying a higher price for branded Plavix during the period when the injunction was in place. The Company and Sanofi have disputed that the Australian government is entitled to any damages and the Australian government's claim is still pending and a trial was concluded in September 2017. The Company is expecting a decision in 2018.
Sprycel - European Union
In May 2013, Apotex, Actavis Group PTC ehf, Generics [UK] Limited (Mylan) and an unnamed company filed oppositions in the EPO seeking revocation of European Patent No. 1169038 (the ‘038 patent) covering dasatinib, the active ingredient in Sprycel . The ‘038 patent is scheduled to expire in April 2020 (excluding potential term extensions). On January 20, 2016, the Opposition Division of the EPO revoked the ‘038 patent. In May 2016, the Company appealed the EPO's decision to the EPO Board of Appeal. In February 2017, the EPO Board of Appeal upheld the Opposition Division's decision, and revoked the ‘038 patent. Orphan drug exclusivity and data exclusivity for Sprycel in the EU expired in November 2016. The EPO Board of Appeal's decision does not affect the validity of our other Sprycel patents within and outside Europe, including different patents that cover the monohydrate form of dasatinib and the use of dasatinib to treat CML. Additionally, in February 2017, the EPO Board of Appeal reversed and remanded an invalidity decision on European Patent No. 1610780 and its claim to the use of dasatinib to treat CML, which the EPO's Opposition Division had revoked in October 2012. The Company intends to take appropriate legal actions to protect Sprycel . We may experience a decline in European revenues in the event that generic dasatinib product enters the market.
98
Anti-PD-1 Antibody Patent Oppositions and Litigation
In September 2015, Dana-Farber Cancer Institute (Dana-Farber) filed a complaint in Massachusetts federal court seeking to correct the inventorship on up to five related U.S. patents directed to methods of treating cancer using PD-1 and PD-L1 antibodies. Specifically, Dana-Farber is seeking to add two scientists as inventors to these patents. In October 2017, Pfizer was allowed to intervene in this case alleging that one of the scientists identified by Dana-Farber was employed by a company eventually acquired by Pfizer during the relevant period. While an adverse decision in this litigation would not result in monetary liability for the Company, it could decrease potential future licensing revenue from these patents.
Eliquis Patent Litigation - U.S.
In 2017, twenty-five generic companies sent the Company Paragraph-IV certification letters informing the Company that they had filed abbreviated new drug applications (aNDAs) seeking approval of generic versions of Eliquis . As a result, two Eliquis patents listed in the FDA Orange Book are being challenged: the composition of matter patent claiming apixaban specifically and a formulation patent. In April 2017, the Company, along with its partner Pfizer, initiated patent lawsuits under the Hatch-Waxman Act against all generic filers in federal district courts in Delaware and West Virginia. In August 2017, the United States Patent and Trademark Office granted patent term restoration to the composition of matter patent, thereby restoring the term of the Eliquis composition of matter patent, which is the Company's basis for projected LOE, from February 2023 to November 2026. The Company has settled lawsuits with several aNDA filers through February 2018. The settlements do not affect the Company's projected LOE for Eliquis .
PRICING, SALES AND PROMOTIONAL PRACTICES LITIGATION
Plavix* State Attorneys General Lawsuits
The Company and certain affiliates of Sanofi are defendants in consumer protection and/or false advertising actions brought by several states relating to the sales and promotion of Plavix* .
PRODUCT LIABILITY LITIGATION
The Company is a party to various product liability lawsuits. Plaintiffs in these cases seek damages and other relief on various grounds for alleged personal injury and economic loss. As previously disclosed, in addition to lawsuits, the Company also faces unfiled claims involving its products.
Plavix*
As previously disclosed, the Company and certain affiliates of Sanofi are defendants in a number of individual lawsuits in various state and federal courts claiming personal injury damage allegedly sustained after using Plavix* . Over 5,000 claims involving injury plaintiffs as well as claims by spouses and/or other beneficiaries, have been filed in state and federal courts in various states including California, New Jersey, Delaware and New York. In February 2013, the Judicial Panel on Multidistrict Litigation granted the Company and Sanofi's motion to establish a multi-district litigation (MDL) to coordinate Federal pretrial proceedings in Plavix* product liability and related cases in New Jersey Federal Court. Following the United States Supreme Court's June 2017 reversal of a California Supreme Court decision that had held that the California state courts can exercise personal jurisdiction over the claims of non-California residents, over 3,300 out-of-state resident plaintiffs' claims (including spouses and beneficiaries) previously pending in the California state court have been dismissed. Some number of these California non-resident plaintiffs' claims may be re-filed in federal court. After the Company filed summary judgment motions in all of the remaining cases, law firms representing a majority of the remaining cases represented to the various courts that they will withdraw from or discontinue all or most of their cases. The resolution of these remaining lawsuits is not expected to have a material impact on the Company.
Byetta*
Amylin, a former subsidiary of the Company, and Lilly are co-defendants in product liability litigation related to Byetta*. To date, there are over 500 separate lawsuits pending on behalf of approximately 2,000 active plaintiffs (including pending settlements), which include injury plaintiffs as well as claims by spouses and/or other beneficiaries, in various courts in the U.S. As previously reported, the Company has agreed to resolve certain of these claims. Most of those claims have been, or are in the process of being, dismissed. The majority of these cases have been brought by individuals who allege personal injury sustained after using Byetta* , primarily pancreatic cancer and pancreatitis, and, in some cases, claiming alleged wrongful death. The majority of cases were pending in Federal Court in San Diego in an MDL or in a coordinated proceeding in California Superior Court in Los Angeles (JCCP). In November 2015, the defendants' motion for summary judgment based on federal preemption was granted in both the MDL and the JCCP. The plaintiffs in the MDL appealed to the U.S. Court of Appeals for the Ninth Circuit. In November 2017, the Ninth Circuit reversed the MDL summary judgment order and remanded the case for further proceedings. The JCCP plaintiffs have appealed to the California Court of Appeal and their appeal remains pending. Amylin has product liability insurance covering a substantial number of claims involving Byetta* and any additional liability to Amylin with respect to Byetta* is expected to be shared between the Company and AstraZeneca.
99
Abilify*
The Company and Otsuka are co-defendants in product liability litigation related to Abilify* . Plaintiffs allege Abilify* caused them to engage in compulsive gambling and other impulse control disorders. There have been over 500 cases filed in state and federal courts and several additional cases are pending in Canada. The Judicial Panel on Multidistrict Litigation has consolidated the federal court cases for pretrial purposes in the United States District Court for the Northern District of Florida. The first MDL trial is currently scheduled to take place in June 2018.
Eliquis
The Company and Pfizer are co-defendants in product liability litigation related to Eliquis . Plaintiffs assert claims, including claims for wrongful death, as a result of bleeding they allege was caused by their use of Eliquis . The majority of these claims are pending in an MDL in the United States District Court for the Southern District of New York and in state court in Delaware. As of January 2018, there are over 160 cases pending in courts in the United States and one pending in Canada. Over 150 cases have been dismissed with prejudice by the MDL. Plaintiffs have appealed some of the dismissed cases to the Second Circuit Court of Appeals.
SHAREHOLDER DERIVATIVE LITIGATION
Since December 2015, three shareholder derivative lawsuits were filed in New York state court against certain officers and directors of the Company. The plaintiffs allege, among other things, breaches of fiduciary duty surrounding the Company's previously disclosed October 2015 civil settlement with the Securities and Exchange Commission of alleged Foreign Corrupt Practices Act violations in China in which the Company agreed to a payment of approximately $14.7 million in disgorgement, penalties and interest. As of October 2017, all three of the lawsuits have been dismissed. The Company received a notice of appeal as to one of the dismissed lawsuits.
SECURITIES LITIGATION
In February 2018, the Company became aware of a putative class action complaint, Joseph Giugno v. Bristol-Myers Squibb Co., et al. that was filed in the U.S. District for the Northern District of California against the Company, the Company's Chief Executive Officer, Giovanni Caforio, the Company's Chief Financial Officer, Charles A. Bancroft and certain former and current executives of the Company. The complaint alleges violations of securities laws for the Company's disclosures related to the CheckMate -026 clinical trial in lung cancer. The Company intends to defend itself vigorously in this litigation.
GOVERNMENT INVESTIGATIONS
Like other pharmaceutical companies, the Company and certain of its subsidiaries are subject to extensive regulation by national, state and local government agencies in the U.S. and other countries in which BMS operates. As a result, the Company, from time to time, is subject to various governmental inquiries and investigations. It is possible that criminal charges, substantial fines and/or civil penalties, could result from government investigations.
ENVIRONMENTAL PROCEEDINGS
As previously reported, the Company is a party to several environmental proceedings and other matters, and is responsible under various state, federal and foreign laws, including CERCLA, for certain costs of investigating and/or remediating contamination resulting from past industrial activity at the Company's current or former sites or at waste disposal or reprocessing facilities operated by third parties.
CERCLA Matters
With respect to CERCLA matters for which the Company is responsible under various state, federal and foreign laws, the Company typically estimates potential costs based on information obtained from the U.S. Environmental Protection Agency, or counterpart state or foreign agency and/or studies prepared by independent consultants, including the total estimated costs for the site and the expected cost-sharing, if any, with other "potentially responsible parties," and the Company accrues liabilities when they are probable and reasonably estimable. The Company estimated its share of future costs for these sites to be $62.8 million at December 31, 2017, which represents the sum of best estimates or, where no best estimate can reasonably be made, estimates of the minimal probable amount among a range of such costs (without taking into account any potential recoveries from other parties). The amount includes the estimated costs for any additional probable loss associated with the previously disclosed North Brunswick Township High School Remediation Site.
100
Note 19 . SELECTED QUARTERLY FINANCIAL DATA (UNAUDITED)
Dollars in Millions, except per share data |
| First Quarter |
| Second Quarter |
| Third Quarter |
| Fourth Quarter |
| Year | ||||||||||
2017 |
|
|
|
|
|
|
|
|
|
| ||||||||||
Total Revenues |
| $ | 4,929 | |
| $ | 5,144 | |
| $ | 5,254 | |
| $ | 5,449 | |
| $ | 20,776 | |
Gross Margin |
| 3,670 | |
| 3,582 | |
| 3,682 | |
| 3,776 | |
| 14,710 | | |||||
Net Earnings/(Loss) |
| 1,526 | |
| 922 | |
| 856 | |
| (2,329 | ) |
| 975 | | |||||
Net Earnings/(Loss) Attributable to: |
|
|
|
|
|
|
|
|
|
| ||||||||||
Noncontrolling Interest |
| (48 | ) |
| 6 | |
| 11 | |
| (1 | ) |
| (32 | ) | |||||
BMS |
| 1,574 | |
| 916 | |
| 845 | |
| (2,328 | ) |
| 1,007 | | |||||
|
|
|
|
|
|
|
|
|
|
| ||||||||||
Earnings/(Loss) per Share - Basic (a) |
| $ | 0.95 | |
| $ | 0.56 | |
| $ | 0.52 | |
| $ | (1.42 | ) |
| $ | 0.61 | |
Earnings/(Loss) per Share - Diluted (a) |
| 0.94 | |
| 0.56 | |
| 0.51 | |
| (1.42 | ) |
| 0.61 | | |||||
|
|
|
|
|
|
|
|
|
|
| ||||||||||
Cash dividends declared per common share |
| $ | 0.39 | |
| $ | 0.39 | |
| $ | 0.39 | |
| $ | 0.40 | |
| $ | 1.57 | |
|
|
|
|
|
|
|
|
|
|
| ||||||||||
Cash and cash equivalents |
| $ | 3,910 | |
| $ | 3,470 | |
| $ | 4,644 | |
| $ | 5,421 | |
| $ | 5,421 | |
Marketable securities (b) |
| 4,884 | |
| 5,615 | |
| 5,004 | |
| 3,871 | |
| 3,871 | | |||||
Total Assets |
| 32,937 | |
| 33,409 | |
| 33,977 | |
| 33,551 | |
| 33,551 | | |||||
Long-term debt (c) |
| 7,237 | |
| 6,911 | |
| 6,982 | |
| 6,975 | |
| 6,975 | | |||||
Equity |
| 14,535 | |
| 14,821 | |
| 14,914 | |
| 11,847 | |
| 11,847 | | |||||
|
|
|
|
|
|
|
|
|
|
| ||||||||||
Dollars in Millions, except per share data |
| First Quarter |
| Second Quarter |
| Third Quarter |
| Fourth Quarter |
| Year | ||||||||||
2016 |
|
|
|
|
|
|
|
|
|
| ||||||||||
Total Revenues |
| $ | 4,391 | |
| $ | 4,871 | |
| $ | 4,922 | |
| $ | 5,243 | |
| $ | 19,427 | |
Gross Margin |
| 3,339 | |
| 3,665 | |
| 3,617 | |
| 3,860 | |
| 14,481 | | |||||
Net Earnings |
| 1,206 | |
| 1,188 | |
| 1,215 | |
| 898 | |
| 4,507 | | |||||
Net Earnings Attributable to: |
|
|
|
|
|
|
|
|
|
| ||||||||||
Noncontrolling Interest |
| 11 | |
| 22 | |
| 13 | |
| 4 | |
| 50 | | |||||
BMS |
| 1,195 | |
| 1,166 | |
| 1,202 | |
| 894 | |
| 4,457 | | |||||
|
|
|
|
|
|
|
|
|
|
| ||||||||||
Earnings per Share - Basic (a) |
| $ | 0.72 | |
| $ | 0.70 | |
| $ | 0.72 | |
| $ | 0.53 | |
| $ | 2.67 | |
Earnings per Share - Diluted (a) |
| 0.71 | |
| 0.69 | |
| 0.72 | |
| 0.53 | |
| 2.65 | | |||||
|
|
|
|
|
|
|
|
|
|
| ||||||||||
Cash dividends declared per common share |
| $ | 0.38 | |
| $ | 0.38 | |
| $ | 0.38 | |
| $ | 0.39 | |
| $ | 1.53 | |
|
|
|
|
|
|
|
|
|
|
| ||||||||||
Cash and cash equivalents |
| $ | 2,644 | |
| $ | 2,934 | |
| $ | 3,432 | |
| $ | 4,237 | |
| $ | 4,237 | |
Marketable securities (b) |
| 5,352 | |
| 4,998 | |
| 5,163 | |
| 4,832 | |
| 4,832 | | |||||
Total Assets |
| 31,892 | |
| 32,831 | |
| 33,727 | |
| 33,707 | |
| 33,707 | | |||||
Long-term debt (c) |
| 6,593 | |
| 6,581 | |
| 6,585 | |
| 6,465 | |
| 6,465 | | |||||
Equity |
| 14,551 | |
| 15,078 | |
| 15,781 | |
| 16,347 | |
| 16,347 | | |||||
(a) | Earnings per share for the quarters may not add to the amounts for the year, as each period is computed on a discrete basis. |
(b) | Marketable securities includes current and non-current assets. |
(c) | Long-term debt includes the current portion. |
101
The following specified items affected the comparability of results in 2017 and 2016 :
Dollars in Millions |
| First Quarter |
| Second Quarter |
| Third Quarter |
| Fourth Quarter |
| Year | ||||||||||
Cost of products sold (a) |
| $ | - | |
| $ | 130 | |
| $ | 1 | |
| $ | 18 | |
| $ | 149 | |
|
|
|
|
|
|
|
|
|
|
| ||||||||||
Marketing, selling and administrative |
| - | |
| - | |
| - | |
| 1 | |
| 1 | | |||||
|
|
|
|
|
|
|
|
|
|
| ||||||||||
License and asset acquisition charges |
| 50 | |
| 393 | |
| 310 | |
| 377 | |
| 1,130 | | |||||
IPRD impairments |
| 75 | |
| - | |
| - | |
| - | |
| 75 | | |||||
Site exit costs and other |
| 72 | |
| 96 | |
| 64 | |
| 151 | |
| 383 | | |||||
Research and development |
| 197 | |
| 489 | |
| 374 | |
| 528 | |
| 1,588 | | |||||
|
|
|
|
|
|
|
|
|
|
| ||||||||||
Provision for restructuring |
| 164 | |
| 15 | |
| 28 | |
| 86 | |
| 293 | | |||||
Litigation and other settlements |
| (481 | ) |
| - | |
| - | |
| - | |
| (481 | ) | |||||
Divestiture gains |
| (100 | ) |
| - | |
| - | |
| (26 | ) |
| (126 | ) | |||||
Royalties and licensing income |
| - | |
| (497 | ) |
| - | |
| - | |
| (497 | ) | |||||
Pension charges |
| 33 | |
| 36 | |
| 22 | |
| 71 | |
| 162 | | |||||
Loss on debt redemption |
| - | |
| 109 | |
| - | |
| - | |
| 109 | | |||||
Other income (net) |
| (384 | ) |
| (337 | ) |
| 50 | |
| 131 | |
| (540 | ) | |||||
|
|
|
|
|
|
|
|
|
|
| ||||||||||
Increase/(decrease) to pretax income |
| (187 | ) |
| 282 | |
| 425 | |
| 678 | |
| 1,198 | | |||||
|
|
|
|
|
|
|
|
|
|
| ||||||||||
Income taxes on items above |
| 72 | |
| 20 | |
| (41 | ) |
| (138 | ) |
| (87 | ) | |||||
Income taxes attributed to U.S. tax reform |
| - | |
| - | |
| - | |
| 2,911 | |
| 2,911 | | |||||
Income taxes |
| 72 | |
| 20 | |
| (41 | ) |
| 2,773 | |
| 2,824 | | |||||
|
|
|
|
|
|
|
|
|
|
| ||||||||||
Increase/(decrease) to net earnings |
| (115 | ) |
| 302 | |
| 384 | |
| 3,451 | |
| 4,022 | | |||||
|
|
|
|
|
|
|
|
|
|
| ||||||||||
Noncontrolling interest |
| (59 | ) |
| - | |
| - | |
| - | |
| (59 | ) | |||||
|
|
|
|
|
|
|
|
|
|
| ||||||||||
Increase/(decrease) to net earnings used for Diluted Non-GAAP EPS calculation |
| $ | (174 | ) |
| $ | 302 | |
| $ | 384 | |
| $ | 3,451 | |
| $ | 3,963 | |
Dollars in Millions |
| First Quarter |
| Second Quarter |
| Third Quarter |
| Fourth Quarter |
| Year | ||||||||||
Cost of products sold (a) |
| $ | 4 | |
| $ | 4 | |
| $ | 7 | |
| $ | 6 | |
| $ | 21 | |
|
|
|
|
|
|
|
|
|
|
| ||||||||||
License and asset acquisition charges |
| 125 | |
| 139 | |
| 45 | |
| 130 | |
| 439 | | |||||
IPRD impairments |
| - | |
| - | |
| - | |
| 13 | |
| 13 | | |||||
Site exit costs and other |
| 13 | |
| 13 | |
| 14 | |
| 43 | |
| 83 | | |||||
Research and development |
| 138 | |
| 152 | |
| 59 | |
| 186 | |
| 535 | | |||||
|
|
|
|
|
|
|
|
|
|
| ||||||||||
Provision for restructuring |
| 4 | |
| 18 | |
| 19 | |
| 68 | |
| 109 | | |||||
Litigation and other settlements |
| 43 | |
| - | |
| (3 | ) |
| - | |
| 40 | | |||||
Divestiture gains |
| (269 | ) |
| (277 | ) |
| (13 | ) |
| - | |
| (559 | ) | |||||
Royalties and licensing income |
| - | |
| - | |
| - | |
| (10 | ) |
| (10 | ) | |||||
Pension charges |
| 22 | |
| 25 | |
| 19 | |
| 25 | |
| 91 | | |||||
Intangible asset impairment |
| 15 | |
| - | |
| - | |
| - | |
| 15 | | |||||
Other income (net) |
| (185 | ) |
| (234 | ) |
| 22 | |
| 83 | |
| (314 | ) | |||||
|
|
|
|
|
|
|
|
|
|
| ||||||||||
Increase/(decrease) to pretax income |
| (43 | ) |
| (78 | ) |
| 88 | |
| 275 | |
| 242 | | |||||
|
|
|
|
|
|
|
|
|
|
| ||||||||||
Income taxes |
| 83 | |
| 76 | |
| (3 | ) |
| (105 | ) |
| 51 | | |||||
|
|
|
|
|
|
|
|
|
|
| ||||||||||
Increase/(decrease) to net earnings |
| $ | 40 | |
| $ | (2 | ) |
| $ | 85 | |
| $ | 170 | |
| $ | 293 | |
(a) | Specified items in cost of products sold are accelerated depreciation, asset impairment and other shutdown costs. |
102
REPORT OF INDEPENDENT REGISTERED PUBLIC ACCOUNTING FIRM
To the shareholders and the Board of Directors of Bristol-Myers Squibb Company
Opinion on the Financial Statements
We have audited the accompanying consolidated balance sheets of Bristol-Myers Squibb Company and subsidiaries (the "Company") as of December 31, 2017 and 2016, the related consolidated statements of earnings, comprehensive income, and cash flows, for each of the three years in the period ended December 31, 2017, and the related notes (collectively referred to as the "financial statements"). In our opinion, the financial statements present fairly, in all material respects, the financial position of the Company as of December 31, 2017 and 2016, and the results of its operations and its cash flows for each of the three years in the period ended December 31, 2017, in conformity with accounting principles generally accepted in the United States of America.
We have also audited, in accordance with the standards of the Public Company Accounting Oversight Board (United States) (PCAOB), the Company's internal control over financial reporting as of December 31, 2017, based on criteria established in Internal Control - Integrated Framework (2013) issued by the Committee of Sponsoring Organizations of the Treadway Commission and our report dated February 13, 2018 expressed an unqualified opinion on the Company's internal control over financial reporting.
Basis for Opinion
These financial statements are the responsibility of the Company's management. Our responsibility is to express an opinion on the Company's financial statements based on our audits. We are a public accounting firm registered with the PCAOB and are required to be independent with respect to the Company in accordance with the U.S. federal securities laws and the applicable rules and regulations of the Securities and Exchange Commission and the PCAOB.
We conducted our audits in accordance with the standards of the PCAOB. Those standards require that we plan and perform the audit to obtain reasonable assurance about whether the financial statements are free of material misstatement, whether due to error or fraud. Our audits included performing procedures to assess the risks of material misstatement of the financial statements, whether due to error or fraud, and performing procedures that respond to those risks. Such procedures included examining, on a test basis, evidence regarding the amounts and disclosures in the financial statements. Our audits also included evaluating the accounting principles used and significant estimates made by management, as well as evaluating the overall presentation of the financial statements. We believe that our audits provide a reasonable basis for our opinion.
/s/ DELOITTE & TOUCHE LLP
Parsippany, New Jersey
February 13, 2018
We have served as the Company's auditor since 2006.
103
Item 9. | CHANGES IN AND DISAGREEMENTS WITH ACCOUNTANTS ON ACCOUNTING AND FINANCIAL DISCLOSURE. |
None.
Item 9A. | CONTROLS AND PROCEDURES. |
Evaluation of Disclosure Controls and Procedures
As of December 31, 2017 , management carried out an evaluation, under the supervision and with the participation of its chief executive officer and chief financial officer, of the effectiveness of the design and operation of its disclosure controls and procedures as such term is defined under Exchange Act Rule 13a-15(e). Based on this evaluation, management has concluded that as of December 31, 2017 , such disclosure controls and procedures were effective.
Management's Report on Internal Control Over Financial Reporting
Management is responsible for establishing and maintaining adequate internal control over financial reporting. Under the supervision and with the participation of management, including the chief executive officer and chief financial officer, management assessed the effectiveness of internal control over financial reporting as of December 31, 2017 based on the framework in "Internal Control-Integrated Framework" (2013) issued by the Committee of Sponsoring Organizations of the Treadway Commission. Based on that assessment, management has concluded that the Company's internal control over financial reporting was effective at December 31, 2017 to provide reasonable assurance regarding the reliability of its financial reporting and the preparation of its financial statements for external purposes in accordance with United States generally accepted accounting principles. Due to its inherent limitations, internal control over financial reporting may not prevent or detect misstatements. Also, projections of any evaluation of effectiveness to future periods are subject to the risk that controls may become inadequate because of changes in conditions, or that the degree of compliance with the policies or procedures may deteriorate.
Deloitte & Touche LLP, an independent registered public accounting firm, has audited the Company's financial statements included in this report on Form 10-K and issued its report on the effectiveness of the Company's internal control over financial reporting as of December 31, 2017 , which is included herein.
Changes in Internal Control Over Financial Reporting
There were no changes in the Company's internal control over financial reporting during the quarter ended December 31, 2017 that have materially affected, or are reasonable likely to materially affect, the Company's internal control over financial reporting.
Item 9B. | OTHER INFORMATION. |
None.
104
REPORT OF INDEPENDENT REGISTERED PUBLIC ACCOUNTING FIRM
To the shareholders and the Board of Directors of Bristol-Myers Squibb Company
Opinion on Internal Control over Financial Reporting
We have audited the internal control over financial reporting of Bristol-Myers Squibb and subsidiaries (the "Company") as of December 31, 2017, based on criteria established in Internal Control - Integrated Framework (2013) issued by the Committee of Sponsoring Organizations of the Treadway Commission (COSO). In our opinion, the Company maintained, in all material respects, effective internal control over financial reporting as of December 31, 2017, based on criteria established in Internal Control - Integrated Framework (2013) issued by COSO.
We have also audited, in accordance with the standards of the Public Company Accounting Oversight Board (United States) (PCAOB), the consolidated financial statements as of and for the year ended December 31, 2017, of the Company and our report dated February 13, 2018, expressed an unqualified opinion on those consolidated financial statements.
Basis for Opinion
The Company's management is responsible for maintaining effective internal control over financial reporting and for its assessment of the effectiveness of internal control over financial reporting, included in the accompanying Management's Report on Internal Control Over Financial Reporting. Our responsibility is to express an opinion on the Company's internal control over financial reporting based on our audit. We are a public accounting firm registered with the PCAOB and are required to be independent with respect to the Company in accordance with the U.S. federal securities laws and the applicable rules and regulations of the Securities and Exchange Commission and the PCAOB.
We conducted our audit in accordance with the standards of the PCAOB. Those standards require that we plan and perform the audit to obtain reasonable assurance about whether effective internal control over financial reporting was maintained in all material respects. Our audit included obtaining an understanding of internal control over financial reporting, assessing the risk that a material weakness exists, testing and evaluating the design and operating effectiveness of internal control based on the assessed risk, and performing such other procedures as we considered necessary in the circumstances. We believe that our audit provides a reasonable basis for our opinion.
Definition and Limitations of Internal Control over Financial Reporting
A company's internal control over financial reporting is a process designed to provide reasonable assurance regarding the reliability of financial reporting and the preparation of financial statements for external purposes in accordance with generally accepted accounting principles. A company's internal control over financial reporting includes those policies and procedures that (1) pertain to the maintenance of records that, in reasonable detail, accurately and fairly reflect the transactions and dispositions of the assets of the company; (2) provide reasonable assurance that transactions are recorded as necessary to permit preparation of financial statements in accordance with generally accepted accounting principles, and that receipts and expenditures of the company are being made only in accordance with authorizations of management and directors of the company; and (3) provide reasonable assurance regarding prevention or timely detection of unauthorized acquisition, use, or disposition of the company's assets that could have a material effect on the financial statements.
Because of its inherent limitations, internal control over financial reporting may not prevent or detect misstatements. Also, projections of any evaluation of effectiveness to future periods are subject to the risk that controls may become inadequate because of changes in conditions, or that the degree of compliance with the policies or procedures may deteriorate.
/s/ DELOITTE & TOUCHE LLP
Parsippany, New Jersey
February 13, 2018
105
PART III
Item 10. | DIRECTORS AND EXECUTIVE OFFICERS OF THE REGISTRANT. |
(a) | Reference is made to the 2018 Proxy Statement to be filed on or about March 22, 2018 with respect to the Directors of the Registrant, which is incorporated herein by reference and made a part hereof in response to the information required by Item 10. |
(b) | The information required by Item 10 with respect to the Executive Officers of the Registrant has been included in Part IA of this Form 10-K in reliance on General Instruction G of Form 10-K and Instruction 3 to Item 401(b) of Regulation S-K. |
Item 11. | EXECUTIVE COMPENSATION. |
Reference is made to the 2018 Proxy Statement to be filed on or about March 22, 2018 with respect to Executive Compensation, which is incorporated herein by reference and made a part hereof in response to the information required by Item 11.
Item 12. | SECURITY OWNERSHIP OF CERTAIN BENEFICIAL OWNERS AND MANAGEMENT AND RELATED STOCKHOLDER MATTERS. |
Reference is made to the 2018 Proxy Statement to be filed on or about March 22, 2018 with respect to the security ownership of certain beneficial owners and management, which is incorporated herein by reference and made a part hereof in response to the information required by Item 12.
Item 13. | CERTAIN RELATIONSHIPS AND RELATED TRANSACTIONS. |
Reference is made to the 2018 Proxy Statement to be filed on or about March 22, 2018 with respect to certain relationships and related transactions, which is incorporated herein by reference and made a part hereof in response to the information required by Item 13.
Item 14. | AUDITOR FEES. |
Reference is made to the 2018 Proxy Statement to be filed on or about March 22, 2018 with respect to auditor fees, which is incorporated herein by reference and made a part hereof in response to the information required by Item 14.
PART IV
Item 15. | EXHIBITS and FINANCIAL STATEMENT SCHEDULE. |
(a) | |
|
|
|
|
| Page Number |
1. | Consolidated Financial Statements |
|
| Consolidated Statements of Earnings and Comprehensive Income | 57 |
| Consolidated Balance Sheets | 58 |
| Consolidated Statements of Cash Flows | 59 |
| Notes to Consolidated Financial Statements | 60 |
| Report of Independent Registered Public Accounting Firm | 103 |
|
|
|
All other schedules not included with this additional financial data are omitted because they are not applicable or the required information is included in the financial statements or notes thereto. | ||
|
|
|
2. | Exhibits Required to be filed by Item 601 of Regulation S-K | 109 |
The information called for by this Item is incorporated herein by reference to the Exhibit Index in this Form 10-K.
Item 16. | FORM 10-K SUMMARY. |
None.
106
SIGNATURES
Pursuant to the requirements of Section 13 or 15 (d) of the Securities Exchange Act of 1934, the Registrant has duly caused this Report to be signed on its behalf by the undersigned, thereunto duly authorized.
BRISTOL-MYERS SQUIBB COMPANY (Registrant) | ||
|
| |
By |
| /s/ GIOVANNI CAFORIO |
|
| Giovanni Caforio |
|
| Chairman of the Board and Chief Executive Officer |
| ||
Date: February 13, 2018 | ||
Pursuant to the requirements of the Securities Exchange Act of 1934, this Report has been signed below by the following persons on behalf of the Registrant and in the capacities and on the dates indicated.
Signature |
| Title |
| Date |
|
|
|
|
|
/s/ GIOVANNI CAFORIO, M.D. |
| Chairman of the Board and Chief Executive Officer |
| February 13, 2018 |
(Giovanni Caforio, M.D.) |
| (Principal Executive Officer) |
|
|
|
|
|
|
|
/s/ CHARLES BANCROFT |
| Chief Financial Officer |
| February 13, 2018 |
(Charles Bancroft) |
| (Principal Financial Officer) |
|
|
|
|
|
|
|
/s/ JOSEPH C. CALDARELLA |
| Senior Vice President and Corporate Controller |
| February 13, 2018 |
(Joseph C. Caldarella) |
| (Principal Accounting Officer) |
|
|
|
|
|
|
|
/s/ PETER J. ARDUINI |
| Director |
| February 13, 2018 |
(Peter J. Arduini) |
|
|
|
|
|
|
|
|
|
/s/ ROBERT J. BERTOLINI |
| Director |
| February 13, 2018 |
(Robert J. Bertolini) |
|
|
|
|
|
|
|
|
|
/s/ MATTHEW W. EMMENS |
| Director |
| February 13, 2018 |
(Matthew W. Emmens) |
|
|
|
|
|
|
|
|
|
/s/ MICHAEL GROBSTEIN |
| Director |
| February 13, 2018 |
(Michael Grobstein) |
|
|
|
|
|
|
|
|
|
/s/ ALAN J. LACY |
| Director |
| February 13, 2018 |
(Alan J. Lacy) |
|
|
|
|
|
|
|
|
|
/s/ DINESH C. PALIWAL |
| Director |
| February 13, 2018 |
(Dinesh C. Paliwal) |
|
|
|
|
|
|
|
|
|
/s/ THEODORE R. SAMUELS |
| Director |
| February 13, 2018 |
(Theodore R. Samuels) |
|
|
|
|
|
|
|
|
|
/s/ VICKI L. SATO, PH.D. |
| Director |
| February 13, 2018 |
(Vicki L. Sato, Ph.D.) |
|
|
|
|
|
|
|
|
|
/s/ GERALD L. STORCH |
| Director |
| February 13, 2018 |
(Gerald L. Storch) |
|
|
|
|
|
|
|
|
|
/s/ KAREN H. VOUSDEN, PH.D. |
| Director |
| February 13, 2018 |
(Karen H. Vousden, Ph.D.) |
|
|
|
|
107
SUMMARY OF ABBREVIATED TERMS
Bristol-Myers Squibb Company may be referred to as Bristol-Myers Squibb, BMS, the Company, we, our or us in this 2017 Form 10-K. Throughout this 2017 Form 10-K we have used terms which are defined below:
2017 Form 10-K | Annual Report on Form 10-K for the fiscal year ended December 31, 2017 | LIBOR | London Interbank Offered Rate |
AbbVie | AbbVie Inc. | Lilly | Eli Lilly and Company |
ALL | acute lymphoblastic leukemia | LOE | loss of exclusivity |
Amira | Amira Pharmaceuticals, Inc. | MAA | Marketing Authorization Application |
Amylin | Amylin Pharmaceuticals, Inc. | MCOs | Managed Care Organizations |
aNDA | abbreviated New Drug Application | mCRC | metastatic colorectal cancer |
API | active pharmaceutical ingredient | MDL | multi-district litigation |
ASEAN | Association of Southeast Asian Nations | Mead Johnson | Mead Johnson Nutrition Company |
AstraZeneca | AstraZeneca PLC | Merck | Merck & Co., Inc. |
auto-HSCT | autologous hematopoietic stem cell transplantation | MF | myelofibrosis |
Biogen | Biogen, Inc. | MPM | malignant pleural mesothelioma |
BLA | Biologics License Application | MSI-H | high microsatellite instability |
Cardioxyl | Cardioxyl Pharmaceuticals, Inc. | mUC | metastatic urothelial carcinoma |
CERCLA | U.S. Comprehensive Environmental Response, Compensation and Liability Act | NAV | net asset value |
cGMP | current Good Manufacturing Practices | NDA | New Drug Application |
cHL | classical Hodgkin lymphoma | Nitto Denko | Nitto Denko Corporation |
CHMP | Committee for Medicinal Products for Human Use | NKT | natural killer T cells |
CML | chronic myeloid leukemia | Novartis | Novartis Pharmaceutical Corporation |
Cormorant | Cormorant Pharmaceuticals | NSCLC | non-small cell lung cancer |
CPPIB | CPPIB Credit Europe S.A.R.L., a Luxembourg private limited liability company | NVAF | nonvalvular atrial fibrillation |
CSF1R | colony stimulating factor 1 receptor | OCI | Other Comprehensive Income |
CytomX | CytomX Therapeutics, Inc. | OIG | Office of Inspector General of the U.S. Dept. of Health and Human Services |
dMMR | DNA mismatch repair deficient | Ono | Ono Pharmaceutical Co., Ltd. |
DSA | Distribution Services Agreement | OTC | Over-the-counter |
EC | European Commission | Otsuka | Otsuka Pharmaceutical Co., Ltd. |
EMA | European Medicines Agency | PAD | Protein/Peptidyl Arginine Deiminase |
EPO | European Patent Office | Padlock | Padlock Therapeutics, Inc. |
EPS | earnings per share | PBMs | Pharmacy Benefit Managers |
ERISA | Employee Retirement Income Security Act of 1974 | PD-1 | programmed death receptor-1 |
EU | European Union | PDMA | Prescription Drug Marketing Act |
FASB | Financial Accounting Standards Board | Pfizer | Pfizer, Inc. |
FCPA | Foreign Corrupt Practices Act | PHRMA Code | Pharmaceutical Research and Manufacturers of America's Professional Practices Code |
FDA | U.S. Food and Drug Administration | Promedior | Promedior, Inc. |
Five Prime | Five Prime Therapeutics, Inc. | PRP | potentially responsible party |
Flexus | Flexus Biosciences, Inc. | PSA | prostate-specific antigen |
F-Star | F-Star Alpha Ltd. | PsiOxus | PsiOxus Therapeutics, Ltd. |
GAAP | U.S. generally accepted accounting principles | PVNS | pigmented vilonodular synovitis |
GBM | glioblastoma multiforme | R&D | Research and Development |
GDD | Genetically Defined Diseases | RA | rheumatoid arthritis |
Gilead | Gilead Sciences, Inc. | RCC | renal cell carcinoma |
GTN | gross-to-net | RDP | regulatory data protection |
Halozyme | Halozyme Therapeutics, Inc. | Reckitt | Reckitt Benckiser Group plc |
HCC | Hepatocellular carcinoma | Roche | Roche Holding AG |
HCV | hepatitis C virus | Sanofi | Sanofi S.A. |
HIV | human immunodeficiency virus | sBLA | supplemental Biologics License Application |
HNC | head and neck cancer | SCCHN | squamous cell carcinoma of the head and neck |
HPV | human papillomavirus | SCLC | small cell lung cancer |
HR 3590 | The Patient Protection and Affordable Care Act | SEC | U.S. Securities and Exchange Commission |
IFM | IFM Therapeutics, Inc. | SK Biotek | SK Biotek Co., Ltd. |
ImClone | ImClone Systems Incorporated | the 2012 Plan | The 2012 Stock Award and Incentive Plan |
IO | Immuno-Oncology | U.S. | United States |
IPF | idiopathic pulmonary fibrosis | UK | United Kingdom |
iPierian | iPierian, Inc. | Valeant | Valeant Pharmaceuticals International, Inc. |
IPRD | in-process research and development | VTE | venous thromboembolic |
JIA | Juvenile Idiopathic Arthritis | WTO | World Trade Organization |
108
EXHIBIT INDEX
The Exhibits listed below are identified by numbers corresponding to the Exhibit Table of Item 601 of Regulation S-K. The Exhibits designated by the symbol ‡‡ are management contracts or compensatory plans or arrangements required to be filed pursuant to Item 15. The symbol ‡ in the Page column indicates that the Exhibit has been previously filed with the Commission and is incorporated herein by reference. Unless otherwise indicated, all Exhibits are part of Commission File Number 1-1136.
Exhibit No. |
| Description |
| Page No |
3a. |
| Amended and Restated Certificate of Incorporation of Bristol-Myers Squibb Company (incorporated herein by reference to Exhibit 3a to the Form 10-Q for the quarterly period ended June 30, 2005). |
| ‡ |
|
|
|
|
|
3b. |
| Certificate of Correction to the Amended and Restated Certificate of Incorporation, effective as of December 24, 2009 (incorporated herein by reference to Exhibit 3b to the Form 10-K for the fiscal year ended December 31, 2010). |
| ‡ |
|
|
|
|
|
3c. |
| Certificate of Amendment to the Amended and Restated Certificate of Incorporation, effective as of May 7, 2010 (incorporated herein by reference to Exhibit 3a to the Form 8-K dated May 4, 2010 and filed on May 10, 2010). |
| ‡ |
|
|
|
|
|
3d. |
| Certificate of Amendment to the Amended and Restated Certificate of Incorporation, effective as of May 7, 2010 (incorporated herein by reference to Exhibit 3b to the Form 8-K dated May 4, 2010 and filed on May 10, 2010). |
| ‡ |
|
|
|
|
|
3e. |
| Bylaws of Bristol-Myers Squibb Company, as amended as of November 2, 2016 (incorporated herein by reference to Exhibit 3.1 to the Form 8-K dated November 2, 2016 and filed November 4, 2016). |
| ‡ |
|
|
|
|
|
4a. |
| Letter of Agreement dated March 28, 1984 (incorporated herein by reference to Exhibit 4 to the Form 10-K for the fiscal year ended December 31, 1983). |
| ‡ |
|
|
|
|
|
4b. |
| Indenture, dated as of June 1, 1993, between Bristol-Myers Squibb Company and JPMorgan Chase Bank (as successor trustee to The Chase Manhattan Bank (National Association)) (incorporated herein by reference to Exhibit 4.1 to the Form 8-K dated May 27, 1993 and filed on June 3, 1993). |
| ‡ |
|
|
|
|
|
4c. |
| Form of 7.15% Debenture due 2023 of Bristol-Myers Squibb Company (incorporated herein by reference to Exhibit 4.2 to the Form 8-K dated May 27, 1993 and filed on June 3, 1993). |
| ‡ |
|
|
|
|
|
4d. |
| Form of 6.80% Debenture due 2026 of Bristol-Myers Squibb Company (incorporated herein by reference to Exhibit 4e to the Form 10-K for the fiscal year ended December 31, 1996). |
| ‡ |
|
|
|
|
|
4e. |
| Form of 6.875% Debenture due 2097 of Bristol-Myers Squibb Company (incorporated herein by reference to Exhibit 4f to the Form 10-Q for the quarterly period ended September 30, 1997). |
| ‡ |
|
|
|
|
|
4f. |
| Indenture, dated October 1, 2003, between Bristol-Myers Squibb Company, as Issuer, and JPMorgan Chase Bank, as Trustee (incorporated herein by reference to Exhibit 4q to the Form 10-Q for the quarterly period ended September 30, 2003). |
| ‡ |
|
|
|
|
|
4g. |
| Form of Floating Rate Convertible Senior Debenture due 2023 (incorporated herein by reference to Exhibit 4s to the Form 10-Q for the quarterly period ended September 30, 2003). |
| ‡ |
|
|
|
|
|
4h. |
| Specimen Certificate of Common Stock (incorporated herein by reference to Exhibit 4s to the Form 10-K for the fiscal year ended December 31, 2003). |
| ‡ |
|
|
|
|
|
4i. |
| Form of Fourth Supplemental Indenture between Bristol-Myers Squibb Company and The Bank of New York, as Trustee, to the indenture dated June 1, 1993 (incorporated herein by reference to Exhibit 4r to the Form 8-K dated November 20, 2006 and filed on November 27, 2006). |
| ‡ |
|
|
|
|
|
4j. |
| Form of 5.875% Notes due 2036 (incorporated herein by reference to Exhibit 4s to the Form 8-K dated November 20, 2006 and filed November 27, 2006). |
| ‡ |
|
|
|
|
|
4k. |
| Form of 4.625% Notes due 2021 (incorporated herein by reference to Exhibit 4u to the Form 8-K dated November 20, 2006 and filed November 27, 2006). |
| ‡ |
|
|
|
|
|
4l. |
| Form of Fifth Supplemental Indenture between Bristol-Myers Squibb Company and The Bank of New York, as Trustee, to the indenture dated June 1, 1993 (incorporated herein by reference to Exhibit 4.1 to the Form 8-K dated May 1, 2008 and filed on May 7, 2008). |
| ‡ |
|
|
|
|
|
4m. |
| Form of 6.125% Notes due 2038 (incorporated herein by reference to Exhibit 4.3 to the Form 8-K dated May 1, 2008 and filed on May 7, 2008). |
| ‡ |
109
|
|
|
|
|
4n. |
| Form of Sixth Supplemental Indenture between Bristol-Myers Squibb Company and The Bank of New York, as Trustee, to the indenture dated June 1, 1993 (incorporated herein by reference to Exhibit 4.1 to the Form 8-K dated July 26, 2012 and filed on July 31, 2012). |
| ‡ |
|
|
|
|
|
4o. |
| Form of 2.000% Notes Due 2022 (incorporated herein by reference to Exhibit 4.3 to the Form 8-K dated July 26, 2012 and filed on July 31, 2012). |
| ‡ |
|
|
|
|
|
4p. |
| Form of 3.250% Notes Due 2042 (incorporated herein by reference to Exhibit 4.4 to the Form 8-K dated July 26, 2012 and filed on July 31, 2012). |
| ‡ |
|
|
|
|
|
4q. |
| Seventh Supplemental Indenture, dated as of October 31, 2013, between Bristol-Myers Squibb Company and The Bank of New York Mellon, as Trustee to the Indenture dated as of June 1, 1993 (incorporated herein by reference to Exhibit 4.1 to the Form 8-K dated and filed on October 31, 2013). |
| ‡ |
|
|
|
|
|
4r. |
| Form of 1.750% Notes Due 2019 (incorporated herein by reference to Exhibit 4.1 to the Form 8-K dated and filed on October 31, 2013). |
| ‡ |
|
|
|
|
|
4s. |
| Form of 3.250% Notes Due 2023 (incorporated herein by reference to Exhibit 4.1 to the Form 8-K dated and filed on October 31, 2013). |
| ‡ |
|
|
|
|
|
4t. |
| Form of 4.500% Notes Due 2044 (incorporated herein by reference to Exhibit 4.1 to the Form 8-K dated and filed on October 31, 2013). |
| ‡ |
|
|
|
|
|
4u. |
| Eighth Supplemental Indenture, dated as of May 5, 2015, between Bristol-Myers Squibb Company and The Bank of New York Mellon, as Trustee, to the Indenture dated as of June 1, 1993 (incorporated herein by reference to Exhibit 4.1 to the Form 8-K dated and filed on May 5, 2015). |
| ‡ |
|
|
|
|
|
4v. |
| Form of €575,000,000 1.000% Notes Due 2025 (incorporated herein by reference to Exhibit 4.2 to the Form 8-K dated and filed on May 5, 2015). |
| ‡ |
|
|
|
|
|
4w. |
| Form of €575,000,000 1.750% Notes Due 2035 (incorporated herein by reference to Exhibit 4.3 to the Form 8-K dated and filed on May 5, 2015). |
| ‡ |
|
|
|
|
|
10a. |
| $1,500,000,000 Five Year Competitive Advance and Revolving Credit Facility Agreement dated as of September 29, 2011 among Bristol-Myers Squibb Company, the borrowing subsidiaries, the lenders named in the agreement, BNP Paribas and The Royal Bank of Scotland plc, as documentation agents, Bank of America N.A., as syndication agent, and JPMorgan Chase Bank, N.A. and Citibank, N.A., as administrative agents (incorporated herein by reference to Exhibit 10.1 to the Form 8-K dated September 29, 2011 and filed on October 4, 2011). |
| ‡ |
|
|
|
|
|
10b. |
| First Amendment dated June 21, 2013 to the Five Year Competitive Advance and Revolving Credit Facility Agreement dated as of September 29, 2011 among Bristol-Myers Squibb Company, the several financial institutions from time to time party to the agreement, and JPMorgan Chase Bank, N.A. and Citibank N.A. as administrative agents (incorporated herein by reference to Exhibit 10a to the Form 10-Q for the quarterly period ended June 30, 2013). |
| ‡ |
|
|
|
|
|
10c. |
| $1,500,000,000 Five Year Competitive Advance and Revolving Credit Facility Agreement dated as of July 30, 2012 among Bristol-Myers Squibb Company, the borrowing subsidiaries, the lenders named in the agreement, Bank of America N.A., Barclays Bank plc, Deutsche Bank Securities Inc., and Wells Fargo Bank, National Association as documentation agents, Citibank, N.A. and JPMorgan Chase Bank, N.A., as administrative agents (incorporated herein by reference to Exhibit 10.1 to the Form 8-K dated July 26, 2012 and filed on July 31, 2012). |
| ‡ |
|
|
|
|
|
10d. |
| Amendment and Waiver dated as of June 21, 2016, to the Five Year Competitive Advance and Revolving Credit Facility Agreement dated as of September 29, 2011 among Bristol-Myers Squibb Company, the several financial institutions from time to time party to the agreement, and JPMorgan Chase Bank, N.A. and Citibank N.A. as administrative agents (incorporated herein by reference to Exhibit 10a to the Form 10-Q for the quarterly period ended June 30, 2016). |
| ‡ |
|
|
|
|
|
10e. |
| Amendment dated as of June 21, 2016, to the Five Year Competitive Advance and Revolving Credit Facility Agreement dated as of July 30, 2012 among Bristol-Myers Squibb Company, the several financial institutions from time to time party to the agreement, and JPMorgan Chase Bank, N.A. and Citibank N.A. as administrative agents (incorporated herein by reference to Exhibit 10b to the Form 10-Q for the quarterly period ended June 30, 2016). |
| ‡ |
|
|
|
|
|
10f. |
| Amendment and Waiver dated as of June 26, 2017, to the Five Year Competitive Advance and Revolving Credit Facility Agreement dated as of September 29, 2011 among Bristol-Myers Squibb Company, the several financial institutions from time to time party to the agreement, and JPMorgan Chase Bank, N.A. and Citibank N.A. as administrative agents (incorporated herein by reference to Exhibit 10a to the Form 10-Q for the quarterly period ended June 30, 2017) |
| ‡ |
|
|
|
|
|
110
10g. |
| Amendment dated as of June 26, 2017, to the Five Year Competitive Advance and Revolving Credit Facility Agreement dated as of July 30, 2012 among Bristol-Myers Squibb Company, the several financial institutions from time to time party to the agreement, and JPMorgan Chase Bank, N.A. and Citibank N.A. as administrative agents (incorporated herein by reference to Exhibit 10b to the Form 10-Q for the quarterly period ended June 30, 2017) |
| ‡ |
|
|
|
|
|
10h. |
| SEC Consent Order (incorporated herein by reference to Exhibit 10s to the Form 10-Q for the quarterly period ended September 30, 2004). |
| ‡ |
|
|
|
|
|
10i. |
| Master Restructuring Agreement between Bristol-Myers Squibb Company and Sanofi dated as of September 27, 2012 (incorporated by reference herein to Exhibit 10a to the Form 10-Q for the quarterly period ended September 30, 2012). † |
| ‡ |
|
|
|
|
|
10j. |
| Side Letter to Master Restructuring Agreement between Bristol-Myers Squibb Company and Sanofi dated as of January 1, 2013 (incorporated herein by reference to Exhibit 10p to the Form 10-K for the fiscal year ended December 31, 2012). † |
| ‡ |
|
|
|
|
|
10k. |
| Restated Development and Commercialization Collaboration Agreement between Otsuka Pharmaceutical Co., Ltd. and Bristol-Myers Squibb Company dated as of October 23, 2001 (incorporated by reference herein to Exhibit 10.12 to the Form 8-K filed on August 17, 2009).† |
| ‡ |
|
|
|
|
|
10l. |
| Amendment No. 3 to the Restated Development and Commercialization Collaboration Agreement between Otsuka Pharmaceutical Co., Ltd. and Bristol-Myers Squibb Company dated as of September 25, 2006 (incorporated by reference herein to Exhibit 10.13 to the Form 8-K filed on August 17, 2009).† |
| ‡ |
|
|
|
|
|
10m. |
| Amendment No. 5 to the Restated Development and Commercialization Collaboration Agreement between Otsuka Pharmaceutical Co., Ltd. and Bristol-Myers Squibb Company effective as of April 4, 2009 (incorporated by reference herein to Exhibit 10.14 to the Form 8-K filed on August 17, 2009).† |
| ‡ |
|
|
|
|
|
10n. |
| Amendment No. 9 to the Restated Development and Commercialization Collaboration Agreement between Otsuka Pharmaceutical Co., Ltd. and Bristol-Myers Squibb Company effective as of October 29, 2012 (incorporated herein by reference to Exhibit 10ee to the Form 10-K for the fiscal year ended December 31, 2012). † |
| ‡ |
|
|
|
|
|
10o. |
| Amended and Restated Co-Development and Co-Promotion Agreement (Apixaban) by and between Bristol-Myers Squibb Company and Pfizer, Inc. dated April 26, 2007 as amended and restated as of August 23, 2007 (incorporated herein by reference to Exhibit 10c to the Form 10-Q for the quarterly period ended June 30, 2016).† |
| ‡ |
|
|
|
|
|
10p. |
| Second Amendment to Amended and Restated Co-Development and Co-Promotion Agreement (Apixaban) by and between Bristol-Myers Squibb Company and Pfizer, Inc. dated as of March 15, 2012 (incorporated herein by reference to Exhibit 10d to the Form 10-Q for the quarterly period ended June 30, 2016).† |
| ‡ |
|
|
|
|
|
10q. |
| Fourth Amendment to Amended and Restated Co-Development and Co-Promotion Agreement (Apixaban) by and between Bristol-Myers Squibb Company and Pfizer, Inc. dated as of May 18, 2015 (incorporated herein by reference to Exhibit 10e to the Form 10-Q for the quarterly period ended June 30, 2016).† |
| ‡ |
|
|
|
|
|
‡‡10r. |
| Bristol-Myers Squibb Company 2002 Stock Incentive Plan, effective as of May 7, 2002 and as amended effective June 10, 2008 (incorporated herein by reference to Exhibit 10.1 to the Form 10-Q for the quarterly period ended September 30, 2008). |
| ‡ |
|
|
|
|
|
‡‡10s. |
| Bristol-Myers Squibb Company 2012 Stock Award and Incentive Plan, effective as of May 1, 2012 (incorporated herein by reference to Exhibit B to the 2012 Proxy Statement dated March 20, 2012). |
| ‡ |
|
|
|
|
|
‡‡10t. |
| Bristol-Myers Squibb Company 2007 Stock Award and Incentive Plan, effective as of May 1, 2007 and as amended effective June 10, 2008 (incorporated herein by reference to Exhibit 10.2 to the Form 10-Q for the quarterly period ended September 30, 2008). |
| ‡ |
|
|
|
|
|
‡‡10u. |
| Bristol-Myers Squibb Company TeamShare Stock Option Plan, as amended and restated effective September 10, 2002 (incorporated herein by reference to Exhibit 10c to the Form 10-K for the fiscal year ended December 31, 2002). |
| ‡ |
|
|
|
|
|
‡‡10v. |
| Form of Non-Qualified Stock Option Agreement under the 2002 Stock Award and Incentive Plan (incorporated herein by reference to Exhibit 10s to the Form 10-K for the fiscal year ended December 31, 2005). |
| ‡ |
|
|
|
|
|
|
|
|
|
|
‡‡10w. |
| Form of 2015-2017 Performance Share Units Agreement under the 2012 Stock Award and Incentive Plan (incorporated by reference to Exhibit 10x to the Form 10-K for the fiscal year ended December 31, 2014). |
| ‡ |
|
|
|
|
|
‡‡10x. |
| Form of 2016-2018 Performance Share Units Agreement under the 2012 Stock Award and Incentive Plan (incorporated by reference to Exhibit 10y to the Form 10-K for the fiscal year ended December 31, 2015). |
| ‡ |
|
|
|
|
|
111
‡‡10y. |
| Form of 2017-2019 Performance Share Units Agreement under the 2012 Stock Award and Incentive Plan (incorporated by reference to Exhibit 10ee to the Form 10-K for the fiscal year ended December 31, 2016). |
| ‡ |
|
|
|
|
|
‡‡10z. |
| Form of 2018-2020 Performance Share Units Agreement under the 2012 Stock Award and Incentive Plan (filed herewith). |
| E-10-1 |
|
|
|
|
|
‡‡10aa. |
| Form of Restricted Stock Units Agreement with five year vesting under the 2012 Stock Award and Incentive Plan (filed herewith). |
| E-10-2 |
|
|
|
|
|
‡‡10bb. |
| Form of Restricted Stock Units Agreement with four year vesting under the 2012 Stock Award and Incentive Plan (filed herewith). |
| E-10-3 |
|
|
|
|
|
‡‡10cc. |
| Form of Market Share Units Agreement under the 2012 Stock Award and Incentive Plan (filed herewith). |
| E-10-4 |
|
|
|
|
|
‡‡10dd. |
| Bristol-Myers Squibb Company Performance Incentive Plan, as amended (as adopted, incorporated herein by reference to Exhibit 2 to the Form 10-K for the fiscal year ended December 31, 1978; as amended as of January 8, 1990, incorporated herein by reference to Exhibit 19b to the Form 10-K for the fiscal year ended December 31, 1990; as amended on April 2, 1991, incorporated herein by reference to Exhibit 19b to the Form 10-K for the fiscal year ended December 31, 1991; as amended effective January 1, 1994, incorporated herein by reference to Exhibit 10d to the Form 10-K for the fiscal year ended December 31, 1993; and as amended effective January 1, 1994, incorporated herein by reference to Exhibit 10d to the Form 10-K for the fiscal year ended December 31, 1994). |
| ‡ |
|
|
|
|
|
‡‡10ee. |
| Bristol-Myers Squibb Company Executive Performance Incentive Plan effective January 1, 1997 (incorporated herein by reference to Exhibit 10b to the Form 10-K for the fiscal year ended December 31, 1996). |
| ‡ |
|
|
|
|
|
‡‡10ff. |
| Bristol-Myers Squibb Company Executive Performance Incentive Plan effective January 1, 2003 and as amended effective June 10, 2008 (incorporated herein by reference to Exhibit 10.3 to the Form 10-Q for the quarterly period ended September 30, 2008). |
| ‡ |
|
|
|
|
|
‡‡10gg. |
| Bristol-Myers Squibb Company 2007 Senior Executive Performance Incentive Plan (as amended and restated effective June 8, 2010 and incorporated herein by reference to Exhibit 10a. to the Form 10-Q for the quarterly period ended June 30, 2010). |
| ‡ |
|
|
|
|
|
‡‡10hh. |
| Bristol-Myers Squibb Company Benefit Equalization Plan – Retirement Income Plan, as amended and restated effective as of January 1, 2012, (incorporated herein by reference to Exhibit 10ww to the Form 10-K for the fiscal year ended December 31, 2012). |
| ‡ |
|
|
|
|
|
‡‡10ii. |
| Bristol-Myers Squibb Company Benefit Equalization Plan – Savings and Investment Program, as amended and restated effective as of January 1, 2012 (incorporated herein by reference to Exhibit 10xx to the Form 10-K for the fiscal year ended December 31, 2012). |
| ‡ |
|
|
|
|
|
‡‡10jj. |
| Squibb Corporation Supplementary Pension Plan, as amended (as previously amended and restated, incorporated herein by reference to Exhibit 19g to the Form 10-K for the fiscal year ended December 31, 1991; as amended as of September 14, 1993, and incorporated herein by reference to Exhibit 10g to the Form 10-K for the fiscal year ended December 31, 1993). |
| ‡ |
|
|
|
|
|
‡‡10kk. |
| Senior Executive Severance Plan, effective as of April 26, 2007 and as amended effective February 16, 2012 (incorporated by reference to Exhibit 10ll to the Form 10-K for the fiscal year ended December 31, 2011). |
| ‡ |
|
|
|
|
|
‡‡10ll. |
| Form of Agreement entered into between the Registrant and each of the named executive officers and certain other executives effective January 1, 2016 (incorporated by reference to Exhibit 10kk to the Form 10-K for the fiscal year ended December 31, 2015). |
| ‡ |
|
|
|
|
|
‡‡10mm. |
| Bristol-Myers Squibb Company Retirement Income Plan for Non-Employee Directors, as amended March 5, 1996 (incorporated herein by reference to Exhibit 10k to the Form 10-K for the fiscal year ended December 31, 1996). |
| ‡ |
|
|
|
|
|
‡‡10nn. |
| Bristol-Myers Squibb Company 1987 Deferred Compensation Plan for Non-Employee Directors, as amended and restated January 20, 2015 (incorporated herein by reference to Exhibit 10mm to the Form 10-K for the fiscal year ended December 31, 2014). |
| ‡ |
|
|
|
|
|
‡‡10oo. |
| Bristol-Myers Squibb Company Non-Employee Directors' Stock Option Plan, as amended (as approved by the Stockholders on May 1, 1990, incorporated herein by reference to Exhibit 28 to Registration Statement No. 33-38587 on Form S-8; as amended May 7, 1991, incorporated herein by reference to Exhibit 19c to the Form 10-K for the fiscal year ended December 31, 1991), as amended January 12, 1999 (incorporated herein by reference to Exhibit 10m to the Form 10-K for the fiscal year ended December 31, 1998). |
| ‡ |
|
|
|
|
|
‡‡10pp. |
| Bristol-Myers Squibb Company Non-Employee Directors' Stock Option Plan, as amended (as approved by the Stockholders on May 2, 2000, incorporated herein by reference to Exhibit A to the 2000 Proxy Statement dated March 20, 2000). |
| ‡ |
|
|
|
|
|
112
‡‡10qq. |
| Squibb Corporation Deferral Plan for Fees of Outside Directors, as amended (as adopted, incorporated herein by reference to Exhibit 10e Squibb Corporation 1991 Form 10-K for the fiscal year ended December 31, 1987, File No. 1-5514; as amended effective December 31, 1991 incorporated herein by reference to Exhibit 10m to the Form 10-K for the fiscal year ended December 31, 1992). |
| ‡ |
|
|
|
|
|
12 |
| Statement re computation of ratios (filed herewith). |
| E-12-1 |
|
|
|
|
|
21 |
| Subsidiaries of the Registrant (filed herewith). |
| E-21-1 |
|
|
|
|
|
23 |
| Consent of Deloitte & Touche LLP (filed herewith). |
| E-23-1 |
|
|
|
|
|
31a. |
| Section 302 Certification Letter (filed herewith). |
| E-31-1 |
|
|
|
|
|
31b. |
| Section 302 Certification Letter (filed herewith). |
| E-31-1 |
|
|
|
|
|
32a. |
| Section 906 Certification Letter (filed herewith). |
| E-32-1 |
|
|
|
|
|
32b. |
| Section 906 Certification Letter (filed herewith). |
| E-32-2 |
|
|
|
|
|
101. |
| The following financial statements from the Bristol-Myers Squibb Company Annual Report on Form 10-K for the years ended December 31, 2017, 2016 and 2015, formatted in Extensible Business Reporting Language (XBRL): (i) consolidated statements of earnings, (ii) consolidated statements of comprehensive income, (iii) consolidated balance sheets, (iv) consolidated statements of cash flows, and (v) the notes to the consolidated financial statements. |
|
|
† | Confidential treatment has been granted for certain portions which are omitted in the copy of the exhibit electronically filed with the Commission. |
* | Indicates, in this Form 10-K, brand names of products, which are registered trademarks not solely owned by the Company or its subsidiaries. Abilify is a trademark of Otsuka Pharmaceutical Co., Ltd.; Adcetris is a trademark of Seattle Genetics, Inc.; Atripla is a trademark of Bristol-Myers Squibb and Gilead Sciences, LLC; Avapro/Avalide (known in the EU as Aprovel/Karvea ) and Plavix are trademarks of Sanofi; Bydureon, Byetta and Symlin are trademarks of Amylin Pharmaceuticals, LLC; Cabometyx is the trademark of Exelixis, Inc.; ENHANZE is a trademark of Halozyme, Inc.; Erbitux is a trademark of ImClone LLC; Farxiga and Onglyza are trademarks of AstraZeneca AB; Gleevec is a trademark of Novartis AG; Ixempra is a trademark of R-Pharm US Operating, LLC; Keytruda is a trademark of Merck Sharp & Dohme Corp.; Myalept is a trademark of Aegerion Pharmaceuticals, Inc.; Prostvac is a trademark of BN ImmunoTherapeutics Inc.; Recothrom is a trademark of The Medicines Company; Rubraca is a trademark of Clovis Oncology, Inc. and Truvada and Tybost are trademarks of Gilead Sciences, Inc. and/or one of its affiliates. Brand names of products that are in all italicized letters, without an asterisk, are registered trademarks of BMS and/or one of its subsidiaries. |
113