UNITED STATES SECURITIES AND EXCHANGE COMMISSION
Washington, D.C. 20549
______________________________________________________
FORM 10-K
(Mark One)
x | ANNUAL REPORT PURSUANT TO SECTION 13 OR 15(d) OF THE SECURITIES EXCHANGE ACT OF 1934 |
For the fiscal year ended July 1, 2012
OR
¨ | TRANSITION REPORT PURSUANT TO SECTION 13 OR 15(d) OF THE SECURITIES EXCHANGE ACT OF 1934 |
For the transition period from __________ to __________
Commission file number 1-1370
_____________________________________________________________

BRIGGS & STRATTON CORPORATION
(Exact name of registrant as specified in its charter)
Wisconsin |
| 39-0182330 |
(State or other jurisdiction of incorporation or organization) |
| (I.R.S. Employer Identification No.) |
12301 West Wirth Street, Wauwatosa, Wisconsin 53222
(Address of Principal Executive Offices) (Zip Code)
Registrant's telephone number, including area code: 414-259-5333
Securities registered pursuant to Section 12(b) of the Act:
Title of Each Class |
| Name of Each Exchange on Which Registered |
Common Stock (par value $0.01 per share) |
| New York Stock Exchange |
Common Share Purchase Rights |
| New York Stock Exchange |
Securities registered pursuant to Section 12(g) of the Act: None
Indicate by check mark if the registrant is a well-known seasoned issuer, as defined in Rule 405 of the Securities Act. Yes x No o
Indicate by check mark if the registrant is not required to file reports pursuant to Section 13 or Section 15(d) of the Act. Yes o No x
Indicate by check mark whether the registrant (1) has filed all reports required to be filed by Section 13 or 15(d) of the Securities Exchange Act of 1934 during the preceding 12 months (or for such shorter period that the registrant was required to file such reports), and (2) has been subject to such filing requirements for the past 90 days. Yes x No o
Indicate by check mark whether the registrant has submitted electronically and posted on its corporate Web site, if any, every Interactive Data File required to be submitted and posted pursuant to Rule 405 of Regulation S-T during the preceding 12 months (or for such shorter period that the registrant was required to submit and post such files). Yes x No o
Indicate by check mark if disclosure of delinquent filers pursuant to Item 405 of Regulation S-K is not contained herein, and will not be contained, to the best of registrant's knowledge, in definitive proxy or information statements incorporated by reference in Part III of this Form 10-K or any amendment to this Form 10-K or any amendment of this Form 10-K. x
Indicate by check mark whether the registrant is a large accelerated filer, an accelerated filer, a non-accelerated filer, or a smaller reporting company. See the definitions of "large accelerated filer", "accelerated filer" and "smaller reporting company" in Rule 12b-2 of the Exchange Act. (Check one):
Large accelerated filer | x | Accelerated filer | ¨ |
Non-accelerated filer | ¨ (Do not check if a smaller reporting company) | Smaller reporting company | ¨ |
Indicate by check mark whether the registrant is a shell company (as defined in Rule 12b-2 of the Exchange Act). Yes o No x
The aggregate market value of Common Stock held by nonaffiliates of the registrant was approximately $770.1 million based on the reported last sale price of such securities as of December 30, 2011 , the last business day of the most recently completed second fiscal quarter.
Number of Shares of Common Stock Outstanding at August 24, 2012 : 47,842,345 .
DOCUMENTS INCORPORATED BY REFERENCE
Part III incorporates information by reference from the definitive proxy statement for the Annual Meeting to be held on October 17, 2012.
BRIGGS & STRATTON CORPORATION
FISCAL
2012
FORM 10-K
TABLE OF CONTENTS
|
|
|
PART I | Page | |
Item 1. | Business | 1 |
Item 1A. | Risk Factors | 5 |
Item 1B. | Unresolved Staff Comments | 10 |
Item 2. | Properties | 10 |
Item 3. | Legal Proceedings | 11 |
Item 4. | Mine Safety Disclosures | 12 |
| Executive Officers of the Registrant | 13 |
PART II |
| |
Item 5. | Market for the Registrant's Common Equity, Related Stockholder Matters and Issuer Purchases of Equity Securities | 15 |
Item 6. | Selected Financial Data | 16 |
Item 7. | Management's Discussion and Analysis of Financial Condition and Results of Operations | 17 |
Item 7A. | Quantitative and Qualitative Disclosures About Market Risk | 26 |
Item 8. | Financial Statements and Supplementary Data | 28 |
Item 9. | Changes in and Disagreements with Accountants on Accounting and Financial Disclosure | 42 |
Item 9A. | Controls and Procedures | 42 |
Item 9B. | Other Information | 42 |
PART III |
| |
Item 10. | Directors, Executive Officers and Corporate Governance | 42 |
Item 11. | Executive Compensation | 43 |
Item 12. | Security Ownership of Certain Beneficial Owners and Management and Related Stockholder Matters | 43 |
Item 13. | Certain Relationships and Related Transactions, and Director Independence | 43 |
Item 14. | Principal Accountant Fees and Services | 43 |
PART IV |
| |
Item 15. | Exhibits and Financial Statement Schedules | 44 |
| Signatures | 45 |
Cautionary Statement on Forward-Looking Statements
This report contains certain forward-looking statements that involve risks and uncertainties that could cause actual results to differ materially from those projected in the forward-looking statements. The words "believe", "estimate", "expect", "forecast", "intend", "plan", "project", and similar expressions are intended to identify forward-looking statements. The forward-looking statements are based on the Company's current views and assumptions and involve risks and uncertainties that include, among other things, the ability to successfully forecast demand for our products; changes in interest rates and foreign exchange rates; the effects of weather on the purchasing patterns of consumers and original equipment manufacturers (OEMs); actions of engine manufacturers and OEMs with whom we compete; changes in laws and regulations; changes in customer and OEM demand; changes in prices of raw materials and parts that we purchase; changes in domestic and foreign economic conditions; the ability to bring new productive capacity on line efficiently and with good quality; outcomes of legal proceedings and claims; and other factors disclosed from time to time in our SEC filings or otherwise, including the factors discussed in Item 1A, Risk Factors, of the Company's Annual Report on Form 10-K and in its periodic reports on Form 10-Q.
PART I
ITEM 1. | BUSINESS |
Briggs & Stratton (the "Company") is the world's largest producer of air cooled gasoline engines for outdoor power equipment. Briggs & Stratton designs, manufactures, markets and services these products for original equipment manufacturers (OEMs) worldwide. In addition, the Company markets and sells related service parts and accessories for its engines. Briggs & Stratton is recognized worldwide for its strong brand name and a reputation for quality, design, innovation and value.
Through its wholly owned subsidiary, Briggs & Stratton Power Products Group, LLC, Briggs & Stratton is also a leading designer, manufacturer and marketer of generators, pressure washers, snow throwers, lawn and garden powered equipment (primarily riding and walk behind mowers) and related service parts and accessories.
The Company conducts its operations in two reportable segments: Engines and Products. Further information about Briggs & Stratton's business segments is contained in Note 7 of the Notes to Consolidated Financial Statements.
The Company's internet address is www.basco.com. The Company makes available free of charge (other than an investor's own internet access charges) through its Internet website the Company's Annual Report on Form 10-K, quarterly reports on Form 10-Q, current reports on Form 8-K, and amendments to those reports filed or furnished pursuant to Section 13(a) or 15(d) of the Securities Exchange Act of 1934, as soon as reasonably practicable after it electronically files such material with, or furnishes such material to, the Securities and Exchange Commission. Charters of the Audit, Compensation, Finance, Nominating and Governance Committees, Corporate Governance Guidelines, Stock Ownership Guidelines and code of business conduct and ethics contained in the Briggs & Stratton Business Integrity Manual are available on the Company's website and are available in print to any shareholder upon request to the Corporate Secretary.
Engines Segment
General
Briggs & Stratton manufactures four-cycle aluminum alloy gasoline engines with displacements ranging from 125 to 993 cubic centimeters through its Engines segment. The Company's engines are used primarily by the lawn and garden equipment industry, which accounted for 86% of the Engines segment's fiscal 2012 engine sales to OEMs. Major lawn and garden equipment applications include walk-behind lawn mowers, riding lawn mowers, garden tillers and snow throwers. The remaining 14% of engine sales to OEMs in fiscal 2012 were for use on products for industrial, construction, agricultural and other consumer applications, that include generators, pumps and pressure washers. Many retailers specify the Company's engines on the power equipment they sell and the Briggs & Stratton logo is often featured prominently on a product because of the appeal and reputation of the brand.
In fiscal 2012 approximately 29% of the Engines segment net sales were derived from sales in international markets, primarily to customers in Europe. The Company serves its key international markets through its European regional office in Switzerland, its distribution center in the Netherlands and sales and service subsidiaries and offices in Australia, Austria, Brazil, Canada, China, the Czech Republic, England, France, Germany, India, Italy, Japan, Mexico, New Zealand, Poland, Russia, South Africa, Sweden and the United Arab Emirates. Briggs & Stratton is a leading supplier of gasoline engines in developed countries where there is an established lawn and garden equipment market. Briggs & Stratton also exports engines to developing nations where its engines are used in agricultural, marine, construction and other applications. More detailed information about our foreign operations is in Note 7 of the Notes to Consolidated Financial Statements.
The Company's engines are sold primarily by its worldwide sales force through direct interaction with customers. The Company's marketing staff and engineers in the United States provide support and technical assistance to its sales force.
The Engines segment also manufactures replacement engines and service parts and sells them to sales and service distributors. The Company owns its principal international distributors. In the United States the distributors are independently owned and operated.
1
These distributors supply service parts and replacement engines directly to independently owned, authorized service dealers throughout the world. These distributors and service dealers incorporate the Company's commitment to reliability and service.
Customers
The Company's engine sales are primarily to OEMs. The Company's three largest external engine customers in fiscal years 2012, 2011 and 2010 were Husqvarna Outdoor Products Group (HOP), MTD Products Inc. (MTD) and Deere & Company. Engines segment sales to the top three customers combined were 45%, 47% and 48% of Engines segment sales in fiscal 2012, 2011 and 2010, respectively. Under purchasing plans available to all of its gasoline engine customers, Briggs & Stratton typically enters into annual engine supply arrangements.
The Company believes that in fiscal 2012 more than 80% of all lawn and garden powered equipment sold in the United States was sold through mass merchandisers such as The Home Depot, Inc. (The Home Depot), Lowe's Companies, Inc. (Lowe's), Sears Holdings Corporation (Sears) and Wal-Mart Stores, Inc. (Wal-Mart). Given the buying power of the mass merchandisers, Briggs & Stratton, through its customers, has continued to experience pricing pressure; however, the Company attempts to recover increases in commodity costs through increased pricing.
Competition
The Company's major domestic competitors in engine manufacturing are Honda Motor Co., Ltd. (Honda), Kawasaki Heavy Industries, Ltd. (Kawasaki) and Kohler Co. (Kohler). Several Japanese and Chinese small engine manufacturers, of which Honda and Kawasaki are the largest, compete directly with the Company in world markets in the sale of engines to other OEMs and indirectly through their sale of end products.
The Company believes it has a significant share of the worldwide market for engines that power outdoor equipment.
The Company believes the major areas of competition from all engine manufacturers include product quality, brand, price, delivery and service. Other factors affecting competition are short-term market share objectives, short-term profit objectives, exchange rate fluctuations, technology, product support, distribution strength, and advertising. The Company believes its technology, product value, distribution, marketing, and service reputation have given it strong brand name recognition and enhanced its competitive position.
Seasonality of Demand
Sales of engines to lawn and garden OEMs are highly seasonal because of consumer buying patterns. The majority of lawn and garden equipment is sold during the spring and summer months when most lawn care and gardening activities are performed. Sales of lawn and garden equipment are also influenced by consumer sentiment, employment levels, housing starts and weather conditions. Engine sales in the Company's fiscal third quarter have historically been the highest, while sales in the first fiscal quarter have historically been the lowest.
In order to efficiently use its capital investments and meet seasonal demand for engines, the Company pursues a relatively balanced production schedule throughout the year. The schedule is adjusted to reflect changes in estimated demand, customer inventory levels and other matters outside the control of the Company. Accordingly, inventory levels generally increase during the first and second fiscal quarters in anticipation of customer demand. Inventory levels begin to decrease as sales increase in the third fiscal quarter. This seasonal pattern results in high inventories and low cash flow for the Company in the first, second and the beginning of the third fiscal quarters. The pattern results in higher cash flow in the latter portion of the third fiscal quarter and in the fourth fiscal quarter as inventories are liquidated and receivables are collected.
Manufacturing
The Company manufactures engines and parts at the following locations: Auburn, Alabama; Statesboro, Georgia; Murray, Kentucky; Poplar Bluff, Missouri; Wauwatosa, Wisconsin; and Chongqing, China. Briggs & Stratton has a parts distribution center in Menomonee Falls, Wisconsin.
2
In January 2012, the Company announced plans to close its Ostrava, Czech Republic facility. During fiscal 2012, the Engines segment ceased manufacturing operations at the Ostrava, Czech Republic plant, shifting production to its Murray, Kentucky facility.
In April 2012, the Company announced that production of horizontal shaft engines currently made in the Auburn, Alabama plant will move to the Company's existing production facility in Chongqing, China or be sourced from third parties in Southeast Asia. The Auburn plant will continue to produce V-Twin engines used in riding mowers and other outdoor power applications.
The Company manufactures a majority of the structural components used in its engines, including aluminum die castings, carburetors and ignition systems. The Company purchases certain parts such as piston rings, spark plugs, valves, ductile and grey iron castings, plastic components, some stampings and screw machine parts and smaller quantities of other components. Raw material purchases consist primarily of aluminum and steel. The Company believes its sources of supply are adequate.
The Company has joint ventures with Daihatsu Motor Company for the manufacture of engines in Japan, and with Starting Industrial of Japan for the production of rewind starters and punch press components in the United States.
The Company has a strategic relationship with Mitsubishi Heavy Industries (MHI) for the global distribution of air cooled gasoline engines manufactured by MHI in Japan under Briggs & Stratton's Vanguard brand.
Products Segment
General
Products segment's ("Products") principal product lines include portable and standby generators, pressure washers, snow throwers and lawn and garden power equipment. Products sells its products through multiple channels of retail distribution, including consumer home centers, warehouse clubs, mass merchants and independent dealers. The products segment product lines are marketed under its own brands such as Briggs & Stratton, Snapper, Simplicity, Ferris, Snapper Pro, Murray, Victa as well as other brands such as Craftsman, John Deere, GE, and Troy-Bilt.
In April 2012, the Company announced that beginning in fiscal 2013, it will no longer pursue placement of lawn and garden products at national mass retailers. The Engines segment will continue to support lawn and garden equipment OEMs who provide lawn and garden equipment to these retailers. The Products segment will continue to focus on innovative, higher margin products that are sold through its independent dealer network and regional retailers. The Company will also continue to sell pressure washers and portable and standby generators through the U.S. mass retail channel.
In October 2011, the Company completed the acquisition of Premier Power Equipments and Products Private Ltd. of Tamil Nadu, India, providing a platform for future growth in India.
Products has a network of independent dealers worldwide for the sale and service of snow throwers, standby generators and lawn and garden powered equipment. To support its international business, Products has leveraged the existing Briggs & Stratton worldwide distribution network.
Customers
Historically, Products' major customers have been Lowe's, Sears and Deere & Company. Sales to these three customers combined were 27%, 33% and 34% of Products segment net sales in fiscal 2012, 2011 and 2010, respectively. Other U.S. customers include Wal-Mart,The Home Depot, Tractor Supply Inc., and a network of independent dealers.
Competition
The principal competitive factors in the power products industry include price, service, product performance, brand, innovation and delivery. Products has various competitors, depending on the type of equipment. Primary competitors include: Honda (portable generators, pressure washers and lawn and garden equipment), Generac Power Systems, Inc. (portable generators, standby generators and pressure washers), Alfred Karcher GmbH & Co. (pressure washers), Techtronic Industries (pressure washers and portable generators), Deere & Company (commercial and consumer lawn mowers), MTD (commercial and consumer
3
lawn mowers), The Toro Company (commercial and consumer lawn mowers), Scag Power Equipment, a Division of Metalcraft of Mayville, Inc. (commercial lawn mowers), and HOP (commercial and consumer lawn mowers).
Products believes it has a significant share of the North American market for portable generators and residential pressure washers.
Seasonality of Demand
Products' sales are subject to seasonal patterns. Due to seasonal and regional weather factors, sales of pressure washers and lawn and garden powered equipment are typically higher during the third and fourth fiscal quarters than at other times of the year. Sales of portable generators and snow throwers are typically higher during the first and second fiscal quarters and can spike during weather related power outage events.
Manufacturing
Products' manufacturing facilities are located in Auburn, Alabama; McDonough, Georgia; Munnsville, New York; Wauwatosa, Wisconsin; Sydney, Australia and Coimbatore, India. Products also purchases certain powered equipment under contract manufacturing agreements.
In January 2012, the Company announced plans to close its Newbern, Tennessee facility. During fiscal 2012, Products ceased manufacturing operations at the Newbern, Tennessee facility and moved production to its McDonough, Georgia facility.
In April 2012, the Company announced that it is evaluating alternatives with respect to manufacturing, assembling or sourcing cost effective portable generators beyond 2012. The Company will continue to manufacture portable generators in Auburn through calendar 2012.
Products manufactures core components for its products, where such integration improves operating profitability by providing lower costs.
Products purchases engines from its parent, Briggs & Stratton, as well as from Honda, Kawasaki and Kohler. Products has not experienced any difficulty obtaining necessary engines or other purchased components.
Products assembles products for the international markets at its U.S. and Australian locations and through contract manufacturing agreements with other OEMs and suppliers.
Consolidated
General Information
The Company holds patents on features incorporated in its products; however, the success of the Company's business is not considered to be primarily dependent upon patent protection. The Company owns several trademarks which it believes significantly affect a consumer's choice of outdoor powered equipment and therefore create value. Licenses, franchises and concessions are not a material factor in the Company's business.
For the fiscal years ended July 1, 2012 , July 3, 2011 and June 27, 2010 , the Company spent approximately $19.8 million , $19.5 million and $22.3 million , respectively, on research activities relating to the development of new products or the improvement of existing products.
In April 2012, the Company announced that it would reduce its salaried workforce by approximately 10%. The Company implemented these salaried workforce reductions during fiscal 2012.
The average number of persons employed by the Company during fiscal 2012 was 6,709. Employment ranged from a low of 6,321 in June 2012 to a high of 6,887 in February 2012.
Export Sales
Export sales for fiscal 2012, 2011 and 2010 were $392.7 million (19% of net sales), $428.0 million (20% of net sales) and $344.1 million (17% of net sales), respectively. These sales were principally to customers in European countries.
4
Refer to Note 7 of the Notes to Consolidated Financial Statements for financial information about geographic areas. Also, refer to Item 7A of this Form 10-K and Note 14 of the Notes to Consolidated Financial Statements for information about Briggs & Stratton's foreign exchange risk management.
ITEM 1A. | RISK FACTORS |
In addition to the risks referred to elsewhere in this Annual Report on Form 10-K, the following risks, among others, may have affected, and in the future could affect, the Company and its subsidiaries' business, financial condition or results of operations. Additional risks not discussed or not presently known to the Company or that the Company currently deems insignificant may also impact its business and stock price.
Demand for products fluctuates significantly due to seasonality. In addition, changes in the weather and consumer confidence impact demand.
Sales of our products are subject to seasonal and consumer buying patterns. Consumer demand in our markets can be reduced by unfavorable weather and weak consumer confidence. Although we manufacture throughout the year, our sales are concentrated in the second half of our fiscal year. This operating method requires us to anticipate demand of our customers many months in advance. If we overestimate or underestimate demand during a given year, we may not be able to adjust our production quickly enough to avoid excess or insufficient inventories, and that may in turn limit our ability to maximize our potential sales or maintain optimum working capital levels.
We have only a limited ability to pass through cost increases in our raw materials to our customers during the year.
We generally enter into annual purchasing plans with our largest customers, so our ability to raise our prices during a particular year to reflect increased raw materials costs is limited.
A significant portion of our net sales comes from major customers and the loss of any of these customers would negatively impact our financial results.
In fiscal 2012, our three largest customers accounted for 31% of our consolidated net sales. The loss of a significant portion of the business of one or more of these key customers would significantly impact our net sales and profitability.
Changes in environmental or other laws could require extensive changes in our operations or to our products.
Our operations and products are subject to a variety of foreign, federal, state and local laws and regulations governing, among other things, emissions to air, discharges to water, noise, the generation, handling, storage, transportation, treatment and disposal of waste and other materials and health and safety matters. We do not expect these laws and regulations to have a material adverse effect on us, but we cannot be certain that these or other proposed changes in applicable laws or regulations will not adversely affect our business or financial condition in the future.
Foreign economic conditions and currency rate fluctuations can reduce our sales.
In fiscal 2012 , we derived approximately 30% of our consolidated net sales from international markets, primarily Europe. Weak economic conditions in Europe could reduce our sales and currency fluctuations could adversely affect our sales or profit levels in U.S. dollar terms.
Actions of our competitors could reduce our sales or profits.
Our markets are highly competitive and we have a number of significant competitors in each market. Competitors may reduce their costs, lower their prices or introduce innovative products that could adversely affect our sales or profits. In addition, our competitors may focus on reducing our market share to improve their results.
Disruptions caused by labor disputes or organized labor activities could harm our business.
Currently, approximately 13% of our workforce is represented by labor unions. In addition, we may from time to time experience union organizing activities in our non-union facilities. Disputes with the current labor union
5
or new union organizing activities could lead to work slowdowns or stoppages and make it difficult or impossible for us to meet scheduled delivery times for product shipments to our customers, which could result in loss of business. In addition, union activity could result in higher labor costs, which could harm our financial condition, results of operations and competitive position.
Our level of debt and our ability to obtain debt financing could adversely affect our operating flexibility and put us at a competitive disadvantage.
Our level of debt and the limitations imposed on us by the indenture for the notes and our other credit agreements could have important consequences, including the following:
• | we will have to use a portion of our cash flow from operations for debt service rather than for our operations; |
• | we may not be able to obtain additional debt financing for future working capital, capital expenditures or other corporate purposes or may have to pay more for such financing; |
• | some or all of the debt under our current or future revolving credit facilities will be at a variable interest rate, making us more vulnerable to increases in interest rates; |
• | we could be less able to take advantage of significant business opportunities, such as acquisition opportunities, and to react to changes in market or industry conditions; |
• | we may be more vulnerable to general adverse economic and industry conditions; and |
• | we may be disadvantaged compared to competitors with less leverage. |
The terms of the indenture for the Senior Notes do not fully prohibit us from incurring substantial additional debt in the future and our revolving credit facilities permit additional borrowings, subject to certain conditions. As incremental debt is added to our current debt levels, the related risks we now face could intensify.
We expect to obtain the money to pay our expenses and to pay the principal and interest on the outstanding 6.875% Senior Notes that are due in December 2020, the credit facilities and other debt primarily from our
operations or by refinancing part of our existing debt. Our ability to meet our expenses thus depends on our future performance, which will be affected by financial, business, economic and other factors. We will not be able to control many of these factors, such as economic conditions in the markets where we operate and pressure from competitors. We cannot be certain that the money we earn will be sufficient to allow us to pay principal and interest on our debt and meet our other obligations. If we do not have enough money, we may be required to refinance all or part of our existing debt, sell assets or borrow more money. We cannot guarantee that we will be able to do so on terms acceptable to us. In addition, the terms of existing or future debt agreements, including the revolving credit facilities and our indentures, may restrict us from adopting certain of these alternatives.
We are restricted by the terms of the outstanding Senior Notes and our other debt, which could adversely affect us.
The indenture relating to the Senior Notes and our multicurrency credit agreement include a number of financial and operating restrictions, which may prevent us from capitalizing on business opportunities and taking some corporate actions. These covenants could adversely affect us by limiting our ability to plan for or react to market conditions or to meet our capital needs. These covenants include, among other things, restrictions on our ability to:
• | incur more debt; |
• | pay dividends, redeem stock or make other distributions; |
• | make certain investments; |
• | create liens; |
• | transfer or sell assets; |
• | merge or consolidate; and |
• | enter into transactions with our affiliates. |
In addition, our multicurrency credit agreement contains financial covenants that, among other things, require us to maintain a minimum interest coverage ratio and impose a maximum average leverage ratio.
6
Our failure to comply with the restrictive covenants described above could result in an event of default, which, if not cured or waived, could result in us being required to repay these borrowings before their due date. If we are forced to refinance these borrowings on less favorable terms, our results of operations and financial condition could be adversely affected by increased costs and rates.
Current worldwide economic conditions may adversely affect our industry, business and results of operations.
General worldwide economic conditions have experienced a downturn due to the sequential effects of the subprime lending crisis, general credit market crisis, sovereign debt crisis, collateral effects on the finance and banking industries, increased energy costs, concerns about inflation, slower economic activity, decreased consumer confidence, reduced corporate profits and capital spending, adverse business conditions and liquidity concerns. These conditions make it difficult for our customers, our vendors and us to accurately forecast and plan future business activities, and they may cause U.S. and foreign OEMs and consumers to slow spending on our products. We cannot predict the timing or duration of any economic slowdown or the timing or strength of a subsequent economic recovery, worldwide or in the specific end markets we serve. If the consumer and commercial lawn and garden markets significantly deteriorate due to these economic effects, our business, financial condition and results of operations will likely be materially and adversely affected. Additionally, our stock price could decrease if investors have concerns that our business, financial condition and results of operations will be negatively impacted by a worldwide economic downturn.
The ongoing European sovereign debt crisis has caused disruption in global financial markets and is likely to continue to cause economic disruptions, particularly if it leads to any future sovereign debt defaults and/or significant bank failures or defaults in the Eurozone. Despite certain stabilization measures taken by the European Union, the European Central Bank and the International Monetary Fund, yields on government bonds of certain European countries have remained volatile and credit ratings of most European countries have been downgraded by certain of the major rating agencies. The market disruptions in the Eurozone could intensify or spread further, particularly if ongoing stabilization efforts prove insufficient. Continued economic turmoil in the Eurozone could have a significant negative impact on us, both directly through our own global exposures and indirectly due to a decline in general global economic conditions. Further, the effects of the European sovereign debt crisis could be even more significant if they lead to a partial or complete break-up of the European Monetary Union (EMU). The partial or full break-up of the EMU would be unprecedented and its impact highly uncertain. The exit of one or more countries from the EMU or the dissolution of the EMU could lead to redenomination of obligations of obligors in exiting countries. Any such exit and redenomination would cause significant uncertainty with respect to outstanding obligations of counterparties and debtors in any exiting country, whether sovereign or otherwise, and lead to complex, lengthy litigation. The resulting uncertainty and market stress could also cause, among other things, severe disruption to equity markets, significant increases in bond yields generally, potential failure or default of financial institutions, including those of systemic importance, a significant decrease in global liquidity, a freeze-up of global credit markets and worldwide recession. There can be no assurance that the various steps we have taken to protect our business, results of operations and financial condition against the concerns related to the European sovereign debt crisis and/or the partial or full break-up of the EMU will be sufficient.
We have a material amount of goodwill, which was written-down in fiscal 2011. If we determine that goodwill and other intangible assets have become further impaired in the future, net income in such years may be adversely affected.
At July 1, 2012, goodwill and other intangible assets represented approximately 18% of our total assets. Goodwill represents the excess of cost over the fair market value of net assets acquired in business combinations. We are required to evaluate whether our goodwill and indefinite-lived intangible assets have been impaired on an annual basis, or more frequently if indicators of impairment exist. As discussed in Note 5 of the Company's financial statements included in Item 8 of this report, the Company recorded pre-tax non-cash goodwill impairment charges of $49.5 million in fiscal 2011. The impairment was determined as part of the fair value assessment of goodwill. No goodwill impairment charges were recorded in fiscal 2012. Reductions in our net income caused by any additional write-down of our goodwill or intangible assets could materially adversely affect our results of operations.
7
We are subject to litigation, including product liability and warranty claims, that may adversely affect our business and results of operations.
We are a party to litigation that arises in the normal course of our business operations, including product warranty and liability (strict liability and negligence) claims, patent and trademark matters, contract disputes and environmental, asbestos, employment and other litigation matters. We face an inherent business risk of exposure to product liability and warranty claims in the event that the use of our products is alleged to have resulted in injury or other damage. While we currently maintain general liability and product liability insurance coverage in amounts that we believe are adequate, we cannot be sure that we will be able to maintain this insurance on acceptable terms or that this insurance will provide sufficient coverage against potential liabilities that may arise. Any claims brought against us, with or without merit, may have an adverse effect on our business and results of operations as a result of potential adverse outcomes, the expenses associated with defending such claims, the diversion of our management's resources and time and the potential adverse effect to our business reputation.
Our pension and postretirement benefit plan obligations are currently underfunded, and we may have to make significant cash payments to some or all of these plans, which would reduce the cash available for our businesses.
We have unfunded obligations under our domestic and foreign pension and postretirement benefit plans. As of July 1, 2012, our pension plans were underfunded by approximately $299 million . The funded status of our pension plans is dependent upon many factors, including returns on invested assets, the level of certain market interest rates and the discount rate used to determine pension obligations. Unfavorable returns on the plan assets or unfavorable changes in applicable laws or regulations could materially change the timing and amount of required plan funding, which would reduce the cash available for our businesses. In addition, a decrease in the discount rate used to determine pension obligations could result in an increase in the valuation of pension obligations, which could affect the reported funding status of our pension plans and future contributions, as well as the periodic pension cost in subsequent fiscal years.
Our dependence on, and the price of, raw materials may adversely affect our profits.
The principal raw materials used to produce our products are aluminum, copper and steel. We source raw materials on a global or regional basis, and the prices of those raw materials are susceptible to significant price fluctuations due to supply/demand trends, transportation costs, government regulations and tariffs, changes in currency exchange rates, price controls, the economic climate and other unforeseen circumstances. If we are unable to pass on raw material price increases to our customers, our future profitability may be adversely affected.
We may be adversely affected by health and safety laws and regulations.
We are subject to various laws and regulations relating to the protection of human health and safety and have incurred and will continue to incur capital and other expenditures to comply with these regulations. Failure to comply with regulations could subject us to future liabilities, fines or penalties or the suspension of production.
The operations and success of our Company can be impacted by natural disasters, terrorism, acts of war, international conflict and political and governmental actions, which could harm our business.
Natural disasters, acts or threats of war or terrorism, international conflicts and the actions taken by the United States and other governments in response to such events could cause damage or disrupt our business operations, our suppliers or our customers, and could create political or economic instability, any of which could have an adverse effect on our business. Although it is not possible to predict such events or their consequences, these events could decrease demand for our products, could make it difficult or impossible for us to deliver products or could disrupt our supply chain. We may also be impacted by actions by foreign governments, including currency devaluation, tariffs and nationalization, where our facilities are located, which could disrupt manufacturing and commercial operations. In addition, our foreign operations make us subject to certain U.S. laws and regulations, including the Export Administration Regulations administered by the U.S. Department of Commerce, the trade sanctions laws and regulations administered by the U.S. Department of the Treasury's Office of Foreign Assets Control and the Foreign Corrupt Practices Act. A violation of these laws and regulations could adversely affect our business, financial condition and results of operations.
8
We are subject to tax laws and regulations in many jurisdictions, and the inability to successfully defend claims from taxing authorities could adversely affect our operating results and financial position.
We conduct business in many countries, which requires us to interpret the income tax laws and rulings in each of those taxing jurisdictions. Due to the subjectivity of tax laws between those jurisdictions as well as the subjectivity of factual interpretations, our estimates of income tax liabilities may differ from actual payments or assessments. Claims from taxing authorities related to these differences could have an adverse impact on our operating results and financial position.
If we fail to remain current with changes in gasoline engine technology or if the technology becomes less important to customers in our markets due to the impact of alternative fuels, our results would be negatively affected.
Our ability to remain current with changes in gasoline engine technology may significantly affect our business. Any advances in gasoline engine technology, including the impact of alternative fuels, may inhibit our ability to compete with other manufacturers. Our competitors may also be more effective and efficient at integrating new technologies. In addition, developing new manufacturing technologies and capabilities requires a significant investment of capital. There can be no assurance that our products will remain competitive in the future or that we will continue to be able to timely implement innovative manufacturing technologies.
Through our Products segment, we compete with certain customers of our Engines segment, thereby creating inherent channel conflict that may impact the actions of engine manufacturers and OEMs with whom we compete.
Through our Products segment, we compete with certain customers of our Engines segment. Any further forward integration of our products may strain relationships with OEMs that are significant customers of our Engines segment and have an adverse impact on operating results.
The financial stability of our suppliers and the ability of our suppliers to produce quality materials could adversely affect our ability to obtain timely and cost-effective raw materials.
The loss of certain of our suppliers or interruption of production at certain suppliers from adverse financial conditions, work stoppages, equipment failures or other unfavorable events would adversely affect our ability to obtain raw materials and other inputs used in the manufacturing process. Our cost of purchasing raw materials and other inputs used in the manufacturing process could be higher and could temporarily affect our ability to produce sufficient quantities of its products, which could harm our financial condition, results of operations and competitive position.
We have implemented, and Wisconsin law contains, anti-takeover provisions that may adversely affect the rights of holders of our common stock.
Our articles of incorporation contain provisions that could have the effect of discouraging or making it more difficult for someone to acquire us through a tender offer, a proxy contest or otherwise, even though such an acquisition might be economically beneficial to our shareholders. These provisions include a board of directors divided into three classes of directors serving staggered terms of three years each and the removal of directors only for cause and only with the affirmative vote of a majority of the votes entitled to be cast in an election of directors.
Each currently outstanding share of our common stock includes, and each newly issued share of our common stock will include, a common share purchase right. The rights are attached to and trade with the shares of common stock and are exercisable only under limited circumstances. The rights will become exercisable if a person or group acquires, or announces an intention to acquire, 20% or more of our outstanding common stock, subject to certain exceptions. The rights have some anti-takeover effects and generally will cause substantial dilution to a person or group that attempts to acquire control of us without conditioning the offer on either redemption of the rights or amendment of the rights to prevent this dilution. The rights could have the effect of delaying, deferring or preventing a change of control.
We are subject to the Wisconsin Business Corporation Law, which contains several provisions that could have the effect of discouraging non-negotiated takeover proposals or impeding a business combination.
9
These provisions include:
• | requiring a supermajority vote of shareholders, in addition to any vote otherwise required, to approve business combinations not meeting adequacy of price standards; |
• | prohibiting some business combinations between an interested shareholder and us for a period of three years, unless the combination was approved by our board of directors prior to the time the shareholder became a 10% or greater beneficial owner of our shares or under some other circumstances; |
• | limiting actions that we can take while a takeover offer for us is being made or after a takeover offer has been publicly announced; and |
• | limiting the voting power of shareholders who own more than 20% of our stock. |
Our common stock is subject to substantial price and volume fluctuations.
The market price of shares of our common stock may be volatile. Among the factors that could affect our common stock price are those previously discussed, as well as:
• | quarterly fluctuation in our operating income and earnings per share results; |
• | decline in demand for our products; |
• | significant strategic actions by our competitors, including new product introductions or technological advances; |
• | fluctuations in interest rates; |
• | cost increases in energy, raw materials or labor; |
• | changes in revenue or earnings estimates or publication of research reports by analysts; and |
• | domestic and international economic and political factors unrelated to our performance. |
In addition, the stock markets have experienced extreme volatility that has often been unrelated to the operating performance of particular companies. These broad market fluctuations may adversely affect the trading price of our common stock.
ITEM 1B. | UNRESOLVED STAFF COMMENTS |
None.
ITEM 2. | PROPERTIES |
The Company maintains leased and owned manufacturing, office, warehouse, distribution and testing facilities throughout the world. The Company believes that its owned and leased facilities are adequate to perform its operations in a reasonable manner. As the Company's business is seasonal, additional warehouse space may be leased when inventory levels are at their peak. Facilities in the United States occupy approximately 6.8 million square feet, of which 58% is owned. Facilities outside of the United States occupy approximately 866 thousand square feet, of which 42% is owned. Certain of the Company's facilities are leased through operating and capital lease agreements. See Note 8 to the Consolidated Financial Statements for information on the Company's operating and capital leases.
10
The following table provides information about each of the Company's facilities (exceeding 25,000 square feet) as of July 1, 2012:
|
|
|
|
|
|
|
Location |
| Type of Property |
| Owned/Leased |
| Segment |
U.S. Locations: |
|
|
|
|
|
|
Auburn, Alabama |
| Manufacturing, office and warehouse |
| Owned and Leased |
| Engines, Products |
McDonough, Georgia |
| Manufacturing, office and warehouse |
| Owned and Leased |
| Products |
Statesboro, Georgia |
| Manufacturing, office and warehouse |
| Owned and Leased |
| Engines |
Murray, Kentucky |
| Manufacturing, office and warehouse |
| Owned and Leased |
| Engines |
Poplar Bluff, Missouri |
| Manufacturing, office and warehouse |
| Owned and Leased |
| Engines |
Reno, Nevada |
| Warehouse |
| Leased |
| Products |
Munnsville, New York |
| Manufacturing and office |
| Owned |
| Products |
Sherrill, New York |
| Warehouse |
| Leased |
| Products |
Dyersburg, Tennessee |
| Warehouse |
| Leased |
| Products |
Newbern, Tennessee (1) |
| Manufacturing and office |
| Leased |
| Products |
Grand Prairie, Texas |
| Warehouse |
| Leased |
| Products |
Brookfield, Wisconsin |
| Office |
| Leased |
| Products |
Menomonee Falls, Wisconsin |
| Distribution and office |
| Leased |
| Engines |
Jefferson, Wisconsin |
| Manufacturing and office (held for sale) |
| Owned |
| Products |
Wauwatosa, Wisconsin |
| Manufacturing, office and warehouse |
| Owned |
| Engines, Products, Corporate |
|
|
|
| |||
Non-U.S. Locations: |
|
|
|
|
|
|
Melbourne, Australia |
| Office |
| Leased |
| Engines, Products |
Sydney, Australia |
| Manufacturing and office |
| Leased |
| Products |
Mississauga, Canada |
| Office and warehouse |
| Leased |
| Products |
Chongqing, China |
| Manufacturing, office and warehouse |
| Owned |
| Engines |
Shanghai, China |
| Office and warehouse |
| Leased |
| Engines, Products |
Ostrava, Czech Republic (1) |
| Manufacturing and office (held for sale) |
| Owned |
| Engines, Products |
Nijmegen, Netherlands |
| Distribution and office |
| Leased |
| Engines |
(1) During Fiscal 2012, the Company completed manufacturing operations at its Newbern, Tennessee and Ostrava, Czech Republic facilities.
ITEM 3. | LEGAL PROCEEDINGS |
The Company is subject to various unresolved legal actions that arise in the normal course of its business. These actions typically relate to product liability (including asbestos-related liability), patent and trademark matters, and disputes with customers, suppliers, distributors and dealers, competitors and employees.
Starting with the first complaint in June 2004, various plaintiff groups filed complaints in state and federal courts across the country against the Company and other engine and lawnmower manufacturers alleging that the horsepower labels on the products they purchased were inaccurate and that the Company conspired with other engine and lawnmower manufacturers to conceal the true horsepower of these engines ("Horsepower Class Actions"). On February 24, 2010, the Company entered into a Stipulation of Settlement ("Settlement") that resolves all of the Horsepower Class Actions including all horsepower-labeling claims brought by all persons or entities in the United States who, beginning January 1, 1994 through the date notice of the
11
Settlement is first given, purchased, for use and not for resale, a lawn mower containing a vertical shaft internal combustion engine up to 30 horsepower provided that either the lawn mower or the engine of the lawn mower was manufactured or sold by a defendant.
The Settlement received final court approval on August 16, 2010. The settling defendants as a group agreed to pay an aggregate amount of $51.0 million. However, the monetary contribution of the amount of each of the settling defendants is confidential. In addition, the Company, along with the other settling defendants, agreed to injunctive relief regarding their future horsepower labeling, as well as procedures that will allow purchasers of lawnmower engines to seek a one-year extended warranty free of charge beginning March 1, 2011 for most class members. As part of the Settlement, the Company denies any and all liability and seeks resolution to avoid further protracted and expensive litigation. As a result of the Settlement, the Company recorded a pre-tax charge of $30.6 million in the third quarter of fiscal 2010.
On March 19, 2010, new plaintiffs filed a complaint in the Ontario Superior Court of Justice in Canada (Robert Foster et al. v. Sears Canada, Inc. et al., Docket No. 766-2010). On May 3, 2010, other plaintiffs filed a complaint in the Montreal Superior Court in Canada (Eric Liverman, et al. v. Deere & Company, et al., Docket No. 500-06-000507-109). Both Canadian complaints contain allegations and seek relief under Canadian law that are similar to the Horsepower Class Actions. The Company is evaluating the complaints and has not yet filed an answer or other responsive pleading to either one.
On May 14, 2010, the Company notified retirees and certain retirement eligible employees of various changes to the Company-sponsored retiree medical plans. The purpose of the amendments was to better align the plans offered to both hourly and salaried retirees. On August 16, 2010, a putative class of retirees who retired prior to August 1, 2006 and the United Steel Workers filed a complaint in the U.S. District Court for the Eastern District of Wisconsin (Merrill, Weber, Carpenter, et al; United Steel, Paper and Forestry, Rubber, Manufacturing, Energy, Allied Industrial and Service Workers International Union, AFL-CIO/CLC v. Briggs & Stratton Corporation; Group Insurance Plan of Briggs & Stratton Corporation; and Does 1 through 20, Docket No. 10-C-0700), contesting the Company's right to make these changes. In addition to a request for class certification, the complaint seeks an injunction preventing the alleged unilateral termination or reduction in insurance coverage to the class of retirees, a permanent injunction preventing defendants from ever making changes to the retirees' insurance coverage, restitution with interest (if applicable) and attorneys' fees and costs. The Company moved to dismiss the complaint and believes the changes are within its rights. On April 21, 2011, the district court issued an order granting the Company's motion to dismiss the complaint. The plaintiffs filed a motion with the court to reconsider its order on May 17, 2011, and on August 24, 2011 the court granted the motion and vacated the dismissal of the case. The Company then filed a motion with the court to appeal its decision directly to the U.S. Court of Appeals for the Seventh Circuit, but the court denied this motion on February 29, 2012. Discovery is now proceeding in the case.
Although it is not possible to predict with certainty the outcome of these unresolved legal actions or the range of possible loss, the Company believes the unresolved legal actions will not have a material adverse effect on its results of operations, financial position or cash flows.
ITEM 4. | MINE SAFETY DISCLOSURES |
Not applicable.
12
Executive Officers of the Registrant
Name, Age, Position |
| Business Experience for Past Five Years |
TODD J. TESKE, 47 Chairman, President and Chief Executive Officer (1)(2) |
| Mr. Teske was elected to his current position effective October 2010. He previously was President and Chief Executive Officer from January 2010. He served as President and Chief Operating Officer since September 2008. He previously served as Executive Vice President and Chief Operating Officer since September 2005. He previously served as Senior Vice President and President – Briggs & Stratton Power Products Group, LLC from September 2003 to August 2005. Mr. Teske also serves as a director of Badger Meter, Inc. and Lennox International, Inc. |
|
| |
RANDALL R. CARPENTER, 55 Vice President – Marketing |
| Mr. Carpenter was elected to his current position effective September 2009. He served as Vice President – Marketing since May 2007. He was previously Vice President Marketing and Product Development for Royal Appliance Manufacturing from 2005 to 2007. He was an Independent Marketing Consultant from 2004 to 2005. |
| ||
| ||
| ||
| ||
| ||
|
| |
DAVID G. DEBAETS, 49 Vice President – North American Operations (Engines Group) |
| Mr. DeBaets was elected to his current position effective September 2007. He has served as Vice President and General Manager – Large Engine Division since April 2000. |
| ||
| ||
|
| |
ROBERT F. HEATH, 64 Vice President, General Counsel and Secretary |
| Mr. Heath was elected to his current position effective February 2010. He previously was elected as Secretary January 2002. He has served as Vice President and General Counsel since January 2001. |
| ||
| ||
| ||
|
|
|
ANDREA L. GOLVACH, 41 Vice President – Treasurer |
| Ms. Golvach was elected to her current position effective November 2011 after serving as Vice President of Treasury since May 2011. Prior to joining Briggs & Stratton, she held the position of Director of Finance & Cash Management at Harley-Davidson, Inc., a global motorcycle manufacturer, from December 2007 to May 2011 and Director of Finance & Cash Management for Harley-Davidson Financial Services from August 2005 to December 2007. |
| ||
| ||
| ||
| ||
| ||
| ||
| ||
|
| |
HAROLD L. REDMAN, 47 Senior Vice President and President – Products Group |
| Mr. Redman was elected to his current position in October 2010. He previously served as Senior Vice President and President – Home Power Products Group since September 2009 after serving as Vice President and President – Home Power Products Group since May 2006. He also served as Senior Vice President – Sales & Marketing – Simplicity Manufacturing, Inc. since July 1995. |
| ||
| ||
| ||
| ||
| ||
| ||
|
| |
WILLIAM H. REITMAN, 56 Senior Vice President – Business Development & Customer Support |
| Mr. Reitman was elected to his current position effective October 2010 after previously serving as Senior Vice President – Sales & Customer Support since September 2007. He previously served as Senior Vice President – Sales & Marketing since May 2006, and Vice President – Sales & Marketing since October 2004. He also served as Vice President – Marketing since November 1995. |
| ||
| ||
| ||
| ||
| ||
| ||
|
| |
13
Name, Age, Position |
| Business Experience for Past Five Years |
DAVID J. RODGERS, 41 Senior Vice President and Chief Financial Officer |
| Mr. Rodgers was elected as Senior Vice President and Chief Financial Officer effective June 28, 2010 after serving as Vice President – Finance since February 2010. He was elected an executive officer in September 2007 and served as Controller from December 2006 to February 2010. He was previously employed by Roundy's Supermarkets, Inc. as Vice President – Corporate Controller from September 2005 to November 2006 and Vice President – Retail Controller from May 2003 to August 2005. |
| ||
| ||
| ||
| ||
| ||
| ||
| ||
|
| |
THOMAS R. SAVAGE, 64 Senior Vice President – Corporate Development |
| Mr. Savage was elected to his current position effective September 1, 2011. He previously served as Senior Vice President – Administration since 1997. |
| ||
| ||
|
|
|
JOSEPH C. WRIGHT, 53 Senior Vice President and President – Engines Group |
| Mr. Wright was elected to his current position in October 2010. He previously served as Senior Vice President and President – Engine Power Products Group since May 2006 after serving as Vice President and President – Yard Power Products Group since September 2005. He also served as Vice President and General Manager – Lawn and Garden Division from September 2004 to September 2005. He was elected an executive officer effective September 2002. |
|
|
|
EDWARD J. WAJDA, 52 Vice President and General Manager – International |
| Mr. Wajda was elected to his current position effective January 2011. He previously served as Vice President and General Manager – International since July 2008. Prior to joining Briggs & Stratton, he held the position of Senior Vice President – Global Medical Vehicle Group for Oshkosh Corporation, a manufacturer of security vehicles and bodies for access equipment, defense, fire and emergency and commercial uses, since June 2006. |
| ||
| ||
| ||
| ||
| ||
|
|
|
(1) Officer is also a Director of Briggs & Stratton.
(2) Member of the Board of Directors Executive Committee.
Officers are elected annually and serve until they resign, die, are removed, or a different person is appointed to the office.
14
PART II
ITEM 5. | MARKET FOR THE REGISTRANT'S COMMON EQUITY, RELATED STOCKHOLDER MATTERS AND ISSUER PURCHASES OF EQUITY SECURITIES |
Briggs & Stratton common stock and its common share purchase rights are traded on the NYSE under the symbol "BGG". Information required by this Item is incorporated by reference from the "Quarterly Financial Data, Dividend and Market Information" (unaudited), included in Item 8 of this report.
Changes in Securities, Use of Proceeds and Issuer Purchases of Equity Securities
The table below sets forth the information with respect to purchases made by or behalf of the Company of its common stock during the quarterly period ended July 1, 2012 .
2012 Fiscal Month |
| Total Number of Shares Purchased |
| Average Price Paid per Share |
| Total Number of Shares Purchased as Part of a Publicly Announced Program (1) |
| Approximate Dollar Value of Shares that May Yet Be Purchased Under the Program (1) | ||||||
April 2, 2012 to April 29, 2012 |
| 405,400 | |
| $ | 17.66 | |
| 405,400 | |
| $ | 20,153,210 | |
April 30, 2012 to May 27, 2012 |
| 260,556 | |
| 17.65 | |
| 260,556 | |
| 15,554,281 | | ||
May 28, 2012 to July 1, 2012 |
| 284,773 | |
| 17.00 | |
| 284,773 | |
| 10,712,996 | | ||
Total Fourth Quarter |
| 950,729 | |
| $ | 17.46 | |
| 950,729 | |
| $ | 10,712,996 | |
(1) In August 2011, the Board of Directors of the Company authorized up to $50 million in funds for use in a common share repurchase program with an expiration of June 30, 2013.
In August 2012, subsequent to the end of fiscal 2012, the Board of Directors authorized up to an additional $50 million in funds associated with the common share repurchase program and an extension of the expiration date to June 30, 2014. The common share repurchase program authorizes the purchase of shares of the Company's common stock on the open market or in private transactions from time to time, depending on market conditions and certain governing loan covenants.
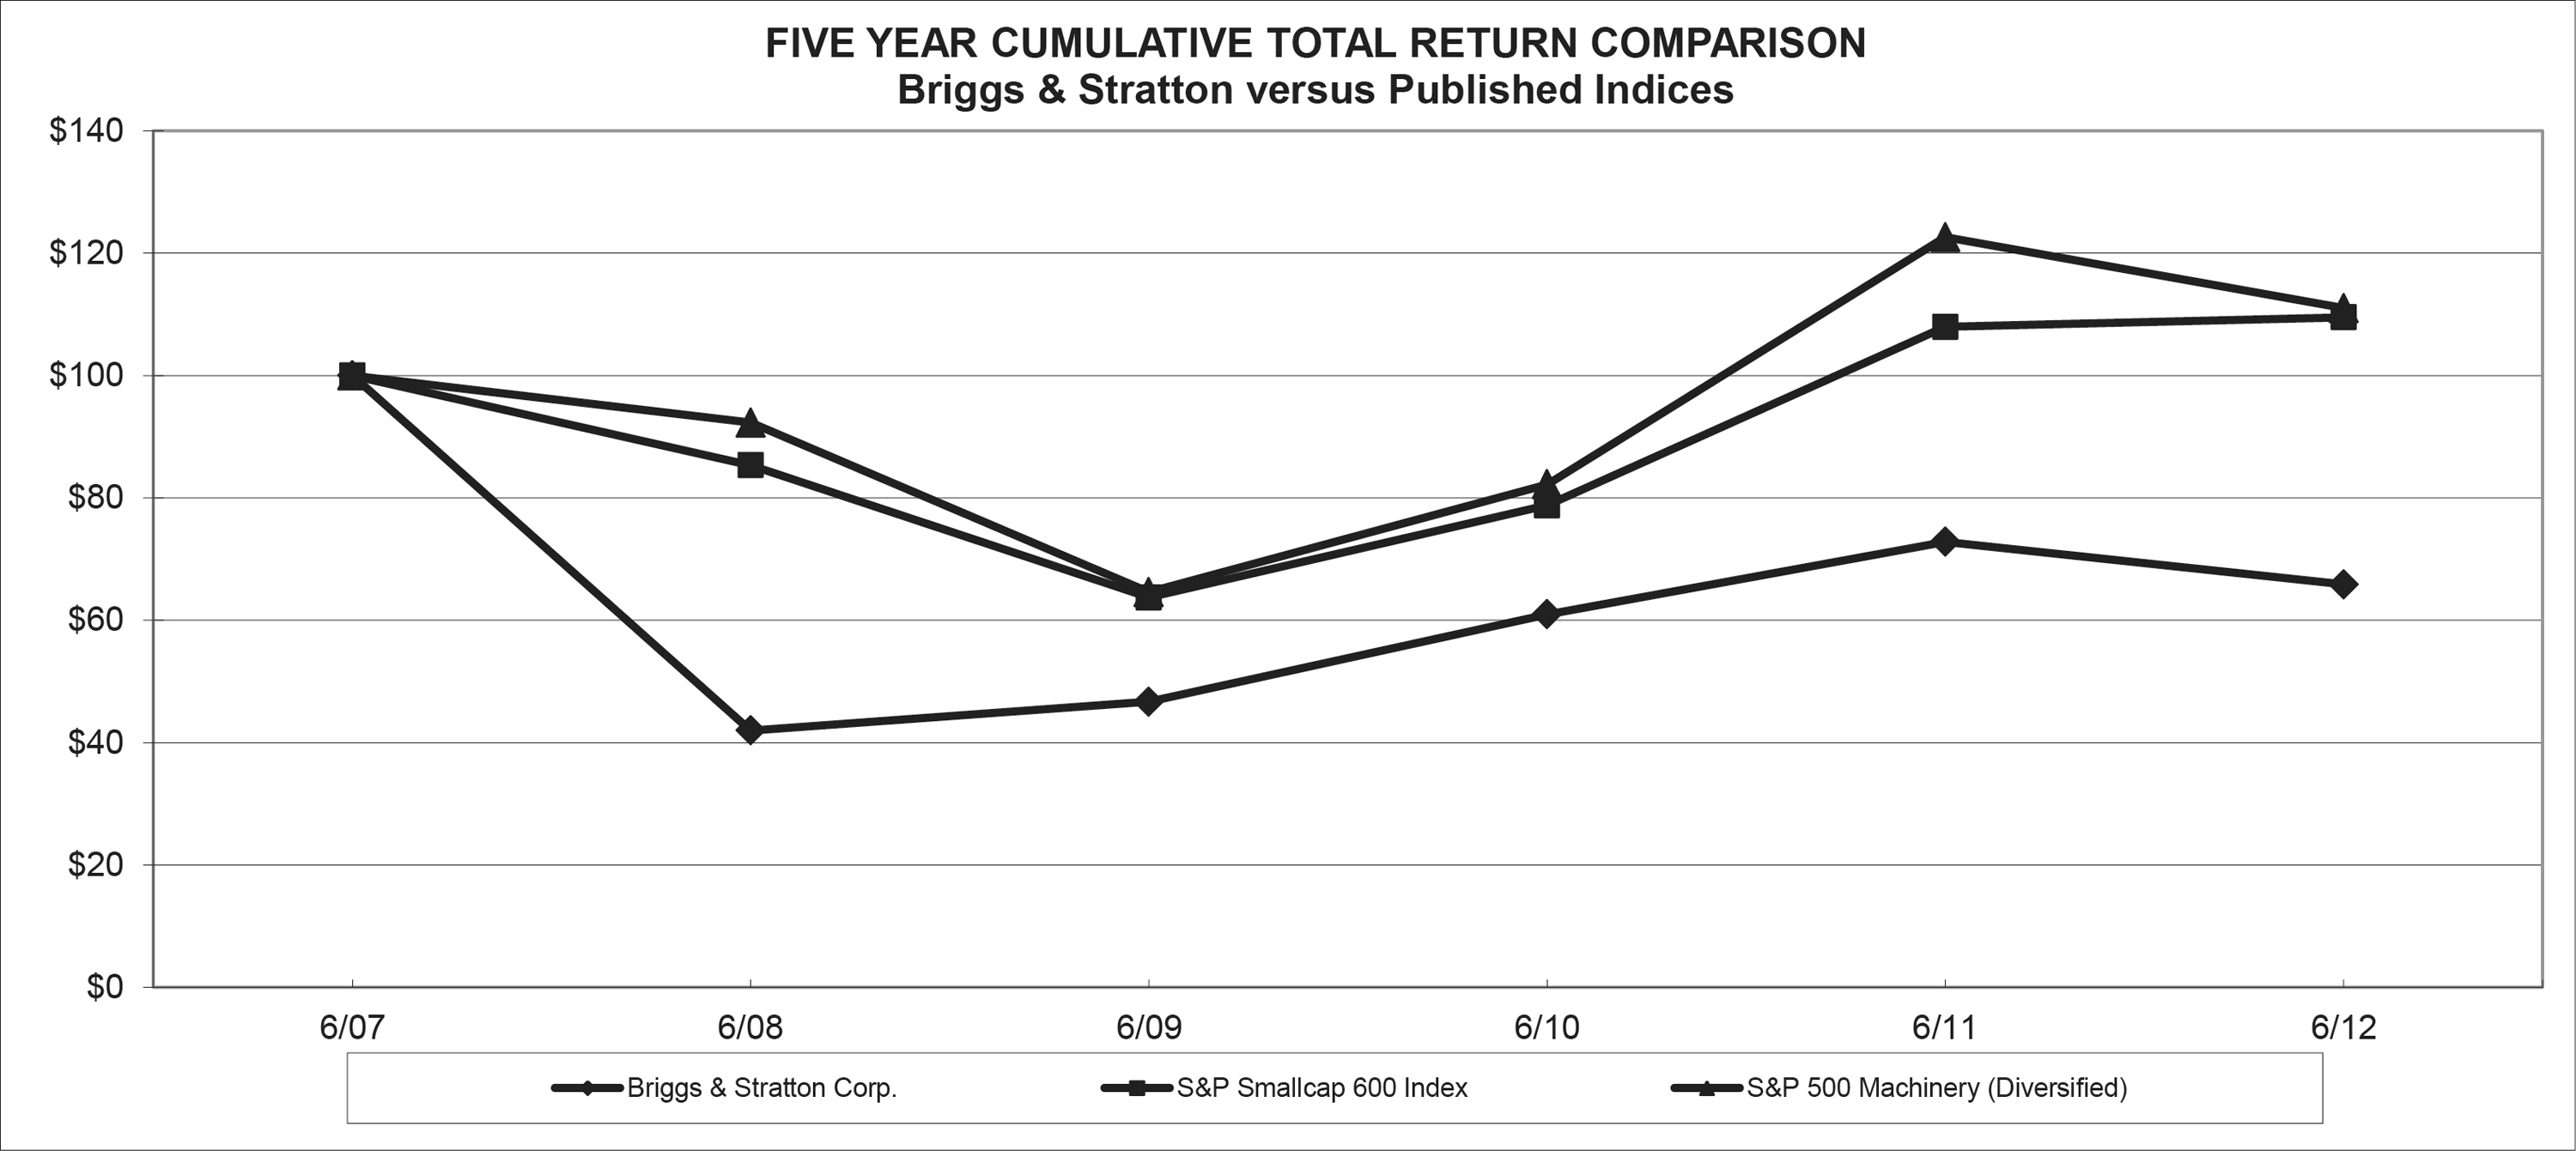
Five-year Stock Performance Graph
The graph below shows the cumulative total stockholder return of an investment of $100 (and the reinvestment of any dividends thereafter) at the close of business on June 30, 2007 in each of Briggs & Stratton common stock, the Standard & Poor's (S&P) Smallcap 600 Index and the S&P Machinery Index.
15
ITEM 6. | SELECTED FINANCIAL DATA |
Fiscal Year |
| 2012 |
| 2011 |
| 2010 |
| 2009 |
| 2008 | ||||||||||
(dollars in thousands, except per share data) |
|
|
|
|
|
|
|
|
|
| ||||||||||
SUMMARY OF OPERATIONS (1) |
|
|
|
|
|
|
|
|
|
| ||||||||||
NET SALES |
| $ | 2,066,533 | |
| $ | 2,109,998 | |
| $ | 2,027,872 | |
| $ | 2,092,189 | |
| $ | 2,151,393 | |
GROSS PROFIT |
| 336,725 | |
| 398,316 | |
| 379,935 | |
| 333,679 | |
| 307,316 | | |||||
PROVISION FOR INCOME TAXES |
| 867 | |
| 7,699 | |
| 12,458 | |
| 8,437 | |
| 7,009 | | |||||
NET INCOME |
| 29,006 | |
| 24,355 | |
| 36,615 | |
| 31,972 | |
| 22,600 | | |||||
EARNINGS PER SHARE OF COMMON STOCK: |
|
|
|
|
|
|
|
|
|
| ||||||||||
Basic Earnings |
| 0.58 | |
| 0.49 | |
| 0.73 | |
| 0.64 | |
| 0.46 | | |||||
Diluted Earnings |
| 0.57 | |
| 0.48 | |
| 0.73 | |
| 0.64 | |
| 0.46 | | |||||
PER SHARE OF COMMON STOCK: |
|
|
|
|
|
|
|
|
|
| ||||||||||
Cash Dividends |
| 0.44 | |
| 0.44 | |
| 0.44 | |
| 0.77 | |
| 0.88 | | |||||
Shareholders' Investment |
| $ | 12.91 | |
| $ | 14.85 | |
| $ | 13.10 | |
| $ | 14.01 | |
| $ | 16.90 | |
WEIGHTED AVERAGE NUMBER OF SHARES OF COMMON STOCK OUTSTANDING (in 000's) |
| 48,965 | |
| 49,677 | |
| 49,668 | |
| 49,572 | |
| 49,549 | | |||||
DILUTED NUMBER OF SHARES OF COMMON STOCK OUTSTANDING (in 000's) |
| 49,909 | |
| 50,409 | |
| 50,064 | |
| 49,725 | |
| 49,652 | | |||||
OTHER DATA (1) |
|
|
|
|
|
|
|
|
|
| ||||||||||
SHAREHOLDERS' INVESTMENT |
| $ | 631,970 | |
| $ | 737,943 | |
| $ | 650,577 | |
| $ | 694,684 | |
| $ | 837,523 | |
LONG-TERM DEBT |
| 225,000 | |
| 225,000 | |
| - | |
| 281,104 | |
| 365,555 | | |||||
CAPITAL LEASES |
| 133 | |
| 571 | |
| 1,041 | |
| 1,807 | |
| 1,677 | | |||||
TOTAL ASSETS |
| 1,608,231 | |
| 1,666,218 | |
| 1,690,057 | |
| 1,619,023 | |
| 1,833,294 | | |||||
PLANT AND EQUIPMENT |
| 1,026,845 | |
| 1,016,892 | |
| 979,898 | |
| 991,682 | |
| 1,012,987 | | |||||
PLANT AND EQUIPMENT, NET OF ACCUMULATED DEPRECIATION |
| 301,249 | |
| 329,225 | |
| 337,763 | |
| 360,175 | |
| 391,833 | | |||||
PROVISION FOR DEPRECIATION |
| 60,297 | |
| 59,920 | |
| 62,999 | |
| 63,981 | |
| 65,133 | | |||||
EXPENDITURES FOR PLANT AND EQUIPMENT |
| 49,573 | |
| 59,919 | |
| 44,443 | |
| 43,027 | |
| 65,513 | | |||||
WORKING CAPITAL (2) |
| $ | 605,591 | |
| $ | 634,356 | |
| $ | 342,132 | |
| $ | 561,431 | |
| $ | 644,935 | |
Current Ratio |
| 3.0 to 1 | |
| 2.8 to 1 | |
| 1.6 to 1 | |
| 2.9 to 1 | |
| 2.9 to 1 | | |||||
NUMBER OF EMPLOYEES AT YEAR-END |
| 6,321 | |
| 6,716 | |
| 6,362 | |
| 6,847 | |
| 7,145 | | |||||
NUMBER OF SHAREHOLDERS AT YEAR-END |
| 3,184 | |
| 3,289 | |
| 3,453 | |
| 3,509 | |
| 3,545 | | |||||
QUOTED MARKET PRICE: |
|
|
|
|
|
|
|
|
|
| ||||||||||
High |
| $ | 20.81 | |
| $ | 24.18 | |
| $ | 24.26 | |
| $ | 21.51 | |
| $ | 33.40 | |
Low |
| $ | 12.36 | |
| $ | 16.50 | |
| $ | 12.89 | |
| $ | 11.13 | |
| $ | 12.80 | |
(1) | The amounts include the acquisition of Victa Lawncare Pty. Limited since June 30, 2008. |
(2) | Included in working capital as of June 27, 2010 is a Current Maturity of Long-Term Debt of $203.5 million. |
16
ITEM 7. | MANAGEMENT'S DISCUSSION AND ANALYSIS OF FINANCIAL CONDITION AND RESULTS OF OPERATIONS |
Results of Operations
FISCAL 2012 COMPARED TO FISCAL 2011
Net Sales
Consolidated net sales for fiscal 2012 were $2.1 billion, a decrease of $43.5 million, or 2.1% when compared to fiscal 2011.
Engines segment net sales for fiscal 2012 were $1.3 billion, which was lower by $89.6 million or 6.4% compared to fiscal 2011. This decrease in net sales was primarily driven by an 11% reduction in shipment volumes of engines to OEMs for lawn and garden products in the North American and European markets due to drought conditions in North America and economic uncertainty in Europe leading to reduced consumer purchases of lawn and garden equipment and unfavorable foreign exchange of $8.7 million primarily related to the Euro. This was partially offset by increased engine pricing, a favorable mix of product shipped that reflected proportionally larger volumes of units used on snow throwers and portable and standby generators.
Products segment net sales for fiscal 2012 were $952.1 million, an increase of $73.1 million or 8.3% from fiscal 2011. The increase in net sales was primarily due to increased shipments of portable and standby generators due to widespread power outages in the U.S. as a result of landed hurricane Irene and a subsequent snow storm on the United States East Coast earlier in the fiscal year, increased shipments of snow equipment after channel inventories were depleted from the prior selling season, improved pricing, a favorable mix of lawn and garden sales through the dealer channel and favorable foreign exchange of $2.3 million. This increase was partially offset by reduced shipment volumes of riding lawn and garden equipment domestically and reduced volume in the international markets. There were no landed hurricanes in fiscal 2011.
Gross Profit
The consolidated gross profit percentage was 16.3% in fiscal 2012, down from 18.9% in the same period last year.
The Engines segment gross profit percentage for fiscal 2012 was 19.1%, which was 3.7% lower compared to fiscal 2011. The gross profit percentage was unfavorably impacted by 0.8% due to reduced absorption on a 13% reduction in production volumes, 0.5% from unfavorable foreign exchange, 3.0% from higher manufacturing spending associated with rising commodity costs and start-up costs of $8.6 million associated with launching our Phase III emissions compliant engines, and 1.1% due to $14.3 million of restructuring charges. This reduction was partially offset by a 1.7% benefit due to improved engine pricing and a favorable mix of products sold.
The Products segment gross profit percentage for fiscal 2012 was 9.1%, which was 0.3% higher compared to fiscal 2011. The gross profit percentage improved by 3.1% from increased pricing and a favorable mix of lawn and garden sales through the dealer channel, 1.5% due to production operational improvements of $13.9 million and 1.7% resulted from improved absorption on higher production volumes. This was offset by a decrease of 2.8% due to increased commodity costs and 3.2% due to $30.5 million of restructuring charges.
Engineering, Selling, General and Administrative Costs
Engineering, selling, general and administrative expenses were $290.4 million in fiscal 2012, a decrease of $6.7 million or 2.2% from fiscal 2011.
The Engines segment engineering, selling, general and administrative expenses were $179.7 million in fiscal 2012, a decrease of $18.9 million from fiscal 2011 primarily due to lower employee compensation expense and a planned reduction of spend in advertising costs and professional services in response to the softness in the global markets.
17
The Products segment engineering, selling, general and administrative expenses were $110.7 million in fiscal 2012, an increase of $12.2 million from fiscal 2011. The increase was attributable to greater selling expense to support investments in international growth, higher employee compensation expense, and $0.7 million higher bad debt expense recorded in fiscal 2012 primarily attributable to distributors in the European market.
Restructuring Actions
In January 2012, the Company announced plans to reduce manufacturing capacity through closure of its Newbern, Tennessee and Ostrava, Czech Republic plants as well as the reconfiguration of its plant in Poplar Bluff, Missouri. In April 2012, the Company announced plans to further reduce manufacturing costs through consolidation of its Auburn, Alabama manufacturing facility as well as the reduction of approximately 10% of the Company's salaried employees. During fiscal 2012, the Company completed manufacturing operations at its Newbern, Tennessee and Ostrava, Czech Republic plants, carried out the reconfiguration of the Poplar Bluff, Missouri plant and implemented the salaried employee reductions. Pre-tax costs of all restructuring actions totaled $49.9 million in fiscal 2012, of which $44.8 million were included in gross profit as previously mentioned.
Additionally, beginning in fiscal 2013, as previously announced, the Company will no longer pursue placement of lawn and garden products at national mass retailers. The Engines segment will continue to support lawn and garden equipment OEMs who provide lawn and garden equipment to these retailers. The Products segment will continue to focus on innovative, higher margin products that are sold through our network of Simplicity, Snapper and Ferris dealers and regional retailers. The Company will also continue to sell pressure washers and portable and standby generators through the U.S. mass retail channel.
Interest Expense
For fiscal 2012, interest expense was $4.8 million lower compared to fiscal 2011 due to $3.9 million of pre-tax charges associated with the refinancing of Senior Notes in fiscal 2011, which did not recur in fiscal 2012, as well as lower average outstanding borrowings at slightly higher weighted average interest rates in fiscal 2012.
Provision for Income Taxes
The effective tax rate for fiscal 2012 was 2.9% compared to 24.0% reported the same period one year ago. The decrease in the effective tax rate for fiscal 2012 compared to fiscal 2011 was primarily due to a net benefit of $5.6 million associated with restructuring charges incurred in connection with closing the Company's Ostrava plant facility and a net benefit of $5.1 million due to the expiration of a non-U.S. statute of limitation period during fiscal 2012 and the settlement of U.S. audits.
FISCAL 2011 COMPARED TO FISCAL 2010
Net Sales
Consolidated net sales for fiscal 2011 were $2.1 billion, an increase of $82.1 million or 4.0% when compared to fiscal 2010.
Engines segment net sales for fiscal 2011 were approximately $1.4 billion, which was $39.1 million or 2.9% higher than the same period in fiscal 2010 despite a 2.1% decline in total unit shipment volumes. This increase from the same period in fiscal 2010 is primarily due to higher international engine unit shipments, a favorable mix of product shipped that reflected proportionately larger volumes of units used on commercial applications, improved engine pricing and a $4.7 million foreign currency benefit, partially offset by reduced engine shipments primarily to customers in North America.
Products segment net sales for fiscal 2011 were $879.0 million, which was $35.3 million or 4.2% higher than the same period in fiscal 2010. This improvement was primarily due to increased sales in our Australia and Europe markets, partially offset by reduced unit shipment volumes of lawn and garden equipment, pressure washers and portable generators in the domestic market.
18
Gross Profit
The consolidated gross profit percentage was 18.9% in fiscal 2011, up from 18.7% in fiscal 2010.
The Engines segment gross profit percentage was 22.8% for fiscal 2011, an improvement from 22.1% in fiscal 2010. This improvement was due to a favorable mix of products shipped, improved engine pricing, increased manufacturing efficiencies, a $5.4 million foreign currency benefit and increased absorption on 4.0% higher production volumes, partially offset by higher commodity costs and increased manufacturing wages and benefits, including a $9.6 million increase in pension benefits expense.
The Products segment gross profit percentage decreased to 8.8% for fiscal 2011 from 10.2% in fiscal 2010. The decline between years resulted from higher manufacturing spending and budget conscious customers purchasing lower margin units, partially offset by increased sales of premium dealer lawn and garden products, increased unit pricing, and a $7.2 million foreign currency benefit. The increase in manufacturing spending relates to higher commodity costs, manufacturing inefficiencies in the first half of fiscal 2011 in launching new products and increased warranty, and increased freight expenses, partially offset by $8.0 million in incremental cost savings associated with the closure of our Jefferson, Wisconsin manufacturing facility in fiscal 2010.
Engineering, Selling, General and Administrative Costs
Engineering, selling, general and administrative expenses were $297.1 million in fiscal 2011, an increase of $16.9 million or 6% from fiscal 2010.
The Engines segment engineering, selling, general and administrative expenses were $198.6 million in fiscal 2011, an increase of $12.5 million from fiscal 2010. The increase was due to higher international selling expenses and increased salaries and benefits, which included a $7.2 million increase in pension benefits expense.
The Products segment fiscal 2011 engineering, selling, general and administrative expenses of $98.5 million increased by $7.3 million in fiscal 2011 primarily related to increased international selling expenses and $1.7 million of unfavorable foreign currency.
Goodwill Impairment
During the fourth quarter of fiscal 2011, the Company performed its annual goodwill impairment testing. Based on a combination of factors, including the influence of prolonged macro-economic conditions on the lawn and garden market in the U.S. and the operating results of the Products segment which lacked the benefit of certain weather related events that are favorable to the business during the past two years, the Company's forecasted cash flow estimates used in the goodwill assessment were adversely impacted. As a result, the Company concluded that the carrying value of the Products reporting unit exceeded its fair value. The non-cash goodwill impairment charge recorded in the fourth quarter of fiscal 2011 was $49.5 million, which was determined by comparing the carrying value of the reporting unit's goodwill with the implied fair value of goodwill for the reporting unit. This impairment charge is a non-cash expense that did not adversely affect the Company's debt position, cash flow, liquidity or compliance with financial covenants under its credit facilities. No impairment charges were recorded within the Engines segment.
Restructuring Actions
In fiscal 2011, the Company made organization changes that involved a reduction of salaried employee headcount. These organization changes resulted in restructuring charges of $3.5 million, consisting of $1.3 million due to the modification of certain vesting conditions for the Company's stock incentive awards and approximately $2.2 million for severance and other related employee separation costs associated with the reduction.
Interest Expense
Interest expense was $3.2 million lower for fiscal 2011 as compared to fiscal 2010 due to lower average outstanding borrowings and the reduced interest rate associated with the 6.875% Senior Notes due 2020 that were issued in December 2010, partially offset by $3.9 million of pre-tax charges related to the redemption premium on the 8.875% Senior Notes and the write-off of related deferred financing costs.
19
Other Income
Other income increased $0.7 million in fiscal 2011 as compared to fiscal 2010. This increase was primarily due to a $1.0 million increase in equity in earnings from unconsolidated affiliates.
Provision for Income Taxes
The effective tax rate was 24.0% and 25.4% for fiscal 2011 and fiscal 2010, respectively. The fiscal 2011 income tax provision includes $15.1 million of income tax benefit related to the $49.5 million non-cash goodwill impairment charge. Approximately $10.6 million of the goodwill impairment was related to non-deductible goodwill associated with past stock acquisitions for which a tax benefit was not recorded. The remaining goodwill impairment generated the $15.1 million of tax benefit. Due to the significant impact the impairment charge had on the effective tax rate, the Company believes the tax benefit and the effective tax rate excluding the $49.5 million impairment charge are more meaningful comparisons to the fiscal 2010 period. Excluding the non-cash goodwill impairment charge, the effective tax rate was 28.0% and 25.4% for fiscal 2011 and fiscal 2010, respectively. The annual fluctuations reflect the impact of changes in foreign earnings at different tax rates, the taxation of dividends from foreign operations as well as the resolution of certain tax matters.
Liquidity and Capital Resources
FISCAL YEARS 2012, 2011 AND 2010
Net cash provided by operating activities were $66 million, $157 million and $244 million in fiscal 2012, 2011 and 2010, respectively.
Cash flows provided by operating activities in fiscal 2012 were $91 million lower compared to fiscal 2011. The decrease in cash provided by operating activities was primarily related to a $32 million reduction in the decrease in accounts receivable compared to the previous year, which was partly due to $19 million of delayed funding under the Company's dealer inventory financing facility with GE Capital Commercial Distribution Finance implemented in fiscal 2012, and cash contributions to the pension plan of $29 million in fiscal 2012.
The fiscal 2011 net cash provided by operating activities were $87 million lower than fiscal 2010. The decrease in net cash provided by operating activities was primarily due to working capital requirements to replenish inventory from lower levels at the end of fiscal 2010 and due to timing of payments associated with accounts receivable, accounts payable and accrued liabilities.
Net cash used in investing activities were $51 million, $60 million and $44 million in fiscal 2012, 2011 and 2010, respectively. These cash flows include capital expenditures of $50 million, $60 million and $44 million in fiscal 2012, 2011 and 2010, respectively. The capital expenditures relate primarily to reinvestment in equipment, capacity additions and new products.
Net cash used in financing activities were $63 million, $4 million and $99 million in fiscal 2012, 2011 and 2010, respectively. In fiscal 2012, the Company repurchased treasury stock at a total cost of $39 million. There were no treasury stock repurchases in fiscal years 2011 or 2010. In fiscal 2012, as disclosed in Note 9 of the Notes to Consolidated Financial Statements, the Company incurred $2 million of debt issuance costs associated with the refinancing of its revolving credit facility. In fiscal 2011, as disclosed in Note 9 of the Notes to Consolidated Financial Statements, the Company issued $225 million aggregate principal amount of 6.875% Senior Notes due December 15, 2020 during fiscal 2011, the net proceeds of which were primarily used to redeem the $201 million outstanding principal amount of the 8.875% Senior Notes due March 15, 2011. The Company incurred $5 million of deferred financing costs in connection with the issuance of the 6.875% Senior Notes in fiscal 2011. In fiscal 2010, the Company reduced its outstanding debt by $78 million. The Company paid cash dividends on the common stock of $22 million in each of fiscal years 2012, 2011 and 2010.
20
Future Liquidity and Capital Resources
In December 2010, the Company issued $225 million aggregate principal amount of 6.875% Senior Notes due December 2020. Net proceeds were primarily used to redeem the remaining outstanding principal of the 8.875% Senior Notes due March 2011.
In October 2011, the Company entered into a $500 million multicurrency credit agreement (the "Revolver"). The Revolver replaced the Company's previous amended and restated multicurrency credit agreement dated as of July 12, 2007. The Revolver has a term of five years and all outstanding borrowings on the Revolver are due and payable on October 13, 2016. The initial maximum availability under the revolving credit facility is $500 million. Availability under the revolving credit facility is reduced by outstanding letters of credit. The Company may from time to time increase the maximum availability under the revolving credit facility by up to $250 million if certain conditions are satisfied. There were no borrowings under the Revolver as of July 1, 2012.
In August 2012, subsequent to the end of fiscal 2012, the Company announced that its Board of Directors declared an increase in the quarterly dividend from $0.11 per share to $0.12 per share on its common stock, payable on or after October 1, 2012 to shareholders of record at the close of business on August 20, 2012.
In August 2011, the Board of Directors of Briggs & Stratton authorized up to $50 million in funds for use in a common share repurchase program with an expiration of June 30, 2013. The common share repurchase program authorizes the purchase of shares of the Company's common stock on the open market or in private transactions from time to time, depending on market conditions and certain governing loan covenants. As of the end of fiscal 2012, the Company repurchased 2,409,972 shares on the open market at an average price of $16.30 per share. Subsequent to the end of fiscal 2012, the Company repurchased an additional 479,997 shares at an average price of $17.40 per share.
In August 2012, subsequent to the end of fiscal 2012, the Board of Directors of Briggs & Stratton authorized an additional $50 million in funds associated with the common share repurchase program and an extension of the expiration date to June 30, 2014. The common share repurchase program authorizes the purchase of shares of the Company's common stock on the open market or in private transactions from time to time, depending on market conditions and certain governing loan covenants.
The Company expects capital expenditures to be approximately $50 to $60 million in fiscal 2013. These anticipated expenditures reflect our plans to continue to reinvest in efficient equipment and innovative new products.
On July 6, 2012, the Moving Ahead for Progress in the 21st Century Act (MAP-21 Act) was signed into law. The MAP-21 Act included certain pension-related provisions which included changes to the methodology used to determine discount rates for ERISA funding purposes for qualified defined benefit pension plans. Based on historical interest rates, the MAP-21 Act allows plan sponsors to utilize a higher discount rate to value pension liabilities, which results in lower required pension plan contributions under ERISA. Based upon current regulations and actuarial studies the Company is required to make minimum contributions to the qualified pension plan of $45 million in fiscal 2013 . The Company may be required to make further contributions in future years depending on the actual return on plan assets and the funded status of the plan in future periods.
Management believes that available cash, cash generated from operations, existing lines of credit and access to debt markets will be adequate to fund the Company's capital requirements and operational needs for the foreseeable future.
The Revolver and the 6.875% Senior Notes contain restrictive covenants. These covenants include restrictions on the Company's ability to: pay dividends; repurchase shares; incur indebtedness; create liens; enter into sale and leaseback transactions; consolidate or merge with other entities; sell or lease all or substantially all of its assets; and dispose of assets or the proceeds of sales of its assets. The Revolver contains financial covenants that require the Company to maintain a minimum interest coverage ratio and impose a maximum average leverage ratio. As of July 1, 2012 , the Company was in compliance with these covenants.
21
Financial Strategy
Management believes that the value of the Company is enhanced if the capital invested in operations yields a cash return that is greater than the cost of capital. Consequently, management's first priority is to reinvest capital into physical assets and products that maintain or grow the global cost leadership and market positions that the Company has achieved, and drive the economic value of the Company. Management's next financial objective is to identify strategic acquisitions or alliances that enhance revenues and provide a superior economic return. Finally, management believes that when capital cannot be invested for returns greater than the cost of capital, the Company should return capital to the capital providers through dividends and/or share repurchases.
Off-Balance Sheet Arrangements
The Company has no off-balance sheet arrangements or significant guarantees to third parties not fully recorded in our Balance Sheets or fully disclosed in our Notes to Consolidated Financial Statements. The Company's significant contractual obligations include our debt agreements and certain employee benefit plans.
Contractual Obligations
A summary of the Company's expected payments for significant contractual obligations as of July 1, 2012 is as follows (in thousands):
|
| Total |
| Fiscal 2013 |
| Fiscal 2014-2015 |
| Fiscal 2016-2017 |
| Thereafter | ||||||||||
Long-Term Debt |
| $ | 225,000 | |
| $ | - | |
| $ | - | |
| $ | - | |
| $ | 225,000 | |
Interest on Long-Term Debt |
| 115,372 | |
| 15,468 | |
| 30,938 | |
| 30,938 | |
| 38,028 | | |||||
Capital Leases |
| 133 | |
| 133 | |
| - | |
| - | |
| - | | |||||
Operating Leases |
| 42,549 | |
| 12,874 | |
| 18,700 | |
| 6,801 | |
| 4,174 | | |||||
Purchase Obligations |
| 58,788 | |
| 58,788 | |
| - | |
| - | |
| - | | |||||
Other Liabilities (a) |
| 153,200 | |
| 44,700 | |
| 40,000 | |
| 68,500 | |
| - | | |||||
|
| $ | 595,042 | |
| $ | 131,963 | |
| $ | 89,638 | |
| $ | 106,239 | |
| $ | 267,202 | |
(a) Includes an estimate of future expected funding requirements related to our pension plans. Any further funding requirements for
pension plans beyond fiscal 2017 cannot be estimated at this time. Because their future cash outflows are uncertain, liabilities for
unrecognized tax benefits and other sundry items are excluded from the table above.
Critical Accounting Policies
The Company's critical accounting policies are more fully described in Note 2 and Note 15 of the Notes to Consolidated Financial Statements. As discussed in Note 2, the preparation of financial statements in conformity with accounting principles generally accepted in the U.S. ("GAAP") requires management to make estimates and assumptions about future events that affect the amounts reported in the financial statements and accompanying notes. Future events and their effects cannot be determined with absolute certainty. Therefore, the determination of estimates requires the exercise of judgment. Actual results inevitably will differ from those estimates, and such differences may be material to the financial statements.
The Company believes the following critical accounting policies represent the more significant judgments and estimates used in preparing the consolidated financial statements. There have been no material changes made to the Company's critical accounting policies and estimates during the periods presented in the consolidated financial statements.
Goodwill and Other Intangible Assets
Goodwill represents the excess of purchase price over tangible and intangible assets acquired less liabilities assumed arising from business combinations. Goodwill is not amortized. The Company evaluates goodwill and other indefinite-lived intangible assets for impairment annually as of the end of the fourth fiscal quarter, or more frequently if events or circumstances indicate that the assets may be impaired, by applying a fair value based test and, if impairment occurs, the amount of impaired goodwill is written off immediately.
22
Goodwill impairment is determined using a two-step process. The first step of the goodwill impairment test is to identify a potential impairment by comparing the carrying values of each of the Company's reporting units to their estimated fair values as of the test dates. The Company has determined that its reporting units are the same as its reportable segments, Engines and Products. The estimates of fair value of the reporting units are computed using an income approach. The income approach utilizes a multi-year forecast of estimated cash flows and a terminal value at the end of the cash flow period. The forecast period assumptions consist of internal projections that are based on the Company's budget and long-range strategic plan. The discount rate used at the test date is the weighted-average cost of capital which reflects the overall level of inherent risk of the reporting unit and the rate of return an outside investor would expect to earn. The sum of the fair values of the reporting units is reconciled to the Company's current market capitalization (based upon the Company's trailing 20-day average stock price) plus an estimated control premium.
If the fair value of a reporting unit exceeds its book value, goodwill of the reporting unit is not deemed impaired and the second step of the impairment test is not performed. If the book value of a reporting unit exceeds its fair value, the second step of the goodwill impairment test is performed to measure the amount of impairment loss, if any. The second step of the goodwill impairment test compares the implied fair value of the reporting unit's goodwill with the carrying amount of that goodwill. The implied fair value of goodwill is determined by allocating the estimated fair value of the reporting unit to the estimated fair value of its existing tangible assets and liabilities as well as existing identified intangible assets and previously unrecognized intangible assets in a manner similar to a purchase price allocation. The unallocated portion of the estimated fair value of the reporting unit is the implied fair value of goodwill. If the carrying amount of the reporting unit's goodwill exceeds the implied fair value of that goodwill, an impairment loss is recognized in an amount equal to that excess.
As discussed in Note 5 to the consolidated financial statements, the Company performed the annual impairment test on its Engines and Products reporting units as of July 1, 2012. The impairment testing performed by the Company at July 1, 2012 indicated that the estimated fair value of each reporting unit exceeded its corresponding carrying amount, including recorded goodwill and as such, no further impairment existed. Such impairment testing indicated that the estimated fair value of the Products reporting unit exceeded its corresponding carrying amount by 3%. The estimated fair value of the Engines reporting unit was substantially in excess of its carrying value. In fiscal 2011, the impairment analysis determined that the goodwill balance of the Products reporting unit was impaired. As a result, the Company recognized a $49.5 million non-cash goodwill impairment charge during fiscal 2011. The assumptions included in the impairment test require judgment; and changes to these inputs could impact the results of the calculation. Other than management's internal projections of future cash flows, the primary assumptions used in the impairment test were the weighted-average cost of capital, long-term growth rates and the control premium.
Trademarks are not amortized. If impairment occurs, the impaired amount of the trademark is written off immediately. For purposes of the trademark impairment analysis, the Company performs its assessment of fair value based on an income approach using the relief-from-royalty method. This methodology assumes that, in lieu of ownership, a third party would be willing to pay a royalty in order to exploit the related benefits of these types of assets. The Company determines the fair value of each trademark by applying a royalty rate to a projection of net sales discounted using a risk adjusted cost of capital. The Company believes the relief-from-royalty method to be an acceptable methodology due to its common use by valuation specialists in determining the fair value of intangible assets. Sales growth rates are determined after considering current and future economic conditions, recent sales trends, discussions with customers, planned timing of new product launches and many other variables. Each royalty rate is based on profitability of the business to which it relates and observed market royalty rates.
The methods of assessing fair value for goodwill and trademark impairment purposes require significant judgments to be made by management. Although the Company's cash flow forecasts are based on assumptions that are considered reasonable by management and consistent with the plans and estimates management is using to operate the underlying businesses, there is significant judgment in determining the expected future cash flows attributable to these businesses.
23
The growth rates and gross profit margins used for the terminal value calculations and the discount rates of the respective reporting units as of July 1, 2012 were as follows:
|
| Terminal Growth Rate |
| Terminal Gross Profit Margin |
| Discount Rate |
Engines |
| 2.5% |
| 22.3% |
| 10.6% |
Products |
| 3.0% |
| 18.1% |
| 13.0% |
Changes in such estimates or the application of alternative assumptions could produce significantly different results.
Definite-lived intangible assets consist primarily of customer relationships and patents. These definite-lived intangible assets are amortized over their estimated useful lives and are subject to impairment testing if events or changes in circumstances indicate that an asset may be impaired.
Income Taxes
The Company's estimate of income taxes payable, deferred income taxes, tax contingencies and the effective tax rate is based on a complex analysis of many factors including interpretations of federal, state and foreign income tax laws, the difference between tax and financial reporting bases of assets and liabilities, estimates of amounts currently due or owed in various jurisdictions, and current accounting standards. Valuation allowances are recorded to reduce deferred tax assets when it is more likely than not that a tax benefit will not be realized. We review and update our estimates on a quarterly basis as facts and circumstances change and actual results are known. In addition, federal, state and foreign taxing authorities periodically review the Company's estimates and interpretation of income tax laws. Adjustments to the effective income tax rate and recorded tax related assets and liabilities may occur in future periods if actual results differ significantly from original estimates and interpretations.
Pension and Other Postretirement Plans
The pension benefit obligation and related pension expense or income are impacted by certain actuarial assumptions, including the discount rate and the expected rate of return on plan assets. These rates are evaluated on an annual basis considering such factors as market interest rates and historical asset performance, which is essential in the current volatile market. Actuarial valuations at July 1, 2012 used a discount rate of 4.45% and an expected rate of return on plan assets of 8.50% . Our discount rate was selected using a methodology that matches plan cash flows with a selection of Moody's Aa or higher rated bonds, resulting in a discount rate that better matches a bond yield curve with comparable cash flows. A 0.25% decrease in the discount rate would decrease annual pension service and interest costs by approximately $0.6 million. A 0.25% decrease in the expected return on plan assets would increase our annual pension service and interest costs by approximately $2.2 million. In estimating the expected return on plan assets, the Company considers the historical returns on plan assets, adjusted for forward looking considerations, including inflation assumptions and active management of the plan's invested assets, knowing that our investment performance has been in the top decile compared to other plans. Changes in the discount rate and return on assets can have a significant effect on the funded status of our pension plans, stockholders' equity and related expense. We cannot predict these changes in discount rates or investment returns and, therefore, cannot reasonably estimate whether the impact in subsequent years will be significant.
The funded status of the Company's pension plan is the difference between the projected benefit obligation and the fair value of its plan assets. The projected benefit obligation is the actuarial present value of all benefits expected to be earned by the employees' service adjusted for future potential wage increases. At July 1, 2012 the fair value of plan assets was less than the projected benefit obligation by approximately $299 million .
On July 6, 2012, the Moving Ahead for Progress in the 21st Century Act (MAP-21 Act) was signed into law. The MAP-21 Act included certain pension-related provisions which included changes to the methodology used to determine discount rates for ERISA funding purposes for qualified defined benefit pension plans. Based on historical interest rates, the MAP-21 Act allows plan sponsors to utilize a higher discount rate to value pension liabilities, which results in lower required pension plan contributions under ERISA. Based upon
24
current regulations and actuarial studies the Company is required to make minimum contributions to the qualified pension plan of $45 million in fiscal 2013 . The Company may be required to make further contributions in future years depending on the actual return on plan assets and the funded status of the plan in future periods.
The other postretirement benefits obligation and related expense or income are impacted by certain actuarial assumptions, including the health care trend rate. An increase of one percentage point in health care costs would increase the accumulated postretirement benefit obligation by $2.5 million and would increase the service and interest cost by $0.1 million . A corresponding decrease of one percentage point, would decrease the accumulated postretirement benefit by $2.8 million and decrease the service and interest cost by $0.1 million .
For pension and postretirement benefits, actuarial gains and losses are accounted for in accordance with U.S. GAAP. Refer to Note 15 of the Notes to the Consolidated Financial Statements for additional discussion.
Other Reserves
The reserves for customer rebates, warranty, product liability, inventory and doubtful accounts are fact specific and take into account such factors as specific customer situations, historical experience, and current and expected economic conditions.
New Accounting Pronouncements
In July 2012, the Financial Accounting Standards Board ("FASB") issued Accounting Standards Update ("ASU") No. 2012-02 "Intangibles – Goodwill and Other (Topic 350): Testing Indefinite-Lived Intangible Assets for Impairment," which permits an entity to first assess qualitative factors to determine whether it is more likely than not that an indefinite-lived intangible asset is impaired before performing quantitative impairment testing. The amendments do not change the measurement of impairment losses. This update is effective for fiscal years beginning after September 15, 2012, with early adoption permitted. Management does not expect adoption of this ASU to have a material impact on the Company's results of operations, financial position or cash flow.
In September 2011, the FASB issued ASU No. 2011-08, "Intangibles - Goodwill and Other (Topic 350): Testing Goodwill for Impairment," which permits an entity to make a qualitative assessment of whether it is more likely than not that a reporting unit's fair value is less than its carrying value before applying the two-step goodwill impairment model that is currently in place. If it is determined through the qualitative assessment that a reporting unit's fair value is more likely than not greater than its carrying value, the remaining impairment steps would be unnecessary. The qualitative assessment is optional, allowing companies to go directly to the quantitative assessment. This update is effective for annual and interim goodwill impairment tests performed in fiscal years beginning after December 15, 2011 with early adoption permitted. Management does not expect adoption of this ASU to have a material impact on the Company's results of operations, financial position or cash flow.
In June 2011, the FASB issued ASU No. 2011-05, "Comprehensive Income: Presentation of Comprehensive Income," which amends current comprehensive income guidance. This ASU eliminates the option to present the components of other comprehensive income as part of the statement of shareholders' equity. Instead, it requires entities to report components of comprehensive income in either (1) a continuous statement of comprehensive income or (2) two separate but consecutive statements. Under the two-statement approach, the first statement would include components of net income, which is consistent with the income statement format used today, and the second statement would include components of other comprehensive income ("OCI"). The ASU does not change the items that must be reported in OCI. ASU 2011-05 will be effective for public companies for fiscal years, and interim periods within those years, beginning after December 15, 2011 with early adoption permitted. Management does not expect adoption of this ASU to have a material impact on the Company's results of operations, financial position or cash flow.
25
Other Matters
Labor Agreement
The Company has collective bargaining agreements with its unions. These agreements expire at various times during calendar year 2013.
Emissions
The United States Environmental Protection Agency (EPA), the California Air Resources Board (CARB), Canada and the European Union (EU) have adopted multiple stages of emission standards for small air cooled engines. The Company currently has product offerings that comply with those standards.
In addition, China has adopted emission standards which parallel those adopted by EPA and are being phased in from 2011 to 2013. The Company has specific products that meet these standards and are certified for sale in China. Australia has announced that it will be adopting emission standards. These standards are generally expected to be based on the EPA standards, but a timetable for their adoption has not yet been published. The Company does not anticipate that compliance with either of these emission standards will have a material adverse effect on its financial position or operations as they are expected to be substantially similar to the existing standards adopted by EPA, CARB, Canada and the EU.
ITEM 7A. | QUANTITATIVE AND QUALITATIVE DISCLOSURES ABOUT MARKET RISK |
The Company is exposed to market risk from changes in foreign exchange rates, commodity prices and interest rates. To reduce the risk from changes in certain foreign exchange rates, commodity prices and interest rates, the Company uses financial instruments. The Company does not hold or issue financial instruments for trading purposes.
Foreign Currency
The Company's earnings are affected by fluctuations in the value of the U.S. Dollar against various currencies. The Company purchases components in Euros from third parties and receives Euros for certain products sold to European customers and receives Canadian dollars for certain products sold to Canadian customers. The Yen is used to purchase engines from the Company's joint venture. The Company's foreign subsidiaries' earnings are also influenced by fluctuations of local currencies, including the Australian dollar, against the U.S. dollar as these subsidiaries purchase components and inventory from vendors and the parent in U.S. dollars. Forward foreign exchange contracts are used to partially hedge against the earnings effects of such fluctuations. At July 1, 2012 , the Company had the following forward foreign exchange contracts outstanding with the fair value (gains) losses shown (in thousands):
Hedge Currency |
| Notional Value |
| Fair Market Value |
| Conversion Currency |
| (Gain) Loss at Fair Value | |||||
Australian Dollar |
| 28,258 | |
| $ | 28,494 | |
| U.S. |
| $ | 103 | |
Euro |
| 53,500 | |
| $ | 67,937 | |
| U.S. |
| $ | (1,522 | ) |
Japanese Yen |
| 695,000 | |
| $ | 8,721 | |
| U.S. |
| $ | (40 | ) |
Fluctuations in currency exchange rates may also impact the shareholders' investment in the Company. Amounts invested in the Company's non-U.S. subsidiaries and joint ventures are translated into U.S. dollars at the exchange rates in effect at fiscal year-end. The resulting cumulative translation adjustments are recorded in Shareholders' Investment as Accumulated Other Comprehensive Income. The cumulative translation adjustments component of Shareholders' Investment decreased $13.5 million during fiscal 2012. Using the year-end exchange rates, the total amount invested in non-U.S. subsidiaries on July 1, 2012 was approximately $149.8 million.
26
Commodity Prices
The Company is exposed to fluctuating market prices for commodities, including steel, natural gas, copper and aluminum. The Company has established programs to manage commodity price fluctuations through contracts that fix the price of certain commodities, some of which are financial derivative instruments. The maturities of these contracts coincide with the expected usage of the commodities for periods up to the next twenty-four months.
Interest Rates
The Company is exposed to interest rate fluctuations on its borrowings, depending on general economic conditions.On July 1, 2012 , the Company had the following short-term loan outstanding (in thousands):
Currency |
| Amount |
|
|
| Weighted Average Interest Rate | ||
U.S. Dollars |
| $ | 3,000 | |
|
|
| 3.66% |
This loan has a variable interest rate. Assuming borrowings are outstanding for an entire year, an increase (decrease) of one percentage point in the weighted average interest rate would increase (decrease) interest expense by $30 thousand .
On July 1, 2012 , long-term loans consisted of the following (in thousands):
Description |
| Amount |
| Maturity |
| Weighted Average Interest Rate | ||
6.875% Senior Notes |
| $ | 225,000 | |
| December 2020 |
| 6.875% |
The Senior Notes carry a fixed rate of interest and are therefore not subject to market fluctuation.
The Company is also exposed to interest rate risk associated with programs under which the Company shares the expense of financing certain dealer and distributor inventories through a third party financing source. The Company enters into interest rate swaps to manage a portion of this interest rate risk. The swaps are designated as cash flow hedges and are used to effectively fix the interest payments to a third party financing source, exclusive of lender spreads, ranging from 1.17% to 1.60% for a notional principal amount of $85 million with expiration dates ranging from July 2017 to May 2019.
27
ITEM 8. | FINANCIAL STATEMENTS AND SUPPLEMENTARY DATA |
Consolidated Balance Sheets
AS OF JULY 1, 2012 AND JULY 3, 2011
(in thousands)
ASSETS |
| 2012 |
| 2011 | ||||
CURRENT ASSETS: |
|
|
|
| ||||
Cash and Cash Equivalents |
| $ | 156,075 | |
| $ | 209,639 | |
Receivables, Less Reserves of $5,780 and $4,971, Respectively |
| 223,996 | |
| 249,358 | | ||
Inventories: |
|
|
|
| ||||
Finished Products and Parts |
| 319,977 | |
| 292,527 | | ||
Work in Process |
| 107,632 | |
| 127,358 | | ||
Raw Materials |
| 6,075 | |
| 7,206 | | ||
Total Inventories |
| 433,684 | |
| 427,091 | | ||
Deferred Income Tax Asset |
| 44,527 | |
| 42,163 | | ||
Assets Held for Sale |
| 10,404 | |
| 14,075 | | ||
Prepaid Expenses and Other Current Assets |
| 42,814 | |
| 36,413 | | ||
Total Current Assets |
| 911,500 | |
| 978,739 | | ||
GOODWILL |
| 204,764 | |
| 202,940 | | ||
INVESTMENTS |
| 22,163 | |
| 21,017 | | ||
DEBT ISSUANCE COSTS, Net |
| 5,717 | |
| 4,919 | | ||
OTHER INTANGIBLE ASSETS, Net |
| 87,067 | |
| 89,275 | | ||
LONG-TERM DEFERRED INCOME TAX ASSET |
| 66,951 | |
| 31,001 | | ||
OTHER LONG-TERM ASSETS, Net |
| 8,820 | |
| 9,102 | | ||
PLANT AND EQUIPMENT: |
|
|
|
| ||||
Land and Land Improvements |
| 18,263 | |
| 18,047 | | ||
Buildings |
| 136,352 | |
| 131,765 | | ||
Machinery and Equipment |
| 843,961 | |
| 833,495 | | ||
Construction in Progress |
| 28,269 | |
| 33,585 | | ||
|
| 1,026,845 | |
| 1,016,892 | | ||
Less - Accumulated Depreciation |
| 725,596 | |
| 687,667 | | ||
Total Plant and Equipment, Net |
| 301,249 | |
| 329,225 | | ||
|
| $ | 1,608,231 | |
| $ | 1,666,218 | |
| |
AS OF JULY 1, 2012 AND JULY 3, 2011
(in thousands, except per share data)
LIABILITIES AND SHAREHOLDERS' INVESTMENT |
| 2012 |
| 2011 | ||||
CURRENT LIABILITIES: |
|
|
|
| ||||
Accounts Payable |
| $ | 151,153 | |
| $ | 183,733 | |
Short-Term Debt |
| 3,000 | |
| 3,000 | | ||
Accrued Liabilities: |
|
|
|
| ||||
Wages and Salaries |
| 44,756 | |
| 54,745 | | ||
Warranty |
| 29,597 | |
| 31,668 | | ||
Accrued Postretirement Health Care Obligation |
| 22,891 | |
| 22,576 | | ||
Other |
| 54,512 | |
| 48,661 | | ||
Total Accrued Liabilities |
| 151,756 | |
| 157,650 | | ||
Total Current Liabilities |
| 305,909 | |
| 344,383 | | ||
ACCRUED PENSION COST |
| 296,394 | |
| 191,417 | | ||
ACCRUED EMPLOYEE BENEFITS |
| 25,035 | |
| 24,100 | | ||
ACCRUED POSTRETIREMENT HEALTH CARE OBLIGATION |
| 89,842 | |
| 116,092 | | ||
ACCRUED WARRANTY |
| 16,415 | |
| 14,327 | | ||
OTHER LONG-TERM LIABILITIES |
| 17,666 | |
| 12,956 | | ||
LONG-TERM DEBT |
| 225,000 | |
| 225,000 | | ||
SHAREHOLDERS' INVESTMENT: |
|
|
|
| ||||
Common Stock - Authorized 120,000 Shares $.01 Par Value, Issued 57,854 Shares |
| 579 | |
| 579 | | ||
Additional Paid-In Capital |
| 81,723 | |
| 79,354 | | ||
Retained Earnings |
| 1,099,859 | |
| 1,092,864 | | ||
Accumulated Other Comprehensive Loss |
| (322,704 | ) |
| (243,498 | ) | ||
Treasury Stock at Cost, 9,663 and 7,373 Shares, Respectively |
| (227,487 | ) |
| (191,356 | ) | ||
Total Shareholders' Investment |
| 631,970 | |
| 737,943 | | ||
|
| $ | 1,608,231 | |
| $ | 1,666,218 | |
| |
Consolidated Statements of Earnings
FOR THE FISCAL YEARS ENDED JULY 1, 2012 , JULY 3, 2011 AND JUNE 27, 2010
(in thousands, except per share data)
|
| 2012 |
| 2011 |
| 2010 | ||||||
NET SALES |
| $ | 2,066,533 | |
| $ | 2,109,998 | |
| $ | 2,027,872 | |
COST OF GOODS SOLD |
| 1,685,048 | |
| 1,711,682 | |
| 1,647,937 | | |||
RESTRUCTURING CHARGES |
| 44,760 | |
| - | |
| - | | |||
Gross Profit |
| 336,725 | |
| 398,316 | |
| 379,935 | | |||
ENGINEERING, SELLING, GENERAL AND ADMINISTRATIVE EXPENSES |
| 290,381 | |
| 297,113 | |
| 280,248 | | |||
RESTRUCTURING CHARGES |
| 5,107 | |
| 3,537 | |
| - | | |||
GOODWILL IMPAIRMENT |
| - | |
| 49,450 | |
| - | | |||
LITIGATION SETTLEMENT |
| - | |
| - | |
| 30,600 | | |||
Income from Operations |
| 41,237 | |
| 48,216 | |
| 69,087 | | |||
INTEREST EXPENSE |
| (18,542 | ) |
| (23,318 | ) |
| (26,469 | ) | |||
OTHER INCOME, Net |
| 7,178 | |
| 7,156 | |
| 6,455 | | |||
Income Before Income Taxes |
| 29,873 | |
| 32,054 | |
| 49,073 | | |||
PROVISION FOR INCOME TAXES |
| 867 | |
| 7,699 | |
| 12,458 | | |||
NET INCOME |
| $ | 29,006 | |
| $ | 24,355 | |
| $ | 36,615 | |
EARNINGS PER SHARE DATA: |
|
|
|
|
|
| ||||||
Weighted Average Shares Outstanding |
| 48,965 | |
| 49,677 | |
| 49,668 | | |||
Basic Earnings Per Share |
| $ | 0.58 | |
| $ | 0.49 | |
| $ | 0.73 | |
Diluted Average Shares Outstanding |
| 49,909 | |
| 50,409 | |
| 50,064 | | |||
Diluted Earnings Per Share |
| $ | 0.57 | |
| $ | 0.48 | |
| $ | 0.73 | |
| |
Consolidated Statements of Shareholders' Investment
FOR THE FISCAL YEARS ENDED JULY 1, 2012 , JULY 3, 2011 AND JUNE 27, 2010
|
| Common Stock |
| Additional Paid-In Capital |
| Retained Earnings |
| Accumulated Other Com- prehensive Income (Loss) |
| Treasury Stock |
| Comprehensive Income (Loss) | ||||||||||||
BALANCES, JUNE 28, 2009 |
| $ | 579 | |
| $ | 77,522 | |
| $ | 1,075,838 | |
| $ | (250,273 | ) |
| $ | (208,982 | ) |
|
| ||
Comprehensive Loss: |
|
|
|
|
|
|
|
|
|
|
|
| ||||||||||||
Net Income |
| - | |
| - | |
| 36,615 | |
| - | |
| - | |
| $ | 36,615 | | |||||
Foreign Currency Translation Adjustment |
| - | |
| - | |
| - | |
| (4,989 | ) |
| - | |
| (4,989 | ) | ||||||
Unrealized Gain on Derivatives, net of tax |
| - | |
| - | |
| - | |
| 11,626 | |
| - | |
| 11,626 | | ||||||
Change in Pension and Postretirement Plans, net of tax of $41,348 |
| - | |
| - | |
| - | |
| (75,073 | ) |
| - | |
| (75,073 | ) | ||||||
Total Comprehensive Loss |
|
|
|
|
|
|
|
|
|
|
| $ | (31,821 | ) | ||||||||||
Cash Dividends Paid ($0.44 per share) |
| - | |
| - | |
| (22,125 | ) |
| - | |
| - | |
|
| |||||||
Stock Option Activity, net of tax |
| - | |
| 2,959 | |
| - | |
| - | |
| 1,514 | |
|
| |||||||
Restricted Stock |
| - | |
| (5,023 | ) |
| - | |
| - | |
| 4,928 | |
|
| |||||||
Amortization of Unearned Compensation |
| - | |
| 2,055 | |
| - | |
| - | |
| - | |
|
| |||||||
Deferred Stock |
| - | |
| 2,877 | |
| - | |
| - | |
| 31 | |
|
| |||||||
Shares Issued to Directors |
| - | |
| (37 | ) |
| - | |
| - | |
| 20 | |
|
| |||||||
Reclassification of EITF 06-4 and 06-10 |
| - | |
| - | |
| 515 | |
| - | |
| - | |
|
| |||||||
BALANCES, JUNE 27, 2010 |
| $ | 579 | |
| $ | 80,353 | |
| $ | 1,090,843 | |
| $ | (318,709 | ) |
| $ | (202,489 | ) |
|
| ||
Comprehensive Income: |
|
|
|
|
|
|
|
|
|
|
|
| ||||||||||||
Net Income |
| - | |
| - | |
| 24,355 | |
| - | |
| - | |
| $ | 24,355 | | |||||
Foreign Currency Translation Adjustment |
| - | |
| - | |
| - | |
| 22,017 | |
| - | |
| 22,017 | | ||||||
Unrealized Loss on Derivatives, net of tax |
| - | |
| - | |
| - | |
| (10,742 | ) |
| - | |
| (10,742 | ) | ||||||
Change in Pension and Postretirement Plans, net of tax of $40,878 |
| - | |
| - | |
| - | |
| 63,936 | |
| - | |
| 63,936 | | ||||||
Total Comprehensive Income |
|
|
|
|
|
|
|
|
|
|
| $ | 99,566 | | ||||||||||
Cash Dividends Paid ($0.44 per share) |
| - | |
| - | |
| (22,334 | ) |
| - | |
| - | |
|
| |||||||
Stock Option Activity, net of tax |
| - | |
| 725 | |
| - | |
| - | |
| 2,681 | |
|
| |||||||
Restricted Stock |
| - | |
| (7,870 | ) |
| - | |
| - | |
| 6,394 | |
|
| |||||||
Amortization of Unearned Compensation |
| - | |
| 2,602 | |
| - | |
| - | |
| - | |
|
| |||||||
Deferred Stock |
| - | |
| 2,686 | |
| - | |
| - | |
| 942 | |
|
| |||||||
Shares Issued to Directors |
| - | |
| (157 | ) |
| - | |
| - | |
| 1,116 | |
|
| |||||||
Modification of Stock Compensation Awards |
| - | |
| 1,015 | |
| - | |
| - | |
| - | |
|
| |||||||
BALANCES, JULY 3, 2011 |
| $ | 579 | |
| $ | 79,354 | |
| $ | 1,092,864 | |
| $ | (243,498 | ) |
| $ | (191,356 | ) |
|
| ||
Comprehensive Loss: |
|
|
|
|
|
|
|
|
|
|
|
| ||||||||||||
Net Income |
| - | |
| - | |
| 29,006 | |
| - | |
| - | |
| $ | 29,006 | | |||||
Foreign Currency Translation Adjustment |
| - | |
| - | |
| - | |
| (13,487 | ) |
| - | |
| (13,487 | ) | ||||||
Unrealized Loss on Derivatives, net of tax |
| - | |
| - | |
| - | |
| (5,411 | ) |
| - | |
| (5,411 | ) | ||||||
Change in Pension and Postretirement Plans, net of tax of $38,557 |
| - | |
| - | |
| - | |
| (60,308 | ) |
| - | |
| (60,308 | ) | ||||||
Total Comprehensive Loss |
|
|
|
|
|
|
|
|
|
|
| $ | (50,200 | ) | ||||||||||
Cash Dividends Paid ($0.44 per share) |
| - | |
| - | |
| (22,011 | ) |
| - | |
| - | |
|
| |||||||
Stock Option Activity, net of tax |
| - | |
| 1,255 | |
| - | |
| - | |
| 390 | |
|
| |||||||
Restricted Stock |
| - | |
| (2,901 | ) |
| - | |
| - | |
| 2,739 | |
|
| |||||||
Amortization of Unearned Compensation |
| - | |
| 3,296 | |
| - | |
| - | |
| - | |
|
| |||||||
Deferred Stock |
| - | |
| 726 | |
| - | |
| - | |
| 23 | |
|
| |||||||
Shares Issued to Directors |
| - | |
| (7 | ) |
| - | |
| - | |
| 3 | |
|
| |||||||
Treasury Stock Purchases |
| - | |
| - | |
| - | |
| - | |
| (39,286 | ) |
|
| |||||||
BALANCES, JULY 1, 2012 |
| $ | 579 | |
| $ | 81,723 | |
| $ | 1,099,859 | |
| $ | (322,704 | ) |
| $ | (227,487 | ) |
|
| ||
| |
Consolidated Statements of Cash Flows
FOR THE FISCAL YEARS ENDED JULY 1, 2012 , JULY 3, 2011 AND JUNE 27, 2010
(in thousands)
|
| 2012 |
| 2011 |
| 2010 | ||||||
CASH FLOWS FROM OPERATING ACTIVITIES: |
|
|
|
|
|
| ||||||
Net Income |
| $ | 29,006 | |
| $ | 24,355 | |
| $ | 36,615 | |
Adjustments to Reconcile Net Income to Net Cash Provided by Operating Activities: |
|
|
|
|
|
| ||||||
Depreciation and Amortization |
| 63,714 | |
| 61,828 | |
| 66,232 | | |||
Stock Compensation Expense |
| 5,555 | |
| 9,595 | |
| 6,975 | | |||
Goodwill Impairment Charge |
| - | |
| 49,450 | |
| - | | |||
Earnings of Unconsolidated Affiliates |
| (5,100 | ) |
| (5,082 | ) |
| (4,071 | ) | |||
Dividends Received from Unconsolidated Affiliates |
| 4,029 | |
| 6,979 | |
| 4,005 | | |||
Loss on Disposition of Plant and Equipment |
| 174 | |
| 1,651 | |
| 2,125 | | |||
Provision for Deferred Income Taxes |
| 3,926 | |
| 6,117 | |
| 3,755 | | |||
Pension Cash Contributions |
| (28,746 | ) |
| - | |
| - | | |||
Non-Cash Restructuring Charges |
| 35,910 | |
| - | |
| - | | |||
Change in Operating Assets and Liabilities: |
|
|
|
|
|
| ||||||
(Increase) Decrease in Receivables |
| 6,195 | |
| 37,775 | |
| (24,430 | ) | |||
(Increase) Decrease in Inventories |
| (20,693 | ) |
| (20,547 | ) |
| 76,389 | | |||
(Increase) Decrease in Prepaid Expenses and Other Current Assets |
| (6,945 | ) |
| 1,843 | |
| 1,032 | | |||
Increase (Decrease) in Accounts Payable, Accrued Liabilities and Income Taxes |
| (9,755 | ) |
| (14,081 | ) |
| 67,947 | | |||
Other, Net |
| (11,309 | ) |
| (2,952 | ) |
| 7,167 | | |||
Net Cash Provided by Operating Activities |
| 65,961 | |
| 156,931 | |
| 243,741 | | |||
CASH FLOWS FROM INVESTING ACTIVITIES: |
|
|
|
|
|
| ||||||
Additions to Plant and Equipment |
| (49,573 | ) |
| (59,919 | ) |
| (44,443 | ) | |||
Cash Paid for Acquisition, Net of Cash Acquired |
| (2,673 | ) |
| - | |
| - | | |||
Proceeds Received on Disposition of Plant and Equipment |
| 1,457 | |
| 148 | |
| 276 | | |||
Other, Net |
| - | |
| - | |
| (144 | ) | |||
Net Cash Used in Investing Activities |
| (50,789 | ) |
| (59,771 | ) |
| (44,311 | ) | |||
CASH FLOWS FROM FINANCING ACTIVITIES: |
|
|
|
|
|
| ||||||
Net Repayments on Revolver |
| - | |
| - | |
| (34,000 | ) | |||
Proceeds from Long-Term Debt Financing |
| - | |
| 225,000 | |
| - | | |||
Repayments on Long-Term Debt |
| - | |
| (203,698 | ) |
| (44,236 | ) | |||
Debt Issuance Costs |
| (2,007 | ) |
| (4,994 | ) |
| - | | |||
Cash Dividends Paid |
| (22,011 | ) |
| (22,334 | ) |
| (22,125 | ) | |||
Stock Option Exercise Proceeds and Tax Benefits |
| 235 | |
| 1,532 | |
| 864 | | |||
Treasury Stock Purchases |
| (39,287 | ) |
| - | |
| - | | |||
Net Cash Used in Financing Activities |
| (63,070 | ) |
| (4,494 | ) |
| (99,497 | ) | |||
EFFECT OF FOREIGN CURRENCY EXCHANGE RATE CHANGES ON CASH AND CASH EQUIVALENTS |
| (5,666 | ) |
| 419 | |
| 629 | | |||
NET INCREASE (DECREASE) IN CASH AND CASH EQUIVALENTS |
| (53,564 | ) |
| 93,085 | |
| 100,562 | | |||
CASH AND CASH EQUIVALENTS: |
|
|
|
|
|
| ||||||
Beginning of Year |
| 209,639 | |
| 116,554 | |
| 15,992 | | |||
End of Year |
| $ | 156,075 | |
| $ | 209,639 | |
| $ | 116,554 | |
SUPPLEMENTAL DISCLOSURE OF CASH FLOW INFORMATION: |
|
|
|
|
|
| ||||||
Interest Paid |
| $ | 18,630 | |
| $ | 26,691 | |
| $ | 26,693 | |
Income Taxes Paid (Refunded) |
| $ | (2,388 | ) |
| $ | 4,340 | |
| $ | (6 | ) |
The accompanying Notes to Consolidated Financial Statements are an integral part of these statements.
28
Notes to Consolidated Financial Statements
FOR THE FISCAL YEARS ENDED JULY 1, 2012 , JULY 3, 2011 AND JUNE 27, 2010
(1) Nature of Operations:
Briggs & Stratton (the "Company") is a U.S. based producer of air cooled gasoline engines and engine powered outdoor equipment. The Company's Engines segment sells engines worldwide, primarily to original equipment manufacturers of lawn and garden equipment and other gasoline engine powered equipment. The Company's Products segment designs, manufacturers and markets a wide range of outdoor power equipment and related accessories.
(2) Summary of Significant Accounting Policies:
Fiscal Year: The Company's fiscal year consists of 52 or 53 weeks, ending on the Sunday nearest the last day of June in each year. Therefore, the 2012 and 2010 fiscal years were 52 weeks long and the fiscal 2011 fiscal year was 53 weeks long. All references to years relate to fiscal years rather than calendar years.
Principles of Consolidation: The consolidated financial statements include the accounts of the Company and its majority owned domestic and foreign subsidiaries after elimination of intercompany accounts and transactions. Investments in companies that are owned 20% to 50% or are less than 20% owned and for which we have significant influence are accounted for by the equity method.
Certain amounts in prior year financial statements have been reclassified to conform to current year presentation.
Accounting Estimates: The preparation of financial statements in conformity with accounting principles generally accepted in the United States requires management to make estimates and assumptions that affect the reported amounts of assets and liabilities and disclosure of contingent assets and liabilities at the date of the financial statements and the reported amounts of revenues and expenses during the reporting period. Actual results may differ from those estimates.
Cash and Cash Equivalents: This caption includes cash, commercial paper and certificates of deposit. The Company considers all highly liquid investments purchased with an original maturity of three months or less to be cash equivalents.
Receivables: Receivables are recorded at their original carrying value less reserves for estimated uncollectible accounts.
Inventories: Inventories are stated at cost, which does not exceed market. The last-in, first-out (LIFO) method was used for determining the cost of approximately 41% of total inventories at each of July 1, 2012 and July 3, 2011. The cost for the remaining inventories was determined using the first-in, first-out (FIFO) method. If the FIFO inventory valuation method had been used exclusively, inventories would have been $62.9 million and $64.5 million higher in fiscal 2012 and 2011 , respectively. The LIFO inventory adjustment was determined on an overall basis, and accordingly, each class of inventory reflects an allocation based on the FIFO amounts. During 2012 and 2010, liquidation of LIFO layers generated income of $1.6 million and $1.7 million , respectively. There were no liquidations of LIFO layers in 2011.
Goodwill and Other Intangible Assets: Goodwill reflects the cost of acquisitions in excess of the fair values assigned to identifiable net assets acquired. Goodwill is assigned to reporting units based upon the expected benefit of the synergies of the acquisition. The reporting units are Engines and Products. Other Intangible Assets reflect identifiable intangible assets that arose from purchase acquisitions. Other Intangible Assets are comprised of trademarks, patents and customer relationships. Goodwill and trademarks, which are considered to have indefinite lives are not amortized; however, both must be tested for impairment annually. Amortization is recorded on a straight-line basis for other intangible assets with finite lives. Patents have been assigned an estimated weighted average useful life of 13 years. The customer relationships have been assigned an estimated useful life of 25 years. The Company is subject to financial statement risk in the event that goodwill and intangible assets become impaired.
29
Notes . . .
| ||
The Company performed the required impairment tests in fiscal 2012 , 2011 and 2010 . Refer to Note 5 for discussion of a non-cash goodwill impairment charge recorded in fiscal 2011.
Investments: This caption represents the Company's investments in unconsolidated affiliated companies consisting of its 30% and 50% owned joint ventures. Combined financial information of the unconsolidated affiliated companies accounted for by the equity method, generally on a lag of 3 months or less, was as follows (in thousands):
Results of operations of unconsolidated affiliated companies for the fiscal year:
|
| 2012 |
| 2011 |
| 2010 | ||||||
Results of Operations: |
|
|
|
|
|
| ||||||
Sales |
| $ | 129,063 | |
| $ | 120,614 | |
| $ | 104,140 | |
Cost of Goods Sold |
| 103,254 | |
| 95,048 | |
| 86,959 | | |||
Gross Profit |
| $ | 25,809 | |
| $ | 25,566 | |
| $ | 17,181 | |
Net Income |
| $ | 9,751 | |
| $ | 11,412 | |
| $ | 7,113 | |
Balance sheets of unconsolidated affiliated companies as of fiscal year-end:
|
| 2012 |
| 2011 | ||||
Financial Position: |
|
|
|
| ||||
Assets: |
|
|
|
| ||||
Current Assets |
| $ | 52,948 | |
| $ | 51,838 | |
Noncurrent Assets |
| 16,944 | |
| 18,292 | | ||
|
| 69,892 | |
| 70,130 | | ||
Liabilities: |
|
|
|
| ||||
Current Liabilities |
| $ | 15,346 | |
| $ | 15,809 | |
Noncurrent Liabilities |
| 4,016 | |
| 5,749 | | ||
|
| 19,362 | |
| 21,558 | | ||
Equity |
| $ | 50,530 | |
| $ | 48,572 | |
Net sales to equity method investees were approximately $1.8 million , $4.7 million and $10.4 million in 2012 , 2011 , and 2010 , respectively. Purchases of finished products from equity method investees were approximately $119.6 million , $115.7 million and $93.2 million in 2012 , 2011 and 2010 , respectively.
Debt Issuance Costs: Direct and incremental costs incurred in obtaining loans or in connection with the issuance of long-term debt are capitalized and amortized to interest expense over the terms of the related credit agreements. Debt discounts incurred in connection with the issuance of the 8.875% Senior Notes were capitalized and amortized to interest expense using the effective interest method until the redemption during fiscal 2011. Approximately $1.2 million , $1.2 million and $1.5 million of debt issuance costs and original issue discounts were amortized to interest expense during fiscal years 2012 , 2011 and 2010 , respectively.
Plant and Equipment and Depreciation: Plant and equipment are stated at historical cost. For financial reporting purposes, plant and equipment are depreciated primarily by the straight line method over the estimated useful lives of the assets which generally range from 3 to 10 years for software, from 20 to 40 years for land improvements, from 20 to 50 years for buildings, and 3 to 20 years for machinery and equipment. Expenditures for repairs and maintenance are charged to expense as incurred. Expenditures for major renewals and betterments, which significantly extend the useful lives of existing plant and equipment, are capitalized and depreciated. Upon retirement or disposition of plant and equipment, the cost and related accumulated depreciation are removed from the accounts, and any resulting gain or loss is recognized in cost of goods sold.
30
Notes . . .
| ||
Depreciation expense was approximately $60.3 million , $59.9 million and $63.0 million during fiscal years 2012 , 2011 and 2010 , respectively.
Impairment of Property, Plant and Equipment: Property, plant and equipment are reviewed for impairment whenever events or changes in circumstances indicate that the carrying amount may not be recoverable. If the sum of the expected undiscounted cash flows is less than the carrying value of the related asset or group of assets, a loss is recognized for the difference between the fair value and carrying value of the asset or group of assets. Refer to Note 16 of the Notes to the Consolidated Financial Statements for an impairment associated with restructuring actions in fiscal 2012. There were no adjustments to the carrying value of property, plant and equipment in fiscal 2011 and 2010.
Warranty: The Company recognizes the cost associated with its standard warranty on engines and products at the time of sale. The amount recognized is based on historical failure rates and current claim cost experience. The following is a reconciliation of the changes in accrued warranty costs for the reporting period (in thousands):
|
| 2012 |
| 2011 | ||||
Balance, Beginning of Period |
| $ | 45,995 | |
| $ | 41,945 | |
Payments |
| (26,856 | ) |
| (28,599 | ) | ||
Provision for Current Year Warranties |
| 30,790 | |
| 35,273 | | ||
Changes in Estimates |
| (3,917 | ) |
| (2,624 | ) | ||
Balance, End of Period |
| $ | 46,012 | |
| $ | 45,995 | |
Revenue Recognition: Net sales include sales of engines, products, and related service parts and accessories, net of allowances for cash discounts, customer volume rebates and discounts, floor plan interest and advertising allowances. The Company recognizes revenue when all of the following criteria are met: persuasive evidence of an arrangement exists, delivery has occurred, the price is fixed or determinable, and collectibility is reasonably assured. This is generally upon shipment, except for certain international shipments, where revenue is recognized when the customer receives the product.
Included in net sales are costs associated with programs under which the Company shares the expense of financing certain dealer and distributor inventories, referred to as floor plan expense. This represents interest for a pre-established length of time based on a variable rate from a contract with a third party financing source for dealer and distributor inventory purchases. Sharing the cost of these financing arrangements is used by Briggs & Stratton as a marketing incentive for customers to buy inventory. The financing costs included in net sales in fiscal 2012 , 2011 and 2010 were $5.5 million , $6.6 million and $6.4 million , respectively.
The Company also offers a variety of customer rebates and sales incentives. The Company records estimates for rebates and incentives at the time of sale, as a reduction in net sales.
Income Taxes: The Provision for Income Taxes includes federal, state and foreign income taxes currently payable and those deferred because of temporary differences between the financial statement and tax bases of assets and liabilities. The Deferred Income Tax Asset represents temporary differences relating to current assets and current liabilities, and the Long-Term Deferred Income Tax Asset represents temporary differences related to noncurrent assets and liabilities. A valuation allowance is recorded to reduce deferred tax assets when it is more likely than not that a tax benefit will not be realized.
Retirement Plans: The Company has noncontributory, defined benefit retirement plans and postretirement benefit plans covering certain employees. Retirement benefits represent a form of deferred compensation, which are subject to change due to changes in assumptions. Management reviews underlying assumptions on an annual basis. Refer to Note 15 of the Notes to Consolidated Financial Statements.
Research and Development Costs: Expenditures relating to the development of new products and processes, including significant improvements and refinements to existing products, are expensed as incurred and
31
Notes . . .
| ||
recorded in engineering, selling, general and administrative expenses within the Consolidated Statements of Earnings. The amounts charged against income were $19.8 million in fiscal 2012 , $19.5 million in fiscal 2011 and $22.3 million in fiscal 2010 .
Advertising Costs: Advertising costs, included in Engineering, Selling, General and Administrative Expenses in the accompanying Consolidated Statements of Earnings, are expensed as incurred. These expenses totaled $22.3 million in fiscal 2012 , $24.3 million in fiscal 2011 and $25.1 million in fiscal 2010 .
Shipping and Handling Fees: Revenue received from shipping and handling fees is reflected in net sales and related shipping costs are recorded in cost of goods sold. Shipping fee revenue for fiscal 2012 , 2011 and 2010 was $5.9 million , $5.3 million and $4.1 million , respectively.
Foreign Currency Translation: Foreign currency balance sheet accounts are translated into dollars at the rates of exchange in effect at fiscal year-end. Income and expenses incurred in a foreign currency are translated at the average rates of exchange in effect during the year. The related translation adjustments are made directly to a separate component of Shareholders' Investment.
Earnings Per Share: The Company computes earnings per share using the two-class method, an earnings allocation formula that determines earnings per share for each class of common stock and participating security according to dividends declared and participation rights in undistributed earnings. The Company's unvested grants of restricted stock and deferred stock awards contain non-forfeitable rights to dividends (whether paid or unpaid), which are required to be treated as participating securities and included in the computation of basic earnings per share.
Information on earnings per share is as follows (in thousands except per share data):
|
| Fiscal Year Ended | ||||||||||
|
| July 1, 2012 |
| July 3, 2011 |
| June 27, 2010 | ||||||
Net Income |
| $ | 29,006 | |
| $ | 24,355 | |
| $ | 36,615 | |
Less: Dividends Attributable to Unvested Shares |
| (508 | ) |
| (181 | ) |
| (296 | ) | |||
Net Income available to Common Shareholders |
| $ | 28,498 | |
| $ | 24,174 | |
| $ | 36,319 | |
Average Shares of Common Stock Outstanding |
| 48,965 | |
| 49,677 | |
| 49,668 | | |||
Incremental Common Shares Applicable to Common Stock Options and Performance Shares Based on the Common Stock Average Market Price During the Period |
| - | |
| - | |
| - | | |||
Incremental Common Shares Applicable to Deferred and Restricted Common Stock Based on the Common Stock Average Market Price During the Period |
| 944 | |
| 732 | |
| 396 | | |||
Diluted Average Shares of Common Stock Outstanding |
| 49,909 | |
| 50,409 | |
| 50,064 | | |||
Basic Earnings Per Share |
| $ | 0.58 | |
| $ | 0.49 | |
| $ | 0.73 | |
Diluted Earnings Per Share |
| $ | 0.57 | |
| $ | 0.48 | |
| $ | 0.73 | |
The dilutive effect of the potential exercise of outstanding stock-based awards to acquire common shares is calculated using the treasury stock method. The following options to purchase shares of common stock were excluded from the calculation of diluted earnings per share as the exercise prices were greater than the average market price of the common shares, and their inclusion in the computation would be antidilutive:
|
| Fiscal Year Ended | ||||||||||
|
| July 1, 2012 |
| July 3, 2011 |
| June 27, 2010 | ||||||
Options to Purchase Shares of Common Stock (in thousands) |
| 3,679 | |
| 4,049 | |
| 3,796 | | |||
Weighted Average Exercise Price of Options Excluded |
| $ | 27.71 | |
| $ | 28.17 | |
| $ | 30.68 | |
32
Notes . . .
| ||
Derivative Instruments & Hedging Activity: The Company enters into derivative contracts designated as cash flow hedges to manage certain foreign currency and commodity exposures. Company policy allows derivatives to be used only for identifiable exposures and, therefore, the Company does not enter into hedges for trading purposes where the sole objective is to generate profits.
The Company formally designates the financial instrument as a hedge of a specific underlying exposure and documents both the risk management objectives and strategies for undertaking the hedge. The Company formally assesses, both at the inception and at least quarterly thereafter, whether the financial instruments that are used in hedging transactions are effective at offsetting changes in the forecasted cash flows of the related underlying exposure. Because of the high degree of effectiveness between the hedging instrument and the underlying exposure being hedged, fluctuations in the value of the derivative instruments are generally offset by changes in the forecasted cash flows of the underlying exposures being hedged. Derivative financial instruments are recorded on the Consolidated Balance Sheets as assets or liabilities, measured at fair value. The effective portion of gains or losses on the derivative designated as cash flow hedges are reported as a component of Accumulated Other Comprehensive Loss (AOCI) and reclassified into earnings in the same period or periods during which the hedged transaction affects earnings. Any ineffective portion of a financial instrument's change in fair value is immediately recognized in earnings.
The Company enters into interest rate swaps to manage a portion of its interest rate risk from financing certain dealer and distributor inventories through a third party financing source. The swaps are designated as cash flow hedges and are used to effectively fix the interest payments to a third party financing source, exclusive of lender spreads, ranging from 1.17% to 1.60% for a notional principal amount of $85 million with expiration dates ranging from July 2017 to May 2019 .
The Company periodically enters into forward foreign currency contracts to hedge the risk from forecasted third party and intercompany sales or payments denominated in foreign currencies. These obligations generally require the Company to exchange foreign currencies for U.S. Dollars, Euros, Australian Dollars, Canadian Dollars or Japanese Yen. These contracts generally do not have a maturity of more than twenty-four months.
The Company uses raw materials that are subject to price volatility. The Company hedges a portion of its exposure to the variability of cash flows associated with commodities used in the manufacturing process by entering into forward purchase contracts or commodity swaps. Derivative contracts designated as cash flow hedges are used by the Company to reduce exposure to variability in cash flows associated with future purchases of natural gas, aluminum and steel. These contracts generally do not have a maturity of more than twenty-four months.
The Company has considered the counterparty credit risk related to all its foreign currency and commodity derivative contracts and does not deem any counterparty credit risk material at this time.
33
Notes . . .
| ||
The notional amount of derivative contracts outstanding at the end of the period is indicative of the level of the Company's derivative activity during the period. As of July 1, 2012 and July 3, 2011 , the Company had the following outstanding derivative contracts (in thousands):
Contract |
| Notional Amount | ||||
|
|
|
| July 1, 2012 |
| July 3, 2011 |
Interest Rate: |
|
|
|
|
|
|
LIBOR Interest Rate (U.S. Dollars) |
| Fixed |
| 85,000 |
| 0 |
Foreign Currency: |
|
|
|
|
|
|
Australian Dollar |
| Sell |
| 28,258 |
| 34,295 |
Canadian Dollar |
| Sell |
| 0 |
| 10,700 |
Euro |
| Sell |
| 53,500 |
| 41,500 |
Japanese Yen |
| Buy |
| 695,000 |
| 0 |
Commodity: |
|
|
|
|
|
|
Natural Gas (Therms) |
| Buy |
| 5,614 |
| 11,187 |
Aluminum (Metric Tons) |
| Buy |
| 24 |
| 8 |
Steel (Metric Tons) |
| Buy |
| 0 |
| 1 |
The location and fair value of derivative instruments reported in the Consolidated Balance Sheets are as follows (in thousands):
Balance Sheet Location |
| Asset (Liability) Fair Value | ||||||
|
| July 1, 2012 |
| July 3, 2011 | ||||
Interest rate contracts: |
|
|
|
| ||||
Other Long-Term Liabilities |
| $ | (2,341 | ) |
| $ | - | |
Foreign currency contracts: |
|
|
|
| ||||
Other Current Assets |
| 1,888 | |
| 108 | | ||
Other Long-Term Assets, Net |
| 24 | |
| - | | ||
Accrued Liabilities |
| (452 | ) |
| (3,550 | ) | ||
Other Long-Term Liabilities |
| - | |
| (280 | ) | ||
Commodity contracts: |
|
|
|
| ||||
Other Current Assets |
| 14 | |
| 26 | | ||
Accrued Liabilities |
| (8,510 | ) |
| (1,937 | ) | ||
Other Long-Term Liabilities |
| - | |
| (91 | ) | ||
|
| $ | (9,377 | ) |
| $ | (5,724 | ) |
34
Notes . . .
| ||
The effect of derivatives designated as hedging instruments on the Consolidated Statements of Earnings is as follows:
|
| Twelve months ended July 1, 2012 | ||||||||||||
|
| Amount of Gain (Loss) Recognized in Other Comprehensive Income on Derivatives, Net of Taxes (Effective Portion) |
| Classification of Gain (Loss) |
| Amount of Gain (Loss) Reclassified from Accumulated Other Comprehensive Loss into Income (Effective Portion) |
| Recognized in Earnings (Ineffective Portion) | ||||||
Interest rate contracts |
| $ | (1,428 | ) |
| Net Sales |
| $ | - | |
| $ | - | |
Foreign currency contracts – sell |
| 1,553 | |
| Net Sales |
| 4,031 | |
| - | | |||
Foreign currency contracts – buy |
| 11 | |
| Cost of Goods Sold |
| 132 | |
| - | | |||
Commodity contracts |
| (5,547 | ) |
| Cost of Goods Sold |
| (7,292 | ) |
| 6 | | |||
|
| $ | (5,411 | ) |
|
|
| $ | (3,129 | ) |
| $ | 6 | |
|
| Twelve months ended July 3, 2011 | ||||||||||||
|
| Amount of Gain (Loss) Recognized in Other Comprehensive Income on Derivatives, Net of Taxes (Effective Portion) |
| Classification of Gain (Loss) |
| Amount of Gain (Loss) Reclassified from Accumulated Other Comprehensive Loss into Income (Effective Portion) |
| Recognized in Earnings (Ineffective Portion) | ||||||
Foreign currency contracts – sell |
| (10,760 | ) |
| Net Sales |
| 972 | |
| - | | |||
Foreign currency contracts – buy |
| (29 | ) |
| Cost of Goods Sold |
| (286 | ) |
| - | | |||
Commodity contracts |
| 47 | |
| Cost of Goods Sold |
| (2,564 | ) |
| (2 | ) | |||
|
| $ | (10,742 | ) |
|
|
| $ | (1,878 | ) |
| $ | (2 | ) |
|
| Twelve months ended June 27, 2010 | ||||||||||||
|
| Amount of Gain (Loss) Recognized in Other Comprehensive Income on Derivatives, Net of Taxes (Effective Portion) |
| Classification of Gain (Loss) |
| Amount of Gain (Loss) Reclassified from Accumulated Other Comprehensive Loss into Income (Effective Portion) |
| Recognized in Earnings (Ineffective Portion) | ||||||
Foreign currency contracts – sell |
| $ | 10,873 | |
| Net Sales |
| $ | (750 | ) |
| $ | - | |
Foreign currency contracts – buy |
| (120 | ) |
| Cost of Goods Sold |
| 187 | |
| - | | |||
Commodity contracts |
| 873 | |
| Cost of Goods Sold |
| 2,978 | |
| 2 | | |||
|
| $ | 11,626 | |
|
|
| $ | 2,415 | |
| $ | 2 | |
During the next twelve months, the amount of the July 1, 2012 Accumulated Other Comprehensive Loss balance that is expected to be reclassified into earnings is $6.6 million .
(3) New Accounting Pronouncements:
In July 2012, the Financial Accounting Standards Board ("FASB") issued Accounting Standards Update ("ASU") No. 2012-02 "Intangibles – Goodwill and Other (Topic 350): Testing Indefinite-Lived Intangible Assets for Impairment," which permits an entity to first assess qualitative factors to determine whether it is more likely than not that an indefinite-lived intangible asset is impaired before performing quantitative impairment testing. The amendments do not change the measurement of impairment losses. This update is effective for fiscal years beginning after September 15, 2012, with early adoption permitted. Management does not expect adoption of this ASU to have a material impact on the Company's results of operations, financial position or cash flow.
In September 2011, the FASB issued ASU No. 2011-08, "Intangibles - Goodwill and Other (Topic 350): Testing Goodwill for Impairment," which permits an entity to make a qualitative assessment of whether it is more likely than not that a reporting unit's fair value is less than its carrying value before applying the two-step goodwill impairment model that is currently in place. If it is determined through the qualitative assessment that a reporting unit's fair value is more likely than not greater than its carrying value, the remaining impairment steps would be unnecessary. The qualitative assessment is optional, allowing companies to go directly to the quantitative assessment. This update is effective for annual and interim goodwill impairment tests performed in fiscal years beginning after December 15, 2011 with early adoption permitted. Management does not expect adoption of this ASU to have a material impact on the Company's results of operations, financial position or cash flow.
In June 2011, the FASB issued ASU No. 2011-05, "Comprehensive Income: Presentation of Comprehensive Income," which amends current comprehensive income guidance. This ASU eliminates the option to present the components of other comprehensive income as part of the statement of shareholders' equity. Instead, it requires entities to report components of comprehensive income in either (1) a continuous statement of comprehensive income or (2) two separate but consecutive statements. Under the two-statement approach, the first statement would include components of net income, which is consistent with the income statement format used today, and the second statement would include components of other comprehensive income ("OCI"). The ASU does not change the items that must be reported in OCI. ASU 2011-05 will be effective for public companies for fiscal years, and interim periods within those years, beginning after December 15, 2011 with early adoption permitted. Management does not expect adoption of this ASU to have a material impact on the Company's results of operations, financial position or cash flow.
(4) Fair Value:
Assets and Liabilities Measured at Fair Value:
The following guidance establishes a fair value hierarchy that prioritizes the inputs to valuation techniques used to measure fair value into three broad levels:
Level 1: Quoted prices for identical instruments in active markets.
Level 2: Quoted prices for similar instruments in active markets; quoted prices for identical or similar instruments in markets that are not active; and model-driven valuations whose inputs are observable or whose significant value drivers are observable.
Level 3: Significant inputs to the valuation model are unobservable.
The following table presents information about the Company's financial assets and liabilities measured at fair value on a recurring basis as of July 1, 2012 and July 3, 2011 (in thousands):
|
|
|
| Fair Value Measurement Using | ||||||||||||
|
| July 1, 2012 |
| Level 1 |
| Level 2 |
| Level 3 | ||||||||
Assets: |
|
|
|
|
|
|
|
| ||||||||
Derivatives |
| $ | 1,926 | |
| $ | - | |
| $ | 1,926 | |
| $ | - | |
Liabilities: |
|
|
|
|
|
|
|
| ||||||||
Derivatives |
| $ | 11,303 | |
| $ | - | |
| $ | 11,303 | |
| $ | - | |
|
|
|
| Fair Value Measurement Using | ||||||||||||
|
| July 3, 2011 |
| Level 1 |
| Level 2 |
| Level 3 | ||||||||
Assets: |
|
|
|
|
|
|
|
| ||||||||
Derivatives |
| $ | 134 | |
| $ | - | |
| $ | 134 | |
| $ | - | |
Liabilities: |
|
|
|
|
|
|
|
| ||||||||
Derivatives |
| $ | 5,858 | |
| $ | - | |
| $ | 5,858 | |
| $ | - | |
The Company has currently chosen not to elect the fair value option for any items that are not already required to be measured at fair value in accordance with accounting principles generally accepted in the United States.
Fair Value of Financial Instruments:
The carrying values of cash and cash equivalents, trade receivables, accounts payable, foreign lines of credit, accrued liabilities and income taxes payable are reasonable estimates of their fair values at July 1, 2012 and July 3, 2011 due to the short-term nature of these instruments.The fair market value of the Company's long-term debt is estimated based on market quotations at year-end.
The estimated fair market values of the Company's Long-Term Debt is (in thousands):
|
| 2012 |
| 2011 | ||||||||||||
|
| Carrying Amount |
| Fair Value |
| Carrying Amount |
| Fair Value | ||||||||
Long-Term Debt |
|
|
|
|
|
|
|
| ||||||||
6.875% Senior Notes |
| $ | 225,000 | |
| $ | 241,027 | |
| $ | 225,000 | |
| $ | 233,726 | |
Borrowings on Revolver |
| $ | - | |
| $ | - | |
| $ | - | |
| $ | - | |
(5) Goodwill and Other Intangible Assets:
Goodwill reflects the cost of acquisitions in excess of the fair values assigned to identifiable net assets acquired. Goodwill is assigned to reporting units based upon the expected benefit of the synergies of the acquisition. The reporting units are Engines and Products. The Engines segment had goodwill of $137.4 million and $138.0 million at July 1, 2012 and July 3, 2011 , respectively. The Products segment had goodwill of $67.4 million and $64.9 million at July 1, 2012 and July 3, 2011 , respectively.
The changes in the carrying amount of goodwill for the fiscal years ended July 1, 2012 and July 3, 2011 are as follows (in thousands):
|
| 2012 |
| 2011 | ||||
Beginning Goodwill Balance |
| $ | 202,940 | |
| $ | 252,975 | |
Impairment Loss |
| - | |
| (49,450 | ) | ||
Tax Benefit on Amortization |
| - | |
| (1,779 | ) | ||
Reversal of Tax Valuation Allowance |
| - | |
| (700 | ) | ||
Acquisition |
| 2,692 | |
| - | | ||
Effect of Translation |
| (868 | ) |
| 1,894 | | ||
Ending Goodwill Balance |
| $ | 204,764 | |
| $ | 202,940 | |
At July 1, 2012 , July 3, 2011 and June 27, 2010 , accumulated goodwill impairment losses were $49.5 million , $49.5 million and $0 , respectively.
The Company evaluates goodwill for impairment at least annually as of the fiscal year-end or more frequently if events or circumstances indicate that the assets may be impaired. The Company recorded a non-cash goodwill impairment charge in fiscal 2011 of $49.5 million , which was determined by comparing the carrying value of the reporting unit's goodwill with the implied fair value of goodwill for the reporting unit. Based on a combination of factors, including the influence of prolonged macro-economic conditions on the lawn and garden market in the U.S. and the operating results of the Products segment during the previous two years which lacked the benefit of certain weather related events that would have been favorable to the business, the Company's forecasted cash flow estimates used in the goodwill assessment were adversely impacted. As a result, the Company concluded that the carrying value amounts of the Products reporting unit exceeded its fair value as of July 3, 2011. The impairment charge is a non-cash expense that did not adversely affect the Company's debt position, cash flow, liquidity or compliance with financial covenants under its revolving credit facility. No impairment charges were recorded within the Engines segment. The Company evaluated its goodwill at July 1, 2012 and determined that there were no further impairments of goodwill.
The Company's other intangible assets as of July 1, 2012 and July 3, 2011 are as follows (in thousands):
|
| 2012 |
| 2011 | ||||||||||||||||||||
|
| Gross Carrying Amount |
| Accumulated Amortization |
| Net |
| Gross Carrying Amount |
| Accumulated Amortization |
| Net | ||||||||||||
Amortized Intangible Assets: |
|
|
|
|
|
|
|
|
|
|
|
| ||||||||||||
Patents |
| $ | 13,601 | |
| $ | (9,464 | ) |
| $ | 4,137 | |
| $ | 13,601 | |
| $ | (8,247 | ) |
| $ | 5,354 | |
Customer Relationships |
| 17,910 | |
| (5,731 | ) |
| 12,179 | |
| 17,910 | |
| (5,015 | ) |
| 12,895 | | ||||||
Effect of Translation |
| 40 | |
| - | |
| 40 | |
| 52 | |
| (16 | ) |
| 36 | | ||||||
Total Amortized Intangible Assets |
| 31,551 | |
| (15,195 | ) |
| 16,356 | |
| 31,563 | |
| (13,278 | ) |
| 18,285 | | ||||||
Unamortized Intangible Assets: |
|
|
|
|
|
|
|
|
|
|
|
| ||||||||||||
Trademarks/Brand Names |
| 69,841 | |
| - | |
| 69,841 | |
| 69,841 | |
| - | |
| 69,841 | | ||||||
Effect of Translation |
| 870 | |
| - | |
| 870 | |
| 1,149 | |
| - | |
| 1,149 | | ||||||
Total Unamortized Intangible Assets |
| 70,711 | |
| - | |
| 70,711 | |
| 70,990 | |
| - | |
| 70,990 | | ||||||
Total Intangible Assets |
| $ | 102,262 | |
| $ | (15,195 | ) |
| $ | 87,067 | |
| $ | 102,553 | |
| $ | (13,278 | ) |
| $ | 89,275 | |
The Company also performs an impairment test of its indefinite-lived intangible assets as of the fiscal year-end. As of July 1, 2012 and July 3, 2011 , the Company concluded that no evidence of impairment of indefinite-lived intangible assets existed.
Amortization expense of other intangible assets amounted to approximately $1.9 million in each of 2012 , 2011 and 2010 .
The estimated amortization expense of other intangible assets for the next five years is (in thousands):
|
| ||
2013 | 1,911 | | |
2014 | 1,900 | | |
2015 | 1,860 | | |
2016 | 1,860 | | |
2017 | 1,860 | | |
|
| ||
| $ | 9,391 | |
|
| ||
(6) Income Taxes:
The provision for income taxes consists of the following (in thousands):
|
| 2012 |
| 2011 |
| 2010 | ||||||
Current |
|
|
|
|
|
| ||||||
Federal |
| $ | (8,711 | ) |
| $ | (2,908 | ) |
| $ | 4,740 | |
State |
| 430 | |
| (177 | ) |
| 305 | | |||
Foreign |
| 5,222 | |
| 4,667 | |
| 3,658 | | |||
|
| (3,059 | ) |
| 1,582 | |
| 8,703 | | |||
Deferred |
| 3,926 | |
| 6,117 | |
| 3,755 | | |||
|
| $ | 867 | |
| $ | 7,699 | |
| $ | 12,458 | |
|
|
|
|
|
|
| ||||||
A reconciliation of the U.S. statutory tax rates to the effective tax rates on income follows:
|
| 2012 |
| 2011 |
| 2010 | |||
U.S. Statutory Rate |
| 35.0 | % |
| 35.0 | % |
| 35.0 | % |
State Taxes, Net of Federal Tax Benefit |
| 1.8 | % |
| 0.9 | % |
| 0.9 | % |
Foreign Taxes |
| 4.2 | % |
| (16.2 | )% |
| 1.9 | % |
Benefit on Dividends Received |
| (2.2 | )% |
| (2.7 | )% |
| (1.6 | )% |
Changes to Unrecognized Tax Benefits |
| (16.0 | )% |
| 1.5 | % |
| (10.9 | )% |
Impact of Restructuring Actions |
| (18.7 | )% |
| - | % |
| - | % |
*Other |
| (1.2 | )% |
| 5.5 | % |
| 0.1 | % |
Effective Tax Rate |
| 2.9 | % |
| 24.0 | % |
| 25.4 | % |
* "Other" in fiscal 2011 includes 11.5% for the impact of goodwill impairment and (6.0)% for the impact of fiscal 2011 and prior year R&D tax credits.
The components of deferred income taxes were as follows (in thousands):
Current Asset (Liability): |
| 2012 |
| 2011 | ||||
Difference Between Book and Tax Related to: |
|
|
|
| ||||
Inventory |
| $ | 17,269 | |
| $ | 15,940 | |
Payroll Related Accruals |
| 5,644 | |
| 4,798 | | ||
Warranty Reserves |
| 11,366 | |
| 11,927 | | ||
Workers Compensation Accruals |
| 2,141 | |
| 2,194 | | ||
Other Accrued Liabilities |
| 12,576 | |
| 13,150 | | ||
Pension Cost |
| 1,049 | |
| 927 | | ||
Miscellaneous |
| (5,518 | ) |
| (6,773 | ) | ||
Deferred Income Tax Asset (Liability) |
| $ | 44,527 | |
| $ | 42,163 | |
Long-Term Asset (Liability): |
|
|
|
| ||||
Difference Between Book and Tax Related to: |
|
|
|
| ||||
Pension Cost |
| $ | 69,639 | |
| $ | 52,404 | |
Accumulated Depreciation |
| (54,860 | ) |
| (52,749 | ) | ||
Intangibles |
| (67,452 | ) |
| (63,356 | ) | ||
Accrued Employee Benefits |
| 39,555 | |
| 36,386 | | ||
Postretirement Health Care Obligation |
| 48,113 | |
| 44,408 | | ||
Warranty |
| 6,402 | |
| 5,588 | | ||
Valuation Allowance |
| (12,025 | ) |
| (7,259 | ) | ||
Net Operating Loss/State Credit Carryforwards |
| 30,079 | |
| 9,370 | | ||
Miscellaneous |
| 7,500 | |
| 6,209 | | ||
Deferred Income Tax Asset (Liability) |
| $ | 66,951 | |
| $ | 31,001 | |
The deferred tax assets that were generated as a result of foreign income tax loss carryforwards and tax incentives in the amount of $7.3 million are potentially not useable by certain foreign subsidiaries. If not utilized against taxable income, $6.9 million will expire from 2013 through 2023 . The remaining $0.4 million has no expiration date. In addition, a deferred tax asset of $6.9 million was generated as a result of state income tax loss and state incentive tax credit carryforwards. If not utilized against future taxable income, this amount will expire from 2013 through 2027 . Realization of the deferred tax assets are contingent upon generating sufficient taxable income prior to expiration of these carryforwards. Management believes that realization of the foreign deferred tax assets is unlikely; therefore, valuation allowances were established in the amount of $7.3 million . In addition, state tax credits in the amount of $4.7 million are potentially not useable against future state income taxes.
The Company has not recorded deferred income taxes applicable to undistributed earnings of foreign subsidiaries because the Company intends to reinvest such earnings indefinitely outside of the U.S. The undistributed earnings amounted to approximately $61.0 million at July 1, 2012 . If the Company were to distribute these earnings, foreign tax credits may become available under current law to reduce the resulting U.S. income tax. Determination of the amount of unrecognized deferred tax liability related to these earnings is not practicable.
The change to the gross unrecognized tax benefits of the Company during the fiscal year ended July 1, 2012 is reconciled as follows:
Unrecognized Tax Benefits (in thousands):
Beginning Balance at July 3, 2011 | $ | 12,040 | |
Changes based on tax positions related to prior year | - | | |
Additions based on tax positions related to current year | 429 | | |
Settlements with taxing authorities | (516 | ) | |
Lapse of statute of limitations | (5,236 | ) | |
Balance at July 1, 2012 | $ | 6,717 | |
The net unrecognized tax benefit as of July 1, 2012 and July 3, 2011 is $5.4 million and $9.9 million , respectively.
As of July 1, 2012 and July 3, 2011 , gross unrecognized tax benefits that, if recognized, would impact the effective tax rate were $5.4 million and $9.9 million , respectively.
The Company recognizes interest and penalties related to unrecognized tax benefits in income tax expense. As of July 1, 2012 and July 3, 2011 , the Company had $0.4 million and $5.7 million , respectively, accrued for the payment of interest and penalties.
There is a reasonable possibility that approximately $0.2 million of the current remaining unrecognized tax benefits may be recognized by the end of fiscal year 2013 as a result of a lapse in the statute of limitations in certain foreign jurisdictions.
Income tax returns are filed in the U.S., state, and foreign jurisdictions and related audits occur on a regular basis. In the U.S., the Company is no longer subject to U.S. federal income tax examinations before fiscal 2009 and is currently under audit by various state and foreign jurisdictions. With respect to the Company's major foreign jurisdictions, it is no longer subject to tax examinations before fiscal 2002.
(7) Segment and Geographic Information and Significant Customers:
The Company has concluded that it operates two reportable business segments that are managed separately based on fundamental differences in their operations. Summarized segment data is as follows (in thousands):
|
| 2012 |
| 2011 |
| 2010 | ||||||
NET SALES: |
|
|
|
|
|
| ||||||
Engines |
| $ | 1,309,942 | |
| $ | 1,399,532 | |
| $ | 1,360,475 | |
Products |
| 952,110 | |
| 878,998 | |
| 843,609 | | |||
Eliminations |
| (195,519 | ) |
| (168,532 | ) |
| (176,212 | ) | |||
|
| $ | 2,066,533 | |
| $ | 2,109,998 | |
| $ | 2,027,872 | |
GROSS PROFIT: |
|
|
|
|
|
| ||||||
Engines |
| $ | 250,323 | |
| $ | 319,584 | |
| $ | 300,246 | |
Products |
| 86,193 | |
| 77,406 | |
| 86,416 | | |||
Eliminations |
| 209 | |
| 1,326 | |
| (6,727 | ) | |||
|
| $ | 336,725 | |
| $ | 398,316 | |
| $ | 379,935 | |
INCOME (LOSS) FROM OPERATIONS: |
|
|
|
|
|
| ||||||
Engines |
| $ | 66,559 | |
| $ | 120,402 | |
| $ | 83,521 | |
Products |
| (25,531 | ) |
| (73,512 | ) |
| (7,707 | ) | |||
Eliminations |
| 209 | |
| 1,326 | |
| (6,727 | ) | |||
|
| $ | 41,237 | |
| $ | 48,216 | |
| $ | 69,087 | |
ASSETS: |
|
|
|
|
|
| ||||||
Engines |
| $ | 1,120,065 | |
| $ | 1,196,627 | |
| $ | 1,161,775 | |
Products |
| 629,325 | |
| 692,971 | |
| 678,594 | | |||
Eliminations |
| (141,159 | ) |
| (223,380 | ) |
| (150,312 | ) | |||
|
| $ | 1,608,231 | |
| $ | 1,666,218 | |
| $ | 1,690,057 | |
CAPITAL EXPENDITURES: |
|
|
|
|
|
| ||||||
Engines |
| $ | 42,697 | |
| $ | 50,050 | |
| $ | 32,635 | |
Products |
| 6,876 | |
| 9,869 | |
| 11,808 | | |||
|
| $ | 49,573 | |
| $ | 59,919 | |
| $ | 44,443 | |
DEPRECIATION & AMORTIZATION: |
|
|
|
|
|
| ||||||
Engines |
| $ | 45,647 | |
| $ | 44,060 | |
| $ | 47,760 | |
Products |
| 18,067 | |
| 17,768 | |
| 18,472 | | |||
|
| $ | 63,714 | |
| $ | 61,828 | |
| $ | 66,232 | |
Pre-tax restructuring charges impact on gross profit is as follows (in thousands):
|
| 2012 |
| 2011 | ||||
PRE-TAX RESTRUCTURING CHARGES INCLUDED IN GROSS PROFIT: |
|
|
|
| ||||
Engines |
| $ | 14,257 | |
| $ | - | |
Products |
| 30,503 | |
| - | | ||
Total |
| $ | 44,760 | |
| $ | - | |
Pre-tax restructuring charges impact on income (loss) from operations is as follows (in thousands):
|
| 2012 |
| 2011 | ||||
PRE-TAX RESTRUCTURING CHARGES INCLUDED IN INCOME (LOSS) FROM OPERATIONS: |
|
|
|
| ||||
Engines |
| $ | 18,314 | |
| $ | 559 | |
Products |
| 31,553 | |
| 2,978 | | ||
Total |
| $ | 49,867 | |
| $ | 3,537 | |
Information regarding the Company's geographic sales based on product shipment destination (in thousands):
|
| 2012 |
| 2011 |
| 2010 | ||||||
United States |
| $ | 1,440,955 | |
| $ | 1,421,994 | |
| $ | 1,471,708 | |
All Other Countries |
| 625,578 | |
| 688,004 | |
| 556,164 | | |||
Total |
| $ | 2,066,533 | |
| $ | 2,109,998 | |
| $ | 2,027,872 | |
Information regarding the Company's net plant and equipment based on geographic location (in thousands):
|
| 2012 |
| 2011 |
| 2010 | ||||||
United States |
| $ | 280,954 | |
| $ | 304,136 | |
| $ | 303,192 | |
All Other Countries |
| 20,295 | |
| 25,089 | |
| 34,571 | | |||
Total |
| $ | 301,249 | |
| $ | 329,225 | |
| $ | 337,763 | |
Sales to the following customers in the Company's Engines segment amount to greater than or equal to 10% of consolidated net sales, respectively:
|
| 2012 |
| 2011 |
| 2010 | |||||||||||||||
Customer: |
| Net Sales |
| % |
| Net Sales |
| % |
| Net Sales |
| % | |||||||||
HOP |
| $ | 265,752 | |
| 13 | % |
| $ | 295,286 | |
| 14 | % |
| $ | 296,066 | |
| 15 | % |
MTD |
| 230,882 | |
| 11 | % |
| 273,132 | |
| 13 | % |
| 295,148 | |
| 15 | % | |||
|
| $ | 496,634 | |
| 24 | % |
| $ | 568,418 | |
| 27 | % |
| $ | 591,214 | |
| 30 | % |
(8) Leases:
The Company leases certain facilities, vehicles, and equipment under both capital and operating leases. Assets held under capital leases are included in Plant and Equipment and are charged to depreciation and interest over the life of the lease. Related liabilities are included in Other Accrued Liabilities and Other Long-Term Liabilities. Operating leases are not capitalized and lease payments are expensed over the life of the lease. Terms of the leases, including purchase options, renewals, and maintenance costs, vary by lease. Rental expense for fiscal 2012 , 2011 and 2010 was $22.4 million , $24.8 million and $25.2 million , respectively.
Future minimum lease commitments for all non-cancelable operating leases as of July 1, 2012 are as follows (in thousands):
Fiscal Year |
| Operating | ||
2013 |
| 12,874 | | |
2014 |
| 10,390 | | |
2015 |
| 8,310 | | |
2016 |
| 3,870 | | |
2017 |
| 2,931 | | |
Thereafter |
| 4,174 | | |
Total future minimum lease commitments |
| $ | 42,549 | |
Future minimum lease commitments for all non-cancelable capital leases as of July 1, 2012 are $0.1 million for fiscal 2013, and none thereafter.
(9) Indebtedness:
Long-Term Debt
The following is a summary of the Company's long-term indebtedness (in thousands):
|
| 2012 |
| 2011 | ||||
Multicurrency Credit Agreement |
| $ | - | |
| $ | - | |
6.875% Senior Notes |
| 225,000 | |
| 225,000 | | ||
Total Long-Term Debt |
| $ | 225,000 | |
| $ | 225,000 | |
On December 15, 2010 , the Company issued $225 million of 6.875% Senior Notes due December 15, 2020 ("Senior Notes"). The net proceeds of the offering were primarily used to redeem the outstanding principal of the 8.875% Senior Notes due March 15, 2011 ("Old Senior Notes"). In connection with the refinancing and the issuance of the Senior Notes, the Company incurred approximately $5.0 million in new debt issuance costs, which are being amortized over the life of the Senior Notes using the effective interest method. In addition, at the time of the refinancing the Company expensed approximately $3.7 million associated with the make-whole terms of the Old Senior Notes, $0.1 million in remaining deferred financing costs and $0.1 million of original issue discount. These amounts are included in interest expense in the Consolidated Statements of Earnings.
Additionally, under the terms of the indentures and credit agreements governing the Senior Notes, Briggs & Stratton Power Products Group, LLC became a joint and several guarantor of amounts outstanding under the Senior Notes. Refer to Note 19 of the Notes to Consolidated Financial Statements for subsidiary guarantor financial information.
Multicurrency Credit Agreement
On October 13, 2011 , the Company entered into a $500 million multicurrency credit agreement (the "Revolver"). The Revolver replaced the Company's previous amended and restated multicurrency credit agreement dated as of July 12, 2007 . The Revolver has a term of five years and all outstanding borrowings on the Revolver are due and payable on October 13, 2016 . The initial maximum availability under the revolving credit facility is $500 million . Availability under the revolving credit facility is reduced by outstanding letters of credit. The Company may from time to time increase the maximum availability under the revolving credit facility by up to $250 million if certain conditions are satisfied. In connection with the refinancing and the issuance of the Revolver, the Company incurred approximately $2.0 million in new debt issuance costs, which
are being amortized over the life of the Revolver using the straight-line method. There were no borrowings under the Credit Agreement as of July 1, 2012 and July 3, 2011.
Borrowings under the Revolver by the Company bear interest at a rate per annum equal to, at its option, either:
(1) a 1, 2, 3 or 6 month LIBOR rate plus a margin varying from 1.25% to 2.25% , depending on the Company's average net leverage ratio; or
(2) the higher of (a) the federal funds rate plus 0.50% ; (b) the bank's prime rate; or (c) the Eurocurrency rate for a one-month interest period plus 1.00% . In addition, the Company is subject to a 0.20% to 0.40% commitment fee and a 1.25% to 2.25% letter of credit fee, depending on the Company's average net leverage ratio.
The Revolver contains covenants that the Company considers usual and customary for an agreement of this type, including a maximum average leverage ratio and minimum interest coverage ratio. Certain of the Company's subsidiaries are required to be guarantors of the Company's obligations under the Credit Agreement.
The Revolver and the Senior Notes contain restrictive covenants. These covenants include restrictions on the Company's ability to: pay dividends; repurchase shares; incur indebtedness; create liens; enter into sale and leaseback transactions; consolidate or merge with other entities; sell or lease all or substantially all of its assets; and dispose of assets or the proceeds of sales of its assets. The Revolver contains financial covenants that require the Company to maintain a minimum interest coverage ratio and impose a maximum average leverage ratio. As of July 1, 2012 , the Company was in compliance with these covenants.
Foreign Lines of Credit
The lines of credit available to the Company in foreign countries are in connection with short-term borrowings and bank overdrafts used in the normal course of business. These amounts totaled $3.5 million at July 1, 2012 , expire at various times throughout fiscal 2013 and beyond and are renewable. None of these arrangements had material commitment fees or compensating balance requirements. Borrowings using these lines of credit are included in short-term debt. Outstanding balances are as follows (in thousands):
|
| 2012 |
| 2011 | ||||
Balance at Fiscal Year-End |
| $ | 3,000 | |
| $ | 3,000 | |
Weighted Average Interest Rate at Fiscal Year-End |
| 3.66 | % |
| 3.61 | % | ||
(10) Other Income, Net:
The components of Other Income, Net are as follows (in thousands):
|
| 2012 |
| 2011 |
| 2010 | ||||||
Interest Income |
| $ | 512 | |
| $ | 369 | |
| $ | 1,172 | |
Equity in Earnings from Unconsolidated Affiliates |
| 5,100 | |
| 5,082 | |
| 4,071 | | |||
Other Items |
| 1,566 | |
| 1,705 | |
| 1,212 | | |||
Total |
| $ | 7,178 | |
| $ | 7,156 | |
| $ | 6,455 | |
(11) Commitments and Contingencies:
The Company is subject to various unresolved legal actions that arise in the normal course of its business. These actions typically relate to product liability (including asbestos-related liability), patent and trademark matters, and disputes with customers, suppliers, distributors and dealers, competitors and employees.
Starting with the first complaint in June 2004, various plaintiff groups filed complaints in state and federal courts across the country against the Company and other engine and lawnmower manufacturers alleging that the horsepower labels on the products they purchased were inaccurate and that the Company conspired with other engine and lawnmower manufacturers to conceal the true horsepower of these engines ("Horsepower Class Actions"). On February 24, 2010, the Company entered into a Stipulation of Settlement ("Settlement") that resolves all of the Horsepower Class Actions including all horsepower-labeling claims brought by all persons or entities in the United States who, beginning January 1, 1994 through the date notice of the Settlement is first given, purchased, for use and not for resale, a lawn mower containing a vertical shaft internal combustion engine up to 30 horsepower provided that either the lawn mower or the engine of the lawn mower was manufactured or sold by a defendant.
The Settlement received final court approval on August 16, 2010. The settling defendants as a group agreed to pay an aggregate amount of $51.0 million . However, the monetary contribution of the amount of each of the settling defendants is confidential. In addition, the Company, along with the other settling defendants, agreed to injunctive relief regarding their future horsepower labeling, as well as procedures that will allow purchasers of lawnmower engines to seek a one-year extended warranty free of charge beginning March 1, 2011 for most class members. As part of the Settlement, the Company denies any and all liability and seeks resolution to avoid further protracted and expensive litigation. As a result of the Settlement, the Company recorded a pre-tax charge of $30.6 million in the third quarter of fiscal 2010.
On March 19, 2010, new plaintiffs filed a complaint in the Ontario Superior Court of Justice in Canada (Robert Foster et al. v. Sears Canada, Inc. et al., Docket No. 766-2010). On May 3, 2010, other plaintiffs filed a complaint in the Montreal Superior Court in Canada (Eric Liverman, et al. v. Deere & Company, et al., Docket No. 500-06-000507-109). Both Canadian complaints contain allegations and seek relief under Canadian law that are similar to the Horsepower Class Actions. The Company is evaluating the complaints and has not yet filed an answer or other responsive pleading to either one.
On May 14, 2010, the Company notified retirees and certain retirement eligible employees of various changes to the Company-sponsored retiree medical plans. The purpose of the amendments was to better align the plans offered to both hourly and salaried retirees. On August 16, 2010, a putative class of retirees who retired prior to August 1, 2006 and the United Steel Workers filed a complaint in the U.S. District Court for the Eastern District of Wisconsin (Merrill, Weber, Carpenter, et al; United Steel, Paper and Forestry, Rubber, Manufacturing, Energy, Allied Industrial and Service Workers International Union, AFL-CIO/CLC v. Briggs & Stratton Corporation; Group Insurance Plan of Briggs & Stratton Corporation; and Does 1 through 20, Docket No. 10-C-0700), contesting the Company's right to make these changes. In addition to a request for class certification, the complaint seeks an injunction preventing the alleged unilateral termination or reduction in insurance coverage to the class of retirees, a permanent injunction preventing defendants from ever making changes to the retirees' insurance coverage, restitution with interest (if applicable) and attorneys' fees and costs. The Company moved to dismiss the complaint and believes the changes are within its rights. On April 21, 2011, the district court issued an order granting the Company's motion to dismiss the complaint. The plaintiffs filed a motion with the court to reconsider its order on May 17, 2011, and on August 24, 2011 the court granted the motion and vacated the dismissal of the case. The Company then filed a motion with the court to appeal its decision directly to the U.S. Court of Appeals for the Seventh Circuit, but the court denied this motion on February 29, 2012. Discovery is now proceeding in the case.
Although it is not possible to predict with certainty the outcome of these unresolved legal actions or the range of possible loss, the Company believes the unresolved legal actions will not have a material adverse effect on its results of operations, financial position or cash flows.
35
Notes . . .
| ||
(12) Stock Incentives:
The Company previously adopted an Incentive Compensation Plan, effective October 20, 2004, under which 4,000,000 shares of common stock ( 8,000,000 shares as a result of the fiscal 2005 2 -for-1 stock split) were reserved for future issuance. An amendment to the Incentive Compensation Plan approved by shareholders on October 21, 2009, added 2,481,494 shares to the shares available for grant under the plan. Prior to October 20, 2004, the Company had a Stock Incentive Plan under which 5,361,935 shares of common stock were reserved for issuance. The adoption of the Incentive Compensation Plan reduced the number of shares available for future issuance under the Stock Incentive Plan to zero . However, as of July 1, 2012 , there were 1,590,120 outstanding option awards granted under the Stock Incentive Plan that are or may become exercisable in the future. In accordance with the plans, the Company can issue eligible employees stock options, stock appreciation rights, restricted stock, deferred stock, performance shares and cash bonus awards subject to certain annual limitations. The plans also allow the Company to issue directors non-qualified stock options and directors' fees in stock.
Stock based compensation expense is calculated by estimating the fair value of incentive stock awards granted and amortizing the estimated value over the awards' vesting periods. During fiscal 2012 , 2011 and 2010 , the Company recognized stock based compensation expense of approximately $5.6 million , $9.6 million and $7.0 million , respectively. Included in stock based compensation expense for fiscal 2011 was an expense of $1.3 million due to the modification of certain vesting conditions for the Company's stock incentive awards. The modification of the awards was made in connection with the Company's previously announced organization changes that involved a planned reduction of salaried employees during the second quarter of fiscal 2011.
On the grant date, the exercise price of each stock option issued exceeds the market value of the stock by 10% . The fair value of each option is estimated using the Black-Scholes option pricing model, and the assumptions are based on historical data and standard industry valuation practices and methodology. The assumptions used to determine fair value are as follows:
Options Granted During |
| 2012 |
| 2011 |
| 2010 | ||||||
Grant Date Fair Value |
| $ | 3.96 | |
| $ | 5.24 | |
| $ | 5.07 | |
(Since options are only granted once per year, the grant date fair value equals the weighted average grant date fair value.) |
|
|
|
|
|
| ||||||
Assumptions: |
|
|
|
|
|
| ||||||
Risk-free Interest Rate |
| 1.0 | % |
| 1.5 | % |
| 2.5 | % | |||
Expected Volatility |
| 43.2 | % |
| 43.2 | % |
| 40.4 | % | |||
Expected Dividend Yield |
| 3.0 | % |
| 2.4 | % |
| 2.5 | % | |||
Expected Term (In Years) |
| 5.0 | |
| 5.0 | |
| 5.0 | | |||
36
Notes . . .
| ||
Information on the options outstanding is as follows:
|
| Options |
| Wtd. Avg. Exercise Price |
| Wtd. Avg. Remaining Contractual Term |
| Aggregate Intrinsic Value (in thousands) | ||||||
Balance, June 28, 2009 |
| 4,305,681 | |
| $ | 29.53 | |
|
|
|
| |||
Granted During the Year |
| 730,000 | |
| 19.73 | |
|
|
|
| ||||
Exercised During the Year |
| (58,250 | ) |
| 14.83 | |
|
|
|
| ||||
Expired During the Year |
| (509,554 | ) |
| 27.99 | |
|
|
|
| ||||
Balance, June 27, 2010 |
| 4,467,877 | |
| $ | 28.29 | |
|
|
|
| |||
Granted During the Year |
| 785,250 | |
| 19.88 | |
|
|
|
| ||||
Exercised During the Year |
| (103,290 | ) |
| 14.83 | |
|
|
|
| ||||
Expired During the Year |
| (428,647 | ) |
| 37.22 | |
|
|
|
| ||||
Balance, July 3, 2011 |
| 4,721,190 | |
| $ | 26.38 | |
|
|
|
| |||
Granted During the Year |
| 465,350 | |
| 16.20 | |
|
|
|
| ||||
Exercised During the Year |
| (15,870 | ) |
| 14.83 | |
|
|
|
| ||||
Expired During the Year |
| (474,240 | ) |
| 29.87 | |
|
|
|
| ||||
Balance, July 1, 2012 |
| 4,696,430 | |
| $ | 25.06 | |
| 2.02 | |
| $ | 2,070 | |
Exercisable, July 1, 2012 |
| 2,715,830 | |
| $ | 29.50 | |
| 1.27 | |
| $ | 1,470 | |
The total intrinsic value of options exercised during the fiscal year ended 2012 was less than $0.1 million . The exercise of options resulted in cash receipts of $0.3 million in fiscal 2012 . The total intrinsic value of options exercised during the fiscal year ended 2011 was $0.7 million . The exercise of options resulted in cash receipts of $1.8 million in fiscal 2011 . The total intrinsic value of options exercised during the fiscal year ended 2010 was $0.5 million . The exercise of options resulted in cash receipts of $1.1 million in fiscal year 2010.
Options Outstanding (as of July 1, 2012) | |||||||||||||
Fiscal Year |
| Grant Date |
| Date Exercisable |
| Expiration Date |
| Exercise Price |
| Options Outstanding | |||
2004 |
| 8/15/2003 |
| 8/15/2006 |
| 8/15/2013 |
| $ | 30.44 | |
| 650,280 | |
2005 |
| 8/13/2004 |
| 8/13/2007 |
| 8/13/2014 |
| $ | 36.68 | |
| 939,840 | |
2006 |
| 8/16/2005 |
| 8/16/2008 |
| 8/16/2010 |
| $ | 38.83 | |
| - | |
2007 |
| 8/15/2006 |
| 8/15/2009 |
| 8/15/2011 |
| $ | 29.87 | |
| - | |
2008 |
| 8/14/2007 |
| 8/14/2010 |
| 8/31/2012 |
| $ | 30.81 | |
| 573,130 | |
2009 |
| 8/19/2008 |
| 8/19/2011 |
| 8/31/2013 |
| $ | 14.83 | |
| 552,580 | |
2010 |
| 8/18/2009 |
| 8/18/2012 |
| 8/31/2014 |
| $ | 19.73 | |
| 730,000 | |
2011 |
| 8/17/2010 |
| 8/17/2013 |
| 8/31/2015 |
| $ | 19.88 | |
| 785,250 | |
2012 |
| 8/16/2011 |
| 8/16/2014 |
| 8/31/2016 |
| $ | 16.20 | |
| 465,350 | |
37
Notes . . .
| ||
Below is a summary of the status of the Company's nonvested shares as of July 1, 2012 , and changes during the year then ended:
|
| Deferred Stock |
| Restricted Stock |
| Stock Options |
| Performance Shares | ||||||||||||||||||||
|
| Shares |
| Wtd. Avg. Grant Date Fair Value |
| Shares |
| Wtd. Avg. Grant Date Fair Value |
| Shares |
| Wtd. Avg. Grant Date Fair Value |
| Shares |
| Wtd. Avg. Grant Date Fair Value | ||||||||||||
Nonvested shares, July 3, 2011 |
| 488,784 | |
| $ | 17.14 | |
| 624,000 | |
| $ | 18.06 | |
| 2,083,700 | |
| $ | 4.28 | |
| - | |
| $ | - | |
Granted |
| 82,377 | |
| 14.73 | |
| 111,890 | |
| 14.77 | |
| 465,350 | |
| 3.96 | |
| 127,940 | |
| 17.11 | | ||||
Cancelled |
| - | |
| - | |
| (2,200 | ) |
| 16.08 | |
| - | |
| - | |
| - | |
| - | | ||||
Exercised |
| - | |
| - | |
| - | |
| - | |
| (15,870 | ) |
| 1.93 | |
| - | |
| - | | ||||
Vested |
| (44,997 | ) |
| 27.59 | |
| (18,425 | ) |
| 29.19 | |
| (552,580 | ) |
| 1.93 | |
| - | |
| - | | ||||
Nonvested shares, July 1, 2012 |
| 526,164 | |
| $ | 16.95 | |
| 715,265 | |
| $ | 17.26 | |
| 1,980,600 | |
| $ | 4.88 | |
| 127,940 | |
| $ | 17.11 | |
As of July 1, 2012 , there was $7.2 million of total unrecognized compensation cost related to nonvested share-based compensation. That cost is expected to be recognized over a weighted average period of 1.8 years. The total fair value of shares vested during fiscal 2012 and 2011 was $1.4 million and $4.5 million , respectively.
Under the plans, the Company has issued restricted stock to certain employees. During fiscal years 2012 , 2011 and 2010 , the Company has issued 111,890 , 269,290 and 194,480 shares, respectively. The restricted stock vests on the fifth anniversary date of the issue provided the recipient is still employed by the Company. The aggregate market value on the date of issue was approximately $1.7 million , $4.9 million and $3.5 million in fiscal 2012 , 2011 and 2010 , respectively, and has been recorded within the Shareholders' Investment section of the Consolidated Balance Sheets, and is being amortized over the five-year vesting period.
Under the plans, the Company may also issue deferred stock to its directors in lieu of directors fees. The Company has issued 44,127 , 28,727 and 31,026 shares in fiscal 2012 , 2011 and 2010 , respectively, under this provision of the plans.
Under the plans, the Company may also issue deferred stock to its officers and key employees. The Company has issued 38,250 , 155,603 and 149,650 shares in fiscal 2012 , 2011 and 2010 , respectively, under this provision. The aggregate market value on the date of issue was approximately $0.6 million , $2.8 million and $2.7 million , respectively. Expense is recognized ratably over the five-year vesting period.
Beginning in fiscal 2012, under the plans, the Company issued performance shares to its officers and key employees. The Company issued 127,940 performance shares in fiscal 2012 under this provision. The aggregate market value on the date of issue was approximately $2.2 million using the Monte Carlo simulation methodology of valuation. The Monte-Carlo valuation model simulates a range of possible future stock prices for the Company and the components of a peer group to estimate the probability that a vesting condition will be achieved. Assumptions used in the Monte Carlo valuation model in fiscal 2012 include a risk-free rate of return of 0.31% , an expected term of 2.87 years, reinvested dividends, and volatility of 46.04% . In determining these assumptions for the Monte Carlo valuation model, we consider historic and observable market data. Expense is recognized ratably over the three-year vesting period.
38
Notes . . .
| ||
The following table summarizes the components of the Company's stock-based compensation programs recorded as expense:
|
| 2012 |
| 2011 |
| 2010 | ||||||
Stock Options: |
|
|
|
|
|
| ||||||
Pretax compensation expense |
| $ | 1,760 | |
| $ | 3,397 | |
| $ | 4,028 | |
Tax benefit |
| (686 | ) |
| (1,325 | ) |
| (1,571 | ) | |||
Stock option expense, net of tax |
| $ | 1,074 | |
| $ | 2,072 | |
| $ | 2,457 | |
Restricted Stock: |
|
|
|
|
|
| ||||||
Pretax compensation expense |
| $ | 2,102 | |
| $ | 3,512 | |
| $ | 1,754 | |
Tax benefit |
| (820 | ) |
| (1,370 | ) |
| (684 | ) | |||
Restricted stock expense, net of tax |
| $ | 1,282 | |
| $ | 2,142 | |
| $ | 1,070 | |
Deferred Stock: |
|
|
|
|
|
| ||||||
Pretax compensation expense |
| $ | 534 | |
| $ | 2,686 | |
| $ | 1,193 | |
Tax benefit |
| (208 | ) |
| (1,048 | ) |
| (465 | ) | |||
Deferred stock expense, net of tax |
| $ | 326 | |
| $ | 1,638 | |
| $ | 728 | |
Performance Shares: |
|
|
|
|
|
| ||||||
Pretax compensation expense |
| $ | 1,159 | |
| $ | - | |
| $ | - | |
Tax benefit |
| (452 | ) |
| - | |
| - | | |||
Performance Share expense, net of tax |
| $ | 707 | |
| $ | - | |
| $ | - | |
Total Stock-Based Compensation: |
|
|
|
|
|
| ||||||
Pretax compensation expense |
| $ | 5,555 | |
| $ | 9,595 | |
| $ | 6,975 | |
Tax benefit |
| (2,166 | ) |
| (3,743 | ) |
| (2,720 | ) | |||
Total stock-based compensation, net of tax |
| $ | 3,389 | |
| $ | 5,852 | |
| $ | 4,255 | |
(13) Shareholder Rights Agreement:
On August 6, 1996, the Board of Directors declared a dividend distribution of one common stock purchase right (a right) for each share of the Company's common stock outstanding on August 19, 1996. Each right would entitle shareowners to buy one-half of one share of the Company's common stock at an exercise price of $160.00 per full common share ( $80.00 per full common share after taking into consideration the effect of a 2-for-1 stock split effective October 29, 2004), subject to adjustment. The agreement relating to the rights was amended by the Board of Directors on August 9, 2006 to extend the term of the rights by three years to October 18, 2009 , to increase from 15 percent to 20 percent or more the percentage of outstanding shares that a person or group must acquire or attempt to acquire in order for the rights to become exercisable, and to add a qualifying offer clause that permits shareholders to vote to redeem the rights in certain circumstances. Shareholders ratified the amended rights agreement at their annual meeting on October 18, 2006. On August 12, 2009, the Board of Directors amended the rights agreement to: (i) modify the definition of "Beneficial Owner" and "beneficial ownership" of common shares of the Company to include, among other things, certain derivative security interests in common shares of the Company; (ii) reduce the redemption price for the rights to $0.001 per right; and (iii) extend the term of the rights agreement by changing the scheduled expiration date from October 18, 2009 to October 17, 2012 . Shareholders ratified the rights agreement at the annual meeting on October 21, 2009. On August 8, 2012, the Board of Directors further amended the rights agreement to extend its term until October 21, 2015 , subject to shareholder approval.
(14) Foreign Exchange Risk Management:
The Company enters into forward exchange contracts to hedge purchases and sales that are denominated in foreign currencies. The terms of these currency derivatives do not exceed twenty-four months, and the purpose is to protect the Company from the risk that the eventual dollars being transferred will be adversely affected by changes in exchange rates.
The Company has forward foreign exchange contracts to sell foreign currency, with the Euro as the most significant. These contracts are used to hedge foreign currency collections on sales of inventory. The Company also has forward contracts to purchase foreign currencies. The Company's foreign currency forward contracts are carried at fair value based on current exchange rates.
The Company had the following forward currency contracts outstanding at the end of fiscal 2012 :
|
| In Millions |
|
|
|
| ||||||||||||
Hedge |
| Notional Value |
| Contract Value |
| Fair Market Value |
| (Gain) Loss at Fair Value |
| Conversion Currency |
| Latest Expiration Date | ||||||
Currency |
| Contract |
| |||||||||||||||
Australian Dollar |
| Sell |
| 28.3 | |
| 28.4 | |
| 28.5 | |
| 0.1 | |
| U.S. |
| August 2013 |
Euro |
| Sell |
| 53.5 | |
| 69.5 | |
| 67.9 | |
| (1.5 | ) |
| U.S. |
| June 2013 |
Japanese Yen |
| Buy |
| 695.0 | |
| 8.7 | |
| 8.7 | |
| - | |
| U.S. |
| December 2012 |
The Company had the following forward currency contracts outstanding at the end of fiscal 2011 :
|
| In Millions |
|
|
|
| ||||||||||||
Hedge |
| Notional Value |
| Contract Value |
| Fair Market Value |
| (Gain) Loss at Fair Value |
| Conversion Currency |
| Latest Expiration Date | ||||||
Currency |
| Contract |
| |||||||||||||||
Australian Dollar |
| Sell |
| 34.3 | |
| 33.6 | |
| 35.9 | |
| 2.3 | |
| U.S. |
| June 2012 |
Canadian Dollar |
| Sell |
| 10.7 | |
| 10.8 | |
| 11.1 | |
| 0.3 | |
| U.S. |
| February 2012 |
Euro |
| Sell |
| 41.5 | |
| 58.7 | |
| 60.1 | |
| 1.3 | |
| U.S. |
| April 2012 |
The Company continuously evaluates the effectiveness of its hedging program by evaluating its foreign exchange contracts compared to the anticipated underlying transactions. The Company did not have any ineffective currency hedges in fiscal 2012 , 2011 , or 2010 .
(15) Employee Benefit Costs:
Retirement Plan and Other Postretirement Benefits
|
| Pension Benefits |
| Other Postretirement Benefits | ||||||||||||
Actuarial Assumptions: |
| 2012 |
| 2011 |
| 2012 |
| 2011 | ||||||||
Discounted Rate Used to Determine Present Value of Projected Benefit Obligation |
| 4.45 | % |
| 5.35 | % |
| 3.75 | % |
| 4.45 | % | ||||
Expected Rate of Future Compensation Level Increases |
| 3.0-4.0% | |
| 3.0-4.0% | |
| n/a | |
| n/a | | ||||
Expected Long-Term Rate of Return on Plan Assets |
| 8.50 | % |
| 8.50 | % |
| n/a | |
| n/a | | ||||
Change in Benefit Obligations: |
|
|
|
|
|
|
|
| ||||||||
Projected Benefit Obligation at Beginning of Year |
| $ | 1,110,299 | |
| $ | 1,108,427 | |
| $ | 161,796 | |
| $ | 180,609 | |
Service Cost |
| 13,764 | |
| 13,475 | |
| 407 | |
| 486 | | ||||
Interest Cost |
| 56,762 | |
| 56,696 | |
| 6,468 | |
| 7,088 | | ||||
Plan Amendments |
| - | |
| 212 | |
| - | |
| (8,750 | ) | ||||
Plan Curtailments |
| (327 | ) |
| - | |
| 1,357 | |
| - | | ||||
Plan Participant Contributions |
| - | |
| - | |
| 1,181 | |
| 1,234 | | ||||
Actuarial (Gain) Loss |
| 130,173 | |
| 6,747 | |
| (15,984 | ) |
| 5,329 | | ||||
Benefits Paid |
| (73,924 | ) |
| (75,258 | ) |
| (18,371 | ) |
| (24,200 | ) | ||||
Projected Benefit Obligation at End of Year |
| $ | 1,236,747 | |
| $ | 1,110,299 | |
| $ | 136,854 | |
| $ | 161,796 | |
Change in Plan Assets: |
|
|
|
|
|
|
|
| ||||||||
Fair Value of Plan Assets at Beginning of Year |
| $ | 916,210 | |
| $ | 831,490 | |
| $ | - | |
| $ | - | |
Actual Return on Plan Assets |
| 63,822 | |
| 157,420 | |
| - | |
| - | | ||||
Plan Participant Contributions |
| - | |
| - | |
| 1,181 | |
| 1,234 | | ||||
Employer Contributions |
| 31,637 | |
| 2,558 | |
| 17,190 | |
| 22,966 | | ||||
Benefits Paid |
| (73,924 | ) |
| (75,258 | ) |
| (18,371 | ) |
| (24,200 | ) | ||||
Fair Value of Plan Assets at End of Year |
| $ | 937,745 | |
| $ | 916,210 | |
| $ | - | |
| $ | - | |
Funded Status: |
|
|
|
|
|
|
|
| ||||||||
Plan Assets (Less Than) in Excess of Projected Benefit Obligation |
| $ | (299,002 | ) |
| $ | (194,089 | ) |
| $ | (136,854 | ) |
| $ | (161,796 | ) |
Amounts Recognized on the Balance Sheets: |
|
|
|
|
|
|
|
| ||||||||
Accrued Pension Cost |
| $ | (296,394 | ) |
| $ | (191,417 | ) |
| $ | - | |
| $ | - | |
Accrued Wages and Salaries |
| (2,608 | ) |
| (2,672 | ) |
| - | |
| - | | ||||
Accrued Postretirement Health Care Obligation |
| - | |
| - | |
| (89,842 | ) |
| (116,092 | ) | ||||
Accrued Liabilities |
| - | |
| - | |
| (22,827 | ) |
| (22,576 | ) | ||||
Accrued Employee Benefits |
| - | |
| - | |
| (24,185 | ) |
| (23,128 | ) | ||||
Net Amount Recognized at End of Year |
| $ | (299,002 | ) |
| $ | (194,089 | ) |
| $ | (136,854 | ) |
| $ | (161,796 | ) |
Amounts Recognized in Accumulated Other Comprehensive Income (Loss): |
|
|
|
|
|
|
|
| ||||||||
Transition Assets (Obligation) |
| $ | (5 | ) |
| $ | (10 | ) |
| $ | - | |
| $ | - | |
Net Actuarial Loss |
| (294,258 | ) |
| (219,637 | ) |
| (41,437 | ) |
| (56,708 | ) | ||||
Prior Service Credit (Cost) |
| (2,051 | ) |
| (4,022 | ) |
| 10,198 | |
| 13,132 | | ||||
Net Amount Recognized at End of Year |
| $ | (296,314 | ) |
| $ | (223,669 | ) |
| $ | (31,239 | ) |
| $ | (43,576 | ) |
The accumulated benefit obligation for all defined benefit pension plans was $1,186 million and $1,062 million at July 1, 2012 and July 3, 2011 , respectively.
The following table summarizes the plans' income and expense for the three years indicated (in thousands):
|
| Pension Benefits |
| Other Postretirement Benefits | ||||||||||||||||||||
|
| 2012 |
| 2011 |
| 2010 |
| 2012 |
| 2011 |
| 2010 | ||||||||||||
Components of Net Periodic (Income) Expense: |
|
|
|
|
|
|
|
|
|
|
|
| ||||||||||||
Service Cost-Benefits Earned During the Year |
| $ | 13,764 | |
| $ | 13,475 | |
| $ | 11,197 | |
| $ | 407 | |
| $ | 486 | |
| $ | 604 | |
Interest Cost on Projected Benefit Obligation |
| 56,762 | |
| 56,696 | |
| 60,705 | |
| 6,468 | |
| 7,088 | |
| 10,942 | | ||||||
Expected Return on Plan Assets |
| (76,445 | ) |
| (76,975 | ) |
| (81,021 | ) |
| - | |
| - | |
| - | | ||||||
Amortization of: |
|
|
|
|
|
|
|
|
|
|
|
| ||||||||||||
Transition Obligation |
| 8 | |
| 8 | |
| 8 | |
| - | |
| - | |
| - | | ||||||
Prior Service Cost (Credit) |
| 2,856 | |
| 3,059 | |
| 3,068 | |
| (3,800 | ) |
| (3,485 | ) |
| (1,140 | ) | ||||||
Actuarial Loss |
| 20,230 | |
| 17,771 | |
| 3,171 | |
| 8,942 | |
| 10,268 | |
| 10,418 | | ||||||
Net Periodic (Income) Expense |
| $ | 17,175 | |
| $ | 14,034 | |
| $ | (2,872 | ) |
| $ | 12,017 | |
| $ | 14,357 | |
| $ | 20,824 | |
Significant assumptions used in determining net periodic (income) expense for the fiscal years indicated are as follows:
|
| Pension Benefits |
| Other Postretirement Benefits | ||||||||
|
| 2012 |
| 2011 |
| 2010 |
| 2012 |
| 2011 |
| 2010 |
Discount Rate |
| 5.35% |
| 5.30% |
| 6.75% |
| 4.45% |
| 4.60% |
| 6.00% |
Expected Return on Plan Assets |
| 8.50% |
| 8.50% |
| 8.75% |
| n/a |
| n/a |
| n/a |
Compensation Increase Rate |
| 3.0-4.0% |
| 3.0-4.0% |
| 3.0-4.0% |
| n/a |
| n/a |
| n/a |
The amounts in Accumulated Other Comprehensive Income that are expected to be recognized as components of net periodic (income) expense during the next fiscal year are as follows (in thousands):
|
| Pension Plans |
| Other Postretirement Plans | ||||
Transition Obligation |
| $ | 7 | |
| $ | - | |
Prior Service Cost (Credit) |
| 902 | |
| (3,589 | ) | ||
Net Actuarial Loss |
| 35,288 | |
| 7,555 | | ||
The "Other Postretirement Benefit" plans are unfunded.
On May 14, 2010, the Company notified retirees and certain retirement eligible employees of various changes to the Company-sponsored retiree medical plans. The purpose of the amendments was to better align the plans offered to both hourly and salaried retirees. On August 16, 2010, a putative class of retirees who retired prior to August 1, 2006 and the United Steel Workers filed a complaint in the U.S. District Court for the Eastern District of Wisconsin (Merrill, Weber, Carpenter, et al; United Steel, Paper and Forestry, Rubber, Manufacturing, Energy, Allied Industrial and Service Workers International Union, AFL-CIO/CLC v. Briggs & Stratton Corporation; Group Insurance Plan of Briggs & Stratton Corporation; and Does 1 through 20, Docket No. 10-C-0700), contesting the Company's right to make these changes. In addition to a request for class certification, the complaint seeks an injunction preventing the alleged unilateral termination or reduction in insurance coverage to the class of retirees, a permanent injunction preventing defendants from ever making changes to the retirees' insurance coverage, restitution with interest (if applicable) and attorneys' fees and costs. The Company moved to dismiss the complaint and believes the changes are within its rights. On April 21, 2011, the district court issued an order granting the Company's motion to dismiss the complaint. The plaintiffs filed a motion with the court to reconsider its order on May 17, 2011, and on August 24, 2011 the court granted the motion and vacated the dismissal of the case. The Company then filed a motion with the court to appeal its decision directly to the U.S. Court of Appeals for the Seventh Circuit, but the court denied this motion on February 29, 2012. Discovery is now proceeding in the case.
For measurement purposes an 8.4% annual rate of increase in the per capita cost of covered health care claims was assumed for the Company for the fiscal year 2012 decreasing gradually to 4.5% for the fiscal year 2028 . The health care cost trend rate assumptions have a significant effect on the amounts reported. An increase of one percentage point, would increase the accumulated postretirement benefit by $2.5 million and would increase the service and interest cost by $0.1 million for fiscal 2012 . A corresponding decrease of one percentage point, would decrease the accumulated postretirement benefit by $2.8 million and decrease the service and interest cost by $0.1 million for the fiscal year 2012 .
As discussed in Note 16, the Company reduced its salaried headcount by approximately 10% in fiscal 2012. The termination of the employees associated with this restructuring action, and the related impact on unrecognized prior service costs, unrecognized losses and the projected benefit obligation resulted in a net curtailment loss of $0.7 million in fiscal 2012 .
In fiscal 2012, as a result of the non-discrimination testing results of the qualified pension plan, approximately 90 employees were moved to the non-qualified pension plan. Benefits accruing prior to July 1, 2012 were unaffected; only benefits accruing for those affected employees after July 1, 2012 will be covered by the non-qualified plan.
Plan Assets
A Board of Directors appointed Investment Committee ("Committee") manages the investment of the pension plan assets. The Committee has established and operates under an Investment Policy. It determines the asset allocation and target ranges based upon periodic asset/liability studies and capital market projections. The Committee retains external investment managers to invest the assets. The Investment Policy prohibits certain investment transactions, such as lettered stock, commodity contracts, margin transactions and short selling, unless the Committee gives prior approval. The Company's pension plan's asset allocations at July 1, 2012 and July 3, 2011 , by asset category are as follows:
|
|
|
| Plan Assets at Year-end | ||
Asset Category |
| Target % |
| 2012 |
| 2011 |
Domestic Equities |
| 17%-23% |
| 20% |
| 19% |
International Equities |
| 3%-7% |
| 4% |
| 4% |
Alternative & Absolute Return |
| 25%-35% |
| 29% |
| 35% |
Emerging Markets Global Balanced |
| 2%-5% |
| 2% |
| 3% |
Fixed Income |
| 37%-43% |
| 44% |
| 36% |
Cash Equivalents |
| 1% |
| 1% |
| 3% |
|
|
|
| 100% |
| 100% |
The plan's investment strategy is based on an expectation that, over time, equity securities will provide higher total returns than debt securities. The plan primarily minimizes the risk of large losses through diversification of investments by asset class, by investing in different types of styles within the classes and by using a number of different managers. The Committee monitors the asset allocation and investment performance monthly, with a more comprehensive quarterly review with its consultant.
The plan's expected return on assets is based on management's and the Committee's expectations of long-term average rates of return to be achieved by the plan's investments. These expectations are based on the plan's historical returns and expected returns for the asset classes in which the plan is invested.
The Company has adopted the fair value provisions for the plan assets of its pension plans. The Company categorizes plan assets within a three level fair value hierarchy, as described in Note 4.
Investments stated at fair value as determined by quoted market prices (Level 1) include:
Short-Term Investments: Short-Term Investments include money market mutual funds that invest in short-term securities and are valued based on cost, which approximates fair value;
Equity Securities: U.S. Common Stocks and International Mutual Funds are valued at the last reported sales price on the last business day of the fiscal year.
Investments stated at estimated fair value using significant observable inputs (Level 2) include:
Fixed Income Securities: Fixed Income Securities include investments in domestic bond collective trusts that are not traded publicly, but the underlying assets held in these funds are traded on active markets and the prices are readily observable. The investment in the trusts is valued at the last quoted price on the last business day of the fiscal year. Fixed Income Securities also include corporate and government bonds that are valued using a bid evaluation process with data provided by independent pricing sources.
Investments stated at estimated fair value using significant unobservable inputs (Level 3) include:
Other Investments: Other Investments include investments in limited partnerships and are valued at their estimated fair value based on audited financial statements of the partnerships.
The fair value of the major categories of the pension plans' investments are presented below (in thousands):
|
|
|
| July 1, 2012 | ||||||||||||||
Category |
|
|
| Total |
| Level 1 |
| Level 2 |
| Level 3 | ||||||||
Short-Term Investments: |
|
|
| $ | 7,337 | |
| $ | 7,337 | |
| $ | - | |
| $ | - | |
Fixed Income Securities: |
|
|
| 408,790 | |
| - | |
| 408,790 | |
| - | | ||||
Equity Securities: |
|
|
|
|
|
|
|
|
|
| ||||||||
U.S. common stocks |
|
|
| 188,997 | |
| 188,997 | |
| - | |
| - | | ||||
International mutual funds |
|
|
| 36,066 | |
| 36,066 | |
| - | |
| - | | ||||
Other Investments: |
|
|
|
|
|
|
|
|
|
| ||||||||
Venture capital funds |
| (A) |
| 152,093 | |
| - | |
| - | |
| 152,093 | | ||||
Debt funds |
| (B) |
| 36,211 | |
| - | |
| - | |
| 36,211 | | ||||
Real estate funds |
| (C) |
| 13,888 | |
| - | |
| - | |
| 13,888 | | ||||
Private equity funds |
| (D) |
| 71,185 | |
| - | |
| - | |
| 71,185 | | ||||
Global balanced funds |
| (E) |
| 23,178 | |
| - | |
| - | |
| 23,178 | | ||||
Fair Value of Plan Assets at End of Year |
|
|
| $ | 937,745 | |
| $ | 232,400 | |
| $ | 408,790 | |
| $ | 296,555 | |
|
|
|
| July 3, 2011 | ||||||||||||||
Category |
|
|
| Total |
| Level 1 |
| Level 2 |
| Level 3 | ||||||||
Short-Term Investments: |
|
|
| $ | 30,103 | |
| $ | 30,103 | |
| $ | - | |
| $ | - | |
Fixed Income Securities: |
|
|
| 330,283 | |
| - | |
| 330,283 | |
| - | | ||||
Equity Securities: |
|
|
|
|
|
|
|
|
|
| ||||||||
U.S. common stocks |
|
|
| 176,370 | |
| 176,370 | |
| - | |
| - | | ||||
International mutual funds |
|
|
| 38,155 | |
| 38,155 | |
| - | |
| - | | ||||
Other Investments: |
|
|
|
|
|
|
|
|
|
| ||||||||
Venture capital funds |
| (A) |
| 189,353 | |
| - | |
| - | |
| 189,353 | | ||||
Debt funds |
| (B) |
| 44,373 | |
| - | |
| - | |
| 44,373 | | ||||
Real estate funds |
| (C) |
| 17,242 | |
| - | |
| - | |
| 17,242 | | ||||
Private equity funds |
| (D) |
| 64,215 | |
| - | |
| - | |
| 64,215 | | ||||
Global balanced funds |
| (E) |
| 26,662 | |
| - | |
| - | |
| 26,662 | | ||||
Total Investments |
|
|
| $ | 916,756 | |
| $ | 244,628 | |
| $ | 330,283 | |
| $ | 341,845 | |
Securities lending collateral pools, net |
| (F) |
| (546 | ) |
| - | |
| (546 | ) |
| - | | ||||
Fair Value of Plan Assets at End of Year |
|
|
| $ | 916,210 | |
| $ | 244,628 | |
| $ | 329,737 | |
| $ | 341,845 | |
(A) | This category invests in a combination of public and private securities of companies in financial distress, spin-offs, or new projects focused on technology and manufacturing. |
(B) | This fund primarily invests in the debt of various entities including corporations and governments in emerging markets, mezzanine financing, or entities that are undergoing, are considered likely to undergo or have undergone a reorganization. |
(C) | This category invests primarily in real estate related investments, including real estate properties, securities of real estate companies and other companies with significant real estate assets as well as real estate related debt and equity securities. |
(D) | Primarily represents investments in all sizes of mostly privately held operating companies in the following core industry sectors: healthcare, energy, financial services, technology-media-telecommunications and industrial and consumer. |
(E) | Primarily represents investments in emerging market debt and equity. |
(F) | This category comprises pools of cash like debt securities and floating rate notes having a maturity or average life of three years or less, with a final payment of principal occurring in five years or less. Some of the investments are collateralized mortgage-backed securities whose maturities have been extended. This category's fair value is determined based on the net book value of the plan's pro-rated share of the collateral pool. |
The following tables present the changes in Level 3 investments for the pension plan (in thousands).
Changes to Level 3 investments for the year ended July 1, 2012 :
Category |
| July 3, 2011 Fair Value |
| Purchases, Sales, Issuances, and Settlements |
| Realized and Unrealized Gain (Loss) |
| July 1, 2012 Fair Value (a) | ||||||||
Venture capital funds |
| $ | 189,353 | |
| $ | (6,413 | ) |
| $ | (30,847 | ) |
| $ | 152,093 | |
Debt funds |
| 44,373 | |
| (9,451 | ) |
| 1,289 | |
| 36,211 | | ||||
Real estate funds |
| 17,242 | |
| (1,314 | ) |
| (2,040 | ) |
| 13,888 | | ||||
Private equity funds |
| 64,215 | |
| 6,433 | |
| 537 | |
| 71,185 | | ||||
Global balanced funds |
| 26,662 | |
| - | |
| (3,484 | ) |
| 23,178 | | ||||
|
| $ | 341,845 | |
| $ | (10,745 | ) |
| $ | (34,545 | ) |
| $ | 296,555 | |
Changes to Level 3 investments for the year ended July 3, 2011 :
Category |
| June 27, 2010 Fair Value |
| Purchases, Sales, Issuances, and Settlements |
| Realized and Unrealized Gain (Loss) |
| July 3, 2011 Fair Value (a) | ||||||||
Venture capital funds |
| $ | 136,179 | |
| $ | (10,290 | ) |
| $ | 63,464 | |
| $ | 189,353 | |
Debt funds |
| 47,110 | |
| (7,667 | ) |
| 4,930 | |
| 44,373 | | ||||
Real estate funds |
| 40,041 | |
| (2,709 | ) |
| (20,090 | ) |
| 17,242 | | ||||
Private equity funds |
| 58,610 | |
| (3,465 | ) |
| 9,070 | |
| 64,215 | | ||||
Global balanced funds |
| 22,805 | |
| - | |
| 3,857 | |
| 26,662 | | ||||
Hedge funds |
| 35,026 | |
| (36,533 | ) |
| 1,507 | |
| - | | ||||
|
| $ | 339,771 | |
| $ | (60,664 | ) |
| $ | 62,738 | |
| $ | 341,845 | |
(a) There were no transfers in or out of Level 3 during the years ended July 1, 2012 or July 3, 2011 .
Contributions
On July 6, 2012, the Moving Ahead for Progress in the 21st Century Act (MAP-21 Act) was signed into law. The MAP-21 Act included certain pension-related provisions which included changes to the methodology used to determine discount rates for ERISA funding purposes for qualified defined benefit pension plans. Based on historical interest rates, the MAP-21 Act allows plan sponsors to utilize a higher discount rate to value pension liabilities, which results in lower required pension plan contributions under ERISA. Based upon current regulations and actuarial studies the Company is required to make minimum contributions to the qualified pension plan of $44.7 million in fiscal 2013 . The Company may be required to make further contributions in future years depending on the actual return on plan assets and the funded status of the plan in future periods.
Estimated Future Benefit Payments
Projected benefit payments from the plans as of July 1, 2012 are estimated as follows (in thousands):
|
| Pension Benefits |
| Other Postretirement Benefits | ||||||||||||||||
Year Ending |
| Qualified |
| Non-Qualified |
| Retiree Medical |
| Retiree Life |
| LTD | ||||||||||
2013 |
| $ | 73,626 | |
| $ | 3,023 | |
| $ | 18,331 | |
| $ | 1,268 | |
| $ | 95 | |
2014 |
| 73,715 | |
| 3,119 | |
| 17,461 | |
| 1,296 | |
| 83 | | |||||
2015 |
| 74,045 | |
| 3,202 | |
| 16,066 | |
| 1,321 | |
| 73 | | |||||
2016 |
| 74,038 | |
| 3,300 | |
| 14,454 | |
| 1,343 | |
| 71 | | |||||
2017 |
| 74,212 | |
| 3,466 | |
| 11,762 | |
| 1,362 | |
| 69 | | |||||
2018-2022 |
| 372,088 | |
| 20,755 | |
| 36,285 | |
| 6,976 | |
| 282 | | |||||
Defined Contribution Plans
Employees of the Company may participate in a defined contribution savings plan that allows participants to contribute a portion of their earnings in accordance with plan specifications. A maximum of 1.50% to 3.50% of each participant's salary, depending upon the participant's group, is matched by the Company. Some of these Company matching contributions ceased July 1, 2009 and were reinstated effective January 1, 2010. Additionally, certain employees may receive Company nonelective contributions equal to 2.0% of the employee's salary. The Company contributions totaled $8.3 million in 2012 , $8.7 million in 2011 and $7.6 million in 2010 .
Postemployment Benefits
The Company accrues the expected cost of postemployment benefits over the years that the employees render service. These benefits apply only to employees who become disabled while actively employed, or who terminate with at least thirty years of service and retire prior to age sixty-five. The items include disability payments, life insurance and medical benefits. These amounts are also discounted using a 3.75% interest rate for fiscal year 2012 and 4.45% interest rate for fiscal year 2011 . Amounts are included in Accrued Employee Benefits in the Consolidated Balance Sheets.
(16) Restructuring Actions:
In January 2012, the Company announced plans to reduce manufacturing capacity through closure of its Newbern, Tennessee and Ostrava, Czech Republic plants as well as the reconfiguration of its plant in Poplar Bluff, Missouri. In April 2012, the Company announced plans to further reduce manufacturing costs through consolidation of its Auburn, Alabama manufacturing facility as well as the reduction of approximately 10% of the Company's salaried headcount. Additionally, beginning in fiscal 2013, the Company will no longer pursue placement of lawn and garden products at national mass retailers. The Engines segment will continue to support lawn and garden equipment OEMs who provide lawn and garden equipment to these retailers. The Products segment will continue to focus on innovative, higher margin products that are sold through our network of Simplicity, Snapper and Ferris dealers and regional retailers. The Company will also continue to sell pressure washers and portable and standby generators through the U.S. mass retail channel. During fiscal 2012, the Company completed manufacturing operations at its Newbern, Tennessee and Ostrava, Czech Republic plants, carried out the reconfiguration of the Poplar Bluff, Missouri plant and implemented the salaried headcount reductions.
The Company reports restructuring charges associated with manufacturing and related initiatives as costs of goods sold within the Consolidated Statements of Earnings. Restructuring charges reflected as costs of goods sold include, but are not limited to, termination and related costs associated with manufacturing employees, asset impairments and accelerated depreciation relating to manufacturing initiatives, and other costs directly related to the restructuring initiatives implemented. The Company reports all other non-manufacturing related restructuring charges as selling, general and administrative expenses on the Consolidated Statements of Earnings. The closing of the Company's facility in Newbern, Tennessee affected approximately 240 regular employees and 450 temporary employees. Additionally, the closing of the Ostrava, Czech Republic facility affected approximately 77 regular employees. There were no significant employment changes at the Poplar Bluff, Missouri facility as a result of the idling of certain assets. Approximately 250 regular employees are expected to be affected by the Auburn, Alabama facility consolidation. The 10% reduction of the Company's salaried workforce affected approximately 210 employees globally.
Pre-tax costs of all restructuring actions totaled $49.9 million ( $28.8 million after tax or $0.58 per diluted share) in fiscal 2012. The Engines Segment and Products Segment recorded $18.3 million and $31.6 million , respectively, of pre-tax restructuring charges during fiscal 2012. The total pre-tax costs associated with these restructuring actions are expected to be $60 million to $70 million .
The following is a rollforward of the restructuring reserve (included in Accrued Liabilities within the Consolidated Condensed Balance Sheets) attributable to all Engines Segment restructuring activities for fiscal 2012 (in thousands):
|
| Termination Benefits |
| Other Costs |
| Total | ||||||
Reserve Balance at July 3, 2011 |
| $ | - | |
| $ | - | |
| $ | - | |
Provisions |
| 4,685 | |
| 13,629 | |
| 18,314 | | |||
Cash Expenditures |
| (2,458 | ) |
| (555 | ) |
| (3,013 | ) | |||
Other Adjustments (1) |
| - | |
| (9,730 | ) |
| (9,730 | ) | |||
Reserve Balance at July 1, 2012 |
| $ | 2,227 | |
| $ | 3,344 | |
| $ | 5,571 | |
(1) Other adjustments includes $2.2 million of property, plant and equipment impairments, $4.7 million of accelerated depreciation, $0.8 million of inventory write-downs, $1.7 million of curtailment associated with pension and other postretirement benefits, and $0.3 million of foreign currency translation.
The following is a rollforward of the restructuring reserve (included in Accrued Liabilities within the Consolidated Condensed Balance Sheets) attributable to all Products Segment restructuring activities for fiscal 2012 (in thousands):
|
| Termination Benefits |
| Other Costs |
| Total | ||||||
Reserve Balance at July 3, 2011 |
| $ | - | |
| $ | - | |
| $ | - | |
Provisions |
| 2,015 | |
| 29,538 | |
| 31,553 | | |||
Cash Expenditures |
| (1,073 | ) |
| (2,607 | ) |
| (3,680 | ) | |||
Other Adjustments (2) |
| - | |
| (26,486 | ) |
| (26,486 | ) | |||
Reserve Balance at July 1, 2012 |
| $ | 942 | |
| $ | 445 | |
| $ | 1,387 | |
(2) Other adjustments includes $13.7 million of accelerated depreciation and $12.6 million of inventory write-downs.
In fiscal 2011, the Company made organization changes that involved a reduction of salaried employees during the quarter ended December 26, 2010. In fiscal 2011, these organization changes resulted in restructuring charges of $3.5 million , consisting of $1.3 million due to the modification of certain vesting conditions for the Company's stock incentive awards and approximately $2.2 million for severance and other related employee separation costs associated with the reduction.
(17) Assets Held for Sale:
At July 1, 2012 and July 3, 2011 , the Company had $10.4 million and $14.1 million , respectively, included in Assets Held for Sale in its Consolidated Condensed Balance Sheets, consisting of certain assets related to the Ostrava, Czech Republic and Jefferson, WI production facilities. Prior to the closure of the Ostrava, Czech Republic facility, small engines were manufactured by the Company within its Engines Segment for the outdoor power equipment industry. Prior to the closure of the Jefferson facility, portable generator and pressure washer products were manufactured, marketed and sold by the Company within its Products Segment.
(18) Equity:
Share Repurchases
In fiscal 2012, the Board of Directors of the Company authorized up to $50.0 million in funds for use in a common share repurchase program with an expiration of June 30, 2013 . As of the end of the fourth quarter of fiscal 2012, the Company repurchased 2,409,972 shares on the open market at a total cost of $39.3 million , or $16.30 per share. There were no shares repurchased in fiscal 2011.
In August 2012, the Board of Directors authorized an additional $50.0 million in funds associated with the common share repurchase program and an extension of the expiration date to June 30, 2014 . Share repurchases, among other things, allow the Company to offset any potentially dilutive impacts of share-based compensation. The common share repurchase program authorizes the purchase of shares of the Company's common stock on the open market or in private transactions from time to time, depending on market conditions and certain governing loan covenants.
Comprehensive Income (Loss)
Comprehensive Income (Loss) is a more inclusive financial reporting method that includes disclosure of financial information that historically has not been recognized in the calculation of net income. The Company has chosen to report Comprehensive Income (Loss) and Accumulated Other Comprehensive Income (Loss) which encompasses net income, cumulative translation adjustments, unrealized gain (loss) on derivatives and unrecognized pension and postretirement obligations in the Consolidated Statements of Shareholders' Investment. Information on Accumulated Other Comprehensive Income (Loss) is as follows (in thousands):
|
| Cumulative Translation Adjustments |
| Unrealized Gain (Loss) on Derivatives |
| Unrecognized Pension and Postretirement Obligation |
| Accumulated Other Comprehensive Income (Loss) | ||||||||
Balance at June 28, 2009 |
| $ | 8,961 | |
| $ | (3,127 | ) |
| $ | (256,107 | ) |
| $ | (250,273 | ) |
Fiscal Year Change |
| (4,989 | ) |
| 11,626 | |
| (75,073 | ) |
| (68,436 | ) | ||||
Balance at June 27, 2010 |
| 3,972 | |
| 8,499 | |
| (331,180 | ) |
| (318,709 | ) | ||||
Fiscal Year Change |
| 22,017 | |
| (10,742 | ) |
| 63,936 | |
| 75,211 | | ||||
Balance at July 3, 2011 |
| 25,989 | |
| (2,243 | ) |
| (267,244 | ) |
| (243,498 | ) | ||||
Fiscal Year Change |
| (13,487 | ) |
| (5,411 | ) |
| (60,308 | ) |
| (79,206 | ) | ||||
Balance at July 1, 2012 |
| $ | 12,502 | |
| $ | (7,654 | ) |
| $ | (327,552 | ) |
| $ | (322,704 | ) |
(19) Separate Financial Information of Subsidiary Guarantors of Indebtedness:
Under the terms of the Company's Senior Notes and the Revolver (collectively, the "Domestic Indebtedness"), Briggs & Stratton Power Products Group, LLC, a 100% owned subsidiary of the Company, is the joint and several guarantor of the Domestic Indebtedness (the "Guarantor"). The guarantees are full and unconditional guarantees. Additionally, if at any time a domestic subsidiary of the Company constitutes a significant domestic subsidiary, then such domestic subsidiary will also become a guarantor of the Domestic Indebtedness. Currently, all of the Domestic Indebtedness is unsecured. If the Company were to fail to make a payment of interest or principal on its due date, the Guarantor is obligated to pay the outstanding Domestic Indebtedness.
The Company had the following outstanding amounts related to the guaranteed debt (in thousands):
|
| July 1, 2012 Carrying Amount |
| Maximum Guarantee | ||||
6.875% Senior Notes |
| $ | 225,000 | |
| $ | 225,000 | |
Multicurrency Credit Agreement |
| $ | - | |
| $ | 500,000 | |
BALANCE SHEET: As of July 1, 2012 |
| Briggs & Stratton Corporation |
| Guarantor Subsidiaries |
| Non-Guarantor Subsidiaries |
| Eliminations |
| Consolidated | ||||||||||
CURRENT ASSETS: |
|
|
|
|
|
|
|
|
|
| ||||||||||
Cash and Cash Equivalents |
| $ | 133,108 | |
| $ | 5,375 | |
| $ | 17,592 | |
| $ | - | |
| $ | 156,075 | |
Accounts Receivable, Net |
| 102,997 | |
| 97,009 | |
| 23,990 | |
| - | |
| 223,996 | | |||||
Intercompany Accounts Receivable |
| 45,391 | |
| 7,593 | |
| 69,096 | |
| (122,080 | ) |
| - | | |||||
Inventories, Net |
| 149,863 | |
| 224,642 | |
| 59,179 | |
| - | |
| 433,684 | | |||||
Deferred Tax Asset |
| 25,630 | |
| 17,699 | |
| 1,198 | |
| - | |
| 44,527 | | |||||
Assets Held for Sale |
| - | |
| 4,000 | |
| 6,404 | |
| - | |
| 10,404 | | |||||
Prepaid Expenses and Other |
| 28,660 | |
| 11,412 | |
| 2,742 | |
| - | |
| 42,814 | | |||||
Total Current Assets |
| $ | 485,649 | |
| $ | 367,730 | |
| $ | 180,201 | |
| $ | (122,080 | ) |
| $ | 911,500 | |
OTHER ASSETS: |
|
|
|
|
|
|
|
|
|
| ||||||||||
Goodwill |
| $ | 128,300 | |
| $ | 64,544 | |
| $ | 11,920 | |
| $ | - | |
| $ | 204,764 | |
Investments |
| 22,163 | |
| - | |
| - | |
| - | |
| 22,163 | | |||||
Investments in Subsidiaries |
| 556,958 | |
| - | |
| - | |
| (556,958 | ) |
| - | | |||||
Intercompany Note Receivable |
| 22,666 | |
| 36,987 | |
| 11,137 | |
| (70,790 | ) |
| - | | |||||
Debt Issuance Costs, Net |
| 5,717 | |
| - | |
| - | |
| - | |
| 5,717 | | |||||
Other Intangible Assets, Net |
| - | |
| 83,242 | |
| 3,825 | |
| - | |
| 87,067 | | |||||
Long-Term Deferred Tax Asset |
| 108,003 | |
| - | |
| 2 | |
| (41,054 | ) |
| 66,951 | | |||||
Other Long-Term Assets, Net |
| 4,813 | |
| 2,733 | |
| 1,274 | |
| - | |
| 8,820 | | |||||
Total Other Assets |
| $ | 848,620 | |
| $ | 187,506 | |
| $ | 28,158 | |
| $ | (668,802 | ) |
| $ | 395,482 | |
PLANT AND EQUIPMENT, NET |
| 230,253 | |
| 53,105 | |
| 17,891 | |
| - | |
| 301,249 | | |||||
TOTAL ASSETS |
| $ | 1,564,522 | |
| $ | 608,341 | |
| $ | 226,250 | |
| $ | (790,882 | ) |
| $ | 1,608,231 | |
|
|
|
|
|
|
|
|
|
|
| ||||||||||
CURRENT LIABILITIES: |
|
|
|
|
|
|
|
|
|
| ||||||||||
Accounts Payable |
| 85,839 | |
| 44,829 | |
| 20,485 | |
| - | |
| 151,153 | | |||||
Intercompany Accounts Payable |
| 56,674 | |
| 26,661 | |
| 38,761 | |
| (122,096 | ) |
| - | | |||||
Short-Term Debt |
| - | |
| - | |
| 3,000 | |
| - | |
| 3,000 | | |||||
Accrued Liabilities |
| 108,079 | |
| 28,706 | |
| 14,971 | |
| - | |
| 151,756 | | |||||
Total Current Liabilities |
| $ | 250,592 | |
| $ | 100,196 | |
| $ | 77,217 | |
| $ | (122,096 | ) |
| $ | 305,909 | |
OTHER LIABILITIES: |
|
|
|
|
|
|
|
|
| - | | |||||||||
Accrued Pension Cost |
| 295,862 | |
| 464 | |
| 68 | |
| - | |
| 296,394 | | |||||
Accrued Employee Benefits |
| 25,035 | |
| - | |
| - | |
| - | |
| 25,035 | | |||||
Accrued Postretirement Health Care Obligation |
| 73,575 | |
| 16,267 | |
| - | |
| - | |
| 89,842 | | |||||
Accrued Warranty |
| 9,900 | |
| 6,515 | |
| - | |
| - | |
| 16,415 | | |||||
Intercompany Note Payable |
| 41,147 | |
| - | |
| 29,627 | |
| (70,774 | ) |
| - | | |||||
Deferred Tax Liabilities |
| - | |
| 41,054 | |
| - | |
| (41,054 | ) |
| - | | |||||
Other Long-Term Liabilities |
| 11,441 | |
| 4,970 | |
| 1,255 | |
| - | |
| 17,666 | | |||||
Long-Term Debt |
| 225,000 | |
| - | |
| - | |
| - | |
| 225,000 | | |||||
Total Other Liabilities |
| $ | 681,960 | |
| $ | 69,270 | |
| $ | 30,950 | |
| $ | (111,828 | ) |
| $ | 670,352 | |
TOTAL SHAREHOLDERS' INVESTMENT: |
| 631,970 | |
| 438,875 | |
| 118,083 | |
| (556,958 | ) |
| 631,970 | | |||||
TOTAL LIABILITIES AND SHAREHOLDERS' INVESTMENT |
| $ | 1,564,522 | |
| $ | 608,341 | |
| $ | 226,250 | |
| $ | (790,882 | ) |
| $ | 1,608,231 | |
BALANCE SHEET: As of July 3, 2011 |
| Briggs & Stratton Corporation |
| Guarantor Subsidiaries |
| Non-Guarantor Subsidiaries |
| Eliminations |
| Consolidated | ||||||||||
CURRENT ASSETS: |
|
|
|
|
|
|
|
|
|
| ||||||||||
Cash and Cash Equivalents |
| $ | 158,672 | |
| $ | 1,372 | |
| $ | 49,595 | |
| $ | - | |
| $ | 209,639 | |
Accounts Receivable, Net |
| 126,872 | |
| 95,645 | |
| 26,841 | |
| - | |
| 249,358 | | |||||
Intercompany Accounts Receivable |
| 41,677 | |
| 3,764 | |
| 65,311 | |
| (110,752 | ) |
| - | | |||||
Inventories, Net |
| 141,587 | |
| 213,084 | |
| 72,420 | |
| - | |
| 427,091 | | |||||
Deferred Tax Asset |
| 27,661 | |
| 13,205 | |
| 1,297 | |
| - | |
| 42,163 | | |||||
Assets Held for Sale |
| - | |
| 4,000 | |
| 10,075 | |
| - | |
| 14,075 | | |||||
Prepaid Expenses and Other |
| 5,470 | |
| 28,217 | |
| 2,726 | |
| - | |
| 36,413 | | |||||
Total Current Assets |
| $ | 501,939 | |
| $ | 359,287 | |
| $ | 228,265 | |
| $ | (110,752 | ) |
| $ | 978,739 | |
OTHER ASSETS: |
|
|
|
|
|
|
|
|
|
| ||||||||||
Goodwill |
| $ | 128,300 | |
| $ | 64,544 | |
| $ | 10,096 | |
| $ | - | |
| $ | 202,940 | |
Investments |
| 21,017 | |
| - | |
| - | |
| - | |
| 21,017 | | |||||
Investments in Subsidiaries |
| 603,498 | |
| - | |
| - | |
| (603,498 | ) |
| - | | |||||
Intercompany Note Receivable |
| 44,263 | |
| 43,437 | |
| 6 | |
| (87,706 | ) |
| - | | |||||
Deferred Loan Costs, Net |
| 4,919 | |
| - | |
| - | |
| - | |
| 4,919 | | |||||
Other Intangible Assets, Net |
| - | |
| 85,102 | |
| 4,173 | |
| - | |
| 89,275 | | |||||
Long-Term Deferred Tax Asset |
| 71,176 | |
| - | |
| 340 | |
| (40,515 | ) |
| 31,001 | | |||||
Other Long-Term Assets, Net |
| 4,352 | |
| 3,493 | |
| 1,257 | |
| - | |
| 9,102 | | |||||
Total Other Assets |
| $ | 877,525 | |
| $ | 196,576 | |
| $ | 15,872 | |
| $ | (731,719 | ) |
| $ | 358,254 | |
PLANT AND EQUIPMENT, NET |
| 232,223 | |
| 71,914 | |
| 25,088 | |
| - | |
| 329,225 | | |||||
TOTAL ASSETS |
| $ | 1,611,687 | |
| $ | 627,777 | |
| $ | 269,225 | |
| $ | (842,471 | ) |
| $ | 1,666,218 | |
|
|
|
|
|
|
|
|
|
|
| ||||||||||
CURRENT LIABILITIES: |
|
|
|
|
|
|
|
|
|
| ||||||||||
Accounts Payable |
| 109,870 | |
| 48,842 | |
| 25,021 | |
| - | |
| 183,733 | | |||||
Intercompany Accounts Payable |
| 46,003 | |
| 15,401 | |
| 49,353 | |
| (110,757 | ) |
| - | | |||||
Short-Term Debt |
| - | |
| - | |
| 3,000 | |
| - | |
| 3,000 | | |||||
Accrued Liabilities |
| 115,335 | |
| 24,645 | |
| 17,670 | |
| - | |
| 157,650 | | |||||
Total Current Liabilities |
| $ | 271,208 | |
| $ | 88,888 | |
| $ | 95,044 | |
| $ | (110,757 | ) |
| $ | 344,383 | |
OTHER LIABILITIES: |
|
|
|
|
|
|
|
|
| - | | |||||||||
Accrued Pension Cost |
| 190,855 | |
| 488 | |
| 74 | |
| - | |
| 191,417 | | |||||
Accrued Employee Benefits |
| 24,100 | |
| - | |
| - | |
| - | |
| 24,100 | | |||||
Accrued Postretirement Health Care Obligation |
| 98,629 | |
| 17,463 | |
| - | |
| - | |
| 116,092 | | |||||
Accrued Warranty |
| 8,704 | |
| 5,623 | |
| - | |
| - | |
| 14,327 | | |||||
Intercompany Note Payable |
| 43,436 | |
| - | |
| 44,265 | |
| (87,701 | ) |
| - | | |||||
Deferred Tax Liabilities |
| - | |
| 40,515 | |
| - | |
| (40,515 | ) |
| - | | |||||
Other Long-Term Liabilities |
| 11,812 | |
| 130 | |
| 1,014 | |
| - | |
| 12,956 | | |||||
Long-Term Debt |
| 225,000 | |
| - | |
| - | |
| - | |
| 225,000 | | |||||
Total Other Liabilities |
| $ | 602,536 | |
| $ | 64,219 | |
| $ | 45,353 | |
| $ | (128,216 | ) |
| $ | 583,892 | |
TOTAL SHAREHOLDERS' INVESTMENT: |
| 737,943 | |
| 474,670 | |
| 128,828 | |
| (603,498 | ) |
| 737,943 | | |||||
TOTAL LIABILITIES AND SHAREHOLDERS' INVESTMENT |
| $ | 1,611,687 | |
| $ | 627,777 | |
| $ | 269,225 | |
| $ | (842,471 | ) |
| $ | 1,666,218 | |
STATEMENT OF EARNINGS: For the Fiscal Year Ended July 1, 2012 |
| Briggs & Stratton Corporation |
| Guarantor Subsidiaries |
| Non-Guarantor Subsidiaries |
| Eliminations |
| Consolidated | ||||||||||
Net Sales |
| $ | 1,235,805 | |
| $ | 835,011 | |
| $ | 321,216 | |
| $ | (325,499 | ) |
| $ | 2,066,533 | |
Cost of Goods Sold |
| 1,007,493 | |
| 744,103 | |
| 258,951 | |
| (325,499 | ) |
| 1,685,048 | | |||||
Restructuring Charges |
| 4,235 | |
| 28,790 | |
| 11,735 | |
| - | |
| 44,760 | | |||||
Gross Profit |
| 224,077 | |
| 62,118 | |
| 50,530 | |
| - | |
| 336,725 | | |||||
Engineering, Selling, General and Administrative Expenses |
| 167,133 | |
| 80,915 | |
| 42,333 | |
| - | |
| 290,381 | | |||||
Restructuring Charges |
| 4,001 | |
| 1,106 | |
| - | |
| - | |
| 5,107 | | |||||
Equity in Loss from Subsidiaries |
| 5,881 | |
| - | |
| - | |
| (5,881 | ) |
| - | | |||||
Income (Loss) from Operations |
| 47,062 | |
| (19,903 | ) |
| 8,197 | |
| 5,881 | |
| 41,237 | | |||||
Interest Expense |
| (18,347 | ) |
| (33 | ) |
| (162 | ) |
| - | |
| (18,542 | ) | |||||
Other Income, Net |
| 4,830 | |
| 207 | |
| 2,141 | |
| - | |
| 7,178 | | |||||
Income (Loss) Before Provision for Income Taxes |
| 33,545 | |
| (19,729 | ) |
| 10,176 | |
| 5,881 | |
| 29,873 | | |||||
Provision (Credit) for Income Taxes |
| 4,539 | |
| (8,897 | ) |
| 5,225 | |
| - | |
| 867 | | |||||
Net Income (Loss) |
| $ | 29,006 | |
| $ | (10,832 | ) |
| $ | 4,951 | |
| $ | 5,881 | |
| $ | 29,006 | |
For the Fiscal Year Ended July 3, 2011 |
|
|
|
|
|
|
|
|
|
| ||||||||||
Net Sales |
| $ | 1,327,378 | |
| $ | 740,336 | |
| $ | 343,293 | |
| $ | (313,643 | ) |
| $ | 2,109,998 | |
Cost of Goods Sold |
| 1,047,229 | |
| 705,410 | |
| 272,686 | |
| (313,643 | ) |
| 1,711,682 | | |||||
Gross Profit |
| 280,149 | |
| 47,560 | |
| 70,607 | |
| - | |
| 398,316 | | |||||
Engineering, Selling, General and Administrative Expenses |
| 179,263 | |
| 75,315 | |
| 42,535 | |
| - | |
| 297,113 | | |||||
Restructuring Charges |
| 559 | |
| 2,978 | |
| - | |
| - | |
| 3,537 | | |||||
Goodwill Impairment |
| - | |
| 49,450 | |
| - | |
| - | |
| 49,450 | | |||||
Equity in Loss from Subsidiaries |
| 28,636 | |
| - | |
| - | |
| (28,636 | ) |
| - | | |||||
Income (Loss) from Operations |
| 71,691 | |
| (80,183 | ) |
| 28,072 | |
| 28,636 | |
| 48,216 | | |||||
Interest Expense |
| (23,084 | ) |
| (66 | ) |
| (168 | ) |
| - | |
| (23,318 | ) | |||||
Other Income, Net |
| 4,331 | |
| 308 | |
| 2,517 | |
| - | |
| 7,156 | | |||||
Income (Loss) Before Provision for Income Taxes |
| 52,938 | |
| (79,941 | ) |
| 30,421 | |
| 28,636 | |
| 32,054 | | |||||
Provision (Credit) for Income Taxes |
| 28,583 | |
| (25,552 | ) |
| 4,668 | |
| - | |
| 7,699 | | |||||
Net Income (Loss) |
| $ | 24,355 | |
| $ | (54,389 | ) |
| $ | 25,753 | |
| $ | 28,636 | |
| $ | 24,355 | |
For the Fiscal Year Ended June 27, 2010 |
|
|
|
|
|
|
|
|
|
| ||||||||||
Net Sales |
| $ | 1,299,283 | |
| $ | 740,336 | |
| $ | 279,134 | |
| $ | (290,881 | ) |
| $ | 2,027,872 | |
Cost of Goods Sold |
| 1,039,021 | |
| 683,061 | |
| 216,736 | |
| (290,881 | ) |
| 1,647,937 | | |||||
Gross Profit |
| 260,262 | |
| 57,275 | |
| 62,398 | |
| - | |
| 379,935 | | |||||
Engineering, Selling, General and Administrative Expenses |
| 164,358 | |
| 76,572 | |
| 39,318 | |
| - | |
| 280,248 | | |||||
Litigation Settlement |
| 30,600 | |
| - | |
| - | |
| - | |
| 30,600 | | |||||
Equity in Earnings from Subsidiaries |
| (20,688 | ) |
| - | |
| - | |
| 20,688 | |
| - | | |||||
Income (Loss) from Operations |
| 85,992 | |
| (19,297 | ) |
| 23,080 | |
| (20,688 | ) |
| 69,087 | | |||||
Interest Expense |
| (26,218 | ) |
| (96 | ) |
| (155 | ) |
| - | |
| (26,469 | ) | |||||
Other Income (Expense), Net |
| (7,644 | ) |
| 157 | |
| 13,942 | |
| - | |
| 6,455 | | |||||
Income (Loss) Before Provision for Income Taxes |
| 52,130 | |
| (19,236 | ) |
| 36,867 | |
| (20,688 | ) |
| 49,073 | | |||||
Provision (Credit) for Income Taxes |
| 15,515 | |
| (6,961 | ) |
| 3,904 | |
| - | |
| 12,458 | | |||||
Net Income (Loss) |
| $ | 36,615 | |
| $ | (12,275 | ) |
| $ | 32,963 | |
| $ | (20,688 | ) |
| $ | 36,615 | |
STATEMENT OF CASH FLOWS: For the Fiscal Year Ended July 1, 2012 |
| Briggs & Stratton Corporation |
| Guarantor Subsidiaries |
| Non-Guarantor Subsidiaries |
| Eliminations |
| Consolidated | ||||||||||
CASH FLOWS FROM OPERATING ACTIVITIES: |
|
|
|
|
|
|
|
|
|
| ||||||||||
Net Cash Provided by (Used in) Operating Activities |
| $ | 82,114 | |
| $ | 2,879 | |
| $ | (19,032 | ) |
| $ | - | |
| $ | 65,961 | |
CASH FLOWS FROM INVESTING ACTIVITIES: |
|
|
|
|
|
|
|
|
|
| ||||||||||
Additions to Plant and Equipment |
| (40,456 | ) |
| (6,588 | ) |
| (2,529 | ) |
| - | |
| (49,573 | ) | |||||
Cash Paid for Acquisition, Net of Cash Acquired |
| - | |
| - | |
| (2,673 | ) |
| - | |
| (2,673 | ) | |||||
Proceeds Received on Disposition of Plant and Equipment |
| 141 | |
| 1,278 | |
| 38 | |
| - | |
| 1,457 | | |||||
Cash Investment in Subsidiary |
| 2,141 | |
| - | |
| (2,141 | ) |
| - | |
| - | | |||||
Net Cash Used in Investing Activities |
| (38,174 | ) |
| (5,310 | ) |
| (7,305 | ) |
| - | |
| (50,789 | ) | |||||
CASH FLOWS FROM FINANCING ACTIVITIES: |
|
|
|
|
|
|
|
|
|
| ||||||||||
Net Borrowings (Repayments) on Loans, Notes Payable and Long-Term Debt |
| (6,434 | ) |
| 6,434 | |
| - | |
| - | |
| - | | |||||
Debt Issuance Costs |
| (2,007 | ) |
| - | |
| - | |
| - | |
| (2,007 | ) | |||||
Cash Dividends Paid |
| (22,011 | ) |
| - | |
| - | |
| - | |
| (22,011 | ) | |||||
Stock Option Exercise Proceeds and Tax Benefits |
| 235 | |
| - | |
| - | |
| - | |
| 235 | | |||||
Treasury Stock Repurchases |
| (39,287 | ) |
| - | |
| - | |
| - | |
| (39,287 | ) | |||||
Net Cash Provided by (Used in) Financing Activities |
| (69,504 | ) |
| 6,434 | |
| - | |
| - | |
| (63,070 | ) | |||||
EFFECT OF FOREIGN CURRENCY EXCHANGE RATE CHANGES ON CASH AND CASH EQUIVALENTS |
| - | |
| - | |
| (5,666 | ) |
| - | |
| (5,666 | ) | |||||
NET INCREASE (DECREASE) IN CASH AND CASH EQUIVALENTS |
| (25,564 | ) |
| 4,003 | |
| (32,003 | ) |
| - | |
| (53,564 | ) | |||||
Cash and Cash Equivalents, Beginning of Year |
| 158,672 | |
| 1,372 | |
| 49,595 | |
| - | |
| 209,639 | | |||||
Cash and Cash Equivalents, End of Year |
| $ | 133,108 | |
| $ | 5,375 | |
| $ | 17,592 | |
| $ | - | |
| $ | 156,075 | |
STATEMENT OF CASH FLOWS: For the Fiscal Year Ended July 3, 2011 |
| Briggs & Stratton Corporation |
| Guarantor Subsidiaries |
| Non-Guarantor Subsidiaries |
| Eliminations |
| Consolidated | ||||||||||
CASH FLOWS FROM OPERATING ACTIVITIES: |
|
|
|
|
|
|
|
|
|
| ||||||||||
Net Cash Provided by (Used in) Operating Activities |
| $ | 126,397 | |
| $ | (13,433 | ) |
| $ | 43,967 | |
| $ | - | |
| $ | 156,931 | |
CASH FLOWS FROM INVESTING ACTIVITIES: |
|
|
|
|
|
|
|
|
|
| ||||||||||
Additions to Plant and Equipment |
| (47,627 | ) |
| (9,384 | ) |
| (2,908 | ) |
| - | |
| (59,919 | ) | |||||
Proceeds Received on Disposition of Plant and Equipment |
| 73 | |
| 49 | |
| 26 | |
| - | |
| 148 | | |||||
Cash Investment in Subsidiary |
| 3,908 | |
| - | |
| (3,908 | ) |
| - | |
| - | | |||||
Net Cash Provided by (Used in) Investing Activities |
| (43,646 | ) |
| (9,335 | ) |
| (6,790 | ) |
| - | |
| (59,771 | ) | |||||
CASH FLOWS FROM FINANCING ACTIVITIES: |
|
|
|
|
|
|
|
|
|
| ||||||||||
Net Borrowings (Repayments) on Loans, Notes Payable and Long-Term Debt |
| 837 | |
| 20,465 | |
| - | |
| - | |
| 21,302 | | |||||
Debt Issuance Costs |
| (4,994 | ) |
| - | |
| - | |
| - | |
| (4,994 | ) | |||||
Cash Dividends Paid |
| (22,334 | ) |
| - | |
| - | |
| - | |
| (22,334 | ) | |||||
Stock Option Exercise Proceeds and Tax Benefits |
| 1,532 | |
| - | |
| - | |
| - | |
| 1,532 | | |||||
Net Cash Provided by (Used in) Financing Activities |
| (24,959 | ) |
| 20,465 | |
| - | |
| - | |
| (4,494 | ) | |||||
EFFECT OF FOREIGN CURRENCY EXCHANGE RATE CHANGES ON CASH AND CASH EQUIVALENTS |
| - | |
| - | |
| 419 | |
| - | |
| 419 | | |||||
NET INCREASE (DECREASE) IN CASH AND CASH EQUIVALENTS |
| 57,792 | |
| (2,303 | ) |
| 37,596 | |
| - | |
| 93,085 | | |||||
Cash and Cash Equivalents, Beginning of Year |
| 100,880 | |
| 3,675 | |
| 11,999 | |
| - | |
| 116,554 | | |||||
Cash and Cash Equivalents, End of Year |
| $ | 158,672 | |
| $ | 1,372 | |
| $ | 49,595 | |
| $ | - | |
| $ | 209,639 | |
STATEMENT OF CASH FLOWS: For the Fiscal Year Ended June 27, 2010 |
| Briggs & Stratton Corporation |
| Guarantor Subsidiaries |
| Non-Guarantor Subsidiaries |
| Eliminations |
| Consolidated | ||||||||||
CASH FLOWS FROM OPERATING ACTIVITIES: |
|
|
|
|
|
|
|
|
|
| ||||||||||
Net Cash Provided by Operating Activities |
| $ | 180,566 | |
| $ | 34,619 | |
| $ | 28,556 | |
| $ | - | |
| $ | 243,741 | |
CASH FLOWS FROM INVESTING ACTIVITIES: |
|
|
|
|
|
|
|
|
|
| ||||||||||
Additions to Plant and Equipment |
| (28,903 | ) |
| (11,494 | ) |
| (4,046 | ) |
| - | |
| (44,443 | ) | |||||
Proceeds Received on Disposition of Plant and Equipment |
| 220 | |
| 40 | |
| 16 | |
| - | |
| 276 | | |||||
Cash Investment in Subsidiary |
| 26,305 | |
| - | |
| (26,305 | ) |
| - | |
| - | | |||||
Other, Net |
| (144 | ) |
| - | |
| - | |
| - | |
| (144 | ) | |||||
Net Cash Used in Investing Activities |
| (2,522 | ) |
| (11,454 | ) |
| (30,335 | ) |
| - | |
| (44,311 | ) | |||||
CASH FLOWS FROM FINANCING ACTIVITIES: |
|
|
|
|
|
|
|
|
|
| ||||||||||
Net Borrowings (Repayments) on Loans, Notes Payable and Long-Term Debt |
| (57,446 | ) |
| (20,790 | ) |
| - | |
| - | |
| (78,236 | ) | |||||
Cash Dividends Paid |
| (22,125 | ) |
| - | |
| - | |
| - | |
| (22,125 | ) | |||||
Stock Option Exercise Proceeds and Tax Benefits |
| 864 | |
| - | |
| - | |
| - | |
| 864 | | |||||
Net Cash Used in Financing Activities |
| (78,707 | ) |
| (20,790 | ) |
| - | |
| - | |
| (99,497 | ) | |||||
EFFECT OF FOREIGN CURRENCY EXCHANGE RATE CHANGES ON CASH AND CASH EQUIVALENTS |
| - | |
| - | |
| 629 | |
| - | |
| 629 | | |||||
NET INCREASE (DECREASE) IN CASH AND CASH EQUIVALENTS |
| 99,337 | |
| 2,375 | |
| (1,150 | ) |
| - | |
| 100,562 | | |||||
Cash and Cash Equivalents, Beginning of Year |
| 1,541 | |
| 1,301 | |
| 13,150 | |
| - | |
| 15,992 | | |||||
Cash and Cash Equivalents, End of Year |
| $ | 100,880 | |
| $ | 3,675 | |
| $ | 11,999 | |
| $ | - | |
| $ | 116,554 | |
The Company revised its condensed supplemental consolidating balance sheet as of July 3, 2011 and condensed supplemental statements of cash flows for the fiscal years ended July 3, 2011 and June 27, 2010, to correct both the form and content of the condensed presentation in accordance with S-X Rule 3-10 and Rule 10-01. The revision was made to include major balance sheet captions within current assets, non-current assets, current liabilities and other long-term obligations within the condensed supplemental consolidating balance sheet and adjust cash flows provided by (used in) operating activities, cash flows provided by (used in) investing activities and cash flows provided by (used in) financing activities within the condensed supplemental consolidating statements of cash flows. The Company identified adjustments to previously reported amounts in the condensed supplemental consolidating balance sheet as of July 3, 2011 and the condensed supplemental statements of cash flows for previously reported periods as a result of the change in presentation described above. The following tables reflect the previously reported and as revised and summarized amounts of the Company's condensed supplemental consolidating financial information:
BALANCE SHEET: As of July 3, 2011 (As Previously Reported) |
| Briggs & Stratton Corporation |
| Guarantor Subsidiaries |
| Non-Guarantor Subsidiaries |
| Eliminations |
| Consolidated | ||||||||||
Current Assets |
| $ | 519,783 | |
| $ | 343,266 | |
| $ | 244,473 | |
| $ | (138,858 | ) |
| $ | 968,664 | |
Investment in Subsidiary |
| 617,553 | |
| - | |
| - | |
| (617,553 | ) |
| - | | |||||
Noncurrent Assets |
| 455,876 | |
| 229,054 | |
| 50,692 | |
| (38,068 | ) |
| 697,554 | | |||||
|
| $ | 1,593,212 | |
| $ | 572,320 | |
| $ | 295,165 | |
| $ | (794,479 | ) |
| $ | 1,666,218 | |
|
|
|
|
|
|
|
|
|
|
| ||||||||||
Current Liabilities |
| $ | 292,908 | |
| $ | 88,888 | |
| $ | 95,044 | |
| $ | (132,457 | ) |
| $ | 344,383 | |
Other Long-Term Obligations |
| 562,361 | |
| 20,988 | |
| 45,012 | |
| (44,469 | ) |
| 583,892 | | |||||
Shareholders' Equity |
| 737,943 | |
| 462,444 | |
| 155,109 | |
| (617,553 | ) |
| 737,943 | | |||||
|
| $ | 1,593,212 | |
| $ | 572,320 | |
| $ | 295,165 | |
| $ | (794,479 | ) |
| $ | 1,666,218 | |
BALANCE SHEET: As of July 3, 2011 (As Revised and Summarized) |
| Briggs & Stratton Corporation |
| Guarantor Subsidiaries |
| Non-Guarantor Subsidiaries |
| Eliminations |
| Consolidated | ||||||||||
Current Assets |
| $ | 501,939 | |
| $ | 359,287 | |
| $ | 228,265 | |
| $ | (110,752 | ) |
| $ | 978,739 | |
Investment in Subsidiary |
| 603,498 | |
| - | |
| - | |
| (603,498 | ) |
| - | | |||||
Noncurrent Assets |
| 506,250 | |
| 268,490 | |
| 40,960 | |
| (128,221 | ) |
| 687,479 | | |||||
|
| $ | 1,611,687 | |
| $ | 627,777 | |
| $ | 269,225 | |
| $ | (842,471 | ) |
| $ | 1,666,218 | |
|
|
|
|
|
|
|
|
|
|
| ||||||||||
Current Liabilities |
| $ | 271,208 | |
| $ | 88,888 | |
| $ | 95,044 | |
| $ | (110,757 | ) |
| $ | 344,383 | |
Other Long-Term Obligations |
| 602,536 | |
| 64,219 | |
| 45,353 | |
| (128,216 | ) |
| 583,892 | | |||||
Shareholders' Equity |
| 737,943 | |
| 474,670 | |
| 128,828 | |
| (603,498 | ) |
| 737,943 | | |||||
|
| $ | 1,611,687 | |
| $ | 627,777 | |
| $ | 269,225 | |
| $ | (842,471 | ) |
| $ | 1,666,218 | |
STATEMENT OF CASH FLOWS: For the Fiscal Year Ended July 3, 2011 (As Previously Reported) |
| Briggs & Stratton Corporation |
| Guarantor Subsidiaries |
| Non-Guarantor Subsidiaries |
| Eliminations |
| Consolidated | ||||||||||
Net Cash Provided by (Used in) Operating Activities |
| $ | 148,428 | |
| $ | (13,433 | ) |
| $ | 48,102 | |
| $ | (26,166 | ) |
| $ | 156,931 | |
Net Cash Provided by (Used in) Investing Activities |
| $ | (43,646 | ) |
| $ | (9,335 | ) |
| $ | 9,023 | |
| $ | (15,813 | ) |
| $ | (59,771 | ) |
Net Cash Provided by (Used in) Financing Activities |
| $ | (46,990 | ) |
| $ | 20,465 | |
| $ | (19,948 | ) |
| $ | 41,979 | |
| $ | (4,494 | ) |
STATEMENT OF CASH FLOWS: For the Fiscal Year Ended July 3, 2011 (As Revised and Summarized) |
| Briggs & Stratton Corporation |
| Guarantor Subsidiaries |
| Non-Guarantor Subsidiaries |
| Eliminations |
| Consolidated | ||||||||||
Net Cash Provided by (Used in) Operating Activities |
| $ | 126,397 | |
| $ | (13,433 | ) |
| $ | 43,967 | |
| $ | - | |
| $ | 156,931 | |
Net Cash Provided by (Used in) Investing Activities |
| $ | (43,646 | ) |
| $ | (9,335 | ) |
| $ | (6,790 | ) |
| $ | - | |
| $ | (59,771 | ) |
Net Cash Provided by (Used in) Financing Activities |
| $ | (24,959 | ) |
| $ | 20,465 | |
| $ | - | |
| $ | - | |
| $ | (4,494 | ) |
STATEMENT OF CASH FLOWS: For the Fiscal Year Ended June 27, 2010 (As Previously Reported) |
| Briggs & Stratton Corporation |
| Guarantor Subsidiaries |
| Non-Guarantor Subsidiaries |
| Eliminations |
| Consolidated | ||||||||||
Net Cash Provided by (Used in) Operating Activities |
| $ | 179,767 | |
| $ | 34,619 | |
| $ | 25,740 | |
| $ | 3,615 | |
| $ | 243,741 | |
Net Cash Provided by (Used in) Investing Activities |
| $ | (2,522 | ) |
| $ | (11,454 | ) |
| $ | (791 | ) |
| $ | (29,544 | ) |
| $ | (44,311 | ) |
Net Cash Provided by (Used in) Financing Activities |
| $ | (77,908 | ) |
| $ | (20,790 | ) |
| $ | (26,728 | ) |
| $ | 25,929 | |
| $ | (99,497 | ) |
STATEMENT OF CASH FLOWS: For the Fiscal Year Ended June 27, 2010 (As Revised and Summarized) |
| Briggs & Stratton Corporation |
| Guarantor Subsidiaries |
| Non-Guarantor Subsidiaries |
| Eliminations |
| Consolidated | ||||||||||
Net Cash Provided by (Used in) Operating Activities |
| $ | 180,566 | |
| $ | 34,619 | |
| $ | 28,556 | |
| $ | - | |
| $ | 243,741 | |
Net Cash Provided by (Used in) Investing Activities |
| $ | (2,522 | ) |
| $ | (11,454 | ) |
| $ | (30,335 | ) |
| $ | - | |
| $ | (44,311 | ) |
Net Cash Provided by (Used in) Financing Activities |
| $ | (78,707 | ) |
| $ | (20,790 | ) |
| $ | - | |
| $ | - | |
| $ | (99,497 | ) |
As other prior period financial information is presented, the Company will similarly revise the condensed supplemental financial information in its future filings. These revisions, which the Company determined are not material individually or in the aggregate, had no impact on the Company's consolidated financial statements.
39
Report of Independent Registered Public Accounting Firm
To the Board of Directors and Shareholders of Briggs & Stratton Corporation:
In our opinion, the consolidated financial statements listed in the index appearing under Item 15(a)(1) present fairly, in all material respects, the financial position of Briggs & Stratton Corporation and its subsidiaries at July 1, 2012 and July 3, 2011 and the results of their operations and their cash flows for each of the three fiscal years in the period ended July 1, 2012 in conformity with accounting principles generally accepted in the United States of America. In addition, in our opinion, the financial statement schedules listed in the index appearing under Item 15 (a)(2) presents fairly, in all material respects, the information set forth therein when read in conjunction with the related consolidated financial statements. Also in our opinion, the Company maintained, in all material respects, effective internal control over financial reporting as of July 1, 2012, based on criteria established in Internal Control – Integrated Framework issued by the Committee of Sponsoring Organizations of the Treadway Commission (COSO). The Company's management is responsible for these financial statements and financial statement schedules, for maintaining effective internal control over financial reporting and for its assessment of the effectiveness of internal control over financial reporting, included in Management's Report on Internal Control over Financial Reporting appearing under Item 9 (a). Our responsibility is to express opinions on these financial statements, on the financial statement schedules, and on the Company's internal control over financial reporting based on our integrated audits. We conducted our audits in accordance with the standards of the Public Company Accounting Oversight Board (United States). Those standards require that we plan and perform the audits to obtain reasonable assurance about whether the financial statements are free of material misstatement and whether effective internal control over financial reporting was maintained in all material respects. Our audits of the financial statements included examining, on a test basis, evidence supporting the amounts and disclosures in the financial statements, assessing the accounting principles used and significant estimates made by management, and evaluating the overall financial statement presentation. Our audit of internal control over financial reporting included obtaining an understanding of internal control over financial reporting, assessing the risk that a material weakness exists, and testing and evaluating the design and operating effectiveness of internal control based on the assessed risk. Our audits also included performing such other procedures as we considered necessary in the circumstances. We believe that our audits provide a reasonable basis for our opinions.
A company's internal control over financial reporting is a process designed to provide reasonable assurance regarding the reliability of financial reporting and the preparation of financial statements for external purposes in accordance with generally accepted accounting principles. A company's internal control over financial reporting includes those policies and procedures that (i) pertain to the maintenance of records that, in reasonable detail, accurately and fairly reflect the transactions and dispositions of the assets of the company; (ii) provide reasonable assurance that transactions are recorded as necessary to permit preparation of financial statements in accordance with generally accepted accounting principles, and that receipts and expenditures of the company are being made only in accordance with authorizations of management and directors of the company; and (iii) provide reasonable assurance regarding prevention or timely detection of unauthorized acquisition, use, or disposition of the company's assets that could have a material effect on the financial statements.
Because of its inherent limitations, internal control over financial reporting may not prevent or detect misstatements. Also, projections of any evaluation of effectiveness to future periods are subject to the risk that controls may become inadequate because of changes in conditions, or that the degree of compliance with the policies or procedures may deteriorate.
/s/ PricewaterhouseCoopers LLP
Milwaukee, Wisconsin
August 28, 2012
40
Quarterly Financial Data, Dividend and Market Information (Unaudited)
|
| In Thousands | ||||||||||
Quarter Ended |
| Net Sales |
| Gross Profit |
| Net Income (Loss) | ||||||
Fiscal 2012 |
|
|
|
|
|
| ||||||
September |
| $ | 397,297 | |
| $ | 66,054 | |
| $ | (5,220 | ) |
December |
| 447,947 | |
| 73,880 | |
| 2,697 | | |||
March (1) |
| 720,097 | |
| 127,112 | |
| 39,937 | | |||
June (2) |
| 501,192 | |
| 69,679 | |
| (8,408 | ) | |||
Total |
| $ | 2,066,533 | |
| $ | 336,725 | |
| $ | 29,006 | |
Fiscal 2011 |
|
|
|
|
|
| ||||||
September |
| $ | 334,116 | |
| $ | 61,993 | |
| $ | (8,114 | ) |
December (3) |
| 450,324 | |
| 78,321 | |
| (1,252 | ) | |||
March |
| 720,333 | |
| 149,549 | |
| 51,521 | | |||
June (4) |
| 605,225 | |
| 108,453 | |
| (17,800 | ) | |||
Total |
| $ | 2,109,998 | |
| $ | 398,316 | |
| $ | 24,355 | |
|
| Per Share of Common Stock | ||||||||||||||
|
|
|
|
|
| Market Price Range on New York Stock Exchange | ||||||||||
Quarter Ended |
| Net Income (Loss) (5) |
| Dividends Declared |
| High |
| Low | ||||||||
Fiscal 2012 |
|
|
|
|
|
|
|
| ||||||||
September |
| $ | (0.10 | ) |
| $ | 0.11 | |
| $ | 20.81 | |
| $ | 12.42 | |
December |
| 0.05 | |
| 0.11 | |
| 17.17 | |
| 12.36 | | ||||
March (1) |
| 0.80 | |
| 0.11 | |
| 18.28 | |
| 15.12 | | ||||
June (2) |
| (0.18 | ) |
| 0.11 | |
| 18.60 | |
| 16.32 | | ||||
Total |
| $ | 0.57 | |
| $ | 0.44 | |
|
|
|
| ||||
Fiscal 2011 |
|
|
|
|
|
|
|
| ||||||||
September |
| $ | (0.16 | ) |
| $ | 0.11 | |
| $ | 19.85 | |
| $ | 16.50 | |
December (3) |
| (0.03 | ) |
| 0.11 | |
| 20.42 | |
| 17.10 | | ||||
March |
| 1.02 | |
| 0.11 | |
| 21.85 | |
| 19.10 | | ||||
June (4) |
| (0.36 | ) |
| 0.11 | |
| 24.18 | |
| 18.69 | | ||||
Total |
| $ | 0.47 | |
| $ | 0.44 | |
|
|
|
| ||||
The number of record holders of Briggs & Stratton Corporation Common Stock on July 1, 2012 was 3,184.
(1) As disclosed in Note 16, the third quarter of fiscal 2012 included restructuring charges of $19.8 million ($9.6 million after tax or $0.19 per diluted share).
(2) As disclosed in Note 16, the fourth quarter of fiscal 2012 included restructuring charges of $30.1 million ($19.3 million after tax or $0.40 per diluted share).
(3) As disclosed in Notes 16 and 9, the second quarter of fiscal 2011 included restructuring charges of $3.5 million ($2.2 million after tax or $0.04 per diluted share) and debt refinancing charges of $3.9 million ($2.4 million after tax or $0.05 per diluted share).
(4) As disclosed in Note 5, the fourth quarter of fiscal 2011 included pre-tax non-cash goodwill impairment charges of $49.5 million ($34.3 million after tax or $0.68 per diluted share).
(5) Net Income (Loss) per share of Common Stock represents Diluted Earnings (Loss) per Share. Refer to Note 2 of the Notes to Consolidated Financial Statements, for information about Diluted Earnings per Share. Amounts may not total because of differing numbers of shares outstanding at the end of each quarter.
41
ITEM 9. | CHANGES IN AND DISAGREEMENTS WITH ACCOUNTANTS ON ACCOUNTING AND FINANCIAL DISCLOSURE |
None.
ITEM 9A. | CONTROLS AND PROCEDURES |
Disclosure Controls and Procedures
The Company's management, with the participation of the Company's Chief Executive Officer and Chief Financial Officer, have evaluated the effectiveness of the Company's disclosure controls and procedures (as such term is defined in Rules 13a-15(e) and 15d-15(e) under the Securities Exchange Act of 1934, as amended ("the Exchange Act")) as of the end of the period covered by this report. Based on such evaluation, the Company's Chief Executive Officer and Chief Financial Officer have concluded that, as of the end of such period, the Company's disclosure controls and procedures are effective in recording, processing, summarizing, and reporting, on a timely basis, information required to be disclosed by the Company in the reports that it files or submits under the Exchange Act.
Management's Report on Internal Control Over Financial Reporting
The Company's management is responsible for establishing and maintaining adequate internal control over financial reporting, as such term is defined in Exchange Act Rule 13a-15(f). The Company's management, with the participation of the Company's Chief Executive Officer and Chief Financial Officer, has evaluated the effectiveness of the Company's internal control over financial reporting based on the framework in Internal Control-Integrated Framework issued by the Committee of Sponsoring Organizations of the Treadway Commission. Based on this evaluation, the Company's management has concluded that, as of the end of the period covered by this report, the Company's internal controls over financial reporting were effective.
Because of its inherent limitations, internal control over financial reporting may not prevent or detect misstatements. Also, projections of any evaluation of the effectiveness to future periods are subject to the risk that the controls may become inadequate because of changes in conditions, or that the degree of compliance with the policies or procedures may deteriorate.
PricewaterhouseCoopers LLP, an independent registered public accounting firm, has audited the Company's consolidated financial statements and the effectiveness of internal controls over financial reporting as of July 1, 2012 , as stated in their report which is included herein.
Changes in Internal Control Over Financial Reporting
There has not been any change in the Company's internal control over financial reporting during the fourth fiscal quarter that has materially affected, or is reasonably likely to materially affect, the Company's internal control over financial reporting.
ITEM 9B. | OTHER INFORMATION |
None.
PART III
ITEM 10. | DIRECTORS, EXECUTIVE OFFICERS AND CORPORATE GOVERNANCE |
(a) | Executive Officers. Reference is made to "Executive Officers of Registrant" in Part I after Item 4. |
(b) | Directors. The information required by this Item is in Briggs & Stratton's definitive Proxy Statement, prepared for the 2012 Annual Meeting of Shareholders, under the caption "Item 1: Election of Directors" and "General Information About Incumbent Directors", and is incorporated herein by reference. |
42
(c) | Section 16 Compliance. The information required by this Item is in Briggs & Stratton's definitive Proxy Statement, prepared for the 2012 Annual Meeting of Shareholders, under the caption "Section 16(a) Beneficial Ownership Reporting Compliance", and is incorporated herein by reference. |
(d) | Audit Committee Financial Expert. The information required by this Item is in Briggs & Stratton's definitive Proxy Statement, prepared for the 2012 Annual Meeting of Shareholders, under the caption "Other Corporate Governance Matters – Board Committees – Audit Committee", and is incorporated herein by reference. |
(e) | Identification of Audit Committee. The information required by this Item is in Briggs & Stratton's definitive Proxy Statement, prepared for the 2012 Annual Meeting of Shareholders, under the caption "Other Corporate Governance Matters – Board Committees – Audit Committee", and is incorporated herein by reference. |
(f) | Code of Ethics. Briggs & Stratton has adopted a written code of ethics, referred to as the Briggs & Stratton Business Integrity Manual applicable to all directors, officers and employees, which includes provisions related to accounting and financial matters applicable to the Principal Executive Officer, Principal Financial Officer, Principal Accounting Officer and Controller. The Briggs & Stratton Business Integrity Manual is available on the Company's corporate website at www.briggsandstratton.com. If the Company makes any substantive amendment to, or grants any waiver of, the code of ethics for any director or officer, Briggs & Stratton will disclose the nature of such amendment or waiver on its corporate website or in a Current Report on Form 8-K. |
ITEM 11. | EXECUTIVE COMPENSATION |
The information in Briggs & Stratton's definitive Proxy Statement, prepared for the 2012 Annual Meeting of Shareholders, concerning this item, under the captions "Compensation Committee Report", "Compensation Discussion and Analysis", "Compensation Tables", "Agreements with Executives", "Change in Control Payments", and "Director Compensation" is incorporated herein by reference.
ITEM 12. | SECURITY OWNERSHIP OF CERTAIN BENEFICIAL OWNERS AND MANAGEMENT AND RELATED STOCKHOLDER MATTERS |
The information in Briggs & Stratton's definitive Proxy Statement, prepared for the 2012 Annual Meeting of Shareholders, concerning this item, under the captions "Security Ownership of Certain Beneficial Owners", "Security Ownership of Directors and Executive Officers" and "Equity Compensation Plan Information" is incorporated herein by reference.
ITEM 13. | CERTAIN RELATIONSHIPS AND RELATED TRANSACTIONS, AND DIRECTOR INDEPENDENCE |
The information in Briggs & Stratton's definitive Proxy Statement, prepared for the 2012 Annual Meeting of Shareholders, concerning this item, under the captions "Other Corporate Governance Matters – Director Independence", "Other Corporate Governance Matters – Board Oversight of Risk" and "Other Corporate Governance Matters – Audit Committee" is incorporated herein by reference.
ITEM 14. | PRINCIPAL ACCOUNTANT FEES AND SERVICES |
The information required by this Item is in Briggs & Stratton's definitive Proxy Statement, prepared for the 2012 Annual Meeting of Shareholders, under the captions "Other Matters – Independent Auditors' Fees" and "Other Corporate Governance Matters – Board Committees – Audit Committee", and is incorporated herein by reference.
43
PART IV
ITEM 15. | EXHIBITS AND FINANCIAL STATEMENT SCHEDULES |
(a) The following documents are filed as part of this report:
1. | Financial Statements |
The following financial statements are included under the caption "Financial Statements and Supplementary Data" in Part II, Item 8 and are incorporated herein by reference:
Consolidated Balance Sheets, July 1, 2012 and July 3, 2011
For the Fiscal Years Ended July 1, 2012 , July 3, 2011 and June 27, 2010 :
Consolidated Statements of Earnings
Consolidated Statements of Shareholders' Investment
Consolidated Statements of Cash Flows
Notes to Consolidated Financial Statements
Report of Independent Registered Public Accounting Firm
2. | Financial Statement Schedules |
Schedule II – Valuation and Qualifying Accounts
All other financial statement schedules provided for in the applicable accounting regulations of the Securities and Exchange Commission are not required under the related instructions.
3. | Exhibits |
Refer to the Exhibit Index incorporated herein by reference. Each management contract or compensatory plan or arrangement required to be filed as an exhibit to this report is identified in the Exhibit Index by an asterisk following the Exhibit Number.
BRIGGS & STRATTON CORPORATION AND SUBSIDIARIES
SCHEDULE II – VALUATION AND QUALIFYING ACCOUNTS
FOR FISCAL YEARS ENDED JULY 1, 2012 , JULY 3, 2011 AND JUNE 27, 2010
Reserve for Doubtful Accounts Receivable |
| Balance Beginning of Year |
| Additions Charged to Earnings |
| Charges to Reserve, Net |
| Balance End of Year |
2012 |
| $4,971,000 |
| 3,608,000 |
| (2,799,000) |
| $5,780,000 |
2011 |
| $11,317,000 |
| 1,916,000 |
| (8,262,000) |
| $4,971,000 |
2010 |
| $7,360,000 |
| 7,399,000 |
| (3,442,000) |
| $11,317,000 |
Deferred Tax Assets Valuation Allowance |
| Balance Beginning of Year |
| Allowance Established for Net Operating and Other Loss Carryforwards |
| Allowance Reversed for Loss Carryforwards Utilized and Other Adjustments |
| Balance End of Year |
2012 |
| $7,259,000 |
| 5,430,000 |
| (664,000) |
| $12,025,000 |
2011 |
| $9,130,000 |
| 774,000 |
| (2,645,000) |
| $7,259,000 |
2010 |
| $6,712,000 |
| 2,418,000 |
| - |
| $9,130,000 |
44
SIGNATURES
Pursuant to the requirements of Section 13 or 15(d) of the Securities Exchange Act of 1934, the registrant has duly caused this report to be signed on its behalf by the undersigned, thereunto duly authorized.
|
|
|
|
|
|
| BRIGGS & STRATTON CORPORATION | ||
|
|
| ||
|
| By |
| /s/ David J. Rodgers |
|
|
|
| David J. Rodgers |
August 28, 2012 |
|
|
| Senior Vice President and |
|
|
|
| Chief Financial Officer |
Pursuant to the requirements of the Securities Exchange Act of 1934, this report has been signed below by the following persons on behalf of the registrant and in the capacities and on the dates indicated.*
|
|
|
|
|
/s/ Todd J. Teske |
|
|
| /s/ Patricia L. Kampling |
Todd J. Teske |
|
|
| Patricia L. Kampling |
Chairman, President and Chief Executive |
|
|
| Director |
Officer and Director (Principal Executive Officer) |
|
|
|
|
|
|
| ||
/s/ David J. Rodgers |
|
|
| /s/ Keith R. McLoughlin |
David J. Rodgers |
|
|
| Keith R. McLoughlin |
Senior Vice President and Chief Financial |
|
|
| Director |
Officer (Principal Financial Officer and |
|
|
|
|
Principal Accounting Officer) |
|
|
|
|
|
|
| ||
/s/ William F. Achtmeyer |
|
|
| /s/ Robert J. O'Toole |
William F. Achtmeyer |
|
|
| Robert J. O'Toole |
Director |
|
|
| Director |
|
|
| ||
/s/ Michael E. Batten |
|
|
| /s/ Charles I. Story |
Michael E. Batten |
|
|
| Charles I. Story |
Director |
|
|
| Director |
|
|
| ||
/s/ James E. Humphrey |
|
|
| /s/ Brian C. Walker |
James E. Humphrey |
|
|
| Brian C. Walker |
Director |
|
|
| Director |
|
|
| ||
|
|
|
| *Each signature affixed as of |
|
|
|
| August 28, 2012 |
45
BRIGGS & STRATTON CORPORATION
(Commission File No. 1-1370)
EXHIBIT INDEX
2012
ANNUAL REPORT ON FORM 10-K
No. |
| Document Description |
3.1 |
| Articles of Incorporation. |
|
| (Filed as Exhibit 3.2 to the Company's Report on Form 10-Q for the quarter ended October 2, 1994 and incorporated by reference herein.) |
|
| |
3.1 (a) |
| Amendment to Articles of Incorporation. |
|
| (Filed as Exhibit 3.1 to the Company's Report on Form 10-Q for the quarter ended September 26, 2004 and incorporated by reference herein.) |
|
| |
3.2 |
| Bylaws, as amended and restated as adopted April 15, 2009. |
|
| (Filed as Exhibit 3.2 to the Company's Report on Form 10-Q for the quarter ended March 29, 2009 and incorporated by reference herein.) |
|
| |
3.2(a) |
| Amendments to Bylaws as adopted August 8, 2012. |
|
| (Filed as Exhibit 3.1 to the Company's Report on Form 8-K dated August 8, 2012 and incorporated by reference herein.) |
|
|
|
4.0 |
| Rights Agreement dated as of August 7, 1996, as amended through August 8, 2012, between Briggs & Stratton Corporation and Wells Fargo Bank, N.A., as successor rights agent, which includes the form of Right Certificate as Exhibit A and the Summary of Rights to Purchase Common Shares as Exhibit B. |
|
| (Filed as Exhibit 4.1 to the Company's Registration Statement on Form 8-A/A dated as of August 13, 2012 and incorporated by reference herein.) |
|
| |
4.1 |
| Indenture, dated December 10, 2010, among Briggs & Stratton Corporation, Briggs & Stratton Power Products Group, LLC and Wells Fargo Bank, National Association, as Trustee. |
|
| (Filed as Exhibit 4.1 to the Company's Report on Form 10-Q for the quarter ended December 26, 2010 and incorporated by reference herein.) |
|
| |
4.2 |
| First Supplemental Indenture, dated December 20, 2010, among Briggs & Stratton Corporation, Briggs & Stratton Power Products Group, LLC and Wells Fargo Bank, National Association, as Trustee. |
|
| (Filed as Exhibit 4.2 to the Company's Report on Form 10-Q for the quarter ended December 26, 2010 and incorporated by reference herein.) |
|
| |
10.1* |
| Amended and Restated Supplemental Executive Retirement Plan. |
|
| (Filed as Exhibit 10.2 to the Company's Report on Form 10-Q for the quarter ended April 1, 2012 and incorporated by reference herein.) |
|
| |
10.2* |
| Amended and Restated Economic Value Added Incentive Compensation Plan. |
|
| (Filed as Exhibit 10.2 to the Company's Annual Report on Form 10-K for fiscal year ended July 3, 2011 and incorporated by reference herein.) |
|
| |
10.3* |
| Amended and Restated Form of Change of Control Employment Agreement. |
|
| (Filed as Exhibit 10.3 to the Company's Report on Form 10-K for fiscal year ended June 28, 2009 and incorporated herein by reference.) |
|
|
|
10.3 (a)* |
| Amended and Restated Form of Change of Control Employment Agreement for new officers of the Company. |
|
| (Filed as Exhibit 10.1 to the Company's Report on Form 8-K dated October 14, 2009 and incorporated by reference herein.) |
|
| |
10.4* |
| Trust Agreement with an independent trustee to provide payments under various compensation agreements with Company employees upon the occurrence of a change in control. |
|
| (Filed as Exhibit 10.5 (a) to the Company's Annual Report on Form 10-K for fiscal year ended July 2, 1995 and incorporated by reference herein.) |
|
|
|
46
No. |
| Document Description |
10.4 (a)* |
| Amendment to Trust Agreement with an independent trustee to provide payments under various compensation agreements with Company employees. |
|
| (Filed as Exhibit 10.5 (b) to the Company's Annual Report on Form 10-K for fiscal year ended July 2, 1995 and incorporated by reference herein.) |
|
| |
10.4 (b)* |
| Amendment to Trust Agreement with an independent trustee to provide payments under various compensation agreements with Company employees. |
|
| (Filed as Exhibit 10.4(b) to the Company's Annual Report on Form 10-K for fiscal year ended July 3, 2011 and incorporated by reference herein.) |
|
| |
10.5* |
| 1999 Amended and Restated Stock Incentive Plan. |
|
| (Filed as Exhibit A to the Company's 1999 Annual Meeting Proxy Statement and incorporated by reference herein.) |
|
| |
10.5 (a)* |
| Amendment to Stock Incentive Plan. |
|
| (Filed as Exhibit 10.2 to the Company's Report on Form 10-Q for the quarter ended March 30, 2003 and incorporated by reference herein.) |
|
| |
10.5 (b)* |
| Amendment to Stock Incentive Plan. |
|
| (Filed as Exhibit 10.5 (c) to the Company's Report on Form 10-K for fiscal year ended June 27, 2004 and incorporated by reference herein.) |
|
| |
10.5 (c)* |
| Amended and Restated Briggs & Stratton Corporation Incentive Compensation Plan. |
|
| (Filed as Exhibit 10.5 (c) to the Company's Report on Form 10-K for fiscal year ended June 27, 2010 and incorporated by reference herein.) |
|
| |
10.6* |
| Amended and Restated Briggs & Stratton Premium Option and Stock Award Program, effective beginning with plan year 2010. |
|
| (Filed as Exhibit 10.6 to the Company's Report on Form 10-K for fiscal year ended June 27, 2010 and incorporated by reference herein.) |
|
| |
10.6 (a)* |
| Amended Form of Stock Option Agreement under the Premium Option and Stock Award Program. |
|
| (Filed as Exhibit 10.6 (d) to the Company's Report on Form 10-K for year ended June 28, 2009 and incorporated herein by reference.) |
|
| |
10.6 (b)* |
| Amended Form of Restricted Stock Award Agreement under the Premium Option and Stock Award Program. |
|
| (Filed as Exhibit 10.6 (b) to the Company's Report on Form 10-K for fiscal year ended June 27, 2010 and incorporated by reference herein.) |
|
| |
10.6 (c)* |
| Amended Form of Deferred Stock Award Agreement under the Premium Option and Stock Award Program. |
|
| (Filed as Exhibit 10.6 (c) to the Company's Report on Form 10-K for fiscal year ended June 27, 2010 and incorporated by reference herein.) |
|
| |
10.7* |
| Amended and Restated Form of Officer Employment Agreement. |
|
| (Filed as Exhibit 10.0 to the Company's Report on Form 8-K dated December 8, 2008 and incorporated by reference herein.) |
|
|
|
10.8* |
| Amended and Restated Supplemental Employee Retirement Plan. |
|
| (Filed as Exhibit 10.1 to the Company's Report on Form 10-Q for the quarter ended April 1, 2012 and incorporated by reference herein.) |
|
| |
10.9* |
| Briggs & Stratton Corporation Incentive Compensation Plan Performance Share Award Agreement. |
|
| (Filed as Exhibit 10.9 to the Company's Report on Form 10-K for fiscal year ended June 27, 2010 and incorporated by reference herein.) |
|
| |
10.11* |
| Amended and Restated Deferred Compensation Plan for Directors. |
|
| (Filed as Exhibit 10.11 to the Company's Annual Report on Form 10-K for fiscal year ended July 3, 2011 and incorporated by reference herein.) |
|
| |
47
No. |
| Document Description |
10.12* |
| Amended and Restated Director's Premium Option and Stock Grant Program. |
|
| (Filed as Exhibit 10.12 to the Company's Report on Form 10-K for fiscal year ended July 3, 2005 and incorporated by reference herein.) |
|
| |
10.12 (a)* |
| Form of Director's Stock Option Agreement under the Director's Premium Option and Stock Grant Program. |
|
| (Filed as Exhibit 10.12 (a) to the Company's Report on Form 10-Q for quarter ended April 2, 2006 and incorporated by reference herein.) |
|
| |
10.13* |
| Summary of Director Compensation. |
|
| (Filed as Exhibit 10.13 to the Company's Annual Report on Form 10-K for fiscal year ended July 3, 2011 and incorporated by reference herein.) |
|
| |
10.14* |
| Executive Life Insurance Plan. |
|
| (Filed as Exhibit 10.17 to the Company's Annual Report on Form 10-K for fiscal year ended June 27, 1999 and incorporated by reference herein.) |
|
| |
10.14 (a)* |
| Amendment to Executive Life Insurance Program. |
|
| (Filed as Exhibit 10.14 (a) to the Company's Report on Form 10-K for fiscal year ended June 29, 2003 and incorporated by reference herein.) |
|
| |
10.14 (b)* |
| Amendment to Executive Life Insurance Plan. |
|
| (Filed as Exhibit 10.14 (b) to the Company's Report on Form 10-K for fiscal year ended June 27, 2004 and incorporated by reference herein.) |
|
| |
10.15* |
| Amended & Restated Key Employee Savings and Investment Plan. |
|
| (Filed as Exhibit 10.15 to the Company's Report on Form 10-Q for the quarter ended March 27, 2011 and incorporated by reference herein.) |
|
| |
10.16* |
| Consultant Reimbursement Arrangement. |
|
| (Filed as Exhibit 10.19 to the Company's Annual Report on Form 10-K for fiscal year ended June 27, 1999 and incorporated by reference herein.) |
|
| |
10.17* |
| Briggs & Stratton Product Program. |
|
| (Filed as Exhibit 10.18 to the Company's Annual Report on Form 10-K for fiscal year ended June 30, 2002 and incorporated by reference herein.) |
|
| |
10.18* |
| Amendment to the Briggs & Stratton Product Program. |
|
| (Filed as Exhibit 10.17 (a) to the Company's Report on Form 10-K for fiscal year ended June 27, 2010 and incorporated by reference herein.) |
|
| |
10.19* |
| Early Retirement Agreement between Briggs & Stratton Corporation and John S. Shiely. |
|
| (Filed as Exhibit 10.1 to the Company's Report on Form 8-K dated August 21, 2009 and incorporated by reference herein.) |
|
| |
10.20 |
| Asset Purchase Agreement, dated January 25, 2005, by and among Briggs & Stratton Power Products Group, LLC, Briggs & Stratton Canada Inc., Murray, Inc. and Murray Canada Co. |
|
| (Filed as Exhibit 10.1 to the Company's Report on Form 8-K dated January 25, 2005 and incorporated by reference herein.) |
|
|
|
10.21 |
| Transition Supply Agreement, dated February 11, 2005, between Briggs & Stratton Power Products Group, LLC and Murray, Inc. |
|
| (Form of Transition Supply Agreement filed as Exhibit 10.2 to the Company's Report on Form 8-K dated January 25, 2005 and incorporated by reference herein.) |
|
|
|
48
No. |
| Document Description |
10.22 |
| Multicurrency Credit Agreement, dated October 13, 2011, among Briggs & Stratton Corporation, Briggs & Stratton AG, various financial institutions, and BMO Harris Bank, N.A., Bank of America, N.A., Wells Fargo Bank, N.A., and PNC Bank, National Association, as co-documentation agents, and U.S. Bank National Association as syndication agent, and JPMorgan Chase Bank, N.A., as administrative agent, an issuing lender and swing line lender, and J.P. Morgan Securities LLC and U.S. Bank National Assocation, as Joint Lead Arrangers and Joint Book Managers. |
|
| (Filed as Exhibit 4.1 to the Company's Report on Form 8-K dated October 13, 2011 and incorporated by reference herein.) |
|
| |
10.23 |
| Class B Preferred Share Redemption Agreement. |
|
| (Filed as Exhibit 10.4 to the Company's Report on Form 10-Q for the quarter ended December 30, 2007 and incorporated by reference herein.) |
|
| |
10.24 |
| Victa Agreement. |
|
| (Filed as Exhibit 10.25 to the Company's Report on Form 10-K for fiscal year ended June 29, 2008 and incorporated by reference herein.) |
|
| |
10.25 |
| Stipulation of Settlement, dated February 24, 2010. |
|
| (Filed as Exhibit 10.1 to the Company's Current Report on Form 8-K dated February 24, 2010 and incorporated herein by reference.) |
|
| |
12 |
| Computation of Ratio of Earnings to Fixed Charges. |
|
| (Filed herewith.) |
|
| |
21 |
| Subsidiaries of the Registrant. |
|
| (Filed herewith.) |
|
| |
23.1 |
| Consent of PricewaterhouseCoopers LLP, an Independent Registered Public Accounting Firm. |
|
| (Filed herewith.) |
|
| |
31.1 |
| Certification of Principal Executive Officer pursuant to Section 302 of the Sarbanes-Oxley Act of 2002. |
|
| (Filed herewith.) |
|
| |
31.2 |
| Certification of Principal Financial Officer pursuant to Section 302 of the Sarbanes-Oxley Act of 2002. |
|
| (Filed herewith.) |
|
| |
32.1 |
| Certification of the Chief Executive Officer pursuant to Section 906 of the Sarbanes-Oxley Act of 2002. |
|
| (Furnished herewith.) |
|
| |
32.2 |
| Certification of the Chief Financial Officer pursuant to Section 906 of the Sarbanes-Oxley Act of 2002. |
|
| (Furnished herewith.) |
|
|
|
101 |
| The following financial information from the Company's Annual Report on Form 10-K for the fiscal year ended July 1, 2012, formatted in extensible Business Reporting Language (XBRL): (i) Consolidated Balance Sheets at July 1, 2012 and July 3, 2011; (ii) Consolidated Statements of Earnings for the Fiscal Years Ended July 1, 2012, July 3, 2011 and June 27, 2010; (iii) Consolidated Statements of Shareholders' Investment for the Fiscal Years Ended July 1, 2012, July 3, 2011 and June 27, 2010; (iv) Consolidated Statements of Cash Flows for the Fiscal Years Ended July 1, 2012, July 3, 2011 and June 27, 2010; (v) Notes to Consolidated Financial Statements; and (vi) Schedule II-Valuation and Qualifying Accounts. (1) |
|
|
|
* | Management contracts and executive compensation plans and arrangements required to be filed as exhibits pursuant to Item 15(a)(3) of Form 10-K. |
|
|
(1) | Furnished herewith. Pursuant to Rule 406T of Regulation S-T, this interactive data file is deemed not filed or part of a registration statement or prospectus for purposes of Sections 11 or 12 of the Securities Act of 1933, is deemed not filed for purposes of Section 18 of the Securities Exchange Act of 1934, and otherwise is not subject to liability under these sections. |
49
Directors
|
|
|
WILLIAM F. ACHTMEYER (2)(5) |
| Chairman, Managing Partner and Chief Executive Officer of The Parthenon Group LLC, a leading strategic advisory and principal investment firm |
|
| |
MICHAEL E. BATTEN (3)(5) |
| Chairman and Chief Executive Officer, Twin Disc, Incorporated, a manufacturer of power transmission equipment |
|
| |
JAMES E. HUMPHREY (2)(5) |
| Chairman and retired Chief Executive Officer of Andersen Corporation, a window and door manufacturer |
|
| |
PATRICIA L. KAMPLING (1)(4) |
| Chairman, President and Chief Operating Officer of Alliant Energy Corporation, a regulated investor-owned public utility holding company |
|
| |
KEITH R. McLOUGHLIN (5) |
| President and Chief Executive Officer of AB Electrolux, a manufacturer of major home appliances |
|
| |
ROBERT J. O'TOOLE (1)(3)(4) |
| Retired Chairman of the Board and Chief Executive Officer, A.O. Smith Corporation, a diversified manufacturer whose major products include water heaters and boilers |
|
| |
CHARLES I. STORY (3)(4) |
| President of ECS Group, Inc., an executive development company |
|
| |
TODD J. TESKE (3) |
| Chairman, President and Chief Executive Officer of Briggs & Stratton Corporation |
|
| |
BRIAN C. WALKER (1)(2)(3) |
| President and Chief Executive Officer, Herman Miller, Inc., a global provider of office furniture and services |
Committees: (1) Audit, (2) Compensation, (3) Executive, (4) Finance, (5) Nominating and Governance.
Elected Officers
TODD J. TESKE |
| Chairman, President & Chief Executive Officer |
|
| |
HAROLD L. REDMAN |
| Senior Vice President & President – Products Group |
|
| |
WILLIAM H. REITMAN |
| Senior Vice President – Business Development & Customer Support |
|
| |
DAVID J. RODGERS |
| Senior Vice President & Chief Financial Officer |
|
| |
THOMAS R. SAVAGE |
| Senior Vice President – Corporate Development |
|
| |
JOSEPH C. WRIGHT |
| Senior Vice President & President – Engines Group |
|
| |
RANDALL R. CARPENTER |
| Vice President – Marketing |
|
| |
DAVID G. DEBAETS |
| Vice President – North America Operations (Engines Group) |
|
| |
ANDREA L. GOLVACH |
| Vice President & Treasurer |
|
|
|
ROBERT F. HEATH |
| Vice President, General Counsel & Secretary |
|
| |
EDWARD J. WAJDA |
| Vice President & General Manager – International |
50
Appointed Vice Presidents & Subsidiary/Group Officers
Corporate |
|
|
|
| |
JAMES H. DENEFFE |
| Senior Vice President – Research & Development |
|
| |
BRENT W. HOAG |
| Vice President – Chief Information Officer |
|
| |
JEFFREY G. MAHLOCH |
| Vice President – Human Resources |
|
| |
DON S. SCHOONENBERG |
| Vice President – Business Planning & Sales Administration |
|
| |
International |
|
|
|
| |
PHILIP J. CAPPITELLI |
| Vice President & General Manager – International Business Development |
|
| |
ROGER A. JANN |
| Managing Director – Europe |
|
| |
MARTIN L. LEVY |
| Managing Director – Latin America |
|
| |
JAMES T. MARCEAU |
| Vice President & General Manager – International Operations |
|
| |
MARK S. PLUM |
| Managing Director – Briggs & Stratton Asia |
|
| |
THOMAS H. RUGG |
| Managing Director – Australia |
|
| |
Engines Group |
|
|
|
|
|
RANDALL E. BALLARD |
| Vice President – North American Engine Sales |
|
| |
EDWARD D. BEDNAR |
| Vice President – Procurement & Logistics |
|
| |
JOHN R. GUY III |
| Vice President & General Manager – Service |
|
| |
PETER HOTZ |
| Vice President – Global Technical Services |
|
| |
MARVIN B. KLOWAK |
| Vice President – Research & Development & Quality |
|
| |
MICHAEL M. MILLER |
| Vice President – Engine Products |
|
| |
PAUL R. PESCI |
| Vice President – Small Commercial Engines |
|
| |
MARTIN C. STRAUBE |
| Vice President – Supply Chain |
|
| |
RICHARD R. ZECKMEISTER |
| Vice President – North American Consumer Marketing & Planning |
Products Group |
|
|
|
| |
TOM BURKARD |
| Vice President – Engineering |
|
| |
JEFF COAD |
| Vice President – Products Marketing |
|
|
|
RICHARD E. FELDER |
| Vice President – Dealer Recruitment |
|
| |
DONALD W. KLENK |
| Vice President – Operations |
|
| |
ERIK P. MEMMO |
| Vice President – North American Dealer Sales |
|
| |
SCOTT L. MURRAY |
| Vice President – Parts & Service |
|
| |
ROBERT PJEVACH |
| Vice President – Consumer Products |
|
| |
WILLIAM L. SHEA |
| Vice President – Sales & Marketing |
|
| |
PHILIP H. WENZEL |
| Vice President – Commercial Products |
|
| |
THOMAS E. WISER |
| Vice President – Standby Power Sales |
51
Shareholder Information
SHAREHOLDER COMMUNICATIONS
Information is provided to shareholders on a regular basis to keep them informed of Briggs & Stratton's activities and financial status. This information is available to any person interested in Briggs & Stratton. Address requests to Shareholder Relations at the Mailing Address listed for the Corporate Offices. A Shareholder Relations Hotline provides a no cost opportunity for shareholders to contact Briggs & Stratton. The Hotline number is 1-800-365-2759.
Briggs & Stratton has an ongoing commitment to provide investors with real time access to financial disclosures, the latest corporate and financial news, and other shareholder information. Visit Briggs & Stratton's home page on the World Wide Web at www.briggsandstratton.com. Information includes: corporate press releases, web casts of conference calls, dividend information, stock prices, filings with the Securities and Exchange Commission, including Form 10-K Reports, Form 10-Q Reports, Proxy Statements, Section 16 filings, code of ethics for principal executive, financial and accounting officers and additional financial information.
INVESTOR, BROKER, SECURITY ANALYST CONTACT
Stockbrokers, financial analysts and others desiring technical/financial information about Briggs & Stratton should contact David J. Rodgers, Senior Vice President and Chief Financial Officer, at 414-259-5333.
DIVIDEND REINVESTMENT PLAN
The Dividend Reinvestment Plan is a convenient way for shareholders of record to increase their investment in Briggs & Stratton. It enables shareholders to apply quarterly dividends and any cash deposits toward the purchase of additional shares of Briggs & Stratton stock. There is no brokerage fee or administrative charge for this service. For a brochure describing the plan, please call the Shareholder Relations Hotline.
PUBLIC INFORMATION
Persons desiring general information about Briggs & Stratton should contact Laura A. Timm, Director of Corporate Communications & Events, at 414-256-5123.
General Information
EXCHANGE LISTING
Briggs & Stratton Corporation common stock is listed on the New York Stock Exchange (symbol BGG) |
| FISCAL 2012 AUDITORS
PricewaterhouseCoopers LLP 100 East Wisconsin Avenue Milwaukee, Wisconsin 53202 |
|
|
|
TRANSFER AGENT, REGISTRAR AND DIVIDEND DISBURSER
Wells Fargo Shareowner Services 161 North Concord Exchange South St. Paul, MN 55075-1139 |
| CORPORATE OFFICES
12301 West Wirth Street Wauwatosa, Wisconsin 53222 Telephone 414-259-5333 |
|
| |
Inquiries concerning transfer requirements, lost certificates, dividend payments, change of address and account status should be directed to Wells Fargo Shareowner Services, at 1-800-468-9716. |
| MAILING ADDRESS
Briggs & Stratton Corporation Post Office Box 702 Milwaukee, Wisconsin 53201 |
52