|
|
|
|
|
UNITED STATES
SECURITIES AND EXCHANGE COMMISSION
Washington, D.C. 20549
FORM 10-Q
(Mark One)
[ ü ] QUARTERLY REPORT PURSUANT TO SECTION 13 OR 15(d) OF THE SECURITIES
EXCHANGE ACT OF 1934
For the Quarterly Period Ended March 31, 2018
or
[ ] TRANSITION REPORT PURSUANT TO SECTION 13 OR 15(d) OF THE SECURITIES
EXCHANGE ACT OF 1934
For the transition period from to
Commission file number:
1-6523
Exact name of registrant as specified in its charter:
Bank of America Corporation
State or other jurisdiction of incorporation or organization:
Delaware
IRS Employer Identification No.:
56-0906609
Address of principal executive offices:
Bank of America Corporate Center
100 N. Tryon Street
Charlotte, North Carolina 28255
Registrant's telephone number, including area code:
(704) 386-5681
Former name, former address and former fiscal year, if changed since last report:
Indicate by check mark whether the registrant (1) has filed all reports required to be filed by Section 13 or 15(d) of the Securities Exchange Act of 1934 during the preceding 12 months (or for such shorter period that the registrant was required to file such reports), and (2) has been subject to such filing requirements for the past 90 days.
Yes ☑ No o
Indicate by check mark whether the registrant has submitted electronically and posted on its corporate Web site, if any, every Interactive Data File required to be submitted and posted pursuant to Rule 405 of Regulation S-T (§ 232.405 of this chapter) during the preceding 12 months (or for such shorter period that the registrant was required to submit and post such files).
Yes ☑ No o
Indicate by check mark whether the registrant is a large accelerated filer, an accelerated filer, a non-accelerated filer, smaller reporting company, or an emerging growth company. See the definitions of "large accelerated filer," "accelerated filer," "smaller reporting company," and "emerging growth company" in Rule 12b-2 of the Exchange Act.
Large accelerated filer ☑ |
| Accelerated filer o |
| Non-accelerated filer o (do not check if a smaller reporting company) |
| Smaller reporting company o |
Emerging growth company o
If an emerging growth company, indicate by check mark if the registrant has elected not to use the extended transition period for complying with any new or revised financial accounting standards provided pursuant to Section 13(a) of the Exchange Act. o
Indicate by check mark whether the registrant is a shell company (as defined in Exchange Act Rule 12b-2).
Yes o No ☑
On April 27, 2018 , there were 10,139,354,414 shares of Bank of America Corporation Common Stock outstanding.
|
|
|
|
|
Bank of America Corporation and Subsidiaries
March 31, 2018
Form 10-Q
INDEX
Part I. Financial Information
Item 1. Financial Statements |
| Page |
Consolidated Statement of Income |
| 50 |
Consolidated Statement of Comprehensive Income |
| 51 |
Consolidated Balance Sheet |
| 52 |
Consolidated Statement of Changes in Shareholders ' Equity |
| 54 |
Consolidated Statement of Cash Flows |
| 55 |
Notes to Consolidated Financial Statements |
| 56 |
Note 1 – Summary of Significant Accounting Principles |
| 56 |
Note 2 – Noninterest Income |
| 58 |
Note 3 – Derivatives |
| 59 |
Note 4 – Securities |
| 66 |
Note 5 – Outstanding Loans and Leases |
| 69 |
Note 6 – Allowance for Credit Losses |
| 79 |
Note 7 – Securitizations and Other Variable Interest Entities |
| 81 |
Note 8 – Goodwill and Intangible Assets |
| 84 |
Note 9 – Federal Funds Sold or Purchased, Securities Financing Agreements, Short-term Borrowings and Restricted Cash |
| 85 |
Note 10 – Commitments and Contingencies |
| 87 |
Note 11 – Shareholders' Equity |
| 90 |
Note 12 – Accumulated Other Comprehensive Income (Loss) |
| 91 |
Note 13 – Earnings Per Common Share |
| 92 |
Note 14 – Fair Value Measurements |
| 92 |
Note 15 – Fair Value Option |
| 100 |
Note 16 – Fair Value of Financial Instruments |
| 101 |
Note 17 – Business Segment Information |
| 101 |
Glossary |
| 104 |
Acronyms |
| 105 |
Item 2. Management's Discussion and Analysis of Financial Condition and Results of Operations |
|
|
Executive Summary |
| 3 |
Recent Events |
| 4 |
Financial Highlights |
| 4 |
Supplemental Financial Data |
| 7 |
Business Segment Operations |
| 9 |
Consumer Banking |
| 9 |
Global Wealth & Investment Management |
| 11 |
Global Banking |
| 13 |
Global Markets |
| 15 |
All Other |
| 16 |
Off-Balance Sheet Arrangements and Contractual Obligations |
| 17 |
Managing Risk |
| 17 |
Capital Management |
| 18 |
Liquidity Risk |
| 22 |
Credit Risk Management |
| 25 |
Consumer Portfolio Credit Risk Management |
| 25 |
Commercial Portfolio Credit Risk Management |
| 34 |
Non-U.S. Portfolio |
| 40 |
Provision for Credit Losses |
| 41 |
Allowance for Credit Losses |
| 41 |
Market Risk Management |
| 43 |
Trading Risk Management |
| 43 |
Interest Rate Risk Management for the Banking Book |
| 45 |
Mortgage Banking Risk Management |
| 48 |
Complex Accounting Estimates |
| 48 |
Non-GAAP Reconciliations |
| 48 |
|
|
|
Item 3. Quantitative and Qualitative Disclosures about Market Risk |
| 49 |
Item 4. Controls and Procedures |
| 49 |
1 Bank of America |
|
|
Part II. Other Information
Item 1. Legal Proceedings |
| 106 |
Item 1A. Risk Factors |
| 106 |
Item 2. Unregistered Sales of Equity Securities and Use of Proceeds |
| 106 |
Item 6. Exhibits |
| 107 |
Signature |
| 107 |
Item 2. Management's Discussion and Analysis of Financial Condition and Results of Operations
Bank of America Corporation (the "Corporation") and its management may make certain statements that constitute "forward-looking statements" within the meaning of the Private Securities Litigation Reform Act of 1995. These statements can be identified by the fact that they do not relate strictly to historical or current facts. Forward-looking statements often use words such as "anticipates," "targets," "expects," "hopes," "estimates," "intends," "plans," "goals," "believes," "continue" and other similar expressions or future or conditional verbs such as "will," "may," "might," "should," "would" and "could." Forward-looking statements represent the Corporation's current expectations, plans or forecasts of its future results, revenues, expenses, efficiency ratio, capital measures, strategy and future business and economic conditions more generally, and other future matters. These statements are not guarantees of future results or performance and involve certain known and unknown risks, uncertainties and assumptions that are difficult to predict and are often beyond the Corporation's control. Actual outcomes and results may differ materially from those expressed in, or implied by, any of these forward-looking statements.
You should not place undue reliance on any forward-looking statement and should consider the following uncertainties and risks, as well as the risks and uncertainties more fully discussed under Item 1A. Risk Factors of our 2017 Annual Report on Form 10-K and in any of the Corporation ' s subsequent Securities and Exchange Commission filings: the Corporation's potential claims, damages, penalties, fines and reputational damage resulting from pending or future litigation, regulatory proceedings and enforcement actions, including inquiries into our retail sales practices, and the possibility that amounts may be in excess of the Corporation's recorded liability and estimated range of possible loss for litigation exposures; the possibility that the Corporation could face increased servicing, securities, fraud, indemnity, contribution or other claims from one or more counterparties, including trustees, purchasers of loans, underwriters, issuers, other parties involved in securitizations, monolines or private-label and other investors; the possibility that future representations and warranties losses may occur in excess of the Corporation's recorded liability and estimated range of possible loss for its representations and warranties exposures; the Corporation's ability to resolve representations and warranties repurchase and related claims, including claims brought by investors or trustees seeking to avoid the statute of limitations for repurchase claims; uncertainties about the financial stability and growth rates of non-U.S. jurisdictions, the risk that those jurisdictions may face difficulties servicing their sovereign debt, and related stresses on financial markets, currencies and trade, and the Corporation's exposures to such risks, including direct, indirect and operational;
the impact of U.S. and global interest rates, currency exchange rates, economic conditions, trade policies and potential geopolitical instability; the impact on the Corporation's business, financial condition and results of operations of a potential higher interest rate environment; the possibility that future credit losses may be higher than currently expected due to changes in economic assumptions, customer behavior, adverse developments with respect to U.S. or global economic conditions and other uncertainties; the Corporation's ability to achieve its expense targets, net interest income expectations, or other projections; adverse changes to the Corporation's credit ratings from the major credit rating agencies; estimates of the fair value of certain of the Corporation's assets and liabilities, which may change; uncertainty regarding the content, timing and impact of regulatory capital and liquidity requirements; the potential impact of total loss-absorbing capacity requirements; potential adverse changes to our global systemically important bank surcharge; the potential impact of Federal Reserve actions on the Corporation's capital plans; the possible impact of the Corporation's failure to remediate a shortcoming identified by banking regulators in the Corporation's Resolution Plan; the effect of regulations, other guidance or additional information on our estimated impact of the Tax Cuts and Jobs Act; the impact of implementation and compliance with U.S. and international laws, regulations and regulatory interpretations, including, but not limited to, recovery and resolution planning requirements, Federal Deposit Insurance Corporation assessments, the Volcker Rule, fiduciary standards and derivatives regulations; a failure in or breach of the Corporation's operational or security systems or infrastructure, or those of third parties, including as a result of cyber attacks; the impact on the Corporation's business, financial condition and results of operations from the planned exit of the United Kingdom from the European Union; and other similar matters.
Forward-looking statements speak only as of the date they are made, and the Corporation undertakes no obligation to update any forward-looking statement to reflect the impact of circumstances or events that arise after the date the forward-looking statement was made.
Notes to the Consolidated Financial Statements referred to in the Management's Discussion and Analysis of Financial Condition and Results of Operations (MD&A) are incorporated by reference into the MD&A. Certain prior-period amounts have been reclassified to conform to current-period presentation. Throughout the MD&A, the Corporation uses certain acronyms and abbreviations which are defined in the Glossary.
|
| Bank of America 2 |
Executive Summary
Business Overview
The Corporation is a Delaware corporation, a bank holding company (BHC) and a financial holding company. When used in this report, "the Corporation" may refer to Bank of America Corporation individually, Bank of America Corporation and its subsidiaries, or certain of Bank of America Corporation's subsidiaries or affiliates. Our principal executive offices are located in Charlotte, North Carolina. Through our banking and various nonbank subsidiaries throughout the U.S. and in international markets, we provide a diversified range of banking and nonbank financial services and products through four business segments: Consumer Banking , Global Wealth & Investment Management (GWIM) , Global Banking and Global Markets , with the remaining operations recorded in All Other . We operate our banking activities primarily under the Bank of America, National Association (Bank of America, N.A. or BANA) charter. At March 31, 2018 , the Corporation had approximately $2.3 trillion in assets and a headcount of approximately 208,000 employees. Headcount has remained relatively unchanged since December 31, 2017 .
As of March 31, 2018 , we served clients through operations across the United States, its territories and more than 35 countries. Our retail banking footprint covers approximately 85 percent of the U.S. population, and we serve approximately 47 million consumer and small business relationships with approximately 4,400 retail financial centers, approximately 16,000 ATMs, and leading digital banking platforms (www.bankofamerica.com) with approximately 36 million active users, including approximately 25 million active mobile users. We offer industry-leading support to approximately three million small business owners. Our wealth management businesses, with client balances of over $2.7 trillion , provide tailored solutions to meet client needs through a full set of investment management, brokerage, banking, trust and retirement products. We are a global leader in corporate and investment banking and trading across a broad range of asset classes serving corporations, governments, institutions and individuals around the world.
First Quarter 2018
Economic and Business Environment
U.S. macroeconomic trends in the first quarter were characterized by moderate economic growth, low inflation and a strong labor market. Gross domestic product (GDP) growth for the first quarter of 2018 was moderate and lower than previously estimated, with actual GDP growth of 2.3 percent, well below the fourth quarter's 2.9 percent annualized pace. Notably, retail sales slowed in the first quarter compared to the fourth quarter. Nevertheless, economic fundamentals point to a second-quarter pickup. Consumer confidence remains near cyclical highs, which along with the robust labor market, point to the likelihood of a household spending rebound in the second quarter. Business investment in equipment and software accelerated over 2017. Both manufacturing and non-manufacturing investments are near their highs of the current economic expansion.
Housing activity showed some signs of growth during the first quarter, with continued solid price appreciation when compared to the fourth quarter of 2017. Selling rates are near year-ago levels with continued persistent supply shortages.
Labor market conditions remain strong. Nonfarm payroll growth has been volatile month-to-month but solid on a trend basis. Initial jobless claims are near historic lows. The unemployment rate was 4.1 percent at the end of the quarter, unchanged for six consecutive months, as strong employment gains have been met with solid increases in labor force growth. Wage growth, however, has been relatively muted.
Inflation strengthened in the first quarter, led by gains in apparel, health care and energy. The core Consumer Price Index increased at a three-percent annualized rate, the fastest quarterly rise of the current business expansion, although the less volatile year-on-year rate remained at 2.1 percent.
Equity markets increased substantially through the end of 2017 and into early 2018, with anticipation and enactment of corporate tax reform being the main catalysts, as well as a synchronous global economic expansion. However, equity volatility increased sharply in early February and periodically in March. The S&P 500 finished the first quarter down 1.2 percent from the year end. The 10-year Treasury yield finished the first quarter at 2.76 percent, up from 2.41 percent at the end of 2017. Although the Treasury yield curve steepened during the equity sell-off, the curve subsequently flattened back to levels that prevailed at the end of 2017. The U.S. dollar index trended lower through most of the first quarter.
The Federal Reserve raised its target Federal funds rate corridor to 1.5 to 1.75 percent, the sixth 25-basis point (bp) rate increase of the current cycle. Current Federal Reserve baseline forecasts suggest gradual rate increases will continue into 2018 against a backdrop of solid economic expansion and a tightening labor market. The Federal Open Market Committee also upgraded their economic forecasts, with somewhat faster GDP growth expected this year and in 2019, and a lower trough anticipated for the unemployment rate. Federal Reserve balance sheet normalization is continuing as initially scheduled.
International trade tensions escalated in the first quarter. The U.S. Administration announced plans for broad-based tariffs on steel and aluminum, although subsequently gave exemptions to various trading partners. The Administration also announced plans for tariffs on imports from China, and the Chinese government announced retaliatory measures. Full enactment of the tariffs remains subject to negotiation and further review by the Administration.
After posting its strongest annual GDP growth in 10 years in 2017, economic activity in the eurozone lost some momentum in the first quarter of the year. Despite the positive trend in growth, underlying inflationary pressures have remained dormant. In this context, the European Central Bank continued with the tapering of its quantitative easing program. The impact of the 2016 U.K. referendum vote in favor of leaving the European Union (EU) continues to weigh on the U.K. economy which, in line with the eurozone, has also showed some signs of slowing in the first three months of the year.
Supported by a very accommodative monetary policy stance and sustained growth in external demand, the Japanese economy has continued to expand with headline inflation reaching its highest level since 2015. Across emerging nations, economic activity was supported by China's continued transition towards a more consumption-based growth model.
3 Bank of America |
|
|
Recent Events
Capital Management
During the first quarter of 2018 , we repurchased approximately $4.9 billion of common stock pursuant to the Board of Directors' (the Board) June 2017 repurchase authorization under our 2017 Comprehensive Capital Analysis and Review (CCAR) capital plan, including repurchases to offset equity-based compensation awards, and an additional share repurchase authorization in December 2017. For more information, see Capital Management on page 18 .
Trust Preferred Securities Redemption
On April 30, 2018, the Corporation announced that it has submitted redemption notices for 11 series of trust preferred securities, which will result in the redemption of such trust
preferred securities, along with the trust common securities (held by the Corporation or its affiliates), on June 6, 2018. The Corporation has received all necessary approvals for these redemptions. Upon the redemption of the trust preferred securities and the extinguishment of the related junior subordinated notes issued by the Corporation, expected to occur in the second quarter of 2018, the Corporation will record a charge to other income and pretax income estimated to be approximately $800 million, subject to certain redemption price calculations at that time. For additional information, see the Corporation's Current Report on Form 8-K filed on April 30, 2018.
Selected Financial Data
Table 1 provides selected consolidated financial data for the three months ended March 31, 2018 and 2017 , and at March 31, 2018 and December 31, 2017 .
|
|
|
|
| ||||
Table 1 | Selected Financial Data |
|
|
| ||||
|
|
|
|
| ||||
|
| Three Months Ended March 31 | ||||||
(Dollars in millions, except per share information) | 2018 |
| 2017 | |||||
Income statement |
|
|
| |||||
Revenue, net of interest expense | $ | 23,125 | |
| $ | 22,248 | | |
Net income | 6,918 | |
| 5,337 | | |||
Diluted earnings per common share | 0.62 | |
| 0.45 | | |||
Dividends paid per common share | 0.12 | |
| 0.075 | | |||
Performance ratios |
|
|
| |||||
Return on average assets | 1.21 | % |
| 0.97 | % | |||
Return on average common shareholders' equity | 10.85 | |
| 8.09 | | |||
Return on average tangible common shareholders' equity (1) | 15.26 | |
| 11.44 | | |||
Efficiency ratio | 60.09 | |
| 63.34 | | |||
|
|
|
| |||||
| March 31 |
| December 31 | |||||
Balance sheet |
| |
|
| | |||
Total loans and leases | $ | 934,078 | |
| $ | 936,749 | | |
Total assets | 2,328,478 | |
| 2,281,234 | | |||
Total deposits | 1,328,664 | |
| 1,309,545 | | |||
Total common shareholders' equity | 241,552 | |
| 244,823 | | |||
Total shareholders' equity | 266,224 | |
| 267,146 | | |||
(1) | Return on average tangible common shareholders' equity is a non-GAAP financial measure. For more information and a corresponding reconciliation to accounting principles generally accepted in the United States of America (GAAP) financial measures, see Non-GAAP Reconciliations on page 48 . |
Financial Highlights
|
|
|
|
| ||||
Table 2 | Summary Income Statement | |||||||
|
|
|
|
| ||||
|
| Three Months Ended March 31 | ||||||
(Dollars in millions) | 2018 |
| 2017 | |||||
Net interest income | $ | 11,608 | |
| $ | 11,058 | | |
Noninterest income | 11,517 | |
| 11,190 | | |||
Total revenue, net of interest expense | 23,125 | |
| 22,248 | | |||
Provision for credit losses | 834 | |
| 835 | | |||
Noninterest expense | 13,897 | |
| 14,093 | | |||
Income before income taxes | 8,394 | |
| 7,320 | | |||
Income tax expense | 1,476 | |
| 1,983 | | |||
Net income | $ | 6,918 | |
| $ | 5,337 | | |
Preferred stock dividends | 428 | |
| 502 | | |||
Net income applicable to common shareholders | $ | 6,490 | |
| $ | 4,835 | | |
|
|
|
|
| ||||
Per common share information |
|
|
| |||||
Earnings | $ | 0.63 | |
| $ | 0.48 | | |
Diluted earnings | 0.62 | |
| 0.45 | | |||
Net income was $6.9 billion , or $0.62 per diluted share for the three months ended March 31, 2018 compared to $5.3 billion , or $0.45 per diluted share for the same period in 2017. The results for the three months ended March 31, 2018 compared to the same period in 2017 were driven by an increase in net interest income and noninterest income, and a decline in noninterest expense as well as lower income tax expense due to the impacts of the Tax Cuts and Jobs Act (the Tax Act). These impacts include a reduction in the federal tax rate to 21 percent from 35 percent, an increase in U.S. taxes related to our non-U.S. operations and the elimination of tax deductions for Federal Deposit Insurance Corporation (FDIC) premiums. These changes resulted in a net reduction to our estimated annual effective tax rate of approximately nine percentage points.
Total assets increased $47.2 billion from December 31, 2017 to $2.3 trillion at March 31, 2018 driven by higher cash and cash equivalents from seasonally higher deposits and an increase in securities borrowed or purchased under agreements to resell to support Global Markets client activity. These increases were partially offset by a decrease in debt securities due to lower reinvestment-related purchases as well as market value declines.
|
| Bank of America 4 |
Total liabilities increased $48.2 billion from December 31, 2017 to $2.1 trillion at March 31, 2018 primarily driven by seasonally higher deposits and an increase in trading account liabilities from increased activity in Global Markets . Shareholders' equity decreased $922 million from December 31, 2017 primarily due to returns of capital to shareholders through common stock repurchases and common and preferred stock dividends, and market value declines on debt securities, largely offset by net income and issuances of preferred stock.
Net Interest Income
Net interest income increased $550 million to $11.6 billion for the three months ended March 31, 2018 compared to the same period in 2017 , and the net interest yield increased one bp to 2.36 percent. These increases were primarily driven by the benefits from higher interest rates along with loan and deposit growth, partially offset by the sale of the non-U.S. consumer credit card business in the second quarter of 2017 and higher funding costs in Global Markets. For more information regarding interest rate risk management, see Interest Rate Risk Management for the Banking Book on page 45 .
Noninterest Income
|
|
|
|
| ||||
Table 3 | Noninterest Income |
|
|
| ||||
|
|
|
|
| ||||
|
| Three Months Ended March 31 | ||||||
(Dollars in millions) | 2018 |
| 2017 | |||||
Card income | $ | 1,457 | |
| $ | 1,449 | | |
Service charges | 1,921 | |
| 1,918 | | |||
Investment and brokerage services | 3,664 | |
| 3,417 | | |||
Investment banking income | 1,353 | |
| 1,584 | | |||
Trading account profits | 2,699 | |
| 2,331 | | |||
Other income | 423 | |
| 491 | | |||
Total noninterest income | $ | 11,517 | |
| $ | 11,190 | | |
Noninterest income increased $327 million to $11.5 billion for the three months ended March 31, 2018 compared to the same period in 2017 . The following highlights the significant changes.
● | Investment and brokerage services income increased $247 million primarily driven by higher market valuations and the impact of assets under management (AUM) flows, partially offset by the impact of changing market dynamics on transactional revenue and AUM pricing. |
● | Investment banking income decreased $231 million primarily due to declines in advisory fees and equity and debt issuance fees. |
● | Trading account profits increased $368 million primarily due to increased client activity and a strong trading performance in equity derivatives, partially offset by lower activity and less favorable markets in credit products. |
● | Other income decreased $68 million primarily due to lower equity investment gains. |
Provision for Credit Losses
The provision for credit losses remained relatively unchanged for the three months ended March 31, 2018 compared to the same period in 2017 with continued improvement in the consumer real estate portfolio and the impact of the sale of the non-U.S. credit card business during the second quarter of 2017, largely offset by an increase in U.S. credit card due to portfolio seasoning and loan growth. For more information on the provision for credit losses, see Provision for Credit Losses on page 41 .
Noninterest Expense
|
|
|
|
| ||||
Table 4 | Noninterest Expense |
|
|
| ||||
|
|
|
|
| ||||
|
| Three Months Ended March 31 | ||||||
(Dollars in millions) | 2018 |
| 2017 | |||||
Personnel | $ | 8,480 | |
| $ | 8,475 | | |
Occupancy | 1,014 | |
| 1,000 | | |||
Equipment | 442 | |
| 438 | | |||
Marketing | 345 | |
| 332 | | |||
Professional fees | 381 | |
| 456 | | |||
Data processing | 810 | |
| 794 | | |||
Telecommunications | 183 | |
| 191 | | |||
Other general operating | 2,242 | |
| 2,407 | | |||
Total noninterest expense | $ | 13,897 | |
| $ | 14,093 | | |
Noninterest expense decreased $196 million to $13.9 billion for the three months ended March 31, 2018 compared to the same period in 2017 driven by lower non-personnel costs, primarily litigation expense and professional fees.
Income Tax Expense
|
|
|
|
| ||||
Table 5 | Income Tax Expense |
|
|
| ||||
|
|
|
|
| ||||
|
| Three Months Ended March 31 | ||||||
(Dollars in millions) | 2018 |
| 2017 | |||||
Income before income taxes | $ | 8,394 | |
| $ | 7,320 | | |
Income tax expense | 1,476 | |
| 1,983 | | |||
Effective tax rate | 17.6 | % |
| 27.1 | % | |||
The effective tax rate for 2018 reflects the new 21 percent federal tax rate and the other provisions of the Tax Act. Further, the effective tax rates for the three months ended March 31, 2018 and 2017 were lower than the applicable federal and state statutory rates due to our recurring tax preference benefits and tax benefits related to stock-based compensation. We expect the effective tax rate for 2018 to be approximately 20 percent, absent unusual items.
5 Bank of America |
|
|
|
|
|
|
|
|
|
|
|
|
| ||||||||||
Table 6 | Selected Quarterly Financial Data |
|
|
|
|
|
|
|
|
| ||||||||||
|
|
|
|
|
|
|
|
|
|
| ||||||||||
|
| 2018 Quarter Quarter |
| 2017 Quarters | ||||||||||||||||
(In millions, except per share information) | First |
| Fourth |
| Third |
| Second |
| First | |||||||||||
Income statement |
|
|
|
|
| |
|
| |
|
| | ||||||||
Net interest income | $ | 11,608 | |
| $ | 11,462 | |
| $ | 11,161 | |
| $ | 10,986 | |
| $ | 11,058 | | |
Noninterest income (1) | 11,517 | |
| 8,974 | |
| 10,678 | |
| 11,843 | |
| 11,190 | | ||||||
Total revenue, net of interest expense | 23,125 | |
| 20,436 | |
| 21,839 | |
| 22,829 | |
| 22,248 | | ||||||
Provision for credit losses | 834 | |
| 1,001 | |
| 834 | |
| 726 | |
| 835 | | ||||||
Noninterest expense | 13,897 | |
| 13,274 | |
| 13,394 | |
| 13,982 | |
| 14,093 | | ||||||
Income before income taxes | 8,394 | |
| 6,161 | |
| 7,611 | |
| 8,121 | |
| 7,320 | | ||||||
Income tax expense (1) | 1,476 | |
| 3,796 | |
| 2,187 | |
| 3,015 | |
| 1,983 | | ||||||
Net income (1) | 6,918 | |
| 2,365 | |
| 5,424 | |
| 5,106 | |
| 5,337 | | ||||||
Net income applicable to common shareholders | 6,490 | |
| 2,079 | |
| 4,959 | |
| 4,745 | |
| 4,835 | | ||||||
Average common shares issued and outstanding | 10,322.4 | |
| 10,470.7 | |
| 10,197.9 | |
| 10,013.5 | |
| 10,099.6 | | ||||||
Average diluted common shares issued and outstanding | 10,472.7 | |
| 10,621.8 | |
| 10,746.7 | |
| 10,834.8 | |
| 10,919.7 | | ||||||
Performance ratios |
| |
|
| |
|
| |
|
| |
|
| | ||||||
Return on average assets | 1.21 | % |
| 0.41 | % |
| 0.95 | % |
| 0.90 | % |
| 0.97 | % | ||||||
Four quarter trailing return on average assets (2) | 0.86 | |
| 0.80 | |
| 0.91 | |
| 0.89 | |
| 0.88 | | ||||||
Return on average common shareholders' equity | 10.85 | |
| 3.29 | |
| 7.89 | |
| 7.75 | |
| 8.09 | | ||||||
Return on average tangible common shareholders' equity (3) | 15.26 | |
| 4.56 | |
| 10.98 | |
| 10.87 | |
| 11.44 | | ||||||
Return on average shareholders' equity | 10.57 | |
| 3.43 | |
| 7.88 | |
| 7.56 | |
| 8.09 | | ||||||
Return on average tangible shareholders' equity (3) | 14.37 | |
| 4.62 | |
| 10.59 | |
| 10.23 | |
| 11.01 | | ||||||
Total ending equity to total ending assets | 11.43 | |
| 11.71 | |
| 11.91 | |
| 12.00 | |
| 11.92 | | ||||||
Total average equity to total average assets | 11.41 | |
| 11.87 | |
| 12.03 | |
| 11.94 | |
| 12.00 | | ||||||
Dividend payout | 19.06 | |
| 60.35 | |
| 25.59 | |
| 15.78 | |
| 15.64 | | ||||||
Per common share data |
| |
|
| |
|
| |
|
| |
|
| | ||||||
Earnings | $ | 0.63 | |
| $ | 0.20 | |
| $ | 0.49 | |
| $ | 0.47 | |
| $ | 0.48 | | |
Diluted earnings | 0.62 | |
| 0.20 | |
| 0.46 | |
| 0.44 | |
| 0.45 | | ||||||
Dividends paid | 0.12 | |
| 0.12 | |
| 0.12 | |
| 0.075 | |
| 0.075 | | ||||||
Book value | 23.74 | |
| 23.80 | |
| 23.87 | |
| 24.85 | |
| 24.34 | | ||||||
Tangible book value (3) | 16.84 | |
| 16.96 | |
| 17.18 | |
| 17.75 | |
| 17.22 | | ||||||
Market price per share of common stock |
| |
|
| |
|
|
|
|
|
| | ||||||||
Closing | $ | 29.99 | |
| $ | 29.52 | |
| $ | 25.34 | |
| $ | 24.26 | |
| $ | 23.59 | | |
High closing | 32.84 | |
| 29.88 | |
| 25.45 | |
| 24.32 | |
| 25.50 | | ||||||
Low closing | 29.17 | |
| 25.45 | |
| 22.89 | |
| 22.23 | |
| 22.05 | | ||||||
Market capitalization | $ | 305,176 | |
| $ | 303,681 | |
| $ | 264,992 | |
| $ | 239,643 | |
| $ | 235,291 | | |
Average balance sheet |
| |
|
| |
|
| |
|
| |
|
| | ||||||
Total loans and leases | $ | 931,915 | |
| $ | 927,790 | |
| $ | 918,129 | |
| $ | 914,717 | |
| $ | 914,144 | | |
Total assets | 2,325,878 | |
| 2,301,687 | |
| 2,271,104 | |
| 2,269,293 | |
| 2,231,649 | | ||||||
Total deposits | 1,297,268 | |
| 1,293,572 | |
| 1,271,711 | |
| 1,256,838 | |
| 1,256,632 | | ||||||
Long-term debt | 229,603 | |
| 227,644 | |
| 227,309 | |
| 224,019 | |
| 221,468 | | ||||||
Common shareholders' equity | 242,713 | |
| 250,838 | |
| 249,214 | |
| 245,756 | |
| 242,480 | | ||||||
Total shareholders' equity | 265,480 | |
| 273,162 | |
| 273,238 | |
| 270,977 | |
| 267,700 | | ||||||
Asset quality |
| |
|
| |
|
| |
|
| |
|
| | ||||||
Allowance for credit losses (4) | $ | 11,042 | |
| $ | 11,170 | |
| $ | 11,455 | |
| $ | 11,632 | |
| $ | 11,869 | | |
Nonperforming loans, leases and foreclosed properties (5) | 6,694 | |
| 6,758 | |
| 6,869 | |
| 7,127 | |
| 7,637 | | ||||||
Allowance for loan and lease losses as a percentage of total loans and leases outstanding (6, 7) | 1.11 | % |
| 1.12 | % |
| 1.16 | % |
| 1.20 | % |
| 1.25 | % | ||||||
Allowance for loan and lease losses as a percentage of total nonperforming loans and leases (5, 6) | 161 | |
| 161 | |
| 163 | |
| 160 | |
| 156 | | ||||||
Net charge-offs (7, 8) | $ | 911 | |
| $ | 1,237 | |
| $ | 900 | |
| $ | 908 | |
| $ | 934 | | |
Annualized net charge-offs as a percentage of average loans and leases outstanding (6, 8) | 0.40 | % |
| 0.53 | % |
| 0.39 | % |
| 0.40 | % |
| 0.42 | % | ||||||
Capital ratios at period end (9) |
| |
|
| |
|
| |
|
| |
|
| | ||||||
Common equity tier 1 capital | 11.3 | % |
| 11.5 | % |
| 11.9 | % |
| 11.5 | % |
| 11.0 | % | ||||||
Tier 1 capital | 13.0 | |
| 13.0 | |
| 13.4 | |
| 13.2 | |
| 12.6 | | ||||||
Total capital | 14.8 | |
| 14.8 | |
| 15.1 | |
| 15.0 | |
| 14.3 | | ||||||
Tier 1 leverage | 8.4 | |
| 8.6 | |
| 8.9 | |
| 8.8 | |
| 8.8 | | ||||||
Supplementary leverage ratio | 6.8 | |
| n/a | |
| n/a | |
| n/a | |
| n/a | | ||||||
Tangible equity (3) | 8.7 | |
| 8.9 | |
| 9.1 | |
| 9.2 | |
| 9.1 | | ||||||
Tangible common equity (3) | 7.6 | |
| 7.9 | |
| 8.1 | |
| 8.0 | |
| 7.9 | | ||||||
(1) | Net income for the fourth quarter of 2017 included an estimated charge of $2.9 billion related to the Tax Act effects which consisted of $946 million in noninterest income and $1.9 billion in income tax expense. |
(2) | Calculated as total net income for four consecutive quarters divided by annualized average assets for four consecutive quarters. |
(3) | Tangible equity ratios and tangible book value per share of common stock are non-GAAP financial measures. For more information on these ratios, see Supplemental Financial Data on page 7 , and for corresponding reconciliations to GAAP financial measures, see Non-GAAP Reconciliations on page 48 . |
(4) | Includes the allowance for loan and lease losses and the reserve for unfunded lending commitments. |
(5) | Balances and ratios do not include loans accounted for under the fair value option. For additional exclusions from nonperforming loans, leases and foreclosed properties, see Consumer Portfolio Credit Risk Management – Nonperforming Consumer Loans, Leases and Foreclosed Properties Activity on page 33 and corresponding Table 28 , and Commercial Portfolio Credit Risk Management – Nonperforming Commercial Loans, Leases and Foreclosed Properties Activity on page 37 and corresponding Table 35 . |
(6) | Asset quality metrics for the first quarter of 2017 include $242 million of non-U.S. credit card allowance for loan and lease losses and $9.5 billion of non-U.S. credit card loans, which were included in assets of business held for sale on the Consolidated Balance Sheet at March 31, 2017. The Corporation sold its non-U.S. consumer credit card business in the second quarter of 2017. |
(7) | Net charge-offs exclude $35 million , $46 million , $73 million , $55 million and $33 million of write-offs in the purchased credit-impaired (PCI) loan portfolio in the first quarter of 2018 , and in the fourth, third, second and first quarters of 2017 , respectively. For more information, see Consumer Portfolio Credit Risk Management – Purchased Credit-impaired Loan Portfolio on page 31 . |
(8) | Includes net charge-offs of $31 million and $44 million on non-U.S. credit card loans in the second and first quarters of 2017, which were included in assets of business held for sale on the Consolidated Balance Sheet at March 31, 2017. |
(9) | Basel 3 transition provisions for regulatory capital adjustments and deductions were fully phased-in as of January 1, 2018. Prior periods are presented on a fully phased-in basis. For more information, see Capital Management on page 18 . |
n/a = not applicable
|
| Bank of America 6 |
Supplemental Financial Data
In this Form 10-Q, we present certain non-GAAP financial measures. Non-GAAP financial measures exclude certain items or otherwise include components that differ from the most directly comparable measures calculated in accordance with GAAP. Non-GAAP financial measures are provided as additional useful information to assess our financial condition, results of operations (including period-to-period operating performance) or compliance with prospective regulatory requirements. These non-GAAP financial measures are not intended as a substitute for GAAP financial measures and may not be defined or calculated the same way as non-GAAP financial measures used by other companies.
We view net interest income and related ratios and analyses on a fully taxable-equivalent (FTE) basis, which when presented on a consolidated basis, are non-GAAP financial measures. To derive the FTE basis, net interest income is adjusted to reflect tax-exempt income on an equivalent before-tax basis with a corresponding increase in income tax expense. For purposes of this calculation, we use the federal statutory tax rate of 21 percent for 2018 (35 percent for all prior periods) and a representative state tax rate. In addition, certain performance measures, including the efficiency ratio and net interest yield, utilize net interest income (and thus total revenue) on an FTE basis. The efficiency ratio measures the costs expended to generate a dollar of revenue, and net interest yield measures the bps we earn over the cost of funds. We believe that presentation of these items on an FTE basis allows for comparison of amounts from both taxable and tax-exempt sources and is consistent with industry practices.
We may present certain key performance indicators and ratios excluding certain items (e.g., debit valuation adjustment (DVA) gains (losses)) which result in non-GAAP financial measures. We believe that the presentation of measures that exclude these items is useful because such measures provide additional information to assess the underlying operational performance and trends of our businesses and to allow better comparison of period-to-period operating performance.
We also evaluate our business based on certain ratios that utilize tangible equity, a non-GAAP financial measure. Tangible
equity represents an adjusted shareholders' equity or common shareholders' equity amount which has been reduced by goodwill and certain acquired intangible assets (excluding mortgage servicing rights (MSRs)), net of related deferred tax liabilities. These measures are used to evaluate our use of equity. In addition, profitability, relationship and investment models use both return on average tangible common shareholders' equity and return on average tangible shareholders' equity as key measures to support our overall growth goals. These ratios are as follows:
● | Return on average tangible common shareholders' equity measures our earnings contribution as a percentage of adjusted common shareholders' equity. The tangible common equity ratio represents adjusted ending common shareholders' equity divided by total assets less goodwill and certain acquired intangible assets (excluding MSRs), net of related deferred tax liabilities. |
● | Return on average tangible shareholders' equity measures our earnings contribution as a percentage of adjusted average total shareholders' equity. The tangible equity ratio represents adjusted ending shareholders' equity divided by total assets less goodwill and certain acquired intangible assets (excluding MSRs), net of related deferred tax liabilities. |
● | Tangible book value per common share represents adjusted ending common shareholders' equity divided by ending common shares outstanding. |
We believe that the use of ratios that utilize tangible equity provides additional useful information because they present measures of those assets that can generate income. Tangible book value per share provides additional useful information about the level of tangible assets in relation to outstanding shares of common stock.
The aforementioned supplemental data and performance measures are presented in Table 6.
For more information on the reconciliation of these non-GAAP financial measures to GAAP financial measures, see Non-GAAP Reconciliations on page 48 .
7 Bank of America |
|
|
|
|
|
|
|
|
|
|
|
|
|
|
| ||||||||||
Table 7 | Quarterly Average Balances and Interest Rates - FTE Basis |
|
|
|
|
|
|
|
| |||||||||||||
|
|
|
|
|
|
|
|
|
|
|
|
| ||||||||||
|
| Average Balance |
| Interest Expense |
| Yield/ Rate |
| Average |
| Interest |
| Yield/ | ||||||||||
(Dollars in millions) | First Quarter 2018 |
| First Quarter 2017 | |||||||||||||||||||
Earning assets |
| |
|
| |
|
| |
|
| |
|
| |
|
| | |||||
Interest-bearing deposits with the Federal Reserve, non-U.S. central banks and other banks | $ | 140,247 | |
| $ | 422 | |
| 1.22 | % |
| $ | 123,921 | |
| $ | 202 | |
| 0.66 | % | |
Time deposits placed and other short-term investments | 10,786 | |
| 61 | |
| 2.31 | |
| 11,497 | |
| 47 | |
| 1.65 | | |||||
Federal funds sold and securities borrowed or purchased under agreements to resell (1) | 248,320 | |
| 622 | |
| 1.02 | |
| 216,402 | |
| 356 | |
| 0.67 | | |||||
Trading account assets | 131,123 | |
| 1,147 | |
| 3.54 | |
| 125,661 | |
| 1,111 | |
| 3.58 | | |||||
Debt securities | 433,096 | |
| 2,830 | |
| 2.58 | |
| 430,234 | |
| 2,573 | |
| 2.38 | | |||||
Loans and leases (2) : |
|
|
|
|
|
|
|
|
|
|
| |||||||||||
Residential mortgage | 204,830 | |
| 1,782 | |
| 3.48 | |
| 193,627 | |
| 1,661 | |
| 3.44 | | |||||
Home equity | 56,952 | |
| 643 | |
| 4.56 | |
| 65,508 | |
| 639 | |
| 3.94 | | |||||
U.S. credit card | 94,423 | |
| 2,313 | |
| 9.93 | |
| 89,628 | |
| 2,111 | |
| 9.55 | | |||||
Non-U.S. credit card (3) | - | |
| - | |
| - | |
| 9,367 | |
| 211 | |
| 9.15 | | |||||
Direct/Indirect consumer (4) | 92,478 | |
| 701 | |
| 3.07 | |
| 93,291 | |
| 608 | |
| 2.65 | | |||||
Other consumer (5) | 2,814 | |
| 27 | |
| 4.00 | |
| 2,547 | |
| 27 | |
| 4.07 | | |||||
Total consumer | 451,497 | |
| 5,466 | |
| 4.89 | |
| 453,968 | |
| 5,257 | |
| 4.68 | | |||||
U.S. commercial | 299,850 | |
| 2,717 | |
| 3.68 | |
| 287,468 | |
| 2,222 | |
| 3.14 | | |||||
Non-U.S. commercial | 99,504 | |
| 738 | |
| 3.01 | |
| 92,821 | |
| 595 | |
| 2.60 | | |||||
Commercial real estate (6) | 59,231 | |
| 587 | |
| 4.02 | |
| 57,764 | |
| 479 | |
| 3.36 | | |||||
Commercial lease financing | 21,833 | |
| 175 | |
| 3.20 | |
| 22,123 | |
| 231 | |
| 4.17 | | |||||
Total commercial | 480,418 | |
| 4,217 | |
| 3.56 | |
| 460,176 | |
| 3,527 | |
| 3.11 | | |||||
Total loans and leases (3) | 931,915 | |
| 9,683 | |
| 4.20 | |
| 914,144 | |
| 8,784 | |
| 3.88 | | |||||
Other earning assets (1) | 84,345 | |
| 984 | |
| 4.72 | |
| 73,514 | |
| 760 | |
| 4.19 | | |||||
Total earning assets (1,7) | 1,979,832 | |
| 15,749 | |
| 3.21 | |
| 1,895,373 | |
| 13,833 | |
| 2.96 | | |||||
Cash and due from banks | 26,275 | |
|
|
|
|
| 27,196 | |
|
|
|
| |||||||||
Other assets, less allowance for loan and lease losses | 319,771 | |
|
|
|
|
| 309,080 | |
|
|
|
| |||||||||
Total assets | $ | 2,325,878 | |
|
|
|
|
| $ | 2,231,649 | |
|
|
|
| |||||||
Interest-bearing liabilities |
| |
|
| |
|
| |
|
| |
|
| |
|
| | |||||
U.S. interest-bearing deposits: |
| |
|
| |
|
| |
|
| |
|
| |
|
| | |||||
Savings | $ | 54,747 | |
| $ | 1 | |
| 0.01 | % |
| $ | 52,193 | |
| $ | 1 | |
| 0.01 | % | |
NOW and money market deposit accounts | 659,033 | |
| 406 | |
| 0.25 | |
| 617,749 | |
| 74 | |
| 0.05 | | |||||
Consumer CDs and IRAs | 41,313 | |
| 33 | |
| 0.33 | |
| 46,711 | |
| 31 | |
| 0.27 | | |||||
Negotiable CDs, public funds and other deposits | 40,639 | |
| 157 | |
| 1.56 | |
| 33,695 | |
| 52 | |
| 0.63 | | |||||
Total U.S. interest-bearing deposits | 795,732 | |
| 597 | |
| 0.30 | |
| 750,348 | |
| 158 | |
| 0.09 | | |||||
Non-U.S. interest-bearing deposits: |
|
|
|
|
|
|
|
|
|
|
| |||||||||||
Banks located in non-U.S. countries | 2,243 | |
| 9 | |
| 1.67 | |
| 2,616 | |
| 5 | |
| 0.76 | | |||||
Governments and official institutions | 1,154 | |
| - | |
| 0.02 | |
| 1,013 | |
| 2 | |
| 0.81 | | |||||
Time, savings and other | 67,334 | |
| 154 | |
| 0.92 | |
| 58,418 | |
| 117 | |
| 0.81 | | |||||
Total non-U.S. interest-bearing deposits | 70,731 | |
| 163 | |
| 0.93 | |
| 62,047 | |
| 124 | |
| 0.81 | | |||||
Total interest-bearing deposits | 866,463 | |
| 760 | |
| 0.36 | |
| 812,395 | |
| 282 | |
| 0.14 | | |||||
Federal funds purchased, securities loaned or sold under agreements to repurchase, short-term borrowings and other interest-bearing liabilities (1) | 278,931 | |
| 1,135 | |
| 1.65 | |
| 266,837 | |
| 573 | |
| 0.87 | | |||||
Trading account liabilities | 55,362 | |
| 357 | |
| 2.62 | |
| 38,731 | |
| 264 | |
| 2.76 | | |||||
Long-term debt | 229,603 | |
| 1,739 | |
| 3.06 | |
| 221,468 | |
| 1,459 | |
| 2.65 | | |||||
Total interest-bearing liabilities (1,7) | 1,430,359 | |
| 3,991 | |
| 1.13 | |
| 1,339,431 | |
| 2,578 | |
| 0.78 | | |||||
Noninterest-bearing sources: |
|
|
|
|
|
|
|
|
|
|
| |||||||||||
Noninterest-bearing deposits | 430,805 | |
|
|
|
|
| 444,237 | |
|
|
|
| |||||||||
Other liabilities (1) | 199,234 | |
|
|
|
|
| 180,281 | |
|
|
|
| |||||||||
Shareholders' equity | 265,480 | |
|
|
|
|
| 267,700 | |
|
|
|
| |||||||||
Total liabilities and shareholders' equity | $ | 2,325,878 | |
|
|
|
|
| $ | 2,231,649 | |
|
|
|
| |||||||
Net interest spread |
|
|
|
| 2.08 | % |
|
|
|
|
| 2.18 | % | |||||||||
Impact of noninterest-bearing sources |
|
|
|
| 0.31 | |
|
|
|
|
| 0.21 | | |||||||||
Net interest income/yield on earning assets |
|
| $ | 11,758 | |
| 2.39 | % |
|
|
| $ | 11,255 | |
| 2.39 | % | |||||
(1) | Certain prior-period amounts have been reclassified to conform to current period presentation. |
(2) | Nonperforming loans are included in the respective average loan balances. Income on these nonperforming loans is generally recognized on a cost recovery basis. PCI loans are recorded at fair value upon acquisition and accrete interest income over the estimated life of the loan. |
(3) | Includes assets of the Corporation's non-U.S. consumer credit card business, which was sold during the second quarter of 2017. |
(4) | Includes non-U.S. consumer loans of $2.9 billion in both the first quarter of 2018 and 2017 . |
(5) | Includes consumer finance loans of $0 and $454 million ; consumer leases of $2.6 billion and $1.9 billion , and consumer overdrafts of $167 million and $170 million in the first quarter of 2018 and 2017 , respectively. |
(6) | Includes U.S. commercial real estate loans of $55.3 billion and $54.7 billion , and non-U.S. commercial real estate loans of $3.9 billion and $3.1 billion in the first quarter of 2018 and 2017 , respectively. |
(7) | Interest income includes the impact of interest rate risk management contracts, which decreased interest income on the underlying assets by $7 million and $17 million in the first quarter of 2018 and 2017 . Interest expense includes the impact of interest rate risk management contracts, which decreased interest expense on the underlying liabilities by $204 million and $424 million in the first quarter of 2018 and 2017 . For more information, see Interest Rate Risk Management for the Banking Book on page 45 . |
|
| Bank of America 8 |
Business Segment Operations
Segment Description and Basis of Presentation
We report our results of operations through the following four business segments: Consumer Banking , GWIM , Global Banking and Global Markets , with the remaining operations recorded in All Other . We periodically review capital allocated to our businesses and allocate capital annually during the strategic and capital planning processes. We utilize a methodology that considers the effect of regulatory capital requirements in addition to internal risk-based capital models. Our internal risk-based capital models use a risk-adjusted methodology incorporating each segment's credit,
market, interest rate, business and operational risk components. For more information on the nature of these risks, see Managing Risk on page 17 . The capital allocated to the business segments
is referred to as allocated capital. Allocated equity in the reporting units is comprised of allocated capital plus capital for the portion of goodwill and intangibles specifically assigned to the reporting unit. For more information, see Note 8 – Goodwill and Intangible Assets to the Consolidated Financial Statements .
For more information on the basis of presentation for business segments and reconciliations to consolidated total revenue, net income and period-end total assets, see Note 17 – Business Segment Information to the Consolidated Financial Statements .
Consumer Banking
|
|
|
|
|
|
|
|
|
|
|
| |||||||||||||
| Deposits |
| Consumer Lending |
| Total Consumer Banking |
|
| |||||||||||||||||
| Three Months Ended March 31 |
|
| |||||||||||||||||||||
(Dollars in millions) | 2018 | 2017 |
| 2018 | 2017 |
| 2018 | 2017 |
| % Change | | |||||||||||||
Net interest income (FTE basis) | $ | 3,741 | | $ | 3,063 | |
| $ | 2,769 | | $ | 2,718 | |
| $ | 6,510 | | $ | 5,781 | |
| 13 | % | |
Noninterest income: |
|
|
|
|
|
|
|
|
|
| ||||||||||||||
Card income | 2 | | 2 | |
| 1,277 | | 1,222 | |
| 1,279 | | 1,224 | |
| 4 | | |||||||
Service charges | 1,044 | | 1,050 | |
| - | | - | |
| 1,044 | | 1,050 | |
| (1 | ) | |||||||
All other income | 108 | | 102 | |
| 91 | | 127 | |
| 199 | | 229 | |
| (13 | ) | |||||||
Total noninterest income | 1,154 | | 1,154 | |
| 1,368 | | 1,349 | |
| 2,522 | | 2,503 | |
| 1 | | |||||||
Total revenue, net of interest expense (FTE basis) | 4,895 | | 4,217 | |
| 4,137 | | 4,067 | |
| 9,032 | | 8,284 | |
| 9 | | |||||||
|
|
|
|
|
|
|
|
|
|
| ||||||||||||||
Provision for credit losses | 41 | | 55 | |
| 894 | | 783 | |
| 935 | | 838 | |
| 12 | | |||||||
Noninterest expense | 2,651 | | 2,527 | |
| 1,829 | | 1,883 | |
| 4,480 | | 4,410 | |
| 2 | | |||||||
Income before income taxes (FTE basis) | 2,203 | | 1,635 | |
| 1,414 | | 1,401 | |
| 3,617 | | 3,036 | |
| 19 | | |||||||
Income tax expense (FTE basis) | 561 | | 616 | |
| 361 | | 528 | |
| 922 | | 1,144 | |
| (19 | ) | |||||||
Net income | $ | 1,642 | | $ | 1,019 | |
| $ | 1,053 | | $ | 873 | |
| $ | 2,695 | | $ | 1,892 | |
| 42 | | |
|
|
|
|
|
|
|
|
|
|
| ||||||||||||||
Effective tax rate (1) |
|
|
|
|
|
| 25.5 | % | 37.7 | % |
|
| ||||||||||||
|
|
|
|
|
|
|
|
|
|
| ||||||||||||||
Net interest yield (FTE basis) | 2.25 | % | 1.96 | % |
| 4.09 | % | 4.34 | % |
| 3.73 | | 3.50 | |
|
| ||||||||
Return on average allocated capital | 55 | | 34 | |
| 17 | | 14 | |
| 30 | | 21 | |
|
| ||||||||
Efficiency ratio (FTE basis) | 54.15 | | 59.94 | |
| 44.21 | | 46.29 | |
| 49.60 | | 53.24 | |
|
| ||||||||
|
|
|
|
|
|
|
|
|
|
|
| |||||||||||||
Balance Sheet |
|
|
|
|
|
|
|
|
|
|
| |||||||||||||
|
| Three Months Ended March 31 |
|
| ||||||||||||||||||||
Average |
| 2018 | 2017 |
| 2018 | 2017 |
| 2018 | 2017 |
| % Change | | ||||||||||||
Total loans and leases | $ | 5,170 | | $ | 4,979 | |
| $ | 274,387 | | $ | 252,966 | |
| $ | 279,557 | | $ | 257,945 | |
| 8 | % | |
Total earning assets (2) | 673,641 | | 634,704 | |
| 274,748 | | 254,066 | |
| 707,754 | | 668,865 | |
| 6 | | |||||||
Total assets (2) | 701,418 | | 661,769 | |
| 285,864 | | 265,783 | |
| 746,647 | | 707,647 | |
| 6 | | |||||||
Total deposits | 668,983 | | 629,337 | |
| 5,368 | | 6,257 | |
| 674,351 | | 635,594 | |
| 6 | | |||||||
Allocated capital | 12,000 | | 12,000 | |
| 25,000 | | 25,000 | |
| 37,000 | | 37,000 | |
| - | | |||||||
|
|
|
|
|
|
|
|
|
|
|
| |||||||||||||
Period end |
| March 31 | December 31 |
| March 31 | December 31 |
| March 31 | December 31 |
| % Change | | ||||||||||||
Total loans and leases | $ | 5,111 | | $ | 5,143 | |
| $ | 273,944 | | $ | 275,330 | |
| $ | 279,055 | | $ | 280,473 | |
| (1 | )% | |
Total earning assets (2) | 700,420 | | 675,485 | |
| 274,977 | | 275,742 | |
| 735,247 | | 709,832 | |
| 4 | | |||||||
Total assets (2) | 728,063 | | 703,330 | |
| 286,343 | | 287,390 | |
| 774,256 | | 749,325 | |
| 3 | | |||||||
Total deposits | 695,514 | | 670,802 | |
| 5,974 | | 5,728 | |
| 701,488 | | 676,530 | |
| 4 | | |||||||
|
|
|
|
|
|
|
|
|
|
|
| |||||||||||||
(1) | Estimated at the segment level only. |
(2) | In segments and businesses where the total of liabilities and equity exceeds assets, we allocate assets from All Other to match the segments' and businesses' liabilities and allocated shareholders' equity. As a result, total earning assets and total assets of the businesses may not equal total Consumer Banking . |
Consumer Banking, which is comprised of Deposits and Consumer Lending, offers a diversified range of credit, banking and investment products and services to consumers and small businesses. For more information about Consumer Banking , including our Deposits and Consumer Lending businesses, see Business Segment Operations in the MD&A of the Corporation's 2017 Annual Report on Form 10-K .
Consumer Banking Results
Net income for Consumer Banking increased $803 million to $2.7 billion for the three months ended March 31, 2018 compared to the same period in 2017 primarily driven by higher pretax income, and lower tax expense. The impact of the reduction in the federal tax rate was somewhat offset by the elimination of tax deductions for FDIC premiums under the Tax Act. The increase in pretax income
9 Bank of America |
|
|
was driven by an increase in revenue partially offset by higher provision for credit losses and an increase in noninterest expense. Net interest income increased $729 million to $6.5 billion primarily due to the beneficial impact of an increase in investable assets as a result of higher deposits and higher interest rates, as well as pricing discipline and loan growth. Noninterest income increased $19 million to $2.5 billion driven by higher card income, partially offset by lower mortgage banking income.
The provision for credit losses increased $97 million to $935 million due to portfolio seasoning and loan growth in the U.S. credit card portfolio. Noninterest expense increased $70 million to $4.5 billion driven by investments in digital capabilities and business growth, including increased primary sales professionals, combined with investments in new financial centers and renovations, as well as higher personnel expense. These increases were largely offset by improved operating efficiencies and lower litigation expense.
The return on average allocated capital was 30 percent, up from 21 percent, driven by higher net income. For additional information on capital allocations, see Business Segment Operations on page 9 .
Deposits and Consumer Lending include the net impact of migrating customers and their related deposit, brokerage asset and loan balances between Deposits, Consumer Lending and GWIM , as well as other client-managed business. For more information on the migration of customer balances to or from GWIM , see GWIM – Net Migration Summary on page 12 .
Deposits
Net income for Deposits increased $623 million to $1.6 billion for the three months ended March 31, 2018 compared to the same period in 2017 driven by higher net interest income and lower income taxes, partially offset by higher noninterest expense. Net interest income increased $678 million to $3.7 billion primarily due to the beneficial impact of an increase in investable assets as a result of higher deposits, and pricing discipline. Noninterest income of $1.2 billion remained unchanged.
The provision for credit losses decreased $14 million to $41 million . Noninterest expense increased $124 million to $2.7 billion primarily driven by investments in digital capabilities and business growth, including increased primary sales professionals, combined with investments in new financial centers and renovations, as well as higher personnel expense.
Average deposits increased $39.6 billion to $669.0 billion driven by strong organic growth. Growth in checking, money market savings and traditional savings of $44.0 billion was partially offset by a decline in time deposits of $4.6 billion.
|
|
|
| ||||
Key Statistics – Deposits |
|
|
| ||||
|
|
|
| ||||
| Three Months Ended March 31 | ||||||
| 2018 |
| 2017 | ||||
Total deposit spreads (excludes noninterest costs) (1) | 2.00 | % |
| 1.67 | % | ||
|
|
|
| ||||
Period End |
|
|
| ||||
Client brokerage assets (in millions) | $ | 182,110 | |
| $ | 153,786 | |
Active digital banking users (units in thousands) (2) | 35,518 | |
| 33,702 | | ||
Active mobile banking users (units in thousands) | 24,801 | |
| 22,217 | | ||
Financial centers | 4,435 | |
| 4,559 | | ||
ATMs | 16,011 | |
| 15,939 | | ||
(1) | Includes deposits held in Consumer Lending. |
(2) | Digital users represents mobile and/or online users across consumer businesses; historical information has been reclassified primarily due to the sale of the Corporation's non-U.S. consumer credit card business in the second quarter of 2017. |
Client brokerage assets increased $28.3 billion driven by strong client flows and market performance. Active mobile banking users increased 2.6 million reflecting continuing changes in our customers' banking preferences. The number of financial centers declined by a net 124 reflecting changes in customer preferences to self-service options as we continue to optimize our consumer banking network and improve our cost-to-serve.
Consumer Lending
We classify consumer real estate loans as core or non-core based on loan and customer characteristics such as origination date, product type, loan-to-value (LTV), Fair Isaac Corporation (FICO) score and delinquency status. For more information on the core and non-core portfolios, see Consumer Portfolio Credit Risk Management on page 25 . At March 31, 2018 , total owned loans in the core portfolio held in Consumer Lending were $117.9 billion, an increase of $14.2 billion from March 31, 2017 , primarily driven by higher residential mortgage balances, based on a decision to retain certain loans on the balance sheet, partially offset by a decline in home equity balances.
Net income for Consumer Lending increased $180 million to $1.1 billion for the three months ended March 31, 2018 compared to the same period in 2017 driven by lower income taxes, higher revenue and lower noninterest expense, partially offset by higher provision for credit losses. Net interest income increased $51 million to $2.8 billion primarily driven by the impact of an increase in loan balances. Noninterest income increased $19 million to $1.4 billion driven by higher card income, partially offset by lower mortgage banking income.
The provision for credit losses increased $111 million to $894 million due to portfolio seasoning and loan growth in the U.S. credit card portfolio. Noninterest expense decreased $54 million to $1.8 billion primarily driven by lower litigation expense and improved operating efficiencies.
Average loans increased $21.4 billion to $274.4 billion driven by increases in residential mortgages, as well as U.S credit card and consumer vehicle loans, partially offset by lower home equity loan balances.
|
|
|
| ||||
Key Statistics – Consumer Lending | |||||||
|
| ||||||
| Three Months Ended March 31 | ||||||
(Dollars in millions) | 2018 |
| 2017 | ||||
Total U.S. credit card (1) |
|
|
| ||||
Gross interest yield | 9.93 | % |
| 9.55 | % | ||
Risk-adjusted margin | 8.32 | |
| 8.89 | | ||
New accounts (in thousands) | 1,194 | |
| 1,184 | | ||
Purchase volumes | $ | 61,347 | |
| $ | 55,321 | |
Debit card purchase volumes | $ | 76,052 | |
| $ | 70,611 | |
(1) | In addition to the U.S. credit card portfolio in Consumer Banking , the remaining U.S. credit card portfolio is in GWIM . |
During the three months ended March 31, 2018 , the total U.S. credit card risk-adjusted margin decreased 57 bps primarily driven by increased net charge-offs and higher credit card rewards costs.
Total U.S. credit card purchase volumes increased $6.0 billion to $61.3 billion , and debit card purchase volumes increased $5.4 billion to $76.1 billion , reflecting higher levels of consumer spending.
|
| Bank of America 10 |
|
|
|
| ||||
Key Statistics - Loan Production (1) | |||||||
|
|
|
| ||||
| Three Months Ended March 31 | ||||||
(Dollars in millions) | 2018 |
| 2017 | ||||
Total (2) : |
|
|
| ||||
First mortgage | $ | 9,424 | |
| $ | 11,442 | |
Home equity | 3,749 | |
| 4,053 | | ||
Consumer Banking: |
|
|
| ||||
First mortgage | $ | 5,964 | |
| $ | 7,629 | |
Home equity | 3,345 | |
| 3,667 | | ||
(1) | The loan production amounts represent the unpaid principal balance of loans and in the case of home equity, the principal amount of the total line of credit. |
(2) | In addition to loan production in Consumer Banking , there is also first mortgage and home equity loan production in GWIM. |
First mortgage loan originations in Consumer Banking and for the total Corporation decreased $1.7 billion and $2.0 billion in the three months ended March 31, 2018 compared to the same period in 2017 primarily driven by the higher interest rate environment driving lower first-lien mortgage refinances.
Home equity production in Consumer Banking and for the total Corporation decreased $322 million and $304 million for the three months ended March 31, 2018 compared to the same period in 2017 driven by a smaller market.
|
|
|
|
|
|
| |||||
|
| Three Months Ended March 31 |
|
| |||||||
(Dollars in millions) | 2018 |
| 2017 |
| % Change | | |||||
Net interest income (FTE basis) | $ | 1,594 | |
| $ | 1,560 | |
| 2 | % | |
Noninterest income: |
|
|
|
|
| ||||||
Investment and brokerage services | 3,040 | |
| 2,791 | |
| 9 | | |||
All other income | 222 | |
| 241 | |
| (8 | ) | |||
Total noninterest income | 3,262 | |
| 3,032 | |
| 8 | | |||
Total revenue, net of interest expense (FTE basis) | 4,856 | |
| 4,592 | |
| 6 | | |||
|
|
|
|
|
| ||||||
Provision for credit losses | 38 | |
| 23 | |
| 65 | | |||
Noninterest expense | 3,428 | |
| 3,329 | |
| 3 | | |||
Income before income taxes (FTE basis) | 1,390 | |
| 1,240 | |
| 12 | | |||
Income tax expense (FTE basis) | 355 | |
| 467 | |
| (24 | ) | |||
Net income | $ | 1,035 | |
| $ | 773 | |
| 34 | | |
|
|
|
|
|
| ||||||
Effective tax rate | 25.5 | % |
| 37.7 | % |
|
| ||||
|
|
|
|
|
| ||||||
Net interest yield (FTE basis) | 2.46 | |
| 2.28 | |
|
| ||||
Return on average allocated capital | 29 | |
| 22 | |
|
| ||||
Efficiency ratio (FTE basis) | 70.60 | |
| 72.51 | |
|
| ||||
|
|
|
|
|
| ||||||
Balance Sheet |
|
|
|
|
|
| |||||
| Three Months Ended March 31 |
|
| ||||||||
Average | 2018 |
| 2017 |
| % Change | | |||||
Total loans and leases | $ | 159,095 | |
| $ | 148,405 | |
| 7 | % | |
Total earning assets | 262,775 | |
| 277,989 | |
| (5 | ) | |||
Total assets | 279,716 | |
| 293,432 | |
| (5 | ) | |||
Total deposits | 243,077 | |
| 257,386 | |
| (6 | ) | |||
Allocated capital | 14,500 | |
| 14,000 | |
| 4 | | |||
|
|
|
|
|
| ||||||
Period end | March 31 |
| December 31 |
| % Change | | |||||
Total loans and leases | $ | 159,636 | |
| $ | 159,378 | |
| - | % | |
Total earning assets | 262,430 | |
| 267,026 | |
| (2 | ) | |||
Total assets | 279,331 | |
| 284,321 | |
| (2 | ) | |||
Total deposits | 241,531 | |
| 246,994 | |
| (2 | ) | |||
GWIM consists of two primary businesses: Merrill Lynch Global Wealth Management (MLGWM) and U.S. Trust, Bank of America Private Wealth Management (U.S. Trust). For more information about GWIM , see Business Segment Operations in the MD&A of the Corporation's 2017 Annual Report on Form 10-K .
Net income for GWIM increased $262 million to $1.0 billion for the three months ended March 31, 2018 compared to the same period in 2017 reflecting higher pretax income, and lower tax expense. The impact of the reduction in the federal tax rate was somewhat offset by the elimination of tax deductions for FDIC premiums under the Tax Act. Pretax results were driven by higher revenue, partially offset by an increase in noninterest expense. The operating margin was 29 percent compared to 27 percent a year ago.
Net interest income increased $34 million to $1.6 billion primarily due to higher interest rates and higher loan balances. Noninterest income, which primarily includes investment and brokerage services income, increased $230 million to $3.3 billion . The increase in noninterest income was driven by higher market valuations and AUM flows, partially offset by the impact of changing market dynamics on transactional revenue and AUM pricing. Noninterest expense increased $99 million to $3.4 billion primarily due to higher revenue-related incentive costs.
Return on average allocated capital was 29 percent, up from 22 percent a year ago, primarily due to higher net income, somewhat offset by an increase in allocated capital.
11 Bank of America |
|
|
During the three months ended March 31, 2018 , revenue from MLGWM of $4.0 billion increased six percent compared to the same period in 2017 due to higher net interest income and asset management fees driven by higher market valuations and AUM
flows, partially offset by lower transactional revenue and AUM pricing. U.S. Trust revenue of $860 million increased six percent reflecting higher net interest income and asset management fees primarily due to higher market valuations and AUM flows.
|
|
|
| ||||
Key Indicators and Metrics |
|
|
| ||||
|
|
|
| ||||
| Three Months Ended March 31 | ||||||
(Dollars in millions, except as noted) | 2018 |
| 2017 | ||||
Revenue by Business |
|
|
| ||||
Merrill Lynch Global Wealth Management | $ | 3,996 | |
| $ | 3,782 | |
U.S. Trust | 860 | |
| 809 | | ||
Other | - | |
| 1 | | ||
Total revenue, net of interest expense (FTE basis) | $ | 4,856 | |
| $ | 4,592 | |
|
|
|
| ||||
Client Balances by Business, at period end |
|
|
| ||||
Merrill Lynch Global Wealth Management | $ | 2,284,803 | |
| $ | 2,167,536 | |
U.S. Trust | 440,683 | |
| 417,841 | | ||
Total client balances | $ | 2,725,486 | |
| $ | 2,585,377 | |
|
|
|
| ||||
Client Balances by Type, at period end |
|
|
| ||||
Assets under management | $ | 1,084,717 | |
| $ | 946,778 | |
Brokerage and other assets | 1,236,799 | |
| 1,232,195 | | ||
Deposits | 241,531 | |
| 254,595 | | ||
Loans and leases (1) | 162,439 | |
| 151,809 | | ||
Total client balances | $ | 2,725,486 | |
| $ | 2,585,377 | |
|
|
|
| ||||
Assets Under Management Rollforward |
|
|
| ||||
Assets under management, beginning of period | $ | 1,080,747 | |
| $ | 886,148 | |
Net client flows | 24,240 | |
| 29,214 | | ||
Market valuation/other | (20,270 | ) |
| 31,416 | | ||
Total assets under management, end of period | $ | 1,084,717 | |
| $ | 946,778 | |
|
|
|
| ||||
Associates, at period end (2) |
|
|
| ||||
Number of financial advisors | 17,367 | |
| 16,678 | | ||
Total wealth advisors, including financial advisors | 19,276 | |
| 18,538 | | ||
Total primary sales professionals, including financial advisors and wealth advisors | 20,398 | |
| 19,536 | | ||
|
|
|
| ||||
Merrill Lynch Global Wealth Management Metric |
|
|
| ||||
Financial advisor productivity (3) (in thousands) | $ | 1,038 | |
| $ | 993 | |
|
|
|
| ||||
U.S. Trust Metric, at period end |
|
|
| ||||
Primary sales professionals | 1,737 | |
| 1,657 | | ||
(1) | Includes margin receivables which are classified in customer and other receivables on the Consolidated Balance Sheet. |
(2) | Includes financial advisors in the Consumer Banking segment of 2,538 and 2,121 at March 31, 2018 and 2017 . |
(3) | Financial advisor productivity is defined as annualized MLGWM total revenue, excluding the allocation of certain asset and liability management (ALM) activities, divided by the total average number of financial advisors (excluding financial advisors in the Consumer Banking segment). |
Client Balances
Client balances increased $140.1 billion , or five percent, to $2.7 trillion at March 31, 2018 compared to March 31, 2017 . The increase in client balances was due to higher market valuations and positive net flows.
Net Migration Summary
GWIM results are impacted by the net migration of clients and their corresponding deposit, loan and brokerage balances primarily to or from Consumer Banking, as presented in the following table. Migrations of client balances primarily result from the periodic
movement of clients and/or accounts between business segments based on changes in the nature of client relationships.
|
|
|
| ||||
Net Migration Summary |
|
|
| ||||
|
|
|
| ||||
| Three Months Ended March 31 | ||||||
(Dollars in millions) | 2018 |
| 2017 | ||||
Total deposits, net – to (from) GWIM | $ | 1,135 | |
| $ | (97 | ) |
Total loans, net – from GWIM | (3 | ) |
| (126 | ) | ||
Total brokerage, net – to (from) GWIM | (48 | ) |
| 94 | | ||
|
| Bank of America 12 |
Global Banking
|
|
|
|
|
|
| |||||
(Dollars in millions) | Three Months Ended March 31 |
|
| ||||||||
| 2018 |
| 2017 |
| % Change | ||||||
Net interest income (FTE basis) | $ | 2,640 | |
| $ | 2,602 | |
| 1 | % | |
Noninterest income: |
|
|
|
|
| ||||||
Service charges | 763 | |
| 765 | |
| - | | |||
Investment banking fees | 744 | |
| 925 | |
| (20 | ) | |||
All other income | 787 | |
| 663 | |
| 19 | | |||
Total noninterest income | 2,294 | |
| 2,353 | |
| (3 | ) | |||
Total revenue, net of interest expense (FTE basis) | 4,934 | |
| 4,955 | |
| - | | |||
|
|
|
|
|
| ||||||
Provision for credit losses | 16 | |
| 17 | |
| (6 | ) | |||
Noninterest expense | 2,195 | |
| 2,163 | |
| 1 | | |||
Income before income taxes (FTE basis) | 2,723 | |
| 2,775 | |
| (2 | ) | |||
Income tax expense (FTE basis) | 707 | |
| 1,046 | |
| (32 | ) | |||
Net income | $ | 2,016 | |
| $ | 1,729 | |
| 17 | | |
|
|
|
|
|
| ||||||
Effective tax rate | 26.0 | % |
| 37.7 | % |
|
| ||||
|
|
|
|
|
| ||||||
Net interest yield (FTE basis) | 2.96 | |
| 2.93 | |
|
| ||||
Return on average allocated capital | 20 | |
| 18 | |
|
| ||||
Efficiency ratio (FTE basis) | 44.47 | |
| 43.66 | |
|
| ||||
|
|
|
|
|
| ||||||
Balance Sheet |
|
|
|
|
|
| |||||
| Three Months Ended March 31 |
|
| ||||||||
Average | 2018 |
| 2017 |
| % Change | ||||||
Total loans and leases | $ | 351,689 | |
| $ | 342,857 | |
| 3 | % | |
Total earning assets | 361,822 | |
| 359,605 | |
| 1 | | |||
Total assets | 420,594 | |
| 415,908 | |
| 1 | | |||
Total deposits | 324,405 | |
| 305,197 | |
| 6 | | |||
Allocated capital | 41,000 | |
| 40,000 | |
| 3 | | |||
|
|
|
|
|
| ||||||
Period end | March 31 |
| December 31 |
| % Change | ||||||
Total loans and leases | $ | 355,165 | |
| $ | 350,668 | |
| 1 | % | |
Total earning assets | 365,895 | |
| 365,560 | |
| - | | |||
Total assets | 424,134 | |
| 424,533 | |
| - | | |||
Total deposits | 331,238 | |
| 329,273 | |
| 1 | | |||
Global Banking , which includes Global Corporate Banking, Global Commercial Banking, Business Banking and Global Investment Banking, provides a wide range of lending-related products and services, integrated working capital management and treasury solutions, and underwriting and advisory services through our network of offices and client relationship teams. For more information about Global Banking , see Business Segment Operations in the MD&A of the Corporation's 2017 Annual Report on Form 10-K .
Net income for Global Banking increased $287 million to $2.0 billion for the three months ended March 31, 2018 compared to the same period in 2017 primarily driven by lower tax expense, partially offset by modestly lower pretax income as discussed below. The impact of the reduction in the federal tax rate was somewhat offset by an increase in U.S. taxes related to our non-U.S. operations and the elimination of tax deductions for FDIC premiums under the Tax Act.
Pretax results were driven by higher noninterest expense and lower revenue. Revenue decreased $21 million to $4.9 billion for the three months ended March 31, 2018 compared to the same period in 2017 driven by lower noninterest income, partially offset by higher net interest income. Net interest income increased $38 million to $2.6 billion primarily due to the impact of higher interest rates on increased deposits, and loan growth. Noninterest income decreased $59 million to $2.3 billion primarily due to lower investment banking fees and the impact of tax reform on certain tax-advantaged investments, partially offset by higher leasing-related revenues.
Noninterest expense increased $32 million to $2.2 billion primarily due to higher personnel and operating expense.
The return on average allocated capital was 20 percent , up from 18 percent , as higher net income was partially offset by an increased capital allocation. For more information on capital allocated to the business segments, see Business Segment Operations on page 9 .
13 Bank of America |
|
|
Global Corporate, Global Commercial and Business Banking
The table below and following discussion present a summary of the results, which exclude certain investment banking activities in Global Banking .
|
|
|
|
|
|
|
|
|
|
|
|
|
|
|
|
| ||||||||||||||||
Global Corporate, Global Commercial and Business Banking |
|
|
|
|
|
|
|
|
|
|
|
| ||||||||||||||||||||
|
|
|
|
|
|
|
|
|
|
|
|
|
|
|
| |||||||||||||||||
|
| Global Corporate Banking |
| Global Commercial Banking |
| Business Banking |
| Total | ||||||||||||||||||||||||
|
| Three Months Ended March 31 | ||||||||||||||||||||||||||||||
(Dollars in millions) | 2018 |
| 2017 |
| 2018 |
| 2017 |
| 2018 |
| 2017 |
| 2018 |
| 2017 | |||||||||||||||||
Revenue |
|
|
|
|
|
|
|
|
|
|
|
|
|
|
| |||||||||||||||||
Business Lending | $ | 1,050 | |
| $ | 1,102 | |
| $ | 975 | |
| $ | 1,044 | |
| $ | 99 | |
| $ | 101 | |
| $ | 2,124 | |
| $ | 2,247 | | |
Global Transaction Services | 882 | |
| 797 | |
| 816 | |
| 707 | |
| 232 | |
| 197 | |
| 1,930 | |
| 1,701 | | |||||||||
Total revenue, net of interest expense | $ | 1,932 | |
| $ | 1,899 | |
| $ | 1,791 | |
| $ | 1,751 | |
| $ | 331 | |
| $ | 298 | |
| $ | 4,054 | |
| $ | 3,948 | | |
|
|
|
|
|
|
|
|
|
|
|
|
|
|
|
| |||||||||||||||||
Balance Sheet |
|
|
|
|
|
|
|
|
|
|
|
|
|
|
|
| ||||||||||||||||
|
|
|
|
|
|
|
|
|
|
|
|
|
|
|
|
| ||||||||||||||||
Average |
|
|
|
|
|
|
|
|
|
|
|
|
|
|
| |||||||||||||||||
Total loans and leases | $ | 162,073 | |
| $ | 155,358 | |
| $ | 172,360 | |
| $ | 169,728 | |
| $ | 17,259 | |
| $ | 17,785 | |
| $ | 351,692 | |
| $ | 342,871 | | |
Total deposits | 155,644 | |
| 146,437 | |
| 132,357 | |
| 122,904 | |
| 36,410 | |
| 35,861 | |
| 324,411 | |
| 305,202 | | |||||||||
|
|
|
|
|
|
|
|
|
|
|
|
|
|
|
| |||||||||||||||||
Period end |
|
|
|
|
|
|
|
|
|
|
|
|
|
|
| |||||||||||||||||
Total loans and leases | $ | 163,563 | |
| $ | 155,801 | |
| $ | 174,580 | |
| $ | 170,897 | |
| $ | 17,008 | |
| $ | 17,775 | |
| $ | 355,151 | |
| $ | 344,473 | | |
Total deposits | 165,040 | |
| 143,080 | |
| 129,895 | |
| 118,435 | |
| 36,326 | |
| 35,653 | |
| 331,261 | |
| 297,168 | | |||||||||
Business Lending revenue decreased $123 million for the three months ended March 31, 2018 compared to the same period in 2017 primarily driven by the impact of tax reform on certain tax-advantaged investments, partially offset by higher leasing-related revenues. Global Transaction Services revenue increased $229 million for the three months ended March 31, 2018 compared to the same period in 2017 driven by the impact of higher interest rates and an increase in the deposit base.
Average loans and leases increased three percent for the three months ended March 31, 2018 compared to the same period in 2017 driven by growth in commercial and industrial loans. Average deposits increased six percent due to growth with new and existing clients.
Global Investment Banking
Client teams and product specialists underwrite and distribute debt, equity and loan products, and provide advisory services and tailored risk management solutions. The economics of certain investment banking and underwriting activities are shared primarily between Global Banking and Global Markets under an internal revenue-sharing arrangement. Global Banking originates certain deal-related transactions with our corporate and commercial clients that are executed and distributed by Global Markets . To provide a complete discussion of our consolidated investment
banking fees, the following table presents total Corporation investment banking fees and the portion attributable to Global Banking.
|
|
|
|
|
|
|
| ||||||||
Investment Banking Fees |
|
|
|
|
|
| |||||||||
|
| ||||||||||||||
| Global Banking |
| Total Corporation | ||||||||||||
| Three Months Ended March 31 | ||||||||||||||
(Dollars in millions) | 2018 |
| 2017 |
| 2018 |
| 2017 | ||||||||
Products |
|
|
|
|
|
|
| ||||||||
Advisory | $ | 276 | |
| $ | 390 | |
| $ | 296 | |
| $ | 405 | |
Debt issuance | 356 | |
| 412 | |
| 827 | |
| 926 | | ||||
Equity issuance | 112 | |
| 123 | |
| 314 | |
| 312 | | ||||
Gross investment banking fees | 744 | |
| 925 | |
| 1,437 | |
| 1,643 | | ||||
Self-led deals | (34 | ) |
| (23 | ) |
| (84 | ) |
| (59 | ) | ||||
Total investment banking fees | $ | 710 | |
| $ | 902 | |
| $ | 1,353 | |
| $ | 1,584 | |
Total Corporation investment banking fees, excluding self-led deals, of $1.4 billion , which are primarily included within Global Banking and Global Markets, decreased 15 percent for the three months ended March 31, 2018 compared to the same period in 2017 due to a decrease in market fee pools.
|
| Bank of America 14 |
|
|
|
|
|
|
| |||||
|
| Three Months Ended March 31 |
|
| |||||||
(Dollars in millions) | 2018 |
| 2017 |
| % Change | ||||||
Net interest income (FTE basis) | $ | 870 | |
| $ | 1,049 | |
| (17 | )% | |
Noninterest income: |
|
|
|
|
| ||||||
Investment and brokerage services | 488 | |
| 531 | |
| (8 | ) | |||
Investment banking fees | 609 | |
| 666 | |
| (9 | ) | |||
Trading account profits | 2,703 | |
| 2,177 | |
| 24 | | |||
All other income | 116 | |
| 285 | |
| (59 | ) | |||
Total noninterest income | 3,916 | |
| 3,659 | |
| 7 | | |||
Total revenue, net of interest expense (FTE basis) | 4,786 | |
| 4,708 | |
| 2 | | |||
|
|
|
|
|
| ||||||
Provision for credit losses | (3 | ) |
| (17 | ) |
| (82 | ) | |||
Noninterest expense | 2,818 | |
| 2,757 | |
| 2 | | |||
Income before income taxes (FTE basis) | 1,971 | |
| 1,968 | |
| - | | |||
Income tax expense (FTE basis) | 513 | |
| 671 | |
| (24 | ) | |||
Net income | $ | 1,458 | |
| $ | 1,297 | |
| 12 | | |
|
|
|
|
|
| ||||||
Effective tax rate | 26.0 | % |
| 34.1 | % |
|
| ||||
|
|
|
|
|
| ||||||
Return on average allocated capital | 17 | |
| 15 | |
|
| ||||
Efficiency ratio (FTE basis) | 58.87 | |
| 58.56 | |
|
| ||||
|
|
|
|
|
| ||||||
Balance Sheet |
|
|
|
|
|
| |||||
| Three Months Ended March 31 |
|
| ||||||||
Average | 2018 |
| 2017 |
| % Change | ||||||
Trading-related assets: |
|
|
|
|
| ||||||
Trading account securities | $ | 210,278 | |
| $ | 203,866 | |
| 3 | % | |
Reverse repurchases | 123,948 | |
| 96,835 | |
| 28 | | |||
Securities borrowed | 82,376 | |
| 81,312 | |
| 1 | | |||
Derivative assets | 46,567 | |
| 40,346 | |
| 15 | | |||
Total trading-related assets | 463,169 | |
| 422,359 | |
| 10 | | |||
Total loans and leases | 73,763 | |
| 70,064 | |
| 5 | | |||
Total earning assets | 486,107 | |
| 429,906 | |
| 13 | | |||
Total assets | 678,368 | |
| 607,010 | |
| 12 | | |||
Total deposits | 32,320 | |
| 33,158 | |
| (3 | ) | |||
Allocated capital | 35,000 | |
| 35,000 | |
| - | | |||
|
|
|
|
|
| ||||||
Period end | March 31 |
| December 31 |
| % Change | ||||||
Total trading-related assets | $ | 450,512 | |
| $ | 419,375 | |
| 7 | % | |
Total loans and leases | 75,638 | |
| 76,778 | |
| (1 | ) | |||
Total earning assets | 478,857 | |
| 449,314 | |
| 7 | | |||
Total assets | 648,605 | |
| 629,007 | |
| 3 | | |||
Total deposits | 32,301 | |
| 34,029 | |
| (5 | ) | |||
Global Markets offers sales and trading services and research services to institutional clients across fixed-income, credit, currency, commodity and equity businesses. Global Markets product coverage includes securities and derivative products in both the primary and secondary markets. For more information about Global Markets , see Business Segment Operations in the MD&A of the Corporation's 2017 Annual Report on Form 10-K .
Net income for Global Markets increased $161 million to $1.5 billion for the three months ended March 31, 2018 compared to the same period in 2017 driven by lower tax expense. The impact of the reduction in the federal tax rate was somewhat offset by an increase in U.S. taxes related to our non-U.S. operations under the Tax Act. Pretax results, which remained relatively unchanged, reflected higher revenue, largely offset by higher noninterest expense. Net DVA gains were $64 million compared to losses of $130 million during the same period in 2017 . Excluding net DVA,
net income increased $31 million to $1.4 billion primarily driven by the impact of the Tax Act.
Sales and trading revenue, excluding net DVA, increased $24 million due to higher Equities revenue partially offset by lower Fixed-income, currencies and commodities (FICC) revenue. Noninterest expense increased $61 million to $2.8 billion primarily due to continued investments in technology.
Average assets increased $71.4 billion to $678.4 billion for the three months ended March 31, 2018 primarily driven by growth in client financing activities in the Equities business and increased levels of inventory across the FICC business to facilitate client demand. Total assets increased $19.6 billion in the three months ended March 31, 2018 to $648.6 billion due to increased levels of inventory across the FICC business to facilitate client demand.
The return on average allocated capital was 17 percent , up from 15 percent , reflecting higher net income.
15 Bank of America |
|
|
Sales and Trading Revenue
Revenue from sales and trading services includes unrealized and realized gains and losses on trading and other assets, net interest income, and fees primarily from commissions on equity securities. Revenue from research services is also included in sales and trading revenue. The following table and related discussion present sales and trading revenue, substantially all of which is in Global
Markets, with the remainder in Global Banking . In addition, the following table and related discussion present sales and trading revenue excluding the impact of net DVA, which is a non-GAAP financial measure. We believe the use of this non-GAAP financial measure provides additional useful information to assess the underlying performance of these businesses and to allow better comparison of period-over-period operating performance.
|
|
|
| ||||
Sales and Trading Revenue (1, 2) | |||||||
|
| ||||||
| Three Months Ended March 31 | ||||||
(Dollars in millions) | 2018 |
| 2017 | ||||
Sales and trading revenue |
|
|
| ||||
Fixed-income, currencies and commodities | $ | 2,614 | |
| $ | 2,810 | |
Equities | 1,503 | |
| 1,089 | | ||
Total sales and trading revenue | $ | 4,117 | |
| $ | 3,899 | |
|
|
|
| ||||
Sales and trading revenue, excluding net DVA (3) |
|
|
| ||||
Fixed-income, currencies and commodities | $ | 2,536 | |
| $ | 2,930 | |
Equities | 1,517 | |
| 1,099 | | ||
Total sales and trading revenue, excluding net DVA | $ | 4,053 | |
| $ | 4,029 | |
(1) | Includes FTE adjustments of $67 million and $49 million for the three months ended March 31, 2018 and 2017 . For more information on sales and trading revenue, see Note 3 – Derivatives to the Consolidated Financial Statements . |
(2) | Includes Global Banking sales and trading revenue of $166 million and $58 million for the three months ended March 31, 2018 and 2017 . |
(3) | FICC and Equities sales and trading revenue, excluding net DVA, is a non-GAAP financial measure. FICC net DVA gains were $78 million and losses were $120 million for the three months ended March 31, 2018 and 2017 . Equities net DVA losses were $14 million and $10 million for the three months ended March 31, 2018 and 2017 . |
The following explanations for period-over-period changes in sales and trading, FICC and Equities revenue would be the same whether net DVA was included or excluded. FICC revenue, excluding net DVA, decreased $394 million in the three months ended March 31, 2018 compared to the same period in 2017 , primarily due to lower activity and a less favorable market in credit-related products compared to the same period in 2017 . The decline in FICC revenue
was also impacted by higher funding costs, which were driven by increases in market interest rates. Equities revenue, excluding net DVA, increased $418 million in the three months ended March 31, 2018 compared to the same period in 2017 , driven by increased client activity and a strong trading performance in derivatives in the more volatile market environment.
All Other
|
|
|
|
|
|
| |||||
|
| Three Months Ended March 31 |
|
| |||||||
(Dollars in millions) | 2018 |
| 2017 |
| % Change | ||||||
Net interest income (FTE basis) | $ | 144 | |
| $ | 263 | |
| (45 | )% | |
Noninterest loss | (477 | ) |
| (357 | ) |
| 34 | | |||
Total revenue, net of interest expense (FTE basis) | (333 | ) |
| (94 | ) |
| n/m | | |||
|
|
|
|
|
| ||||||
Provision for credit losses | (152 | ) |
| (26 | ) |
| n/m | | |||
Noninterest expense | 976 | |
| 1,434 | |
| (32 | ) | |||
Loss before income taxes (FTE basis) | (1,157 | ) |
| (1,502 | ) |
| (23 | ) | |||
Income tax benefit (FTE basis) | (871 | ) |
| (1,148 | ) |
| (24 | ) | |||
Net loss | $ | (286 | ) |
| $ | (354 | ) |
| (19 | ) | |
|
|
|
|
|
|
| |||||
Balance Sheet |
|
|
|
|
|
| |||||
|
| Three Months Ended March 31 |
|
| |||||||
Average |
| 2018 |
| 2017 |
| % Change | |||||
Total loans and leases | $ | 67,811 | |
| $ | 94,873 | |
| (29 | )% | |
Total assets (1) | 200,553 | |
| 207,652 | |
| (3 | ) | |||
Total deposits | 23,115 | |
| 25,297 | |
| (9 | ) | |||
|
|
|
|
|
|
| |||||
Period end |
| March 31 |
| December 31 |
| % Change | |||||
Total loans and leases | $ | 64,584 | |
| $ | 69,452 | |
| (7 | )% | |
Total assets (1) | 202,152 | |
| 194,048 | |
| 4 | | |||
Total deposits | 22,106 | |
| 22,719 | |
| (3 | ) | |||
(1) | In segments where the total of liabilities and equity exceeds assets, which are generally deposit-taking segments, we allocate assets from All Other to those segments to match liabilities (i.e., deposits) and allocated shareholders' equity. Average allocated assets were $514.6 billion and $522.0 billion for the three months ended March 31, 2018 and 2017 , and period-end allocated assets were $543.3 billion and $520.4 billion at March 31, 2018 and December 31, 2017 . |
n/m = not meaningful
All Other consists of ALM activities, equity investments, non-core mortgage loans and servicing activities, the net impact of periodic revisions to the MSR valuation model for core and non-core MSRs and the related economic hedge results, liquidating businesses and residual expense allocations. For more information about All Other , see Business Segment Operations in the MD&A of the Corporation's 2017 Annual Report on Form 10-K .
|
| Bank of America 16 |
The Corporation classifies consumer real estate loans as core or non-core based on loan and customer characteristics such as origination date, product type, LTV, FICO score and delinquency status. For more information on the core and non-core portfolios, see Consumer Portfolio Credit Risk Management on page 25 . Residential mortgage loans that are held for ALM purposes, including interest rate or liquidity risk management, are classified as core and are presented on the balance sheet of All Other . For more information on our interest rate and liquidity risk management activities, see Liquidity Risk on page 22 and Interest Rate Risk Management for the Banking Book on page 45 . During the three months ended March 31, 2018 , residential mortgage loans held for ALM activities decreased $1.3 billion to $27.2 billion at March 31, 2018 primarily as a result of payoffs and paydowns. Non-core residential mortgage and home equity loans, which are principally run-off portfolios, including certain loans accounted for under the fair value option and MSRs pertaining to non-core loans serviced for others, are also held in All Other . During the three months ended March 31, 2018 , total non-core loans decreased $3.5 billion to $37.8 billion at March 31, 2018 due primarily to payoffs and paydowns, as well as transfers to loans held-for-sale (LHFS) of $1.1 billion and loan sales of $700 million.
The net loss for All Other improved $68 million to $286 million for the three months ended March 31, 2018 compared to the same period in 2017 , driven by a lower pretax loss, partially offset by a lower income tax benefit due to the impact of the reduction in the federal income tax rate. Pretax results were driven by lower noninterest expense and a higher benefit in the provision for credit losses, partially offset by a decline in revenue.
Revenue decreased $239 million primarily due to the impact of the sale of the non-U.S. consumer credit card business in the second quarter of 2017. Gains on sales of loans included in noninterest loss, including nonperforming and other delinquent loans, were $37 million for the three months ended March 31, 2018 compared to gains of $17 million in the same period in 2017 .
The provision for credit losses improved $126 million to a benefit of $152 million primarily driven by continued runoff of the non-core portfolio.
Noninterest expense decreased $458 million to $976 million driven by lower litigation expense, lower operating costs due to the sale of the non-U.S. consumer credit card business and a decline in non-core mortgage servicing costs.
The income tax benefit was $871 million for the three months ended March 31, 2018 compared to a benefit of $1.1 billion in the same period in 2017 . The change was driven by the lower federal tax rate in effect in 2018 and the change in the pretax loss. Both periods include income tax benefit adjustments to eliminate the FTE treatment of certain tax credits recorded in Global Banking .
Off-Balance Sheet Arrangements and Contractual Obligations
We have contractual obligations to make future payments on debt and lease agreements. Additionally, in the normal course of business, we enter into contractual arrangements whereby we commit to future purchases of products or services from unaffiliated parties. For more information on obligations and commitments, see Note 10 – Commitments and Contingencies to
the Consolidated Financial Statements herein, Off-Balance Sheet Arrangements and Contractual Obligations in the MD&A of the Corporation's 2017 Annual Report on Form 10-K , as well as Note 11 – Long-term Debt and Note 12 – Commitments and Contingencies to the Consolidated Financial Statements of the Corporation's 2017 Annual Report on Form 10-K .
Representations and Warranties
For information on representations and warranties, see Note 7 – Representations and Warranties Obligations and Corporate Guarantees to the Consolidated Financial Statements of the Corporation's 2017 Annual Report on Form 10-K and Representations and Warranties in Note 10 – Commitments and Contingencies to the Consolidated Financial Statements herein. For more information related to the sensitivity of the assumptions used to estimate our reserve for representations and warranties, see Complex Accounting Estimates – Representations and Warranties Liability in the MD&A of the Corporation's 2017 Annual Report on Form 10-K .
Other Mortgage-related Matters
For more information on other mortgage-related matters, see Off-Balance Sheet Arrangements and Contractual Obligations – Other Mortgage-related Matters in the MD&A of the Corporation's 2017 Annual Report on Form 10-K .
Managing Risk
Risk is inherent in all our business activities. The seven key types of risk faced by the Corporation are strategic, credit, market, liquidity, compliance, operational and reputational risks. Sound risk management enables us to serve our customers and deliver for our shareholders. If not managed well, risks can result in financial loss, regulatory sanctions and penalties, and damage to our reputation, each of which may adversely impact our ability to execute our business strategies. The Corporation takes a comprehensive approach to risk management with a defined Risk Framework and an articulated Risk Appetite Statement which are approved annually by the Enterprise Risk Committee and the Board.
Our Risk Framework is the foundation for comprehensive management of the risks facing the Corporation. The Risk Framework sets forth clear roles, responsibilities and accountability for the management of risk and provides a blueprint for how the Board, through delegation of authority to committees and executive officers, establishes risk appetite and associated limits for our activities.
Our Risk Appetite Statement is intended to ensure that the Corporation maintains an acceptable risk profile by providing a common framework and a comparable set of measures for senior management and the Board to clearly indicate the level of risk the Corporation is willing to accept. Risk appetite is set at least annually and is aligned with the Corporation's strategic, capital and financial operating plans. Our line of business strategies and risk appetite are also similarly aligned.
For more information on our risk management activities, including our Risk Framework, and the key types of risk faced by the Corporation, see the Managing Risk through Reputational Risk sections in the MD&A of the Corporation's 2017 Annual Report on Form 10-K .
17 Bank of America |
|
|
Capital Management
The Corporation manages its capital position so its capital is more than adequate to support its business activities and to maintain capital, risk and risk appetite commensurate with one another. Additionally, we seek to maintain safety and soundness at all times, even under adverse scenarios, take advantage of organic growth opportunities, meet obligations to creditors and counterparties, maintain ready access to financial markets, continue to serve as a credit intermediary, remain a source of strength for our subsidiaries, and satisfy current and future regulatory capital requirements. Capital management is integrated into our risk and governance processes, as capital is a key consideration in the development of our strategic plan, risk appetite and risk limits.
We periodically review capital allocated to our businesses and allocate capital annually during the strategic and capital planning processes. For more information, see Business Segment Operations on page 9 .
CCAR and Capital Planning
The Federal Reserve requires BHCs to submit a capital plan and requests for capital actions on an annual basis, consistent with the rules governing the CCAR capital plan.
On June 28, 2017, following the Federal Reserve's non-objection to our 2017 CCAR capital plan, the Board authorized the repurchase of $ 12.0 billion in common stock from July 1, 2017 through June 30, 2018, plus repurchases expected to be approximately $900 million to offset the effect of equity-based compensation plans during the same period. On December 5, 2017, following approval by the Federal Reserve, the Board authorized the repurchase of an additional $5.0 billion of common stock through June 30, 2018. The common stock repurchase authorizations include both common stock and warrants. At March 31, 2018, our remaining stock repurchase authorization was $5.2 billion .
The timing and amount of common stock repurchases will be subject to various factors, including the Corporation's capital position, liquidity, financial performance and alternative uses of capital, stock trading price, and general market conditions, and may be suspended at any time. The common stock repurchases may be effected through open market purchases or privately negotiated transactions, including repurchase plans that satisfy the conditions of Rule 10b5-1 of the Securities Exchange Act of 1934. As a "well-capitalized" BHC, we may notify the Federal Reserve of our intention to make additional capital distributions not to exceed 0.25 percent of Tier 1 capital, and which were not contemplated in our capital plan, subject to the Federal Reserve's non-objection.
In April 2018, we submitted our 2018 CCAR capital plan and related supervisory stress tests. The Federal Reserve has announced that it will release CCAR capital plan summary results, including supervisory projections of capital ratios, losses and revenues under stress scenarios, and publish the results of stress tests conducted under the supervisory adverse and supervisory severely adverse scenarios by June 30, 2018.
Regulatory Capital
As a financial services holding company, we are subject to regulatory capital rules issued by U.S. banking regulators including Basel 3, which includes certain transition provisions through January 1, 2019. Under the Basel 3 regulatory capital transition provisions, certain deductions and adjustments to Common equity tier 1 capital were phased in through January 1, 2018. The Corporation and its primary affiliated banking entity, BANA, are Basel 3 Advanced approaches institutions and are required to report regulatory risk-based capital ratios and risk-weighted assets under both the Standardized and Advanced approaches. The approach that yields the lower ratio is used to assess capital adequacy including under the Prompt Corrective Action (PCA) framework and for the Corporation was the Advanced approaches method for both periods presented. For more information on Basel 3, see Capital Management in the MD&A of the Corporation's 2017 Annual Report on Form 10-K .
Minimum Capital Requirements
Minimum capital requirements and related buffers are being phased in from January 1, 2014 through January 1, 2019. The PCA framework establishes categories of capitalization including "well capitalized," based on the Basel 3 regulatory ratio requirements. U.S. banking regulators are required to take certain mandatory actions depending on the category of capitalization, with no mandatory actions required for "well-capitalized" banking organizations, which included BANA at March 31, 2018 .
We are subject to a capital conservation buffer, a countercyclical capital buffer and a global systemically important bank (G-SIB) surcharge that are being phased in over a three-year period ending January 1, 2019. Once fully phased-in, the Corporation's risk-based capital ratio requirements will include a capital conservation buffer greater than 2.5 percent, plus any applicable countercyclical capital buffer and a G-SIB surcharge in order to avoid restrictions on capital distributions and discretionary bonus payments. The buffers and surcharge must be comprised solely of Common equity tier 1 capital. Under the phase-in provisions, we are required to maintain a capital conservation buffer greater than 1.875 percent plus a G-SIB surcharge of 1.875 percent in 2018 . The countercyclical capital buffer is currently set at zero. We estimate that our fully phased-in G-SIB surcharge will
be 2.5 percent. The G-SIB surcharge may differ from this estimate over time. For more information on the Corporation's capital ratios and regulatory requirements, see Table 8 .
Supplementary Leverage Ratio
Effective January 1, 2018, the Corporation is required to maintain a minimum supplementary leverage ratio (SLR) of 3.0 percent plus a leverage buffer of 2.0 percent in order to avoid certain restrictions on capital distributions and discretionary bonus payments. Insured depository institution subsidiaries of BHCs are required to maintain a minimum 6.0 percent SLR to be considered "well capitalized" under the PCA framework. The numerator of the SLR is quarter-end Basel 3 Tier 1 capital. The denominator is total leverage exposure based on the daily average of the sum of on-balance sheet exposures less permitted Tier 1 deductions, as well as the simple average of certain off-balance sheet exposures, as of the end of each month in a quarter.
|
| Bank of America 18 |
Capital Composition and Ratios
Table 8 presents Bank of America Corporation's capital ratios and related information in accordance with Basel 3 Standardized and Advanced approaches as measured at March 31, 2018 and December 31, 2017 . As of March 31, 2018 and December 31, 2017 , the Corporation met the definition of "well capitalized" under current regulatory requirements.
|
|
|
|
|
|
|
|
| ||||||
Table 8 | Bank of America Corporation Regulatory Capital under Basel 3 (1) |
|
|
|
| |||||||||
|
|
| ||||||||||||
| Standardized |
| Advanced |
| Current Regulatory Minimum (2) |
| 2019 Regulatory Minimum (3) | |||||||
(Dollars in millions, except as noted) | March 31, 2018 | |||||||||||||
Risk-based capital metrics: |
|
|
|
|
|
|
| |||||||
Common equity tier 1 capital | $ | 164,828 | |
| $ | 164,828 | |
|
|
|
| |||
Tier 1 capital | 188,900 | |
| 188,900 | |
|
|
|
| |||||
Total capital (4) | 223,772 | |
| 215,261 | |
|
|
|
| |||||
Risk-weighted assets (in billions) | 1,452 | |
| 1,458 | |
|
|
|
| |||||
Common equity tier 1 capital ratio | 11.4 | % |
| 11.3 | % |
| 8.25 | % |
| 9.5 | % | |||
Tier 1 capital ratio | 13.0 | |
| 13.0 | |
| 9.75 | |
| 11.0 | | |||
Total capital ratio | 15.4 | |
| 14.8 | |
| 11.75 | |
| 13.0 | | |||
|
|
|
|
|
|
|
|
| ||||||
Leverage-based metrics: |
|
|
|
|
|
|
| |||||||
Adjusted quarterly average assets (in billions) (5) | $ | 2,247 | |
| $ | 2,247 | |
|
|
|
| |||
Tier 1 leverage ratio | 8.4 | % |
| 8.4 | % |
| 4.0 | |
| 4.0 | | |||
|
|
|
|
|
|
|
| |||||||
SLR leverage exposure (in billions) |
|
| $ | 2,794 | |
|
|
|
| |||||
SLR |
|
| 6.8 | % |
| 5.0 | |
| 5.0 | | ||||
|
|
|
|
|
|
|
|
| ||||||
|
| December 31, 2017 | ||||||||||||
Risk-based capital metrics: |
|
|
|
|
|
|
| |||||||
Common equity tier 1 capital | $ | 168,461 | |
| $ | 168,461 | |
|
|
|
| |||
Tier 1 capital | 190,189 | |
| 190,189 | |
|
|
|
| |||||
Total capital (4) | 224,209 | |
| 215,311 | |
|
|
|
| |||||
Risk-weighted assets (in billions) | 1,443 | |
| 1,459 | |
|
|
|
| |||||
Common equity tier 1 capital ratio | 11.7 | % |
| 11.5 | % |
| 7.25 | % |
| 9.5 | % | |||
Tier 1 capital ratio | 13.2 | |
| 13.0 | |
| 8.75 | |
| 11.0 | | |||
Total capital ratio | 15.5 | |
| 14.8 | |
| 10.75 | |
| 13.0 | | |||
|
|
|
|
|
|
|
|
| ||||||
Leverage-based metrics: |
|
|
|
|
|
|
| |||||||
Adjusted quarterly average assets (in billions) (5) | $ | 2,223 | |
| $ | 2,223 | |
|
|
|
| |||
Tier 1 leverage ratio | 8.6 | % |
| 8.6 | % |
| 4.0 | |
| 4.0 | | |||
|
|
|
|
|
|
|
|
| ||||||
SLR leverage exposure (in billions) |
|
| $ | 2,756 | |
|
|
|
| |||||
SLR |
|
| 6.9 | % |
|
|
| 5.0 | | |||||
(1) | Basel 3 transition provisions for regulatory capital adjustments and deductions were fully phased-in as of January 1, 2018. Prior periods are presented on a fully phased-in basis. |
(2) | The March 31, 2018 and December 31, 2017 amounts include a transition capital conservation buffer of 1.875 percent and 1.25 percent and a transition G-SIB surcharge of 1.875 percent and 1.5 percent . The countercyclical capital buffer for both periods is zero . |
(3) | The 2019 regulatory minimums assume a capital conservation buffer of 2.5 percent and G-SIB surcharge of 2.5 percent . The countercyclical capital buffer is zero . We will be subject to regulatory minimums on January 1, 2019. The SLR minimum includes a leverage buffer of 2.0 percent and is applicable beginning on January 1, 2018. |
(4) | Total capital under the Advanced approaches differs from the Standardized approach due to differences in the amount permitted in Tier 2 capital related to the qualifying allowance for credit losses. |
(5) | Reflects adjusted average total assets for the three months ended March 31, 2018 and December 31, 2017 . |
19 Bank of America |
|
|
Common equity tier 1 capital under Basel 3 Advanced approaches was $164.8 billion at March 31, 2018 , a decrease of $3.6 billion compared to December 31, 2017 driven by common stock repurchases, market value declines included in accumulated other comprehensive income (OCI) and dividends, partially offset by earnings. During the three months ended March 31, 2018 , total capital and risk-weighted assets remained relatively unchanged. Table 9 shows the capital composition as measured under Basel 3 Advanced approaches at March 31, 2018 and December 31, 2017 .
|
|
|
|
| ||||
Table 9 | Capital Composition under Basel 3 (1) |
|
|
| ||||
|
|
|
|
| ||||
(Dollars in millions) | March 31 |
| December 31 | |||||
Total common shareholders' equity | $ | 241,552 | |
| $ | 244,823 | | |
Goodwill | (68,576 | ) |
| (68,576 | ) | |||
Deferred tax assets arising from net operating loss and tax credit carryforwards | (6,755 | ) |
| (6,555 | ) | |||
Adjustments for amounts recorded in accumulated OCI attributed to certain cash flow hedges | 1,260 | |
| 831 | | |||
Intangibles, other than mortgage servicing rights and goodwill | (1,632 | ) |
| (1,743 | ) | |||
Defined benefit pension fund assets | (1,189 | ) |
| (1,138 | ) | |||
DVA related to liabilities and derivatives | 580 | |
| 1,196 | | |||
Other | (412 | ) |
| (377 | ) | |||
Common equity tier 1 capital | 164,828 | |
| 168,461 | | |||
Qualifying preferred stock, net of issuance cost | 24,672 | |
| 22,323 | | |||
Other | (600 | ) |
| (595 | ) | |||
Total Tier 1 capital | 188,900 | |
| 190,189 | | |||
Tier 2 capital instruments | 23,914 | |
| 22,938 | | |||
Eligible credit reserves included in Tier 2 capital | 2,531 | |
| 2,272 | | |||
Other | (84 | ) |
| (88 | ) | |||
Total Basel 3 Capital | $ | 215,261 | |
| $ | 215,311 | | |
(1) | Basel 3 transition provisions for regulatory capital adjustments and deductions were fully phased-in as of January 1, 2018. Prior periods are presented on a fully phased-in basis. |
Table 10 shows the components of risk-weighted assets as measured under Basel 3 at March 31, 2018 and December 31, 2017 .
|
|
|
|
|
|
|
|
| ||||||||
Table 10 | Risk-weighted Assets under Basel 3 (1) |
|
|
|
|
|
|
| ||||||||
|
|
|
|
|
|
|
|
| ||||||||
| Standardized Approach |
| Advanced Approaches |
| Standardized Approach |
| Advanced Approaches | |||||||||
(Dollars in billions) | March 31, 2018 |
| December 31, 2017 | |||||||||||||
Credit risk | $ | 1,391 | |
| $ | 862 | |
| $ | 1,384 | |
| $ | 867 | | |
Market risk | 61 | |
| 61 | |
| 59 | |
| 58 | | |||||
Operational risk | n/a | |
| 500 | |
| n/a | |
| 500 | | |||||
Risks related to credit valuation adjustments | n/a | |
| 35 | |
| n/a | |
| 34 | | |||||
Total risk-weighted assets | $ | 1,452 | |
| $ | 1,458 | |
| $ | 1,443 | |
| $ | 1,459 | | |
(1) | Basel 3 transition provisions for regulatory capital adjustments and deductions were fully phased-in as of January 1, 2018. Prior periods are presented on a fully phased-in basis. |
n/a = not applicable
Bank of America, N.A. Regulatory Capital
Table 11 presents regulatory capital information for BANA in accordance with Basel 3 Standardized and Advanced approaches as measured at March 31, 2018 and December 31, 2017 . BANA met the definition of "well capitalized" under the PCA framework for both periods.
|
|
|
|
|
|
|
|
|
|
| |||||||
Table 11 | Bank of America, N.A. Regulatory Capital under Basel 3 |
|
| ||||||||||||||
|
|
|
|
|
|
|
|
|
|
| |||||||
|
| Standardized Approach |
| Advanced Approaches |
|
| |||||||||||
| Ratio |
| Amount |
| Ratio |
| Amount |
| Minimum | ||||||||
(Dollars in millions) | March 31, 2018 | ||||||||||||||||
Common equity tier 1 capital | 12.2 | % |
| $ | 147,645 | |
| 14.7 | % |
| $ | 147,645 | |
| 6.5 | % | |
Tier 1 capital | 12.2 | |
| 147,645 | |
| 14.7 | |
| 147,645 | |
| 8.0 | | |||
Total capital | 13.3 | |
| 160,158 | |
| 15.1 | |
| 151,968 | |
| 10.0 | | |||
Tier 1 leverage | 8.8 | |
| 147,645 | |
| 8.8 | |
| 147,645 | |
| 5.0 | | |||
|
|
|
|
|
|
|
|
|
|
| |||||||
SLR leverage exposure (in billions) |
|
|
|
|
|
| $ | 2,088 | |
|
| ||||||
SLR |
|
|
|
|
|
| 7.1 | % |
| 6.0 | | ||||||
|
|
|
|
|
|
|
|
|
|
| |||||||
|
| December 31, 2017 | |||||||||||||||
Common equity tier 1 capital | 12.5 | % |
| $ | 150,552 | |
| 14.9 | % |
| $ | 150,552 | |
| 6.5 | % | |
Tier 1 capital | 12.5 | |
| 150,552 | |
| 14.9 | |
| 150,552 | |
| 8.0 | | |||
Total capital | 13.6 | |
| 163,243 | |
| 15.4 | |
| 154,675 | |
| 10.0 | | |||
Tier 1 leverage | 9.0 | |
| 150,552 | |
| 9.0 | |
| 150,552 | |
| 5.0 | | |||
(1) | Percent required to meet guidelines to be considered "well capitalized" under the PCA framework. |
|
| Bank of America 20 |
Regulatory Developments
The following supplements the disclosure in Capital Management – Regulatory Developments in the MD&A of the Corporation's 2017 Annual Report on Form 10-K .
Minimum Total Loss-Absorbing Capacity
The Federal Reserve's final rule, which is effective January 1, 2019, includes minimum external total loss-absorbing capacity (TLAC) and long-term debt requirements to improve the resolvability and resiliency of large, interconnected BHCs. As of March 31, 2018 , the Corporation's TLAC and long-term debt exceeded our estimated 2019 minimum requirements.
Stress Buffer Requirements
On April 10, 2018, the Federal Reserve announced a proposal to integrate the annual quantitative assessment of the CCAR program with the buffer requirements in the Basel 3 capital rule by introducing stress buffer requirements as a replacement of the CCAR quantitative objection. Under the Standardized approach, the proposal replaces the existing static 2.5 percent capital conservation buffer with a stress capital buffer, calculated as the decrease in the Common equity tier 1 capital ratio in the supervisory severely adverse scenario of the modified CCAR stress test plus four quarters of planned common stock dividend payments, floored at 2.5 percent. The static 2.5 percent capital conservation buffer would be retained under the Advanced approaches. The proposal also introduces a stress leverage buffer requirement which would be calculated as the decrease in the Tier 1 leverage ratio in the supervisory severely adverse scenario of the modified CCAR stress test plus four quarters of planned common stock dividends, with no floor. The SLR would not incorporate a stress buffer requirement. The proposal also updates the capital distribution assumptions used in the CCAR stress test to better align with a firm's expected actions in stress, notably removing the assumption that a BHC will carry out all of its planned capital actions under stress. If finalized, the proposal would be effective December 31, 2018, with the first stress buffer requirements generally becoming effective on October 1, 2019.
Enhanced Supplementary Leverage Ratio Requirements
On April 11, 2018, the Federal Reserve and OCC announced a proposal to modify the enhanced SLR standards applicable to U.S. G-SIBs and their insured depository institution subsidiaries. The proposal replaces the existing 2.0 percent leverage buffer with a leverage buffer tailored to each G-SIB, set at 50 percent of the applicable GSIB surcharge. This proposal also replaces the current 6.0 percent threshold at which a G-SIB's insured depository institution subsidiaries are considered "well capitalized" under the PCA framework with a threshold set at 3.0 percent plus 50 percent of the G-SIB surcharge applicable to the subsidiary's G-SIB holding company. Correspondingly, the proposal updates the external TLAC leverage buffer for each G-SIB to 50 percent of the applicable G-SIB surcharge and revises the leverage component of the minimum long-term debt requirements to be 2.5 percent plus 50 percent of the applicable G-SIB surcharge.
Revisions to Basel 3 to Address Current Expected Credit Loss Accounting
On April 13, 2018, the U.S. banking regulators announced a proposal to address the regulatory capital impact of using the current expected credit loss methodology to measure credit reserves under a new accounting standard which is effective on January 1, 2020. For more information on this standard, see Note 1 – Summary of Significant Accounting Principles to the Consolidated Financial Statements . The proposal provides an option to phase-in the impact to regulatory capital over a three-year period on a straight-line basis. It also updates the existing regulatory capital framework by creating a new defined term, allowance for credit losses (ACL), which would include credit losses on all financial instruments measured at amortized cost with the exception of purchased credit-impaired assets. The proposal continues to allow a limited amount of credit losses to be recognized in Tier 2 capital and maintains the existing limits under the Standardized and Advanced approaches.
Broker-dealer Regulatory Capital and Securities Regulation
The Corporation's principal U.S. broker-dealer subsidiaries are Merrill Lynch, Pierce, Fenner & Smith Incorporated (MLPF&S) and Merrill Lynch Professional Clearing Corp (MLPCC). MLPCC is a fully-guaranteed subsidiary of MLPF&S and provides clearing and settlement services. Both entities are subject to the net capital requirements of Securities and Exchange Commission (SEC) Rule 15c3-1. Both entities are also registered as futures commission merchants and are subject to the Commodity Futures Trading Commission Regulation 1.17.
MLPF&S has elected to compute the minimum capital requirement in accordance with the Alternative Net Capital Requirement as permitted by SEC Rule 15c3-1. At March 31, 2018 , MLPF&S's regulatory net capital as defined by Rule 15c3-1 was $12.3 billion and exceeded the minimum requirement of $1.7 billion by $10.6 billion. MLPCC's net capital of $4.5 billion exceeded the minimum requirement of $539 million by $4.0 billion.
In accordance with the Alternative Net Capital Requirements, MLPF&S is required to maintain tentative net capital in excess of $1.0 billion, net capital in excess of $500 million and notify the SEC in the event its tentative net capital is less than $5.0 billion. At March 31, 2018 , MLPF&S had tentative net capital and net capital in excess of the minimum and notification requirements.
Merrill Lynch International (MLI), a U.K. investment firm, is regulated by the Prudential Regulation Authority and the Financial Conduct Authority, and is subject to certain regulatory capital requirements. At March 31, 2018 , MLI's capital resources were $35.1 billion, which exceeded the minimum Pillar 1 requirement of $17.7 billion.
21 Bank of America |
|
|
Common and Preferred Stock Dividends
Table 12 is a summary of our cash dividend declarations on preferred stock during the first quarter of 2018 and through April 30, 2018 . During the first quarter of 2018 , we declared $428 million of cash dividends on preferred stock. For more information on preferred stock and a summary of our declared quarterly cash dividends on common stock, see Note 11 – Shareholders' Equity to the Consolidated Financial Statements .
|
|
|
|
|
|
|
|
|
|
|
|
|
|
| |||||
Table 12 | Preferred Stock Cash Dividend Summary |
|
|
|
|
|
| ||||||||||||
|
|
|
|
|
|
|
|
|
|
|
|
|
|
| |||||
|
| March 31, 2018 |
|
|
|
|
|
|
|
|
|
| |||||||
Preferred Stock |
| Outstanding (in millions) |
|
| Declaration Date |
| Record Date |
| Payment Date |
| Per Annum Dividend Rate |
| Dividend Per Share | ||||||
Series B (1) |
|
| $ | 1 | |
|
| April 25, 2018 |
| July 11, 2018 |
| July 25, 2018 |
| 7.00 | % |
| $ | 1.75 | |
|
|
|
|
|
| January 31, 2018 |
| April 11, 2018 |
| April 25, 2018 |
| 7.00 | |
| 1.75 | | |||
Series D (2) |
|
| $ | 654 | |
|
| April 13, 2018 |
| May 31, 2018 |
| June 14, 2018 |
| 6.204 | % |
| $ | 0.38775 | |
|
|
|
|
|
| January 8, 2018 |
| February 28, 2018 |
| March 14, 2018 |
| 6.204 | |
| 0.38775 | | |||
Series E (2) |
|
| $ | 317 | |
|
| April 13, 2018 |
| April 30, 2018 |
| May 15, 2018 |
| Floating | |
| $ | 0.24722 | |
|
|
|
|
|
| January 8, 2018 |
| January 31, 2018 |
| February 15, 2018 |
| Floating | |
| 0.25556 | | |||
Series F |
|
| $ | 141 | |
|
| April 13, 2018 |
| May 31, 2018 |
| June 15, 2018 |
| Floating | |
| $ | 1,022.22222 | |
|
|
|
|
|
| January 8, 2018 |
| February 28, 2018 |
| March 15, 2018 |
| Floating | |
| 1,000.00 | | |||
Series G |
|
| $ | 493 | |
|
| April 13, 2018 |
| May 31, 2018 |
| June 15, 2018 |
| Adjustable | |
| $ | 1,022.22222 | |
|
|
|
|
|
| January 8, 2018 |
| February 28, 2018 |
| March 15, 2018 |
| Adjustable | |
| 1,000.00 | | |||
Series I (2) |
|
| $ | 365 | |
|
| April 13, 2018 |
| June 15, 2018 |
| July 2, 2018 |
| 6.625 | % |
| $ | 0.4140625 | |
|
|
|
|
|
| January 8, 2018 |
| March 15, 2018 |
| April 2, 2018 |
| 6.625 | |
| 0.4140625 | | |||
Series K (3, 4) |
|
| $ | 1,544 | |
|
| April 13, 2018 |
| April 15, 2018 |
| April 30, 2018 |
| Fixed-to-floating | |
| $ | 13.49225 | |
|
|
|
|
|
| January 8, 2018 |
| January 15, 2018 |
| January 30, 2018 |
| Fixed-to-floating | |
| 40.00 | | |||
Series L |
|
| $ | 3,080 | |
|
| March 20, 2018 |
| April 1, 2018 |
| April 30, 2018 |
| 7.25 | % |
| $ | 18.125 | |
Series M (3, 4) |
|
| $ | 1,310 | |
|
| April 13, 2018 |
| April 30, 2018 |
| May 15, 2018 |
| Fixed-to-floating | |
| $ | 40.625 | |
Series T (5) |
|
| $ | 35 | |
|
| April 25, 2018 |
| June 25, 2018 |
| July 10, 2018 |
| 6.00 | % |
| $ | 1,500.00 | |
|
|
|
|
|
| January 31, 2018 |
| March 26, 2018 |
| April 10, 2018 |
| 6.00 | |
| 1,500.00 | | |||
Series U (3, 4) |
|
| $ | 1,000 | |
|
| April 13, 2018 |
| May 15, 2018 |
| June 1, 2018 |
| Fixed-to-floating | |
| $ | 26.00 | |
Series V (3, 4) |
|
| $ | 1,500 | |
|
| April 13, 2018 |
| June 1, 2018 |
| June 18, 2018 |
| Fixed-to-floating | |
| $ | 25.625 | |
Series W (2) |
|
| $ | 1,100 | |
|
| April 13, 2018 |
| May 15, 2018 |
| June 11, 2018 |
| 6.625 | % |
| $ | 0.4140625 | |
|
|
|
|
|
| January 8, 2018 |
| February 15, 2018 |
| March 9, 2018 |
| 6.625 | |
| 0.4140625 | | |||
Series X (3, 4) |
|
| $ | 2,000 | |
|
| January 8, 2018 |
| February 15, 2018 |
| March 5, 2018 |
| Fixed-to-floating | |
| $ | 31.25 | |
Series Y (2) |
|
| $ | 1,100 | |
|
| March 20, 2018 |
| April 1, 2018 |
| April 27, 2018 |
| 6.50 | % |
| $ | 0.40625 | |
Series Z (3,4) |
|
| $ | 1,400 | |
|
| March 20, 2018 |
| April 1, 2018 |
| April 23, 2018 |
| Fixed-to-floating | |
| $ | 32.50 | |
Series AA (3, 4) |
|
| $ | 1,900 | |
|
| January 8, 2018 |
| March 1, 2018 |
| March 19, 2018 |
| Fixed-to-floating | |
| $ | 30.50 | |
Series CC (2) |
|
| $ | 1,100 | |
|
| March 20, 2018 |
| April 1, 2018 |
| April 30, 2018 |
| 6.20 | % |
| $ | 0.3875 | |
Series DD (3, 4) |
|
| $ | 1,000 | |
|
| January 8, 2018 |
| February 15, 2018 |
| March 12, 2018 |
| Fixed-to-floating | |
| $ | 31.50 | |
Series EE (2) |
|
| $ | 900 | |
|
| March 20, 2018 |
| April 1, 2018 |
| April 25, 2018 |
| 6.00 | % |
| $ | 0.375 | |
Series 1 (6) |
|
| $ | 98 | |
|
| April 13, 2018 |
| May 15, 2018 |
| May 29, 2018 |
| Floating | |
| $ | 0.18750 | |
|
|
|
|
|
| January 8, 2018 |
| February 15, 2018 |
| February 28, 2018 |
| Floating | |
| 0.18750 | | |||
Series 2 (6) |
|
| $ | 299 | |
|
| April 13, 2018 |
| May 15, 2018 |
| May 29, 2018 |
| Floating | |
| $ | 0.18542 | |
|
|
|
|
|
| January 8, 2018 |
| February 15, 2018 |
| February 28, 2018 |
| Floating | |
| 0.19167 | | |||
Series 3 (6) |
|
| $ | 653 | |
|
| April 13, 2018 |
| May 15, 2018 |
| May 29, 2018 |
| 6.375 | % |
| $ | 0.3984375 | |
|
|
|
| |
|
| January 8, 2018 |
| February 15, 2018 |
| February 28, 2018 |
| 6.375 | |
| 0.3984375 | | ||
Series 4 (6) |
|
| $ | 210 | |
|
| April 13, 2018 |
| May 15, 2018 |
| May 29, 2018 |
| Floating | |
| $ | 0.24722 | |
|
|
|
|
|
| January 8, 2018 |
| February 15, 2018 |
| February 28, 2018 |
| Floating | |
| 0.25556 | | |||
Series 5 (6) |
|
| $ | 422 | |
|
| April 13, 2018 |
| May 1, 2018 |
| May 21, 2018 |
| Floating | |
| $ | 0.24722 | |
|
|
|
|
|
| January 8, 2018 |
| February 1, 2018 |
| February 21, 2018 |
| Floating | |
| 0.25556 | | |||
(1) | Dividends are cumulative. |
(2) | Dividends per depositary share, each representing a 1/1,000 th interest in a share of preferred stock. |
(3) | Initially pays dividends semi-annually. |
(4) | Dividends per depositary share, each representing a 1/25 th interest in a share of preferred stock. |
(5) | Represents shares that were not surrendered when the holders of Series T preferred stock exercised warrants to acquire common stock in the third quarter of 2017. |
(6) | Dividends per depositary share, each representing a 1/1,200 th interest in a share of preferred stock. |
Liquidity Risk
Funding and Liquidity Risk Management
Our primary liquidity risk management objective is to meet expected or unexpected cash flow and collateral needs while continuing to support our businesses and customers under a range of economic conditions. To achieve that objective, we analyze and monitor our liquidity risk under expected and stressed conditions, maintain liquidity and access to diverse funding sources, including our stable deposit base, and seek to align liquidity-related incentives and risks.
We define liquidity as readily available assets, limited to cash and high-quality, liquid, unencumbered securities that we can use
to meet our contractual and contingent financial obligations as those obligations arise. We manage our liquidity position through line of business and ALM activities, as well as through our legal entity funding strategy, on both a forward and current (including intraday) basis under both expected and stressed conditions. We believe that a centralized approach to funding and liquidity management enhances our ability to monitor liquidity requirements, maximizes access to funding sources, minimizes borrowing costs and facilitates timely responses to liquidity events. For more information regarding global funding and liquidity risk management, see Liquidity Risk – Funding and Liquidity Risk Management in the MD&A of the Corporation's 2017 Annual Report on Form 10-K .
|
| Bank of America 22 |
NB Holdings Corporation
We have intercompany arrangements with certain key subsidiaries under which we transferred certain of our parent company assets, and agreed to transfer certain additional parent company assets not needed to satisfy anticipated near-term expenditures, to NB Holdings Corporation, a wholly-owned holding company subsidiary (NB Holdings). The parent company is expected to continue to have access to the same flow of dividends, interest and other amounts of cash necessary to service its debt, pay dividends and perform other obligations as it would have had if it had not entered into these arrangements and transferred any assets. These arrangements support our preferred single point of entry resolution strategy, under which only the parent company would be resolved under the U.S. Bankruptcy Code. For more information on these arrangements, see Liquidity Risk – NB Holdings Corporation in the MD&A of the Corporation's 2017 Annual Report on Form 10-K .
Global Liquidity Sources and Other Unencumbered Assets
We maintain liquidity available to the Corporation, including the parent company and selected subsidiaries, in the form of cash and high-quality, liquid, unencumbered securities. For more information on our liquidity sources, see Liquidity Risk – Global Liquidity Sources and Other Unencumbered Assets in the MD&A of the Corporation's 2017 Annual Report on Form 10-K .
|
|
|
|
| ||||
Table 13 | Average Global Liquidity Sources | |||||||
|
|
|
|
| ||||
|
| Three Months Ended | ||||||
(Dollars in billions) | March 31 |
| December 31 | |||||
Parent company and NB Holdings | $ | 77 | |
| $ | 79 | | |
Bank subsidiaries | 396 | |
| 394 | | |||
Other regulated entities | 49 | |
| 49 | | |||
Total Average Global Liquidity Sources | $ | 522 | |
| $ | 522 | | |
Parent company and NB Holdings average liquidity was $77 billion and $79 billion for the three months ended March 31, 2018 and December 31, 2017 . Typically, parent company and NB Holdings liquidity is in the form of cash deposited with BANA.
Average liquidity held at our bank subsidiaries was $396 billion and $394 billion for the three months ended March 31, 2018 and December 31, 2017 . Our bank subsidiaries' liquidity is primarily driven by deposit and lending activity, as well as securities valuation and net debt activity. Liquidity at bank subsidiaries excludes the cash deposited by the parent company and NB Holdings. Our bank subsidiaries can also generate incremental liquidity by pledging a range of unencumbered loans and securities to certain Federal Home Loan Banks (FHLBs) and the Federal Reserve Discount Window. The cash we could have obtained by borrowing against this pool of specifically-identified eligible assets was $308 billion at both March 31, 2018 and December 31, 2017 . We have established operational procedures to enable us to borrow against these assets, including regularly monitoring our total pool of eligible loans and securities collateral. Eligibility is defined in guidelines from the FHLBs and the Federal Reserve and is subject to change at their discretion. Due to regulatory restrictions, liquidity generated by the bank subsidiaries can generally be used only to fund obligations within the bank subsidiaries, and transfers to the parent company or nonbank subsidiaries may be subject to prior regulatory approval.
Average liquidity held at our other regulated entities, comprised primarily of broker-dealer subsidiaries, was $49 billion for both the three months ended March 31, 2018 and December 31, 2017 . Our other regulated entities also held unencumbered investment-
grade securities and equities that we believe could be used to generate additional liquidity. Liquidity held in an other regulated entity is primarily available to meet the obligations of that entity and transfers to the parent company or to any other subsidiary may be subject to prior regulatory approval due to regulatory restrictions and minimum requirements.
Table 14 presents the composition of average global liquidity sources (GLS) for the three months ended March 31, 2018 and December 31, 2017 .
|
|
|
|
| ||||
Table 14 | Average Global Liquidity Sources Composition | |||||||
|
|
| ||||||
|
| Three Months Ended | ||||||
(Dollars in billions) | March 31 |
| December 31 | |||||
Cash on deposit | $ | 128 | |
| $ | 118 | | |
U.S. Treasury securities | 64 | |
| 62 | | |||
U.S. agency securities and mortgage-backed securities | 320 | |
| 330 | | |||
Non-U.S. government securities | 10 | |
| 12 | | |||
Total Average Global Liquidity Sources | $ | 522 | |
| $ | 522 | | |
Our GLS are substantially the same in composition to what qualifies as High Quality Liquid Assets (HQLA) under the final U.S. Liquidity Coverage Ratio (LCR) rules. However, HQLA for purposes of calculating LCR is not reported at market value, but at a lower value that incorporates regulatory deductions and the exclusion of excess liquidity held at certain subsidiaries. The LCR is calculated as the amount of a financial institution's unencumbered HQLA relative to the estimated net cash outflows the institution could encounter over a 30-day period of significant liquidity stress, expressed as a percentage. Our average consolidated HQLA, on a net basis, was $444 billion and $439 billion for the three months ended March 31, 2018 and December 31, 2017 . For the same periods, the average consolidated LCR was 124 percent and 125 percent. Our LCR will fluctuate due to normal business flows from customer activity.
Liquidity Stress Analysis and Time-to-required Funding
We utilize liquidity stress analysis to assist us in determining the appropriate amounts of liquidity to maintain at the parent company and our subsidiaries to meet contractual and contingent cash outflows under a range of scenarios. For more information on our liquidity stress analysis, see Liquidity Risk – Liquidity Stress Analysis and Time-to-required Funding in the MD&A of the Corporation's 2017 Annual Report on Form 10-K .
We use a variety of metrics to determine the appropriate amounts of liquidity to maintain at the parent company and our subsidiaries. One metric we use to evaluate the appropriate level of liquidity at the parent company and NB Holdings is "time-to-required funding" (TTF). This debt coverage measure indicates the number of months the parent company can continue to meet its unsecured contractual obligations as they come due using only the parent company and NB Holdings' liquidity sources without issuing any new debt or accessing any additional liquidity sources. We define unsecured contractual obligations for purposes of this metric as maturities of senior or subordinated debt issued or guaranteed by Bank of America Corporation. These include certain unsecured debt instruments, primarily structured liabilities, which we may be required to settle for cash prior to maturity. TTF was 56 months at March 31, 2018 compared to 49 months at December 31, 2017 . The increase in TTF was driven by higher parent company and NB Holdings liquidity.
23 Bank of America |
|
|
Diversified Funding Sources
We fund our assets primarily with a mix of deposits and secured and unsecured liabilities through a centralized, globally coordinated funding approach diversified across products, programs, markets, currencies and investor groups. We fund a substantial portion of our lending activities through our deposits, which were $1.33 trillion and $1.31 trillion at March 31, 2018 and December 31, 2017 .
Our trading activities in other regulated entities are primarily funded on a secured basis through securities lending and repurchase agreements and these amounts will vary based on customer activity and market conditions.
During the three months ended March 31, 2018 , we issued $20.9 billion of long-term debt consisting of $14.4 billion for Bank of America Corporation, substantially all of which was TLAC compliant, $4.1 billion for Bank of America, N.A. and $2.4 billion of other debt.
Table 15 presents the carrying value of aggregate annual contractual maturities of long-term debt as of March 31, 2018 . During the three months ended March 31, 2018 , we had total long-term debt maturities and purchases of $13.4 billion consisting of $8.0 billion for Bank of America Corporation, $2.9 billion for Bank of America, N.A. and $2.5 billion of other debt.
|
|
|
|
|
|
|
|
|
|
|
|
|
|
| ||||||||||||||
Table 15 | Long-term Debt by Maturity |
|
|
|
|
|
|
|
|
|
|
|
|
| ||||||||||||||
|
|
|
|
|
|
|
|
|
|
|
|
|
|
| ||||||||||||||
(Dollars in millions) | Remainder of 2018 |
| 2019 |
| 2020 |
| 2021 |
| 2022 |
| Thereafter |
| Total | |||||||||||||||
Bank of America Corporation |
|
|
|
|
|
|
|
|
|
|
|
|
| |||||||||||||||
Senior notes | $ | 13,996 | |
| $ | 15,235 | |
| $ | 10,561 | |
| $ | 16,225 | |
| $ | 11,813 | |
| $ | 80,166 | |
| $ | 147,996 | | |
Senior structured notes | 1,768 | |
| 1,485 | |
| 923 | |
| 430 | |
| 2,048 | |
| 8,081 | |
| 14,735 | | ||||||||
Subordinated notes | 1,606 | |
| 1,576 | |
| - | |
| 382 | |
| 469 | |
| 20,188 | |
| 24,221 | | ||||||||
Junior subordinated notes | - | |
| - | |
| - | |
| - | |
| - | |
| 3,829 | |
| 3,829 | | ||||||||
Total Bank of America Corporation | 17,370 | |
| 18,296 | |
| 11,484 | |
| 17,037 | |
| 14,330 | |
| 112,264 | |
| 190,781 | | ||||||||
Bank of America, N.A. |
|
|
|
|
|
|
|
|
|
|
|
|
| |||||||||||||||
Senior notes | 3,990 | |
| - | |
| - | |
| - | |
| - | |
| 21 | |
| 4,011 | | ||||||||
Subordinated notes | - | |
| 1 | |
| - | |
| - | |
| - | |
| 1,626 | |
| 1,627 | | ||||||||
Advances from Federal Home Loan Banks | 3,005 | |
| 4,513 | |
| 11 | |
| 2 | |
| 3 | |
| 106 | |
| 7,640 | | ||||||||
Securitizations and other Bank VIEs (1) | 1,199 | |
| 3,200 | |
| 3,072 | |
| 1,572 | |
| - | |
| 47 | |
| 9,090 | | ||||||||
Other | 53 | |
| 166 | |
| 11 | |
| - | |
| 1 | |
| 97 | |
| 328 | | ||||||||
Total Bank of America, N.A. | 8,247 | |
| 7,880 | |
| 3,094 | |
| 1,574 | |
| 4 | |
| 1,897 | |
| 22,696 | | ||||||||
Other debt |
|
|
|
|
|
|
|
|
|
|
|
|
| |||||||||||||||
Structured liabilities | 4,009 | |
| 3,199 | |
| 1,887 | |
| 821 | |
| 746 | |
| 7,138 | |
| 17,800 | | ||||||||
Nonbank VIEs (1) | 20 | |
| 52 | |
| - | |
| - | |
| - | |
| 889 | |
| 961 | | ||||||||
Other | - | |
| - | |
| - | |
| - | |
| - | |
| 18 | |
| 18 | | ||||||||
Total other debt | 4,029 | |
| 3,251 | |
| 1,887 | |
| 821 | |
| 746 | |
| 8,045 | |
| 18,779 | | ||||||||
Total long-term debt | $ | 29,646 | |
| $ | 29,427 | |
| $ | 16,465 | |
| $ | 19,432 | |
| $ | 15,080 | |
| $ | 122,206 | |
| $ | 232,256 | | |
(1) | Represents the total long-term debt included in the liabilities of consolidated variable interest entities (VIEs) on the Consolidated Balance Sheet. |
Table 16 presents our long-term debt by major currency at March 31, 2018 and December 31, 2017 .
|
|
|
|
| ||||
Table 16 | Long-term Debt by Major Currency | |||||||
|
|
| ||||||
(Dollars in millions) | March 31 |
| December 31 | |||||
U.S. dollar | $ | 181,398 | |
| $ | 175,623 | | |
Euro | 34,487 | |
| 35,481 | | |||
British pound | 7,127 | |
| 7,016 | | |||
Japanese yen | 3,035 | |
| 2,993 | | |||
Australian dollar | 3,015 | |
| 3,046 | | |||
Canadian dollar | 1,915 | |
| 1,966 | | |||
Other | 1,279 | |
| 1,277 | | |||
Total long-term debt | $ | 232,256 | |
| $ | 227,402 | | |
Total long-term debt increased $4.9 billion , or two percent , during the three months ended March 31, 2018 , primarily due to issuances outpacing maturities. We may, from time to time, purchase outstanding debt instruments in various transactions, depending on prevailing market conditions, liquidity and other factors. In addition, our other regulated entities may make markets in our debt instruments to provide liquidity for investors. For information on funding and liquidity risk management, see Liquidity Risk – Liquidity Stress Analysis and Time-to-required Funding on page 23 , and for more information regarding long-term debt funding, see Note 11 – Long-term Debt to the Consolidated
Financial Statements of the Corporation's 2017 Annual Report on Form 10-K .
We use derivative transactions to manage the duration, interest rate and currency risks of our borrowings, considering the characteristics of the assets they are funding. For more information on our ALM activities, see Interest Rate Risk Management for the Banking Book on page 45 .
We may also issue unsecured debt in the form of structured notes for client purposes, certain of which qualify as TLAC eligible debt. During the three months ended March 31, 2018 , we issued $1.4 billion of structured notes, which are debt obligations that pay investors returns linked to other debt or equity securities, indices, currencies or commodities. We typically hedge the returns we are obligated to pay on these liabilities with derivatives and/or investments in the underlying instruments, so that from a funding perspective, the cost is similar to our other unsecured long-term debt. We could be required to settle certain structured note obligations for cash or other securities prior to maturity under certain circumstances, which we consider for liquidity planning purposes. We believe, however, that a portion of such borrowings will remain outstanding beyond the earliest put or redemption date.
Substantially all of our senior and subordinated debt obligations contain no provisions that could trigger a requirement for an early repayment, require additional collateral support, result in changes to terms, accelerate maturity or create additional financial obligations upon an adverse change in our credit ratings, financial ratios, earnings, cash flows or stock price.
|
| Bank of America 24 |
Credit Ratings
Credit ratings and outlooks are opinions expressed by rating agencies on our creditworthiness and that of our obligations or securities, including long-term debt, short-term borrowings, preferred stock and other securities, including asset securitizations. Table 17 presents the Corporation's current long-term/short-term senior debt ratings and outlooks expressed by the rating agencies. These ratings have not changed from those disclosed in the Corporation's 2017 Annual Report on Form 10 – K. For more information on credit ratings, see Liquidity Risk – Credit
Ratings in the MD&A of the Corporation's 2017 Annual Report on Form 10-K .
For more information on the additional collateral and termination payments that could be required in connection with certain over-the-counter (OTC) derivative contracts and other trading agreements as a result of a credit rating downgrade, see Note 3 – Derivatives to the Consolidated Financial Statements herein and Item 1A. Risk Factors of the Corporation's 2017 Annual Report on Form 10-K .
|
|
|
|
|
|
|
|
|
|
|
|
|
|
|
|
|
|
|
Table 17 | Senior Debt Ratings |
|
|
|
|
|
|
|
|
|
|
|
|
|
| |||
|
|
| ||||||||||||||||
|
| Moody's Investors Service |
| Standard & Poor's Global Ratings |
| Fitch Ratings | ||||||||||||
| Long-term |
| Short-term |
| Outlook |
| Long-term |
| Short-term |
| Outlook |
| Long-term |
| Short-term |
| Outlook | |
Bank of America Corporation | A3 |
| P-2 |
| Stable |
| A- |
| A-2 |
| Stable |
| A |
| F1 |
| Stable | |
Bank of America, N.A. | Aa3 |
| P-1 |
| Stable |
| A+ |
| A-1 |
| Stable |
| A+ |
| F1 |
| Stable | |
Merrill Lynch, Pierce, Fenner & Smith Incorporated | NR |
| NR |
| NR |
| A+ |
| A-1 |
| Stable |
| A+ |
| F1 |
| Stable | |
Merrill Lynch International | NR |
| NR |
| NR |
| A+ |
| A-1 |
| Stable |
| A |
| F1 |
| Stable | |
NR = not rated
Credit Risk Management
For information on our credit risk management activities, see Consumer Portfolio Credit Risk Management below, Commercial Portfolio Credit Risk Management on page 34 , Non-U.S. Portfolio on page 40 , Provision for Credit Losses on page 41 , Allowance for Credit Losses on page 41 , and Note 5 – Outstanding Loans and Leases and Note 6 – Allowance for Credit Losses to the Consolidated Financial Statements .
Consumer Portfolio Credit Risk Management
Credit risk management for the consumer portfolio begins with initial underwriting and continues throughout a borrower's credit cycle. Statistical techniques in conjunction with experiential judgment are used in all aspects of portfolio management including underwriting, product pricing, risk appetite, setting credit limits, and establishing operating processes and metrics to quantify and balance risks and returns. Statistical models are built using detailed behavioral information from external sources such as credit bureaus and/or internal historical experience and are a component of our consumer credit risk management process. These models are used in part to assist in making both new and ongoing credit decisions, as well as portfolio management strategies, including authorizations and line management, collection practices and strategies, and determination of the allowance for loan and lease losses and allocated capital for credit risk.
Consumer Credit Portfolio
Improvement in home prices continued during the three months ended March 31, 2018 resulting in improved credit quality and lower credit losses in the consumer real estate portfolio, partially offset by seasoning and loan growth in the U.S. credit card portfolio compared to the same period in 2017 .
Improved credit quality and continued loan balance run-off in the consumer real estate portfolio, partially offset by seasoning
within the U.S. credit card portfolio, drove a $133 million decrease in the consumer allowance for loan and lease losses during the three months ended March 31, 2018 to $5.3 billion at March 31, 2018 . For more information, see Allowance for Credit Losses on page 41 .
For more information on our accounting policies regarding delinquencies, nonperforming status, charge-offs and troubled debt restructurings (TDRs) for the consumer portfolio, see Note 1 – Summary of Significant Accounting Principles to the Consolidated Financial Statements of the Corporation's 2017 Annual Report on Form 10-K .
Table 18 presents our outstanding consumer loans and leases, consumer nonperforming loans and accruing consumer loans past due 90 days or more. Nonperforming loans do not include past due consumer credit card loans, other unsecured loans and in general, consumer loans not secured by real estate (bankruptcy loans are included) as these loans are typically charged off no later than the end of the month in which the loan becomes 180 days past due. Real estate-secured past due consumer loans that are insured by the Federal Housing Administration (FHA) or individually insured under long-term standby agreements with Fannie Mae and Freddie Mac (collectively, the fully-insured loan portfolio) are reported as accruing as opposed to nonperforming since the principal repayment is insured. Fully-insured loans included in accruing past due 90 days or more are primarily from our repurchases of delinquent FHA loans pursuant to our servicing agreements with the Government National Mortgage Association (GNMA). Additionally, nonperforming loans and accruing balances past due 90 days or more do not include the PCI loan portfolio or loans accounted for under the fair value option even though the customer may be contractually past due.
For more information on PCI loans, see Consumer Portfolio Credit Risk Management – Purchased Credit-impaired Loan Portfolio on page 31 and Note 5 – Outstanding Loans and Leases to the Consolidated Financial Statements .
25 Bank of America |
|
|
|
|
|
|
|
|
|
|
|
|
|
|
| ||||||||||||
Table 18 | Consumer Credit Quality |
|
|
|
|
|
|
|
|
|
|
| ||||||||||||
|
|
|
|
|
|
|
|
|
|
|
|
| ||||||||||||
| Outstandings |
| Nonperforming |
| Accruing Past Due 90 Days or More | |||||||||||||||||||
(Dollars in millions) | March 31 |
| December 31 |
| March 31 |
| December 31 |
| March 31 |
| December 31 | |||||||||||||
Residential mortgage (1) | $ | 204,112 | |
| $ | 203,811 | |
| $ | 2,262 | |
| $ | 2,476 | |
| $ | 2,885 | |
| $ | 3,230 | | |
Home equity | 55,308 | |
| 57,744 | |
| 2,598 | |
| 2,644 | |
| - | |
| - | | |||||||
U.S. credit card | 93,014 | |
| 96,285 | |
| n/a | |
| n/a | |
| 925 | |
| 900 | | |||||||
Direct/Indirect consumer (2) | 91,213 | |
| 93,830 | |
| 46 | |
| 46 | |
| 38 | |
| 40 | | |||||||
Other consumer (3) | 2,860 | |
| 2,678 | |
| - | |
| - | |
| 1 | |
| - | | |||||||
Consumer loans excluding loans accounted for under the fair value option | $ | 446,507 | |
| $ | 454,348 | |
| $ | 4,906 | |
| $ | 5,166 | |
| $ | 3,849 | |
| $ | 4,170 | | |
Loans accounted for under the fair value option (4) | 894 | |
| 928 | |
|
|
|
|
|
|
|
| |||||||||||
Total consumer loans and leases | $ | 447,401 | |
| $ | 455,276 | |
|
|
|
|
|
|
|
| |||||||||
Percentage of outstanding consumer loans and leases (5) | n/a | |
| n/a | |
| 1.10 | % |
| 1.14 | % |
| 0.86 | % |
| 0.92 | % | |||||||
Percentage of outstanding consumer loans and leases, excluding PCI and fully-insured loan portfolios (5) | n/a | |
| n/a | |
| 1.19 | |
| 1.23 | |
| 0.23 | |
| 0.22 | | |||||||
(1) | Residential mortgage loans accruing past due 90 days or more are fully-insured loans. At March 31, 2018 and December 31, 2017 , residential mortgage includes $2.0 billion and $2.2 billion of loans on which interest had been curtailed by the FHA, and therefore were no longer accruing interest, although principal was still insured, and $885 million and $1.0 billion of loans on which interest was still accruing. |
(2) | Outstandings include auto and specialty lending loans of $49.1 billion and $49.9 billion , unsecured consumer lending loans of $428 million and $469 million , U.S. securities-based lending loans of $38.1 billion and $39.8 billion , non-U.S. consumer loans of $2.9 billion and $3.0 billion and other consumer loans of $676 million and $684 million at March 31, 2018 and December 31, 2017 . |
(3) | Outstandings include consumer leases of $2.7 billion and $2.5 billion and consumer overdrafts of $129 million and $163 million at March 31, 2018 and December 31, 2017 . |
(4) | Consumer loans accounted for under the fair value option include residential mortgage loans of $523 million and $567 million and home equity loans of $371 million and $361 million at March 31, 2018 and December 31, 2017 . For more information on the fair value option, see Note 15 – Fair Value Option to the Consolidated Financial Statements . |
(5) | Excludes consumer loans accounted for under the fair value option. At March 31, 2018 and December 31, 2017 , $25 million and $26 million of loans accounted for under the fair value option were past due 90 days or more and not accruing interest. |
n/a = not applicable
Table 19 presents net charge-offs and related ratios for consumer loans and leases.
|
|
|
|
|
|
|
|
| ||||||
Table 19 | Consumer Net Charge-offs and Related Ratios |
|
|
|
|
|
| |||||||
|
|
|
|
|
|
|
|
| ||||||
|
| Net Charge-offs (1) |
| Net Charge-off Ratios (1, 2) | ||||||||||
|
| Three Months Ended March 31 | ||||||||||||
(Dollars in millions) | 2018 |
| 2017 |
| 2018 |
| 2017 | |||||||
Residential mortgage | $ | (6 | ) |
| $ | 17 | |
| (0.01 | )% |
| 0.04 | % | |
Home equity | 33 | |
| 64 | |
| 0.23 | |
| 0.40 | | |||
U.S. credit card | 701 | |
| 606 | |
| 3.01 | |
| 2.74 | | |||
Non-U.S. credit card (3) | - | |
| 44 | |
| - | |
| 1.91 | | |||
Direct/Indirect consumer | 58 | |
| 48 | |
| 0.26 | |
| 0.21 | | |||
Other consumer | 44 | |
| 48 | |
| 6.34 | |
| 7.61 | | |||
Total | $ | 830 | |
| $ | 827 | |
| 0.75 | |
| 0.74 | | |
(1) | Net charge-offs exclude write-offs in the PCI loan portfolio. For more information, see Consumer Portfolio Credit Risk Management – Purchased Credit-impaired Loan Portfolio on page 31 . |
(2) | Net charge-off ratios are calculated as annualized net charge-offs divided by average outstanding loans and leases excluding loans accounted for under the fair value option. |
(3) | Represents net charge-offs related to the non-U.S. credit card loan portfolio, which was sold during the second quarter of 2017. |
Net charge-offs, as shown in Tables 19 and 20 , exclude write-offs in the PCI loan portfolio of $17 million and $9 million in residential mortgage and $18 million and $24 million in home equity for the three months ended March 31, 2018 and 2017 . Net charge-off ratios including the PCI write-offs were 0.02 percent and 0.06 percent for residential mortgage and 0.36 percent and 0.55 percent for home equity for the three months ended March 31, 2018 and 2017 . For more information on PCI write-offs, see Consumer Portfolio Credit Risk Management – Purchased Credit-impaired Loan Portfolio on page 31 .
Table 20 presents outstandings, nonperforming balances, net charge-offs, allowance for loan and lease losses and provision for loan and lease losses for the core and non-core portfolios within the consumer real estate portfolio. We categorize consumer real estate loans as core and non-core based on loan and customer characteristics such as origination date, product type, LTV, FICO
score and delinquency status consistent with our current consumer and mortgage servicing strategy. Generally, loans that were originated after January 1, 2010, qualified under government-sponsored enterprise underwriting guidelines, or otherwise met our underwriting guidelines in place in 2015 are characterized as core loans. All other loans are generally characterized as non-core loans and represent run-off portfolios. Core loans as reported in Table 20 include loans held in the Consumer Banking and GWIM segments, as well as loans held for ALM activities in All Other . For more information, see Note 5 – Outstanding Loans and Leases to the Consolidated Financial Statements .
As shown in Table 20 , outstanding core consumer real estate loans increased $1.3 billion during the three months ended March 31, 2018 driven by an increase of $ 3.0 billion in residential mortgage, partially offset by a $ 1.7 billion decrease in home equity.
|
| Bank of America 26 |
|
|
|
|
|
|
|
|
|
|
|
|
| ||||||||||||
Table 20 | Consumer Real Estate Portfolio (1) |
|
|
|
| |||||||||||||||||||
|
|
|
|
|
|
| ||||||||||||||||||
|
| Outstandings |
| Nonperforming |
| Net Charge-offs (2) | ||||||||||||||||||
| March 31 |
| December 31 |
| March 31 |
| December 31 |
| Three Months Ended March 31 | |||||||||||||||
(Dollars in millions) |
| 2018 |
| 2017 | ||||||||||||||||||||
Core portfolio |
| |
|
| |
|
| |
|
| |
|
|
|
| |||||||||
Residential mortgage | $ | 179,578 | |
| $ | 176,618 | |
| $ | 1,073 | |
| $ | 1,087 | |
| $ | 9 | |
| $ | 4 | | |
Home equity | 42,568 | |
| 44,245 | |
| 1,118 | |
| 1,079 | |
| 23 | |
| 31 | | |||||||
Total core portfolio | 222,146 | |
| 220,863 | |
| 2,191 | |
| 2,166 | |
| 32 | |
| 35 | | |||||||
Non-core portfolio |
|
|
| |
|
| |
|
| |
|
|
|
| ||||||||||
Residential mortgage | 24,534 | |
| 27,193 | |
| 1,189 | |
| 1,389 | |
| (15 | ) |
| 13 | | |||||||
Home equity | 12,740 | |
| 13,499 | |
| 1,480 | |
| 1,565 | |
| 10 | |
| 33 | | |||||||
Total non-core portfolio | 37,274 | |
| 40,692 | |
| 2,669 | |
| 2,954 | |
| (5 | ) |
| 46 | | |||||||
Consumer real estate portfolio |
| |
|
| |
|
| |
|
| |
|
|
|
| |||||||||
Residential mortgage | 204,112 | |
| 203,811 | |
| 2,262 | |
| 2,476 | |
| (6 | ) |
| 17 | | |||||||
Home equity | 55,308 | |
| 57,744 | |
| 2,598 | |
| 2,644 | |
| 33 | |
| 64 | | |||||||
Total consumer real estate portfolio | $ | 259,420 | |
| $ | 261,555 | |
| $ | 4,860 | |
| $ | 5,120 | |
| $ | 27 | |
| $ | 81 | | |
|
|
|
|
|
|
|
|
|
|
|
|
| ||||||||||||
|
|
|
|
|
| Allowance for Loan and Lease Losses |
| Provision for Loan and Lease Losses | ||||||||||||||||
|
|
|
|
|
| March 31 |
| December 31 |
| Three Months Ended March 31 | ||||||||||||||
|
|
|
|
|
|
| 2018 |
| 2017 | |||||||||||||||
Core portfolio |
|
|
|
|
|
|
|
|
|
|
| |||||||||||||
Residential mortgage |
|
|
|
| $ | 216 | |
| $ | 218 | |
| $ | 8 | |
| $ | (1 | ) | |||||
Home equity |
|
|
|
| 343 | |
| 367 | |
| (1 | ) |
| (11 | ) | |||||||||
Total core portfolio |
|
|
|
| 559 | |
| 585 | |
| 7 | |
| (12 | ) | |||||||||
Non-core portfolio |
|
|
|
|
| |
|
| |
|
|
|
| |||||||||||
Residential mortgage |
|
|
|
| 395 | |
| 483 | |
| (86 | ) |
| 33 | | |||||||||
Home equity |
|
|
|
| 576 | |
| 652 | |
| (49 | ) |
| (92 | ) | |||||||||
Total non-core portfolio |
|
|
|
| 971 | |
| 1,135 | |
| (135 | ) |
| (59 | ) | |||||||||
Consumer real estate portfolio |
|
|
|
|
| |
|
| |
|
|
|
| |||||||||||
Residential mortgage |
|
|
|
| 611 | |
| 701 | |
| (78 | ) |
| 32 | | |||||||||
Home equity |
|
|
|
| 919 | |
| 1,019 | |
| (50 | ) |
| (103 | ) | |||||||||
Total consumer real estate portfolio |
|
|
|
| $ | 1,530 | |
| $ | 1,720 | |
| $ | (128 | ) |
| $ | (71 | ) | |||||
(1) | Outstandings and nonperforming loans exclude loans accounted for under the fair value option. Consumer loans accounted for under the fair value option included residential mortgage loans of $523 million and $567 million and home equity loans of $371 million and $361 million at March 31, 2018 and December 31, 2017 . For more information, see Note 15 – Fair Value Option to the Consolidated Financial Statements . |
(2) | Net charge-offs exclude write-offs in the PCI loan portfolio. For more information, see Consumer Portfolio Credit Risk Management – Purchased Credit-impaired Loan Portfolio on page 31 . |
We believe that the presentation of information adjusted to exclude the impact of the PCI loan portfolio, the fully-insured loan portfolio and loans accounted for under the fair value option is more representative of the ongoing operations and credit quality of the business. As a result, in the following discussions of the residential mortgage and home equity portfolios, we provide information that excludes the impact of the PCI loan portfolio, the fully-insured loan portfolio and loans accounted for under the fair value option in certain credit quality statistics. We separately disclose information on the PCI loan portfolio on page 31 .
Residential Mortgage
The residential mortgage portfolio makes up the largest percentage of our consumer loan portfolio at 46 percent of consumer loans and leases at March 31, 2018 . Approximately 39 percent of the residential mortgage portfolio is in Consumer Banking and approximately 36 percent is in GWIM. The remaining portion is in All Other and is comprised of originated loans, purchased loans used in our overall ALM activities, delinquent FHA
loans repurchased pursuant to our servicing agreements with GNMA as well as loans repurchased related to our representations and warranties.
Outstanding balances in the residential mortgage portfolio, excluding loans accounted for under the fair value option, increased $ 301 million during the three months ended March 31, 2018 as retention of new originations was partially offset by loan transfers to held for sale of $1.3 billion, loan sales of $812 million and run-off.
At March 31, 2018 and December 31, 2017 , the residential mortgage portfolio included $22.7 billion and $23.7 billion of outstanding fully-insured loans. At March 31, 2018 and December 31, 2017 , $16.5 billion and $17.4 billion had FHA insurance with the remainder protected by long-term standby agreements. At March 31, 2018 and December 31, 2017 , $4.8 billion and $5.2 billion of the FHA-insured loan population were repurchases of delinquent FHA loans pursuant to our servicing agreements with GNMA.
27 Bank of America |
|
|
Table 21 presents certain residential mortgage key credit statistics on both a reported basis excluding loans accounted for under the fair value option, and excluding the PCI loan portfolio, the fully-insured loan portfolio and loans accounted for under the fair value option. Additionally, in the "Reported Basis" columns in the following table, accruing balances past due and nonperforming loans do not include the PCI loan portfolio, in accordance with our
accounting policies, even though the customer may be contractually past due. As such, the following discussion presents the residential mortgage portfolio excluding the PCI loan portfolio, the fully-insured loan portfolio and loans accounted for under the fair value option. For more information on the PCI loan portfolio, see page 31 .
|
|
|
|
|
|
|
|
|
| ||||||||
Table 21 | Residential Mortgage – Key Credit Statistics |
|
|
|
|
|
|
|
| ||||||||
|
|
|
|
|
|
|
|
|
| ||||||||
|
|
| Reported Basis (1) |
| Excluding Purchased | ||||||||||||
(Dollars in millions) |
| March 31 |
| December 31 |
| March 31 |
| December 31 | |||||||||
Outstandings |
| $ | 204,112 | |
| $ | 203,811 | |
| $ | 173,813 | |
| $ | 172,069 | | |
Accruing past due 30 days or more |
| 5,192 | |
| 5,987 | |
| 1,277 | |
| 1,521 | | |||||
Accruing past due 90 days or more |
| 2,885 | |
| 3,230 | |
| - | |
| - | | |||||
Nonperforming loans |
| 2,262 | |
| 2,476 | |
| 2,262 | |
| 2,476 | | |||||
Percent of portfolio |
|
| |
|
| |
|
| |
|
| | |||||
Refreshed LTV greater than 90 but less than or equal to 100 |
| 3 | % |
| 3 | % |
| 2 | % |
| 2 | % | |||||
Refreshed LTV greater than 100 |
| 2 | |
| 2 | |
| 1 | |
| 1 | | |||||
Refreshed FICO below 620 |
| 6 | |
| 6 | |
| 2 | |
| 3 | | |||||
2006 and 2007 vintages (2) |
| 9 | |
| 10 | |
| 7 | |
| 8 | | |||||
|
|
|
|
|
|
|
|
|
| ||||||||
|
|
| Three Months Ended March 31 | ||||||||||||||
|
|
| 2018 |
| 2017 |
| 2018 |
| 2017 | ||||||||
Net charge-off ratio (3) |
| (0.01 | )% |
| 0.04 | % |
| (0.01 | )% |
| 0.05 | % | |||||
(1) | Outstandings, accruing past due, nonperforming loans and percentages of portfolio exclude loans accounted for under the fair value option. |
(2) | These vintages of loans accounted for $729 million , or 32 percent , and $825 million , or 33 percent , of nonperforming residential mortgage loans at March 31, 2018 and December 31, 2017 . |
(3) | Net charge-off ratios are calculated as annualized net charge-offs divided by average outstanding loans excluding loans accounted for under the fair value option. |
Nonperforming residential mortgage loans decreased $214 million during the three months ended March 31, 2018 as outflows, including sales of $257 million, outpaced new inflows. Of the nonperforming residential mortgage loans at March 31, 2018 , $789 million, or 35 percent, were current on contractual payments. Loans accruing past due 30 days or more decreased $244 million from seasonal declines.
Net charge-offs decreased $23 million to a net recovery of $6 million for the three months ended March 31, 2018 compared to $17 million of net charge-offs for the same period in 2017 . This change was driven in part by net recoveries of $18 million related to loan sales during the three months ended March 31, 2018 compared to loan sale-related net recoveries of $11 million for the same period in 2017 . Additionally, net charge-offs declined due to favorable portfolio trends and decreased write-downs on loans greater than 180 days past due driven by improvement in home prices and the U.S. economy.
Loans with a refreshed LTV greater than 100 percent represented one percent of the residential mortgage loan portfolio at both March 31, 2018 and December 31, 2017 . Of the loans with a refreshed LTV greater than 100 percent, 99 percent were performing at March 31, 2018 compared to 98 percent at December 31, 2017 . Loans with a refreshed LTV greater than 100 percent reflect loans where the outstanding carrying value of the loan is greater than the most recent valuation of the property securing the loan. The majority of these loans have a refreshed LTV greater than 100 percent due to home price deterioration since 2006, partially offset by subsequent appreciation.
Of the $173.8 billion in total residential mortgage loans outstanding at March 31, 2018 , as shown in Table 22 , 32 percent were originated as interest-only loans. The outstanding balance of
interest-only residential mortgage loans that have entered the amortization period was $9.9 billion, or 18 percent, at March 31, 2018 . Residential mortgage loans that have entered the amortization period generally have experienced a higher rate of early stage delinquencies and nonperforming status compared to the residential mortgage portfolio as a whole. At March 31, 2018 , $251 million, or three percent, of outstanding interest-only residential mortgages that had entered the amortization period were accruing past due 30 days or more compared to $1.3 billion , or one percent , for the entire residential mortgage portfolio. In addition, at March 31, 2018 , $432 million, or four percent, of outstanding interest-only residential mortgage loans that had entered the amortization period were nonperforming, of which $166 million were contractually current, compared to $2.3 billion , or one percent , for the entire residential mortgage portfolio, of which $789 million were contractually current. Loans that have yet to enter the amortization period in our interest-only residential mortgage portfolio are primarily well-collateralized loans to our wealth management clients and have an interest-only period of three to ten years. More than 90 percent of these loans that have yet to enter the amortization period will not be required to make a fully-amortizing payment until 2020 or later.
Table 22 presents outstandings, nonperforming loans and net charge-offs by certain state concentrations for the residential mortgage portfolio. The Los Angeles-Long Beach-Santa Ana Metropolitan Statistical Area (MSA) within California represented 16 percent of outstandings at both March 31, 2018 and December 31, 2017 . In the New York area, the New York-Northern New Jersey-Long Island MSA made up 13 percent of outstandings at both March 31, 2018 and December 31, 2017 .
|
| Bank of America 28 |
|
|
|
|
|
|
|
|
|
|
|
|
| ||||||||||||
Table 22 | Residential Mortgage State Concentrations | |||||||||||||||||||||||
|
|
|
|
|
|
|
|
|
|
|
|
| ||||||||||||
| Outstandings (1) |
| Nonperforming (1) |
| Net Charge-offs (2) | |||||||||||||||||||
| March 31 |
| December 31 |
| March 31 |
| December 31 |
| Three Months Ended March 31 | |||||||||||||||
(Dollars in millions) |
|
|
|
| 2018 |
| 2017 | |||||||||||||||||
California | $ | 69,368 | |
| $ | 68,455 | |
| $ | 384 | |
| $ | 433 | |
| $ | (10 | ) |
| $ | (4 | ) | |
New York (3) | 17,613 | |
| 17,239 | |
| 221 | |
| 227 | |
| 4 | |
| (2 | ) | |||||||
Florida (3) | 10,887 | |
| 10,880 | |
| 281 | |
| 280 | |
| (5 | ) |
| 1 | | |||||||
Texas | 7,298 | |
| 7,237 | |
| 127 | |
| 126 | |
| 1 | |
| 1 | | |||||||
New Jersey (3) | 6,202 | |
| 6,099 | |
| 118 | |
| 130 | |
| 2 | |
| 1 | | |||||||
Other | 62,445 | |
| 62,159 | |
| 1,131 | |
| 1,280 | |
| 2 | |
| 20 | | |||||||
Residential mortgage loans (4) | $ | 173,813 | |
| $ | 172,069 | |
| $ | 2,262 | |
| $ | 2,476 | |
| $ | (6 | ) |
| $ | 17 | | |
Fully-insured loan portfolio | 22,709 | |
| 23,741 | |
|
| |
|
| |
|
| |
|
| | |||||||
Purchased credit-impaired residential mortgage loan portfolio (5) | 7,590 | |
| 8,001 | |
|
| |
|
| |
|
| |
|
| | |||||||
Total residential mortgage loan portfolio | $ | 204,112 | |
| $ | 203,811 | |
|
| |
|
| |
|
| |
|
| | |||||
(1) | Outstandings and nonperforming loans exclude loans accounted for under the fair value option. |
(2) | Net charge-offs excluded $17 million and $ 9 million of write-offs in the residential mortgage PCI loan portfolio for the three months ended March 31, 2018 and 2017 . For more information on PCI write-offs, see Consumer Portfolio Credit Risk Management – Purchased Credit-impaired Loan Portfolio on page 31 . |
(3) | In these states, foreclosure requires a court order following a legal proceeding (judicial states). |
(4) | Amounts exclude the PCI residential mortgage and fully-insured loan portfolios. |
(5) | At both March 31, 2018 and December 31, 2017 , 47 percent of PCI residential mortgage loans were in California. There were no other significant single state concentrations. |
Home Equity
At March 31, 2018 , the home equity portfolio made up 12 percent of the consumer portfolio and is comprised of home equity lines of credit (HELOCs), home equity loans and reverse mortgages.
At March 31, 2018 , our HELOC portfolio had an outstanding balance of $49.0 billion, or 89 percent of the total home equity portfolio, compared to $51.2 billion, or 89 percent, at December 31, 2017 . HELOCs generally have an initial draw period of 10 years, and after the initial draw period ends, the loans generally convert to 15-year amortizing loans.
At March 31, 2018 , our home equity loan portfolio had an outstanding balance of $4.1 billion, or seven percent of the total home equity portfolio, compared to $4.4 billion, or seven percent, at December 31, 2017 . Home equity loans are almost all fixed-rate loans with amortizing payment terms of 10 to 30 years, and of the $4.1 billion at March 31, 2018 , 58 percent have 25- to 30-year terms. At March 31, 2018 , our reverse mortgage portfolio had an outstanding balance, excluding loans accounted for under the fair value option, of $2.2 billion, or four percent of the total home equity portfolio, compared to $2.1 billion, also four percent, at December 31, 2017 . We no longer originate reverse mortgages.
At March 31, 2018 , approximately 70 percent of the home equity portfolio was in Consumer Banking , 23 percent was in All Other and the remainder of the portfolio was primarily in GWIM . Outstanding balances in the home equity portfolio, excluding loans accounted for under the fair value option, decreased $2.4 billion during the three months ended March 31, 2018 primarily due to paydowns and charge-offs outpacing new originations and draws on existing lines. Of the total home equity portfolio at March 31,
2018 and December 31, 2017 , $18.2 billion and $18.7 billion, or 33 percent and 32 percent, were in first-lien positions (34 percent for both periods excluding the PCI home equity portfolio). At March 31, 2018 , outstanding balances in the home equity portfolio that were in a second-lien or more junior-lien position and where we also held the first-lien loan totaled $8.9 billion, or 17 percent of our total home equity portfolio excluding the PCI loan portfolio.
Unused HELOCs totaled $43.9 billion at March 31, 2018 compared to $44.2 billion at December 31, 2017 . The decrease was primarily due to accounts reaching the end of their draw period, which automatically eliminates open line exposure, and customers choosing to close accounts. Both of these more than offset the impact of new production. The HELOC utilization rate was 53 percent and 54 percent at March 31, 2018 and December 31, 2017 .
Table 23 presents certain home equity portfolio key credit statistics on both a reported basis excluding loans accounted for under the fair value option, and excluding the PCI loan portfolio and loans accounted for under the fair value option. Additionally, in the "Reported Basis" columns in the following table, accruing balances past due 30 days or more and nonperforming loans do not include the PCI loan portfolio, in accordance with our accounting policies, even though the customer may be contractually past due. As such, the following discussion presents the home equity portfolio excluding the PCI loan portfolio and loans accounted for under the fair value option. For more information on the PCI loan portfolio, see page 31 .
29 Bank of America |
|
|
|
|
|
|
|
|
|
|
| ||||||||
Table 23 | Home Equity – Key Credit Statistics | |||||||||||||||
|
|
|
|
|
|
|
|
| ||||||||
|
| Reported Basis (1) |
| Excluding Purchased | ||||||||||||
(Dollars in millions) | March 31 |
| December 31 |
| March 31 |
| December 31 | |||||||||
Outstandings | $ | 55,308 | |
| $ | 57,744 | |
| $ | 52,763 | |
| $ | 55,028 | | |
Accruing past due 30 days or more (2) | 460 | |
| 502 | |
| 460 | |
| 502 | | |||||
Nonperforming loans (2) | 2,598 | |
| 2,644 | |
| 2,598 | |
| 2,644 | | |||||
Percent of portfolio |
|
|
|
|
|
|
| |||||||||
Refreshed CLTV greater than 90 but less than or equal to 100 | 3 | % |
| 3 | % |
| 3 | % |
| 3 | % | |||||
Refreshed CLTV greater than 100 | 5 | |
| 5 | |
| 4 | |
| 4 | | |||||
Refreshed FICO below 620 | 6 | |
| 6 | |
| 6 | |
| 6 | | |||||
2006 and 2007 vintages (3) | 28 | |
| 29 | |
| 26 | |
| 27 | | |||||
|
|
|
|
|
|
|
| |||||||||
| Three Months Ended March 31 | |||||||||||||||
| 2018 |
| 2017 |
| 2018 |
| 2017 | |||||||||
Net charge-off ratio (4) | 0.23 | % |
| 0.40 | % |
| 0.24 | % |
| 0.42 | % | |||||
(1) | Outstandings, accruing past due, nonperforming loans and percentages of the portfolio exclude loans accounted for under the fair value option. |
(2) | Accruing past due 30 days or more included $53 million and $67 million and nonperforming loans included $325 million and $344 million of loans where we serviced the underlying first-lien at March 31, 2018 and December 31, 2017 . |
(3) | These vintages of loans have higher refreshed combined loan-to-value (CLTV) ratios and accounted for 53 percent and 52 percent of nonperforming home equity loans at March 31, 2018 and December 31, 2017 , and 89 percent of net charge-offs in both the three months ended March 31, 2018 and 2017 . |
(4) | Net charge-off ratios are calculated as annualized net charge-offs divided by average outstanding loans excluding loans accounted for under the fair value option. |
Nonperforming outstanding balances in the home equity portfolio decreased $46 million during the three months ended March 31, 2018 as outflows, including $12 million of sales, outpaced new inflows. Of the nonperforming home equity portfolio at March 31, 2018 , $1.4 billion, or 54 percent, were current on contractual payments. Nonperforming loans that are contractually current primarily consist of collateral-dependent TDRs, including those that have been discharged in Chapter 7 bankruptcy, junior-lien loans where the underlying first-lien is 90 days or more past due, as well as loans that have not yet demonstrated a sustained period of payment performance following a TDR. In addition, $690 million, or 27 percent, of nonperforming home equity loans were 180 days or more past due and had been written down to the estimated fair value of the collateral, less costs to sell. Accruing loans that were 30 days or more past due decreased $42 million during the three months ended March 31, 2018 .
In some cases, the junior-lien home equity outstanding balance that we hold is performing, but the underlying first-lien is not. For outstanding balances in the home equity portfolio on which we service the first-lien loan, we are able to track whether the first-lien loan is in default. For loans where the first-lien is serviced by a third party, we utilize credit bureau data to estimate the delinquency status of the first-lien. For certain loans, we utilize a third-party vendor to combine credit bureau and public record data to better link a junior-lien loan with the underlying first-lien loan. At March 31, 2018 , we estimate that $776 million of current and $121 million of 30 to 89 days past due junior-lien loans were behind a delinquent first-lien loan. We service the first-lien loans on $152 million of these combined amounts, with the remaining $745 million serviced by third parties. Of the $897 million of current to 89 days past due junior-lien loans, based on available credit bureau data and our own internal servicing data, we estimate that approximately $294 million had first-lien loans that were 90 days or more past due.
Net charge-offs decreased $31 million to $33 million for the three months ended March 31, 2018 compared to $64 million for the same period in 2017 driven by favorable portfolio trends due in part to improvement in home prices and the U.S. economy.
Outstanding balances with a refreshed CLTV greater than 100 percent comprised four percent of the home equity portfolio at both March 31, 2018 and December 31, 2017 . Outstanding balances with a refreshed CLTV greater than 100 percent reflect
loans where our loan and available line of credit combined with any outstanding senior liens against the property are equal to or greater than the most recent valuation of the property securing the loan. Depending on the value of the property, there may be collateral in excess of the first-lien that is available to reduce the severity of loss on the second-lien. Of those outstanding balances with a refreshed CLTV greater than 100 percent, 95 percent of the customers were current on their home equity loan and 91 percent of second-lien loans with a refreshed CLTV greater than 100 percent were current on both their second-lien and underlying first-lien loans at March 31, 2018 .
Of the $52.8 billion in total home equity portfolio outstandings at March 31, 2018 , as shown in Table 24 , 26 percent require interest-only payments. The outstanding balance of HELOCs that have reached the end of their draw period and have entered the amortization period was $18.6 billion at March 31, 2018 . The HELOCs that have entered the amortization period have experienced a higher percentage of early stage delinquencies and nonperforming status when compared to the HELOC portfolio as a whole. At March 31, 2018 , $341 million, or two percent, of outstanding HELOCs that had entered the amortization period were accruing past due 30 days or more. In addition, at March 31, 2018 , $2.1 billion, or 12 percent, of outstanding HELOCs that had entered the amortization period were nonperforming, of which $1.2 billion were contractually current. Loans in our HELOC portfolio generally have an initial draw period of 10 years and six percent of these loans will enter the amortization period during the remainder of 2018 and will be required to make fully-amortizing payments. We communicate to contractually current customers more than a year prior to the end of their draw period to inform them of the potential change to the payment structure before entering the amortization period, and provide payment options to customers prior to the end of the draw period.
Although we do not actively track how many of our home equity customers pay only the minimum amount due on their home equity loans and lines, we can infer some of this information through a review of our HELOC portfolio that we service and that is still in its revolving period (i.e., customers may draw on and repay their line of credit, but are generally only required to pay interest on a monthly basis). During the three months ended March 31, 2018 , approximately 27 percent of these customers with an outstanding balance did not pay any principal on their HELOCs.
|
| Bank of America 30 |
Table 24 presents outstandings, nonperforming balances and net charge-offs by certain state concentrations for the home equity portfolio. In the New York area, the New York-Northern New Jersey-Long Island MSA made up 13 percent of the outstanding home equity portfolio at both March 31, 2018 and December 31, 2017 . Loans within this MSA contributed 32 percent and 20 percent of net charge-offs within the home equity portfolio for the three
months ended March 31, 2018 and 2017 . The Los Angeles-Long Beach-Santa Ana MSA within California made up 11 percent of the outstanding home equity portfolio at both March 31, 2018 and December 31, 2017 . Loans within this MSA contributed net recoveries of $5 million and $4 million within the home equity portfolio for the three months ended March 31, 2018 and 2017 .
|
|
|
|
|
|
|
|
|
|
|
|
| ||||||||||||
Table 24 | Home Equity State Concentrations | |||||||||||||||||||||||
|
|
|
|
|
|
|
|
|
|
|
|
| ||||||||||||
|
| Outstandings (1) |
| Nonperforming (1) |
| Net Charge-offs (2) | ||||||||||||||||||
|
| March 31 |
| December 31 |
| March 31 |
| December 31 |
| Three Months Ended March 31 | ||||||||||||||
(Dollars in millions) |
|
|
|
| 2018 |
| 2017 | |||||||||||||||||
California | $ | 14,506 | |
| $ | 15,145 | |
| $ | 740 | |
| $ | 766 | |
| $ | (7 | ) |
| $ | (7 | ) | |
Florida (3) | 6,033 | |
| 6,308 | |
| 432 | |
| 411 | |
| 10 | |
| 11 | | |||||||
New Jersey (3) | 4,333 | |
| 4,546 | |
| 190 | |
| 191 | |
| 9 | |
| 10 | | |||||||
New York (3) | 4,024 | |
| 4,195 | |
| 250 | |
| 252 | |
| 6 | |
| 8 | | |||||||
Massachusetts | 2,645 | |
| 2,751 | |
| 90 | |
| 92 | |
| 2 | |
| 1 | | |||||||
Other | 21,222 | |
| 22,083 | |
| 896 | |
| 932 | |
| 13 | |
| 41 | | |||||||
Home equity loans (4) | $ | 52,763 | |
| $ | 55,028 | |
| $ | 2,598 | |
| $ | 2,644 | |
| $ | 33 | |
| $ | 64 | | |
Purchased credit-impaired home equity portfolio (5) | 2,545 | |
| 2,716 | |
|
| |
|
| |
|
| |
|
| | |||||||
Total home equity loan portfolio | $ | 55,308 | |
| $ | 57,744 | |
|
| |
|
| |
|
| |
|
| | |||||
(1) | Outstandings and nonperforming loans exclude loans accounted for under the fair value option. |
(2) | Net charge-offs excluded $18 million and $24 million of write-offs in the home equity PCI loan portfolio for the three months ended March 31, 2018 and 2017 . For more information on PCI write-offs, see Consumer Portfolio Credit Risk Management – Purchased Credit-impaired Loan Portfolio . |
(3) | In these states, foreclosure requires a court order following a legal proceeding (judicial states). |
(4) | Amount excludes the PCI home equity portfolio. |
(5) | At both March 31, 2018 and December 31, 2017 , 28 percent of PCI home equity loans were in California. There were no other significant single state concentrations. |
Purchased Credit-impaired Loan Portfolio
Loans acquired with evidence of credit quality deterioration since origination and for which it is probable at purchase that we will be unable to collect all contractually required payments are accounted for under the accounting standards for PCI loans. For more information, see Note 1 – Summary of Significant Accounting Principles to the Consolidated Financial Statements of the
Corporation's 2017 Annual Report on Form 10-K and Note 5 – Outstanding Loans and Leases to the Consolidated Financial Statements .
Table 25 presents the unpaid principal balance, carrying value, related valuation allowance and the net carrying value as a percentage of the unpaid principal balance for the PCI loan portfolio.
|
|
|
|
|
|
|
|
|
|
| |||||||||
Table 25 | Purchased Credit-impaired Loan Portfolio | ||||||||||||||||||
|
|
|
|
|
|
|
|
|
|
| |||||||||
| Unpaid |
| Gross Carrying |
| Related |
| Carrying Value Net of Valuation Allowance |
| Percent of Unpaid Principal Balance | ||||||||||
(Dollars in millions) | March 31, 2018 | ||||||||||||||||||
Residential mortgage (1) | $ | 7,698 | |
| $ | 7,590 | |
| $ | 84 | |
| $ | 7,506 | |
| 97.51 | % | |
Home equity | 2,614 | |
| 2,545 | |
| 158 | |
| 2,387 | |
| 91.32 | | |||||
Total purchased credit-impaired loan portfolio | $ | 10,312 | |
| $ | 10,135 | |
| $ | 242 | |
| $ | 9,893 | |
| 95.94 | | |
|
|
|
|
|
|
|
|
|
|
| |||||||||
|
| December 31, 2017 | |||||||||||||||||
Residential mortgage (1) | $ | 8,117 | |
| $ | 8,001 | |
| $ | 117 | |
| $ | 7,884 | |
| 97.13 | % | |
Home equity | 2,787 | |
| 2,716 | |
| 172 | |
| 2,544 | |
| 91.28 | | |||||
Total purchased credit-impaired loan portfolio | $ | 10,904 | |
| $ | 10,717 | |
| $ | 289 | |
| $ | 10,428 | |
| 95.63 | | |
(1) | At March 31, 2018 and December 31, 2017 , pay option loans had an unpaid principal balance of $1.3 billion and $1.4 billion and a carrying value of $ 1.3 billion and $ 1.4 billion . This includes $1.1 billion and $1.2 billion of loans that were credit-impaired upon acquisition and $119 million and $141 million of loans that were 90 days or more past due at March 31, 2018 and December 31, 2017 . The total unpaid principal balance of pay option loans with accumulated negative amortization was $134 million and $160 million, including $7 million and $9 million of negative amortization at March 31, 2018 and December 31, 2017 . |
31 Bank of America |
|
|
The total PCI unpaid principal balance decreased $592 million , or five percent , during the three months ended March 31, 2018 primarily driven by payoffs, paydowns, write-offs and PCI loan sales with a carrying value of $109 million compared to no sales during the same period in 2017 .
Of the unpaid principal balance of $10.3 billion at March 31, 2018 , $9.3 billion, or 90 percent, was current based on the contractual terms, $608 million, or six percent, was in early stage delinquency, and $314 million was 180 days or more past due, including $253 million of first-lien mortgages and $61 million of home equity loans.
The PCI residential mortgage loan and home equity portfolios represented 75 percent and 25 percent of the total PCI loan portfolio at March 31, 2018 . Those loans to borrowers with a refreshed FICO score below 620 represented 24 percent and 17 percent of the PCI residential mortgage loan and home equity portfolios at March 31, 2018 . Residential mortgage and home equity loans with a refreshed LTV or CLTV greater than 90 percent, after consideration of purchase accounting adjustments and the related valuation allowance, represented 14 percent and 34 percent of their respective PCI loan portfolios and 15 percent and 36 percent based on the unpaid principal balance at March 31, 2018 .
U.S. Credit Card
At March 31, 2018 , 97 percent of the U.S. credit card portfolio was managed in Consumer Banking with the remainder in GWIM . Outstandings in the U.S. credit card portfolio decreased $3.3 billion to $93.0 billion during the three months ended March 31, 2018 due to paydowns and a seasonal decline in purchase volumes. Net charge-offs increased $95 million to $701 million during the three months ended March 31, 2018 compared to the same period in 2017 due to portfolio seasoning and loan growth. U.S. credit card loans 30 days or more past due and still accruing interest decreased $52 million during the three months ended March 31, 2018 from seasonal declines while loans 90 days or more past due and still accruing interest increased $25 million, driven by the same factors as described for net charge-offs.
Unused lines of credit for U.S. credit card totaled $334.1 billion and $326.3 billion at March 31, 2018 and December 31, 2017 . The increase was driven by a seasonal decrease in line utilization due to a decrease in transaction volume as well as account growth and lines of credit increases.
Table 26 presents certain state concentrations for the U.S. credit card portfolio.
|
|
|
|
|
|
|
|
|
|
|
|
| ||||||||||||
Table 26 | U.S. Credit Card State Concentrations | |||||||||||||||||||||||
|
|
|
|
|
|
|
|
|
|
|
|
| ||||||||||||
|
| Outstandings |
| Accruing Past Due 90 Days or More |
| Net Charge-Offs | ||||||||||||||||||
|
| March 31 |
| December 31 |
| March 31 |
| December 31 |
| Three Months Ended March 31 | ||||||||||||||
(Dollars in millions) |
|
|
|
| 2018 |
| 2017 | |||||||||||||||||
California | $ | 14,841 | |
| $ | 15,254 | |
| $ | 141 | |
| $ | 136 | |
| $ | 116 | |
| $ | 96 | | |
Florida | 8,174 | |
| 8,359 | |
| 116 | |
| 94 | |
| 77 | |
| 67 | | |||||||
Texas | 7,303 | |
| 7,451 | |
| 79 | |
| 76 | |
| 56 | |
| 47 | | |||||||
New York | 5,796 | |
| 5,977 | |
| 91 | |
| 91 | |
| 70 | |
| 45 | | |||||||
Washington | 4,153 | |
| 4,350 | |
| 22 | |
| 20 | |
| 15 | |
| 14 | | |||||||
Other | 52,747 | |
| 54,894 | |
| 476 | |
| 483 | |
| 367 | |
| 337 | | |||||||
Total U.S. credit card portfolio | $ | 93,014 | |
| $ | 96,285 | |
| $ | 925 | |
| $ | 900 | |
| $ | 701 | |
| $ | 606 | | |
Direct/Indirect and Other Consumer
At March 31, 2018 , approximately 54 percent of the direct/indirect portfolio was included in Consumer Banking (consumer auto and specialty lending – automotive, marine, aircraft, recreational vehicle loans and consumer personal loans) and 46 percent was included in GWIM (principally securities-based lending loans). At March 31, 2018 , approximately 95 percent of the $2.9 billion other consumer portfolio was consumer auto leases included in Consumer Banking.
Outstandings in the direct/indirect portfolio decreased $2.6 billion to $91.2 billion during the three months ended March 31, 2018 primarily due to lower draws and seasonal utilization in the securities-based lending portfolio. Net charge-offs increased $10 million to $ 58 million during the three months ended March 31, 2018 compared to the same period in 2017 due largely to portfolio seasoning.
Table 27 presents certain state concentrations for the direct/indirect consumer loan portfolio.
|
|
|
|
|
|
|
|
|
|
|
|
| ||||||||||||
Table 27 | Direct/Indirect State Concentrations | |||||||||||||||||||||||
|
|
|
|
|
|
|
|
|
|
|
|
| ||||||||||||
|
| Outstandings |
| Accruing Past Due |
| Net Charge-Offs | ||||||||||||||||||
|
| March 31 |
| December 31 |
| March 31 |
| December 31 |
| Three Months Ended March 31 | ||||||||||||||
(Dollars in millions) |
|
|
|
| 2018 |
| 2017 | |||||||||||||||||
California | $ | 11,659 | |
| $ | 12,502 | |
| $ | 3 | |
| $ | 3 | |
| $ | 6 | |
| $ | 5 | | |
Florida | 10,612 | |
| 10,946 | |
| 5 | |
| 5 | |
| 9 | |
| 9 | | |||||||
Texas | 10,338 | |
| 10,623 | |
| 4 | |
| 5 | |
| 9 | |
| 10 | | |||||||
New York | 5,907 | |
| 6,058 | |
| 2 | |
| 2 | |
| 3 | |
| 1 | | |||||||
Georgia | 3,483 | |
| 3,502 | |
| 4 | |
| 4 | |
| 4 | |
| 3 | | |||||||
Other | 49,214 | |
| 50,199 | |
| 20 | |
| 21 | |
| 27 | |
| 20 | | |||||||
Total direct/indirect loan portfolio | $ | 91,213 | |
| $ | 93,830 | |
| $ | 38 | |
| $ | 40 | |
| $ | 58 | |
| $ | 48 | | |
|
| Bank of America 32 |
Nonperforming Consumer Loans, Leases and Foreclosed Properties Activity
Table 28 presents nonperforming consumer loans, leases and foreclosed properties activity during the three months ended March 31, 2018 and 2017 . For more information on nonperforming loans, see Note 1 – Summary of Significant Accounting Principles to the Consolidated Financial Statements of the Corporation's 2017 Annual Report on Form 10-K and Note 5 – Outstanding Loans and Leases to the Consolidated Financial Statements . During the three months ended March 31, 2018 , nonperforming consumer loans declined $260 million to $4.9 billion driven by loan sales of $269 million .
At March 31, 2018 , $1.5 billion, or 31 percent, of nonperforming loans were 180 days or more past due and had been written down to their estimated property value less costs to sell. In addition, at March 31, 2018 , $2.2 billion, or 45 percent, of nonperforming consumer loans were modified and are now current after successful trial periods, or are current loans classified as nonperforming loans in accordance with applicable policies.
Foreclosed properties increased $28 million to $264 million during the three months ended March 31, 2018 as additions
outpaced liquidations. PCI loans are excluded from nonperforming loans as these loans were written down to fair value at the acquisition date; however, once we acquire the underlying real estate upon foreclosure of the delinquent PCI loan, it is included in foreclosed properties. Certain delinquent government-guaranteed loans (principally FHA-insured loans) are excluded from our nonperforming loans and foreclosed properties activity as we expect we will be reimbursed once the property is conveyed to the guarantor for principal and, up to certain limits, costs incurred during the foreclosure process and interest accrued during the holding period.
We classify junior-lien home equity loans as nonperforming when the first-lien loan becomes 90 days past due even if the junior-lien loan is performing. At March 31, 2018 and December 31, 2017 , $294 million and $330 million of such junior-lien home equity loans were included in nonperforming loans and leases.
Nonperforming loans also include certain loans that have been modified in TDRs where economic concessions have been granted to borrowers experiencing financial difficulties. Nonperforming TDRs, excluding those modified loans in the PCI loan portfolio, are included in Table 28 .
|
|
|
|
| ||||
Table 28 | Nonperforming Consumer Loans, Leases and Foreclosed Properties Activity (1) |
|
|
| ||||
|
|
|
|
| ||||
|
| Three Months Ended March 31 | ||||||
(Dollars in millions) | 2018 |
| 2017 | |||||
Nonperforming loans and leases, January 1 | $ | 5,166 | |
| $ | 6,004 | | |
Additions | 812 | |
| 818 | | |||
Reductions: |
|
|
| |||||
Paydowns and payoffs | (245 | ) |
| (296 | ) | |||
Sales | (269 | ) |
| (142 | ) | |||
Returns to performing status (2) | (364 | ) |
| (386 | ) | |||
Charge-offs | (147 | ) |
| (174 | ) | |||
Transfers to foreclosed properties | (45 | ) |
| (57 | ) | |||
Transfers to loans held-for-sale | (2 | ) |
| (221 | ) | |||
Total net reductions to nonperforming loans and leases | (260 | ) |
| (458 | ) | |||
Total nonperforming loans and leases, March 31 (3) | 4,906 | |
| 5,546 | | |||
Foreclosed properties, March 31 (4) | 264 | |
| 328 | | |||
Nonperforming consumer loans, leases and foreclosed properties, March 31 | $ | 5,170 | |
| $ | 5,874 | | |
Nonperforming consumer loans and leases as a percentage of outstanding consumer loans and leases (5) | 1.10 | % |
| 1.23 | % | |||
Nonperforming consumer loans, leases and foreclosed properties as a percentage of outstanding consumer loans, leases and foreclosed properties (5) | 1.16 | |
| 1.30 | | |||
(1) | Balances do not include nonperforming LHFS of $4 million and $179 million and nonaccruing TDRs removed from the PCI loan portfolio prior to January 1, 2010 of $24 million and $28 million at March 31, 2018 and 2017 as well as loans accruing past due 90 days or more as presented in Table 18 and Note 5 – Outstanding Loans and Leases to the Consolidated Financial Statements . |
(2) | Consumer loans may be returned to performing status when all principal and interest is current and full repayment of the remaining contractual principal and interest is expected, or when the loan otherwise becomes well-secured and is in the process of collection. |
(3) | At March 31, 2018 , 31 percent of nonperforming loans were 180 days or more past due. |
(4) | Foreclosed property balances do not include properties insured by certain government-guaranteed loans, principally FHA-insured, of $680 million and $1.1 billion at March 31, 2018 and 2017 . |
(5) | Outstanding consumer loans and leases exclude loans accounted for under the fair value option. |
Table 29 presents TDRs for the consumer real estate portfolio. Performing TDR balances are excluded from nonperforming loans and leases in Table 28 .
|
|
|
|
|
|
|
|
|
|
|
|
| ||||||||||||
Table 29 | Consumer Real Estate Troubled Debt Restructurings | |||||||||||||||||||||||
|
|
|
|
|
|
|
|
|
|
|
|
| ||||||||||||
|
| March 31, 2018 |
| December 31, 2017 | ||||||||||||||||||||
(Dollars in millions) | Nonperforming |
| Performing |
| Total |
| Nonperforming |
| Performing |
| Total | |||||||||||||
Residential mortgage (1, 2, 3) | $ | 1,425 | |
| $ | 6,594 | |
| $ | 8,019 | |
| $ | 1,535 | |
| $ | 8,163 | |
| $ | 9,698 | | |
Home equity (4) | 1,444 | |
| 1,409 | |
| 2,853 | |
| 1,457 | |
| 1,399 | |
| 2,856 | | |||||||
Total consumer real estate troubled debt restructurings | $ | 2,869 | |
| $ | 8,003 | |
| $ | 10,872 | |
| $ | 2,992 | |
| $ | 9,562 | |
| $ | 12,554 | | |
(1) | At March 31, 2018 and December 31, 2017 , residential mortgage TDRs deemed collateral dependent totaled $1.8 billion and $2.8 billion , and included $1.1 billion and $1.2 billion of loans classified as nonperforming and $709 million and $1.6 billion of loans classified as performing. |
(2) | Residential mortgage performing TDRs included $3.5 billion and $3.7 billion of loans that were fully-insured at March 31, 2018 and December 31, 2017 . |
(3) | During the three months ended March 31, 2018 , the Corporation transferred impaired residential mortgage loans with a carrying value of $1.2 billion to held for sale. |
(4) | Home equity TDRs deemed collateral dependent totaled $1.6 billion for both periods and included $1.2 billion for both periods of loans classified as nonperforming, and $389 million and $388 million of loans classified as performing at March 31, 2018 and December 31, 2017 . |
33 Bank of America |
|
|
In addition to modifying consumer real estate loans, we work with customers who are experiencing financial difficulty by modifying credit card and other consumer loans. Credit card and other consumer loan modifications generally involve a reduction in the customer's interest rate on the account and placing the customer on a fixed payment plan not exceeding 60 months, all of which are considered TDRs (the renegotiated TDR portfolio).
Modifications of credit card and other consumer loans are made through renegotiation programs utilizing direct customer contact, but may also utilize external renegotiation programs. The renegotiated TDR portfolio is excluded in large part from Table 28 as substantially all of the loans remain on accrual status until either charged off or paid in full. At March 31, 2018 and December 31, 2017 , our renegotiated TDR portfolio was $501 million and $490 million , of which $433 million and $426 million were current or less than 30 days past due under the modified terms. The increase in the renegotiated TDR portfolio was primarily driven by new renegotiated enrollments outpacing the run off of existing portfolios. For more information on the renegotiated TDR portfolio, see Note 5 – Outstanding Loans and Leases to the Consolidated Financial Statements .
Commercial Portfolio Credit Risk Management
Commercial credit risk is evaluated and managed with the goal that concentrations of credit exposure do not result in undesirable levels of risk. We review, measure and manage concentrations of credit exposure by industry, product, geography, customer relationship and loan size. We also review, measure and manage commercial real estate loans by geographic location and property type. In addition, within our non-U.S. portfolio, we evaluate exposures by region and by country. Tables 34 , 37 and 42 summarize our concentrations. We also utilize syndications of exposure to third parties, loan sales, hedging and other risk
mitigation techniques to manage the size and risk profile of the commercial credit portfolio. For more information on our industry concentrations, see Commercial Portfolio Credit Risk Management – Industry Concentrations on page 37 and Table 37 .
For more information on our accounting policies regarding nonperforming status, net charge-offs and delinquencies for the commercial portfolio, see Note 1 – Summary of Significant Accounting Principles to the Consolidated Financial Statements of the Corporation's 2017 Annual Report on Form 10-K .
Commercial Credit Portfolio
During the three months ended March 31, 2018 , credit quality among large corporate borrowers was strong and there was continued improvement in the energy portfolio. Credit quality of commercial real estate borrowers continued to be strong with conservative LTV ratios, stable market rents in most sectors and vacancy rates that remain low.
Total commercial utilized credit exposure increased $8.9 billion during the three months ended March 31, 2018 primarily driven by increases in derivative assets and loans and leases, partially offset by decreases in LHFS. The utilization rate for loans and leases, standby letters of credit (SBLCs) and financial guarantees, and commercial letters of credit, in the aggregate, was 58 percent and 59 percent at March 31, 2018 and December 31, 2017 .
Table 30 presents commercial credit exposure by type for utilized, unfunded and total binding committed credit exposure. Commercial utilized credit exposure includes SBLCs and financial guarantees and commercial letters of credit that have been issued and for which we are legally bound to advance funds under prescribed conditions during a specified time period, and excludes exposure related to trading account assets. Although funds have not yet been advanced, these exposure types are considered utilized for credit risk management purposes.
|
|
|
|
|
|
|
|
|
|
|
|
| ||||||||||||
Table 30 | Commercial Credit Exposure by Type | |||||||||||||||||||||||
|
|
|
|
|
|
|
|
|
|
|
|
| ||||||||||||
|
| Commercial Utilized (1) |
| Commercial Unfunded (2, 3, 4) |
| Total Commercial Committed | ||||||||||||||||||
(Dollars in millions) | March 31 |
| December 31 |
| March 31 |
| December 31 |
| March 31 |
| December 31 | |||||||||||||
Loans and leases (5) | $ | 492,900 | |
| $ | 487,748 | |
| $ | 375,888 | |
| $ | 364,743 | |
| $ | 868,788 | |
| $ | 852,491 | | |
Derivative assets (6) | 47,869 | |
| 37,762 | |
| - | |
| - | |
| 47,869 | |
| 37,762 | | |||||||
Standby letters of credit and financial guarantees | 33,969 | |
| 34,517 | |
| 583 | |
| 863 | |
| 34,552 | |
| 35,380 | | |||||||
Debt securities and other investments | 26,998 | |
| 28,161 | |
| 4,461 | |
| 4,864 | |
| 31,459 | |
| 33,025 | | |||||||
Loans held-for-sale | 5,653 | |
| 10,257 | |
| 16,887 | |
| 9,742 | |
| 22,540 | |
| 19,999 | | |||||||
Commercial letters of credit | 1,351 | |
| 1,467 | |
| 117 | |
| 155 | |
| 1,468 | |
| 1,622 | | |||||||
Other | 948 | |
| 888 | |
| - | |
| - | |
| 948 | |
| 888 | | |||||||
Total |
| $ | 609,688 | |
| $ | 600,800 | |
| $ | 397,936 | |
| $ | 380,367 | |
| $ | 1,007,624 | |
| $ | 981,167 | |
(1) | Commercial utilized exposure includes loans of $5.1 billion and $4.8 billion and issued letters of credit with a notional amount of $193 million and $232 million accounted for under the fair value option at March 31, 2018 and December 31, 2017 . |
(2) | Commercial unfunded exposure includes commitments accounted for under the fair value option with a notional amount of $4.2 billion and $4.6 billion at March 31, 2018 and December 31, 2017 . |
(3) | Excludes unused business card lines, which are not legally binding. |
(4) | Includes the notional amount of unfunded legally binding lending commitments net of amounts distributed (i.e., syndicated or participated) to other financial institutions. The distributed amounts were $10.9 billion and $11.0 billion at March 31, 2018 and December 31, 2017 . |
(5) | Includes credit risk exposure associated with assets under operating lease arrangements of $6.2 billion and $6.3 billion at March 31, 2018 and December 31, 2017 . |
(6) | Derivative assets are carried at fair value, reflect the effects of legally enforceable master netting agreements and have been reduced by cash collateral of $36.5 billion and $34.6 billion at March 31, 2018 and December 31, 2017 . Not reflected in utilized and committed exposure is additional non-cash derivative collateral held of $36.9 billion and $26.2 billion at March 31, 2018 and December 31, 2017 , which consists primarily of other marketable securities. |
Outstanding commercial loans and leases increased $5.2 billion during the three months ended March 31, 2018 primarily due to growth in commercial and industrial loans. During the three months ended March 31, 2018 , reservable criticized balances decreased $197 million to $13.4 billion primarily driven by improvements in the energy sector, while nonperforming commercial loans and leases, excluding loans accounted for under
the fair value option, increased $168 million to $1.5 billion . The allowance for loan and lease losses for the commercial portfolio was unchanged at $5.0 billion at March 31, 2018 . For more information, see Allowance for Credit Losses on page 41 . Table 31 presents our commercial loans and leases portfolio and related credit quality information at March 31, 2018 and December 31, 2017 .
|
| Bank of America 34 |
|
|
|
|
|
|
|
|
|
|
|
|
| ||||||||||||
Table 31 | Commercial Credit Quality | |||||||||||||||||||||||
|
|
| ||||||||||||||||||||||
|
| Outstandings |
| Nonperforming |
| Accruing Past Due 90 Days or More | ||||||||||||||||||
(Dollars in millions) | March 31 |
| December 31 |
| March 31 |
| December 31 |
| March 31 |
| December 31 | |||||||||||||
Commercial and industrial: |
|
|
|
|
|
|
|
|
|
|
| |||||||||||||
U.S. commercial | $ | 288,476 | |
| $ | 284,836 | |
| $ | 1,059 | |
| $ | 814 | |
| $ | 98 | |
| $ | 144 | | |
Non-U.S. commercial | 97,365 | |
| 97,792 | |
| 255 | |
| 299 | |
| - | |
| 3 | | |||||||
Total commercial and industrial | 385,841 | |
| 382,628 | |
| 1,314 | |
| 1,113 | |
| 98 | |
| 147 | | |||||||
Commercial real estate (1) | 60,085 | |
| 58,298 | |
| 73 | |
| 112 | |
| 13 | |
| 4 | | |||||||
Commercial lease financing | 21,764 | |
| 22,116 | |
| 27 | |
| 24 | |
| 8 | |
| 19 | | |||||||
| 467,690 | |
| 463,042 | |
| 1,414 | |
| 1,249 | |
| 119 | |
| 170 | | |||||||
U.S. small business commercial (2) | 13,892 | |
| 13,649 | |
| 58 | |
| 55 | |
| 76 | |
| 75 | | |||||||
Commercial loans excluding loans accounted for under the fair value option | 481,582 | |
| 476,691 | |
| 1,472 | |
| 1,304 | |
| 195 | |
| 245 | | |||||||
Loans accounted for under the fair value option (3) | 5,095 | |
| 4,782 | |
| 12 | |
| 43 | |
| - | |
| - | | |||||||
Total commercial loans and leases | $ | 486,677 | |
| $ | 481,473 | |
| $ | 1,484 | |
| $ | 1,347 | |
| $ | 195 | |
| $ | 245 | | |
(1) | Includes U.S. commercial real estate of $55.6 billion and $54.8 billion and non-U.S. commercial real estate of $4.5 billion and $3.5 billion at March 31, 2018 and December 31, 2017 . |
(2) | Includes card-related products. |
(3) | Commercial loans accounted for under the fair value option include U.S. commercial of $3.2 billion and $2.6 billion and non-U.S. commercial of $1.9 billion and $2.2 billion at March 31, 2018 and December 31, 2017 . For more information on the fair value option, see Note 15 – Fair Value Option to the Consolidated Financial Statements . |
Table 32 presents net charge-offs and related ratios for our commercial loans and leases for the three months ended March 31, 2018 and 2017 . Net charge-offs declined $26 million for the three months ended March 31, 2018 compared to the same period in 2017 .
|
|
|
|
|
|
|
|
| ||||||
Table 32 | Commercial Net Charge-offs and Related Ratios | |||||||||||||
|
|
|
|
|
| |||||||||
|
| Net Charge-offs |
| Net Charge-off Ratios (1) | ||||||||||
|
| Three Months Ended March 31 | ||||||||||||
(Dollars in millions) | 2018 |
| 2017 |
| 2018 |
| 2017 | |||||||
Commercial and industrial: |
|
|
|
|
|
|
| |||||||
U.S. commercial | $ | 24 | |
| $ | 44 | |
| 0.03 | % |
| 0.06 | % | |
Non-U.S. commercial | 4 | |
| 15 | |
| 0.02 | |
| 0.07 | | |||
Total commercial and industrial | 28 | |
| 59 | |
| 0.03 | |
| 0.07 | | |||
Commercial real estate | (3 | ) |
| (4 | ) |
| (0.02 | ) |
| (0.03 | ) | |||
Commercial lease financing | (1 | ) |
| - | |
| (0.01 | ) |
| - | | |||
|
| 24 | |
| 55 | |
| 0.02 | |
| 0.05 | | ||
U.S. small business commercial | 57 | |
| 52 | |
| 1.67 | |
| 1.61 | | |||
Total commercial | $ | 81 | |
| $ | 107 | |
| 0.07 | |
| 0.10 | | |
(1) | Net charge-off ratios are calculated as net charge-offs divided by average outstanding loans and leases excluding loans accounted for under the fair value option. |
Table 33 presents commercial utilized reservable criticized exposure by loan type. Criticized exposure corresponds to the Special Mention, Substandard and Doubtful asset categories as defined by regulatory authorities. Total commercial utilized reservable criticized exposure decreased $197 million , or one percent , during the three months ended March 31, 2018 primarily driven by upgrades and paydowns in the energy portfolio. Approximately 86 percent and 84 percent of commercial utilized reservable criticized exposure was secured at March 31, 2018 and December 31, 2017 .
|
|
|
|
|
|
|
|
| ||||||
Table 33 | Commercial Utilized Reservable Criticized Exposure | |||||||||||||
|
|
|
|
|
|
|
|
| ||||||
|
| Amount (1) |
| Percent (2) |
| Amount (1) |
| Percent (2) | ||||||
(Dollars in millions) | March 31, 2018 |
| December 31, 2017 | |||||||||||
Commercial and industrial: | ||||||||||||||
U.S. commercial | $ | 9,874 | |
| 3.12 | % |
| $ | 9,891 | |
| 3.15 | % | |
Non-U.S. commercial | 1,719 | |
| 1.66 | |
| 1,766 | |
| 1.70 | | |||
Total commercial and industrial | 11,593 | |
| 2.76 | |
| 11,657 | |
| 2.79 | | |||
Commercial real estate | 523 | |
| 0.85 | |
| 566 | |
| 0.95 | | |||
Commercial lease financing | 489 | |
| 2.25 | |
| 581 | |
| 2.63 | | |||
|
| 12,605 | |
| 2.50 | |
| 12,804 | |
| 2.57 | | ||
U.S. small business commercial | 761 | |
| 5.48 | |
| 759 | |
| 5.56 | | |||
Total commercial utilized reservable criticized exposure | $ | 13,366 | |
| 2.58 | |
| $ | 13,563 | |
| 2.65 | | |
(1) | Total commercial utilized reservable criticized exposure includes loans and leases of $12.3 billion and $12.5 billion and commercial letters of credit of $1.1 billion at both March 31, 2018 and December 31, 2017 . |
(2) | Percentages are calculated as commercial utilized reservable criticized exposure divided by total commercial utilized reservable exposure for each exposure category. |
35 Bank of America |
|
|
Commercial and Industrial
Commercial and industrial loans include U.S. commercial and non-U.S. commercial portfolios.
U.S. Commercial
At March 31, 2018 , 70 percent of the U.S. commercial loan portfolio, excluding small business, was managed in Global Banking, 17 percent in Global Markets , 12 percent in GWIM (generally business-purpose loans for high net worth clients) and the remainder primarily in Consumer Banking . U.S. commercial loans, excluding loans accounted for under the fair value option, increased $3.6 billion , or one percent , during the three months ended March 31, 2018 due to growth across most of the commercial businesses. Nonperforming loans and leases increased $245 million , or 30 percent, during the three months ended March 31, 2018 driven by a small number of client downgrades across industries. Reservable criticized balances decreased $17 million , or less than one percent. Net charge-offs decreased $20 million for the three months ended March 31, 2018 compared to the same period in 2017 .
Non-U.S. Commercial
At March 31, 2018 , 79 percent of the non-U.S. commercial loan portfolio was managed in Global Banking and 21 percent in Global Markets . Outstanding loans, excluding loans accounted for under the fair value option, decreased $427 million during the three months ended March 31, 2018 . Nonperforming loans and leases decreased $44 million , or 15 percent , and reservable criticized balances decreased $47 million , or three percent . Net charge-offs decreased $11 million for the three months ended March 31, 2018 to $4 million . For more information on the non-U.S. commercial portfolio, see Non-U.S. Portfolio on page 40 .
Commercial Real Estate
Commercial real estate primarily includes commercial loans and leases secured by non-owner-occupied real estate and is dependent on the sale or lease of the real estate as the primary source of repayment. The portfolio remains diversified across property types and geographic regions. California represented the largest state concentration at 23 percent of the commercial real estate loans and leases portfolio at both March 31, 2018 and December 31, 2017 . The commercial real estate portfolio is predominantly managed in Global Banking and consists of loans made primarily to public and private developers, and commercial real estate firms. Outstanding loans increased $1.8 billion , or three percent , during the three months ended March 31, 2018 to $60.1 billion due to new originations outpacing paydowns.
For the three months ended March 31, 2018 , we continued to see low default rates and solid credit quality in both the residential and non-residential portfolios. We use a number of proactive risk mitigation initiatives to reduce adversely rated exposure in the commercial real estate portfolio, including transfers of deteriorating exposures to management by independent special asset officers and the pursuit of loan restructurings or asset sales to achieve the best results for our customers and the Corporation.
Nonperforming commercial real estate loans and foreclosed properties decreased $39 million , or 24 percent , during the three months ended March 31, 2018 to $125 million at March 31, 2018 and reservable criticized balances decreased $ 43 million , or eight percent, to $523 million primarily due to loan paydowns. Net recoveries were $3 million for the three months ended March 31, 2018 compared to $4 million for the same period in 2017 .
Table 34 presents outstanding commercial real estate loans by geographic region, based on the geographic location of the collateral, and by property type.
|
|
|
|
| ||||
Table 34 | Outstanding Commercial Real Estate Loans | |||||||
|
|
|
|
| ||||
(Dollars in millions) | March 31 |
| December 31 | |||||
By Geographic Region |
| |
|
| | |||
California | $ | 14,059 | |
| $ | 13,607 | | |
Northeast | 9,898 | |
| 10,072 | | |||
Southwest | 7,092 | |
| 6,970 | | |||
Southeast | 5,708 | |
| 5,487 | | |||
Midwest | 3,883 | |
| 3,769 | | |||
Florida | 3,425 | |
| 3,170 | | |||
Midsouth | 3,386 | |
| 2,962 | | |||
Illinois | 2,838 | |
| 3,263 | | |||
Northwest | 2,487 | |
| 2,657 | | |||
Non-U.S. | 4,506 | |
| 3,538 | | |||
Other (1) | 2,803 | |
| 2,803 | | |||
Total outstanding commercial real estate loans | $ | 60,085 | |
| $ | 58,298 | | |
By Property Type |
| |
|
| | |||
Non-residential |
|
|
| |||||
Office | $ | 17,442 | |
| $ | 16,718 | | |
Shopping centers / Retail | 8,927 | |
| 8,825 | | |||
Multi-family rental | 8,401 | |
| 8,280 | | |||
Hotels / Motels | 6,410 | |
| 6,344 | | |||
Industrial / Warehouse | 5,948 | |
| 6,070 | | |||
Unsecured | 3,039 | |
| 2,187 | | |||
Multi-use | 2,445 | |
| 2,771 | | |||
Land and land development | 149 | |
| 160 | | |||
Other | 6,101 | |
| 5,485 | | |||
Total non-residential | 58,862 | |
| 56,840 | | |||
Residential | 1,223 | |
| 1,458 | | |||
Total outstanding commercial real estate loans | $ | 60,085 | |
| $ | 58,298 | | |
(1) | Includes unsecured loans to real estate investment trusts and national home builders whose portfolios of properties span multiple geographic regions and properties in the states of Colorado, Utah, Hawaii, Wyoming and Montana. |
|
| Bank of America 36 |
U.S. Small Business Commercial
The U.S. small business commercial loan portfolio is comprised of small business card loans and small business loans managed in Consumer Banking . Credit card-related products were 50 percent of the U.S. small business commercial portfolio at both March 31, 2018 and December 31, 2017 . Net charge-offs were $57 million for the three months ended March 31, 2018 compared to $52 million for the same period in 2017 . Of the U.S. small business commercial net charge-offs, 95 percent were credit card-related products for the three months ended March 31, 2018 compared to 88 percent for the same period in 2017 .
Nonperforming Commercial Loans, Leases and Foreclosed Properties Activity
Table 35 presents the nonperforming commercial loans, leases and foreclosed properties activity during the three months ended March 31, 2018 and 2017 . Nonperforming loans do not include loans accounted for under the fair value option. During the three months ended March 31, 2018 , nonperforming commercial loans and leases increased $168 million to $1.5 billion . Approximately 83 percent of commercial nonperforming loans, leases and foreclosed properties were secured and approximately 55 percent were contractually current. Commercial nonperforming loans were carried at approximately 89 percent of their unpaid principal balance before consideration of the allowance for loan and lease losses as the carrying value of these loans has been reduced to the estimated property value less costs to sell.
|
|
|
|
| ||||
Table 35 | Nonperforming Commercial Loans, Leases and Foreclosed Properties Activity (1, 2) | |||||||
|
|
| ||||||
|
| Three Months Ended March 31 | ||||||
(Dollars in millions) | 2018 |
| 2017 | |||||
Nonperforming loans and leases, January 1 | $ | 1,304 | |
| $ | 1,703 | | |
Additions | 436 | |
| 472 | | |||
Reductions: |
|
|
| | ||||
Paydowns | (169 | ) |
| (267 | ) | |||
Sales | (24 | ) |
| (22 | ) | |||
Returns to performing status (3) | (27 | ) |
| (54 | ) | |||
Charge-offs | (48 | ) |
| (82 | ) | |||
Transfers to foreclosed properties | - | |
| (22 | ) | |||
Total net additions to nonperforming loans and leases | 168 | |
| 25 | | |||
Total nonperforming loans and leases, March 31 | 1,472 | |
| 1,728 | | |||
Foreclosed properties, March 31 | 52 | |
| 35 | | |||
Nonperforming commercial loans, leases and foreclosed properties, March 31 | $ | 1,524 | |
| $ | 1,763 | | |
Nonperforming commercial loans and leases as a percentage of outstanding commercial loans and leases (4) | 0.31 | % |
| 0.38 | % | |||
Nonperforming commercial loans, leases and foreclosed properties as a percentage of outstanding commercial loans, leases and foreclosed properties (4) | 0.32 | |
| 0.39 | | |||
(1) | Balances do not include nonperforming LHFS of $228 million and $246 million at March 31, 2018 and 2017 . |
(2) | Includes U.S. small business commercial activity. Small business card loans are excluded as they are not classified as nonperforming. |
(3) | Commercial loans and leases may be returned to performing status when all principal and interest is current and full repayment of the remaining contractual principal and interest is expected, or when the loan otherwise becomes well-secured and is in the process of collection. TDRs are generally classified as performing after a sustained period of demonstrated payment performance. |
(4) | Outstanding commercial loans exclude loans accounted for under the fair value option. |
Table 36 presents our commercial TDRs by product type and performing status. U.S. small business commercial TDRs are comprised of renegotiated small business card loans and small business loans. The renegotiated small business card loans are not classified as nonperforming as they are charged off no later than the end of the month in which the loan becomes 180 days past due. For more information on TDRs, see Note 5 – Outstanding Loans and Leases to the Consolidated Financial Statements .
|
|
|
|
|
|
|
|
|
|
|
|
| ||||||||||||
Table 36 | Commercial Troubled Debt Restructurings | |||||||||||||||||||||||
|
|
| ||||||||||||||||||||||
|
| March 31, 2018 |
| December 31, 2017 | ||||||||||||||||||||
(Dollars in millions) | Nonperforming |
| Performing |
| Total |
| Nonperforming |
| Performing |
| Total | |||||||||||||
Commercial and industrial: | ||||||||||||||||||||||||
U.S. commercial | $ | 432 | |
| $ | 919 | |
| $ | 1,351 | |
| $ | 370 | |
| $ | 866 | |
| $ | 1,236 | | |
Non-U.S. commercial | 224 | |
| 220 | |
| 444 | |
| 11 | |
| 219 | |
| 230 | | |||||||
Total commercial and industrial | 656 | |
| 1,139 | |
| 1,795 | |
| 381 | |
| 1,085 | |
| 1,466 | | |||||||
Commercial real estate | 18 | |
| 3 | |
| 21 | |
| 38 | |
| 9 | |
| 47 | | |||||||
Commercial lease financing | 4 | |
| 11 | |
| 15 | |
| 5 | |
| 13 | |
| 18 | | |||||||
| 678 | |
| 1,153 | |
| 1,831 | |
| 424 | |
| 1,107 | |
| 1,531 | | |||||||
U.S. small business commercial | 4 | |
| 16 | |
| 20 | |
| 4 | |
| 15 | |
| 19 | | |||||||
Total commercial troubled debt restructurings | $ | 682 | |
| $ | 1,169 | |
| $ | 1,851 | |
| $ | 428 | |
| $ | 1,122 | |
| $ | 1,550 | | |
Industry Concentrations
Table 37 presents commercial committed and utilized credit exposure by industry and the total net credit default protection purchased to cover the funded and unfunded portions of certain credit exposures. Our commercial credit exposure is diversified across a broad range of industries. Total commercial committed exposure increased $26.5 billion , or three percent, during the three
months ended March 31, 2018 to $1.0 trillion . The increase in commercial committed exposure was concentrated in the Asset Managers and Funds, Real Estate, Capital Goods, Materials and Media industry sectors. Increases were partially offset by reduced exposure to the Food and Staples Retailing and Retailing industry sectors.
37 Bank of America |
|
|
Industry limits are used internally to manage industry concentrations and are based on committed exposure that is allocated on an industry-by-industry basis. A risk management framework is in place to set and approve industry limits as well as to provide ongoing monitoring. The Management Risk Committee oversees industry limit governance.
Asset Managers and Funds, our largest industry concentration with committed exposure of $103.5 billion , increased $12.4 billion , or 14 percent , during the three months ended March 31, 2018 . The increase primarily reflected an increase in exposure to several counterparties.
Real Estate, our second largest industry concentration with committed exposure of $88.8 billion , increased $5.0 billion , or six percent , during the three months ended March 31, 2018 . For more information on the commercial real estate and related portfolios, see Commercial Portfolio Credit Risk Management – Commercial Real Estate on page 36 .
Capital Goods, our third largest industry concentration with committed exposure of $73.7 billion , increased $3.2 billion , or five percent , during the three months ended March 31, 2018 . The increase in committed exposure occurred primarily as a result of increases in aerospace and defense and large conglomerates.
Our energy-related committed exposure decreased $1.2 billion , or three percent , during the three months ended March 31, 2018 to $35.6 billion . Energy sector net charge-offs were $11 million for the three months ended March 31, 2018 compared to $3 million for the same period in 2017. Energy sector reservable criticized exposure decreased $228 million during the three months ended March 31, 2018 to $1.4 billion due to improvement in credit quality of some borrowers coupled with exposure reductions. The energy allowance for credit losses decreased $75 million during the three months ended March 31, 2018 to $485 million.
|
|
|
|
|
|
|
|
| ||||||||
Table 37 | Commercial Credit Exposure by Industry (1) | |||||||||||||||
|
|
|
|
|
|
|
|
| ||||||||
|
| Commercial Utilized |
| Total Commercial Committed (2) | ||||||||||||
(Dollars in millions) | March 31 |
| December 31 |
| March 31 |
| December 31 | |||||||||
Asset managers and funds | $ | 70,819 | |
| $ | 59,190 | |
| $ | 103,466 | |
| $ | 91,092 | | |
Real estate (3) | 64,507 | |
| 61,940 | |
| 88,750 | |
| 83,773 | | |||||
Capital goods | 39,560 | |
| 36,705 | |
| 73,650 | |
| 70,417 | | |||||
Healthcare equipment and services | 37,456 | |
| 37,780 | |
| 58,960 | |
| 57,256 | | |||||
Government and public education | 47,499 | |
| 48,684 | |
| 57,269 | |
| 58,067 | | |||||
Finance companies | 31,984 | |
| 34,050 | |
| 52,392 | |
| 53,107 | | |||||
Materials | 26,213 | |
| 24,001 | |
| 50,569 | |
| 47,386 | | |||||
Retailing | 25,679 | |
| 26,117 | |
| 45,241 | |
| 48,796 | | |||||
Food, beverage and tobacco | 22,351 | |
| 23,252 | |
| 44,620 | |
| 42,815 | | |||||
Consumer services | 27,160 | |
| 27,191 | |
| 43,005 | |
| 43,605 | | |||||
Media | 13,089 | |
| 19,155 | |
| 36,778 | |
| 33,955 | | |||||
Commercial services and supplies | 22,686 | |
| 22,100 | |
| 36,387 | |
| 35,496 | | |||||
Energy | 15,888 | |
| 16,345 | |
| 35,564 | |
| 36,765 | | |||||
Global commercial banks | 28,142 | |
| 29,491 | |
| 30,218 | |
| 31,764 | | |||||
Transportation | 21,652 | |
| 21,704 | |
| 30,121 | |
| 29,946 | | |||||
Utilities | 11,515 | |
| 11,342 | |
| 28,639 | |
| 27,935 | | |||||
Individuals and trusts | 19,276 | |
| 18,549 | |
| 25,161 | |
| 25,097 | | |||||
Technology hardware and equipment | 10,116 | |
| 10,728 | |
| 21,691 | |
| 22,071 | | |||||
Software and services | 7,971 | |
| 8,562 | |
| 20,757 | |
| 18,202 | | |||||
Vehicle dealers | 16,621 | |
| 16,896 | |
| 20,409 | |
| 20,361 | | |||||
Pharmaceuticals and biotechnology | 4,785 | |
| 5,653 | |
| 20,116 | |
| 18,623 | | |||||
Consumer durables and apparel | 9,286 | |
| 8,859 | |
| 18,535 | |
| 17,296 | | |||||
Automobiles and components | 7,097 | |
| 5,988 | |
| 13,993 | |
| 13,318 | | |||||
Insurance | 6,230 | |
| 6,411 | |
| 12,853 | |
| 12,990 | | |||||
Telecommunication services | 6,234 | |
| 6,389 | |
| 12,823 | |
| 13,108 | | |||||
Food and staples retailing | 5,298 | |
| 4,955 | |
| 11,452 | |
| 15,589 | | |||||
Religious and social organizations | 3,823 | |
| 4,454 | |
| 5,697 | |
| 6,318 | | |||||
Financial markets infrastructure (clearinghouses) | 1,499 | |
| 688 | |
| 3,261 | |
| 2,403 | | |||||
Other | 5,252 | |
| 3,621 | |
| 5,247 | |
| 3,616 | | |||||
Total commercial credit exposure by industry | $ | 609,688 | |
| $ | 600,800 | |
| $ | 1,007,624 | |
| $ | 981,167 | | |
Net credit default protection purchased on total commitments (4) |
| |
|
| |
| $ | (2,194 | ) |
| $ | (2,129 | ) | |||
(1) | Includes U.S. small business commercial exposure. |
(2) | Includes the notional amount of unfunded legally binding lending commitments net of amounts distributed (i.e., syndicated or participated) to other financial institutions. The distributed amounts were $ 10.9 billion and $11.0 billion at March 31, 2018 and December 31, 2017 . |
(3) | Industries are viewed from a variety of perspectives to best isolate the perceived risks. For purposes of this table, the real estate industry is defined based on the borrowers' or counterparties' primary business activity using operating cash flows and primary source of repayment as key factors. |
(4) | Represents net notional credit protection purchased. For more information, see Commercial Portfolio Credit Risk Management – Risk Mitigation . |
Risk Mitigation
We purchase credit protection to cover the funded portion as well as the unfunded portion of certain credit exposures. To lower the cost of obtaining our desired credit protection levels, we may add credit exposure within an industry, borrower or counterparty group by selling protection.
At March 31, 2018 and December 31, 2017 , net notional credit default protection purchased in our credit derivatives portfolio to hedge our funded and unfunded exposures for which we elected the fair value option, as well as certain other credit exposures, was $2.2 billion and $2.1 billion . We recorded net losses of $9 million for the three months ended March 31, 2018 compared to net losses of $31 million for the same period in 2017 on these
|
| Bank of America 38 |
positions. The gains and losses on these instruments were offset by gains and losses on the related exposures. The Value-at-Risk
(VaR) results for these exposures are included in the fair value option portfolio information in Table 45 . For more information, see Trading Risk Management on page 43 .
Tables 38 and 39 present the maturity profiles and the credit exposure debt ratings of the net credit default protection portfolio at March 31, 2018 and December 31, 2017 .
|
|
|
|
| ||
Table 38 | Net Credit Default Protection by Maturity | |||||
|
|
|
|
| ||
| March 31 |
| December 31 | |||
Less than or equal to one year | 40 | % |
| 42 | % | |
Greater than one year and less than or equal to five years | 53 | |
| 58 | | |
Greater than five years | 7 | |
| - | | |
Total net credit default protection | 100 | % |
| 100 | % | |
|
|
|
|
|
|
|
|
| ||||||
Table 39 | Net Credit Default Protection by Credit Exposure Debt Rating | |||||||||||||
|
|
|
|
|
|
|
|
| ||||||
|
| Net |
| Percent of |
| Net |
| Percent of | ||||||
(Dollars in millions) | March 31, 2018 |
| December 31, 2017 | |||||||||||
Ratings (2, 3) |
| |
|
| |
|
| |
|
| | |||
A | $ | (375 | ) |
| 17.1 | % |
| $ | (280 | ) |
| 13.2 | % | |
BBB | (326 | ) |
| 14.9 | |
| (459 | ) |
| 21.6 | | |||
BB | (1,152 | ) |
| 52.5 | |
| (893 | ) |
| 41.9 | | |||
B | (208 | ) |
| 9.5 | |
| (403 | ) |
| 18.9 | | |||
CCC and below | (118 | ) |
| 5.4 | |
| (84 | ) |
| 3.9 | | |||
NR (4) | (15 | ) |
| 0.6 | |
| (10 | ) |
| 0.5 | | |||
Total net credit default protection | $ | (2,194 | ) |
| 100.0 | % |
| $ | (2,129 | ) |
| 100.0 | % | |
(1) | Represents net credit default protection purchased. |
(2) | Ratings are refreshed on a quarterly basis. |
(3) | Ratings of BBB- or higher are considered to meet the definition of investment grade. |
(4) | NR is comprised of index positions held and any names that have not been rated. |
In addition to our net notional credit default protection purchased to cover the funded and unfunded portion of certain credit exposures, credit derivatives are used for market-making activities for clients and establishing positions intended to profit from directional or relative value changes. We execute the majority of our credit derivative trades in the OTC market with large, multinational financial institutions, including broker-dealers and, to a lesser degree, with a variety of other investors. Because these transactions are executed in the OTC market, we are subject to settlement risk. We are also subject to credit risk in the event that these counterparties fail to perform under the terms of these contracts. In most cases, credit derivative transactions are executed on a daily margin basis. Therefore, events such as a credit downgrade, depending on the ultimate rating level, or a breach of credit covenants would typically require an increase in the amount of collateral required by the counterparty, where applicable, and/or allow us to take additional protective measures such as early termination of all trades.
Table 40 presents the total contract/notional amount of credit derivatives outstanding and includes both purchased and written credit derivatives. The credit risk amounts are measured as net asset exposure by counterparty, taking into consideration all contracts with the counterparty. For more information on our written credit derivatives, see Note 3 – Derivatives to the Consolidated Financial Statements .
The credit risk amounts discussed above and presented in Table 40 take into consideration the effects of legally enforceable master netting agreements while amounts disclosed in Note 3 – Derivatives to the Consolidated Financial Statements are shown on a gross basis. Credit risk reflects the potential benefit from offsetting exposure to non-credit derivative products with the same counterparties that may be netted upon the occurrence of certain events, thereby reducing our overall exposure.
|
|
|
|
| ||||
Table 40 | Credit Derivatives | |||||||
|
|
|
|
| ||||
|
| Contract/ |
| Credit Risk | ||||
(Dollars in millions) | March 31, 2018 | |||||||
Purchased credit derivatives: |
| |
|
| | |||
Credit default swaps | $ | 484,071 | |
| $ | 2,383 | | |
Total return swaps/options | 67,587 | |
| 298 | | |||
Total purchased credit derivatives | $ | 551,658 | |
| $ | 2,681 | | |
Written credit derivatives: |
| |
|
| | |||
Credit default swaps | $ | 457,370 | |
| n/a | | ||
Total return swaps/options | 65,220 | |
| n/a | | |||
Total written credit derivatives | $ | 522,590 | |
| n/a | | ||
|
|
|
|
| ||||
|
| December 31, 2017 | ||||||
Purchased credit derivatives: |
| |
|
| | |||
Credit default swaps | $ | 470,907 | |
| $ | 2,434 | | |
Total return swaps/options | 54,135 | |
| 277 | | |||
Total purchased credit derivatives | $ | 525,042 | |
| $ | 2,711 | | |
Written credit derivatives: |
| |
|
| | |||
Credit default swaps | $ | 448,201 | |
| n/a | | ||
Total return swaps/options | 55,223 | |
| n/a | | |||
Total written credit derivatives | $ | 503,424 | |
| n/a | | ||
n/a = not applicable
Counterparty Credit Risk Valuation Adjustments
We record counterparty credit risk valuation adjustments on certain derivative assets, including our credit default protection purchased, in order to properly reflect the credit risk of the counterparty, as presented in Table 41 . We calculate credit valuation adjustments (CVA) based on a modeled expected exposure that incorporates current market risk factors including changes in market spreads and non-credit related market factors that affect the value of a derivative. The exposure also takes into consideration credit mitigants such as legally enforceable master netting agreements and collateral. For more information, see Note 3 – Derivatives to the Consolidated Financial Statements .
We enter into risk management activities to offset market driven exposures. We often hedge the counterparty spread risk in CVA with credit default swaps (CDS). We hedge other market risks in CVA primarily with currency and interest rate swaps. In certain instances, the net-of-hedge amounts in the following table move in the same direction as the gross amount or may move in the opposite direction. This movement is a consequence of the complex interaction of the risks being hedged, resulting in limitations in the ability to perfectly hedge all of the market exposures at all times.
|
|
|
|
|
|
|
|
| ||||||||||||
Table 41 | Credit Valuation Gains and Losses | |||||||||||||||||||
|
|
|
|
| ||||||||||||||||
|
| Three Months Ended March 31 | ||||||||||||||||||
(Dollars in millions) | 2018 |
| 2017 | |||||||||||||||||
Gains (Losses) | Gross | Hedge | Net |
| Gross | Hedge | Net | |||||||||||||
Credit valuation | $ | (24 | ) | $ | 42 | | $ | 18 | |
| $ | 161 | | $ | (135 | ) | $ | 26 | | |
39 Bank of America |
|
|
Non-U.S. Portfolio
Our non-U.S. credit and trading portfolios are subject to country risk. We define country risk as the risk of loss from unfavorable economic and political conditions, currency fluctuations, social instability and changes in government policies. A risk management framework is in place to measure, monitor and manage non-U.S. risk and exposures. In addition to the direct risk of doing business in a country, we also are exposed to indirect country risks (e.g., related to the collateral received on secured financing transactions or related to client clearing activities). These indirect exposures are managed in the normal course of business through credit, market and operational risk governance, rather than through country risk governance.
Table 42 presents our 20 largest non-U.S. country exposures as of March 31, 2018 . These exposures accounted for 87 percent and 86 percent of our total non-U.S. exposure at March 31, 2018 and December 31, 2017 . Net country exposure for these 20 countries increased $27.4 billion in the three months ended March 31, 2018 , primarily driven by increases in the U.K., Germany and Japan.
Non-U.S. exposure is presented on an internal risk management basis and includes sovereign and non-sovereign credit exposure, securities and other investments issued by or domiciled in countries other than the U.S.
Funded loans and loan equivalents include loans, leases, and other extensions of credit and funds, including letters of credit and due from placements. Unfunded commitments are the undrawn portion of legally binding commitments related to loans and loan equivalents. Net counterparty exposure includes the fair value of derivatives, including the counterparty risk associated with CDS, and secured financing transactions. Securities and other investments are carried at fair value and long securities exposures are netted against short exposures with the same underlying issuer to, but not below, zero. Net country exposure represents country exposure less hedges and credit default protection purchased, net of credit default protection sold. For more information on our non-U.S. credit and trading portfolios, see Non-U.S. Portfolio in the MD&A of the Corporation's 2017 Annual Report on Form 10-K .
|
|
|
|
|
|
|
|
|
|
|
|
|
|
|
|
| ||||||||||||||||
Table 42 | Top 20 Non-U.S. Countries Exposure | |||||||||||||||||||||||||||||||
|
|
|
|
|
|
|
|
|
|
|
|
|
|
|
|
| ||||||||||||||||
(Dollars in millions) | Funded Loans and Loan Equivalents |
| Unfunded Loan Commitments |
| Net Counterparty Exposure |
| Securities/ Investments |
| Country Exposure at March 31 |
| Hedges and Credit Default Protection |
| Net Country Exposure at March 31 |
| Increase (Decrease) from December 31 | |||||||||||||||||
United Kingdom | $ | 26,362 | |
| $ | 18,105 | |
| $ | 6,710 | |
| $ | 1,478 | |
| $ | 52,655 | |
| $ | (5,714 | ) |
| $ | 46,941 | |
| $ | 9,346 | | |
Germany | 18,749 | |
| 8,751 | |
| 1,590 | |
| 1,766 | |
| 30,856 | |
| (3,250 | ) |
| 27,606 | |
| 6,103 | | |||||||||
Canada | 7,262 | |
| 7,373 | |
| 1,838 | |
| 2,020 | |
| 18,493 | |
| (844 | ) |
| 17,649 | |
| (1,074 | ) | |||||||||
China | 13,118 | |
| 940 | |
| 1,293 | |
| 1,255 | |
| 16,606 | |
| (282 | ) |
| 16,324 | |
| 399 | | |||||||||
Japan | 12,992 | |
| 639 | |
| 1,318 | |
| 473 | |
| 15,422 | |
| (1,472 | ) |
| 13,950 | |
| 4,860 | | |||||||||
France | 5,539 | |
| 5,818 | |
| 2,436 | |
| 3,070 | |
| 16,863 | |
| (5,098 | ) |
| 11,765 | |
| 1,222 | | |||||||||
India | 7,332 | |
| 357 | |
| 344 | |
| 3,366 | |
| 11,399 | |
| (78 | ) |
| 11,321 | |
| 824 | | |||||||||
Brazil | 7,309 | |
| 1,078 | |
| 606 | |
| 2,796 | |
| 11,789 | |
| (532 | ) |
| 11,257 | |
| 541 | | |||||||||
Australia | 5,422 | |
| 2,879 | |
| 566 | |
| 1,618 | |
| 10,485 | |
| (431 | ) |
| 10,054 | |
| (535 | ) | |||||||||
Netherlands | 6,897 | |
| 2,332 | |
| 769 | |
| 1,287 | |
| 11,285 | |
| (1,785 | ) |
| 9,500 | |
| 1,033 | | |||||||||
Hong Kong | 7,388 | |
| 188 | |
| 559 | |
| 1,051 | |
| 9,186 | |
| (79 | ) |
| 9,107 | |
| 429 | | |||||||||
South Korea | 5,054 | |
| 609 | |
| 632 | |
| 2,736 | |
| 9,031 | |
| (357 | ) |
| 8,674 | |
| 773 | | |||||||||
Switzerland | 4,951 | |
| 2,966 | |
| 215 | |
| 229 | |
| 8,361 | |
| (1,122 | ) |
| 7,239 | |
| 1,442 | | |||||||||
Singapore | 3,488 | |
| 153 | |
| 591 | |
| 2,316 | |
| 6,548 | |
| (76 | ) |
| 6,472 | |
| 209 | | |||||||||
Mexico | 3,088 | |
| 1,954 | |
| 112 | |
| 248 | |
| 5,402 | |
| (485 | ) |
| 4,917 | |
| (570 | ) | |||||||||
Spain | 2,618 | |
| 1,062 | |
| 193 | |
| 1,440 | |
| 5,313 | |
| (730 | ) |
| 4,583 | |
| 1,475 | | |||||||||
Belgium | 2,741 | |
| 968 | |
| 112 | |
| 1,077 | |
| 4,898 | |
| (411 | ) |
| 4,487 | |
| 522 | | |||||||||
Italy | 2,947 | |
| 1,491 | |
| 520 | |
| 825 | |
| 5,783 | |
| (1,350 | ) |
| 4,433 | |
| 187 | | |||||||||
United Arab Emirates | 2,824 | |
| 349 | |
| 273 | |
| 60 | |
| 3,506 | |
| (42 | ) |
| 3,464 | |
| 77 | | |||||||||
Turkey | 2,707 | |
| 83 | |
| 49 | |
| 321 | |
| 3,160 | |
| (12 | ) |
| 3,148 | |
| 159 | | |||||||||
Total top 20 non-U.S. countries exposure | $ | 148,788 | |
| $ | 58,095 | |
| $ | 20,726 | |
| $ | 29,432 | |
| $ | 257,041 | |
| $ | (24,150 | ) |
| $ | 232,891 | |
| $ | 27,422 | | |
A number of economic conditions and geopolitical events have given rise to risk aversion in certain emerging markets. Our largest emerging market country exposure at March 31, 2018 was China, with net exposure of $16.3 billion , concentrated in large state-owned companies, subsidiaries of multinational corporations and commercial banks. At March 31, 2018 , net exposure to Brazil was $11.3 billion , concentrated in sovereign securities, oil and gas companies and commercial banks.
The outlook for policy direction and therefore economic performance in the EU remains uncertain as a consequence of
reduced political cohesion among EU countries. Additionally, we believe that the uncertainty in the U.K.'s ability to negotiate a favorable exit from the EU will further weigh on economic performance. Our largest EU country exposure at March 31, 2018 was the U.K. with net exposure of $46.9 billion , a $9.3 billion increase from December 31, 2017 . The increase was driven by corporate loan growth and increased placements with the central bank as part of liquidity management. For more information, see Executive Summary – First Quarter 2018 Economic and Business Environment on page 3 .
|
| Bank of America 40 |
Provision for Credit Losses
The provision for credit losses remained relatively unchanged at $834 million for the three months ended March 31, 2018 compared to the same period in 2017 . The provision for credit losses was $77 million lower than net charge-offs for the three months ended March 31, 2018 , resulting in a reduction in the allowance for credit losses. This compared to a reduction of $99 million in the allowance for credit losses for the three months ended March 31, 2017 .
The provision for credit losses for the consumer portfolio decreased $24 million to $748 million for the three months ended March 31, 2018 compared to the same period in 2017 . The decrease was primarily driven by improvement in the consumer real estate portfolio, including a benefit of $11 million related to the PCI loan portfolio compared to an expense of $68 million for the same period in 2017 . Provision related to the credit card and other consumer portfolio increased $33 million for the three months ended March 31, 2018 compared to the same period in 2017 due to U.S. credit card portfolio seasoning and loan growth, partially offset by the impact of the sale of the non-U.S. consumer credit card business in the second quarter of 2017 .
The provision for credit losses for the commercial portfolio, including unfunded lending commitments, increased $23 million to $86 million for the three months ended March 31, 2018 compared to the same period in 2017 driven by loan growth.
Allowance for Credit Losses
Allowance for Loan and Lease Losses
The allowance for loan and lease losses is comprised of two components. The first component covers nonperforming commercial loans and TDRs. The second component covers loans and leases on which there are incurred losses that are not yet individually identifiable, as well as incurred losses that may not be represented in the loss forecast models. We evaluate the adequacy of the allowance for loan and lease losses based on the total of these two components. The allowance for loan and lease losses excludes LHFS and loans accounted for under the fair value option as the fair value reflects a credit risk component. For more information on the allowance for loan and lease losses, see Allowance for Credit Losses in the MD&A of the Corporation's 2017 Annual Report on Form 10-K .
During the three months ended March 31, 2018 , the factors that impacted the allowance for loan and lease losses included improvements in the credit quality of the consumer real estate portfolios driven by continuing improvements in the U.S. economy and strong labor markets, proactive credit risk management initiatives and the impact of high credit quality originations. Evidencing the improvements in the U.S. economy and strong labor
markets are low levels of unemployment and increases in home prices. In addition to these improvements, in the consumer portfolio, nonperforming consumer loans decreased $260 million in the three months ended March 31, 2018 as returns to performing status, loan sales, paydowns and charge-offs continued to outpace new nonaccrual loans. During the three months ended March 31, 2018 , the allowance for loan and lease losses in the commercial portfolio reflected decreased energy reserves primarily driven by reductions in energy exposures including utilized reservable criticized exposures.
The allowance for loan and lease losses for the consumer portfolio, as presented in Table 44 , was $5.3 billion at March 31, 2018 , a decrease of $133 million from December 31, 2017 . The decrease was primarily in the consumer real estate portfolio, partially offset by an increase in the U.S. credit card portfolio. The reduction in the allowance for the consumer real estate portfolio was due to improved home prices, lower nonperforming loans and a decrease in loan balances in our non-core portfolio. The increase in the allowance for the U.S. credit card portfolio was driven by portfolio seasoning.
The allowance for loan and lease losses for the commercial portfolio, as presented in Table 44 , was $5.0 billion at March 31, 2018 , unchanged from December 31, 2017 . Commercial utilized reservable criticized exposure decreased to $13.4 billion at March 31, 2018 from $13.6 billion (to 2.58 percent from 2.65 percent of total commercial utilized reservable exposure) at December 31, 2017 , largely due to an improvement in energy exposures. Nonperforming commercial loans increased to $1.5 billion at March 31, 2018 from $1.3 billion (to 0.31 percent from 0.27 percent of outstanding commercial loans excluding loans accounted for under the fair value option) at December 31, 2017 with the increase spread across multiple industries. See Tables 31 , 32 and 33 for more details on key commercial credit statistics.
The allowance for loan and lease losses as a percentage of total loans and leases outstanding was 1.11 percent at March 31, 2018 compared to 1.12 percent at December 31, 2017 .
Reserve for Unfunded Lending Commitments
In addition to the allowance for loan and lease losses, we also estimate probable losses related to unfunded lending commitments such as letters of credit, financial guarantees, unfunded bankers' acceptances and binding loan commitments, excluding commitments accounted for under the fair value option. For more information on the reserve for unfunded lending commitments, see Allowance for Credit Losses in the MD&A of the Corporation's 2017 Annual Report on Form 10-K .
The reserve for unfunded lending commitments was $782 million at March 31, 2018 compared to $777 million at December 31, 2017 .
41 Bank of America |
|
|
Table 43 presents a rollforward of the allowance for credit losses, which includes the allowance for loan and lease losses and the reserve for unfunded lending commitments, for the three months ended March 31, 2018 and 2017 .
|
|
|
|
| ||||
Table 43 | Allowance for Credit Losses |
|
|
| ||||
|
|
|
|
| ||||
|
| Three Months Ended March 31 | ||||||
(Dollars in millions) | 2018 |
| 2017 | |||||
Allowance for loan and lease losses, January 1 (1) | $ | 10,393 | |
| $ | 11,237 | | |
Loans and leases charged off |
|
|
| |||||
Residential mortgage | (56 | ) |
| (61 | ) | |||
Home equity | (118 | ) |
| (143 | ) | |||
U.S. credit card | (824 | ) |
| (718 | ) | |||
Non-U.S. credit card (2) | - | |
| (59 | ) | |||
Direct/Indirect consumer | (133 | ) |
| (114 | ) | |||
Other consumer | (49 | ) |
| (55 | ) | |||
Total consumer charge-offs | (1,180 | ) |
| (1,150 | ) | |||
U.S. commercial (3) | (108 | ) |
| (137 | ) | |||
Non-U.S. commercial | (7 | ) |
| (20 | ) | |||
Commercial lease financing | (1 | ) |
| (3 | ) | |||
Total commercial charge-offs | (116 | ) |
| (160 | ) | |||
Total loans and leases charged off | (1,296 | ) |
| (1,310 | ) | |||
Recoveries of loans and leases previously charged off |
|
|
| |||||
Residential mortgage | 62 | |
| 44 | | |||
Home equity | 85 | |
| 79 | | |||
U.S. credit card | 123 | |
| 112 | | |||
Non-U.S. credit card (2) | - | |
| 15 | | |||
Direct/Indirect consumer | 75 | |
| 66 | | |||
Other consumer | 5 | |
| 7 | | |||
Total consumer recoveries | 350 | |
| 323 | | |||
U.S. commercial (4) | 27 | |
| 41 | | |||
Non-U.S. commercial | 3 | |
| 5 | | |||
Commercial real estate | 3 | |
| 4 | | |||
Commercial lease financing | 2 | |
| 3 | | |||
Total commercial recoveries | 35 | |
| 53 | | |||
Total recoveries of loans and leases previously charged off | 385 | |
| 376 | | |||
Net charge-offs | (911 | ) |
| (934 | ) | |||
Write-offs of PCI loans | (35 | ) |
| (33 | ) | |||
Provision for loan and lease losses | 829 | |
| 840 | | |||
Other (5) | (16 | ) |
| 2 | | |||
Allowance for loan and lease losses, March 31 (1) | 10,260 | |
| 11,112 | | |||
Reserve for unfunded lending commitments, January 1 | 777 | |
| 762 | | |||
Provision for unfunded lending commitments | 5 | |
| (5 | ) | |||
Reserve for unfunded lending commitments, March 31 | 782 | |
| 757 | | |||
Allowance for credit losses, March 31 (1) | $ | 11,042 | |
| $ | 11,869 | | |
(1) | Excludes $242 million and $243 million at March 31, 2017 and January 1, 2017 of allowance for loan and lease losses related to the non-U.S. credit card loan portfolio, which was sold in the second quarter of 2017. |
(2) | Represents net charge-offs related to the non-U.S. credit card loan portfolio. See footnote 1 for more information. |
(3) | Includes U.S. small business commercial charge-offs of $68 million and $64 million for the three months ended March 31, 2018 and 2017 . |
(4) | Includes U.S. small business commercial recoveries of $11 million and $12 million for the three months ended March 31, 2018 and 2017 . |
(5) | Primarily represents the net impact of portfolio sales, consolidations and deconsolidations, foreign currency translation adjustments, transfers to held for sale and certain other reclassifications. |
|
| Bank of America 42 |
|
|
|
|
| ||||
Table 43 | Allowance for Credit Losses (continued) |
|
|
| ||||
|
|
|
|
| ||||
|
| Three Months Ended March 31 | ||||||
(Dollars in millions) | 2018 |
| 2017 | |||||
Loan and allowance ratios (6) : |
|
|
| |||||
Loans and leases outstanding at March 31 (7) | $ | 928,089 | |
| $ | 908,219 | | |
Allowance for loan and lease losses as a percentage of total loans and leases outstanding at March 31 (7) | 1.11 | % |
| 1.25 | % | |||
Consumer allowance for loan and lease losses as a percentage of total consumer loans and leases outstanding at March 31 (8) | 1.18 | |
| 1.36 | | |||
Commercial allowance for loan and lease losses as a percentage of total commercial loans and leases outstanding at March 31 (9) | 1.04 | |
| 1.14 | | |||
Average loans and leases outstanding (7) | $ | 926,297 | |
| $ | 906,585 | | |
Annualized net charge-offs as a percentage of average loans and leases outstanding (7, 10) | 0.40 | % |
| 0.42 | % | |||
Annualized net charge-offs and PCI write-offs as a percentage of average loans and leases outstanding (7) | 0.41 | |
| 0.43 | | |||
Allowance for loan and lease losses as a percentage of total nonperforming loans and leases at March 31 (7, 11) | 161 | |
| 156 | | |||
Ratio of the allowance for loan and lease losses at March 31 to annualized net charge-offs (10) | 2.78 | |
| 3.00 | | |||
Ratio of the allowance for loan and lease losses at March 31 to annualized net charge-offs and PCI write-offs | 2.67 | |
| 2.90 | | |||
Amounts included in allowance for loan and lease losses for loans and leases that are excluded from nonperforming loans and leases at March 31 (12) | $ | 3,992 | |
| $ | 4,047 | | |
Allowance for loan and lease losses as a percentage of total nonperforming loans and leases, excluding the allowance for loan and lease losses for loans and leases that are excluded from nonperforming loans and leases at March 31 (7, 12) | 98 | % |
| 100 | % | |||
(6) | Loan and allowance ratios for the three months ended March 31, 2017 include $242 million of non-U.S. credit card allowance for loan and lease losses and $9.5 billion of ending non-U.S. credit card loans, which were sold in the second quarter of 2017. |
(7) | Outstanding loan and lease balances and ratios do not include loans accounted for under the fair value option of $6.0 billion and $7.5 billion at March 31, 2018 and 2017 . Average loans accounted for under the fair value option were $5.6 billion and $7.6 billion for the three months ended March 31, 2018 and 2017 . |
(8) | Excludes consumer loans accounted for under the fair value option of $894 million and $1.0 billion at March 31, 2018 and 2017 . |
(9) | Excludes commercial loans accounted for under the fair value option of $5.1 billion and $6.5 billion at March 31, 2018 and 2017 . |
(10) | Net charge-offs exclude $35 million and $33 million of write-offs in the PCI loan portfolio for the three months ended March 31, 2018 and 2017 . For more information on PCI write-offs, see Consumer Portfolio Credit Risk Management – Purchased Credit-impaired Loan Portfolio on page 31 . |
(11) | For more information on our definition of nonperforming loans, see page 33 and page 37 . |
(12) | Primarily includes amounts allocated to U.S. credit card and unsecured consumer lending portfolios in Consumer Banking and PCI loans and the non-U.S. credit card portfolio in All Other . |
For reporting purposes, we allocate the allowance for credit losses across products as presented in Table 44 .
|
|
|
|
|
|
|
|
|
|
|
|
| ||||||||
Table 44 | Allocation of the Allowance for Credit Losses by Product Type |
|
|
|
| |||||||||||||||
|
|
|
|
|
|
|
|
| ||||||||||||
| Amount |
| Percent of Total |
| Percent of Outstanding (1) |
| Amount |
| Percent of Total |
| Percent of Outstanding (1) | |||||||||
(Dollars in millions) | March 31, 2018 |
| December 31, 2017 | |||||||||||||||||
Allowance for loan and lease losses |
| |
|
| |
|
| |
|
| |
|
| |
|
| | |||
Residential mortgage | $ | 611 | |
| 5.96 | % |
| 0.30 | % |
| $ | 701 | |
| 6.74 | % |
| 0.34 | % | |
Home equity | 919 | |
| 8.96 | |
| 1.66 | |
| 1,019 | |
| 9.80 | |
| 1.76 | | |||
U.S. credit card | 3,425 | |
| 33.38 | |
| 3.68 | |
| 3,368 | |
| 32.41 | |
| 3.50 | | |||
Direct/Indirect consumer | 262 | |
| 2.55 | |
| 0.29 | |
| 262 | |
| 2.52 | |
| 0.28 | | |||
Other consumer | 33 | |
| 0.32 | |
| 1.17 | |
| 33 | |
| 0.32 | |
| 1.22 | | |||
Total consumer | 5,250 | |
| 51.17 | |
| 1.18 | |
| 5,383 | |
| 51.79 | |
| 1.18 | | |||
U.S. commercial (2) | 3,091 | |
| 30.12 | |
| 1.02 | |
| 3,113 | |
| 29.95 | |
| 1.04 | | |||
Non-U.S. commercial | 801 | |
| 7.81 | |
| 0.82 | |
| 803 | |
| 7.73 | |
| 0.82 | | |||
Commercial real estate | 953 | |
| 9.29 | |
| 1.59 | |
| 935 | |
| 9.00 | |
| 1.60 | | |||
Commercial lease financing | 165 | |
| 1.61 | |
| 0.76 | |
| 159 | |
| 1.53 | |
| 0.72 | | |||
Total commercial | 5,010 | |
| 48.83 | |
| 1.04 | |
| 5,010 | |
| 48.21 | |
| 1.05 | | |||
Allowance for loan and lease losses (3) | 10,260 | |
| 100.00 | % |
| 1.11 | |
| 10,393 | |
| 100.00 | % |
| 1.12 | | |||
Reserve for unfunded lending commitments | 782 | |
|
|
|
|
| 777 | |
|
|
|
| | ||||||
Allowance for credit losses | $ | 11,042 | |
|
|
|
|
| $ | 11,170 | |
|
|
|
| |||||
(1) | Ratios are calculated as allowance for loan and lease losses as a percentage of loans and leases outstanding excluding loans accounted for under the fair value option. Consumer loans accounted for under the fair value option included residential mortgage loans of $523 million and $567 million and home equity loans of $371 million and $361 million at March 31, 2018 and December 31, 2017 . Commercial loans accounted for under the fair value option included U.S. commercial loans of $3.2 billion and $2.6 billion and non-U.S. commercial loans of $1.9 billion and $2.2 billion at March 31, 2018 and December 31, 2017 . |
(2) | Includes allowance for loan and lease losses for U.S. small business commercial loans of $446 million and $439 million at March 31, 2018 and December 31, 2017 . |
(3) | Includes $242 million and $289 million of valuation allowance presented with the allowance for loan and lease losses related to PCI loans at March 31, 2018 and December 31, 2017 . |
Market Risk Management
For more information on our market risk management process, see Market Risk Management in the MD&A of the Corporation's 2017 Annual Report on Form 10-K .
Trading Risk Management
To evaluate risk arising from trading activities, the Corporation focuses on the actual and potential volatility of revenues generated by individual positions as well as portfolios of positions.
VaR is a common statistic used to measure market risk as it allows the aggregation of market risk factors, including the effects of portfolio diversification. A VaR model simulates the value of a
portfolio under a range of scenarios in order to generate a distribution of potential gains and losses. VaR represents the loss a portfolio is not expected to exceed more than a certain number of times per period, based on a specified holding period, confidence level and window of historical data. We use one VaR model consistently across the trading portfolios and it uses a historical simulation approach based on a three-year window of historical data. Our primary VaR statistic is equivalent to a 99 percent confidence level. This means that for a VaR with a one-day holding period, there should not be losses in excess of VaR, on average, 99 out of 100 trading days. For more information on our trading risk management process, see Trading Risk
43 Bank of America |
|
|
Management in the MD&A of the Corporation's 2017 Annual Report on Form 10-K .
Table 45 presents the total market-based trading portfolio VaR which is the combination of the covered positions trading portfolio and the impact from less liquid trading exposures. For more information on the market risk VaR for trading activities, see Trading Risk Management in the MD&A of the Corporation's 2017 Annual Report on Form 10-K .
The total market-based portfolio VaR results in Table 45 include market risk, excluding CVA and DVA, to which we are exposed from
all business segments. The majority of this portfolio is within the Global Markets segment. Table 45 presents period-end, average, high and low daily trading VaR for the three months ended March 31, 2018 , December 31, 2017 and March 31, 2017 using a 99 percent confidence level.
The average total market-based trading portfolio VaR increased for the three months ended March 31, 2018 compared to the previous quarter primarily due to increased exposure in the interest rate and commodities markets.
|
|
|
|
|
|
|
|
|
|
|
|
|
|
|
|
|
|
|
|
|
|
|
|
| ||||||||||||||||||||||||
Table 45 | Market Risk VaR for Trading Activities |
|
|
|
|
|
|
|
|
|
|
|
| |||||||||||||||||||||||||||||||||||
|
| Three Months Ended | ||||||||||||||||||||||||||||||||||||||||||||||
| March 31, 2018 |
| December 31, 2017 |
| March 31, 2017 | |||||||||||||||||||||||||||||||||||||||||||
(Dollars in millions) | Period End |
| Average |
| High (1) |
| Low (1) |
| Period End |
| Average |
| High (1) |
| Low (1) |
| Period End |
| Average |
| High (1) |
| Low (1) | |||||||||||||||||||||||||
Foreign exchange | $ | 8 | |
| $ | 8 | |
| $ | 12 | |
| $ | 6 | |
| $ | 7 | |
| $ | 7 | |
| $ | 9 | |
| $ | 5 | |
| $ | 23 | |
| $ | 12 | |
| $ | 23 | |
| $ | 5 | | |
Interest rate | 33 | |
| 23 | |
| 33 | |
| 18 | |
| 22 | |
| 21 | |
| 28 | |
| 14 | |
| 28 | |
| 17 | |
| 28 | |
| 11 | | |||||||||||||
Credit | 28 | |
| 27 | |
| 31 | |
| 23 | |
| 29 | |
| 27 | |
| 33 | |
| 21 | |
| 26 | |
| 26 | |
| 29 | |
| 22 | | |||||||||||||
Equity | 16 | |
| 19 | |
| 28 | |
| 14 | |
| 19 | |
| 19 | |
| 24 | |
| 14 | |
| 24 | |
| 19 | |
| 30 | |
| 14 | | |||||||||||||
Commodity | 10 | |
| 6 | |
| 12 | |
| 3 | |
| 5 | |
| 4 | |
| 6 | |
| 3 | |
| 6 | |
| 4 | |
| 7 | |
| 3 | | |||||||||||||
Portfolio diversification | (57 | ) |
| (49 | ) |
| - | |
| - | |
| (49 | ) |
| (48 | ) |
| - | |
| - | |
| (58 | ) |
| (45 | ) |
| - | |
| - | | |||||||||||||
Total covered positions trading portfolio | 38 | |
| 34 | |
| 43 | |
| 25 | |
| 33 | |
| 30 | |
| 38 | |
| 23 | |
| 49 | |
| 33 | |
| 49 | |
| 25 | | |||||||||||||
Impact from less liquid exposures | 4 | |
| 6 | |
| - | |
| - | |
| 5 | |
| 6 | |
| - | |
| - | |
| 10 | |
| 5 | |
| - | |
| - | | |||||||||||||
Total market-based trading portfolio | 42 | |
| 40 | |
| 51 | |
| 29 | |
| 38 | |
| 36 | |
| 47 | |
| 26 | |
| 59 | |
| 38 | |
| 59 | |
| 28 | | |||||||||||||
Fair value option loans | 12 | |
| 10 | |
| 12 | |
| 8 | |
| 9 | |
| 9 | |
| 11 | |
| 7 | |
| 11 | |
| 12 | |
| 14 | |
| 11 | | |||||||||||||
Fair value option hedges | 9 | |
| 8 | |
| 10 | |
| 6 | |
| 7 | |
| 7 | |
| 11 | |
| 5 | |
| 6 | |
| 6 | |
| 7 | |
| 5 | | |||||||||||||
Fair value option portfolio diversification | (11 | ) |
| (9 | ) |
| - | |
| - | |
| (7 | ) |
| (8 | ) |
| - | |
| - | |
| (7 | ) |
| (8 | ) |
| - | |
| - | | |||||||||||||
Total fair value option portfolio | 10 | |
| 9 | |
| 10 | |
| 7 | |
| 9 | |
| 8 | |
| 11 | |
| 6 | |
| 10 | |
| 10 | |
| 11 | |
| 9 | | |||||||||||||
Portfolio diversification | (3 | ) |
| (4 | ) |
| - | |
| - | |
| (4 | ) |
| (3 | ) |
| - | |
| - | |
| (6 | ) |
| (4 | ) |
| - | |
| - | | |||||||||||||
Total market-based portfolio | $ | 49 | |
| $ | 45 | |
| 57 | |
| 33 | |
| $ | 43 | |
| $ | 41 | |
| $ | 53 | |
| $ | 30 | |
| $ | 63 | |
| $ | 44 | |
| 63 | |
| 32 | | |||||
(1) | The high and low for each portfolio may have occurred on different trading days than the high and low for the components. Therefore the impact from less liquid exposures and the amount of portfolio diversification, which is the difference between the total portfolio and the sum of the individual components, is not relevant. |
The graph below presents the daily total market-based trading portfolio VaR for the previous five quarters, corresponding to the data in Table 45 .
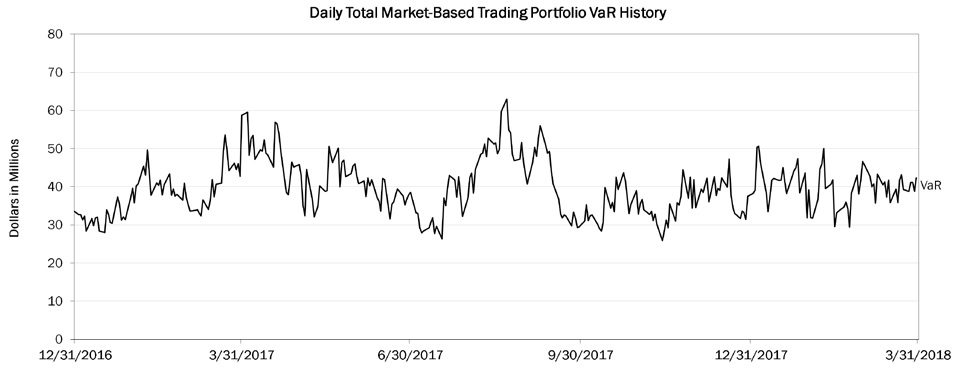
Additional VaR statistics produced within our single VaR model are provided in Table 46 at the same level of detail as in Table 45 . Evaluating VaR with additional statistics allows for an increased understanding of the risks in the portfolio as the historical market data used in the VaR calculation does not necessarily follow a predefined statistical distribution. Table 46 presents average trading VaR statistics at 99 percent and 95 percent confidence levels for the three months ended March 31, 2018 , December 31, 2017 and March 31, 2017 .
|
| Bank of America 44 |
|
|
|
|
|
|
|
|
|
|
|
|
|
| ||||||||||||
Table 46 | Average Market Risk VaR for Trading Activities – 99 percent and 95 percent VaR Statistics | ||||||||||||||||||||||||
|
|
|
|
|
|
|
|
|
|
|
|
|
| ||||||||||||
|
|
| Three Months Ended | ||||||||||||||||||||||
|
|
| March 31, 2018 |
| December 31, 2017 |
| March 31, 2017 | ||||||||||||||||||
(Dollars in millions) |
| 99 percent |
| 95 percent |
| 99 percent |
| 95 percent |
| 99 percent |
| 95 percent | |||||||||||||
Foreign exchange |
| $ | 8 | |
| $ | 5 | |
| $ | 7 | |
| $ | 4 | |
| $ | 12 | |
| $ | 8 | | |
Interest rate |
| 23 | |
| 15 | |
| 21 | |
| 14 | |
| 17 | |
| 11 | | |||||||
Credit |
| 27 | |
| 16 | |
| 27 | |
| 15 | |
| 26 | |
| 14 | | |||||||
Equity |
| 19 | |
| 10 | |
| 19 | |
| 10 | |
| 19 | |
| 10 | | |||||||
Commodity |
| 6 | |
| 3 | |
| 4 | |
| 2 | |
| 4 | |
| 3 | | |||||||
Portfolio diversification |
| (49 | ) |
| (30 | ) |
| (48 | ) |
| (30 | ) |
| (45 | ) |
| (28 | ) | |||||||
Total covered positions trading portfolio |
| 34 | |
| 19 | |
| 30 | |
| 15 | |
| 33 | |
| 18 | | |||||||
Impact from less liquid exposures |
| 6 | |
| 2 | |
| 6 | |
| 2 | |
| 5 | |
| 3 | | |||||||
Total market-based trading portfolio |
| 40 | |
| 21 | |
| 36 | |
| 17 | |
| 38 | |
| 21 | | |||||||
Fair value option loans |
| 10 | |
| 5 | |
| 9 | |
| 6 | |
| 12 | |
| 7 | | |||||||
Fair value option hedges |
| 8 | |
| 6 | |
| 7 | |
| 5 | |
| 6 | |
| 4 | | |||||||
Fair value option portfolio diversification |
| (9 | ) |
| (6 | ) |
| (8 | ) |
| (6 | ) |
| (8 | ) |
| (5 | ) | |||||||
Total fair value option portfolio |
| 9 | |
| 5 | |
| 8 | |
| 5 | |
| 10 | |
| 6 | | |||||||
Portfolio diversification |
| (4 | ) |
| (3 | ) |
| (3 | ) |
| (3 | ) |
| (4 | ) |
| (4 | ) | |||||||
Total market-based portfolio |
| $ | 45 | |
| $ | 23 | |
| $ | 41 | |
| $ | 19 | |
| $ | 44 | |
| $ | 23 | | |
Backtesting
The accuracy of the VaR methodology is evaluated by backtesting, which compares the daily VaR results, utilizing a one-day holding period, against a comparable subset of trading revenue. A backtesting excess occurs when a trading loss exceeds the VaR for the corresponding day. These excesses are evaluated to understand the positions and market moves that produced the trading loss and to ensure that the VaR methodology accurately represents those losses. For more information on our backtesting process, see Trading Risk Management – Backtesting in the MD&A of the Corporation's 2017 Annual Report on Form 10-K .
During the three months ended March 31, 2018 , there were no days in which there was a backtesting excess for our total market-based portfolio VaR, utilizing a one-day holding period.
Total Trading-related Revenue
Total trading-related revenue, excluding brokerage fees, and CVA, DVA and funding valuation adjustment gains (losses), represents the total amount earned from trading positions, including market-based net interest income, which are taken in a diverse range of financial instruments and markets. Trading account assets and liabilities are reported at fair value. For more information on fair value, see Note 20 – Fair Value Measurements to the Consolidated Financial Statements of the Corporation's 2017 Annual Report on Form 10-K . Trading-related revenue can be volatile and is largely driven by general market conditions and customer demand. Also, trading-related revenue is dependent on the volume and type of transactions, the level of risk assumed, and the volatility of price and rate movements at any given time within the ever-changing market environment. Significant daily revenue by business is monitored and the primary drivers of these are reviewed.
The following histogram is a graphic depiction of trading volatility and illustrates the daily level of trading-related revenue for the three months ended March 31, 2018 compared to the three months ended December 31, 2017 . During the three months ended March 31, 2018 , positive trading-related revenue was recorded for 100 percent of the trading days, of which 88 percent were daily trading gains of over $25 million. This compares to the three months ended December 31, 2017 where positive trading-related revenue was recorded for 100 percent of the trading days, of which 63 percent were daily trading gains of over $25 million.
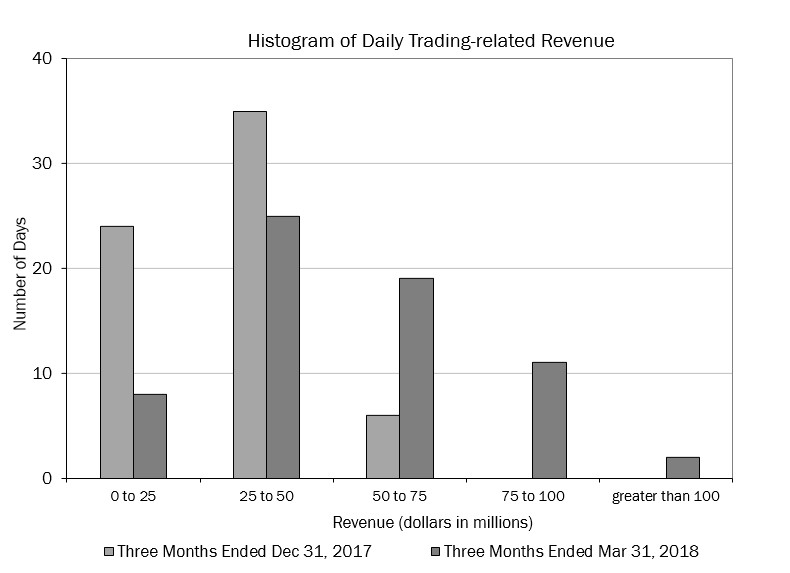
Trading Portfolio Stress Testing
Because the very nature of a VaR model suggests results can exceed our estimates and it is dependent on a limited historical window, we also stress test our portfolio using scenario analysis. This analysis estimates the change in the value of our trading portfolio that may result from abnormal market movements. For additional information, see Trading Risk Management – Trading Portfolio Stress Testing in the MD&A of the Corporation's 2017 Annual Report on Form 10-K .
Interest Rate Risk Management for the Banking Book
The following discussion presents net interest income for banking book activities.
Interest rate risk represents the most significant market risk exposure to our banking book balance sheet. Interest rate risk is measured as the potential change in net interest income caused by movements in market interest rates. Client-facing activities, primarily lending and deposit-taking, create interest rate sensitive positions on our balance sheet.
45 Bank of America |
|
|
We prepare forward-looking forecasts of net interest income. The baseline forecast takes into consideration expected future business growth, ALM positioning and the direction of interest rate movements as implied by the market-based forward curve. We then measure and evaluate the impact that alternative interest rate scenarios have on the baseline forecast in order to assess
interest rate sensitivity under varied conditions. The net interest income forecast is frequently updated for changing assumptions and differing outlooks based on economic trends, market conditions and business strategies. Thus, we continually monitor our balance sheet position in order to maintain an acceptable level of exposure to interest rate changes.
The interest rate scenarios that we analyze incorporate balance sheet assumptions such as loan and deposit growth and pricing, changes in funding mix, product repricing, maturity characteristics and investment securities premium amortization. Our overall goal is to manage interest rate risk so that movements in interest rates do not significantly adversely affect earnings and capital.
Table 47 presents the spot and 12-month forward rates used in our baseline forecasts at March 31, 2018 and December 31, 2017 .
|
|
|
|
|
|
| |||
Table 47 | Forward Rates | ||||||||
|
|
|
|
|
|
| |||
|
| March 31, 2018 | |||||||
|
| Federal Funds |
| Three-month LIBOR |
| 10-Year Swap | |||
Spot rates | 1.75 | % |
| 2.31 | % |
| 2.78 | % | |
12-month forward rates | 2.25 | |
| 2.57 | |
| 2.83 | | |
|
|
|
|
|
|
| |||
|
| December 31, 2017 | |||||||
Spot rates | 1.50 | % |
| 1.69 | % |
| 2.40 | % | |
12-month forward rates | 2.00 | |
| 2.14 | |
| 2.48 | | |
Table 48 shows the pretax impact to forecasted net interest income over the next 12 months from March 31, 2018 and December 31, 2017 , resulting from instantaneous parallel and non-parallel shocks to the market-based forward curve. Periodically we evaluate the scenarios presented so that they are meaningful in the context of the current rate environment.
In the three months ended March 31, 2018 , the asset sensitivity of our balance sheet to rising rates was largely unchanged. We continue to be asset sensitive to a parallel move in interest rates with the majority of that impact coming from the short end of the yield curve. Additionally, higher interest rates impact the fair value of debt securities and, accordingly, for debt securities classified as available for sale (AFS), may adversely affect accumulated OCI and thus capital levels under the Basel 3 capital rules. Under instantaneous upward parallel shifts, the near-term adverse impact to Basel 3 capital is reduced over time by offsetting positive impacts to net interest income. For more information on Basel 3, see Capital Management – Regulatory Capital on page 18 .
|
|
|
|
|
|
|
|
| ||||||
Table 48 | Estimated Banking Book Net Interest Income Sensitivity | |||||||||||||
|
|
|
|
|
|
|
|
| ||||||
|
| Short Rate (bps) |
| Long Rate (bps) |
|
|
|
| ||||||
(Dollars in millions) |
|
| March 31 |
| December 31 | |||||||||
Curve Change |
|
|
| |||||||||||
Parallel Shifts |
|
|
|
|
|
|
| |||||||
+100 bps instantaneous shift | +100 |
| +100 |
| $ | 2,964 | |
| $ | 3,317 | | |||
-100 bps instantaneous shift | -100 | |
| -100 | |
| (3,717 | ) |
| (5,183 | ) | |||
Flatteners |
| |
|
| |
|
|
|
| |||||
Short-end instantaneous change | +100 |
| - | |
| 2,188 | |
| 2,182 | | ||||
Long-end instantaneous change | - | |
| -100 | |
| (1,641 | ) |
| (2,765 | ) | |||
Steepeners |
| |
|
| |
|
|
|
| |||||
Short-end instantaneous change | -100 | |
| - | |
| (2,057 | ) |
| (2,394 | ) | |||
Long-end instantaneous change | - | |
| +100 |
| 785 | |
| 1,135 | | ||||
The sensitivity analysis in Table 48 assumes that we take no action in response to these rate shocks and does not assume any change in other macroeconomic variables normally correlated with changes in interest rates. As part of our ALM activities, we use securities, certain residential mortgages, and interest rate and foreign exchange derivatives in managing interest rate sensitivity.
The behavior of our deposit portfolio in the baseline forecast and in alternate interest rate scenarios is a key assumption in our projected estimates of net interest income. The sensitivity analysis in Table 48 assumes no change in deposit portfolio size or mix from the baseline forecast in alternate rate environments. In higher rate scenarios, any customer activity resulting in the replacement of low-cost or noninterest-bearing deposits with higher-yielding deposits or market-based funding would reduce our benefit in those scenarios.
Interest Rate and Foreign Exchange Derivative Contracts
Interest rate and foreign exchange derivative contracts are utilized in our ALM activities and serve as an efficient tool to manage our interest rate and foreign exchange risk. We use derivatives to hedge the variability in cash flows or changes in fair value on our balance sheet due to interest rate and foreign exchange components. For more information on our hedging activities, see Note 3 – Derivatives to the Consolidated Financial Statements . For more information on interest rate contracts and risk management, see Interest Rate Risk Management for the Banking Book in the MD&A of the Corporation's 2017 Annual Report on Form 10-K .
|
| Bank of America 46 |
Table 49 presents derivatives utilized in our ALM activities and shows the notional amount, fair value, weighted-average receive-fixed and pay-fixed rates, expected maturity and average estimated durations of our open ALM derivatives at March 31, 2018 and December 31, 2017 . These amounts do not include derivative hedges on our MSRs.
|
|
|
|
|
|
|
|
|
|
|
|
|
|
|
|
|
|
| |||||||||||||||||
Table 49 | Asset and Liability Management Interest Rate and Foreign Exchange Contracts | ||||||||||||||||||||||||||||||||||
|
|
|
|
|
|
| |||||||||||||||||||||||||||||
|
|
|
| March 31, 2018 |
|
| |||||||||||||||||||||||||||||
|
|
|
| Expected Maturity |
|
| |||||||||||||||||||||||||||||
(Dollars in millions, average estimated duration in years) | Fair Value |
| Total |
| Remainder of 2018 |
| 2019 |
| 2020 |
| 2021 |
| 2022 |
| Thereafter |
| Average Duration | ||||||||||||||||||
Receive-fixed interest rate swaps (1) | $ | (1,096 | ) |
|
| |
|
| |
|
| |
|
| |
|
| |
|
| |
|
| |
| 5.23 | | ||||||||
Notional amount |
| |
| $ | 190,804 | |
| $ | 17,211 | |
| $ | 27,176 | |
| $ | 16,347 | |
| $ | 9,548 | |
| $ | 19,120 | |
| $ | 101,402 | |
|
| | ||
Weighted-average fixed-rate |
| |
| 2.47 | % |
| 3.79 | % |
| 1.87 | % |
| 1.88 | % |
| 2.81 | % |
| 2.10 | % |
| 2.55 | % |
|
| | |||||||||
Pay-fixed interest rate swaps (1) | 827 | |
|
| |
|
| |
|
| |
|
| |
|
| |
|
| |
|
| |
| 5.27 | | |||||||||
Notional amount |
| |
| $ | 45,565 | |
| $ | 11,247 | |
| $ | 1,210 | |
| $ | 4,344 | |
| $ | 1,616 | |
| $ | - | |
| $ | 27,148 | |
|
| | ||
Weighted-average fixed-rate |
| |
| 2.14 | % |
| 1.70 | % |
| 2.07 | % |
| 2.16 | % |
| 2.22 | % |
| - | % |
| 2.32 | % |
|
| | |||||||||
Same-currency basis swaps (2) | (20 | ) |
|
| |
|
| |
|
| |
|
| |
|
| |
|
| |
|
| |
|
| | |||||||||
Notional amount |
| |
| $ | 41,342 | |
| $ | 6,290 | |
| $ | 6,792 | |
| $ | 8,576 | |
| $ | 2,812 | |
| $ | 955 | |
| $ | 15,917 | |
|
| | ||
Foreign exchange basis swaps (1, 3, 4) | (1,329 | ) |
|
| |
|
| |
|
| |
|
| |
|
| |
|
| |
|
| |
|
| | |||||||||
Notional amount |
| |
| 112,409 | |
| 22,898 | |
| 12,449 | |
| 17,550 | |
| 9,527 | |
| 7,169 | |
| 42,816 | |
|
| | |||||||||
Option products (5) | 3 | |
|
| |
|
| |
|
| |
|
| |
|
| |
|
| |
|
| |
|
| | |||||||||
Notional amount (6) |
| |
| 1,249 | |
| 1,232 | |
| - | |
| - | |
| - | |
| - | |
| 17 | |
|
| | |||||||||
Foreign exchange contracts (1, 4, 7) | 1,186 | |
|
| |
|
| |
|
| |
|
| |
|
| |
|
| |
|
| |
|
| | |||||||||
Notional amount (6) |
|
| (5,905 | ) |
| (23,224 | ) |
| 2,296 | |
| (20 | ) |
| 2,546 | |
| 2,934 | |
| 9,563 | |
|
| | ||||||||||
Net ALM contracts | $ | (429 | ) |
|
| |
|
| |
|
| |
|
| |
|
| |
|
| |
|
| |
|
| | ||||||||
|
|
|
|
|
|
| |||||||||||||||||||||||||||||
|
|
|
| December 31, 2017 |
|
| |||||||||||||||||||||||||||||
|
|
|
| Expected Maturity |
|
| |||||||||||||||||||||||||||||
(Dollars in millions, average estimated duration in years) | Fair Value |
| Total |
| 2018 |
| 2019 |
| 2020 |
| 2021 |
| 2022 |
| Thereafter |
| Average Estimated Duration | ||||||||||||||||||
Receive-fixed interest rate swaps (1) | $ | 2,330 | |
|
| |
|
| |
|
| |
|
| |
|
| |
|
| |
|
| |
| 5.38 | | ||||||||
Notional amount |
| |
| $ | 176,390 | |
| $ | 21,850 | |
| $ | 27,176 | |
| $ | 16,347 | |
| $ | 6,498 | |
| $ | 19,120 | |
| $ | 85,399 | |
|
| | ||
Weighted-average fixed-rate |
| |
| 2.42 | % |
| 3.20 | % |
| 1.87 | % |
| 1.88 | % |
| 2.99 | % |
| 2.10 | % |
| 2.52 | % |
|
| | |||||||||
Pay-fixed interest rate swaps (1) | (37 | ) |
|
| |
|
| |
|
| |
|
| |
|
| |
|
| |
|
| |
| 5.63 | | |||||||||
Notional amount |
| |
| $ | 45,873 | |
| $ | 11,555 | |
| $ | 1,210 | |
| $ | 4,344 | |
| $ | 1,616 | |
| $ | - | |
| $ | 27,148 | |
|
| | ||
Weighted-average fixed-rate |
| |
| 2.15 | % |
| 1.73 | % |
| 2.07 | % |
| 2.16 | % |
| 2.22 | % |
| - | % |
| 2.32 | % |
|
| | |||||||||
Same-currency basis swaps (2) | (17 | ) |
|
| |
|
| |
|
| |
|
| |
|
| |
|
| |
|
| |
|
| | |||||||||
Notional amount |
| |
| $ | 38,622 | |
| $ | 11,028 | |
| $ | 6,789 | |
| $ | 1,180 | |
| $ | 2,807 | |
| $ | 955 | |
| $ | 15,863 | |
|
| | ||
Foreign exchange basis swaps (1, 3, 4) | (1,616 | ) |
|
| |
|
| |
|
| |
|
| |
|
| |
|
| |
|
| |
|
| | |||||||||
Notional amount |
| |
| 107,263 | |
| 24,886 | |
| 11,922 | |
| 13,367 | |
| 9,301 | |
| 6,860 | |
| 40,927 | |
|
| | |||||||||
Option products (5) | 13 | |
|
| |
|
| |
|
| |
|
| |
|
| |
|
| |
|
| |
|
| | |||||||||
Notional amount (6) |
| |
| 1,218 | |
| 1,201 | |
| - | |
| - | |
| - | |
| - | |
| 17 | |
|
| | |||||||||
Foreign exchange contracts (1, 4, 7) | 1,424 | |
|
| |
|
| |
|
| |
|
| |
|
| |
|
| |
|
| |
|
| | |||||||||
Notional amount (6) |
| |
| (11,783 | ) |
| (28,689 | ) |
| 2,231 | |
| (24 | ) |
| 2,471 | |
| 2,919 | |
| 9,309 | |
|
| | |||||||||
Net ALM contracts | $ | 2,097 | |
|
| |
|
| |
|
| |
|
| |
|
| |
|
| |
|
| |
|
| | ||||||||
(1) | Does not include basis adjustments on either fixed-rate debt issued by the Corporation or AFS debt securities, which are hedged using derivatives designated as fair value hedging instruments, that substantially offset the fair values of these derivatives. |
(2) | At March 31, 2018 and December 31, 2017 , the notional amount of same-currency basis swaps included $41.3 billion and $38.6 billion in both foreign currency and U.S. dollar-denominated basis swaps in which both sides of the swap are in the same currency. |
(3) | Foreign exchange basis swaps consisted of cross-currency variable interest rate swaps used separately or in conjunction with receive-fixed interest rate swaps. |
(4) | Does not include foreign currency translation adjustments on certain non-U.S. debt issued by the Corporation that substantially offset the fair values of these derivatives. |
(5) | The notional amount of option products of $1.2 billion at both March 31, 2018 and December 31, 2017 was substantially all in foreign exchange options. |
(6) | Reflects the net of long and short positions. Amounts shown as negative reflect a net short position. |
(7) | The notional amount of foreign exchange contracts of $(5.9) billion at March 31, 2018 was comprised of $30.0 billion in foreign currency-denominated and cross-currency receive-fixed swaps, $(30.8) billion in net foreign currency forward rate contracts, $(6.4) billion in foreign currency-denominated pay-fixed swaps and $1.3 billion in net foreign currency futures contracts. Foreign exchange contracts of $(11.8) billion at December 31, 2017 were comprised of $29.1 billion in foreign currency-denominated and cross-currency receive-fixed swaps, $(35.6) billion in net foreign currency forward rate contracts, $(6.2) billion in foreign currency-denominated pay-fixed swaps and $940 million in foreign currency futures contracts. |
47 Bank of America |
|
|
We use interest rate derivative instruments to hedge the variability in the cash flows of our assets and liabilities and other forecasted transactions (collectively referred to as cash flow hedges). The net losses on both open and terminated cash flow hedge derivative instruments recorded in accumulated OCI were $1.6 billion and $1.3 billion , on a pretax basis, at March 31, 2018 and December 31, 2017 . These net losses are expected to be reclassified into earnings in the same period as the hedged cash flows affect earnings and will decrease income or increase expense on the respective hedged cash flows. Assuming no change in open cash flow derivative hedge positions and no changes in prices or interest rates beyond what is implied in forward yield curves at March 31, 2018 , the pretax net losses are expected to be reclassified into earnings as follows: $354 million , or 21 percent, within the next year, 58 percent in years two through five, and 13 percent in years six through 10, with the remaining eight percent thereafter. For more information on derivatives designated as cash flow hedges, see Note 3 – Derivatives to the Consolidated Financial Statements .
We hedge our net investment in non-U.S. operations determined to have functional currencies other than the U.S. dollar using forward foreign exchange contracts that typically settle in less than 180 days, cross-currency basis swaps and foreign exchange options. We recorded net after-tax losses on derivatives in accumulated OCI associated with net investment hedges which were offset by gains on our net investments in consolidated non-U.S. entities at March 31, 2018 .
Mortgage Banking Risk Management
We originate, fund and service mortgage loans, which subject us to credit, liquidity and interest rate risks, among others. We determine whether loans will be held for investment or held for sale at the time of commitment and manage credit and liquidity risks by selling or securitizing a portion of the loans we originate.
Interest rate risk and market risk can be substantial in the mortgage business. Changes in interest rates and other market factors impact the volume of mortgage originations. Changes in interest rates also impact the value of interest rate lock commitments (IRLCs) and the related residential first mortgage LHFS between the date of the IRLC and the date the loans are sold to the secondary market. An increase in mortgage interest rates typically leads to a decrease in the value of these instruments. Conversely, the value of the MSRs will increase driven by lower prepayment expectations when there is an increase in interest rates. Because the interest rate risks of these two hedged items offset, we combine them into one overall hedged item with one combined economic hedge portfolio consisting of derivative contracts and securities.
For the three months ended March 31, 2018 and 2017 , we recorded gains of $69 million and $25 million related to the change in fair value of the MSRs, IRLCs and LHFS, net of gains and losses on the hedge portfolio. For more information on MSRs, see Note 14 – Fair Value Measurements to the Consolidated Financial Statements .
Complex Accounting Estimates
Our significant accounting principles are essential in understanding the MD&A. Many of our significant accounting principles require complex judgments to estimate the values of assets and liabilities. We have procedures and processes in place to facilitate making these judgments. For additional information, see Complex Accounting Estimates in the MD&A of the Corporation's 2017 Annual Report on Form 10-K and Note 1 – Summary of Significant Accounting Principles to the Consolidated Financial Statements of the Corporation's 2017 Annual Report on Form 10-K .
Non-GAAP Reconciliations
Tables 50 and 51 provide reconciliations of certain non-GAAP financial measures to GAAP financial measures.
|
|
|
|
|
|
|
|
|
|
|
|
| ||||||||||||
Table 50 | Quarterly Supplemental Financial Data and Reconciliations to GAAP Financial Measures | |||||||||||||||||||||||
|
|
|
|
|
|
|
|
|
|
|
|
| ||||||||||||
|
| Three Months Ended March 31 | ||||||||||||||||||||||
| 2018 |
| 2017 | |||||||||||||||||||||
(Dollars in millions) | As Reported |
| Fully taxable-equivalent adjustment |
| Fully taxable-equivalent basis |
| As Reported |
| Fully taxable-equivalent adjustment |
| Fully taxable-equivalent basis | |||||||||||||
Net interest income | $ | 11,608 | |
| $ | 150 | |
| $ | 11,758 | |
| $ | 11,058 | |
| $ | 197 | |
| $ | 11,255 | | |
Total revenue, net of interest expense | 23,125 | |
| 150 | |
| 23,275 | |
| 22,248 | |
| 197 | |
| 22,445 | | |||||||
Income tax expense | 1,476 | |
| 150 | |
| 1,626 | |
| 1,983 | |
| 197 | |
| 2,180 | | |||||||
|
| Bank of America 48 |
|
|
|
|
|
|
|
|
| ||||||||
Table 51 | Period-end and Average Supplemental Financial Data and Reconciliations to GAAP Financial Measures | |||||||||||||||
|
|
|
|
|
|
| ||||||||||
| Period-end |
| Average | |||||||||||||
| March 31 |
| December 31 |
| Three Months Ended March 31 | |||||||||||
(Dollars in millions) |
|
| 2018 |
| 2017 | |||||||||||
Common shareholders' equity | $ | 241,552 | |
| $ | 244,823 | |
| $ | 242,713 | |
| $ | 242,480 | | |
Goodwill | (68,951 | ) |
| (68,951 | ) |
| (68,951 | ) |
| (69,744 | ) | |||||
Intangible assets (excluding MSRs) | (2,177 | ) |
| (2,312 | ) |
| (2,261 | ) |
| (2,923 | ) | |||||
Related deferred tax liabilities | 920 | |
| 943 | |
| 939 | |
| 1,539 | | |||||
Tangible common shareholders' equity | $ | 171,344 | |
| $ | 174,503 | |
| $ | 172,440 | |
| $ | 171,352 | | |
|
|
|
|
|
|
|
| |||||||||
Shareholders' equity | $ | 266,224 | |
| $ | 267,146 | |
| $ | 265,480 | |
| $ | 267,700 | | |
Goodwill | (68,951 | ) |
| (68,951 | ) |
| (68,951 | ) |
| (69,744 | ) | |||||
Intangible assets (excluding MSRs) | (2,177 | ) |
| (2,312 | ) |
| (2,261 | ) |
| (2,923 | ) | |||||
Related deferred tax liabilities | 920 | |
| 943 | |
| 939 | |
| 1,539 | | |||||
Tangible shareholders' equity | $ | 196,016 | |
| $ | 196,826 | |
| $ | 195,207 | |
| $ | 196,572 | | |
|
|
|
|
|
|
|
| |||||||||
Total assets | $ | 2,328,478 | |
| $ | 2,281,234 | |
|
|
|
| |||||
Goodwill | (68,951 | ) |
| (68,951 | ) |
|
|
|
| |||||||
Intangible assets (excluding MSRs) | (2,177 | ) |
| (2,312 | ) |
|
|
|
| |||||||
Related deferred tax liabilities | 920 | |
| 943 | |
|
|
|
| |||||||
Tangible assets | $ | 2,258,270 | |
| $ | 2,210,914 | |
|
|
|
| |||||
Item 3. Quantitative and Qualitative Disclosures about Market Risk
See Market Risk Management on page 43 in the MD&A and the sections referenced therein for Quantitative and Qualitative Disclosures about Market Risk.
Item 4. Controls and Procedures
Disclosure Controls and Procedures
As of the end of the period covered by this report, the Corporation's management, including the Chief Executive Officer and Chief Financial Officer, conducted an evaluation of the effectiveness and design of the Corporation's disclosure controls and procedures (as that term is defined in Rule 13a-15(e) of the Exchange Act). Based upon that evaluation, the Corporation's Chief Executive Officer and Chief Financial Officer concluded that the Corporation's disclosure controls and procedures were effective, as of the end of the period covered by this report, in recording, processing, summarizing and reporting information required to be disclosed by the Corporation in reports that it files or submits under the Exchange Act, within the time periods specified in the Securities and Exchange Commission's rules and forms.
Changes in Internal Control Over Financial Reporting
There have been no changes in the Corporation's internal control over financial reporting (as defined in Rule 13a-15(f) of the Exchange Act) during the three months ended March 31, 2018 , that have materially affected, or are reasonably likely to materially affect, the Corporation's internal control over financial reporting.
49 Bank of America |
|
|
Part I. Financial Information
Item 1. Financial Statements
Bank of America Corporation and Subsidiaries
|
|
|
| ||||
Consolidated Statement of Income | |||||||
| Three Months Ended March 31 | ||||||
(In millions, except per share information) | 2018 |
| 2017 | ||||
Interest income |
| |
|
| | ||
Loans and leases | $ | 9,623 | |
| $ | 8,754 | |
Debt securities | 2,804 | |
| 2,541 | | ||
Federal funds sold and securities borrowed or purchased under agreements to resell | 622 | |
| 439 | | ||
Trading account assets | 1,136 | |
| 1,076 | | ||
Other interest income | 1,414 | |
| 900 | | ||
Total interest income | 15,599 | |
| 13,710 | | ||
|
|
|
| ||||
Interest expense |
| |
|
| | ||
Deposits | 760 | |
| 282 | | ||
Short-term borrowings | 1,135 | |
| 647 | | ||
Trading account liabilities | 357 | |
| 264 | | ||
Long-term debt | 1,739 | |
| 1,459 | | ||
Total interest expense | 3,991 | |
| 2,652 | | ||
Net interest income | 11,608 | |
| 11,058 | | ||
|
|
|
| ||||
Noninterest income |
| |
|
| | ||
Card income | 1,457 | |
| 1,449 | | ||
Service charges | 1,921 | |
| 1,918 | | ||
Investment and brokerage services | 3,664 | |
| 3,417 | | ||
Investment banking income | 1,353 | |
| 1,584 | | ||
Trading account profits | 2,699 | |
| 2,331 | | ||
Other income | 423 | |
| 491 | | ||
Total noninterest income | 11,517 | |
| 11,190 | | ||
Total revenue, net of interest expense | 23,125 | |
| 22,248 | | ||
|
|
|
| ||||
Provision for credit losses | 834 | |
| 835 | | ||
|
|
|
| ||||
Noninterest expense |
| |
|
| | ||
Personnel | 8,480 | |
| 8,475 | | ||
Occupancy | 1,014 | |
| 1,000 | | ||
Equipment | 442 | |
| 438 | | ||
Marketing | 345 | |
| 332 | | ||
Professional fees | 381 | |
| 456 | | ||
Data processing | 810 | |
| 794 | | ||
Telecommunications | 183 | |
| 191 | | ||
Other general operating | 2,242 | |
| 2,407 | | ||
Total noninterest expense | 13,897 | |
| 14,093 | | ||
Income before income taxes | 8,394 | |
| 7,320 | | ||
Income tax expense | 1,476 | |
| 1,983 | | ||
Net income | $ | 6,918 | |
| $ | 5,337 | |
Preferred stock dividends | 428 | |
| 502 | | ||
Net income applicable to common shareholders | $ | 6,490 | |
| $ | 4,835 | |
|
|
|
| ||||
Per common share information |
| |
|
| | ||
Earnings | $ | 0.63 | |
| $ | 0.48 | |
Diluted earnings | 0.62 | |
| 0.45 | | ||
Dividends paid | 0.12 | |
| 0.075 | | ||
Average common shares issued and outstanding | 10,322.4 | |
| 10,099.6 | | ||
Average diluted common shares issued and outstanding | 10,472.7 | |
| 10,919.7 | | ||
See accompanying Notes to Consolidated Financial Statements.
|
| Bank of America 50 |
Bank of America Corporation and Subsidiaries
|
|
|
| ||||
Consolidated Statement of Comprehensive Income | |||||||
|
|
|
| ||||
| Three Months Ended March 31 | ||||||
(Dollars in millions) | 2018 |
| 2017 | ||||
Net income | $ | 6,918 | |
| $ | 5,337 | |
Other comprehensive income (loss), net-of-tax: |
|
|
| ||||
Net change in debt and equity securities | (3,963 | ) |
| (99 | ) | ||
Net change in debit valuation adjustments | 273 | |
| 9 | | ||
Net change in derivatives | (275 | ) |
| 38 | | ||
Employee benefit plan adjustments | 30 | |
| 27 | | ||
Net change in foreign currency translation adjustments | (48 | ) |
| (3 | ) | ||
Other comprehensive income (loss) | (3,983 | ) |
| (28 | ) | ||
Comprehensive income | $ | 2,935 | |
| $ | 5,309 | |
See accompanying Notes to Consolidated Financial Statements.
51 Bank of America |
|
|
Bank of America Corporation and Subsidiaries
|
|
|
| ||||
Consolidated Balance Sheet | |||||||
|
| ||||||
(Dollars in millions) | March 31 |
| December 31 | ||||
Assets |
| |
|
| | ||
Cash and due from banks | $ | 26,247 | |
| $ | 29,480 | |
Interest-bearing deposits with the Federal Reserve, non-U.S. central banks and other banks | 177,994 | |
| 127,954 | | ||
Cash and cash equivalents | 204,241 | |
| 157,434 | | ||
Time deposits placed and other short-term investments | 8,069 | |
| 11,153 | | ||
Federal funds sold and securities borrowed or purchased under agreements to resell (includes $68,556 and $52,906 measured at fair value) | 244,630 | |
| 212,747 | | ||
Trading account assets (includes $107,906 and $106,274 pledged as collateral) | 198,477 | |
| 209,358 | | ||
Derivative assets | 47,869 | |
| 37,762 | | ||
Debt securities: |
| |
|
| |||
Carried at fair value | 303,298 | |
| 315,117 | | ||
Held-to-maturity, at cost (fair value – $119,132 and $123,299) | 123,539 | |
| 125,013 | | ||
Total debt securities | 426,837 | |
| 440,130 | | ||
Loans and leases (includes $5,989 and $5,710 measured at fair value) | 934,078 | |
| 936,749 | | ||
Allowance for loan and lease losses | (10,260 | ) |
| (10,393 | ) | ||
Loans and leases, net of allowance | 923,818 | |
| 926,356 | | ||
Premises and equipment, net | 9,399 | |
| 9,247 | | ||
Goodwill | 68,951 | |
| 68,951 | | ||
Loans held-for-sale (includes $3,091 and $2,156 measured at fair value) | 9,227 | |
| 11,430 | | ||
Customer and other receivables | 58,127 | |
| 61,623 | | ||
Other assets (includes $20,575 and $22,581 measured at fair value) | 128,833 | |
| 135,043 | | ||
Total assets | $ | 2,328,478 | |
| $ | 2,281,234 | |
|
|
|
| ||||
Assets of consolidated variable interest entities included in total assets above (isolated to settle the liabilities of the variable interest entities) | |||||||
Trading account assets | $ | 6,065 | |
| $ | 6,521 | |
Loans and leases | 46,590 | |
| 48,929 | | ||
Allowance for loan and lease losses | (984 | ) |
| (1,016 | ) | ||
Loans and leases, net of allowance | 45,606 | |
| 47,913 | | ||
Loans held-for-sale | 13 | |
| 27 | | ||
All other assets | 399 | |
| 1,694 | | ||
Total assets of consolidated variable interest entities | $ | 52,083 | |
| $ | 56,155 | |
See accompanying Notes to Consolidated Financial Statements.
|
| Bank of America 52 |
Bank of America Corporation and Subsidiaries
|
|
|
| ||||
Consolidated Balance Sheet (continued) | |||||||
|
| ||||||
(Dollars in millions) | March 31 |
| December 31 | ||||
Liabilities |
| |
|
| | ||
Deposits in U.S. offices: |
| |
|
| | ||
Noninterest-bearing | $ | 434,709 | |
| $ | 430,650 | |
Interest-bearing (includes $435 and $449 measured at fair value) | 811,212 | |
| 796,576 | | ||
Deposits in non-U.S. offices: |
|
|
| ||||
Noninterest-bearing | 13,768 | |
| 14,024 | | ||
Interest-bearing | 68,975 | |
| 68,295 | | ||
Total deposits | 1,328,664 | |
| 1,309,545 | | ||
Federal funds purchased and securities loaned or sold under agreements to repurchase (includes $35,116 and $36,182 measured at fair value) | 178,528 | |
| 176,865 | | ||
Trading account liabilities | 100,218 | |
| 81,187 | | ||
Derivative liabilities | 33,900 | |
| 34,300 | | ||
Short-term borrowings (includes $2,284 and $1,494 measured at fair value) | 38,073 | |
| 32,666 | | ||
Accrued expenses and other liabilities (includes $20,176 and $22,840 measured at fair value and $782 and $777 of reserve for unfunded lending commitments) | 150,615 | |
| 152,123 | | ||
Long-term debt (includes $30,062 and $31,786 measured at fair value) | 232,256 | |
| 227,402 | | ||
Total liabilities | 2,062,254 | |
| 2,014,088 | | ||
Commitments and contingencies (Note 7 – Securitizations and Other Variable Interest Entities and Note 10 – Commitments and Contingencies) | | |
| | | ||
Shareholders' equity |
| |
|
| |||
Preferred stock, $0.01 par value; authorized – 100,000,000 shares; issued and outstanding – 3,931,683 and 3,837,683 shares | 24,672 | |
| 22,323 | | ||
Common stock and additional paid-in capital, $0.01 par value; authorized – 12,800,000,000 shares; issued and outstanding – 10,175,910,851 and 10,287,302,431 shares | 133,532 | |
| 138,089 | | ||
Retained earnings | 120,298 | |
| 113,816 | | ||
Accumulated other comprehensive income (loss) | (12,278 | ) |
| (7,082 | ) | ||
Total shareholders' equity | 266,224 | |
| 267,146 | | ||
Total liabilities and shareholders' equity | $ | 2,328,478 | |
| $ | 2,281,234 | |
|
|
|
| ||||
Liabilities of consolidated variable interest entities included in total liabilities above |
| |
|
| | ||
Short-term borrowings | $ | 286 | |
| $ | 312 | |
Long-term debt (includes $10,050 and $9,872 of non-recourse debt) | 10,051 | |
| 9,873 | | ||
All other liabilities (includes $35 and $34 of non-recourse liabilities) | 38 | |
| 37 | | ||
Total liabilities of consolidated variable interest entities | $ | 10,375 | |
| $ | 10,222 | |
See accompanying Notes to Consolidated Financial Statements.
53 Bank of America |
|
|
Bank of America Corporation and Subsidiaries
|
|
|
|
|
|
|
|
|
|
|
| |||||||||||
Consolidated Statement of Changes in Shareholders' Equity | ||||||||||||||||||||||
|
|
|
|
|
|
|
|
|
|
|
| |||||||||||
| Preferred Stock |
| Common Stock and Additional Paid-in Capital |
| Retained Earnings |
| Accumulated Comprehensive Income (Loss) |
| Total Shareholders' Equity | |||||||||||||
(In millions) |
| Shares |
| Amount |
|
|
| |||||||||||||||
Balance, December 31, 2016 | $ | 25,220 | |
| 10,052.6 | |
| $ | 147,038 | |
| $ | 101,225 | |
| $ | (7,288 | ) |
| $ | 266,195 | |
Net income |
|
|
|
|
|
| 5,337 | |
|
|
| 5,337 | | |||||||||
Net change in debt and equity securities |
|
|
|
|
|
|
|
| (99 | ) |
| (99 | ) | |||||||||
Net change in debit valuation adjustments |
|
|
|
|
|
|
|
| 9 | |
| 9 | | |||||||||
Net change in derivatives |
|
|
|
|
|
|
|
| 38 | |
| 38 | | |||||||||
Employee benefit plan adjustments |
|
|
|
|
|
|
|
| 27 | |
| 27 | | |||||||||
Net change in foreign currency translation adjustments |
|
|
|
|
|
|
|
| (3 | ) |
| (3 | ) | |||||||||
Dividends declared: |
|
|
|
|
|
|
|
|
|
|
| |||||||||||
Common |
|
|
|
|
|
| (756 | ) |
|
|
| (756 | ) | |||||||||
Preferred |
|
|
|
|
|
| (502 | ) |
|
|
| (502 | ) | |||||||||
Common stock issued under employee plans, net |
|
| 36.0 | |
| 472 | |
|
|
|
|
| 472 | | ||||||||
Common stock repurchased |
|
| (114.4 | ) |
| (2,728 | ) |
|
|
|
|
| (2,728 | ) | ||||||||
Balance, March 31, 2017 | $ | 25,220 | |
| 9,974.2 | |
| $ | 144,782 | |
| $ | 105,304 | |
| $ | (7,316 | ) |
| $ | 267,990 | |
|
|
|
|
|
|
|
|
|
|
|
| |||||||||||
Balance, December 31, 2017 | $ | 22,323 | |
| 10,287.3 | |
| $ | 138,089 | |
| $ | 113,816 | |
| $ | (7,082 | ) |
| $ | 267,146 | |
Cumulative adjustment for adoption of new hedge accounting standard |
|
|
|
|
|
| (32 | ) |
| 57 | |
| 25 | | ||||||||
Adoption of accounting standard related to certain tax effects stranded in accumulated other comprehensive income (loss) |
|
|
|
|
|
| 1,270 | |
| (1,270 | ) |
| - | | ||||||||
Net income |
|
|
|
|
|
| 6,918 | |
|
|
| 6,918 | | |||||||||
Net change in debt and equity securities |
|
|
|
|
|
|
|
| (3,963 | ) |
| (3,963 | ) | |||||||||
Net change in debit valuation adjustments |
|
|
|
|
|
|
|
| 273 | |
| 273 | | |||||||||
Net change in derivatives |
|
|
|
|
|
|
|
| (275 | ) |
| (275 | ) | |||||||||
Employee benefit plan adjustments |
|
|
|
|
|
|
|
| 30 | |
| 30 | | |||||||||
Net change in foreign currency translation adjustments |
|
|
|
|
|
|
|
| (48 | ) |
| (48 | ) | |||||||||
Dividends declared: |
|
|
|
|
|
|
|
|
|
|
| |||||||||||
Common |
|
|
|
|
|
| (1,237 | ) |
|
|
| (1,237 | ) | |||||||||
Preferred |
|
|
|
|
|
| (428 | ) |
|
|
| (428 | ) | |||||||||
Issuance of preferred stock | 2,349 | |
|
|
|
|
|
|
|
|
| 2,349 | | |||||||||
Common stock issued under employee plans, net and other |
|
| 41.2 | |
| 301 | |
| (9 | ) |
|
|
| 292 | | |||||||
Common stock repurchased |
|
| (152.6 | ) |
| (4,858 | ) |
|
|
|
|
| (4,858 | ) | ||||||||
Balance, March 31, 2018 | $ | 24,672 | |
| 10,175.9 | |
| $ | 133,532 | |
| $ | 120,298 | |
| $ | (12,278 | ) |
| $ | 266,224 | |
See accompanying Notes to Consolidated Financial Statements.
|
| Bank of America 54 |
Bank of America Corporation and Subsidiaries
|
|
|
| ||||
Consolidated Statement of Cash Flows |
|
|
| ||||
|
|
|
| ||||
| Three Months Ended March 31 | ||||||
(Dollars in millions) | 2018 |
| 2017 | ||||
Operating activities |
|
|
| ||||
Net income | $ | 6,918 | |
| $ | 5,337 | |
Adjustments to reconcile net income to net cash provided by (used in) operating activities: |
|
|
| ||||
Provision for credit losses | 834 | |
| 835 | | ||
Gains on sales of debt securities | (2 | ) |
| (52 | ) | ||
Depreciation and premises improvements amortization | 376 | |
| 372 | | ||
Amortization of intangibles | 135 | |
| 162 | | ||
Net amortization of premium/discount on debt securities | 475 | |
| 544 | | ||
Deferred income taxes | 804 | |
| 1,382 | | ||
Stock-based compensation | 415 | |
| 306 | | ||
Loans held-for-sale: |
|
|
| ||||
Originations and purchases | (5,745 | ) |
| (13,309 | ) | ||
Proceeds from sales and paydowns of loans originally classified as held for sale and instruments from related securitization activities | 9,876 | |
| 7,755 | | ||
Net change in: |
|
|
| ||||
Trading and derivative instruments | 15,807 | |
| (16,723 | ) | ||
Other assets | 11,233 | |
| 3,532 | | ||
Accrued expenses and other liabilities | (814 | ) |
| (4,518 | ) | ||
Other operating activities, net | 42 | |
| 1,388 | | ||
Net cash provided by (used in) operating activities | 40,354 | |
| (12,989 | ) | ||
Investing activities |
|
|
| ||||
Net change in: |
|
|
| ||||
Time deposits placed and other short-term investments | 3,084 | |
| (2,106 | ) | ||
Federal funds sold and securities borrowed or purchased under agreements to resell | (31,883 | ) |
| (12,509 | ) | ||
Debt securities carried at fair value: |
|
|
| ||||
Proceeds from sales | 683 | |
| 22,087 | | ||
Proceeds from paydowns and maturities | 19,052 | |
| 24,015 | | ||
Purchases | (14,176 | ) |
| (44,198 | ) | ||
Held-to-maturity debt securities: |
|
|
| ||||
Proceeds from paydowns and maturities | 3,764 | |
| 3,874 | | ||
Purchases | (2,453 | ) |
| (3,033 | ) | ||
Loans and leases: |
|
|
| ||||
Proceeds from sales of loans originally classified as held for investment and instruments from related securitization activities | 2,684 | |
| 2,590 | | ||
Purchases | (1,609 | ) |
| (1,648 | ) | ||
Other changes in loans and leases, net | (1,190 | ) |
| (1,811 | ) | ||
Other investing activities, net | (805 | ) |
| (1,202 | ) | ||
Net cash used in investing activities | (22,849 | ) |
| (13,941 | ) | ||
Financing activities |
|
|
| ||||
Net change in: |
|
|
| ||||
Deposits | 19,119 | |
| 11,207 | | ||
Federal funds purchased and securities loaned or sold under agreements to repurchase | 1,626 | |
| 15,807 | | ||
Short-term borrowings | 5,407 | |
| 20,131 | | ||
Long-term debt: |
|
|
| ||||
Proceeds from issuance | 20,934 | |
| 17,378 | | ||
Retirement | (13,577 | ) |
| (13,552 | ) | ||
Proceeds from issuance of preferred stock | 2,349 | |
| - | | ||
Common stock repurchased | (4,858 | ) |
| (2,728 | ) | ||
Cash dividends paid | (1,674 | ) |
| (1,255 | ) | ||
Other financing activities, net | (724 | ) |
| (584 | ) | ||
Net cash provided by financing activities | 28,602 | |
| 46,404 | | ||
Effect of exchange rate changes on cash and cash equivalents | 700 | |
| 813 | | ||
Net increase in cash and cash equivalents | 46,807 | |
| 20,287 | | ||
Cash and cash equivalents at January 1 | 157,434 | |
| 147,738 | | ||
Cash and cash equivalents at March 31 | $ | 204,241 | |
| $ | 168,025 | |
See accompanying Notes to Consolidated Financial Statements.
55 Bank of America |
|
|
Bank of America Corporation and Subsidiaries
Notes to Consolidated Financial Statements
NOTE 1
Summary of Significant Accounting Principles
Bank of America Corporation, a bank holding company and a financial holding company, provides a diverse range of financial services and products throughout the U.S. and in certain international markets. The term "the Corporation" as used herein may refer to Bank of America Corporation, individually, Bank of America Corporation and its subsidiaries, or certain of Bank of America Corporation's subsidiaries or affiliates.
Principles of Consolidation and Basis of Presentation
The Consolidated Financial Statements include the accounts of the Corporation and its majority-owned subsidiaries and those variable interest entities (VIEs) where the Corporation is the primary beneficiary. Intercompany accounts and transactions have been eliminated. Results of operations of acquired companies are included from the dates of acquisition and for VIEs, from the dates that the Corporation became the primary beneficiary. Assets held in an agency or fiduciary capacity are not included in the Consolidated Financial Statements. The Corporation accounts for investments in companies for which it owns a voting interest and for which it has the ability to exercise significant influence over operating and financing decisions using the equity method of accounting. These investments are included in other assets. Equity method investments are subject to impairment testing, and the Corporation's proportionate share of income or loss is included in other income.
The preparation of the Consolidated Financial Statements in conformity with accounting principles generally accepted in the United States of America (GAAP) requires management to make estimates and assumptions that affect reported amounts and disclosures. Realized results could materially differ from those estimates and assumptions.
These unaudited Consolidated Financial Statements should be read in conjunction with the audited Consolidated Financial Statements of the Corporation's 2017 Annual Report on Form 10-K.
The nature of the Corporation's business is such that the results of any interim period are not necessarily indicative of results for a full year. In the opinion of management, all adjustments, which consist of normal recurring adjustments necessary for a fair statement of the interim period results, have been made. The Corporation evaluates subsequent events through the date of filing with the Securities and Exchange Commission (SEC). Certain prior-period amounts have been reclassified to conform to current period presentation.
Change in Tax Law
On December 22, 2017, the President signed into law the Tax Cuts and Jobs Act (the Tax Act) which made significant changes to federal income tax law including, among other things, reducing the statutory corporate income tax rate to 21 percent from 35 percent and changing the taxation of the Corporation's non-U.S. business activities. On the same date, the SEC issued Staff Accounting Bulletin No. 118 which specifies, among other things, that
reasonable estimates of the income tax effects of the Tax Act should be used, if determinable. The Corporation has accounted for the effects of the Tax Act using reasonable estimates based on currently available information and its interpretations thereof. This accounting may change due to, among other things, changes in interpretations the Corporation has made and the issuance of new tax or accounting guidance.
Accounting Standards Adopted on January 1, 2018
Effective January 1, 2018, the Corporation adopted the following new accounting standards on a prospective basis. For additional information, see Note 1 – Summary of Significant Accounting Principles to the Consolidated Financial Statements of the Corporation's 2017 Annual Report on Form 10-K.
● | Revenue Recognition – The new accounting standard addresses the recognition of revenue from contracts with customers. For additional information, see Revenue Recognition Accounting Policies in this Note, Note 2 – Noninterest Income and Note 17 – Business Segment Information . |
● | Hedge Accounting – The new accounting standard simplifies and expands the ability to apply hedge accounting to certain risk management activities. For additional information, see Note 3 – Derivatives . |
● | Recognition and Measurement of Financial Assets and Liabilities – The new accounting standard relates to the recognition and measurement of financial instruments, including equity investments. For additional information, see Note 4 – Securities and Note 16 – Fair Value of Financial Instruments . |
● | Tax Effects in Accumulated Other Comprehensive Income – The new accounting standard addresses certain tax effects stranded in accumulated other comprehensive income (OCI) related to the Tax Act. For additional information, see Note 12 – Accumulated Other Comprehensive Income (Loss) . |
Effective January 1, 2018, the Corporation adopted the following new accounting standards on a retrospective basis, resulting in restatement of all prior periods presented in the Consolidated Statement of Income and the Consolidated Statement of Cash Flows. The changes in presentation are not material to the individual line items affected.
● | Presentation of Pension Costs – The new accounting standard requires separate presentation of the service cost component of pension expense from all other components of net pension benefit/cost in the Consolidated Statement of Income. As a result, the service cost component continues to be presented in personnel expense while other components of net pension benefit/cost (e.g., interest cost, actual return on plan assets, amortization of prior service cost) are now presented in other general operating expense. |
● | Classification of Cash Flows and Restricted Cash – The new accounting standards address the classification of certain cash receipts and cash payments in the statement of cash flows as well as the presentation and disclosure of restricted cash. For more information on restricted cash, see Note 9 – Federal Funds Sold or Purchased, Securities Financing Agreements, Short-term Borrowings and Restricted Cash . |
|
| Bank of America 56 |
Accounting Standards Issued and Not Yet Adopted
Lease Accounting
The Financial Accounting Standards Board (FASB) issued a new accounting standard effective on January 1, 2019 that requires substantially all leases to be recorded as assets and liabilities on the balance sheet. On January 5, 2018, the FASB issued an exposure draft proposing an amendment to the standard that, if approved, would permit companies the option to apply the provisions of the new lease standard either prospectively as of the effective date, without adjusting comparative periods presented, or using a modified retrospective transition applicable to all prior periods presented. The Corporation is in the process of reviewing its existing lease portfolios, including certain service contracts for embedded leases, to evaluate the impact of the standard on the consolidated financial statements, as well as the impact to regulatory capital and risk-weighted assets. The effect of the adoption will depend on the lease portfolio at the time of transition and the transition options ultimately available; however, the Corporation does not expect the new accounting standard to have a material impact on its consolidated financial position, results of operations or disclosures in the Notes to the Consolidated Financial Statements.
Accounting for Financial Instruments -- Credit Losses
The FASB issued a new accounting standard effective on January 1, 2020, with early adoption permitted on January 1, 2019, that will replace the existing measurement of the allowance for credit losses with management's best estimate of probable credit losses inherent in the Corporation's lending activities. The new standard will reflect management's best estimate of all expected credit losses for substantially all of the Corporation's financial assets that are recognized at amortized cost. The standard also requires expanded credit quality disclosures. The Corporation is in the process of identifying and implementing required changes to credit loss estimation models and processes and evaluating the impact of this new accounting standard, which at the date of adoption may increase the allowance for credit losses with a resulting negative adjustment to retained earnings. The change will be dependent on the characteristics of the Corporation's portfolio at adoption date as well as the macroeconomic conditions and forecast as of that date. While a final decision has not been made, the Corporation does not expect to early adopt the standard.
Revenue Recognition Accounting Policies
The following summarizes the Corporation's revenue recognition accounting policies for certain noninterest income activities.
Card Income
Card income includes annual, late and over-limit fees as well as fees earned from interchange, cash advances and other miscellaneous transactions and is presented net of direct costs. Interchange fees are recognized upon settlement of the credit and debit card payment transactions and are generally determined on a percentage basis for credit cards and fixed rates for debit cards based on the corresponding payment network's rates. Substantially all card fees are recognized at the transaction date, except for certain time-based fees such as annual fees, which are recognized over 12 months. Fees charged to cardholders that are
estimated to be uncollectible are reserved in the allowance for loan and lease losses. Rewards paid to cardholders are related to points earned by the cardholder that can be redeemed for a broad range of rewards including cash, travel and gift cards. Based on past redemption behavior, card product type, account transaction activity and other historical card performance, the Corporation estimates a liability based on the amount of earned reward points that are expected to be redeemed. The Corporation also makes payments to credit card partners. The payments are based on revenue-sharing agreements that are generally driven by cardholder transactions and partner sales volumes.
Service Charges
Service charges include deposit and lending-related fees. Deposit-related fees consist of fees earned on consumer and commercial deposit activities and are generally recognized when the transactions occur or as the service is performed. Consumer fees are earned on consumer deposit accounts for account maintenance and various transaction-based services, such as ATM transactions, wire transfer activities, check and money order processing and insufficient funds/overdraft transactions. Commercial deposit-related fees are from the Corporation's Global Transaction Services business and consist of commercial deposit and treasury management services, including account maintenance and other services, such as payroll, sweep account and other cash management services. Lending-related fees generally represent transactional fees earned from certain loan commitments, financial guarantees and standby letters of credit (SBLCs).
Investment and Brokerage Services
Investment and brokerage services consist of asset management and brokerage fees. Asset management fees are earned from the management of client assets under advisory agreements or the full discretion of the Corporation's financial advisors (collectively referred to as assets under management (AUM)). Asset management fees are earned as a percentage of the client's AUM and generally range from 50 basis points (bps) to 150 bps of the AUM. In cases where a third party is used to obtain a client's investment allocation, the fee remitted to the third party is recorded net and is not reflected in the transaction price, as the Corporation is an agent for those services.
Brokerage fees include income earned from transaction-based services that are performed as part of investment management services and are based on a fixed price per unit or as a percentage of the total transaction amount. Brokerage fees also include distribution fees and sales commissions that are primarily in the Global Wealth & Investment Management ( GWIM ) segment and are earned over time. In addition, primarily in the Global Markets segment, brokerage fees are earned when the Corporation fills customer orders to buy or sell various financial products or when it acknowledges, affirms, settles and clears transactions and/or submits trade information to the appropriate clearing broker. Certain customers pay brokerage, clearing and/or exchange fees imposed by relevant regulatory bodies or exchanges in order to execute or clear trades. These fees are recorded net and are not reflected in the transaction price, as the Corporation is an agent for those services.
57 Bank of America |
|
|
Investment Banking Income
Investment banking income includes underwriting income and financial advisory services income. Underwriting consists of fees earned for the placement of a customer's debt or equity securities. The revenue is generally earned based on a percentage of the fixed number of shares or principal placed. Once the number of shares or notes is determined and the service is completed, the underwriting fees are recognized. The Corporation incurs certain out-of-pocket expenses, such as legal costs, in performing these services. These expenses are recovered through the revenue the Corporation earns from the customer and are included in operating expenses. Syndication fees represent fees earned as the agent or lead lender responsible for structuring, arranging and administering a loan syndication.
Financial advisory services consist of fees earned for assisting customers with transactions related to mergers and acquisitions
and financial restructurings. Revenue varies depending on the size and number of services performed for each contract and is generally contingent on successful execution of the transaction. Revenue is typically recognized once the transaction is completed and all services have been rendered. Additionally, the Corporation may earn a fixed fee in merger and acquisition transactions to provide a fairness opinion, with the fees recognized when the opinion is delivered to the customer.
Other Revenue Measurement and Recognition Policies
The Corporation did not disclose the value of any open performance obligations at March 31, 2018, as its contracts with customers generally have a fixed term that is less than one year, an open term with a cancellation period that is less than one year, or provisions that allow the Corporation to recognize revenue at the amount it has the right to invoice.
NOTE 2
Noninterest Income
The table below presents the Corporation's noninterest income disaggregated by revenue source for the three months ended March 31, 2018 and 2017 . For more information, see Note 1 – Summary of Significant Accounting Principles . For a disaggregation of noninterest income by business segment and All Other , see Note 17 – Business Segment Information .
|
| ||||||
| Three Months Ended March 31 | ||||||
(Dollars in millions) | 2018 |
| 2017 | ||||
Card income |
|
|
| ||||
Interchange fees (1) | $ | 971 | |
| $ | 958 | |
Other card income | 486 | |
| 491 | | ||
Total card income | 1,457 | |
| 1,449 | | ||
Service charges |
|
|
| ||||
Deposit-related fees | 1,646 | |
| 1,653 | | ||
Lending-related fees | 275 | |
| 265 | | ||
Total service charges | 1,921 | |
| 1,918 | | ||
Investment and brokerage services |
|
|
| ||||
Asset management fees | 2,564 | |
| 2,200 | | ||
Brokerage fees | 1,100 | |
| 1,217 | | ||
Total investment and brokerage services | 3,664 | |
| 3,417 | | ||
Investment banking income |
|
|
| ||||
Underwriting income | 740 | |
| 779 | | ||
Syndication fees | 316 | |
| 400 | | ||
Financial advisory services | 297 | |
| 405 | | ||
Total investment banking income | 1,353 | |
| 1,584 | | ||
Trading account profits | 2,699 | |
| 2,331 | | ||
Other income | 423 | |
| 491 | | ||
Total noninterest income | $ | 11,517 | |
| $ | 11,190 | |
(1) | Gross interchange fees were $2.2 billion and $2.0 billion for the three months ended March 31, 2018 and 2017 , and are presented net of $1.3 billion and $1.1 billion of expenses for rewards and partner payments. |
|
| Bank of America 58 |
NOTE 3
Derivatives
Derivative Balances
Derivatives are entered into on behalf of customers, for trading or to support risk management activities. Derivatives used in risk management activities include derivatives that may or may not be designated in qualifying hedge accounting relationships. Derivatives that are not designated in qualifying hedge accounting relationships are referred to as other risk management derivatives. For more information on the Corporation's derivatives and hedging activities, see Note 1 – Summary of Significant Accounting
Principles to the Consolidated Financial Statements of the Corporation's 2017 Annual Report on Form 10-K . The following tables present derivative instruments included on the Consolidated Balance Sheet in derivative assets and liabilities at March 31, 2018 and December 31, 2017 . Balances are presented on a gross basis, prior to the application of counterparty and cash collateral netting. Total derivative assets and liabilities are adjusted on an aggregate basis to take into consideration the effects of legally enforceable master netting agreements and have been reduced by cash collateral received or paid.
|
|
|
|
|
|
|
|
|
|
|
|
|
| |||||||||||||||
|
|
| March 31, 2018 | |||||||||||||||||||||||||
|
|
| Gross Derivative Assets |
| Gross Derivative Liabilities | |||||||||||||||||||||||
(Dollars in billions) | Contract/ Notional (1) |
| Trading and Other Risk Management Derivatives |
| Qualifying Hedges |
| Total |
| Trading and Other Risk Management Derivatives |
| Qualifying Hedges |
| Total | |||||||||||||||
Interest rate contracts |
| |
|
| |
|
| |
|
| |
|
| |
|
| |
|
| | ||||||||
Swaps | $ | 17,401.6 | |
| $ | 166.4 | |
| $ | 2.2 | |
| $ | 168.6 | |
| $ | 160.8 | |
| $ | 3.5 | |
| $ | 164.3 | | |
Futures and forwards | 6,470.8 | |
| 1.6 | |
| - | |
| 1.6 | |
| 1.6 | |
| - | |
| 1.6 | | ||||||||
Written options | 1,274.0 | |
| - | |
| - | |
| - | |
| 33.7 | |
| - | |
| 33.7 | | ||||||||
Purchased options | 1,258.0 | |
| 35.4 | |
| - | |
| 35.4 | |
| - | |
| - | |
| - | | ||||||||
Foreign exchange contracts |
|
|
|
|
|
|
| |
|
|
|
| |
|
| | ||||||||||||
Swaps | 2,044.4 | |
| 35.8 | |
| 2.0 | |
| 37.8 | |
| 37.3 | |
| 2.5 | |
| 39.8 | | ||||||||
Spot, futures and forwards | 4,734.3 | |
| 43.4 | |
| 0.8 | |
| 44.2 | |
| 40.5 | |
| 0.7 | |
| 41.2 | | ||||||||
Written options | 363.3 | |
| - | |
| - | |
| - | |
| 5.1 | |
| - | |
| 5.1 | | ||||||||
Purchased options | 323.2 | |
| 4.9 | |
| - | |
| 4.9 | |
| - | |
| - | |
| - | | ||||||||
Equity contracts |
|
|
|
|
|
|
| |
|
|
|
| |
|
| | ||||||||||||
Swaps | 271.1 | |
| 5.7 | |
| - | |
| 5.7 | |
| 5.8 | |
| - | |
| 5.8 | | ||||||||
Futures and forwards | 102.4 | |
| 0.9 | |
| - | |
| 0.9 | |
| 0.7 | |
| - | |
| 0.7 | | ||||||||
Written options | 521.5 | |
| - | |
| - | |
| - | |
| 25.5 | |
| - | |
| 25.5 | | ||||||||
Purchased options | 491.0 | |
| 38.3 | |
| - | |
| 38.3 | |
| - | |
| - | |
| - | | ||||||||
Commodity contracts |
| |
|
|
|
|
|
| |
|
|
|
| |
|
| | |||||||||||
Swaps | 49.4 | |
| 1.9 | |
| - | |
| 1.9 | |
| 4.6 | |
| - | |
| 4.6 | | ||||||||
Futures and forwards | 52.8 | |
| 3.6 | |
| - | |
| 3.6 | |
| 0.7 | |
| - | |
| 0.7 | | ||||||||
Written options | 23.1 | |
| - | |
| - | |
| - | |
| 1.5 | |
| - | |
| 1.5 | | ||||||||
Purchased options | 24.3 | |
| 1.6 | |
| - | |
| 1.6 | |
| - | |
| - | |
| - | | ||||||||
Credit derivatives (2) |
| |
|
|
|
| |
|
| |
|
|
|
| |
|
| | ||||||||||
Purchased credit derivatives: |
| |
|
|
|
| |
|
| |
|
|
|
| |
|
| | ||||||||||
Credit default swaps | 484.1 | |
| 3.9 | |
| - | |
| 3.9 | |
| 11.4 | |
| - | |
| 11.4 | | ||||||||
Total return swaps/options | 67.6 | |
| 0.2 | |
| - | |
| 0.2 | |
| 1.3 | |
| - | |
| 1.3 | | ||||||||
Written credit derivatives: |
|
|
|
|
| |
|
| |
|
|
|
| |
|
| | |||||||||||
Credit default swaps | 457.4 | |
| 11.0 | |
| - | |
| 11.0 | |
| 3.4 | |
| - | |
| 3.4 | | ||||||||
Total return swaps/options | 65.2 | |
| 0.8 | |
| - | |
| 0.8 | |
| 0.3 | |
| - | |
| 0.3 | | ||||||||
Gross derivative assets/liabilities |
|
| $ | 355.4 | |
| $ | 5.0 | |
| $ | 360.4 | |
| $ | 334.2 | |
| $ | 6.7 | |
| $ | 340.9 | | |||
Less: Legally enforceable master netting agreements |
| |
|
| |
|
| |
| (276.0 | ) | - | |
| |
|
| |
| (276.0 | ) | |||||||
Less: Cash collateral received/paid |
| |
|
| |
|
| |
| (36.5 | ) |
|
| |
|
| |
| (31.0 | ) | ||||||||
Total derivative assets/liabilities |
| |
|
| |
|
| |
| $ | 47.9 | |
|
| |
|
| |
| $ | 33.9 | | ||||||
(1) | Represents the total contract/notional amount of derivative assets and liabilities outstanding. |
(2) | The net derivative asset and notional amount of written credit derivatives for which the Corporation held purchased credit derivatives with identical underlying referenced names were $6.7 billion and $456.5 billion at March 31, 2018 . |
59 Bank of America |
|
|
|
|
|
|
|
|
|
|
|
|
|
|
|
| ||||||||||||||
|
|
| December 31, 2017 | ||||||||||||||||||||||||
|
|
| Gross Derivative Assets |
| Gross Derivative Liabilities | ||||||||||||||||||||||
(Dollars in billions) | Contract/ Notional (1) |
| Trading and Other Risk Management Derivatives |
| Qualifying Hedges |
| Total |
| Trading and Other Risk Management Derivatives |
| Qualifying Hedges |
| Total | ||||||||||||||
Interest rate contracts |
| |
|
| |
|
| |
|
| |
|
| |
|
| |
|
| | |||||||
Swaps | $ | 15,416.4 | |
| $ | 175.1 | |
| $ | 2.9 | |
| $ | 178.0 | |
| $ | 172.5 | |
| $ | 1.7 | |
| $ | 174.2 | |
Futures and forwards | 4,332.4 | |
| 0.5 | |
| - | |
| 0.5 | |
| 0.5 | |
| - | |
| 0.5 | | |||||||
Written options | 1,170.5 | |
| - | |
| - | |
| - | |
| 35.5 | |
| - | |
| 35.5 | | |||||||
Purchased options | 1,184.5 | |
| 37.6 | |
| - | |
| 37.6 | |
| - | |
| - | |
| - | | |||||||
Foreign exchange contracts |
|
|
| |
|
| |
|
| |
|
| |
|
| |
|
| | ||||||||
Swaps | 2,011.1 | |
| 35.6 | |
| 2.2 | |
| 37.8 | |
| 36.1 | |
| 2.7 | |
| 38.8 | | |||||||
Spot, futures and forwards | 3,543.3 | |
| 39.1 | |
| 0.7 | |
| 39.8 | |
| 39.1 | |
| 0.8 | |
| 39.9 | | |||||||
Written options | 291.8 | |
| - | |
| - | |
| - | |
| 5.1 | |
| - | |
| 5.1 | | |||||||
Purchased options | 271.9 | |
| 4.6 | |
| - | |
| 4.6 | |
| - | |
| - | |
| - | | |||||||
Equity contracts |
| |
|
| |
|
| |
|
| |
|
| |
|
| |
|
| | |||||||
Swaps | 265.6 | |
| 4.8 | |
| - | |
| 4.8 | |
| 4.4 | |
| - | |
| 4.4 | | |||||||
Futures and forwards | 106.9 | |
| 1.5 | |
| - | |
| 1.5 | |
| 0.9 | |
| - | |
| 0.9 | | |||||||
Written options | 480.8 | |
| - | |
| - | |
| - | |
| 23.9 | |
| - | |
| 23.9 | | |||||||
Purchased options | 428.2 | |
| 24.7 | |
| - | |
| 24.7 | |
| - | |
| - | |
| - | | |||||||
Commodity contracts |
| |
|
| |
|
| |
|
| |
|
| |
|
| |
|
| | |||||||
Swaps | 46.1 | |
| 1.8 | |
| - | |
| 1.8 | |
| 4.6 | |
| - | |
| 4.6 | | |||||||
Futures and forwards | 47.1 | |
| 3.5 | |
| - | |
| 3.5 | |
| 0.6 | |
| - | |
| 0.6 | | |||||||
Written options | 21.7 | |
| - | |
| - | |
| - | |
| 1.4 | |
| - | |
| 1.4 | | |||||||
Purchased options | 22.9 | |
| 1.4 | |
| - | |
| 1.4 | |
| - | |
| - | |
| - | | |||||||
Credit derivatives (2) |
| |
|
| |
|
| |
|
| |
|
| |
|
| |
|
| | |||||||
Purchased credit derivatives: |
| |
|
| |
|
| |
|
| |
|
| |
|
| |
|
| | |||||||
Credit default swaps | 470.9 | |
| 4.1 | |
| - | |
| 4.1 | |
| 11.1 | |
| - | |
| 11.1 | | |||||||
Total return swaps/options | 54.1 | |
| 0.1 | |
| - | |
| 0.1 | |
| 1.3 | |
| - | |
| 1.3 | | |||||||
Written credit derivatives: |
| |
|
| |
|
| |
|
| |
|
|
|
| |
|
| | ||||||||
Credit default swaps | 448.2 | |
| 10.6 | |
| - | |
| 10.6 | |
| 3.6 | |
| - | |
| 3.6 | | |||||||
Total return swaps/options | 55.2 | |
| 0.8 | |
| - | |
| 0.8 | |
| 0.2 | |
| - | |
| 0.2 | | |||||||
Gross derivative assets/liabilities |
| |
| $ | 345.8 | |
| $ | 5.8 | |
| $ | 351.6 | |
| $ | 340.8 | |
| $ | 5.2 | |
| $ | 346.0 | | |
Less: Legally enforceable master netting agreements |
| |
|
| |
|
| |
| (279.2 | ) |
|
| |
|
| |
| (279.2 | ) | |||||||
Less: Cash collateral received/paid |
| |
|
| |
|
| |
| (34.6 | ) |
|
| |
|
| |
| (32.5 | ) | |||||||
Total derivative assets/liabilities |
| |
|
| |
|
| |
| $ | 37.8 | |
|
| |
|
| |
| $ | 34.3 | | |||||
(1) | Represents the total contract/notional amount of derivative assets and liabilities outstanding. |
(2) | The net derivative asset and notional amount of written credit derivatives for which the Corporation held purchased credit derivatives with identical underlying referenced names were $6.4 billion and $435.1 billion at December 31, 2017 . |
Offsetting of Derivatives
The Corporation enters into International Swaps and Derivatives Association, Inc. (ISDA) master netting agreements or similar agreements with substantially all of the Corporation's derivative counterparties. Where legally enforceable, these master netting agreements give the Corporation, in the event of default by the counterparty, the right to liquidate securities held as collateral and to offset receivables and payables with the same counterparty. For purposes of the Consolidated Balance Sheet, the Corporation offsets derivative assets and liabilities and cash collateral held with the same counterparty where it has such a legally enforceable master netting agreement.
The following table presents derivative instruments included in derivative assets and liabilities on the Consolidated Balance
Sheet at March 31, 2018 and December 31, 2017 by primary risk (e.g., interest rate risk) and the platform, where applicable, on which these derivatives are transacted. Balances are presented on a gross basis, prior to the application of counterparty and cash collateral netting. Total gross derivative assets and liabilities are adjusted on an aggregate basis to take into consideration the effects of legally enforceable master netting agreements which include reducing the balance for counterparty netting and cash collateral received or paid.
For more information on offsetting of securities financing agreements, see Note 9 – Federal Funds Sold or Purchased, Securities Financing Agreements, Short-term Borrowings and Restricted Cash .
|
| Bank of America 60 |
|
|
|
|
|
|
|
| ||||||||
Offsetting of Derivatives (1) |
|
|
|
|
|
|
| ||||||||
|
|
|
|
|
|
|
| ||||||||
| Derivative Assets |
| Derivative Liabilities |
| Derivative Assets |
| Derivative Liabilities | ||||||||
(Dollars in billions) | March 31, 2018 |
| December 31, 2017 | ||||||||||||
Interest rate contracts |
| |
|
| |
|
| |
|
| | ||||
Over-the-counter | $ | 200.0 | |
| $ | 194.2 | |
| $ | 211.7 | |
| $ | 206.0 | |
Over-the-counter cleared | 3.4 | |
| 2.9 | |
| 1.9 | |
| 1.8 | | ||||
Foreign exchange contracts |
|
|
|
|
|
|
| ||||||||
Over-the-counter | 83.5 | |
| 83.3 | |
| 78.7 | |
| 80.8 | | ||||
Over-the-counter cleared | 0.5 | |
| 0.5 | |
| 0.9 | |
| 0.7 | | ||||
Equity contracts |
|
|
|
|
|
|
| ||||||||
Over-the-counter | 28.5 | |
| 16.3 | |
| 18.3 | |
| 16.2 | | ||||
Exchange-traded | 11.7 | |
| 11.3 | |
| 9.1 | |
| 8.5 | | ||||
Commodity contracts |
|
|
|
|
|
|
| ||||||||
Over-the-counter | 3.2 | |
| 4.2 | |
| 2.9 | |
| 4.4 | | ||||
Exchange-traded | 0.8 | |
| 0.8 | |
| 0.7 | |
| 0.8 | | ||||
Credit derivatives |
|
|
|
|
|
|
| ||||||||
Over-the-counter | 8.7 | |
| 9.3 | |
| 9.1 | |
| 9.6 | | ||||
Over-the-counter cleared | 6.8 | |
| 6.6 | |
| 6.1 | |
| 6.0 | | ||||
Total gross derivative assets/liabilities, before netting |
|
|
|
|
|
|
| ||||||||
Over-the-counter | 323.9 | |
| 307.3 | |
| 320.7 | |
| 317.0 | | ||||
Exchange-traded | 12.5 | |
| 12.1 | |
| 9.8 | |
| 9.3 | | ||||
Over-the-counter cleared | 10.7 | |
| 10.0 | |
| 8.9 | |
| 8.5 | | ||||
Less: Legally enforceable master netting agreements and cash collateral received/paid |
|
|
|
|
|
|
| ||||||||
Over-the-counter | (291.8 | ) |
| (286.0 | ) |
| (296.9 | ) |
| (294.6 | ) | ||||
Exchange-traded | (11.0 | ) |
| (11.0 | ) |
| (8.6 | ) |
| (8.6 | ) | ||||
Over-the-counter cleared | (9.7 | ) |
| (10.0 | ) |
| (8.3 | ) |
| (8.5 | ) | ||||
Derivative assets/liabilities, after netting | 34.6 | |
| 22.4 | |
| 25.6 | |
| 23.1 | | ||||
Other gross derivative assets/liabilities (2) | 13.3 | |
| 11.5 | |
| 12.2 | |
| 11.2 | | ||||
Total derivative assets/liabilities | 47.9 | |
| 33.9 | |
| 37.8 | |
| 34.3 | | ||||
Less: Financial instruments collateral (3) | (20.1 | ) |
| (8.7 | ) |
| (11.2 | ) |
| (10.4 | ) | ||||
Total net derivative assets/liabilities | $ | 27.8 | |
| $ | 25.2 | |
| $ | 26.6 | |
| $ | 23.9 | |
(1) | Over-the-counter (OTC) derivatives include bilateral transactions between the Corporation and a particular counterparty. OTC-cleared derivatives include bilateral transactions between the Corporation and a counterparty where the transaction is cleared through a clearinghouse, and exchange-traded derivatives include listed options transacted on an exchange. |
(2) | Consists of derivatives entered into under master netting agreements where the enforceability of these agreements is uncertain under bankruptcy laws in some countries or industries. |
(3) | Amounts are limited to the derivative asset/liability balance and, accordingly, do not include excess collateral received/pledged. Financial instruments collateral includes securities collateral received or pledged and cash securities held and posted at third-party custodians that are not offset on the Consolidated Balance Sheet but shown as a reduction to derive net derivative assets and liabilities. |
ALM and Risk Management Derivatives
The Corporation's asset and liability management (ALM) and risk management activities include the use of derivatives to mitigate risk to the Corporation including derivatives designated in qualifying hedge accounting relationships and derivatives used in other risk management activities. For additional information, see Note 2 – Derivatives to the Consolidated Financial Statements of the Corporation's 2017 Annual Report on Form 10-K .
Derivatives Designated as Accounting Hedges
The Corporation uses various types of interest rate and foreign exchange derivative contracts to protect against changes in the fair value of its assets and liabilities due to fluctuations in interest rates and exchange rates (fair value hedges). The Corporation also
uses these types of contracts and equity derivatives to protect against changes in the cash flows of its assets and liabilities, and other forecasted transactions (cash flow hedges). The Corporation hedges its net investment in consolidated non-U.S. operations determined to have functional currencies other than the U.S. dollar using forward exchange contracts and cross-currency basis swaps, and by issuing foreign currency-denominated debt (net investment hedges).
Effective January 1, 2018, the Corporation early adopted the new hedge accounting standard on a prospective basis and, accordingly, prior-period hedge accounting disclosures were not conformed to the current-period presentation. For more information, see Note 1 – Summary of Significant Accounting Principles .
61 Bank of America |
|
|
Fair Value Hedges
The table below summarizes information related to fair value hedges for the three months ended March 31, 2018 and 2017 .
|
|
|
|
|
|
|
|
|
| ||||||||||
Gains and Losses on Derivatives Designated as Fair Value Hedges | |||||||||||||||||||
|
|
|
|
|
|
|
|
|
| ||||||||||
| Three Months Ended March 31 | ||||||||||||||||||
| 2018 |
| 2017 | ||||||||||||||||
(Dollars in millions) | Derivative |
| Hedged Item |
| Derivative |
| Hedged Item |
| Hedge Ineffectiveness | ||||||||||
Interest rate risk on long-term debt (1) | $ | (2,305 | ) |
| $ | 2,236 | |
| $ | (750 | ) |
| $ | 566 | |
| $ | (184 | ) |
Interest rate and foreign currency risk on long-term debt (2, 3) | 322 | |
| (346 | ) |
| 123 | |
| (133 | ) |
| (10 | ) | |||||
Interest rate risk on available-for-sale securities (4) | (31 | ) |
| 30 | |
| 17 | |
| (37 | ) |
| (20 | ) | |||||
Total | $ | (2,014 | ) |
| $ | 1,920 | |
| $ | (610 | ) |
| $ | 396 | |
| $ | (214 | ) |
(1) | Amounts are recorded in interest expense in the Consolidated Statement of Income. |
(2) | For the three months ended March 31, 2018 , the derivative amount includes a gain of $433 million in other income and a loss of $64 million in interest expense. For the three months ended March 31, 2017 , the derivative amount includes a gain of $280 million in other income and a loss of $157 million in interest expense. Line item totals are in the Consolidated Statement of Income. |
(3) | For the three months ended March 31, 2018 , the derivative amount includes a $47 million loss related to certain changes in the fair value of derivatives that were excluded from effectiveness testing and recognized in accumulated OCI. None of the excluded amounts have been reclassified into earnings. |
(4) | Amounts are recorded in interest income in the Consolidated Statement of Income. |
The table below summarizes the carrying value of hedged assets and liabilities that are designated and qualifying in fair value hedging relationships along with the cumulative amount of fair value hedging adjustments included in the carrying value that have been recorded in the current hedging relationships. These fair value hedging adjustments are open basis adjustments that are not subject to amortization as long as the hedging relationship remains designated.
|
|
|
| ||||
Designated Fair Value Hedged Assets (Liabilities) | |||||||
|
|
|
| ||||
| March 31, 2018 | ||||||
(Dollars in millions) | Carrying Value |
| Cumulative Fair Value Adjustments (1) | ||||
Long-term debt | $ | (129,893 | ) |
| $ | 1,086 | |
Available-for-sale securities (2) | 961 | |
| (36 | ) | ||
(1) | For assets, increase (decrease) to carrying value and for liabilities, (increase) decrease to carrying value. |
(2) | The amortized cost of available-for-sale securities in fair value hedging relationships was $959 million and is included in debt securities carried at fair value on the Consolidated Balance Sheet. |
At March 31, 2018, the cumulative fair value adjustments remaining on long-term debt and available-for-sale (AFS) securities from discontinued hedging relationships were an increase of $1.1 billion and a decrease of $42 million , respectively, which are being amortized over the remaining contractual life of the de-designated hedged items.
Cash Flow and Net Investment Hedges
The table below summarizes certain information related to cash flow hedges and net investment hedges for the three months ended March 31, 2018 and 2017 . Of the $1.2 billion after-tax net
loss ( $1.6 billion pretax) on derivatives in accumulated OCI at March 31, 2018 , $269 million after-tax ( $354 million pretax) is expected to be reclassified into earnings in the next 12 months. These net losses reclassified into earnings are expected to primarily reduce net interest income related to the respective hedged items. For terminated cash flow hedges, the time period over which the majority of the forecasted transactions are hedged is approximately seven years , with a maximum length of time for certain forecasted transactions of 18 years.
|
|
|
|
|
|
|
|
| ||||||||
Gains and Losses on Derivatives Designated as Cash Flow and Net Investment Hedges | ||||||||||||||||
|
|
|
|
|
|
|
|
| ||||||||
|
| Three Months Ended March 31 | ||||||||||||||
|
| 2018 |
| 2017 | ||||||||||||
(Dollars in millions, amounts pretax) |
| Gains (Losses) |
| Gains (Losses) |
| Gains (Losses) |
| Gains (Losses) | ||||||||
Cash flow hedges |
|
|
|
|
|
|
|
| ||||||||
Interest rate risk on variable-rate assets (1) |
| $ | (428 | ) |
| $ | (50 | ) |
| $ | (37 | ) |
| $ | (112 | ) |
Price risk on certain restricted stock awards (2) |
| 4 | |
| 27 | |
| 28 | |
| 42 | | ||||
Total |
| $ | (424 | ) |
| $ | (23 | ) |
| $ | (9 | ) |
| $ | (70 | ) |
Net investment hedges |
|
|
|
|
|
| |
|
| | ||||||
Foreign exchange risk (3) |
| $ | (244 | ) |
| $ | (1 | ) |
| $ | (389 | ) |
| $ | (130 | ) |
(1) | Amounts reclassified from accumulated OCI are recorded in interest income in the Consolidated Statement of Income. |
(2) | Amounts reclassified from accumulated OCI are recorded in personnel expense in the Consolidated Statement of Income. |
(3) | Amounts reclassified from accumulated OCI are recorded in other income in the Consolidated Statement of Income. For the three months ended March 31, 2018 and 2017 , amounts excluded from effectiveness testing and recognized in other income were a gain of $4 million and a loss of $15 million . |
|
| Bank of America 62 |
Other Risk Management Derivatives
Other risk management derivatives are used by the Corporation to reduce certain risk exposures by economically hedging various assets and liabilities. The gains and losses on these derivatives are recognized in other income. The table below presents gains (losses) on these derivatives for the three months ended March 31, 2018 and 2017 . These gains (losses) are largely offset by the income or expense that is recorded on the hedged item.
|
|
|
| ||||
Other Risk Management Derivatives | |||||||
|
|
|
| ||||
Gains (Losses) | Three Months Ended March 31 | ||||||
(Dollars in millions) | 2018 |
| 2017 | ||||
Interest rate risk on mortgage activities (1) | $ | (135 | ) |
| $ | (24 | ) |
Credit risk on loans (2) | (3 | ) |
| (2 | ) | ||
Interest rate and foreign currency risk on ALM activities (3) | (139 | ) |
| (290 | ) | ||
(1) | Primarily related to hedges of interest rate risk on mortgage servicing rights (MSRs) and interest rate lock commitments (IRLCs) to originate mortgage loans that will be held for sale. The net gains on IRLCs, which are not included in the table but are considered derivative instruments, were $14 million and $56 million for the three months ended March 31, 2018 and 2017 . |
(2) | Primarily related to derivatives that are economic hedges of credit risk on loans. |
(3) | Primarily related to hedges of debt securities carried at fair value and hedges of foreign currency-denominated debt. |
Transfers of Financial Assets with Risk Retained through Derivatives
The Corporation enters into certain transactions involving the transfer of financial assets that are accounted for as sales where substantially all of the economic exposure to the transferred financial assets is retained through derivatives (e.g., interest rate and/or credit), but the Corporation does not retain control over the assets transferred. At March 31, 2018 and December 31, 2017, the Corporation had transferred $6.2 billion and $6.0 billion of non-U.S. government-guaranteed mortgage-backed securities (MBS) to a third-party trust and retained economic exposure to the
transferred assets through derivative contracts. In connection with these transfers, the Corporation received gross cash proceeds of $6.2 billion and $6.0 billion at the transfer dates. At both March 31, 2018 and December 31, 2017 , the fair value of the transferred securities was $6.1 billion . At March 31, 2018 and December 31, 2017 , derivative assets of $48 million and $46 million and liabilities of $3 million for both periods were recorded and are included in credit derivatives in the derivative instruments table on page 59 .
Sales and Trading Revenue
The Corporation enters into trading derivatives to facilitate client transactions and to manage risk exposures arising from trading account assets and liabilities. It is the Corporation's policy to include these derivative instruments in its trading activities which include derivatives and non-derivative cash instruments. The resulting risk from these derivatives is managed on a portfolio basis as part of the Corporation's Global Markets business segment. For more information on sales and trading revenue, see Note 2 – Derivatives to the Consolidated Financial Statements of the Corporation's 2017 Annual Report on Form 10-K .
The following table, which includes both derivatives and non-derivative cash instruments, identifies the amounts in the respective income statement line items attributable to the Corporation's sales and trading revenue in Global Markets , categorized by primary risk, for the three months ended March 31, 2018 and 2017 . The difference between total trading account profits in the following table and in the Consolidated Statement of Income represents trading activities in business segments other than Global Markets . This table includes debit valuation adjustment (DVA) and funding valuation adjustment (FVA) gains (losses). Global Markets results in Note 17 – Business Segment Information are presented on a fully taxable-equivalent (FTE) basis. The table below is not presented on an FTE basis.
|
|
|
|
|
|
|
| ||||||||
Sales and Trading Revenue |
|
|
|
|
|
|
| ||||||||
|
|
|
|
|
|
|
| ||||||||
(Dollars in millions) | Trading Account Profits |
| Net Interest Income |
| Other (1) |
| Total | ||||||||
| Three Months Ended March 31, 2018 | ||||||||||||||
Interest rate risk | $ | 620 | |
| $ | 206 | |
| $ | 68 | |
| $ | 894 | |
Foreign exchange risk | 404 | |
| (5 | ) |
| 2 | |
| 401 | | ||||
Equity risk | 1,154 | |
| (125 | ) |
| 449 | |
| 1,478 | | ||||
Credit risk | 463 | |
| 591 | |
| 136 | |
| 1,190 | | ||||
Other risk | 62 | |
| 9 | |
| 16 | |
| 87 | | ||||
Total sales and trading revenue | $ | 2,703 | |
| $ | 676 | |
| $ | 671 | |
| $ | 4,050 | |
|
|
|
|
|
|
|
| ||||||||
| Three Months Ended March 31, 2017 | ||||||||||||||
Interest rate risk | $ | 348 | |
| $ | 310 | |
| $ | 76 | |
| $ | 734 | |
Foreign exchange risk | 368 | |
| (3 | ) |
| 1 | |
| 366 | | ||||
Equity risk | 672 | |
| (75 | ) |
| 486 | |
| 1,083 | | ||||
Credit risk | 686 | |
| 644 | |
| 197 | |
| 1,527 | | ||||
Other risk | 103 | |
| 4 | |
| 33 | |
| 140 | | ||||
Total sales and trading revenue | $ | 2,177 | |
| $ | 880 | |
| $ | 793 | |
| $ | 3,850 | |
(1) | Represents amounts in investment and brokerage services and other income that are recorded in Global Markets and included in the definition of sales and trading revenue. Includes investment and brokerage services revenue of $ 476 million and $524 million for the three months ended March 31, 2018 and 2017 . |
63 Bank of America |
|
|
Credit Derivatives
The Corporation enters into credit derivatives primarily to facilitate client transactions and to manage credit risk exposures. Credit derivatives derive value based on an underlying third-party referenced obligation or a portfolio of referenced obligations and generally require the Corporation, as the seller of credit protection, to make payments to a buyer upon the occurrence of a predefined credit event. Such credit events generally include bankruptcy of the referenced credit entity and failure to pay under the obligation,
as well as acceleration of indebtedness and payment repudiation or moratorium. For credit derivatives based on a portfolio of referenced credits or credit indices, the Corporation may not be required to make payment until a specified amount of loss has occurred and/or may only be required to make payment up to a specified amount.
Credit derivative instruments where the Corporation is the seller of credit protection and their expiration at March 31, 2018 and December 31, 2017 are summarized in the table below.
|
|
|
|
|
|
|
|
|
| ||||||||||
Credit Derivative Instruments |
|
|
|
|
|
|
|
|
| ||||||||||
|
|
|
|
|
|
|
|
|
| ||||||||||
| Less than One Year |
| One to Three Years |
| Three to Five Years |
| Over Five Years |
| Total | ||||||||||
| March 31, 2018 | ||||||||||||||||||
(Dollars in millions) | Carrying Value | ||||||||||||||||||
Credit default swaps: |
| |
|
| |
|
| |
|
| |
|
| | |||||
Investment grade | $ | 2 | |
| $ | 1 | |
| $ | 30 | |
| $ | 182 | |
| $ | 215 | |
Non-investment grade | 219 | |
| 371 | |
| 520 | |
| 2,124 | |
| 3,234 | | |||||
Total | 221 | |
| 372 | |
| 550 | |
| 2,306 | |
| 3,449 | | |||||
Total return swaps/options: |
| |
|
| |
|
| |
|
| |
|
| | |||||
Investment grade | 41 | |
| - | |
| - | |
| - | |
| 41 | | |||||
Non-investment grade | 209 | |
| 17 | |
| - | |
| - | |
| 226 | | |||||
Total | 250 | |
| 17 | |
| - | |
| - | |
| 267 | | |||||
Total credit derivatives | $ | 471 | |
| $ | 389 | |
| $ | 550 | |
| $ | 2,306 | |
| $ | 3,716 | |
Credit-related notes: |
| |
|
| |
|
| |
|
| |
|
| | |||||
Investment grade | $ | - | |
| $ | - | |
| $ | 8 | |
| $ | 634 | |
| $ | 642 | |
Non-investment grade | 4 | |
| 3 | |
| 10 | |
| 1,682 | |
| 1,699 | | |||||
Total credit-related notes | $ | 4 | |
| $ | 3 | |
| $ | 18 | |
| $ | 2,316 | |
| $ | 2,341 | |
| Maximum Payout/Notional | ||||||||||||||||||
Credit default swaps: |
| |
|
| |
|
| |
|
| |
|
| | |||||
Investment grade | $ | 39,988 | |
| $ | 113,263 | |
| $ | 118,991 | |
| $ | 34,167 | |
| $ | 306,409 | |
Non-investment grade | 39,210 | |
| 44,802 | |
| 46,083 | |
| 20,866 | |
| 150,961 | | |||||
Total | 79,198 | |
| 158,065 | |
| 165,074 | |
| 55,033 | |
| 457,370 | | |||||
Total return swaps/options: |
| |
|
| |
|
| |
|
| |
|
| | |||||
Investment grade | 45,484 | |
| 2,089 | |
| - | |
| 139 | |
| 47,712 | | |||||
Non-investment grade | 16,844 | |
| 275 | |
| 169 | |
| 220 | |
| 17,508 | | |||||
Total | 62,328 | |
| 2,364 | |
| 169 | |
| 359 | |
| 65,220 | | |||||
Total credit derivatives | $ | 141,526 | |
| $ | 160,429 | |
| $ | 165,243 | |
| $ | 55,392 | |
| $ | 522,590 | |
|
|
|
|
|
|
|
|
|
| ||||||||||
| December 31, 2017 | ||||||||||||||||||
| Carrying Value | ||||||||||||||||||
Credit default swaps: |
|
|
|
|
|
|
|
|
| ||||||||||
Investment grade | $ | 4 | |
| $ | 3 | |
| $ | 61 | |
| $ | 245 | |
| $ | 313 | |
Non-investment grade | 203 | |
| 453 | |
| 484 | |
| 2,133 | |
| 3,273 | | |||||
Total | 207 | |
| 456 | |
| 545 | |
| 2,378 | |
| 3,586 | | |||||
Total return swaps/options: |
| |
|
| |
|
| |
|
| |
|
| | |||||
Investment grade | 30 | |
| - | |
| - | |
| - | |
| 30 | | |||||
Non-investment grade | 150 | |
| - | |
| - | |
| 3 | |
| 153 | | |||||
Total | 180 | |
| - | |
| - | |
| 3 | |
| 183 | | |||||
Total credit derivatives | $ | 387 | |
| $ | 456 | |
| $ | 545 | |
| $ | 2,381 | |
| $ | 3,769 | |
Credit-related notes: |
| |
|
| |
|
| |
|
| |
|
| | |||||
Investment grade | $ | - | |
| $ | - | |
| $ | 7 | |
| $ | 689 | |
| $ | 696 | |
Non-investment grade | 12 | |
| 4 | |
| 34 | |
| 1,548 | |
| 1,598 | | |||||
Total credit-related notes | $ | 12 | |
| $ | 4 | |
| $ | 41 | |
| $ | 2,237 | |
| $ | 2,294 | |
| Maximum Payout/Notional | ||||||||||||||||||
Credit default swaps: |
|
|
|
|
|
|
|
|
| ||||||||||
Investment grade | $ | 61,388 | |
| $ | 115,480 | |
| $ | 107,081 | |
| $ | 21,579 | |
| $ | 305,528 | |
Non-investment grade | 39,312 | |
| 49,843 | |
| 39,098 | |
| 14,420 | |
| 142,673 | | |||||
Total | 100,700 | |
| 165,323 | |
| 146,179 | |
| 35,999 | |
| 448,201 | | |||||
Total return swaps/options: |
| |
|
| |
|
| |
|
| |
|
| | |||||
Investment grade | 37,394 | |
| 2,581 | |
| - | |
| 143 | |
| 40,118 | | |||||
Non-investment grade | 13,751 | |
| 514 | |
| 143 | |
| 697 | |
| 15,105 | | |||||
Total | 51,145 | |
| 3,095 | |
| 143 | |
| 840 | |
| 55,223 | | |||||
Total credit derivatives | $ | 151,845 | |
| $ | 168,418 | |
| $ | 146,322 | |
| $ | 36,839 | |
| $ | 503,424 | |
|
| Bank of America 64 |
Credit derivatives are classified as investment and non-investment grade based on the credit quality of the underlying referenced obligation. The Corporation considers ratings of BBB- or higher as investment grade. Non-investment grade includes non-rated credit derivative instruments. The Corporation discloses internal categorizations of investment grade and non-investment grade consistent with how risk is managed for these instruments.
The notional amount represents the maximum amount payable by the Corporation for most credit derivatives. However, the Corporation does not monitor its exposure to credit derivatives based solely on the notional amount because this measure does not take into consideration the probability of occurrence. As such, the notional amount is not a reliable indicator of the Corporation's exposure to these contracts. Instead, a risk framework is used to define risk tolerances and establish limits so that certain credit risk-related losses occur within acceptable, predefined limits.
Credit-related notes in the table above include investments in securities issued by collateralized debt obligation (CDO), collateralized loan obligation and credit-linked note vehicles. These instruments are primarily classified as trading securities. The carrying value of these instruments equals the Corporation's maximum exposure to loss. The Corporation is not obligated to make any payments to the entities under the terms of the securities owned.
Credit-related Contingent Features and Collateral
A majority of the Corporation's derivative contracts contain credit risk-related contingent features, primarily in the form of ISDA master netting agreements and credit support documentation that enhance the creditworthiness of these instruments compared to other obligations of the respective counterparty with whom the Corporation has transacted. These contingent features may be for the benefit of the Corporation as well as its counterparties with respect to changes in the Corporation's creditworthiness and the mark-to-market exposure under the derivative transactions. At March 31, 2018 and December 31, 2017 , the Corporation held cash and securities collateral of $90.4 billion and $77.2 billion , and posted cash and securities collateral of $58.3 billion and $59.2 billion in the normal course of business under derivative agreements, excluding cross-product margining agreements where clients are permitted to margin on a net basis for both derivative and secured financing arrangements.
In connection with certain OTC derivative contracts and other trading agreements, the Corporation can be required to provide additional collateral or to terminate transactions with certain counterparties in the event of a downgrade of the senior debt ratings of the Corporation or certain subsidiaries. The amount of
additional collateral required depends on the contract and is usually a fixed incremental amount and/or the market value of the exposure. For more information on credit-related contingent features and collateral, see Note 2 – Derivatives to the Consolidated Financial Statements of the Corporation's 2017 Annual Report on Form 10-K .
At March 31, 2018 , the amount of collateral, calculated based on the terms of the contracts, that the Corporation and certain subsidiaries could be required to post to counterparties but had not yet posted to counterparties was $2.2 billion , including $1.1 billion for Bank of America, National Association (Bank of America, N.A. or BANA).
Some counterparties are currently able to unilaterally terminate certain contracts, or the Corporation or certain subsidiaries may be required to take other action such as find a suitable replacement or obtain a guarantee. At March 31, 2018 and December 31, 2017 , the liability recorded for these derivative contracts was not significant.
The table below presents the amount of additional collateral that would have been contractually required by derivative contracts and other trading agreements at March 31, 2018 if the rating agencies had downgraded their long-term senior debt ratings for the Corporation or certain subsidiaries by one incremental notch and by an additional second incremental notch.
|
|
|
| ||||
Additional Collateral Required to be Posted Upon Downgrade at March 31, 2018 | |||||||
|
|
|
| ||||
(Dollars in millions) | One incremental notch |
| Second incremental notch | ||||
Bank of America Corporation | $ | 647 | |
| $ | 591 | |
Bank of America, N.A. and subsidiaries (1) | 323 | |
| 207 | | ||
(1) | Included in Bank of America Corporation collateral requirements in this table. |
The table below presents the derivative liabilities that would be subject to unilateral termination by counterparties and the amounts of collateral that would have been contractually required at March 31, 2018 if the long-term senior debt ratings for the Corporation or certain subsidiaries had been lower by one incremental notch and by an additional second incremental notch.
|
|
|
| ||||
Derivative Liabilities Subject to Unilateral Termination Upon Downgrade at March 31, 2018 | |||||||
|
|
|
| ||||
(Dollars in millions) | One incremental notch |
| Second incremental notch | ||||
Derivative liabilities | $ | 382 | |
| $ | 1,158 | |
Collateral posted | 311 | |
| 716 | | ||
Valuation Adjustments on Derivatives
The table below presents credit valuation adjustment (CVA), DVA and FVA gains (losses) on derivatives, which are recorded in trading account profits, on a gross and net of hedge basis for the three months ended March 31, 2018 and 2017 . For more information on the valuation adjustments on derivatives, see Note 2 – Derivatives to the Consolidated Financial Statements of the Corporation's 2017 Annual Report on Form 10-K .
|
|
|
|
|
| ||||||||
Valuation Adjustments on Derivatives (1) | |||||||||||||
|
|
|
|
|
| ||||||||
Gains (Losses) | Three Months Ended March 31 | ||||||||||||
| 2018 |
| 2017 | ||||||||||
(Dollars in millions) | Gross | Net |
| Gross | Net | ||||||||
Derivative assets (CVA) | $ | (24 | ) | $ | 18 | |
| $ | 161 | | $ | 26 | |
Derivative assets/liabilities (FVA) | (37 | ) | (1 | ) |
| 49 | | 56 | | ||||
Derivative liabilities (DVA) | 114 | | 106 | |
| (150 | ) | (93 | ) | ||||
(1) | At March 31, 2018 and December 31, 2017 , cumulative CVA reduced the derivative assets balance by $701 million and $677 million , cumulative FVA reduced the net derivatives balance by $173 million and $136 million , and cumulative DVA reduced the derivative liabilities balance by $565 million and $450 million , respectively. |
65 Bank of America |
|
|
NOTE 4
Securities
The table below presents the amortized cost, gross unrealized gains and losses, and fair value of AFS debt securities, other debt securities carried at fair value and held-to-maturity (HTM) debt securities at March 31, 2018 and December 31, 2017 .
|
|
|
|
|
|
|
| ||||||||
Debt Securities |
|
|
|
| |||||||||||
|
| ||||||||||||||
| Amortized Cost |
| Gross Gains |
| Gross Losses |
| Fair Value | ||||||||
(Dollars in millions) | March 31, 2018 | ||||||||||||||
Available-for-sale debt securities |
|
|
|
|
|
|
| ||||||||
Mortgage-backed securities: |
|
|
|
|
|
|
| | |||||||
Agency | $ | 189,426 | |
| $ | 168 | |
| $ | (5,483 | ) |
| $ | 184,111 | |
Agency-collateralized mortgage obligations | 6,525 | |
| 15 | |
| (142 | ) |
| 6,398 | | ||||
Commercial | 13,998 | |
| 1 | |
| (440 | ) |
| 13,559 | | ||||
Non-agency residential (1) | 2,354 | |
| 260 | |
| (10 | ) |
| 2,604 | | ||||
Total mortgage-backed securities | 212,303 | |
| 444 | |
| (6,075 | ) |
| 206,672 | | ||||
U.S. Treasury and agency securities | 54,753 | |
| 13 | |
| (1,794 | ) |
| 52,972 | | ||||
Non-U.S. securities | 6,918 | |
| 7 | |
| - | |
| 6,925 | | ||||
Other taxable securities, substantially all asset-backed securities | 4,619 | |
| 100 | |
| (5 | ) |
| 4,714 | | ||||
Total taxable securities | 278,593 | |
| 564 | |
| (7,874 | ) |
| 271,283 | | ||||
Tax-exempt securities | 19,133 | |
| 58 | |
| (114 | ) |
| 19,077 | | ||||
Total available-for-sale debt securities | 297,726 | |
| 622 | |
| (7,988 | ) |
| 290,360 | | ||||
Other debt securities carried at fair value | 12,682 | |
| 291 | |
| (35 | ) |
| 12,938 | | ||||
Total debt securities carried at fair value | 310,408 | |
| 913 | |
| (8,023 | ) |
| 303,298 | | ||||
Held-to-maturity debt securities, substantially all U.S. agency mortgage-backed securities | 123,539 | |
| 12 | |
| (4,419 | ) |
| 119,132 | | ||||
Total debt securities (2, 3) | $ | 433,947 | |
| $ | 925 | |
| $ | (12,442 | ) |
| $ | 422,430 | |
|
|
|
|
|
|
|
| ||||||||
| December 31, 2017 | ||||||||||||||
Available-for-sale debt securities |
|
|
|
|
|
|
| ||||||||
Mortgage-backed securities: |
| |
|
| |
|
| |
|
| | ||||
Agency | $ | 194,119 | |
| $ | 506 | |
| $ | (1,696 | ) |
| $ | 192,929 | |
Agency-collateralized mortgage obligations | 6,846 | |
| 39 | |
| (81 | ) |
| 6,804 | | ||||
Commercial | 13,864 | |
| 28 | |
| (208 | ) |
| 13,684 | | ||||
Non-agency residential (1) | 2,410 | |
| 267 | |
| (8 | ) |
| 2,669 | | ||||
Total mortgage-backed securities | 217,239 | |
| 840 | |
| (1,993 | ) |
| 216,086 | | ||||
U.S. Treasury and agency securities | 54,523 | |
| 18 | |
| (1,018 | ) |
| 53,523 | | ||||
Non-U.S. securities | 6,669 | |
| 9 | |
| (1 | ) |
| 6,677 | | ||||
Other taxable securities, substantially all asset-backed securities | 5,699 | |
| 73 | |
| (2 | ) |
| 5,770 | | ||||
Total taxable securities | 284,130 | |
| 940 | |
| (3,014 | ) |
| 282,056 | | ||||
Tax-exempt securities | 20,541 | |
| 138 | |
| (104 | ) |
| 20,575 | | ||||
Total available-for-sale debt securities | 304,671 | |
| 1,078 | |
| (3,118 | ) |
| 302,631 | | ||||
Other debt securities carried at fair value | 12,273 | |
| 252 | |
| (39 | ) |
| 12,486 | | ||||
Total debt securities carried at fair value | 316,944 | |
| 1,330 | |
| (3,157 | ) |
| 315,117 | | ||||
Held-to-maturity debt securities, substantially all U.S. agency mortgage-backed securities | 125,013 | |
| 111 | |
| (1,825 | ) |
| 123,299 | | ||||
Total debt securities (2, 3) | $ | 441,957 | |
| $ | 1,441 | |
| $ | (4,982 | ) |
| $ | 438,416 | |
Available-for-sale marketable equity securities (4) | $ | 27 | |
| $ | - | |
| $ | (2 | ) |
| $ | 25 | |
(1) | At both March 31, 2018 and December 31, 2017 , the underlying collateral type included approximately 62 percent prime, 13 percent Alt-A, and 25 percent subprime. |
(2) | Includes securities pledged as collateral of $36.9 billion and $35.8 billion at March 31, 2018 and December 31, 2017 . |
(3) | The Corporation had debt securities from Fannie Mae (FNMA) and Freddie Mac (FHLMC) that each exceeded 10 percent of shareholders' equity, with an amortized cost of $161.1 billion and $49.3 billion , and a fair value of $156.0 billion and $48.0 billion at March 31, 2018 , and an amortized cost of $163.6 billion and $50.3 billion , and a fair value of $162.1 billion and $50.0 billion at December 31, 2017 . |
(4) | Classified in other assets on the Consolidated Balance Sheet. |
At March 31, 2018 , the accumulated net unrealized loss on AFS debt securities included in accumulated OCI was $5.5 billion , net of the related income tax benefit of $1.8 billion . The Corporation had nonperforming AFS debt securities of $128 million and $99 million at March 31, 2018 and December 31, 2017 .
Effective January 1, 2018, the Corporation adopted a new accounting standard applicable to equity securities. For more information, see Note 1 – Summary of Significant Accounting Principles . At March 31, 2018 , the Corporation held equity securities at an aggregate fair value of $988 million and other
equity securities, as valued under the measurement alternative, at cost of $247 million , both of which are included in other assets.
The following table presents the components of other debt securities carried at fair value where the changes in fair value are reported in other income. In the three months ended March 31, 2018 , the Corporation recorded unrealized mark-to-market net gains of $41 million and realized net losses of $6 million compared to unrealized mark-to-market net gains of $117 million and realized net losses of $103 million in the three months ended March 31, 2017 . These amounts exclude hedge results.
|
| Bank of America 66 |
|
|
|
| ||||
Other Debt Securities Carried at Fair Value | |||||||
|
| ||||||
(Dollars in millions) | March 31 |
| December 31 | ||||
Mortgage-backed securities: |
|
|
| ||||
Agency-collateralized mortgage obligations | $ | - | |
| $ | 5 | |
Non-agency residential | 2,736 | |
| 2,764 | | ||
Total mortgage-backed securities | 2,736 | |
| 2,769 | | ||
Non-U.S. securities (1) | 9,976 | |
| 9,488 | | ||
Other taxable securities, substantially all asset-backed securities | 226 | |
| 229 | | ||
Total | $ | 12,938 | |
| $ | 12,486 | |
(1) | These securities are primarily used to satisfy certain international regulatory liquidity requirements. |
The gross realized gains and losses on sales of AFS debt securities for the three months ended March 31, 2018 and 2017 are presented in the table below.
|
|
|
| ||||
Gains and Losses on Sales of AFS Debt Securities | |||||||
|
| ||||||
| Three Months Ended March 31 | ||||||
(Dollars in millions) | 2018 |
| 2017 | ||||
Gross gains | $ | 2 | |
| $ | 54 | |
Gross losses | - | |
| (2 | ) | ||
Net gains on sales of AFS debt securities | $ | 2 | |
| $ | 52 | |
Income tax expense attributable to realized net gains on sales of AFS debt securities | $ | - | |
| $ | 20 | |
The table below presents the fair value and the associated gross unrealized losses on AFS debt securities and whether these securities have had gross unrealized losses for less than 12 months or for 12 months or longer at March 31, 2018 and December 31, 2017 .
|
|
|
|
|
|
|
|
|
|
|
| ||||||||||||
Temporarily Impaired and Other-than-temporarily Impaired AFS Debt Securities |
|
|
|
|
|
| |||||||||||||||||
|
| ||||||||||||||||||||||
| Less than Twelve Months |
| Twelve Months or Longer |
| Total | ||||||||||||||||||
| Fair Value |
| Gross Unrealized Losses |
| Fair Value |
| Gross Unrealized Losses |
| Fair Value |
| Gross Unrealized Losses | ||||||||||||
(Dollars in millions) | March 31, 2018 | ||||||||||||||||||||||
Temporarily impaired AFS debt securities |
|
|
|
|
|
|
|
|
|
|
| ||||||||||||
Mortgage-backed securities: |
|
|
|
|
|
|
|
|
|
|
| ||||||||||||
Agency | $ | 109,535 | |
| $ | (2,608 | ) |
| $ | 68,632 | |
| $ | (2,875 | ) |
| $ | 178,167 | |
| $ | (5,483 | ) |
Agency-collateralized mortgage obligations | 3,635 | |
| (77 | ) |
| 1,579 | |
| (65 | ) |
| 5,214 | |
| (142 | ) | ||||||
Commercial | 8,794 | |
| (182 | ) |
| 4,480 | |
| (258 | ) |
| 13,274 | |
| (440 | ) | ||||||
Non-agency residential | 241 | |
| (8 | ) |
| - | |
| - | |
| 241 | |
| (8 | ) | ||||||
Total mortgage-backed securities | 122,205 | |
| (2,875 | ) |
| 74,691 | |
| (3,198 | ) |
| 196,896 | |
| (6,073 | ) | ||||||
U.S. Treasury and agency securities | 27,813 | |
| (760 | ) |
| 23,792 | |
| (1,034 | ) |
| 51,605 | |
| (1,794 | ) | ||||||
Other taxable securities, substantially all asset-backed securities | 135 | |
| (3 | ) |
| 102 | |
| (2 | ) |
| 237 | |
| (5 | ) | ||||||
Total taxable securities | 150,153 | |
| (3,638 | ) |
| 98,585 | |
| (4,234 | ) |
| 248,738 | |
| (7,872 | ) | ||||||
Tax-exempt securities | 251 | |
| (1 | ) |
| 5,667 | |
| (113 | ) |
| 5,918 | |
| (114 | ) | ||||||
Total temporarily impaired AFS debt securities | 150,404 | |
| (3,639 | ) |
| 104,252 | |
| (4,347 | ) |
| 254,656 | |
| (7,986 | ) | ||||||
Other-than-temporarily impaired AFS debt securities (1) |
|
|
|
|
|
|
|
|
|
|
| ||||||||||||
Non-agency residential mortgage-backed securities | 103 | |
| (2 | ) |
| - | |
| - | |
| 103 | |
| (2 | ) | ||||||
Total temporarily impaired and other-than-temporarily impaired AFS debt securities | $ | 150,507 | |
| $ | (3,641 | ) |
| $ | 104,252 | |
| $ | (4,347 | ) |
| $ | 254,759 | |
| $ | (7,988 | ) |
|
|
|
|
|
|
|
|
|
|
|
| ||||||||||||
| December 31, 2017 | ||||||||||||||||||||||
Temporarily impaired AFS debt securities |
|
|
|
|
|
|
|
|
|
|
| ||||||||||||
Mortgage-backed securities: |
|
|
|
|
|
|
|
|
|
|
| ||||||||||||
Agency | $ | 73,535 | |
| $ | (352 | ) |
| $ | 72,612 | |
| $ | (1,344 | ) |
| $ | 146,147 | |
| $ | (1,696 | ) |
Agency-collateralized mortgage obligations | 2,743 | |
| (29 | ) |
| 1,684 | |
| (52 | ) |
| 4,427 | |
| (81 | ) | ||||||
Commercial | 5,575 | |
| (50 | ) |
| 4,586 | |
| (158 | ) |
| 10,161 | |
| (208 | ) | ||||||
Non-agency residential | 335 | |
| (7 | ) |
| - | |
| - | |
| 335 | |
| (7 | ) | ||||||
Total mortgage-backed securities | 82,188 | |
| (438 | ) |
| 78,882 | |
| (1,554 | ) |
| 161,070 | |
| (1,992 | ) | ||||||
U.S. Treasury and agency securities | 27,537 | |
| (251 | ) |
| 24,035 | |
| (767 | ) |
| 51,572 | |
| (1,018 | ) | ||||||
Non-U.S. securities | 772 | |
| (1 | ) |
| - | |
| - | |
| 772 | |
| (1 | ) | ||||||
Other taxable securities, substantially all asset-backed securities | - | |
| - | |
| 92 | |
| (2 | ) |
| 92 | |
| (2 | ) | ||||||
Total taxable securities | 110,497 | |
| (690 | ) |
| 103,009 | |
| (2,323 | ) |
| 213,506 | |
| (3,013 | ) | ||||||
Tax-exempt securities | 1,090 | |
| (2 | ) |
| 7,100 | |
| (102 | ) |
| 8,190 | |
| (104 | ) | ||||||
Total temporarily impaired AFS debt securities | 111,587 | |
| (692 | ) |
| 110,109 | |
| (2,425 | ) |
| 221,696 | |
| (3,117 | ) | ||||||
Other-than-temporarily impaired AFS debt securities (1) |
|
|
|
|
|
|
|
|
|
|
| ||||||||||||
Non-agency residential mortgage-backed securities | 58 | |
| (1 | ) |
| - | |
| - | |
| 58 | |
| (1 | ) | ||||||
Total temporarily impaired and other-than-temporarily impaired AFS debt securities | $ | 111,645 | |
| $ | (693 | ) |
| $ | 110,109 | |
| $ | (2,425 | ) |
| $ | 221,754 | |
| $ | (3,118 | ) |
(1) | Includes other-than-temporarily impaired (OTTI) AFS debt securities on which an OTTI loss, primarily related to changes in interest rates, remains in accumulated OCI. |
67 Bank of America |
|
|
The Corporation had $4 million and $27 million of credit-related OTTI losses on AFS debt securities which were recognized in other income for the three months ended March 31, 2018 and 2017 . The amount of noncredit-related OTTI losses, which is recognized in OCI, was insignificant for all periods presented.
The cumulative credit loss component of OTTI losses that have been recognized in income related to AFS debt securities that the Corporation does not intend to sell was $278 million and $279 million at March 31, 2018 and 2017 .
The Corporation estimates the portion of a loss on a security that is attributable to credit using a discounted cash flow model and estimates the expected cash flows of the underlying collateral using internal credit, interest rate and prepayment risk models that incorporate management's best estimate of current key assumptions such as default rates, loss severity and prepayment rates. Assumptions used for the underlying loans that support the MBS can vary widely from loan to loan and are influenced by such factors as loan interest rate, geographic location of the borrower, borrower characteristics and collateral type. Based on these assumptions, the Corporation then determines how the underlying collateral cash flows will be distributed to each MBS issued from the applicable special purpose entity. Expected principal and interest cash flows on an impaired AFS debt security are discounted using the effective yield of each individual impaired AFS debt security.
Significant assumptions used in estimating the expected cash flows for measuring credit losses on non-agency residential mortgage-backed securities (RMBS) were as follows at March 31, 2018 .
|
|
|
|
|
| |||
Significant Assumptions | ||||||||
|
|
|
| |||||
|
|
| Range (1) | |||||
| Weighted |
| 10th Percentile (2) |
| 90th Percentile (2) | |||
Prepayment speed | 11.7 | % |
| 2.9 | % |
| 20.9 | % |
Loss severity | 21.6 | |
| 9.1 | |
| 40.6 | |
Life default rate | 20.1 | |
| 1.3 | |
| 72.3 | |
(1) | Represents the range of inputs/assumptions based upon the underlying collateral. |
(2) | The value of a variable below which the indicated percentile of observations will fall. |
Annual constant prepayment speed and loss severity rates are projected considering collateral characteristics such as loan-to-value (LTV), creditworthiness of borrowers as measured using Fair Isaac Corporation (FICO) scores, and geographic concentrations. The weighted-average severity by collateral type was 16.4 percent for prime, 17.6 percent for Alt-A and 27.9 percent for subprime at March 31, 2018 . Default rates are projected by considering collateral characteristics including, but not limited to, LTV, FICO and geographic concentration. Weighted-average life default rates by collateral type were 15.1 percent for prime, 20.0 percent for Alt-A and 22.4 percent for subprime at March 31, 2018 .
The remaining contractual maturity distribution and yields of the Corporation's debt securities carried at fair value and HTM debt securities at March 31, 2018 are summarized in the table below. Actual duration and yields may differ as prepayments on the loans underlying the mortgages or other asset-backed securities (ABS) are passed through to the Corporation.
|
|
|
|
|
|
|
|
|
|
|
|
|
|
|
|
|
|
|
| |||||||||||||||
Maturities of Debt Securities Carried at Fair Value and Held-to-maturity Debt Securities | ||||||||||||||||||||||||||||||||||
|
|
|
|
|
|
|
|
|
|
|
|
|
|
|
|
|
|
|
| |||||||||||||||
| Due in One Year or Less |
| Due after One Year through Five Years |
| Due after Five Years through Ten Years |
| Due after Ten Years |
| Total | |||||||||||||||||||||||||
| Amount |
| Yield (1) |
| Amount |
| Yield (1) |
| Amount |
| Yield (1) |
| Amount |
| Yield (1) |
| Amount |
| Yield (1) | |||||||||||||||
(Dollars in millions) | March 31, 2018 | |||||||||||||||||||||||||||||||||
Amortized cost of debt securities carried at fair value |
| |
|
| |
|
| |
|
| |
|
| |
|
| |
|
| |
|
| |
|
| |
|
| | |||||
Mortgage-backed securities: |
| |
|
| |
|
| |
|
| |
|
| |
|
| |
|
| |
|
| |
|
| |
|
| | |||||
Agency | $ | 2 | |
| 5.50 | % |
| $ | 26 | |
| 3.94 | % |
| $ | 519 | |
| 2.57 | % |
| $ | 188,879 | |
| 3.22 | % |
| $ | 189,426 | |
| 3.22 | % |
Agency-collateralized mortgage obligations | - | |
| - | |
| - | |
| - | |
| 32 | |
| 2.53 | |
| 6,493 | |
| 3.17 | |
| 6,525 | |
| 3.17 | | |||||
Commercial | 54 | |
| 9.55 | |
| 1,662 | |
| 2.15 | |
| 11,350 | |
| 2.44 | |
| 932 | |
| 2.61 | |
| 13,998 | |
| 2.44 | | |||||
Non-agency residential | - | |
| - | |
| - | |
| - | |
| 22 | |
| 0.01 | |
| 4,843 | |
| 9.44 | |
| 4,865 | |
| 9.40 | | |||||
Total mortgage-backed securities | 56 | |
| 9.40 | |
| 1,688 | |
| 2.18 | |
| 11,923 | |
| 2.44 | |
| 201,147 | |
| 3.37 | |
| 214,814 | |
| 3.31 | | |||||
U.S. Treasury and agency securities | 543 | |
| 0.41 | |
| 26,339 | |
| 1.41 | |
| 27,849 | |
| 2.12 | |
| 22 | |
| 2.57 | |
| 54,753 | |
| 1.76 | | |||||
Non-U.S. securities | 14,405 | |
| 0.95 | |
| 2,110 | |
| 0.92 | |
| 214 | |
| 1.17 | |
| 153 | |
| 6.64 | |
| 16,882 | |
| 1.00 | | |||||
Other taxable securities, substantially all asset-backed securities | 972 | |
| 3.12 | |
| 2,496 | |
| 3.21 | |
| 1,072 | |
| 3.43 | |
| 286 | |
| 8.13 | |
| 4,826 | |
| 3.54 | | |||||
Total taxable securities | 15,976 | |
| 1.10 | |
| 32,633 | |
| 1.55 | |
| 41,058 | |
| 2.24 | |
| 201,608 | |
| 3.37 | |
| 291,275 | |
| 2.89 | | |||||
Tax-exempt securities | 691 | |
| 1.58 | |
| 6,922 | |
| 2.10 | |
| 8,626 | |
| 2.07 | |
| 2,894 | |
| 1.94 | |
| 19,133 | |
| 2.04 | | |||||
Total amortized cost of debt securities carried at fair value | $ | 16,667 | |
| 1.12 | |
| $ | 39,555 | |
| 1.65 | |
| $ | 49,684 | |
| 2.21 | |
| $ | 204,502 | |
| 3.35 | |
| $ | 310,408 | |
| 2.83 | |
Amortized cost of HTM debt securities (2) | $ | 2 | |
| 4.35 | |
| $ | 67 | |
| 3.84 | |
| $ | 1,358 | |
| 2.74 | |
| $ | 122,112 | |
| 3.04 | |
| $ | 123,539 | |
| 3.04 | |
|
|
|
|
|
|
|
|
|
|
|
|
|
|
|
|
|
|
|
| |||||||||||||||
Debt securities carried at fair value |
| |
|
| |
|
| |
|
| |
|
| |
|
| |
|
| |
|
| |
|
| |
|
| | |||||
Mortgage-backed securities: |
| |
|
| |
|
| |
|
| |
|
| |
|
| |
|
| |
|
| |
|
| |
|
| | |||||
Agency | $ | 2 | |
|
| |
| $ | 27 | |
|
| |
| $ | 512 | |
|
| |
| $ | 183,570 | |
|
| |
| $ | 184,111 | |
|
| |
Agency-collateralized mortgage obligations | - | |
|
| |
| - | |
|
| |
| 31 | |
|
| |
| 6,367 | |
|
| |
| 6,398 | |
|
| | |||||
Commercial | 54 | |
|
| |
| 1,635 | |
|
| |
| 10,973 | |
|
| |
| 897 | |
|
| |
| 13,559 | |
|
| | |||||
Non-agency residential | - | |
|
| |
| - | |
|
| |
| 32 | |
|
| |
| 5,308 | |
|
| |
| 5,340 | |
|
| | |||||
Total mortgage-backed securities | 56 | |
|
|
| 1,662 | |
|
|
| 11,548 | |
|
|
| 196,142 | |
|
|
| 209,408 | |
|
| ||||||||||
U.S. Treasury and agency securities | 541 | |
|
|
| 25,460 | |
|
|
| 26,950 | |
|
|
| 21 | |
|
|
| 52,972 | |
|
| ||||||||||
Non-U.S. securities | 14,403 | |
|
| |
| 2,125 | |
|
| |
| 214 | |
|
| |
| 159 | |
|
| |
| 16,901 | |
|
| | |||||
Other taxable securities, substantially all asset-backed securities | 967 | |
|
| |
| 2,493 | |
|
| |
| 1,122 | |
|
| |
| 358 | |
|
| |
| 4,940 | |
|
| | |||||
Total taxable securities | 15,967 | |
|
| |
| 31,740 | |
|
| |
| 39,834 | |
|
| |
| 196,680 | |
|
| |
| 284,221 | |
|
| | |||||
Tax-exempt securities | 691 | |
|
| |
| 6,930 | |
|
| |
| 8,582 | |
|
| |
| 2,874 | |
|
| |
| 19,077 | |
|
| | |||||
Total debt securities carried at fair value | $ | 16,658 | |
|
| |
| $ | 38,670 | |
|
| |
| $ | 48,416 | |
|
| |
| $ | 199,554 | |
|
| |
| $ | 303,298 | |
|
| |
Fair value of HTM debt securities (2) | $ | 2 | |
|
|
| $ | 67 | |
|
|
| $ | 1,307 | |
|
|
| $ | 117,756 | |
|
|
| $ | 119,132 | |
|
| |||||
(1) | The average yield is computed based on a constant effective interest rate over the contractual life of each security. The average yield considers the contractual coupon and the amortization of premiums and accretion of discounts, excluding the effect of related hedging derivatives. |
(2) | Substantially all U.S. agency MBS. |
|
| Bank of America 68 |
NOTE 5
Outstanding Loans and Leases
The following tables present total outstanding loans and leases and an aging analysis for the Consumer Real Estate, Credit Card and Other Consumer, and Commercial portfolio segments, by class of financing receivables, at March 31, 2018 and December 31, 2017 .
|
|
|
|
|
|
|
|
|
|
|
|
|
|
|
| ||||||||||||||||
| 30-59 Days Past Due (1) |
| 60-89 Days Past Due (1) |
| 90 Days or Past Due (2) |
| Total Past or More |
| Total Current or Less Than 30 Days Past Due (3) |
| Purchased |
| Loans Accounted for Under the Fair Value Option |
| Total Outstandings | ||||||||||||||||
(Dollars in millions) | March 31, 2018 | ||||||||||||||||||||||||||||||
Consumer real estate |
| |
|
|
|
| |
|
| |
|
| |
|
| |
|
| |
|
| | |||||||||
Core portfolio |
|
|
|
|
|
|
|
|
|
|
|
|
|
|
| ||||||||||||||||
Residential mortgage | $ | 1,080 | |
| $ | 284 | |
| $ | 962 | |
| $ | 2,326 | |
| $ | 177,252 | |
|
|
|
|
| $ | 179,578 | | ||||
Home equity | 202 | |
| 119 | |
| 491 | |
| 812 | |
| 41,756 | |
|
|
|
|
| 42,568 | | ||||||||||
Non-core portfolio |
|
|
|
|
|
|
|
|
|
|
|
|
|
|
| ||||||||||||||||
Residential mortgage (5) | 852 | |
| 406 | |
| 3,106 | |
| 4,364 | |
| 12,580 | |
| $ | 7,590 | |
|
|
| 24,534 | | ||||||||
Home equity | 193 | |
| 114 | |
| 549 | |
| 856 | |
| 9,339 | |
| 2,545 | |
|
|
| 12,740 | | |||||||||
Credit card and other consumer |
|
|
|
|
|
|
|
|
|
|
|
|
|
|
| ||||||||||||||||
U.S. credit card | 515 | |
| 355 | |
| 925 | |
| 1,795 | |
| 91,219 | |
|
|
|
|
| 93,014 | | ||||||||||
Direct/Indirect consumer (6) | 253 | |
| 73 | |
| 41 | |
| 367 | |
| 90,846 | |
|
|
|
|
| 91,213 | | ||||||||||
Other consumer (7) | 9 | |
| 2 | |
| 1 | |
| 12 | |
| 2,848 | |
|
|
|
|
| 2,860 | | ||||||||||
Total consumer | 3,104 | |
| 1,353 | |
| 6,075 | |
| 10,532 | |
| 425,840 | |
| 10,135 | |
|
|
| 446,507 | | |||||||||
Consumer loans accounted for under the fair value option (8) |
| |
|
| |
|
| |
|
| |
|
| |
|
| |
| $ | 894 | |
| 894 | | |||||||
Total consumer loans and leases | 3,104 | |
| 1,353 | |
| 6,075 | |
| 10,532 | |
| 425,840 | |
| 10,135 | |
| 894 | |
| 447,401 | | ||||||||
Commercial |
|
|
|
|
|
|
|
|
|
|
|
|
|
|
| ||||||||||||||||
U.S. commercial | 773 | |
| 173 | |
| 416 | |
| 1,362 | |
| 287,114 | |
|
|
|
|
| 288,476 | | ||||||||||
Non-U.S. commercial | 36 | |
| - | |
| - | |
| 36 | |
| 97,329 | |
|
|
|
|
| 97,365 | | ||||||||||
Commercial real estate (9) | 159 | |
| - | |
| 37 | |
| 196 | |
| 59,889 | |
|
|
|
|
| 60,085 | | ||||||||||
Commercial lease financing | 173 | |
| 29 | |
| 27 | |
| 229 | |
| 21,535 | |
|
|
|
|
| 21,764 | | ||||||||||
U.S. small business commercial | 79 | |
| 43 | |
| 87 | |
| 209 | |
| 13,683 | |
|
|
|
|
| 13,892 | | ||||||||||
Total commercial | 1,220 | |
| 245 | |
| 567 | |
| 2,032 | |
| 479,550 | |
|
|
|
|
| 481,582 | | ||||||||||
Commercial loans accounted for under the fair value option (8) |
| |
|
| |
|
| |
|
| |
|
| |
|
| |
| 5,095 | |
| 5,095 | | ||||||||
Total commercial loans and leases | 1,220 | |
| 245 | |
| 567 | |
| 2,032 | |
| 479,550 | |
|
|
| 5,095 | |
| 486,677 | | |||||||||
Total loans and leases (10) | $ | 4,324 | |
| $ | 1,598 | |
| $ | 6,642 | |
| $ | 12,564 | |
| $ | 905,390 | |
| $ | 10,135 | |
| $ | 5,989 | |
| $ | 934,078 | |
Percentage of outstandings | 0.47 | % |
| 0.17 | % |
| 0.71 | % |
| 1.35 | % |
| 96.93 | % |
| 1.08 | % |
| 0.64 | % |
| 100.00 | % | ||||||||
(1) | Consumer real estate loans 30-59 days past due includes fully-insured loans of $689 million and nonperforming loans of $267 million . Consumer real estate loans 60-89 days past due includes fully-insured loans of $341 million and nonperforming loans of $200 million . |
(2) | Consumer real estate includes fully-insured loans of $2.9 billion . |
(3) | Consumer real estate includes $2.2 billion and direct/indirect consumer includes $43 million of nonperforming loans. |
(4) | Purchased credit-impaired (PCI) loan amounts are shown gross of the valuation allowance. |
(5) | Total outstandings includes pay option loans of $1.3 billion . The Corporation no longer originates this product. |
(6) | Total outstandings includes auto and specialty lending loans of $49.1 billion , unsecured consumer lending loans of $428 million , U.S. securities-based lending loans of $38.1 billion , non-U.S. consumer loans of $2.9 billion and other consumer loans of $676 million . |
(7) | Total outstandings includes consumer leases of $2.7 billion and consumer overdrafts of $129 million . |
(8) | Consumer loans accounted for under the fair value option includes residential mortgage loans of $523 million and home equity loans of $371 million . Commercial loans accounted for under the fair value option includes U.S. commercial loans of $3.2 billion and non-U.S. commercial loans of $1.9 billion . For more information, see Note 14 – Fair Value Measurements and Note 15 – Fair Value Option . |
(9) | Total outstandings includes U.S. commercial real estate loans of $55.6 billion and non-U.S. commercial real estate loans of $4.5 billion . |
(10) | Total outstandings Includes loans and leases pledged as collateral of $47.8 billion . The Corporation also pledged $151.4 billion of loans with no related outstanding borrowings to secure potential borrowing capacity with the Federal Reserve Bank and Federal Home Loan Bank (FHLB). |
69 Bank of America |
|
|
|
|
|
|
|
|
|
|
|
|
|
|
|
|
|
| ||||||||||||||||
| 30-59 Days |
| 60-89 Days Past Due (1) |
| 90 Days or |
| Total Past |
| Total Current or Less Than 30 Days Past Due (3) |
| Purchased |
| Loans Accounted for Under the Fair Value Option |
| Total Outstandings | ||||||||||||||||
(Dollars in millions) | December 31, 2017 | ||||||||||||||||||||||||||||||
Consumer real estate |
| |
|
|
|
| |
|
| |
|
| |
|
| |
|
| |
|
| | |||||||||
Core portfolio |
|
|
|
|
|
|
|
|
|
|
|
|
|
|
| ||||||||||||||||
Residential mortgage | $ | 1,242 | |
| $ | 321 | |
| $ | 1,040 | |
| $ | 2,603 | |
| $ | 174,015 | |
|
|
|
| |
| $ | 176,618 | | |||
Home equity | 215 | |
| 108 | |
| 473 | |
| 796 | |
| 43,449 | |
|
|
|
| |
| 44,245 | | |||||||||
Non-core portfolio |
|
|
| |
|
| |
|
| |
|
| |
|
| |
|
| |
|
| | |||||||||
Residential mortgage (5) | 1,028 | |
| 468 | |
| 3,535 | |
| 5,031 | |
| 14,161 | |
| $ | 8,001 | |
|
| |
| 27,193 | | |||||||
Home equity | 224 | |
| 121 | |
| 572 | |
| 917 | |
| 9,866 | |
| 2,716 | |
|
| |
| 13,499 | | ||||||||
Credit card and other consumer |
|
|
| |
|
| |
|
| |
|
| |
|
| |
|
| |
|
| | |||||||||
U.S. credit card | 542 | |
| 405 | |
| 900 | |
| 1,847 | |
| 94,438 | |
|
|
|
| |
| 96,285 | | |||||||||
Direct/Indirect consumer (6) | 320 | |
| 102 | |
| 43 | |
| 465 | |
| 93,365 | |
|
|
|
| |
| 93,830 | | |||||||||
Other consumer (7) | 10 | |
| 2 | |
| 1 | |
| 13 | |
| 2,665 | |
|
|
|
| |
| 2,678 | | |||||||||
Total consumer | 3,581 | |
| 1,527 | |
| 6,564 | |
| 11,672 | |
| 431,959 | |
| 10,717 | |
|
| | 454,348 | | |||||||||
Consumer loans accounted for under the fair value option (8) |
|
|
|
|
|
|
|
|
|
|
|
| $ | 928 | | | 928 | | |||||||||||||
Total consumer loans and leases | 3,581 | |
| 1,527 | |
| 6,564 | |
| 11,672 | |
| 431,959 | |
| 10,717 | |
| 928 | |
| 455,276 | | ||||||||
Commercial |
|
|
| |
|
| |
|
| |
|
| |
|
| |
|
| |
|
| | |||||||||
U.S. commercial | 547 | |
| 244 | |
| 425 | |
| 1,216 | |
| 283,620 | |
|
|
|
| |
| 284,836 | | |||||||||
Non-U.S. commercial | 52 | |
| 1 | |
| 3 | |
| 56 | |
| 97,736 | |
|
|
|
| |
| 97,792 | | |||||||||
Commercial real estate (9) | 48 | |
| 10 | |
| 29 | |
| 87 | |
| 58,211 | |
|
|
|
| |
| 58,298 | | |||||||||
Commercial lease financing | 110 | |
| 68 | |
| 26 | |
| 204 | |
| 21,912 | |
|
|
|
| |
| 22,116 | | |||||||||
U.S. small business commercial | 95 | |
| 45 | |
| 88 | |
| 228 | |
| 13,421 | |
|
|
|
| |
| 13,649 | | |||||||||
Total commercial | 852 | |
| 368 | |
| 571 | |
| 1,791 | |
| 474,900 | |
|
|
|
| |
| 476,691 | | |||||||||
Commercial loans accounted for under the fair value option (8) |
|
|
|
|
|
|
|
|
|
|
|
| 4,782 | |
| 4,782 | | ||||||||||||||
Total commercial loans and leases | 852 | |
| 368 | |
| 571 | |
| 1,791 | |
| 474,900 | |
|
|
| 4,782 | |
| 481,473 | | |||||||||
Total loans and leases (10) | $ | 4,433 | |
| $ | 1,895 | |
| $ | 7,135 | |
| $ | 13,463 | |
| $ | 906,859 | |
| $ | 10,717 | |
| $ | 5,710 | |
| $ | 936,749 | |
Percentage of outstandings | 0.48 | % |
| 0.20 | % |
| 0.76 | % |
| 1.44 | % |
| 96.81 | % |
| 1.14 | % |
| 0.61 | % |
| 100.00 | % | ||||||||
(1) | Consumer real estate loans 30-59 days past due includes fully-insured loans of $850 million and nonperforming loans of $253 million . Consumer real estate loans 60-89 days past due includes fully-insured loans of $386 million and nonperforming loans of $195 million . |
(2) | Consumer real estate includes fully-insured loans of $3.2 billion . |
(3) | Consumer real estate includes $2.3 billion and direct/indirect consumer includes $43 million of nonperforming loans. |
(4) | PCI loan amounts are shown gross of the valuation allowance. |
(5) | Total outstandings includes pay option loans of $1.4 billion . The Corporation no longer originates this product. |
(6) | Total outstandings includes auto and specialty lending loans of $49.9 billion , unsecured consumer lending loans of $469 million , U.S. securities-based lending loans of $39.8 billion , non-U.S. consumer loans of $3.0 billion and other consumer loans of $684 million . |
(7) | Total outstandings includes consumer leases of $2.5 billion and consumer overdrafts of $163 million . |
(8) | Consumer loans accounted for under the fair value option includes residential mortgage loans of $567 million and home equity loans of $361 million . Commercial loans accounted for under the fair value option includes U.S. commercial loans of $2.6 billion and non-U.S. commercial loans of $2.2 billion . For more information, see Note 14 – Fair Value Measurements and Note 15 – Fair Value Option . |
(9) | Total outstandings includes U.S. commercial real estate loans of $54.8 billion and non-U.S. commercial real estate loans of $3.5 billion . |
(10) | Total outstandings Includes loans and leases pledged as collateral of $40.1 billion . The Corporation also pledged $160.3 billion of loans with no related outstanding borrowings to secure potential borrowing capacity with the Federal Reserve Bank and FHLB. |
The Corporation categorizes consumer real estate loans as core and non-core based on loan and customer characteristics such as origination date, product type, LTV, FICO score and delinquency status consistent with its current consumer and mortgage servicing strategy. Generally, loans that were originated after January 1, 2010, qualified under government-sponsored enterprise (GSE) underwriting guidelines, or otherwise met the Corporation's underwriting guidelines in place in 2015 are characterized as core loans. All other loans are generally characterized as non-core loans and represent run-off portfolios.
The Corporation has entered into long-term credit protection agreements with FNMA and FHLMC on loans totaling $6.2 billion and $6.3 billion at March 31, 2018 and December 31, 2017 , providing full credit protection on residential mortgage loans that become severely delinquent. All of these loans are individually insured and therefore the Corporation does not record an allowance for credit losses related to these loans.
Nonperforming Loans and Leases
The Corporation classifies junior-lien home equity loans as nonperforming when the first-lien loan becomes 90 days past due even if the junior-lien loan is performing. At March 31, 2018 and
December 31, 2017 , $294 million and $330 million of such junior-lien home equity loans were included in nonperforming loans.
The Corporation classifies consumer real estate loans that have been discharged in Chapter 7 bankruptcy and not reaffirmed by the borrower as troubled debt restructurings (TDRs), irrespective of payment history or delinquency status, even if the repayment terms for the loan have not been otherwise modified. The Corporation continues to have a lien on the underlying collateral. At March 31, 2018 , nonperforming loans discharged in Chapter 7 bankruptcy with no change in repayment terms were $299 million of which $165 million were current on their contractual payments, while $113 million were 90 days or more past due. Of the contractually current nonperforming loans, 62 percent were discharged in Chapter 7 bankruptcy over 12 months ago, and 53 percent were discharged 24 months or more ago.
During the three months ended March 31, 2018 and 2017 , the Corporation sold nonperforming and other delinquent consumer real estate loans with a carrying value of $378 million and $142 million , including $109 million and $0 of PCI loans. The Corporation recorded net recoveries of $20 million and $11 million related to these sales. Gains related to these sales of $16 million and $6 million were recorded in other income in the Consolidated
|
| Bank of America 70 |
Statement of Income. During the three months ended March 31, 2018 and 2017 , the Corporation transferred consumer nonperforming loans with a net carrying value of $2 million and $221 million to held for sale.
The table below presents the Corporation's nonperforming loans and leases including nonperforming TDRs, and loans accruing past due 90 days or more at March 31, 2018 and
December 31, 2017 . Nonperforming loans held-for-sale (LHFS) are excluded from nonperforming loans and leases as they are recorded at either fair value or the lower of cost or fair value. For more information on the criteria for classification as nonperforming, see Note 1 – Summary of Significant Accounting Principles to the Consolidated Financial Statements of the Corporation's 2017 Annual Report on Form 10-K .
|
|
|
|
|
|
|
| ||||||||
Credit Quality |
|
| |||||||||||||
|
|
|
|
|
|
|
| ||||||||
| Nonperforming Loans and Leases |
| Accruing Past Due 90 Days or More | ||||||||||||
(Dollars in millions) | March 31 |
| December 31 |
| March 31 |
| December 31 | ||||||||
Consumer real estate |
| |
|
| |
|
| |
|
| | ||||
Core portfolio |
|
|
|
|
|
|
| ||||||||
Residential mortgage (1) | $ | 1,073 | |
| $ | 1,087 | |
| $ | 385 | |
| $ | 417 | |
Home equity | 1,118 | |
| 1,079 | |
| - | |
| - | | ||||
Non-core portfolio |
| |
|
| |
|
| |
|
| |||||
Residential mortgage (1) | 1,189 | |
| 1,389 | |
| 2,500 | |
| 2,813 | | ||||
Home equity | 1,480 | |
| 1,565 | |
| - | |
| - | | ||||
Credit card and other consumer |
| |
|
| |
|
|
|
| ||||||
U.S. credit card | n/a | |
| n/a | |
| 925 | |
| 900 | | ||||
Direct/Indirect consumer | 46 | |
| 46 | |
| 38 | |
| 40 | | ||||
Other consumer | - | |
| - | |
| 1 | |
| - | | ||||
Total consumer | 4,906 | |
| 5,166 | |
| 3,849 | |
| 4,170 | | ||||
Commercial |
| |
|
| |
|
| |
|
| | ||||
U.S. commercial | 1,059 | |
| 814 | |
| 98 | |
| 144 | | ||||
Non-U.S. commercial | 255 | |
| 299 | |
| - | |
| 3 | | ||||
Commercial real estate | 73 | |
| 112 | |
| 13 | |
| 4 | | ||||
Commercial lease financing | 27 | |
| 24 | |
| 8 | |
| 19 | | ||||
U.S. small business commercial | 58 | |
| 55 | |
| 76 | |
| 75 | | ||||
Total commercial | 1,472 | |
| 1,304 | |
| 195 | |
| 245 | | ||||
Total loans and leases | $ | 6,378 | |
| $ | 6,470 | |
| $ | 4,044 | |
| $ | 4,415 | |
(1) | Residential mortgage loans in the core and non-core portfolios accruing past due 90 days or more are fully-insured loans. At March 31, 2018 and December 31, 2017 , residential mortgage includes $2.0 billion and $2.2 billion of loans on which interest has been curtailed by the Federal Housing Administration (FHA), and therefore are no longer accruing interest, although principal is still insured, and $885 million and $1.0 billion of loans on which interest is still accruing. |
n/a = not applicable
Credit Quality Indicators
The Corporation monitors credit quality within its Consumer Real Estate, Credit Card and Other Consumer, and Commercial portfolio segments based on primary credit quality indicators. For more information on the portfolio segments and their related credit quality indicators, see Significant Accounting Principles – Loans and Leases in Note 1 – Summary of Significant Accounting
Principles and Credit Quality Indicators in Note 4 – Outstanding Loans and Leases to the Consolidated Financial Statements of the Corporation's 2017 Annual Report on Form 10-K .
The following tables present certain credit quality indicators for the Corporation's Consumer Real Estate, Credit Card and Other Consumer, and Commercial portfolio segments, by class of financing receivables, at March 31, 2018 and December 31, 2017 .
|
|
|
|
|
|
|
|
|
|
|
| ||||||||||||
Consumer Real Estate – Credit Quality Indicators (1) | |||||||||||||||||||||||
|
|
|
|
|
|
|
|
|
|
|
| ||||||||||||
| Core Residential Mortgage (2) |
| Non-core Residential |
| Residential Mortgage PCI (3) |
| Core Home Equity (2) |
| Non-core Home Equity (2) |
| Home Equity PCI | ||||||||||||
(Dollars in millions) | March 31, 2018 | ||||||||||||||||||||||
Refreshed LTV (4) |
| |
|
| |
|
| |
|
| |
|
|
|
| ||||||||
Less than or equal to 90 percent | $ | 157,236 | |
| $ | 10,484 | |
| $ | 6,535 | |
| $ | 41,498 | |
| $ | 7,629 | |
| $ | 1,691 | |
Greater than 90 percent but less than or equal to 100 percent | 3,046 | |
| 783 | |
| 530 | |
| 488 | |
| 985 | |
| 379 | | ||||||
Greater than 100 percent | 1,357 | |
| 907 | |
| 525 | |
| 582 | |
| 1,581 | |
| 475 | | ||||||
Fully-insured loans (5) | 17,939 | |
| 4,770 | |
| - | |
| - | |
| - | |
| - | | ||||||
Total consumer real estate | $ | 179,578 | |
| $ | 16,944 | |
| $ | 7,590 | |
| $ | 42,568 | |
| $ | 10,195 | |
| $ | 2,545 | |
Refreshed FICO score |
|
|
|
|
|
|
|
|
|
|
| ||||||||||||
Less than 620 | $ | 2,183 | |
| $ | 2,060 | |
| $ | 1,790 | |
| $ | 1,165 | |
| $ | 1,976 | |
| $ | 425 | |
Greater than or equal to 620 and less than 680 | 4,417 | |
| 1,771 | |
| 1,530 | |
| 2,261 | |
| 2,243 | |
| 425 | | ||||||
Greater than or equal to 680 and less than 740 | 22,407 | |
| 2,988 | |
| 2,273 | |
| 7,685 | |
| 2,592 | |
| 729 | | ||||||
Greater than or equal to 740 | 132,632 | |
| 5,355 | |
| 1,997 | |
| 31,457 | |
| 3,384 | |
| 966 | | ||||||
Fully-insured loans (5) | 17,939 | |
| 4,770 | |
| - | |
| - | |
| - | |
| - | | ||||||
Total consumer real estate | $ | 179,578 | |
| $ | 16,944 | |
| $ | 7,590 | |
| $ | 42,568 | |
| $ | 10,195 | |
| $ | 2,545 | |
(1) | Excludes $894 million of loans accounted for under the fair value option. |
(2) | Excludes PCI loans. |
(3) | Includes $1.1 billion of pay option loans. The Corporation no longer originates this product. |
(4) | Refreshed LTV percentages for PCI loans are calculated using the carrying value net of the related valuation allowance. |
(5) | Credit quality indicators are not reported for fully-insured loans as principal repayment is insured. |
71 Bank of America |
|
|
|
|
|
|
|
| ||||||
Credit Card and Other Consumer – Credit Quality Indicators | |||||||||||
|
|
|
|
|
| ||||||
| U.S. Credit Card |
| Direct/Indirect Consumer |
| Other Consumer | ||||||
(Dollars in millions) | March 31, 2018 | ||||||||||
Refreshed FICO score |
| |
|
| |
|
| | |||
Less than 620 | $ | 4,704 | |
| $ | 1,635 | |
| $ | 57 | |
Greater than or equal to 620 and less than 680 | 12,052 | |
| 1,902 | |
| 155 | | |||
Greater than or equal to 680 and less than 740 | 34,673 | |
| 11,480 | |
| 429 | | |||
Greater than or equal to 740 | 41,585 | |
| 34,467 | |
| 2,088 | | |||
Other internal credit metrics (1, 2) | - | |
| 41,729 | |
| 131 | | |||
Total credit card and other consumer | $ | 93,014 | |
| $ | 91,213 | |
| $ | 2,860 | |
(1) | Other internal credit metrics may include delinquency status, geography or other factors. |
(2) | Direct/indirect consumer includes $41.1 billion of securities-based lending which is overcollateralized and therefore has minimal credit risk. |
|
|
|
|
|
|
|
|
|
| ||||||||||
Commercial – Credit Quality Indicators (1) |
|
|
|
| |||||||||||||||
|
|
|
|
|
|
|
|
|
| ||||||||||
| U.S. Commercial |
| Non-U.S. Commercial |
| Commercial Real Estate |
| Commercial Financing |
| U.S. Small Commercial (2) | ||||||||||
(Dollars in millions) | March 31, 2018 | ||||||||||||||||||
Risk ratings |
| |
|
| |
|
| |
|
| |
|
| | |||||
Pass rated | $ | 279,492 | |
| $ | 95,807 | |
| $ | 59,562 | |
| $ | 21,275 | |
| $ | 314 | |
Reservable criticized | 8,984 | |
| 1,558 | |
| 523 | |
| 489 | |
| 42 | | |||||
Refreshed FICO score (3) |
|
|
|
|
|
|
|
|
| | |||||||||
Less than 620 |
| |
|
|
|
|
|
|
| 238 | | ||||||||
Greater than or equal to 620 and less than 680 |
|
|
|
|
|
|
|
| 648 | | |||||||||
Greater than or equal to 680 and less than 740 |
|
|
|
|
|
|
|
| 1,926 | | |||||||||
Greater than or equal to 740 |
|
|
|
|
|
|
|
| 3,869 | | |||||||||
Other internal credit metrics (3, 4) |
|
|
|
|
|
|
|
| 6,855 | | |||||||||
Total commercial | $ | 288,476 | |
| $ | 97,365 | |
| $ | 60,085 | |
| $ | 21,764 | |
| $ | 13,892 | |
(1) | Excludes $5.1 billion of loans accounted for under the fair value option. |
(2) | U.S. small business commercial includes $719 million of criticized business card and small business loans which are evaluated using refreshed FICO scores or internal credit metrics, including delinquency status, rather than risk ratings. At March 31, 2018 , 99 percent of the balances where internal credit metrics are used was current or less than 30 days past due. |
(3) | Refreshed FICO score and other internal credit metrics are applicable only to the U.S. small business commercial portfolio. |
(4) | Other internal credit metrics may include delinquency status, application scores, geography or other factors. |
|
|
|
|
|
|
|
|
|
|
|
| ||||||||||||
Consumer Real Estate – Credit Quality Indicators (1) | |||||||||||||||||||||||
|
|
|
|
|
|
|
|
|
|
|
| ||||||||||||
| Core Residential Mortgage (2) |
| Non-core Residential |
| Residential Mortgage PCI (3) |
| Core Home Equity (2) |
| Non-core Home Equity (2) |
| Home Equity PCI | ||||||||||||
(Dollars in millions) | December 31, 2017 | ||||||||||||||||||||||
Refreshed LTV (4) |
| |
|
| |
|
| |
|
| |
|
|
|
| ||||||||
Less than or equal to 90 percent | $ | 153,669 | |
| $ | 12,135 | |
| $ | 6,872 | |
| $ | 43,048 | |
| $ | 7,944 | |
| $ | 1,781 | |
Greater than 90 percent but less than or equal to 100 percent | 3,082 | |
| 850 | |
| 559 | |
| 549 | |
| 1,053 | |
| 412 | | ||||||
Greater than 100 percent | 1,322 | |
| 1,011 | |
| 570 | |
| 648 | |
| 1,786 | |
| 523 | | ||||||
Fully-insured loans (5) | 18,545 | |
| 5,196 | |
| - | |
| - | |
| - | |
| - | | ||||||
Total consumer real estate | $ | 176,618 | |
| $ | 19,192 | |
| $ | 8,001 | |
| $ | 44,245 | |
| $ | 10,783 | |
| $ | 2,716 | |
Refreshed FICO score |
| |
|
| |
|
| |
|
| |
|
| |
|
| | ||||||
Less than 620 | $ | 2,234 | |
| $ | 2,390 | |
| $ | 1,941 | |
| $ | 1,169 | |
| $ | 2,098 | |
| $ | 452 | |
Greater than or equal to 620 and less than 680 | 4,531 | |
| 2,086 | |
| 1,657 | |
| 2,371 | |
| 2,393 | |
| 466 | | ||||||
Greater than or equal to 680 and less than 740 | 22,934 | |
| 3,519 | |
| 2,396 | |
| 8,115 | |
| 2,723 | |
| 786 | | ||||||
Greater than or equal to 740 | 128,374 | |
| 6,001 | |
| 2,007 | |
| 32,590 | |
| 3,569 | |
| 1,012 | | ||||||
Fully-insured loans (5) | 18,545 | |
| 5,196 | |
| - | |
| - | |
| - | |
| - | | ||||||
Total consumer real estate | $ | 176,618 | |
| $ | 19,192 | |
| $ | 8,001 | |
| $ | 44,245 | |
| $ | 10,783 | |
| $ | 2,716 | |
(1) | Excludes $928 million of loans accounted for under the fair value option. |
(2) | Excludes PCI loans. |
(3) | Includes $1.2 billion of pay option loans. The Corporation no longer originates this product. |
(4) | Refreshed LTV percentages for PCI loans are calculated using the carrying value net of the related valuation allowance. |
(5) | Credit quality indicators are not reported for fully-insured loans as principal repayment is insured. |
|
| Bank of America 72 |
|
|
|
|
|
| ||||||
Credit Card and Other Consumer – Credit Quality Indicators | |||||||||||
|
|
|
|
|
| ||||||
| U.S. Credit Card |
| Direct/Indirect Consumer |
| Other Consumer | ||||||
(Dollars in millions) | December 31, 2017 | ||||||||||
Refreshed FICO score |
| |
|
| |
|
| | |||
Less than 620 | $ | 4,730 | |
| $ | 1,630 | |
| $ | 49 | |
Greater than or equal to 620 and less than 680 | 12,422 | |
| 2,000 | |
| 143 | | |||
Greater than or equal to 680 and less than 740 | 35,656 | |
| 11,906 | |
| 398 | | |||
Greater than or equal to 740 | 43,477 | |
| 34,838 | |
| 1,921 | | |||
Other internal credit metrics (1, 2) | - | |
| 43,456 | |
| 167 | | |||
Total credit card and other consumer | $ | 96,285 | |
| $ | 93,830 | |
| $ | 2,678 | |
(1) | Other internal credit metrics may include delinquency status, geography or other factors. |
(2) | Direct/indirect consumer includes $42.8 billion of securities-based lending which is overcollateralized and therefore has minimal credit risk. |
|
|
|
|
|
|
|
|
|
| ||||||||||
Commercial – Credit Quality Indicators (1) |
|
|
|
| |||||||||||||||
|
|
|
|
|
|
|
|
|
| ||||||||||
| U.S. Commercial |
| Non-U.S. Commercial |
| Commercial Real Estate |
| Commercial Financing |
| U.S. Small Commercial (2) | ||||||||||
(Dollars in millions) | December 31, 2017 | ||||||||||||||||||
Risk ratings |
| |
|
| |
|
| |
|
| |
|
| | |||||
Pass rated | $ | 275,904 | |
| $ | 96,199 | |
| $ | 57,732 | |
| $ | 21,535 | |
| $ | 322 | |
Reservable criticized | 8,932 | |
| 1,593 | |
| 566 | |
| 581 | |
| 50 | | |||||
Refreshed FICO score (3) |
|
|
|
|
|
|
|
|
| ||||||||||
Less than 620 |
|
|
|
|
|
|
|
| 223 | | |||||||||
Greater than or equal to 620 and less than 680 |
|
|
|
|
|
|
|
| 625 | | |||||||||
Greater than or equal to 680 and less than 740 |
|
|
|
|
|
|
|
| 1,875 | | |||||||||
Greater than or equal to 740 |
|
|
|
|
|
|
|
| 3,713 | | |||||||||
Other internal credit metrics (3, 4) |
|
|
|
|
|
|
|
| 6,841 | | |||||||||
Total commercial | $ | 284,836 | |
| $ | 97,792 | |
| $ | 58,298 | |
| $ | 22,116 | |
| $ | 13,649 | |
(1) | Excludes $4.8 billion of loans accounted for under the fair value option. |
(2) | U.S. small business commercial includes $709 million of criticized business card and small business loans which are evaluated using refreshed FICO scores or internal credit metrics, including delinquency status, rather than risk ratings. At December 31, 2017 , 98 percent of the balances where internal credit metrics are used was current or less than 30 days past due. |
(3) | Refreshed FICO score and other internal credit metrics are applicable only to the U.S. small business commercial portfolio. |
(4) | Other internal credit metrics may include delinquency status, application scores, geography or other factors. |
Impaired Loans and Troubled Debt Restructurings
A loan is considered impaired when, based on current information, it is probable that the Corporation will be unable to collect all amounts due from the borrower in accordance with the contractual terms of the loan. For additional information on impaired loans, see Note 1 – Summary of Significant Accounting Principles and Note 4 – Outstanding Loans and Leases to the Consolidated Financial Statements of the Corporation's 2017 Annual Report on Form 10-K .
Consumer Real Estate
Impaired consumer real estate loans within the Consumer Real Estate portfolio segment consist entirely of TDRs. Excluding PCI loans, most modifications of consumer real estate loans meet the definition of TDRs when a binding offer is extended to a borrower. For more information on impaired consumer real estate loans, see Note 4 – Outstanding Loans and Leases to the Consolidated Financial Statements of the Corporation's 2017 Annual Report on Form 10-K .
Consumer real estate loans that have been discharged in Chapter 7 bankruptcy with no change in repayment terms and not reaffirmed by the borrower of $1.1 billion were included in TDRs at March 31, 2018 , of which $299 million were classified as nonperforming and $405 million were loans fully-insured by the FHA. For more information on loans discharged in Chapter 7 bankruptcy, see Nonperforming Loans and Leases in this Note.
At March 31, 2018 and December 31, 2017 , remaining commitments to lend additional funds to debtors whose terms have been modified in a consumer real estate TDR were immaterial. Consumer real estate foreclosed properties totaled $264 million and $236 million at March 31, 2018 and December 31, 2017 . The carrying value of consumer real estate loans, including fully-insured and PCI loans, for which formal foreclosure proceedings were in process at March 31, 2018 was $3.3 billion . During the three months ended March 31, 2018 and 2017 , the Corporation reclassified $168 million and $200 million of consumer real estate loans to foreclosed properties or, for properties acquired upon foreclosure of certain government-guaranteed loans (principally FHA-insured loans), to other assets. The reclassifications represent non-cash investing activities and, accordingly, are not reflected in the Consolidated Statement of Cash Flows.
The table below provides the unpaid principal balance, carrying value and related allowance at March 31, 2018 and December 31, 2017 , and the average carrying value and interest income recognized for the three months ended March 31, 2018 and 2017 for impaired loans in the Corporation's Consumer Real Estate portfolio segment. Certain impaired consumer real estate loans do not have a related allowance as the current valuation of these impaired loans exceeded the carrying value, which is net of previously recorded charge-offs.
73 Bank of America |
|
|
|
|
|
|
|
|
|
|
|
|
|
| ||||||||||||
Impaired Loans – Consumer Real Estate |
|
| |||||||||||||||||||||
|
|
|
|
|
|
|
|
|
|
|
| ||||||||||||
| Unpaid Balance |
| Carrying Value |
| Related Allowance |
| Unpaid Balance |
| Carrying Value |
| Related Allowance | ||||||||||||
(Dollars in millions) | March 31, 2018 |
| December 31, 2017 | ||||||||||||||||||||
With no recorded allowance |
| |
|
| |
|
| |
|
| |
|
| |
|
| |||||||
Residential mortgage | $ | 6,793 | |
| $ | 5,451 | |
| $ | - | |
| $ | 8,856 | |
| $ | 6,870 | |
| $ | - | |
Home equity | 3,583 | |
| 1,943 | |
| - | |
| 3,622 | |
| 1,956 | |
| - | | ||||||
With an allowance recorded |
|
|
|
|
| |
|
|
|
|
|
| |||||||||||
Residential mortgage | $ | 2,634 | |
| $ | 2,568 | |
| $ | 157 | |
| $ | 2,908 | |
| $ | 2,828 | |
| $ | 174 | |
Home equity | 985 | |
| 910 | |
| 181 | |
| 972 | |
| 900 | |
| 174 | | ||||||
Total |
| |
|
| |
|
| |
|
|
|
|
|
| |||||||||
Residential mortgage (1) | $ | 9,427 | |
| $ | 8,019 | |
| $ | 157 | |
| $ | 11,764 | |
| $ | 9,698 | |
| $ | 174 | |
Home equity | 4,568 | |
| 2,853 | |
| 181 | |
| 4,594 | |
| 2,856 | |
| 174 | | ||||||
|
|
|
|
|
|
|
|
|
|
|
| ||||||||||||
|
|
|
|
| Average |
| Interest |
| Average |
| Interest | ||||||||||||
|
|
|
|
| Three Months Ended March 31 | ||||||||||||||||||
|
|
| 2018 |
| 2017 | ||||||||||||||||||
With no recorded allowance |
|
|
|
|
|
|
|
|
|
|
| ||||||||||||
Residential mortgage |
|
|
|
| $ | 6,462 | |
| $ | 65 | |
| $ | 8,456 | |
| $ | 79 | | ||||
Home equity |
|
|
|
| 1,961 | |
| 27 | |
| 1,991 | |
| 27 | | ||||||||
With an allowance recorded |
|
|
|
|
|
|
|
|
|
|
| ||||||||||||
Residential mortgage |
|
|
|
| $ | 2,705 | |
| $ | 25 | |
| $ | 3,832 | |
| $ | 35 | | ||||
Home equity |
|
|
|
| 892 | |
| 6 | |
| 825 | |
| 5 | | ||||||||
Total |
|
|
|
|
|
|
|
|
|
|
| ||||||||||||
Residential mortgage (1) |
|
|
|
| $ | 9,167 | |
| $ | 90 | |
| $ | 12,288 | |
| $ | 114 | | ||||
Home equity |
|
|
|
| 2,853 | |
| 33 | |
| 2,816 | |
| 32 | | ||||||||
(1) | During the three months ended March 31, 2018 , the Corporation transferred impaired residential mortgage loans with a carrying value of $1.2 billion to held for sale. |
(2) | Interest income recognized includes interest accrued and collected on the outstanding balances of accruing impaired loans as well as interest cash collections on nonaccruing impaired loans for which the principal is considered collectible. |
The table below presents the March 31, 2018 and 2017 unpaid principal balance, carrying value, and average pre- and post-modification interest rates on consumer real estate loans that were modified in TDRs during the three months ended March 31, 2018 and 2017 , and net charge-offs recorded during the period in which the modification occurred. The following Consumer Real Estate portfolio segment tables include loans that were initially classified as TDRs during the period and also loans that had previously been classified as TDRs and were modified again during the period.
|
|
|
|
|
|
|
|
|
| ||||||||
Consumer Real Estate – TDRs Entered into During the Three Months Ended March 31, 2018 and 2017 | |||||||||||||||||
|
| ||||||||||||||||
| Unpaid Principal Balance |
| Carrying Value |
| Pre-Modification Interest Rate |
| Post-Modification Interest Rate (1) |
| Net Charge-offs (2) | ||||||||
(Dollars in millions) | March 31, 2018 |
| Three Months Ended March 31, 2018 | ||||||||||||||
Residential mortgage | $ | 407 | |
| $ | 358 | |
| 4.39 | % |
| 4.36 | % |
| $ | 3 | |
Home equity | 207 | |
| 161 | |
| 4.37 | |
| 4.37 | |
| 6 | | |||
Total | $ | 614 | |
| $ | 519 | |
| 4.39 | |
| 4.36 | |
| $ | 9 | |
|
|
|
|
|
|
|
|
|
| ||||||||
| March 31, 2017 |
| Three Months Ended March 31, 2017 | ||||||||||||||
Residential mortgage | $ | 382 | |
| $ | 344 | |
| 4.68 | % |
| 4.44 | % |
| $ | 2 | |
Home equity | 248 | |
| 189 | |
| 4.90 | |
| 3.80 | |
| 6 | | |||
Total | $ | 630 | |
| $ | 533 | |
| 4.77 | |
| 4.19 | |
| $ | 8 | |
(1) | The post-modification interest rate reflects the interest rate applicable only to permanently completed modifications, which exclude loans that are in a trial modification period. |
(2) | Net charge-offs include amounts recorded on loans modified during the period that are no longer held by the Corporation at March 31, 2018 and 2017 due to sales and other dispositions. |
|
| Bank of America 74 |
The table below presents the March 31, 2018 and 2017 carrying value for consumer real estate loans that were modified in a TDR during the three months ended March 31, 2018 and 2017 , by type of modification.
|
|
|
| ||||
Consumer Real Estate – Modification Programs |
|
| |||||
|
|
|
| ||||
| TDRs Entered into During the Three Months Ended March 31 | ||||||
(Dollars in millions) | 2018 |
| 2017 | ||||
Modifications under government programs |
|
|
| ||||
Contractual interest rate reduction | $ | 7 | |
| $ | 32 | |
Principal and/or interest forbearance | - | |
| 1 | | ||
Other modifications (1) | 6 | |
| 2 | | ||
Total modifications under government programs | 13 | |
| 35 | | ||
Modifications under proprietary programs |
|
|
| ||||
Contractual interest rate reduction | 11 | |
| 14 | | ||
Capitalization of past due amounts | 14 | |
| 5 | | ||
Principal and/or interest forbearance | 6 | |
| 3 | | ||
Other modifications (1) | 169 | |
| 30 | | ||
Total modifications under proprietary programs | 200 | |
| 52 | | ||
Trial modifications | 242 | |
| 372 | | ||
Loans discharged in Chapter 7 bankruptcy (2) | 64 | |
| 74 | | ||
Total modifications | $ | 519 | |
| $ | 533 | |
(1) | Includes other modifications such as term or payment extensions and repayment plans. During the three months ended March 31, 2018 , this included $168 million of modifications related to the 2017 hurricanes that met the definition of a TDR. These modifications had been written down to their net realizable value less costs to sell or were fully insured as of March 31, 2018. |
(2) | Includes loans discharged in Chapter 7 bankruptcy with no change in repayment terms that are classified as TDRs. |
The table below presents the carrying value of consumer real estate loans that entered into payment default during the three months ended March 31, 2018 and 2017 that were modified in a TDR during the 12 months preceding payment default. A payment default for consumer real estate TDRs is recognized when a borrower has missed three monthly payments (not necessarily consecutively) since modification.
|
|
|
| ||||
Consumer Real Estate – TDRs Entering Payment Default that were Modified During the Preceding 12 Months | |||||||
|
|
|
| ||||
| Three Months Ended March 31 | ||||||
(Dollars in millions) | 2018 |
| 2017 | ||||
Modifications under government programs | $ | 13 | |
| $ | 26 | |
Modifications under proprietary programs | 31 | |
| 34 | | ||
Loans discharged in Chapter 7 bankruptcy (1) | 23 | |
| 62 | | ||
Trial modifications (2) | 45 | |
| 212 | | ||
Total modifications | $ | 112 | |
| $ | 334 | |
(1) | Includes loans discharged in Chapter 7 bankruptcy with no change in repayment terms that are classified as TDRs. |
(2) | Includes trial modification offers to which the customer did not respond. |
Credit Card and Other Consumer
Impaired loans within the Credit Card and Other Consumer portfolio segment consist entirely of loans that have been modified in TDRs. The Corporation seeks to assist customers that are experiencing financial difficulty by modifying loans while ensuring compliance with federal, local and international laws and guidelines. Credit card and other consumer loan modifications generally involve reducing the interest rate on the account, placing the customer on a fixed payment plan not exceeding 60 months and canceling the customer's available line of credit, all of which are considered TDRs. The Corporation makes loan modifications directly with borrowers for debt held only by the Corporation (internal programs). Additionally, the Corporation makes loan modifications for borrowers working with third-party renegotiation agencies that
provide solutions to customers' entire unsecured debt structures (external programs). The Corporation classifies other secured consumer loans that have been discharged in Chapter 7 bankruptcy as TDRs which are written down to collateral value and placed on nonaccrual status no later than the time of discharge. For more information on the regulatory guidance on loans discharged in Chapter 7 bankruptcy, see Nonperforming Loans and Leases in this Note.
The table below provides the unpaid principal balance, carrying value and related allowance at March 31, 2018 and December 31, 2017 , and the average carrying value and interest income recognized for the three months ended March 31, 2018 and 2017 on TDRs within the Credit Card and Other Consumer portfolio segment.
75 Bank of America |
|
|
|
|
|
|
|
|
|
|
|
|
|
|
| ||||||||||||
Impaired Loans – Credit Card and Other Consumer |
|
| ||||||||||||||||||||||
|
|
|
|
|
|
|
|
|
|
|
|
| ||||||||||||
|
| Unpaid Balance |
| Carrying Value (1) |
| Related Allowance |
| Unpaid Balance |
| Carrying Value (1) |
| Related Allowance | ||||||||||||
(Dollars in millions) |
| March 31, 2018 |
| December 31, 2017 | ||||||||||||||||||||
With no recorded allowance |
|
| |
|
| |
|
| |
|
|
|
|
|
| |||||||||
Direct/Indirect consumer |
| $ | 59 | |
| $ | 28 | |
| $ | - | |
| $ | 58 | |
| $ | 28 | |
| $ | - | |
With an allowance recorded |
|
| |
|
| |
|
| |
|
|
|
|
|
| |||||||||
U.S. credit card |
| $ | 465 | |
| $ | 472 | |
| $ | 128 | |
| $ | 454 | |
| $ | 461 | |
| $ | 125 | |
Direct/Indirect consumer |
| 1 | |
| 1 | |
| - | |
| 1 | |
| 1 | |
| - | | ||||||
Total |
|
| |
|
| |
|
| |
|
| |
|
| |
|
| |||||||
U.S. credit card |
| $ | 465 | |
| $ | 472 | |
| $ | 128 | |
| $ | 454 | |
| $ | 461 | |
| $ | 125 | |
Direct/Indirect consumer |
| 60 | |
| 29 | |
| - | |
| 59 | |
| 29 | |
| - | | ||||||
|
|
|
|
|
|
|
|
|
|
|
|
| ||||||||||||
|
|
|
|
|
| Average |
| Interest |
| Average |
| Interest | ||||||||||||
|
|
|
|
|
| Three Months Ended March 31 | ||||||||||||||||||
|
|
|
| 2018 |
| 2017 | ||||||||||||||||||
With no recorded allowance |
|
|
|
|
|
|
|
|
|
|
|
| ||||||||||||
Direct/Indirect consumer |
|
|
|
|
| $ | 27 | |
| $ | - | |
| $ | 19 | |
| $ | - | | ||||
With an allowance recorded |
|
|
|
|
|
| |
|
| |
|
|
|
| ||||||||||
U.S. credit card |
|
|
|
|
| $ | 465 | |
| $ | 6 | |
| $ | 477 | |
| $ | 6 | | ||||
Non-U.S. credit card (3) |
|
|
|
|
| - | |
| - | |
| 102 | |
| 1 | | ||||||||
Direct/Indirect consumer |
|
|
|
|
| 1 | |
| - | |
| 3 | |
| - | | ||||||||
Total |
|
|
|
|
|
| |
|
| |
|
|
|
| ||||||||||
U.S. credit card |
|
|
|
|
| $ | 465 | |
| $ | 6 | |
| $ | 477 | |
| $ | 6 | | ||||
Non-U.S. credit card (3) |
|
|
|
|
| - | |
| - | |
| 102 | |
| 1 | | ||||||||
Direct/Indirect consumer |
|
|
|
|
| 28 | |
| - | |
| 22 | |
| - | | ||||||||
(1) | Includes accrued interest and fees. |
(2) | Interest income recognized includes interest accrued and collected on the outstanding balances of accruing impaired loans as well as interest cash collections on nonaccruing impaired loans for which the principal is considered collectible. |
(3) | In the second quarter of 2017, the Corporation sold its non-U.S. consumer credit card business. |
The table below provides information on the Corporation's primary modification programs for the Credit Card and Other Consumer TDR portfolio at March 31, 2018 and December 31, 2017 .
|
|
|
|
|
|
|
|
|
|
|
| ||||||||||||
Credit Card and Other Consumer – TDRs by Program Type | |||||||||||||||||||||||
|
|
|
|
|
| ||||||||||||||||||
| U.S. Credit Card |
| Direct/Indirect Consumer |
| Total TDRs by Program Type | ||||||||||||||||||
(Dollars in millions) | March 31 |
| December 31 |
| March 31 |
| December 31 |
| March 31 |
| December 31 | ||||||||||||
Internal programs | $ | 212 | |
| $ | 203 | |
| $ | 1 | |
| $ | 1 | |
| $ | 213 | |
| $ | 204 | |
External programs | 259 | |
| 257 | |
| - | |
| - | |
| 259 | |
| 257 | | ||||||
Other | 1 | |
| 1 | |
| 28 | |
| 28 | |
| 29 | |
| 29 | | ||||||
Total | $ | 472 | |
| $ | 461 | |
| $ | 29 | |
| $ | 29 | |
| $ | 501 | |
| $ | 490 | |
Percent of balances current or less than 30 days past due | 86.27 | % |
| 86.92 | % |
| 90.66 | % |
| 88.16 | % |
| 86.50 | % |
| 87.00 | % | ||||||
The table below provides information on the Corporation's Credit Card and Other Consumer TDR portfolio including the March 31, 2018 and 2017 unpaid principal balance, carrying value, and average pre- and post-modification interest rates of loans that were modified in TDRs during the three months ended March 31, 2018 and 2017 , and net charge-offs recorded during the period in which the modification occurred.
|
|
|
|
|
|
|
| ||||||
Credit Card and Other Consumer – TDRs Entered into During the Three Months Ended March 31, 2018 and 2017 | |||||||||||||
|
|
|
|
|
|
|
| ||||||
| Unpaid Principal Balance |
| Carrying Value (1) |
| Pre- Modification Interest Rate |
| Post- Modification Interest Rate | ||||||
(Dollars in millions) | March 31, 2018 | ||||||||||||
U.S. credit card | $ | 74 | |
| $ | 80 | |
| 18.83 | % |
| 5.20 | % |
Direct/Indirect consumer | 17 | |
| 10 | |
| 4.98 | |
| 4.67 | | ||
Total (2) | $ | 91 | |
| $ | 90 | |
| 17.24 | |
| 5.14 | |
|
|
|
|
|
|
|
| ||||||
| March 31, 2017 | ||||||||||||
U.S. credit card | $ | 52 | |
| $ | 55 | |
| 18.01 | % |
| 5.30 | % |
Non-U.S. credit card (3) | 34 | |
| 40 | |
| 23.89 | |
| 0.34 | | ||
Direct/Indirect consumer | 10 | |
| 6 | |
| 4.08 | |
| 4.04 | | ||
Total (2) | $ | 96 | |
| $ | 101 | |
| 19.51 | |
| 3.28 | |
(1) | Includes accrued interest and fees. |
(2) | Net charge-offs were $8 million and $6 million for the three months ended March 31, 2018 and 2017 . |
(3) | In the second quarter of 2017, the Corporation sold its non-U.S. consumer credit card business. |
|
| Bank of America 76 |
Credit card and other consumer loans are deemed to be in payment default during the quarter in which a borrower misses the second of two consecutive payments. Payment defaults are one of the factors considered when projecting future cash flows in the calculation of the allowance for loan and lease losses for impaired credit card and other consumer loans. Based on historical experience, the Corporation estimates that 13 percent of new U.S. credit card TDRs and 18 percent of new direct/indirect consumer TDRs may be in payment default within 12 months after modification. Loans that entered into payment default during the three months ended March 31, 2018 and 2017 that had been modified in a TDR during the preceding 12 months were $8 million and $7 million for U.S. credit card, $0 and $32 million for non-U.S. credit card, and $3 million and $1 million for direct/indirect consumer.
Commercial Loans
Impaired commercial loans include nonperforming loans and TDRs (both performing and nonperforming). For more information on
impaired commercial loans, see Note 4 – Outstanding Loans and Leases to the Consolidated Financial Statements of the Corporation's 2017 Annual Report on Form 10-K .
At March 31, 2018 and December 31, 2017 , remaining commitments to lend additional funds to debtors whose terms have been modified in a commercial loan TDR were $199 million and $205 million .
Commercial foreclosed properties totaled $52 million at both March 31, 2018 and December 31, 2017 .
The table below provides information on impaired loans in the Commercial loan portfolio segment including the unpaid principal balance, carrying value and related allowance at March 31, 2018 and December 31, 2017 , and the average carrying value and interest income recognized for the three months ended March 31, 2018 and 2017 . Certain impaired commercial loans do not have a related allowance as the valuation of these impaired loans exceeded the carrying value, which is net of previously recorded charge-offs.
|
|
|
|
|
|
|
|
|
|
|
| ||||||||||||
Impaired Loans – Commercial |
|
| |||||||||||||||||||||
|
|
|
|
|
|
|
|
|
|
|
| ||||||||||||
| Unpaid Balance |
| Carrying Value |
| Related Allowance |
| Unpaid Balance |
| Carrying Value |
| Related Allowance | ||||||||||||
(Dollars in millions) | March 31, 2018 |
| December 31, 2017 | ||||||||||||||||||||
With no recorded allowance |
| |
|
| |
|
| |
|
| |
|
| |
|
| |||||||
U.S. commercial | $ | 814 | |
| $ | 772 | |
| $ | - | |
| $ | 576 | |
| $ | 571 | |
| $ | - | |
Non-U.S. commercial | 113 | |
| 113 | |
| - | |
| 14 | |
| 11 | |
| - | | ||||||
Commercial real estate | 62 | |
| 58 | |
| - | |
| 83 | |
| 80 | |
| - | | ||||||
Commercial lease financing | 11 | |
| 11 | |
| - | |
| - | |
| - | |
| - | | ||||||
With an allowance recorded |
|
|
|
|
|
|
|
|
|
|
| | |||||||||||
U.S. commercial | $ | 1,448 | |
| $ | 1,206 | |
| $ | 137 | |
| $ | 1,393 | |
| $ | 1,109 | |
| $ | 98 | |
Non-U.S. commercial | 394 | |
| 362 | |
| 72 | |
| 528 | |
| 507 | |
| 58 | | ||||||
Commercial real estate | 102 | |
| 18 | |
| 2 | |
| 133 | |
| 41 | |
| 4 | | ||||||
Commercial lease financing | 15 | |
| 4 | |
| - | |
| 20 | |
| 18 | |
| 3 | | ||||||
U.S. small business commercial (1) | 87 | |
| 74 | |
| 29 | |
| 84 | |
| 70 | |
| 27 | | ||||||
Total |
| |
|
| |
|
| |
|
|
|
|
|
| |||||||||
U.S. commercial | $ | 2,262 | |
| $ | 1,978 | |
| $ | 137 | |
| $ | 1,969 | |
| $ | 1,680 | |
| $ | 98 | |
Non-U.S. commercial | 507 | |
| 475 | |
| 72 | |
| 542 | |
| 518 | |
| 58 | | ||||||
Commercial real estate | 164 | |
| 76 | |
| 2 | |
| 216 | |
| 121 | |
| 4 | | ||||||
Commercial lease financing | 26 | |
| 15 | |
| - | |
| 20 | |
| 18 | |
| 3 | | ||||||
U.S. small business commercial (1) | 87 | |
| 74 | |
| 29 | |
| 84 | |
| 70 | |
| 27 | | ||||||
|
|
|
|
|
|
|
|
|
|
|
| ||||||||||||
|
|
|
|
| Average |
| Interest |
| Average |
| Interest | ||||||||||||
|
|
|
|
| Three Months Ended March 31 | ||||||||||||||||||
|
|
| 2018 |
| 2017 | ||||||||||||||||||
With no recorded allowance |
| |
|
| |
|
| |
|
| |
|
|
|
| ||||||||
U.S. commercial |
|
|
|
| $ | 672 | |
| $ | 4 | |
| $ | 882 | |
| $ | 3 | | ||||
Non-U.S. commercial |
|
|
|
| 62 | |
| 2 | |
| 108 | |
| - | | ||||||||
Commercial real estate |
|
|
|
| 69 | |
| - | |
| 60 | |
| - | | ||||||||
Commercial lease financing |
|
|
|
| 6 | |
| - | |
| - | |
| - | | ||||||||
With an allowance recorded |
|
|
|
|
|
|
|
|
|
|
| ||||||||||||
U.S. commercial |
|
|
|
| $ | 1,105 | |
| $ | 11 | |
| $ | 1,487 | |
| $ | 9 | | ||||
Non-U.S. commercial |
|
|
|
| 445 | |
| 2 | |
| 453 | |
| 3 | | ||||||||
Commercial real estate |
|
|
|
| 36 | |
| - | |
| 76 | |
| 1 | | ||||||||
Commercial lease financing |
|
|
|
| 11 | |
| - | |
| 3 | |
| - | | ||||||||
U.S. small business commercial (1) |
|
|
|
| 75 | |
| - | |
| 74 | |
| - | | ||||||||
Total |
|
|
|
|
| |
|
| |
|
| |
|
| | ||||||||
U.S. commercial |
|
|
|
| $ | 1,777 | |
| $ | 15 | |
| $ | 2,369 | |
| $ | 12 | | ||||
Non-U.S. commercial |
|
|
|
| 507 | |
| 4 | |
| 561 | |
| 3 | | ||||||||
Commercial real estate |
|
|
|
| 105 | |
| - | |
| 136 | |
| 1 | | ||||||||
Commercial lease financing |
|
|
|
| 17 | |
| - | |
| 3 | |
| - | | ||||||||
U.S. small business commercial (1) |
|
|
|
| 75 | |
| - | |
| 74 | |
| - | | ||||||||
(1) | Includes U.S. small business commercial renegotiated TDR loans and related allowance. |
(2) | Interest income recognized includes interest accrued and collected on the outstanding balances of accruing impaired loans as well as interest cash collections on nonaccruing impaired loans for which the principal is considered collectible. |
77 Bank of America |
|
|
The table below presents the March 31, 2018 and 2017 unpaid principal balance and carrying value of commercial loans that were modified as TDRs during the three months ended March 31, 2018 and 2017 , and net charge-offs that were recorded during the period in which the modification occurred. The table below includes loans that were initially classified as TDRs during the period and also loans that had previously been classified as TDRs and were modified again during the period.
|
|
|
| ||||
Commercial – TDRs Entered into During the Three Months Ended March 31, 2018 and 2017 | |||||||
|
| ||||||
| Unpaid Principal Balance |
| Carrying Value | ||||
(Dollars in millions) | March 31, 2018 | ||||||
U.S. commercial | $ | 618 | |
| $ | 550 | |
Non-U.S. commercial | 331 | |
| 331 | | ||
Commercial lease financing | 2 | |
| 1 | | ||
U.S. small business commercial (1) | 3 | |
| 3 | | ||
Total (2) | $ | 954 | |
| $ | 885 | |
|
|
|
| ||||
| March 31, 2017 | ||||||
U.S. commercial | $ | 468 | |
| $ | 440 | |
Commercial real estate | 15 | |
| 9 | | ||
U.S. small business commercial (1) | 2 | |
| 2 | | ||
Total (2) | $ | 485 | |
| $ | 451 | |
(1) | U.S. small business commercial TDRs are comprised of renegotiated small business card loans. |
(2) | Net charge-offs were $17 million and $41 million for the three months ended March 31, 2018 and 2017 . |
A commercial TDR is generally deemed to be in payment default when the loan is 90 days or more past due, including delinquencies that were not resolved as part of the modification. U.S. small business commercial TDRs are deemed to be in payment default during the quarter in which a borrower misses the second of two consecutive payments. Payment defaults are one of the factors considered when projecting future cash flows, along with observable market prices or fair value of collateral when measuring the allowance for loan and lease losses. TDRs that were in payment default had a carrying value of $139 million and $111 million for
U.S. commercial, $18 million and $33 million for commercial real estate and $4 million and $0 for commercial lease financing at March 31, 2018 and 2017 .
Purchased Credit-impaired Loans
The table below shows activity for the accretable yield on PCI loans. The reclassifications from nonaccretable difference in the three months ended March 31, 2018 were primarily due to an increase in the expected principal and interest cash flows due to lower default estimates and the rising interest rate environment.
|
|
| ||
Rollforward of Accretable Yield |
|
| ||
|
|
| ||
(Dollars in millions) |
| Three Months Ended March 31, 2018 | ||
Accretable yield, January 1, 2018 |
| $ | 2,789 | |
Accretion |
| (130 | ) | |
Disposals/transfers |
| (107 | ) | |
Reclassifications from nonaccretable difference |
| 178 | | |
Accretable yield, March 31, 2018 |
| $ | 2,730 | |
During the three months ended March 31, 2018 , the Corporation sold PCI loans with a carrying value of $109 million . There were no sales in the three months ended March 31, 2017 . For more information on PCI loans, see Note 1 – Summary of Significant Accounting Principles and Note 4 – Outstanding Loans and Leases to the Consolidated Financial Statements of the Corporation's 2017 Annual Report on Form 10-K , and for the carrying value and valuation allowance for PCI loans, see Note 6 – Allowance for Credit Losses .
Loans Held-for-sale
The Corporation had LHFS of $9.2 billion and $11.4 billion at March 31, 2018 and December 31, 2017 . Cash and non-cash proceeds from sales and paydowns of loans originally classified as LHFS were $9.8 billion and $7.7 billion for the three months ended March 31, 2018 and 2017 . Cash used for originations and purchases of LHFS totaled $5.7 billion and $13.3 billion for the three months ended March 31, 2018 and 2017 .
|
| Bank of America 78 |
NOTE 6
Allowance for Credit Losses
The table below summarizes the changes in the allowance for credit losses by portfolio segment for the three months ended March 31, 2018 and 2017 .
|
|
|
|
|
|
|
| ||||||||
| Consumer |
| Credit Card and Other Consumer |
| Commercial |
| Total | ||||||||
(Dollars in millions) | Three Months Ended March 31, 2018 | ||||||||||||||
Allowance for loan and lease losses, January 1 | $ | 1,720 | |
| $ | 3,663 | |
| $ | 5,010 | |
| $ | 10,393 | |
Loans and leases charged off | (174 | ) |
| (1,006 | ) |
| (116 | ) |
| (1,296 | ) | ||||
Recoveries of loans and leases previously charged off | 147 | |
| 203 | |
| 35 | |
| 385 | | ||||
Net charge-offs | (27 | ) |
| (803 | ) |
| (81 | ) |
| (911 | ) | ||||
Write-offs of PCI loans (2) | (35 | ) |
| - | |
| - | |
| (35 | ) | ||||
Provision for loan and lease losses (3) | (128 | ) |
| 876 | |
| 81 | |
| 829 | | ||||
Other (4) | - | |
| (16 | ) |
| - | |
| (16 | ) | ||||
Allowance for loan and lease losses, March 31 | 1,530 | |
| 3,720 | |
| 5,010 | |
| 10,260 | | ||||
Reserve for unfunded lending commitments, January 1 | - | |
| - | |
| 777 | |
| 777 | | ||||
Provision for unfunded lending commitments | - | |
| - | |
| 5 | |
| 5 | | ||||
Reserve for unfunded lending commitments, March 31 | - | |
| - | |
| 782 | |
| 782 | | ||||
Allowance for credit losses, March 31 | $ | 1,530 | |
| $ | 3,720 | |
| $ | 5,792 | |
| $ | 11,042 | |
|
|
|
|
|
|
|
| ||||||||
| Three Months Ended March 31, 2017 | ||||||||||||||
Allowance for loan and lease losses, January 1 (5) | $ | 2,750 | |
| $ | 3,229 | |
| $ | 5,258 | |
| $ | 11,237 | |
Loans and leases charged off | (204 | ) |
| (946 | ) |
| (160 | ) |
| (1,310 | ) | ||||
Recoveries of loans and leases previously charged off | 123 | |
| 200 | |
| 53 | |
| 376 | | ||||
Net charge-offs (6) | (81 | ) |
| (746 | ) |
| (107 | ) |
| (934 | ) | ||||
Write-offs of PCI loans (2) | (33 | ) |
| - | |
| - | |
| (33 | ) | ||||
Provision for loan and lease losses (3) | (71 | ) |
| 843 | |
| 68 | |
| 840 | | ||||
Other (4) | - | |
| 3 | |
| (1 | ) |
| 2 | | ||||
Allowance for loan and lease losses, March 31 (5) | 2,565 | |
| 3,329 | |
| 5,218 | |
| 11,112 | | ||||
Reserve for unfunded lending commitments, January 1 | - | |
| - | |
| 762 | |
| 762 | | ||||
Provision for unfunded lending commitments | - | |
| - | |
| (5 | ) |
| (5 | ) | ||||
Reserve for unfunded lending commitments, March 31 | - | |
| - | |
| 757 | |
| 757 | | ||||
Allowance for credit losses, March 31 (5) | $ | 2,565 | |
| $ | 3,329 | |
| $ | 5,975 | |
| $ | 11,869 | |
(1) | Includes valuation allowance associated with the PCI loan portfolio. |
(2) | Includes write-offs associated with the sale of PCI loans of $16 million and $0 during the three months ended March 31, 2018 and 2017 . |
(3) | Includes provision benefit associated with the PCI loan portfolio of $11 million and provision expense of $68 million during the three months ended March 31, 2018 and 2017 . |
(4) | Primarily represents the net impact of portfolio sales, consolidations and deconsolidations, foreign currency translation adjustments, transfers to held for sale and certain other reclassifications. |
(5) | Excludes $242 million and $243 million at March 31, 2017 and January 1, 2017 of allowance for loan and lease losses related to the non-U.S. credit card loan portfolio, which was sold in the second quarter of 2017. |
(6) | Includes net charge-offs of $44 million related to the non-U.S. credit card loan portfolio. See footnote 5 for more information. |
79 Bank of America |
|
|
The table below presents the allowance and the carrying value of outstanding loans and leases by portfolio segment at March 31, 2018 and December 31, 2017 .
|
|
|
|
|
|
|
| ||||||||
Allowance and Carrying Value by Portfolio Segment |
|
|
|
|
|
| |||||||||
|
|
|
|
|
|
|
| ||||||||
| Consumer |
| Credit Card and Other Consumer |
| Commercial |
| Total | ||||||||
(Dollars in millions) | March 31, 2018 | ||||||||||||||
Impaired loans and troubled debt restructurings (1) |
| |
|
| |
|
| |
|
| | ||||
Allowance for loan and lease losses | $ | 338 | |
| $ | 128 | |
| $ | 240 | |
| $ | 706 | |
Carrying value (2) | 10,872 | |
| 501 | |
| 2,618 | |
| 13,991 | | ||||
Allowance as a percentage of carrying value | 3.11 | % |
| 25.55 | % |
| 9.17 | % |
| 5.05 | % | ||||
Loans collectively evaluated for impairment |
| |
|
| |
|
| |
|
| | ||||
Allowance for loan and lease losses | $ | 950 | |
| $ | 3,592 | |
| $ | 4,770 | |
| $ | 9,312 | |
Carrying value (2, 3) | 238,413 | |
| 186,586 | |
| 478,964 | |
| 903,963 | | ||||
Allowance as a percentage of carrying value (3) | 0.40 | % |
| 1.93 | % |
| 1.00 | % |
| 1.03 | % | ||||
Purchased credit-impaired loans |
| |
|
|
|
| |
|
| | |||||
Valuation allowance | $ | 242 | |
| n/a | |
| n/a | |
| $ | 242 | | ||
Carrying value gross of valuation allowance | 10,135 | |
| n/a | |
| n/a | |
| 10,135 | | ||||
Valuation allowance as a percentage of carrying value | 2.39 | % |
| n/a | |
| n/a | |
| 2.39 | % | ||||
Total |
| |
|
| |
|
| |
|
| | ||||
Allowance for loan and lease losses | $ | 1,530 | |
| $ | 3,720 | |
| $ | 5,010 | |
| $ | 10,260 | |
Carrying value (2, 3) | 259,420 | |
| 187,087 | |
| 481,582 | |
| 928,089 | | ||||
Allowance as a percentage of carrying value (3) | 0.59 | % |
| 1.99 | % |
| 1.04 | % |
| 1.11 | % | ||||
|
|
|
|
|
|
|
| ||||||||
| December 31, 2017 | ||||||||||||||
Impaired loans and troubled debt restructurings (1) |
| |
|
| |
|
| |
|
| | ||||
Allowance for loan and lease losses | $ | 348 | |
| $ | 125 | |
| $ | 190 | |
| $ | 663 | |
Carrying value (2) | 12,554 | |
| 490 | |
| 2,407 | |
| 15,451 | | ||||
Allowance as a percentage of carrying value | 2.77 | % |
| 25.51 | % |
| 7.89 | % |
| 4.29 | % | ||||
Loans collectively evaluated for impairment |
| |
|
| |
|
| |
|
| |||||
Allowance for loan and lease losses | $ | 1,083 | |
| $ | 3,538 | |
| $ | 4,820 | |
| $ | 9,441 | |
Carrying value (2, 3) | 238,284 | |
| 192,303 | |
| 474,284 | |
| 904,871 | | ||||
Allowance as a percentage of carrying value (3) | 0.45 | % |
| 1.84 | % |
| 1.02 | % |
| 1.04 | % | ||||
Purchased credit-impaired loans |
| |
|
|
|
| |
|
| ||||||
Valuation allowance | $ | 289 | |
| n/a | |
| n/a | |
| $ | 289 | | ||
Carrying value gross of valuation allowance | 10,717 | |
| n/a | |
| n/a | |
| 10,717 | | ||||
Valuation allowance as a percentage of carrying value | 2.70 | % |
| n/a | |
| n/a | |
| 2.70 | % | ||||
Total |
| |
|
| |
|
| |
|
| |||||
Allowance for loan and lease losses | $ | 1,720 | |
| $ | 3,663 | |
| $ | 5,010 | |
| $ | 10,393 | |
Carrying value (2, 3) | 261,555 | |
| 192,793 | |
| 476,691 | |
| 931,039 | | ||||
Allowance as a percentage of carrying value (3) | 0.66 | % |
| 1.90 | % |
| 1.05 | % |
| 1.12 | % | ||||
(1) | Impaired loans include nonperforming commercial loans and all TDRs, including both commercial and consumer TDRs. Impaired loans exclude nonperforming consumer loans unless they are TDRs, and all consumer and commercial loans accounted for under the fair value option. |
(2) | Amounts are presented gross of the allowance for loan and lease losses. |
(3) | Outstanding loan and lease balances and ratios do not include loans accounted for under the fair value option of $6.0 billion and $5.7 billion at March 31, 2018 and December 31, 2017 . |
n/a = not applicable
|
| Bank of America 80 |
NOTE 7
Securitizations and Other Variable Interest Entities
The Corporation utilizes VIEs in the ordinary course of business to support its own and its customers' financing and investing needs. The tables in this Note present the assets, liabilities and maximum loss exposure of consolidated and unconsolidated VIEs at March 31, 2018 and December 31, 2017 where the Corporation has continuing involvement with transferred assets or if the Corporation otherwise has a variable interest in the VIE. For additional information on the Corporation's use of VIEs and related maximum loss exposure, see Note 1 – Summary of Significant Accounting Principles and Note 6 – Securitizations and Other Variable Interest Entities to the Consolidated Financial Statements of the Corporation's 2017 Annual Report on Form 10-K .
The Corporation invests in ABS issued by third-party VIEs with which it has no other form of involvement and enters into certain
commercial lending arrangements that may also incorporate the use of VIEs, for example to hold collateral. These securities and loans are included in Note 4 – Securities or Note 5 – Outstanding Loans and Leases . In addition, the Corporation uses VIEs such as trust preferred securities trusts in connection with its funding activities. For more information, see Note 11 – Long-term Debt to the Consolidated Financial Statements of the Corporation's 2017
Annual Report on Form 10-K . These VIEs, which are generally not consolidated by the Corporation, as applicable, are not included in the tables herein.
Except as described below, the Corporation did not provide financial support to consolidated or unconsolidated VIEs during the three months ended March 31, 2018 or the year ended December 31, 2017 that it was not previously contractually required to provide, nor does it intend to do so.
First-lien Mortgage Securitizations
First-lien Mortgages
As part of its mortgage banking activities, the Corporation securitizes a portion of the first-lien residential mortgage loans it originates or purchases from third parties. Except as described below and in Note 10 – Commitments and Contingencies , the Corporation does not provide guarantees or recourse to the securitization trusts other than standard representations and warranties.
The table below summarizes select information related to first-lien mortgage securitizations for the three months ended March 31, 2018 and 2017 .
|
|
|
|
|
|
|
| ||||||||
First-lien Mortgage Securitizations |
|
|
|
|
|
| |||||||||
|
|
|
|
|
|
|
| ||||||||
| Residential Mortgage - Agency |
| Commercial Mortgage | ||||||||||||
| Three Months Ended March 31 | ||||||||||||||
(Dollars in millions) | 2018 |
| 2017 |
| 2018 |
| 2017 | ||||||||
Cash proceeds from new securitizations (1) | $ | 1,686 | |
| $ | 4,656 | |
| $ | 512 | |
| $ | 609 | |
Gains on securitizations (2) | 18 | |
| 39 | |
| 18 | |
| 18 | | ||||
Repurchases from securitization trusts (3) | 501 | |
| 872 | |
| - | |
| - | | ||||
(1) | The Corporation transfers residential mortgage loans to securitizations sponsored by the GSEs or Government National Mortgage Association (GNMA) in the normal course of business and receives RMBS in exchange which may then be sold into the market to third-party investors for cash proceeds. |
(2) | A majority of the first-lien residential mortgage loans securitized are initially classified as LHFS and accounted for under the fair value option. Gains recognized on these LHFS prior to securitization, which totaled $24 million and $90 million , net of hedges, during the three months ended March 31, 2018 and 2017 , are not included in the table above. |
(3) | The Corporation may have the option to repurchase delinquent loans out of securitization trusts, which reduces the amount of servicing advances it is required to make. The Corporation may also repurchase loans from securitization trusts to perform modifications. Repurchased loans include FHA-insured mortgages collateralizing GNMA securities. |
In addition to cash proceeds as reported in the table above, the Corporation received securities with an initial fair value of $120 million and $275 million in connection with first-lien mortgage securitizations for the three months ended March 31, 2018 and 2017 . The receipt of these securities represents non-cash operating and investing activities and, accordingly, is not reflected in the Consolidated Statement of Cash Flows. Substantially all of these securities were initially classified as Level 2 assets within the fair value hierarchy. During the three months ended March 31, 2018 and 2017 , there were no changes to the initial classification.
The Corporation recognizes consumer MSRs from the sale or securitization of consumer real estate loans. The unpaid principal balance of loans serviced for investors, including residential mortgage and home equity loans, totaled $259.7 billion and
$316.1 billion at March 31, 2018 and 2017 . Servicing fee and ancillary fee income on serviced loans was $197 million and $245 million during the three months ended March 31, 2018 and 2017 . Servicing advances on serviced loans, including loans serviced for others and loans held for investment, were $4.1 billion and $4.5 billion at March 31, 2018 and December 31, 2017 . For more information on MSRs, see Note 14 – Fair Value Measurements .
During the three months ended March 31, 2018 and 2017 , there were no deconsolidations of agency residential mortgage securitizations.
The following table summarizes select information related to first-lien mortgage securitization trusts in which the Corporation held a variable interest at March 31, 2018 and December 31, 2017 .
81 Bank of America |
|
|
|
|
|
|
|
|
|
|
|
|
|
|
|
|
| ||||||||||||||||||||
First-lien Mortgage VIEs |
|
|
|
|
|
|
|
|
|
|
| |||||||||||||||||||||||
| Residential Mortgage |
|
| |
| | ||||||||||||||||||||||||||||
|
| |
| |
| Non-agency |
|
| |
| | |||||||||||||||||||||||
| Agency |
| Prime |
| Subprime |
| Alt-A |
| Commercial Mortgage | |||||||||||||||||||||||||
(Dollars in millions) | March 31 | December 31 |
| March 31 | December 31 |
| March 31 | December 31 |
| March 31 | December 31 |
| March 31 | December 31 | ||||||||||||||||||||
Unconsolidated VIEs |
| |
| |
|
| |
| |
|
| |
| |
|
| |
| |
|
| |
| | ||||||||||
Maximum loss exposure (1) | $ | 18,120 | | $ | 19,110 | |
| $ | 652 | | $ | 689 | |
| $ | 2,659 | | $ | 2,643 | |
| $ | 419 | | $ | 403 | |
| $ | 565 | | $ | 585 | |
On-balance sheet assets |
| |
| |
|
| |
| |
|
| |
| |
|
| |
| |
|
| |
| | ||||||||||
Senior securities: |
| |
| |
|
| |
| |
|
| |
| |
|
| |
| |
|
| |
| | ||||||||||
Trading account assets | $ | 658 | | $ | 716 | |
| $ | 7 | | $ | 6 | |
| $ | 15 | | $ | 10 | |
| $ | 74 | | $ | 50 | |
| $ | 77 | | $ | 108 | |
Debt securities carried at fair value | 14,214 | | 15,036 | |
| 447 | | 477 | |
| 2,204 | | 2,221 | |
| 343 | | 351 | |
| - | | - | | ||||||||||
Held-to-maturity securities | 3,248 | | 3,348 | |
| - | | - | |
| - | | - | |
| - | | - | |
| 298 | | 274 | | ||||||||||
Subordinate securities | - | | - | |
| 6 | | 5 | |
| 64 | | 38 | |
| 2 | | 2 | |
| 64 | | 69 | | ||||||||||
Residual interests | - | | - | |
| - | | - | |
| - | | - | |
| - | | - | |
| 24 | | 19 | | ||||||||||
All other assets (2) | - | | 10 | |
| - | | - | |
| - | | - | |
| - | | - | |
| - | | - | | ||||||||||
Total retained positions | $ | 18,120 | | $ | 19,110 | |
| $ | 460 | | $ | 488 | |
| $ | 2,283 | | $ | 2,269 | |
| $ | 419 | | $ | 403 | |
| $ | 463 | | $ | 470 | |
Principal balance outstanding (3) | $ | 216,493 | | $ | 232,761 | |
| $ | 10,305 | | $ | 10,549 | |
| $ | 10,118 | | $ | 10,254 | |
| $ | 26,865 | | $ | 28,129 | |
| $ | 26,092 | | $ | 26,504 | |
|
|
|
|
|
|
|
|
|
|
|
|
|
|
| ||||||||||||||||||||
Consolidated VIEs |
| |
| |
|
| |
| |
|
| |
| |
|
| |
| |
|
| |
| | ||||||||||
Maximum loss exposure (1) | $ | 13,872 | | $ | 14,502 | |
| $ | 662 | | $ | 571 | |
| $ | - | | $ | - | |
| $ | - | | $ | - | |
| $ | - | | $ | - | |
On-balance sheet assets |
| |
| |
|
| |
| |
|
| |
| |
|
| |
| |
|
| |
| | ||||||||||
Trading account assets | $ | 203 | | $ | 232 | |
| $ | 683 | | $ | 571 | |
| $ | - | | $ | - | |
| $ | - | | $ | - | |
| $ | - | | $ | - | |
Loans and leases, net | 13,476 | | 14,030 | |
| - | | - | |
| - | | - | |
| - | | - | |
| - | | - | | ||||||||||
All other assets | 194 | | 240 | |
| - | | - | |
| - | | - | |
| - | | - | |
| - | | - | | ||||||||||
Total assets | $ | 13,873 | | $ | 14,502 | |
| $ | 683 | | $ | 571 | |
| $ | - | | $ | - | |
| $ | - | | $ | - | |
| $ | - | | $ | - | |
On-balance sheet liabilities |
| |
| |
|
| |
| |
|
| |
| |
|
| |
| |
|
| |
| | ||||||||||
Long-term debt | $ | 1 | | $ | - | |
| $ | 21 | | $ | - | |
| $ | - | | $ | - | |
| $ | - | | $ | - | |
| $ | - | | $ | - | |
All other liabilities | 3 | | 3 | |
| - | | - | |
| - | | - | |
| - | | - | |
| - | | - | | ||||||||||
Total liabilities | $ | 4 | | $ | 3 | |
| $ | 21 | | $ | - | |
| $ | - | | $ | - | |
| $ | - | | $ | - | |
| $ | - | | $ | - | |
(1) | Maximum loss exposure includes obligations under loss-sharing reinsurance and other arrangements for non-agency residential mortgage and commercial mortgage securitizations, but excludes the reserve for representations and warranties obligations and corporate guarantees and also excludes servicing advances and other servicing rights and obligations. For more information, see Note 10 – Commitments and Contingencies and Note 14 – Fair Value Measurements . |
(2) | Not included in the table above are all other assets of $65 million and $148 million , representing the unpaid principal balance of mortgage loans eligible for repurchase from unconsolidated residential mortgage securitization VIEs, principally guaranteed by GNMA, and all other liabilities of $65 million and $148 million , representing the principal amount that would be payable to the securitization VIEs if the Corporation was to exercise the repurchase option, at March 31, 2018 and December 31, 2017 . |
(3) | Principal balance outstanding includes loans where the Corporation was the transferor to securitization VIEs with which it has continuing involvement, which may include servicing the loans. |
Other Asset-backed Securitizations
The table below summarizes select information related to home equity loan, credit card and other asset-backed VIEs in which the Corporation held a variable interest at March 31, 2018 and December 31, 2017 .
|
|
|
|
|
|
|
|
|
|
|
| ||||||||||||||||
Home Equity Loan, Credit Card and Other Asset-backed VIEs |
|
|
|
| |||||||||||||||||||||||
|
|
|
|
|
|
|
|
| |||||||||||||||||||
| Home Equity Loan (1) |
| Credit Card (2, 3) |
| Resecuritization Trusts |
| Municipal Bond Trusts | ||||||||||||||||||||
(Dollars in millions) | March 31 | December 31 |
| March 31 | December 31 |
| March 31 | December 31 |
| March 31 | December 31 | ||||||||||||||||
Unconsolidated VIEs |
| |
| |
|
|
|
|
| |
| |
|
| |
| | ||||||||||
Maximum loss exposure | $ | 1,350 | | $ | 1,522 | |
| $ | - | | $ | - | |
| $ | 8,680 | | $ | 8,204 | |
| $ | 1,614 | | $ | 1,631 | |
On-balance sheet assets |
| |
| |
|
|
|
|
| |
| |
|
| |
| | ||||||||||
Senior securities (4) : |
| |
| |
|
|
|
|
| |
| |
|
| |
| | ||||||||||
Trading account assets | $ | - | | $ | - | |
| $ | - | | $ | - | |
| $ | 1,660 | | $ | 869 | |
| $ | - | | $ | 33 | |
Debt securities carried at fair value | 32 | | 36 | |
| - | | - | |
| 1,557 | | 1,661 | |
| - | | - | | ||||||||
Held-to-maturity securities | - | | - | |
| - | | - | |
| 5,463 | | 5,644 | |
| - | | - | | ||||||||
Subordinate securities (4) | - | | - | |
| - | | - | |
| - | | 30 | |
| - | | - | | ||||||||
Total retained positions | $ | 32 | | $ | 36 | |
| $ | - | | $ | - | |
| $ | 8,680 | | $ | 8,204 | |
| $ | - | | $ | 33 | |
Total assets of VIEs (5) | $ | 2,238 | | $ | 2,432 | |
| $ | - | | $ | - | |
| $ | 19,073 | | $ | 19,281 | |
| $ | 2,249 | | $ | 2,287 | |
|
|
|
|
|
|
|
|
|
|
|
| ||||||||||||||||
Consolidated VIEs |
| |
| |
|
|
|
|
| |
| |
|
| |
| | ||||||||||
Maximum loss exposure | $ | 104 | | $ | 112 | |
| $ | 20,873 | | $ | 24,337 | |
| $ | 457 | | $ | 628 | |
| $ | 1,436 | | $ | 1,453 | |
On-balance sheet assets |
| |
| |
|
|
|
|
| |
| |
|
| |
| | ||||||||||
Trading account assets | $ | - | | $ | - | |
| $ | - | | $ | - | |
| $ | 1,053 | | $ | 1,557 | |
| $ | 1,447 | | $ | 1,452 | |
Loans and leases | 165 | | 177 | |
| 30,764 | | 32,554 | |
| - | | - | |
| - | | - | | ||||||||
Allowance for loan and lease losses | (9 | ) | (9 | ) |
| (968 | ) | (988 | ) |
| - | | - | |
| - | | - | | ||||||||
All other assets | 6 | | 6 | |
| 137 | | 1,385 | |
| - | | - | |
| 1 | | 1 | | ||||||||
Total assets | $ | 162 | | $ | 174 | |
| $ | 29,933 | | $ | 32,951 | |
| $ | 1,053 | | $ | 1,557 | |
| $ | 1,448 | | $ | 1,453 | |
On-balance sheet liabilities |
| |
| |
|
|
|
|
| |
| |
|
| |
| | ||||||||||
Short-term borrowings | $ | - | | $ | - | |
| $ | - | | $ | - | |
| $ | - | | $ | - | |
| $ | 286 | | $ | 312 | |
Long-term debt | 70 | | 76 | |
| 9,043 | | 8,598 | |
| 596 | | 929 | |
| 12 | | - | | ||||||||
All other liabilities | - | | - | |
| 17 | | 16 | |
| - | | - | |
| - | | - | | ||||||||
Total liabilities | $ | 70 | | $ | 76 | |
| $ | 9,060 | | $ | 8,614 | |
| $ | 596 | | $ | 929 | |
| $ | 298 | | $ | 312 | |
(1) | For unconsolidated home equity loan VIEs, the maximum loss exposure includes outstanding trust certificates issued by trusts in rapid amortization, net of recorded reserves. For both consolidated and unconsolidated home equity loan VIEs, the maximum loss exposure excludes the reserve for representations and warranties obligations and corporate guarantees. For more information, see Note 10 – Commitments and Contingencies . |
(2) | At March 31, 2018 and December 31, 2017 , loans and leases in the consolidated credit card trust included $13.3 billion and $15.6 billion of seller's interest. |
(3) | At March 31, 2018 and December 31, 2017 , all other assets in the consolidated credit card trust included restricted cash, certain short-term investments, and unbilled accrued interest and fees. |
(4) | The retained senior and subordinate securities were valued using quoted market prices or observable market inputs (Level 2 of the fair value hierarchy). |
(5) | Total assets include loans the Corporation transferred with which it has continuing involvement, which may include servicing the loan. |
|
| Bank of America 82 |
Home Equity Loans
The Corporation retains interests in home equity securitization trusts to which it transferred home equity loans. These retained interests primarily include senior securities. In addition, the Corporation may be obligated to provide subordinate funding to the trusts during a rapid amortization event. This obligation is included in the maximum loss exposure in the table above. The charges that will ultimately be recorded as a result of the rapid amortization events depend on the undrawn portion of the home equity lines of credit (HELOCs), performance of the loans, the amount of subsequent draws and the timing of related cash flows.
There were no deconsolidations of HELOC trusts during the three months ended March 31, 2018 and 2017 .
Credit Card Securitizations
The Corporation securitizes originated and purchased credit card loans. The Corporation's continuing involvement with the securitization trust includes servicing the receivables, retaining an undivided interest (seller's interest) in the receivables, and holding certain retained interests including subordinate interests in accrued interest and fees on the securitized receivables and cash reserve accounts.
During the three months ended March 31, 2018 and 2017 , new senior debt securities issued to third-party investors from the credit card securitization trust were $ 1.6 billion and $2.0 billion .
At March 31, 2018 and December 31, 2017 , the Corporation held subordinate securities issued by the credit card securitization trust with a notional principal amount of $7.5 billion and $7.4 billion . These securities serve as a form of credit enhancement to the senior debt securities and have a stated interest rate of zero percent . There were $254 million and $323 million of these subordinate securities issued during the three months ended March 31, 2018 and 2017 .
Resecuritization Trusts
The Corporation transfers securities, typically MBS, into resecuritization VIEs at the request of customers seeking
securities with specific characteristics. Generally, there are no significant ongoing activities performed in a resecuritization trust, and no single investor has the unilateral ability to liquidate the trust.
The Corporation resecuritized $6.7 billion and $7.8 billion of securities during the three months ended March 31, 2018 and 2017 . Securities transferred into resecuritization VIEs during the three months ended March 31, 2018 and 2017 were measured at fair value with changes in fair value recorded in trading account profits prior to the resecuritization and no gain or loss on sale was recorded. Resecuritization proceeds included securities with an initial fair value of $1.3 billion and $734 million during the three months ended March 31, 2018 and 2017 . Substantially all of the other securities received as resecuritization proceeds were classified as trading securities and were categorized as Level 2 within the fair value hierarchy.
Municipal Bond Trusts
The Corporation administers municipal bond trusts that hold highly-rated, long-term, fixed-rate municipal bonds. The trusts obtain financing by issuing floating-rate trust certificates that reprice on a weekly or other short-term basis to third-party investors.
The Corporation's liquidity commitments to unconsolidated municipal bond trusts, including those for which the Corporation was transferor, totaled $1.6 billion at both March 31, 2018 and December 31, 2017 . The weighted-average remaining life of bonds held in the trusts at March 31, 2018 was 5.8 years . There were no material write-downs or downgrades of assets or issuers during the three months ended March 31, 2018 and 2017 .
Other Variable Interest Entities
The table below summarizes select information related to other VIEs in which the Corporation held a variable interest at March 31, 2018 and December 31, 2017 .
|
|
|
|
|
|
|
|
|
|
|
| ||||||||||||
Other VIEs |
|
|
|
|
|
|
|
| |||||||||||||||
|
|
|
| ||||||||||||||||||||
| Consolidated |
| Unconsolidated |
| Total |
| Consolidated |
| Unconsolidated |
| Total | ||||||||||||
(Dollars in millions) | March 31, 2018 |
| December 31, 2017 | ||||||||||||||||||||
Maximum loss exposure | $ | 4,606 | |
| $ | 20,998 | |
| $ | 25,604 | |
| $ | 4,660 | |
| $ | 19,785 | |
| $ | 24,445 | |
On-balance sheet assets |
| |
|
| |
|
| |
|
| |
|
| |
|
| | ||||||
Trading account assets | $ | 2,679 | |
| $ | 376 | |
| $ | 3,055 | |
| $ | 2,709 | |
| $ | 346 | |
| $ | 3,055 | |
Debt securities carried at fair value | - | |
| 130 | |
| 130 | |
| - | |
| 160 | |
| 160 | | ||||||
Loans and leases | 2,180 | |
| 4,255 | |
| 6,435 | |
| 2,152 | |
| 3,596 | |
| 5,748 | | ||||||
Allowance for loan and lease losses | (2 | ) |
| (32 | ) |
| (34 | ) |
| (3 | ) |
| (32 | ) |
| (35 | ) | ||||||
Loans held-for-sale | 13 | |
| 1,258 | |
| 1,271 | |
| 27 | |
| 940 | |
| 967 | | ||||||
All other assets | 61 | |
| 14,379 | |
| 14,440 | |
| 62 | |
| 14,276 | |
| 14,338 | | ||||||
Total | $ | 4,931 | |
| $ | 20,366 | |
| $ | 25,297 | |
| $ | 4,947 | |
| $ | 19,286 | |
| $ | 24,233 | |
On-balance sheet liabilities |
| |
|
| |
|
| |
|
| |
|
| |
|
| | ||||||
Long-term debt (1) | $ | 308 | |
| $ | - | |
| $ | 308 | |
| $ | 270 | |
| $ | - | |
| $ | 270 | |
All other liabilities | 18 | |
| 3,508 | |
| 3,526 | |
| 18 | |
| 3,417 | |
| 3,435 | | ||||||
Total | $ | 326 | |
| $ | 3,508 | |
| $ | 3,834 | |
| $ | 288 | |
| $ | 3,417 | |
| $ | 3,705 | |
Total assets of VIEs | $ | 4,931 | |
| $ | 75,401 | |
| $ | 80,332 | |
| $ | 4,947 | |
| $ | 69,746 | |
| $ | 74,693 | |
(1) | Includes $1 million of long-term debt at both March 31, 2018 and December 31, 2017 issued by other consolidated VIEs, which has recourse to the general credit of the Corporation. |
Customer VIEs
Customer VIEs include credit-linked, equity-linked and commodity-linked note VIEs, repackaging VIEs, and asset acquisition VIEs, which are typically created on behalf of customers who wish to obtain market or credit exposure to a specific company, index, commodity or financial instrument.
The Corporation's maximum loss exposure to consolidated and unconsolidated customer VIEs totaled $2.3 billion at both
March 31, 2018 and December 31, 2017 , including the notional amount of derivatives to which the Corporation is a counterparty, net of losses previously recorded, and the Corporation's investment, if any, in securities issued by the VIEs. The Corporation also had liquidity commitments, including written put options and collateral value guarantees, with certain unconsolidated VIEs of $225 million and $442 million at March 31, 2018 and December 31, 2017 , that are included in the table above.
83 Bank of America |
|
|
Collateralized Debt Obligation VIEs
The Corporation receives fees for structuring CDO VIEs, which hold diversified pools of fixed-income securities, typically corporate debt or ABS, which the CDO VIEs fund by issuing multiple tranches of debt and equity securities. CDOs are generally managed by third-party portfolio managers. The Corporation typically transfers assets to these CDOs, holds securities issued by the CDOs and may be a derivative counterparty to the CDOs. The Corporation's maximum loss exposure to consolidated and unconsolidated CDOs totaled $390 million and $358 million at March 31, 2018 and December 31, 2017 .
Investment VIEs
The Corporation sponsors, invests in or provides financing, which may be in connection with the sale of assets, to a variety of investment VIEs that hold loans, real estate, debt securities or other financial instruments and are designed to provide the desired investment profile to investors or the Corporation. At March 31, 2018 and December 31, 2017 , the Corporation's consolidated investment VIEs had total assets of $287 million and $249 million . The Corporation also held investments in unconsolidated VIEs with total assets of $22.9 billion and $20.3 billion at March 31, 2018 and December 31, 2017 . The Corporation's maximum loss exposure associated with both consolidated and unconsolidated investment VIEs totaled $6.8 billion and $5.7 billion at March 31, 2018 and December 31, 2017 comprised primarily of on-balance sheet assets less non-recourse liabilities.
Leveraged Lease Trusts
The Corporation's net investment in consolidated leveraged lease trusts totaled $2.0 billion at both March 31, 2018 and December 31, 2017 . The trusts hold long-lived equipment such as rail cars, power generation and distribution equipment, and commercial aircraft. The Corporation structures the trusts and holds a significant residual interest. The net investment represents the Corporation's maximum loss exposure to the trusts in the unlikely
event that the leveraged lease investments become worthless. Debt issued by the leveraged lease trusts is non-recourse to the Corporation.
Tax Credit VIEs
The Corporation holds investments in unconsolidated limited partnerships and similar entities that construct, own and operate affordable housing, wind and solar projects. An unrelated third party is typically the general partner or managing member and has control over the significant activities of the VIE. The Corporation earns a return primarily through the receipt of tax credits allocated to the projects. The maximum loss exposure included in the Other VIEs table was $13.9 billion and $13.8 billion at March 31, 2018 and December 31, 2017 . The Corporation's risk of loss is generally mitigated by policies requiring that the project qualify for the expected tax credits prior to making its investment.
The Corporation's investments in affordable housing partnerships, which are reported in other assets on the Consolidated Balance Sheet, totaled $8.1 billion and $8.0 billion , including unfunded commitments to provide capital contributions of $3.2 billion and $3.1 billion at March 31, 2018 and December 31, 2017 . The unfunded commitments are expected to be paid over the next five years. The Corporation recognized tax credits and other tax benefits from investments in affordable housing partnerships of $248 million and reported pretax losses in other noninterest income of $208 million for the three months ended March 31, 2018 . For the same period in 2017 , the Corporation recognized tax credits and other tax benefits of $251 million and pretax losses of $196 million . Tax credits are recognized as part of the Corporation's annual effective tax rate used to determine tax expense in a given quarter. Accordingly, the portion of a year's expected tax benefits recognized in any given quarter may differ from 25 percent . The Corporation may from time to time be asked to invest additional amounts to support a troubled affordable housing project. Such additional investments have not been and are not expected to be significant.
NOTE 8
Goodwill and Intangible Assets
Goodwill
The table below presents goodwill balances by business segment and All Other at March 31, 2018 and December 31, 2017 . The reporting units utilized for goodwill impairment testing are the operating segments or one level below. For more information, see Note 8 – Goodwill and Intangible Assets to the Consolidated Financial Statements of the Corporation's 2017 Annual Report on Form 10-K .
|
|
|
| ||||
Goodwill |
|
|
| ||||
|
|
|
| ||||
(Dollars in millions) | March 31 |
| December 31 | ||||
Consumer Banking | $ | 30,123 | |
| $ | 30,123 | |
Global Wealth & Investment Management | 9,677 | |
| 9,677 | | ||
Global Banking | 23,923 | |
| 23,923 | | ||
Global Markets | 5,182 | |
| 5,182 | | ||
All Other | 46 | |
| 46 | | ||
Total goodwill | $ | 68,951 | |
| $ | 68,951 | |
|
| Bank of America 84 |
Intangible Assets
The table below presents the gross and net carrying values and accumulated amortization for intangible assets at March 31, 2018 and December 31, 2017 .
|
|
|
|
|
|
|
|
|
|
|
| ||||||||||||
Intangible Assets (1, 2) |
|
|
|
|
|
|
|
|
|
|
| ||||||||||||
|
|
|
|
|
|
|
|
|
|
|
| ||||||||||||
| Gross |
| Accumulated |
| Net |
| Gross |
| Accumulated |
| Net | ||||||||||||
(Dollars in millions) | March 31, 2018 |
| December 31, 2017 | ||||||||||||||||||||
Purchased credit card and affinity relationships | $ | 5,919 | |
| $ | 5,643 | |
| $ | 276 | |
| $ | 5,919 | |
| $ | 5,604 | |
| $ | 315 | |
Core deposit and other intangibles (3) | 3,835 | |
| 2,160 | |
| 1,675 | |
| 3,835 | |
| 2,140 | |
| 1,695 | | ||||||
Customer relationships | 3,886 | |
| 3,660 | |
| 226 | |
| 3,886 | |
| 3,584 | |
| 302 | | ||||||
Total intangible assets | $ | 13,640 | |
| $ | 11,463 | |
| $ | 2,177 | |
| $ | 13,640 | |
| $ | 11,328 | |
| $ | 2,312 | |
(1) | Excludes fully amortized intangible assets. |
(2) | At March 31, 2018 and December 31, 2017 , none of the intangible assets were impaired. |
(3) | Includes $1.6 billion at both March 31, 2018 and December 31, 2017 of intangible assets associated with trade names that have an indefinite life and, accordingly, are not amortized. |
Amortization of intangibles expense was $135 million and $162 million for the three months ended March 31, 2018 and 2017 . The Corporation estimates aggregate amortization expense will be $403 million for the remainder of 2018, $105 million for 2019, $53 million for 2020 and none for the years thereafter.
NOTE 9
Federal Funds Sold or Purchased, Securities Financing Agreements, Short-term Borrowings and Restricted Cash
The table below presents federal funds sold or purchased, securities financing agreements, which include securities borrowed or purchased under agreements to resell and securities loaned or sold under agreements to repurchase, and short-term borrowings. The Corporation elects to account for certain securities financing agreements and short-term borrowings under the fair value option. For more information on the election of the fair value option, see Note 15 – Fair Value Option .
|
|
|
|
|
|
|
| ||||||
| Amount |
| Rate |
| Amount |
| Rate | ||||||
| Three Months Ended March 31 | ||||||||||||
(Dollars in millions) | 2018 |
| 2017 | ||||||||||
Federal funds sold and securities borrowed or purchased under agreements to resell |
| |
|
|
|
| |
|
| | |||
Average during period | $ | 248,320 | |
| 1.02 | % |
| $ | 216,402 | |
| 0.67 | % |
Maximum month-end balance during period | 252,078 | |
| n/a | |
| 223,499 | |
| n/a | | ||
Federal funds purchased and securities loaned or sold under agreements to repurchase |
| |
|
| |
|
| |
|
| | ||
Average during period | $ | 195,614 | |
| 1.41 | % |
| $ | 191,677 | |
| 0.93 | % |
Maximum month-end balance during period | 191,319 | |
| n/a | |
| 199,926 | |
| n/a | | ||
Short-term borrowings |
| |
|
| |
|
| |
|
| | ||
Average during period | 46,334 | |
| 3.98 | |
| 40,040 | |
| 2.11 | | ||
Maximum month-end balance during period | 52,480 | |
| n/a | |
| 44,944 | |
| n/a | | ||
n/a = not applicable
Offsetting of Securities Financing Agreements
The Corporation enters into securities financing agreements to accommodate customers (also referred to as "matched-book transactions"), obtain securities to cover short positions, and to finance inventory positions. Substantially all of the Corporation's securities financing activities are transacted under legally enforceable master repurchase agreements or legally enforceable master securities lending agreements that give the Corporation, in the event of default by the counterparty, the right to liquidate securities held and to offset receivables and payables with the same counterparty. For more information, see Note 10 – Federal Funds Sold or Purchased, Securities Financing Agreements and Short-term Borrowings to the Consolidated Financial Statements of the Corporation's 2017 Annual Report on Form 10-K .
The Securities Financing Agreements table presents securities financing agreements included on the Consolidated Balance Sheet in federal funds sold and securities borrowed or purchased under agreements to resell, and in federal funds purchased and securities loaned or sold under agreements to repurchase at March 31, 2018 and December 31, 2017 . Balances are presented on a gross basis, prior to the application of counterparty netting. Gross assets and liabilities are adjusted on an aggregate basis to take into consideration the effects of legally enforceable master netting agreements. For more information on the offsetting of derivatives, see Note 3 – Derivatives .
85 Bank of America |
|
|
|
|
|
|
|
|
|
|
|
| ||||||||||
Securities Financing Agreements |
|
|
|
|
|
|
|
|
| ||||||||||
|
|
|
|
|
|
|
|
|
| ||||||||||
| Gross Assets/Liabilities (1) |
| Amounts Offset |
| Net Balance Sheet Amount |
| Financial Instruments (2) |
| Net Assets/Liabilities | ||||||||||
(Dollars in millions) | March 31, 2018 | ||||||||||||||||||
Securities borrowed or purchased under agreements to resell (3) | $ | 381,692 | |
| $ | (137,062 | ) |
| $ | 244,630 | |
| $ | (200,677 | ) |
| $ | 43,953 | |
Securities loaned or sold under agreements to repurchase | $ | 315,590 | |
| $ | (137,062 | ) |
| $ | 178,528 | |
| $ | (149,374 | ) |
| $ | 29,154 | |
Other (4) | 20,048 | |
| - | |
| 20,048 | |
| (20,048 | ) |
| - | | |||||
Total | $ | 335,638 | |
| $ | (137,062 | ) |
| $ | 198,576 | |
| $ | (169,422 | ) |
| $ | 29,154 | |
|
|
|
|
|
|
|
|
|
| ||||||||||
| December 31, 2017 | ||||||||||||||||||
Securities borrowed or purchased under agreements to resell (3) | $ | 348,472 | |
| $ | (135,725 | ) |
| $ | 212,747 | |
| $ | (165,720 | ) |
| $ | 47,027 | |
Securities loaned or sold under agreements to repurchase | $ | 312,582 | |
| $ | (135,725 | ) |
| $ | 176,857 | |
| $ | (146,205 | ) |
| $ | 30,652 | |
Other (4) | 22,711 | |
| - | |
| 22,711 | |
| (22,711 | ) |
| - | | |||||
Total | $ | 335,293 | |
| $ | (135,725 | ) |
| $ | 199,568 | |
| $ | (168,916 | ) |
| $ | 30,652 | |
(1) | Includes activity where uncertainty exists as to the enforceability of certain master netting agreements under bankruptcy laws in some countries or industries. |
(2) | Includes securities collateral received or pledged under repurchase or securities lending agreements where there is a legally enforceable master netting agreement. These amounts are not offset on the Consolidated Balance Sheet, but are shown as a reduction to derive a net asset or liability. Securities collateral received or pledged where the legal enforceability of the master netting agreements is uncertain is excluded from the table. |
(3) | Excludes repurchase activity of $8.5 billion and $10.2 billion reported in loans and leases on the Consolidated Balance Sheet at March 31, 2018 and December 31, 2017 . |
(4) | Balance is reported in accrued expenses and other liabilities on the Consolidated Balance Sheet and relates to transactions where the Corporation acts as the lender in a securities lending agreement and receives securities that can be pledged as collateral or sold. In these transactions, the Corporation recognizes an asset at fair value, representing the securities received, and a liability, representing the obligation to return those securities. |
Repurchase Agreements and Securities Loaned Transactions Accounted for as Secured Borrowings
The tables below present securities sold under agreements to repurchase and securities loaned by remaining contractual term to maturity and class of collateral pledged. Included in "Other" are transactions where the Corporation acts as the lender in a
securities lending agreement and receives securities that can be pledged as collateral or sold. Certain agreements contain a right to substitute collateral and/or terminate the agreement prior to maturity at the option of the Corporation or the counterparty. Such agreements are included in the table below based on the remaining contractual term to maturity.
|
|
|
|
|
|
|
|
|
| ||||||||||
Remaining Contractual Maturity |
|
|
|
|
|
|
|
|
| ||||||||||
|
|
|
|
|
|
|
|
|
| ||||||||||
| March 31, 2018 | ||||||||||||||||||
(Dollars in millions) | Overnight and Continuous |
| 30 Days or Less |
| After 30 Days Through 90 Days |
| Greater than 90 Days (1) |
| Total | ||||||||||
Securities sold under agreements to repurchase | $ | 112,400 | |
| $ | 90,486 | |
| $ | 38,437 | |
| $ | 52,570 | |
| $ | 293,893 | |
Securities loaned | 14,727 | |
| 258 | |
| 2,130 | |
| 4,582 | |
| 21,697 | | |||||
Other | 20,048 | |
| - | |
| - | |
| - | |
| 20,048 | | |||||
Total | $ | 147,175 | |
| $ | 90,744 | |
| $ | 40,567 | |
| $ | 57,152 | |
| $ | 335,638 | |
|
|
|
|
|
|
|
|
|
| ||||||||||
| December 31, 2017 | ||||||||||||||||||
Securities sold under agreements to repurchase | $ | 125,956 | |
| $ | 79,913 | |
| $ | 46,091 | |
| $ | 38,935 | |
| $ | 290,895 | |
Securities loaned | 9,853 | |
| 5,658 | |
| 2,043 | |
| 4,133 | |
| 21,687 | | |||||
Other | 22,711 | |
| - | |
| - | |
| - | |
| 22,711 | | |||||
Total | $ | 158,520 | |
| $ | 85,571 | |
| $ | 48,134 | |
| $ | 43,068 | |
| $ | 335,293 | |
(1) | No agreements have maturities greater than three years . |
|
|
|
|
|
|
|
| ||||||||
Class of Collateral Pledged |
|
|
|
|
|
|
| ||||||||
|
|
|
|
|
|
|
| ||||||||
| March 31, 2018 | ||||||||||||||
(Dollars in millions) | Securities Sold Under Agreements to Repurchase |
| Securities Loaned |
| Other |
| Total | ||||||||
U.S. government and agency securities | $ | 163,292 | |
| $ | - | |
| $ | 1 | |
| $ | 163,293 | |
Corporate securities, trading loans and other | 10,454 | |
| 2,835 | |
| 356 | |
| 13,645 | | ||||
Equity securities | 21,971 | |
| 12,898 | |
| 19,648 | |
| 54,517 | | ||||
Non-U.S. sovereign debt | 92,805 | |
| 5,964 | |
| 43 | |
| 98,812 | | ||||
Mortgage trading loans and ABS | 5,371 | |
| - | |
| - | |
| 5,371 | | ||||
Total | $ | 293,893 | |
| $ | 21,697 | |
| $ | 20,048 | |
| $ | 335,638 | |
|
|
|
|
|
|
|
| ||||||||
| December 31, 2017 | ||||||||||||||
U.S. government and agency securities | $ | 158,299 | |
| $ | - | |
| $ | 409 | |
| $ | 158,708 | |
Corporate securities, trading loans and other | 12,787 | |
| 2,669 | |
| 624 | |
| 16,080 | | ||||
Equity securities | 23,975 | |
| 13,523 | |
| 21,628 | |
| 59,126 | | ||||
Non-U.S. sovereign debt | 90,857 | |
| 5,495 | |
| 50 | |
| 96,402 | | ||||
Mortgage trading loans and ABS | 4,977 | |
| - | |
| - | |
| 4,977 | | ||||
Total | $ | 290,895 | |
| $ | 21,687 | |
| $ | 22,711 | |
| $ | 335,293 | |
|
| Bank of America 86 |
The Corporation is required to post collateral with a market value equal to or in excess of the principal amount borrowed under repurchase agreements. For securities loaned transactions, the Corporation receives collateral in the form of cash, letters of credit or other securities. To determine whether the market value of the underlying collateral remains sufficient, collateral is generally valued daily, and the Corporation may be required to deposit additional collateral or may receive or return collateral pledged when appropriate. Repurchase agreements and securities loaned transactions are generally either overnight, continuous (i.e., no stated term) or short-term. The Corporation manages liquidity risks related to these agreements by sourcing funding from a diverse group of counterparties, providing a range of securities collateral and pursuing longer durations, when appropriate.
Restricted Cash
At March 31, 2018 and December 31, 2017 , the Corporation held restricted cash included within cash and cash equivalents on the Consolidated Balance Sheet of $16.3 billion and $18.8 billion , primarily related to cash segregated in compliance with securities regulations and cash held on deposit with the Federal Reserve and non-U.S. central banks to meet reserve requirements.
NOTE 10
Commitments and Contingencies
In the normal course of business, the Corporation enters into a number of off-balance sheet commitments. These commitments expose the Corporation to varying degrees of credit and market risk and are subject to the same credit and market risk limitation reviews as those instruments recorded on the Consolidated Balance Sheet. For more information on commitments and contingencies, see Note 12 – Commitments and Contingencies to
the Consolidated Financial Statements of the Corporation's 2017 Annual Report on Form 10-K .
Credit Extension Commitments
The Corporation enters into commitments to extend credit such as loan commitments, SBLCs and commercial letters of credit to meet the financing needs of its customers. The following table includes the notional amount of unfunded legally binding lending commitments net of amounts distributed (i.e., syndicated or participated) to other financial institutions. The distributed amounts were $10.9 billion and $11.0 billion at March 31, 2018 and December 31, 2017 . At March 31, 2018 , the carrying value of these commitments, excluding commitments accounted for under the fair value option, was $800 million , including deferred revenue of $18 million and a reserve for unfunded lending commitments of $782 million . At December 31, 2017 , the comparable amounts were $793 million , $16 million and $777 million , respectively. The carrying value of these commitments is classified in accrued expenses and other liabilities on the Consolidated Balance Sheet.
The following table also includes the notional amount of commitments of $4.4 billion and $4.8 billion at March 31, 2018 and December 31, 2017 that are accounted for under the fair value option. However, the following table excludes cumulative net fair value of $120 million at both March 31, 2018 and December 31, 2017 on these commitments, which is classified in accrued expenses and other liabilities. For more information regarding the Corporation's loan commitments accounted for under the fair value option, see Note 15 – Fair Value Option .
|
|
|
|
|
|
|
|
|
| ||||||||||
Credit Extension Commitments |
|
|
|
|
|
|
|
|
| ||||||||||
|
| ||||||||||||||||||
| Expire in One |
| Expire After One |
| Expire After Three Years Through Five Years |
| Expire After Five Years |
| Total | ||||||||||
(Dollars in millions) | March 31, 2018 | ||||||||||||||||||
Notional amount of credit extension commitments |
| |
|
| |
|
| |
|
| |
|
| | |||||
Loan commitments | $ | 89,618 | |
| $ | 148,332 | |
| $ | 150,703 | |
| $ | 24,020 | |
| $ | 412,673 | |
Home equity lines of credit | 4,843 | |
| 3,784 | |
| 2,464 | |
| 32,802 | |
| 43,893 | | |||||
Standby letters of credit and financial guarantees (1) | 20,833 | |
| 10,062 | |
| 2,687 | |
| 1,345 | |
| 34,927 | | |||||
Letters of credit | 1,212 | |
| 115 | |
| 85 | |
| 56 | |
| 1,468 | | |||||
Legally binding commitments | 116,506 | |
| 162,293 | |
| 155,939 | |
| 58,223 | |
| 492,961 | | |||||
Credit card lines (2) | 368,608 | |
| - | |
| - | |
| - | |
| 368,608 | | |||||
Total credit extension commitments | $ | 485,114 | |
| $ | 162,293 | |
| $ | 155,939 | |
| $ | 58,223 | |
| $ | 861,569 | |
|
|
|
|
|
|
|
|
|
| ||||||||||
| December 31, 2017 | ||||||||||||||||||
Notional amount of credit extension commitments |
| |
|
| |
|
| |
|
| |
|
| | |||||
Loan commitments | $ | 85,804 | |
| $ | 140,942 | |
| $ | 147,043 | |
| $ | 21,342 | |
| $ | 395,131 | |
Home equity lines of credit | 6,172 | |
| 4,457 | |
| 2,288 | |
| 31,250 | |
| 44,167 | | |||||
Standby letters of credit and financial guarantees (1) | 19,976 | |
| 11,261 | |
| 3,420 | |
| 1,144 | |
| 35,801 | | |||||
Letters of credit | 1,291 | |
| 117 | |
| 129 | |
| 87 | |
| 1,624 | | |||||
Legally binding commitments | 113,243 | |
| 156,777 | |
| 152,880 | |
| 53,823 | |
| 476,723 | | |||||
Credit card lines (2) | 362,030 | |
| - | |
| - | |
| - | |
| 362,030 | | |||||
Total credit extension commitments | $ | 475,273 | |
| $ | 156,777 | |
| $ | 152,880 | |
| $ | 53,823 | |
| $ | 838,753 | |
(1) | The notional amounts of SBLCs and financial guarantees classified as investment grade and non-investment grade based on the credit quality of the underlying reference name within the instrument were $27.0 billion and $7.6 billion at March 31, 2018 , and $27.3 billion and $8.1 billion at December 31, 2017 . Amounts in the table include consumer SBLCs of $375 million and $421 million at March 31, 2018 and December 31, 2017 . |
(2) | Includes business card unused lines of credit. |
Legally binding commitments to extend credit generally have specified rates and maturities. Certain of these commitments have adverse change clauses that help to protect the Corporation against deterioration in the borrower's ability to pay.
87 Bank of America |
|
|
Other Commitments
At March 31, 2018 and December 31, 2017 , the Corporation had commitments to purchase loans (e.g., residential mortgage and commercial real estate) of $399 million and $344 million , and commitments to purchase commercial loans of $450 million and $994 million , which upon settlement will be included in loans or LHFS.
At March 31, 2018 and December 31, 2017 , the Corporation had commitments to purchase commodities, primarily liquefied natural gas, of $1.4 billion and $1.5 billion , which upon settlement will be included in trading account assets. At March 31, 2018 and December 31, 2017 , the Corporation had commitments to enter into resale and forward-dated resale and securities borrowing agreements of $89.7 billion and $56.8 billion , and commitments to enter into forward-dated repurchase and securities lending agreements of $46.4 billion and $34.3 billion . These commitments expire primarily within the next 12 months.
The Corporation has entered into agreements to purchase retail automobile loans from certain auto loan originators. These agreements provide for stated purchase amounts and contain cancellation provisions that allow the Corporation to terminate its commitment to purchase at any time, with a minimum notification period. During the three months ended March 31, 2018 , the Corporation's purchase commitment was terminated. At December 31, 2017 , the Corporation's maximum purchase commitment was $345 million . In addition, the Corporation has a commitment to originate or purchase up to $3.0 billion of auto loans and leases from a strategic partner during the twelve months ending March 31, 2019. This commitment extends through November 2022 and can be terminated with 12 months prior notice.
The Corporation is a party to operating leases for certain of its premises and equipment. Commitments under these leases are approximately $1.7 billion , $2.2 billion , $2.0 billion , $1.7 billion and $1.4 billion for the remainder of 2018 and the years through 2022 , respectively, and $6.0 billion in the aggregate for all years thereafter.
Other Guarantees
Bank-owned Life Insurance Book Value Protection
The Corporation sells products that offer book value protection to insurance carriers who offer group life insurance policies to corporations, primarily banks. At March 31, 2018 and December 31, 2017 , the notional amount of these guarantees totaled $10.3 billion and $10.4 billion , and the Corporation's maximum exposure related to these guarantees totaled $1.6 billion at both period ends, with estimated maturity dates between 2033 and 2039. The net fair value including the fee receivable associated with these guarantees was $1 million and $3 million at March 31, 2018 and December 31, 2017 , and reflects the probability of surrender as well as the multiple structural protection features in the contracts.
Merchant Services
In accordance with credit and debit card association rules, the Corporation sponsors merchant processing servicers that process credit and debit card transactions on behalf of various merchants. If the merchant processor fails to meet its obligation to reimburse the cardholder for disputed transactions, then the Corporation, as the sponsor, could be held liable for the disputed amount. For the
three months ended March 31, 2018 and 2017 , the sponsored entities processed and settled $200.7 billion and $186.8 billion of transactions and recorded losses of $8 million and $7 million . A significant portion of this activity was processed by a joint venture in which the Corporation holds a 49 percent ownership. The carrying value of the Corporation's investment in the merchant services joint venture was $2.8 billion and $2.9 billion at March 31, 2018 and December 31, 2017 , and is recorded in other assets on the Consolidated Balance Sheet and in All Other .
As of March 31, 2018 and December 31, 2017 , the maximum
potential exposure for sponsored transactions totaled $343.3 billion and $346.4 billion . However, the Corporation believes that the maximum potential exposure is not representative of the actual potential loss exposure and does not expect to make material payments in connection with these guarantees.
Representations and Warranties Obligations and Corporate Guarantees
For information on representations and warranties obligations and corporate guarantees and the related reserve and estimated range of possible loss, see Note 7 – Representations and Warranties Obligations and Corporate Guarantees to the Consolidated Financial Statements of the Corporation's 2017 Annual Report on Form 10-K .
The reserve for representations and warranties and corporate guarantees was $2.0 billion and $1.9 billion at March 31, 2018 and December 31, 2017 and is included in accrued expenses and other liabilities on the Consolidated Balance Sheet and the related provision is included in other income in the Consolidated Statement of Income. The representations and warranties reserve represents the Corporation's best estimate of probable incurred losses. It is reasonably possible that future representations and warranties losses may occur in excess of the amounts recorded for these exposures.
Other Guarantees
The Corporation has entered into additional guarantee agreements and commitments, including sold risk participation swaps, liquidity facilities, lease-end obligation agreements, partial credit guarantees on certain leases, real estate joint venture guarantees, divested business commitments and sold put options that require gross settlement. The maximum potential future payment under these agreements was approximately $6.0 billion and $5.9 billion at March 31, 2018 and December 31, 2017 . The estimated maturity dates of these obligations extend up to 2040 . The Corporation has made no material payments under these guarantees.
In the normal course of business, the Corporation periodically guarantees the obligations of its affiliates in a variety of transactions including ISDA-related transactions and non-ISDA related transactions such as commodities trading, repurchase agreements, prime brokerage agreements and other transactions.
Payment Protection Insurance Claims Matter
On June 1, 2017, the Corporation sold its non-U.S. consumer credit card business. Included in the calculation of the gain on sale, the Corporation recorded an obligation to indemnify the purchaser for substantially all payment protection insurance exposure above reserves assumed by the purchaser.
|
| Bank of America 88 |
Litigation and Regulatory Matters
The following supplements the disclosure in Note 12 – Commitments and Contingencies to the Consolidated Financial Statements of the Corporation's 2017 Annual Report on Form 10-K (the prior commitments and contingencies disclosure).
In the ordinary course of business, the Corporation and its subsidiaries are routinely defendants in or parties to many pending and threatened legal, regulatory and governmental actions and proceedings. In view of the inherent difficulty of predicting the outcome of such matters, particularly where the claimants seek very large or indeterminate damages or where the matters present novel legal theories or involve a large number of parties, the Corporation generally cannot predict what the eventual outcome of the matters will be, what the timing of the ultimate resolution of these matters will be, or what the expense, eventual loss, fines or penalties related to each matter may be.
The Corporation establishes an accrued liability when those matters present loss contingencies that are both probable and estimable. In such cases, there may be an exposure to loss in excess of any amounts accrued. As a matter develops, the Corporation, in conjunction with any outside counsel handling the matter, evaluates on an ongoing basis whether such matter presents a loss contingency that is probable and estimable. Once the loss contingency is deemed to be both probable and estimable, the Corporation will establish an accrued liability and record a corresponding amount of litigation-related expense. The Corporation continues to monitor the matter for further developments that could affect the amount of the accrued liability that has been previously established. Excluding expenses of internal and external legal service providers, litigation-related expense of $116 million and $274 million was recognized for the three months ended March 31, 2018 and 2017 .
For a limited number of the matters disclosed in the prior commitments and contingencies disclosure, for which a loss, whether in excess of a related accrued liability or where there is no accrued liability, is reasonably possible in future periods, the Corporation is able to estimate a range of possible loss. In determining whether it is possible to estimate a range of possible loss, the Corporation reviews and evaluates its matters on an ongoing basis, in conjunction with any outside counsel handling the matter, in light of potentially relevant factual and legal developments. In cases in which the Corporation possesses sufficient appropriate information to estimate a range of possible loss, that estimate is aggregated and disclosed below. There may be other previously disclosed matters for which a loss is probable or reasonably possible but such an estimate of the range of possible loss may not be possible. For those matters where an estimate of the range of possible loss is reasonably possible, management currently estimates the aggregate range of possible loss is $0 to $1.2 billion in excess of the accrued liability (if any) related to those matters. This estimated range of possible loss is based upon currently available information and is subject to significant judgment and a variety of assumptions, and known and unknown uncertainties. The matters underlying the estimated range will change from time to time, and actual results may vary significantly from the current estimate. Therefore, this estimated range of possible loss represents what the Corporation believes to be an estimate of possible loss only for certain matters meeting these criteria. It does not represent the Corporation's maximum loss exposure.
Information has been provided below or in the prior commitments and contingencies disclosure regarding the nature of all of these contingencies and, where specified, the amount of the claim associated with these loss contingencies. Based on current knowledge, management does not believe that loss contingencies arising from pending matters, including the matters described in the prior commitments and contingencies disclosure, will have a material adverse effect on the consolidated financial position or liquidity of the Corporation. However, in light of the inherent uncertainties involved in these matters, some of which are beyond the Corporation's control, and the very large or indeterminate damages sought in some of these matters, an adverse outcome in one or more of these matters could be material to the Corporation's results of operations or liquidity for any particular reporting period.
Ambac Bond Insurance Litigation
Ambac v. Countrywide III
On March 13, 2018, the Wisconsin Supreme Court denied Ambac's petition for review.
Deposit Insurance Assessment
On March 27, 2018, the U.S. District Court for the District of Columbia denied BANA's partial motion to dismiss certain of the Federal Deposit Insurance Corporation's claims.
LIBOR, Other Reference Rates, Foreign Exchange (FX) and Bond Trading Matters
On February 23, 2018, the U.S. Court of Appeals for the Second Circuit issued an opinion affirming in part and vacating in part the decision of the U.S. District Court for the Southern District of New York dismissing Securities Exchange Act and certain state law claims against the Corporation, BANA and other defendants.
On February 28, 2018, the District Court issued an opinion granting certification of a class of persons that purchased over-the-counter swaps and notes that referenced U.S. dollar LIBOR from one of the U.S. dollar LIBOR panel banks, limited to claims under Section 1 of the Sherman Act, and denying plaintiffs' class certification motions in other respects, including with respect to other putative classes. Requests to appeal those rulings are pending in the U.S. Court of Appeals for the Second Circuit.
Mortgage Appraisal Litigation
The Corporation and certain subsidiaries are named as defendants in two putative class action lawsuits filed in U.S. District Court for the Central District of California (Waldrup and Williams, et al. ). In November 2016, the actions were consolidated for pre-trial purposes. Plaintiffs allege that in fulfilling orders made by Countrywide for residential mortgage appraisal services, a former Countrywide subsidiary, LandSafe Appraisal Services, Inc., arranged for and completed appraisals that were not in compliance with applicable laws and appraisal standards. Plaintiffs seek, among other forms of relief, compensatory and treble damages.
On February 8, 2018, the District Court granted plaintiffs' motion for class certification. Defendants' petition for permission to appeal that ruling to the U.S. Court of Appeals for the Ninth Circuit is pending.
89 Bank of America |
|
|
NOTE 11
Shareholders' Equity
Common Stock
|
|
|
|
|
|
| ||
Declared Quarterly Cash Dividends on Common Stock (1) | ||||||||
|
|
|
|
|
|
| ||
Declaration Date |
| Record Date |
| Payment Date |
| Dividend Per Share | ||
April 25, 2018 |
| June 1, 2018 |
| June 29, 2018 |
| $ | 0.12 | |
January 31, 2018 |
| March 2, 2018 |
| March 30, 2018 |
| 0.12 | | |
(1) | In 2018 , and through April 30, 2018 . |
The Corporation's 2017 Comprehensive Capital Analysis and Review (CCAR) capital plan included a request to repurchase $12.0 billion of common stock from July 1, 2017 through June 30, 2018, plus repurchases expected to be approximately $900 million to offset the effect of equity-based compensation plans during the same period. The common stock repurchase authorization includes both common stock and warrants. The Corporation's 2017 capital plan also included a request to increase the quarterly common stock dividend from $0.075 per share to $0.12 per share. On December 5, 2017, following approval by the Federal Reserve, the Board authorized the repurchase of an additional $5.0 billion of common stock through June 30, 2018. During the three months ended March 31, 2018 , the Corporation repurchased and retired 153 million shares of common stock, which reduced shareholders' equity by $4.9 billion .
The Corporation has warrants outstanding and exercisable to purchase 122 million shares of its common stock expiring on October 28, 2018, and warrants outstanding and exercisable to purchase 142 million shares of common stock expiring on January 16, 2019. These warrants were originally issued in connection with preferred stock issuances to the U.S. Department of the Treasury in 2009 and 2008, and are listed on the New York Stock Exchange. The exercise price of the warrants expiring on January 16, 2019 is subject to continued adjustment each time the quarterly cash dividend is in excess of $0.01 per common share to compensate the holders of the warrants for dilution resulting from an increased dividend. As a result of the Corporation's first-quarter 2018 dividend of $0.12 per common share, the exercise price of the warrants expiring on January 16, 2019 was adjusted to $12.713 per share. The warrants expiring on October 28, 2018,
which have an exercise price of $30.79 per share, also contain this anti-dilution provision except the adjustment is triggered only when the Corporation declares quarterly dividends at a level greater than $0.32 per common share.
During the three months ended March 31, 2018 , in connection with employee stock plans, the Corporation issued 66 million
shares and repurchased 25 million shares of its common stock to satisfy tax withholding obligations. At March 31, 2018 , the Corporation had reserved 804 million unissued shares of common stock for future issuances under employee stock plans, common stock warrants, convertible notes and preferred stock.
Preferred Stock
During the three months ended March 31, 2018 , the Corporation declared $428 million of cash dividends on preferred stock. On March 15, 2018, the Corporation issued 94,000 shares of 5.875% Fixed-to-Floating Rate Non-Cumulative Preferred Stock, Series FF for $2.35 billion . Dividends are paid semi-annually commencing on September 15, 2018 through March 15, 2028 and quarterly thereafter beginning on June 15, 2028. The Series FF preferred stock has a liquidation preference of $25,000 per share and is subject to certain restrictions in the event that the Corporation fails to declare and pay full dividends.
Restricted Stock Units
During the three months ended March 31, 2018 , the Corporation granted 71 million restricted stock unit (RSU) awards to certain employees under the Bank of America Corporation Key Employee Equity Plan. These awards were authorized to settle predominantly in shares of common stock of the Corporation and will be expensed based on the grant-date fair value of the shares. Certain RSUs will be settled in cash or contain settlement provisions that subject these awards to variable accounting whereby compensation expense is adjusted to fair value based on changes in the share price of the Corporation's common stock up to the settlement date. Of the RSUs granted, 63 million will vest in one-third increments on each of the first three anniversaries of the grant date provided that the employee remains continuously employed with the Corporation during that time, and will be expensed ratably over the vesting period, net of estimated forfeitures, for non-retirement eligible employees. For RSUs granted to employees who are retirement eligible, the awards are deemed authorized as of the beginning of the year preceding the grant date when the incentive award plans are generally approved. As a result, the estimated value is expensed ratably over the year preceding the grant date. Additionally, eight million of the RSUs granted will vest in one-fourth increments on each of the first four anniversaries of the grant date provided that the employee remains continuously employed with the Corporation during that time, and will be expensed ratably over the vesting period, net of estimated forfeitures. For additional information, see Note 18 – Stock-based Compensation Plans to the Consolidated Financial Statements of the Corporation's 2017 Annual Report on Form 10-K .
|
| Bank of America 90 |
NOTE 12
Accumulated Other Comprehensive Income (Loss)
The table below presents the changes in accumulated OCI after-tax for the three months ended March 31, 2018 and 2017 .
|
|
|
|
|
|
|
|
|
|
|
| ||||||||||||
(Dollars in millions) | Debt and Equity Securities |
| Debit Valuation Adjustments |
| Derivatives |
| Employee Benefit Plans |
| Foreign Currency |
| Total | ||||||||||||
Balance, December 31, 2016 | $ | (1,267 | ) |
| $ | (767 | ) |
| $ | (895 | ) |
| $ | (3,480 | ) |
| $ | (879 | ) |
| $ | (7,288 | ) |
Net change | (99 | ) |
| 9 | |
| 38 | |
| 27 | |
| (3 | ) |
| (28 | ) | ||||||
Balance, March 31, 2017 | $ | (1,366 | ) |
| $ | (758 | ) |
| $ | (857 | ) |
| $ | (3,453 | ) |
| $ | (882 | ) |
| $ | (7,316 | ) |
|
|
|
|
|
|
|
|
|
|
|
| ||||||||||||
Balance, December 31, 2017 | $ | (1,206 | ) |
| $ | (1,060 | ) |
| $ | (831 | ) |
| $ | (3,192 | ) |
| $ | (793 | ) |
| $ | (7,082 | ) |
Accounting change related to certain tax effects (1) | (393 | ) |
| (220 | ) |
| (189 | ) |
| (707 | ) |
| 239 | |
| (1,270 | ) | ||||||
Cumulative adjustment for hedge accounting change (2) | - | |
| - | |
| 57 | |
| - | |
| - | |
| 57 | | ||||||
Net change | (3,963 | ) |
| 273 | |
| (275 | ) |
| 30 | |
| (48 | ) |
| (3,983 | ) | ||||||
Balance, March 31, 2018 | $ | (5,562 | ) |
| $ | (1,007 | ) |
| $ | (1,238 | ) |
| $ | (3,869 | ) |
| $ | (602 | ) |
| $ | (12,278 | ) |
The table below presents the net change in fair value recorded in accumulated OCI, net realized gains and losses reclassified into earnings and other changes for each component of OCI before- and after-tax for the three months ended March 31, 2018 and 2017 .
|
|
|
|
|
|
|
|
|
|
|
| ||||||||||||
Changes in OCI Components Before- and After-tax |
|
|
|
|
|
|
|
| |||||||||||||||
|
| ||||||||||||||||||||||
| Before- tax |
| Tax effect |
| After- tax |
| Before- tax |
| Tax effect |
| After- tax | ||||||||||||
| Three Months Ended March 31 | ||||||||||||||||||||||
(Dollars in millions) | 2018 |
| 2017 | ||||||||||||||||||||
Debt and equity securities: |
|
|
|
|
|
|
|
|
|
|
| ||||||||||||
Net decrease in fair value | $ | (5,323 | ) |
| $ | 1,360 | |
| $ | (3,963 | ) |
| $ | (124 | ) |
| $ | 53 | |
| $ | (71 | ) |
Net realized gains reclassified into earnings (3) | (2 | ) |
| 2 | |
| - | |
| (45 | ) |
| 17 | |
| (28 | ) | ||||||
Net change | (5,325 | ) |
| 1,362 | |
| (3,963 | ) |
| (169 | ) |
| 70 | |
| (99 | ) | ||||||
Debit valuation adjustments: |
|
|
|
|
|
|
|
|
|
|
| ||||||||||||
Net increase in fair value | 342 | |
| (82 | ) |
| 260 | |
| 9 | |
| (4 | ) |
| 5 | | ||||||
Net realized losses reclassified into earnings (3) | 17 | |
| (4 | ) |
| 13 | |
| 6 | |
| (2 | ) |
| 4 | | ||||||
Net change | 359 | |
| (86 | ) |
| 273 | |
| 15 | |
| (6 | ) |
| 9 | | ||||||
Derivatives: |
|
|
|
|
|
|
|
|
|
|
| ||||||||||||
Net decrease in fair value | (424 | ) |
| 131 | |
| (293 | ) |
| (9 | ) |
| 3 | |
| (6 | ) | ||||||
Reclassifications into earnings: |
|
|
|
|
|
|
|
|
|
|
| ||||||||||||
Net interest income | 50 | |
| (12 | ) |
| 38 | |
| 112 | |
| (42 | ) |
| 70 | | ||||||
Personnel expense | (27 | ) |
| 7 | |
| (20 | ) |
| (42 | ) |
| 16 | |
| (26 | ) | ||||||
Net realized losses reclassified into earnings | 23 | |
| (5 | ) |
| 18 | |
| 70 | |
| (26 | ) |
| 44 | | ||||||
Net change | (401 | ) |
| 126 | |
| (275 | ) |
| 61 | |
| (23 | ) |
| 38 | | ||||||
Employee benefit plans: |
|
|
|
|
|
|
|
|
|
|
| ||||||||||||
Reclassifications into earnings: |
|
|
|
|
|
|
|
|
|
|
| ||||||||||||
Prior service cost | (1 | ) |
| - | |
| (1 | ) |
| 1 | |
| - | |
| 1 | | ||||||
Net actuarial losses | 42 | |
| (11 | ) |
| 31 | |
| 42 | |
| (16 | ) |
| 26 | | ||||||
Net realized losses reclassified into earnings (4) | 41 | |
| (11 | ) |
| 30 | |
| 43 | |
| (16 | ) |
| 27 | | ||||||
Settlements, curtailments and other | - | |
| - | |
| - | |
| - | |
| - | |
| - | | ||||||
Net change | 41 | |
| (11 | ) |
| 30 | |
| 43 | |
| (16 | ) |
| 27 | | ||||||
Foreign currency: |
|
|
|
|
|
|
|
|
|
|
| ||||||||||||
Net decrease in fair value | (82 | ) |
| 34 | |
| (48 | ) |
| (131 | ) |
| 108 | |
| (23 | ) | ||||||
Net realized (gains) losses reclassified into earnings (3) | 1 | |
| (1 | ) |
| - | |
| (12 | ) |
| 32 | |
| 20 | | ||||||
Net change | (81 | ) |
| 33 | |
| (48 | ) |
| (143 | ) |
| 140 | |
| (3 | ) | ||||||
Total other comprehensive income (loss) | $ | (5,407 | ) |
| $ | 1,424 | |
| $ | (3,983 | ) |
| $ | (193 | ) |
| $ | 165 | |
| $ | (28 | ) |
(1) | Effective January 1, 2018, the Corporation adopted the new accounting standard on tax effects in accumulated OCI related to the Tax Act. Accordingly, certain tax effects were reclassified from accumulated OCI to retained earnings. For additional information, see Note 1 – Summary of Significant Accounting Principles . |
(2) | Reflects the Corporation's adoption of the new hedge accounting standard. For additional information, see Note 1 – Summary of Significant Accounting Principles . |
(3) | Reclassifications of pretax debt and equity securities, DVA and foreign currency (gains) losses are recorded in other income in the Consolidated Statement of Income. |
(4) | Reclassifications of pretax employee benefit plan costs are recorded in other general operating expense in the Consolidated Statement of Income. |
91 Bank of America |
|
|
NOTE 13
Earnings Per Common Share
The calculation of earnings per common share (EPS) and diluted EPS for the three months ended March 31, 2018 and 2017 is presented below. For more information on the calculation of EPS, see Note 1 – Summary of Significant Accounting Principles to the Consolidated Financial Statements of the Corporation's 2017 Annual Report on Form 10-K.
|
|
|
| ||||
| Three Months Ended March 31 | ||||||
(In millions, except per share information) | 2018 |
| 2017 | ||||
Earnings per common share |
| |
|
| | ||
Net income | $ | 6,918 | |
| $ | 5,337 | |
Preferred stock dividends | (428 | ) |
| (502 | ) | ||
Net income applicable to common shareholders | $ | 6,490 | |
| $ | 4,835 | |
Average common shares issued and outstanding | 10,322.4 | |
| 10,099.6 | | ||
Earnings per common share | $ | 0.63 | |
| $ | 0.48 | |
|
|
|
| ||||
Diluted earnings per common share |
| |
|
| | ||
Net income applicable to common shareholders | $ | 6,490 | |
| $ | 4,835 | |
Add preferred stock dividends due to assumed conversions (1) | - | |
| 75 | | ||
Net income allocated to common shareholders | $ | 6,490 | |
| $ | 4,910 | |
Average common shares issued and outstanding | 10,322.4 | |
| 10,099.6 | | ||
Dilutive potential common shares (2) | 150.3 | |
| 820.1 | | ||
Total diluted average common shares issued and outstanding | 10,472.7 | |
| 10,919.7 | | ||
Diluted earnings per common share | $ | 0.62 | |
| $ | 0.45 | |
(1) | Represents the Series T dividends under the "if-converted" method prior to conversion. |
(2) | Includes incremental dilutive shares from RSUs, restricted stock and warrants. |
The Corporation previously issued warrants to purchase 700 million shares of the Corporation's common stock to the holders of the Series T 6% Non-cumulative preferred stock (Series T). In the third quarter of 2017, the Series T holders exercised the warrants and acquired the 700 million shares of the Corporation's common stock. For the three months ended March 31, 2017 , the 700 million average dilutive potential common shares were included in the diluted share count under the "if-converted" method.
For the three months ended March 31, 2018 and 2017 , 62 million average dilutive potential common shares associated with the Series L preferred stock were not included in the diluted share count because the result would have been antidilutive under the "if-converted" method. For the three months ended March 31, 2018 and 2017 , average options to purchase seven million and 30 million shares of common stock were outstanding but not included in the computation of EPS because the result would have been antidilutive under the treasury stock method. For the three months ended March 31, 2018 , average warrants to purchase 264 million shares of common stock were included in the diluted EPS calculation under the treasury stock method compared to 150 million shares of common stock for the three months ended March 31, 2017 . For the three months ended March 31, 2017 , average warrants to purchase 122 million shares of common stock were outstanding but not included in the computation of EPS because the result would have been antidilutive under the treasury stock method.
NOTE 14
Fair Value Measurements
Under applicable accounting standards, fair value is defined as the exchange price that would be received for an asset or paid to transfer a liability (an exit price) in the principal or most advantageous market for the asset or liability in an orderly transaction between market participants on the measurement date. The Corporation determines the fair values of its financial instruments under applicable accounting standards and conducts a review of its fair value hierarchy classifications on a quarterly basis. Transfers into or out of fair value hierarchy classifications are considered to be effective as of the beginning of the quarter in which they occur. During the three months ended March 31, 2018 , there were no changes to valuation approaches or techniques that had, or are expected to have, a material impact on the Corporation's consolidated financial position or results of operations.
For more information regarding the fair value hierarchy and how the Corporation measures fair value and valuation processes and techniques, see Note 1 – Summary of Significant Accounting Principles and Note 20 – Fair Value Measurements to the Consolidated Financial Statements of the Corporation's 2017 Annual Report on Form 10-K . The Corporation accounts for certain financial instruments under the fair value option. For additional information, see Note 15 – Fair Value Option .
|
| Bank of America 92 |
Recurring Fair Value
Assets and liabilities carried at fair value on a recurring basis at March 31, 2018 and December 31, 2017 , including financial instruments which the Corporation accounts for under the fair value option, are summarized in the following tables.
|
|
|
|
|
|
|
|
|
| ||||||||||
| March 31, 2018 | ||||||||||||||||||
| Fair Value Measurements |
|
|
|
| ||||||||||||||
(Dollars in millions) | Level 1 |
| Level 2 |
| Level 3 |
| Netting Adjustments (1) |
| Assets/Liabilities at Fair Value | ||||||||||
Assets |
| |
|
| |
|
| |
|
| |
|
| | |||||
Federal funds sold and securities borrowed or purchased under agreements to resell | $ | - | |
| $ | 68,556 | |
| $ | - | |
| $ | - | |
| $ | 68,556 | |
Trading account assets: |
| |
|
| |
|
| |
|
| |
|
| | |||||
U.S. Treasury and agency securities (2) | 35,219 | |
| 2,473 | |
| - | |
| - | |
| 37,692 | | |||||
Corporate securities, trading loans and other | - | |
| 31,556 | |
| 1,716 | |
| - | |
| 33,272 | | |||||
Equity securities | 40,949 | |
| 24,724 | |
| 212 | |
| - | |
| 65,885 | | |||||
Non-U.S. sovereign debt | 7,459 | |
| 25,381 | |
| 401 | |
| - | |
| 33,241 | | |||||
Mortgage trading loans, MBS and ABS: |
|
|
|
|
|
|
|
|
| ||||||||||
U.S. government-sponsored agency guaranteed (2) | - | |
| 18,380 | |
| - | |
| - | |
| 18,380 | | |||||
Mortgage trading loans, ABS and other MBS | - | |
| 8,635 | |
| 1,372 | |
| - | |
| 10,007 | | |||||
Total trading account assets (3) | 83,627 | |
| 111,149 | |
| 3,701 | |
| - | |
| 198,477 | | |||||
Derivative assets (4) | 9,873 | |
| 345,940 | |
| 4,545 | |
| (312,489 | ) |
| 47,869 | | |||||
AFS debt securities: |
| |
|
| |
|
| |
|
| |
|
| | |||||
U.S. Treasury and agency securities | 51,412 | |
| 1,560 | |
| - | |
| - | |
| 52,972 | | |||||
Mortgage-backed securities: |
| |
|
| |
|
| |
|
| |
|
| | |||||
Agency | - | |
| 184,111 | |
| - | |
| - | |
| 184,111 | | |||||
Agency-collateralized mortgage obligations | - | |
| 6,398 | |
| - | |
| - | |
| 6,398 | | |||||
Non-agency residential | - | |
| 2,604 | |
| - | |
| - | |
| 2,604 | | |||||
Commercial | - | |
| 13,559 | |
| - | |
| - | |
| 13,559 | | |||||
Non-U.S. securities | 751 | |
| 6,151 | |
| 23 | |
| - | |
| 6,925 | | |||||
Other taxable securities | - | |
| 4,671 | |
| 43 | |
| - | |
| 4,714 | | |||||
Tax-exempt securities | - | |
| 19,077 | |
| - | |
| - | |
| 19,077 | | |||||
Total AFS debt securities | 52,163 | |
| 238,131 | |
| 66 | |
| - | |
| 290,360 | | |||||
Other debt securities carried at fair value: |
|
|
|
|
|
|
|
|
| ||||||||||
Mortgage-backed securities: |
|
|
|
|
|
|
|
|
| ||||||||||
Non-agency residential | - | |
| 2,736 | |
| - | |
| - | |
| 2,736 | | |||||
Non-U.S. securities | 8,621 | |
| 1,355 | |
| - | |
| - | |
| 9,976 | | |||||
Other taxable securities | - | |
| 226 | |
| - | |
| - | |
| 226 | | |||||
Total other debt securities carried at fair value | 8,621 | |
| 4,317 | |
| - | |
| - | |
| 12,938 | | |||||
Loans and leases | - | |
| 5,463 | |
| 526 | |
| - | |
| 5,989 | | |||||
Loans held-for-sale | - | |
| 2,406 | |
| 685 | |
| - | |
| 3,091 | | |||||
Other assets (5) | 15,376 | |
| 1,904 | |
| 3,295 | |
| - | |
| 20,575 | | |||||
Total assets | $ | 169,660 | |
| $ | 777,866 | |
| $ | 12,818 | |
| $ | (312,489 | ) |
| $ | 647,855 | |
Liabilities |
| |
|
| |
|
| |
|
| |
|
| | |||||
Interest-bearing deposits in U.S. offices | $ | - | |
| $ | 435 | |
| $ | - | |
| $ | - | |
| $ | 435 | |
Federal funds purchased and securities loaned or sold under agreements to repurchase | - | |
| 35,116 | |
| - | |
| - | |
| 35,116 | | |||||
Trading account liabilities: |
| |
|
| |
|
| |
|
| |
|
| ||||||
U.S. Treasury and agency securities | 15,205 | |
| 293 | |
| - | |
| - | |
| 15,498 | | |||||
Equity securities | 43,434 | |
| 5,061 | |
| - | |
| - | |
| 48,495 | | |||||
Non-U.S. sovereign debt | 17,210 | |
| 11,080 | |
| - | |
| - | |
| 28,290 | | |||||
Corporate securities and other | - | |
| 7,909 | |
| 26 | |
| - | |
| 7,935 | | |||||
Total trading account liabilities | 75,849 | |
| 24,343 | |
| 26 | |
| - | |
| 100,218 | | |||||
Derivative liabilities (4) | 9,374 | |
| 325,832 | |
| 5,683 | |
| (306,989 | ) |
| 33,900 | | |||||
Short-term borrowings | - | |
| 2,284 | |
| - | |
| - | |
| 2,284 | | |||||
Accrued expenses and other liabilities | 18,131 | |
| 2,037 | |
| 8 | |
| - | |
| 20,176 | | |||||
Long-term debt | - | |
| 28,711 | |
| 1,351 | |
| - | |
| 30,062 | | |||||
Total liabilities | $ | 103,354 | |
| $ | 418,758 | |
| $ | 7,068 | |
| $ | (306,989 | ) |
| $ | 222,191 | |
(1) | Amounts represent the impact of legally enforceable master netting agreements and also cash collateral held or placed with the same counterparties. |
(2) | Includes $19.1 billion of GSE obligations. |
(3) | Includes securities with a fair value of $16.4 billion that were segregated in compliance with securities regulations or deposited with clearing organizations. This amount is included in the parenthetical disclosure on the Consolidated Balance Sheet. |
(4) | During the three months ended March 31, 2018 , $364 million of derivative assets and $188 million of derivative liabilities were transferred from Level 1 to Level 2 and $916 million of derivative assets and $663 million of derivative liabilities were transferred from Level 2 to Level 1 based on the observability of inputs used to measure fair value. For further disaggregation of derivative assets and liabilities, see Note 3 – Derivatives . |
(5) | Includes MSRs of $2.3 billion . |
93 Bank of America |
|
|
|
|
|
|
|
|
|
|
|
| ||||||||||
| December 31, 2017 | ||||||||||||||||||
| Fair Value Measurements |
|
|
|
| ||||||||||||||
(Dollars in millions) | Level 1 |
| Level 2 |
| Level 3 |
| Netting Adjustments (1) |
| Assets/Liabilities at Fair Value | ||||||||||
Assets |
| |
|
| |
|
| |
|
| |
|
| | |||||
Federal funds sold and securities borrowed or purchased under agreements to resell | $ | - | |
| $ | 52,906 | |
| $ | - | |
| $ | - | |
| $ | 52,906 | |
Trading account assets: |
| |
|
| |
|
| |
|
| |
|
| | |||||
U.S. Treasury and agency securities (2, 3) | 38,720 | |
| 1,922 | |
| - | |
| - | |
| 40,642 | | |||||
Corporate securities, trading loans and other | - | |
| 28,714 | |
| 1,864 | |
| - | |
| 30,578 | | |||||
Equity securities (3) | 60,747 | |
| 23,958 | |
| 235 | |
| - | |
| 84,940 | | |||||
Non-U.S. sovereign debt (3) | 6,545 | |
| 15,839 | |
| 556 | |
| - | |
| 22,940 | | |||||
Mortgage trading loans, MBS and ABS: |
|
|
|
|
|
|
|
|
| ||||||||||
U.S. government-sponsored agency guaranteed (2) | - | |
| 20,586 | |
| - | |
| - | |
| 20,586 | | |||||
Mortgage trading loans, ABS and other MBS | - | |
| 8,174 | |
| 1,498 | |
| - | |
| 9,672 | | |||||
Total trading account assets (4) | 106,012 | |
| 99,193 | |
| 4,153 | |
| - | |
| 209,358 | | |||||
Derivative assets (3) | 6,305 | |
| 341,178 | |
| 4,067 | |
| (313,788 | ) |
| 37,762 | | |||||
AFS debt securities: |
| |
|
| |
|
| |
|
| |
|
| | |||||
U.S. Treasury and agency securities | 51,915 | |
| 1,608 | |
| - | |
| - | |
| 53,523 | | |||||
Mortgage-backed securities: |
| |
|
| |
|
| |
|
| |
|
| | |||||
Agency | - | |
| 192,929 | |
| - | |
| - | |
| 192,929 | | |||||
Agency-collateralized mortgage obligations | - | |
| 6,804 | |
| - | |
| - | |
| 6,804 | | |||||
Non-agency residential | - | |
| 2,669 | |
| - | |
| - | |
| 2,669 | | |||||
Commercial | - | |
| 13,684 | |
| - | |
| - | |
| 13,684 | | |||||
Non-U.S. securities | 772 | |
| 5,880 | |
| 25 | |
| - | |
| 6,677 | | |||||
Other taxable securities | - | |
| 5,261 | |
| 509 | |
| - | |
| 5,770 | | |||||
Tax-exempt securities | - | |
| 20,106 | |
| 469 | |
| - | |
| 20,575 | | |||||
Total AFS debt securities | 52,687 | |
| 248,941 | |
| 1,003 | |
| - | |
| 302,631 | | |||||
Other debt securities carried at fair value: |
|
|
|
|
|
|
|
|
| ||||||||||
Mortgage-backed securities: |
|
|
|
|
|
|
|
|
| ||||||||||
Agency-collateralized mortgage obligations | - | |
| 5 | |
| - | |
| - | |
| 5 | | |||||
Non-agency residential | - | |
| 2,764 | |
| - | |
| - | |
| 2,764 | | |||||
Non-U.S. securities | 8,191 | |
| 1,297 | |
| - | |
| - | |
| 9,488 | | |||||
Other taxable securities | - | |
| 229 | |
| - | |
| - | |
| 229 | | |||||
Total other debt securities carried at fair value | 8,191 | |
| 4,295 | |
| - | |
| - | |
| 12,486 | | |||||
Loans and leases | - | |
| 5,139 | |
| 571 | |
| - | |
| 5,710 | | |||||
Loans held-for-sale | - | |
| 1,466 | |
| 690 | |
| - | |
| 2,156 | | |||||
Other assets (5) | 19,367 | |
| 789 | |
| 2,425 | |
| - | |
| 22,581 | | |||||
Total assets | $ | 192,562 | |
| $ | 753,907 | |
| $ | 12,909 | |
| $ | (313,788 | ) |
| $ | 645,590 | |
Liabilities |
| |
|
| |
|
| |
|
| |
|
| | |||||
Interest-bearing deposits in U.S. offices | $ | - | |
| $ | 449 | |
| $ | - | |
| $ | - | |
| $ | 449 | |
Federal funds purchased and securities loaned or sold under agreements to repurchase | - | |
| 36,182 | |
| - | |
| - | |
| 36,182 | | |||||
Trading account liabilities: |
| |
|
| |
|
| |
|
| |
|
| ||||||
U.S. Treasury and agency securities | 17,266 | |
| 734 | |
| - | |
| - | |
| 18,000 | | |||||
Equity securities (3) | 33,019 | |
| 3,885 | |
| - | |
| - | |
| 36,904 | | |||||
Non-U.S. sovereign debt (3) | 11,976 | |
| 7,382 | |
| - | |
| - | |
| 19,358 | | |||||
Corporate securities and other | - | |
| 6,901 | |
| 24 | |
| - | |
| 6,925 | | |||||
Total trading account liabilities | 62,261 | |
| 18,902 | |
| 24 | |
| - | |
| 81,187 | | |||||
Derivative liabilities (3) | 6,029 | |
| 334,261 | |
| 5,781 | |
| (311,771 | ) |
| 34,300 | | |||||
Short-term borrowings | - | |
| 1,494 | |
| - | |
| - | |
| 1,494 | | |||||
Accrued expenses and other liabilities | 21,887 | |
| 945 | |
| 8 | |
| - | |
| 22,840 | | |||||
Long-term debt | - | |
| 29,923 | |
| 1,863 | |
| - | |
| 31,786 | | |||||
Total liabilities | $ | 90,177 | |
| $ | 422,156 | |
| $ | 7,676 | |
| $ | (311,771 | ) |
| $ | 208,238 | |
(1) | Amounts represent the impact of legally enforceable master netting agreements and also cash collateral held or placed with the same counterparties. |
(2) | Includes $21.3 billion of GSE obligations. |
(3) | During 2017 , for trading account assets and liabilities, $1.1 billion of U.S. Treasury and agency securities assets, $5.3 billion of equity securities assets, $3.1 billion of equity securities liabilities, $3.3 billion of non-U.S. sovereign debt assets and $1.5 billion of non-U.S. sovereign debt liabilities were transferred from Level 1 to Level 2 based on the liquidity of the positions. In addition, $14.1 billion of equity securities assets and $4.3 billion of equity securities liabilities were transferred from Level 2 to Level 1. Also in 2017 , $4.2 billion of derivative assets and $3.0 billion of derivative liabilities were transferred from Level 1 to Level 2 and $758 million of derivative assets and $608 million of derivative liabilities were transferred from Level 2 to Level 1 based on the observability of inputs used to measure fair value. For further disaggregation of derivative assets and liabilities, see Note 3 – Derivatives . |
(4) | Includes securities with a fair value of $16.8 billion that were segregated in compliance with securities regulations or deposited with clearing organizations. This amount is included in the parenthetical disclosure on the Consolidated Balance Sheet. |
(5) | Includes MSRs of $2.3 billion . |
|
| Bank of America 94 |
The following tables present a reconciliation of all assets and liabilities measured at fair value on a recurring basis using significant unobservable inputs (Level 3) during the three months ended March 31, 2018 and 2017 , including net realized and unrealized gains (losses) included in earnings and accumulated OCI.
|
|
|
|
|
|
|
|
|
|
|
| ||||||||||||||||||||||
Level 3 – Fair Value Measurements for the Three Months Ended March 31, 2018 (1) | |||||||||||||||||||||||||||||||||
|
|
| |||||||||||||||||||||||||||||||
(Dollars in millions) | Balance January 1 2018 | Total Realized/Unrealized Gains (Losses) (2) | Gains | Gross | Gross Level 3 | Gross Level 3 | Balance | Change in Unrealized Gains (Losses) Related to Financial Instruments Still Held (2) | |||||||||||||||||||||||||
Purchases | Sales | Issuances | Settlements | ||||||||||||||||||||||||||||||
Trading account assets: |
| |
| |
| |
| |
|
|
|
| |
| |
| |
| |||||||||||||||
Corporate securities, trading loans and other | $ | 1,864 | | $ | 9 | | $ | - | | $ | 193 | | $ | (136 | ) | $ | - | | $ | (139 | ) | $ | 103 | | $ | (178 | ) | $ | 1,716 | | $ | (15 | ) |
Equity securities | 235 | | 8 | | - | | 6 | | (7 | ) | - | | - | | 1 | | (31 | ) | 212 | | 8 | | |||||||||||
Non-U.S. sovereign debt | 556 | | 16 | | 2 | | - | | (50 | ) | - | | (8 | ) | - | | (115 | ) | 401 | | 16 | | |||||||||||
Mortgage trading loans, ABS and other MBS | 1,498 | | 99 | | 3 | | 125 | | (320 | ) | - | | (69 | ) | 94 | | (58 | ) | 1,372 | | 83 | | |||||||||||
Total trading account assets | 4,153 | | 132 | | 5 | | 324 | | (513 | ) | - | | (216 | ) | 198 | | (382 | ) | 3,701 | | 92 | | |||||||||||
Net derivative assets (4) | (1,714 | ) | 495 | | - | | 153 | | (262 | ) | - | | 202 | | 71 | | (83 | ) | (1,138 | ) | 517 | | |||||||||||
AFS debt securities: |
| |
| |
| |
| |
| |
| |
| |
| |
| |
| |
| ||||||||||||
Non-U.S. securities | 25 | | - | | - | | - | | - | | - | | (2 | ) | - | | - | | 23 | | - | | |||||||||||
Other taxable securities | 509 | | 1 | | - | | - | | - | | - | | (7 | ) | - | | (460 | ) | 43 | | - | | |||||||||||
Tax-exempt securities | 469 | | - | | - | | - | | - | | - | | - | | - | | (469 | ) | - | | - | | |||||||||||
Total AFS debt securities (5) | 1,003 | | 1 | | - | | - | | - | | - | | (9 | ) | - | | (929 | ) | 66 | | - | | |||||||||||
Loans and leases (6, 7) | 571 | | (16 | ) | - | | - | | (4 | ) | - | | (25 | ) | - | | - | | 526 | | (16 | ) | |||||||||||
Loans held-for-sale (6) | 690 | | 24 | | - | | 12 | | - | | - | | (41 | ) | - | | - | | 685 | | 21 | | |||||||||||
Other assets (5, 7, 8) | 2,425 | | 192 | | - | | - | | (38 | ) | 29 | | (242 | ) | 929 | | - | | 3,295 | | 120 | | |||||||||||
Trading account liabilities – Corporate securities and other | (24 | ) | 1 | | - | | - | | (2 | ) | (1 | ) | - | | - | | - | | (26 | ) | 1 | | |||||||||||
Accrued expenses and other liabilities (6) | (8 | ) | - | | - | | - | | - | | - | | - | | - | | - | | (8 | ) | - | | |||||||||||
Long-term debt (6) | (1,863 | ) | 23 | | 1 | | 5 | | - | | (67 | ) | 172 | | (33 | ) | 411 | | (1,351 | ) | 26 | | |||||||||||
(1) | Assets (liabilities). For assets, increase (decrease) to Level 3 and for liabilities, (increase) decrease to Level 3. |
(2) | Includes gains (losses) reported in earnings in the following income statement line items: Trading account assets/liabilities - primarily trading account profits; Net derivative assets - primarily trading account profits and other income; Other assets - primarily other income related to MSRs; Long-term debt - primarily trading account profits. For MSRs, the amounts reflect the changes in modeled MSR fair value due to observed changes in interest rates, volatility, spreads and the shape of the forward swap curve, and periodic adjustments to the valuation model to reflect changes in the modeled relationships between inputs and projected cash flows, as well as changes in cash flow assumptions including cost to service. |
(3) | Includes unrealized gains (losses) in OCI on foreign currency translation adjustments and the impact of changes in the Corporation's credit spreads on long-term debt accounted for under the fair value option. For more information, see Note 1 – Summary of Significant Accounting Principles to the Consolidated Financial Statements of the Corporation's 2017 Annual Report on Form 10-K . |
(4) | Net derivatives include derivative assets of $4.5 billion and derivative liabilities of $5.7 billion . |
(5) | Transfer relates to the reclassification of certain securities. |
(6) | Amounts represent instruments that are accounted for under the fair value option. |
(7) | Issuances represent loan originations and MSRs recognized following securitizations or whole-loan sales. |
(8) | Settlements primarily represent the net change in fair value of the MSR asset due to the recognition of modeled cash flows and the passage of time. |
Transfers into Level 3, primarily due to decreased price observability, during the three months ended March 31, 2018 included $198 million of trading account assets.
Transfers out of Level 3, primarily due to increased price observability, during the three months ended March 31, 2018
included $382 million of trading account assets and $411 million of long-term debt. Transfers occur on a regular basis for long-term debt instruments due to changes in the impact of unobservable inputs on the value of the embedded derivative in relation to the instrument as a whole.
95 Bank of America |
|
|
|
|
|
|
|
|
|
|
|
|
|
| ||||||||||||||||||||||
Level 3 – Fair Value Measurements for the Three Months Ended March 31, 2017 (1) | |||||||||||||||||||||||||||||||||
|
|
| |||||||||||||||||||||||||||||||
| Balance 2017 | Total Realized/Unrealized Gains (Losses) (2) | Gains | Gross | Gross Level 3 | Gross Level 3 | Balance | Change in Unrealized Gains (Losses) Related to Financial Instruments Still Held (2) | |||||||||||||||||||||||||
(Dollars in millions) | Purchases | Sales | Issuances | Settlements | |||||||||||||||||||||||||||||
Trading account assets: |
| |
| |
| |
|
|
|
| |
|
| |
| |
| ||||||||||||||||
Corporate securities, trading loans and other | $ | 2,777 | | $ | 84 | | $ | - | | $ | 199 | | $ | (480 | ) | $ | - | | $ | (127 | ) | $ | 75 | | $ | (499 | ) | $ | 2,029 | | $ | 56 | |
Equity securities | 281 | | 12 | | - | | 20 | | (17 | ) | - | | (10 | ) | 72 | | (70 | ) | 288 | | 8 | | |||||||||||
Non-U.S. sovereign debt | 510 | | 19 | | 10 | | - | | (9 | ) | - | | (6 | ) | 3 | | - | | 527 | | 19 | | |||||||||||
Mortgage trading loans, ABS and other MBS | 1,211 | | 107 | | - | | 339 | | (375 | ) | - | | (54 | ) | 28 | | (41 | ) | 1,215 | | 74 | | |||||||||||
Total trading account assets | 4,779 | | 222 | | 10 | | 558 | | (881 | ) | - | | (197 | ) | 178 | | (610 | ) | 4,059 | | 157 | | |||||||||||
Net derivative assets (4) | (1,313 | ) | (474 | ) | - | | 200 | | (247 | ) | - | | 170 | | 29 | | (30 | ) | (1,665 | ) | (489 | ) | |||||||||||
AFS debt securities: |
| |
| |
| |
|
|
|
| |
| |
| |
| |
| |||||||||||||||
Non-U.S. securities | 229 | | - | | 3 | | 20 | | - | | - | | (45 | ) | - | | - | | 207 | | - | | |||||||||||
Other taxable securities | 594 | | 3 | | 4 | | - | | - | | - | | (22 | ) | - | | - | | 579 | | - | | |||||||||||
Tax-exempt securities | 542 | | - | | 2 | | - | | (56 | ) | - | | (3 | ) | 35 | | - | | 520 | | - | | |||||||||||
Total AFS debt securities | 1,365 | | 3 | | 9 | | 20 | | (56 | ) | - | | (70 | ) | 35 | | - | | 1,306 | | - | | |||||||||||
Other debt securities carried at fair value – Non-agency residential MBS | 25 | | (1 | ) | - | | - | | - | | - | | - | | - | | - | | 24 | | - | | |||||||||||
Loans and leases (5, 6) | 720 | | 12 | | - | | - | | - | | - | | (30 | ) | - | | - | | 702 | | 12 | | |||||||||||
Loans held-for-sale (5) | 656 | | 29 | | 6 | | - | | (136 | ) | - | | (60 | ) | 315 | | (18 | ) | 792 | | 22 | | |||||||||||
Other assets (6, 7) | 2,986 | | (33 | ) | - | | - | | 5 | | 75 | | (192 | ) | - | | - | | 2,841 | | (123 | ) | |||||||||||
Federal funds purchased and securities loaned or sold under agreements to repurchase (5) | (359 | ) | 1 | | - | | - | | - | | (2 | ) | 28 | | - | | 106 | | (226 | ) | 1 | | |||||||||||
Trading account liabilities – Corporate securities and other | (27 | ) | 2 | | - | | - | | (10 | ) | - | | - | | - | | - | | (35 | ) | 2 | | |||||||||||
Accrued expenses and other liabilities (5) | (9 | ) | - | | - | | - | | - | | - | | - | | - | | - | | (9 | ) | - | | |||||||||||
Long-term debt (5) | (1,514 | ) | (83 | ) | 7 | | 11 | | - | | (130 | ) | 159 | | (178 | ) | 68 | | (1,660 | ) | (83 | ) | |||||||||||
(1) | Assets (liabilities). For assets, increase (decrease) to Level 3 and for liabilities, (increase) decrease to Level 3. |
(2) | Includes gains (losses) reported in earnings in the following income statement line items: Trading account assets/liabilities - trading account profits; Net derivative assets - primarily trading account profits and other income; Other assets - primarily other income related to MSRs; Long-term debt - primarily trading account profits. For MSRs, the amounts reflect the changes in modeled MSR fair value due to observed changes in interest rates, volatility, spreads and the shape of the forward swap curve, and periodic adjustments to the valuation model to reflect changes in the modeled relationships between inputs and projected cash flows, as well as changes in cash flow assumptions including cost to service. |
(3) | Includes gains (losses) in OCI related to unrealized gains (losses) on AFS debt securities, foreign currency translation adjustments and the impact of changes in the Corporation's credit spreads on long-term debt accounted for under the fair value option. For additional information, see Note 1 – Summary of Significant Accounting Principles to the Consolidated Financial Statements of the Corporation's 2017 Annual Report on Form 10-K . |
(4) | Net derivatives include derivative assets of $4.2 billion and derivative liabilities of $5.8 billion . |
(5) | Amounts represent instruments that are accounted for under the fair value option. |
(6) | Issuances represent loan originations and MSRs recognized following securitizations or whole-loan sales. |
(7) | Settlements represent the net change in fair value of the MSR asset due to the recognition of modeled cash flows and the passage of time. |
Transfers into Level 3, primarily due to decreased price observability, during the three months ended March 31, 2017 included $178 million of trading account assets, $315 million of LHFS and $178 million of long-term debt. Transfers occur on a regular basis for long-term debt instruments due to changes in the impact of unobservable inputs on the value of the embedded derivative in relation to the instrument as a whole.
Transfers out of Level 3, primarily due to increased price observability, during the three months ended March 31, 2017 included $610 million of trading account assets and $106 million of federal funds purchased and securities loaned or sold under agreements to repurchase.
|
| Bank of America 96 |
The following tables present information about significant unobservable inputs related to the Corporation's material categories of Level 3 financial assets and liabilities at March 31, 2018 and December 31, 2017 .
|
|
|
|
|
| ||||
Quantitative Information about Level 3 Fair Value Measurements at March 31, 2018 |
| ||||||||
|
|
|
|
| |||||
(Dollars in millions) |
|
| Inputs | ||||||
Financial Instrument | Fair Value | Valuation Technique | Significant Unobservable Inputs | Ranges of Inputs | Weighted Average | ||||
Loans and Securities (1) |
|
|
|
|
| ||||
Instruments backed by residential real estate assets | $ | 845 | | Discounted cash flow | Yield | 0% to 25% | | 6 | % |
Trading account assets – Mortgage trading loans, ABS and other MBS | 318 | | Prepayment speed | 0% to 20% CPR | | 11 | % | ||
Loans and leases | 525 | | Default rate | 0% to 2% CDR | | 1 | % | ||
Loans held-for-sale | 2 | | Loss severity | 0% to 52% | | 17 | % | ||
Instruments backed by commercial real estate assets | $ | 299 | | Discounted cash flow | Yield | 0% to 25% | | 9 | % |
Trading account assets – Corporate securities, trading loans and other | 265 | | Price | $0 to $100 | | $67 | |||
Trading account assets – Mortgage trading loans, ABS and other MBS | 34 | |
|
|
| ||||
Commercial loans, debt securities and other | $ | 3,592 | | Discounted cash flow, Market comparables | Yield | 0% to 12% | | 5 | % |
Trading account assets – Corporate securities, trading loans and other | 1,444 | | Prepayment speed | 10% to 20% | | 15 | % | ||
Trading account assets – Non-U.S. sovereign debt | 401 | | Default rate | 3% to 4% | | 4 | % | ||
Trading account assets – Mortgage trading loans, ABS and other MBS | 1,020 | | Loss severity | 35% to 40% | | 38 | % | ||
AFS debt securities – Other taxable securities | 43 | | Price | $0 to $141 | | $66 | |||
Loans and leases | 1 | |
|
|
| ||||
Loans held-for-sale | 683 | |
|
|
| ||||
Other assets, primarily auction rate securities | $ | 999 | | Discounted cash flow, Market comparables | Price | $10 to $100 | | $96 | |
|
|
|
|
| |||||
|
|
|
|
| |||||
MSRs | $ | 2,296 | | Discounted cash flow | Weighted-average life, fixed rate (4) | 0 to 14 years | | 6 years | |
|
| Weighted-average life, variable rate (4) | 0 to 10 years | | 3 years | | |||
|
| Option Adjusted Spread, fixed rate | 9% to 14% | | 10 | % | |||
|
| Option Adjusted Spread, variable rate | 9% to 15% | | 12 | % | |||
Structured liabilities |
|
|
|
|
| ||||
Long-term debt | $ | (1,351 | ) | Discounted cash flow, Market comparables, Industry standard derivative pricing (2) | Equity correlation | 7% to 100% | | 68 | % |
|
| Long-dated equity volatilities | 4% to 70% | | 23 | % | |||
|
| Yield | 7.5 | % | n/a | | |||
|
| Price | $0 to $100 | | $73 | ||||
Net derivative assets |
|
|
|
|
| ||||
Credit derivatives | $ | (298 | ) | Discounted cash flow, Stochastic recovery correlation model | Yield | 2% to 4% | | 3 | % |
|
| Upfront points | 0 points to 100 points | | 71 points | | |||
|
| Credit correlation | 22% to 80% | | 38 | % | |||
|
| Prepayment speed | 15% to 20% CPR | | 15 | % | |||
|
| Default rate | 1% to 4% CDR | | 2 | % | |||
|
| Loss severity | 35 | % | n/a | | |||
|
| Price | $1 to $83 | | $73 | ||||
Equity derivatives | $ | (1,508 | ) | Industry standard derivative pricing (2) | Equity correlation | 7% to 100% | | 68 | % |
|
| Long-dated equity volatilities | 4% to 70% | | 23 | % | |||
Commodity derivatives | $ | 2 | | Discounted cash flow, Industry standard derivative pricing (2) | Natural gas forward price | $1/MMBtu to $5/MMBtu | | $3/MMBtu | |
|
| Correlation | 65% to 93% | | 79 | % | |||
|
| Volatilities | 11% to 196% | | 60 | % | |||
Interest rate derivatives | $ | 666 | | Industry standard derivative pricing (3) | Correlation (IR/IR) | 15% to 70% | | 43 | % |
|
| Correlation (FX/IR) | 0% to 46% | | 1 | % | |||
|
| Long-dated inflation rates | -18% to 34% | | 2 | % | |||
|
| Long-dated inflation volatilities | 0% to 1% | | 1 | % | |||
Total net derivative assets | $ | (1,138 | ) |
|
|
|
| ||
(1) | The categories are aggregated based upon product type which differs from financial statement classification. The following is a reconciliation to the line items in the table on page 93 : Trading account assets – Corporate securities, trading loans and other of $1.7 billion , Trading account assets – Non-U.S. sovereign debt of $401 million , Trading account assets – Mortgage trading loans, ABS and other MBS of $1.4 billion , Other assets of $999 million , Loans and leases of $526 million and LHFS of $685 million . |
(2) | Includes models such as Monte Carlo simulation and Black-Scholes. |
(3) | Includes models such as Monte Carlo simulation, Black-Scholes and other methods that model the joint dynamics of interest, inflation and foreign exchange rates. |
(4) | The weighted-average life is a product of changes in market rates of interest, prepayment rates and other model and cash flow assumptions. |
CPR = Constant Prepayment Rate
CDR = Constant Default Rate
MMBtu = Million British thermal units
IR = Interest Rate
FX = Foreign Exchange
n/a = not applicable
97 Bank of America |
|
|
|
|
|
|
|
| ||||
Quantitative Information about Level 3 Fair Value Measurements at December 31, 2017 | |||||||||
|
|
|
|
| |||||
(Dollars in millions) |
|
| Inputs | ||||||
Financial Instrument | Fair | Valuation | Significant Unobservable | Ranges of | Weighted Average | ||||
Loans and Securities (1) |
|
|
|
|
| ||||
Instruments backed by residential real estate assets | $ | 871 | | Discounted cash flow | Yield | 0% to 25% | | 6 | % |
Trading account assets – Mortgage trading loans, ABS and other MBS | 298 | | Prepayment speed | 0% to 22% CPR | | 12 | % | ||
Loans and leases | 570 | | Default rate | 0% to 3% CDR | | 1 | % | ||
Loans held-for-sale | 3 | | Loss severity | 0% to 53% | | 17 | % | ||
Instruments backed by commercial real estate assets | $ | 286 | | Discounted cash flow | Yield | 0% to 25% | | 9 | % |
Trading account assets – Corporate securities, trading loans and other | 244 | | Price | $0 to $100 | | $67 | |||
Trading account assets – Mortgage trading loans, ABS and other MBS | 42 | |
|
|
| ||||
Commercial loans, debt securities and other | $ | 4,023 | | Discounted cash flow, Market comparables | Yield | 0% to 12% | | 5 | % |
Trading account assets – Corporate securities, trading loans and other | 1,613 | | Prepayment speed | 10% to 20% | | 16 | % | ||
Trading account assets – Non-U.S. sovereign debt | 556 | | Default rate | 3% to 4% | | 4 | % | ||
Trading account assets – Mortgage trading loans, ABS and other MBS | 1,158 | | Loss severity | 35% to 40% | | 37 | % | ||
AFS debt securities – Other taxable securities | 8 | | Price | $0 to $145 | | $63 | |||
Loans and leases | 1 | |
|
|
| ||||
Loans held-for-sale | 687 | |
|
|
| ||||
Auction rate securities | $ | 977 | | Discounted cash flow, Market comparables | Price | $10 to $100 | | $94 | |
Trading account assets – Corporate securities, trading loans and other | 7 | |
|
|
| ||||
AFS debt securities – Other taxable securities | 501 | |
|
|
| ||||
AFS debt securities – Tax-exempt securities | 469 | |
|
|
| ||||
MSRs | $ | 2,302 | | Discounted cash flow | Weighted-average life, fixed rate (4) | 0 to 14 years | | 5 years | |
|
| Weighted-average life, variable rate (4) | 0 to 10 years | | 3 years | | |||
|
| Option Adjusted Spread, fixed rate | 9% to 14% | | 10 | % | |||
|
| Option Adjusted Spread, variable rate | 9% to 15% | | 12 | % | |||
Structured liabilities |
|
|
|
|
| ||||
Long-term debt | $ | (1,863 | ) | Discounted cash flow, Market comparables, Industry standard derivative pricing (2) | Equity correlation | 15% to 100% | | 63 | % |
|
| Long-dated equity volatilities | 4% to 84% | | 22 | % | |||
|
| Yield | 7.5 | % | n/a | | |||
|
| Price | $0 to $100 | | $66 | ||||
Net derivative assets |
|
|
|
|
| ||||
Credit derivatives | $ | (282 | ) | Discounted cash flow, Stochastic recovery correlation model | Yield | 1% to 5% | | 3 | % |
|
| Upfront points | 0 points to 100 points | | 71 points | | |||
|
| Credit correlation | 35% to 83% | | 42 | % | |||
|
| Prepayment speed | 15% to 20% CPR | | 16 | % | |||
|
| Default rate | 1% to 4% CDR | | 2 | % | |||
|
| Loss severity | 35 | % | n/a | | |||
|
| Price | $0 to $102 | | $82 | ||||
Equity derivatives | $ | (2,059 | ) | Industry standard derivative pricing (2) | Equity correlation | 15% to 100% | | 63 | % |
|
| Long-dated equity volatilities | 4% to 84% | | 22 | % | |||
Commodity derivatives | $ | (3 | ) | Discounted cash flow, Industry standard derivative pricing (2) | Natural gas forward price | $1/MMBtu to $5/MMBtu | | $3/MMBtu | |
|
| Correlation | 71% to 87% | | 81 | % | |||
|
| Volatilities | 26% to 132% | | 57 | % | |||
Interest rate derivatives | $ | 630 | | Industry standard derivative pricing (3) | Correlation (IR/IR) | 15% to 92% | | 50 | % |
|
| Correlation (FX/IR) | 0% to 46% | | 1 | % | |||
|
| Long-dated inflation rates | -14% to 38% | | 4 | % | |||
|
| Long-dated inflation volatilities | 0% to 1% | | 1 | % | |||
Total net derivative assets | $ | (1,714 | ) |
|
|
|
| ||
(1) | The categories are aggregated based upon product type which differs from financial statement classification. The following is a reconciliation to the line items in the table on page 94 : Trading account assets – Corporate securities, trading loans and other of $1.9 billion , Trading account assets – Non-U.S. sovereign debt of $556 million , Trading account assets – Mortgage trading loans, ABS and other MBS of $1.5 billion , AFS debt securities – Other taxable securities of $509 million , AFS debt securities – Tax-exempt securities of $469 million , Loans and leases of $571 million and LHFS of $690 million . |
(2) | Includes models such as Monte Carlo simulation and Black-Scholes. |
(3) | Includes models such as Monte Carlo simulation, Black-Scholes and other methods that model the joint dynamics of interest, inflation and foreign exchange rates. |
(4) | The weighted-average life is a product of changes in market rates of interest, prepayment rates and other model and cash flow assumptions. |
CPR = Constant Prepayment Rate
CDR = Constant Default Rate
MMBtu = Million British thermal units
IR = Interest Rate
FX = Foreign Exchange
n/a = not applicable
|
| Bank of America 98 |
Sensitivity of Fair Value Measurements to Changes in Unobservable Inputs
For information on the types of instruments, valuation approaches and the impact of changes in unobservable inputs used in Level 3 measurements, see Note 20 – Fair Value Measurements to the Consolidated Financial Statements of the Corporation's 2017 Annual Report on Form 10-K .
Mortgage Servicing Rights
The weighted-average lives and fair value of MSRs are sensitive to changes in modeled assumptions. The weighted-average life is a product of changes in market rates of interest, prepayment rates and other model and cash flow assumptions. The weighted-average life represents the average period of time that the MSRs' cash flows are expected to be received. Absent other changes, an increase (decrease) to the weighted-average life would generally result in an increase (decrease) in the fair value of the MSRs. For example, a 10 percent or 20 percent decrease in prepayment rates, which impacts the weighted-average life, could result in an increase in fair value of $72 million or $149 million , while a 10 percent or
20 percent increase in prepayment rates could result in a decrease in fair value of $67 million or $129 million . A 100 bp or 200 bp decrease in option-adjusted spread (OAS) levels could result in an increase in fair value of $70 million or $146 million , while a 100 bp or 200 bp increase in OAS levels could result in a decrease in fair value of $66 million or $127 million . These sensitivities are hypothetical and actual amounts may vary materially. For more information on variations in assumptions and sensitivities on MSRs, see Note 20 – Fair Value Measurements to the Consolidated Financial Statements of the Corporation's 2017 Annual Report on Form 10-K .
Nonrecurring Fair Value
The Corporation holds certain assets that are measured at fair value, but only in certain situations (e.g., impairment) and these measurements are referred to herein as nonrecurring. The amounts below represent assets still held as of the reporting date for which a nonrecurring fair value adjustment was recorded during the three months ended March 31, 2018 and 2017 .
|
|
|
|
|
| ||||||
Assets Measured at Fair Value on a Nonrecurring Basis | |||||||||||
|
| ||||||||||
| March 31, 2018 |
| Three Months Ended March 31, 2018 | ||||||||
(Dollars in millions)
| Level 2 |
| Level 3 |
| Gains (Losses) | ||||||
Assets |
| |
|
| |
|
| ||||
Loans held-for-sale | $ | 13 | |
| $ | - | |
| $ | (2 | ) |
Loans and leases (1) | - | |
| 273 | |
| (98 | ) | |||
Foreclosed properties (2, 3) | - | |
| 61 | |
| (17 | ) | |||
Other assets | 47 | |
| - | |
| (7 | ) | |||
|
|
|
|
|
| ||||||
| March 31, 2017 |
| Three Months Ended March 31, 2017 | ||||||||
Assets |
| |
|
| |
|
| ||||
Loans held-for-sale | $ | 69 | |
| $ | 18 | |
| $ | (4 | ) |
Loans and leases (1) | - | |
| 438 | |
| (123 | ) | |||
Foreclosed properties (2, 3) | - | |
| 82 | |
| (25 | ) | |||
Other assets | 91 | |
| - | |
| (86 | ) | |||
(1) | Includes $45 million and $46 million of losses on loans that were written down to a collateral value of zero during the three months ended March 31, 2018 and 2017 . |
(2) | Amounts are included in other assets on the Consolidated Balance Sheet and represent the carrying value of foreclosed properties that were written down subsequent to their initial classification as foreclosed properties. Losses on foreclosed properties include losses recorded during the first 90 days after transfer of a loan to foreclosed properties. |
(3) | Excludes $680 million and $1.1 billion of properties acquired upon foreclosure of certain government-guaranteed loans (principally FHA-insured loans) at March 31, 2018 and 2017 . |
The table below presents information about significant unobservable inputs related to the Corporation's nonrecurring Level 3 financial assets and liabilities at March 31, 2018 and December 31, 2017 . Loans and leases backed by residential real estate assets represent residential mortgages where the loan has been written down to the fair value of the underlying collateral.
|
|
|
|
|
|
|
|
|
| |||
Quantitative Information about Nonrecurring Level 3 Fair Value Measurements | ||||||||||||
|
|
|
|
|
|
|
|
|
| |||
|
|
|
|
| Inputs | |||||||
Financial Instrument | Fair Value |
| Valuation Technique |
| Significant Unobservable Inputs |
| Ranges of Inputs |
| Weighted Average | |||
(Dollars in millions) | March 31, 2018 | |||||||||||
Loans and leases backed by residential real estate assets | $ | 273 | |
| Market comparables |
| OREO discount |
| 13% to 59% |
| 23 | % |
|
|
|
|
| Costs to sell |
| 8% to 26% |
| 9 | % | ||
|
|
|
|
|
|
|
|
|
| |||
| December 31, 2017 | |||||||||||
Loans and leases backed by residential real estate assets | $ | 894 | |
| Market comparables |
| OREO discount |
| 15% to 58% |
| 23 | % |
|
|
|
|
| Costs to sell |
| 5% to 49% |
| 7 | % | ||
99 Bank of America |
|
|
NOTE 15
Fair Value Option
The Corporation elects to account for certain financial instruments under the fair value option. For more information on the primary financial instruments for which the fair value option elections have been made, see Note 21 – Fair Value Option to the Consolidated Financial Statements of the Corporation's 2017 Annual Report on Form 10-K .
The following tables provide information about the fair value carrying amount and the contractual principal outstanding of assets and liabilities accounted for under the fair value option at March 31, 2018 and December 31, 2017 , and information about where changes in the fair value of assets and liabilities accounted for under the fair value option are included in the Consolidated Statement of Income for the three months ended March 31, 2018 and 2017 .
|
|
|
|
|
|
|
|
|
|
|
| ||||||||||||
Fair Value Option Elections |
|
|
|
|
|
|
|
|
|
|
| ||||||||||||
|
|
|
|
|
|
|
|
|
|
|
| ||||||||||||
| March 31, 2018 |
| December 31, 2017 | ||||||||||||||||||||
(Dollars in millions) | Fair Value Carrying Amount |
| Contractual Principal Outstanding |
| Fair Value Carrying Amount Less Unpaid Principal |
| Fair Value Carrying Amount |
| Contractual Principal Outstanding |
| Fair Value Carrying Amount Less Unpaid Principal | ||||||||||||
Federal funds sold and securities borrowed or purchased under agreements to resell | $ | 68,556 | |
| $ | 68,539 | |
| $ | 17 | |
| $ | 52,906 | |
| $ | 52,907 | |
| $ | (1 | ) |
Loans reported as trading account assets (1) | 5,939 | |
| 13,419 | |
| (7,480 | ) |
| 5,735 | |
| 11,804 | |
| (6,069 | ) | ||||||
Trading inventory – other | 12,622 | |
| n/a | |
| n/a | |
| 12,027 | |
| n/a | |
| n/a | | ||||||
Consumer and commercial loans | 5,989 | |
| 6,026 | |
| (37 | ) |
| 5,710 | |
| 5,744 | |
| (34 | ) | ||||||
Loans held-for-sale | 3,091 | |
| 4,639 | |
| (1,548 | ) |
| 2,156 | |
| 3,717 | |
| (1,561 | ) | ||||||
Other assets | 3 | |
| n/a | |
| n/a | |
| 3 | |
| n/a | |
| n/a | | ||||||
Long-term deposits | 435 | |
| 414 | |
| 21 | |
| 449 | |
| 421 | |
| 28 | | ||||||
Federal funds purchased and securities loaned or sold under agreements to repurchase | 35,116 | |
| 35,127 | |
| (11 | ) |
| 36,182 | |
| 36,187 | |
| (5 | ) | ||||||
Short-term borrowings | 2,284 | |
| 2,284 | |
| - | |
| 1,494 | |
| 1,494 | |
| - | | ||||||
Unfunded loan commitments | 120 | |
| n/a | |
| n/a | |
| 120 | |
| n/a | |
| n/a | | ||||||
Long-term debt (2) | 30,062 | |
| 30,381 | |
| (319 | ) |
| 31,786 | |
| 31,512 | |
| 274 | | ||||||
(1) | A significant portion of the loans reported as trading account assets are distressed loans that trade and were purchased at a deep discount to par, and the remainder are loans with a fair value near contractual principal outstanding. |
(2) | Includes structured liabilities with a fair value of $29.7 billion and $31.4 billion , and contractual principal outstanding of $30.0 billion and $31.1 billion at March 31, 2018 and December 31, 2017 . |
n/a = not applicable
|
|
|
|
|
| ||||||
Gains (Losses) Relating to Assets and Liabilities Accounted for Under the Fair Value Option | |||||||||||
|
|
|
|
|
| ||||||
| Three Months Ended March 31, 2018 | ||||||||||
(Dollars in millions) | Trading Account Profits |
| Other Income |
| Total | ||||||
Loans reported as trading account assets | $ | 103 | |
| $ | - | |
| $ | 103 | |
Trading inventory – other (1) | 595 | |
| - | |
| 595 | | |||
Consumer and commercial loans | 106 | |
| (21 | ) |
| 85 | | |||
Loans held-for-sale (2) | 1 | |
| - | |
| 1 | | |||
Long-term debt (3, 4) | 819 | |
| (41 | ) |
| 778 | | |||
Other (5) | 7 | |
| 8 | |
| 15 | | |||
Total | $ | 1,631 | |
| $ | (54 | ) |
| $ | 1,577 | |
|
|
|
|
|
| ||||||
| Three Months Ended March 31, 2017 | ||||||||||
Loans reported as trading account assets | $ | 150 | |
| $ | - | |
| $ | 150 | |
Trading inventory – other (1) | 1,151 | |
| - | |
| 1,151 | | |||
Consumer and commercial loans | 5 | |
| 19 | |
| 24 | | |||
Loans held-for-sale (2) | 1 | |
| 84 | |
| 85 | | |||
Long-term debt (3, 4) | (162 | ) |
| (37 | ) |
| (199 | ) | |||
Other (5) | (58 | ) |
| 43 | |
| (15 | ) | |||
Total | $ | 1,087 | |
| $ | 109 | |
| $ | 1,196 | |
(1) | The gains in trading account profits are primarily offset by losses on trading liabilities that hedge these assets. |
(2) | Includes the value of IRLCs on funded loans, including those sold during the period. |
(3) | The majority of the net gains (losses) in trading account profits relate to the embedded derivatives in structured liabilities and are offset by gains (losses) on derivatives and securities that hedge these liabilities. |
(4) | For the cumulative impact of changes in the Corporation's own credit spreads and the amount recognized in accumulated OCI, see Note 12 – Accumulated Other Comprehensive Income (Loss) . For additional information on how the Corporation's own credit spread is determined, see Note 20 – Fair Value Measurements to the Consolidated Financial Statements of the Corporation's 2017 Annual Report on Form 10-K . |
(5) | Includes gains (losses) on federal funds sold and securities borrowed or purchased under agreements to resell, long-term deposits, federal funds purchased and securities loaned or sold under agreements to repurchase, short-term borrowings and unfunded loan commitments. |
|
| Bank of America 100 |
|
|
|
| ||||
Gains (Losses) Related to Borrower-specific Credit Risk for Assets Accounted for Under the Fair Value Option | |||||||
|
|
|
| ||||
| Three Months Ended March 31 | ||||||
(Dollars in millions) | 2018 |
| 2017 | ||||
Loans reported as trading account assets | $ | 13 | |
| $ | 13 | |
Consumer and commercial loans | (17 | ) |
| 19 | | ||
Loans held-for-sale | (3 | ) |
| - | | ||
NOTE 16
Fair Value of Financial Instruments
The following disclosures include financial instruments that are not carried at fair value or only a portion of the ending balance at March 31, 2018 and December 31, 2017 is carried at fair value on the Consolidated Balance Sheet. Certain loans, deposits, long-term debt and loan commitments are accounted for under the fair value option. For additional information, see Note 21 – Fair Value Option to the Consolidated Financial Statements of the Corporation's 2017 Annual Report on Form 10-K .
Fair Value of Financial Instruments
The carrying values and fair values by fair value hierarchy of certain financial instruments where only a portion of the ending balance was carried at fair value at March 31, 2018 and December 31, 2017 are presented in the following table.
|
|
|
|
|
|
|
| ||||||||
Fair Value of Financial Instruments | |||||||||||||||
|
|
|
| ||||||||||||
|
|
| Fair Value | ||||||||||||
| Carrying Value |
| Level 2 |
| Level 3 |
| Total | ||||||||
(Dollars in millions) | March 31, 2018 | ||||||||||||||
Financial assets |
|
|
|
|
|
|
| ||||||||
Loans | $ | 902,219 | |
| $ | 67,137 | |
| $ | 841,274 | |
| $ | 908,411 | |
Loans held-for-sale | 9,227 | |
| 8,377 | |
| 1,530 | |
| 9,907 | | ||||
Financial liabilities |
|
|
|
|
|
|
| ||||||||
Deposits (1) | 1,328,664 | |
| 1,327,961 | |
| - | |
| 1,327,961 | | ||||
Long-term debt | 232,256 | |
| 237,851 | |
| 1,351 | |
| 239,202 | | ||||
Commercial unfunded lending commitments (2) | 902 | |
| 120 | |
| 4,253 | |
| 4,373 | | ||||
|
|
|
|
|
|
|
| ||||||||
| December 31, 2017 | ||||||||||||||
Financial assets |
|
|
|
|
|
|
| ||||||||
Loans | $ | 904,399 | |
| $ | 68,586 | |
| $ | 849,576 | |
| $ | 918,162 | |
Loans held-for-sale | 11,430 | |
| 10,521 | |
| 909 | |
| 11,430 | | ||||
Financial liabilities |
| |
|
|
|
|
|
| | ||||||
Deposits (1) | 1,309,545 | |
| 1,309,398 | |
| - | |
| 1,309,398 | | ||||
Long-term debt | 227,402 | |
| 235,126 | |
| 1,863 | |
| 236,989 | | ||||
Commercial unfunded lending commitments (2) | 897 | |
| 120 | |
| 3,908 | |
| 4,028 | | ||||
(1) Includes demand deposits of $528.9 billion and $519.6 billion with no stated maturities at March 31, 2018 and December 31, 2017 .
(2) The carrying value is included in accrued expenses and other liabilities on the Consolidated Balance Sheet. For more information on commitments, see Note 10 – Commitments and Contingencies .
NOTE 17
Business Segment Information
The Corporation reports its results of operations through the following four business segments: Consumer Banking , GWIM , Global Banking and Global Markets , with the remaining operations recorded in All Other . For additional information, see Note 23 – Business Segment Information to the Consolidated Financial Statements of the Corporation's 2017 Annual Report on Form 10-K . The following tables present net income (loss) and the
components thereto (with net interest income on an FTE basis) for the three months ended March 31, 2018 and 2017 and total assets at March 31, 2018 and 2017 for each business segment, as well as All Other, including a reconciliation of the four business segments' total revenue, net of interest expense, on an FTE basis, and net income to the Consolidated Statement of Income, and total assets to the Consolidated Balance Sheet.
101 Bank of America |
|
|
|
|
|
|
|
|
|
|
| ||||||||||||
Results of Business Segments and All Other |
|
|
|
|
|
|
|
| ||||||||||||
|
|
|
|
|
|
|
|
| ||||||||||||
At and for the three months ended March 31 | Total Corporation (1) |
| Consumer Banking |
| Global Wealth & | |||||||||||||||
(Dollars in millions) | 2018 | 2017 |
| 2018 | 2017 |
| 2018 | 2017 | ||||||||||||
Net interest income (FTE basis) | $ | 11,758 | | $ | 11,255 | |
| $ | 6,510 | | $ | 5,781 | |
| $ | 1,594 | | $ | 1,560 | |
Noninterest income | 11,517 | | 11,190 | |
| 2,522 | | 2,503 | |
| 3,262 | | 3,032 | | ||||||
Total revenue, net of interest expense (FTE basis) | 23,275 | | 22,445 | |
| 9,032 | | 8,284 | |
| 4,856 | | 4,592 | | ||||||
Provision for credit losses | 834 | | 835 | |
| 935 | | 838 | |
| 38 | | 23 | | ||||||
Noninterest expense | 13,897 | | 14,093 | |
| 4,480 | | 4,410 | |
| 3,428 | | 3,329 | | ||||||
Income before income taxes (FTE basis) | 8,544 | | 7,517 | |
| 3,617 | | 3,036 | |
| 1,390 | | 1,240 | | ||||||
Income tax expense (FTE basis) | 1,626 | | 2,180 | |
| 922 | | 1,144 | |
| 355 | | 467 | | ||||||
Net income | $ | 6,918 | | $ | 5,337 | |
| $ | 2,695 | | $ | 1,892 | |
| $ | 1,035 | | $ | 773 | |
Period-end total assets | $ | 2,328,478 | | $ | 2,247,794 | |
| $ | 774,256 | | $ | 734,087 | |
| $ | 279,331 | | $ | 291,177 | |
|
|
|
|
|
|
|
|
| ||||||||||||
| Global Banking |
| Global Markets |
| All Other | |||||||||||||||
| 2018 | 2017 |
| 2018 | 2017 |
| 2018 | 2017 | ||||||||||||
Net interest income (FTE basis) | $ | 2,640 | | $ | 2,602 | |
| $ | 870 | | $ | 1,049 | |
| $ | 144 | | $ | 263 | |
Noninterest income (loss) | 2,294 | | 2,353 | |
| 3,916 | | 3,659 | |
| (477 | ) | (357 | ) | ||||||
Total revenue, net of interest expense (FTE basis) | 4,934 | | 4,955 | |
| 4,786 | | 4,708 | |
| (333 | ) | (94 | ) | ||||||
Provision for credit losses | 16 | | 17 | |
| (3 | ) | (17 | ) |
| (152 | ) | (26 | ) | ||||||
Noninterest expense | 2,195 | | 2,163 | |
| 2,818 | | 2,757 | |
| 976 | | 1,434 | | ||||||
Income (loss) before income taxes (FTE basis) | 2,723 | | 2,775 | |
| 1,971 | | 1,968 | |
| (1,157 | ) | (1,502 | ) | ||||||
Income tax expense (benefit) (FTE basis) | 707 | | 1,046 | |
| 513 | | 671 | |
| (871 | ) | (1,148 | ) | ||||||
Net income (loss) | $ | 2,016 | | $ | 1,729 | |
| $ | 1,458 | | $ | 1,297 | |
| $ | (286 | ) | $ | (354 | ) |
Period-end total assets | $ | 424,134 | | $ | 416,763 | |
| $ | 648,605 | | $ | 604,014 | |
| $ | 202,152 | | $ | 201,753 | |
|
|
|
|
| ||||
Business Segment Reconciliations |
|
|
|
| ||||
|
|
|
|
| ||||
|
| Three Months Ended March 31 | ||||||
|
| 2018 |
| 2017 | ||||
Segments' total revenue, net of interest expense (FTE basis) |
| $ | 23,608 | |
| $ | 22,539 | |
Adjustments (2) : |
|
| |
|
| | ||
ALM activities |
| 116 | |
| (45 | ) | ||
Liquidating businesses and other |
| (449 | ) |
| (49 | ) | ||
FTE basis adjustment |
| (150 | ) |
| (197 | ) | ||
Consolidated revenue, net of interest expense |
| $ | 23,125 | |
| $ | 22,248 | |
Segments' total net income |
| 7,204 | |
| 5,691 | | ||
Adjustments, net-of-taxes (2) : |
|
| |
|
| | ||
ALM activities |
| (54 | ) |
| (179 | ) | ||
Liquidating businesses and other |
| (232 | ) |
| (175 | ) | ||
Consolidated net income |
| $ | 6,918 | |
| $ | 5,337 | |
|
|
|
|
| ||||
|
| March 31 | ||||||
|
| 2018 |
| 2017 | ||||
Segments' total assets |
| $ | 2,126,326 | |
| $ | 2,046,041 | |
Adjustments (2) : |
|
| |
|
| | ||
ALM activities, including securities portfolio |
| 659,849 | |
| 633,028 | | ||
Liquidating businesses and other (3) |
| 85,631 | |
| 112,153 | | ||
Elimination of segment asset allocations to match liabilities |
| (543,328 | ) |
| (543,428 | ) | ||
Consolidated total assets |
| $ | 2,328,478 | |
| $ | 2,247,794 | |
(1) | There were no material intersegment revenues. |
(2) | Adjustments include consolidated income, expense and asset amounts not specifically allocated to individual business segments. |
(3) | At March 31, 2017 , includes assets of the non-U.S. consumer credit card business which were included in assets of business held for sale on the Consolidated Balance Sheet. |
|
| Bank of America 102 |
The table below presents noninterest income and the components thereto for the three months ended March 31, 2018 and 2017 for each business segment, as well as All Other . For additional information, see Note 1 – Summary of Significant Accounting Principles and Note 2 – Noninterest Income .
|
|
|
|
|
|
|
|
|
|
|
| ||||||||||||
Noninterest Income by Business Segment and All Other |
|
|
|
|
|
| |||||||||||||||||
|
|
|
|
|
|
|
|
|
|
|
| ||||||||||||
| Total Corporation |
| Consumer Banking |
| Global Wealth & | ||||||||||||||||||
| Three Months Ended March 31 | ||||||||||||||||||||||
(Dollars in millions) | 2018 |
| 2017 |
| 2018 |
| 2017 |
| 2018 |
| 2017 | ||||||||||||
Card income |
|
|
|
|
|
|
|
|
|
|
| ||||||||||||
Interchange fees | $ | 971 | |
| $ | 958 | |
| $ | 804 | |
| $ | 784 | |
| $ | 11 | |
| $ | 26 | |
Other card income | 486 | |
| 491 | |
| 475 | |
| 440 | |
| 10 | |
| 10 | | ||||||
Total card income | 1,457 | |
| 1,449 | |
| 1,279 | |
| 1,224 | |
| 21 | |
| 36 | | ||||||
Service charges |
|
|
|
|
|
|
|
|
|
|
| ||||||||||||
Deposit-related fees | 1,646 | |
| 1,653 | |
| 1,044 | |
| 1,050 | |
| 19 | |
| 20 | | ||||||
Lending-related fees | 275 | |
| 265 | |
| - | |
| - | |
| - | |
| - | | ||||||
Total service charges | 1,921 | |
| 1,918 | |
| 1,044 | |
| 1,050 | |
| 19 | |
| 20 | | ||||||
Investment and brokerage services |
|
|
|
|
|
|
|
|
|
|
| ||||||||||||
Asset management fees | 2,564 | |
| 2,200 | |
| 36 | |
| 33 | |
| 2,528 | |
| 2,167 | | ||||||
Brokerage fees | 1,100 | |
| 1,217 | |
| 46 | |
| 49 | |
| 512 | |
| 624 | | ||||||
Total investment and brokerage services | 3,664 | |
| 3,417 | |
| 82 | |
| 82 | |
| 3,040 | |
| 2,791 | | ||||||
Investment banking income |
|
|
|
|
|
|
|
|
|
|
| ||||||||||||
Underwriting income | 740 | |
| 779 | |
| - | |
| - | |
| 84 | |
| 51 | | ||||||
Syndication fees | 316 | |
| 400 | |
| - | |
| - | |
| - | |
| - | | ||||||
Financial advisory services | 297 | |
| 405 | |
| - | |
| - | |
| - | |
| - | | ||||||
Total investment banking income | 1,353 | |
| 1,584 | |
| - | |
| - | |
| 84 | |
| 51 | | ||||||
Trading account profits | 2,699 | |
| 2,331 | |
| 2 | |
| - | |
| 29 | |
| 59 | | ||||||
Other income | 423 | |
| 491 | |
| 115 | |
| 147 | |
| 69 | |
| 75 | | ||||||
Total noninterest income | $ | 11,517 | |
| $ | 11,190 | |
| $ | 2,522 | |
| $ | 2,503 | |
| $ | 3,262 | |
| $ | 3,032 | |
|
|
|
|
|
|
|
|
|
|
|
| ||||||||||||
| Global Banking |
| Global Markets |
| All Other | ||||||||||||||||||
| Three Months Ended March 31 | ||||||||||||||||||||||
| 2018 |
| 2017 |
| 2018 |
| 2017 |
| 2018 |
| 2017 | ||||||||||||
Card income |
|
|
|
|
|
|
|
|
|
|
| ||||||||||||
Interchange fees | $ | 134 | |
| $ | 121 | |
| $ | 22 | |
| $ | 22 | |
| $ | - | |
| $ | 5 | |
Other card income | 1 | |
| 4 | |
| - | |
| - | |
| - | |
| 37 | | ||||||
Total card income | 135 | |
| 125 | |
| 22 | |
| 22 | |
| - | |
| 42 | | ||||||
Service charges |
|
|
|
|
|
|
|
|
|
|
| ||||||||||||
Deposit-related fees | 538 | |
| 544 | |
| 40 | |
| 33 | |
| 5 | |
| 6 | | ||||||
Lending-related fees | 225 | |
| 221 | |
| 50 | |
| 44 | |
| - | |
| - | | ||||||
Total service charges | 763 | |
| 765 | |
| 90 | |
| 77 | |
| 5 | |
| 6 | | ||||||
Investment and brokerage services |
|
|
|
|
|
|
|
|
|
|
| ||||||||||||
Asset management fees | - | |
| - | |
| - | |
| - | |
| - | |
| - | | ||||||
Brokerage fees (1) | 25 | |
| 17 | |
| 488 | |
| 531 | |
| 29 | |
| (4 | ) | ||||||
Total investment and brokerage services | 25 | |
| 17 | |
| 488 | |
| 531 | |
| 29 | |
| (4 | ) | ||||||
Investment banking income |
|
|
|
|
|
|
|
|
|
|
| ||||||||||||
Underwriting income (1) | 161 | |
| 150 | |
| 579 | |
| 636 | |
| (84 | ) |
| (58 | ) | ||||||
Syndication fees | 298 | |
| 379 | |
| 18 | |
| 21 | |
| - | |
| - | | ||||||
Financial advisory services | 285 | |
| 396 | |
| 12 | |
| 9 | |
| - | |
| - | | ||||||
Total investment banking income | 744 | |
| 925 | |
| 609 | |
| 666 | |
| (84 | ) |
| (58 | ) | ||||||
Trading account profits | 61 | |
| 32 | |
| 2,703 | |
| 2,177 | |
| (96 | ) |
| 63 | | ||||||
Other income | 566 | |
| 489 | |
| 4 | |
| 186 | |
| (331 | ) |
| (406 | ) | ||||||
Total noninterest income | $ | 2,294 | |
| $ | 2,353 | |
| $ | 3,916 | |
| $ | 3,659 | |
| $ | (477 | ) |
| $ | (357 | ) |
(1) | All Other Includes eliminations of intercompany transactions. |
103 Bank of America |
|
|
Glossary
Alt-A Mortgage – A type of U.S. mortgage that is considered riskier than A-paper, or "prime," and less risky than "subprime," the riskiest category. Typically, Alt-A mortgages are characterized by borrowers with less than full documentation, lower credit scores and higher LTVs.
Assets Under Management (AUM) – The total market value of assets under the investment advisory and/or discretion of GWIM which generate asset management fees based on a percentage of the assets' market values. AUM reflects assets that are generally managed for institutional, high net worth and retail clients, and are distributed through various investment products including mutual funds, other commingled vehicles and separate accounts.
Banking Book – All on- and off-balance sheet financial instruments of the Corporation except for those positions that are held for trading purposes.
Brokerage and Other Assets – Non-discretionary client assets which are held in brokerage accounts or held for safekeeping.
Committed Credit Exposure – Any funded portion of a facility plus the unfunded portion of a facility on which the lender is legally bound to advance funds during a specified period under prescribed conditions.
Credit Derivatives – Contractual agreements that provide protection against a specified credit event on one or more referenced obligations.
Credit Valuation Adjustment (CVA) – A portfolio adjustment required to properly reflect the counterparty credit risk exposure as part of the fair value of derivative instruments.
Debit Valuation Adjustment (DVA) – A portfolio adjustment required to properly reflect the Corporation's own credit risk exposure as part of the fair value of derivative instruments and/or structured liabilities.
Funding Valuation Adjustment (FVA) – A portfolio adjustment required to include funding costs on uncollateralized derivatives and derivatives where the Corporation is not permitted to use the collateral it receives.
Interest Rate Lock Commitment (IRLC) – Commitment with a loan applicant in which the loan terms are guaranteed for a designated period of time subject to credit approval.
Letter of Credit – A document issued on behalf of a customer to a third party promising to pay the third party upon presentation of specified documents. A letter of credit effectively substitutes the issuer's credit for that of the customer.
Loan-to-value (LTV) – A commonly used credit quality metric. LTV is calculated as the outstanding carrying value of the loan divided by the estimated value of the property securing the loan.
Margin Receivable – An extension of credit secured by eligible securities in certain brokerage accounts.
Matched Book – Repurchase and resale agreements or securities borrowed and loaned transactions where the overall asset and liability position is similar in size and/or maturity. Generally, these are entered into to accommodate customers where the Corporation earns the interest rate spread.
Mortgage Servicing Rights (MSR) – The right to service a mortgage loan when the underlying loan is sold or securitized. Servicing includes collections for principal, interest and escrow payments from borrowers and accounting for and remitting principal and interest payments to investors.
Net Interest Yield – Net interest income divided by average total interest-earning assets.
Nonperforming Loans and Leases – Includes loans and leases that have been placed on nonaccrual status, including nonaccruing loans whose contractual terms have been restructured in a manner that grants a concession to a borrower experiencing financial difficulties.
Operating Margin – Income before income taxes divided by total revenue, net of interest expense.
Prompt Corrective Action (PCA) – A framework established by the U.S. banking regulators requiring banks to maintain certain levels of regulatory capital ratios, comprised of five categories of capitalization: "well capitalized," "adequately capitalized," "undercapitalized," "significantly undercapitalized" and "critically undercapitalized." Insured depository institutions that fail to meet certain of these capital levels are subject to increasingly strict limits on their activities, including their ability to make capital distributions, pay management compensation, grow assets and take other actions.
Subprime Loans – Although a standard industry definition for subprime loans (including subprime mortgage loans) does not exist, the Corporation defines subprime loans as specific product offerings for higher risk borrowers.
Troubled Debt Restructurings (TDRs) – Loans whose contractual terms have been restructured in a manner that grants a concession to a borrower experiencing financial difficulties. Certain consumer loans for which a binding offer to restructure has been extended are also classified as TDRs.
Value-at-Risk (VaR) – VaR is a model that simulates the value of a portfolio under a range of hypothetical scenarios in order to generate a distribution of potential gains and losses. VaR represents the loss the portfolio is expected to experience with a given confidence level based on historical data. A VaR model is an effective tool in estimating ranges of potential gains and losses on our trading portfolios.
|
| Bank of America 104 |
Acronyms
ABS | Asset-backed securities |
AFS | Available-for-sale |
ALM | Asset and liability management |
AUM | Assets under management |
BANA | Bank of America, National Association |
BHC | Bank holding company |
bps | basis points |
CCAR | Comprehensive Capital Analysis and Review |
CDO | Collateralized debt obligation |
CDS | Credit default swap |
CLO | Collateralized loan obligation |
CLTV | Combined loan-to-value |
CVA | Credit valuation adjustment |
DVA | Debit valuation adjustment |
EPS | Earnings per common share |
FASB | Financial Accounting Standards Board |
FDIC | Federal Deposit Insurance Corporation |
FHA | Federal Housing Administration |
FHLB | Federal Home Loan Bank |
FHLMC | Freddie Mac |
FICC | Fixed-income, currencies and commodities |
FICO | Fair Isaac Corporation (credit score) |
FNMA | Fannie Mae |
FTE | Fully taxable-equivalent |
FVA | Funding valuation adjustment |
GAAP | Accounting principles generally accepted in the United States of America |
GLS | Global Liquidity Sources |
GNMA | Government National Mortgage Association |
GSE | Government-sponsored enterprise |
G-SIB | Global systemically important bank |
GWIM | Global Wealth & Investment Management |
HELOC | Home equity line of credit |
HQLA | High Quality Liquid Assets |
HTM | Held-to-maturity |
IRLC | Interest rate lock commitment |
ISDA | International Swaps and Derivatives Association, Inc. |
LCR | Liquidity Coverage Ratio |
LHFS | Loans held-for-sale |
LIBOR | London InterBank Offered Rate |
LTV | Loan-to-value |
MBS | Mortgage-backed securities |
MD&A | Management's Discussion and Analysis of Financial Condition and Results of Operations |
MLGWM | Merrill Lynch Global Wealth Management |
MLI | Merrill Lynch International |
MLPCC | Merrill Lynch Professional Clearing Corp |
MLPF&S | Merrill Lynch, Pierce, Fenner & Smith Incorporated |
MSA | Metropolitan Statistical Area |
MSR | Mortgage servicing right |
OAS | Option-adjusted spread |
OCI | Other comprehensive income |
OREO | Other real estate owned |
OTC | Over-the-counter |
OTTI | Other-than-temporary impairment |
PCA | Prompt Corrective Action |
PCI | Purchased credit-impaired |
RMBS | Residential mortgage-backed securities |
RSU | Restricted stock unit |
SBLC | Standby letter of credit |
SEC | Securities and Exchange Commission |
SLR | Supplementary leverage ratio |
TDR | Troubled debt restructurings |
TLAC | Total loss-absorbing capacity |
TTF | Time-to-required funding |
VaR | Value-at-Risk |
VIE | Variable interest entity |
105 Bank of America |
|
|
Part II. Other Information
Bank of America Corporation and Subsidiaries
Item 1. Legal Proceedings
See Litigation and Regulatory Matters in Note 10 – Commitments and Contingencies to the Consolidated Financial Statements , which is incorporated by reference in this Item 1, for litigation and regulatory disclosure that supplements the disclosure in Note 12 – Commitments and Contingencies to the Consolidated Financial Statements of the Corporation's 2017 Annual Report on Form 10-K .
Item 1A. Risk Factors
There are no material changes from the risk factors set forth under Part 1, Item 1A. Risk Factors of the Corporation's 2017 Annual Report on Form 10-K .
Item 2. Unregistered Sales of Equity Securities and Use of Proceeds
The table below presents share repurchase activity for the three months ended March 31, 2018 . The primary source of funds for cash distributions by the Corporation to its shareholders is dividends received from its banking subsidiaries. Each of the banking subsidiaries is subject to various regulatory policies and requirements relating to the payment of dividends, including requirements to maintain capital above regulatory minimums. All of the Corporation's preferred stock outstanding has preference over the Corporation's common stock with respect to payment of dividends.
|
|
|
|
|
|
|
| ||||||
(Dollars in millions, except per share information; shares in thousands) | Common Shares Repurchased (1) |
| Weighted-Average Per Share Price |
| Shares Purchased as |
| Remaining Buyback Authority Amounts (2) | ||||||
January 1 - 31, 2018 | 36,068 | |
| $ | 31.66 | |
| 36,002 | |
| $ | 8,919 | |
February 1 - 28, 2018 | 87,300 | |
| 31.78 | |
| 62,155 | |
| 6,954 | | ||
March 1 - 31, 2018 | 54,570 | |
| 32.18 | |
| 54,474 | |
| 5,201 | | ||
Three months ended March 31, 2018 | 177,938 | |
| 31.88 | |
|
| |
|
| | ||
(1) | Includes shares of the Corporation's common stock acquired by the Corporation in connection with satisfaction of tax withholding obligations on vested restricted stock or restricted stock units and certain forfeitures and terminations of employment-related awards and for potential re-issuance to certain employees under equity incentive plans. |
(2) | Pursuant to the Corporation's 2017 CCAR capital plan, the Board authorized the repurchase of $12.0 billion in common stock from July 1, 2017 through June 30, 2018, plus approximately $900 million to offset the effect of equity-based compensation plans during the same period. During the three months ended March 31, 2018 , pursuant to the Board's authorization, the Corporation repurchased approximately $ 4.9 billion of common stock, which included common stock to offset equity-based compensation awards. For additional information, see Capital Management -- CCAR and Capital Planning on page 18 and Note 11 – Shareholders' Equity to the Consolidated Financial Statements. |
The Corporation did not have any unregistered sales of securities during the three months ended March 31, 2018 .
|
| Bank of America 106 |
Item 6. Exhibits
|
|
| Incorporated by Reference | |||
Exhibit No. | Description | Notes | Form | Exhibit | Filing Date | File No. |
3(a) | Amended and Restated Certificate as in effect of the date hereof | 1 |
|
|
|
|
|
|
|
|
|
|
|
3(b) | Amended and Restated Bylaws of the Corporation in effect as of the date hereof |
| 8-K | 3.1 | 3/20/15 | 1-6523 |
|
|
|
|
|
|
|
10 | Form of Performance Restricted Stock Units Award Agreement (February 2018) between the Corporation and certain executive officers of the Corporation, including Named Executive Officers | 1, 2 |
|
|
|
|
|
|
|
|
|
|
|
11 | Earnings Per Share Computation – included in Note 13 – Earnings Per Common Share to the Consolidated Financial Statements | 1 |
|
|
|
|
|
|
|
|
|
|
|
12 | Ratio of Earnings to Fixed Charges | 1 |
|
|
|
|
|
|
|
|
|
|
|
31(a) | Certification of the Chief Executive Officer pursuant to Section 302 of the Sarbanes-Oxley Act of 2002 | 1 |
|
|
|
|
|
|
|
|
|
|
|
31(b) | Certification of the Chief Financial Officer pursuant to Section 302 of the Sarbanes-Oxley Act of 2002 | 1 |
|
|
|
|
|
|
|
|
|
|
|
32(a) | Certification of the Chief Executive Officer pursuant to 18 U.S.C. Section 1350, as adopted pursuant to Section 906 of the Sarbanes-Oxley Act of 2002 | 1 |
|
|
|
|
|
|
|
|
|
|
|
32(b) | Certification of the Chief Financial Officer pursuant to 18 U.S.C. Section 1350, as adopted pursuant to Section 906 of the Sarbanes-Oxley Act of 2002 | 1 |
|
|
|
|
|
|
|
|
|
|
|
101.INS | XBRL Instance Document | 1 |
|
|
|
|
|
|
|
|
|
|
|
101.SCH | XBRL Taxonomy Extension Schema Document | 1 |
|
|
|
|
|
|
|
|
|
|
|
101.CAL | XBRL Taxonomy Extension Calculation Linkbase Document | 1 |
|
|
|
|
|
|
|
|
|
|
|
101.LAB | XBRL Taxonomy Extension Label Linkbase Document | 1 |
|
|
|
|
|
|
|
|
|
|
|
101.PRE | XBRL Taxonomy Extension Presentation Linkbase Document | 1 |
|
|
|
|
|
|
|
|
|
|
|
101.DEF | XBRL Taxonomy Extension Definitions Linkbase Document | 1 |
|
|
|
|
(1) Filed herewith.
(2) Exhibit is a management contract or a compensatory plan or arrangement.
Signature
Pursuant to the requirements of the Securities Exchange Act of 1934, the registrant has duly caused this report to be signed on its behalf by the undersigned, thereunto duly authorized.
|
| Bank of America Corporation Registrant |
| ||
|
|
|
|
| |
Date: | April 30, 2018 |
| /s/ Rudolf A. Bless |
| |
|
|
| Rudolf A. Bless Chief Accounting Officer |
| |
107 Bank of America |
|
|